Embed Size (px)
Citation preview
A Component Unit of the City of San Antonio, Texas
For the Years Ended December 31, 2018 and 2017
CAFRComprehensive
Annual Financial Report
This Page Intentionally Left Blank
COMPREHENSIVE ANNUAL FINANCIAL REPORT OF THE
SAN ANTONIO WATER SYSTEM A COMPONENT UNIT OF THE CITY OF SAN ANTONIO, TEXAS
For the Years Ended December 31, 2018 and 2017
Prepared by: Financial Services Department
Douglas P. Evanson Senior Vice President/Chief Financial Officer
Cecilia Velasquez Director of Accounting/Controller

This Page Intentionally Left Blank
Comprehensive Annual Financial Report
INTRODUCTION
COMPREHENSIVE ANNUAL FINANCIAL REPORT
SAN ANTONIO WATER SYSTEM
TABLE OF CONTENTSPage
INTRODUCTIONTitle PageTable of ContentsLetter of Transmittal A1-A6San Antonio Water System Board of Trustees BSan Antonio Water System Organization Chart CCertificate of Achievement for Excellence in Financial Reporting D
FINANCIAL SECTIONIndependent Auditor's Report 1 - 3
Required Supplemental Information:Management's Discussion and Analysis (Unaudited) 4 - 14
Basic Financial Statements:San Antonio Water System: Statements of Net Position 15 - 16 Statements of Revenues, Expenses and Changes in Net Position 17 Statements of Cash Flows 18 - 19San Antonio Water System Fiduciary Funds: Statements of Fiduciary Net Position 20 Statements of Changes in Fiduciary Net Position 20Notes to Financial Statements 21 - 80
Required Supplemental Information:Texas Municipal Retirement System - San Antonio Water System Schedule of Changes in Net Pension Liability and Related Ratios (Unaudited) 81 Schedule of Contributions (Unaudited) 82San Antonio Water System Retirement Plan - Defined Benefit Component: Schedule of Changes in Net Pension Liability and Related Ratios (Unaudited) 83 Schedule of Contributions (Unaudited) 84 Schedule of Investment Returns (Unaudited) 84District Special Project Retirement Income Plan Schedule of Changes in Net Pension Liability and Related Ratios (Unaudited) 85 Schedule of Contributions (Unaudited) 86 Schedule of Investment Returns (Unaudited) 86Other Post Employment Benefit Plan Schedule of Changes in Net OPEB Liability and Related Ratios (Unaudited) 87 Schedule of Contributions (Unaudited) 88 Schedule of Investment Returns (Unaudited) 88 Schedule of Funding Progress (Unaudited) 89 Schedule of Employer Contributions (Unaudited) 89
Supplemental Information
Supplemental Schedules:Schedule of Revenues and Other Financial Sources and Their Disposition 90Schedule of Revenues and Their Disposition Compared to Annual Budget 91Schedule of Operation and Maintenance Expenses By Account (System Fund) 92 - 93Notes to Supplemental Schedules 94 - 95Combining Schedule of Fiduciary Net Position 96Combining Schedule of Changes in Fiduciary Net Position 96
Other Information
Statistical Section:Table of Contents 97Financial Trends Schedule 1 - Fund Net Position 98 Schedule 2 - Changes in Net Position 99 Schedule 3 - Net Position in System 100
COMPREHENSIVE ANNUAL FINANCIAL REPORT
SAN ANTONIO WATER SYSTEM
TABLE OF CONTENTSContinued
PageStatistical Section (continued):Revenue Capacity Schedule 4 - Water Production, Water Usage and Wastewater Treated 101 Schedule 5 - Sales by Source 102 Schedule 6 - Sales in Gallons 103 Schedule 7 - Number of Customer Connections 103 Schedule 8 - Residential Class Rates (Inside City Limits) 104 Schedule 9 - Residential Class Rates (Outside City Limits) 105 Schedule 10 - General Class Rates (Inside City Limits) 106 Schedule 11 - General Class Rates (Outside City Limits) 107 Schedule 12 - Wholesale Class Rates 108 Schedule 13 - Irrigation Class Rates 109 Schedule 14 - Other Fees 110 Schedule 15 - Recycled Water Rates 111 Schedule 16 - Impact Fees 112 Schedule 17 - Ten Largest Customers - Water 113 Schedule 18 - Ten Largest Customers - Wastewater 114 Schedule 19 - Ten Largest Customers - Wholesale Wastewater 115Debt Capacity Schedule 20 - Ratios of Total Outstanding Debt by Type 116 Schedule 21 - Pledged Revenue Coverage 117Demographic and Economic Information Schedule 22 - Demographic and Economic Statistics 118 Schedule 23 - Principal Employers 119Operating Information Schedule 24 - Number of Employees by Functional Group 120 Schedule 25 - Capital Assets 121 Map 1 - Map of Water Service Area 122 Schedule 26 - Operating and Capital Indicators - Water 123 Schedule 27 - Monthly Residential Service Charges for Ten Major Texas Cities - Water 124 Map 2 - Map of Wastewater Service Area 125 Schedule 28 - Operating and Capital Indicators - Wastewater 126 Schedule 29 - Monthly Residential Service Charges for Ten Major Texas Cities - Wastewater 127
Bonded Debt Schedules and Analyses:Analysis of Changes in Bonded Debt 128 - 174Water System Revenue Bonds - Total Debt Service to Maturity 175 - 177Water System Senior Lien Revenue Bonds - Total Debt Service to Maturity 178Water System Revenue Taxable Bonds - Series 2009B 179Water System Revenue Taxable Bonds - Series 2010B 180Water System Revenue Refunding Bonds - Series 2011 181Water System Revenue Refunding Bonds - Series 2011A 182Water System Revenue Refunding Bonds - Series 2012 183Water System Revenue and Refunding Bonds - Series 2012A 184Water System Junior Lien Revenue Bonds - Total Debt Service to Maturity 185 - 186Water System Junior Lien Revenue and Refunding Bonds - Series 2007 187Water System Junior Lien Revenue Bonds - Series 2009 188Water System Junior Lien Revenue and Refunding Bonds - Series 2009-A 189Water System Junior Lien Revenue and Refunding Bonds - Series 2010 190Water System Junior Lien Revenue and Refunding Bonds - Series 2010-A 191Water System Junior Lien Revenue Bonds - Series 2011 192Water System Junior Lien Revenue and Refunding Bonds - Series 2011-A 193Water System Junior Lien Revenue Refunding Bonds - Series 2012 (No Reserve Fund) 194Water System Junior Lien Revenue Bonds - Series 2012 195
COMPREHENSIVE ANNUAL FINANCIAL REPORT
SAN ANTONIO WATER SYSTEM
TABLE OF CONTENTSContinued Page
Bonded Debt Schedules and Analyses (continued):Water System Junior Lien Revenue Bonds - Series 2013A 196Water System Junior Lien Revenue Refunding Bonds - Series 2013B (No Reserve Fund) 197Water System Junior Lien Revenue Bonds - Series 2013C 198Water System Junior Lien Revenue Bonds - Series 2013D 199Water System Junior Lien Revenue Refunding Bonds - Series 2013E (No Reserve Fund) 200Water System Variable Rate Junior Lien Revenue Refunding Bonds - Series 2013F (No Reserve Fund) 201Water System Junior Lien Revenue Refunding Bonds - Series 2014A (No Reserve Fund) 202Water System Variable Rate Junior Lien Revenue Refunding Bonds - Series 2014B (No Reserve Fund) 203Water System Junior Lien Revenue Bonds - Series 2014C 204Water System Junior Lien Revenue Bonds - Series 2014D 205Water System Junior Lien Revenue Bonds - Series 2015A 206Water System Junior Lien Revenue Bonds - Series 2015B 207Water System Junior Lien Revenue Refunding Bonds - Series 2016A 208Water System Junior Lien Revenue Refunding Bonds - Taxable Series 2016B 209Water System Junior Lien Revenue and Refunding Bonds - Series 2016C 210Water System Junior Lien Revenue Bonds - Series 2016D 211Water System Junior Lien Revenue Bonds - Series 2016E 212Water System Junior Lien Revenue Refunding Bonds - Series 2017A 213Water System Junior Lien Revenue Bonds - Series 2018A 214Water System Junior Lien Revenue Bonds - Series 2018B 215Revenue Bond Debt Coverage Ratio 216
A1
March 27, 2019
Mr. Berto Guerra, Jr., Chairman Ms. Pat Jasso, Vice-Chairman Ms. Amy Hardberger, Secretary Ms. Pat Merritt, Assistant Secretary Mr. David McGee, Trustee Mr. Eduardo Parra, Trustee Hon. Ron Nirenberg, Mayor Trustees: In accordance with the requirements of City Ordinance No. 75686, we are pleased to submit herewith the Comprehensive Annual Financial Report (CAFR) of the San Antonio Water System (SAWS) for the year ended December 31, 2018. We believe that the financial and statistical information presented in the report is accurate in all material respects and that all disclosures necessary to enable the reader to gain an understanding of SAWS’ financial status have been included. The information contained in this report is the responsibility of management. Management assumes this responsibility based upon a comprehensive framework of internal control that it has established for this purpose. This internal control structure has been designed to ensure that the assets of SAWS are protected from loss, theft, or misuse and to ensure that adequate accounting data is compiled to allow for the preparation of financial statements in conformity with accounting principles generally accepted in the United States of America. The internal control structure is designed to provide reasonable, but not absolute, assurance that the objectives are met. The concept of reasonable assurance recognizes that (1) the cost of a control should not exceed the benefits likely to be derived and (2) the valuation of costs and benefits requires estimates and judgments by management. City Ordinance No. 75686 also requires that the annual financial report be submitted for audit by an independent accountant. The report of our independent auditors, Baker Tilly Virchow Krause, LLP is included in the financial section of the 2018 CAFR. Their report expresses an unmodified or “clean” opinion as to the fairness of the presentation of our financial statements. The independent audit involved examining, on a test basis, evidence supporting the amounts and disclosures in the financial statements; assessing the accounting principles used and significant estimates made by management; and evaluating the overall financial statement presentation. The results of the audit of SAWS for the year ended December 31, 2018 provided no instances of material weaknesses in the internal control structure. The Management’s Discussion and Analysis (MD&A) beginning on page 4 provides a narrative introduction, overview, and analysis of the basic financial statements. This transmittal letter complements the MD&A and should be read in conjunction with it.
A2
PROFILE OF SAN ANTONIO WATER SYSTEM On February 13, 1992, the City Council determined that it was in the best interest of the citizens of San Antonio (the City) and the customers served by the water and wastewater systems to consolidate all water systems, agencies and activities into one institution. This action was taken due to the myriad of issues confronting the City related to the development and protection of its water resources. Such consolidation provided the City a singular voice of representation when promoting or defending the City's goals and objectives related to water resource planning and development with local, regional, state and federal water authorities and officials. Final City Council approval for such consolidation was given on April 30, 1992 with the approval of Ordinance No. 75686, which provided for the consolidation of all city owned utilities related to water, including the water, wastewater, and water reuse systems, into the San Antonio Water System. The City, which is the county seat of Bexar County, is located in south central Texas, approximately 80 miles south of the state capital of Austin, 200 miles west of Houston and 150 miles northeast of Laredo on the Mexican border. The most recent population estimate from the U. S. Census Bureau is 1,511,913 for San Antonio and 1,958,578 for Bexar County. The U.S. Census Bureau currently ranks San Antonio as the second largest city in Texas and the seventh largest city in the United States. The climate in San Antonio is characterized by warm summers with mild winters. Based on data observed over a thirty year period, the average high temperature in August is 96 degrees Fahrenheit, with the average low temperature in January of 41 degrees. Precipitation for the City averages approximately 32 inches annually. SAWS includes all water resources, properties, facilities, and plants owned, operated and maintained by the City relating to supply, storage, treatment, transmission, and distribution of treated potable water; collection and treatment of wastewater; and distribution of recycled water. Additionally, SAWS owns and operates four thermal energy facilities providing chilled water services to governmental and private entities. In 2018, SAWS provided potable water service to over 502,000 customer connections which represents nearly all of the water utility customers in Bexar County, while providing wastewater services to more than 449,000 customer connections representing approximately 93% of the wastewater customers in Bexar County not utilizing septic systems. As of December 31, 2018, SAWS had 1,733 employees and provided maintenance for more than 12,670 miles of water and sewer mains. The complete management and control of SAWS has been vested in the San Antonio Water System Board of Trustees (“the Board”). The Board consists of the Mayor and six Trustees who are residents of the City of San Antonio or reside within the area serviced by SAWS. With the exception of the Mayor, all other trustees are appointed by the City Council for four year staggered terms and are eligible for reappointment for one additional four-year term. Four trustees must be appointed from four different quadrants in the City and two trustees are appointed from the north and south sides of the City. In addition to appointing the SAWS trustees, City Council must approve all changes in SAWS rates and any debt issued by SAWS. The general operations of SAWS are under the supervision of the President/Chief Executive Officer, who is employed by the Board. The financial statements of SAWS are presented in the CAFR of the City of San Antonio as a major discretely presented component unit. On January 28, 2012, SAWS assumed the operational control and management of the Bexar Metropolitan Water District (BexarMet). SAWS operated the former BexarMet as a separate entity known as SAWS District Special Project (SAWS DSP) from January 2012 until January 2016. In February 2016, all the outstanding debt of SAWS DSP was refunded with SAWS issued debt and the assets and liabilities of SAWS DSP were transferred to SAWS. On January 1, 2017, SAWS completed all legally required steps to fully integrate the operations and customers of the former BexarMet with SAWS. This final step of full integration included the application of consistent rates for both existing SAWS and former BexarMet customers.
A3
The mission, vision and values of the San Antonio Water System are as follows:
Mission Sustainable, Affordable, Water Services
Vision
To be leaders in delivering responsible water services for life
Values Excellence, Integrity and Respect
LOCAL ECONOMIC CONDITIONS The San Antonio economy has experienced robust, sustained growth since the mid-1990’s adding on average approximately 19,000 new residents a year over the last 20 years. This economic growth coupled with the net in-migration trends experienced in many areas of Texas has resulted in population growth that has exceeded national averages. While the rate of this growth slowed significantly during the recession occurring in the late 2000’s, growth has accelerated again during the last several years with the number of building permits issued for single and multi-family dwelling units in the last three years reaching levels not seen in almost a decade. According to the U.S. Census Bureau (2018), during 2017, Texas was home to three of the top five cities in the U.S. in terms of largest population gains, with San Antonio topping the list. In order to accommodate this influx of new residents, San Antonio relies on a very diverse economy which encompasses strategic positions in key employment sectors including government and military, biomedical sciences, medical services, tourism, and hospitality. San Antonio’s strong economic position is reflected in the fact that the San Antonio-New Braunfels MSA unemployment rate at year-end was 3.2%, marking the fifth consecutive year that the year-end rate has been below 4%. Additional information regarding demographic and economic conditions for San Antonio can be found in the Statistical Section of this report on pages 118 and 119. LONG-RANGE FINANCIAL PLANNING – MAJOR INITIATIVES In order to accomplish SAWS mission of providing sustainable, affordable water services to one of the fastest growing major cities in the country, long-range financial planning is critical. In support of SAWS long-range planning efforts, 25-year capital improvement master plans for both water and wastewater are maintained and incorporated into SAWS 20-year financial model. During the last several years and looking forward for at least the next five years, a significant portion of SAWS financial resources have been and will be dedicated to the following major initiatives:
Meeting the Water Supply Needs of a Growing Community – For most of its modern history, the City of San Antonio obtained nearly all of its water from the Edwards Aquifer. However, as a result of continued growth and regulations limiting withdrawals from the Edwards Aquifer, SAWS has been aggressively promoting water conservation while also developing new sources of water supply since its formation in 1992. Over the last 20 years, SAWS has brought on-line a number of new water sources including one of the nation’s largest recycled water systems, the development of alternative sources of groundwater and surface water supply, and the construction of a state-of-the-art groundwater desalination plant. While each of these projects were successful in providing for the short-term growth needs of the City, SAWS was still seeking a major alternative source of water supply, which would meet its needs for the next several decades. In November of 2014, SAWS entered into the Vista Ridge project, which is scheduled to provide 50,000 acre-feet of water to San Antonio for 60 years beginning in 2020. This first-of-its-kind water supply public-private partnership (P3) in Texas, which transfers risk of project development, financing, and water source availability to the private entity in return for the strong financial position provided by SAWS. While all of the construction expenditures associated
A4
with the production wells and the 142 mile pipeline necessary to deliver the water to San Antonio are the responsibility of the private entity, SAWS has begun making preparations to receive water deliveries, which are projected to equal approximately 20% of the current system demand, beginning in April 2020. During 2018, SAWS ramped up the construction of system improvements necessary to accept and integrate the Vista Ridge water. These improvements are currently projected to total approximately $210 million. Once water deliveries begin under the agreement, SAWS will be responsible for paying for all water made available each year up to 50,000 acre feet a year. It is estimated that the water will initially cost approximately $2,000 per acre foot, resulting in an estimated initial annual cost of approximately $100 million. Additional information regarding the Vista Ridge water supply project can be found in the Notes to Financial Statements of this report on pages 53-55.
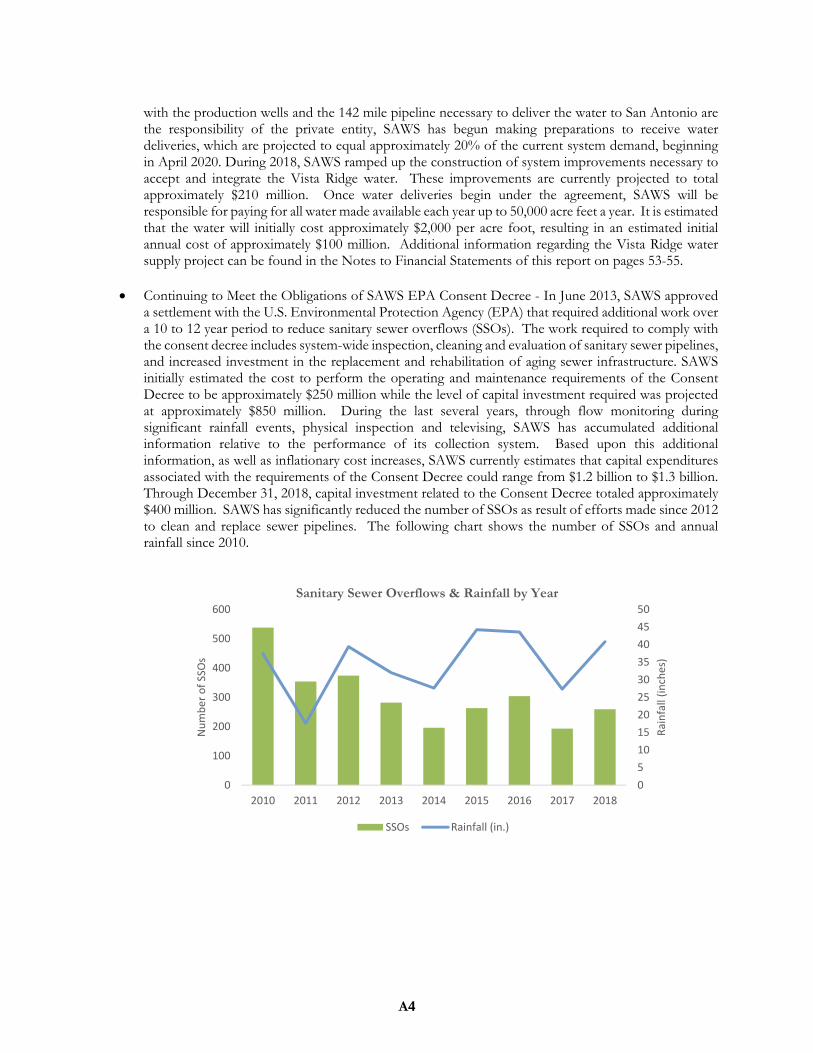
Continuing to Meet the Obligations of SAWS EPA Consent Decree - In June 2013, SAWS approved a settlement with the U.S. Environmental Protection Agency (EPA) that required additional work over a 10 to 12 year period to reduce sanitary sewer overflows (SSOs). The work required to comply with the consent decree includes system-wide inspection, cleaning and evaluation of sanitary sewer pipelines, and increased investment in the replacement and rehabilitation of aging sewer infrastructure. SAWS initially estimated the cost to perform the operating and maintenance requirements of the Consent Decree to be approximately $250 million while the level of capital investment required was projected at approximately $850 million. During the last several years, through flow monitoring during significant rainfall events, physical inspection and televising, SAWS has accumulated additional information relative to the performance of its collection system. Based upon this additional information, as well as inflationary cost increases, SAWS currently estimates that capital expenditures associated with the requirements of the Consent Decree could range from $1.2 billion to $1.3 billion. Through December 31, 2018, capital investment related to the Consent Decree totaled approximately $400 million. SAWS has significantly reduced the number of SSOs as result of efforts made since 2012 to clean and replace sewer pipelines. The following chart shows the number of SSOs and annual rainfall since 2010.
0
5
10
15
20
25
30
35
40
45
50
2010 2011 2012 2013 2014 2015 2016 2017 2018
0
100
200
300
400
500
600
Rainfall (inches)
Number of SSOs
Sanitary Sewer Overflows & Rainfall by Year
SSOs Rainfall (in.)
A5
Improving Service and Meeting Customer Expectations through Advanced Metering – During the last several years, SAWS has continued to evaluate the progress of advanced metering technology as it pertains to water utilities. Based on this analysis, SAWS currently has plans to begin a pilot project during 2019 to evaluate the benefits of fully implementing advanced metering infrastructure (AMI). Assuming the successful completion of the pilot project, SAWS currently anticipates beginning a full scale implementation in 2020. The complete deployment is projected to require a capital investment of approximately $170 million over a 3-5 year period. Successful AMI implementation will have a significant impact on the SAWS meter-to-cash process. It will greatly improve SAWS ability to provide relevant and timely information to SAWS customers about their water usage, in particular, potential leaks on the customer side of the meter. AMI should further benefit SAWS conservation efforts as it strives to meet the per capita reduction goals outlined in the 2017 Water Management Plan. The anticipated improvement in meter registration is also expected to have a positive impact on revenues while reducing non-revenue water.
RELEVANT FINANCIAL METRICS AND TARGETS SAWS has established and regularly tracks and reports on a number of key financial metrics, which are utilized to provide a basic framework for the financial management of SAWS and its planning and budgeting process. These metrics and the goals for these metrics have been formally communicated to the Board, who has acknowledged their importance and accepted the targeted levels as appropriate. During the current year, two of these metrics are particularly relevant in light of the $2.3 billion in projected capital spending over the 2019-2023 time horizon. During 2018, SAWS’ capital expenditures totaled $322 million with 36.7% or $122 million of those expenditures having been funded with cash sources. Historically, SAWS’ goal had been to fund approximately one-third of annual capital expenditures with cash sources. SAWS is working toward increasing cash funding to approximately 50% of capital expenditures. Increasing the capital expenditure cash funding ratio to 50% provides for the financial well-being of SAWS while also providing intergenerational equity by ensuring that both today’s customers as well as those in the future pay their fair share to maintain and improve SAWS water and sewer infrastructure. Given the approximately 50% higher than normal level of capital expenditures anticipated during the next five years, primarily to comply with the requirements of the Consent Decree, attainment of this metric over the next several years appears particularly challenging. In order to enhance the level of cash funding for capital expenditures during the next five years, SAWS has intentionally built up its level of unrestricted cash reserves to a point that they are currently in excess of SAWS targeted metric levels. SAWS currently targets to maintain approximately 300 days of operating and maintenance expenses in its unrestricted cash reserves in order to provide sufficient liquidity during periods of unforeseen financial stress. As of the end of 2018, SAWS maintains 556 days cash on hand, however, much of this unrestricted cash is committed to the funding of previously awarded construction contracts or is anticipated to be utilized to cash fund future capital improvements. Over the course of the next several years, SAWS anticipates the level of its days cash on hand to return to its targeted level. 2018 and 2019 Rate Adjustments In December 2017, the City Council approved rate adjustments for both 2018 and 2019 primarily to facilitate the ongoing wastewater collection system improvements required to be made in connection with the EPA Consent Decree as well as to prepare for the delivery of water from the Vista Ridge project. It is estimated that the 5.8% 2018 rate adjustment served to increase SAWS operating revenues by approximately $36 million during 2018 while the 2019 rate adjustment of 4.7% is projected to generate an additional $27 million. The two years of approved rate adjustments reflect the ongoing commitment of the SAWS Board and City Council to continued improvement and maintenance of water and sewer infrastructure in San Antonio.

B
SAN ANTONIO WATER SYSTEM
BOARD OF TRUSTEES
Heriberto Guerra, Jr. Chairman
Pat Jasso Vice Chairman
Amy Hardberger Secretary David McGee
Pat Merritt Assistant Secretary Eduardo Parra
Ron Nirenberg, ex Officio
C
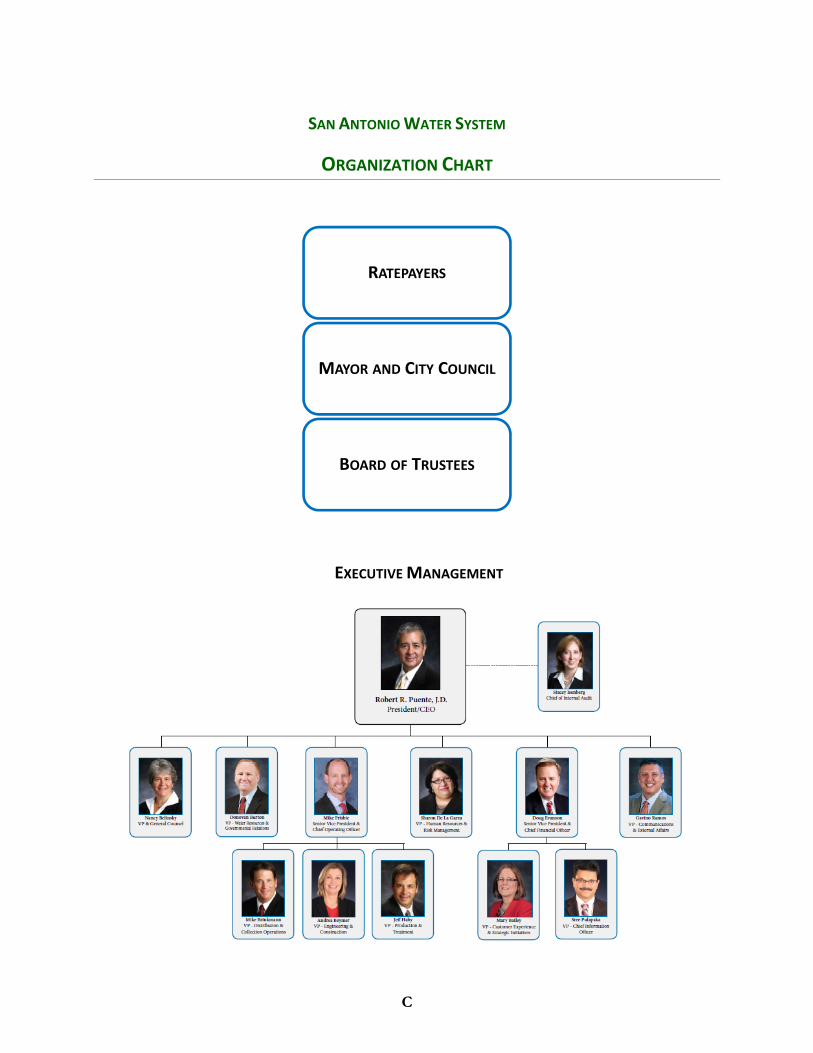
SAN ANTONIO WATER SYSTEM
ORGANIZATION CHART
EXECUTIVE MANAGEMENT
RATEPAYERS
MAYOR AND CITY COUNCIL
BOARD OF TRUSTEES
D

This Page Intentionally Left Blank
Comprehensive Annual Financial Report
FINANCIAL SECTION

This Page Intentionally Left Blank
INDEPENDENT AUDITORS' REPORT
To the Board of Trustees San Antonio Water System San Antonio, Texas
Report on the Financial Statements
We have audited the accompanying financial statements of the business-type activities and the aggregate remaining fund information of San Antonio Water System (SAWS), a component unit of the City of San Antonio, Texas, as of and for the years ended December 31, 2018 and 2017, and the related notes to the financial statements, which collectively comprise SAWS’ basic financial statements as listed in the table of contents.
Management’s Responsibility for the Financial Statements
Management is responsible for the preparation and fair presentation of these financial statements in accordance with accounting principles generally accepted in the United States of America; this includes the design, implementation, and maintenance of internal control relevant to the preparation and fair presentation of financial statements that are free from material misstatement, whether due to fraud or error.
Auditors’ Responsibility
Our responsibility is to express opinions on these financial statements based on our audits. We conducted our audits in accordance with auditing standards generally accepted in the United States of America and the standards applicable to financial audits contained in Government Auditing Standards issued by the Comptroller General of the United States. Those standards require that we plan and perform the audits to obtain reasonable assurance about whether the financial statements are free from material misstatement.
An audit involves performing procedures to obtain audit evidence about the amounts and disclosures in the financial statements. The procedures selected depend on the auditors’ judgment, including the assessment of the risks of material misstatement of the financial statements, whether due to fraud or error. In making those risk assessments, the auditor considers internal control relevant to SAWS’ preparation and fair presentation of the financial statements in order to design audit procedures that are appropriate in the circumstances, but not for the purpose of expressing an opinion on the effectiveness of SAWS’ internal control. Accordingly, we express no such opinion. An audit also includes evaluating the appropriateness of accounting policies used and the reasonableness of significant accounting estimates made by management, as well as evaluating the overall presentation of the financial statements.
We believe that the audit evidence we have obtained is sufficient and appropriate to provide a basis for our audit opinions.
Opinions
In our opinion, the financial statements referred to above present fairly, in all material respects, the respective financial position of the business-type activities and the aggregate remaining fund information of SAWS, as of December 31, 2018 and 2017, and the respective changes in financial position and, where applicable, cash flows thereof for the years then ended, in accordance with accounting principles generally accepted in the United States of America.
Baker Tilly Virchow Krause, LLP trading as Baker Tilly is a member of the global network of Baker Tilly International Ltd., the members of which are separate and independent legal entities. © 2018 Baker Tilly Virchow Krause, LLP
1
Emphasis of Matter As discussed in Note A, SAWS adopted the provisions of GASB Statement No. 75, Accounting and Financial Reporting for Other Postemployment Benefits Other Than Pension effective January 1, 2018. The cumulative effect of the change is shown in the current year. Our opinion is not modified with respect to this matter. Other Matters Required Supplementary Information Accounting principles generally accepted in the United States of America require that the required supplementary information as listed in the table of contents be presented to supplement the basic financial statements. Such information, although not a part of the basic financial statements, is required by the Governmental Accounting Standards Board who considers it to be an essential part of financial reporting for placing the basic financial statements in an appropriate operational, economic, or historical context. We have applied certain limited procedures to the required supplementary information in accordance with auditing standards generally accepted in the United States of America, which consisted of inquiries of management about the methods of preparing the information and comparing the information for consistency with management's responses to our inquiries, the basic financial statements, and other knowledge we obtained during our audit of the basic financial statements. We do not express an opinion or provide any assurance on the information because the limited procedures do not provide us with sufficient evidence to express an opinion or provide any assurance. Supplementary Information Our audits were conducted for the purpose of forming opinions on the financial statements as a whole. The supplemental information as listed in the table of contents is presented for purposes of additional analysis and is not a required part of the basic financial statements. Such information is the responsibility of management and was derived from and relates directly to the underlying accounting and other records used to prepare the basic financial statements. The information has been subjected to the auditing procedures applied in the audits of the basic financial statements and certain additional procedures, including comparing and reconciling such information directly to the underlying accounting and other records used to prepare the basic financial statements or to the basic financial statements themselves, and other additional procedures in accordance with auditing standards generally accepted in the United States of America. In our opinion, the supplemental information as of and for the years ended December 31, 2018 and 2017, is fairly stated in all material respects in relation to the financial statements as a whole.
Other Information Our audits were conducted for the purpose of forming opinions on the financial statements as a whole. The introduction, statistical section and bonded debt schedules and analyses information as identified in the table of contents are presented for purposes of additional analysis and are not a required part of the basic financial statements. Such information has not been subjected to the auditing procedures applied in the audits of the basic financial statements, and accordingly, we express no opinion or provide any assurance on it.
2
Other Reporting Required by Government Auditing Standards In accordance with Government Auditing Standards, we have issued our report dated March 27, 2019, on our consideration of SAWS’ internal control over financial reporting and on our tests of its compliance with certain provisions of laws, regulations, contracts, and grant agreements and other matters. The purpose of that report is to describe the scope of our testing of internal control over financial reporting and compliance and the results of that testing, and not to provide an opinion on the internal control over financial reporting or on compliance. That report is an integral part of an audit performed in accordance with Government Auditing Standards in considering SAWS’ internal control over financial reporting and compliance.
Austin, Texas March 27, 2019
3
4
Management’s Discussion and Analysis
(Unaudited) This Management’s Discussion and Analysis (MD&A) serves as an introduction to the basic financial statements and provides a narrative overview and analysis of financial activities and performance as detailed in the Comprehensive Annual Financial Report (CAFR) for fiscal years ending December 31, 2018 and 2017. Please read it in conjunction with SAWS’ financial statements including the notes to the financial statements and required supplemental information, which follow this section. FINANCIAL HIGHLIGHTS
SAWS’ net position increased by $252.5 million during 2018, including an increase in unrestricted net position of $89.8 million.
Total assets and deferred outflows of resources increased $302.8 million from 2017 to 2018, including net capital asset growth of $214.3 million and an increase in unrestricted cash and investments of $109.1 million.
SAWS refunded $40.8 million in long-term debt, reducing future debt service payments by nearly $7.9 million and resulting in an economic gain of $2.9 million.
Operating revenues increased $24.3 million or 4% from 2017 to 2018 primarily due to rate adjustments implemented during the year.
Total debt coverage was 2.01x for 2018 compared to 1.89x for 2017. OVERVIEW OF THE FINANCIAL STATEMENTS MD&A is intended to serve as an introduction to the basic financial statements, which are comprised of the following components:
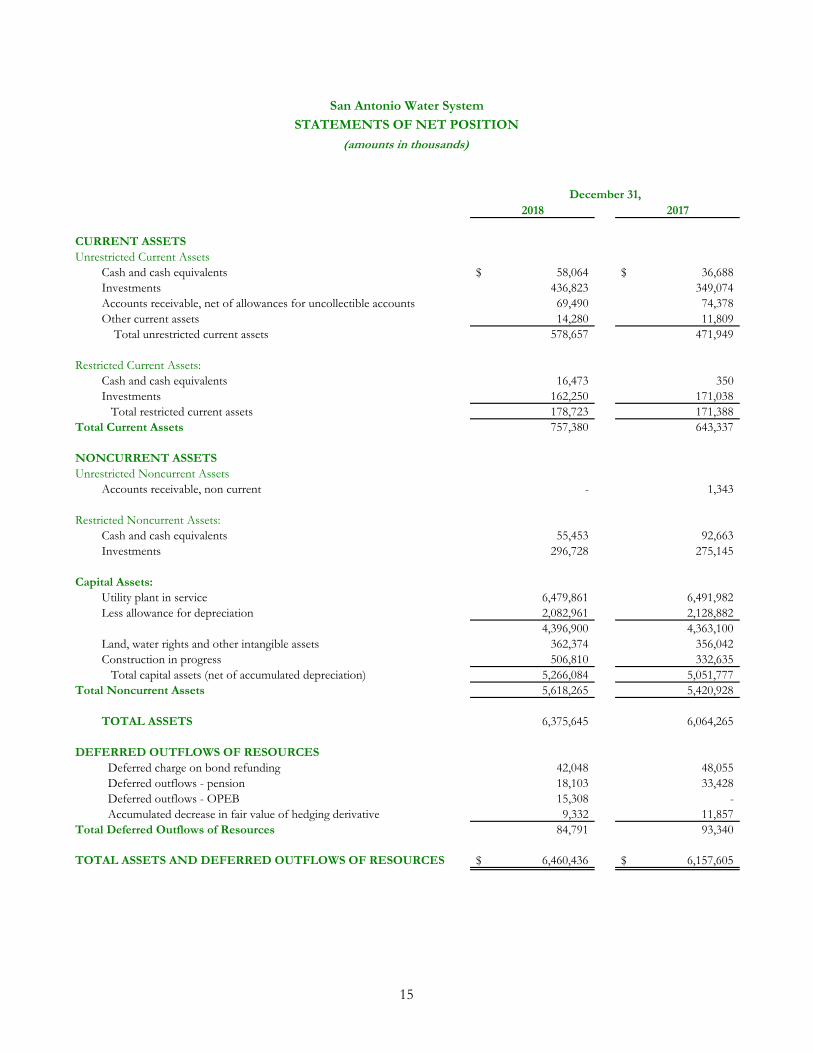
Statements of Net Position - present information on all of SAWS’ assets, deferred outflows of resources, liabilities and deferred inflows of resources as of the end of each calendar year, with the net amount reported as SAWS’ net position. Over time, increases or decreases in net position may serve as a useful indicator of whether the financial position of SAWS is improving or deteriorating.
Statements of Revenues, Expenses and Changes in Net Position - present information showing how SAWS’ net position changed during the years presented on an accrual basis. This statement measures the success of SAWS’ activities and can be used to determine whether SAWS has successfully recovered all its costs through its rates and other charges.
Statements of Cash Flows – reflect cash receipts and payments for operating, non-capital financing, capital and related financing, and investing activities for the years presented.
San Antonio Water System Fiduciary Funds Statements of Fiduciary Net Position – present information on SAWS single-employer postretirement benefit plans’ assets and liabilities, with the difference between the two reported as net position held in trust for pension and other postemployment benefits.
San Antonio Water System Fiduciary Funds Statements of Changes in Fiduciary Net Position – present information showing how the fiduciary funds’ net position changed during the years presented on an accrual basis.
Notes to financial statements - provide additional information that is essential to a full understanding of the data provided in the financial statements, such as SAWS’ accounting policies, significant account balances and activities, material risks, obligations, commitments, contingencies and subsequent events, if any.
5
Required Supplemental Information – Historical information is presented concerning SAWS’ defined benefit plans including changes in the net pension and other postemployment benefit liabilities, annual contributions made to benefit plans, and annual investment returns.
Supplemental information is presented to provide supporting schedules, which are not a required part of the basic financial statements.
Supplemental Schedules – Includes schedules that provide information relative to the sources and uses of funds in accordance with SAWS’ founding ordinance and budgetary information and combining schedules for the fiduciary funds.
Other information is presented for additional analysis and is also not a required part of the basic financial statements.
Statistical Section – Presents detailed information as a context for understanding what the information in the financial statements, note disclosures and required supplementary information says about SAWS’ overall financial health.
Bonded Debt Schedules and Analyses – Includes detailed schedules that provide information relative to SAWS’ various bond obligations.
FINANCIAL ANALYSIS – FINANCIAL POSITION
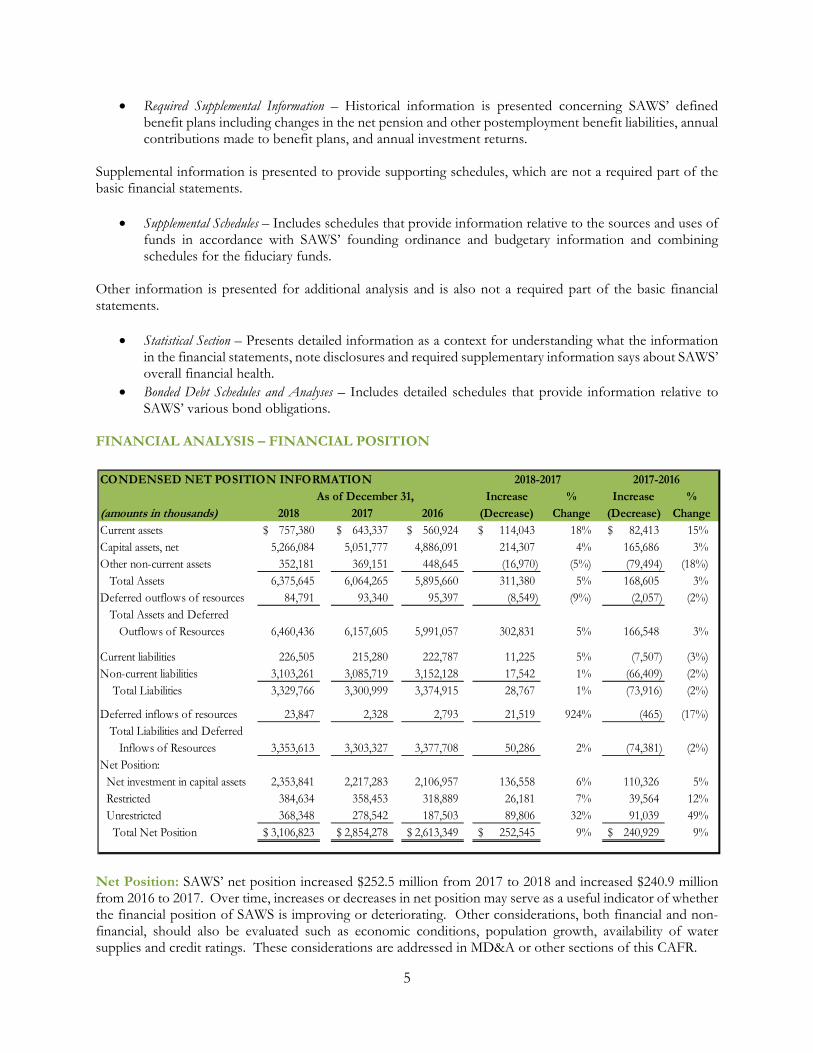
Net Position: SAWS’ net position increased $252.5 million from 2017 to 2018 and increased $240.9 million from 2016 to 2017. Over time, increases or decreases in net position may serve as a useful indicator of whether the financial position of SAWS is improving or deteriorating. Other considerations, both financial and non-financial, should also be evaluated such as economic conditions, population growth, availability of water supplies and credit ratings. These considerations are addressed in MD&A or other sections of this CAFR.
CONDENSED NET POSITION INFORMATION 2018-2017 2017-2016As of December 31, Increase % Increase %
(amounts in thousands) 2018 2017 2016 (Decrease) Change (Decrease) ChangeCurrent assets 757,380$ 643,337$ 560,924$ 114,043$ 18% 82,413$ 15%Capital assets, net 5,266,084 5,051,777 4,886,091 214,307 4% 165,686 3%Other non-current assets 352,181 369,151 448,645 (16,970) (5%) (79,494) (18%) Total Assets 6,375,645 6,064,265 5,895,660 311,380 5% 168,605 3%Deferred outflows of resources 84,791 93,340 95,397 (8,549) (9%) (2,057) (2%) Total Assets and Deferred Outflows of Resources 6,460,436 6,157,605 5,991,057 302,831 5% 166,548 3%
Current liabilities 226,505 215,280 222,787 11,225 5% (7,507) (3%)Non-current liabilities 3,103,261 3,085,719 3,152,128 17,542 1% (66,409) (2%) Total Liabilities 3,329,766 3,300,999 3,374,915 28,767 1% (73,916) (2%)
Deferred inflows of resources 23,847 2,328 2,793 21,519 924% (465) (17%) Total Liabilities and Deferred Inflows of Resources 3,353,613 3,303,327 3,377,708 50,286 2% (74,381) (2%)Net Position: Net investment in capital assets 2,353,841 2,217,283 2,106,957 136,558 6% 110,326 5% Restricted 384,634 358,453 318,889 26,181 7% 39,564 12% Unrestricted 368,348 278,542 187,503 89,806 32% 91,039 49% Total Net Position 3,106,823$ 2,854,278$ 2,613,349$ 252,545$ 9% 240,929$ 9%
6
The largest portion of SAWS’ net position reflects its net investment in capital assets. SAWS’ net investment in capital assets represents the carrying value of capital assets and capital related deferred outflows of resources, less capital related borrowings. The primary reasons for an increase in the net investment in capital assets are capital assets acquired with non-debt resources, including assets contributed by developers, and repayments of debt. Depreciation expense serves to decrease the net investment in capital assets. SAWS’ net investment in capital assets increased by $136.6 million between 2017 and 2018 and $110.3 million from 2016 to 2017. Funds that have been restricted for a specific purpose by legally enforceable legislation and bond covenants are classified as restricted net position. In accordance with City of San Antonio Ordinance 75686, SAWS must maintain an operating reserve equal to two months of the annual maintenance and operations budget. SAWS is also required to make monthly transfers to a Debt Service Fund sufficient to make the semi-annual debt service payments on outstanding bonds. Cash and investments restricted for construction purposes, net of any related liabilities, are also reflected in these totals. Finally, SAWS must accumulate and maintain a Debt Service Reserve equal to 100% of the maximum annual debt service requirements for senior lien debt obligations plus the average annual debt service on all junior lien debt obligations secured by the Debt Service Reserve. SAWS may provide surety policies equal to all or part of the required debt service reserve. Restricted net position increased $26.2 million from 2017 to 2018 and increased $39.6 million from 2016 to 2017 primarily due to changes in amounts restricted for construction. The remaining balance of SAWS’ net position is unrestricted and may be used for any allowable purpose as outlined in Ordinance 75686. Unrestricted net position increased $89.8 million from 2017 to 2018 and $91.0 million from 2016 to 2017 as funds provided by operations exceeded transfers to the Debt Service Fund and capital expenditures paid with renewal and replacement funds. Additionally, during 2018 SAWS adopted GASB Statement No. 75, which resulted in the recording of a change to unrestricted net position as of January 1, 2018 of $18.3 million. For further information on adopting GASB Statement No. 75, refer to Note L.
Remainder of this page is intentionally left blank
7
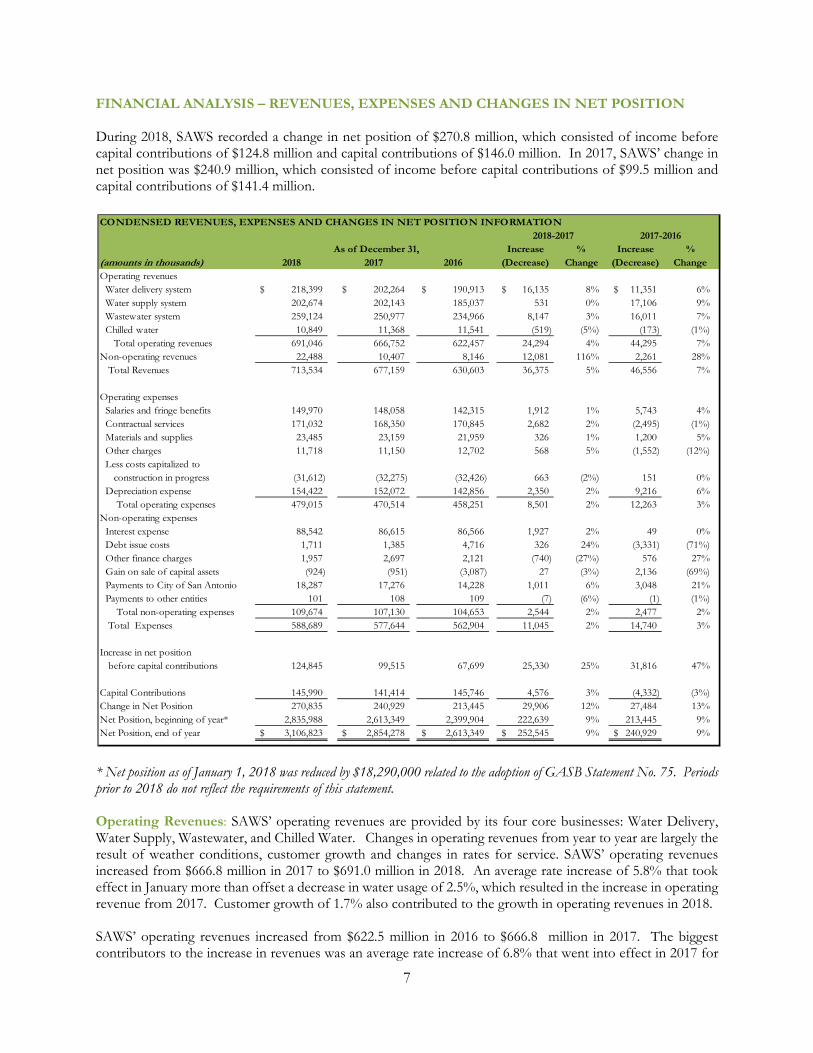
FINANCIAL ANALYSIS – REVENUES, EXPENSES AND CHANGES IN NET POSITION During 2018, SAWS recorded a change in net position of $270.8 million, which consisted of income before capital contributions of $124.8 million and capital contributions of $146.0 million. In 2017, SAWS’ change in net position was $240.9 million, which consisted of income before capital contributions of $99.5 million and capital contributions of $141.4 million.
* Net position as of January 1, 2018 was reduced by $18,290,000 related to the adoption of GASB Statement No. 75. Periods prior to 2018 do not reflect the requirements of this statement. Operating Revenues: SAWS’ operating revenues are provided by its four core businesses: Water Delivery, Water Supply, Wastewater, and Chilled Water. Changes in operating revenues from year to year are largely the result of weather conditions, customer growth and changes in rates for service. SAWS’ operating revenues increased from $666.8 million in 2017 to $691.0 million in 2018. An average rate increase of 5.8% that took effect in January more than offset a decrease in water usage of 2.5%, which resulted in the increase in operating revenue from 2017. Customer growth of 1.7% also contributed to the growth in operating revenues in 2018. SAWS’ operating revenues increased from $622.5 million in 2016 to $666.8 million in 2017. The biggest contributors to the increase in revenues was an average rate increase of 6.8% that went into effect in 2017 for
CONDENSED REVENUES, EXPENSES AND CHANGES IN NET POSITION INFORMATION2018-2017 2017-2016
As of December 31, Increase % Increase %(amounts in thousands) 2018 2017 2016 (Decrease) Change (Decrease) ChangeOperating revenues Water delivery system 218,399$ 202,264$ 190,913$ 16,135$ 8% 11,351$ 6% Water supply system 202,674 202,143 185,037 531 0% 17,106 9% Wastewater system 259,124 250,977 234,966 8,147 3% 16,011 7% Chilled water 10,849 11,368 11,541 (519) (5%) (173) (1%) Total operating revenues 691,046 666,752 622,457 24,294 4% 44,295 7%Non-operating revenues 22,488 10,407 8,146 12,081 116% 2,261 28% Total Revenues 713,534 677,159 630,603 36,375 5% 46,556 7%
Operating expenses Salaries and fringe benefits 149,970 148,058 142,315 1,912 1% 5,743 4% Contractual services 171,032 168,350 170,845 2,682 2% (2,495) (1%) Materials and supplies 23,485 23,159 21,959 326 1% 1,200 5% Other charges 11,718 11,150 12,702 568 5% (1,552) (12%) Less costs capitalized to construction in progress (31,612) (32,275) (32,426) 663 (2%) 151 0% Depreciation expense 154,422 152,072 142,856 2,350 2% 9,216 6% Total operating expenses 479,015 470,514 458,251 8,501 2% 12,263 3%Non-operating expenses Interest expense 88,542 86,615 86,566 1,927 2% 49 0% Debt issue costs 1,711 1,385 4,716 326 24% (3,331) (71%) Other finance charges 1,957 2,697 2,121 (740) (27%) 576 27% Gain on sale of capital assets (924) (951) (3,087) 27 (3%) 2,136 (69%) Payments to City of San Antonio 18,287 17,276 14,228 1,011 6% 3,048 21% Payments to other entities 101 108 109 (7) (6%) (1) (1%) Total non-operating expenses 109,674 107,130 104,653 2,544 2% 2,477 2% Total Expenses 588,689 577,644 562,904 11,045 2% 14,740 3%
Increase in net position before capital contributions 124,845 99,515 67,699 25,330 25% 31,816 47%
Capital Contributions 145,990 141,414 145,746 4,576 3% (4,332) (3%)Change in Net Position 270,835 240,929 213,445 29,906 12% 27,484 13%Net Position, beginning of year* 2,835,988 2,613,349 2,399,904 222,639 9% 213,445 9%Net Position, end of year 3,106,823$ 2,854,278$ 2,613,349$ 252,545$ 9% 240,929$ 9%
8
most of SAWS customers and an increase in water usage over the prior year of 2.7%. Beginning in 2017, a class of SAWS customers located in the former District Special Project (DSP) service area moved to the rates paid by all other SAWS customers. Customer growth averaged 1.6% during 2017, contributing to the growth in operating revenues in 2017. The Water Delivery core business is responsible for the actual distribution of water from its source to the customer’s premises. Operating revenues for this business are derived through a combination of a monthly service charge that is dependent upon the size of the customer’s water meter and a volume charge that relates to the customer’s metered water usage. Water Delivery operating revenues increased $16.1 million or 8% to $218.4 million for 2018 largely as a result of the 9.7% rate adjustment for this business unit, which went into effect in January. Water Delivery operating revenues increased $11.4 million or 6% from 2016 to 2017 largely as a result of a rate increase of 8.6% and increased usage of 2.7%. The transition of former DSP customers to SAWS rates in 2017 partially offset the impact of the SAWS rate increase.
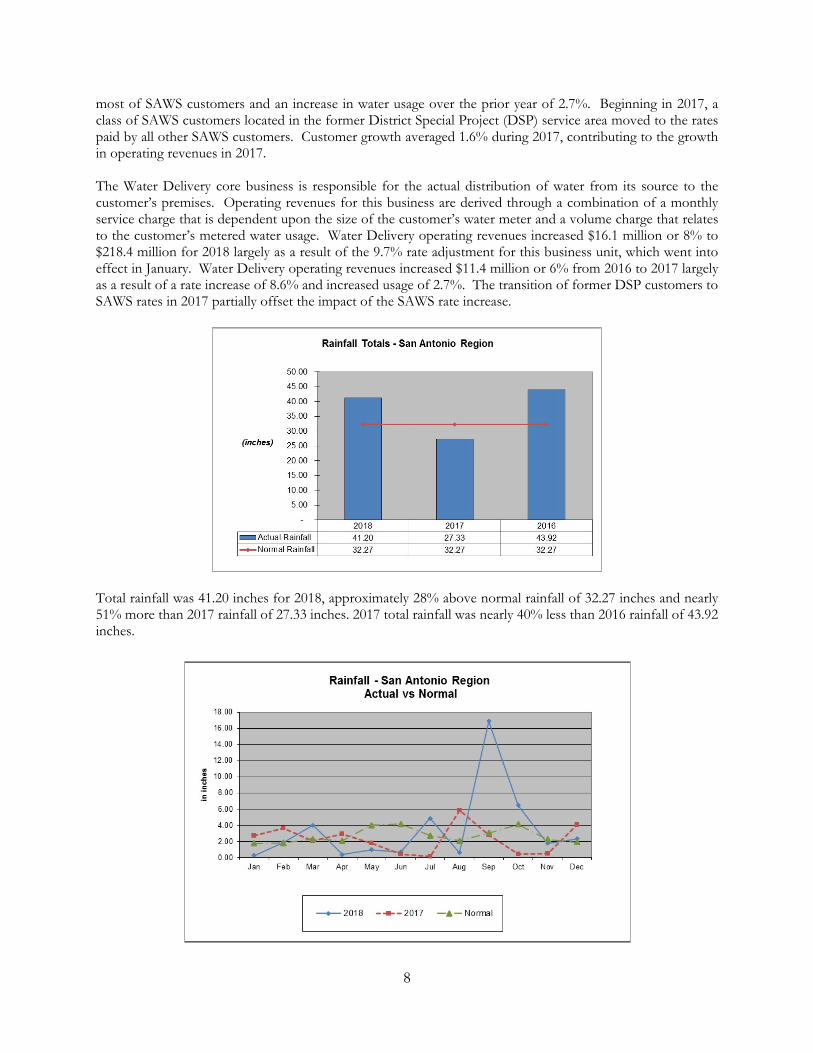
Total rainfall was 41.20 inches for 2018, approximately 28% above normal rainfall of 32.27 inches and nearly 51% more than 2017 rainfall of 27.33 inches. 2017 total rainfall was nearly 40% less than 2016 rainfall of 43.92 inches.
9
The Water Supply core business is responsible for all functions related to the development and provision of additional water resources. In order to support the costs associated with these initiatives, in 2000, SAWS implemented a separate funding mechanism, known as the Water Supply Fee, for water supply development and water quality protection. Certain other charges are also included in Water Supply operating revenues including the following:
pass-through fees designed to recoup the annual fees paid to the Edwards Aquifer Authority (EAA) for permitted water rights
meter fees and volumetric charges to customers utilizing recycled water for industrial or irrigation purposes
allocated portions of water delivery revenues designed to fund residential and commercial conservation programs and debt service associated with water supply and recycle projects in progress prior to the implementation of a separate Water Supply Fee
Water Supply operating revenues increased $0.5 million or 0.3% from 2017 to $202.7 million for 2018 as a result of a 4.5% water supply rate increase that mitigated decreased water usage. Water Supply operating revenues increased $17.1 million or 9% from 2016 to 2017 as a result of a 6.9% rate increase and increased water usage. The transition of DSP customers to SAWS rates also served to increase Water Supply operating revenues in 2017.
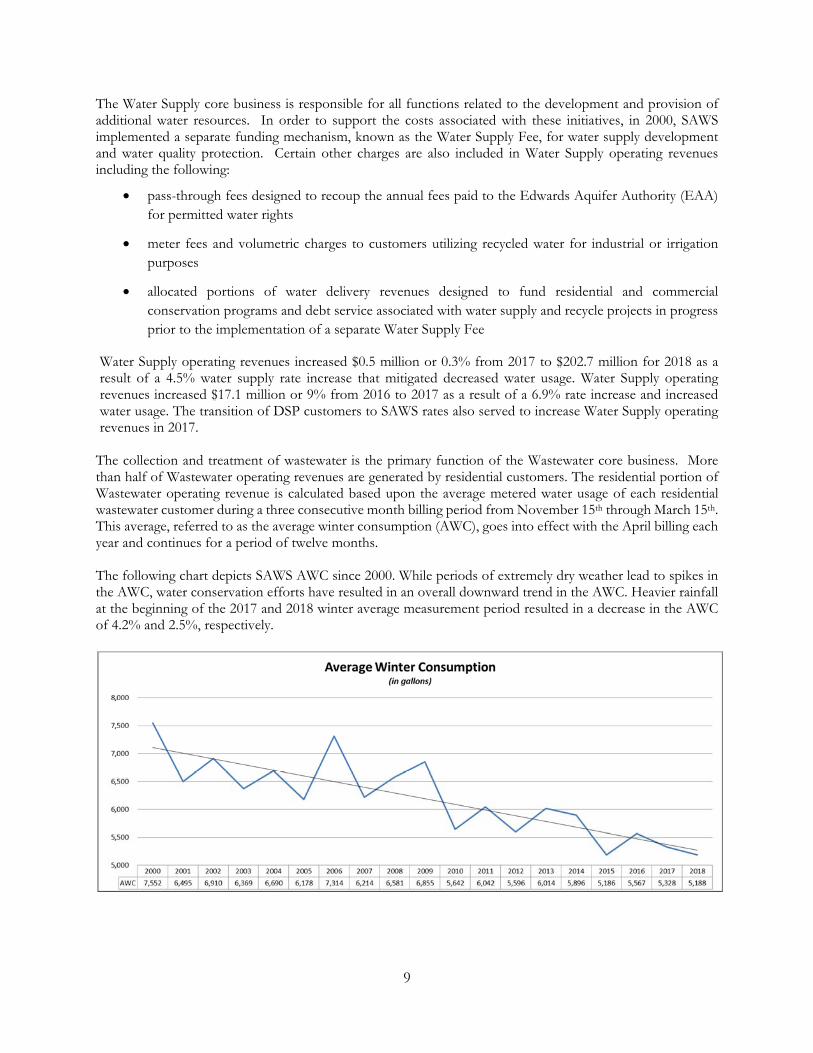
The collection and treatment of wastewater is the primary function of the Wastewater core business. More than half of Wastewater operating revenues are generated by residential customers. The residential portion of Wastewater operating revenue is calculated based upon the average metered water usage of each residential wastewater customer during a three consecutive month billing period from November 15th through March 15th. This average, referred to as the average winter consumption (AWC), goes into effect with the April billing each year and continues for a period of twelve months. The following chart depicts SAWS AWC since 2000. While periods of extremely dry weather lead to spikes in the AWC, water conservation efforts have resulted in an overall downward trend in the AWC. Heavier rainfall at the beginning of the 2017 and 2018 winter average measurement period resulted in a decrease in the AWC of 4.2% and 2.5%, respectively.
10
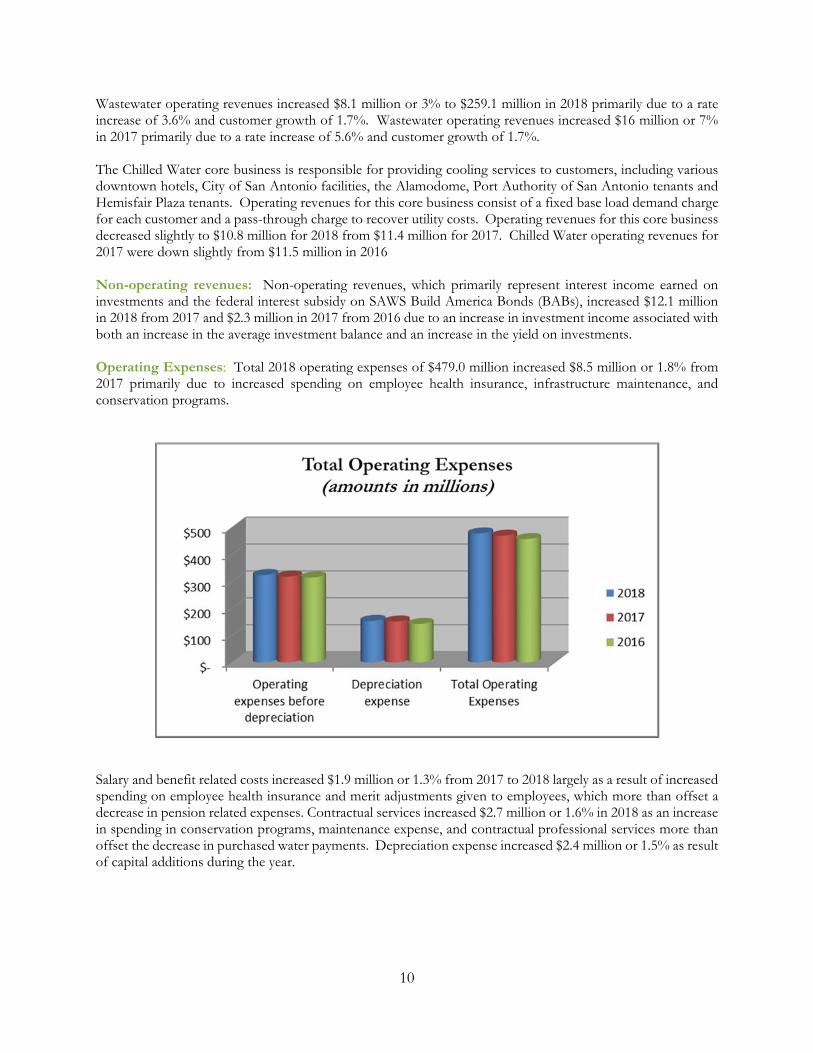
Wastewater operating revenues increased $8.1 million or 3% to $259.1 million in 2018 primarily due to a rate increase of 3.6% and customer growth of 1.7%. Wastewater operating revenues increased $16 million or 7% in 2017 primarily due to a rate increase of 5.6% and customer growth of 1.7%. The Chilled Water core business is responsible for providing cooling services to customers, including various downtown hotels, City of San Antonio facilities, the Alamodome, Port Authority of San Antonio tenants and Hemisfair Plaza tenants. Operating revenues for this core business consist of a fixed base load demand charge for each customer and a pass-through charge to recover utility costs. Operating revenues for this core business decreased slightly to $10.8 million for 2018 from $11.4 million for 2017. Chilled Water operating revenues for 2017 were down slightly from $11.5 million in 2016 Non-operating revenues: Non-operating revenues, which primarily represent interest income earned on investments and the federal interest subsidy on SAWS Build America Bonds (BABs), increased $12.1 million in 2018 from 2017 and $2.3 million in 2017 from 2016 due to an increase in investment income associated with both an increase in the average investment balance and an increase in the yield on investments. Operating Expenses: Total 2018 operating expenses of $479.0 million increased $8.5 million or 1.8% from 2017 primarily due to increased spending on employee health insurance, infrastructure maintenance, and conservation programs.
Salary and benefit related costs increased $1.9 million or 1.3% from 2017 to 2018 largely as a result of increased spending on employee health insurance and merit adjustments given to employees, which more than offset a decrease in pension related expenses. Contractual services increased $2.7 million or 1.6% in 2018 as an increase in spending in conservation programs, maintenance expense, and contractual professional services more than offset the decrease in purchased water payments. Depreciation expense increased $2.4 million or 1.5% as result of capital additions during the year.
11
Total 2017 expenses of $470.5 million increased $12.3 million or 2.7% from 2017 levels as increases in salaries and benefits, and depreciation were partially offset by decreases in contractual services and other charges. Salary and benefit related costs increased from 2016 largely as a result of merit adjustments given to employees and a 1.7% increase in filled positions. Contractual services decreased in 2017 as a decrease in purchased water payments and contractual services related to sewer line condition assessment and cleaning more than offset the increase in electrical expenses associated with SAWS new groundwater desalination facility. The increase in depreciation expense resulted from capital additions during the year, including the groundwater desalination plant that came online in early 2017.
Non-operating Expenses: Non-operating expenses increased $2.5 million or 2.4% in 2018 driven by an increase in interest expense and payments to the City of San Antonio. The $1.9 million increase in interest expense reflects a rise in short-term borrowing costs, while the increase in the payments to the City of San Antonio are attributable to increased revenues. Non-operating expenses increased $2.5 million or 2% in 2017 as an increase in payments to the City of San Antonio and a reduction in the gain on sale of assets was partially offset by a decrease in debt issue costs.
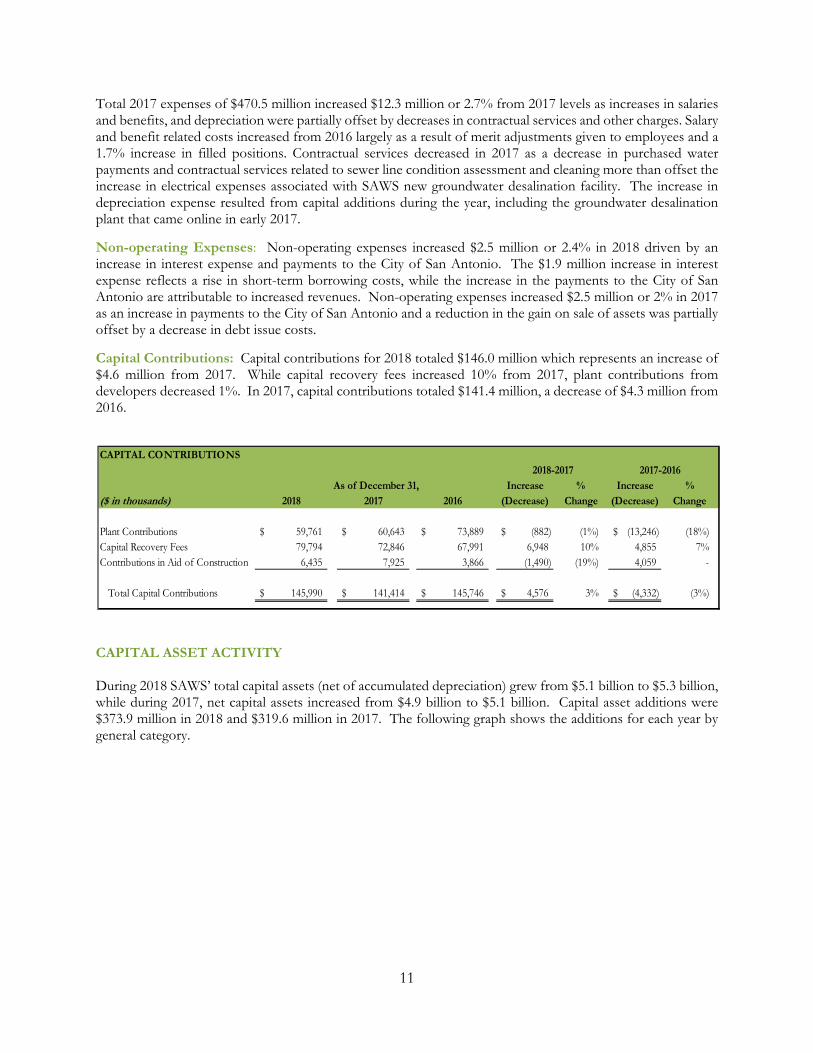
Capital Contributions: Capital contributions for 2018 totaled $146.0 million which represents an increase of $4.6 million from 2017. While capital recovery fees increased 10% from 2017, plant contributions from developers decreased 1%. In 2017, capital contributions totaled $141.4 million, a decrease of $4.3 million from 2016.
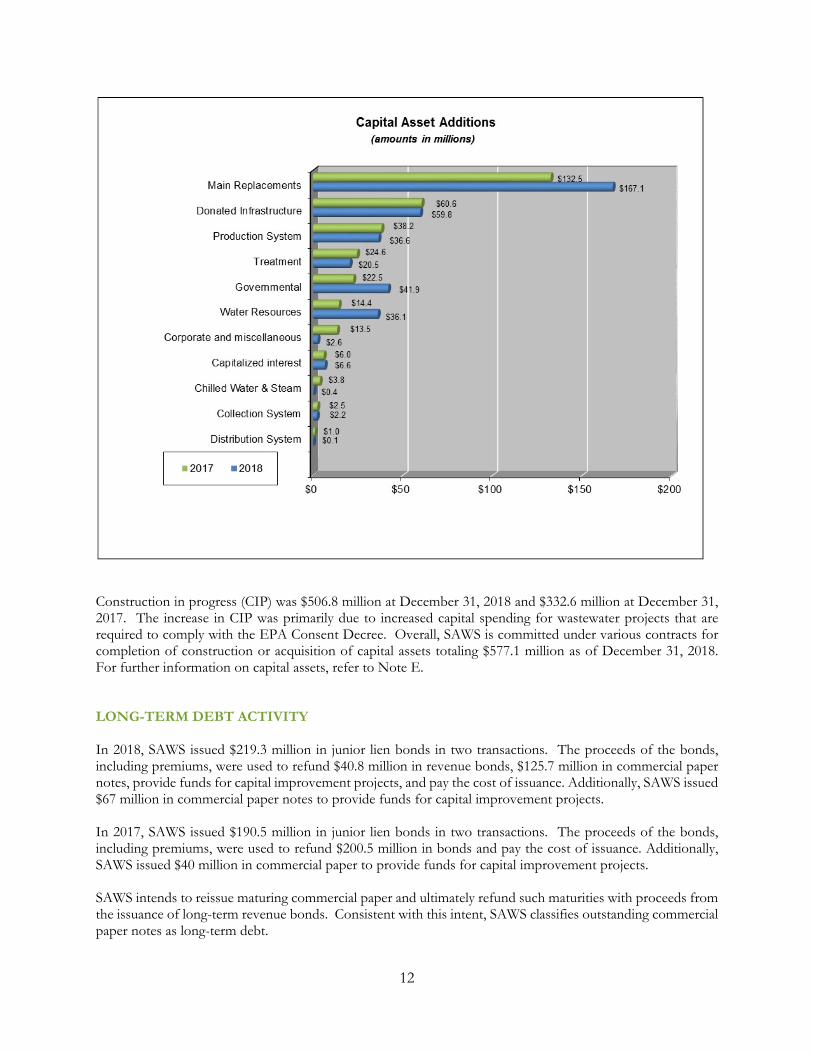
CAPITAL ASSET ACTIVITY During 2018 SAWS’ total capital assets (net of accumulated depreciation) grew from $5.1 billion to $5.3 billion, while during 2017, net capital assets increased from $4.9 billion to $5.1 billion. Capital asset additions were $373.9 million in 2018 and $319.6 million in 2017. The following graph shows the additions for each year by general category.
CAPITAL CONTRIBUTIONS2018-2017 2017-2016
As of December 31, Increase % Increase %($ in thousands) 2018 2017 2016 (Decrease) Change (Decrease) Change
Plant Contributions 59,761$ 60,643$ 73,889$ (882)$ (1%) (13,246)$ (18%)Capital Recovery Fees 79,794 72,846 67,991 6,948 10% 4,855 7%Contributions in Aid of Construction 6,435 7,925 3,866 (1,490) (19%) 4,059 -
Total Capital Contributions 145,990$ 141,414$ 145,746$ 4,576$ 3% (4,332)$ (3%)
12
Construction in progress (CIP) was $506.8 million at December 31, 2018 and $332.6 million at December 31, 2017. The increase in CIP was primarily due to increased capital spending for wastewater projects that are required to comply with the EPA Consent Decree. Overall, SAWS is committed under various contracts for completion of construction or acquisition of capital assets totaling $577.1 million as of December 31, 2018. For further information on capital assets, refer to Note E. LONG-TERM DEBT ACTIVITY In 2018, SAWS issued $219.3 million in junior lien bonds in two transactions. The proceeds of the bonds, including premiums, were used to refund $40.8 million in revenue bonds, $125.7 million in commercial paper notes, provide funds for capital improvement projects, and pay the cost of issuance. Additionally, SAWS issued $67 million in commercial paper notes to provide funds for capital improvement projects. In 2017, SAWS issued $190.5 million in junior lien bonds in two transactions. The proceeds of the bonds, including premiums, were used to refund $200.5 million in bonds and pay the cost of issuance. Additionally, SAWS issued $40 million in commercial paper to provide funds for capital improvement projects. SAWS intends to reissue maturing commercial paper and ultimately refund such maturities with proceeds from the issuance of long-term revenue bonds. Consistent with this intent, SAWS classifies outstanding commercial paper notes as long-term debt.
13
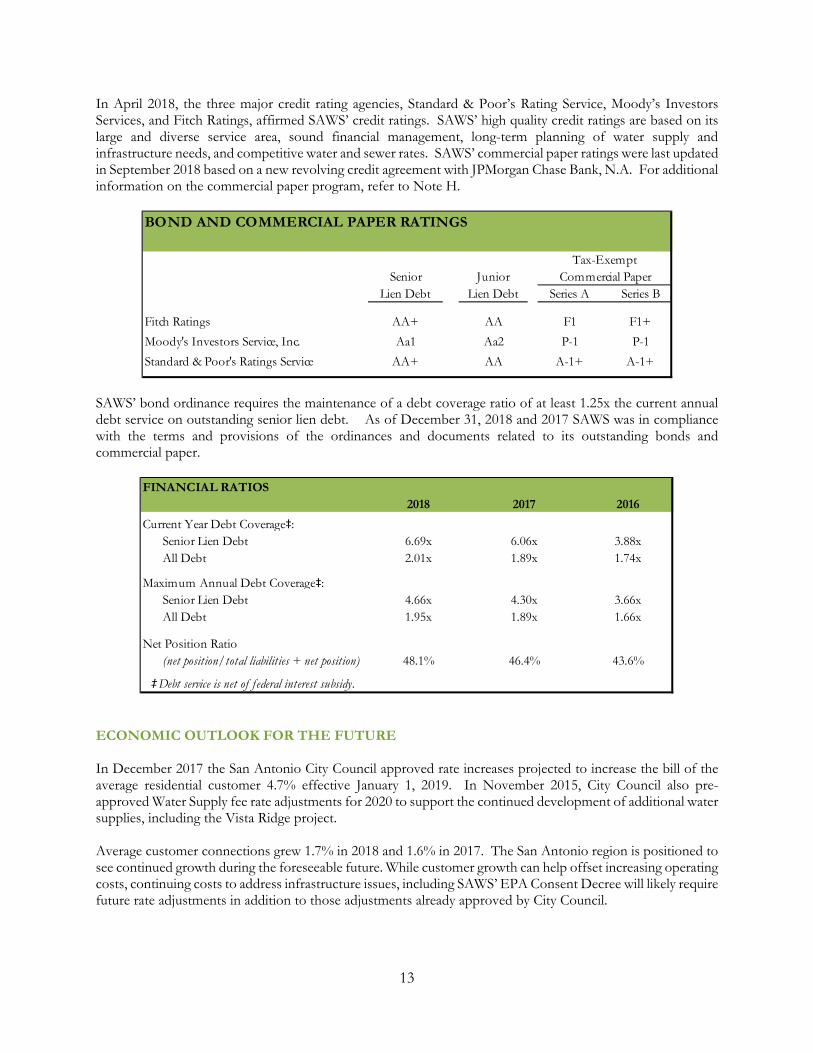
In April 2018, the three major credit rating agencies, Standard & Poor’s Rating Service, Moody’s Investors Services, and Fitch Ratings, affirmed SAWS’ credit ratings. SAWS’ high quality credit ratings are based on its large and diverse service area, sound financial management, long-term planning of water supply and infrastructure needs, and competitive water and sewer rates. SAWS’ commercial paper ratings were last updated in September 2018 based on a new revolving credit agreement with JPMorgan Chase Bank, N.A. For additional information on the commercial paper program, refer to Note H.
SAWS’ bond ordinance requires the maintenance of a debt coverage ratio of at least 1.25x the current annual debt service on outstanding senior lien debt. As of December 31, 2018 and 2017 SAWS was in compliance with the terms and provisions of the ordinances and documents related to its outstanding bonds and commercial paper.
ECONOMIC OUTLOOK FOR THE FUTURE In December 2017 the San Antonio City Council approved rate increases projected to increase the bill of the average residential customer 4.7% effective January 1, 2019. In November 2015, City Council also pre-approved Water Supply fee rate adjustments for 2020 to support the continued development of additional water supplies, including the Vista Ridge project. Average customer connections grew 1.7% in 2018 and 1.6% in 2017. The San Antonio region is positioned to see continued growth during the foreseeable future. While customer growth can help offset increasing operating costs, continuing costs to address infrastructure issues, including SAWS’ EPA Consent Decree will likely require future rate adjustments in addition to those adjustments already approved by City Council.
BOND AND COMMERCIAL PAPER RATINGS
Senior JuniorLien Debt Lien Debt Series A Series B
Fitch Ratings AA+ AA F1 F1+
Moody's Investors Service, Inc. Aa1 Aa2 P-1 P-1
Standard & Poor's Ratings Service AA+ AA A-1+ A-1+
Tax-ExemptCommercial Paper
FINANCIAL RATIOS2018 2017 2016
Current Year Debt Coverage‡:Senior Lien Debt 6.69x 6.06x 3.88xAll Debt 2.01x 1.89x 1.74x
Maximum Annual Debt Coverage‡:Senior Lien Debt 4.66x 4.30x 3.66xAll Debt 1.95x 1.89x 1.66x
Net Position Ratio (net position/total liabilities + net position) 48.1% 46.4% 43.6%
‡Debt service is net of f ederal interest subsidy.
14
CONTACTING SAWS’ FINANCIAL MANAGEMENT This Comprehensive Annual Financial Report is provided to our citizens, customers, investors and creditors as a general overview of SAWS’ financial condition and results of operation with a general explanation of the factors affecting the finances of the organization. It is provided to demonstrate SAWS’ accountability for the revenues it collects and the expenditures it makes for the services provided. If you have questions about this report or need additional financial information, contact either of the following:
Cecilia Velasquez Director of Accounting/Controller Email: [email protected] Douglas P. Evanson Sr.Vice President/Chief Financial Officer
Email: [email protected]
Mailing address: San Antonio Water System PO Box 2449 San Antonio, TX 78298 Information about the San Antonio Water System can also be obtained through the Internet at www.saws.org.
Comprehensive Annual Financial Report
BASIC FINANCIAL STATEMENTS
2018 2017
CURRENT ASSETSUnrestricted Current Assets
Cash and cash equivalents 58,064$ 36,688$ Investments 436,823 349,074 Accounts receivable, net of allowances for uncollectible accounts 69,490 74,378 Other current assets 14,280 11,809 Total unrestricted current assets 578,657 471,949
Restricted Current Assets:Cash and cash equivalents 16,473 350 Investments 162,250 171,038 Total restricted current assets 178,723 171,388
Total Current Assets 757,380 643,337
NONCURRENT ASSETSUnrestricted Noncurrent Assets
Accounts receivable, non current - 1,343
Restricted Noncurrent Assets:Cash and cash equivalents 55,453 92,663 Investments 296,728 275,145
Capital Assets:Utility plant in service 6,479,861 6,491,982 Less allowance for depreciation 2,082,961 2,128,882
4,396,900 4,363,100 Land, water rights and other intangible assets 362,374 356,042 Construction in progress 506,810 332,635 Total capital assets (net of accumulated depreciation) 5,266,084 5,051,777
Total Noncurrent Assets 5,618,265 5,420,928
TOTAL ASSETS 6,375,645 6,064,265
DEFERRED OUTFLOWS OF RESOURCES Deferred charge on bond refunding 42,048 48,055 Deferred outflows - pension 18,103 33,428 Deferred outflows - OPEB 15,308 - Accumulated decrease in fair value of hedging derivative 9,332 11,857
Total Deferred Outflows of Resources 84,791 93,340
TOTAL ASSETS AND DEFERRED OUTFLOWS OF RESOURCES 6,460,436$ 6,157,605$
San Antonio Water System
STATEMENTS OF NET POSITION
(amounts in thousands)
December 31,
15
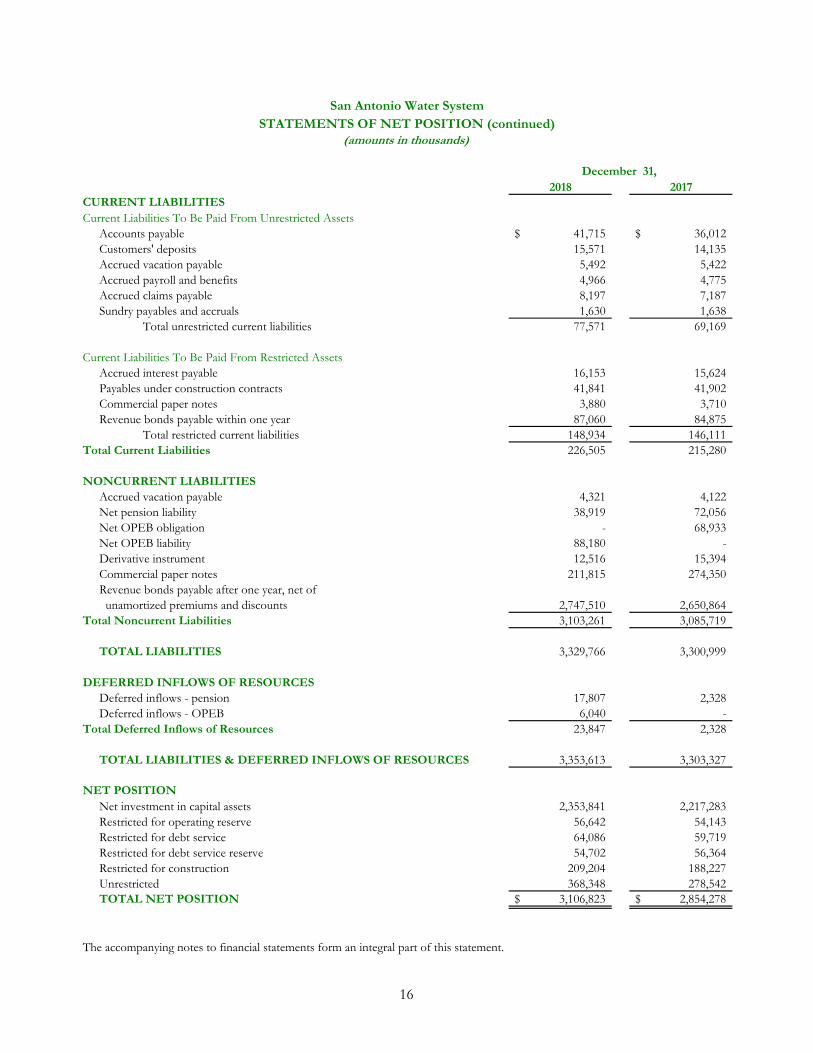
2018 2017
Current Liabilities To Be Paid From Unrestricted AssetsAccounts payable 41,715$ 36,012$ Customers' deposits 15,571 14,135 Accrued vacation payable 5,492 5,422 Accrued payroll and benefits 4,966 4,775 Accrued claims payable 8,197 7,187 Sundry payables and accruals 1,630 1,638 Total unrestricted current liabilities 77,571 69,169
Current Liabilities To Be Paid From Restricted AssetsAccrued interest payable 16,153 15,624 Payables under construction contracts 41,841 41,902 Commercial paper notes 3,880 3,710 Revenue bonds payable within one year 87,060 84,875 Total restricted current liabilities 148,934 146,111
Total Current Liabilities 226,505 215,280
NONCURRENT LIABILITIESAccrued vacation payable 4,321 4,122 Net pension liability 38,919 72,056 Net OPEB obligation - 68,933 Net OPEB liability 88,180 - Derivative instrument 12,516 15,394 Commercial paper notes 211,815 274,350 Revenue bonds payable after one year, net of unamortized premiums and discounts 2,747,510 2,650,864
Total Noncurrent Liabilities 3,103,261 3,085,719
TOTAL LIABILITIES 3,329,766 3,300,999
DEFERRED INFLOWS OF RESOURCESDeferred inflows - pension 17,807 2,328 Deferred inflows - OPEB 6,040 -
Total Deferred Inflows of Resources 23,847 2,328
TOTAL LIABILITIES & DEFERRED INFLOWS OF RESOURCES 3,353,613 3,303,327
Net investment in capital assets 2,353,841 2,217,283 Restricted for operating reserve 56,642 54,143 Restricted for debt service 64,086 59,719 Restricted for debt service reserve 54,702 56,364 Restricted for construction 209,204 188,227 Unrestricted 368,348 278,542 TOTAL NET POSITION 3,106,823$ 2,854,278$
The accompanying notes to financial statements form an integral part of this statement.
San Antonio Water SystemSTATEMENTS OF NET POSITION (continued)
(amounts in thousands)
NET POSITION
CURRENT LIABILITIES
December 31,
16

This Page Intentionally Left Blank
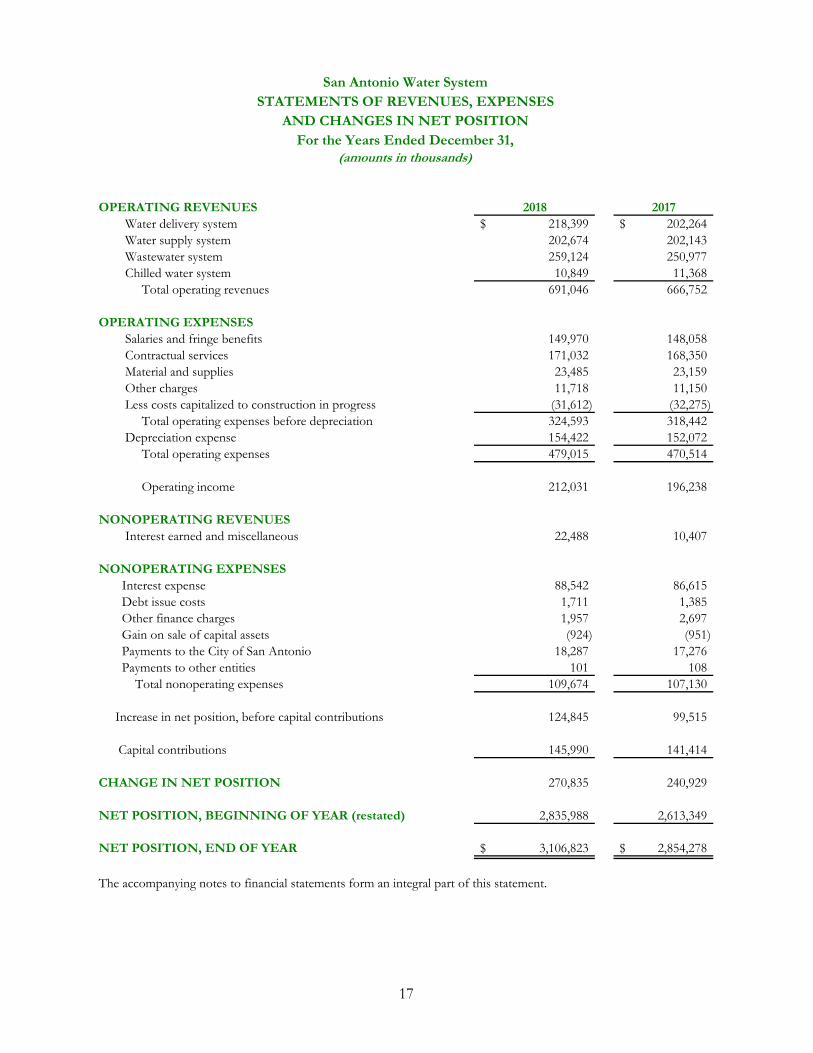
OPERATING REVENUES 2018 2017 Water delivery system 218,399$ 202,264$ Water supply system 202,674 202,143 Wastewater system 259,124 250,977 Chilled water system 10,849 11,368 Total operating revenues 691,046 666,752
OPERATING EXPENSES Salaries and fringe benefits 149,970 148,058 Contractual services 171,032 168,350 Material and supplies 23,485 23,159 Other charges 11,718 11,150 Less costs capitalized to construction in progress (31,612) (32,275) Total operating expenses before depreciation 324,593 318,442 Depreciation expense 154,422 152,072 Total operating expenses 479,015 470,514
Operating income 212,031 196,238
NONOPERATING REVENUES Interest earned and miscellaneous 22,488 10,407
NONOPERATING EXPENSES Interest expense 88,542 86,615 Debt issue costs 1,711 1,385 Other finance charges 1,957 2,697 Gain on sale of capital assets (924) (951) Payments to the City of San Antonio 18,287 17,276 Payments to other entities 101 108 Total nonoperating expenses 109,674 107,130
Increase in net position, before capital contributions 124,845 99,515
Capital contributions 145,990 141,414
CHANGE IN NET POSITION 270,835 240,929
NET POSITION, BEGINNING OF YEAR (restated) 2,835,988 2,613,349
NET POSITION, END OF YEAR 3,106,823$ 2,854,278$
The accompanying notes to financial statements form an integral part of this statement.
San Antonio Water SystemSTATEMENTS OF REVENUES, EXPENSES
AND CHANGES IN NET POSITIONFor the Years Ended December 31,
(amounts in thousands)
17
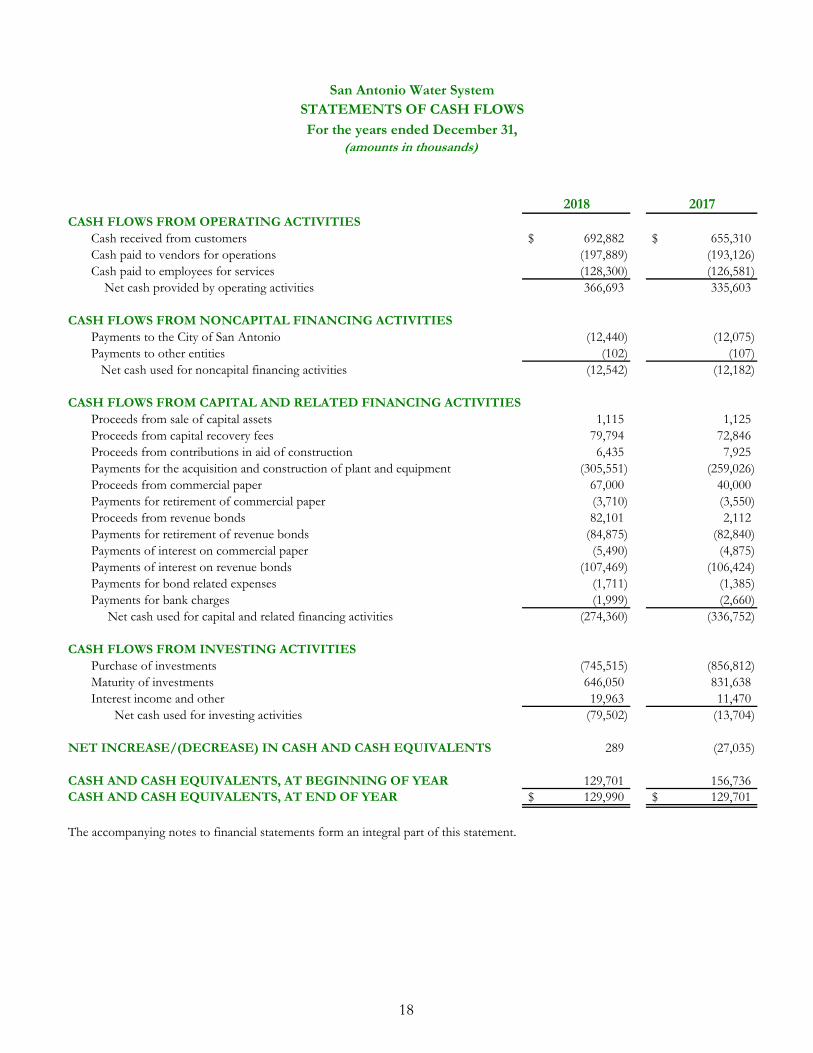
2018 2017CASH FLOWS FROM OPERATING ACTIVITIES
Cash received from customers 692,882$ 655,310$ Cash paid to vendors for operations (197,889) (193,126) Cash paid to employees for services (128,300) (126,581) Net cash provided by operating activities 366,693 335,603
CASH FLOWS FROM NONCAPITAL FINANCING ACTIVITIESPayments to the City of San Antonio (12,440) (12,075) Payments to other entities (102) (107) Net cash used for noncapital financing activities (12,542) (12,182)
CASH FLOWS FROM CAPITAL AND RELATED FINANCING ACTIVITIESProceeds from sale of capital assets 1,115 1,125 Proceeds from capital recovery fees 79,794 72,846 Proceeds from contributions in aid of construction 6,435 7,925 Payments for the acquisition and construction of plant and equipment (305,551) (259,026) Proceeds from commercial paper 67,000 40,000 Payments for retirement of commercial paper (3,710) (3,550) Proceeds from revenue bonds 82,101 2,112 Payments for retirement of revenue bonds (84,875) (82,840) Payments of interest on commercial paper (5,490) (4,875) Payments of interest on revenue bonds (107,469) (106,424) Payments for bond related expenses (1,711) (1,385) Payments for bank charges (1,999) (2,660) Net cash used for capital and related financing activities (274,360) (336,752)
CASH FLOWS FROM INVESTING ACTIVITIESPurchase of investments (745,515) (856,812) Maturity of investments 646,050 831,638 Interest income and other 19,963 11,470 Net cash used for investing activities (79,502) (13,704)
NET INCREASE/(DECREASE) IN CASH AND CASH EQUIVALENTS 289 (27,035)
CASH AND CASH EQUIVALENTS, AT BEGINNING OF YEAR 129,701 156,736 CASH AND CASH EQUIVALENTS, AT END OF YEAR 129,990$ 129,701$
The accompanying notes to financial statements form an integral part of this statement.
San Antonio Water SystemSTATEMENTS OF CASH FLOWS
For the years ended December 31,(amounts in thousands)
18
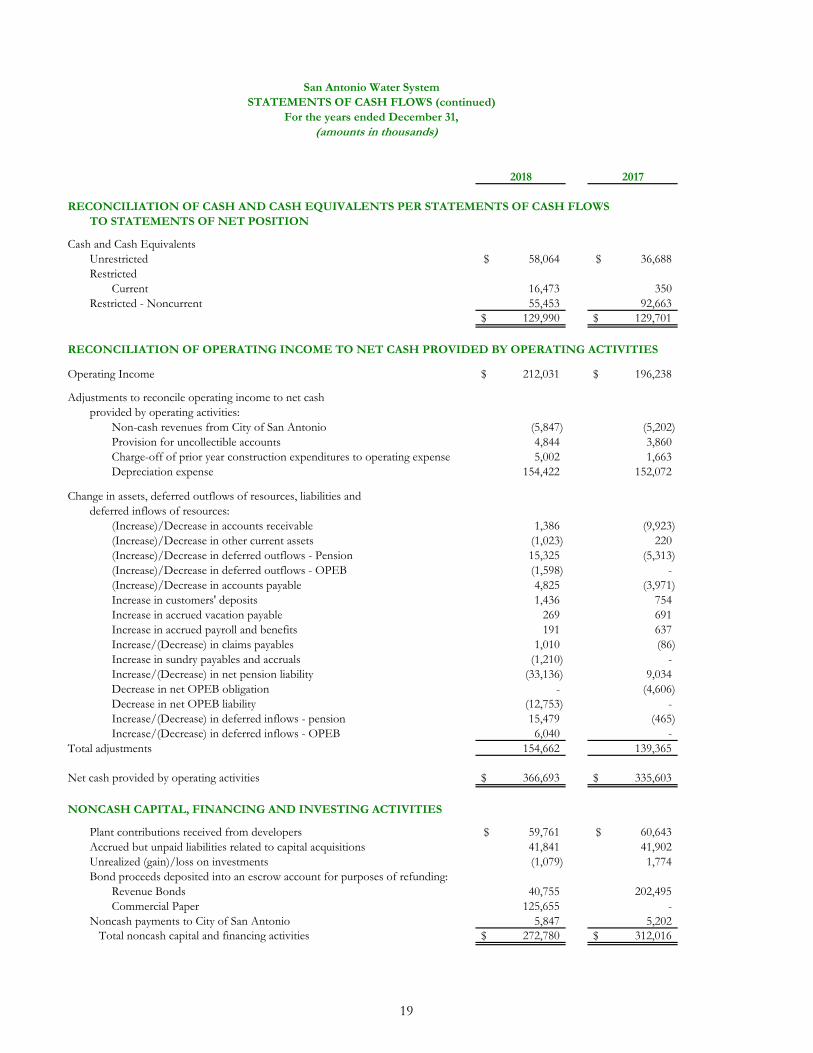
2018 2017
RECONCILIATION OF CASH AND CASH EQUIVALENTS PER STATEMENTS OF CASH FLOWS TO STATEMENTS OF NET POSITION
Cash and Cash EquivalentsUnrestricted 58,064$ 36,688$ Restricted
Current 16,473 350 Restricted - Noncurrent 55,453 92,663
129,990$ 129,701$
RECONCILIATION OF OPERATING INCOME TO NET CASH PROVIDED BY OPERATING ACTIVITIES Operating Income 212,031$ 196,238$
Adjustments to reconcile operating income to net cashprovided by operating activities:
Non-cash revenues from City of San Antonio (5,847) (5,202) Provision for uncollectible accounts 4,844 3,860 Charge-off of prior year construction expenditures to operating expense 5,002 1,663 Depreciation expense 154,422 152,072
Change in assets, deferred outflows of resources, liabilities and deferred inflows of resources:
(Increase)/Decrease in accounts receivable 1,386 (9,923) (Increase)/Decrease in other current assets (1,023) 220 (Increase)/Decrease in deferred outflows - Pension 15,325 (5,313) (Increase)/Decrease in deferred outflows - OPEB (1,598) - (Increase)/Decrease in accounts payable 4,825 (3,971) Increase in customers' deposits 1,436 754 Increase in accrued vacation payable 269 691 Increase in accrued payroll and benefits 191 637 Increase/(Decrease) in claims payables 1,010 (86) Increase in sundry payables and accruals (1,210) - Increase/(Decrease) in net pension liability (33,136) 9,034 Decrease in net OPEB obligation - (4,606) Decrease in net OPEB liability (12,753) - Increase/(Decrease) in deferred inflows - pension 15,479 (465) Increase/(Decrease) in deferred inflows - OPEB 6,040 -
Total adjustments 154,662 139,365
Net cash provided by operating activities 366,693$ 335,603$
NONCASH CAPITAL, FINANCING AND INVESTING ACTIVITIES
Plant contributions received from developers 59,761$ 60,643$ Accrued but unpaid liabilities related to capital acquisitions 41,841 41,902 Unrealized (gain)/loss on investments (1,079) 1,774 Bond proceeds deposited into an escrow account for purposes of refunding:
Revenue Bonds 40,755 202,495 Commercial Paper 125,655 -
Noncash payments to City of San Antonio 5,847 5,202 Total noncash capital and financing activities 272,780$ 312,016$
San Antonio Water SystemSTATEMENTS OF CASH FLOWS (continued)
For the years ended December 31, (amounts in thousands)
19

This Page Intentionally Left Blank
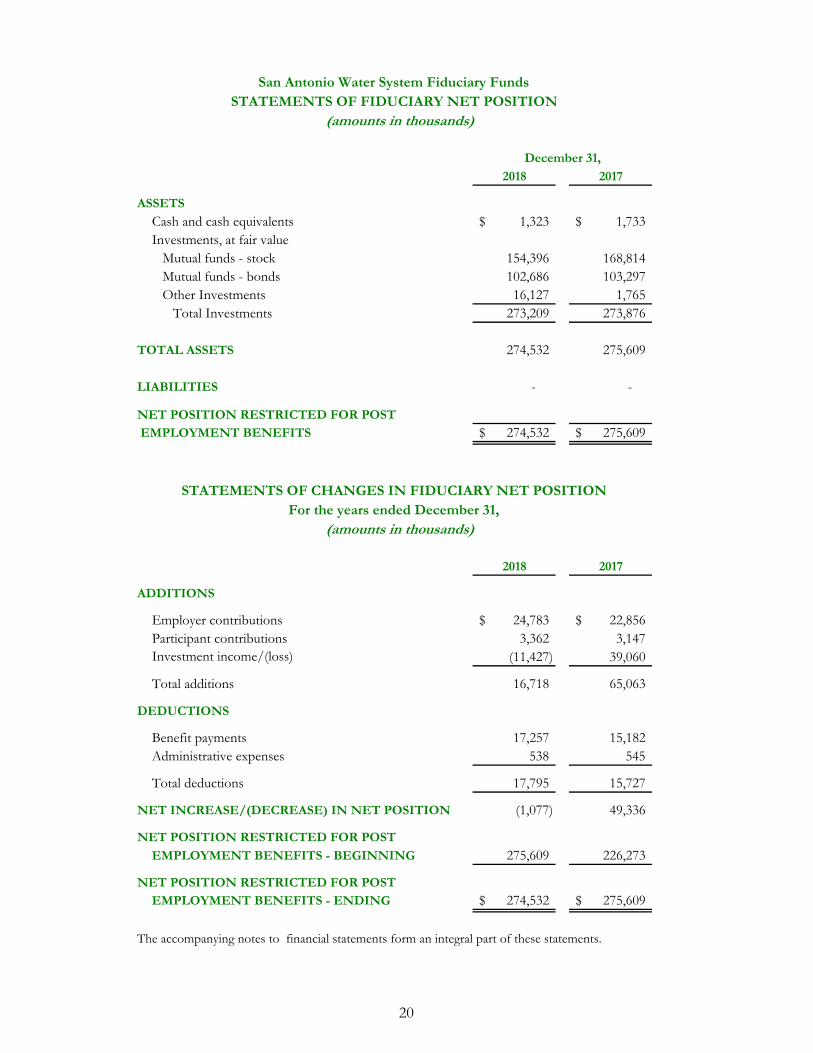
2018 2017
ASSETS
Cash and cash equivalents 1,323$ 1,733$ Investments, at fair value Mutual funds - stock 154,396 168,814 Mutual funds - bonds 102,686 103,297 Other Investments 16,127 1,765 Total Investments 273,209 273,876
TOTAL ASSETS 274,532 275,609
LIABILITIES - -
NET POSITION RESTRICTED FOR POST EMPLOYMENT BENEFITS 274,532$ 275,609$
2018 2017
ADDITIONS
Employer contributions 24,783$ 22,856$ Participant contributions 3,362 3,147 Investment income/(loss) (11,427) 39,060
Total additions 16,718 65,063
DEDUCTIONS
Benefit payments 17,257 15,182 Administrative expenses 538 545
Total deductions 17,795 15,727
NET INCREASE/(DECREASE) IN NET POSITION (1,077) 49,336
NET POSITION RESTRICTED FOR POST
EMPLOYMENT BENEFITS - BEGINNING 275,609 226,273
NET POSITION RESTRICTED FOR POSTEMPLOYMENT BENEFITS - ENDING 274,532$ 275,609$
The accompanying notes to financial statements form an integral part of these statements.
(amounts in thousands)
San Antonio Water System Fiduciary FundsSTATEMENTS OF FIDUCIARY NET POSITION
December 31,
STATEMENTS OF CHANGES IN FIDUCIARY NET POSITIONFor the years ended December 31,
(amounts in thousands)
20
NOTES TO FINANCIAL STATEMENTS
21
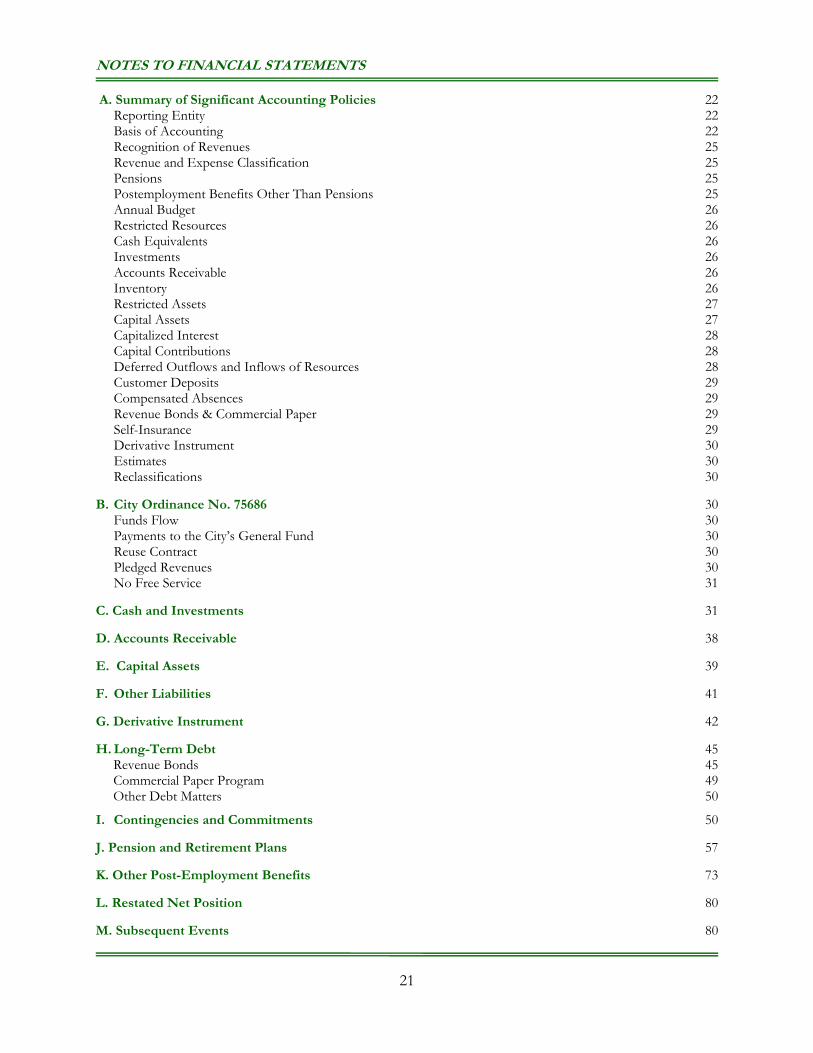
A. Summary of Significant Accounting Policies 22 Reporting Entity 22 Basis of Accounting 22 Recognition of Revenues 25 Revenue and Expense Classification 25 Pensions 25 Postemployment Benefits Other Than Pensions 25 Annual Budget 26 Restricted Resources 26 Cash Equivalents 26 Investments 26 Accounts Receivable 26 Inventory 26 Restricted Assets 27 Capital Assets 27 Capitalized Interest 28 Capital Contributions 28 Deferred Outflows and Inflows of Resources 28 Customer Deposits 29 Compensated Absences 29 Revenue Bonds & Commercial Paper 29 Self-Insurance 29 Derivative Instrument 30 Estimates 30 Reclassifications 30
B. City Ordinance No. 75686 30 Funds Flow 30 Payments to the City’s General Fund 30 Reuse Contract 30 Pledged Revenues 30 No Free Service 31
C. Cash and Investments 31
D. Accounts Receivable 38
E. Capital Assets 39
F. Other Liabilities 41 G. Derivative Instrument 42
H. Long-Term Debt 45 Revenue Bonds 45 Commercial Paper Program 49 Other Debt Matters 50 I. Contingencies and Commitments 50
J. Pension and Retirement Plans 57
K. Other Post-Employment Benefits 73 L. Restated Net Position 80 M. Subsequent Events 80
NOTES TO FINANCIAL STATEMENTS
22
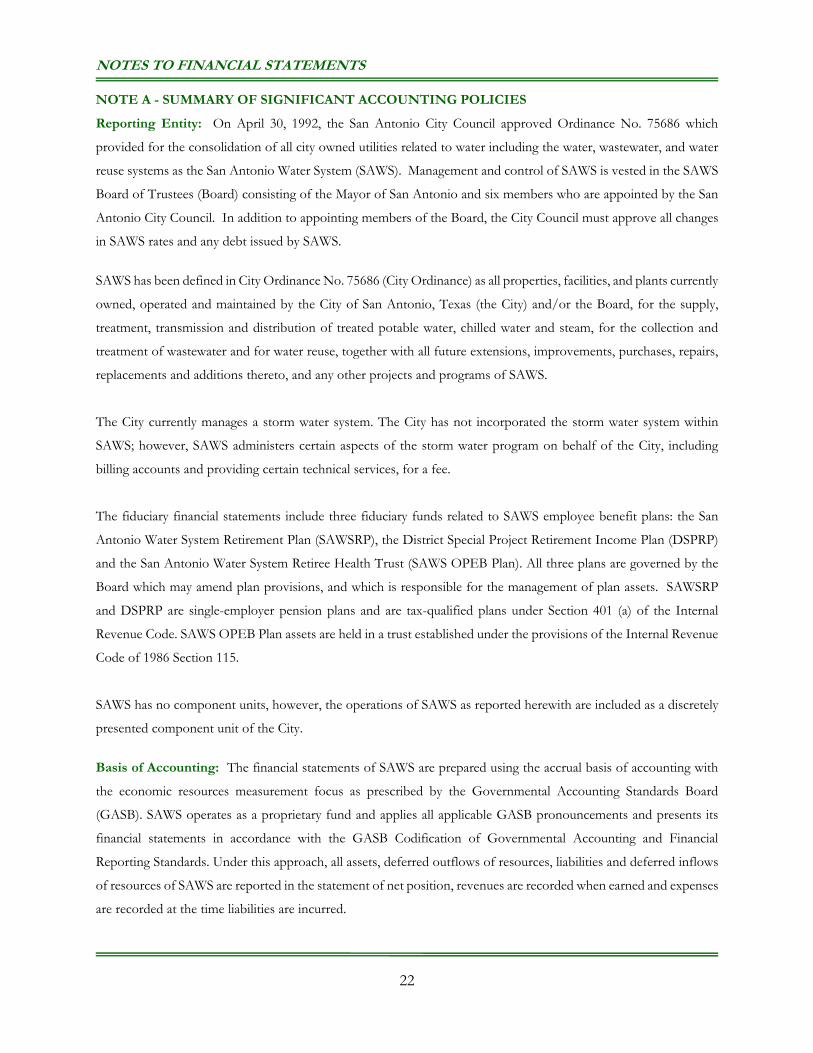
NOTE A - SUMMARY OF SIGNIFICANT ACCOUNTING POLICIES Reporting Entity: On April 30, 1992, the San Antonio City Council approved Ordinance No. 75686 which
provided for the consolidation of all city owned utilities related to water including the water, wastewater, and water
reuse systems as the San Antonio Water System (SAWS). Management and control of SAWS is vested in the SAWS
Board of Trustees (Board) consisting of the Mayor of San Antonio and six members who are appointed by the San
Antonio City Council. In addition to appointing members of the Board, the City Council must approve all changes
in SAWS rates and any debt issued by SAWS.
SAWS has been defined in City Ordinance No. 75686 (City Ordinance) as all properties, facilities, and plants currently
owned, operated and maintained by the City of San Antonio, Texas (the City) and/or the Board, for the supply,
treatment, transmission and distribution of treated potable water, chilled water and steam, for the collection and
treatment of wastewater and for water reuse, together with all future extensions, improvements, purchases, repairs,
replacements and additions thereto, and any other projects and programs of SAWS.
The City currently manages a storm water system. The City has not incorporated the storm water system within
SAWS; however, SAWS administers certain aspects of the storm water program on behalf of the City, including
billing accounts and providing certain technical services, for a fee.
The fiduciary financial statements include three fiduciary funds related to SAWS employee benefit plans: the San
Antonio Water System Retirement Plan (SAWSRP), the District Special Project Retirement Income Plan (DSPRP)
and the San Antonio Water System Retiree Health Trust (SAWS OPEB Plan). All three plans are governed by the
Board which may amend plan provisions, and which is responsible for the management of plan assets. SAWSRP
and DSPRP are single-employer pension plans and are tax-qualified plans under Section 401 (a) of the Internal
Revenue Code. SAWS OPEB Plan assets are held in a trust established under the provisions of the Internal Revenue
Code of 1986 Section 115.
SAWS has no component units, however, the operations of SAWS as reported herewith are included as a discretely
presented component unit of the City.
Basis of Accounting: The financial statements of SAWS are prepared using the accrual basis of accounting with
the economic resources measurement focus as prescribed by the Governmental Accounting Standards Board
(GASB). SAWS operates as a proprietary fund and applies all applicable GASB pronouncements and presents its
financial statements in accordance with the GASB Codification of Governmental Accounting and Financial
Reporting Standards. Under this approach, all assets, deferred outflows of resources, liabilities and deferred inflows
of resources of SAWS are reported in the statement of net position, revenues are recorded when earned and expenses
are recorded at the time liabilities are incurred.
NOTES TO FINANCIAL STATEMENTS
23
The fiduciary fund financial statements are prepared using the accrual basis of accounting. Employer contributions
to the plan are recognized when due and the employer has made a formal commitment to provide the contributions.
Benefit payments and plan expenses are recognized when due and payable in accordance with the terms of the plan.
SAWS implemented the following new GASB pronouncements during the current year:
GASB Statement No. 75, Accounting and Financial Reporting for Postemployment Benefits Other Than Pensions (OPEB).
This Statement replaces the requirements of Statement No. 45, Accounting and Financial Reporting by Employers for
Postemployment Benefits Other Than Pensions, as amended, Statement No. 57, OPEB Measurements by Agent Employers
and Agent Multiple-Employer Plans, for OPEB. The scope of this Statement addresses the accounting and financial
reporting for OPEB that is provided to employees of state and local governmental employers. The major
provisions of this Statement include:
o The difference between the present value of projected benefit payments to be provided to current
active and inactive employees that is attributable to those employees’ past periods of service and the
OPEB plan’s fiduciary net position be on the employer’s Statement of Net Position as either a net
OPEB asset or liability
o The majority of the changes in the net OPEB asset or liability are to be recognized immediately as an
expense. Some changes are to be reported as deferred inflows and/or deferred outflows of resources
and amortized to expense over prescribed periods of time, based on the nature of the deferred item.
Information required by this Statement is provided in Note K of these financial statements. The impact of
implementing this Statement on the 2017 financial statements is provided in Note L to these financial
statements.
GASB Statement No. 86, Certain Debt Extinguishment Issues. This Statement provides guidance for in-substance
defeasance of debt in which cash and other monetary assets acquired with only existing resources—resources
other than the proceeds of refunding debt—are placed in an irrevocable trust for the sole purpose of
extinguishing debt. In financial statements using the economic resources measurement focus, governments
should recognize any difference between the reacquisition price (the amount required to be placed in the trust)
and the net carrying amount of the debt defeased in substance using only existing resources as a separately
identified gain or loss in the period of the defeasance. The guidance provided by this Statement has no current
impact for SAWS.
The following additional GASB pronouncements will be implemented in the future. Once implemented, application
of these standards may restate portions of these financial statements.
NOTES TO FINANCIAL STATEMENTS
24
GASB Statement No. 83, Certain Asset Retirement Obligations. This Statement establishes criteria for determining
the timing and pattern of recognition of a liability and a corresponding deferred outflow of resources for Asset
Retirement Obligations (AROs). An ARO is a legally enforceable liability associated with the retirement of a
tangible capital asset. This Statement requires that recognition occur when the liability is both incurred and
reasonably estimable. The determination of when the liability is incurred should be based on the occurrence of
external laws, regulations, contracts, or court judgments, together with the occurrence of an internal event that
obligates a government to perform asset retirement activities. This Statement requires the measurement of an
ARO to be based on the best estimate of the current value of outlays expected to be incurred. This Statement
requires the current value of a government’s AROs to be adjusted for the effects of general inflation or deflation
at least annually. The requirements of this Statement are effective for reporting periods beginning after June 15,
2018. SAWS will implement this Statement in 2019.
GASB Statement No. 87, Leases. This Statement requires the recognition of certain lease assets and liabilities
for leases that previously were classified as operating leases. It establishes a single model for lease accounting
based on the foundational principle that leases are financings of the right to use an underlying asset. Under this
Statement, a lessee is required to recognize a lease liability and an intangible right-to-use lease asset, and a lessor
is required to recognize a lease receivable and a deferred inflow of resources, thereby enhancing the relevance
and consistency of information about governments’ leasing activities. The requirements of this Statement are
effective for reporting periods beginning after June 15, 2019. SAWS will implement this Statement in 2020.
GASB Statement No. 88, Certain Disclosures Related to Debt, including Direct Borrowing and Direct Placements. This
Statement defines debt for purposes of disclosure in notes to financial statements and establishes additional
financial statement note disclosure requirements related to debt obligations of governments, including direct
borrowing (for example, a government entering into a loan agreement with a lender) and direct placements (for
example, a government issuing a debt security directly to an investor). Direct borrowings and direct placements
have terms negotiated directly with the investor or lender and are not offered for public sale. The requirements
of this Statement are effective for reporting periods beginning after June 15, 2018. SAWS will implement this
Statement in 2019.
GASB Statement No. 89, Accounting for Interest Cost Incurred before the End of a Construction Period. This Statement
establishes accounting requirements for interest cost incurred before the end of a construction period. This
Statement requires that interest cost incurred before the end of a construction period be recognized as an
expense in the period in which the cost is incurred for financial statements prepared using the economic
resources measurement focus. As a result, interest cost incurred before the end of a construction period will no
longer be included in the historical cost of a capital asset reported in a business-type activity or enterprise fund.
NOTES TO FINANCIAL STATEMENTS
25
The requirements of this Statement are effective for reporting periods beginning after December 15, 2019,
earlier adoption is encouraged. SAWS will implement this Statement in 2019.
GASB Statement No. 90, Majority Equity Interests. This Statement specifies that a majority equity interest in a
legally separate organization should be reported as an investment if a government’s holding of the equity interest
meets the definition of an investment. A majority equity interest that meets the definition of an investment
should be measured using the equity method, unless it is held by a special-purpose government engaged only in
fiduciary activities, a fiduciary fund, or an endowment (including permanent and term endowments) or
permanent fund. Those governments and funds should measure the majority equity interest at fair value. SAWS
holds no equity interests in a legally separate organization at December 31, 2018. The requirements of this
Statement are effective for reporting periods beginning after December 15, 2018. SAWS will implement this
Statement in 2019.
Recognition of Revenues: Revenues are recognized as goods or services are provided. Customers’ meters are
read and bills are prepared monthly based on billing cycles. SAWS uses historical information to estimate and record
earned revenue not yet billed.
Revenue and Expense Classification: Proprietary funds distinguish operating revenues and expenses from non-
operating items. Operating revenues and expenses generally result from providing services in connection with a
proprietary fund’s principal ongoing operations. The principal operating revenues of SAWS are charges to customers
for water supply, water delivery, wastewater, and chilled water services. Operating expenses include costs of service,
administrative expenses and depreciation on capital assets. All revenues and expenses not meeting this definition
are reported as non-operating revenues and expenses.
Pensions: For purposes of measuring the Net Pension Liability, deferred outflows of resources and deferred inflows
of resources related to pensions, and pension expense, information about the fiduciary net position of the SAWSRP,
TMRS and DSPRP plans and additions to/from the SAWSRP, TMRS and DSPRP fiduciary net position have been
determined using the same basis as they are reported by SAWSRP, TMRS, and DSPRP. For this purpose, benefit
payments, including refunds of employee contributions, are recognized when due and payable in accordance with
benefit terms. Investments are reported at fair value.
Postemployment Benefits Other Than Pensions (OPEB): For purposes of measuring the Net OPEB Liability,
deferred outflows of resources and deferred inflows of resources related to SAWS OPEB, and SAWS OPEB
expense, information about the fiduciary net position of the SAWS OPEB plan and additions to/from the SAWS
OPEB fiduciary net position have been determined using the same basis as they are reported by the SAWS OPEB
plan. For this purpose, benefit payments, including refunds of employee contributions, are recognized when due
and payable in accordance with benefit terms. Investments are reported at fair value.
NOTES TO FINANCIAL STATEMENTS
26
Annual Budget: Approximately sixty days prior to the beginning of each fiscal year, an annual budget is presented
to the Board for consideration. This budget is prepared on an accrual basis and serves as a tool in controlling and
administering the management and operation of the organization. The annual budget reflects an estimate of gross
revenues and disposition of these revenues in accordance with the flow of funds required by Ordinance No. 75686
(See Note B). Once the annual budget has been approved by the Board, the budget is submitted to City Council for
review and consultation.
Restricted Resources: When an expenditure is made for purposes for which both restricted and unrestricted
resources are available, it is SAWS policy to choose the appropriate resource based on the availability of resources
and funding goals established by management for those expenditures.
Cash Equivalents: SAWS considers investments with an original maturity of three months or less at the time of
purchase to be cash equivalents.
Investments: City Ordinance No. 75686, SAWS’ Investment Policy, and Texas state law allow SAWS to invest in
direct obligations of the United States or its agencies and instrumentalities. Other allowable investments include
direct obligations of the State of Texas or its agencies and instrumentalities; secured certificates of deposit issued by
depository institutions that have their main office or a branch office in the State of Texas; defined bankers
acceptances and commercial paper; collateralized direct repurchase agreements, reverse repurchase agreements; no-
load money market mutual funds; investment pools; municipal bonds; and other types of secured or guaranteed
investments. These investments are subject to market risk, interest rate risk, and credit risk which may affect the
value at which these investments are recorded. Under the provisions of GASB Statement No. 31, money market
investments, including US Treasury and agency obligations, with a remaining maturity at time of purchase of one
year or less are reported at amortized cost. All other investments are reported at fair value.
Accounts Receivable: Accounts receivable are recorded at the invoiced amounts plus an estimate of unbilled
revenue receivable. The allowance for uncollectible accounts is management’s best estimate of the amount of
probable credit losses based on account delinquencies and historical write-off experience. Account balances are
written off against the allowance when it is probable the receivable will not be recovered. SAWS wrote off account
balances totaling $5.4 million in 2018 and $1.5 million in 2017. A provision to increase the allowance for uncollectible
accounts is recorded as an offset to operating revenue. The provision for uncollectible accounts was $4.8 million
in 2018 and $3.9 million in 2017.
Inventory: Inventories are valued at lower of cost or market using the weighted average cost method. Inventories
are reported in the Statements of Net Position in Other Current Assets. Inventories (net) totaled $5.8 million at
December 31, 2018 and $5.6 million at December 31, 2017.
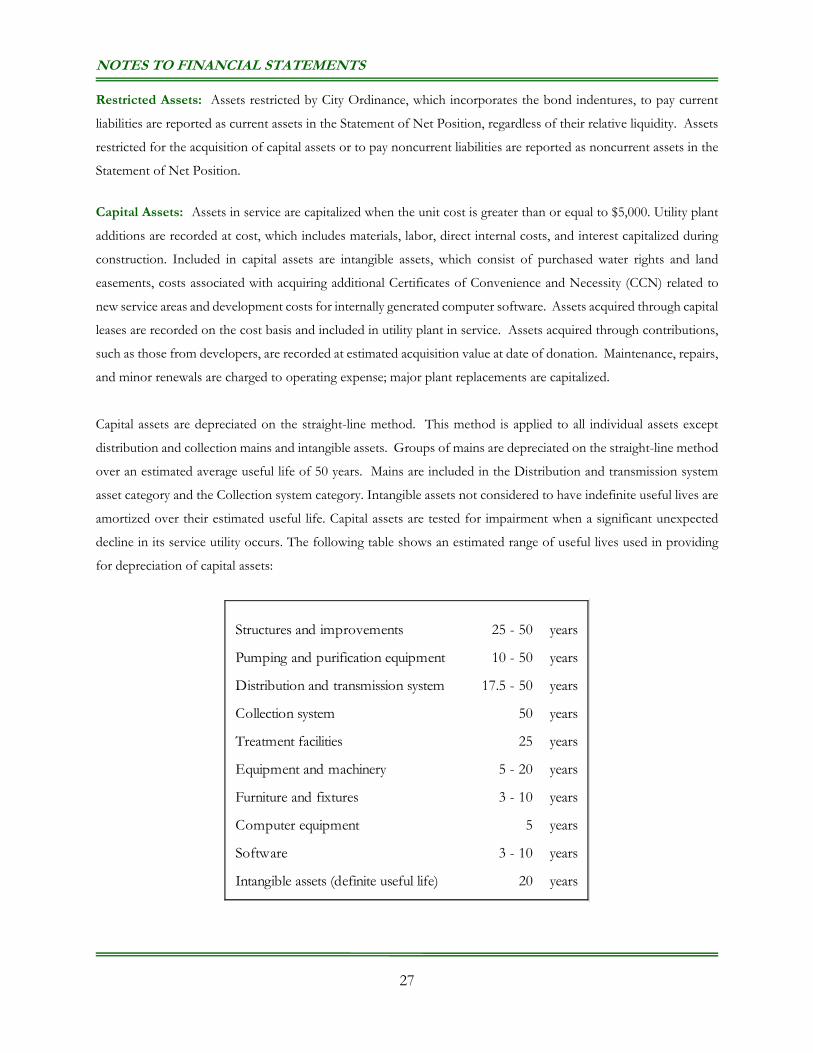
NOTES TO FINANCIAL STATEMENTS
27
Restricted Assets: Assets restricted by City Ordinance, which incorporates the bond indentures, to pay current
liabilities are reported as current assets in the Statement of Net Position, regardless of their relative liquidity. Assets
restricted for the acquisition of capital assets or to pay noncurrent liabilities are reported as noncurrent assets in the
Statement of Net Position.
Capital Assets: Assets in service are capitalized when the unit cost is greater than or equal to $5,000. Utility plant
additions are recorded at cost, which includes materials, labor, direct internal costs, and interest capitalized during
construction. Included in capital assets are intangible assets, which consist of purchased water rights and land
easements, costs associated with acquiring additional Certificates of Convenience and Necessity (CCN) related to
new service areas and development costs for internally generated computer software. Assets acquired through capital
leases are recorded on the cost basis and included in utility plant in service. Assets acquired through contributions,
such as those from developers, are recorded at estimated acquisition value at date of donation. Maintenance, repairs,
and minor renewals are charged to operating expense; major plant replacements are capitalized.
Capital assets are depreciated on the straight-line method. This method is applied to all individual assets except
distribution and collection mains and intangible assets. Groups of mains are depreciated on the straight-line method
over an estimated average useful life of 50 years. Mains are included in the Distribution and transmission system
asset category and the Collection system category. Intangible assets not considered to have indefinite useful lives are
amortized over their estimated useful life. Capital assets are tested for impairment when a significant unexpected
decline in its service utility occurs. The following table shows an estimated range of useful lives used in providing
for depreciation of capital assets:
Structures and improvements 25 - 50 years
Pumping and purification equipment 10 - 50 years
Distribution and transmission system 17.5 - 50 years
Collection system 50 years
Treatment facilities 25 years
Equipment and machinery 5 - 20 years
Furniture and fixtures 3 - 10 years
Computer equipment 5 years
Software 3 - 10 years
Intangible assets (definite useful life) 20 years
NOTES TO FINANCIAL STATEMENTS
28
Capitalized Interest: Interest expense during the construction period is capitalized as part of the cost of capital
assets. SAWS capitalized $6.6 million of interest in 2018 and $6 million in 2017.
Capital Contributions: Capital Contributions consist of plant contributions from developers, capital recovery fees,
and contributions in aid of construction and/or grant proceeds received from governmental agencies for facility
expansion. Capital Contributions are recognized in the Statement of Revenues, Expenses, and Changes in Net
Position, after non-operating revenues (expenses), when eligibility requirements are met.
Capital recovery fees are charged to customers to connect to the water or wastewater system. By Texas law, these
fees are to be used for capital expenditures that expand infrastructure capacity or to reimburse SAWS for the cost
associated with existing excess infrastructure capacity. In certain instances, infrastructure that facilitates expansion
of SAWS’ service capacity is contributed by developers. In these instances, SAWS records the donated infrastructure
as plant contributions and may abate future capital recovery fees due from the developer equal to a portion of the
acquisition value of the of the infrastructure contributed. SAWS abated future capital recovery fees of $337,000 in
2018 and $4,377,000 in 2017. These abatements are conditional based on the type of development and in certain
instances, time requirements and geographic restrictions.
Deferred Outflows and Inflows of Resources: In addition to assets, liabilities, and net position, the Statement of
Net Position includes separate sections for deferred outflows and inflows of resources. A deferred outflow of
resources represents a consumption of net position that applies to a future period(s) and therefore, will not be
recognized as an outflow of resources until the applicable future period. A deferred inflow of resources is an
acquisition of net position that is applicable to future reporting period(s) and therefore, will not be recognized as an
inflow of resources until the applicable future period.
Deferred charge on bond refunding results from the difference in the carrying value of refunded debt and its reacquisition
price. This amount is deferred and amortized to interest expense over the shorter of the life of the refunded or
refunding debt using the interest method.
Deferred outflows – pension and Deferred inflows – pension result from contributions made by SAWS to its defined benefit
pension plans after the measurement date of Net Pension Liability as well as changes in the Net Pension Liability
not yet reflected in pension expense. Changes in the Net Pension Liability not yet reflected in pension expense
include differences between projected and actual earnings on pension plan investments, expected and actual
experience with regard to economic or demographic factors and changes in assumptions about future economic or
demographic factors. Differences between projected and actual earnings are recognized in pension expense over a
closed five year period. Other changes are recognized in pension expense using a systematic and rational manner
over a closed period equal to the average of the expected remaining service lives of all employees participating in the
plans.
NOTES TO FINANCIAL STATEMENTS
29
Deferred outflows – OPEB and Deferred inflows – OPEB result from contributions made by SAWS to its OPEB plan after
the measurement date of Net OPEB Liability as well as changes in the Net OPEB Liability not yet reflected in
pension expense. Changes in the Net OPEB Liability not yet reflected in pension expense include differences
between projected and actual earnings on OPEB plan investments, expected and actual experience with regard to
economic or demographic factors and changes in assumptions about future economic or demographic factors.
Differences between projected and actual earnings are recognized in OPEB expense over a closed five year period.
Other changes are recognized in pension expense using a systematic and rational manner over a closed period equal
to the average of the expected remaining service lives of all employees participating in the plans.
SAWS is a party to an interest rate swap agreement which serves to hedge interest rates on a portion of SAWS’
variable rate debt. The agreement qualifies as a derivative instrument and meets the requirements of an effective
hedge in accordance with GASB Statements No. 53 and 64. As a result, hedge accounting is used to account for the
changes in the fair value of the swap agreement. Accumulated decrease in fair value of hedging derivative represents the
change in the fair value of the interest rate swap that has not been recognized in the Statement of Revenues, Expenses
and Changes in Net Position due to the use of hedge accounting. For more information about this derivative
instrument see Note G.
Customer Deposits: SAWS collects an advance deposit from new customers to secure payment of the customer’s
final bill. The deposit is refundable once the customer has demonstrated an acceptable payment history of no more
than two late payments within the first twelve month period. SAWS may collect an additional deposit for customers
whose service has been turned off for non-payment and need to restore service.
Compensated Absences: It is SAWS’ policy to accrue earned but unused employee vacation pay as well as the
employer portion of Social Security taxes and required employer pension contributions related to the accrued
vacation pay. The total vacation paid in the current year is used as the estimated amount to be due within one year.
Sick leave is not accrued as a terminating employee is not paid for accumulated sick leave.
Revenue Bonds & Commercial Paper: SAWS issues revenue bonds to finance capital improvement projects,
refund outstanding bonds to reduce future debt service payments, and pay the cost of issuance. All SAWS’ revenue
bonds are secured by a lien on and pledge of net revenues of the system. Additionally, certain SAWS’ bonds are
further secured by the maintenance of a reserve fund established for the benefit of the bondholders. SAWS
maintains a commercial paper program that is used to provide funds for the interim financing of a portion of its
capital improvements.
Self-Insurance: SAWS is self-insured for a portion of workers' compensation, employee’s health, employer’s
liability, public officials’ liability, property damage, and certain elements of general liability. A liability has been
recorded for the estimated amount of eventual loss which will be incurred on claims arising prior to the end of the
period including incurred but not reported claims.
NOTES TO FINANCIAL STATEMENTS
30
Derivative Instrument: As noted above, SAWS is a party to an interest rate swap agreement that qualifies as a
derivative instrument. Additionally, mutual fund investments held by SAWS fiduciary funds may use derivatives as
part of their investment strategy. These mutual funds are comingled pools, rather than individual securities.
Estimates: The preparation of financial statements in conformity with generally accepted accounting principles
requires management to make estimates and assumptions that affect certain reported amounts and disclosures.
Accordingly, actual results could differ from those estimates.
Reclassifications: Certain amounts presented in the prior year data have been reclassified in order to be consistent
with the current year’s presentation.
NOTE B - CITY ORDINANCE NO. 75686 Funds Flow: City Ordinance requires that SAWS’ gross revenues be applied in sequence to: (1) System Fund for
payment of current maintenance and operating expenses including a reserve equal to two months of budgeted
maintenance and operating expenses for the current fiscal year; (2) Debt Service Fund requirements of Senior Lien
Obligations; (3) Reserve Fund requirements of Senior Lien Obligations; (4) Interest and Sinking Fund and Reserve
Fund requirements of Junior Lien Obligations; (5) Interest and Sinking Fund and Reserve Fund requirements of
Subordinate Lien Obligations; (6) Payment of amounts required on Inferior Lien Obligations, and (7) Transfers to
the City's General Fund and to the Renewal and Replacement Fund.
Payments to the City’s General Fund: The City Ordinance requires SAWS to make payments to the City each
month after making all other payments required by the City Ordinance. The amount of the payment is determined
by City Council from time to time and cannot exceed 5% of Gross Revenues. Gross Revenues consist of all revenue
with respect to the operation and ownership of SAWS with the exception of capital contributions, payments received
under the CPS Energy contract, the federal subsidy of interest on Build America Bonds and earnings on funds
deposited in the Project Fund and Reserve Fund until the Reserve Fund contains the required reserve amount.
Currently SAWS pays 2.7% of Gross Revenues to the City. Payments to the City are reported as non-operating
expense in the Statement of Revenues, Expenses and Changes in Net Position.
Reuse Contract: SAWS has a contract with CPS Energy, the city owned electricity and gas utility, for the provision
of reuse water. According to the City Ordinance, the revenues derived from the contract have been restricted in use
to only reuse activities and are excluded from gross revenue for purposes of calculating any payments to the City's
General Fund.
Pledged Revenues: Net Revenues of SAWS have been pledged to the payment and security of its debt obligations.
Net Revenues are defined by the City Ordinance as SAWS’ Gross Revenues after deducting operating expenses
before depreciation.
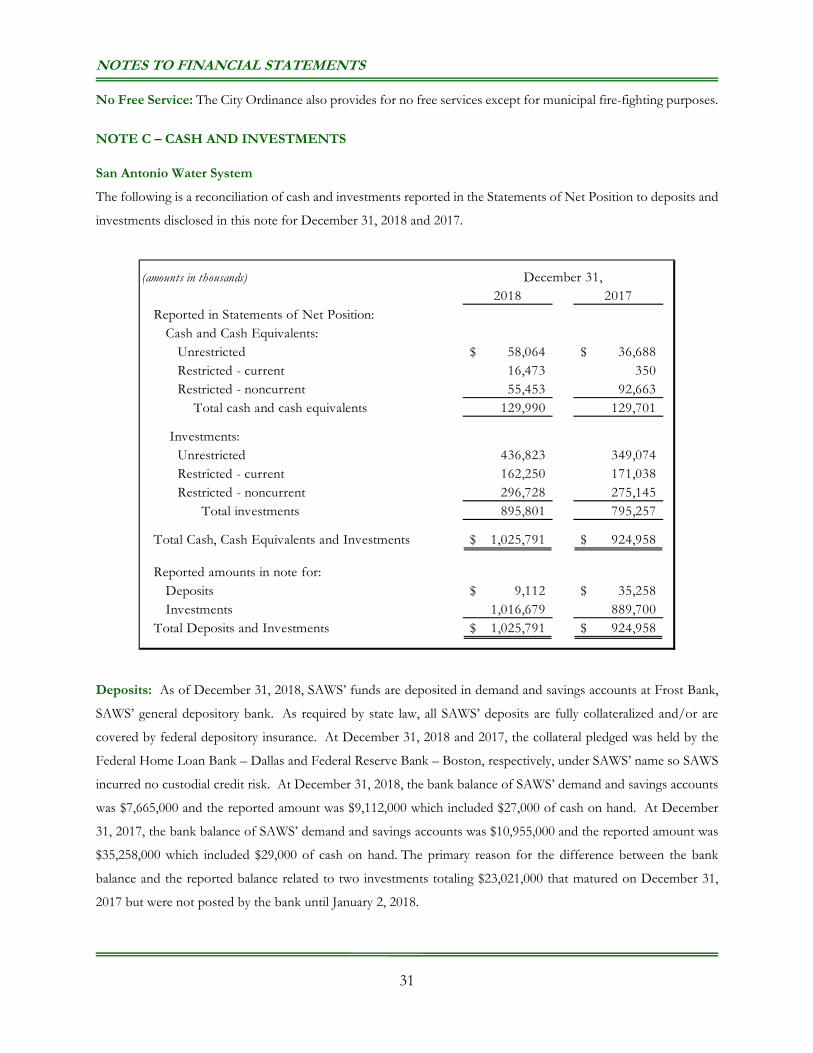
NOTES TO FINANCIAL STATEMENTS
31
No Free Service: The City Ordinance also provides for no free services except for municipal fire-fighting purposes.
NOTE C – CASH AND INVESTMENTS San Antonio Water System
The following is a reconciliation of cash and investments reported in the Statements of Net Position to deposits and
investments disclosed in this note for December 31, 2018 and 2017.
Deposits: As of December 31, 2018, SAWS’ funds are deposited in demand and savings accounts at Frost Bank,
SAWS’ general depository bank. As required by state law, all SAWS’ deposits are fully collateralized and/or are
covered by federal depository insurance. At December 31, 2018 and 2017, the collateral pledged was held by the
Federal Home Loan Bank – Dallas and Federal Reserve Bank – Boston, respectively, under SAWS’ name so SAWS
incurred no custodial credit risk. At December 31, 2018, the bank balance of SAWS’ demand and savings accounts
was $7,665,000 and the reported amount was $9,112,000 which included $27,000 of cash on hand. At December
31, 2017, the bank balance of SAWS’ demand and savings accounts was $10,955,000 and the reported amount was
$35,258,000 which included $29,000 of cash on hand. The primary reason for the difference between the bank
balance and the reported balance related to two investments totaling $23,021,000 that matured on December 31,
2017 but were not posted by the bank until January 2, 2018.
(amounts in thousands) December 31,2018 2017
Reported in Statements of Net Position: Cash and Cash Equivalents: Unrestricted 58,064$ 36,688$ Restricted - current 16,473 350 Restricted - noncurrent 55,453 92,663 Total cash and cash equivalents 129,990 129,701
Investments: Unrestricted 436,823 349,074 Restricted - current 162,250 171,038 Restricted - noncurrent 296,728 275,145 Total investments 895,801 795,257
Total Cash, Cash Equivalents and Investments 1,025,791$ 924,958$
Reported amounts in note for: Deposits 9,112$ 35,258$ Investments 1,016,679 889,700 Total Deposits and Investments 1,025,791$ 924,958$
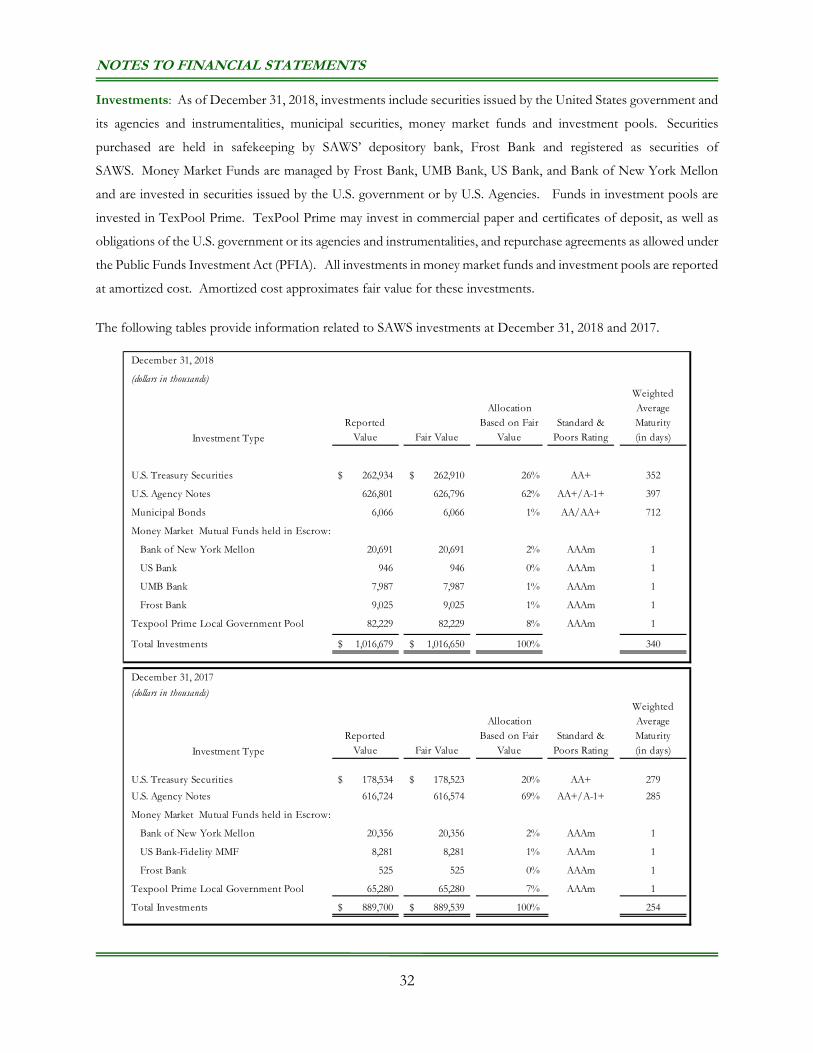
NOTES TO FINANCIAL STATEMENTS
32
Investments: As of December 31, 2018, investments include securities issued by the United States government and
its agencies and instrumentalities, municipal securities, money market funds and investment pools. Securities
purchased are held in safekeeping by SAWS’ depository bank, Frost Bank and registered as securities of
SAWS. Money Market Funds are managed by Frost Bank, UMB Bank, US Bank, and Bank of New York Mellon
and are invested in securities issued by the U.S. government or by U.S. Agencies. Funds in investment pools are
invested in TexPool Prime. TexPool Prime may invest in commercial paper and certificates of deposit, as well as
obligations of the U.S. government or its agencies and instrumentalities, and repurchase agreements as allowed under
the Public Funds Investment Act (PFIA). All investments in money market funds and investment pools are reported
at amortized cost. Amortized cost approximates fair value for these investments.
The following tables provide information related to SAWS investments at December 31, 2018 and 2017.
December 31, 2018
(dollars in thousands)
Investment Type
Reported Value Fair Value
Allocation Based on Fair
ValueStandard &
Poors Rating
Weighted Average Maturity (in days)
U.S. Treasury Securities 262,934$ 262,910$ 26% AA+ 352
U.S. Agency Notes 626,801 626,796 62% AA+/A-1+ 397
Municipal Bonds 6,066 6,066 1% AA/AA+ 712
Money Market Mutual Funds held in Escrow:
Bank of New York Mellon 20,691 20,691 2% AAAm 1
US Bank 946 946 0% AAAm 1
UMB Bank 7,987 7,987 1% AAAm 1
Frost Bank 9,025 9,025 1% AAAm 1
Texpool Prime Local Government Pool 82,229 82,229 8% AAAm 1
Total Investments 1,016,679$ 1,016,650$ 100% 340
December 31, 2017
(dollars in thousands)
Investment Type
Reported Value Fair Value
Allocation Based on Fair
ValueStandard &
Poors Rating
Weighted Average Maturity (in days)
U.S. Treasury Securities 178,534$ 178,523$ 20% AA+ 279
U.S. Agency Notes 616,724 616,574 69% AA+/A-1+ 285
Money Market Mutual Funds held in Escrow:
Bank of New York Mellon 20,356 20,356 2% AAAm 1
US Bank-Fidelity MMF 8,281 8,281 1% AAAm 1
Frost Bank 525 525 0% AAAm 1
Texpool Prime Local Government Pool 65,280 65,280 7% AAAm 1
Total Investments 889,700$ 889,539$ 100% 254
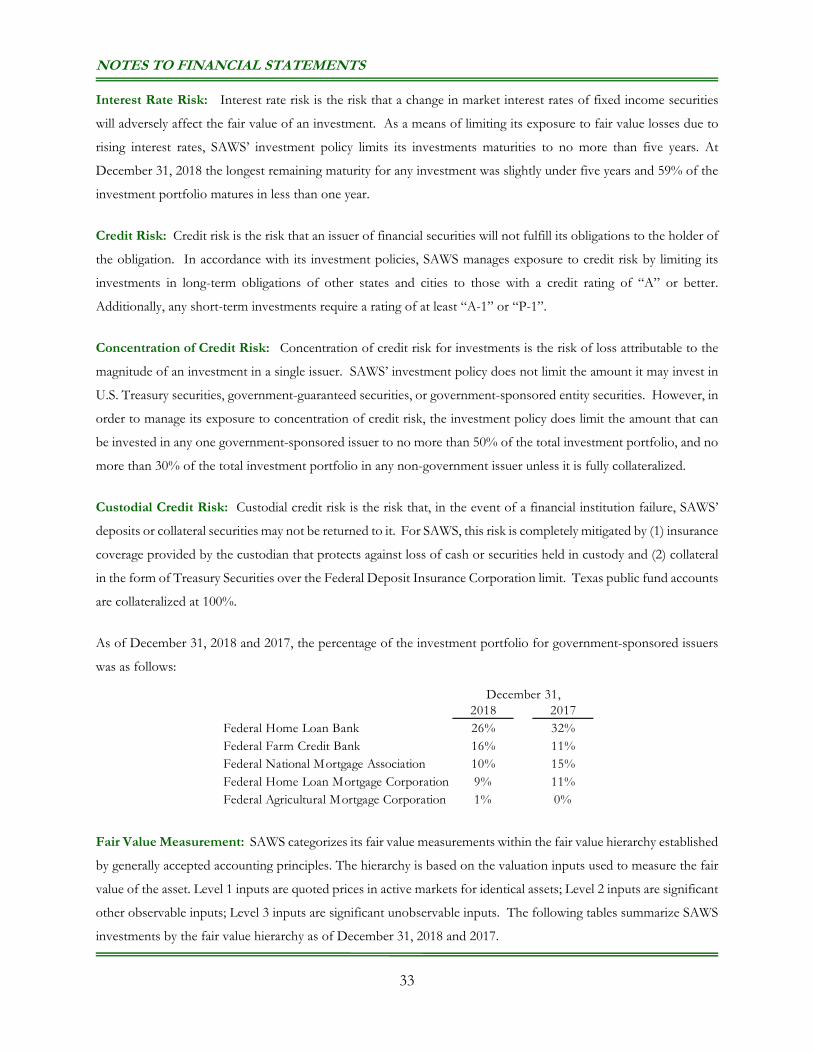
NOTES TO FINANCIAL STATEMENTS
33
Interest Rate Risk: Interest rate risk is the risk that a change in market interest rates of fixed income securities
will adversely affect the fair value of an investment. As a means of limiting its exposure to fair value losses due to
rising interest rates, SAWS’ investment policy limits its investments maturities to no more than five years. At
December 31, 2018 the longest remaining maturity for any investment was slightly under five years and 59% of the
investment portfolio matures in less than one year.
Credit Risk: Credit risk is the risk that an issuer of financial securities will not fulfill its obligations to the holder of
the obligation. In accordance with its investment policies, SAWS manages exposure to credit risk by limiting its
investments in long-term obligations of other states and cities to those with a credit rating of “A” or better.
Additionally, any short-term investments require a rating of at least “A-1” or “P-1”.
Concentration of Credit Risk: Concentration of credit risk for investments is the risk of loss attributable to the
magnitude of an investment in a single issuer. SAWS’ investment policy does not limit the amount it may invest in
U.S. Treasury securities, government-guaranteed securities, or government-sponsored entity securities. However, in
order to manage its exposure to concentration of credit risk, the investment policy does limit the amount that can
be invested in any one government-sponsored issuer to no more than 50% of the total investment portfolio, and no
more than 30% of the total investment portfolio in any non-government issuer unless it is fully collateralized.
Custodial Credit Risk: Custodial credit risk is the risk that, in the event of a financial institution failure, SAWS’
deposits or collateral securities may not be returned to it. For SAWS, this risk is completely mitigated by (1) insurance
coverage provided by the custodian that protects against loss of cash or securities held in custody and (2) collateral
in the form of Treasury Securities over the Federal Deposit Insurance Corporation limit. Texas public fund accounts
are collateralized at 100%.
As of December 31, 2018 and 2017, the percentage of the investment portfolio for government-sponsored issuers
was as follows:
Fair Value Measurement: SAWS categorizes its fair value measurements within the fair value hierarchy established
by generally accepted accounting principles. The hierarchy is based on the valuation inputs used to measure the fair
value of the asset. Level 1 inputs are quoted prices in active markets for identical assets; Level 2 inputs are significant
other observable inputs; Level 3 inputs are significant unobservable inputs. The following tables summarize SAWS
investments by the fair value hierarchy as of December 31, 2018 and 2017.
December 31,2018 2017
Federal Home Loan Bank 26% 32%Federal Farm Credit Bank 16% 11%Federal National Mortgage Association 10% 15%Federal Home Loan Mortgage Corporation 9% 11%Federal Agricultural Mortgage Corporation 1% 0%
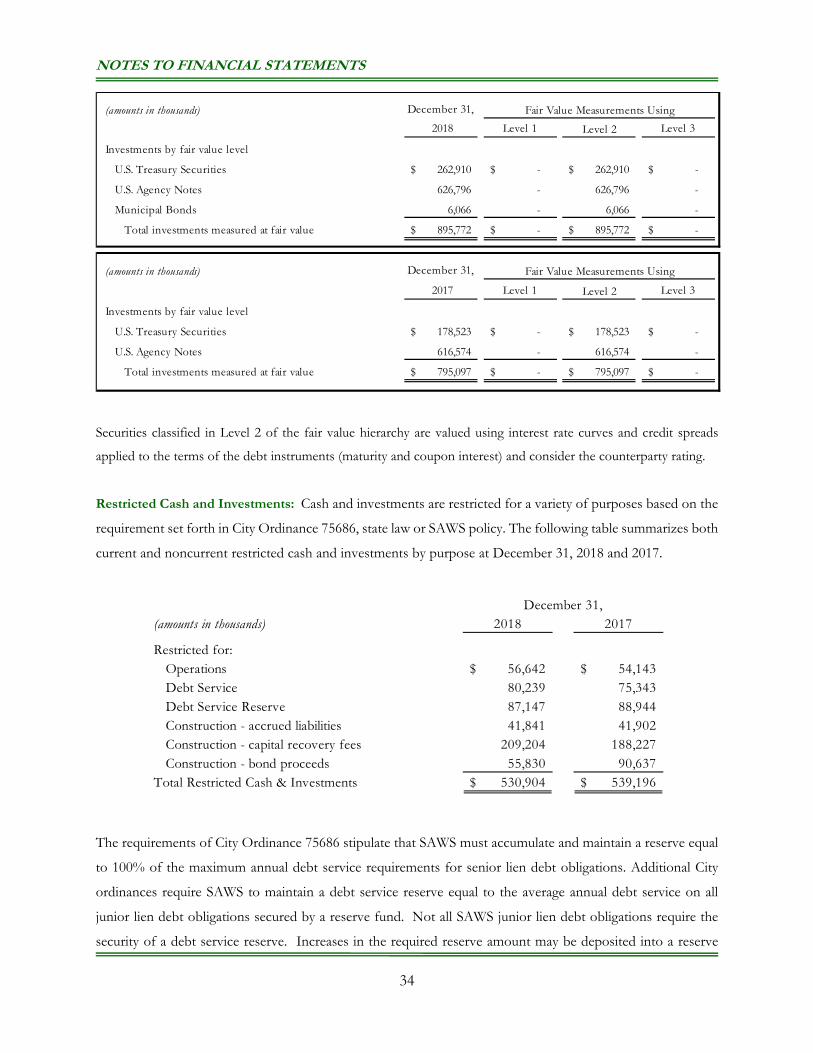
NOTES TO FINANCIAL STATEMENTS
34
Securities classified in Level 2 of the fair value hierarchy are valued using interest rate curves and credit spreads
applied to the terms of the debt instruments (maturity and coupon interest) and consider the counterparty rating.
Restricted Cash and Investments: Cash and investments are restricted for a variety of purposes based on the
requirement set forth in City Ordinance 75686, state law or SAWS policy. The following table summarizes both
current and noncurrent restricted cash and investments by purpose at December 31, 2018 and 2017.
The requirements of City Ordinance 75686 stipulate that SAWS must accumulate and maintain a reserve equal
to 100% of the maximum annual debt service requirements for senior lien debt obligations. Additional City
ordinances require SAWS to maintain a debt service reserve equal to the average annual debt service on all
junior lien debt obligations secured by a reserve fund. Not all SAWS junior lien debt obligations require the
security of a debt service reserve. Increases in the required reserve amount may be deposited into a reserve
(amounts in thousands) December 31,
2018 Level 1 Level 2 Level 3
Investments by fair value level
U.S. Treasury Securities 262,910$ -$ 262,910$ -$
U.S. Agency Notes 626,796 - 626,796 -
Municipal Bonds 6,066 - 6,066 -
Total investments measured at fair value 895,772$ -$ 895,772$ -$
(amounts in thousands) December 31,
2017 Level 1 Level 2 Level 3
Investments by fair value level
U.S. Treasury Securities 178,523$ -$ 178,523$ -$
U.S. Agency Notes 616,574 - 616,574 -
Total investments measured at fair value 795,097$ -$ 795,097$ -$
Fair Value Measurements Using
Fair Value Measurements Using
December 31,(amounts in thousands) 2018 2017
Restricted for: Operations 56,642$ 54,143$ Debt Service 80,239 75,343 Debt Service Reserve 87,147 88,944 Construction - accrued liabilities 41,841 41,902 Construction - capital recovery fees 209,204 188,227 Construction - bond proceeds 55,830 90,637 Total Restricted Cash & Investments 530,904$ 539,196$
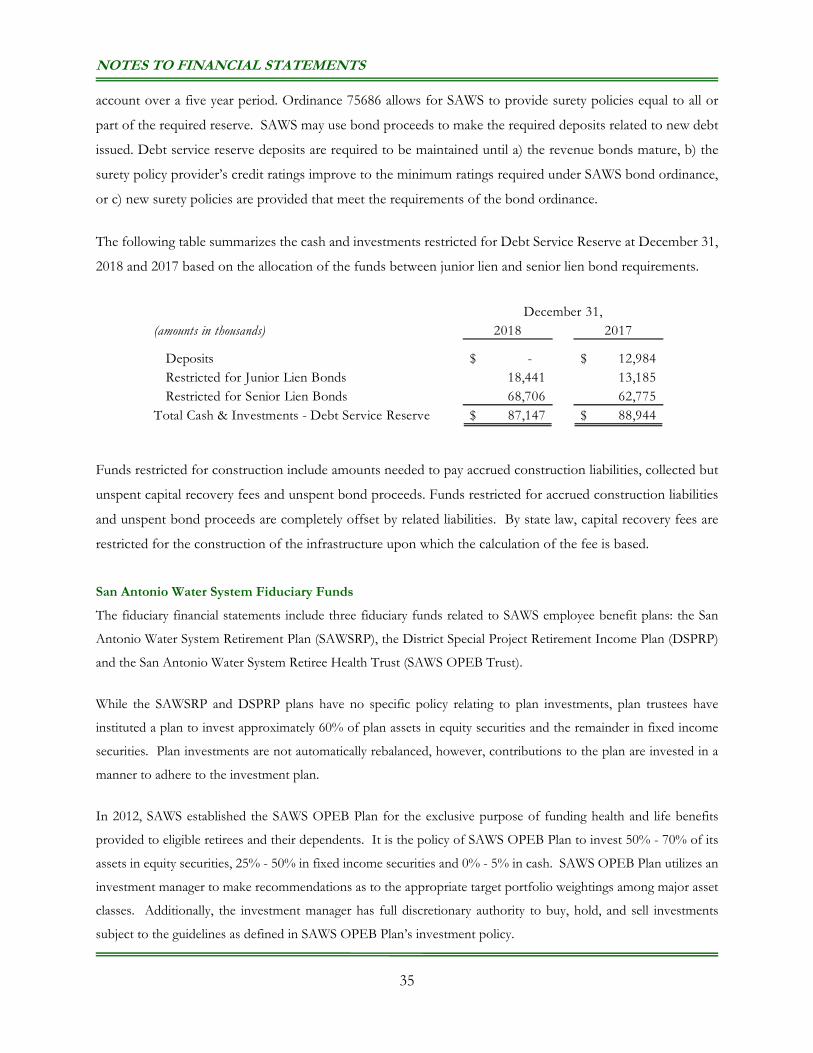
NOTES TO FINANCIAL STATEMENTS
35
account over a five year period. Ordinance 75686 allows for SAWS to provide surety policies equal to all or
part of the required reserve. SAWS may use bond proceeds to make the required deposits related to new debt
issued. Debt service reserve deposits are required to be maintained until a) the revenue bonds mature, b) the
surety policy provider’s credit ratings improve to the minimum ratings required under SAWS bond ordinance,
or c) new surety policies are provided that meet the requirements of the bond ordinance.
The following table summarizes the cash and investments restricted for Debt Service Reserve at December 31,
2018 and 2017 based on the allocation of the funds between junior lien and senior lien bond requirements.
Funds restricted for construction include amounts needed to pay accrued construction liabilities, collected but
unspent capital recovery fees and unspent bond proceeds. Funds restricted for accrued construction liabilities
and unspent bond proceeds are completely offset by related liabilities. By state law, capital recovery fees are
restricted for the construction of the infrastructure upon which the calculation of the fee is based.
San Antonio Water System Fiduciary Funds
The fiduciary financial statements include three fiduciary funds related to SAWS employee benefit plans: the San
Antonio Water System Retirement Plan (SAWSRP), the District Special Project Retirement Income Plan (DSPRP)
and the San Antonio Water System Retiree Health Trust (SAWS OPEB Trust).
While the SAWSRP and DSPRP plans have no specific policy relating to plan investments, plan trustees have
instituted a plan to invest approximately 60% of plan assets in equity securities and the remainder in fixed income
securities. Plan investments are not automatically rebalanced, however, contributions to the plan are invested in a
manner to adhere to the investment plan.
In 2012, SAWS established the SAWS OPEB Plan for the exclusive purpose of funding health and life benefits
provided to eligible retirees and their dependents. It is the policy of SAWS OPEB Plan to invest 50% - 70% of its
assets in equity securities, 25% - 50% in fixed income securities and 0% - 5% in cash. SAWS OPEB Plan utilizes an
investment manager to make recommendations as to the appropriate target portfolio weightings among major asset
classes. Additionally, the investment manager has full discretionary authority to buy, hold, and sell investments
subject to the guidelines as defined in SAWS OPEB Plan’s investment policy.
December 31,(amounts in thousands) 2018 2017
Deposits -$ 12,984$ Restricted for Junior Lien Bonds 18,441 13,185 Restricted for Senior Lien Bonds 68,706 62,775 Total Cash & Investments - Debt Service Reserve 87,147$ 88,944$
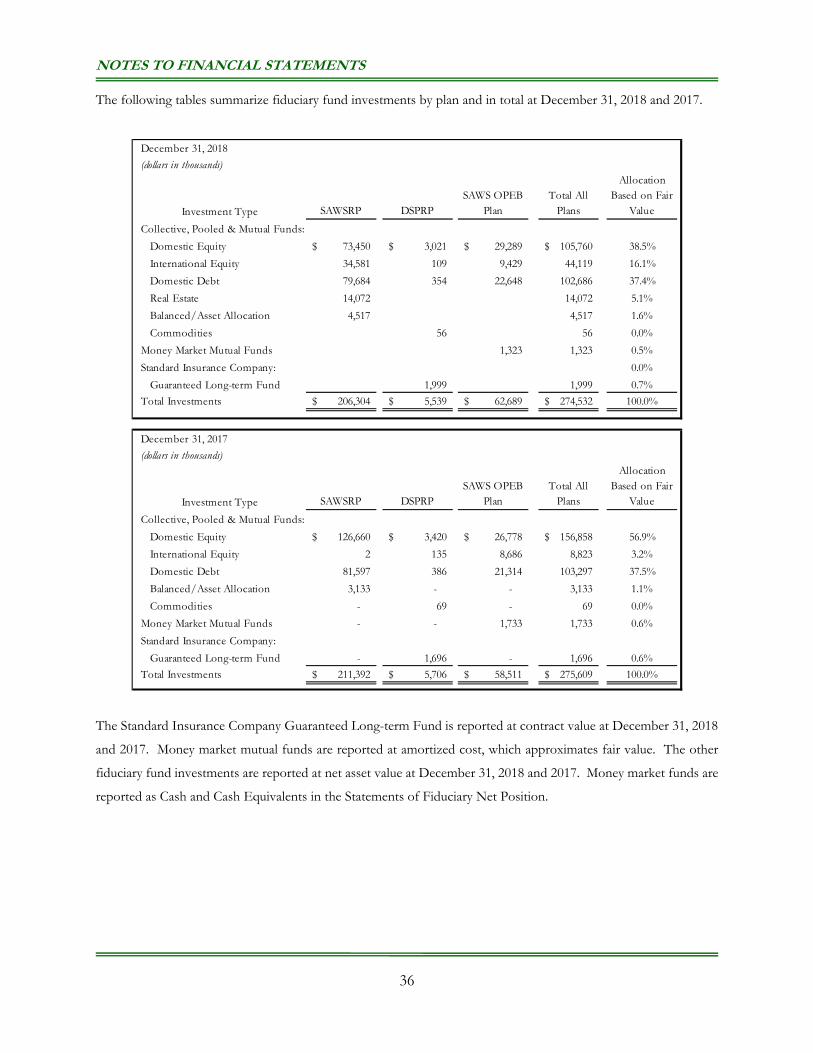
NOTES TO FINANCIAL STATEMENTS
36
The following tables summarize fiduciary fund investments by plan and in total at December 31, 2018 and 2017.
The Standard Insurance Company Guaranteed Long-term Fund is reported at contract value at December 31, 2018
and 2017. Money market mutual funds are reported at amortized cost, which approximates fair value. The other
fiduciary fund investments are reported at net asset value at December 31, 2018 and 2017. Money market funds are
reported as Cash and Cash Equivalents in the Statements of Fiduciary Net Position.
December 31, 2018
(dollars in thousands)
Investment Type SAWSRP DSPRPSAWS OPEB
PlanTotal All
Plans
Allocation Based on Fair
Value
Collective, Pooled & Mutual Funds:
Domestic Equity 73,450$ 3,021$ 29,289$ 105,760$ 38.5%
International Equity 34,581 109 9,429 44,119 16.1%
Domestic Debt 79,684 354 22,648 102,686 37.4%
Real Estate 14,072 14,072 5.1%
Balanced/Asset Allocation 4,517 4,517 1.6%
Commodities 56 56 0.0%
Money Market Mutual Funds 1,323 1,323 0.5%
Standard Insurance Company: 0.0%
Guaranteed Long-term Fund 1,999 1,999 0.7%
Total Investments 206,304$ 5,539$ 62,689$ 274,532$ 100.0%
December 31, 2017
(dollars in thousands)
Investment Type SAWSRP DSPRPSAWS OPEB
PlanTotal All
Plans
Allocation Based on Fair
Value
Collective, Pooled & Mutual Funds:
Domestic Equity 126,660$ 3,420$ 26,778$ 156,858$ 56.9%
International Equity 2 135 8,686 8,823 3.2%
Domestic Debt 81,597 386 21,314 103,297 37.5%
Balanced/Asset Allocation 3,133 - - 3,133 1.1%
Commodities - 69 - 69 0.0%
Money Market Mutual Funds - - 1,733 1,733 0.6%
Standard Insurance Company:
Guaranteed Long-term Fund - 1,696 - 1,696 0.6%
Total Investments 211,392$ 5,706$ 58,511$ 275,609$ 100.0%
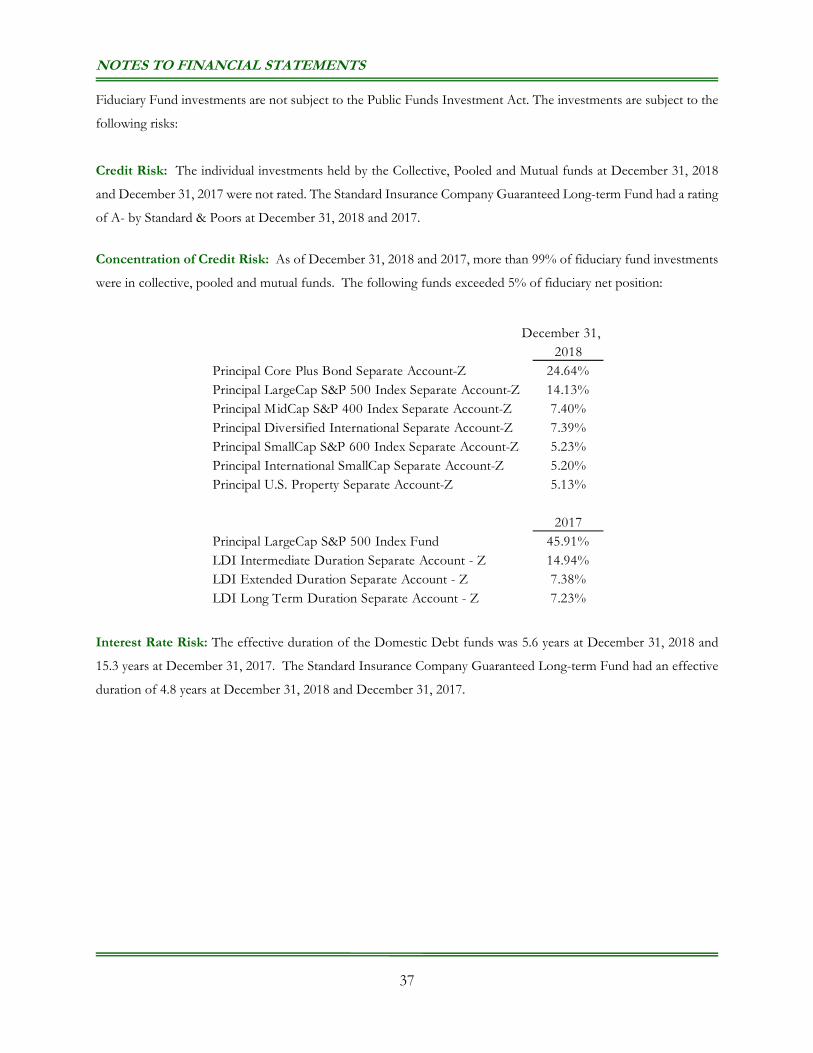
NOTES TO FINANCIAL STATEMENTS
37
Fiduciary Fund investments are not subject to the Public Funds Investment Act. The investments are subject to the
following risks:
Credit Risk: The individual investments held by the Collective, Pooled and Mutual funds at December 31, 2018
and December 31, 2017 were not rated. The Standard Insurance Company Guaranteed Long-term Fund had a rating
of A- by Standard & Poors at December 31, 2018 and 2017.
Concentration of Credit Risk: As of December 31, 2018 and 2017, more than 99% of fiduciary fund investments
were in collective, pooled and mutual funds. The following funds exceeded 5% of fiduciary net position:
Interest Rate Risk: The effective duration of the Domestic Debt funds was 5.6 years at December 31, 2018 and
15.3 years at December 31, 2017. The Standard Insurance Company Guaranteed Long-term Fund had an effective
duration of 4.8 years at December 31, 2018 and December 31, 2017.
2018Principal Core Plus Bond Separate Account-Z 24.64%Principal LargeCap S&P 500 Index Separate Account-Z 14.13%Principal MidCap S&P 400 Index Separate Account-Z 7.40%Principal Diversified International Separate Account-Z 7.39%Principal SmallCap S&P 600 Index Separate Account-Z 5.23%Principal International SmallCap Separate Account-Z 5.20%Principal U.S. Property Separate Account-Z 5.13%
2017Principal LargeCap S&P 500 Index Fund 45.91%LDI Intermediate Duration Separate Account - Z 14.94%LDI Extended Duration Separate Account - Z 7.38%LDI Long Term Duration Separate Account - Z 7.23%
December 31,
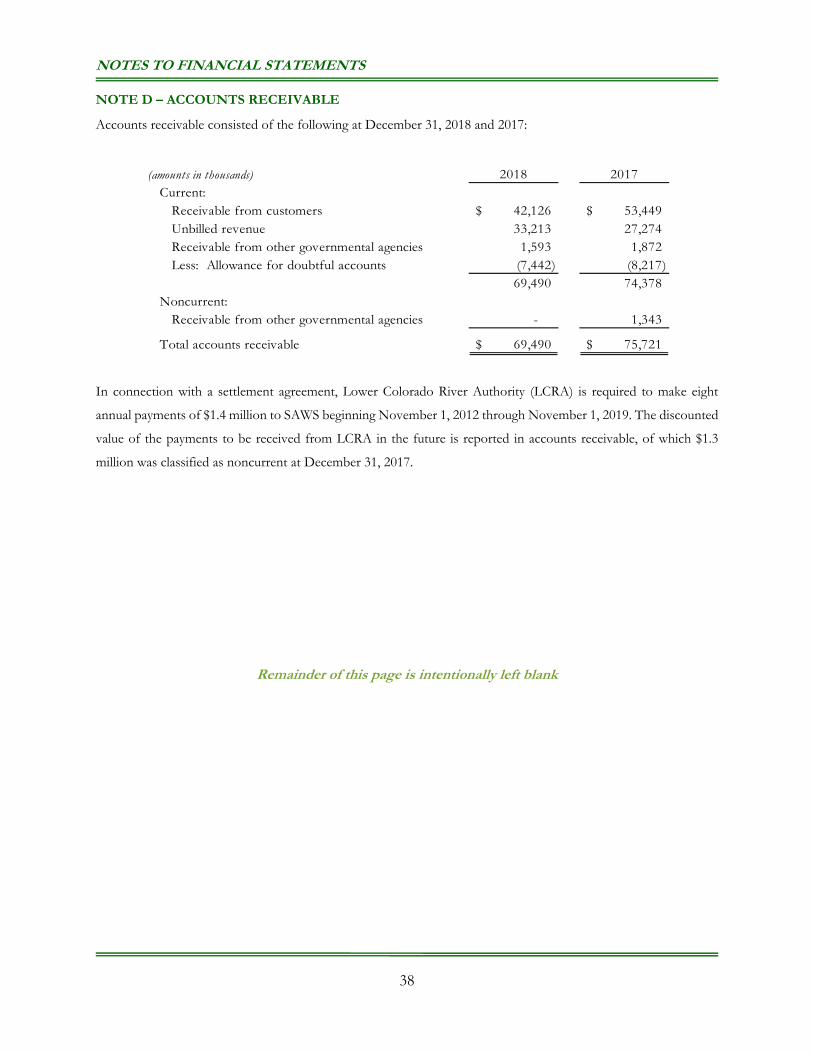
NOTES TO FINANCIAL STATEMENTS
38
NOTE D – ACCOUNTS RECEIVABLE Accounts receivable consisted of the following at December 31, 2018 and 2017:
In connection with a settlement agreement, Lower Colorado River Authority (LCRA) is required to make eight
annual payments of $1.4 million to SAWS beginning November 1, 2012 through November 1, 2019. The discounted
value of the payments to be received from LCRA in the future is reported in accounts receivable, of which $1.3
million was classified as noncurrent at December 31, 2017.
Remainder of this page is intentionally left blank
(amounts in thousands) 2018 2017Current: Receivable from customers 42,126$ 53,449$ Unbilled revenue 33,213 27,274 Receivable from other governmental agencies 1,593 1,872 Less: Allowance for doubtful accounts (7,442) (8,217)
69,490 74,378 Noncurrent: Receivable from other governmental agencies - 1,343
Total accounts receivable 69,490$ 75,721$
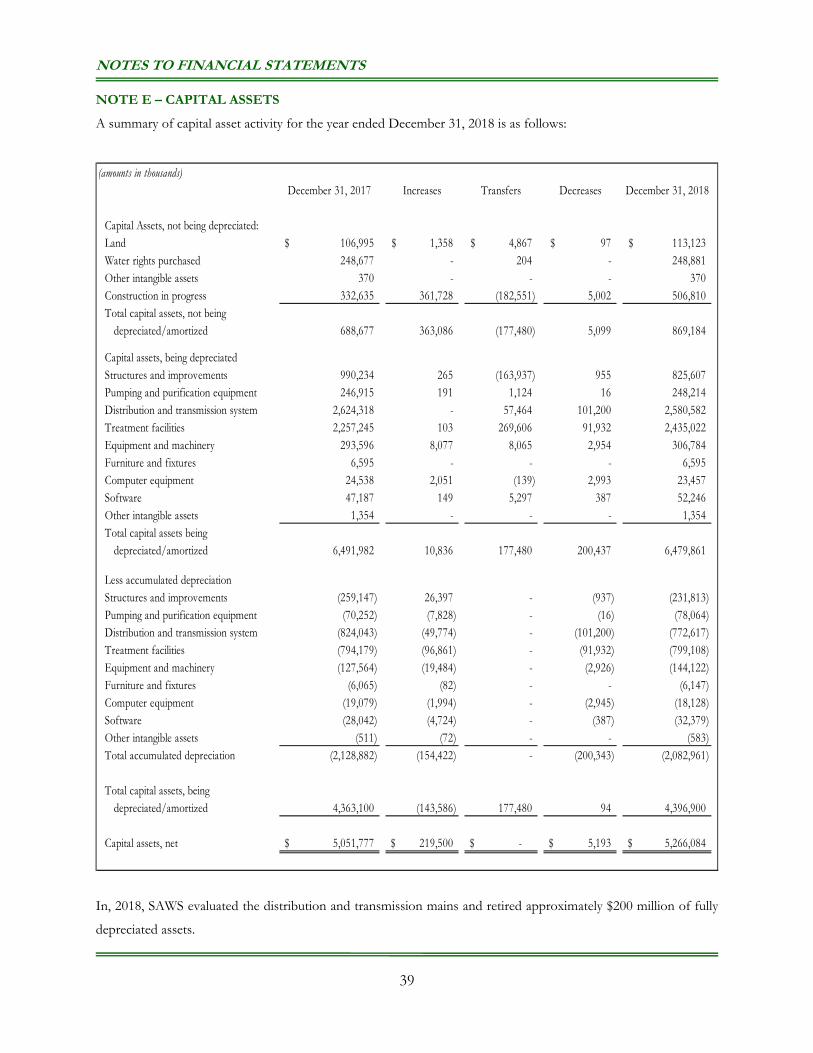
NOTES TO FINANCIAL STATEMENTS
39
NOTE E – CAPITAL ASSETS
A summary of capital asset activity for the year ended December 31, 2018 is as follows:
In, 2018, SAWS evaluated the distribution and transmission mains and retired approximately $200 million of fully
depreciated assets.
(amounts in thousands)December 31, 2017 Increases Transfers Decreases December 31, 2018
Capital Assets, not being depreciated:Land 106,995$ 1,358$ 4,867$ 97$ 113,123$ Water rights purchased 248,677 - 204 - 248,881 Other intangible assets 370 - - - 370 Construction in progress 332,635 361,728 (182,551) 5,002 506,810 Total capital assets, not being depreciated/amortized 688,677 363,086 (177,480) 5,099 869,184
Capital assets, being depreciatedStructures and improvements 990,234 265 (163,937) 955 825,607 Pumping and purification equipment 246,915 191 1,124 16 248,214 Distribution and transmission system 2,624,318 - 57,464 101,200 2,580,582 Treatment facilities 2,257,245 103 269,606 91,932 2,435,022 Equipment and machinery 293,596 8,077 8,065 2,954 306,784 Furniture and fixtures 6,595 - - - 6,595 Computer equipment 24,538 2,051 (139) 2,993 23,457 Software 47,187 149 5,297 387 52,246 Other intangible assets 1,354 - - - 1,354 Total capital assets being depreciated/amortized 6,491,982 10,836 177,480 200,437 6,479,861
Less accumulated depreciationStructures and improvements (259,147) 26,397 - (937) (231,813) Pumping and purification equipment (70,252) (7,828) - (16) (78,064) Distribution and transmission system (824,043) (49,774) - (101,200) (772,617) Treatment facilities (794,179) (96,861) - (91,932) (799,108) Equipment and machinery (127,564) (19,484) - (2,926) (144,122) Furniture and fixtures (6,065) (82) - - (6,147) Computer equipment (19,079) (1,994) - (2,945) (18,128) Software (28,042) (4,724) - (387) (32,379) Other intangible assets (511) (72) - - (583) Total accumulated depreciation (2,128,882) (154,422) - (200,343) (2,082,961)
Total capital assets, being depreciated/amortized 4,363,100 (143,586) 177,480 94 4,396,900
Capital assets, net 5,051,777$ 219,500$ -$ 5,193$ 5,266,084$
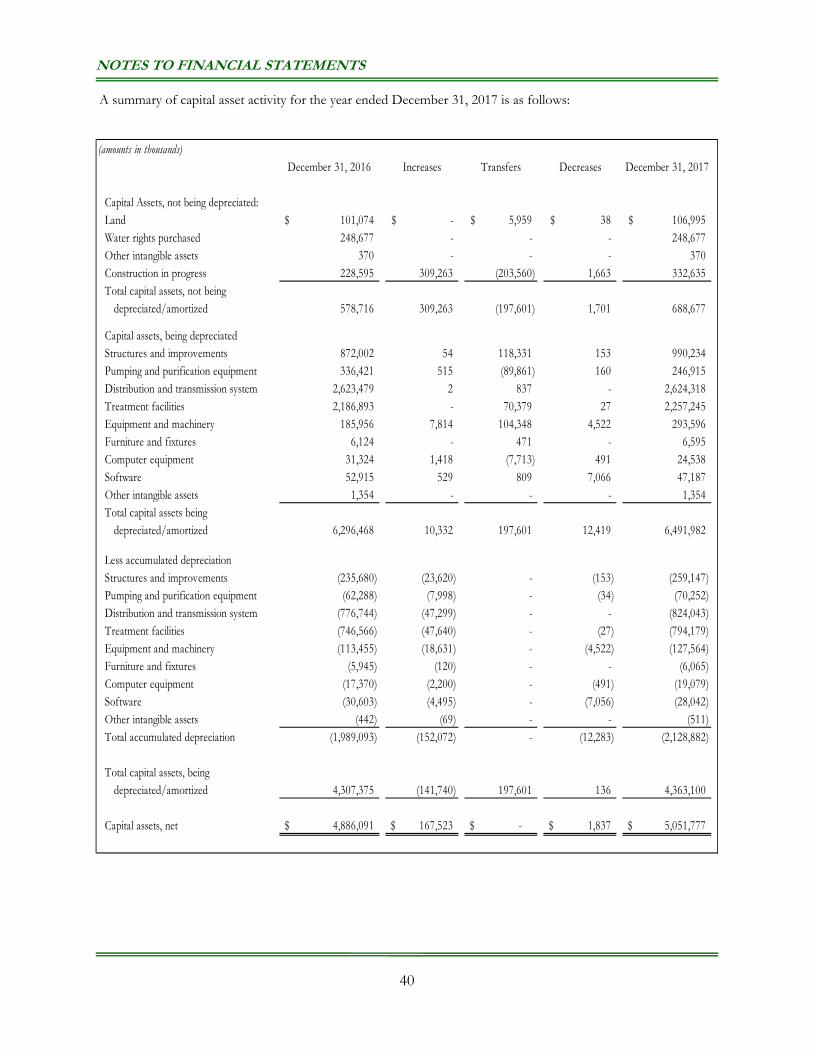
NOTES TO FINANCIAL STATEMENTS
40
A summary of capital asset activity for the year ended December 31, 2017 is as follows:
(amounts in thousands)December 31, 2016 Increases Transfers Decreases December 31, 2017
Capital Assets, not being depreciated:Land 101,074$ -$ 5,959$ 38$ 106,995$ Water rights purchased 248,677 - - - 248,677 Other intangible assets 370 - - - 370 Construction in progress 228,595 309,263 (203,560) 1,663 332,635 Total capital assets, not being depreciated/amortized 578,716 309,263 (197,601) 1,701 688,677
Capital assets, being depreciatedStructures and improvements 872,002 54 118,331 153 990,234 Pumping and purification equipment 336,421 515 (89,861) 160 246,915 Distribution and transmission system 2,623,479 2 837 - 2,624,318 Treatment facilities 2,186,893 - 70,379 27 2,257,245 Equipment and machinery 185,956 7,814 104,348 4,522 293,596 Furniture and fixtures 6,124 - 471 - 6,595 Computer equipment 31,324 1,418 (7,713) 491 24,538 Software 52,915 529 809 7,066 47,187 Other intangible assets 1,354 - - - 1,354 Total capital assets being depreciated/amortized 6,296,468 10,332 197,601 12,419 6,491,982
Less accumulated depreciationStructures and improvements (235,680) (23,620) - (153) (259,147) Pumping and purification equipment (62,288) (7,998) - (34) (70,252) Distribution and transmission system (776,744) (47,299) - - (824,043) Treatment facilities (746,566) (47,640) - (27) (794,179) Equipment and machinery (113,455) (18,631) - (4,522) (127,564) Furniture and fixtures (5,945) (120) - - (6,065) Computer equipment (17,370) (2,200) - (491) (19,079) Software (30,603) (4,495) - (7,056) (28,042) Other intangible assets (442) (69) - - (511) Total accumulated depreciation (1,989,093) (152,072) - (12,283) (2,128,882)
Total capital assets, being depreciated/amortized 4,307,375 (141,740) 197,601 136 4,363,100
Capital assets, net 4,886,091$ 167,523$ -$ 1,837$ 5,051,777$
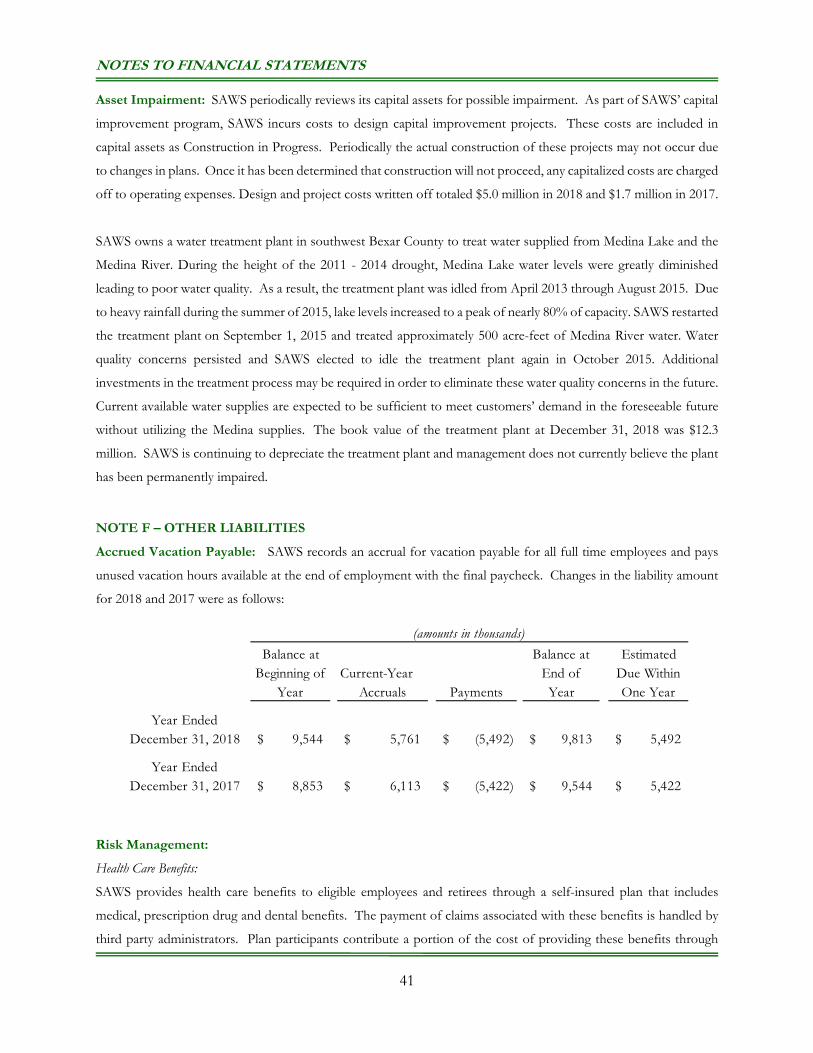
NOTES TO FINANCIAL STATEMENTS
41
Asset Impairment: SAWS periodically reviews its capital assets for possible impairment. As part of SAWS’ capital
improvement program, SAWS incurs costs to design capital improvement projects. These costs are included in
capital assets as Construction in Progress. Periodically the actual construction of these projects may not occur due
to changes in plans. Once it has been determined that construction will not proceed, any capitalized costs are charged
off to operating expenses. Design and project costs written off totaled $5.0 million in 2018 and $1.7 million in 2017.
SAWS owns a water treatment plant in southwest Bexar County to treat water supplied from Medina Lake and the
Medina River. During the height of the 2011 - 2014 drought, Medina Lake water levels were greatly diminished
leading to poor water quality. As a result, the treatment plant was idled from April 2013 through August 2015. Due
to heavy rainfall during the summer of 2015, lake levels increased to a peak of nearly 80% of capacity. SAWS restarted
the treatment plant on September 1, 2015 and treated approximately 500 acre-feet of Medina River water. Water
quality concerns persisted and SAWS elected to idle the treatment plant again in October 2015. Additional
investments in the treatment process may be required in order to eliminate these water quality concerns in the future.
Current available water supplies are expected to be sufficient to meet customers’ demand in the foreseeable future
without utilizing the Medina supplies. The book value of the treatment plant at December 31, 2018 was $12.3
million. SAWS is continuing to depreciate the treatment plant and management does not currently believe the plant
has been permanently impaired.
NOTE F – OTHER LIABILITIES Accrued Vacation Payable: SAWS records an accrual for vacation payable for all full time employees and pays
unused vacation hours available at the end of employment with the final paycheck. Changes in the liability amount
for 2018 and 2017 were as follows:
Risk Management:
Health Care Benefits:
SAWS provides health care benefits to eligible employees and retirees through a self-insured plan that includes
medical, prescription drug and dental benefits. The payment of claims associated with these benefits is handled by
third party administrators. Plan participants contribute a portion of the cost of providing these benefits through
Balance at Balance at EstimatedBeginning of Current-Year End of Due Within
Year Accruals Payments Year One Year
Year EndedDecember 31, 2018 9,544$ 5,761$ (5,492)$ 9,813$ 5,492$
Year EndedDecember 31, 2017 8,853$ 6,113$ (5,422)$ 9,544$ 5,422$
(amounts in thousands)
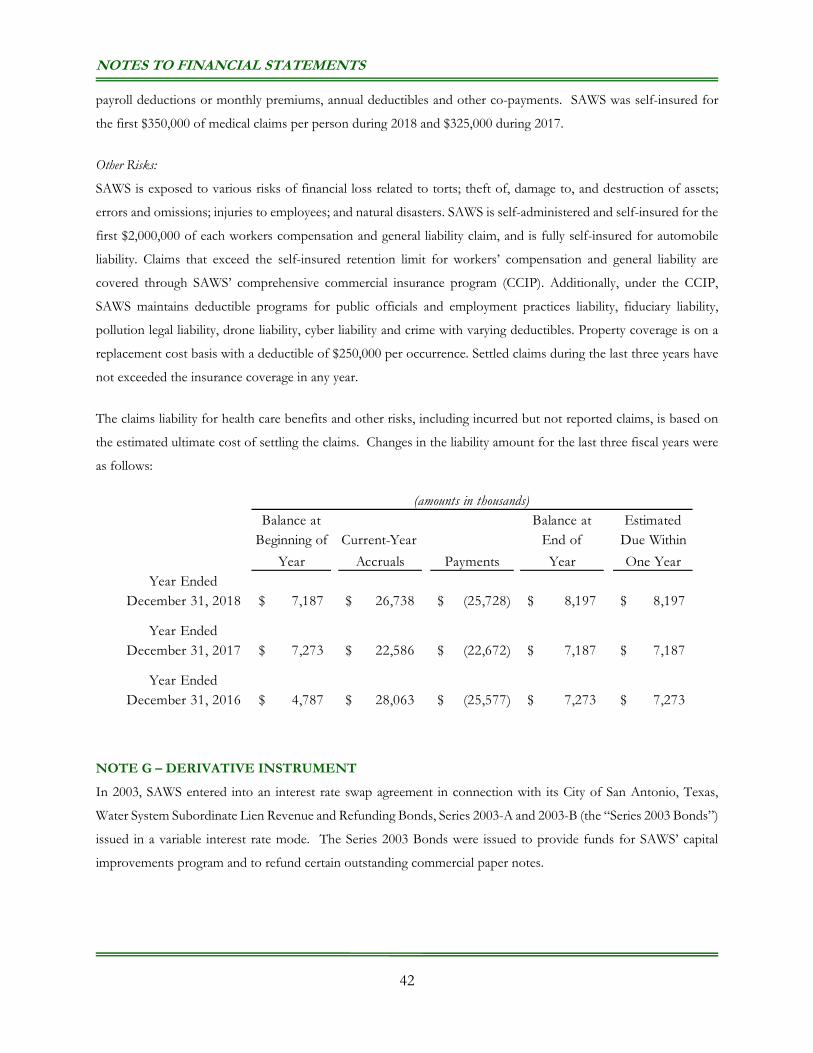
NOTES TO FINANCIAL STATEMENTS
42
payroll deductions or monthly premiums, annual deductibles and other co-payments. SAWS was self-insured for
the first $350,000 of medical claims per person during 2018 and $325,000 during 2017.
Other Risks:
SAWS is exposed to various risks of financial loss related to torts; theft of, damage to, and destruction of assets;
errors and omissions; injuries to employees; and natural disasters. SAWS is self-administered and self-insured for the
first $2,000,000 of each workers compensation and general liability claim, and is fully self-insured for automobile
liability. Claims that exceed the self-insured retention limit for workers’ compensation and general liability are
covered through SAWS’ comprehensive commercial insurance program (CCIP). Additionally, under the CCIP,
SAWS maintains deductible programs for public officials and employment practices liability, fiduciary liability,
pollution legal liability, drone liability, cyber liability and crime with varying deductibles. Property coverage is on a
replacement cost basis with a deductible of $250,000 per occurrence. Settled claims during the last three years have
not exceeded the insurance coverage in any year.
The claims liability for health care benefits and other risks, including incurred but not reported claims, is based on
the estimated ultimate cost of settling the claims. Changes in the liability amount for the last three fiscal years were
as follows:
NOTE G – DERIVATIVE INSTRUMENT
In 2003, SAWS entered into an interest rate swap agreement in connection with its City of San Antonio, Texas,
Water System Subordinate Lien Revenue and Refunding Bonds, Series 2003-A and 2003-B (the “Series 2003 Bonds”)
issued in a variable interest rate mode. The Series 2003 Bonds were issued to provide funds for SAWS’ capital
improvements program and to refund certain outstanding commercial paper notes.
Balance at Balance at EstimatedBeginning of Current-Year End of Due Within
Year Accruals Payments Year One YearYear Ended
December 31, 2018 7,187$ 26,738$ (25,728)$ 8,197$ 8,197$
Year EndedDecember 31, 2017 7,273$ 22,586$ (22,672)$ 7,187$ 7,187$
Year EndedDecember 31, 2016 4,787$ 28,063$ (25,577)$ 7,273$ 7,273$
(amounts in thousands)
NOTES TO FINANCIAL STATEMENTS
43
Objective of the Interest Rate Swap: The swap was used to hedge interest rates on the Series 2003 Bonds to a
synthetic fixed rate that produced a lower interest rate cost than a traditional long term fixed rate bond issued at that
time. In August 2008, SAWS used commercial paper notes to redeem $110,615,000 of the $111,615,000 outstanding
principal of the Series 2003 Bonds due to unfavorable market conditions relating to the ratings downgrade of the
2003 Bond insurer, MBIA Insurance Corporation. In 2009, SAWS redeemed the remaining $1 million of the Series
2003 Bonds through the issuance of additional commercial paper. The interest rate swap agreement was not
terminated upon the redemption of the 2003 Bonds and instead serves as an off-market hedge for that portion of
the commercial paper notes outstanding which pertain to the redemption of the 2003 Bonds. SAWS currently intends
to maintain a portion of its outstanding commercial paper in amounts matching the notional amounts of the swap.
SAWS did not recognize any economic gain or loss as a result of this refunding since the debt service requirements
of the commercial paper notes are expected to closely match the debt service requirements of the refunded debt.
Commercial paper notes totaling $80,995,000 at December 31, 2018 and $84,705,000 at December 31, 2017 were
hedged by the interest rate swap agreement.
Terms: The swap agreement contains scheduled reductions to the outstanding notional amounts that are expected
to follow the original scheduled reductions of the Series 2003 Bonds. The Series 2003 Bonds were issued on March
27, 2003, with a principal amount of $122,500,000. The swap agreement matures on May 1, 2033. At the time the
swap was entered into, the counterparty was Bear Stearns Financial Products, Inc. (“Bear Stearns FPI”), with the
index for the variable rate leg of the SWAP being the Securities Industry and Financial Markets Association
(“SIFMA”) Municipal Swap Index.
In 2008, JPMorgan Chase & Co. announced its acquisition of The Bear Stearns Companies Inc., the parent of Bear
Stearns FPI. JPMorgan Chase guaranteed the trading obligations of Bear Stearns and its subsidiaries. Effective June
16, 2009, the swap agreement was amended between SAWS, JPMorgan Chase & Co, and MBIA to provide for
JPMorgan Chase Bank N.A. to become the swap counterparty and allow for the remainder of outstanding Series
2003 Bonds to be redeemed, while maintaining the swap agreement as an obligation to all parties. The amendment
provides for the conditional release of MBIA’s swap insurance policy upon the occurrence of certain future events.
The combination of commercial paper notes and a floating-to-fixed swap creates a synthetic fixed-rate of 4.18%.
The synthetic fixed-rate protects against the potential of rising interest rates.
Fair Value: The swap had a fair value of approximately negative $12,516,000 at December 31, 2018 and negative
$15,394,000 at December 31, 2017. This value is based on Level 2 inputs in the fair value hierarchy using the zero-
coupon valuation method. This method calculates the future net settlement payments required by the swap,
assuming that the current forward rates implied by the yield curve correctly anticipate future spot interest rates.
These net payments are then discounted using the spot rates implied by the current yield curve for hypothetical zero-
coupon bonds due on the date of each future net settlement on the swap.
NOTES TO FINANCIAL STATEMENTS
44
The swap agreement meets the criteria of an effective hedge under GASB Statement No. 53 and therefore qualifies
for hedge accounting treatment. Since the fair value is negative, the fair value is recorded as a non-current liability.
Changes in the swap’s fair value are recorded as a deferred outflow of resources and included on the Statement of
Net Position. At the time the 2003 Bonds were redeemed in 2008, the fair value of the swap was negative $6.2
million. The deferred outflow at the time of redemption was included in the carrying value of the 2003 Bonds and
resulted in a loss on redemption of $6.2 million. This loss is included in the deferred charge on bond refunding on
the Statement of Net Position and is being amortized over the remaining life of the 2003 Bonds. The unamortized
deferred charge on bond refunding related to the swap was $3,184,000 at December 31, 2018 and $3,537,000 at
December 31, 2017.
Credit Risk: SAWS was not exposed to credit risk on its outstanding swap at December 31, 2017 and 2018 because
the swap had a negative fair value. However, should interest rates change and the fair value of the swap become
positive, SAWS would be exposed to credit risk in the amount of the swap’s fair value. The swap counterparty,
JPMorgan Chase Bank, N.A. was rated Aa2 by Moody’s Investors Services, A+ by Standard and Poor’s, and AA by
Fitch Ratings as of December 31, 2018 and Aa3 by Moody’s Investors Services, A+ by Standard and Poor’s, and
AA- by Fitch Ratings as of December 31, 2017. The amended swap agreement contains a credit support annex
which will become effective upon the release of MBIA from the swap insurance policy. Collateralization would be
required by either party should the fair value of the swap reach applicable thresholds as stated in the amended swap
agreement.
Basis Risk: SAWS is exposed to basis risk to the extent that the interest payments on its hedged commercial paper
notes do not match the variable-rate payments received on the associated swap. SAWS attempts to mitigate this risk
by (a) matching the outstanding hedged commercial paper notes associated with the redemption of the variable-rate
debt to the notional amount and amortization schedule of the swap and (b) selecting an index for the variable-rate
leg of the swap that is reasonably expected to closely match the interest rate on the hedged commercial paper notes.
Termination Risk: SAWS may terminate the Swap at any time for any reason. JPMorgan Chase may terminate
the swap if SAWS fails to perform under the terms of the agreement. SAWS’ ongoing payment obligations under
the swap are insured as provided for in the swap amendment and JPMorgan Chase cannot terminate as long as the
insurer does not fail to perform. Also, if at the time of the termination the swap has a negative fair value, SAWS
would be liable to the counterparty for a payment equal to the swap’s fair value.
Market-access Risk: SAWS is subject to market-access risk as the variable-rate debt hedged by the swap is
commercial paper notes. At December 31, 2018, $80,995,000 of outstanding commercial paper with current
maturities of approximately 30 days was hedged by the interest rate swap. The amount of commercial paper hedge
at December 31, 2017 totaled $84,705,000 with maturities of approximately 32 days. As previously noted, SAWS
intends to reissue the commercial paper notes in amounts matching the notional amounts of the swap.
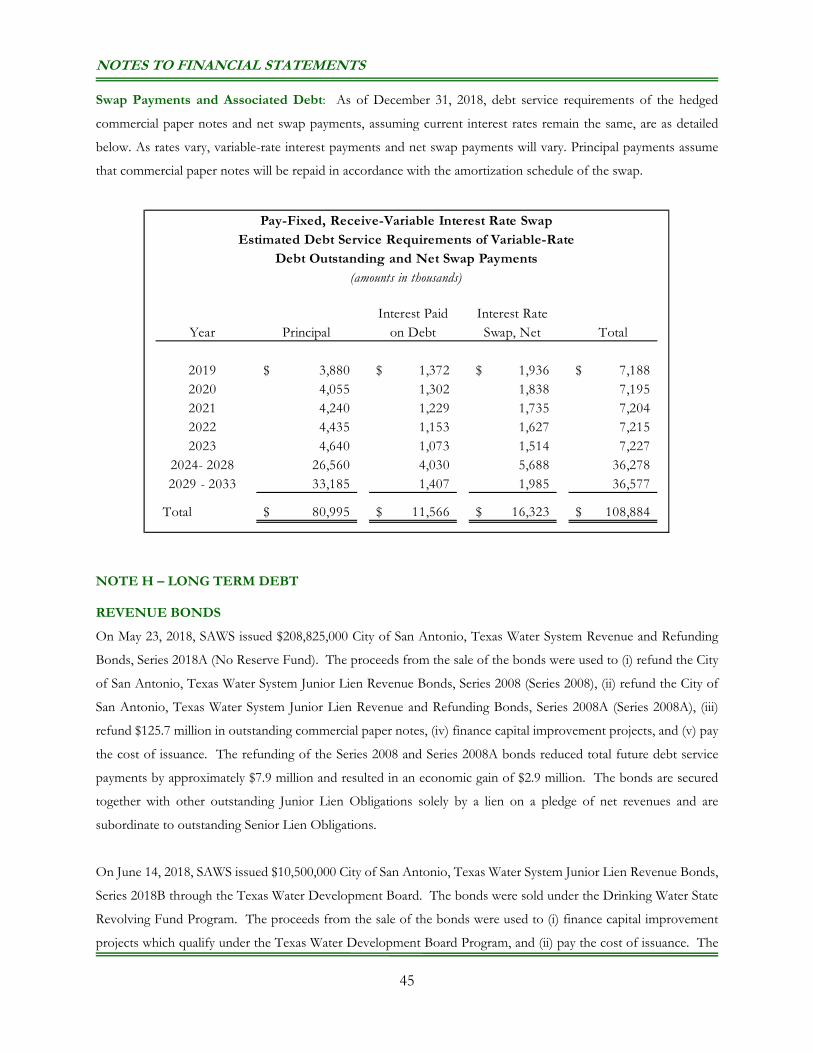
NOTES TO FINANCIAL STATEMENTS
45
Swap Payments and Associated Debt: As of December 31, 2018, debt service requirements of the hedged
commercial paper notes and net swap payments, assuming current interest rates remain the same, are as detailed
below. As rates vary, variable-rate interest payments and net swap payments will vary. Principal payments assume
that commercial paper notes will be repaid in accordance with the amortization schedule of the swap.
NOTE H – LONG TERM DEBT REVENUE BONDS
On May 23, 2018, SAWS issued $208,825,000 City of San Antonio, Texas Water System Revenue and Refunding
Bonds, Series 2018A (No Reserve Fund). The proceeds from the sale of the bonds were used to (i) refund the City
of San Antonio, Texas Water System Junior Lien Revenue Bonds, Series 2008 (Series 2008), (ii) refund the City of
San Antonio, Texas Water System Junior Lien Revenue and Refunding Bonds, Series 2008A (Series 2008A), (iii)
refund $125.7 million in outstanding commercial paper notes, (iv) finance capital improvement projects, and (v) pay
the cost of issuance. The refunding of the Series 2008 and Series 2008A bonds reduced total future debt service
payments by approximately $7.9 million and resulted in an economic gain of $2.9 million. The bonds are secured
together with other outstanding Junior Lien Obligations solely by a lien on a pledge of net revenues and are
subordinate to outstanding Senior Lien Obligations.
On June 14, 2018, SAWS issued $10,500,000 City of San Antonio, Texas Water System Junior Lien Revenue Bonds,
Series 2018B through the Texas Water Development Board. The bonds were sold under the Drinking Water State
Revolving Fund Program. The proceeds from the sale of the bonds were used to (i) finance capital improvement
projects which qualify under the Texas Water Development Board Program, and (ii) pay the cost of issuance. The
Year PrincipalInterest Paid
on DebtInterest Rate Swap, Net Total
2019 3,880$ 1,372$ 1,936$ 7,188$ 2020 4,055 1,302 1,838 7,195 2021 4,240 1,229 1,735 7,204 2022 4,435 1,153 1,627 7,215 2023 4,640 1,073 1,514 7,227
2024- 2028 26,560 4,030 5,688 36,278 2029 - 2033 33,185 1,407 1,985 36,577
Total 80,995$ 11,566$ 16,323$ 108,884$
Pay-Fixed, Receive-Variable Interest Rate SwapEstimated Debt Service Requirements of Variable-Rate
Debt Outstanding and Net Swap Payments(amounts in thousands)
NOTES TO FINANCIAL STATEMENTS
46
bonds are secured together with other outstanding Junior Lien Obligations solely by a lien on a pledge of net revenues
and are subordinate to outstanding Senior Lien Obligations.
Senior lien water system revenue bonds outstanding as of December 31, 2018 consist of the Series 2009B, Series
2010B, Series 2011, Series 2011A, Series 2012, and Series 2012A, outstanding in the amount of $718,305,000 and as
of December 31, 2017, consist of the Series 2009, Series 2009B, Series 2010B, Series 2011, Series 2011A, Series 2012,
and Series 2012A, in the amount of $742,025,000. Senior lien revenue bonds are collateralized by a senior lien and
pledge of the gross revenues of SAWS after deducting and paying the current expenses of operation and maintenance
of SAWS and maintaining a two-month operating reserve for such expenses. Interest rates on senior lien bonds
range from 3.000% to 6.220%, exclusive of any federal interest subsidy on the Series 2009B and 2010B Build America
Bonds.
The junior lien water system revenue bonds are composed of two categories of debt: fixed rate debt and variable
rate debt. The junior lien fixed rate debt is similar to the senior lien bonds, as they have fixed interest rates for the
life of the bonds. The junior lien variable rate bonds have interest rates that are periodically reset throughout the
life of the bonds. All the junior lien water system revenue bonds are collateralized by a junior lien and pledge of the
gross revenues of SAWS after deducting the current expenses of operation and maintenance of SAWS, maintaining
a two-month operating reserve for such expenses, and paying debt service on senior lien debt.
As of December 31, 2018, outstanding junior lien fixed rate bonds consist of Series 2007, Series 2009, Series 2009A,
Series 2010, Series 2010A, Series 2011, Series 2011A, Series 2012 (No Reserve Fund), Series 2012, Series 2013A,
Series 2013B (No Reserve Fund), Series 2013C, Series 2013D, Series 2013E (No Reserve Fund), Series 2014A (No
Reserve Fund), Series 2014C, Series 2014D, Series 2015A, Series 2015B (No Reserve Fund), Series 2016A (No
Reserve Fund), Taxable Series 2016B, Series 2016C (No Reserve Fund), Series 2016D, Series 2016E, Series 2017A
(No Reserve Fund), Series 2018A (No Reserve Fund), and Series 2018B is outstanding in the amount of
$1,714,525,000. As of December 31, 2017, outstanding junior lien fixed rate bonds consist of Series 2007, Series
2008, Series 2008A, Series 2009, Series 2009A, Series 2010, Series 2010A, Series 2011, Series 2011A, Series 2012 (No
Reserve Fund), Series 2012, Series 2013A, Series 2013B (No Reserve Fund), Series 2013C, Series 2013D, Series
2013E (No Reserve Fund), Series 2014A (No Reserve Fund), Series 2014C, Series 2014D, Series 2015A, Series 2015B
(No Reserve Fund), Series 2016A (No Reserve Fund), Taxable Series 2016B, Series 2016C (No Reserve Fund), Series
2016D, Series 2016E, and Series 2017A (No Reserve Fund), in the amount of $1,597,110,000. Interest rates on the
junior lien fixed rate bonds range from 0.000% to 5.000%
The junior lien variable rate bonds, comprised of the Series 2013F (No Reserve Fund) (the Series 2013F Bonds) and
the Series 2014B (No Reserve Fund) (the Series 2014B Bonds), are outstanding in the amount of $198,385,000 at
December 31, 2018 and December 31, 2017. The Series 2013F Bonds are tax-exempt variable rate notes initially
issued in a Securities Industry and Financial Markets Association (SIFMA) Index Mode, with the interest rate reset
NOTES TO FINANCIAL STATEMENTS
47
weekly, through the initial interest period which expired October 31, 2016. On November 1, 2016, SAWS remarketed
$98,795,000 in Series 2013F Bonds into a five-year interest rate period that ends October 31, 2021, the new interest
period. During the new interest period, the Series 2013F Bonds bear interest at 2.00% with a yield of 1.63%. The
Series 2014B Bonds are tax-exempt variable rate notes initially issued in a SIFMA Index Mode, with the interest rate
reset weekly, through the initial interest period expiring October 31, 2017. On November 1, 2017, SAWS remarketed
$99,590,000 in Series 2014B Bonds into a five-year interest rate period that ends October 31, 2022, the new interest
period. During the new interest period, the Series 2014B Bonds bear interest at 2.00% with a yield of 1.80%.
Upon conclusion of the initial interest period, or any subsequent new interest period, SAWS is permitted to change
the mode for all or any portion of the junior lien variable interest bonds (the Bonds) to a different mode or to a
SIFMA Index Mode of different duration. The Bonds are subject to a mandatory tender without right of retention
at the conclusion of the initial interest period or any subsequent new interest period. During the initial interest
period and any subsequent new interest period the Bonds are not subject to the benefit of a liquidity facility provided
by a third party. Accordingly, a failure to remarket the Bonds at the end of the initial interest period or subsequent
new interest period will result in the rescission of the notice of mandatory tender with respect to the Bonds and
SAWS has no obligation to purchase the Bonds at such time. The occurrence of a failed remarketing will not result
in an event of default under the ordinance. Until SAWS redeems or remarkets the Bonds that had a failed
remarketing, the Bonds shall bear interest at the stepped rate of 8.0% for the Series 2013F Bonds and 7.0% for the
Series 2014B Bonds.
The Federal Tax Reform Act of 1986 requires issuers of tax-exempt debt to make payments to the United States
Treasury for investment income received at yields that exceed the issuer’s tax exempt borrowing rates. The Treasury
requires payment for each issue every five years. The estimated liability is updated annually for all tax-exempt
issuances or changes in yields until such time payment of the calculated liability is due. A liability is recorded once
payment appears to be probable. As of December 31, 2018 and December 31, 2017, SAWS has no arbitrage rebate
liability associated with any outstanding bonds.
The following tables summarize revenue bond transactions for the years ended December 31, 2018 and 2017.
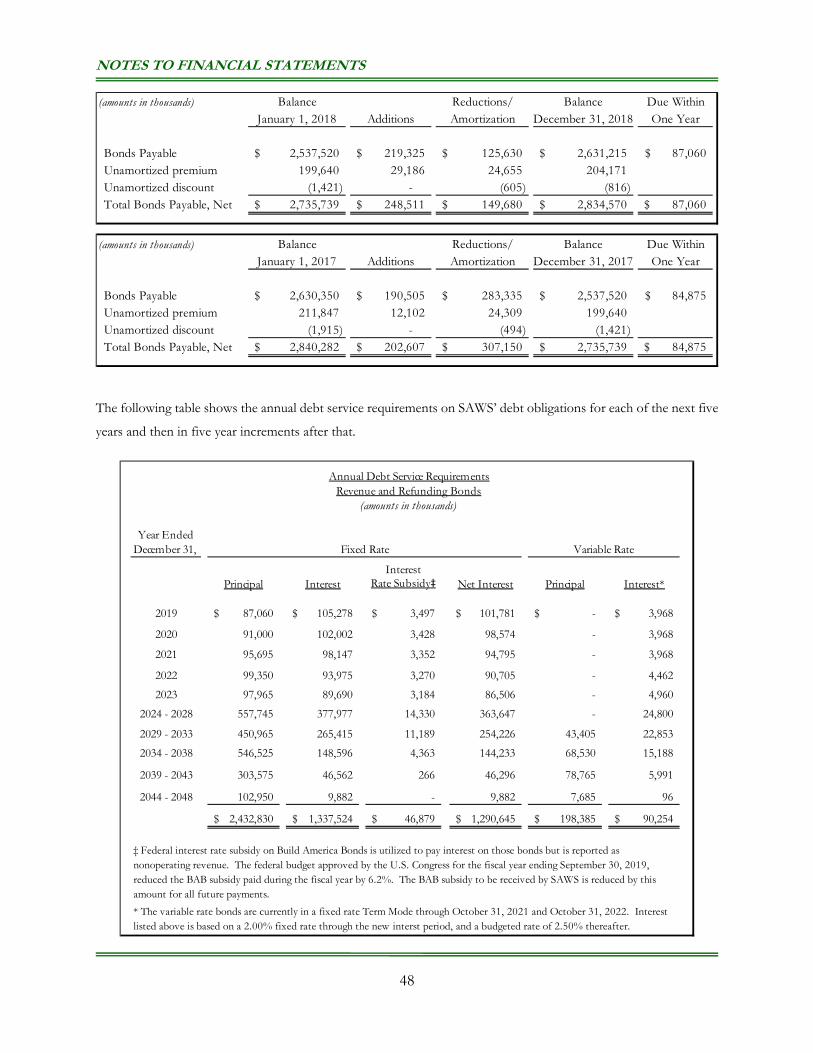
NOTES TO FINANCIAL STATEMENTS
48
The following table shows the annual debt service requirements on SAWS’ debt obligations for each of the next five
years and then in five year increments after that.
(amounts in thousands) Balance Reductions/ Balance Due WithinJanuary 1, 2018 Additions Amortization December 31, 2018 One Year
Bonds Payable 2,537,520$ 219,325$ 125,630$ 2,631,215$ 87,060$ Unamortized premium 199,640 29,186 24,655 204,171 Unamortized discount (1,421) - (605) (816) Total Bonds Payable, Net 2,735,739$ 248,511$ 149,680$ 2,834,570$ 87,060$
(amounts in thousands) Balance Reductions/ Balance Due WithinJanuary 1, 2017 Additions Amortization December 31, 2017 One Year
Bonds Payable 2,630,350$ 190,505$ 283,335$ 2,537,520$ 84,875$ Unamortized premium 211,847 12,102 24,309 199,640 Unamortized discount (1,915) - (494) (1,421) Total Bonds Payable, Net 2,840,282$ 202,607$ 307,150$ 2,735,739$ 84,875$
Year EndedDecember 31,
InterestPrincipal Interest Rate Subsidy‡ Net Interest
2019 87,060$ 105,278$ 3,497$ 101,781$
2020 91,000 102,002 3,428 98,574
2021 95,695 98,147 3,352 94,795
2022 99,350 93,975 3,270 90,705
2023 97,965 89,690 3,184 86,506
2024 - 2028 557,745 377,977 14,330 363,647
2029 - 2033 450,965 265,415 11,189 254,226
2034 - 2038 546,525 148,596 4,363 144,233
2039 - 2043 303,575 46,562 266 46,296
2044 - 2048 102,950 9,882 - 9,882
2,432,830$ 1,337,524$ 46,879$ 1,290,645$ 198,385$ 90,254$
‡ Federal interest rate subsidy on Build America Bonds is utilized to pay interest on those bonds but is reported as nonoperating revenue. The federal budget approved by the U.S. Congress for the fiscal year ending September 30, 2019, reduced the BAB subsidy paid during the fiscal year by 6.2%. The BAB subsidy to be received by SAWS is reduced by this amount for all future payments.
* The variable rate bonds are currently in a fixed rate Term Mode through October 31, 2021 and October 31, 2022. Interest listed above is based on a 2.00% fixed rate through the new interst period, and a budgeted rate of 2.50% thereafter.
7,685 96
68,530 15,188
78,765 5,991
43,405 22,853
- 4,462
- 4,960
- 24,800
- 3,968
-$ 3,968$
- 3,968
Principal Interest*
(amounts in thousands)
Fixed Rate Variable Rate
Annual Debt Service RequirementsRevenue and Refunding Bonds
NOTES TO FINANCIAL STATEMENTS
49
COMMERCIAL PAPER PROGRAM
SAWS maintains a commercial paper program that is used to provide funds for the interim financing of a portion of
its capital improvements. The City Council of the City of San Antonio has authorized the commercial paper program
in an amount of $500 million. Notes payable under the program cannot exceed maturities of 270 days.
The City has covenanted in the Ordinance authorizing the commercial paper program (the “Note Ordinance”) the
issuance of “City of San Antonio, Texas Water System Commercial Paper Notes, Series A” (the “Series A Notes”),
the issuance of “City of San Antonio, Texas Water System Commercial Paper Notes, Series B” (the “Series B
Notes”), and the maintenance at all times of credit facilities with banks or other financial institutions which would
provide available borrowing capacity sufficient to pay the principal of the commercial paper program. The credit
facility is maintained under the terms of a revolving credit agreement. The Ordinance also authorizes the ability to
designate and issues subseries of notes. The Series A Notes are currently authorized as “City of San Antonio, Texas
Water System Commercial Paper Notes, Subseries A-1” (the “Subseries A-1 Notes”) and “City of San Antonio,
Texas Water System Commercial Paper Notes, Subseries A-2” (the “Subseries A-2 Notes”). The Subseries A-2
Notes are directly placed with JPMorgan Chase Bank, N.A. under a Note Purchase Agreement.
The borrowings under the commercial paper program are equally and ratably secured by and are payable from (i) the
proceeds from the sale of bonds or additional borrowing under the commercial paper program and (ii) borrowing
under and pursuant to the revolving credit agreement. The capacity of the combined revolving credit and note
purchase agreements is $500 million with the Revolving Credit Agreement with JPMorgan Chase Bank, N.A. in the
amount of $400 million, supporting the Series A Notes expiring October 4, 2023; and the Revolving Credit
Agreement with Wells Fargo Bank, N.A. in the amount of $100 million, supporting the Series B Notes expiring
January 15, 2021.
The issuance of commercial paper is further supported by the following agreements and related participants:
Dealer Agreements with Goldman, Sachs & Co., J.P. Morgan Securities LLC., and Ramirez & Co., Inc.
Issuing and Paying Agency Agreement with The Bank of New York Mellon Trust Company, N.A.
Commercial paper notes of $215,695,000 are outstanding as of December 31, 2018, with $132,700,000 outstanding
under the Subseries A-1 Notes, $2,000,000 outstanding under Subseries A-2 Notes, and $80,995,000 outstanding
under Series B Notes. Interest rates on the Subseries A-1 Notes and the Series B Notes outstanding at December
31, 2018 range from 1.75% to 1.95% and maturities range from 30 to 180 days. The interest rate on the Subseries
A-2 Notes outstanding at December 31, 2018 is 3.16% with a maturity of 30 days. All outstanding notes had an
average rate of 1.82% and averaged 71 days to maturity. Commercial paper notes of $278,060,000 are outstanding
as of December 31, 2017. Interest rates on the notes outstanding at December 31, 2017 range from 0.99% to 1.16%
and maturities range from 32 to 180 days. The outstanding notes had an average rate of 1.08% and averaged 73 days
to maturity.
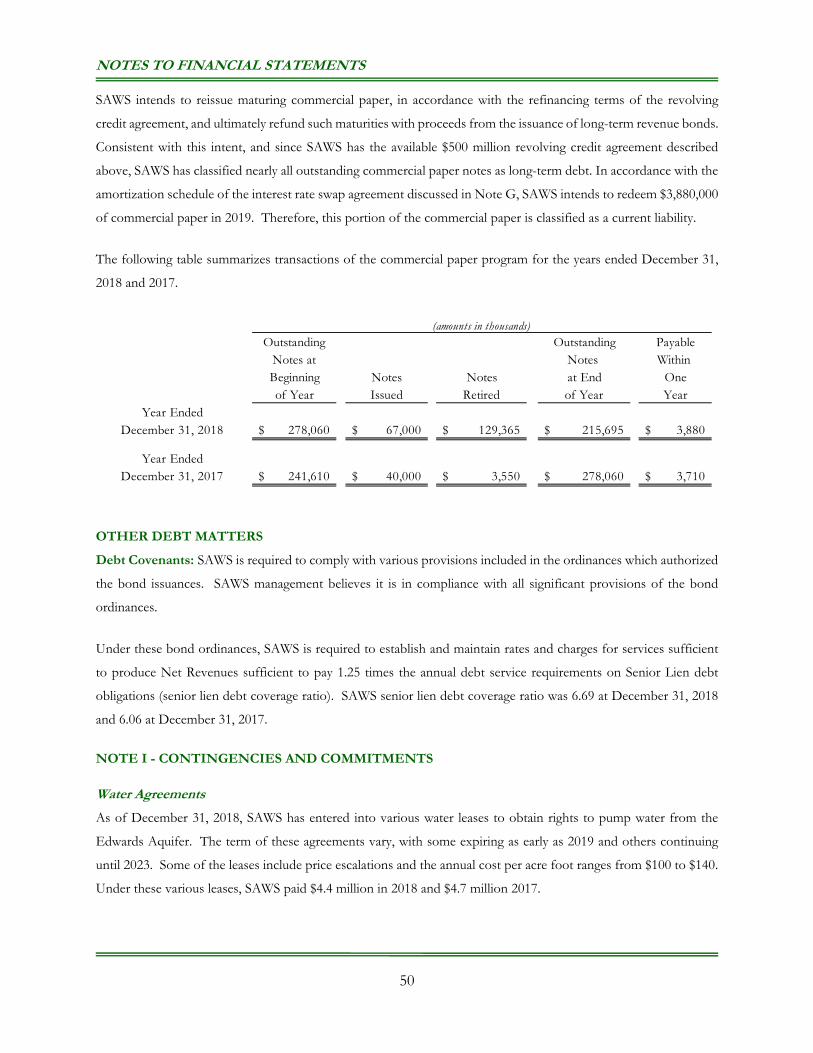
NOTES TO FINANCIAL STATEMENTS
50
SAWS intends to reissue maturing commercial paper, in accordance with the refinancing terms of the revolving
credit agreement, and ultimately refund such maturities with proceeds from the issuance of long-term revenue bonds.
Consistent with this intent, and since SAWS has the available $500 million revolving credit agreement described
above, SAWS has classified nearly all outstanding commercial paper notes as long-term debt. In accordance with the
amortization schedule of the interest rate swap agreement discussed in Note G, SAWS intends to redeem $3,880,000
of commercial paper in 2019. Therefore, this portion of the commercial paper is classified as a current liability.
The following table summarizes transactions of the commercial paper program for the years ended December 31,
2018 and 2017.
OTHER DEBT MATTERS
Debt Covenants: SAWS is required to comply with various provisions included in the ordinances which authorized
the bond issuances. SAWS management believes it is in compliance with all significant provisions of the bond
ordinances.
Under these bond ordinances, SAWS is required to establish and maintain rates and charges for services sufficient
to produce Net Revenues sufficient to pay 1.25 times the annual debt service requirements on Senior Lien debt
obligations (senior lien debt coverage ratio). SAWS senior lien debt coverage ratio was 6.69 at December 31, 2018
and 6.06 at December 31, 2017.
NOTE I - CONTINGENCIES AND COMMITMENTS
Water Agreements
As of December 31, 2018, SAWS has entered into various water leases to obtain rights to pump water from the
Edwards Aquifer. The term of these agreements vary, with some expiring as early as 2019 and others continuing
until 2023. Some of the leases include price escalations and the annual cost per acre foot ranges from $100 to $140.
Under these various leases, SAWS paid $4.4 million in 2018 and $4.7 million 2017.
Outstanding Outstanding PayableNotes at Notes Within Beginning Notes Notes at End Oneof Year Issued Retired of Year Year
Year EndedDecember 31, 2018 278,060$ 67,000$ 129,365$ 215,695$ 3,880$
Year EndedDecember 31, 2017 241,610$ 40,000$ 3,550$ 278,060$ 3,710$
(amounts in thousands)
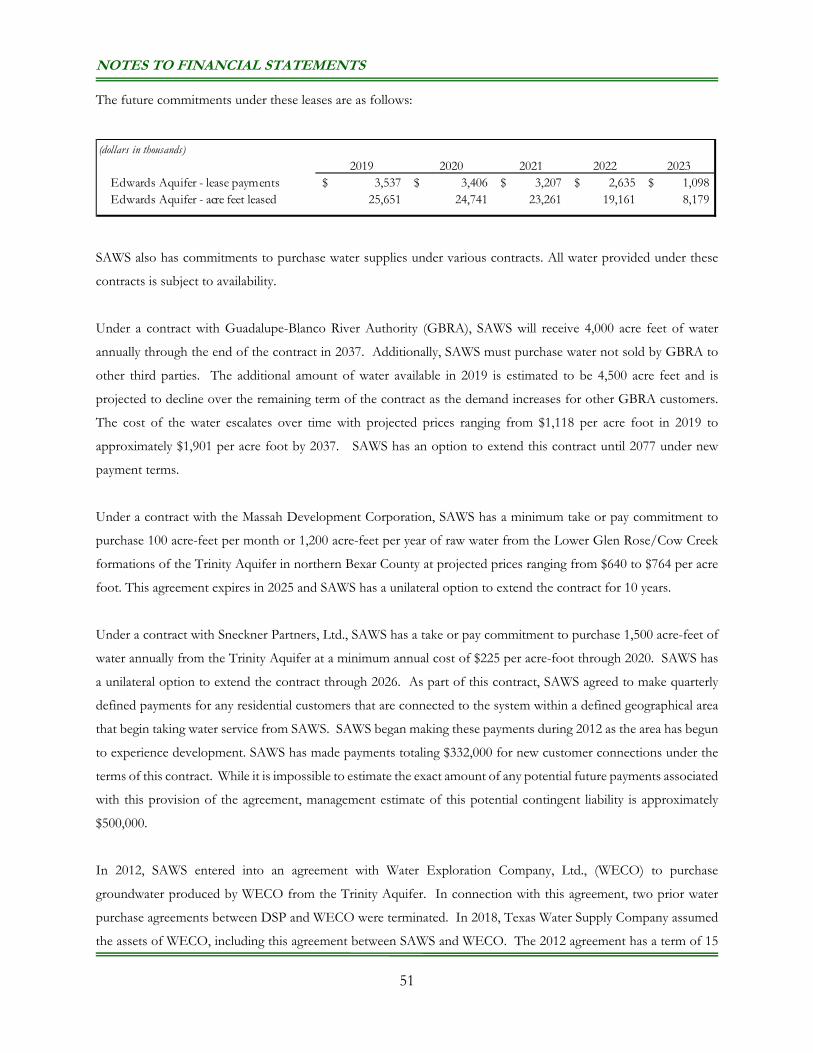
NOTES TO FINANCIAL STATEMENTS
51
The future commitments under these leases are as follows:
SAWS also has commitments to purchase water supplies under various contracts. All water provided under these
contracts is subject to availability.
Under a contract with Guadalupe-Blanco River Authority (GBRA), SAWS will receive 4,000 acre feet of water
annually through the end of the contract in 2037. Additionally, SAWS must purchase water not sold by GBRA to
other third parties. The additional amount of water available in 2019 is estimated to be 4,500 acre feet and is
projected to decline over the remaining term of the contract as the demand increases for other GBRA customers.
The cost of the water escalates over time with projected prices ranging from $1,118 per acre foot in 2019 to
approximately $1,901 per acre foot by 2037. SAWS has an option to extend this contract until 2077 under new
payment terms.
Under a contract with the Massah Development Corporation, SAWS has a minimum take or pay commitment to
purchase 100 acre-feet per month or 1,200 acre-feet per year of raw water from the Lower Glen Rose/Cow Creek
formations of the Trinity Aquifer in northern Bexar County at projected prices ranging from $640 to $764 per acre
foot. This agreement expires in 2025 and SAWS has a unilateral option to extend the contract for 10 years.
Under a contract with Sneckner Partners, Ltd., SAWS has a take or pay commitment to purchase 1,500 acre-feet of
water annually from the Trinity Aquifer at a minimum annual cost of $225 per acre-foot through 2020. SAWS has
a unilateral option to extend the contract through 2026. As part of this contract, SAWS agreed to make quarterly
defined payments for any residential customers that are connected to the system within a defined geographical area
that begin taking water service from SAWS. SAWS began making these payments during 2012 as the area has begun
to experience development. SAWS has made payments totaling $332,000 for new customer connections under the
terms of this contract. While it is impossible to estimate the exact amount of any potential future payments associated
with this provision of the agreement, management estimate of this potential contingent liability is approximately
$500,000.
In 2012, SAWS entered into an agreement with Water Exploration Company, Ltd., (WECO) to purchase
groundwater produced by WECO from the Trinity Aquifer. In connection with this agreement, two prior water
purchase agreements between DSP and WECO were terminated. In 2018, Texas Water Supply Company assumed
the assets of WECO, including this agreement between SAWS and WECO. The 2012 agreement has a term of 15
(dollars in thousands)
2019 2020 2021 2022 2023Edwards Aquifer - lease payments 3,537$ 3,406$ 3,207$ 2,635$ 1,098$ Edwards Aquifer - acre feet leased 25,651 24,741 23,261 19,161 8,179
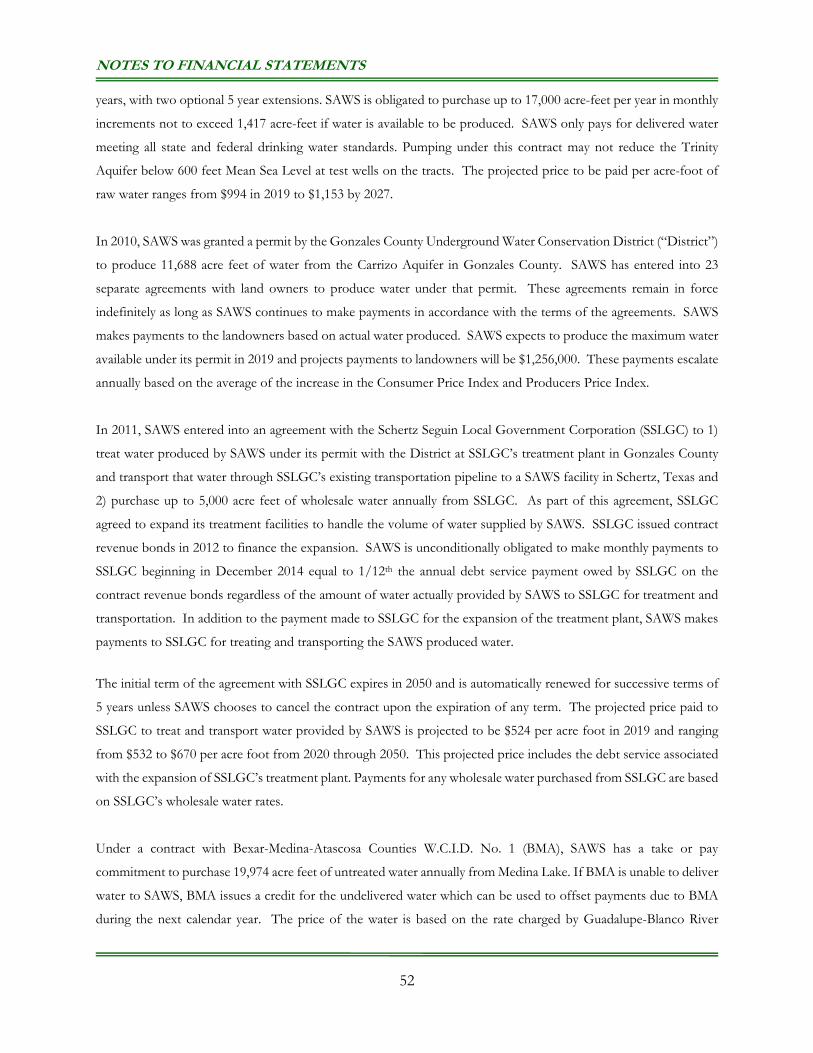
NOTES TO FINANCIAL STATEMENTS
52
years, with two optional 5 year extensions. SAWS is obligated to purchase up to 17,000 acre-feet per year in monthly
increments not to exceed 1,417 acre-feet if water is available to be produced. SAWS only pays for delivered water
meeting all state and federal drinking water standards. Pumping under this contract may not reduce the Trinity
Aquifer below 600 feet Mean Sea Level at test wells on the tracts. The projected price to be paid per acre-foot of
raw water ranges from $994 in 2019 to $1,153 by 2027.
In 2010, SAWS was granted a permit by the Gonzales County Underground Water Conservation District (“District”)
to produce 11,688 acre feet of water from the Carrizo Aquifer in Gonzales County. SAWS has entered into 23
separate agreements with land owners to produce water under that permit. These agreements remain in force
indefinitely as long as SAWS continues to make payments in accordance with the terms of the agreements. SAWS
makes payments to the landowners based on actual water produced. SAWS expects to produce the maximum water
available under its permit in 2019 and projects payments to landowners will be $1,256,000. These payments escalate
annually based on the average of the increase in the Consumer Price Index and Producers Price Index.
In 2011, SAWS entered into an agreement with the Schertz Seguin Local Government Corporation (SSLGC) to 1)
treat water produced by SAWS under its permit with the District at SSLGC’s treatment plant in Gonzales County
and transport that water through SSLGC’s existing transportation pipeline to a SAWS facility in Schertz, Texas and
2) purchase up to 5,000 acre feet of wholesale water annually from SSLGC. As part of this agreement, SSLGC
agreed to expand its treatment facilities to handle the volume of water supplied by SAWS. SSLGC issued contract
revenue bonds in 2012 to finance the expansion. SAWS is unconditionally obligated to make monthly payments to
SSLGC beginning in December 2014 equal to 1/12th the annual debt service payment owed by SSLGC on the
contract revenue bonds regardless of the amount of water actually provided by SAWS to SSLGC for treatment and
transportation. In addition to the payment made to SSLGC for the expansion of the treatment plant, SAWS makes
payments to SSLGC for treating and transporting the SAWS produced water.
The initial term of the agreement with SSLGC expires in 2050 and is automatically renewed for successive terms of
5 years unless SAWS chooses to cancel the contract upon the expiration of any term. The projected price paid to
SSLGC to treat and transport water provided by SAWS is projected to be $524 per acre foot in 2019 and ranging
from $532 to $670 per acre foot from 2020 through 2050. This projected price includes the debt service associated
with the expansion of SSLGC’s treatment plant. Payments for any wholesale water purchased from SSLGC are based
on SSLGC’s wholesale water rates.
Under a contract with Bexar-Medina-Atascosa Counties W.C.I.D. No. 1 (BMA), SAWS has a take or pay
commitment to purchase 19,974 acre feet of untreated water annually from Medina Lake. If BMA is unable to deliver
water to SAWS, BMA issues a credit for the undelivered water which can be used to offset payments due to BMA
during the next calendar year. The price of the water is based on the rate charged by Guadalupe-Blanco River
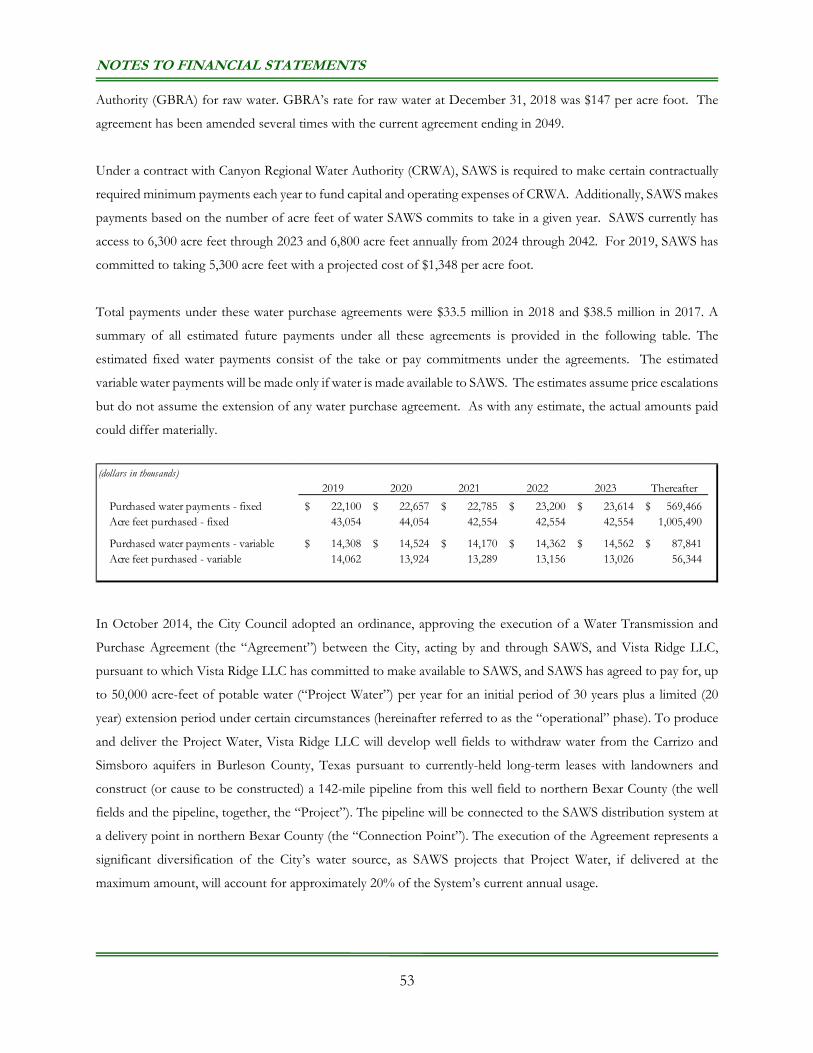
NOTES TO FINANCIAL STATEMENTS
53
Authority (GBRA) for raw water. GBRA’s rate for raw water at December 31, 2018 was $147 per acre foot. The
agreement has been amended several times with the current agreement ending in 2049.
Under a contract with Canyon Regional Water Authority (CRWA), SAWS is required to make certain contractually
required minimum payments each year to fund capital and operating expenses of CRWA. Additionally, SAWS makes
payments based on the number of acre feet of water SAWS commits to take in a given year. SAWS currently has
access to 6,300 acre feet through 2023 and 6,800 acre feet annually from 2024 through 2042. For 2019, SAWS has
committed to taking 5,300 acre feet with a projected cost of $1,348 per acre foot.
Total payments under these water purchase agreements were $33.5 million in 2018 and $38.5 million in 2017. A
summary of all estimated future payments under all these agreements is provided in the following table. The
estimated fixed water payments consist of the take or pay commitments under the agreements. The estimated
variable water payments will be made only if water is made available to SAWS. The estimates assume price escalations
but do not assume the extension of any water purchase agreement. As with any estimate, the actual amounts paid
could differ materially.
In October 2014, the City Council adopted an ordinance, approving the execution of a Water Transmission and
Purchase Agreement (the “Agreement”) between the City, acting by and through SAWS, and Vista Ridge LLC,
pursuant to which Vista Ridge LLC has committed to make available to SAWS, and SAWS has agreed to pay for, up
to 50,000 acre-feet of potable water (“Project Water”) per year for an initial period of 30 years plus a limited (20
year) extension period under certain circumstances (hereinafter referred to as the “operational” phase). To produce
and deliver the Project Water, Vista Ridge LLC will develop well fields to withdraw water from the Carrizo and
Simsboro aquifers in Burleson County, Texas pursuant to currently-held long-term leases with landowners and
construct (or cause to be constructed) a 142-mile pipeline from this well field to northern Bexar County (the well
fields and the pipeline, together, the “Project”). The pipeline will be connected to the SAWS distribution system at
a delivery point in northern Bexar County (the “Connection Point”). The execution of the Agreement represents a
significant diversification of the City’s water source, as SAWS projects that Project Water, if delivered at the
maximum amount, will account for approximately 20% of the System’s current annual usage.
(dollars in thousands)2019 2020 2021 2022 2023 Thereafter
Purchased water payments - fixed 22,100$ 22,657$ 22,785$ 23,200$ 23,614$ 569,466$ Acre feet purchased - fixed 43,054 44,054 42,554 42,554 42,554 1,005,490
Purchased water payments - variable 14,308$ 14,524$ 14,170$ 14,362$ 14,562$ 87,841$ Acre feet purchased - variable 14,062 13,924 13,289 13,156 13,026 56,344
NOTES TO FINANCIAL STATEMENTS
54
At the end of the operational phase, ownership of the Project will be transferred to SAWS at no cost. SAWS has
also entered into a separate agreement with Blue Water Vista Ridge, LLC, the lessee of the Project Water, to continue
to acquire the 50,000 acre-feet of untreated groundwater upon the termination of the Agreement and transfer of the
Project to SAWS, and the cost of such water at the end of the Agreement will be tied to prevailing Edwards Aquifer
leases.
The Project achieved financial close in November 2016 and is now in the construction phase. During this phase,
Vista Ridge LLC will complete the construction of the Project and SAWS must construct any improvements
necessary to accept and integrate Project Water. The anticipated capital cost of SAWS improvements is currently
projected to be approximately $210 million. The construction phase is scheduled to be completed in 2020 and will
result in the commencement of the aforementioned 30-year operational phase, during which period SAWS is
obligated to pay for water (up to 50,000 acre-feet annually) made available to it by Vista Ridge LLC at the Connection
Point.
Pursuant to the terms of the Agreement, SAWS will pay costs arising under the Agreement, as a maintenance and
operating expense of the System from a flow of funds perspective (see Note B), only for Project Water made available
at the Connection Point (which payment will include the costs of operating and maintaining the Project). SAWS will
have no obligation to pay for any debt issued by Vista Ridge LLC, and any such debt will be non-recourse to SAWS.
On May 17, 2016, SAWS exercised its contractual right to fix the Capital and Raw Groundwater Unit Price under
the Agreement based on the methodology provided for therein. This action served to lock in the price of the Project
Water component of SAWS annual payment requirement at $1,606 per acre foot for the entire 30 year term (and any
extension of that term) of the Agreement.
In addition to the Capital and Raw Groundwater Unit Price, SAWS will pay operations and maintenance costs
deemed to be compensable by an independent budget panel as a direct pass through under the Agreement as well as
electricity cost. Through December 2018, SAWS has paid $5,900,000 for electrical costs to the utility providers.
Finally, SAWS is responsible for compensating the Project Company for any major repairs and replacement costs,
which may arise and are deemed to be compensable by the budget panel. It is estimated that the water will initially
cost approximately $2,000 per acre foot, resulting in an estimated initial annual cost of approximately $100 million
for 50,000 acre feet of delivered water. Delivery of water from the Project is expected to begin in April 2020. In
2015, the City Council approved a series of increases to the water supply fee through 2020 to support the acquisition
of new water supplies, including water supplied from the Project.
Because all Project assets will transfer to SAWS at the end of the contract, once the operational phase begins, SAWS
anticipates recording capital assets and a contract liability equal to the acquisition value of the Project Company
NOTES TO FINANCIAL STATEMENTS
55
infrastructure. Management currently estimates the initial recorded value for the capital assets and contract liability
to be approximately $900 million.
SAWS has the right to terminate the Agreement at any time by purchasing the Project for the aggregate amount of
the outstanding Project Company debt, contract breakage costs and return of and return on equity contributions by
Vista Ridge’s principals. SAWS also has the obligation to purchase the Project assets in similar fashion in the event
of a SAWS default under the Agreement. The termination payment as of December 31, 2018 was estimated to be
approximately $735 million. The termination payment will continue to increase throughout the construction phase
as additional funds are expended by the Project Company on the construction of the project. By the time the
operational phase is reached in 2020 the termination payment is projected to approximate $1 billion.
Other Contingencies and Commitments
SAWS is also committed under various contracts for completion of construction or acquisition of utility plant totaling
approximately $577.1 million as of December 31, 2018. Funding of this amount will come from excess revenues,
contributions from developers, restricted assets and available commercial paper capacity.
In connection with desalination injection well permits obtained by SAWS from the Texas Commission on
Environmental Quality (TCEQ), SAWS has an obligation to plug the injection wells once the wells are no longer in
service. These wells became operational in 2016 and have an expected useful life of 50 years based on SAWS
experience with other wells throughout the system. At December 31, 2018, SAWS has recorded a liability of $482,000
related to this post-closure obligation based on the current projected cost to plug wells of similar size, depth and
diameter.
In March 2007, SAWS was orally notified by Region 6 of the United States Environmental Protection Agency (the
“EPA”) of alleged failures to comply with the Clean Water Act due to the occurrence of sanitary sewer overflows
(SSOs). The EPA subsequently referred the matter to the United States Department of Justice (the “DOJ”) for
enforcement action. SAWS engaged in settlement negotiations with the EPA and the DOJ to resolve the allegations.
In June 2013, the Board approved a Consent Decree between SAWS and the United States of America and the State
of Texas to resolve this enforcement action. During the 10 to 12 year term of the Consent Decree, SAWS estimates
the cost to perform the operating and maintenance requirements of the Consent Decree will be approximately $250
million. SAWS estimates that capital expenditures associated with the requirements of the Consent Decree could
range from $1.2 billion to $1.3 billion. As with any estimate, the actual amounts incurred could differ materially.
Through December 31, 2018, capital expenditures related to the Consent Decree total $418 million, which includes
certain work which was previously planned prior to entry into the Consent Decree. Since entry into the Consent
Decree, SAWS has performed its obligations under the terms of the Consent Decree and management believes
NOTES TO FINANCIAL STATEMENTS
56
SAWS is in material compliance with such terms, conditions and requirements. Since 2010, SAWS has seen a
significant reduction in SSOs, from 538 in 2010 to 259 in 2018, even though San Antonio had the wettest September
on record and the 3rd wettest month ever recorded. SAWS will continue to perform best practices to assure the
capacity and operations of the collection system provides uninterrupted service to the San Antonio community and
surrounding counties.
SAWS operates the Mitchell Lake Site Wastewater Treatment Facility (“Mitchell Lake”) pursuant to a Texas Pollutant
Discharge Elimination Permit (the “Permit”) issued by the Texas Commission on Environmental Quality under a
delegation of authority from the U.S. Environmental Protection Agency (the “EPA”). In October 2015, the EPA
orally notified SAWS that SAWS violated the effluent discharge limitations provided in that Permit as a result of
discharges occurring during significant rainfall events.
On August 18, 2016, SAWS received an Administrative Order from the EPA that alleges that SAWS violated the
Permit by failing to meet effluent water quality limits as required by the Permit. SAWS responded to the
Administrative Order by letter dated September 15, 2016, describing that SAWS was exploring the construction of
wetlands to treat discharges from Mitchell Lake as a means of achieving Permit compliance.
SAWS has engaged consulting experts and conducted preliminary feasibility evaluations of reconstructing the existing
dam and spillway and constructing extensive treatment wetlands below Mitchell Lake. A pilot wetlands project is
currently under construction to evaluate the performance of wetlands in treating Mitchell Lake water. SAWS
purchased a 283 acre tract of land that is anticipated to be necessary for the implementation of a full downstream
wetlands treatment process. SAWS has partnered with the U.S. Army Corps of Engineers on an Aquatic Ecosystem
Restoration Feasibility Study for Mitchell Lake. The three year study will include an investigation into the methods
of restoring lost and/or degraded ecological functions within the lake while reducing the eutrophic conditions of the
lake water.
On February 7, 2019, SAWS received an Administrative Order from the EPA (which supersedes the August 18,
2016 Administrative Order) that establishes a schedule of compliance activities including submission of a Pilot
Wetlands Performance Report by December 31, 2020, completion of the wetlands by September 30, 2024, and
submission of various progress and annual reports. No monetary penalties were assessed, although the EPA reserves
all rights to seek any appropriate remedies. It is premature to estimate the final cost of the project that SAWS will
implement to construct downstream wetlands and modified dam structures, or the ultimate success of the pilot
project.
NOTES TO FINANCIAL STATEMENTS
57
NOTE J - PENSION AND RETIREMENT PLANS SAWS’ pension program includes benefits provided by the Texas Municipal Retirement System (TMRS), the San
Antonio Water System Retirement Plan (SAWSRP) and the District Special Project Retirement Income Plan
(DSPRP).
Texas Municipal Retirement System
SAWS participates as one of 883 plans in the nontraditional, joint contributory, hybrid defined benefit pension plan
administered by the Texas Municipal Retirement System (TMRS). TMRS is an agency created by the State of Texas
and administered in accordance with the TMRS Act, Subtitle G, Title 8, Texas Government Code (the TMRS Act)
as an agent multiple-employer retirement system for municipal employees in the State of Texas. The TMRS Act
places the general administration and management of the System with a six-member Board of Trustees. Although
the Governor, with the advice and consent of the Senate, appoints the TMRS Board, TMRS is not fiscally dependent
on the State of Texas. TMRS’s defined benefit pension plan is a tax-qualified plan under Section 401 (a) of the
Internal Revenue Code. TMRS issues a publicly available comprehensive annual financial report that can be obtained
at www.tmrs.com
TMRS provides retirement benefits to eligible SAWS employees. At retirement, the benefit is calculated as if the
sum of the employee’s contribution, with interest, and the SAWS financed monetary credits with interest were used
to purchase an annuity. Members choose to receive their benefit in one of seven payment options. Members may
also choose to receive a portion of their benefit as a partial lump sum distribution in an amount equal to 12, 24 or
36 monthly payments, which cannot exceed 75% of the member’s deposits and interest.
The plan provisions that have been adopted by SAWS are within the options available in the governing state statutes
of TMRS. Plan provisions for SAWS for the 2018 and 2017 plan years were as follows:
Years required for vesting 5
Service retirement eligibility (expressed as age/years of service) 60/5, any/20
Updated Service Credit 100% Repeating
Annuity increase (to retirees) 70% of CPI Repeating
NOTES TO FINANCIAL STATEMENTS
58
Total number of SAWS participants in TMRS as of the last two actuarial valuation dates is summarized below:
Under the state law governing TMRS, SAWS’ contribution rate is determined annually by the actuary using the Entry
Age Normal (EAN) cost method. The actuarially determined rate is the estimated amount necessary to finance the
cost of benefits earned by employees during the year, with an additional amount to finance any unfunded accrued
liability. Eligible SAWS employees are required to contribute 3% of their annual gross earnings. The employer
required contribution rates for SAWS were 3.70% and 3.67% in calendar years 2018 and 2017, respectively. SAWS’
contributions to TMRS totaled $4,059,000 and $3,852,000 for the years ended December 31, 2018 and 2017,
respectively. These contributions equaled the required contributions.
SAWS Net Pension Liability for the TMRS plan as of December 31, 2018 and 2017 was measured as of December
31, 2017 and 2016, respectively. The Total Pension Liability used to calculate the Net Pension Liability was
determined by an actuarial valuation performed as of the measurement date.
The December 31, 2017 and 2016 valuations included the following actuarial assumptions:
Annual inflation 2.50%
Overall payroll growth 3.00%
Investment rate of return 6.75%, net of pension plan investment expense, including inflation
Salary increases were based on a service-related table. Mortality rates for active members, retirees, and beneficiaries
were based on the gender-distinct RP2000 Combined Healthy Mortality Table with Blue Collar Adjustment, with
male rates multiplied by 109% and female rates multiplied by 103%. The rates are projected on a fully generational
basis by scale BB to account for future mortality improvements. For disabled annuitants, the gender-distinct RP2000
Combined Healthy Mortality Tables with Blue Collar Adjustment are used with males rates multiplied by 109% and
female rates multiplied by 103% with a 3-year set-forward for both males and females. In addition, a 3% minimum
mortality rate is applied to reflect the impairment for younger members who become disabled. The rates are projected
on a fully generational basis by scale BB to account for future mortality improvements subject to the 3% floor.
2017 2016
Active employees 1,698 1,648
Retirees and beneficiaries currently receiving benefits 1,223 1,175
Inactive members 653 595
Total 3,574 3,418
December 31,
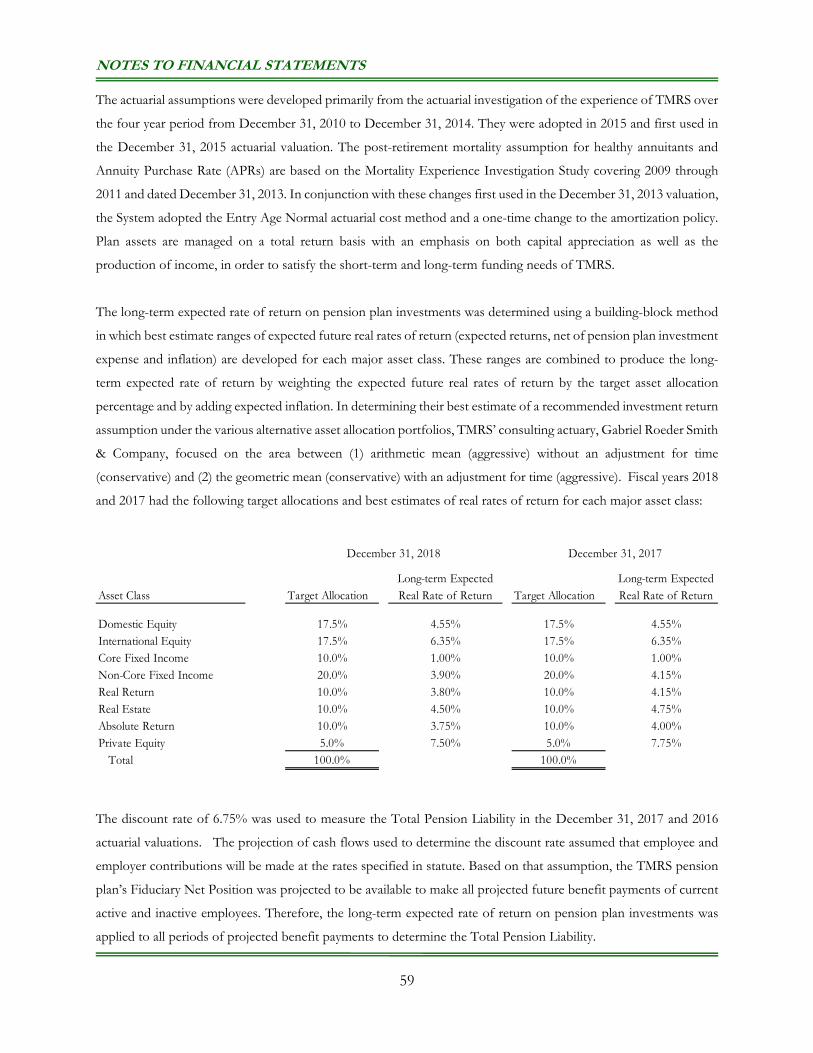
NOTES TO FINANCIAL STATEMENTS
59
The actuarial assumptions were developed primarily from the actuarial investigation of the experience of TMRS over
the four year period from December 31, 2010 to December 31, 2014. They were adopted in 2015 and first used in
the December 31, 2015 actuarial valuation. The post-retirement mortality assumption for healthy annuitants and
Annuity Purchase Rate (APRs) are based on the Mortality Experience Investigation Study covering 2009 through
2011 and dated December 31, 2013. In conjunction with these changes first used in the December 31, 2013 valuation,
the System adopted the Entry Age Normal actuarial cost method and a one-time change to the amortization policy.
Plan assets are managed on a total return basis with an emphasis on both capital appreciation as well as the
production of income, in order to satisfy the short-term and long-term funding needs of TMRS.
The long-term expected rate of return on pension plan investments was determined using a building-block method
in which best estimate ranges of expected future real rates of return (expected returns, net of pension plan investment
expense and inflation) are developed for each major asset class. These ranges are combined to produce the long-
term expected rate of return by weighting the expected future real rates of return by the target asset allocation
percentage and by adding expected inflation. In determining their best estimate of a recommended investment return
assumption under the various alternative asset allocation portfolios, TMRS’ consulting actuary, Gabriel Roeder Smith
& Company, focused on the area between (1) arithmetic mean (aggressive) without an adjustment for time
(conservative) and (2) the geometric mean (conservative) with an adjustment for time (aggressive). Fiscal years 2018
and 2017 had the following target allocations and best estimates of real rates of return for each major asset class:
The discount rate of 6.75% was used to measure the Total Pension Liability in the December 31, 2017 and 2016
actuarial valuations. The projection of cash flows used to determine the discount rate assumed that employee and
employer contributions will be made at the rates specified in statute. Based on that assumption, the TMRS pension
plan’s Fiduciary Net Position was projected to be available to make all projected future benefit payments of current
active and inactive employees. Therefore, the long-term expected rate of return on pension plan investments was
applied to all periods of projected benefit payments to determine the Total Pension Liability.
Asset Class Target AllocationLong-term Expected Real Rate of Return Target Allocation
Long-term Expected Real Rate of Return
Domestic Equity 17.5% 4.55% 17.5% 4.55%International Equity 17.5% 6.35% 17.5% 6.35%Core Fixed Income 10.0% 1.00% 10.0% 1.00%Non-Core Fixed Income 20.0% 3.90% 20.0% 4.15%Real Return 10.0% 3.80% 10.0% 4.15%Real Estate 10.0% 4.50% 10.0% 4.75%Absolute Return 10.0% 3.75% 10.0% 4.00%Private Equity 5.0% 7.50% 5.0% 7.75% Total 100.0% 100.0%
December 31, 2018 December 31, 2017
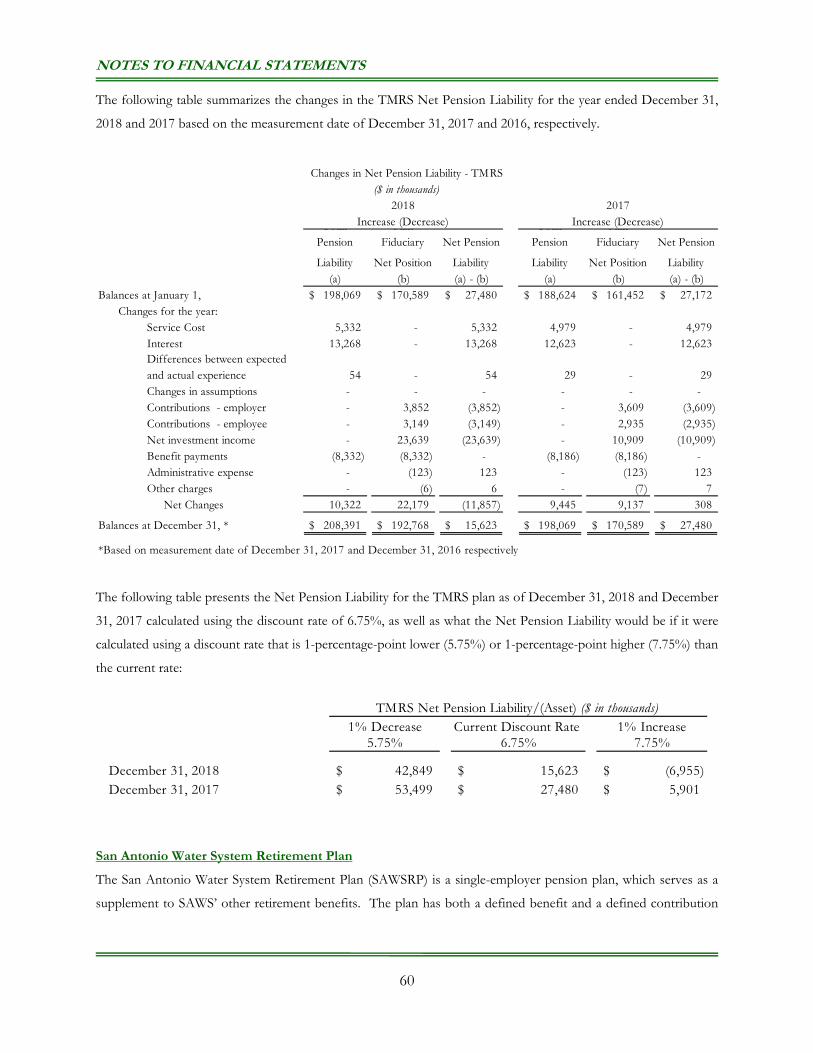
NOTES TO FINANCIAL STATEMENTS
60
The following table summarizes the changes in the TMRS Net Pension Liability for the year ended December 31,
2018 and 2017 based on the measurement date of December 31, 2017 and 2016, respectively.
The following table presents the Net Pension Liability for the TMRS plan as of December 31, 2018 and December
31, 2017 calculated using the discount rate of 6.75%, as well as what the Net Pension Liability would be if it were
calculated using a discount rate that is 1-percentage-point lower (5.75%) or 1-percentage-point higher (7.75%) than
the current rate:
San Antonio Water System Retirement Plan
The San Antonio Water System Retirement Plan (SAWSRP) is a single-employer pension plan, which serves as a
supplement to SAWS’ other retirement benefits. The plan has both a defined benefit and a defined contribution
Total Pension
Plan Fiduciary Net Pension
Total Pension
Plan Fiduciary Net Pension
Liability Net Position Liability Liability Net Position Liability(a) (b) (a) - (b) (a) (b) (a) - (b)
Balances at January 1, 198,069$ 170,589$ 27,480$ 188,624$ 161,452$ 27,172$ Changes for the year:
Service Cost 5,332 - 5,332 4,979 - 4,979 Interest 13,268 - 13,268 12,623 - 12,623 Differences between expected and actual experience 54 - 54 29 - 29 Changes in assumptions - - - - - - Contributions - employer - 3,852 (3,852) - 3,609 (3,609) Contributions - employee - 3,149 (3,149) - 2,935 (2,935) Net investment income - 23,639 (23,639) - 10,909 (10,909) Benefit payments (8,332) (8,332) - (8,186) (8,186) - Administrative expense - (123) 123 - (123) 123 Other charges - (6) 6 - (7) 7 Net Changes 10,322 22,179 (11,857) 9,445 9,137 308
Balances at December 31, * 208,391$ 192,768$ 15,623$ 198,069$ 170,589$ 27,480$
*Based on measurement date of December 31, 2017 and December 31, 2016 respectively
Increase (Decrease) Increase (Decrease)2018 2017
Changes in Net Pension Liability - TMRS($ in thousands)
1% Decrease Current Discount Rate 1% Increase5.75% 6.75% 7.75%
December 31, 2018 42,849$ 15,623$ (6,955)$ December 31, 2017 53,499$ 27,480$ 5,901$
TMRS Net Pension Liability/(Asset) ($ in thousands)
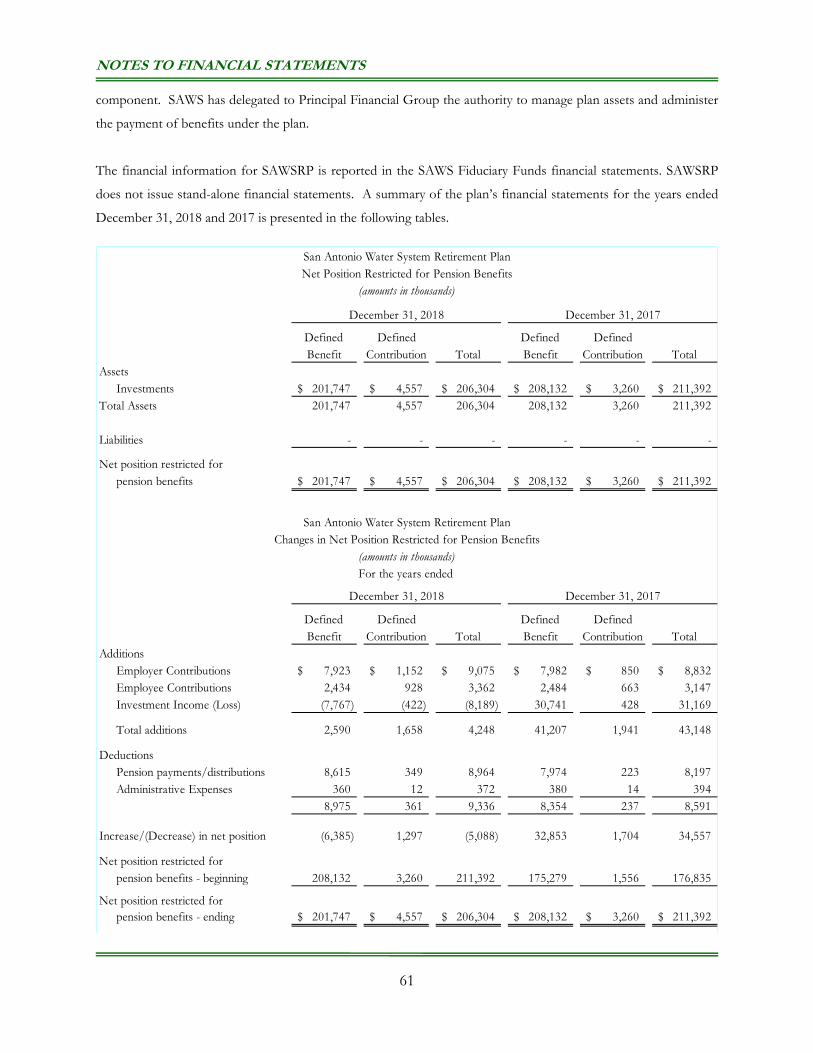
NOTES TO FINANCIAL STATEMENTS
61
component. SAWS has delegated to Principal Financial Group the authority to manage plan assets and administer
the payment of benefits under the plan.
The financial information for SAWSRP is reported in the SAWS Fiduciary Funds financial statements. SAWSRP
does not issue stand-alone financial statements. A summary of the plan’s financial statements for the years ended
December 31, 2018 and 2017 is presented in the following tables.
Defined Benefit
Defined Contribution Total
Defined Benefit
Defined Contribution Total
AssetsInvestments 201,747$ 4,557$ 206,304$ 208,132$ 3,260$ 211,392$
Total Assets 201,747 4,557 206,304 208,132 3,260 211,392
Liabilities - - - - - -
Net position restricted for pension benefits 201,747$ 4,557$ 206,304$ 208,132$ 3,260$ 211,392$
Defined Benefit
Defined Contribution Total
Defined Benefit
Defined Contribution Total
AdditionsEmployer Contributions 7,923$ 1,152$ 9,075$ 7,982$ 850$ 8,832$ Employee Contributions 2,434 928 3,362 2,484 663 3,147 Investment Income (Loss) (7,767) (422) (8,189) 30,741 428 31,169
Total additions 2,590 1,658 4,248 41,207 1,941 43,148
DeductionsPension payments/distributions 8,615 349 8,964 7,974 223 8,197 Administrative Expenses 360 12 372 380 14 394
8,975 361 9,336 8,354 237 8,591
Increase/(Decrease) in net position (6,385) 1,297 (5,088) 32,853 1,704 34,557
Net position restricted forpension benefits - beginning 208,132 3,260 211,392 175,279 1,556 176,835
Net position restricted forpension benefits - ending 201,747$ 4,557$ 206,304$ 208,132$ 3,260$ 211,392$
Net Position Restricted for Pension BenefitsSan Antonio Water System Retirement Plan
December 31, 2018
December 31, 2018 December 31, 2017
December 31, 2017
San Antonio Water System Retirement PlanChanges in Net Position Restricted for Pension Benefits
For the years ended
(amounts in thousands)
(amounts in thousands)

NOTES TO FINANCIAL STATEMENTS
62
Defined Benefit Component: Eligible employees hired prior to June 1, 2014 participate in the defined benefit component
of the plan. Eligible employees vest in this plan after the completion of five years of service.
Covered employees are eligible to retire upon attaining the normal retirement age of 65. An employee may elect
early retirement, with reduced benefits, upon attainment of (i) 20 years of vesting service regardless of age or (ii) five
years of vesting service and at least age 60. An employee is automatically 100% vested upon attainment of age 65 or
upon becoming totally and permanently disabled.
The normal retirement benefit is based upon two factors, average compensation and years of vesting service.
Average Compensation is defined as the monthly average of total compensation received for the three consecutive
years ending December 31, out of the last ten compensation years prior to normal retirement date which gives the
highest average. The normal retirement benefit under SAWSRP is equal to the following:
1. 1.20% of the Average Compensation, times years of credited service not in excess of 25 years, plus
2. 0.75% of the Average Compensation, times years of credited service in excess of 25 years but not in excess
of 35 years, plus
3. 0.375% of the Average Compensation, times years of credited service in excess of 35 years.
Upon retirement, an employee must select from one of seven alternative payment plans. Each payment plan provides
for monthly payments as long as the retired employee lives. The options available address how plan benefits are to
be distributed to the designated beneficiary of the retired employee. The program also provides disability benefits.
Participants in the defined benefit component of the SAWSRP as of the last two actuarial valuation dates is
summarized below:
The funding policy provides for actuarially determined periodic contributions so that sufficient assets will be available
to pay benefits when they are due. Contribution requirements are established and may be amended by SAWS Board
of Trustees. The actuarially determined contributions for 2018 and 2017 were determined using the Entry Age
Normal cost method. The actuarially determined contribution is the estimated amount necessary to finance the cost
of benefits earned by participating employees during the year, with an additional amount to finance any unfunded
2018 2017
Active employees 1,184 1,285
Retirees and beneficiaries currently receiving benefits 1,007 946
Inactive members 526 522
Total 2,717 2,753
January 1,
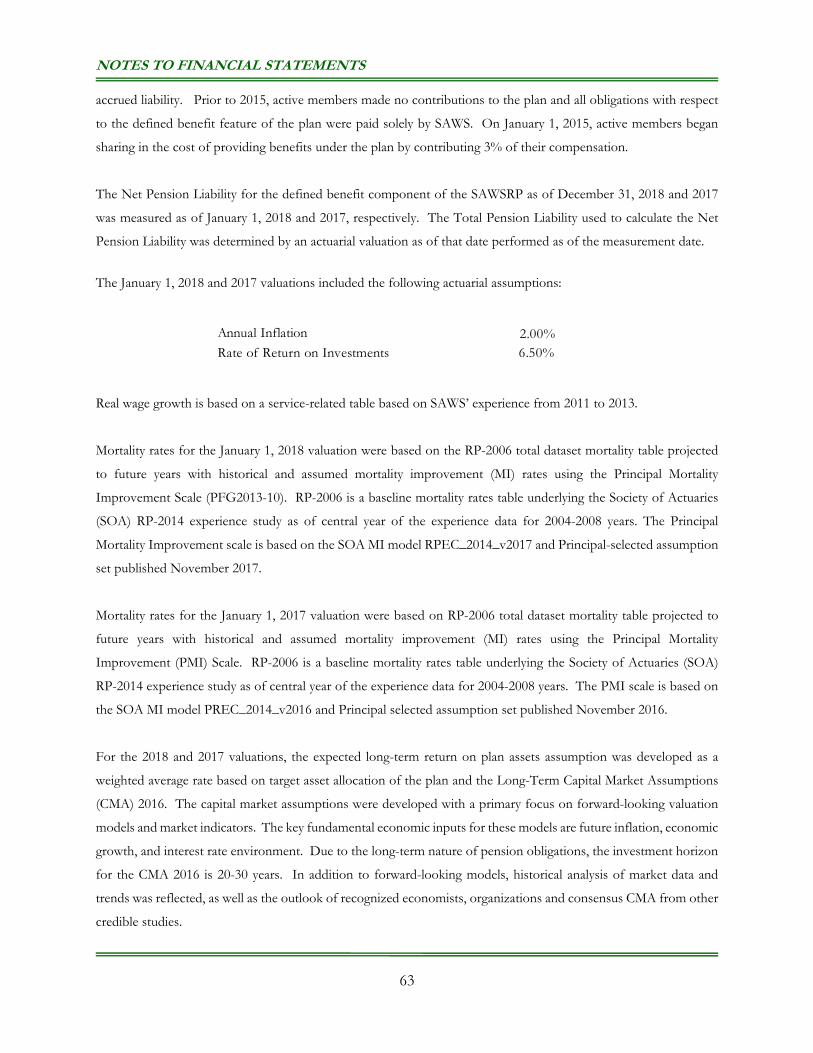
NOTES TO FINANCIAL STATEMENTS
63
accrued liability. Prior to 2015, active members made no contributions to the plan and all obligations with respect
to the defined benefit feature of the plan were paid solely by SAWS. On January 1, 2015, active members began
sharing in the cost of providing benefits under the plan by contributing 3% of their compensation.
The Net Pension Liability for the defined benefit component of the SAWSRP as of December 31, 2018 and 2017
was measured as of January 1, 2018 and 2017, respectively. The Total Pension Liability used to calculate the Net
Pension Liability was determined by an actuarial valuation as of that date performed as of the measurement date.
The January 1, 2018 and 2017 valuations included the following actuarial assumptions:
Real wage growth is based on a service-related table based on SAWS’ experience from 2011 to 2013.
Mortality rates for the January 1, 2018 valuation were based on the RP-2006 total dataset mortality table projected
to future years with historical and assumed mortality improvement (MI) rates using the Principal Mortality
Improvement Scale (PFG2013-10). RP-2006 is a baseline mortality rates table underlying the Society of Actuaries
(SOA) RP-2014 experience study as of central year of the experience data for 2004-2008 years. The Principal
Mortality Improvement scale is based on the SOA MI model RPEC_2014_v2017 and Principal-selected assumption
set published November 2017.
Mortality rates for the January 1, 2017 valuation were based on RP-2006 total dataset mortality table projected to
future years with historical and assumed mortality improvement (MI) rates using the Principal Mortality
Improvement (PMI) Scale. RP-2006 is a baseline mortality rates table underlying the Society of Actuaries (SOA)
RP-2014 experience study as of central year of the experience data for 2004-2008 years. The PMI scale is based on
the SOA MI model PREC_2014_v2016 and Principal selected assumption set published November 2016.
For the 2018 and 2017 valuations, the expected long-term return on plan assets assumption was developed as a
weighted average rate based on target asset allocation of the plan and the Long-Term Capital Market Assumptions
(CMA) 2016. The capital market assumptions were developed with a primary focus on forward-looking valuation
models and market indicators. The key fundamental economic inputs for these models are future inflation, economic
growth, and interest rate environment. Due to the long-term nature of pension obligations, the investment horizon
for the CMA 2016 is 20-30 years. In addition to forward-looking models, historical analysis of market data and
trends was reflected, as well as the outlook of recognized economists, organizations and consensus CMA from other
credible studies.
Annual Inflation 2.00%Rate of Return on Investments 6.50%
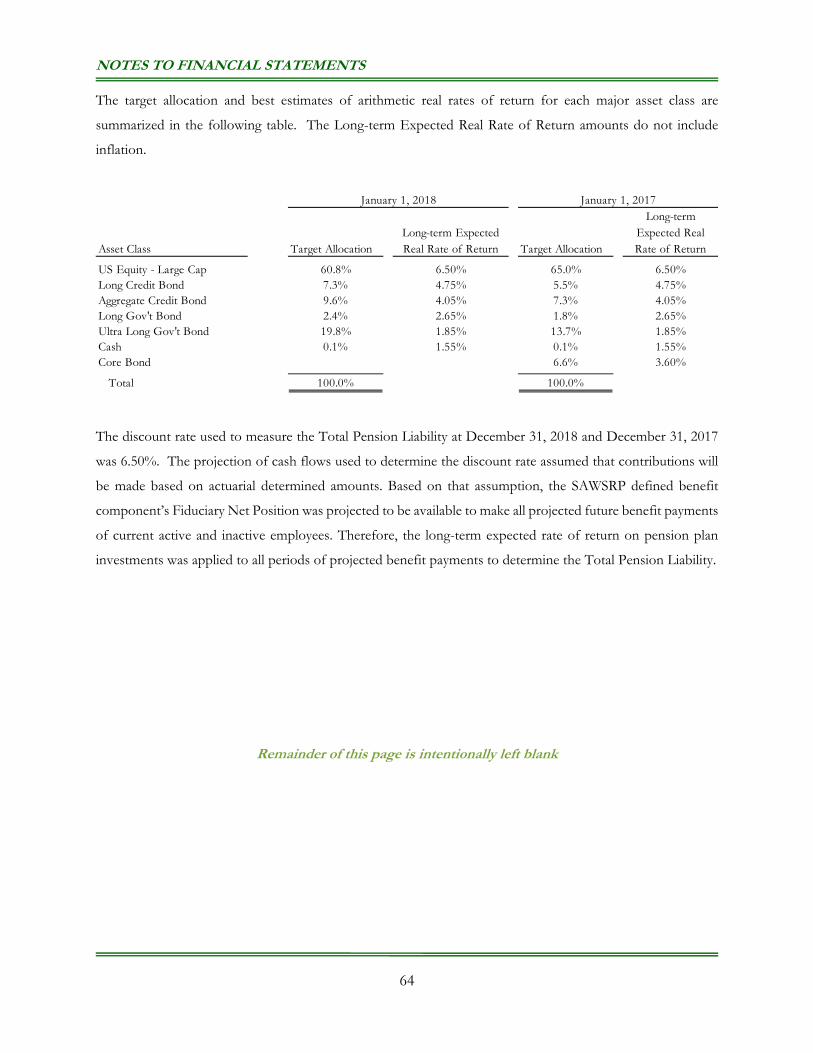
NOTES TO FINANCIAL STATEMENTS
64
The target allocation and best estimates of arithmetic real rates of return for each major asset class are
summarized in the following table. The Long-term Expected Real Rate of Return amounts do not include
inflation.
The discount rate used to measure the Total Pension Liability at December 31, 2018 and December 31, 2017
was 6.50%. The projection of cash flows used to determine the discount rate assumed that contributions will
be made based on actuarial determined amounts. Based on that assumption, the SAWSRP defined benefit
component’s Fiduciary Net Position was projected to be available to make all projected future benefit payments
of current active and inactive employees. Therefore, the long-term expected rate of return on pension plan
investments was applied to all periods of projected benefit payments to determine the Total Pension Liability.
Remainder of this page is intentionally left blank
Asset Class Target AllocationLong-term Expected Real Rate of Return Target Allocation
Long-term Expected Real Rate of Return
US Equity - Large Cap 60.8% 6.50% 65.0% 6.50%Long Credit Bond 7.3% 4.75% 5.5% 4.75%Aggregate Credit Bond 9.6% 4.05% 7.3% 4.05%Long Gov't Bond 2.4% 2.65% 1.8% 2.65%Ultra Long Gov't Bond 19.8% 1.85% 13.7% 1.85%Cash 0.1% 1.55% 0.1% 1.55%Core Bond 6.6% 3.60%
Total 100.0% 100.0%
January 1, 2018 January 1, 2017
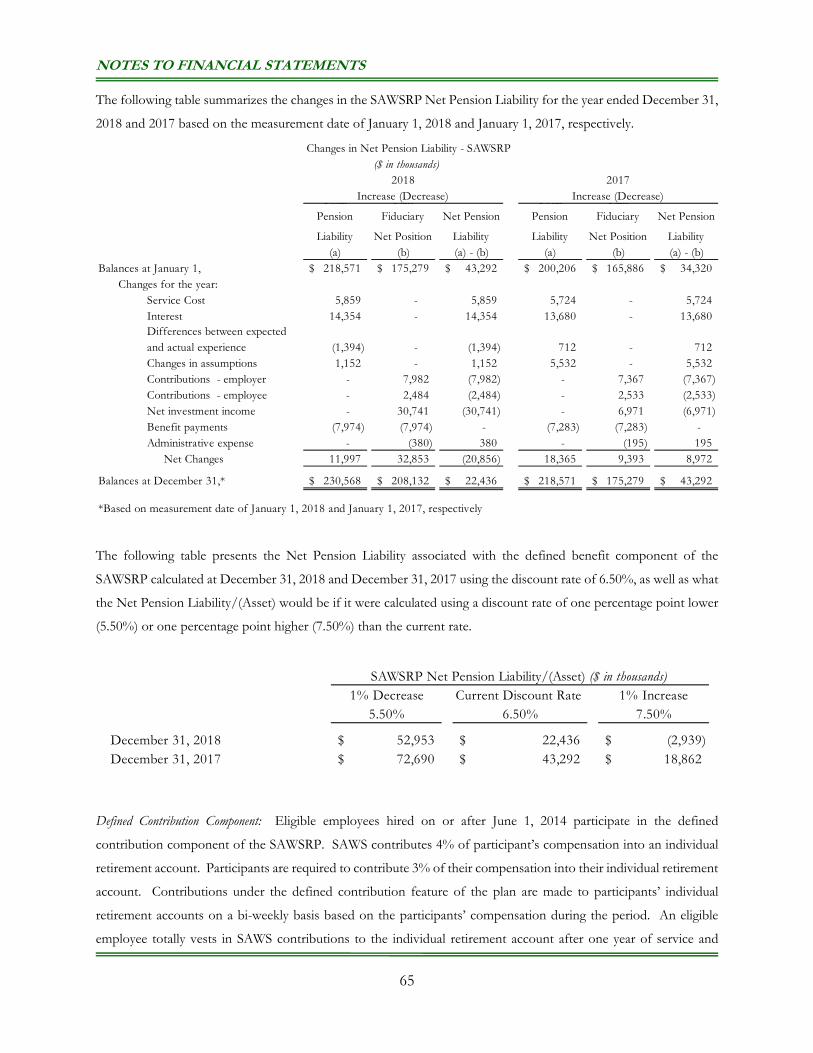
NOTES TO FINANCIAL STATEMENTS
65
The following table summarizes the changes in the SAWSRP Net Pension Liability for the year ended December 31,
2018 and 2017 based on the measurement date of January 1, 2018 and January 1, 2017, respectively.
The following table presents the Net Pension Liability associated with the defined benefit component of the
SAWSRP calculated at December 31, 2018 and December 31, 2017 using the discount rate of 6.50%, as well as what
the Net Pension Liability/(Asset) would be if it were calculated using a discount rate of one percentage point lower
(5.50%) or one percentage point higher (7.50%) than the current rate.
Defined Contribution Component: Eligible employees hired on or after June 1, 2014 participate in the defined
contribution component of the SAWSRP. SAWS contributes 4% of participant’s compensation into an individual
retirement account. Participants are required to contribute 3% of their compensation into their individual retirement
account. Contributions under the defined contribution feature of the plan are made to participants’ individual
retirement accounts on a bi-weekly basis based on the participants’ compensation during the period. An eligible
employee totally vests in SAWS contributions to the individual retirement account after one year of service and
Total Pension
Plan Fiduciary Net Pension
Total Pension
Plan Fiduciary Net Pension
Liability Net Position Liability Liability Net Position Liability(a) (b) (a) - (b) (a) (b) (a) - (b)
Balances at January 1, 218,571$ 175,279$ 43,292$ 200,206$ 165,886$ 34,320$ Changes for the year:
Service Cost 5,859 - 5,859 5,724 - 5,724 Interest 14,354 - 14,354 13,680 - 13,680 Differences between expected and actual experience (1,394) - (1,394) 712 - 712 Changes in assumptions 1,152 - 1,152 5,532 - 5,532 Contributions - employer - 7,982 (7,982) - 7,367 (7,367) Contributions - employee - 2,484 (2,484) - 2,533 (2,533) Net investment income - 30,741 (30,741) - 6,971 (6,971) Benefit payments (7,974) (7,974) - (7,283) (7,283) - Administrative expense - (380) 380 - (195) 195 Net Changes 11,997 32,853 (20,856) 18,365 9,393 8,972
Balances at December 31,* 230,568$ 208,132$ 22,436$ 218,571$ 175,279$ 43,292$
*Based on measurement date of January 1, 2018 and January 1, 2017, respectively
Increase (Decrease)
Changes in Net Pension Liability - SAWSRP($ in thousands)
Increase (Decrease)2018 2017
1% Decrease Current Discount Rate 1% Increase5.50% 6.50% 7.50%
December 31, 2018 52,953$ 22,436$ (2,939)$ December 31, 2017 72,690$ 43,292$ 18,862$
SAWSRP Net Pension Liability/(Asset) ($ in thousands)
NOTES TO FINANCIAL STATEMENTS
66
immediately vests in the employee’s contributions to the plan. The employee directs the investments in their
individual retirement account. SAWS has no liability for losses under the defined contribution component of the
SAWSRP but does have the usual fiduciary responsibilities of a plan sponsor.
During the year ended December 31, 2018, SAWS made contributions to participants’ individual retirement accounts
totaling $1,152,000, net of forfeitures of $33,000 and employees contributed $928,000. During the year ended
December 31, 2017, SAWS made contributions to participants’ individual retirement accounts totaling $850,000, net
of forfeitures of $35,000 and employees contributed $663,000.
District Special Project Retirement Income Plan
District Special Project Retirement Income Plan (DSPRP) is a single-employer defined benefit pension plan that
covers all eligible employees. The plan was originally established by Bexar Metropolitan Water District (BexarMet)
to provide pension benefits to its employees. In 2008, the BexarMet Board elected to freeze pension benefits and
entry into the plan effective September 30, 2008. In 2012, BexarMet was dissolved and all its assets and liabilities
were transferred to the San Antonio Water System District Special Project (DSP). The plan was renamed District
Special Project Retirement Income Plan. In 2016, DSP was merged into SAWS and DSPRP is now governed by
SAWS, which is authorized to establish and amend all plan provisions. SAWS has delegated to Standard Insurance
Company the authority to manage plan assets and administer the payment of benefits under the plan.
The financial information for DSPRP is reported in the SAWS Fiduciary Funds financial statements. DSPRP does
not issue stand-alone financial statements. A summary of the plan’s financial statements for the years ended
December 31, 2018 and 2017 is presented in the following tables.
Remainder of this page is intentionally left blank
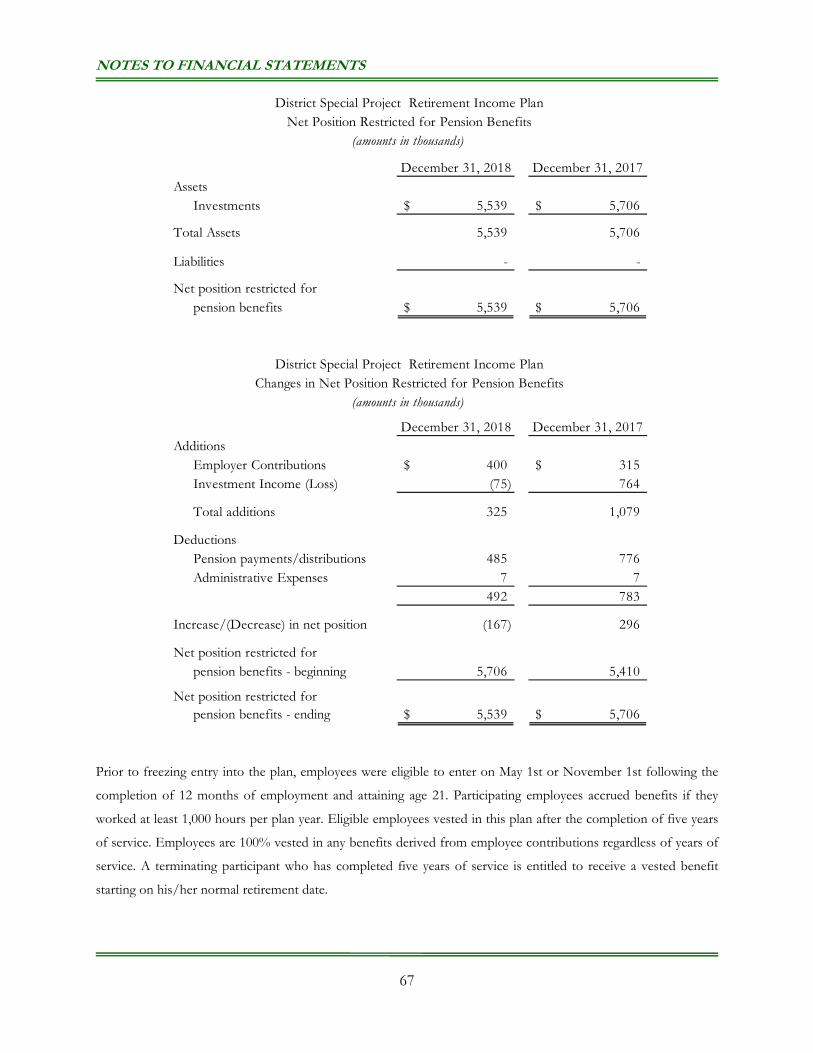
NOTES TO FINANCIAL STATEMENTS
67
Prior to freezing entry into the plan, employees were eligible to enter on May 1st or November 1st following the
completion of 12 months of employment and attaining age 21. Participating employees accrued benefits if they
worked at least 1,000 hours per plan year. Eligible employees vested in this plan after the completion of five years
of service. Employees are 100% vested in any benefits derived from employee contributions regardless of years of
service. A terminating participant who has completed five years of service is entitled to receive a vested benefit
starting on his/her normal retirement date.
December 31, 2018 December 31, 2017Assets
Investments 5,539$ 5,706$
Total Assets 5,539 5,706
Liabilities - -
Net position restricted for pension benefits 5,539$ 5,706$
December 31, 2018 December 31, 2017Additions
Employer Contributions 400$ 315$ Investment Income (Loss) (75) 764
Total additions 325 1,079
DeductionsPension payments/distributions 485 776 Administrative Expenses 7 7
492 783
Increase/(Decrease) in net position (167) 296
Net position restricted forpension benefits - beginning 5,706 5,410
Net position restricted forpension benefits - ending 5,539$ 5,706$
(amounts in thousands)
District Special Project Retirement Income PlanNet Position Restricted for Pension Benefits
(amounts in thousands)
District Special Project Retirement Income PlanChanges in Net Position Restricted for Pension Benefits
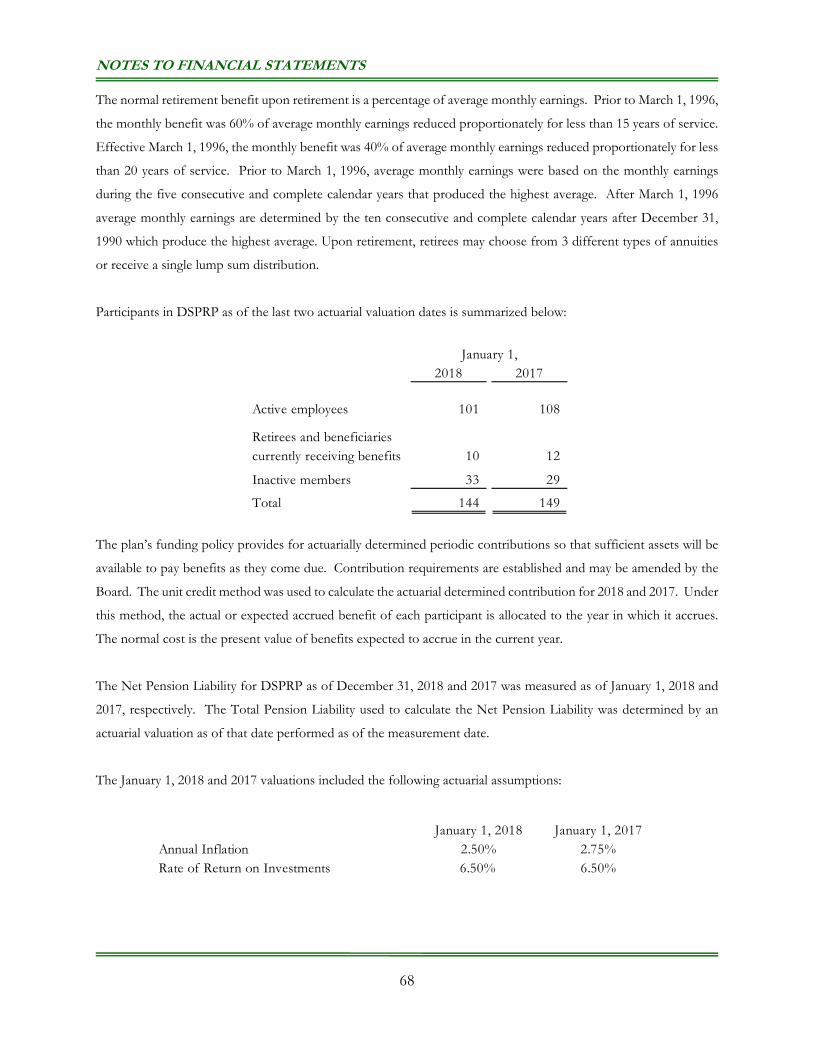
NOTES TO FINANCIAL STATEMENTS
68
The normal retirement benefit upon retirement is a percentage of average monthly earnings. Prior to March 1, 1996,
the monthly benefit was 60% of average monthly earnings reduced proportionately for less than 15 years of service.
Effective March 1, 1996, the monthly benefit was 40% of average monthly earnings reduced proportionately for less
than 20 years of service. Prior to March 1, 1996, average monthly earnings were based on the monthly earnings
during the five consecutive and complete calendar years that produced the highest average. After March 1, 1996
average monthly earnings are determined by the ten consecutive and complete calendar years after December 31,
1990 which produce the highest average. Upon retirement, retirees may choose from 3 different types of annuities
or receive a single lump sum distribution.
Participants in DSPRP as of the last two actuarial valuation dates is summarized below:
The plan’s funding policy provides for actuarially determined periodic contributions so that sufficient assets will be
available to pay benefits as they come due. Contribution requirements are established and may be amended by the
Board. The unit credit method was used to calculate the actuarial determined contribution for 2018 and 2017. Under
this method, the actual or expected accrued benefit of each participant is allocated to the year in which it accrues.
The normal cost is the present value of benefits expected to accrue in the current year.
The Net Pension Liability for DSPRP as of December 31, 2018 and 2017 was measured as of January 1, 2018 and
2017, respectively. The Total Pension Liability used to calculate the Net Pension Liability was determined by an
actuarial valuation as of that date performed as of the measurement date.
The January 1, 2018 and 2017 valuations included the following actuarial assumptions:
2018 2017
Active employees 101 108
Retirees and beneficiaries currently receiving benefits 10 12
Inactive members 33 29
Total 144 149
January 1,
January 1, 2018 January 1, 2017Annual Inflation 2.50% 2.75%Rate of Return on Investments 6.50% 6.50%
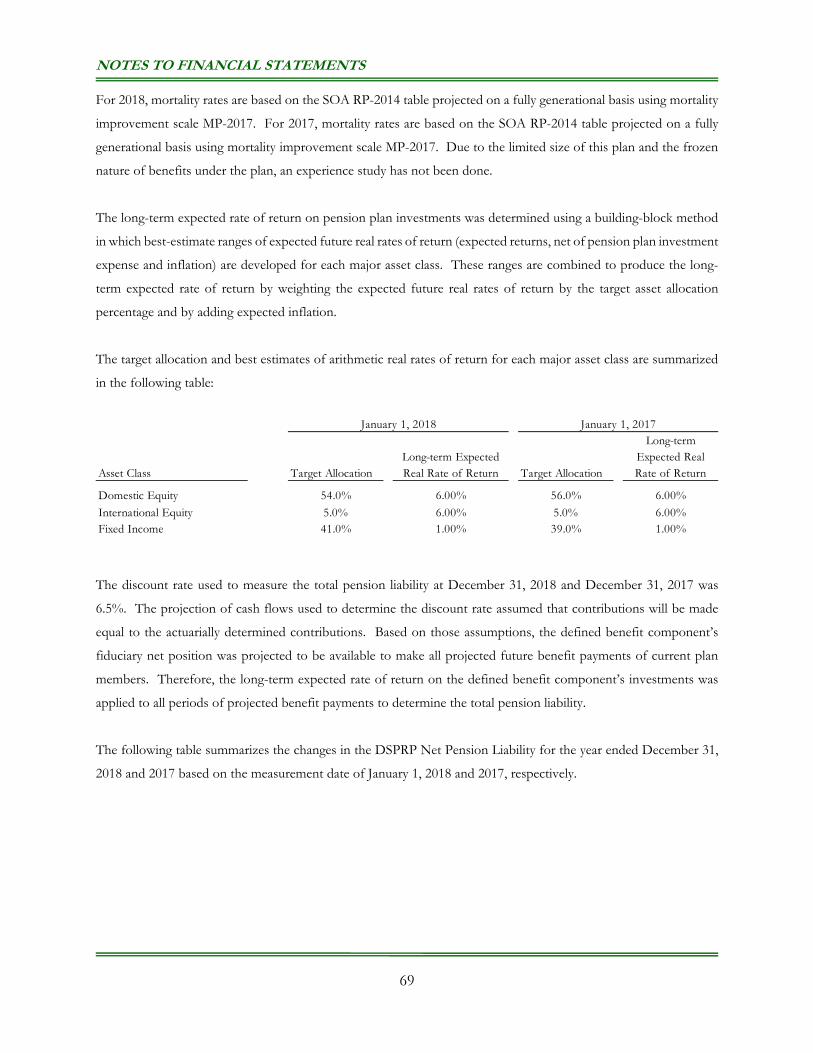
NOTES TO FINANCIAL STATEMENTS
69
For 2018, mortality rates are based on the SOA RP-2014 table projected on a fully generational basis using mortality
improvement scale MP-2017. For 2017, mortality rates are based on the SOA RP-2014 table projected on a fully
generational basis using mortality improvement scale MP-2017. Due to the limited size of this plan and the frozen
nature of benefits under the plan, an experience study has not been done.
The long-term expected rate of return on pension plan investments was determined using a building-block method
in which best-estimate ranges of expected future real rates of return (expected returns, net of pension plan investment
expense and inflation) are developed for each major asset class. These ranges are combined to produce the long-
term expected rate of return by weighting the expected future real rates of return by the target asset allocation
percentage and by adding expected inflation.
The target allocation and best estimates of arithmetic real rates of return for each major asset class are summarized
in the following table:
The discount rate used to measure the total pension liability at December 31, 2018 and December 31, 2017 was
6.5%. The projection of cash flows used to determine the discount rate assumed that contributions will be made
equal to the actuarially determined contributions. Based on those assumptions, the defined benefit component’s
fiduciary net position was projected to be available to make all projected future benefit payments of current plan
members. Therefore, the long-term expected rate of return on the defined benefit component’s investments was
applied to all periods of projected benefit payments to determine the total pension liability.
The following table summarizes the changes in the DSPRP Net Pension Liability for the year ended December 31,
2018 and 2017 based on the measurement date of January 1, 2018 and 2017, respectively.
Asset Class Target AllocationLong-term Expected Real Rate of Return Target Allocation
Long-term Expected Real Rate of Return
Domestic Equity 54.0% 6.00% 56.0% 6.00%
International Equity 5.0% 6.00% 5.0% 6.00%Fixed Income 41.0% 1.00% 39.0% 1.00%
January 1, 2018 January 1, 2017
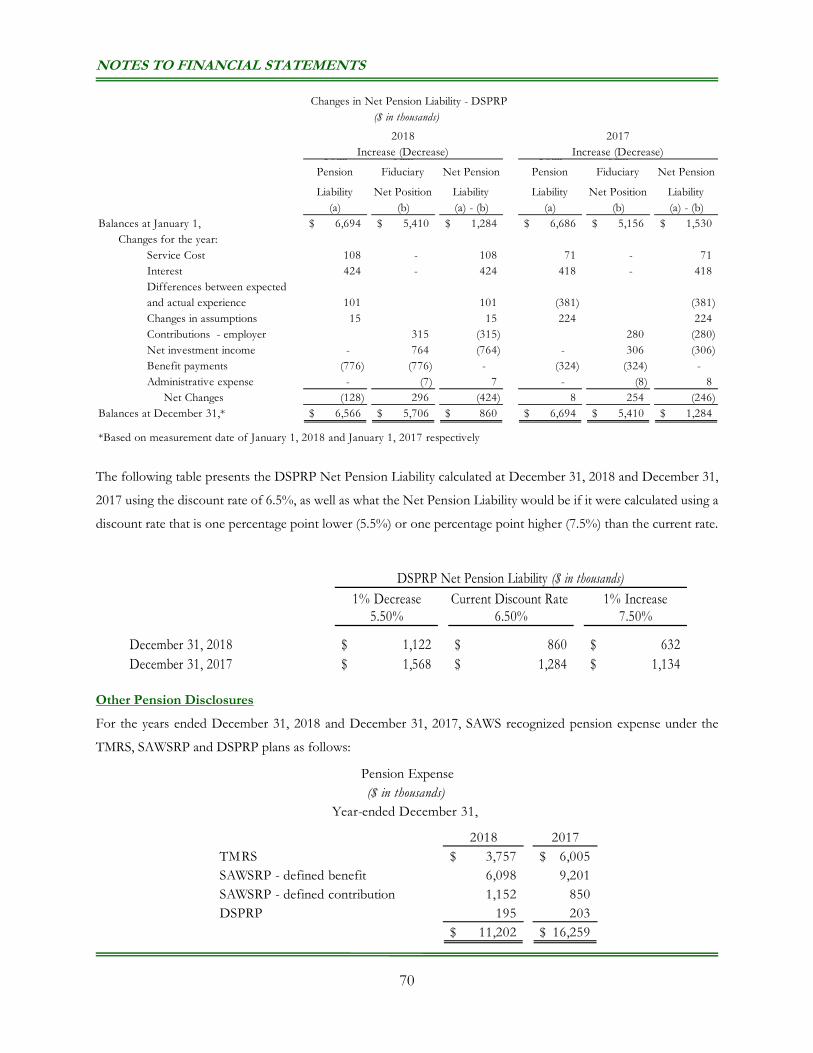
NOTES TO FINANCIAL STATEMENTS
70
The following table presents the DSPRP Net Pension Liability calculated at December 31, 2018 and December 31,
2017 using the discount rate of 6.5%, as well as what the Net Pension Liability would be if it were calculated using a
discount rate that is one percentage point lower (5.5%) or one percentage point higher (7.5%) than the current rate.
Other Pension Disclosures
For the years ended December 31, 2018 and December 31, 2017, SAWS recognized pension expense under the
TMRS, SAWSRP and DSPRP plans as follows:
Total Pension
Plan Fiduciary Net Pension
Total Pension
Plan Fiduciary Net Pension
Liability Net Position Liability Liability Net Position Liability(a) (b) (a) - (b) (a) (b) (a) - (b)
Balances at January 1, 6,694$ 5,410$ 1,284$ 6,686$ 5,156$ 1,530$ Changes for the year:
Service Cost 108 - 108 71 - 71 Interest 424 - 424 418 - 418 Differences between expected and actual experience 101 101 (381) (381) Changes in assumptions 15 15 224 224 Contributions - employer 315 (315) 280 (280) Net investment income - 764 (764) - 306 (306) Benefit payments (776) (776) - (324) (324) - Administrative expense - (7) 7 - (8) 8 Net Changes (128) 296 (424) 8 254 (246)
Balances at December 31,* 6,566$ 5,706$ 860$ 6,694$ 5,410$ 1,284$
*Based on measurement date of January 1, 2018 and January 1, 2017 respectively
Increase (Decrease)2018 2017
Changes in Net Pension Liability - DSPRP($ in thousands)
Increase (Decrease)
1% Decrease Current Discount Rate 1% Increase5.50% 6.50% 7.50%
December 31, 2018 1,122$ 860$ 632$ December 31, 2017 1,568$ 1,284$ 1,134$
DSPRP Net Pension Liability ($ in thousands)
2018 2017TMRS 3,757$ 6,005$ SAWSRP - defined benefit 6,098 9,201 SAWSRP - defined contribution 1,152 850 DSPRP 195 203
11,202$ 16,259$
Pension Expense
Year-ended December 31, ($ in thousands)
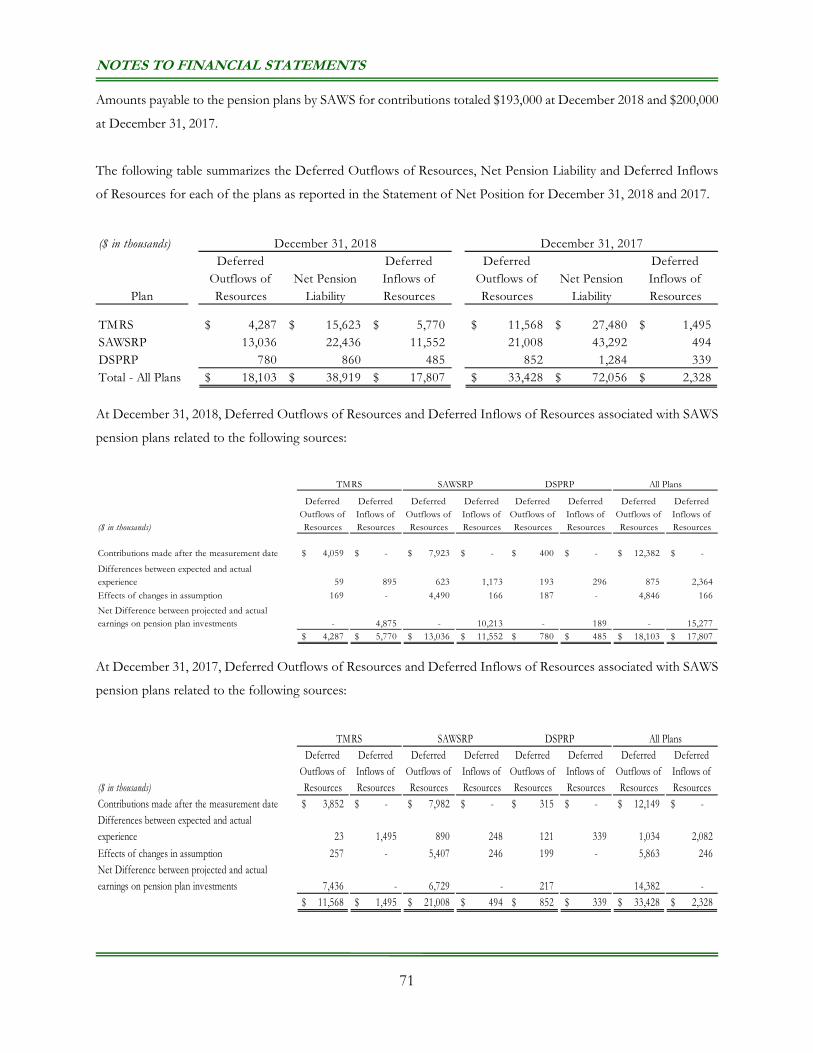
NOTES TO FINANCIAL STATEMENTS
71
Amounts payable to the pension plans by SAWS for contributions totaled $193,000 at December 2018 and $200,000
at December 31, 2017.
The following table summarizes the Deferred Outflows of Resources, Net Pension Liability and Deferred Inflows
of Resources for each of the plans as reported in the Statement of Net Position for December 31, 2018 and 2017.
At December 31, 2018, Deferred Outflows of Resources and Deferred Inflows of Resources associated with SAWS
pension plans related to the following sources:
At December 31, 2017, Deferred Outflows of Resources and Deferred Inflows of Resources associated with SAWS
pension plans related to the following sources:
($ in thousands)
Plan
Deferred Outflows of Resources
Net Pension Liability
Deferred Inflows of Resources
Deferred Outflows of Resources
Net Pension Liability
Deferred Inflows of Resources
TMRS 4,287$ 15,623$ 5,770$ 11,568$ 27,480$ 1,495$ SAWSRP 13,036 22,436 11,552 21,008 43,292 494 DSPRP 780 860 485 852 1,284 339 Total - All Plans 18,103$ 38,919$ 17,807$ 33,428$ 72,056$ 2,328$
December 31, 2018 December 31, 2017
($ in thousands)
Deferred Outflows of Resources
Deferred Inflows of Resources
Deferred Outflows of Resources
Deferred Inflows of Resources
Deferred Outflows of Resources
Deferred Inflows of Resources
Deferred Outflows of Resources
Deferred Inflows of Resources
Contributions made after the measurement date 4,059$ -$ 7,923$ -$ 400$ -$ 12,382$ -$
Differences between expected and actual experience 59 895 623 1,173 193 296 875 2,364
Effects of changes in assumption 169 - 4,490 166 187 - 4,846 166
Net Difference between projected and actual earnings on pension plan investments - 4,875 - 10,213 - 189 - 15,277
4,287$ 5,770$ 13,036$ 11,552$ 780$ 485$ 18,103$ 17,807$
TMRS All PlansDSPRPSAWSRP
($ in thousands)
Deferred Outflows of Resources
Deferred Inflows of Resources
Deferred Outflows of Resources
Deferred Inflows of Resources
Deferred Outflows of Resources
Deferred Inflows of Resources
Deferred Outflows of Resources
Deferred Inflows of Resources
Contributions made after the measurement date 3,852$ -$ 7,982$ -$ 315$ -$ 12,149$ -$ Differences between expected and actual experience 23 1,495 890 248 121 339 1,034 2,082
Effects of changes in assumption 257 - 5,407 246 199 - 5,863 246 Net Difference between projected and actual earnings on pension plan investments 7,436 - 6,729 - 217 14,382 -
11,568$ 1,495$ 21,008$ 494$ 852$ 339$ 33,428$ 2,328$
TMRS DSPRP All PlansSAWSRP
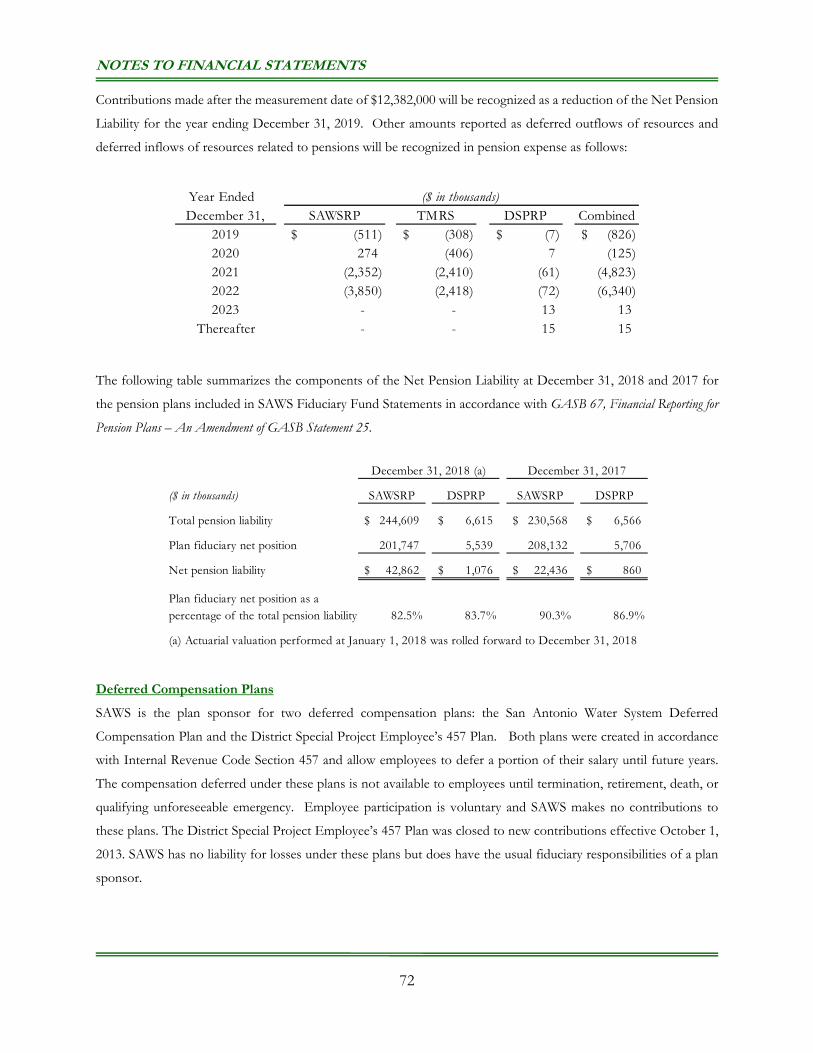
NOTES TO FINANCIAL STATEMENTS
72
Contributions made after the measurement date of $12,382,000 will be recognized as a reduction of the Net Pension
Liability for the year ending December 31, 2019. Other amounts reported as deferred outflows of resources and
deferred inflows of resources related to pensions will be recognized in pension expense as follows:
The following table summarizes the components of the Net Pension Liability at December 31, 2018 and 2017 for
the pension plans included in SAWS Fiduciary Fund Statements in accordance with GASB 67, Financial Reporting for
Pension Plans – An Amendment of GASB Statement 25.
Deferred Compensation Plans
SAWS is the plan sponsor for two deferred compensation plans: the San Antonio Water System Deferred
Compensation Plan and the District Special Project Employee’s 457 Plan. Both plans were created in accordance
with Internal Revenue Code Section 457 and allow employees to defer a portion of their salary until future years.
The compensation deferred under these plans is not available to employees until termination, retirement, death, or
qualifying unforeseeable emergency. Employee participation is voluntary and SAWS makes no contributions to
these plans. The District Special Project Employee’s 457 Plan was closed to new contributions effective October 1,
2013. SAWS has no liability for losses under these plans but does have the usual fiduciary responsibilities of a plan
sponsor.
Year Ended December 31, SAWSRP TMRS DSPRP Combined
2019 (511)$ (308)$ (7)$ (826)$ 2020 274 (406) 7 (125) 2021 (2,352) (2,410) (61) (4,823) 2022 (3,850) (2,418) (72) (6,340) 2023 - - 13 13
Thereafter - - 15 15
($ in thousands)
($ in thousands) SAWSRP DSPRP SAWSRP DSPRP
Total pension liability 244,609$ 6,615$ 230,568$ 6,566$
Plan fiduciary net position 201,747 5,539 208,132 5,706
Net pension liability 42,862$ 1,076$ 22,436$ 860$
Plan fiduciary net position as a percentage of the total pension liability 82.5% 83.7% 90.3% 86.9%
December 31, 2017December 31, 2018 (a)
(a) Actuarial valuation performed at January 1, 2018 was rolled forward to December 31, 2018
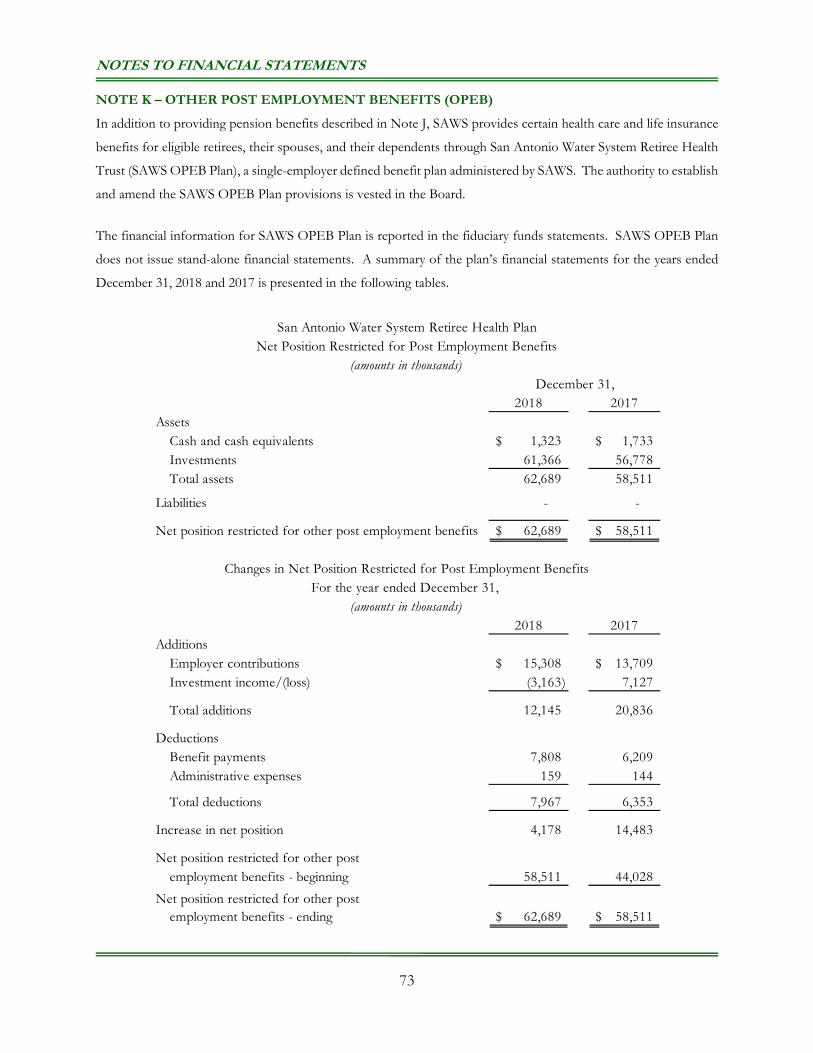
NOTES TO FINANCIAL STATEMENTS
73
NOTE K – OTHER POST EMPLOYMENT BENEFITS (OPEB)
In addition to providing pension benefits described in Note J, SAWS provides certain health care and life insurance
benefits for eligible retirees, their spouses, and their dependents through San Antonio Water System Retiree Health
Trust (SAWS OPEB Plan), a single-employer defined benefit plan administered by SAWS. The authority to establish
and amend the SAWS OPEB Plan provisions is vested in the Board.
The financial information for SAWS OPEB Plan is reported in the fiduciary funds statements. SAWS OPEB Plan
does not issue stand-alone financial statements. A summary of the plan’s financial statements for the years ended
December 31, 2018 and 2017 is presented in the following tables.
2018 2017Assets
Cash and cash equivalents 1,323$ 1,733$ Investments 61,366 56,778 Total assets 62,689 58,511
Liabilities - -
Net position restricted for other post employment benefits 62,689$ 58,511$
San Antonio Water System Retiree Health PlanNet Position Restricted for Post Employment Benefits
(amounts in thousands)December 31,
2018 2017Additions
Employer contributions 15,308$ 13,709$ Investment income/(loss) (3,163) 7,127
Total additions 12,145 20,836
DeductionsBenefit payments 7,808 6,209 Administrative expenses 159 144
Total deductions 7,967 6,353
Increase in net position 4,178 14,483
Net position restricted for other postemployment benefits - beginning 58,511 44,028
Net position restricted for other postemployment benefits - ending 62,689$ 58,511$
For the year ended December 31, (amounts in thousands)
Changes in Net Position Restricted for Post Employment Benefits
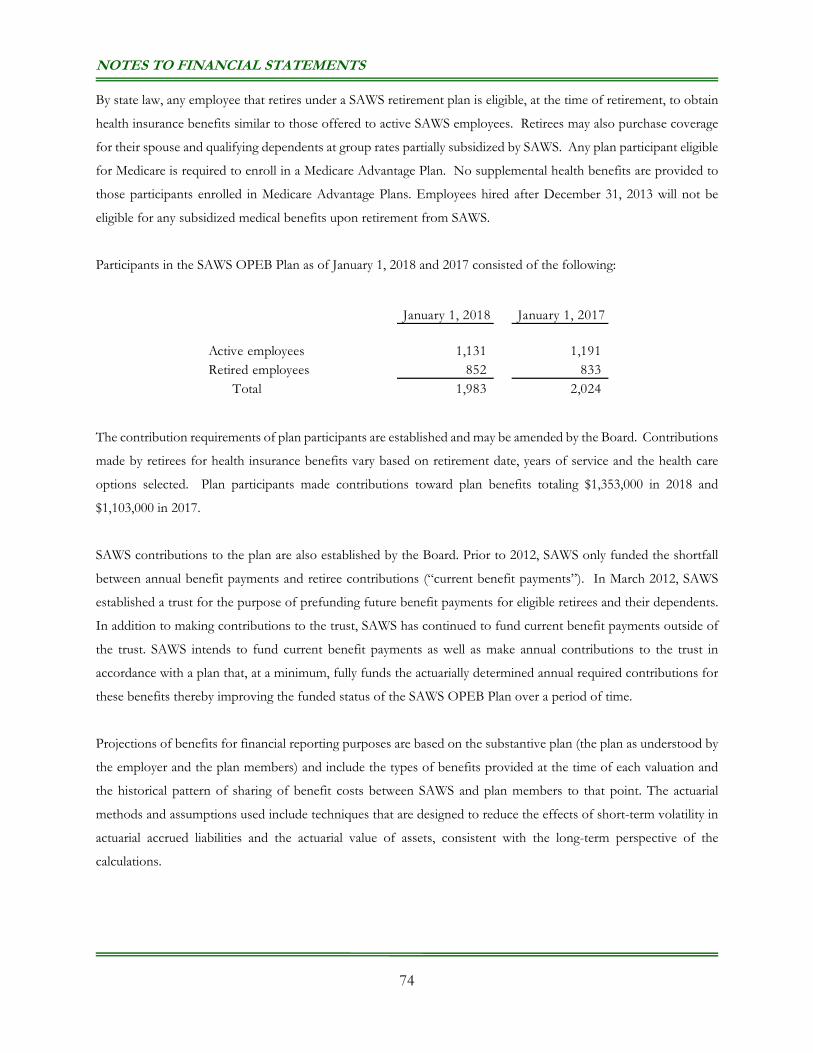
NOTES TO FINANCIAL STATEMENTS
74
By state law, any employee that retires under a SAWS retirement plan is eligible, at the time of retirement, to obtain
health insurance benefits similar to those offered to active SAWS employees. Retirees may also purchase coverage
for their spouse and qualifying dependents at group rates partially subsidized by SAWS. Any plan participant eligible
for Medicare is required to enroll in a Medicare Advantage Plan. No supplemental health benefits are provided to
those participants enrolled in Medicare Advantage Plans. Employees hired after December 31, 2013 will not be
eligible for any subsidized medical benefits upon retirement from SAWS.
Participants in the SAWS OPEB Plan as of January 1, 2018 and 2017 consisted of the following:
The contribution requirements of plan participants are established and may be amended by the Board. Contributions
made by retirees for health insurance benefits vary based on retirement date, years of service and the health care
options selected. Plan participants made contributions toward plan benefits totaling $1,353,000 in 2018 and
$1,103,000 in 2017.
SAWS contributions to the plan are also established by the Board. Prior to 2012, SAWS only funded the shortfall
between annual benefit payments and retiree contributions (“current benefit payments”). In March 2012, SAWS
established a trust for the purpose of prefunding future benefit payments for eligible retirees and their dependents.
In addition to making contributions to the trust, SAWS has continued to fund current benefit payments outside of
the trust. SAWS intends to fund current benefit payments as well as make annual contributions to the trust in
accordance with a plan that, at a minimum, fully funds the actuarially determined annual required contributions for
these benefits thereby improving the funded status of the SAWS OPEB Plan over a period of time.
Projections of benefits for financial reporting purposes are based on the substantive plan (the plan as understood by
the employer and the plan members) and include the types of benefits provided at the time of each valuation and
the historical pattern of sharing of benefit costs between SAWS and plan members to that point. The actuarial
methods and assumptions used include techniques that are designed to reduce the effects of short-term volatility in
actuarial accrued liabilities and the actuarial value of assets, consistent with the long-term perspective of the
calculations.
January 1, 2018 January 1, 2017
Active employees 1,131 1,191 Retired employees 852 833 Total 1,983 2,024
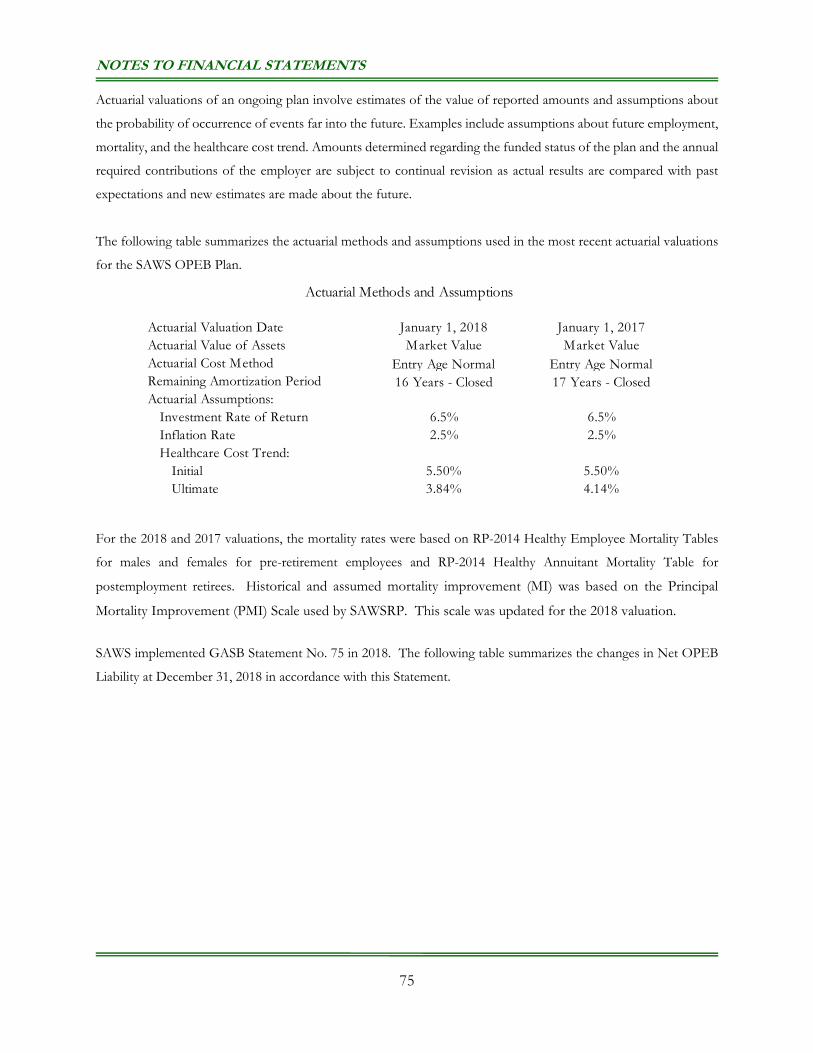
NOTES TO FINANCIAL STATEMENTS
75
Actuarial valuations of an ongoing plan involve estimates of the value of reported amounts and assumptions about
the probability of occurrence of events far into the future. Examples include assumptions about future employment,
mortality, and the healthcare cost trend. Amounts determined regarding the funded status of the plan and the annual
required contributions of the employer are subject to continual revision as actual results are compared with past
expectations and new estimates are made about the future.
The following table summarizes the actuarial methods and assumptions used in the most recent actuarial valuations
for the SAWS OPEB Plan.
For the 2018 and 2017 valuations, the mortality rates were based on RP-2014 Healthy Employee Mortality Tables
for males and females for pre-retirement employees and RP-2014 Healthy Annuitant Mortality Table for
postemployment retirees. Historical and assumed mortality improvement (MI) was based on the Principal
Mortality Improvement (PMI) Scale used by SAWSRP. This scale was updated for the 2018 valuation.
SAWS implemented GASB Statement No. 75 in 2018. The following table summarizes the changes in Net OPEB
Liability at December 31, 2018 in accordance with this Statement.
Actuarial Valuation Date January 1, 2018 January 1, 2017Actuarial Value of Assets Market Value Market ValueActuarial Cost Method Entry Age Normal Entry Age NormalRemaining Amortization Period 16 Years - Closed 17 Years - ClosedActuarial Assumptions: Investment Rate of Return 6.5% 6.5% Inflation Rate 2.5% 2.5% Healthcare Cost Trend: Initial 5.50% 5.50% Ultimate 3.84% 4.14%
Actuarial Methods and Assumptions
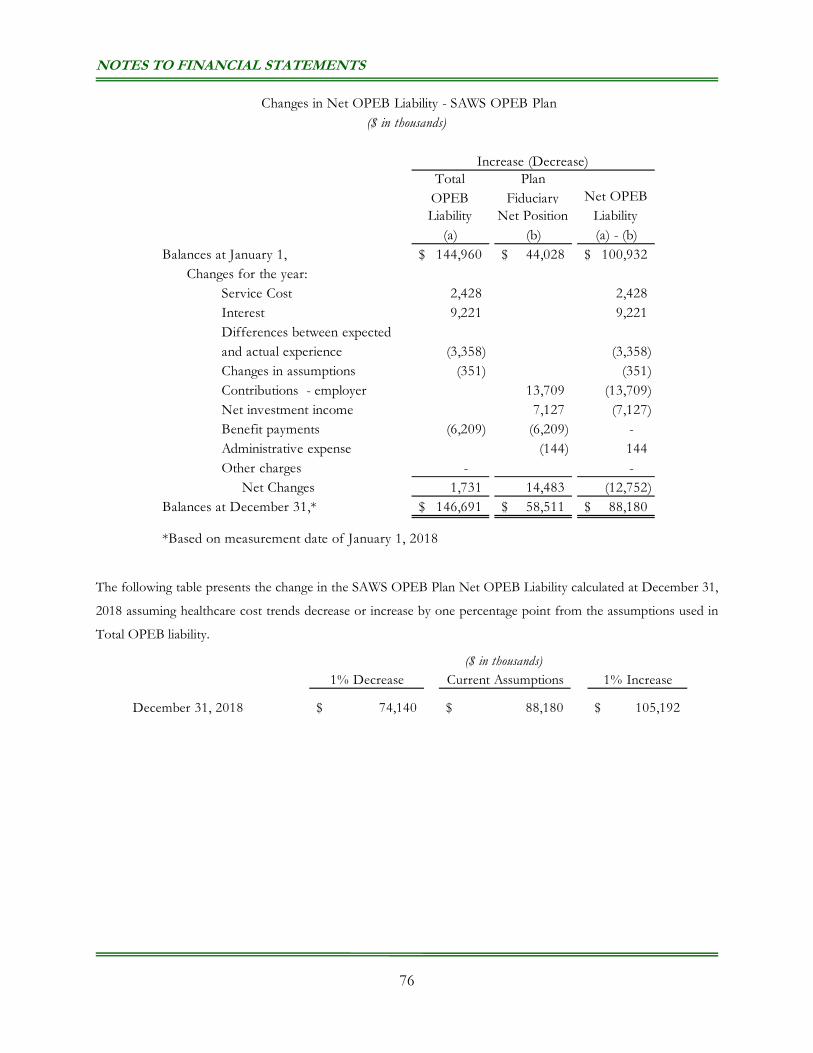
NOTES TO FINANCIAL STATEMENTS
76
The following table presents the change in the SAWS OPEB Plan Net OPEB Liability calculated at December 31,
2018 assuming healthcare cost trends decrease or increase by one percentage point from the assumptions used in
Total OPEB liability.
Total OPEB
Plan Fiduciary Net OPEB
Liability Net Position Liability(a) (b) (a) - (b)
Balances at January 1, 144,960$ 44,028$ 100,932$ Changes for the year:
Service Cost 2,428 2,428 Interest 9,221 9,221 Differences between expected and actual experience (3,358) (3,358) Changes in assumptions (351) (351) Contributions - employer 13,709 (13,709) Net investment income 7,127 (7,127) Benefit payments (6,209) (6,209) - Administrative expense (144) 144 Other charges - - Net Changes 1,731 14,483 (12,752)
Balances at December 31,* 146,691$ 58,511$ 88,180$
*Based on measurement date of January 1, 2018
Increase (Decrease)
Changes in Net OPEB Liability - SAWS OPEB Plan($ in thousands)
($ in thousands)1% Decrease Current Assumptions 1% Increase
December 31, 2018 74,140$ 88,180$ 105,192$
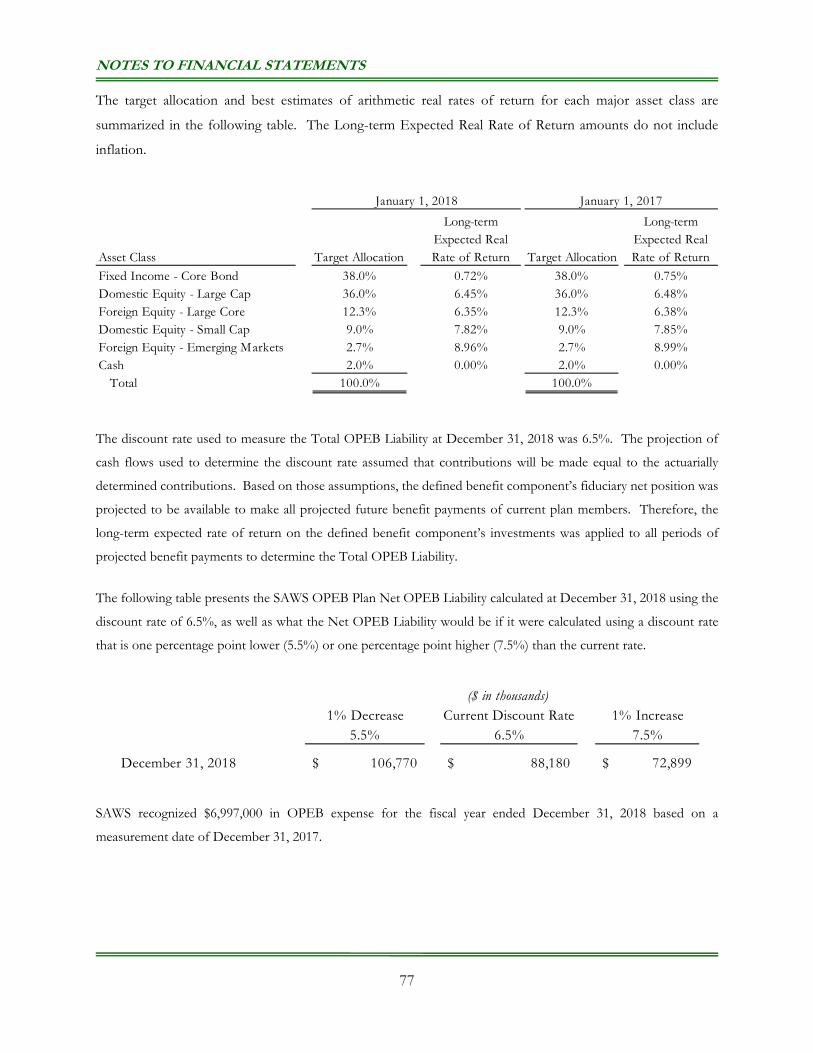
NOTES TO FINANCIAL STATEMENTS
77
The target allocation and best estimates of arithmetic real rates of return for each major asset class are
summarized in the following table. The Long-term Expected Real Rate of Return amounts do not include
inflation.
The discount rate used to measure the Total OPEB Liability at December 31, 2018 was 6.5%. The projection of
cash flows used to determine the discount rate assumed that contributions will be made equal to the actuarially
determined contributions. Based on those assumptions, the defined benefit component’s fiduciary net position was
projected to be available to make all projected future benefit payments of current plan members. Therefore, the
long-term expected rate of return on the defined benefit component’s investments was applied to all periods of
projected benefit payments to determine the Total OPEB Liability.
The following table presents the SAWS OPEB Plan Net OPEB Liability calculated at December 31, 2018 using the
discount rate of 6.5%, as well as what the Net OPEB Liability would be if it were calculated using a discount rate
that is one percentage point lower (5.5%) or one percentage point higher (7.5%) than the current rate.
SAWS recognized $6,997,000 in OPEB expense for the fiscal year ended December 31, 2018 based on a
measurement date of December 31, 2017.
Asset Class Target Allocation
Long-term Expected Real Rate of Return Target Allocation
Long-term Expected Real Rate of Return
Fixed Income - Core Bond 38.0% 0.72% 38.0% 0.75%Domestic Equity - Large Cap 36.0% 6.45% 36.0% 6.48%Foreign Equity - Large Core 12.3% 6.35% 12.3% 6.38%Domestic Equity - Small Cap 9.0% 7.82% 9.0% 7.85%Foreign Equity - Emerging Markets 2.7% 8.96% 2.7% 8.99%Cash 2.0% 0.00% 2.0% 0.00% Total 100.0% 100.0%
January 1, 2018 January 1, 2017
($ in thousands)1% Decrease Current Discount Rate 1% Increase
5.5% 6.5% 7.5%
December 31, 2018 106,770$ 88,180$ 72,899$
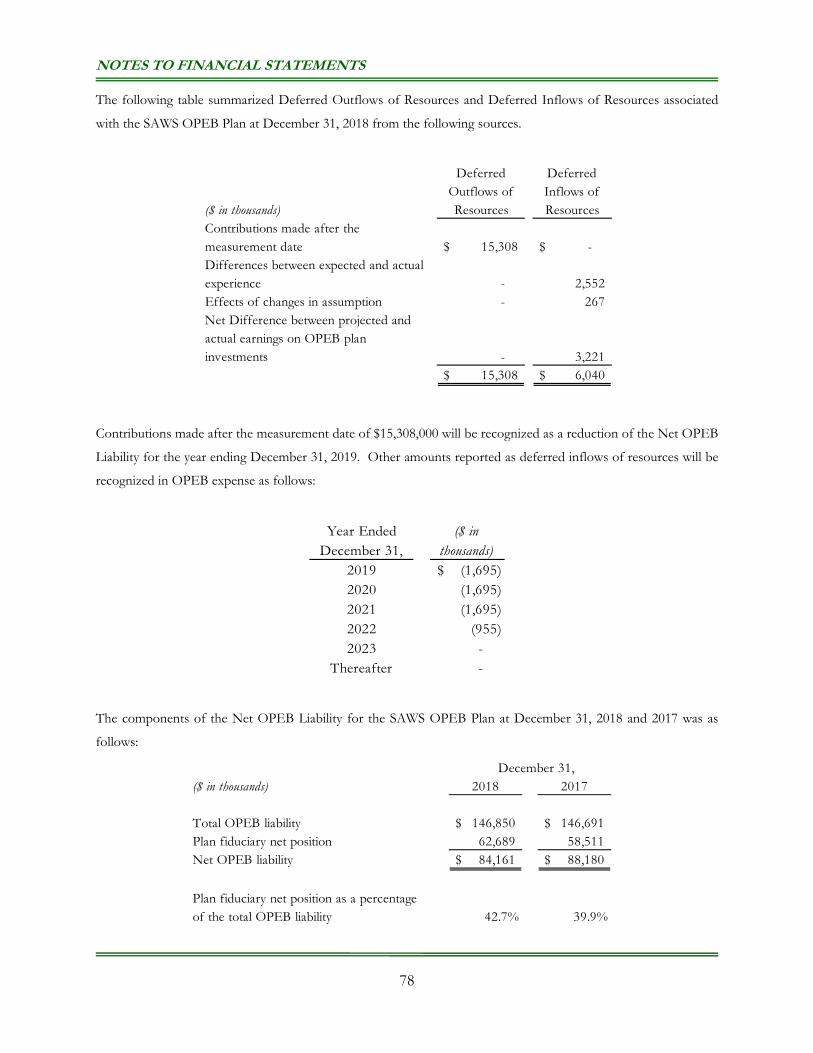
NOTES TO FINANCIAL STATEMENTS
78
The following table summarized Deferred Outflows of Resources and Deferred Inflows of Resources associated
with the SAWS OPEB Plan at December 31, 2018 from the following sources.
Contributions made after the measurement date of $15,308,000 will be recognized as a reduction of the Net OPEB
Liability for the year ending December 31, 2019. Other amounts reported as deferred inflows of resources will be
recognized in OPEB expense as follows:
The components of the Net OPEB Liability for the SAWS OPEB Plan at December 31, 2018 and 2017 was as
follows:
($ in thousands)
Deferred Outflows of Resources
Deferred Inflows of Resources
Contributions made after the measurement date 15,308$ -$ Differences between expected and actual experience - 2,552 Effects of changes in assumption - 267 Net Difference between projected and actual earnings on OPEB plan investments - 3,221
15,308$ 6,040$
Year Ended December 31,
($ in thousands)
2019 (1,695)$ 2020 (1,695) 2021 (1,695) 2022 (955) 2023 -
Thereafter -
($ in thousands) 2018 2017
Total OPEB liability 146,850$ 146,691$ Plan fiduciary net position 62,689 58,511 Net OPEB liability 84,161$ 88,180$
Plan fiduciary net position as a percentage of the total OPEB liability 42.7% 39.9%
December 31,
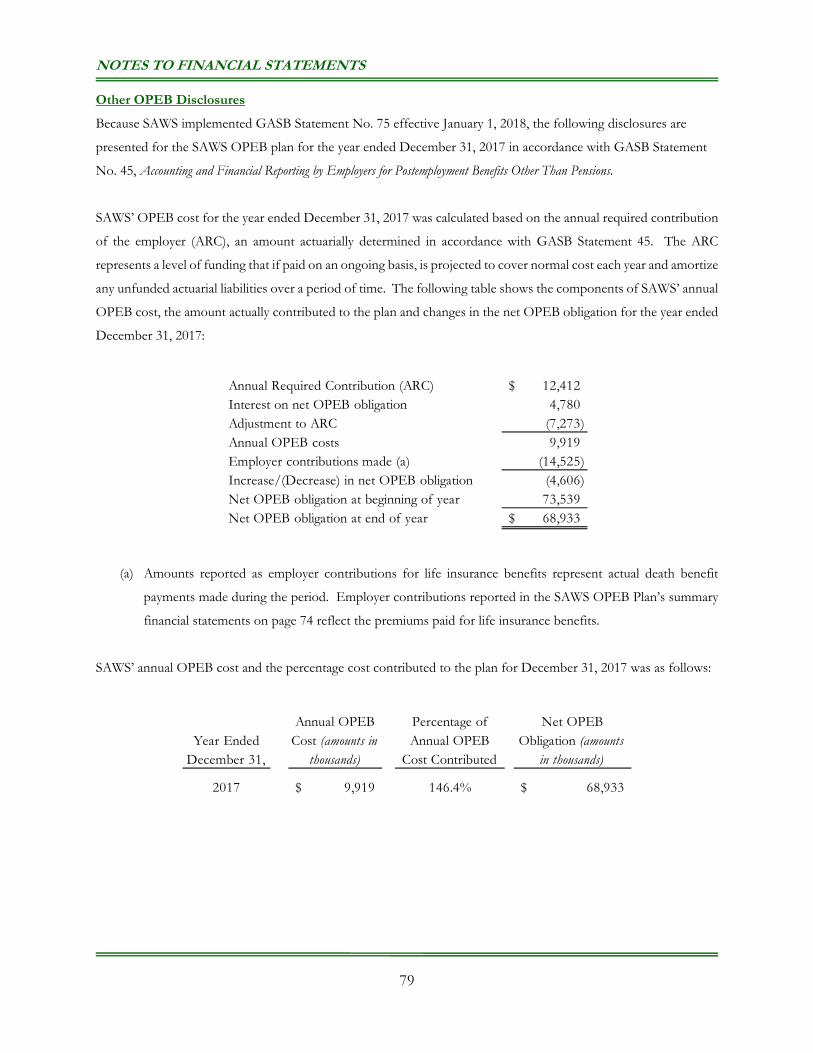
NOTES TO FINANCIAL STATEMENTS
79
Other OPEB Disclosures
Because SAWS implemented GASB Statement No. 75 effective January 1, 2018, the following disclosures are
presented for the SAWS OPEB plan for the year ended December 31, 2017 in accordance with GASB Statement
No. 45, Accounting and Financial Reporting by Employers for Postemployment Benefits Other Than Pensions.
SAWS’ OPEB cost for the year ended December 31, 2017 was calculated based on the annual required contribution
of the employer (ARC), an amount actuarially determined in accordance with GASB Statement 45. The ARC
represents a level of funding that if paid on an ongoing basis, is projected to cover normal cost each year and amortize
any unfunded actuarial liabilities over a period of time. The following table shows the components of SAWS’ annual
OPEB cost, the amount actually contributed to the plan and changes in the net OPEB obligation for the year ended
December 31, 2017:
(a) Amounts reported as employer contributions for life insurance benefits represent actual death benefit
payments made during the period. Employer contributions reported in the SAWS OPEB Plan’s summary
financial statements on page 74 reflect the premiums paid for life insurance benefits.
SAWS’ annual OPEB cost and the percentage cost contributed to the plan for December 31, 2017 was as follows:
Annual Required Contribution (ARC) 12,412$ Interest on net OPEB obligation 4,780 Adjustment to ARC (7,273) Annual OPEB costs 9,919 Employer contributions made (a) (14,525) Increase/(Decrease) in net OPEB obligation (4,606) Net OPEB obligation at beginning of year 73,539 Net OPEB obligation at end of year 68,933$
Year Ended December 31,
Annual OPEB Cost (amounts in
thousands)
Percentage of Annual OPEB
Cost Contributed
Net OPEB Obligation (amounts
in thousands)
2017 9,919$ 146.4% 68,933$
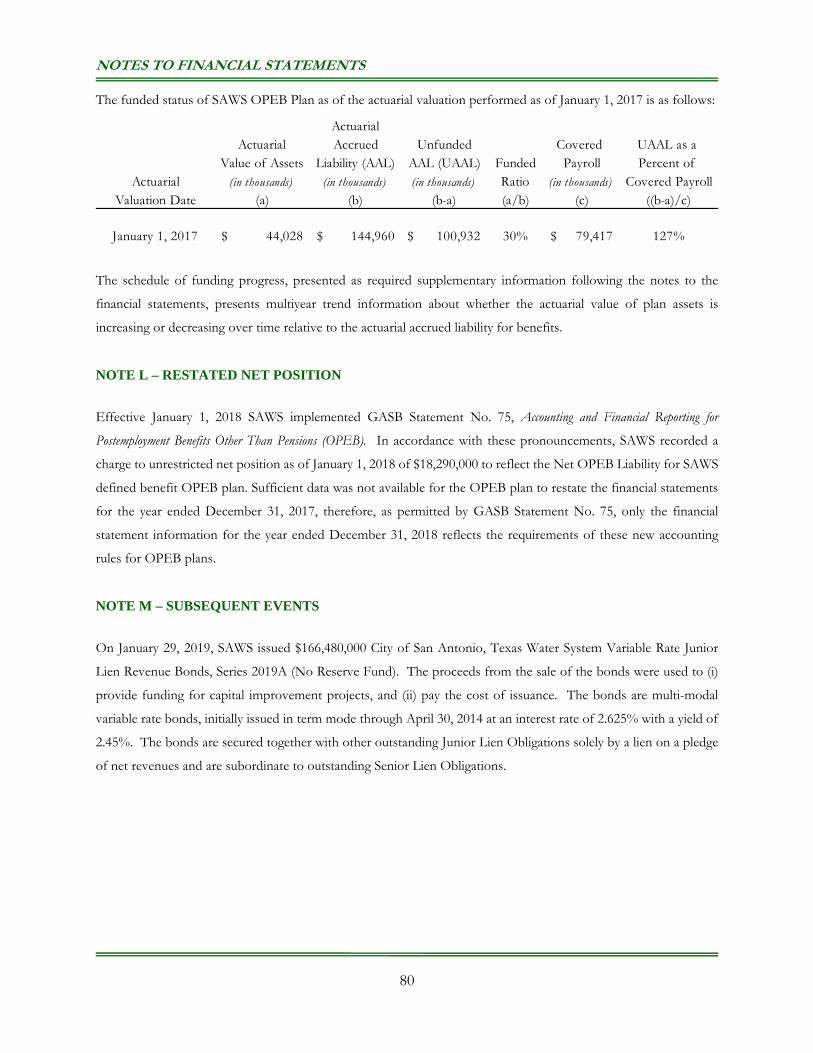
NOTES TO FINANCIAL STATEMENTS
80
The funded status of SAWS OPEB Plan as of the actuarial valuation performed as of January 1, 2017 is as follows:
The schedule of funding progress, presented as required supplementary information following the notes to the
financial statements, presents multiyear trend information about whether the actuarial value of plan assets is
increasing or decreasing over time relative to the actuarial accrued liability for benefits.
NOTE L – RESTATED NET POSITION
Effective January 1, 2018 SAWS implemented GASB Statement No. 75, Accounting and Financial Reporting for
Postemployment Benefits Other Than Pensions (OPEB). In accordance with these pronouncements, SAWS recorded a
charge to unrestricted net position as of January 1, 2018 of $18,290,000 to reflect the Net OPEB Liability for SAWS
defined benefit OPEB plan. Sufficient data was not available for the OPEB plan to restate the financial statements
for the year ended December 31, 2017, therefore, as permitted by GASB Statement No. 75, only the financial
statement information for the year ended December 31, 2018 reflects the requirements of these new accounting
rules for OPEB plans.
NOTE M – SUBSEQUENT EVENTS
On January 29, 2019, SAWS issued $166,480,000 City of San Antonio, Texas Water System Variable Rate Junior
Lien Revenue Bonds, Series 2019A (No Reserve Fund). The proceeds from the sale of the bonds were used to (i)
provide funding for capital improvement projects, and (ii) pay the cost of issuance. The bonds are multi-modal
variable rate bonds, initially issued in term mode through April 30, 2014 at an interest rate of 2.625% with a yield of
2.45%. The bonds are secured together with other outstanding Junior Lien Obligations solely by a lien on a pledge
of net revenues and are subordinate to outstanding Senior Lien Obligations.
ActuarialActuarial Accrued Unfunded Covered UAAL as a
Value of Assets Liability (AAL) AAL (UAAL) Funded Payroll Percent of Actuarial (in thousands) (in thousands) (in thousands) Ratio (in thousands) Covered Payroll
Valuation Date (a) (b) (b-a) (a/b) (c) ((b-a)/c)
January 1, 2017 44,028$ 144,960$ 100,932$ 30% 79,417$ 127%
This Page Intentionally Left Blank
Comprehensive Annual Financial Report
REQUIRED SUPPLEMENTAL INFORMATION
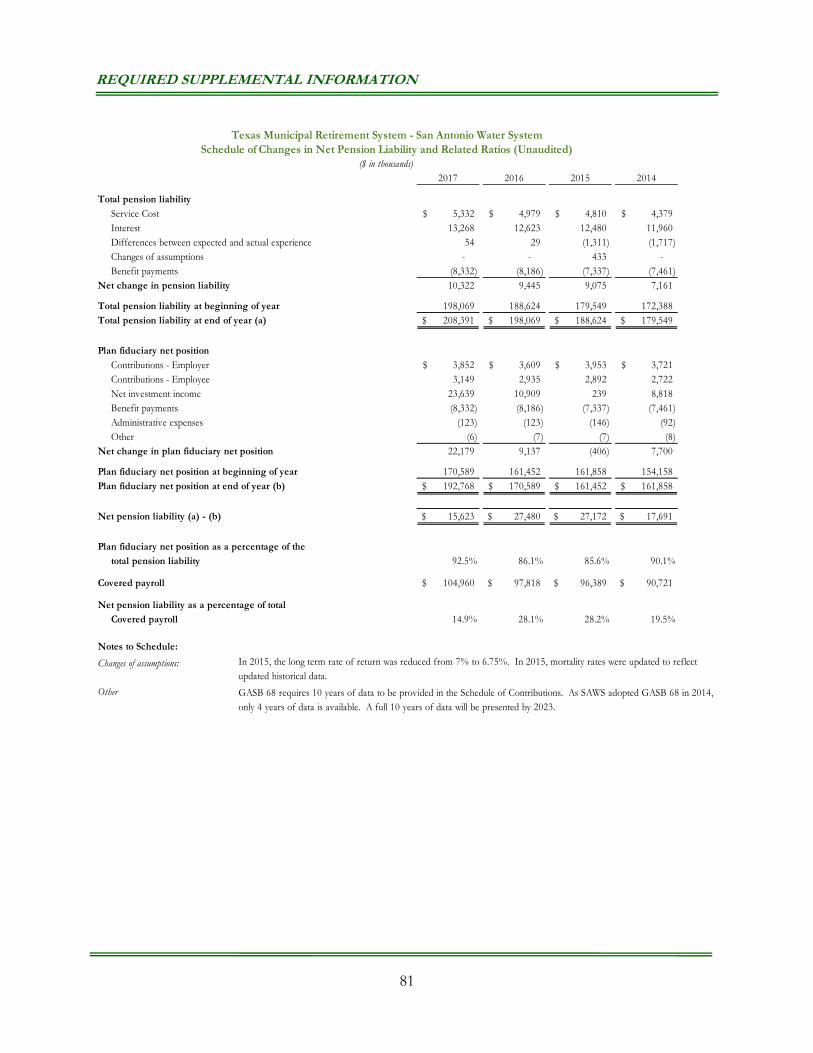
REQUIRED SUPPLEMENTAL INFORMATION
81
2017 2016 2015 2014
Total pension liabilityService Cost 5,332$ 4,979$ 4,810$ 4,379$ Interest 13,268 12,623 12,480 11,960 Differences between expected and actual experience 54 29 (1,311) (1,717) Changes of assumptions - - 433 - Benefit payments (8,332) (8,186) (7,337) (7,461)
Net change in pension liability 10,322 9,445 9,075 7,161
Total pension liability at beginning of year 198,069 188,624 179,549 172,388 Total pension liability at end of year (a) 208,391$ 198,069$ 188,624$ 179,549$
Plan fiduciary net positionContributions - Employer 3,852$ 3,609$ 3,953$ 3,721$ Contributions - Employee 3,149 2,935 2,892 2,722 Net investment income 23,639 10,909 239 8,818 Benefit payments (8,332) (8,186) (7,337) (7,461) Administrative expenses (123) (123) (146) (92) Other (6) (7) (7) (8)
Net change in plan fiduciary net position 22,179 9,137 (406) 7,700
Plan fiduciary net position at beginning of year 170,589 161,452 161,858 154,158 Plan fiduciary net position at end of year (b) 192,768$ 170,589$ 161,452$ 161,858$
Net pension liability (a) - (b) 15,623$ 27,480$ 27,172$ 17,691$
Plan fiduciary net position as a percentage of thetotal pension liability 92.5% 86.1% 85.6% 90.1%
Covered payroll 104,960$ 97,818$ 96,389$ 90,721$
Net pension liability as a percentage of totalCovered payroll 14.9% 28.1% 28.2% 19.5%
Notes to Schedule:
Changes of assumptions:
Other GASB 68 requires 10 years of data to be provided in the Schedule of Contributions. As SAWS adopted GASB 68 in 2014, only 4 years of data is available. A full 10 years of data will be presented by 2023.
In 2015, the long term rate of return was reduced from 7% to 6.75%. In 2015, mortality rates were updated to reflect updated historical data.
Schedule of Changes in Net Pension Liability and Related Ratios (Unaudited)Texas Municipal Retirement System - San Antonio Water System
($ in thousands)
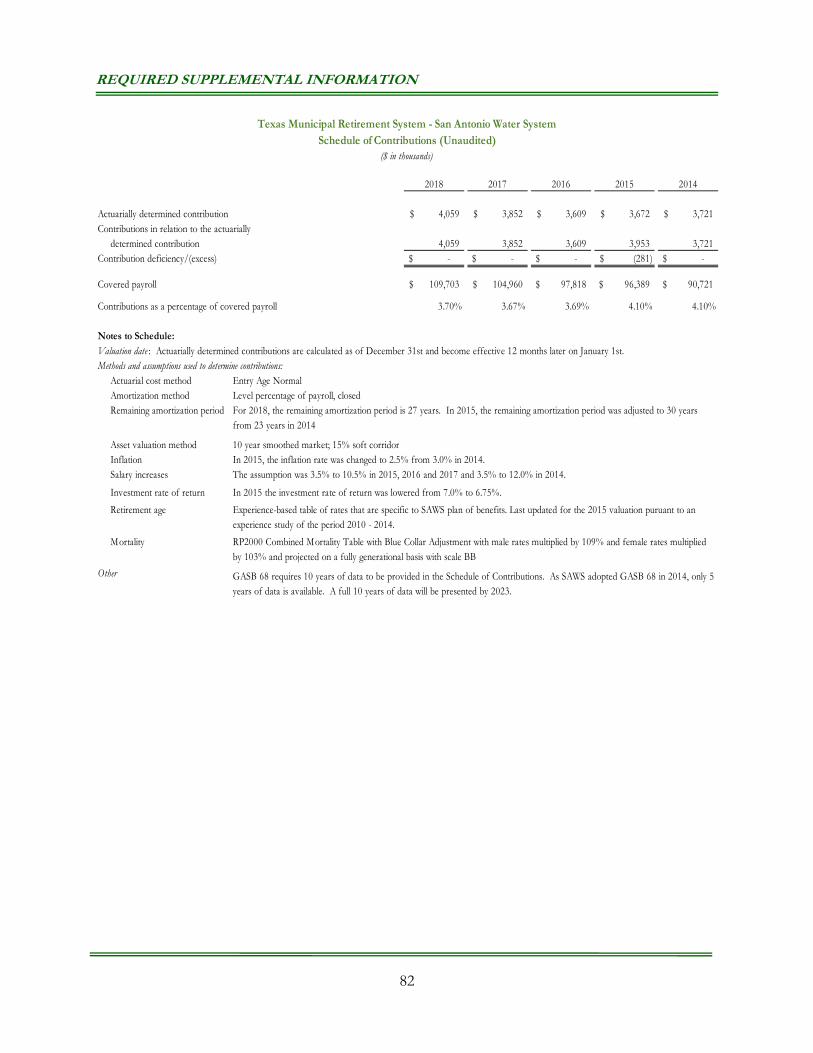
REQUIRED SUPPLEMENTAL INFORMATION
82
2018 2017 2016 2015 2014
Actuarially determined contribution 4,059$ 3,852$ 3,609$ 3,672$ 3,721$ Contributions in relation to the actuarially
determined contribution 4,059 3,852 3,609 3,953 3,721 Contribution deficiency/(excess) -$ -$ -$ (281)$ -$
Covered payroll 109,703$ 104,960$ 97,818$ 96,389$ 90,721$
Contributions as a percentage of covered payroll 3.70% 3.67% 3.69% 4.10% 4.10%
Notes to Schedule:Valuation date : Actuarially determined contributions are calculated as of December 31st and become effective 12 months later on January 1st.Methods and assumptions used to determine contributions:
Actuarial cost methodAmortization method Level percentage of payroll, closedRemaining amortization period
Asset valuation methodInflationSalary increases
Investment rate of return In 2015 the investment rate of return was lowered from 7.0% to 6.75%.
Retirement age
Mortality
GASB 68 requires 10 years of data to be provided in the Schedule of Contributions. As SAWS adopted GASB 68 in 2014, only 5 years of data is available. A full 10 years of data will be presented by 2023.
Entry Age Normal
10 year smoothed market; 15% soft corridorIn 2015, the inflation rate was changed to 2.5% from 3.0% in 2014.The assumption was 3.5% to 10.5% in 2015, 2016 and 2017 and 3.5% to 12.0% in 2014.
For 2018, the remaining amortization period is 27 years. In 2015, the remaining amortization period was adjusted to 30 years from 23 years in 2014
Experience-based table of rates that are specific to SAWS plan of benefits. Last updated for the 2015 valuation puruant to an experience study of the period 2010 - 2014.
RP2000 Combined Mortality Table with Blue Collar Adjustment with male rates multiplied by 109% and female rates multiplied by 103% and projected on a fully generational basis with scale BB
Other
Schedule of Contributions (Unaudited)Texas Municipal Retirement System - San Antonio Water System
($ in thousands)
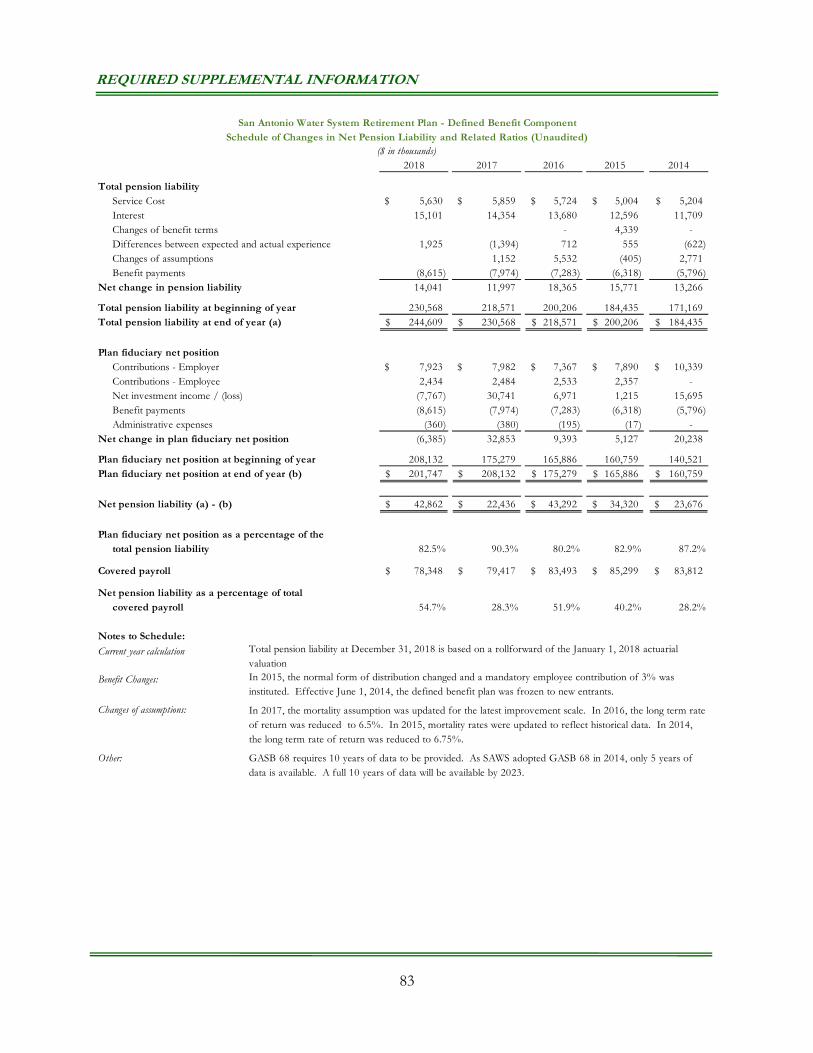
REQUIRED SUPPLEMENTAL INFORMATION
83
2018 2017 2016 2015 2014
Total pension liabilityService Cost 5,630$ 5,859$ 5,724$ 5,004$ 5,204$ Interest 15,101 14,354 13,680 12,596 11,709 Changes of benefit terms - 4,339 - Differences between expected and actual experience 1,925 (1,394) 712 555 (622) Changes of assumptions 1,152 5,532 (405) 2,771 Benefit payments (8,615) (7,974) (7,283) (6,318) (5,796)
Net change in pension liability 14,041 11,997 18,365 15,771 13,266
Total pension liability at beginning of year 230,568 218,571 200,206 184,435 171,169 Total pension liability at end of year (a) 244,609$ 230,568$ 218,571$ 200,206$ 184,435$
Plan fiduciary net positionContributions - Employer 7,923$ 7,982$ 7,367$ 7,890$ 10,339$ Contributions - Employee 2,434 2,484 2,533 2,357 - Net investment income / (loss) (7,767) 30,741 6,971 1,215 15,695 Benefit payments (8,615) (7,974) (7,283) (6,318) (5,796) Administrative expenses (360) (380) (195) (17) -
Net change in plan fiduciary net position (6,385) 32,853 9,393 5,127 20,238
Plan fiduciary net position at beginning of year 208,132 175,279 165,886 160,759 140,521 Plan fiduciary net position at end of year (b) 201,747$ 208,132$ 175,279$ 165,886$ 160,759$
Net pension liability (a) - (b) 42,862$ 22,436$ 43,292$ 34,320$ 23,676$
Plan fiduciary net position as a percentage of thetotal pension liability 82.5% 90.3% 80.2% 82.9% 87.2%
Covered payroll 78,348$ 79,417$ 83,493$ 85,299$ 83,812$
Net pension liability as a percentage of totalcovered payroll 54.7% 28.3% 51.9% 40.2% 28.2%
Notes to Schedule:
Current year calculation
Benefit Changes:
Changes of assumptions:
San Antonio Water System Retirement Plan - Defined Benefit ComponentSchedule of Changes in Net Pension Liability and Related Ratios (Unaudited)
($ in thousands)
In 2017, the mortality assumption was updated for the latest improvement scale. In 2016, the long term rate of return was reduced to 6.5%. In 2015, mortality rates were updated to reflect historical data. In 2014, the long term rate of return was reduced to 6.75%.
In 2015, the normal form of distribution changed and a mandatory employee contribution of 3% was instituted. Effective June 1, 2014, the defined benefit plan was frozen to new entrants.
Total pension liability at December 31, 2018 is based on a rollforward of the January 1, 2018 actuarial valuation
Other: GASB 68 requires 10 years of data to be provided. As SAWS adopted GASB 68 in 2014, only 5 years of data is available. A full 10 years of data will be available by 2023.
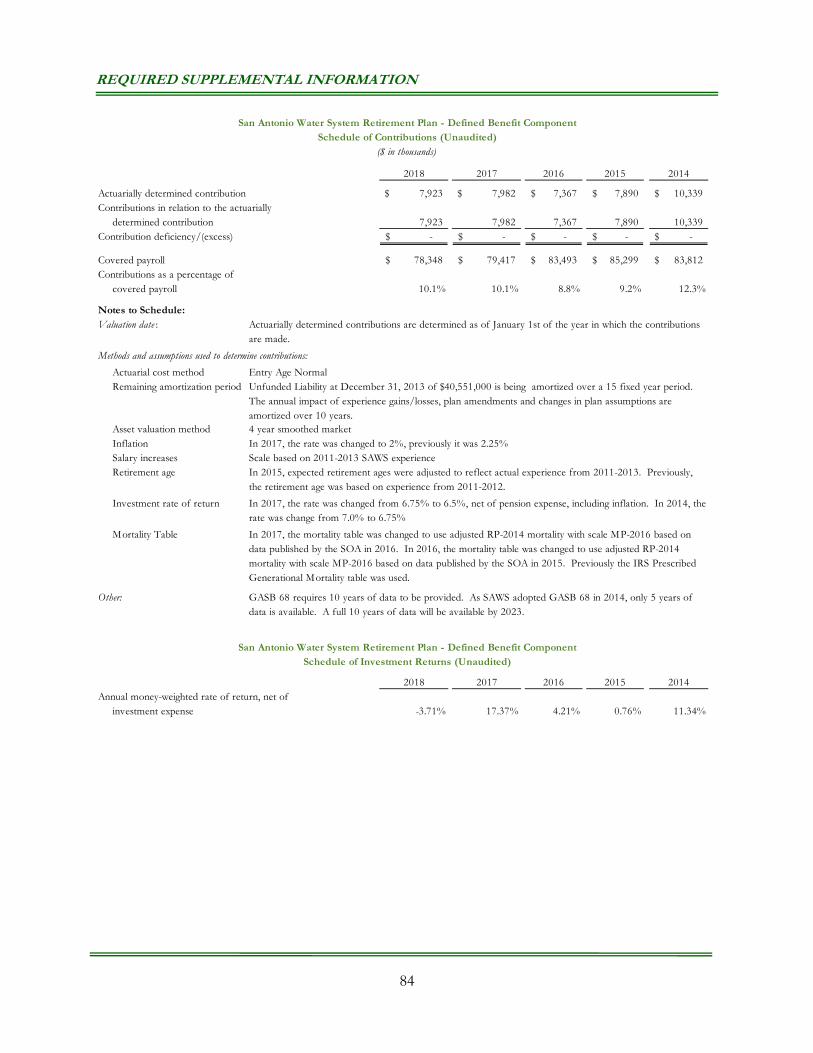
REQUIRED SUPPLEMENTAL INFORMATION
84
2018 2017 2016 2015 2014
Actuarially determined contribution 7,923$ 7,982$ 7,367$ 7,890$ 10,339$ Contributions in relation to the actuarially
determined contribution 7,923 7,982 7,367 7,890 10,339 Contribution deficiency/(excess) -$ -$ -$ -$ -$
Covered payroll 78,348$ 79,417$ 83,493$ 85,299$ 83,812$ Contributions as a percentage of
covered payroll 10.1% 10.1% 8.8% 9.2% 12.3%
Notes to Schedule:Valuation date :
Methods and assumptions used to determine contributions:
Actuarial cost methodRemaining amortization period
Asset valuation methodInflationSalary increasesRetirement age
Investment rate of return
Mortality Table
2018 2017 2016 2015 2014Annual money-weighted rate of return, net of
investment expense -3.71% 17.37% 4.21% 0.76% 11.34%
San Antonio Water System Retirement Plan - Defined Benefit ComponentSchedule of Investment Returns (Unaudited)
Schedule of Contributions (Unaudited)($ in thousands)
4 year smoothed marketIn 2017, the rate was changed to 2%, previously it was 2.25%Scale based on 2011-2013 SAWS experienceIn 2015, expected retirement ages were adjusted to reflect actual experience from 2011-2013. Previously, the retirement age was based on experience from 2011-2012.
In 2017, the rate was changed from 6.75% to 6.5%, net of pension expense, including inflation. In 2014, the rate was change from 7.0% to 6.75%
In 2017, the mortality table was changed to use adjusted RP-2014 mortality with scale MP-2016 based on data published by the SOA in 2016. In 2016, the mortality table was changed to use adjusted RP-2014 mortality with scale MP-2016 based on data published by the SOA in 2015. Previously the IRS Prescribed Generational Mortality table was used.
Other: GASB 68 requires 10 years of data to be provided. As SAWS adopted GASB 68 in 2014, only 5 years of data is available. A full 10 years of data will be available by 2023.
Entry Age NormalUnfunded Liability at December 31, 2013 of $40,551,000 is being amortized over a 15 fixed year period. The annual impact of experience gains/losses, plan amendments and changes in plan assumptions are amortized over 10 years.
Actuarially determined contributions are determined as of January 1st of the year in which the contributions are made.
San Antonio Water System Retirement Plan - Defined Benefit Component
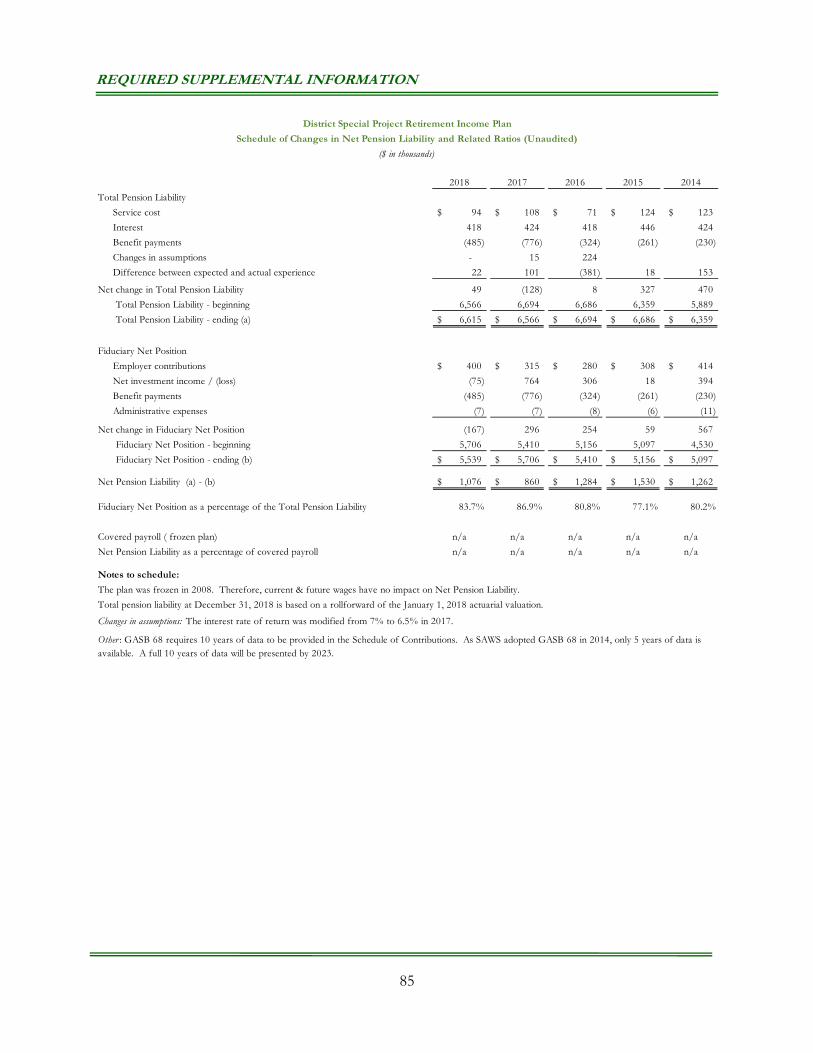
REQUIRED SUPPLEMENTAL INFORMATION
85
2018 2017 2016 2015 2014
Total Pension Liability
Service cost 94$ 108$ 71$ 124$ 123$
Interest 418 424 418 446 424
Benefit payments (485) (776) (324) (261) (230)
Changes in assumptions - 15 224
Difference between expected and actual experience 22 101 (381) 18 153
Net change in Total Pension Liability 49 (128) 8 327 470
Total Pension Liability - beginning 6,566 6,694 6,686 6,359 5,889
Total Pension Liability - ending (a) 6,615$ 6,566$ 6,694$ 6,686$ 6,359$
Fiduciary Net Position
Employer contributions 400$ 315$ 280$ 308$ 414$
Net investment income / (loss) (75) 764 306 18 394
Benefit payments (485) (776) (324) (261) (230)
Administrative expenses (7) (7) (8) (6) (11)
Net change in Fiduciary Net Position (167) 296 254 59 567
Fiduciary Net Position - beginning 5,706 5,410 5,156 5,097 4,530
Fiduciary Net Position - ending (b) 5,539$ 5,706$ 5,410$ 5,156$ 5,097$
Net Pension Liability (a) - (b) 1,076$ 860$ 1,284$ 1,530$ 1,262$
Fiduciary Net Position as a percentage of the Total Pension Liability 83.7% 86.9% 80.8% 77.1% 80.2%
Covered payroll ( frozen plan) n/a n/a n/a n/a n/a
Net Pension Liability as a percentage of covered payroll n/a n/a n/a n/a n/a
Notes to schedule:
Total pension liability at December 31, 2018 is based on a rollforward of the January 1, 2018 actuarial valuation.
The plan was frozen in 2008. Therefore, current & future wages have no impact on Net Pension Liability.
District Special Project Retirement Income Plan
Other : GASB 68 requires 10 years of data to be provided in the Schedule of Contributions. As SAWS adopted GASB 68 in 2014, only 5 years of data is available. A full 10 years of data will be presented by 2023.
Changes in assumptions: The interest rate of return was modified from 7% to 6.5% in 2017.
Schedule of Changes in Net Pension Liability and Related Ratios (Unaudited)
($ in thousands)
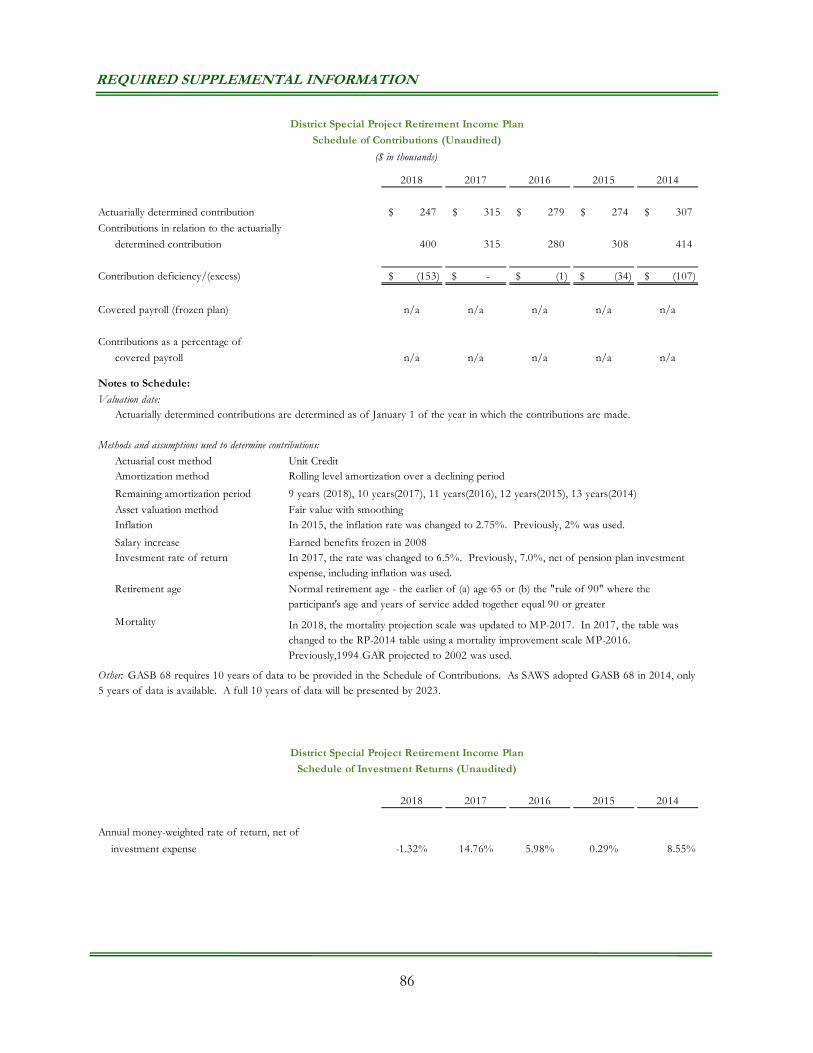
REQUIRED SUPPLEMENTAL INFORMATION
86
2018 2017 2016 2015 2014
Actuarially determined contribution 247$ 315$ 279$ 274$ 307$
Contributions in relation to the actuarially
determined contribution 400 315 280 308 414
Contribution deficiency/(excess) (153)$ -$ (1)$ (34)$ (107)$
Covered payroll (frozen plan) n/a n/a n/a n/a n/a
Contributions as a percentage of
covered payroll n/a n/a n/a n/a n/a
Notes to Schedule:
Valuation date:
Actuarial cost methodAmortization method
Remaining amortization period
Asset valuation methodInflation
Salary increaseInvestment rate of return
Retirement age
Mortality
2018 2017 2016 2015 2014
Annual money-weighted rate of return, net of
investment expense -1.32% 14.76% 5.98% 0.29% 8.55%
Schedule of Investment Returns (Unaudited)
Other: GASB 68 requires 10 years of data to be provided in the Schedule of Contributions. As SAWS adopted GASB 68 in 2014, only 5 years of data is available. A full 10 years of data will be presented by 2023.
Unit Credit
In 2018, the mortality projection scale was updated to MP-2017. In 2017, the table was changed to the RP-2014 table using a mortality improvement scale MP-2016. Previously,1994 GAR projected to 2002 was used.
Normal retirement age - the earlier of (a) age 65 or (b) the "rule of 90" where the participant's age and years of service added together equal 90 or greater
Rolling level amortization over a declining period
Fair value with smoothing
Earned benefits frozen in 2008In 2017, the rate was changed to 6.5%. Previously, 7.0%, net of pension plan investment expense, including inflation was used.
9 years (2018), 10 years(2017), 11 years(2016), 12 years(2015), 13 years(2014)
In 2015, the inflation rate was changed to 2.75%. Previously, 2% was used.
District Special Project Retirement Income Plan
Schedule of Contributions (Unaudited)
($ in thousands)
District Special Project Retirement Income Plan
Methods and assumptions used to determine contributions:
Actuarially determined contributions are determined as of January 1 of the year in which the contributions are made.
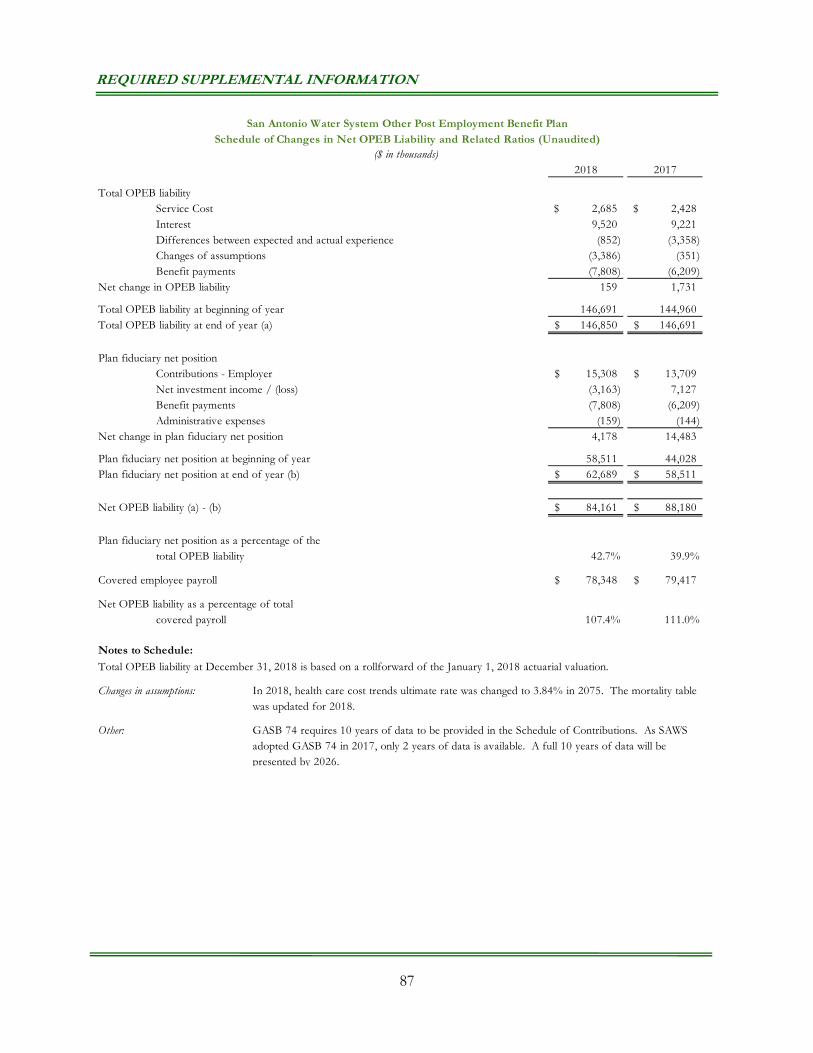
REQUIRED SUPPLEMENTAL INFORMATION
87
2018 2017
Total OPEB liabilityService Cost 2,685$ 2,428$ Interest 9,520 9,221 Differences between expected and actual experience (852) (3,358) Changes of assumptions (3,386) (351) Benefit payments (7,808) (6,209)
Net change in OPEB liability 159 1,731
Total OPEB liability at beginning of year 146,691 144,960 Total OPEB liability at end of year (a) 146,850$ 146,691$
Plan fiduciary net positionContributions - Employer 15,308$ 13,709$ Net investment income / (loss) (3,163) 7,127 Benefit payments (7,808) (6,209) Administrative expenses (159) (144)
Net change in plan fiduciary net position 4,178 14,483
Plan fiduciary net position at beginning of year 58,511 44,028 Plan fiduciary net position at end of year (b) 62,689$ 58,511$
Net OPEB liability (a) - (b) 84,161$ 88,180$
Plan fiduciary net position as a percentage of thetotal OPEB liability 42.7% 39.9%
Covered employee payroll 78,348$ 79,417$
Net OPEB liability as a percentage of totalcovered payroll 107.4% 111.0%
Notes to Schedule:
Total OPEB liability at December 31, 2018 is based on a rollforward of the January 1, 2018 actuarial valuation.
Changes in assumptions:
San Antonio Water System Other Post Employment Benefit PlanSchedule of Changes in Net OPEB Liability and Related Ratios (Unaudited)
($ in thousands)
GASB 74 requires 10 years of data to be provided in the Schedule of Contributions. As SAWS adopted GASB 74 in 2017, only 2 years of data is available. A full 10 years of data will be presented by 2026.
Other:
In 2018, health care cost trends ultimate rate was changed to 3.84% in 2075. The mortality table was updated for 2018.
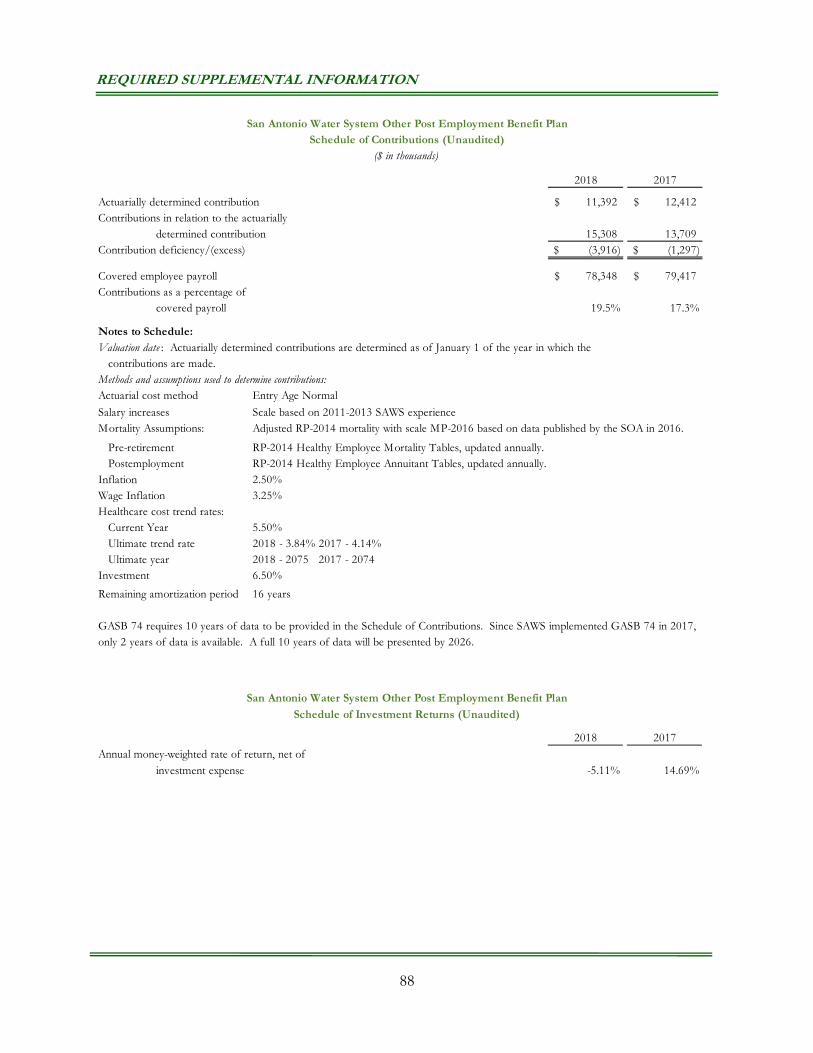
REQUIRED SUPPLEMENTAL INFORMATION
88
2018 2017
Actuarially determined contribution 11,392$ 12,412$ Contributions in relation to the actuarially
determined contribution 15,308 13,709 Contribution deficiency/(excess) (3,916)$ (1,297)$
Covered employee payroll 78,348$ 79,417$ Contributions as a percentage of
covered payroll 19.5% 17.3%
Notes to Schedule:Valuation date : Actuarially determined contributions are determined as of January 1 of the year in which the contributions are made.Methods and assumptions used to determine contributions:Actuarial cost method
Salary increasesMortality Assumptions:
Pre-retirement RP-2014 Healthy Employee Mortality Tables, updated annually. Postemployment RP-2014 Healthy Employee Annuitant Tables, updated annually.Inflation 2.50%Wage Inflation 3.25%Healthcare cost trend rates: Current Year 5.50% Ultimate trend rate 2018 - 3.84% 2017 - 4.14% Ultimate year 2018 - 2075 2017 - 2074Investment 6.50%
Remaining amortization period 16 years
Schedule of Contributions (Unaudited)San Antonio Water System Other Post Employment Benefit Plan
Adjusted RP-2014 mortality with scale MP-2016 based on data published by the SOA in 2016.
GASB 74 requires 10 years of data to be provided in the Schedule of Contributions. Since SAWS implemented GASB 74 in 2017, only 2 years of data is available. A full 10 years of data will be presented by 2026.
($ in thousands)
Entry Age Normal
Scale based on 2011-2013 SAWS experience
2018 2017Annual money-weighted rate of return, net of
investment expense -5.11% 14.69%
San Antonio Water System Other Post Employment Benefit PlanSchedule of Investment Returns (Unaudited)
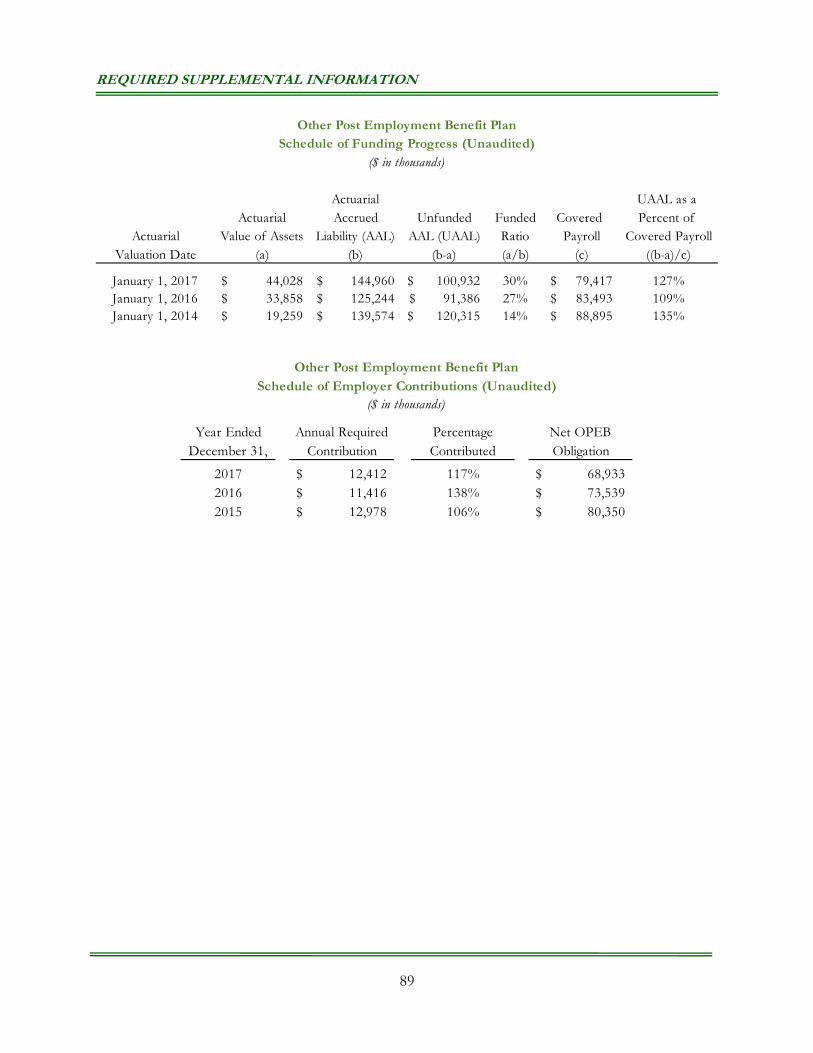
REQUIRED SUPPLEMENTAL INFORMATION
89
Actuarial UAAL as a Actuarial Accrued Unfunded Funded Covered Percent of
Actuarial Value of Assets Liability (AAL) AAL (UAAL) Ratio Payroll Covered PayrollValuation Date (a) (b) (b-a) (a/b) (c) ((b-a)/c)
January 1, 2017 44,028$ 144,960$ 100,932$ 30% 79,417$ 127%January 1, 2016 33,858$ 125,244$ 91,386$ 27% 83,493$ 109%January 1, 2014 19,259$ 139,574$ 120,315$ 14% 88,895$ 135%
Other Post Employment Benefit PlanSchedule of Funding Progress (Unaudited)
($ in thousands)
Year Ended December 31,
Annual Required Contribution
Percentage Contributed
Net OPEB Obligation
2017 12,412$ 117% 68,933$ 2016 11,416$ 138% 73,539$ 2015 12,978$ 106% 80,350$
Schedule of Employer Contributions (Unaudited)Other Post Employment Benefit Plan
($ in thousands)
Comprehensive Annual Financial Report
SUPPLEMENTAL SCHEDULES
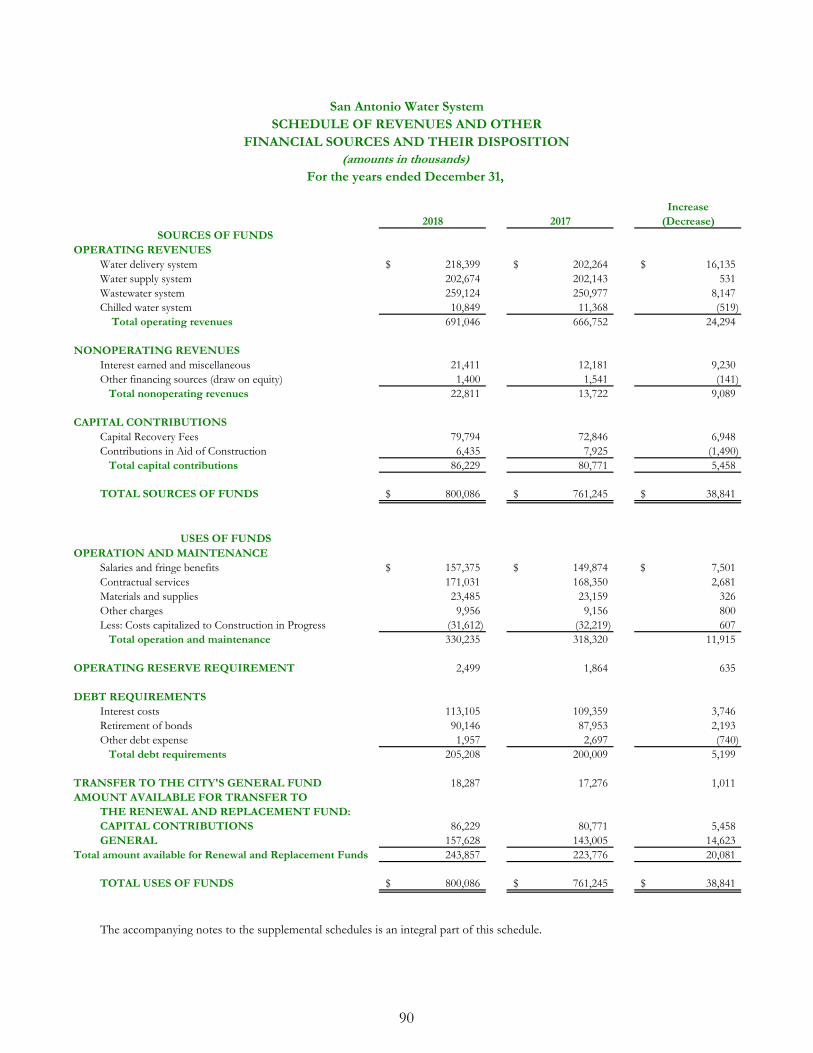
Increase2018 2017 (Decrease)
OPERATING REVENUESWater delivery system 218,399$ 202,264$ 16,135$ Water supply system 202,674 202,143 531 Wastewater system 259,124 250,977 8,147 Chilled water system 10,849 11,368 (519) Total operating revenues 691,046 666,752 24,294
NONOPERATING REVENUESInterest earned and miscellaneous 21,411 12,181 9,230 Other financing sources (draw on equity) 1,400 1,541 (141) Total nonoperating revenues 22,811 13,722 9,089
CAPITAL CONTRIBUTIONSCapital Recovery Fees 79,794 72,846 6,948 Contributions in Aid of Construction 6,435 7,925 (1,490) Total capital contributions 86,229 80,771 5,458
TOTAL SOURCES OF FUNDS 800,086$ 761,245$ 38,841$
OPERATION AND MAINTENANCESalaries and fringe benefits 157,375$ 149,874$ 7,501$ Contractual services 171,031 168,350 2,681 Materials and supplies 23,485 23,159 326 Other charges 9,956 9,156 800 Less: Costs capitalized to Construction in Progress (31,612) (32,219) 607 Total operation and maintenance 330,235 318,320 11,915
OPERATING RESERVE REQUIREMENT 2,499 1,864 635
DEBT REQUIREMENTSInterest costs 113,105 109,359 3,746 Retirement of bonds 90,146 87,953 2,193 Other debt expense 1,957 2,697 (740) Total debt requirements 205,208 200,009 5,199
TRANSFER TO THE CITY'S GENERAL FUND 18,287 17,276 1,011 AMOUNT AVAILABLE FOR TRANSFER TO
THE RENEWAL AND REPLACEMENT FUND:CAPITAL CONTRIBUTIONS 86,229 80,771 5,458 GENERAL 157,628 143,005 14,623
Total amount available for Renewal and Replacement Funds 243,857 223,776 20,081
TOTAL USES OF FUNDS 800,086$ 761,245$ 38,841$
The accompanying notes to the supplemental schedules is an integral part of this schedule.
SOURCES OF FUNDS
USES OF FUNDS
(amounts in thousands)For the years ended December 31,
San Antonio Water System
FINANCIAL SOURCES AND THEIR DISPOSITIONSCHEDULE OF REVENUES AND OTHER
90
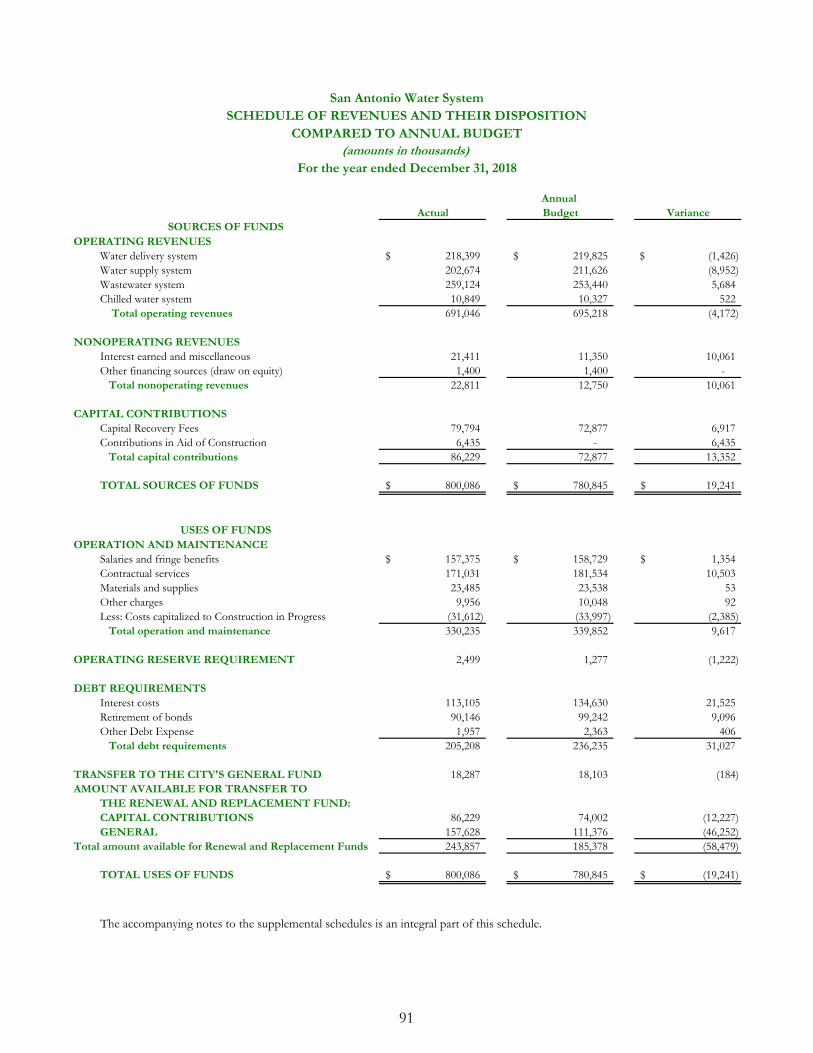
Annual Actual Budget Variance
OPERATING REVENUESWater delivery system 218,399$ 219,825$ (1,426)$ Water supply system 202,674 211,626 (8,952) Wastewater system 259,124 253,440 5,684 Chilled water system 10,849 10,327 522 Total operating revenues 691,046 695,218 (4,172)
NONOPERATING REVENUESInterest earned and miscellaneous 21,411 11,350 10,061 Other financing sources (draw on equity) 1,400 1,400 - Total nonoperating revenues 22,811 12,750 10,061
CAPITAL CONTRIBUTIONSCapital Recovery Fees 79,794 72,877 6,917 Contributions in Aid of Construction 6,435 - 6,435 Total capital contributions 86,229 72,877 13,352
TOTAL SOURCES OF FUNDS 800,086$ 780,845$ 19,241$
OPERATION AND MAINTENANCESalaries and fringe benefits 157,375$ 158,729$ 1,354$ Contractual services 171,031 181,534 10,503 Materials and supplies 23,485 23,538 53 Other charges 9,956 10,048 92 Less: Costs capitalized to Construction in Progress (31,612) (33,997) (2,385) Total operation and maintenance 330,235 339,852 9,617
OPERATING RESERVE REQUIREMENT 2,499 1,277 (1,222)
DEBT REQUIREMENTSInterest costs 113,105 134,630 21,525 Retirement of bonds 90,146 99,242 9,096 Other Debt Expense 1,957 2,363 406 Total debt requirements 205,208 236,235 31,027
TRANSFER TO THE CITY'S GENERAL FUND 18,287 18,103 (184) AMOUNT AVAILABLE FOR TRANSFER TO
THE RENEWAL AND REPLACEMENT FUND:CAPITAL CONTRIBUTIONS 86,229 74,002 (12,227) GENERAL 157,628 111,376 (46,252)
Total amount available for Renewal and Replacement Funds 243,857 185,378 (58,479)
TOTAL USES OF FUNDS 800,086$ 780,845$ (19,241)$
The accompanying notes to the supplemental schedules is an integral part of this schedule.
SOURCES OF FUNDS
USES OF FUNDS
San Antonio Water System
COMPARED TO ANNUAL BUDGETSCHEDULE OF REVENUES AND THEIR DISPOSITION
For the year ended December 31, 2018(amounts in thousands)
91
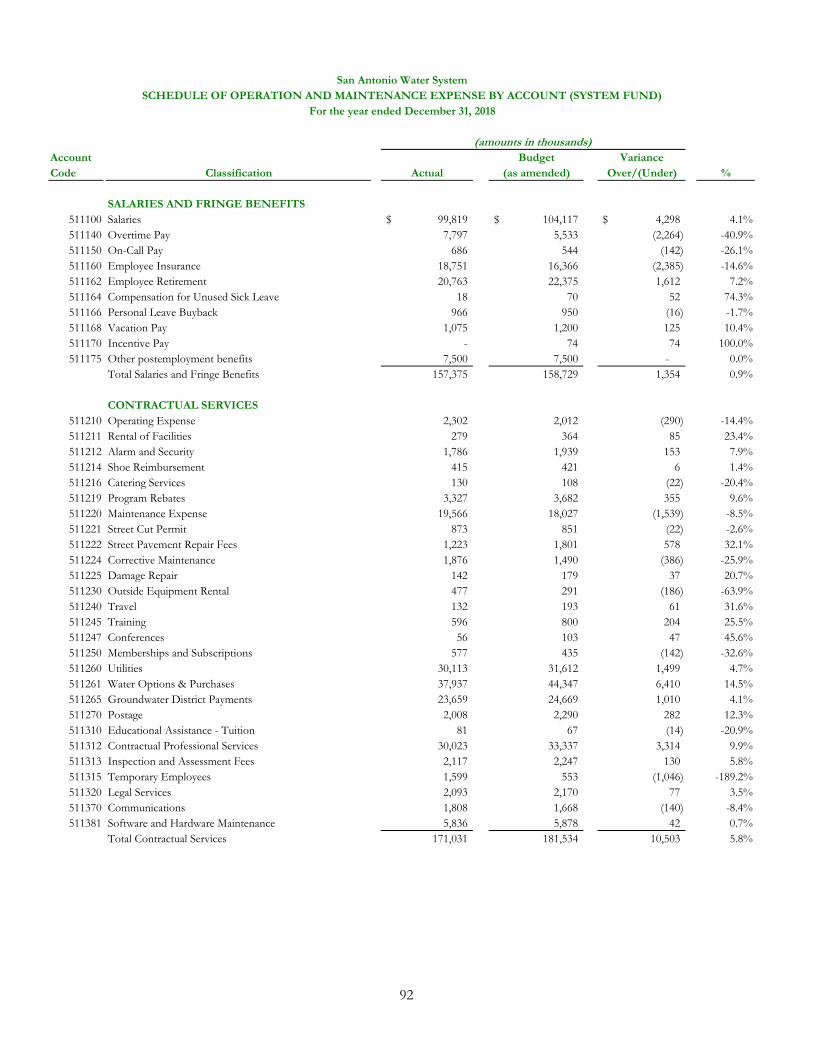
(amounts in thousands)Account Budget VarianceCode Classification Actual (as amended) Over/(Under) %
SALARIES AND FRINGE BENEFITS511100 Salaries 99,819$ 104,117$ 4,298$ 4.1%511140 Overtime Pay 7,797 5,533 (2,264) -40.9%511150 On-Call Pay 686 544 (142) -26.1%511160 Employee Insurance 18,751 16,366 (2,385) -14.6%511162 Employee Retirement 20,763 22,375 1,612 7.2%511164 Compensation for Unused Sick Leave 18 70 52 74.3%511166 Personal Leave Buyback 966 950 (16) -1.7%511168 Vacation Pay 1,075 1,200 125 10.4%511170 Incentive Pay - 74 74 100.0%511175 Other postemployment benefits 7,500 7,500 - 0.0%
Total Salaries and Fringe Benefits 157,375 158,729 1,354 0.9%
CONTRACTUAL SERVICES511210 Operating Expense 2,302 2,012 (290) -14.4%511211 Rental of Facilities 279 364 85 23.4%511212 Alarm and Security 1,786 1,939 153 7.9%511214 Shoe Reimbursement 415 421 6 1.4%511216 Catering Services 130 108 (22) -20.4%511219 Program Rebates 3,327 3,682 355 9.6%511220 Maintenance Expense 19,566 18,027 (1,539) -8.5%511221 Street Cut Permit 873 851 (22) -2.6%511222 Street Pavement Repair Fees 1,223 1,801 578 32.1%511224 Corrective Maintenance 1,876 1,490 (386) -25.9%511225 Damage Repair 142 179 37 20.7%511230 Outside Equipment Rental 477 291 (186) -63.9%511240 Travel 132 193 61 31.6%511245 Training 596 800 204 25.5%511247 Conferences 56 103 47 45.6%511250 Memberships and Subscriptions 577 435 (142) -32.6%511260 Utilities 30,113 31,612 1,499 4.7%511261 Water Options & Purchases 37,937 44,347 6,410 14.5%511265 Groundwater District Payments 23,659 24,669 1,010 4.1%511270 Postage 2,008 2,290 282 12.3%511310 Educational Assistance - Tuition 81 67 (14) -20.9%511312 Contractual Professional Services 30,023 33,337 3,314 9.9%511313 Inspection and Assessment Fees 2,117 2,247 130 5.8%511315 Temporary Employees 1,599 553 (1,046) -189.2%511320 Legal Services 2,093 2,170 77 3.5%511370 Communications 1,808 1,668 (140) -8.4%511381 Software and Hardware Maintenance 5,836 5,878 42 0.7%
Total Contractual Services 171,031 181,534 10,503 5.8%
San Antonio Water SystemSCHEDULE OF OPERATION AND MAINTENANCE EXPENSE BY ACCOUNT (SYSTEM FUND)
For the year ended December 31, 2018
92
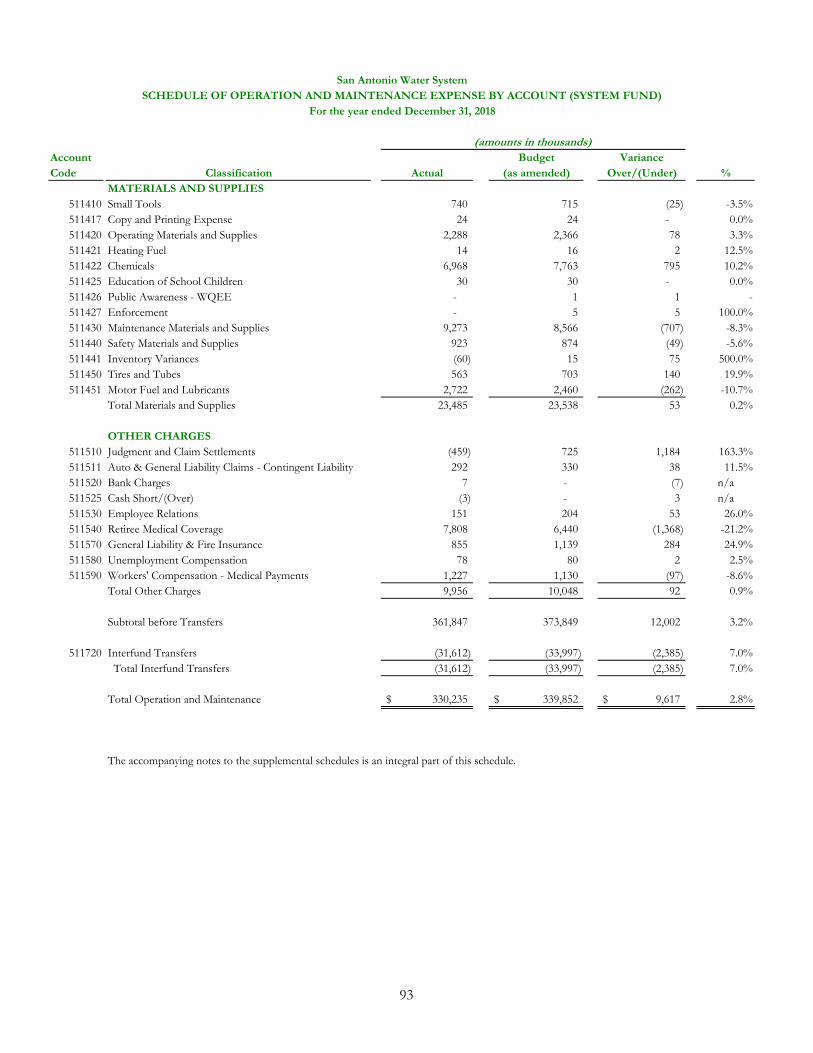
(amounts in thousands)Account Budget VarianceCode Classification Actual (as amended) Over/(Under) %
San Antonio Water SystemSCHEDULE OF OPERATION AND MAINTENANCE EXPENSE BY ACCOUNT (SYSTEM FUND)
For the year ended December 31, 2018
MATERIALS AND SUPPLIES511410 Small Tools 740 715 (25) -3.5%511417 Copy and Printing Expense 24 24 - 0.0%511420 Operating Materials and Supplies 2,288 2,366 78 3.3%511421 Heating Fuel 14 16 2 12.5%511422 Chemicals 6,968 7,763 795 10.2%511425 Education of School Children 30 30 - 0.0%511426 Public Awareness - WQEE - 1 1 -511427 Enforcement - 5 5 100.0%511430 Maintenance Materials and Supplies 9,273 8,566 (707) -8.3%511440 Safety Materials and Supplies 923 874 (49) -5.6%511441 Inventory Variances (60) 15 75 500.0%511450 Tires and Tubes 563 703 140 19.9%511451 Motor Fuel and Lubricants 2,722 2,460 (262) -10.7%
Total Materials and Supplies 23,485 23,538 53 0.2%
OTHER CHARGES511510 Judgment and Claim Settlements (459) 725 1,184 163.3%511511 Auto & General Liability Claims - Contingent Liability 292 330 38 11.5%511520 Bank Charges 7 - (7) n/a511525 Cash Short/(Over) (3) - 3 n/a511530 Employee Relations 151 204 53 26.0%511540 Retiree Medical Coverage 7,808 6,440 (1,368) -21.2%511570 General Liability & Fire Insurance 855 1,139 284 24.9%511580 Unemployment Compensation 78 80 2 2.5%511590 Workers' Compensation - Medical Payments 1,227 1,130 (97) -8.6%
Total Other Charges 9,956 10,048 92 0.9%
Subtotal before Transfers 361,847 373,849 12,002 3.2%
511720 Interfund Transfers (31,612) (33,997) (2,385) 7.0% Total Interfund Transfers (31,612) (33,997) (2,385) 7.0%
Total Operation and Maintenance 330,235$ 339,852$ 9,617$ 2.8%
The accompanying notes to the supplemental schedules is an integral part of this schedule.
93
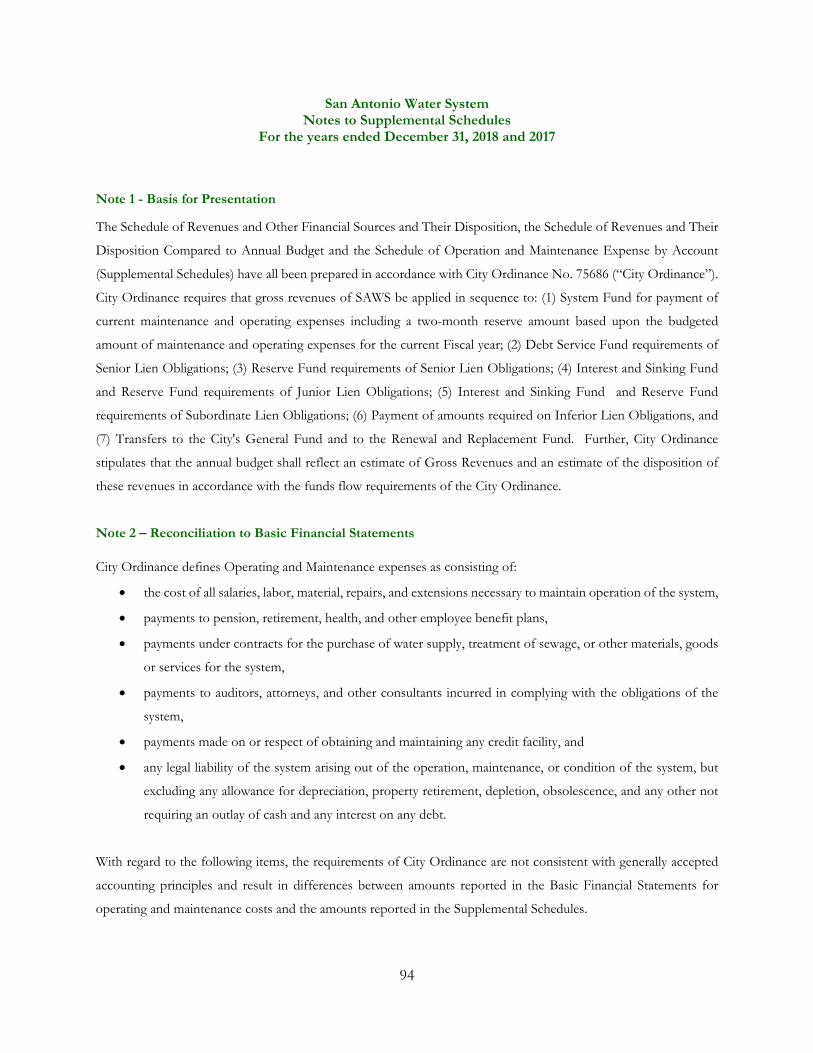
San Antonio Water System Notes to Supplemental Schedules
For the years ended December 31, 2018 and 2017
94
Note 1 - Basis for Presentation The Schedule of Revenues and Other Financial Sources and Their Disposition, the Schedule of Revenues and Their
Disposition Compared to Annual Budget and the Schedule of Operation and Maintenance Expense by Account
(Supplemental Schedules) have all been prepared in accordance with City Ordinance No. 75686 (“City Ordinance”).
City Ordinance requires that gross revenues of SAWS be applied in sequence to: (1) System Fund for payment of
current maintenance and operating expenses including a two-month reserve amount based upon the budgeted
amount of maintenance and operating expenses for the current Fiscal year; (2) Debt Service Fund requirements of
Senior Lien Obligations; (3) Reserve Fund requirements of Senior Lien Obligations; (4) Interest and Sinking Fund
and Reserve Fund requirements of Junior Lien Obligations; (5) Interest and Sinking Fund and Reserve Fund
requirements of Subordinate Lien Obligations; (6) Payment of amounts required on Inferior Lien Obligations, and
(7) Transfers to the City's General Fund and to the Renewal and Replacement Fund. Further, City Ordinance
stipulates that the annual budget shall reflect an estimate of Gross Revenues and an estimate of the disposition of
these revenues in accordance with the funds flow requirements of the City Ordinance.
Note 2 – Reconciliation to Basic Financial Statements
City Ordinance defines Operating and Maintenance expenses as consisting of:
the cost of all salaries, labor, material, repairs, and extensions necessary to maintain operation of the system,
payments to pension, retirement, health, and other employee benefit plans,
payments under contracts for the purchase of water supply, treatment of sewage, or other materials, goods
or services for the system,
payments to auditors, attorneys, and other consultants incurred in complying with the obligations of the
system,
payments made on or respect of obtaining and maintaining any credit facility, and
any legal liability of the system arising out of the operation, maintenance, or condition of the system, but
excluding any allowance for depreciation, property retirement, depletion, obsolescence, and any other not
requiring an outlay of cash and any interest on any debt.
With regard to the following items, the requirements of City Ordinance are not consistent with generally accepted
accounting principles and result in differences between amounts reported in the Basic Financial Statements for
operating and maintenance costs and the amounts reported in the Supplemental Schedules.
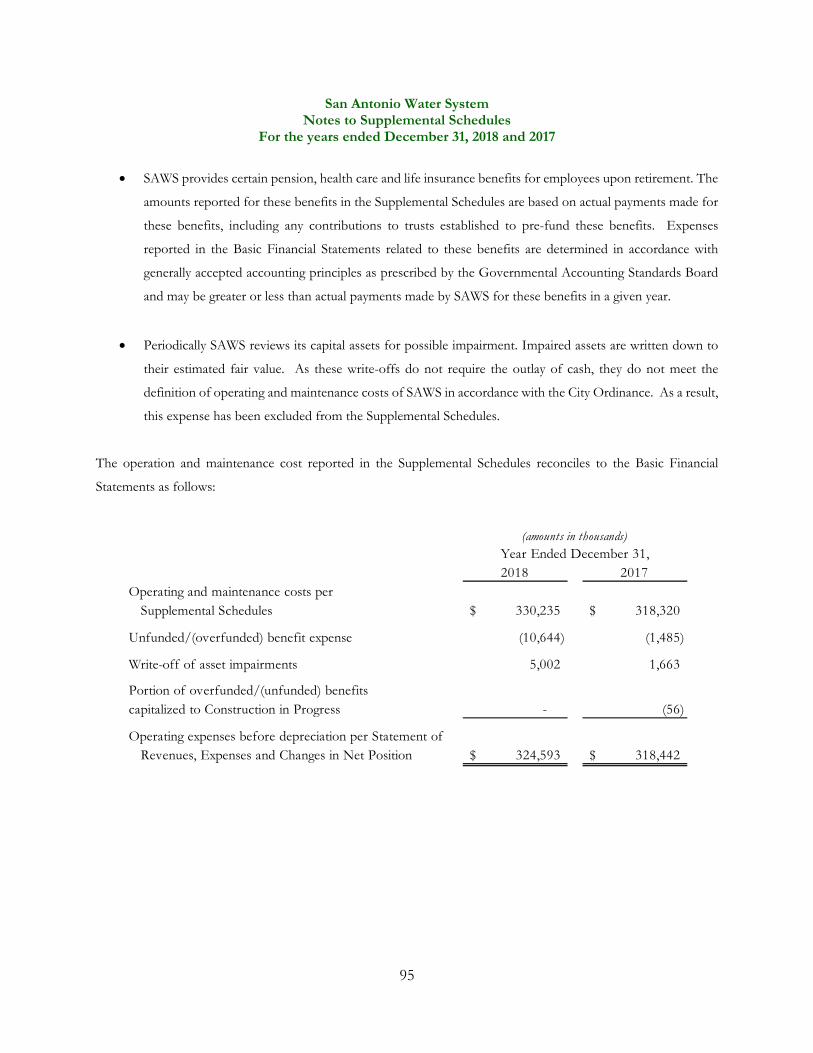
San Antonio Water System Notes to Supplemental Schedules
For the years ended December 31, 2018 and 2017
95
SAWS provides certain pension, health care and life insurance benefits for employees upon retirement. The
amounts reported for these benefits in the Supplemental Schedules are based on actual payments made for
these benefits, including any contributions to trusts established to pre-fund these benefits. Expenses
reported in the Basic Financial Statements related to these benefits are determined in accordance with
generally accepted accounting principles as prescribed by the Governmental Accounting Standards Board
and may be greater or less than actual payments made by SAWS for these benefits in a given year.
Periodically SAWS reviews its capital assets for possible impairment. Impaired assets are written down to
their estimated fair value. As these write-offs do not require the outlay of cash, they do not meet the
definition of operating and maintenance costs of SAWS in accordance with the City Ordinance. As a result,
this expense has been excluded from the Supplemental Schedules.
The operation and maintenance cost reported in the Supplemental Schedules reconciles to the Basic Financial
Statements as follows:
(amounts in thousands)Year Ended December 31,2018 2017
Operating and maintenance costs per Supplemental Schedules 330,235$ 318,320$
Unfunded/(overfunded) benefit expense (10,644) (1,485)
Write-off of asset impairments 5,002 1,663
Portion of overfunded/(unfunded) benefits capitalized to Construction in Progress - (56)
Operating expenses before depreciation per Statement of Revenues, Expenses and Changes in Net Position 324,593$ 318,442$
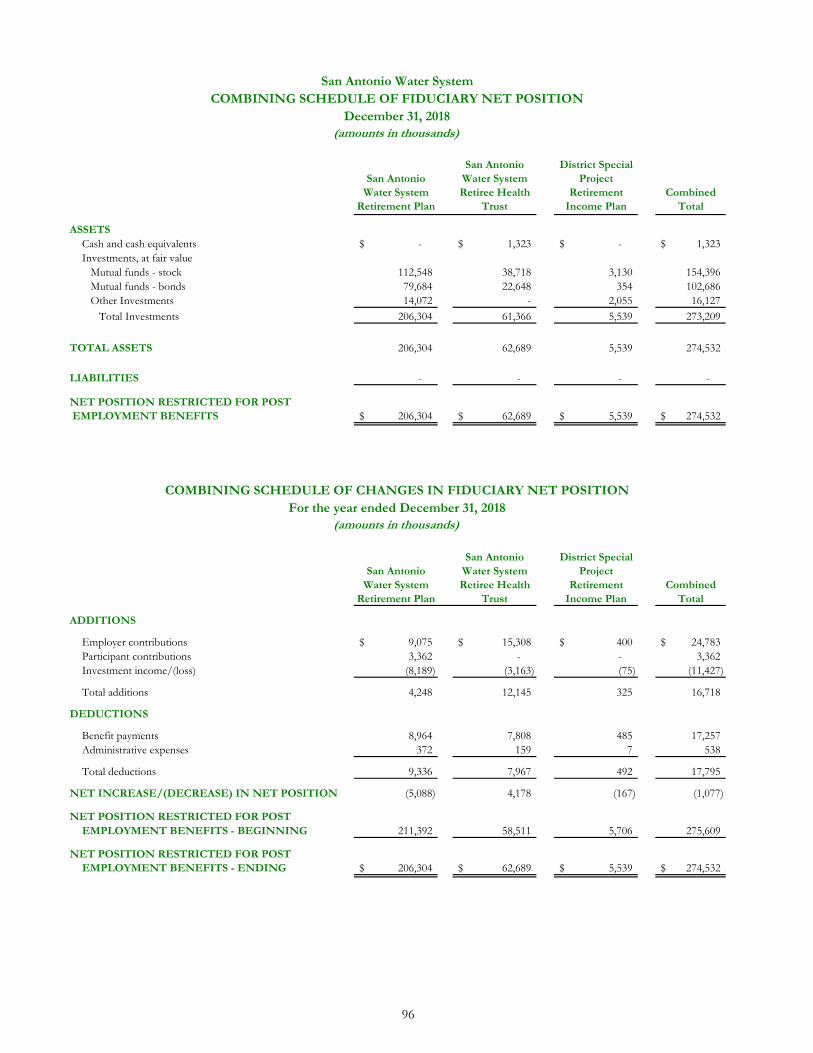
San Antonio Water System
Retirement Plan
San Antonio Water System Retiree Health
Trust
District Special Project
Retirement Income Plan
Combined Total
ASSETSCash and cash equivalents -$ 1,323$ -$ 1,323$ Investments, at fair value Mutual funds - stock 112,548 38,718 3,130 154,396 Mutual funds - bonds 79,684 22,648 354 102,686 Other Investments 14,072 - 2,055 16,127 Total Investments 206,304 61,366 5,539 273,209
TOTAL ASSETS 206,304 62,689 5,539 274,532
LIABILITIES - - - -
NET POSITION RESTRICTED FOR POST EMPLOYMENT BENEFITS 206,304$ 62,689$ 5,539$ 274,532$
San Antonio Water System
Retirement Plan
San Antonio Water System Retiree Health
Trust
District Special Project
Retirement Income Plan
Combined Total
ADDITIONS
Employer contributions 9,075$ 15,308$ 400$ 24,783$ Participant contributions 3,362 - - 3,362 Investment income/(loss) (8,189) (3,163) (75) (11,427)
Total additions 4,248 12,145 325 16,718
DEDUCTIONS
Benefit payments 8,964 7,808 485 17,257 Administrative expenses 372 159 7 538
Total deductions 9,336 7,967 492 17,795
NET INCREASE/(DECREASE) IN NET POSITION (5,088) 4,178 (167) (1,077)
NET POSITION RESTRICTED FOR POSTEMPLOYMENT BENEFITS - BEGINNING 211,392 58,511 5,706 275,609
NET POSITION RESTRICTED FOR POSTEMPLOYMENT BENEFITS - ENDING 206,304$ 62,689$ 5,539$ 274,532$
(amounts in thousands)
San Antonio Water SystemCOMBINING SCHEDULE OF FIDUCIARY NET POSITION
COMBINING SCHEDULE OF CHANGES IN FIDUCIARY NET POSITIONFor the year ended December 31, 2018
December 31, 2018(amounts in thousands)
96
Comprehensive Annual Financial Report
OTHER INFORMATION

This Page Intentionally Left Blank

Comprehensive Annual Financial Report
STATISTICAL SECTION
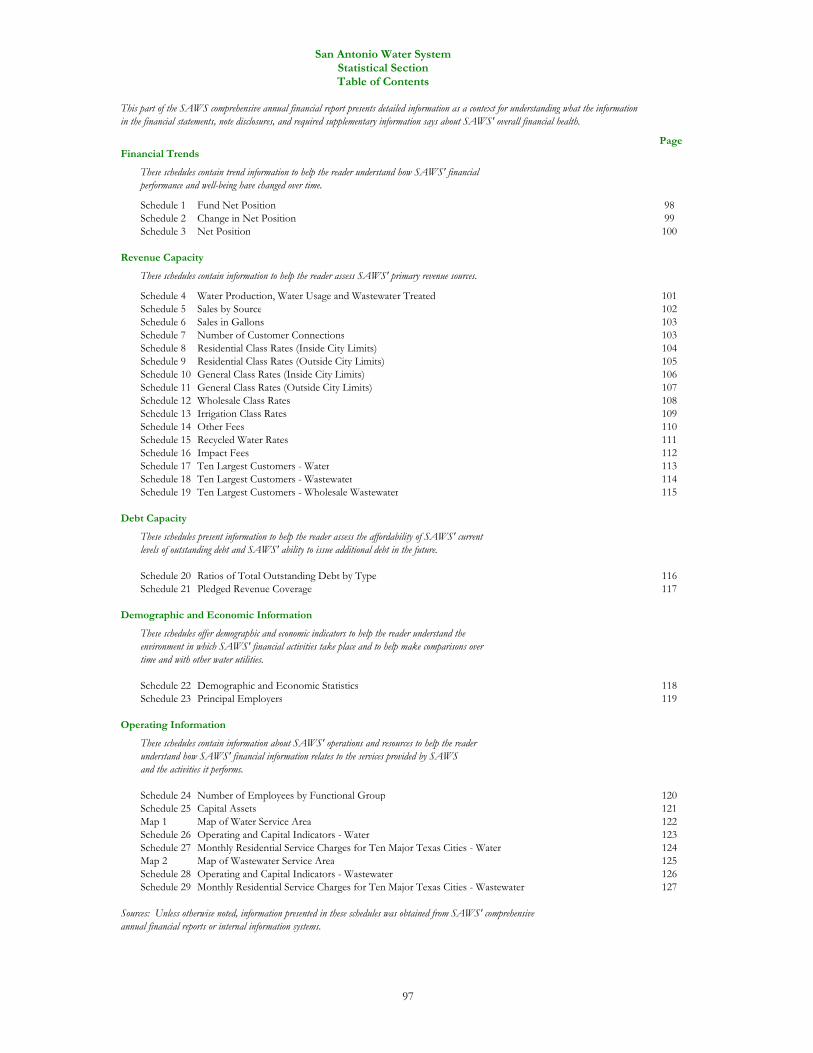
San Antonio Water SystemStatistical SectionTable of Contents
This part of the SAWS comprehensive annual financial report presents detailed information as a context for understanding what the informationin the financial statements, note disclosures, and required supplementary information says about SAWS' overall financial health.
PageFinancial Trends
These schedules contain trend information to help the reader understand how SAWS' financialperformance and well-being have changed over time.
Schedule 1 Fund Net Position 98Schedule 2 Change in Net Position 99Schedule 3 Net Position 100
Revenue Capacity
These schedules contain information to help the reader assess SAWS' primary revenue sources.
Schedule 4 Water Production, Water Usage and Wastewater Treated 101Schedule 5 Sales by Source 102Schedule 6 Sales in Gallons 103Schedule 7 Number of Customer Connections 103Schedule 8 Residential Class Rates (Inside City Limits) 104Schedule 9 Residential Class Rates (Outside City Limits) 105Schedule 10 General Class Rates (Inside City Limits) 106Schedule 11 General Class Rates (Outside City Limits) 107Schedule 12 Wholesale Class Rates 108Schedule 13 Irrigation Class Rates 109Schedule 14 Other Fees 110Schedule 15 Recycled Water Rates 111Schedule 16 Impact Fees 112Schedule 17 Ten Largest Customers - Water 113Schedule 18 Ten Largest Customers - Wastewater 114Schedule 19 Ten Largest Customers - Wholesale Wastewater 115
Debt Capacity
These schedules present information to help the reader assess the affordability of SAWS' currentlevels of outstanding debt and SAWS' ability to issue additional debt in the future.
Schedule 20 Ratios of Total Outstanding Debt by Type 116Schedule 21 Pledged Revenue Coverage 117
Demographic and Economic Information
These schedules offer demographic and economic indicators to help the reader understand the environment in which SAWS' financial activities take place and to help make comparisons overtime and with other water utilities.
Schedule 22 Demographic and Economic Statistics 118Schedule 23 Principal Employers 119
Operating Information
These schedules contain information about SAWS' operations and resources to help the readerunderstand how SAWS' financial information relates to the services provided by SAWSand the activities it performs.
Schedule 24 Number of Employees by Functional Group 120Schedule 25 Capital Assets 121Map 1 Map of Water Service Area 122Schedule 26 Operating and Capital Indicators - Water 123Schedule 27 Monthly Residential Service Charges for Ten Major Texas Cities - Water 124Map 2 Map of Wastewater Service Area 125Schedule 28 Operating and Capital Indicators - Wastewater 126Schedule 29 Monthly Residential Service Charges for Ten Major Texas Cities - Wastewater 127
Sources: Unless otherwise noted, information presented in these schedules was obtained from SAWS' comprehensive annual financial reports or internal information systems.
97
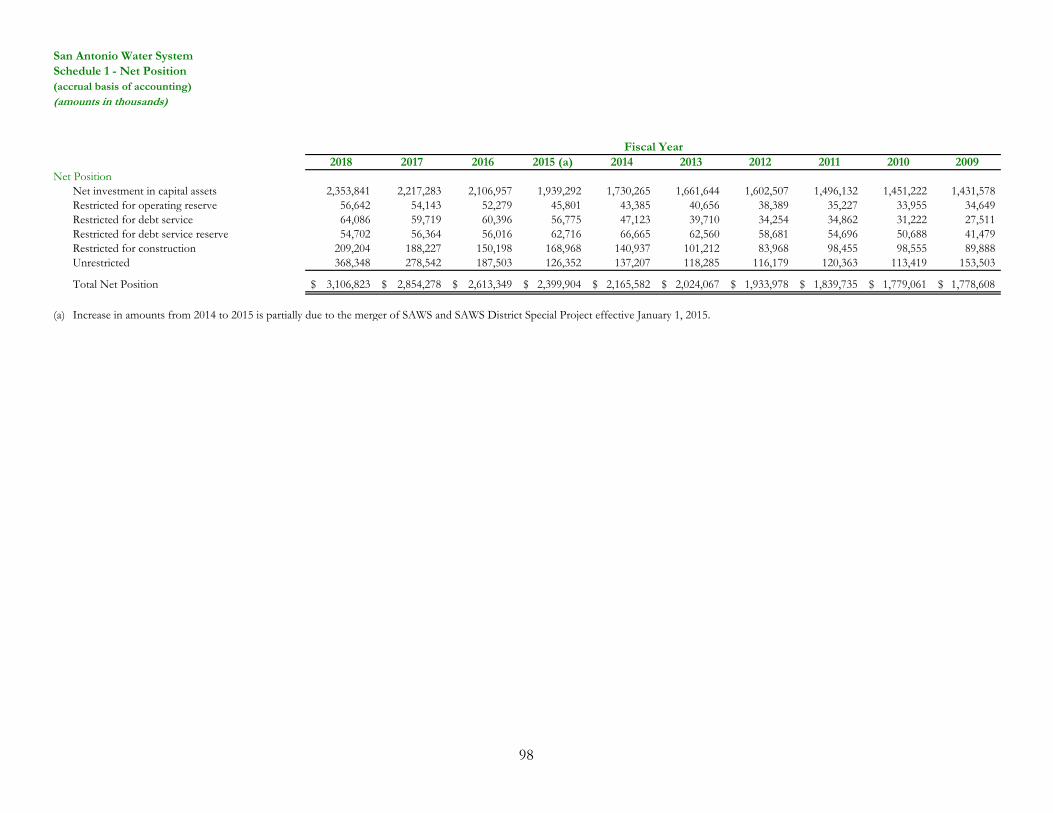
San Antonio Water SystemSchedule 1 - Net Position(accrual basis of accounting)(amounts in thousands)
2018 2017 2016 2015 (a) 2014 2013 2012 2011 2010 2009Net Position
Net investment in capital assets 2,353,841 2,217,283 2,106,957 1,939,292 1,730,265 1,661,644 1,602,507 1,496,132 1,451,222 1,431,578Restricted for operating reserve 56,642 54,143 52,279 45,801 43,385 40,656 38,389 35,227 33,955 34,649Restricted for debt service 64,086 59,719 60,396 56,775 47,123 39,710 34,254 34,862 31,222 27,511Restricted for debt service reserve 54,702 56,364 56,016 62,716 66,665 62,560 58,681 54,696 50,688 41,479Restricted for construction 209,204 188,227 150,198 168,968 140,937 101,212 83,968 98,455 98,555 89,888Unrestricted 368,348 278,542 187,503 126,352 137,207 118,285 116,179 120,363 113,419 153,503
Total Net Position 3,106,823$ 2,854,278$ 2,613,349$ 2,399,904$ 2,165,582$ 2,024,067$ 1,933,978$ 1,839,735$ 1,779,061$ 1,778,608$
(a) Increase in amounts from 2014 to 2015 is partially due to the merger of SAWS and SAWS District Special Project effective January 1, 2015.
Fiscal Year
98
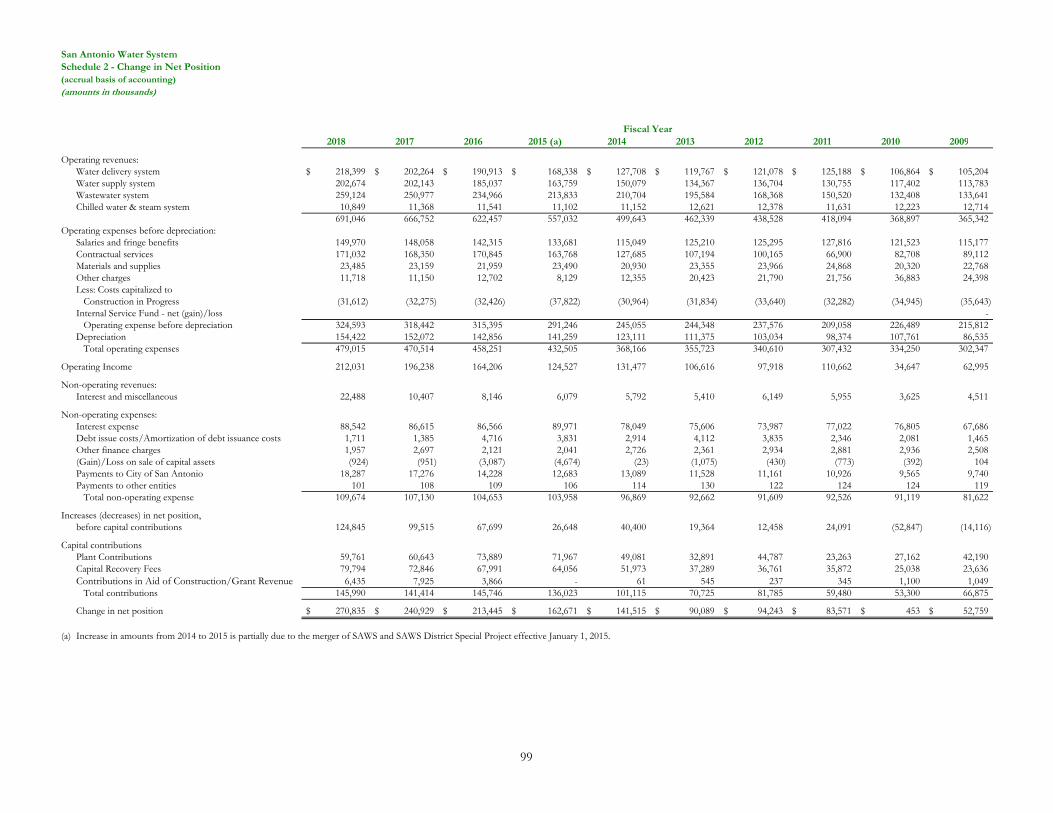
San Antonio Water SystemSchedule 2 - Change in Net Position(accrual basis of accounting)(amounts in thousands)
2018 2017 2016 2015 (a) 2014 2013 2012 2011 2010 2009
Operating revenues: Water delivery system 218,399$ 202,264$ 190,913$ 168,338$ 127,708$ 119,767$ 121,078$ 125,188$ 106,864$ 105,204$ Water supply system 202,674 202,143 185,037 163,759 150,079 134,367 136,704 130,755 117,402 113,783 Wastewater system 259,124 250,977 234,966 213,833 210,704 195,584 168,368 150,520 132,408 133,641 Chilled water & steam system 10,849 11,368 11,541 11,102 11,152 12,621 12,378 11,631 12,223 12,714
691,046 666,752 622,457 557,032 499,643 462,339 438,528 418,094 368,897 365,342 Operating expenses before depreciation:
Salaries and fringe benefits 149,970 148,058 142,315 133,681 115,049 125,210 125,295 127,816 121,523 115,177 Contractual services 171,032 168,350 170,845 163,768 127,685 107,194 100,165 66,900 82,708 89,112 Materials and supplies 23,485 23,159 21,959 23,490 20,930 23,355 23,966 24,868 20,320 22,768 Other charges 11,718 11,150 12,702 8,129 12,355 20,423 21,790 21,756 36,883 24,398 Less: Costs capitalized to Construction in Progress (31,612) (32,275) (32,426) (37,822) (30,964) (31,834) (33,640) (32,282) (34,945) (35,643) Internal Service Fund - net (gain)/loss - Operating expense before depreciation 324,593 318,442 315,395 291,246 245,055 244,348 237,576 209,058 226,489 215,812 Depreciation 154,422 152,072 142,856 141,259 123,111 111,375 103,034 98,374 107,761 86,535 Total operating expenses 479,015 470,514 458,251 432,505 368,166 355,723 340,610 307,432 334,250 302,347
Operating Income 212,031 196,238 164,206 124,527 131,477 106,616 97,918 110,662 34,647 62,995
Non-operating revenues: Interest and miscellaneous 22,488 10,407 8,146 6,079 5,792 5,410 6,149 5,955 3,625 4,511
Non-operating expenses:Interest expense 88,542 86,615 86,566 89,971 78,049 75,606 73,987 77,022 76,805 67,686 Debt issue costs/Amortization of debt issuance costs 1,711 1,385 4,716 3,831 2,914 4,112 3,835 2,346 2,081 1,465 Other finance charges 1,957 2,697 2,121 2,041 2,726 2,361 2,934 2,881 2,936 2,508 (Gain)/Loss on sale of capital assets (924) (951) (3,087) (4,674) (23) (1,075) (430) (773) (392) 104 Payments to City of San Antonio 18,287 17,276 14,228 12,683 13,089 11,528 11,161 10,926 9,565 9,740 Payments to other entities 101 108 109 106 114 130 122 124 124 119 Total non-operating expense 109,674 107,130 104,653 103,958 96,869 92,662 91,609 92,526 91,119 81,622
Increases (decreases) in net position, before capital contributions 124,845 99,515 67,699 26,648 40,400 19,364 12,458 24,091 (52,847) (14,116)
Capital contributionsPlant Contributions 59,761 60,643 73,889 71,967 49,081 32,891 44,787 23,263 27,162 42,190 Capital Recovery Fees 79,794 72,846 67,991 64,056 51,973 37,289 36,761 35,872 25,038 23,636 Contributions in Aid of Construction/Grant Revenue 6,435 7,925 3,866 - 61 545 237 345 1,100 1,049 Total contributions 145,990 141,414 145,746 136,023 101,115 70,725 81,785 59,480 53,300 66,875
Change in net position 270,835$ 240,929$ 213,445$ 162,671$ 141,515$ 90,089$ 94,243$ 83,571$ 453$ 52,759$
(a) Increase in amounts from 2014 to 2015 is partially due to the merger of SAWS and SAWS District Special Project effective January 1, 2015.
Fiscal Year
99
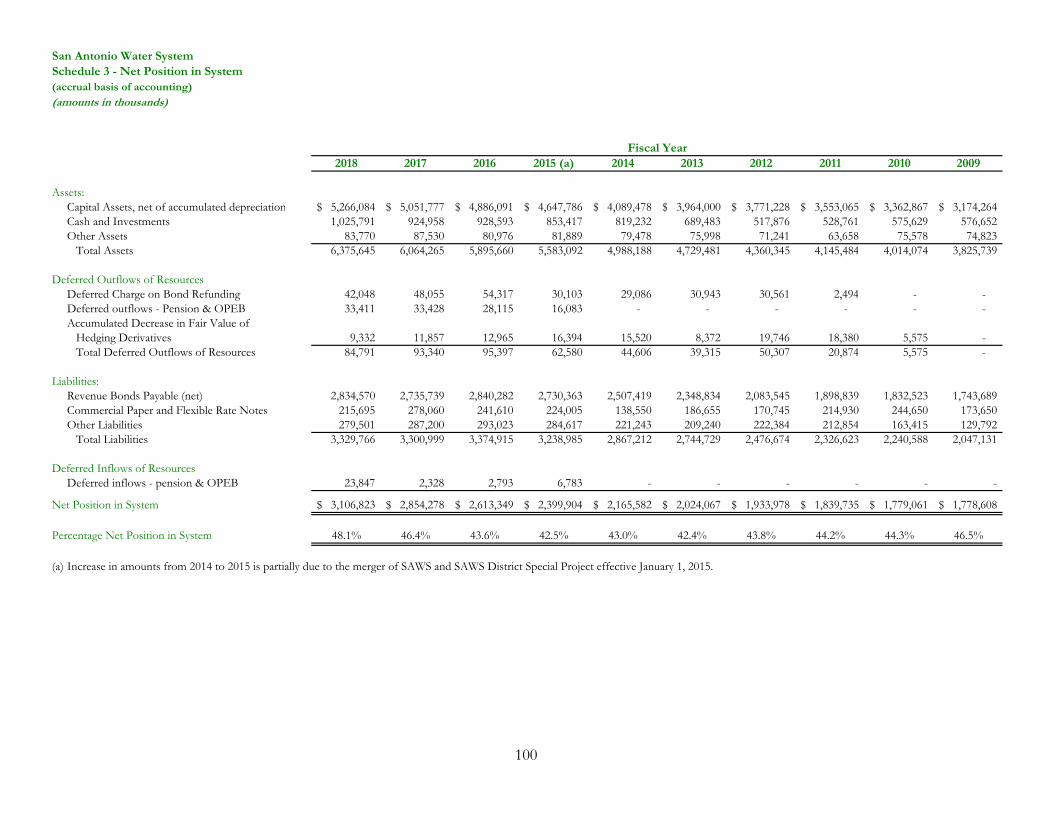
San Antonio Water SystemSchedule 3 - Net Position in System(accrual basis of accounting)(amounts in thousands)
2018 2017 2016 2015 (a) 2014 2013 2012 2011 2010 2009
Assets:Capital Assets, net of accumulated depreciation 5,266,084$ 5,051,777$ 4,886,091$ 4,647,786$ 4,089,478$ 3,964,000$ 3,771,228$ 3,553,065$ 3,362,867$ 3,174,264$ Cash and Investments 1,025,791 924,958 928,593 853,417 819,232 689,483 517,876 528,761 575,629 576,652 Other Assets 83,770 87,530 80,976 81,889 79,478 75,998 71,241 63,658 75,578 74,823 Total Assets 6,375,645 6,064,265 5,895,660 5,583,092 4,988,188 4,729,481 4,360,345 4,145,484 4,014,074 3,825,739
Deferred Outflows of ResourcesDeferred Charge on Bond Refunding 42,048 48,055 54,317 30,103 29,086 30,943 30,561 2,494 - - Deferred outflows - Pension & OPEB 33,411 33,428 28,115 16,083 - - - - - - Accumulated Decrease in Fair Value of Hedging Derivatives 9,332 11,857 12,965 16,394 15,520 8,372 19,746 18,380 5,575 - Total Deferred Outflows of Resources 84,791 93,340 95,397 62,580 44,606 39,315 50,307 20,874 5,575 -
Liabilities:Revenue Bonds Payable (net) 2,834,570 2,735,739 2,840,282 2,730,363 2,507,419 2,348,834 2,083,545 1,898,839 1,832,523 1,743,689 Commercial Paper and Flexible Rate Notes 215,695 278,060 241,610 224,005 138,550 186,655 170,745 214,930 244,650 173,650 Other Liabilities 279,501 287,200 293,023 284,617 221,243 209,240 222,384 212,854 163,415 129,792 Total Liabilities 3,329,766 3,300,999 3,374,915 3,238,985 2,867,212 2,744,729 2,476,674 2,326,623 2,240,588 2,047,131
Deferred Inflows of ResourcesDeferred inflows - pension & OPEB 23,847 2,328 2,793 6,783 - - - - - -
Net Position in System 3,106,823$ 2,854,278$ 2,613,349$ 2,399,904$ 2,165,582$ 2,024,067$ 1,933,978$ 1,839,735$ 1,779,061$ 1,778,608$
Percentage Net Position in System 48.1% 46.4% 43.6% 42.5% 43.0% 42.4% 43.8% 44.2% 44.3% 46.5%
(a) Increase in amounts from 2014 to 2015 is partially due to the merger of SAWS and SAWS District Special Project effective January 1, 2015.
Fiscal Year
100
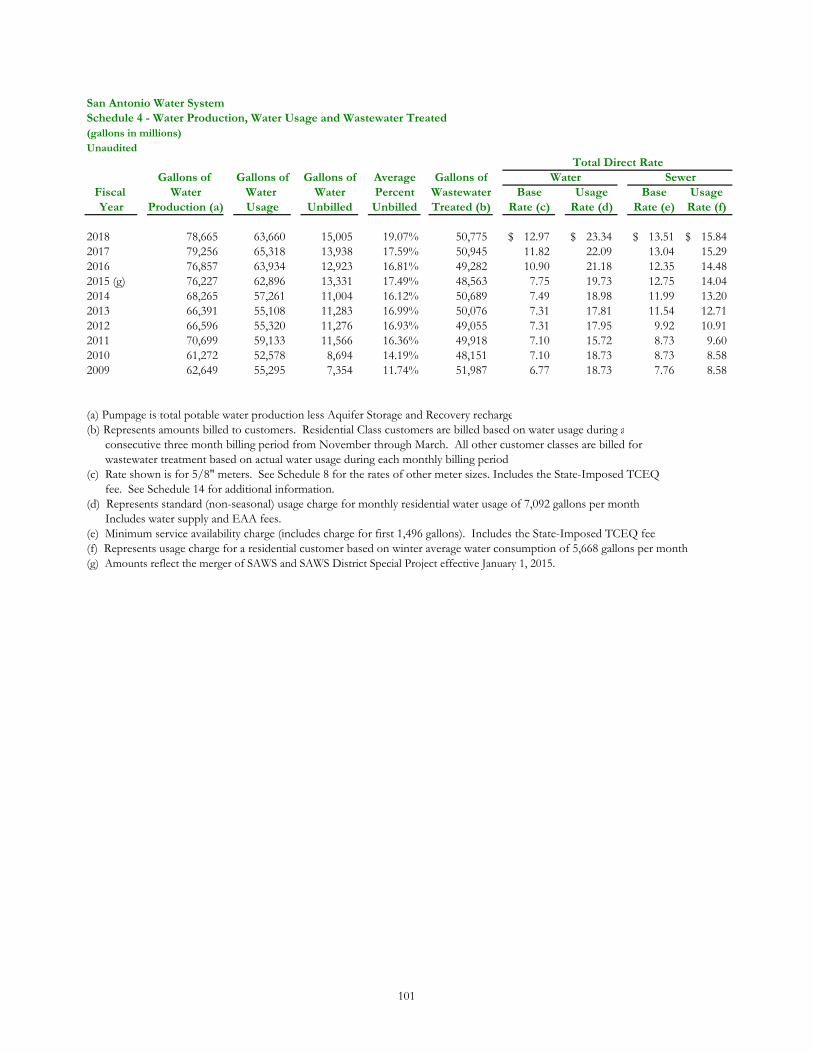
San Antonio Water SystemSchedule 4 - Water Production, Water Usage and Wastewater Treated(gallons in millions)Unaudited
Gallons of Gallons of Gallons of Average Gallons of WaterFiscal Water Water Water Percent Wastewater Base Usage Base UsageYear Production (a) Usage Unbilled Unbilled Treated (b) Rate (c) Rate (d) Rate (e) Rate (f)
2018 78,665 63,660 15,005 19.07% 50,775 12.97$ 23.34$ 13.51$ 15.84$ 2017 79,256 65,318 13,938 17.59% 50,945 11.82 22.09 13.04 15.29 2016 76,857 63,934 12,923 16.81% 49,282 10.90 21.18 12.35 14.48 2015 (g) 76,227 62,896 13,331 17.49% 48,563 7.75 19.73 12.75 14.042014 68,265 57,261 11,004 16.12% 50,689 7.49 18.98 11.99 13.202013 66,391 55,108 11,283 16.99% 50,076 7.31 17.81 11.54 12.712012 66,596 55,320 11,276 16.93% 49,055 7.31 17.95 9.92 10.912011 70,699 59,133 11,566 16.36% 49,918 7.10 15.72 8.73 9.602010 61,272 52,578 8,694 14.19% 48,151 7.10 18.73 8.73 8.582009 62,649 55,295 7,354 11.74% 51,987 6.77 18.73 7.76 8.58
(a) Pumpage is total potable water production less Aquifer Storage and Recovery recharge(b) Represents amounts billed to customers. Residential Class customers are billed based on water usage during a consecutive three month billing period from November through March. All other customer classes are billed for wastewater treatment based on actual water usage during each monthly billing period.(c) Rate shown is for 5/8" meters. See Schedule 8 for the rates of other meter sizes. Includes the State-Imposed TCEQ fee. See Schedule 14 for additional information.(d) Represents standard (non-seasonal) usage charge for monthly residential water usage of 7,092 gallons per month Includes water supply and EAA fees.(e) Minimum service availability charge (includes charge for first 1,496 gallons). Includes the State-Imposed TCEQ fee.(f) Represents usage charge for a residential customer based on winter average water consumption of 5,668 gallons per month(g) Amounts reflect the merger of SAWS and SAWS District Special Project effective January 1, 2015.
Total Direct RateSewer
101
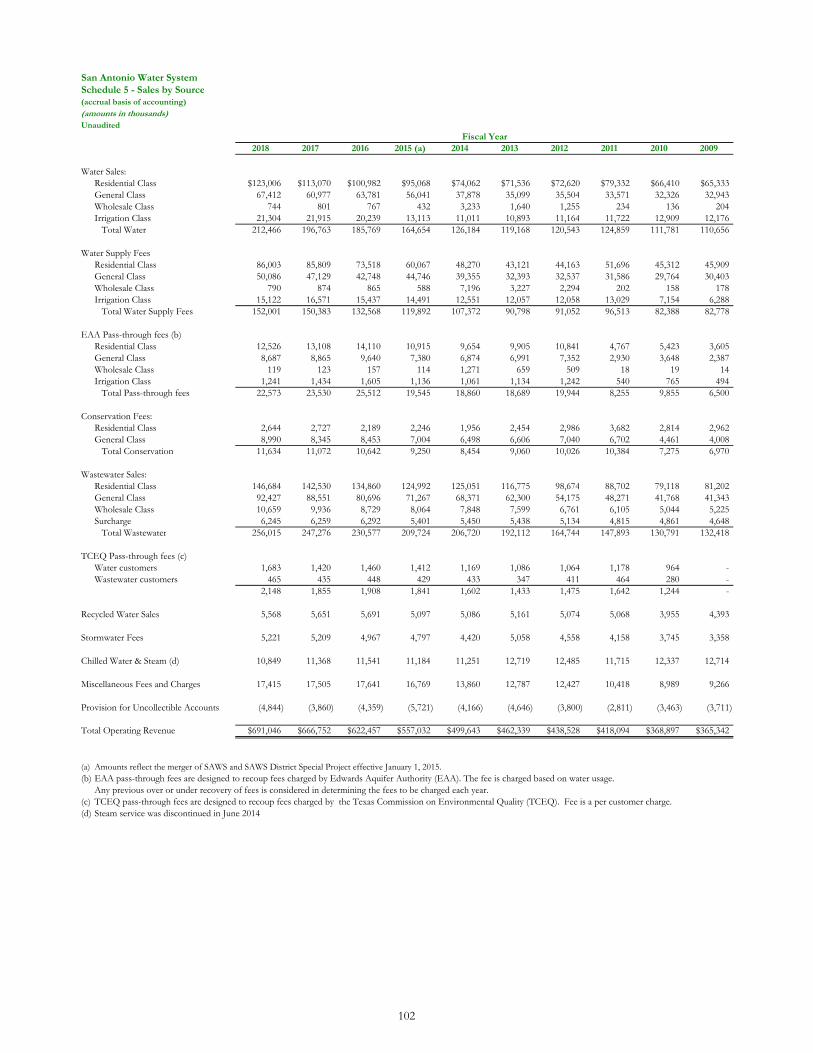
San Antonio Water SystemSchedule 5 - Sales by Source(accrual basis of accounting)(amounts in thousands)Unaudited
2018 2017 2016 2015 (a) 2014 2013 2012 2011 2010 2009
Water Sales:Residential Class $123,006 $113,070 $100,982 $95,068 $74,062 $71,536 $72,620 $79,332 $66,410 $65,333General Class 67,412 60,977 63,781 56,041 37,878 35,099 35,504 33,571 32,326 32,943Wholesale Class 744 801 767 432 3,233 1,640 1,255 234 136 204Irrigation Class 21,304 21,915 20,239 13,113 11,011 10,893 11,164 11,722 12,909 12,176 Total Water 212,466 196,763 185,769 164,654 126,184 119,168 120,543 124,859 111,781 110,656
Water Supply FeesResidential Class 86,003 85,809 73,518 60,067 48,270 43,121 44,163 51,696 45,312 45,909General Class 50,086 47,129 42,748 44,746 39,355 32,393 32,537 31,586 29,764 30,403Wholesale Class 790 874 865 588 7,196 3,227 2,294 202 158 178Irrigation Class 15,122 16,571 15,437 14,491 12,551 12,057 12,058 13,029 7,154 6,288 Total Water Supply Fees 152,001 150,383 132,568 119,892 107,372 90,798 91,052 96,513 82,388 82,778
EAA Pass-through fees (b)Residential Class 12,526 13,108 14,110 10,915 9,654 9,905 10,841 4,767 5,423 3,605General Class 8,687 8,865 9,640 7,380 6,874 6,991 7,352 2,930 3,648 2,387Wholesale Class 119 123 157 114 1,271 659 509 18 19 14Irrigation Class 1,241 1,434 1,605 1,136 1,061 1,134 1,242 540 765 494 Total Pass-through fees 22,573 23,530 25,512 19,545 18,860 18,689 19,944 8,255 9,855 6,500
Conservation Fees:Residential Class 2,644 2,727 2,189 2,246 1,956 2,454 2,986 3,682 2,814 2,962General Class 8,990 8,345 8,453 7,004 6,498 6,606 7,040 6,702 4,461 4,008 Total Conservation 11,634 11,072 10,642 9,250 8,454 9,060 10,026 10,384 7,275 6,970
Wastewater Sales:Residential Class 146,684 142,530 134,860 124,992 125,051 116,775 98,674 88,702 79,118 81,202General Class 92,427 88,551 80,696 71,267 68,371 62,300 54,175 48,271 41,768 41,343Wholesale Class 10,659 9,936 8,729 8,064 7,848 7,599 6,761 6,105 5,044 5,225Surcharge 6,245 6,259 6,292 5,401 5,450 5,438 5,134 4,815 4,861 4,648 Total Wastewater 256,015 247,276 230,577 209,724 206,720 192,112 164,744 147,893 130,791 132,418
TCEQ Pass-through fees (c)Water customers 1,683 1,420 1,460 1,412 1,169 1,086 1,064 1,178 964 - Wastewater customers 465 435 448 429 433 347 411 464 280 -
2,148 1,855 1,908 1,841 1,602 1,433 1,475 1,642 1,244 -
Recycled Water Sales 5,568 5,651 5,691 5,097 5,086 5,161 5,074 5,068 3,955 4,393
Stormwater Fees 5,221 5,209 4,967 4,797 4,420 5,058 4,558 4,158 3,745 3,358
Chilled Water & Steam (d) 10,849 11,368 11,541 11,184 11,251 12,719 12,485 11,715 12,337 12,714
Miscellaneous Fees and Charges 17,415 17,505 17,641 16,769 13,860 12,787 12,427 10,418 8,989 9,266
Provision for Uncollectible Accounts (4,844) (3,860) (4,359) (5,721) (4,166) (4,646) (3,800) (2,811) (3,463) (3,711)
Total Operating Revenue $691,046 $666,752 $622,457 $557,032 $499,643 $462,339 $438,528 $418,094 $368,897 $365,342
(a) Amounts reflect the merger of SAWS and SAWS District Special Project effective January 1, 2015. (b) EAA pass-through fees are designed to recoup fees charged by Edwards Aquifer Authority (EAA). The fee is charged based on water usage.
Any previous over or under recovery of fees is considered in determining the fees to be charged each year. (c) TCEQ pass-through fees are designed to recoup fees charged by the Texas Commission on Environmental Quality (TCEQ). Fee is a per customer charge.(d) Steam service was discontinued in June 2014
Fiscal Year
102
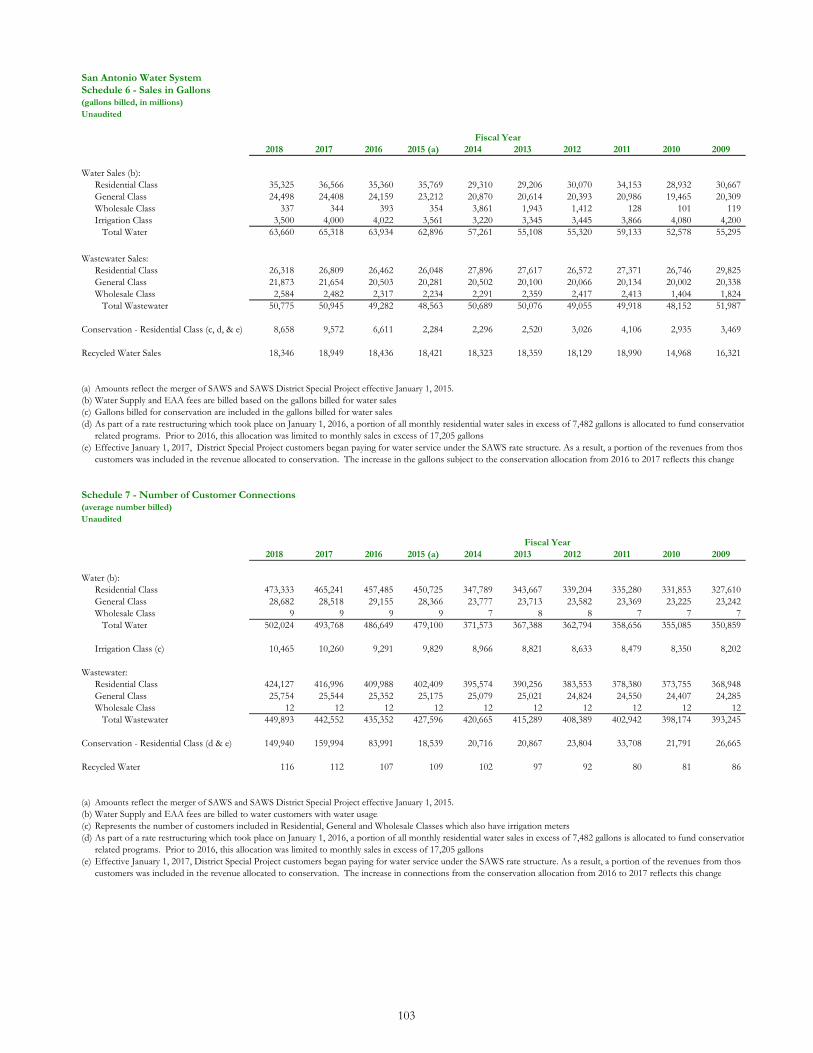
San Antonio Water SystemSchedule 6 - Sales in Gallons(gallons billed, in millions)Unaudited
2018 2017 2016 2015 (a) 2014 2013 2012 2011 2010 2009
Water Sales (b):Residential Class 35,325 36,566 35,360 35,769 29,310 29,206 30,070 34,153 28,932 30,667General Class 24,498 24,408 24,159 23,212 20,870 20,614 20,393 20,986 19,465 20,309Wholesale Class 337 344 393 354 3,861 1,943 1,412 128 101 119Irrigation Class 3,500 4,000 4,022 3,561 3,220 3,345 3,445 3,866 4,080 4,200 Total Water 63,660 65,318 63,934 62,896 57,261 55,108 55,320 59,133 52,578 55,295
Wastewater Sales:Residential Class 26,318 26,809 26,462 26,048 27,896 27,617 26,572 27,371 26,746 29,825General Class 21,873 21,654 20,503 20,281 20,502 20,100 20,066 20,134 20,002 20,338Wholesale Class 2,584 2,482 2,317 2,234 2,291 2,359 2,417 2,413 1,404 1,824 Total Wastewater 50,775 50,945 49,282 48,563 50,689 50,076 49,055 49,918 48,152 51,987
Conservation - Residential Class (c, d, & e) 8,658 9,572 6,611 2,284 2,296 2,520 3,026 4,106 2,935 3,469
Recycled Water Sales 18,346 18,949 18,436 18,421 18,323 18,359 18,129 18,990 14,968 16,321
(a) Amounts reflect the merger of SAWS and SAWS District Special Project effective January 1, 2015. (b) Water Supply and EAA fees are billed based on the gallons billed for water sales.(c) Gallons billed for conservation are included in the gallons billed for water sales.(d) As part of a rate restructuring which took place on January 1, 2016, a portion of all monthly residential water sales in excess of 7,482 gallons is allocated to fund conservation
related programs. Prior to 2016, this allocation was limited to monthly sales in excess of 17,205 gallons.(e) Effective January 1, 2017, District Special Project customers began paying for water service under the SAWS rate structure. As a result, a portion of the revenues from those
customers was included in the revenue allocated to conservation. The increase in the gallons subject to the conservation allocation from 2016 to 2017 reflects this change
Schedule 7 - Number of Customer Connections(average number billed)Unaudited
2018 2017 2016 2015 (a) 2014 2013 2012 2011 2010 2009
Water (b):Residential Class 473,333 465,241 457,485 450,725 347,789 343,667 339,204 335,280 331,853 327,610General Class 28,682 28,518 29,155 28,366 23,777 23,713 23,582 23,369 23,225 23,242Wholesale Class 9 9 9 9 7 8 8 7 7 7 Total Water 502,024 493,768 486,649 479,100 371,573 367,388 362,794 358,656 355,085 350,859
Irrigation Class (c) 10,465 10,260 9,291 9,829 8,966 8,821 8,633 8,479 8,350 8,202
Wastewater:Residential Class 424,127 416,996 409,988 402,409 395,574 390,256 383,553 378,380 373,755 368,948General Class 25,754 25,544 25,352 25,175 25,079 25,021 24,824 24,550 24,407 24,285Wholesale Class 12 12 12 12 12 12 12 12 12 12 Total Wastewater 449,893 442,552 435,352 427,596 420,665 415,289 408,389 402,942 398,174 393,245
Conservation - Residential Class (d & e) 149,940 159,994 83,991 18,539 20,716 20,867 23,804 33,708 21,791 26,665
Recycled Water 116 112 107 109 102 97 92 80 81 86
(a) Amounts reflect the merger of SAWS and SAWS District Special Project effective January 1, 2015. (b) Water Supply and EAA fees are billed to water customers with water usage.(c) Represents the number of customers included in Residential, General and Wholesale Classes which also have irrigation meters(d) As part of a rate restructuring which took place on January 1, 2016, a portion of all monthly residential water sales in excess of 7,482 gallons is allocated to fund conservation
related programs. Prior to 2016, this allocation was limited to monthly sales in excess of 17,205 gallons.(e) Effective January 1, 2017, District Special Project customers began paying for water service under the SAWS rate structure. As a result, a portion of the revenues from those
customers was included in the revenue allocated to conservation. The increase in connections from the conservation allocation from 2016 to 2017 reflects this change
Fiscal Year
Fiscal Year
103
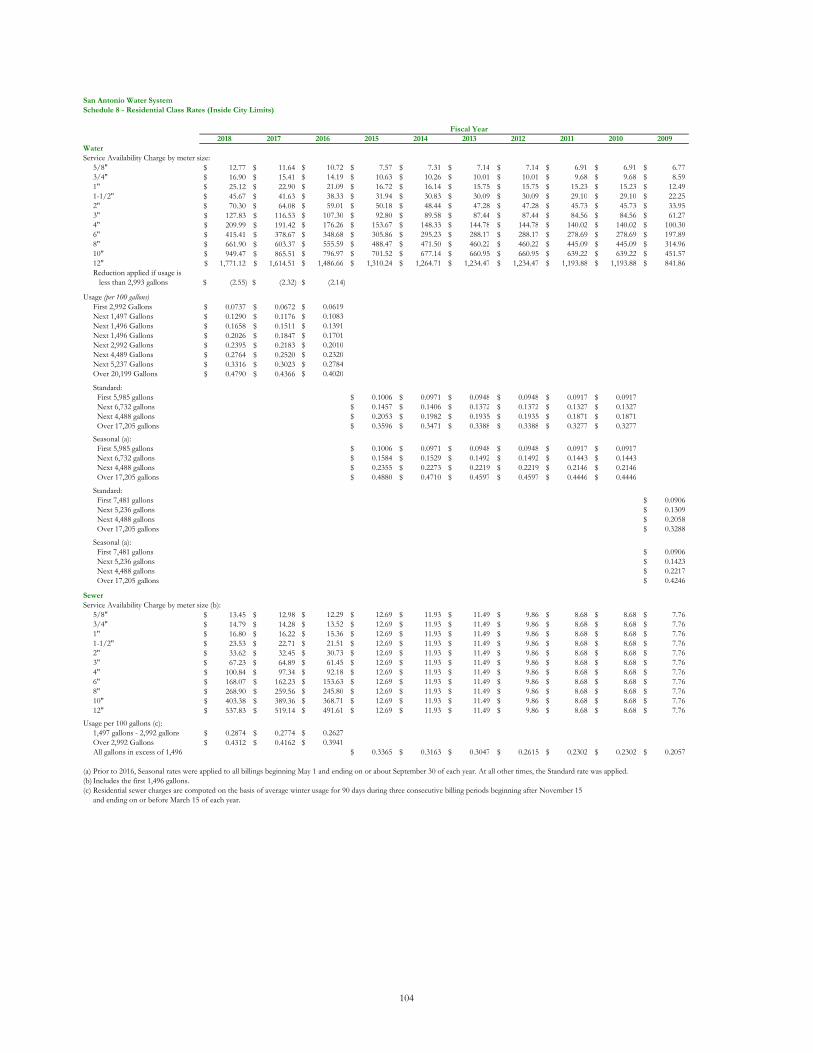
San Antonio Water SystemSchedule 8 - Residential Class Rates (Inside City Limits)
2018 2017 2016 2015 2014 2013 2012 2011 2010 2009Water Service Availability Charge by meter size:
5/8" $ 12.77 $ 11.64 10.72$ 7.57$ 7.31$ 7.14$ 7.14$ 6.91$ 6.91$ 6.77$ 3/4" $ 16.90 $ 15.41 14.19$ 10.63$ 10.26$ 10.01$ 10.01$ 9.68$ 9.68$ 8.59$ 1" $ 25.12 $ 22.90 21.09$ 16.72$ 16.14$ 15.75$ 15.75$ 15.23$ 15.23$ 12.49$ 1-1/2" $ 45.67 $ 41.63 38.33$ 31.94$ 30.83$ 30.09$ 30.09$ 29.10$ 29.10$ 22.25$ 2" $ 70.30 $ 64.08 59.01$ 50.18$ 48.44$ 47.28$ 47.28$ 45.73$ 45.73$ 33.95$ 3" $ 127.83 $ 116.53 107.30$ 92.80$ 89.58$ 87.44$ 87.44$ 84.56$ 84.56$ 61.27$ 4" $ 209.99 $ 191.42 176.26$ 153.67$ 148.33$ 144.78$ 144.78$ 140.02$ 140.02$ 100.30$ 6" $ 415.41 $ 378.67 348.68$ 305.86$ 295.23$ 288.17$ 288.17$ 278.69$ 278.69$ 197.89$ 8" $ 661.90 $ 603.37 555.59$ 488.47$ 471.50$ 460.22$ 460.22$ 445.09$ 445.09$ 314.96$ 10" $ 949.47 $ 865.51 796.97$ 701.52$ 677.14$ 660.95$ 660.95$ 639.22$ 639.22$ 451.57$ 12" $ 1,771.12 $ 1,614.51 1,486.66$ 1,310.24$ 1,264.71$ 1,234.47$ 1,234.47$ 1,193.88$ 1,193.88$ 841.86$ Reduction applied if usage is less than 2,993 gallons (2.55)$ (2.32)$ (2.14)$
Usage (per 100 gallons)First 2,992 Gallons $ 0.0737 $ 0.0672 0.0619$ Next 1,497 Gallons $ 0.1290 $ 0.1176 0.1083$ Next 1,496 Gallons $ 0.1658 $ 0.1511 0.1391$ Next 1,496 Gallons $ 0.2026 $ 0.1847 0.1701$ Next 2,992 Gallons $ 0.2395 $ 0.2183 0.2010$ Next 4,489 Gallons $ 0.2764 $ 0.2520 0.2320$ Next 5,237 Gallons $ 0.3316 $ 0.3023 0.2784$ Over 20,199 Gallons $ 0.4790 $ 0.4366 0.4020$
Standard: First 5,985 gallons 0.1006$ 0.0971$ 0.0948$ 0.0948$ 0.0917$ 0.0917$ Next 6,732 gallons 0.1457$ 0.1406$ 0.1372$ 0.1372$ 0.1327$ 0.1327$ Next 4,488 gallons 0.2053$ 0.1982$ 0.1935$ 0.1935$ 0.1871$ 0.1871$ Over 17,205 gallons 0.3596$ 0.3471$ 0.3388$ 0.3388$ 0.3277$ 0.3277$
Seasonal (a): First 5,985 gallons 0.1006$ 0.0971$ 0.0948$ 0.0948$ 0.0917$ 0.0917$ Next 6,732 gallons 0.1584$ 0.1529$ 0.1492$ 0.1492$ 0.1443$ 0.1443$ Next 4,488 gallons 0.2355$ 0.2273$ 0.2219$ 0.2219$ 0.2146$ 0.2146$ Over 17,205 gallons 0.4880$ 0.4710$ 0.4597$ 0.4597$ 0.4446$ 0.4446$
Standard: First 7,481 gallons 0.0906$ Next 5,236 gallons 0.1309$ Next 4,488 gallons 0.2058$ Over 17,205 gallons 0.3288$
Seasonal (a): First 7,481 gallons 0.0906$ Next 5,236 gallons 0.1423$ Next 4,488 gallons 0.2217$ Over 17,205 gallons 0.4246$
Sewer Service Availability Charge by meter size (b):
5/8" $ 13.45 $ 12.98 12.29$ 12.69$ 11.93$ 11.49$ 9.86$ 8.68$ 8.68$ 7.76$ 3/4" $ 14.79 $ 14.28 13.52$ 12.69$ 11.93$ 11.49$ 9.86$ 8.68$ 8.68$ 7.76$ 1" $ 16.80 $ 16.22 15.36$ 12.69$ 11.93$ 11.49$ 9.86$ 8.68$ 8.68$ 7.76$ 1-1/2" $ 23.53 $ 22.71 21.51$ 12.69$ 11.93$ 11.49$ 9.86$ 8.68$ 8.68$ 7.76$ 2" $ 33.62 $ 32.45 30.73$ 12.69$ 11.93$ 11.49$ 9.86$ 8.68$ 8.68$ 7.76$ 3" $ 67.23 $ 64.89 61.45$ 12.69$ 11.93$ 11.49$ 9.86$ 8.68$ 8.68$ 7.76$ 4" $ 100.84 $ 97.34 92.18$ 12.69$ 11.93$ 11.49$ 9.86$ 8.68$ 8.68$ 7.76$ 6" $ 168.07 $ 162.23 153.63$ 12.69$ 11.93$ 11.49$ 9.86$ 8.68$ 8.68$ 7.76$ 8" $ 268.90 $ 259.56 245.80$ 12.69$ 11.93$ 11.49$ 9.86$ 8.68$ 8.68$ 7.76$ 10" $ 403.38 $ 389.36 368.71$ 12.69$ 11.93$ 11.49$ 9.86$ 8.68$ 8.68$ 7.76$ 12" $ 537.83 $ 519.14 491.61$ 12.69$ 11.93$ 11.49$ 9.86$ 8.68$ 8.68$ 7.76$
Usage per 100 gallons (c):1,497 gallons - 2,992 gallons $ 0.2874 $ 0.2774 0.2627$ Over 2,992 Gallons $ 0.4312 $ 0.4162 0.3941$ All gallons in excess of 1,496 0.3365$ 0.3163$ 0.3047$ 0.2615$ 0.2302$ 0.2302$ 0.2057$
(a) Prior to 2016, Seasonal rates were applied to all billings beginning May 1 and ending on or about September 30 of each year. At all other times, the Standard rate was applied.(b) Includes the first 1,496 gallons. (c) Residential sewer charges are computed on the basis of average winter usage for 90 days during three consecutive billing periods beginning after November 15
and ending on or before March 15 of each year.
Fiscal Year
104
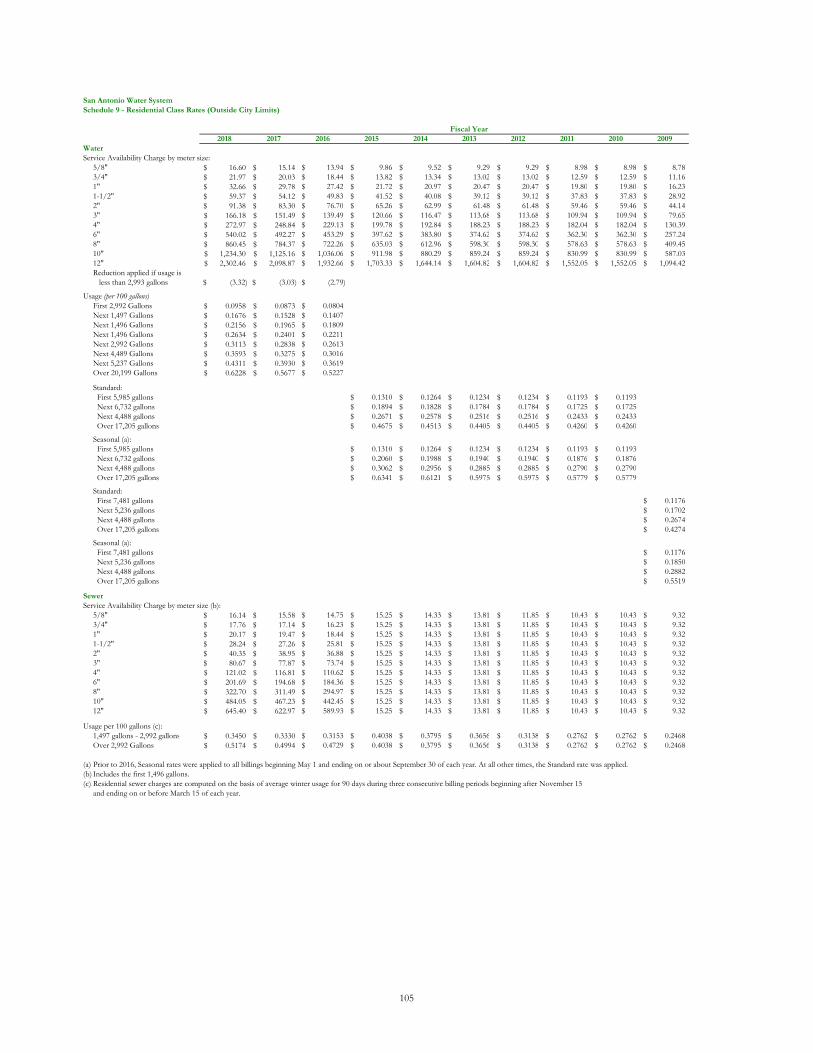
San Antonio Water SystemSchedule 9 - Residential Class Rates (Outside City Limits)
2018 2017 2016 2015 2014 2013 2012 2011 2010 2009Water Service Availability Charge by meter size:
5/8" $ 16.60 $ 15.14 13.94$ 9.86$ 9.52$ 9.29$ 9.29$ 8.98$ 8.98$ 8.78$ 3/4" $ 21.97 $ 20.03 18.44$ 13.82$ 13.34$ 13.02$ 13.02$ 12.59$ 12.59$ 11.16$ 1" $ 32.66 $ 29.78 27.42$ 21.72$ 20.97$ 20.47$ 20.47$ 19.80$ 19.80$ 16.23$ 1-1/2" $ 59.37 $ 54.12 49.83$ 41.52$ 40.08$ 39.12$ 39.12$ 37.83$ 37.83$ 28.92$ 2" $ 91.38 $ 83.30 76.70$ 65.26$ 62.99$ 61.48$ 61.48$ 59.46$ 59.46$ 44.14$ 3" $ 166.18 $ 151.49 139.49$ 120.66$ 116.47$ 113.68$ 113.68$ 109.94$ 109.94$ 79.65$ 4" $ 272.97 $ 248.84 229.13$ 199.78$ 192.84$ 188.23$ 188.23$ 182.04$ 182.04$ 130.39$ 6" $ 540.02 $ 492.27 453.29$ 397.62$ 383.80$ 374.62$ 374.62$ 362.30$ 362.30$ 257.24$ 8" $ 860.45 $ 784.37 722.26$ 635.03$ 612.96$ 598.30$ 598.30$ 578.63$ 578.63$ 409.45$ 10" $ 1,234.30 $ 1,125.16 1,036.06$ 911.98$ 880.29$ 859.24$ 859.24$ 830.99$ 830.99$ 587.03$ 12" $ 2,302.46 $ 2,098.87 1,932.66$ 1,703.33$ 1,644.14$ 1,604.82$ 1,604.82$ 1,552.05$ 1,552.05$ 1,094.42$ Reduction applied if usage is less than 2,993 gallons (3.32)$ (3.03)$ (2.79)$
Usage (per 100 gallons)First 2,992 Gallons $ 0.0958 $ 0.0873 0.0804$ Next 1,497 Gallons $ 0.1676 $ 0.1528 0.1407$ Next 1,496 Gallons $ 0.2156 $ 0.1965 0.1809$ Next 1,496 Gallons $ 0.2634 $ 0.2401 0.2211$ Next 2,992 Gallons $ 0.3113 $ 0.2838 0.2613$ Next 4,489 Gallons $ 0.3593 $ 0.3275 0.3016$ Next 5,237 Gallons $ 0.4311 $ 0.3930 0.3619$ Over 20,199 Gallons $ 0.6228 $ 0.5677 0.5227$
Standard: First 5,985 gallons 0.1310$ 0.1264$ 0.1234$ 0.1234$ 0.1193$ 0.1193$ Next 6,732 gallons 0.1894$ 0.1828$ 0.1784$ 0.1784$ 0.1725$ 0.1725$ Next 4,488 gallons 0.2671$ 0.2578$ 0.2516$ 0.2516$ 0.2433$ 0.2433$ Over 17,205 gallons 0.4675$ 0.4513$ 0.4405$ 0.4405$ 0.4260$ 0.4260$
Seasonal (a): First 5,985 gallons 0.1310$ 0.1264$ 0.1234$ 0.1234$ 0.1193$ 0.1193$ Next 6,732 gallons 0.2060$ 0.1988$ 0.1940$ 0.1940$ 0.1876$ 0.1876$ Next 4,488 gallons 0.3062$ 0.2956$ 0.2885$ 0.2885$ 0.2790$ 0.2790$ Over 17,205 gallons 0.6341$ 0.6121$ 0.5975$ 0.5975$ 0.5779$ 0.5779$
Standard: First 7,481 gallons 0.1176$ Next 5,236 gallons 0.1702$ Next 4,488 gallons 0.2674$ Over 17,205 gallons 0.4274$
Seasonal (a): First 7,481 gallons 0.1176$ Next 5,236 gallons 0.1850$ Next 4,488 gallons 0.2882$ Over 17,205 gallons 0.5519$
Sewer Service Availability Charge by meter size (b):
5/8" $ 16.14 $ 15.58 14.75$ 15.25$ 14.33$ 13.81$ 11.85$ 10.43$ 10.43$ 9.32$ 3/4" $ 17.76 $ 17.14 16.23$ 15.25$ 14.33$ 13.81$ 11.85$ 10.43$ 10.43$ 9.32$ 1" $ 20.17 $ 19.47 18.44$ 15.25$ 14.33$ 13.81$ 11.85$ 10.43$ 10.43$ 9.32$ 1-1/2" $ 28.24 $ 27.26 25.81$ 15.25$ 14.33$ 13.81$ 11.85$ 10.43$ 10.43$ 9.32$ 2" $ 40.35 $ 38.95 36.88$ 15.25$ 14.33$ 13.81$ 11.85$ 10.43$ 10.43$ 9.32$ 3" $ 80.67 $ 77.87 73.74$ 15.25$ 14.33$ 13.81$ 11.85$ 10.43$ 10.43$ 9.32$ 4" $ 121.02 $ 116.81 110.62$ 15.25$ 14.33$ 13.81$ 11.85$ 10.43$ 10.43$ 9.32$ 6" $ 201.69 $ 194.68 184.36$ 15.25$ 14.33$ 13.81$ 11.85$ 10.43$ 10.43$ 9.32$ 8" $ 322.70 $ 311.49 294.97$ 15.25$ 14.33$ 13.81$ 11.85$ 10.43$ 10.43$ 9.32$ 10" $ 484.05 $ 467.23 442.45$ 15.25$ 14.33$ 13.81$ 11.85$ 10.43$ 10.43$ 9.32$ 12" $ 645.40 $ 622.97 589.93$ 15.25$ 14.33$ 13.81$ 11.85$ 10.43$ 10.43$ 9.32$
Usage per 100 gallons (c):1,497 gallons - 2,992 gallons $ 0.3450 $ 0.3330 0.3153$ 0.4038$ 0.3795$ 0.3656$ 0.3138$ 0.2762$ 0.2762$ 0.2468$ Over 2,992 Gallons $ 0.5174 $ 0.4994 0.4729$ 0.4038$ 0.3795$ 0.3656$ 0.3138$ 0.2762$ 0.2762$ 0.2468$
(a) Prior to 2016, Seasonal rates were applied to all billings beginning May 1 and ending on or about September 30 of each year. At all other times, the Standard rate was applied.(b) Includes the first 1,496 gallons. (c) Residential sewer charges are computed on the basis of average winter usage for 90 days during three consecutive billing periods beginning after November 15
and ending on or before March 15 of each year.
Fiscal Year
105

San Antonio Water SystemSchedule 10 - General Class Rates (Inside City Limits)
2018 2017 2016 2015 2014 2013 2012 2011 2010 2009Water Service Availability Charge by meter size:
5/8" $ 13.80 $ 12.58 11.58$ 10.53$ 10.16$ 9.92$ 9.92$ 9.59$ 9.59$ 9.81$ 3/4" $ 19.71 $ 17.97 16.55$ 15.05$ 14.53$ 14.18$ 14.18$ 13.71$ 13.71$ 13.16$ 1" $ 31.53 $ 28.74 26.46$ 24.08$ 23.24$ 22.68$ 22.68$ 21.93$ 21.93$ 19.21$ 1-1/2" $ 61.05 $ 55.65 51.24$ 46.65$ 45.03$ 43.95$ 43.95$ 42.50$ 42.50$ 35.03$ 2" $ 96.40 $ 87.88 80.92$ 73.74$ 71.18$ 69.48$ 69.48$ 67.20$ 67.20$ 52.83$ 3" $ 179.02 $ 163.19 150.27$ 136.96$ 132.20$ 129.04$ 129.04$ 124.80$ 124.80$ 106.92$ 4" $ 297.00 $ 270.74 249.30$ 227.28$ 219.38$ 214.13$ 214.13$ 207.09$ 207.09$ 176.40$ 6" $ 591.95 $ 539.61 496.88$ 453.06$ 437.32$ 426.86$ 426.86$ 412.82$ 412.82$ 350.03$ 8" $ 945.95 $ 862.31 794.02$ 723.99$ 698.83$ 682.12$ 682.12$ 659.69$ 659.69$ 543.20$ 10" $ 1,358.90 $ 1,238.74 1,140.64$ 1,040.08$ 1,003.94$ 979.93$ 979.93$ 947.71$ 947.71$ 755.89$ 12" $ 2,538.80 $ 2,314.31 2,131.04$ 1,943.21$ 1,875.69$ 1,830.83$ 1,830.83$ 1,770.63$ 1,770.63$ 1,191.85$
Usage (per 100 gallons) Base (a) $ 0.1803 $ 0.1644 0.1514$ 0.1218$ 0.1176$ 0.1148$ 0.1148$ 0.1110$ 0.1110$ 100-125% of base $ 0.2076 $ 0.1892 0.1742$ 0.1457$ 0.1406$ 0.1372$ 0.1372$ 0.1327$ 0.1327$ 125-175% of base $ 0.2706 $ 0.2467 0.2272$ 0.2042$ 0.1971$ 0.1924$ 0.1924$ 0.1861$ 0.1861$ Over 175% of base $ 0.3158 $ 0.2879 0.2651$ 0.2991$ 0.2887$ 0.2818$ 0.2818$ 0.2725$ 0.2725$
Usage (per 100 gallons) Below base (b) 0.1086$ 100-125% of base 0.1257$ 125-150% of base 0.1633$ 150-200% of base 0.2138$ Over 200% of base 0.3160$
Sewer Service Availability Charge by meter size (c):By meter size:
5/8" $ 13.45 $ 12.98 12.29$ 12.69$ 11.93$ 11.49$ 9.86$ 8.68$ 8.68$ 7.76$ 3/4" $ 14.79 $ 14.28 13.52$ 12.69$ 11.93$ 11.49$ 9.86$ 8.68$ 8.68$ 7.76$ 1" $ 16.80 $ 16.22 15.36$ 12.69$ 11.93$ 11.49$ 9.86$ 8.68$ 8.68$ 7.76$ 1-1/2" $ 23.53 $ 22.71 21.51$ 12.69$ 11.93$ 11.49$ 9.86$ 8.68$ 8.68$ 7.76$ 2" $ 33.62 $ 32.45 30.73$ 12.69$ 11.93$ 11.49$ 9.86$ 8.68$ 8.68$ 7.76$ 3" $ 67.23 $ 64.89 61.45$ 12.69$ 11.93$ 11.49$ 9.86$ 8.68$ 8.68$ 7.76$ 4" $ 100.84 $ 97.34 92.18$ 12.69$ 11.93$ 11.49$ 9.86$ 8.68$ 8.68$ 7.76$ 6" $ 168.07 $ 162.23 153.63$ 12.69$ 11.93$ 11.49$ 9.86$ 8.68$ 8.68$ 7.76$ 8" $ 268.90 $ 259.56 245.80$ 12.69$ 11.93$ 11.49$ 9.86$ 8.68$ 8.68$ 7.76$ 10" $ 403.38 $ 389.36 368.71$ 12.69$ 11.93$ 11.49$ 9.86$ 8.68$ 8.68$ 7.76$ 12" $ 537.83 $ 519.14 491.61$ 12.69$ 11.93$ 11.49$ 9.86$ 8.68$ 8.68$ 7.76$
Usage (per 100 gallons)All gallons in excess of 1,496 0.3851$ 0.3717$ 0.3520$ 0.3365$ 0.3163$ 0.3047$ 0.2615$ 0.2302$ 0.2302$ 0.2057$
(a) Since 2010, base has been defined as 100% of the previous year's annual usage divided by 12.(b) Base was defined as 90% of the previous year's annual usage divided by 12.(c) Per 100 gallons. Includes the first 1,496 gallons.
Fiscal Year
106
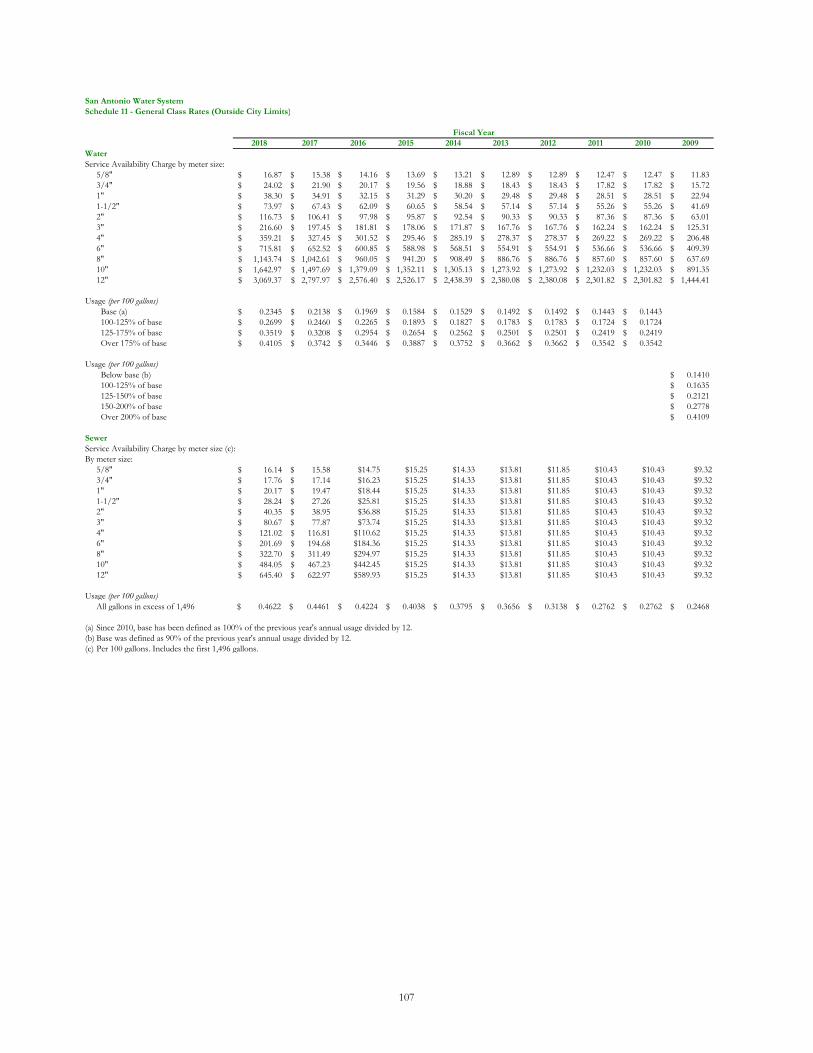
San Antonio Water SystemSchedule 11 - General Class Rates (Outside City Limits)
2018 2017 2016 2015 2014 2013 2012 2011 2010 2009Water Service Availability Charge by meter size:
5/8" $ 16.87 $ 15.38 14.16$ 13.69$ 13.21$ 12.89$ 12.89$ 12.47$ 12.47$ 11.83$ 3/4" $ 24.02 $ 21.90 20.17$ 19.56$ 18.88$ 18.43$ 18.43$ 17.82$ 17.82$ 15.72$ 1" $ 38.30 $ 34.91 32.15$ 31.29$ 30.20$ 29.48$ 29.48$ 28.51$ 28.51$ 22.94$ 1-1/2" $ 73.97 $ 67.43 62.09$ 60.65$ 58.54$ 57.14$ 57.14$ 55.26$ 55.26$ 41.69$ 2" $ 116.73 $ 106.41 97.98$ 95.87$ 92.54$ 90.33$ 90.33$ 87.36$ 87.36$ 63.01$ 3" $ 216.60 $ 197.45 181.81$ 178.06$ 171.87$ 167.76$ 167.76$ 162.24$ 162.24$ 125.31$ 4" $ 359.21 $ 327.45 301.52$ 295.46$ 285.19$ 278.37$ 278.37$ 269.22$ 269.22$ 206.48$ 6" $ 715.81 $ 652.52 600.85$ 588.98$ 568.51$ 554.91$ 554.91$ 536.66$ 536.66$ 409.39$ 8" $ 1,143.74 $ 1,042.61 960.05$ 941.20$ 908.49$ 886.76$ 886.76$ 857.60$ 857.60$ 637.69$ 10" $ 1,642.97 $ 1,497.69 1,379.09$ 1,352.11$ 1,305.13$ 1,273.92$ 1,273.92$ 1,232.03$ 1,232.03$ 891.35$ 12" $ 3,069.37 $ 2,797.97 2,576.40$ 2,526.17$ 2,438.39$ 2,380.08$ 2,380.08$ 2,301.82$ 2,301.82$ 1,444.41$
Usage (per 100 gallons) Base (a) $ 0.2345 $ 0.2138 0.1969$ 0.1584$ 0.1529$ 0.1492$ 0.1492$ 0.1443$ 0.1443$ 100-125% of base $ 0.2699 $ 0.2460 0.2265$ 0.1893$ 0.1827$ 0.1783$ 0.1783$ 0.1724$ 0.1724$ 125-175% of base $ 0.3519 $ 0.3208 0.2954$ 0.2654$ 0.2562$ 0.2501$ 0.2501$ 0.2419$ 0.2419$ Over 175% of base $ 0.4105 $ 0.3742 0.3446$ 0.3887$ 0.3752$ 0.3662$ 0.3662$ 0.3542$ 0.3542$
Usage (per 100 gallons) Below base (b) 0.1410$ 100-125% of base 0.1635$ 125-150% of base 0.2121$ 150-200% of base 0.2778$ Over 200% of base 0.4109$
Sewer Service Availability Charge by meter size (c):By meter size:
5/8" $ 16.14 $ 15.58 $14.75 $15.25 $14.33 $13.81 $11.85 $10.43 $10.43 $9.323/4" $ 17.76 $ 17.14 $16.23 $15.25 $14.33 $13.81 $11.85 $10.43 $10.43 $9.321" $ 20.17 $ 19.47 $18.44 $15.25 $14.33 $13.81 $11.85 $10.43 $10.43 $9.321-1/2" $ 28.24 $ 27.26 $25.81 $15.25 $14.33 $13.81 $11.85 $10.43 $10.43 $9.322" $ 40.35 $ 38.95 $36.88 $15.25 $14.33 $13.81 $11.85 $10.43 $10.43 $9.323" $ 80.67 $ 77.87 $73.74 $15.25 $14.33 $13.81 $11.85 $10.43 $10.43 $9.324" $ 121.02 $ 116.81 $110.62 $15.25 $14.33 $13.81 $11.85 $10.43 $10.43 $9.326" $ 201.69 $ 194.68 $184.36 $15.25 $14.33 $13.81 $11.85 $10.43 $10.43 $9.328" $ 322.70 $ 311.49 $294.97 $15.25 $14.33 $13.81 $11.85 $10.43 $10.43 $9.3210" $ 484.05 $ 467.23 $442.45 $15.25 $14.33 $13.81 $11.85 $10.43 $10.43 $9.3212" $ 645.40 $ 622.97 $589.93 $15.25 $14.33 $13.81 $11.85 $10.43 $10.43 $9.32
Usage (per 100 gallons)All gallons in excess of 1,496 0.4622$ 0.4461$ 0.4224$ 0.4038$ 0.3795$ 0.3656$ 0.3138$ 0.2762$ 0.2762$ 0.2468$
(a) Since 2010, base has been defined as 100% of the previous year's annual usage divided by 12.(b) Base was defined as 90% of the previous year's annual usage divided by 12.(c) Per 100 gallons. Includes the first 1,496 gallons.
Fiscal Year
107
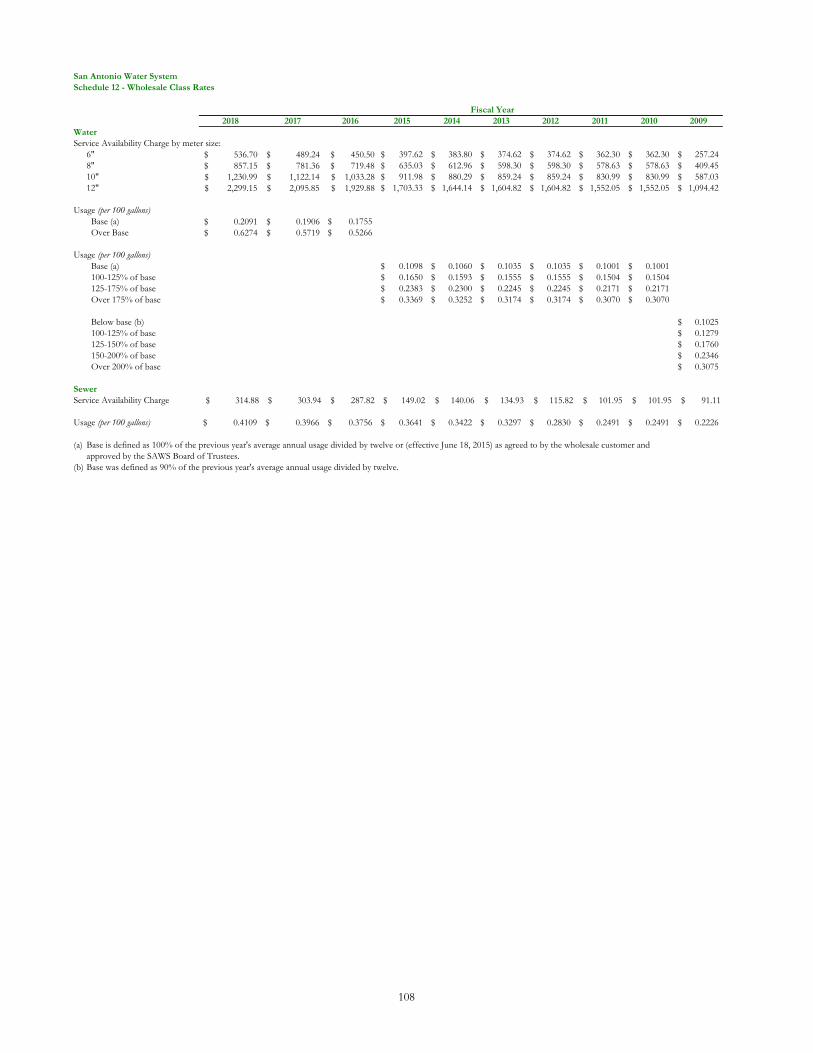
San Antonio Water SystemSchedule 12 - Wholesale Class Rates
2018 2017 2016 2015 2014 2013 2012 2011 2010 2009Water Service Availability Charge by meter size:
6" $ 536.70 $ 489.24 $ 450.50 397.62$ 383.80$ 374.62$ 374.62$ 362.30$ 362.30$ 257.24$ 8" $ 857.15 $ 781.36 $ 719.48 635.03$ 612.96$ 598.30$ 598.30$ 578.63$ 578.63$ 409.45$ 10" $ 1,230.99 $ 1,122.14 $ 1,033.28 911.98$ 880.29$ 859.24$ 859.24$ 830.99$ 830.99$ 587.03$ 12" $ 2,299.15 $ 2,095.85 $ 1,929.88 1,703.33$ 1,644.14$ 1,604.82$ 1,604.82$ 1,552.05$ 1,552.05$ 1,094.42$
Usage (per 100 gallons) Base (a) $ 0.2091 $ 0.1906 0.1755$ Over Base $ 0.6274 $ 0.5719 0.5266$
Usage (per 100 gallons) Base (a) 0.1098$ 0.1060$ 0.1035$ 0.1035$ 0.1001$ 0.1001$ 100-125% of base 0.1650$ 0.1593$ 0.1555$ 0.1555$ 0.1504$ 0.1504$ 125-175% of base 0.2383$ 0.2300$ 0.2245$ 0.2245$ 0.2171$ 0.2171$ Over 175% of base 0.3369$ 0.3252$ 0.3174$ 0.3174$ 0.3070$ 0.3070$
Below base (b) 0.1025$ 100-125% of base 0.1279$ 125-150% of base 0.1760$ 150-200% of base 0.2346$ Over 200% of base 0.3075$
Sewer Service Availability Charge $ 314.88 $ 303.94 $ 287.82 $ 149.02 $ 140.06 $ 134.93 $ 115.82 $ 101.95 $ 101.95 $ 91.11
Usage (per 100 gallons) 0.4109$ 0.3966$ 0.3756$ 0.3641$ 0.3422$ 0.3297$ 0.2830$ 0.2491$ 0.2491$ 0.2226$
(a) Base is defined as 100% of the previous year's average annual usage divided by twelve or (effective June 18, 2015) as agreed to by the wholesale customer andapproved by the SAWS Board of Trustees.
(b) Base was defined as 90% of the previous year's average annual usage divided by twelve.
Fiscal Year
108
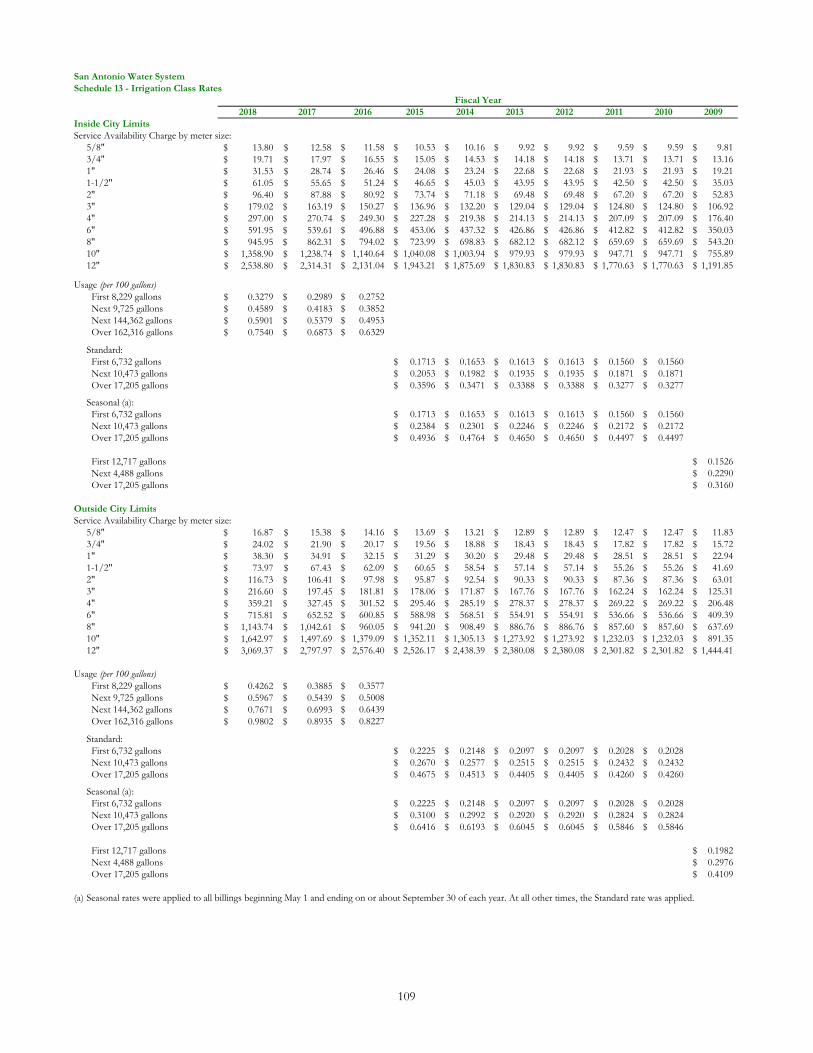
San Antonio Water SystemSchedule 13 - Irrigation Class Rates
2018 2017 2016 2015 2014 2013 2012 2011 2010 2009Inside City LimitsService Availability Charge by meter size:
5/8" $ 13.80 $ 12.58 11.58$ 10.53$ 10.16$ 9.92$ 9.92$ 9.59$ 9.59$ 9.81$ 3/4" $ 19.71 $ 17.97 16.55$ 15.05$ 14.53$ 14.18$ 14.18$ 13.71$ 13.71$ 13.16$ 1" $ 31.53 $ 28.74 26.46$ 24.08$ 23.24$ 22.68$ 22.68$ 21.93$ 21.93$ 19.21$ 1-1/2" $ 61.05 $ 55.65 51.24$ 46.65$ 45.03$ 43.95$ 43.95$ 42.50$ 42.50$ 35.03$ 2" $ 96.40 $ 87.88 80.92$ 73.74$ 71.18$ 69.48$ 69.48$ 67.20$ 67.20$ 52.83$ 3" $ 179.02 $ 163.19 150.27$ 136.96$ 132.20$ 129.04$ 129.04$ 124.80$ 124.80$ 106.92$ 4" $ 297.00 $ 270.74 249.30$ 227.28$ 219.38$ 214.13$ 214.13$ 207.09$ 207.09$ 176.40$ 6" $ 591.95 $ 539.61 496.88$ 453.06$ 437.32$ 426.86$ 426.86$ 412.82$ 412.82$ 350.03$ 8" $ 945.95 $ 862.31 794.02$ 723.99$ 698.83$ 682.12$ 682.12$ 659.69$ 659.69$ 543.20$ 10" $ 1,358.90 $ 1,238.74 1,140.64$ 1,040.08$ 1,003.94$ 979.93$ 979.93$ 947.71$ 947.71$ 755.89$ 12" $ 2,538.80 $ 2,314.31 2,131.04$ 1,943.21$ 1,875.69$ 1,830.83$ 1,830.83$ 1,770.63$ 1,770.63$ 1,191.85$
Usage (per 100 gallons) First 8,229 gallons $ 0.3279 $ 0.2989 0.2752$ Next 9,725 gallons $ 0.4589 $ 0.4183 0.3852$ Next 144,362 gallons $ 0.5901 $ 0.5379 0.4953$ Over 162,316 gallons $ 0.7540 $ 0.6873 0.6329$
Standard: First 6,732 gallons 0.1713$ 0.1653$ 0.1613$ 0.1613$ 0.1560$ 0.1560$ Next 10,473 gallons 0.2053$ 0.1982$ 0.1935$ 0.1935$ 0.1871$ 0.1871$ Over 17,205 gallons 0.3596$ 0.3471$ 0.3388$ 0.3388$ 0.3277$ 0.3277$
Seasonal (a): First 6,732 gallons 0.1713$ 0.1653$ 0.1613$ 0.1613$ 0.1560$ 0.1560$ Next 10,473 gallons 0.2384$ 0.2301$ 0.2246$ 0.2246$ 0.2172$ 0.2172$ Over 17,205 gallons 0.4936$ 0.4764$ 0.4650$ 0.4650$ 0.4497$ 0.4497$
First 12,717 gallons 0.1526$ Next 4,488 gallons 0.2290$ Over 17,205 gallons 0.3160$
Outside City LimitsService Availability Charge by meter size:
5/8" $ 16.87 $ 15.38 14.16$ 13.69$ 13.21$ 12.89$ 12.89$ 12.47$ 12.47$ 11.83$ 3/4" $ 24.02 $ 21.90 20.17$ 19.56$ 18.88$ 18.43$ 18.43$ 17.82$ 17.82$ 15.72$ 1" $ 38.30 $ 34.91 32.15$ 31.29$ 30.20$ 29.48$ 29.48$ 28.51$ 28.51$ 22.94$ 1-1/2" $ 73.97 $ 67.43 62.09$ 60.65$ 58.54$ 57.14$ 57.14$ 55.26$ 55.26$ 41.69$ 2" $ 116.73 $ 106.41 97.98$ 95.87$ 92.54$ 90.33$ 90.33$ 87.36$ 87.36$ 63.01$ 3" $ 216.60 $ 197.45 181.81$ 178.06$ 171.87$ 167.76$ 167.76$ 162.24$ 162.24$ 125.31$ 4" $ 359.21 $ 327.45 301.52$ 295.46$ 285.19$ 278.37$ 278.37$ 269.22$ 269.22$ 206.48$ 6" $ 715.81 $ 652.52 600.85$ 588.98$ 568.51$ 554.91$ 554.91$ 536.66$ 536.66$ 409.39$ 8" $ 1,143.74 $ 1,042.61 960.05$ 941.20$ 908.49$ 886.76$ 886.76$ 857.60$ 857.60$ 637.69$ 10" $ 1,642.97 $ 1,497.69 1,379.09$ 1,352.11$ 1,305.13$ 1,273.92$ 1,273.92$ 1,232.03$ 1,232.03$ 891.35$ 12" $ 3,069.37 $ 2,797.97 2,576.40$ 2,526.17$ 2,438.39$ 2,380.08$ 2,380.08$ 2,301.82$ 2,301.82$ 1,444.41$
Usage (per 100 gallons) First 8,229 gallons $ 0.4262 $ 0.3885 0.3577$ Next 9,725 gallons $ 0.5967 $ 0.5439 0.5008$ Next 144,362 gallons $ 0.7671 $ 0.6993 0.6439$ Over 162,316 gallons $ 0.9802 $ 0.8935 0.8227$
Standard: First 6,732 gallons 0.2225$ 0.2148$ 0.2097$ 0.2097$ 0.2028$ 0.2028$ Next 10,473 gallons 0.2670$ 0.2577$ 0.2515$ 0.2515$ 0.2432$ 0.2432$ Over 17,205 gallons 0.4675$ 0.4513$ 0.4405$ 0.4405$ 0.4260$ 0.4260$
Seasonal (a): First 6,732 gallons 0.2225$ 0.2148$ 0.2097$ 0.2097$ 0.2028$ 0.2028$ Next 10,473 gallons 0.3100$ 0.2992$ 0.2920$ 0.2920$ 0.2824$ 0.2824$ Over 17,205 gallons 0.6416$ 0.6193$ 0.6045$ 0.6045$ 0.5846$ 0.5846$
First 12,717 gallons 0.1982$ Next 4,488 gallons 0.2976$ Over 17,205 gallons 0.4109$
(a) Seasonal rates were applied to all billings beginning May 1 and ending on or about September 30 of each year. At all other times, the Standard rate was applied.
Fiscal Year
109
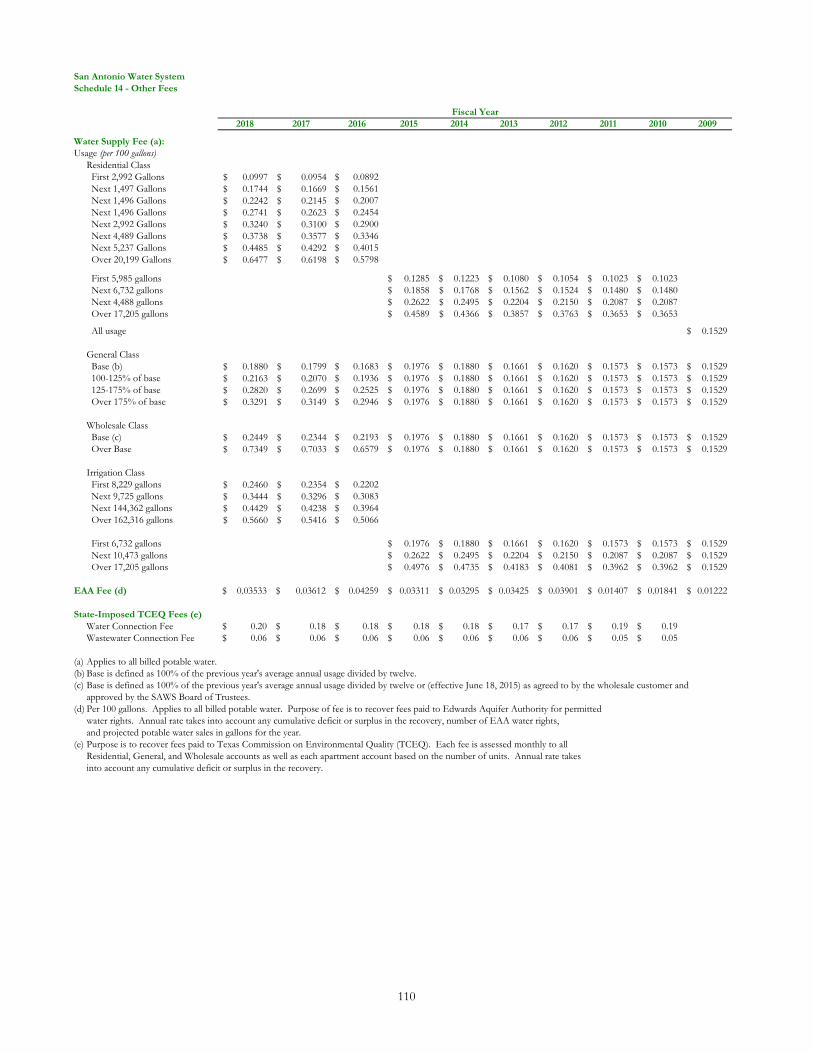
San Antonio Water SystemSchedule 14 - Other Fees
2018 2017 2016 2015 2014 2013 2012 2011 2010 2009
Water Supply Fee (a):Usage (per 100 gallons)
Residential Class First 2,992 Gallons $ 0.0997 $ 0.0954 0.0892$ Next 1,497 Gallons $ 0.1744 $ 0.1669 0.1561$ Next 1,496 Gallons $ 0.2242 $ 0.2145 0.2007$ Next 1,496 Gallons $ 0.2741 $ 0.2623 0.2454$ Next 2,992 Gallons $ 0.3240 $ 0.3100 0.2900$ Next 4,489 Gallons $ 0.3738 $ 0.3577 0.3346$ Next 5,237 Gallons $ 0.4485 $ 0.4292 0.4015$ Over 20,199 Gallons $ 0.6477 $ 0.6198 0.5798$
First 5,985 gallons 0.1285$ 0.1223$ 0.1080$ 0.1054$ 0.1023$ 0.1023$ Next 6,732 gallons 0.1858$ 0.1768$ 0.1562$ 0.1524$ 0.1480$ 0.1480$ Next 4,488 gallons 0.2622$ 0.2495$ 0.2204$ 0.2150$ 0.2087$ 0.2087$ Over 17,205 gallons 0.4589$ 0.4366$ 0.3857$ 0.3763$ 0.3653$ 0.3653$
All usage 0.1529$
General Class Base (b) $ 0.1880 $ 0.1799 0.1683$ 0.1976$ 0.1880$ 0.1661$ 0.1620$ 0.1573$ 0.1573$ 0.1529$ 100-125% of base $ 0.2163 $ 0.2070 0.1936$ 0.1976$ 0.1880$ 0.1661$ 0.1620$ 0.1573$ 0.1573$ 0.1529$ 125-175% of base $ 0.2820 $ 0.2699 0.2525$ 0.1976$ 0.1880$ 0.1661$ 0.1620$ 0.1573$ 0.1573$ 0.1529$ Over 175% of base $ 0.3291 $ 0.3149 0.2946$ 0.1976$ 0.1880$ 0.1661$ 0.1620$ 0.1573$ 0.1573$ 0.1529$
Wholesale Class Base (c) $ 0.2449 $ 0.2344 0.2193$ 0.1976$ 0.1880$ 0.1661$ 0.1620$ 0.1573$ 0.1573$ 0.1529$ Over Base $ 0.7349 $ 0.7033 0.6579$ 0.1976$ 0.1880$ 0.1661$ 0.1620$ 0.1573$ 0.1573$ 0.1529$
Irrigation Class First 8,229 gallons $ 0.2460 $ 0.2354 0.2202$ Next 9,725 gallons $ 0.3444 $ 0.3296 0.3083$ Next 144,362 gallons $ 0.4429 $ 0.4238 0.3964$ Over 162,316 gallons $ 0.5660 $ 0.5416 0.5066$
First 6,732 gallons 0.1976$ 0.1880$ 0.1661$ 0.1620$ 0.1573$ 0.1573$ 0.1529$ Next 10,473 gallons 0.2622$ 0.2495$ 0.2204$ 0.2150$ 0.2087$ 0.2087$ 0.1529$ Over 17,205 gallons 0.4976$ 0.4735$ 0.4183$ 0.4081$ 0.3962$ 0.3962$ 0.1529$
EAA Fee (d) 0.03533$ 0.03612$ 0.04259$ 0.03311$ 0.03295$ 0.03425$ 0.03901$ 0.01407$ 0.01841$ 0.01222$
State-Imposed TCEQ Fees (e)Water Connection Fee 0.20$ 0.18$ 0.18$ 0.18$ 0.18$ 0.17$ 0.17$ 0.19$ 0.19$ Wastewater Connection Fee 0.06$ 0.06$ 0.06$ 0.06$ 0.06$ 0.06$ 0.06$ 0.05$ 0.05$
(a) Applies to all billed potable water.(b) Base is defined as 100% of the previous year's average annual usage divided by twelve. (c) Base is defined as 100% of the previous year's average annual usage divided by twelve or (effective June 18, 2015) as agreed to by the wholesale customer and
approved by the SAWS Board of Trustees.(d)
(e)
Fiscal Year
Purpose is to recover fees paid to Texas Commission on Environmental Quality (TCEQ). Each fee is assessed monthly to allResidential, General, and Wholesale accounts as well as each apartment account based on the number of units. Annual rate takesinto account any cumulative deficit or surplus in the recovery.
Per 100 gallons. Applies to all billed potable water. Purpose of fee is to recover fees paid to Edwards Aquifer Authority for permittedwater rights. Annual rate takes into account any cumulative deficit or surplus in the recovery, number of EAA water rights,and projected potable water sales in gallons for the year.
110
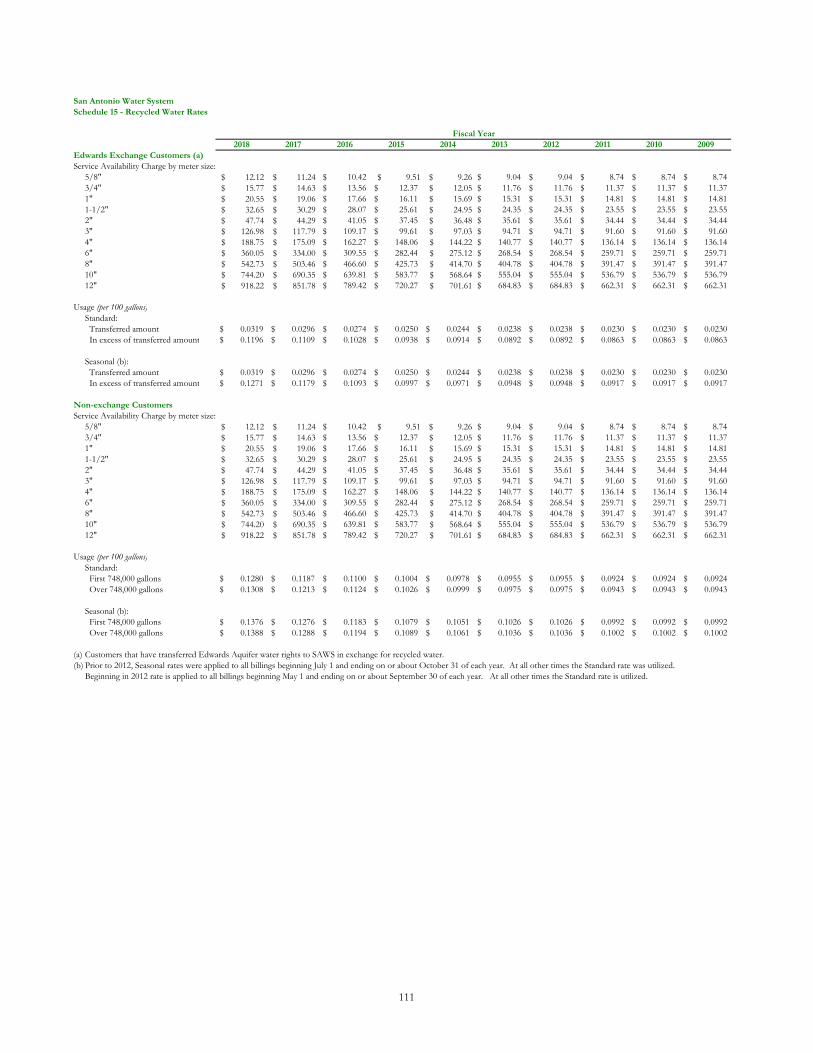
San Antonio Water SystemSchedule 15 - Recycled Water Rates
2018 2017 2016 2015 2014 2013 2012 2011 2010 2009Edwards Exchange Customers (a)Service Availability Charge by meter size:
5/8" $ 12.12 $ 11.24 10.42$ $ 9.51 $ 9.26 9.04$ 9.04$ 8.74$ 8.74$ 8.74$ 3/4" $ 15.77 $ 14.63 13.56$ 12.37$ $ 12.05 11.76$ 11.76$ 11.37$ 11.37$ 11.37$ 1" $ 20.55 $ 19.06 17.66$ 16.11$ $ 15.69 15.31$ 15.31$ 14.81$ 14.81$ 14.81$ 1-1/2" $ 32.65 $ 30.29 28.07$ 25.61$ $ 24.95 24.35$ 24.35$ 23.55$ 23.55$ 23.55$ 2" $ 47.74 $ 44.29 41.05$ 37.45$ $ 36.48 35.61$ 35.61$ 34.44$ 34.44$ 34.44$ 3" $ 126.98 $ 117.79 109.17$ 99.61$ $ 97.03 94.71$ 94.71$ 91.60$ 91.60$ 91.60$ 4" $ 188.75 $ 175.09 162.27$ 148.06$ $ 144.22 140.77$ 140.77$ 136.14$ 136.14$ 136.14$ 6" $ 360.05 $ 334.00 309.55$ 282.44$ $ 275.12 268.54$ 268.54$ 259.71$ 259.71$ 259.71$ 8" $ 542.73 $ 503.46 466.60$ 425.73$ $ 414.70 404.78$ 404.78$ 391.47$ 391.47$ 391.47$ 10" $ 744.20 $ 690.35 639.81$ 583.77$ $ 568.64 555.04$ 555.04$ 536.79$ 536.79$ 536.79$ 12" $ 918.22 $ 851.78 789.42$ 720.27$ $ 701.61 684.83$ 684.83$ 662.31$ 662.31$ 662.31$
Usage (per 100 gallons)Standard: Transferred amount 0.0319$ 0.0296$ 0.0274$ 0.0250$ 0.0244$ 0.0238$ 0.0238$ 0.0230$ 0.0230$ 0.0230$ In excess of transferred amount 0.1196$ 0.1109$ 0.1028$ 0.0938$ 0.0914$ 0.0892$ 0.0892$ 0.0863$ 0.0863$ 0.0863$
Seasonal (b): Transferred amount 0.0319$ 0.0296$ 0.0274$ 0.0250$ 0.0244$ 0.0238$ 0.0238$ 0.0230$ 0.0230$ 0.0230$ In excess of transferred amount 0.1271$ 0.1179$ 0.1093$ 0.0997$ 0.0971$ 0.0948$ 0.0948$ 0.0917$ 0.0917$ 0.0917$
Non-exchange Customers Service Availability Charge by meter size:
5/8" $ 12.12 $ 11.24 10.42$ $ 9.51 $ 9.26 9.04$ 9.04$ 8.74$ 8.74$ 8.74$ 3/4" $ 15.77 $ 14.63 13.56$ 12.37$ $ 12.05 11.76$ 11.76$ 11.37$ 11.37$ 11.37$ 1" $ 20.55 $ 19.06 17.66$ 16.11$ $ 15.69 15.31$ 15.31$ 14.81$ 14.81$ 14.81$ 1-1/2" $ 32.65 $ 30.29 28.07$ 25.61$ $ 24.95 24.35$ 24.35$ 23.55$ 23.55$ 23.55$ 2" $ 47.74 $ 44.29 41.05$ 37.45$ $ 36.48 35.61$ 35.61$ 34.44$ 34.44$ 34.44$ 3" $ 126.98 $ 117.79 109.17$ 99.61$ $ 97.03 94.71$ 94.71$ 91.60$ 91.60$ 91.60$ 4" $ 188.75 $ 175.09 162.27$ 148.06$ $ 144.22 140.77$ 140.77$ 136.14$ 136.14$ 136.14$ 6" $ 360.05 $ 334.00 309.55$ 282.44$ $ 275.12 268.54$ 268.54$ 259.71$ 259.71$ 259.71$ 8" $ 542.73 $ 503.46 466.60$ 425.73$ $ 414.70 404.78$ 404.78$ 391.47$ 391.47$ 391.47$ 10" $ 744.20 $ 690.35 639.81$ 583.77$ $ 568.64 555.04$ 555.04$ 536.79$ 536.79$ 536.79$ 12" $ 918.22 $ 851.78 789.42$ 720.27$ $ 701.61 684.83$ 684.83$ 662.31$ 662.31$ 662.31$
Usage (per 100 gallons)Standard: First 748,000 gallons 0.1280$ 0.1187$ 0.1100$ 0.1004$ 0.0978$ 0.0955$ 0.0955$ 0.0924$ 0.0924$ 0.0924$ Over 748,000 gallons 0.1308$ 0.1213$ 0.1124$ 0.1026$ 0.0999$ 0.0975$ 0.0975$ 0.0943$ 0.0943$ 0.0943$
Seasonal (b): First 748,000 gallons 0.1376$ 0.1276$ 0.1183$ 0.1079$ 0.1051$ 0.1026$ 0.1026$ 0.0992$ 0.0992$ 0.0992$ Over 748,000 gallons 0.1388$ 0.1288$ 0.1194$ 0.1089$ 0.1061$ 0.1036$ 0.1036$ 0.1002$ 0.1002$ 0.1002$
(a) Customers that have transferred Edwards Aquifer water rights to SAWS in exchange for recycled water.(b) Prior to 2012, Seasonal rates were applied to all billings beginning July 1 and ending on or about October 31 of each year. At all other times the Standard rate was utilized.
Beginning in 2012 rate is applied to all billings beginning May 1 and ending on or about September 30 of each year. At all other times the Standard rate is utilized.
Fiscal Year
111
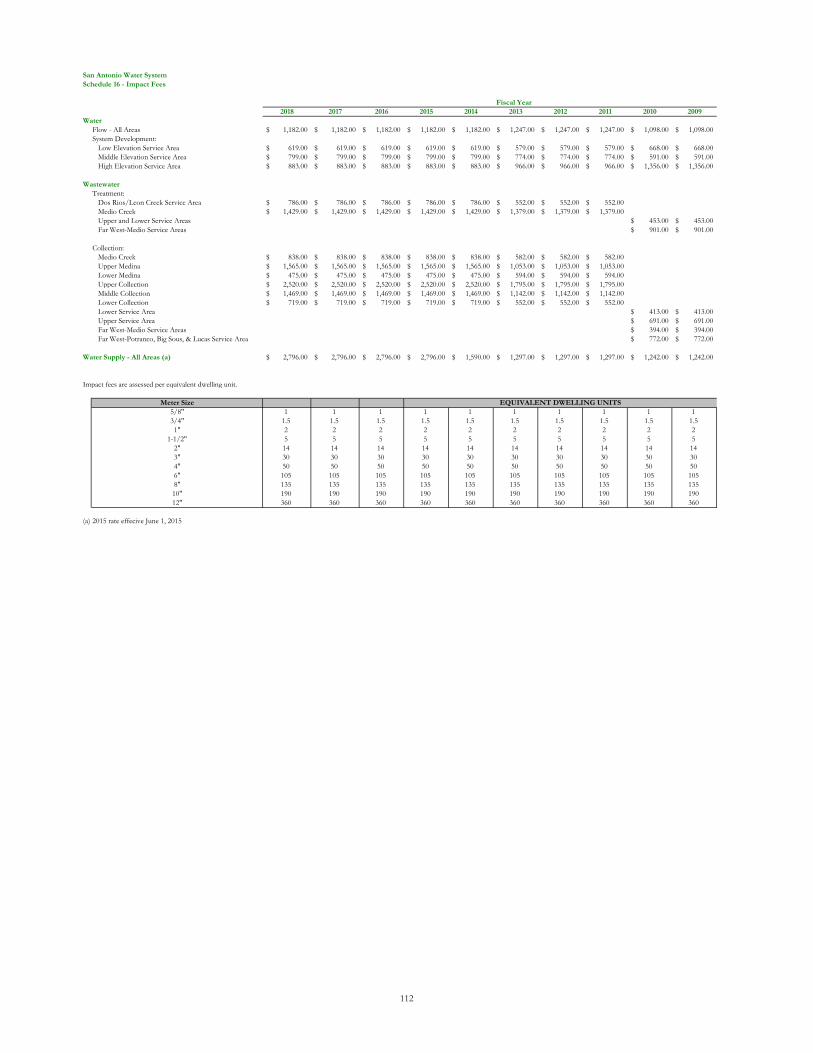
San Antonio Water SystemSchedule 16 - Impact Fees
2018 2017 2016 2015 2014 2013 2012 2011 2010 2009Water
Flow - All Areas 1,182.00$ 1,182.00$ 1,182.00$ 1,182.00$ 1,182.00$ 1,247.00$ 1,247.00$ 1,247.00$ 1,098.00$ 1,098.00$ System Development: Low Elevation Service Area 619.00$ 619.00$ 619.00$ 619.00$ 619.00$ 579.00$ 579.00$ 579.00$ 668.00$ 668.00$ Middle Elevation Service Area 799.00$ 799.00$ 799.00$ 799.00$ 799.00$ 774.00$ 774.00$ 774.00$ 591.00$ 591.00$ High Elevation Service Area 883.00$ 883.00$ 883.00$ 883.00$ 883.00$ 966.00$ 966.00$ 966.00$ 1,356.00$ 1,356.00$
Wastewater Treatment: Dos Rios/Leon Creek Service Area 786.00$ 786.00$ 786.00$ 786.00$ 786.00$ 552.00$ 552.00$ 552.00$ Medio Creek 1,429.00$ 1,429.00$ 1,429.00$ 1,429.00$ 1,429.00$ 1,379.00$ 1,379.00$ 1,379.00$ Upper and Lower Service Areas 453.00$ 453.00$ Far West-Medio Service Areas 901.00$ 901.00$
Collection: Medio Creek 838.00$ 838.00$ 838.00$ 838.00$ 838.00$ 582.00$ 582.00$ 582.00$ Upper Medina 1,565.00$ 1,565.00$ 1,565.00$ 1,565.00$ 1,565.00$ 1,053.00$ 1,053.00$ 1,053.00$ Lower Medina 475.00$ 475.00$ 475.00$ 475.00$ 475.00$ 594.00$ 594.00$ 594.00$ Upper Collection 2,520.00$ 2,520.00$ 2,520.00$ 2,520.00$ 2,520.00$ 1,795.00$ 1,795.00$ 1,795.00$ Middle Collection 1,469.00$ 1,469.00$ 1,469.00$ 1,469.00$ 1,469.00$ 1,142.00$ 1,142.00$ 1,142.00$ Lower Collection 719.00$ 719.00$ 719.00$ 719.00$ 719.00$ 552.00$ 552.00$ 552.00$ Lower Service Area 413.00$ 413.00$ Upper Service Area 691.00$ 691.00$ Far West-Medio Service Areas 394.00$ 394.00$ Far West-Potranco, Big Sous, & Lucas Service Area 772.00$ 772.00$
Water Supply - All Areas (a) 2,796.00$ 2,796.00$ 2,796.00$ 2,796.00$ 1,590.00$ 1,297.00$ 1,297.00$ 1,297.00$ 1,242.00$ 1,242.00$
Impact fees are assessed per equivalent dwelling unit.
Meter Size5/8" 1 1 1 1 1 1 1 1 1 13/4" 1.5 1.5 1.5 1.5 1.5 1.5 1.5 1.5 1.5 1.51" 2 2 2 2 2 2 2 2 2 2
1-1/2" 5 5 5 5 5 5 5 5 5 52" 14 14 14 14 14 14 14 14 14 143" 30 30 30 30 30 30 30 30 30 304" 50 50 50 50 50 50 50 50 50 506" 105 105 105 105 105 105 105 105 105 1058" 135 135 135 135 135 135 135 135 135 13510" 190 190 190 190 190 190 190 190 190 19012" 360 360 360 360 360 360 360 360 360 360
(a) 2015 rate effecive June 1, 2015
EQUIVALENT DWELLING UNITS
Fiscal Year
112
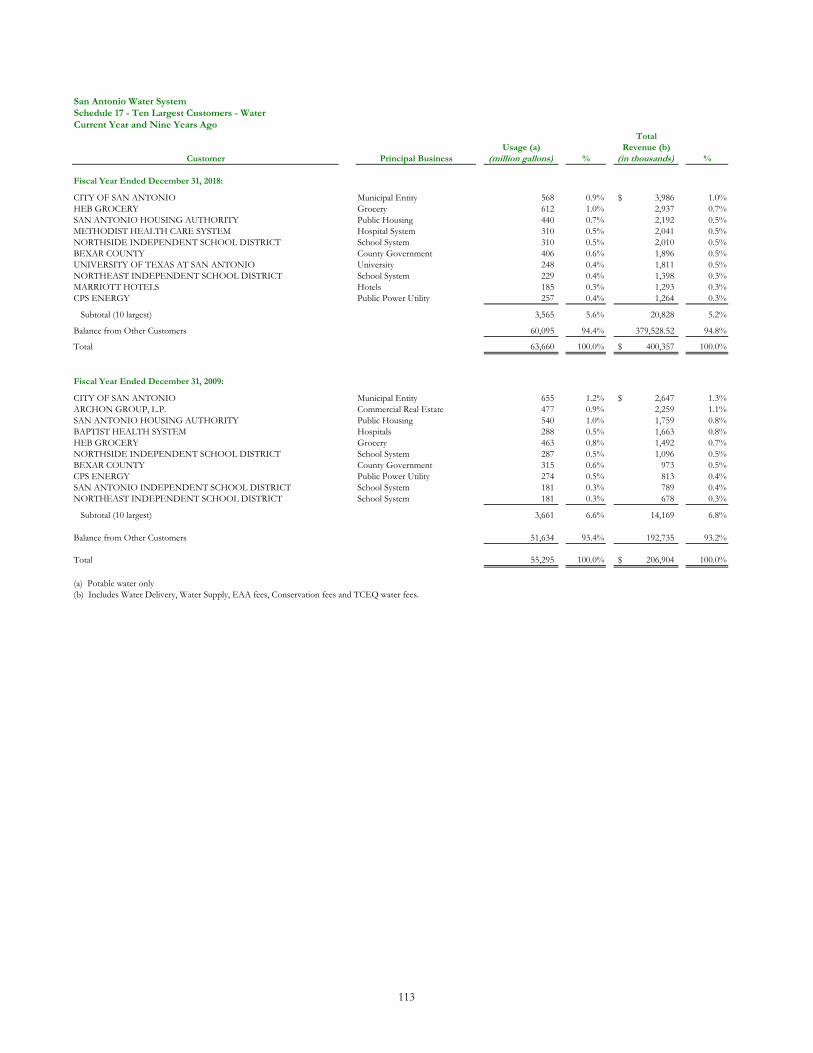
TotalUsage (a) Revenue (b)
Customer Principal Business (million gallons) % (in thousands) %
Fiscal Year Ended December 31, 2018:
CITY OF SAN ANTONIO Municipal Entity 568 0.9% 3,986$ 1.0%HEB GROCERY Grocery 612 1.0% 2,937 0.7%SAN ANTONIO HOUSING AUTHORITY Public Housing 440 0.7% 2,192 0.5%METHODIST HEALTH CARE SYSTEM Hospital System 310 0.5% 2,041 0.5%NORTHSIDE INDEPENDENT SCHOOL DISTRICT School System 310 0.5% 2,010 0.5%BEXAR COUNTY County Government 406 0.6% 1,896 0.5%UNIVERSITY OF TEXAS AT SAN ANTONIO University 248 0.4% 1,811 0.5%NORTHEAST INDEPENDENT SCHOOL DISTRICT School System 229 0.4% 1,398 0.3%MARRIOTT HOTELS Hotels 185 0.3% 1,293 0.3%CPS ENERGY Public Power Utility 257 0.4% 1,264 0.3%
Subtotal (10 largest) 3,565 5.6% 20,828 5.2%
Balance from Other Customers 60,095 94.4% 379,528.52 94.8%
Total 63,660 100.0% 400,357$ 100.0%
Fiscal Year Ended December 31, 2009:
CITY OF SAN ANTONIO Municipal Entity 655 1.2% 2,647$ 1.3%ARCHON GROUP, L.P. Commercial Real Estate 477 0.9% 2,259 1.1%SAN ANTONIO HOUSING AUTHORITY Public Housing 540 1.0% 1,759 0.8%BAPTIST HEALTH SYSTEM Hospitals 288 0.5% 1,663 0.8%HEB GROCERY Grocery 463 0.8% 1,492 0.7%NORTHSIDE INDEPENDENT SCHOOL DISTRICT School System 287 0.5% 1,096 0.5%BEXAR COUNTY County Government 315 0.6% 973 0.5%CPS ENERGY Public Power Utility 274 0.5% 813 0.4%SAN ANTONIO INDEPENDENT SCHOOL DISTRICT School System 181 0.3% 789 0.4%NORTHEAST INDEPENDENT SCHOOL DISTRICT School System 181 0.3% 678 0.3%
Subtotal (10 largest) 3,661 6.6% 14,169 6.8%
Balance from Other Customers 51,634 93.4% 192,735 93.2%
Total 55,295 100.0% 206,904$ 100.0%
(a) Potable water only(b) Includes Water Delivery, Water Supply, EAA fees, Conservation fees and TCEQ water fees.
San Antonio Water SystemSchedule 17 - Ten Largest Customers - WaterCurrent Year and Nine Years Ago
113
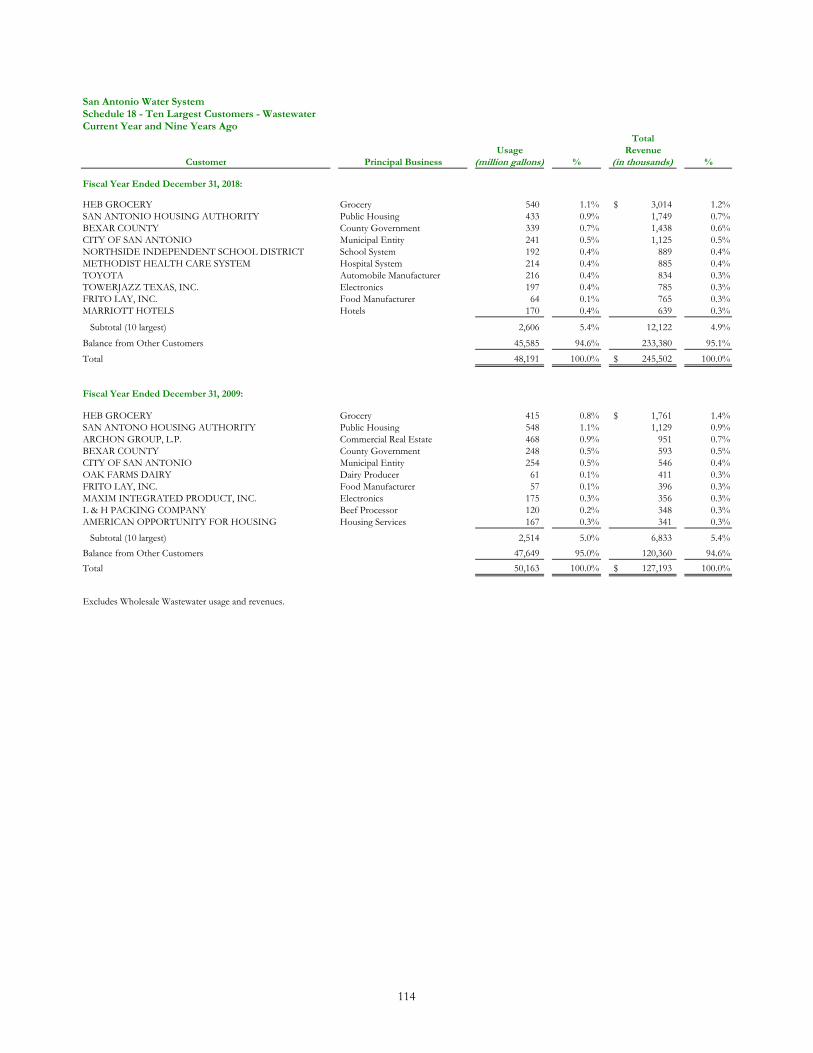
TotalUsage Revenue
Customer Principal Business (million gallons) % (in thousands) %
Fiscal Year Ended December 31, 2018:
HEB GROCERY Grocery 540 1.1% 3,014$ 1.2%SAN ANTONIO HOUSING AUTHORITY Public Housing 433 0.9% 1,749 0.7%BEXAR COUNTY County Government 339 0.7% 1,438 0.6%CITY OF SAN ANTONIO Municipal Entity 241 0.5% 1,125 0.5%NORTHSIDE INDEPENDENT SCHOOL DISTRICT School System 192 0.4% 889 0.4%METHODIST HEALTH CARE SYSTEM Hospital System 214 0.4% 885 0.4%TOYOTA Automobile Manufacturer 216 0.4% 834 0.3%TOWERJAZZ TEXAS, INC. Electronics 197 0.4% 785 0.3%FRITO LAY, INC. Food Manufacturer 64 0.1% 765 0.3%MARRIOTT HOTELS Hotels 170 0.4% 639 0.3%
Subtotal (10 largest) 2,606 5.4% 12,122 4.9%
Balance from Other Customers 45,585 94.6% 233,380 95.1%
Total 48,191 100.0% 245,502$ 100.0%
Fiscal Year Ended December 31, 2009:
HEB GROCERY Grocery 415 0.8% 1,761$ 1.4%SAN ANTONO HOUSING AUTHORITY Public Housing 548 1.1% 1,129 0.9%ARCHON GROUP, L.P. Commercial Real Estate 468 0.9% 951 0.7%BEXAR COUNTY County Government 248 0.5% 593 0.5%CITY OF SAN ANTONIO Municipal Entity 254 0.5% 546 0.4%OAK FARMS DAIRY Dairy Producer 61 0.1% 411 0.3%FRITO LAY, INC. Food Manufacturer 57 0.1% 396 0.3%MAXIM INTEGRATED PRODUCT, INC. Electronics 175 0.3% 356 0.3%L & H PACKING COMPANY Beef Processor 120 0.2% 348 0.3%AMERICAN OPPORTUNITY FOR HOUSING Housing Services 167 0.3% 341 0.3%
Subtotal (10 largest) 2,514 5.0% 6,833 5.4%
Balance from Other Customers 47,649 95.0% 120,360 94.6%
Total 50,163 100.0% 127,193$ 100.0%
Excludes Wholesale Wastewater usage and revenues.
San Antonio Water SystemSchedule 18 - Ten Largest Customers - WastewaterCurrent Year and Nine Years Ago
114
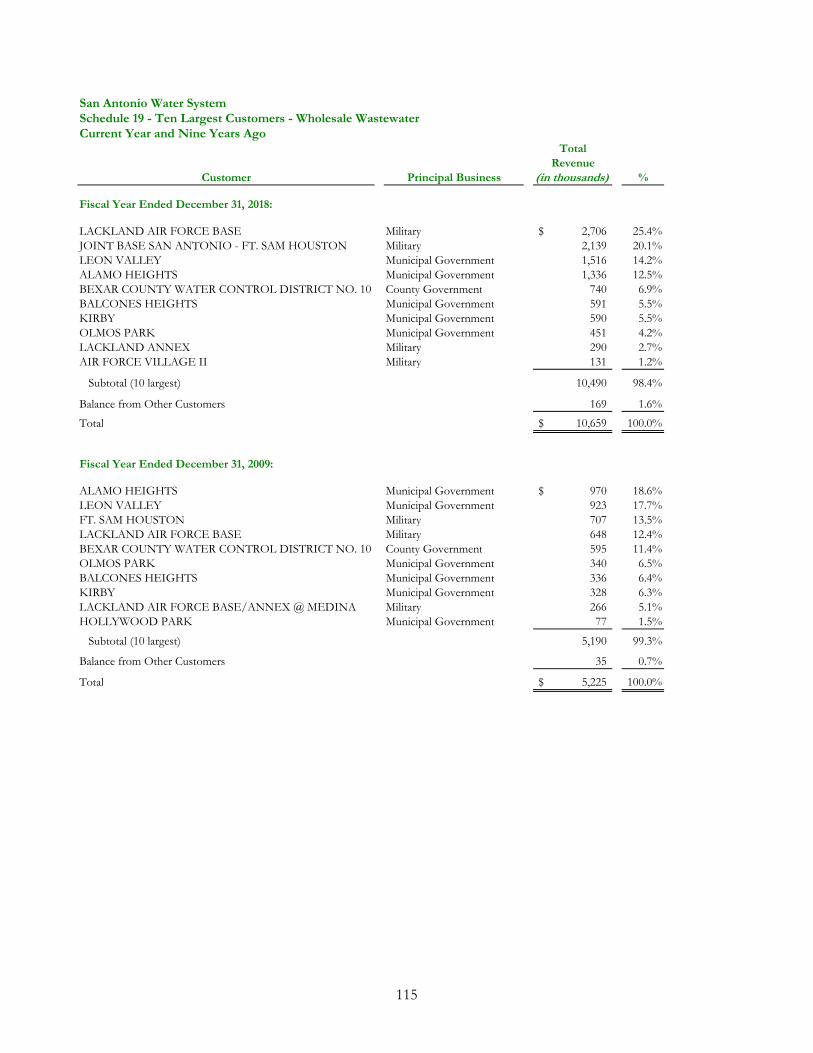
TotalRevenue
Customer Principal Business (in thousands) %
Fiscal Year Ended December 31, 2018:
LACKLAND AIR FORCE BASE Military 2,706$ 25.4%JOINT BASE SAN ANTONIO - FT. SAM HOUSTON Military 2,139 20.1%LEON VALLEY Municipal Government 1,516 14.2%ALAMO HEIGHTS Municipal Government 1,336 12.5%BEXAR COUNTY WATER CONTROL DISTRICT NO. 10 County Government 740 6.9%BALCONES HEIGHTS Municipal Government 591 5.5%KIRBY Municipal Government 590 5.5%OLMOS PARK Municipal Government 451 4.2%LACKLAND ANNEX Military 290 2.7%AIR FORCE VILLAGE II Military 131 1.2%
Subtotal (10 largest) 10,490 98.4%
Balance from Other Customers 169 1.6%
Total 10,659$ 100.0%
Fiscal Year Ended December 31, 2009:
ALAMO HEIGHTS Municipal Government 970$ 18.6%LEON VALLEY Municipal Government 923 17.7%FT. SAM HOUSTON Military 707 13.5%LACKLAND AIR FORCE BASE Military 648 12.4%BEXAR COUNTY WATER CONTROL DISTRICT NO. 10 County Government 595 11.4%OLMOS PARK Municipal Government 340 6.5%BALCONES HEIGHTS Municipal Government 336 6.4%KIRBY Municipal Government 328 6.3%LACKLAND AIR FORCE BASE/ANNEX @ MEDINA Military 266 5.1%HOLLYWOOD PARK Municipal Government 77 1.5%
Subtotal (10 largest) 5,190 99.3%
Balance from Other Customers 35 0.7%
Total 5,225$ 100.0%
San Antonio Water SystemSchedule 19 - Ten Largest Customers - Wholesale Wastewater Current Year and Nine Years Ago
115
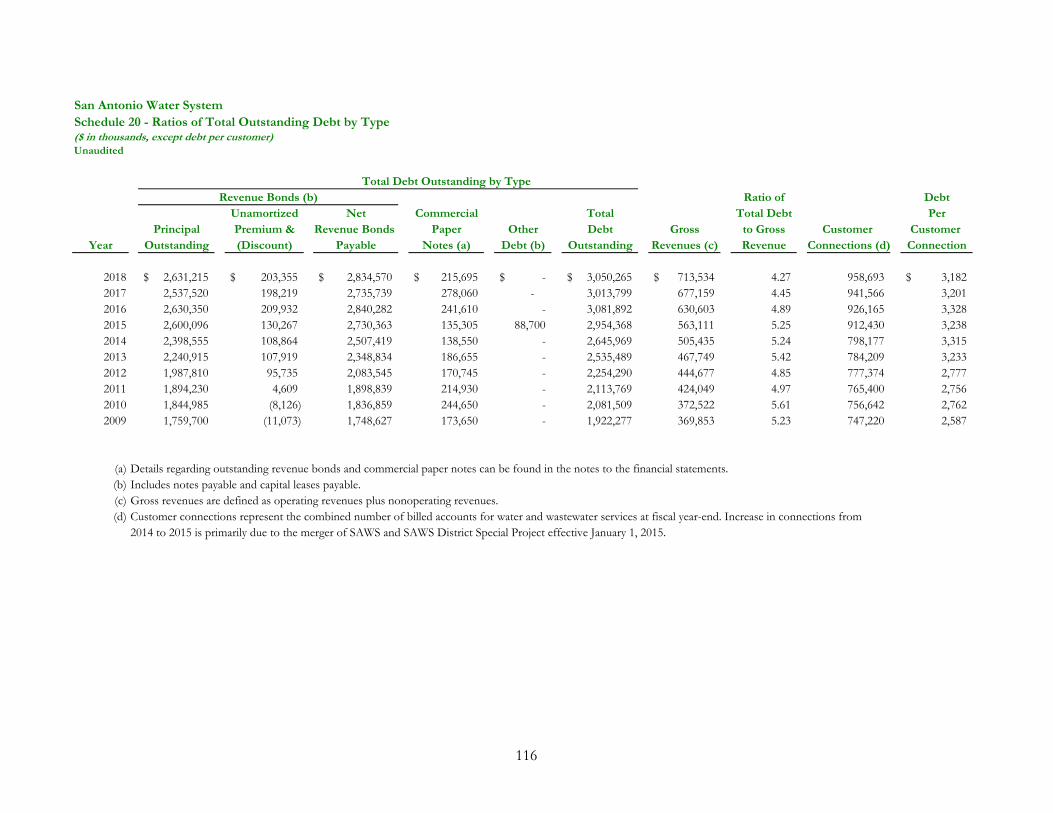
San Antonio Water SystemSchedule 20 - Ratios of Total Outstanding Debt by Type($ in thousands, except debt per customer)Unaudited
Total Debt Outstanding by TypeRatio of Debt
Unamortized Net Commercial Total Total Debt PerPrincipal Premium & Revenue Bonds Paper Other Debt Gross to Gross Customer Customer
Year Outstanding (Discount) Payable Notes (a) Debt (b) Outstanding Revenues (c) Revenue Connections (d) Connection
2018 2,631,215$ 203,355$ 2,834,570$ 215,695$ -$ 3,050,265$ 713,534$ 4.27 958,693 3,182$ 2017 2,537,520 198,219 2,735,739 278,060 - 3,013,799 677,159 4.45 941,566 3,201 2016 2,630,350 209,932 2,840,282 241,610 - 3,081,892 630,603 4.89 926,165 3,328 2015 2,600,096 130,267 2,730,363 135,305 88,700 2,954,368 563,111 5.25 912,430 3,238 2014 2,398,555 108,864 2,507,419 138,550 - 2,645,969 505,435 5.24 798,177 3,315 2013 2,240,915 107,919 2,348,834 186,655 - 2,535,489 467,749 5.42 784,209 3,233 2012 1,987,810 95,735 2,083,545 170,745 - 2,254,290 444,677 4.85 777,374 2,777 2011 1,894,230 4,609 1,898,839 214,930 - 2,113,769 424,049 4.97 765,400 2,756 2010 1,844,985 (8,126) 1,836,859 244,650 - 2,081,509 372,522 5.61 756,642 2,762 2009 1,759,700 (11,073) 1,748,627 173,650 - 1,922,277 369,853 5.23 747,220 2,587
(a) Details regarding outstanding revenue bonds and commercial paper notes can be found in the notes to the financial statements. (b) Includes notes payable and capital leases payable.(c) Gross revenues are defined as operating revenues plus nonoperating revenues. (d) Customer connections represent the combined number of billed accounts for water and wastewater services at fiscal year-end. Increase in connections from
2014 to 2015 is primarily due to the merger of SAWS and SAWS District Special Project effective January 1, 2015.
Revenue Bonds (b)
116
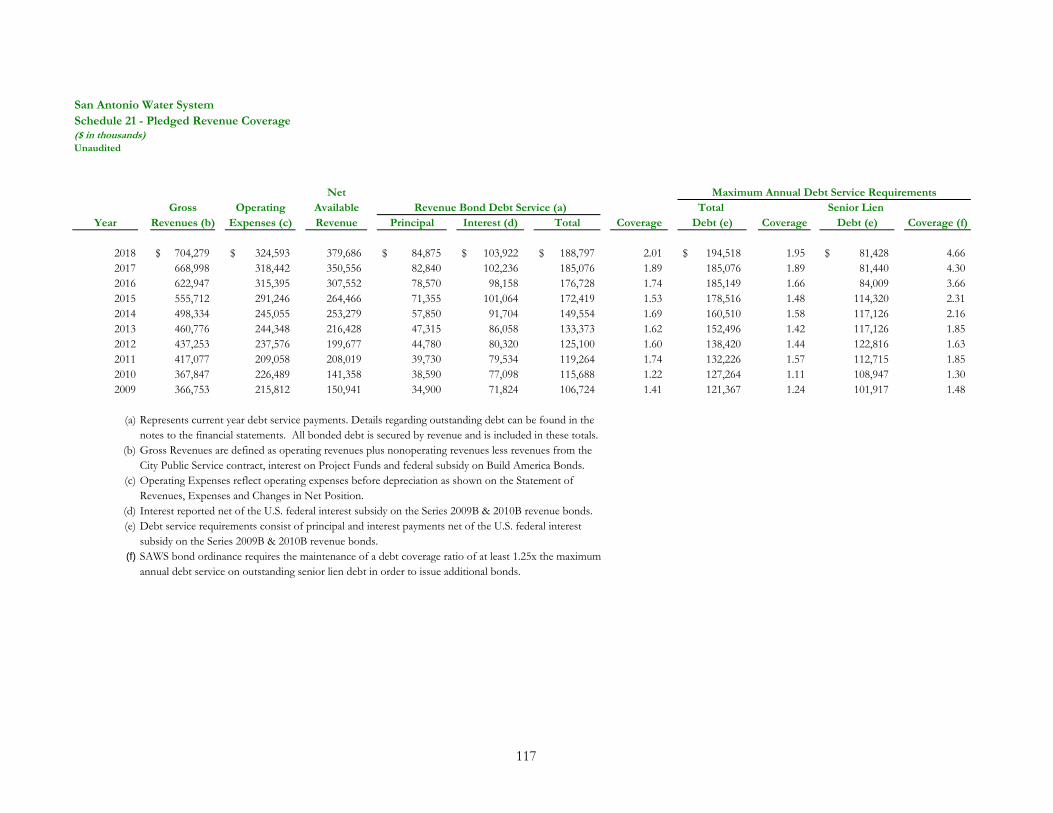
San Antonio Water SystemSchedule 21 - Pledged Revenue Coverage($ in thousands)Unaudited
Net Maximum Annual Debt Service RequirementsGross Operating Available Revenue Bond Debt Service (a) Total Senior Lien
Year Revenues (b) Expenses (c) Revenue Principal Interest (d) Total Coverage Debt (e) Coverage Debt (e) Coverage (f)
2018 704,279$ 324,593$ 379,686 84,875$ 103,922$ 188,797$ 2.01 194,518$ 1.95 81,428$ 4.66 2017 668,998 318,442 350,556 82,840 102,236 185,076 1.89 185,076 1.89 81,440 4.30 2016 622,947 315,395 307,552 78,570 98,158 176,728 1.74 185,149 1.66 84,009 3.66 2015 555,712 291,246 264,466 71,355 101,064 172,419 1.53 178,516 1.48 114,320 2.31 2014 498,334 245,055 253,279 57,850 91,704 149,554 1.69 160,510 1.58 117,126 2.16 2013 460,776 244,348 216,428 47,315 86,058 133,373 1.62 152,496 1.42 117,126 1.85 2012 437,253 237,576 199,677 44,780 80,320 125,100 1.60 138,420 1.44 122,816 1.63 2011 417,077 209,058 208,019 39,730 79,534 119,264 1.74 132,226 1.57 112,715 1.85 2010 367,847 226,489 141,358 38,590 77,098 115,688 1.22 127,264 1.11 108,947 1.30 2009 366,753 215,812 150,941 34,900 71,824 106,724 1.41 121,367 1.24 101,917 1.48
(a) Represents current year debt service payments. Details regarding outstanding debt can be found in the notes to the financial statements. All bonded debt is secured by revenue and is included in these totals.
(b) Gross Revenues are defined as operating revenues plus nonoperating revenues less revenues from the City Public Service contract, interest on Project Funds and federal subsidy on Build America Bonds.
(c) Operating Expenses reflect operating expenses before depreciation as shown on the Statement of Revenues, Expenses and Changes in Net Position.
(d) Interest reported net of the U.S. federal interest subsidy on the Series 2009B & 2010B revenue bonds.(e) Debt service requirements consist of principal and interest payments net of the U.S. federal interest
subsidy on the Series 2009B & 2010B revenue bonds.(f) SAWS bond ordinance requires the maintenance of a debt coverage ratio of at least 1.25x the maximum
annual debt service on outstanding senior lien debt in order to issue additional bonds.
117
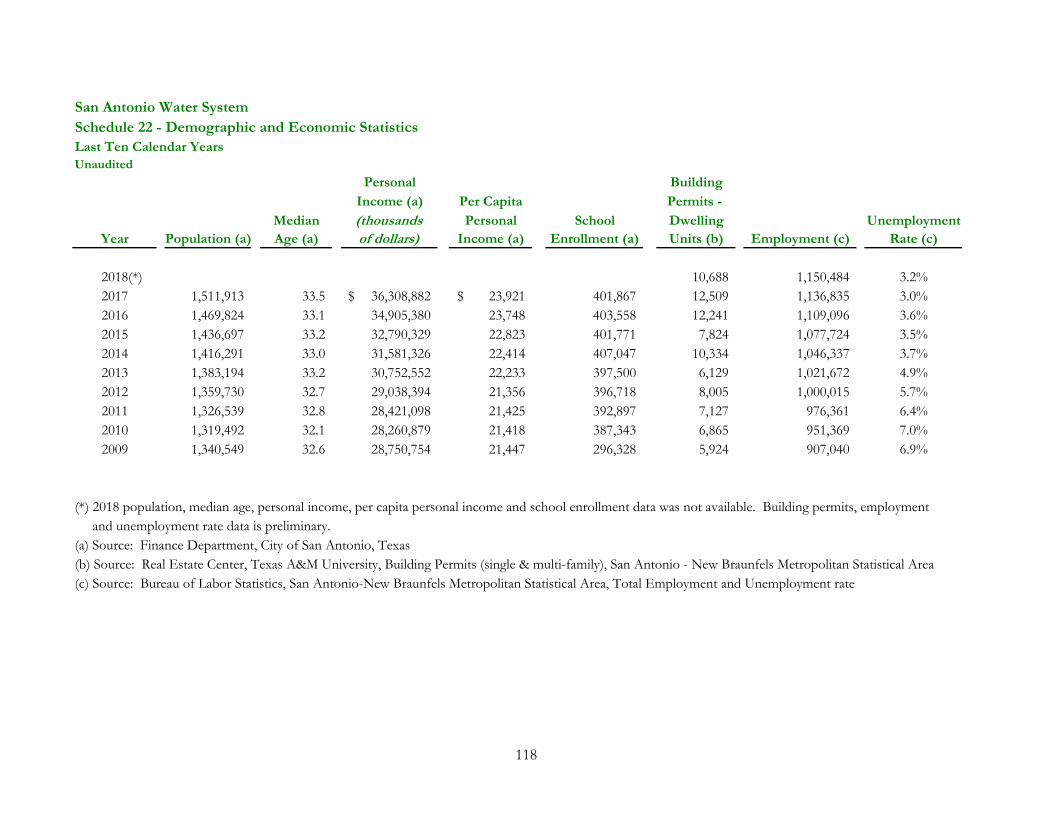
San Antonio Water SystemSchedule 22 - Demographic and Economic StatisticsLast Ten Calendar Years Unaudited
Personal BuildingIncome (a) Per Capita Permits -
Median (thousands Personal School Dwelling UnemploymentYear Population (a) Age (a) of dollars) Income (a) Enrollment (a) Units (b) Employment (c) Rate (c)
2018(*) 10,688 1,150,484 3.2%2017 1,511,913 33.5 36,308,882$ 23,921$ 401,867 12,509 1,136,835 3.0%2016 1,469,824 33.1 34,905,380 23,748 403,558 12,241 1,109,096 3.6%2015 1,436,697 33.2 32,790,329 22,823 401,771 7,824 1,077,724 3.5%2014 1,416,291 33.0 31,581,326 22,414 407,047 10,334 1,046,337 3.7%2013 1,383,194 33.2 30,752,552 22,233 397,500 6,129 1,021,672 4.9%2012 1,359,730 32.7 29,038,394 21,356 396,718 8,005 1,000,015 5.7%2011 1,326,539 32.8 28,421,098 21,425 392,897 7,127 976,361 6.4%2010 1,319,492 32.1 28,260,879 21,418 387,343 6,865 951,369 7.0%2009 1,340,549 32.6 28,750,754 21,447 296,328 5,924 907,040 6.9%
(*) 2018 population, median age, personal income, per capita personal income and school enrollment data was not available. Building permits, employment and unemployment rate data is preliminary.(a) Source: Finance Department, City of San Antonio, Texas(b) Source: Real Estate Center, Texas A&M University, Building Permits (single & multi-family), San Antonio - New Braunfels Metropolitan Statistical Area(c) Source: Bureau of Labor Statistics, San Antonio-New Braunfels Metropolitan Statistical Area, Total Employment and Unemployment rate
118
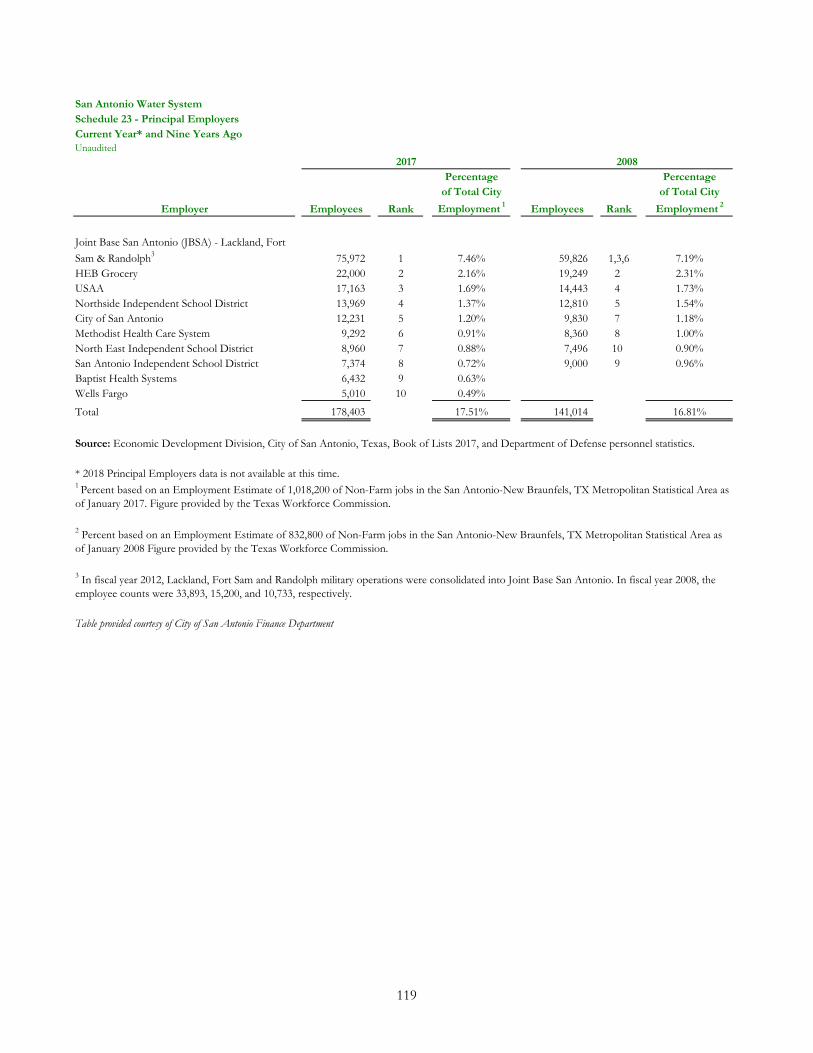
Unaudited
Percentage Percentageof Total City of Total City
Employer Employees Rank Employment 1 Employees Rank Employment 2
Joint Base San Antonio (JBSA) - Lackland, Fort
Sam & Randolph3 75,972 1 7.46% 59,826 1,3,6 7.19%HEB Grocery 22,000 2 2.16% 19,249 2 2.31%USAA 17,163 3 1.69% 14,443 4 1.73%Northside Independent School District 13,969 4 1.37% 12,810 5 1.54%City of San Antonio 12,231 5 1.20% 9,830 7 1.18%Methodist Health Care System 9,292 6 0.91% 8,360 8 1.00%North East Independent School District 8,960 7 0.88% 7,496 10 0.90%San Antonio Independent School District 7,374 8 0.72% 9,000 9 0.96%Baptist Health Systems 6,432 9 0.63%Wells Fargo 5,010 10 0.49%
Total 178,403 17.51% 141,014 16.81%
* 2018 Principal Employers data is not available at this time.
Table provided courtesy of City of San Antonio Finance Department
3 In fiscal year 2012, Lackland, Fort Sam and Randolph military operations were consolidated into Joint Base San Antonio. In fiscal year 2008, the employee counts were 33,893, 15,200, and 10,733, respectively.
San Antonio Water SystemSchedule 23 - Principal EmployersCurrent Year* and Nine Years Ago
1 Percent based on an Employment Estimate of 1,018,200 of Non-Farm jobs in the San Antonio-New Braunfels, TX Metropolitan Statistical Area as of January 2017. Figure provided by the Texas Workforce Commission.
2 Percent based on an Employment Estimate of 832,800 of Non-Farm jobs in the San Antonio-New Braunfels, TX Metropolitan Statistical Area as of January 2008 Figure provided by the Texas Workforce Commission.
Source: Economic Development Division, City of San Antonio, Texas, Book of Lists 2017, and Department of Defense personnel statistics.
2017 2008
119
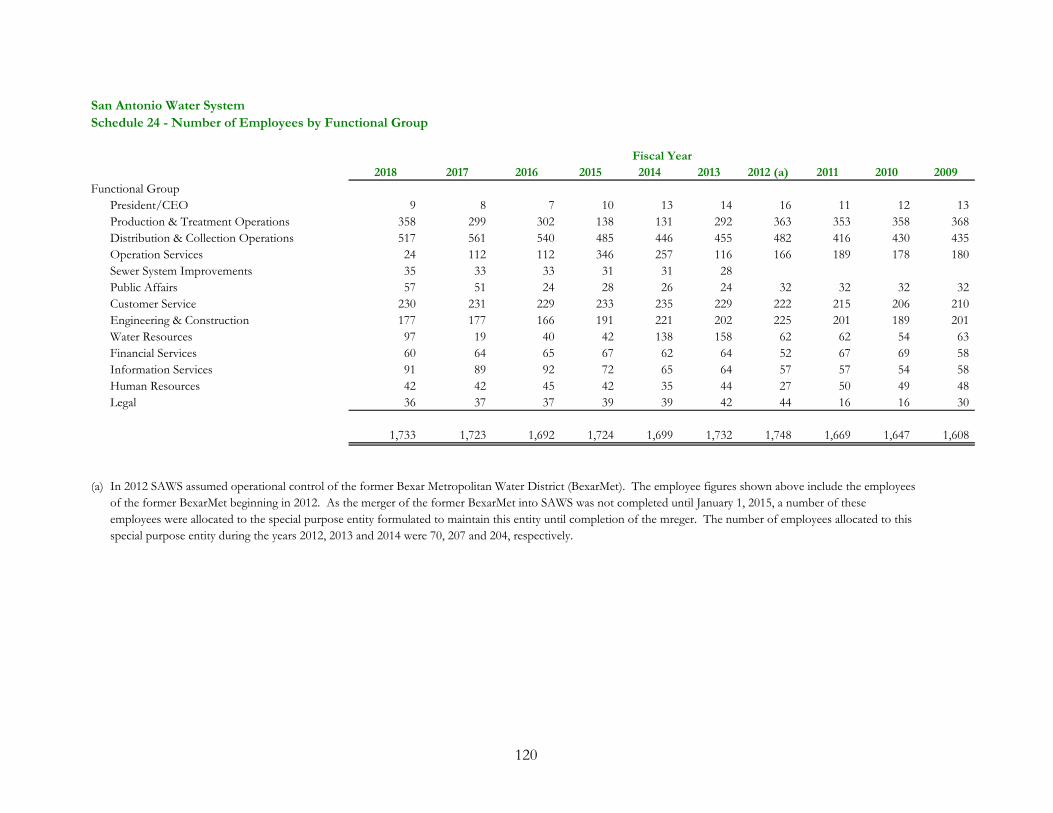
San Antonio Water SystemSchedule 24 - Number of Employees by Functional Group
2018 2017 2016 2015 2014 2013 2012 (a) 2011 2010 2009Functional Group
President/CEO 9 8 7 10 13 14 16 11 12 13Production & Treatment Operations 358 299 302 138 131 292 363 353 358 368Distribution & Collection Operations 517 561 540 485 446 455 482 416 430 435Operation Services 24 112 112 346 257 116 166 189 178 180Sewer System Improvements 35 33 33 31 31 28Public Affairs 57 51 24 28 26 24 32 32 32 32Customer Service 230 231 229 233 235 229 222 215 206 210Engineering & Construction 177 177 166 191 221 202 225 201 189 201Water Resources 97 19 40 42 138 158 62 62 54 63Financial Services 60 64 65 67 62 64 52 67 69 58Information Services 91 89 92 72 65 64 57 57 54 58Human Resources 42 42 45 42 35 44 27 50 49 48Legal 36 37 37 39 39 42 44 16 16 30
1,733 1,723 1,692 1,724 1,699 1,732 1,748 1,669 1,647 1,608
(a) In 2012 SAWS assumed operational control of the former Bexar Metropolitan Water District (BexarMet). The employee figures shown above include the employeesof the former BexarMet beginning in 2012. As the merger of the former BexarMet into SAWS was not completed until January 1, 2015, a number of theseemployees were allocated to the special purpose entity formulated to maintain this entity until completion of the mreger. The number of employees allocated to thisspecial purpose entity during the years 2012, 2013 and 2014 were 70, 207 and 204, respectively.
Fiscal Year
120
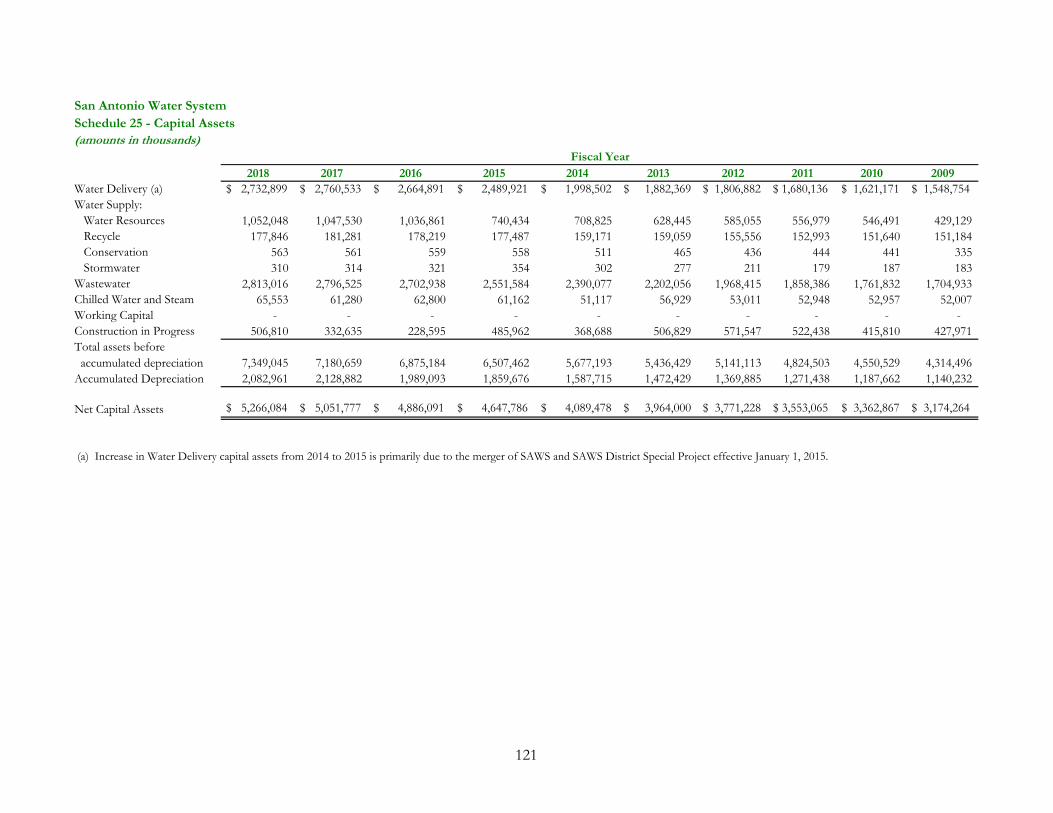
San Antonio Water SystemSchedule 25 - Capital Assets(amounts in thousands)
2018 2017 2016 2015 2014 2013 2012 2011 2010 2009Water Delivery (a) $ 2,732,899 $ 2,760,533 $ 2,664,891 $ 2,489,921 $ 1,998,502 $ 1,882,369 $ 1,806,882 $ 1,680,136 $ 1,621,171 $ 1,548,754 Water Supply: Water Resources 1,052,048 1,047,530 1,036,861 740,434 708,825 628,445 585,055 556,979 546,491 429,129 Recycle 177,846 181,281 178,219 177,487 159,171 159,059 155,556 152,993 151,640 151,184 Conservation 563 561 559 558 511 465 436 444 441 335 Stormwater 310 314 321 354 302 277 211 179 187 183 Wastewater 2,813,016 2,796,525 2,702,938 2,551,584 2,390,077 2,202,056 1,968,415 1,858,386 1,761,832 1,704,933 Chilled Water and Steam 65,553 61,280 62,800 61,162 51,117 56,929 53,011 52,948 52,957 52,007 Working Capital - - - - - - - - - - Construction in Progress 506,810 332,635 228,595 485,962 368,688 506,829 571,547 522,438 415,810 427,971 Total assets before accumulated depreciation 7,349,045 7,180,659 6,875,184 6,507,462 5,677,193 5,436,429 5,141,113 4,824,503 4,550,529 4,314,496 Accumulated Depreciation 2,082,961 2,128,882 1,989,093 1,859,676 1,587,715 1,472,429 1,369,885 1,271,438 1,187,662 1,140,232
Net Capital Assets $ 5,266,084 $ 5,051,777 $ 4,886,091 $ 4,647,786 $ 4,089,478 $ 3,964,000 $ 3,771,228 $ 3,553,065 $ 3,362,867 $ 3,174,264
(a) Increase in Water Delivery capital assets from 2014 to 2015 is primarily due to the merger of SAWS and SAWS District Special Project effective January 1, 2015.
Fiscal Year
121
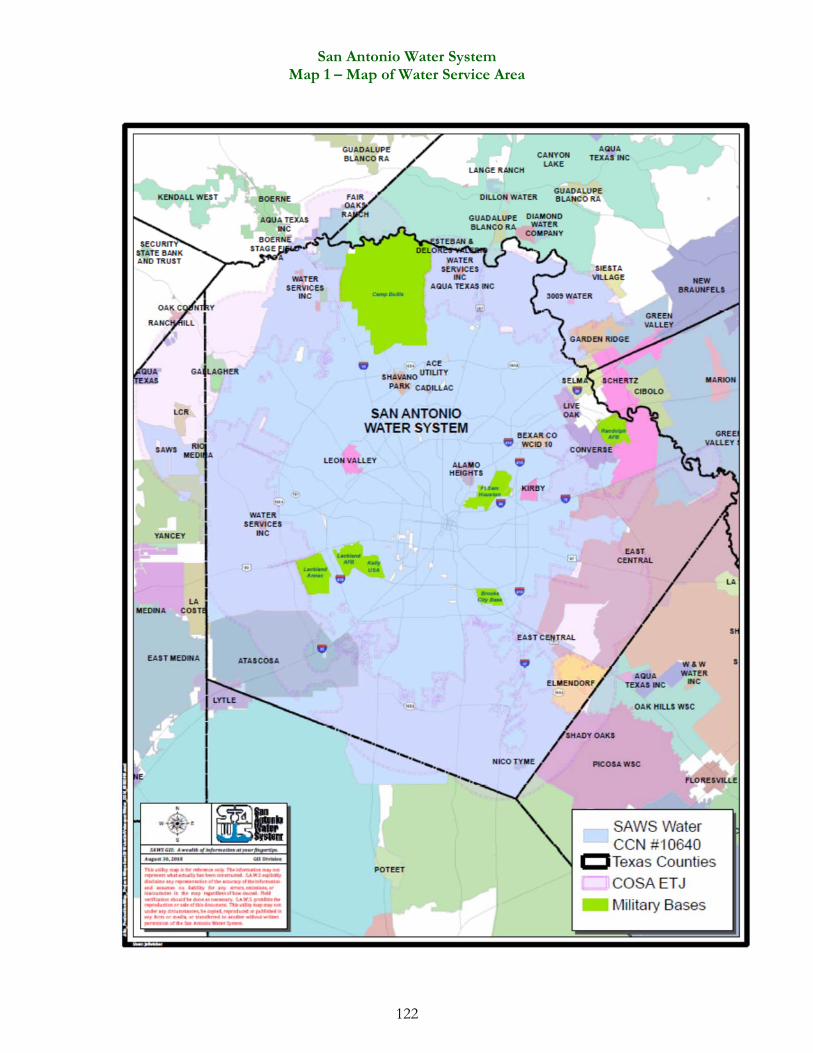
San Antonio Water System Map 1 – Map of Water Service Area
122
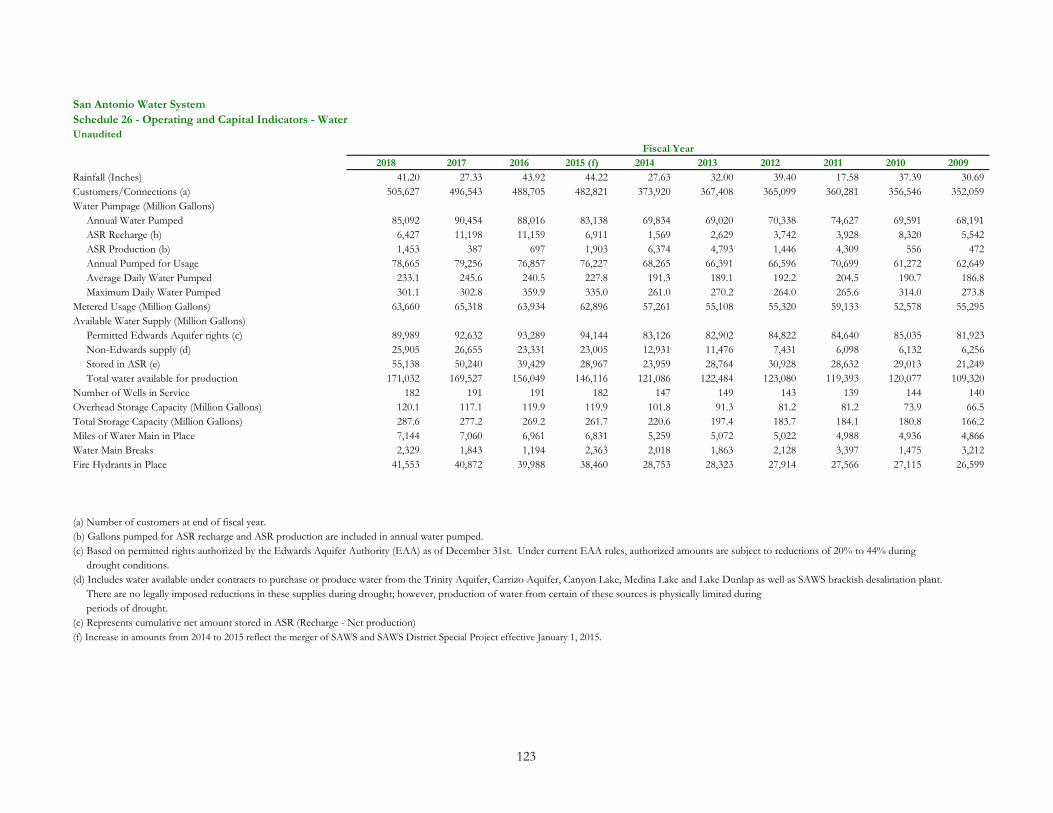
San Antonio Water SystemSchedule 26 - Operating and Capital Indicators - WaterUnaudited
Fiscal Year2018 2017 2016 2015 (f) 2014 2013 2012 2011 2010 2009
Rainfall (Inches) 41.20 27.33 43.92 44.22 27.63 32.00 39.40 17.58 37.39 30.69 Customers/Connections (a) 505,627 496,543 488,705 482,821 373,920 367,408 365,099 360,281 356,546 352,059 Water Pumpage (Million Gallons) Annual Water Pumped 85,092 90,454 88,016 83,138 69,834 69,020 70,338 74,627 69,591 68,191 ASR Recharge (b) 6,427 11,198 11,159 6,911 1,569 2,629 3,742 3,928 8,320 5,542 ASR Production (b) 1,453 387 697 1,903 6,374 4,793 1,446 4,309 556 472 Annual Pumped for Usage 78,665 79,256 76,857 76,227 68,265 66,391 66,596 70,699 61,272 62,649 Average Daily Water Pumped 233.1 245.6 240.5 227.8 191.3 189.1 192.2 204.5 190.7 186.8 Maximum Daily Water Pumped 301.1 302.8 359.9 335.0 261.0 270.2 264.0 265.6 314.0 273.8 Metered Usage (Million Gallons) 63,660 65,318 63,934 62,896 57,261 55,108 55,320 59,133 52,578 55,295 Available Water Supply (Million Gallons) Permitted Edwards Aquifer rights (c) 89,989 92,632 93,289 94,144 83,126 82,902 84,822 84,640 85,035 81,923 Non-Edwards supply (d) 25,905 26,655 23,331 23,005 12,931 11,476 7,431 6,098 6,132 6,256 Stored in ASR (e) 55,138 50,240 39,429 28,967 23,959 28,764 30,928 28,632 29,013 21,249 Total water available for production 171,032 169,527 156,049 146,116 121,086 122,484 123,080 119,393 120,077 109,320Number of Wells in Service 182 191 191 182 147 149 143 139 144 140 Overhead Storage Capacity (Million Gallons) 120.1 117.1 119.9 119.9 101.8 91.3 81.2 81.2 73.9 66.5 Total Storage Capacity (Million Gallons) 287.6 277.2 269.2 261.7 220.6 197.4 183.7 184.1 180.8 166.2 Miles of Water Main in Place 7,144 7,060 6,961 6,831 5,259 5,072 5,022 4,988 4,936 4,866 Water Main Breaks 2,329 1,843 1,194 2,363 2,018 1,863 2,128 3,397 1,475 3,212 Fire Hydrants in Place 41,553 40,872 39,988 38,460 28,753 28,323 27,914 27,566 27,115 26,599
(a) Number of customers at end of fiscal year.(b) Gallons pumped for ASR recharge and ASR production are included in annual water pumped.(c) Based on permitted rights authorized by the Edwards Aquifer Authority (EAA) as of December 31st. Under current EAA rules, authorized amounts are subject to reductions of 20% to 44% during drought conditions.(d) Includes water available under contracts to purchase or produce water from the Trinity Aquifer, Carrizo Aquifer, Canyon Lake, Medina Lake and Lake Dunlap as well as SAWS brackish desalination plant. There are no legally imposed reductions in these supplies during drought; however, production of water from certain of these sources is physically limited during periods of drought.(e) Represents cumulative net amount stored in ASR (Recharge - Net production)(f) Increase in amounts from 2014 to 2015 reflect the merger of SAWS and SAWS District Special Project effective January 1, 2015.
123
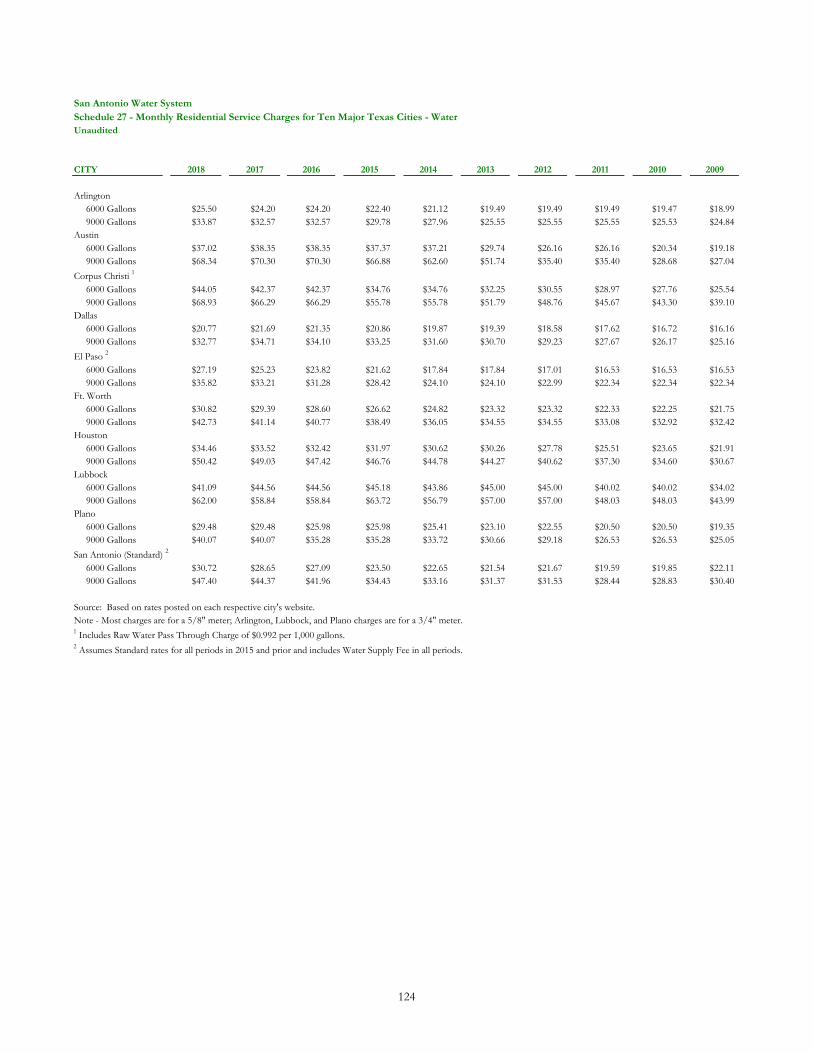
San Antonio Water SystemSchedule 27 - Monthly Residential Service Charges for Ten Major Texas Cities - WaterUnaudited
CITY 2018 2017 2016 2015 2014 2013 2012 2011 2010 2009
Arlington 6000 Gallons $25.50 $24.20 $24.20 $22.40 $21.12 $19.49 $19.49 $19.49 $19.47 $18.99 9000 Gallons $33.87 $32.57 $32.57 $29.78 $27.96 $25.55 $25.55 $25.55 $25.53 $24.84Austin 6000 Gallons $37.02 $38.35 $38.35 $37.37 $37.21 $29.74 $26.16 $26.16 $20.34 $19.18 9000 Gallons $68.34 $70.30 $70.30 $66.88 $62.60 $51.74 $35.40 $35.40 $28.68 $27.04
Corpus Christi 1
6000 Gallons $44.05 $42.37 $42.37 $34.76 $34.76 $32.25 $30.55 $28.97 $27.76 $25.54 9000 Gallons $68.93 $66.29 $66.29 $55.78 $55.78 $51.79 $48.76 $45.67 $43.30 $39.10Dallas 6000 Gallons $20.77 $21.69 $21.35 $20.86 $19.87 $19.39 $18.58 $17.62 $16.72 $16.16 9000 Gallons $32.77 $34.71 $34.10 $33.25 $31.60 $30.70 $29.23 $27.67 $26.17 $25.16
El Paso 2
6000 Gallons $27.19 $25.23 $23.82 $21.62 $17.84 $17.84 $17.01 $16.53 $16.53 $16.53 9000 Gallons $35.82 $33.21 $31.28 $28.42 $24.10 $24.10 $22.99 $22.34 $22.34 $22.34Ft. Worth 6000 Gallons $30.82 $29.39 $28.60 $26.62 $24.82 $23.32 $23.32 $22.33 $22.25 $21.75 9000 Gallons $42.73 $41.14 $40.77 $38.49 $36.05 $34.55 $34.55 $33.08 $32.92 $32.42Houston 6000 Gallons $34.46 $33.52 $32.42 $31.97 $30.62 $30.26 $27.78 $25.51 $23.65 $21.91 9000 Gallons $50.42 $49.03 $47.42 $46.76 $44.78 $44.27 $40.62 $37.30 $34.60 $30.67Lubbock 6000 Gallons $41.09 $44.56 $44.56 $45.18 $43.86 $45.00 $45.00 $40.02 $40.02 $34.02 9000 Gallons $62.00 $58.84 $58.84 $63.72 $56.79 $57.00 $57.00 $48.03 $48.03 $43.99Plano 6000 Gallons $29.48 $29.48 $25.98 $25.98 $25.41 $23.10 $22.55 $20.50 $20.50 $19.35 9000 Gallons $40.07 $40.07 $35.28 $35.28 $33.72 $30.66 $29.18 $26.53 $26.53 $25.05
San Antonio (Standard) 2
6000 Gallons $30.72 $28.65 $27.09 $23.50 $22.65 $21.54 $21.67 $19.59 $19.85 $22.11 9000 Gallons $47.40 $44.37 $41.96 $34.43 $33.16 $31.37 $31.53 $28.44 $28.83 $30.40
Source: Based on rates posted on each respective city's website.Note - Most charges are for a 5/8" meter; Arlington, Lubbock, and Plano charges are for a 3/4" meter.1 Includes Raw Water Pass Through Charge of $0.992 per 1,000 gallons.2 Assumes Standard rates for all periods in 2015 and prior and includes Water Supply Fee in all periods.
124
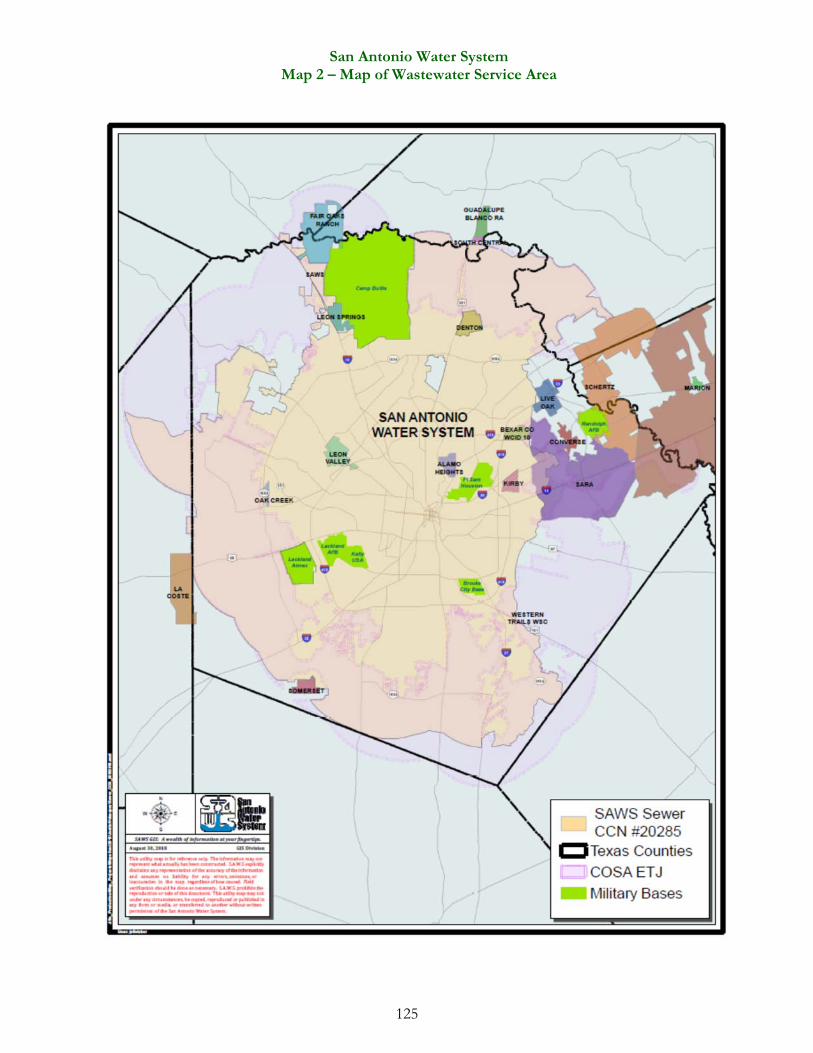
San Antonio Water System Map 2 – Map of Wastewater Service Area
125
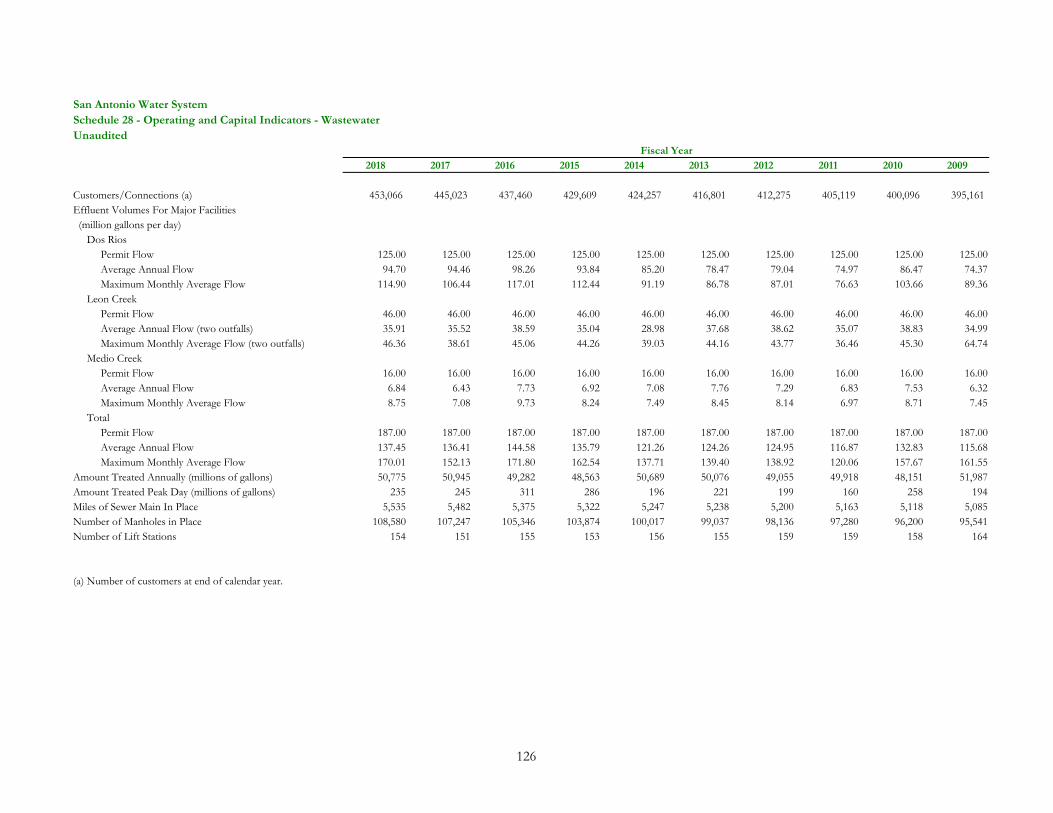
San Antonio Water SystemSchedule 28 - Operating and Capital Indicators - WastewaterUnaudited
2018 2017 2016 2015 2014 2013 2012 2011 2010 2009
Customers/Connections (a) 453,066 445,023 437,460 429,609 424,257 416,801 412,275 405,119 400,096 395,161 Effluent Volumes For Major Facilities (million gallons per day) Dos Rios Permit Flow 125.00 125.00 125.00 125.00 125.00 125.00 125.00 125.00 125.00 125.00 Average Annual Flow 94.70 94.46 98.26 93.84 85.20 78.47 79.04 74.97 86.47 74.37 Maximum Monthly Average Flow 114.90 106.44 117.01 112.44 91.19 86.78 87.01 76.63 103.66 89.36 Leon Creek Permit Flow 46.00 46.00 46.00 46.00 46.00 46.00 46.00 46.00 46.00 46.00 Average Annual Flow (two outfalls) 35.91 35.52 38.59 35.04 28.98 37.68 38.62 35.07 38.83 34.99 Maximum Monthly Average Flow (two outfalls) 46.36 38.61 45.06 44.26 39.03 44.16 43.77 36.46 45.30 64.74 Medio Creek Permit Flow 16.00 16.00 16.00 16.00 16.00 16.00 16.00 16.00 16.00 16.00 Average Annual Flow 6.84 6.43 7.73 6.92 7.08 7.76 7.29 6.83 7.53 6.32 Maximum Monthly Average Flow 8.75 7.08 9.73 8.24 7.49 8.45 8.14 6.97 8.71 7.45 Total Permit Flow 187.00 187.00 187.00 187.00 187.00 187.00 187.00 187.00 187.00 187.00 Average Annual Flow 137.45 136.41 144.58 135.79 121.26 124.26 124.95 116.87 132.83 115.68 Maximum Monthly Average Flow 170.01 152.13 171.80 162.54 137.71 139.40 138.92 120.06 157.67 161.55Amount Treated Annually (millions of gallons) 50,775 50,945 49,282 48,563 50,689 50,076 49,055 49,918 48,151 51,987Amount Treated Peak Day (millions of gallons) 235 245 311 286 196 221 199 160 258 194Miles of Sewer Main In Place 5,535 5,482 5,375 5,322 5,247 5,238 5,200 5,163 5,118 5,085Number of Manholes in Place 108,580 107,247 105,346 103,874 100,017 99,037 98,136 97,280 96,200 95,541Number of Lift Stations 154 151 155 153 156 155 159 159 158 164
(a) Number of customers at end of calendar year.
Fiscal Year
126
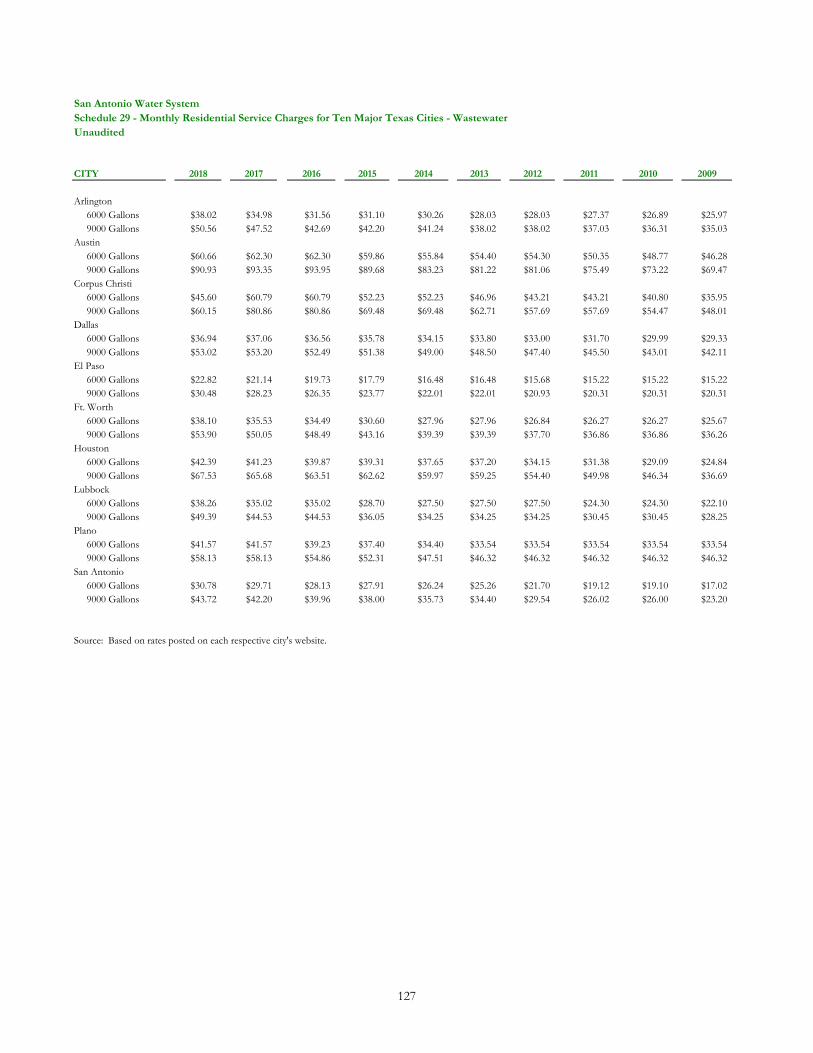
San Antonio Water SystemSchedule 29 - Monthly Residential Service Charges for Ten Major Texas Cities - WastewaterUnaudited
CITY 2018 2017 2016 2015 2014 2013 2012 2011 2010 2009
Arlington 6000 Gallons $38.02 $34.98 $31.56 $31.10 $30.26 $28.03 $28.03 $27.37 $26.89 $25.97 9000 Gallons $50.56 $47.52 $42.69 $42.20 $41.24 $38.02 $38.02 $37.03 $36.31 $35.03Austin 6000 Gallons $60.66 $62.30 $62.30 $59.86 $55.84 $54.40 $54.30 $50.35 $48.77 $46.28 9000 Gallons $90.93 $93.35 $93.95 $89.68 $83.23 $81.22 $81.06 $75.49 $73.22 $69.47Corpus Christi 6000 Gallons $45.60 $60.79 $60.79 $52.23 $52.23 $46.96 $43.21 $43.21 $40.80 $35.95 9000 Gallons $60.15 $80.86 $80.86 $69.48 $69.48 $62.71 $57.69 $57.69 $54.47 $48.01Dallas 6000 Gallons $36.94 $37.06 $36.56 $35.78 $34.15 $33.80 $33.00 $31.70 $29.99 $29.33 9000 Gallons $53.02 $53.20 $52.49 $51.38 $49.00 $48.50 $47.40 $45.50 $43.01 $42.11El Paso 6000 Gallons $22.82 $21.14 $19.73 $17.79 $16.48 $16.48 $15.68 $15.22 $15.22 $15.22 9000 Gallons $30.48 $28.23 $26.35 $23.77 $22.01 $22.01 $20.93 $20.31 $20.31 $20.31Ft. Worth 6000 Gallons $38.10 $35.53 $34.49 $30.60 $27.96 $27.96 $26.84 $26.27 $26.27 $25.67 9000 Gallons $53.90 $50.05 $48.49 $43.16 $39.39 $39.39 $37.70 $36.86 $36.86 $36.26Houston 6000 Gallons $42.39 $41.23 $39.87 $39.31 $37.65 $37.20 $34.15 $31.38 $29.09 $24.84 9000 Gallons $67.53 $65.68 $63.51 $62.62 $59.97 $59.25 $54.40 $49.98 $46.34 $36.69Lubbock 6000 Gallons $38.26 $35.02 $35.02 $28.70 $27.50 $27.50 $27.50 $24.30 $24.30 $22.10 9000 Gallons $49.39 $44.53 $44.53 $36.05 $34.25 $34.25 $34.25 $30.45 $30.45 $28.25Plano 6000 Gallons $41.57 $41.57 $39.23 $37.40 $34.40 $33.54 $33.54 $33.54 $33.54 $33.54 9000 Gallons $58.13 $58.13 $54.86 $52.31 $47.51 $46.32 $46.32 $46.32 $46.32 $46.32San Antonio 6000 Gallons $30.78 $29.71 $28.13 $27.91 $26.24 $25.26 $21.70 $19.12 $19.10 $17.02 9000 Gallons $43.72 $42.20 $39.96 $38.00 $35.73 $34.40 $29.54 $26.02 $26.00 $23.20
Source: Based on rates posted on each respective city's website.
127
Comprehensive Annual Financial Report
BONDED DEBT SCHEDULES AND ANALYSES
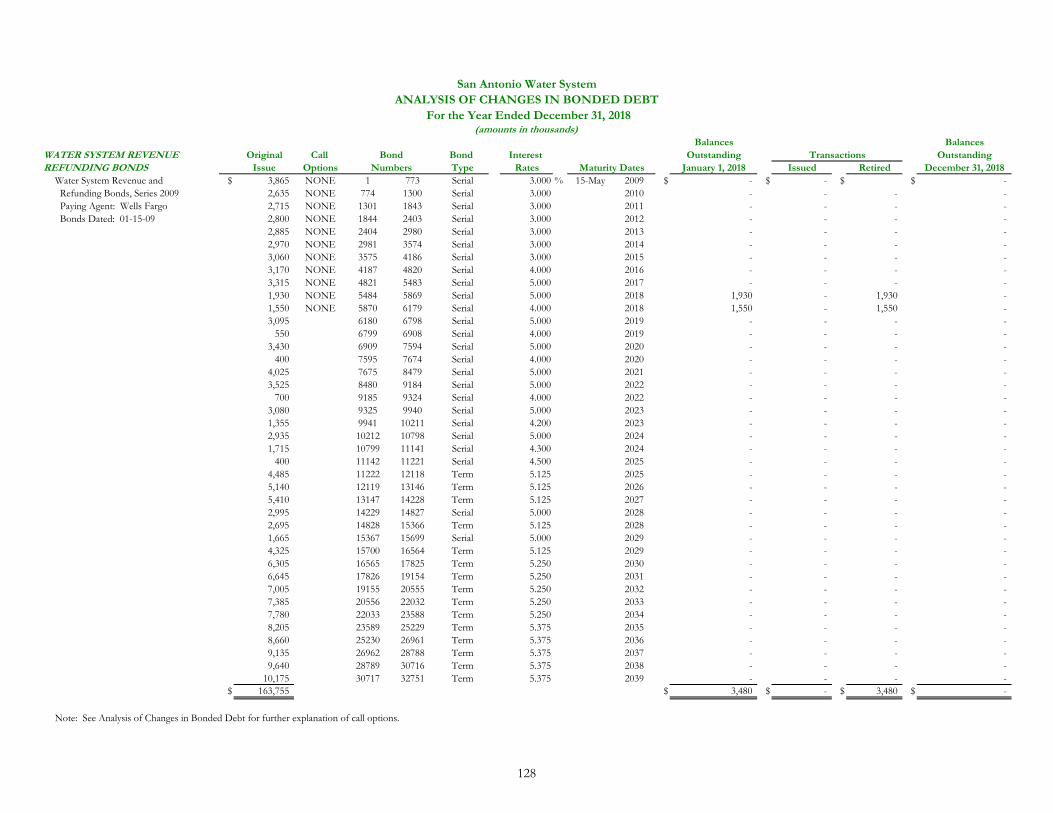
San Antonio Water SystemANALYSIS OF CHANGES IN BONDED DEBT
For the Year Ended December 31, 2018(amounts in thousands)
Balances BalancesWATER SYSTEM REVENUE Original Call Bond Interest Outstanding Transactions OutstandingREFUNDING BONDS Issue Options Type Rates Maturity Dates January 1, 2018 Issued Retired December 31, 2018
Water System Revenue and $ 3,865 NONE 1 773 Serial 3.000 % 15-May 2009 $ - $ - $ $ - Refunding Bonds, Series 2009 2,635 NONE 774 1300 Serial 3.000 2010 - - - - Paying Agent: Wells Fargo 2,715 NONE 1301 1843 Serial 3.000 2011 - - - - Bonds Dated: 01-15-09 2,800 NONE 1844 2403 Serial 3.000 2012 - - - -
2,885 NONE 2404 2980 Serial 3.000 2013 - - - - 2,970 NONE 2981 3574 Serial 3.000 2014 - - - - 3,060 NONE 3575 4186 Serial 3.000 2015 - - - - 3,170 NONE 4187 4820 Serial 4.000 2016 - - - - 3,315 NONE 4821 5483 Serial 5.000 2017 - - - - 1,930 NONE 5484 5869 Serial 5.000 2018 1,930 - 1,930 - 1,550 NONE 5870 6179 Serial 4.000 2018 1,550 - 1,550 - 3,095 6180 6798 Serial 5.000 2019 - - - -
550 6799 6908 Serial 4.000 2019 - - - - 3,430 6909 7594 Serial 5.000 2020 - - - -
400 7595 7674 Serial 4.000 2020 - - - - 4,025 7675 8479 Serial 5.000 2021 - - - - 3,525 8480 9184 Serial 5.000 2022 - - - -
700 9185 9324 Serial 4.000 2022 - - - - 3,080 9325 9940 Serial 5.000 2023 - - - - 1,355 9941 10211 Serial 4.200 2023 - - - - 2,935 10212 10798 Serial 5.000 2024 - - - - 1,715 10799 11141 Serial 4.300 2024 - - - -
400 11142 11221 Serial 4.500 2025 - - - - 4,485 11222 12118 Term 5.125 2025 - - - - 5,140 12119 13146 Term 5.125 2026 - - - - 5,410 13147 14228 Term 5.125 2027 - - - - 2,995 14229 14827 Serial 5.000 2028 - - - - 2,695 14828 15366 Term 5.125 2028 - - - - 1,665 15367 15699 Serial 5.000 2029 - - - - 4,325 15700 16564 Term 5.125 2029 - - - - 6,305 16565 17825 Term 5.250 2030 - - - - 6,645 17826 19154 Term 5.250 2031 - - - - 7,005 19155 20555 Term 5.250 2032 - - - - 7,385 20556 22032 Term 5.250 2033 - - - - 7,780 22033 23588 Term 5.250 2034 - - - - 8,205 23589 25229 Term 5.375 2035 - - - - 8,660 25230 26961 Term 5.375 2036 - - - - 9,135 26962 28788 Term 5.375 2037 - - - - 9,640 28789 30716 Term 5.375 2038 - - - -
10,175 30717 32751 Term 5.375 2039 - - - - $ 163,755 $ 3,480 $ - $ 3,480 $ -
Note: See Analysis of Changes in Bonded Debt for further explanation of call options.
BondNumbers
128
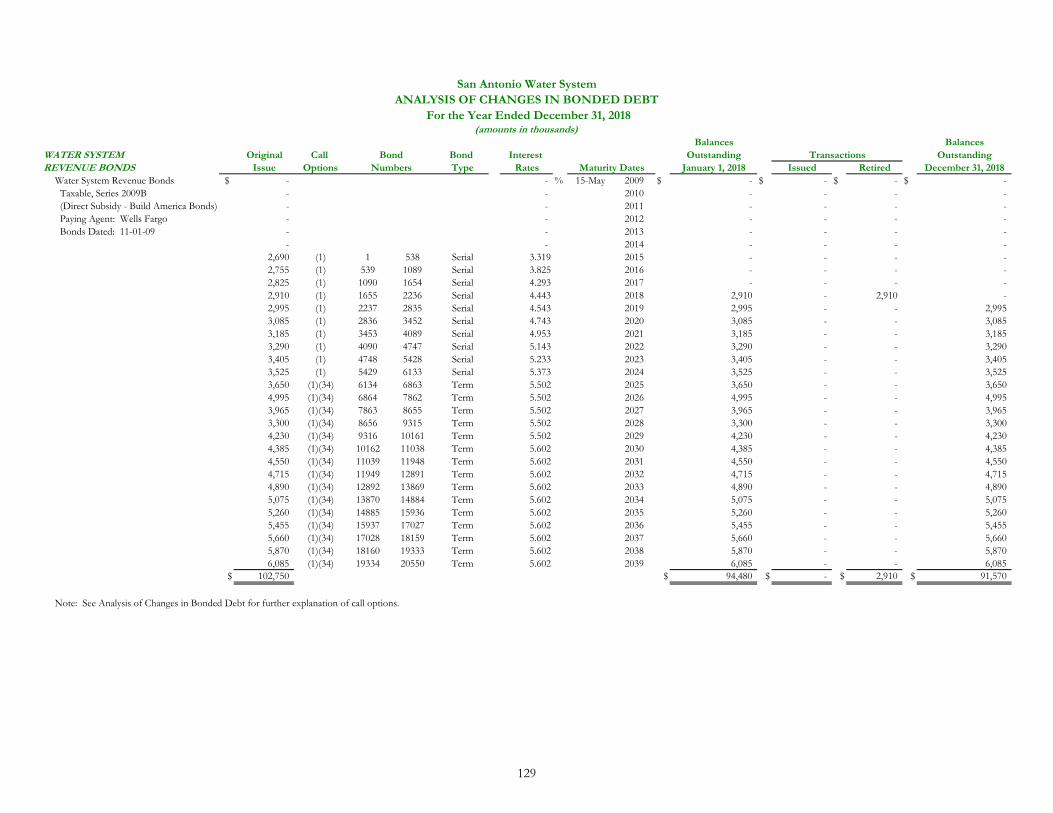
San Antonio Water SystemANALYSIS OF CHANGES IN BONDED DEBT
For the Year Ended December 31, 2018(amounts in thousands)
Balances BalancesWATER SYSTEM Original Call Bond Interest Outstanding Transactions OutstandingREVENUE BONDS Issue Options Type Rates Maturity Dates January 1, 2018 Issued Retired December 31, 2018
Water System Revenue Bonds $ - - % 15-May 2009 $ - $ - $ - $ - Taxable, Series 2009B - - 2010 - - - - (Direct Subsidy - Build America Bonds) - - 2011 - - - - Paying Agent: Wells Fargo - - 2012 - - - - Bonds Dated: 11-01-09 - - 2013 - - - -
- - 2014 - - - - 2,690 (1) 1 538 Serial 3.319 2015 - - - - 2,755 (1) 539 1089 Serial 3.825 2016 - - - - 2,825 (1) 1090 1654 Serial 4.293 2017 - - - - 2,910 (1) 1655 2236 Serial 4.443 2018 2,910 - 2,910 - 2,995 (1) 2237 2835 Serial 4.543 2019 2,995 - - 2,995 3,085 (1) 2836 3452 Serial 4.743 2020 3,085 - - 3,085 3,185 (1) 3453 4089 Serial 4.953 2021 3,185 - - 3,185 3,290 (1) 4090 4747 Serial 5.143 2022 3,290 - - 3,290 3,405 (1) 4748 5428 Serial 5.233 2023 3,405 - - 3,405 3,525 (1) 5429 6133 Serial 5.373 2024 3,525 - - 3,525 3,650 (1)(34) 6134 6863 Term 5.502 2025 3,650 - - 3,650 4,995 (1)(34) 6864 7862 Term 5.502 2026 4,995 - - 4,995 3,965 (1)(34) 7863 8655 Term 5.502 2027 3,965 - - 3,965 3,300 (1)(34) 8656 9315 Term 5.502 2028 3,300 - - 3,300 4,230 (1)(34) 9316 10161 Term 5.502 2029 4,230 - - 4,230 4,385 (1)(34) 10162 11038 Term 5.602 2030 4,385 - - 4,385 4,550 (1)(34) 11039 11948 Term 5.602 2031 4,550 - - 4,550 4,715 (1)(34) 11949 12891 Term 5.602 2032 4,715 - - 4,715 4,890 (1)(34) 12892 13869 Term 5.602 2033 4,890 - - 4,890 5,075 (1)(34) 13870 14884 Term 5.602 2034 5,075 - - 5,075 5,260 (1)(34) 14885 15936 Term 5.602 2035 5,260 - - 5,260 5,455 (1)(34) 15937 17027 Term 5.602 2036 5,455 - - 5,455 5,660 (1)(34) 17028 18159 Term 5.602 2037 5,660 - - 5,660 5,870 (1)(34) 18160 19333 Term 5.602 2038 5,870 - - 5,870 6,085 (1)(34) 19334 20550 Term 5.602 2039 6,085 - - 6,085
$ 102,750 $ 94,480 $ - $ 2,910 $ 91,570
Note: See Analysis of Changes in Bonded Debt for further explanation of call options.
NumbersBond
129
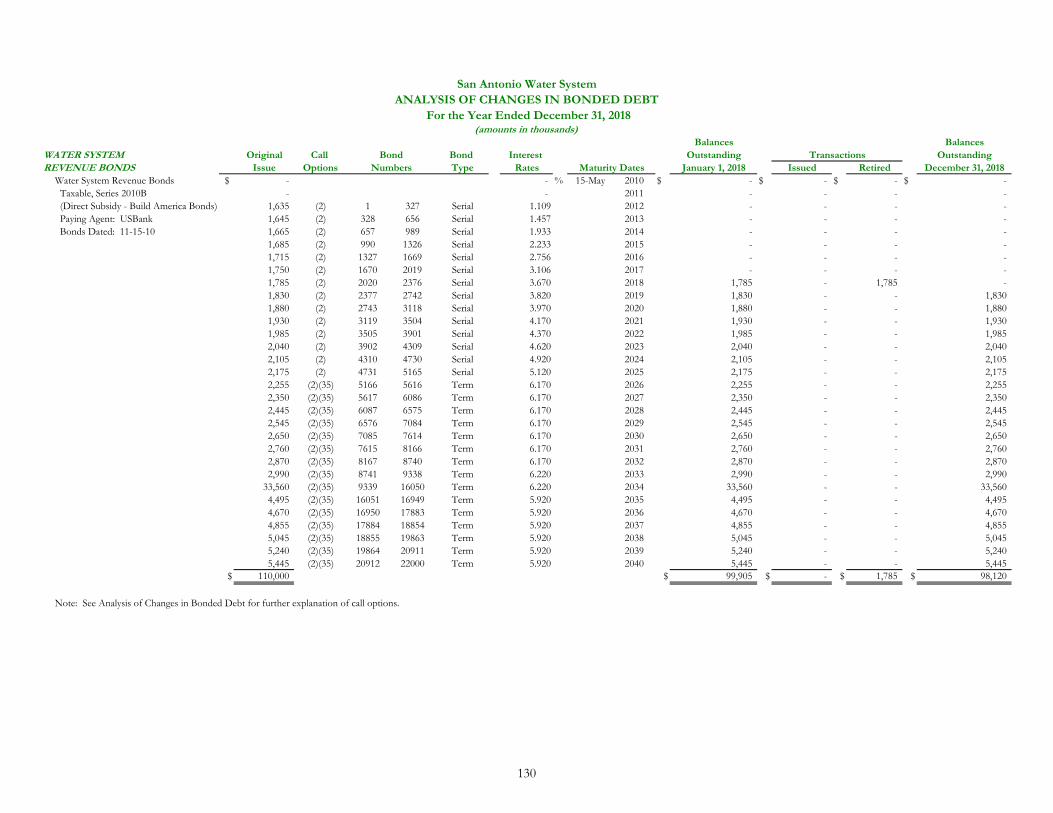
San Antonio Water SystemANALYSIS OF CHANGES IN BONDED DEBT
For the Year Ended December 31, 2018(amounts in thousands)
Balances BalancesWATER SYSTEM Original Call Bond Interest Outstanding Transactions OutstandingREVENUE BONDS Issue Options Type Rates Maturity Dates January 1, 2018 Issued Retired December 31, 2018
Water System Revenue Bonds $ - - % 15-May 2010 $ - $ - $ - $ - Taxable, Series 2010B - - 2011 - - - - (Direct Subsidy - Build America Bonds) 1,635 (2) 1 327 Serial 1.109 2012 - - - - Paying Agent: USBank 1,645 (2) 328 656 Serial 1.457 2013 - - - - Bonds Dated: 11-15-10 1,665 (2) 657 989 Serial 1.933 2014 - - - -
1,685 (2) 990 1326 Serial 2.233 2015 - - - - 1,715 (2) 1327 1669 Serial 2.756 2016 - - - - 1,750 (2) 1670 2019 Serial 3.106 2017 - - - - 1,785 (2) 2020 2376 Serial 3.670 2018 1,785 - 1,785 - 1,830 (2) 2377 2742 Serial 3.820 2019 1,830 - - 1,830 1,880 (2) 2743 3118 Serial 3.970 2020 1,880 - - 1,880 1,930 (2) 3119 3504 Serial 4.170 2021 1,930 - - 1,930 1,985 (2) 3505 3901 Serial 4.370 2022 1,985 - - 1,985 2,040 (2) 3902 4309 Serial 4.620 2023 2,040 - - 2,040 2,105 (2) 4310 4730 Serial 4.920 2024 2,105 - - 2,105 2,175 (2) 4731 5165 Serial 5.120 2025 2,175 - - 2,175 2,255 (2)(35) 5166 5616 Term 6.170 2026 2,255 - - 2,255 2,350 (2)(35) 5617 6086 Term 6.170 2027 2,350 - - 2,350 2,445 (2)(35) 6087 6575 Term 6.170 2028 2,445 - - 2,445 2,545 (2)(35) 6576 7084 Term 6.170 2029 2,545 - - 2,545 2,650 (2)(35) 7085 7614 Term 6.170 2030 2,650 - - 2,650 2,760 (2)(35) 7615 8166 Term 6.170 2031 2,760 - - 2,760 2,870 (2)(35) 8167 8740 Term 6.170 2032 2,870 - - 2,870 2,990 (2)(35) 8741 9338 Term 6.220 2033 2,990 - - 2,990
33,560 (2)(35) 9339 16050 Term 6.220 2034 33,560 - - 33,560 4,495 (2)(35) 16051 16949 Term 5.920 2035 4,495 - - 4,495 4,670 (2)(35) 16950 17883 Term 5.920 2036 4,670 - - 4,670 4,855 (2)(35) 17884 18854 Term 5.920 2037 4,855 - - 4,855 5,045 (2)(35) 18855 19863 Term 5.920 2038 5,045 - - 5,045 5,240 (2)(35) 19864 20911 Term 5.920 2039 5,240 - - 5,240 5,445 (2)(35) 20912 22000 Term 5.920 2040 5,445 - - 5,445
$ 110,000 $ 99,905 $ - $ 1,785 $ 98,120
Note: See Analysis of Changes in Bonded Debt for further explanation of call options.
BondNumbers
130
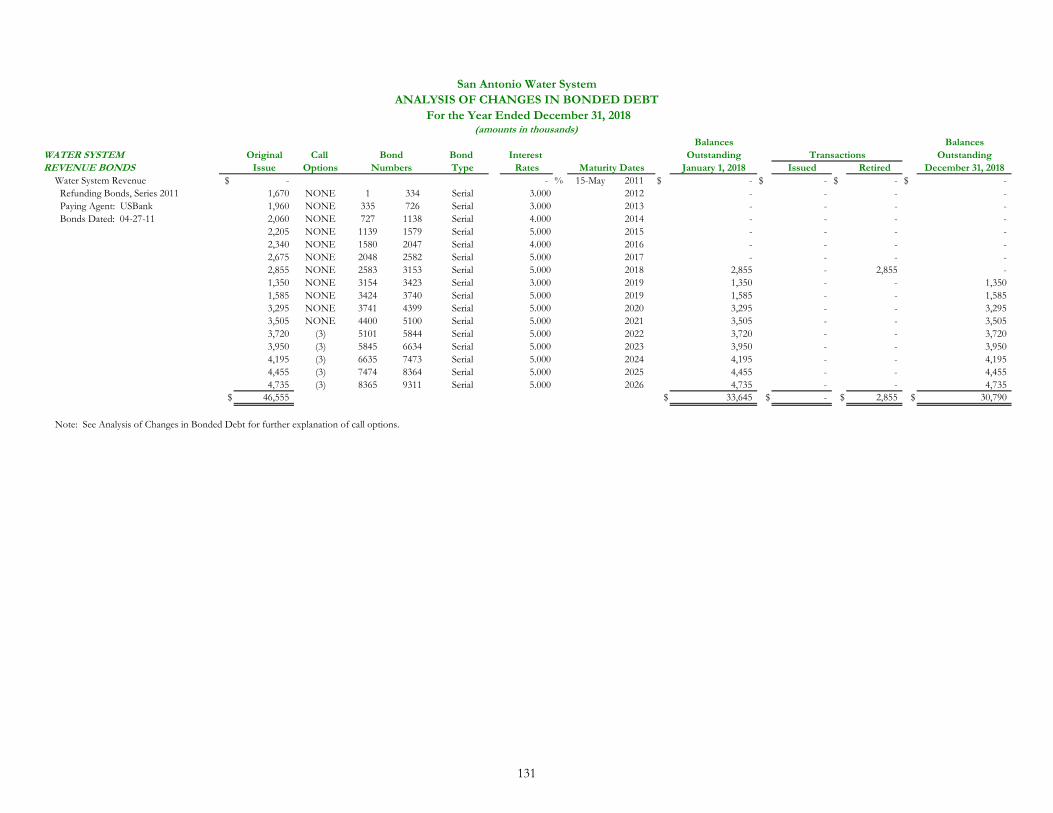
San Antonio Water SystemANALYSIS OF CHANGES IN BONDED DEBT
For the Year Ended December 31, 2018(amounts in thousands)
Balances BalancesWATER SYSTEM Original Call Bond Interest Outstanding Transactions OutstandingREVENUE BONDS Issue Options Type Rates Maturity Dates January 1, 2018 Issued Retired December 31, 2018
Water System Revenue $ - - % 15-May 2011 $ - $ - $ - $ - Refunding Bonds, Series 2011 1,670 NONE 1 334 Serial 3.000 2012 - - - - Paying Agent: USBank 1,960 NONE 335 726 Serial 3.000 2013 - - - - Bonds Dated: 04-27-11 2,060 NONE 727 1138 Serial 4.000 2014 - - - -
2,205 NONE 1139 1579 Serial 5.000 2015 - - - - 2,340 NONE 1580 2047 Serial 4.000 2016 - - - - 2,675 NONE 2048 2582 Serial 5.000 2017 - - - - 2,855 NONE 2583 3153 Serial 5.000 2018 2,855 - 2,855 - 1,350 NONE 3154 3423 Serial 3.000 2019 1,350 - - 1,350 1,585 NONE 3424 3740 Serial 5.000 2019 1,585 - - 1,585 3,295 NONE 3741 4399 Serial 5.000 2020 3,295 - - 3,295 3,505 NONE 4400 5100 Serial 5.000 2021 3,505 - - 3,505 3,720 (3) 5101 5844 Serial 5.000 2022 3,720 - - 3,720 3,950 (3) 5845 6634 Serial 5.000 2023 3,950 - - 3,950 4,195 (3) 6635 7473 Serial 5.000 2024 4,195 - - 4,195 4,455 (3) 7474 8364 Serial 5.000 2025 4,455 - - 4,455 4,735 (3) 8365 9311 Serial 5.000 2026 4,735 - - 4,735
$ 46,555 $ 33,645 $ - $ 2,855 $ 30,790
Note: See Analysis of Changes in Bonded Debt for further explanation of call options.
BondNumbers
131
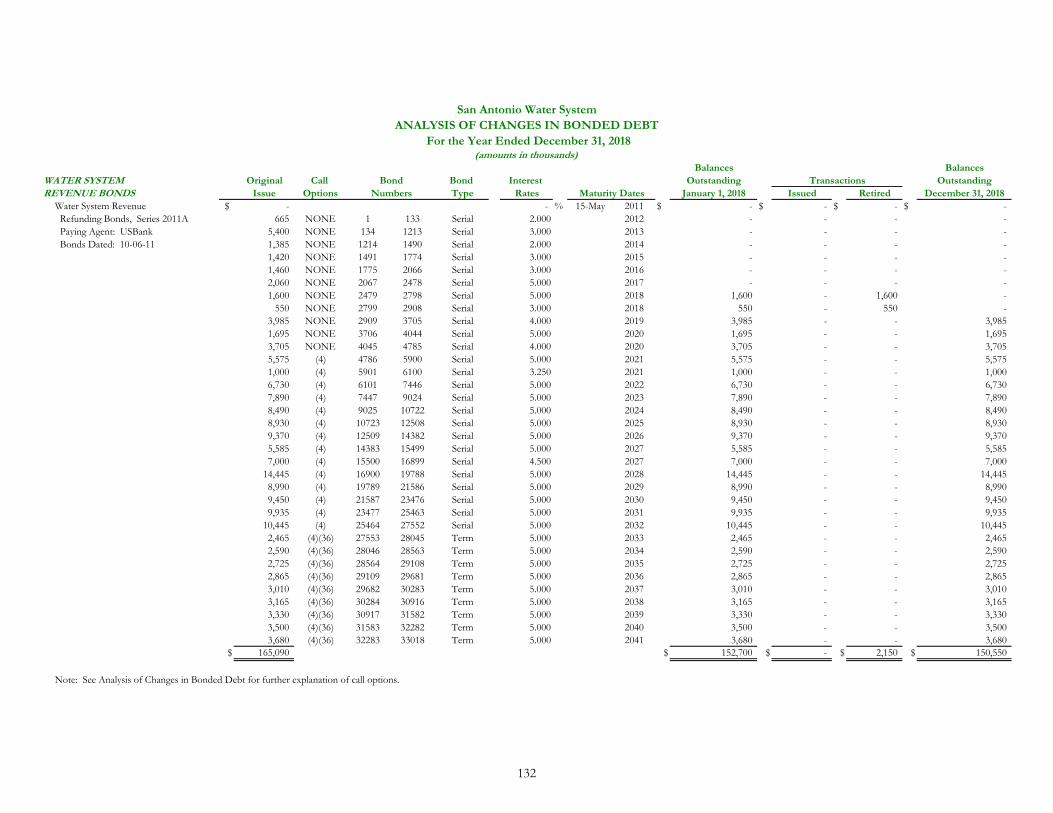
San Antonio Water SystemANALYSIS OF CHANGES IN BONDED DEBT
For the Year Ended December 31, 2018(amounts in thousands)
Balances BalancesWATER SYSTEM Original Call Bond Interest Outstanding Transactions OutstandingREVENUE BONDS Issue Options Type Rates Maturity Dates January 1, 2018 Issued Retired December 31, 2018
Water System Revenue $ - - % 15-May 2011 $ - $ - $ - $ - Refunding Bonds, Series 2011A 665 NONE 1 133 Serial 2.000 2012 - - - - Paying Agent: USBank 5,400 NONE 134 1213 Serial 3.000 2013 - - - - Bonds Dated: 10-06-11 1,385 NONE 1214 1490 Serial 2.000 2014 - - - -
1,420 NONE 1491 1774 Serial 3.000 2015 - - - - 1,460 NONE 1775 2066 Serial 3.000 2016 - - - - 2,060 NONE 2067 2478 Serial 5.000 2017 - - - - 1,600 NONE 2479 2798 Serial 5.000 2018 1,600 - 1,600 -
550 NONE 2799 2908 Serial 3.000 2018 550 - 550 - 3,985 NONE 2909 3705 Serial 4.000 2019 3,985 - - 3,985 1,695 NONE 3706 4044 Serial 5.000 2020 1,695 - - 1,695 3,705 NONE 4045 4785 Serial 4.000 2020 3,705 - - 3,705 5,575 (4) 4786 5900 Serial 5.000 2021 5,575 - - 5,575 1,000 (4) 5901 6100 Serial 3.250 2021 1,000 - - 1,000 6,730 (4) 6101 7446 Serial 5.000 2022 6,730 - - 6,730 7,890 (4) 7447 9024 Serial 5.000 2023 7,890 - - 7,890 8,490 (4) 9025 10722 Serial 5.000 2024 8,490 - - 8,490 8,930 (4) 10723 12508 Serial 5.000 2025 8,930 - - 8,930 9,370 (4) 12509 14382 Serial 5.000 2026 9,370 - - 9,370 5,585 (4) 14383 15499 Serial 5.000 2027 5,585 - - 5,585 7,000 (4) 15500 16899 Serial 4.500 2027 7,000 - - 7,000
14,445 (4) 16900 19788 Serial 5.000 2028 14,445 - - 14,445 8,990 (4) 19789 21586 Serial 5.000 2029 8,990 - - 8,990 9,450 (4) 21587 23476 Serial 5.000 2030 9,450 - - 9,450 9,935 (4) 23477 25463 Serial 5.000 2031 9,935 - - 9,935
10,445 (4) 25464 27552 Serial 5.000 2032 10,445 - - 10,445 2,465 (4)(36) 27553 28045 Term 5.000 2033 2,465 - - 2,465 2,590 (4)(36) 28046 28563 Term 5.000 2034 2,590 - - 2,590 2,725 (4)(36) 28564 29108 Term 5.000 2035 2,725 - - 2,725 2,865 (4)(36) 29109 29681 Term 5.000 2036 2,865 - - 2,865 3,010 (4)(36) 29682 30283 Term 5.000 2037 3,010 - - 3,010 3,165 (4)(36) 30284 30916 Term 5.000 2038 3,165 - - 3,165 3,330 (4)(36) 30917 31582 Term 5.000 2039 3,330 - - 3,330 3,500 (4)(36) 31583 32282 Term 5.000 2040 3,500 - - 3,500 3,680 (4)(36) 32283 33018 Term 5.000 2041 3,680 - - 3,680
$ 165,090 $ 152,700 $ - $ 2,150 $ 150,550
Note: See Analysis of Changes in Bonded Debt for further explanation of call options.
NumbersBond
132
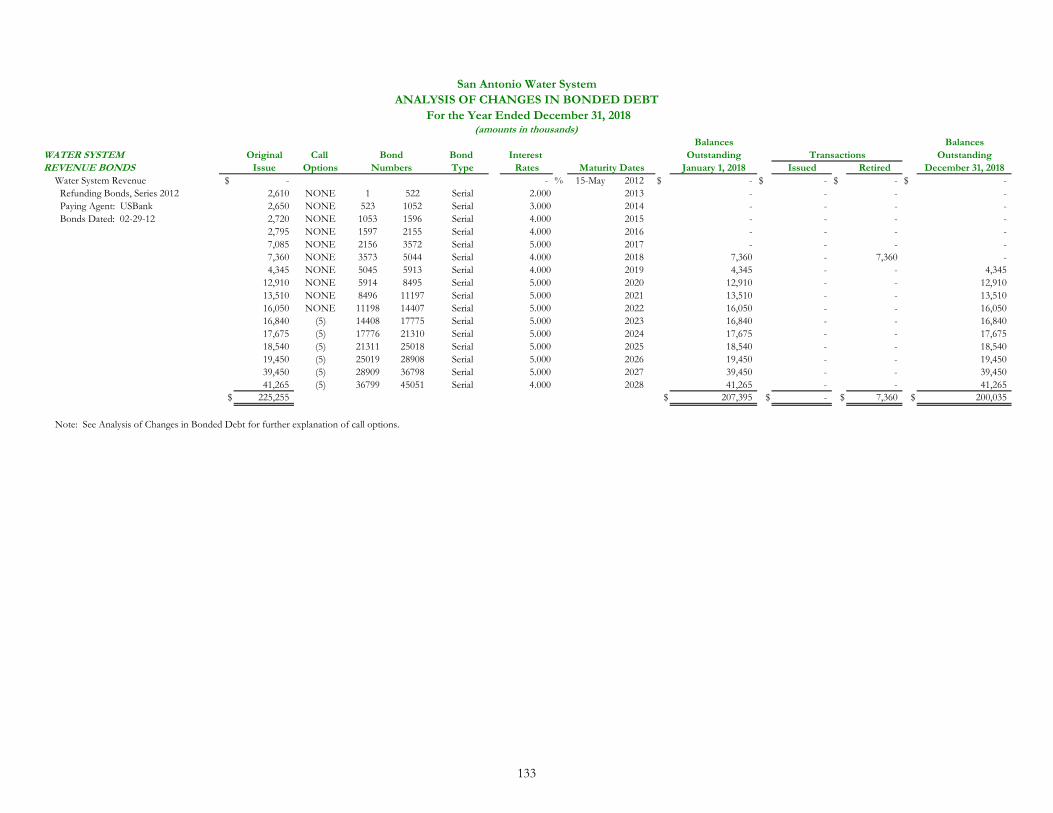
San Antonio Water SystemANALYSIS OF CHANGES IN BONDED DEBT
For the Year Ended December 31, 2018(amounts in thousands)
Balances BalancesWATER SYSTEM Original Call Bond Interest Outstanding Transactions OutstandingREVENUE BONDS Issue Options Type Rates Maturity Dates January 1, 2018 Issued Retired December 31, 2018
Water System Revenue $ - - % 15-May 2012 $ - $ - $ - $ - Refunding Bonds, Series 2012 2,610 NONE 1 522 Serial 2.000 2013 - - - - Paying Agent: USBank 2,650 NONE 523 1052 Serial 3.000 2014 - - - - Bonds Dated: 02-29-12 2,720 NONE 1053 1596 Serial 4.000 2015 - - - -
2,795 NONE 1597 2155 Serial 4.000 2016 - - - - 7,085 NONE 2156 3572 Serial 5.000 2017 - - - - 7,360 NONE 3573 5044 Serial 4.000 2018 7,360 - 7,360 - 4,345 NONE 5045 5913 Serial 4.000 2019 4,345 - - 4,345
12,910 NONE 5914 8495 Serial 5.000 2020 12,910 - - 12,910 13,510 NONE 8496 11197 Serial 5.000 2021 13,510 - - 13,510 16,050 NONE 11198 14407 Serial 5.000 2022 16,050 - - 16,050 16,840 (5) 14408 17775 Serial 5.000 2023 16,840 - - 16,840 17,675 (5) 17776 21310 Serial 5.000 2024 17,675 - - 17,675 18,540 (5) 21311 25018 Serial 5.000 2025 18,540 - - 18,540 19,450 (5) 25019 28908 Serial 5.000 2026 19,450 - - 19,450 39,450 (5) 28909 36798 Serial 5.000 2027 39,450 - - 39,450 41,265 (5) 36799 45051 Serial 4.000 2028 41,265 - - 41,265
$ 225,255 $ 207,395 $ - $ 7,360 $ 200,035
Note: See Analysis of Changes in Bonded Debt for further explanation of call options.
BondNumbers
133
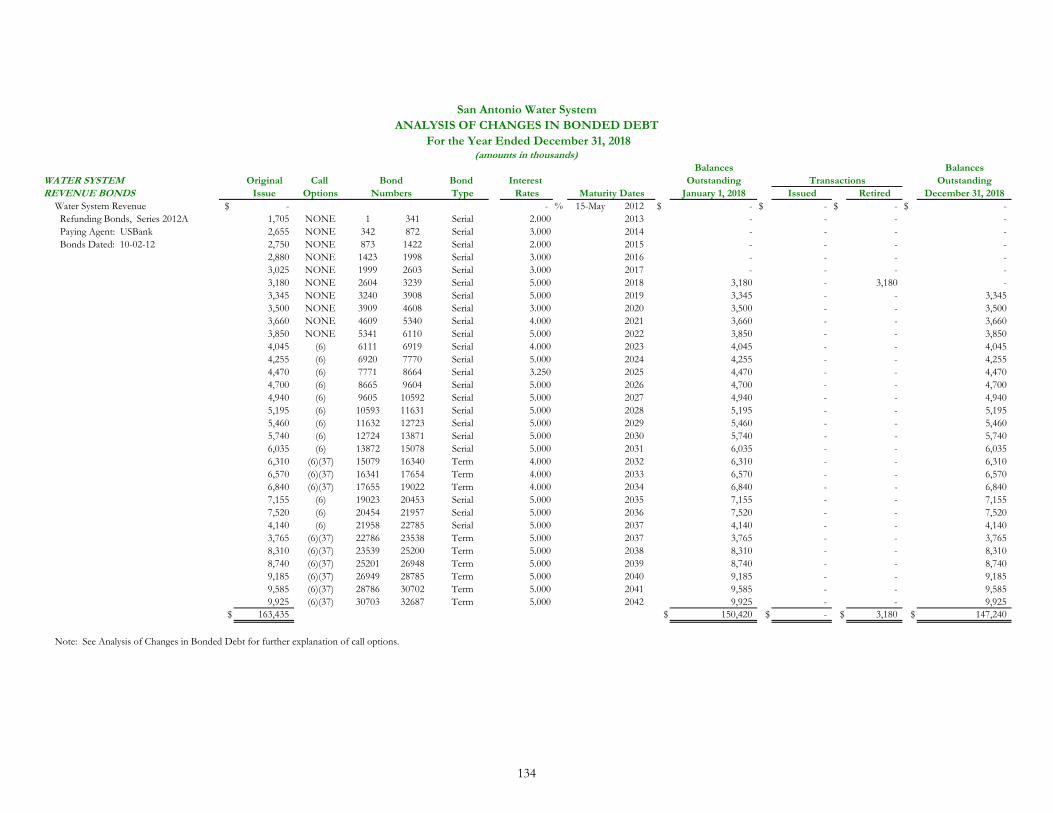
San Antonio Water SystemANALYSIS OF CHANGES IN BONDED DEBT
For the Year Ended December 31, 2018(amounts in thousands)
Balances BalancesWATER SYSTEM Original Call Bond Interest Outstanding Transactions OutstandingREVENUE BONDS Issue Options Type Rates Maturity Dates January 1, 2018 Issued Retired December 31, 2018
Water System Revenue $ - - % 15-May 2012 $ - $ - $ - $ - Refunding Bonds, Series 2012A 1,705 NONE 1 341 Serial 2.000 2013 - - - - Paying Agent: USBank 2,655 NONE 342 872 Serial 3.000 2014 - - - - Bonds Dated: 10-02-12 2,750 NONE 873 1422 Serial 2.000 2015 - - - -
2,880 NONE 1423 1998 Serial 3.000 2016 - - - - 3,025 NONE 1999 2603 Serial 3.000 2017 - - - - 3,180 NONE 2604 3239 Serial 5.000 2018 3,180 - 3,180 - 3,345 NONE 3240 3908 Serial 5.000 2019 3,345 - - 3,345 3,500 NONE 3909 4608 Serial 3.000 2020 3,500 - - 3,500 3,660 NONE 4609 5340 Serial 4.000 2021 3,660 - - 3,660 3,850 NONE 5341 6110 Serial 5.000 2022 3,850 - - 3,850 4,045 (6) 6111 6919 Serial 4.000 2023 4,045 - - 4,045 4,255 (6) 6920 7770 Serial 5.000 2024 4,255 - - 4,255 4,470 (6) 7771 8664 Serial 3.250 2025 4,470 - - 4,470 4,700 (6) 8665 9604 Serial 5.000 2026 4,700 - - 4,700 4,940 (6) 9605 10592 Serial 5.000 2027 4,940 - - 4,940 5,195 (6) 10593 11631 Serial 5.000 2028 5,195 - - 5,195 5,460 (6) 11632 12723 Serial 5.000 2029 5,460 - - 5,460 5,740 (6) 12724 13871 Serial 5.000 2030 5,740 - - 5,740 6,035 (6) 13872 15078 Serial 5.000 2031 6,035 - - 6,035 6,310 (6)(37) 15079 16340 Term 4.000 2032 6,310 - - 6,310 6,570 (6)(37) 16341 17654 Term 4.000 2033 6,570 - - 6,570 6,840 (6)(37) 17655 19022 Term 4.000 2034 6,840 - - 6,840 7,155 (6) 19023 20453 Serial 5.000 2035 7,155 - - 7,155 7,520 (6) 20454 21957 Serial 5.000 2036 7,520 - - 7,520 4,140 (6) 21958 22785 Serial 5.000 2037 4,140 - - 4,140 3,765 (6)(37) 22786 23538 Term 5.000 2037 3,765 - - 3,765 8,310 (6)(37) 23539 25200 Term 5.000 2038 8,310 - - 8,310 8,740 (6)(37) 25201 26948 Term 5.000 2039 8,740 - - 8,740 9,185 (6)(37) 26949 28785 Term 5.000 2040 9,185 - - 9,185 9,585 (6)(37) 28786 30702 Term 5.000 2041 9,585 - - 9,585 9,925 (6)(37) 30703 32687 Term 5.000 2042 9,925 - - 9,925
$ 163,435 $ 150,420 $ - $ 3,180 $ 147,240
Note: See Analysis of Changes in Bonded Debt for further explanation of call options.
BondNumbers
134
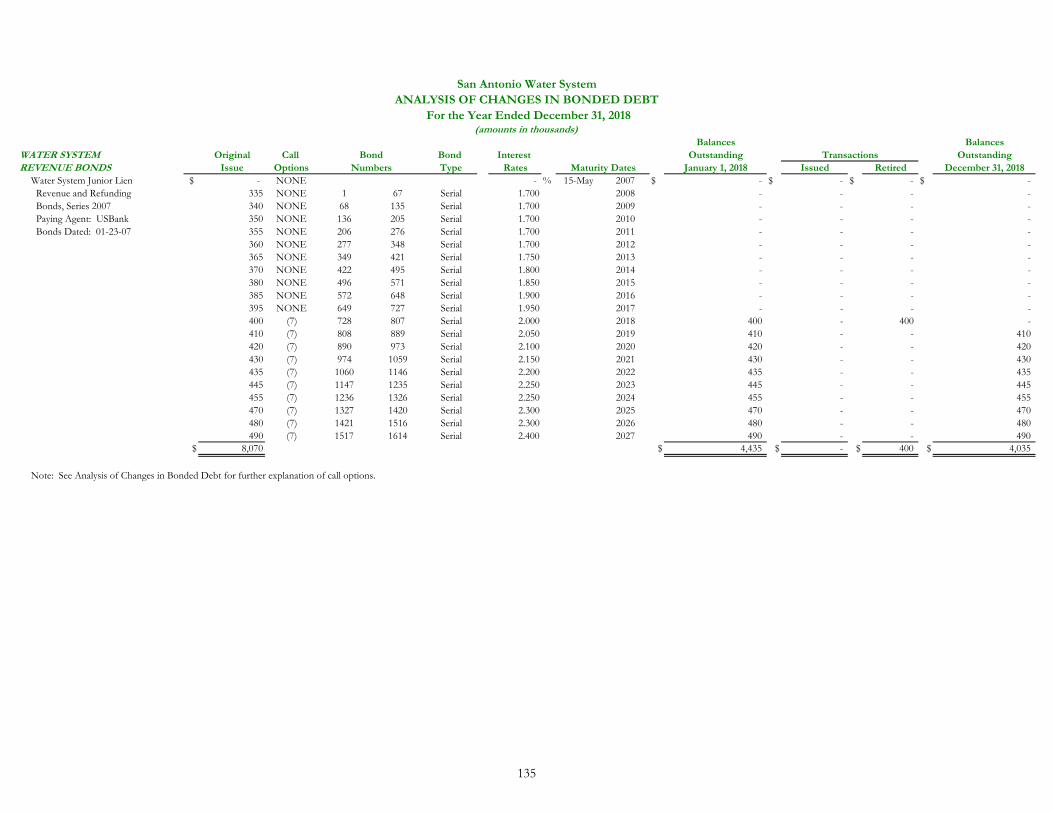
San Antonio Water SystemANALYSIS OF CHANGES IN BONDED DEBT
For the Year Ended December 31, 2018(amounts in thousands)
Balances BalancesWATER SYSTEM Original Call Bond Interest Outstanding Transactions OutstandingREVENUE BONDS Issue Options Type Rates Maturity Dates January 1, 2018 Issued Retired December 31, 2018
Water System Junior Lien $ - NONE - % 15-May 2007 $ - $ - $ - $ - Revenue and Refunding 335 NONE 1 67 Serial 1.700 2008 - - - - Bonds, Series 2007 340 NONE 68 135 Serial 1.700 2009 - - - - Paying Agent: USBank 350 NONE 136 205 Serial 1.700 2010 - - - - Bonds Dated: 01-23-07 355 NONE 206 276 Serial 1.700 2011 - - - -
360 NONE 277 348 Serial 1.700 2012 - - - - 365 NONE 349 421 Serial 1.750 2013 - - - - 370 NONE 422 495 Serial 1.800 2014 - - - - 380 NONE 496 571 Serial 1.850 2015 - - - - 385 NONE 572 648 Serial 1.900 2016 - - - - 395 NONE 649 727 Serial 1.950 2017 - - - - 400 (7) 728 807 Serial 2.000 2018 400 - 400 - 410 (7) 808 889 Serial 2.050 2019 410 - - 410 420 (7) 890 973 Serial 2.100 2020 420 - - 420 430 (7) 974 1059 Serial 2.150 2021 430 - - 430 435 (7) 1060 1146 Serial 2.200 2022 435 - - 435 445 (7) 1147 1235 Serial 2.250 2023 445 - - 445 455 (7) 1236 1326 Serial 2.250 2024 455 - - 455 470 (7) 1327 1420 Serial 2.300 2025 470 - - 470 480 (7) 1421 1516 Serial 2.300 2026 480 - - 480 490 (7) 1517 1614 Serial 2.400 2027 490 - - 490
$ 8,070 $ 4,435 $ - $ 400 $ 4,035
Note: See Analysis of Changes in Bonded Debt for further explanation of call options.
BondNumbers
135
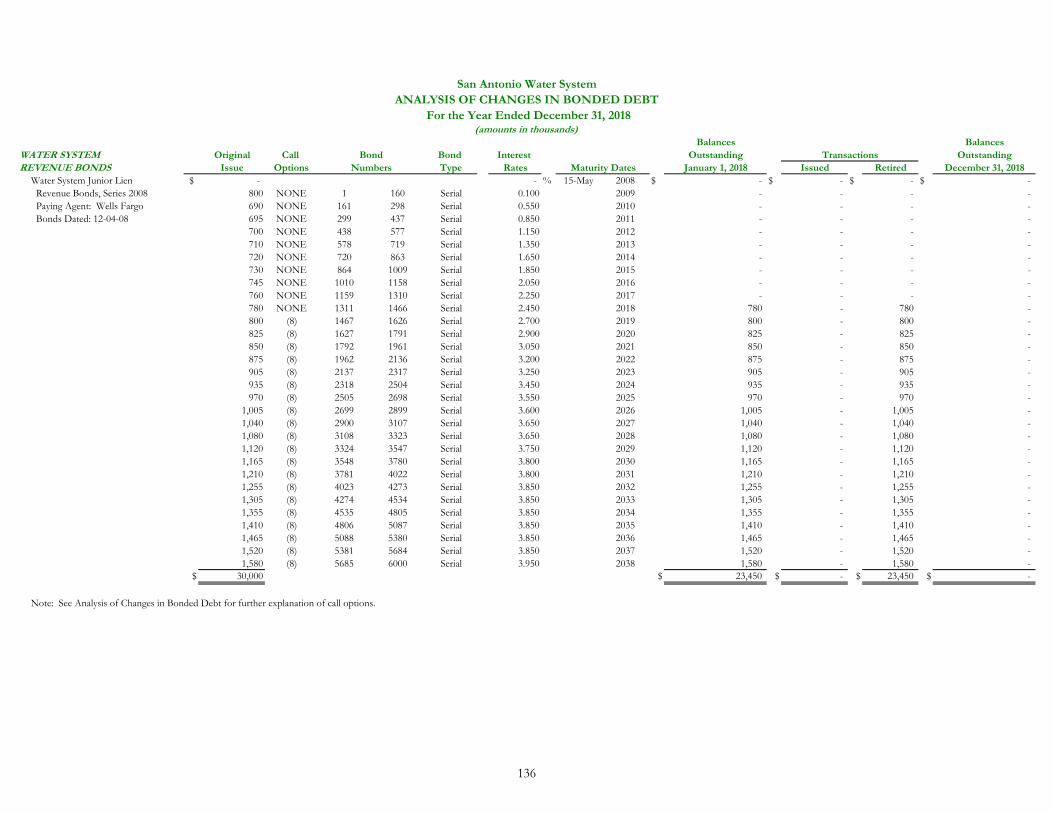
San Antonio Water SystemANALYSIS OF CHANGES IN BONDED DEBT
For the Year Ended December 31, 2018(amounts in thousands)
Balances BalancesWATER SYSTEM Original Call Bond Interest Outstanding Transactions OutstandingREVENUE BONDS Issue Options Type Rates Maturity Dates January 1, 2018 Issued Retired December 31, 2018
Water System Junior Lien $ - - % 15-May 2008 $ - $ - $ - $ - Revenue Bonds, Series 2008 800 NONE 1 160 Serial 0.100 2009 - - - - Paying Agent: Wells Fargo 690 NONE 161 298 Serial 0.550 2010 - - - - Bonds Dated: 12-04-08 695 NONE 299 437 Serial 0.850 2011 - - - -
700 NONE 438 577 Serial 1.150 2012 - - - - 710 NONE 578 719 Serial 1.350 2013 - - - - 720 NONE 720 863 Serial 1.650 2014 - - - - 730 NONE 864 1009 Serial 1.850 2015 - - - - 745 NONE 1010 1158 Serial 2.050 2016 - - - - 760 NONE 1159 1310 Serial 2.250 2017 - - - - 780 NONE 1311 1466 Serial 2.450 2018 780 - 780 - 800 (8) 1467 1626 Serial 2.700 2019 800 - 800 - 825 (8) 1627 1791 Serial 2.900 2020 825 - 825 - 850 (8) 1792 1961 Serial 3.050 2021 850 - 850 - 875 (8) 1962 2136 Serial 3.200 2022 875 - 875 - 905 (8) 2137 2317 Serial 3.250 2023 905 - 905 - 935 (8) 2318 2504 Serial 3.450 2024 935 - 935 - 970 (8) 2505 2698 Serial 3.550 2025 970 - 970 -
1,005 (8) 2699 2899 Serial 3.600 2026 1,005 - 1,005 - 1,040 (8) 2900 3107 Serial 3.650 2027 1,040 - 1,040 - 1,080 (8) 3108 3323 Serial 3.650 2028 1,080 - 1,080 - 1,120 (8) 3324 3547 Serial 3.750 2029 1,120 - 1,120 - 1,165 (8) 3548 3780 Serial 3.800 2030 1,165 - 1,165 - 1,210 (8) 3781 4022 Serial 3.800 2031 1,210 - 1,210 - 1,255 (8) 4023 4273 Serial 3.850 2032 1,255 - 1,255 - 1,305 (8) 4274 4534 Serial 3.850 2033 1,305 - 1,305 - 1,355 (8) 4535 4805 Serial 3.850 2034 1,355 - 1,355 - 1,410 (8) 4806 5087 Serial 3.850 2035 1,410 - 1,410 - 1,465 (8) 5088 5380 Serial 3.850 2036 1,465 - 1,465 - 1,520 (8) 5381 5684 Serial 3.850 2037 1,520 - 1,520 - 1,580 (8) 5685 6000 Serial 3.950 2038 1,580 - 1,580 -
$ 30,000 $ 23,450 $ - $ 23,450 $ -
Note: See Analysis of Changes in Bonded Debt for further explanation of call options.
BondNumbers
136
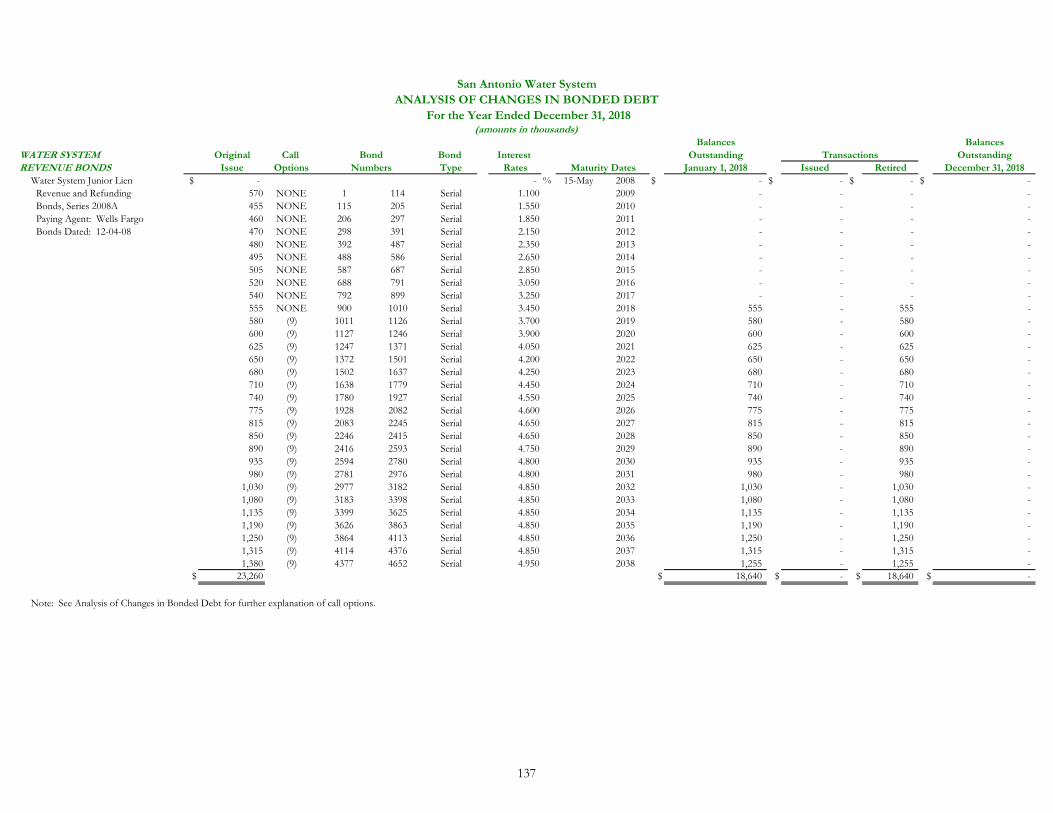
San Antonio Water SystemANALYSIS OF CHANGES IN BONDED DEBT
For the Year Ended December 31, 2018(amounts in thousands)
Balances BalancesWATER SYSTEM Original Call Bond Interest Outstanding Transactions OutstandingREVENUE BONDS Issue Options Type Rates Maturity Dates January 1, 2018 Issued Retired December 31, 2018
Water System Junior Lien $ - - % 15-May 2008 $ - $ - $ - $ - Revenue and Refunding 570 NONE 1 114 Serial 1.100 2009 - - - - Bonds, Series 2008A 455 NONE 115 205 Serial 1.550 2010 - - - - Paying Agent: Wells Fargo 460 NONE 206 297 Serial 1.850 2011 - - - - Bonds Dated: 12-04-08 470 NONE 298 391 Serial 2.150 2012 - - - -
480 NONE 392 487 Serial 2.350 2013 - - - - 495 NONE 488 586 Serial 2.650 2014 - - - - 505 NONE 587 687 Serial 2.850 2015 - - - - 520 NONE 688 791 Serial 3.050 2016 - - - - 540 NONE 792 899 Serial 3.250 2017 - - - - 555 NONE 900 1010 Serial 3.450 2018 555 - 555 - 580 (9) 1011 1126 Serial 3.700 2019 580 - 580 - 600 (9) 1127 1246 Serial 3.900 2020 600 - 600 - 625 (9) 1247 1371 Serial 4.050 2021 625 - 625 - 650 (9) 1372 1501 Serial 4.200 2022 650 - 650 - 680 (9) 1502 1637 Serial 4.250 2023 680 - 680 - 710 (9) 1638 1779 Serial 4.450 2024 710 - 710 - 740 (9) 1780 1927 Serial 4.550 2025 740 - 740 - 775 (9) 1928 2082 Serial 4.600 2026 775 - 775 - 815 (9) 2083 2245 Serial 4.650 2027 815 - 815 - 850 (9) 2246 2415 Serial 4.650 2028 850 - 850 - 890 (9) 2416 2593 Serial 4.750 2029 890 - 890 - 935 (9) 2594 2780 Serial 4.800 2030 935 - 935 - 980 (9) 2781 2976 Serial 4.800 2031 980 - 980 -
1,030 (9) 2977 3182 Serial 4.850 2032 1,030 - 1,030 - 1,080 (9) 3183 3398 Serial 4.850 2033 1,080 - 1,080 - 1,135 (9) 3399 3625 Serial 4.850 2034 1,135 - 1,135 - 1,190 (9) 3626 3863 Serial 4.850 2035 1,190 - 1,190 - 1,250 (9) 3864 4113 Serial 4.850 2036 1,250 - 1,250 - 1,315 (9) 4114 4376 Serial 4.850 2037 1,315 - 1,315 - 1,380 (9) 4377 4652 Serial 4.950 2038 1,255 - 1,255 -
$ 23,260 $ 18,640 $ - $ 18,640 $ -
Note: See Analysis of Changes in Bonded Debt for further explanation of call options.
NumbersBond
137
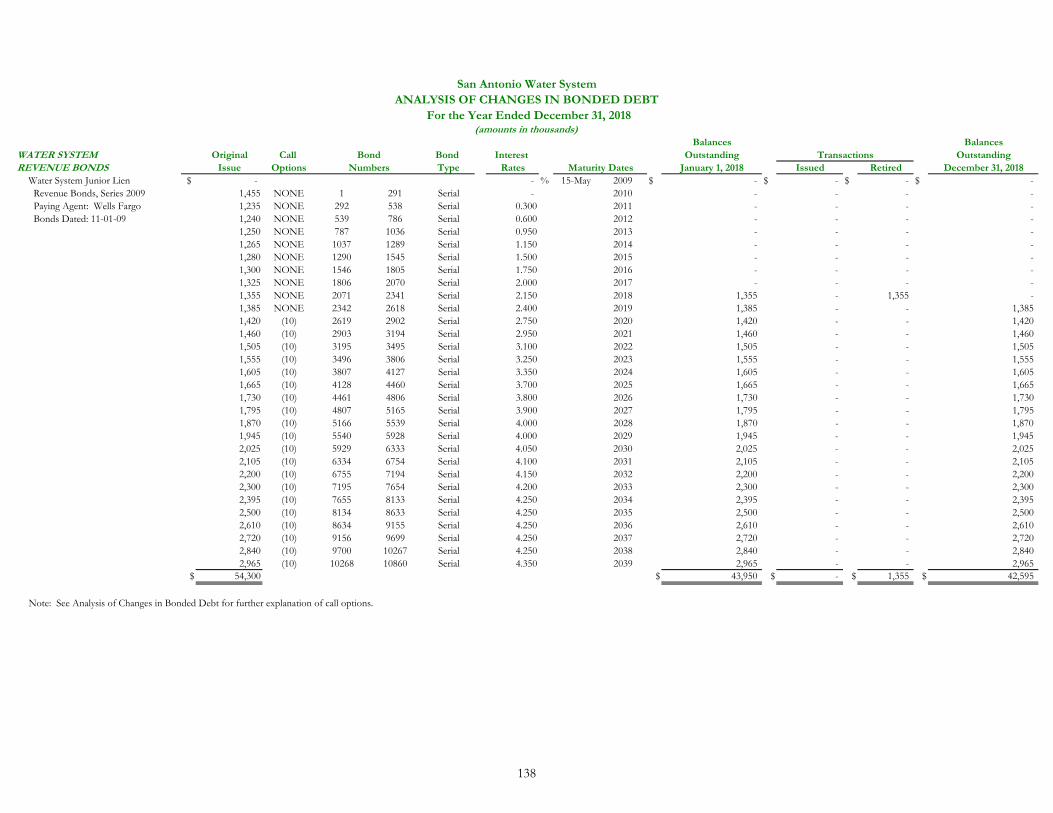
San Antonio Water SystemANALYSIS OF CHANGES IN BONDED DEBT
For the Year Ended December 31, 2018(amounts in thousands)
Balances BalancesWATER SYSTEM Original Call Bond Interest Outstanding Transactions OutstandingREVENUE BONDS Issue Options Type Rates Maturity Dates January 1, 2018 Issued Retired December 31, 2018
Water System Junior Lien $ - - % 15-May 2009 $ - $ - $ - $ - Revenue Bonds, Series 2009 1,455 NONE 1 291 Serial - 2010 - - - - Paying Agent: Wells Fargo 1,235 NONE 292 538 Serial 0.300 2011 - - - - Bonds Dated: 11-01-09 1,240 NONE 539 786 Serial 0.600 2012 - - - -
1,250 NONE 787 1036 Serial 0.950 2013 - - - - 1,265 NONE 1037 1289 Serial 1.150 2014 - - - - 1,280 NONE 1290 1545 Serial 1.500 2015 - - - - 1,300 NONE 1546 1805 Serial 1.750 2016 - - - - 1,325 NONE 1806 2070 Serial 2.000 2017 - - - - 1,355 NONE 2071 2341 Serial 2.150 2018 1,355 - 1,355 - 1,385 NONE 2342 2618 Serial 2.400 2019 1,385 - - 1,385 1,420 (10) 2619 2902 Serial 2.750 2020 1,420 - - 1,420 1,460 (10) 2903 3194 Serial 2.950 2021 1,460 - - 1,460 1,505 (10) 3195 3495 Serial 3.100 2022 1,505 - - 1,505 1,555 (10) 3496 3806 Serial 3.250 2023 1,555 - - 1,555 1,605 (10) 3807 4127 Serial 3.350 2024 1,605 - - 1,605 1,665 (10) 4128 4460 Serial 3.700 2025 1,665 - - 1,665 1,730 (10) 4461 4806 Serial 3.800 2026 1,730 - - 1,730 1,795 (10) 4807 5165 Serial 3.900 2027 1,795 - - 1,795 1,870 (10) 5166 5539 Serial 4.000 2028 1,870 - - 1,870 1,945 (10) 5540 5928 Serial 4.000 2029 1,945 - - 1,945 2,025 (10) 5929 6333 Serial 4.050 2030 2,025 - - 2,025 2,105 (10) 6334 6754 Serial 4.100 2031 2,105 - - 2,105 2,200 (10) 6755 7194 Serial 4.150 2032 2,200 - - 2,200 2,300 (10) 7195 7654 Serial 4.200 2033 2,300 - - 2,300 2,395 (10) 7655 8133 Serial 4.250 2034 2,395 - - 2,395 2,500 (10) 8134 8633 Serial 4.250 2035 2,500 - - 2,500 2,610 (10) 8634 9155 Serial 4.250 2036 2,610 - - 2,610 2,720 (10) 9156 9699 Serial 4.250 2037 2,720 - - 2,720 2,840 (10) 9700 10267 Serial 4.250 2038 2,840 - - 2,840 2,965 (10) 10268 10860 Serial 4.350 2039 2,965 - - 2,965
$ 54,300 $ 43,950 $ - $ 1,355 $ 42,595
Note: See Analysis of Changes in Bonded Debt for further explanation of call options.
BondNumbers
138
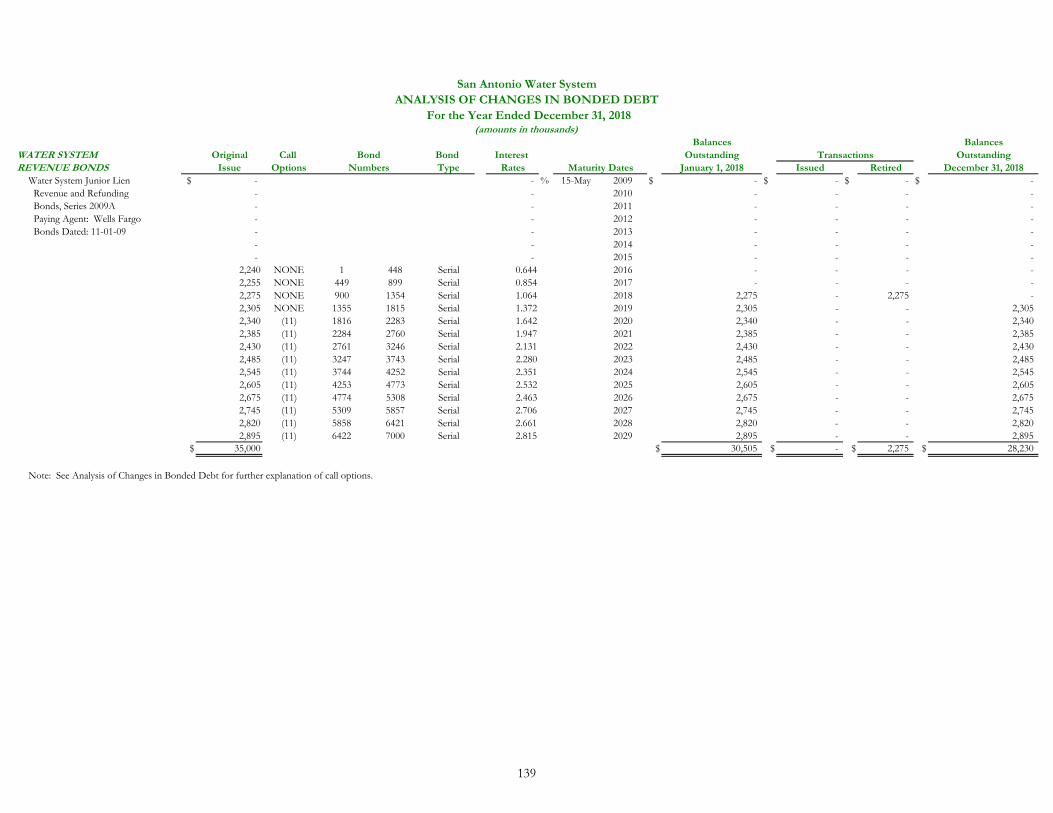
San Antonio Water SystemANALYSIS OF CHANGES IN BONDED DEBT
For the Year Ended December 31, 2018(amounts in thousands)
Balances BalancesWATER SYSTEM Original Call Bond Interest Outstanding Transactions OutstandingREVENUE BONDS Issue Options Type Rates Maturity Dates January 1, 2018 Issued Retired December 31, 2018
Water System Junior Lien $ - - % 15-May 2009 $ - $ - $ - $ - Revenue and Refunding - - 2010 - - - - Bonds, Series 2009A - - 2011 - - - - Paying Agent: Wells Fargo - - 2012 - - - - Bonds Dated: 11-01-09 - - 2013 - - - -
- - 2014 - - - - - - 2015 - - - -
2,240 NONE 1 448 Serial 0.644 2016 - - - - 2,255 NONE 449 899 Serial 0.854 2017 - - - - 2,275 NONE 900 1354 Serial 1.064 2018 2,275 - 2,275 - 2,305 NONE 1355 1815 Serial 1.372 2019 2,305 - - 2,305 2,340 (11) 1816 2283 Serial 1.642 2020 2,340 - - 2,340 2,385 (11) 2284 2760 Serial 1.947 2021 2,385 - - 2,385 2,430 (11) 2761 3246 Serial 2.131 2022 2,430 - - 2,430 2,485 (11) 3247 3743 Serial 2.280 2023 2,485 - - 2,485 2,545 (11) 3744 4252 Serial 2.351 2024 2,545 - - 2,545 2,605 (11) 4253 4773 Serial 2.532 2025 2,605 - - 2,605 2,675 (11) 4774 5308 Serial 2.463 2026 2,675 - - 2,675 2,745 (11) 5309 5857 Serial 2.706 2027 2,745 - - 2,745 2,820 (11) 5858 6421 Serial 2.661 2028 2,820 - - 2,820 2,895 (11) 6422 7000 Serial 2.815 2029 2,895 - - 2,895
$ 35,000 $ 30,505 $ - $ 2,275 $ 28,230
Note: See Analysis of Changes in Bonded Debt for further explanation of call options.
BondNumbers
139
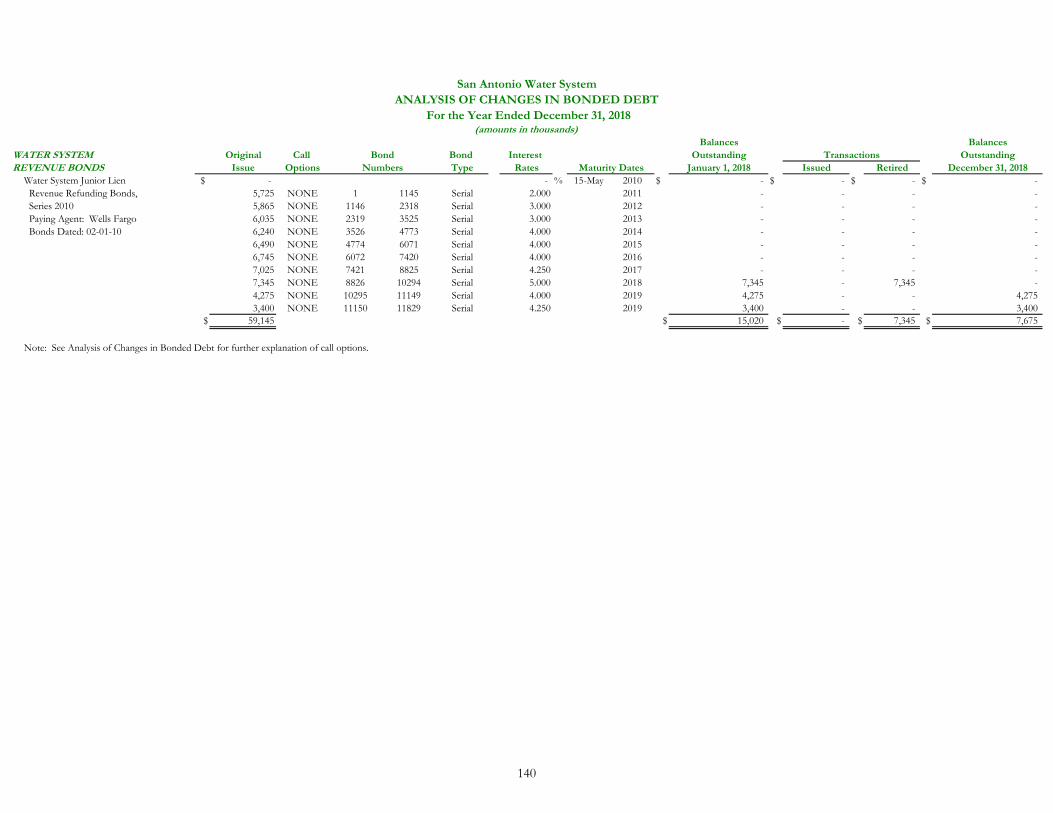
San Antonio Water SystemANALYSIS OF CHANGES IN BONDED DEBT
For the Year Ended December 31, 2018(amounts in thousands)
Balances BalancesWATER SYSTEM Original Call Bond Interest Outstanding Transactions OutstandingREVENUE BONDS Issue Options Type Rates Maturity Dates January 1, 2018 Issued Retired December 31, 2018
Water System Junior Lien $ - - % 15-May 2010 $ - $ - $ - $ - Revenue Refunding Bonds, 5,725 NONE 1 1145 Serial 2.000 2011 - - - - Series 2010 5,865 NONE 1146 2318 Serial 3.000 2012 - - - - Paying Agent: Wells Fargo 6,035 NONE 2319 3525 Serial 3.000 2013 - - - - Bonds Dated: 02-01-10 6,240 NONE 3526 4773 Serial 4.000 2014 - - - -
6,490 NONE 4774 6071 Serial 4.000 2015 - - - - 6,745 NONE 6072 7420 Serial 4.000 2016 - - - - 7,025 NONE 7421 8825 Serial 4.250 2017 - - - - 7,345 NONE 8826 10294 Serial 5.000 2018 7,345 - 7,345 - 4,275 NONE 10295 11149 Serial 4.000 2019 4,275 - - 4,275 3,400 NONE 11150 11829 Serial 4.250 2019 3,400 - - 3,400
$ 59,145 $ 15,020 $ - $ 7,345 $ 7,675
Note: See Analysis of Changes in Bonded Debt for further explanation of call options.
BondNumbers
140
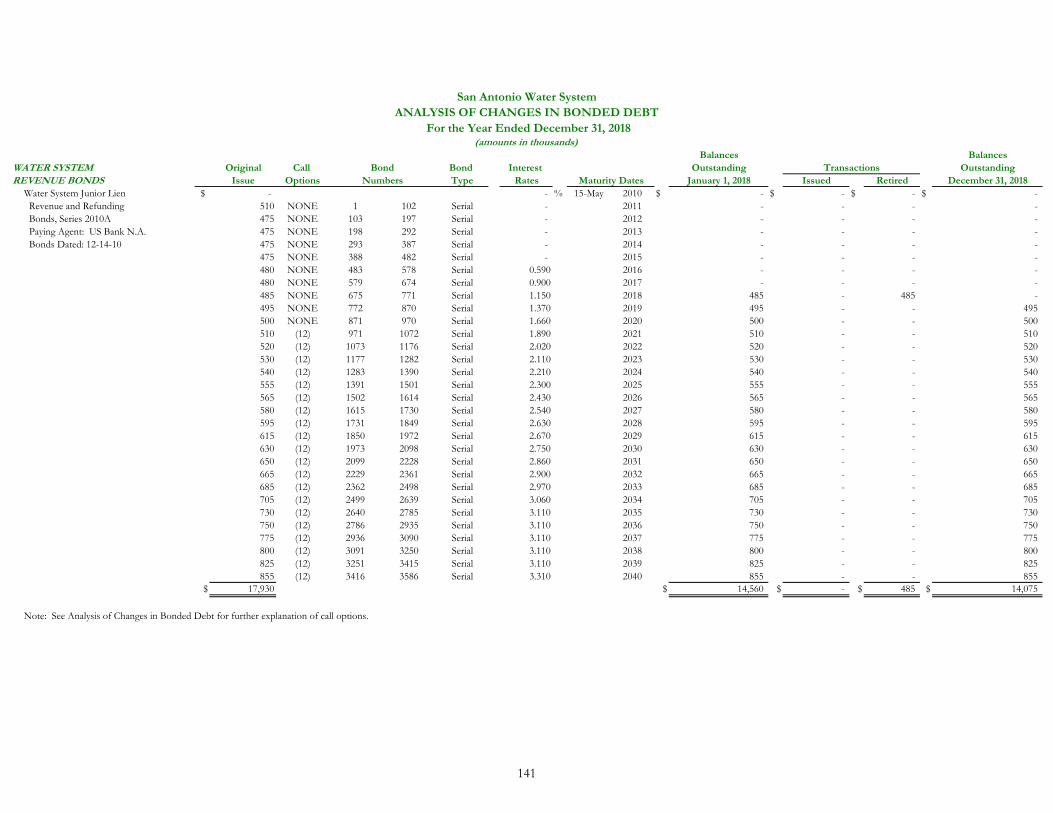
San Antonio Water SystemANALYSIS OF CHANGES IN BONDED DEBT
For the Year Ended December 31, 2018(amounts in thousands)
Balances BalancesWATER SYSTEM Original Call Bond Interest Outstanding Transactions OutstandingREVENUE BONDS Issue Options Type Rates Maturity Dates January 1, 2018 Issued Retired December 31, 2018
Water System Junior Lien $ - - % 15-May 2010 $ - $ - $ - $ - Revenue and Refunding 510 NONE 1 102 Serial - 2011 - - - - Bonds, Series 2010A 475 NONE 103 197 Serial - 2012 - - - - Paying Agent: US Bank N.A. 475 NONE 198 292 Serial - 2013 - - - - Bonds Dated: 12-14-10 475 NONE 293 387 Serial - 2014 - - - -
475 NONE 388 482 Serial - 2015 - - - - 480 NONE 483 578 Serial 0.590 2016 - - - - 480 NONE 579 674 Serial 0.900 2017 - - - - 485 NONE 675 771 Serial 1.150 2018 485 - 485 - 495 NONE 772 870 Serial 1.370 2019 495 - - 495 500 NONE 871 970 Serial 1.660 2020 500 - - 500 510 (12) 971 1072 Serial 1.890 2021 510 - - 510 520 (12) 1073 1176 Serial 2.020 2022 520 - - 520 530 (12) 1177 1282 Serial 2.110 2023 530 - - 530 540 (12) 1283 1390 Serial 2.210 2024 540 - - 540 555 (12) 1391 1501 Serial 2.300 2025 555 - - 555 565 (12) 1502 1614 Serial 2.430 2026 565 - - 565 580 (12) 1615 1730 Serial 2.540 2027 580 - - 580 595 (12) 1731 1849 Serial 2.630 2028 595 - - 595 615 (12) 1850 1972 Serial 2.670 2029 615 - - 615 630 (12) 1973 2098 Serial 2.750 2030 630 - - 630 650 (12) 2099 2228 Serial 2.860 2031 650 - - 650 665 (12) 2229 2361 Serial 2.900 2032 665 - - 665 685 (12) 2362 2498 Serial 2.970 2033 685 - - 685 705 (12) 2499 2639 Serial 3.060 2034 705 - - 705 730 (12) 2640 2785 Serial 3.110 2035 730 - - 730 750 (12) 2786 2935 Serial 3.110 2036 750 - - 750 775 (12) 2936 3090 Serial 3.110 2037 775 - - 775 800 (12) 3091 3250 Serial 3.110 2038 800 - - 800 825 (12) 3251 3415 Serial 3.110 2039 825 - - 825 855 (12) 3416 3586 Serial 3.310 2040 855 - - 855
$ 17,930 $ 14,560 $ - $ 485 $ 14,075
Note: See Analysis of Changes in Bonded Debt for further explanation of call options.
BondNumbers
141
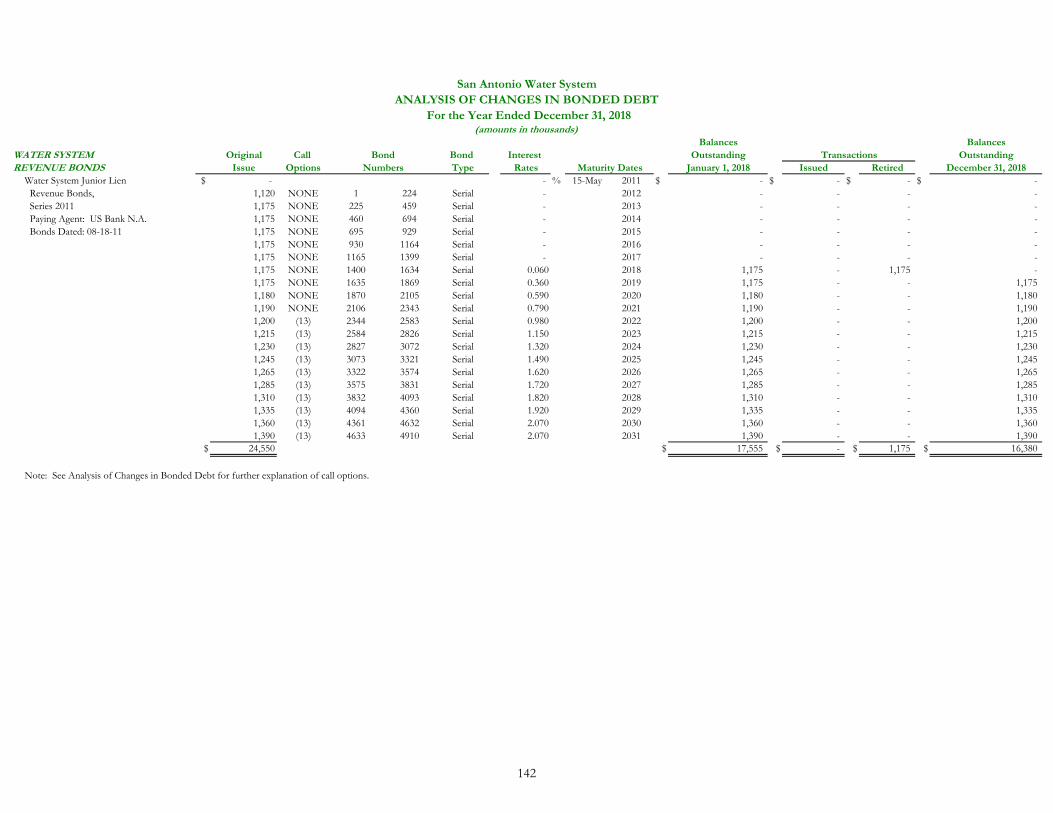
San Antonio Water SystemANALYSIS OF CHANGES IN BONDED DEBT
For the Year Ended December 31, 2018(amounts in thousands)
Balances BalancesWATER SYSTEM Original Call Bond Interest Outstanding Transactions OutstandingREVENUE BONDS Issue Options Type Rates Maturity Dates January 1, 2018 Issued Retired December 31, 2018
Water System Junior Lien $ - - % 15-May 2011 $ - $ - $ - $ - Revenue Bonds, 1,120 NONE 1 224 Serial - 2012 - - - - Series 2011 1,175 NONE 225 459 Serial - 2013 - - - - Paying Agent: US Bank N.A. 1,175 NONE 460 694 Serial - 2014 - - - - Bonds Dated: 08-18-11 1,175 NONE 695 929 Serial - 2015 - - - -
1,175 NONE 930 1164 Serial - 2016 - - - - 1,175 NONE 1165 1399 Serial - 2017 - - - - 1,175 NONE 1400 1634 Serial 0.060 2018 1,175 - 1,175 - 1,175 NONE 1635 1869 Serial 0.360 2019 1,175 - - 1,175 1,180 NONE 1870 2105 Serial 0.590 2020 1,180 - - 1,180 1,190 NONE 2106 2343 Serial 0.790 2021 1,190 - - 1,190 1,200 (13) 2344 2583 Serial 0.980 2022 1,200 - - 1,200 1,215 (13) 2584 2826 Serial 1.150 2023 1,215 - - 1,215 1,230 (13) 2827 3072 Serial 1.320 2024 1,230 - - 1,230 1,245 (13) 3073 3321 Serial 1.490 2025 1,245 - - 1,245 1,265 (13) 3322 3574 Serial 1.620 2026 1,265 - - 1,265 1,285 (13) 3575 3831 Serial 1.720 2027 1,285 - - 1,285 1,310 (13) 3832 4093 Serial 1.820 2028 1,310 - - 1,310 1,335 (13) 4094 4360 Serial 1.920 2029 1,335 - - 1,335 1,360 (13) 4361 4632 Serial 2.070 2030 1,360 - - 1,360 1,390 (13) 4633 4910 Serial 2.070 2031 1,390 - - 1,390
$ 24,550 $ 17,555 $ - $ 1,175 $ 16,380
Note: See Analysis of Changes in Bonded Debt for further explanation of call options.
BondNumbers
142
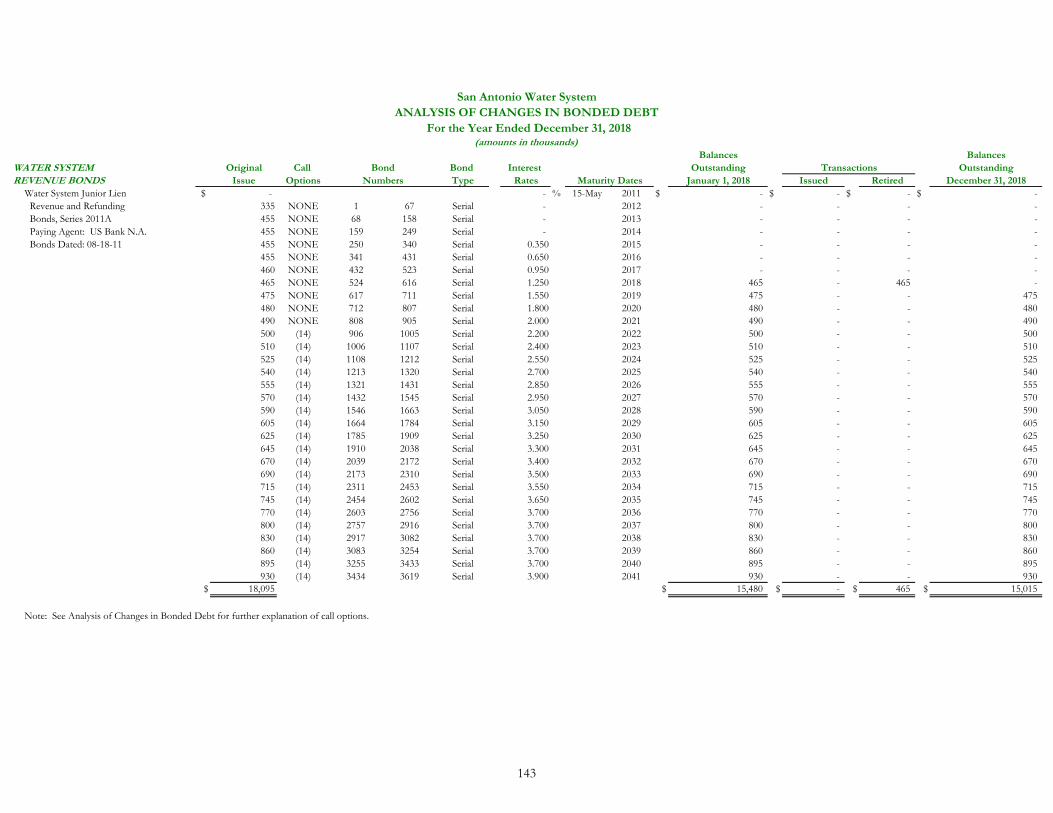
San Antonio Water SystemANALYSIS OF CHANGES IN BONDED DEBT
For the Year Ended December 31, 2018(amounts in thousands)
Balances BalancesWATER SYSTEM Original Call Bond Interest Outstanding Transactions OutstandingREVENUE BONDS Issue Options Type Rates Maturity Dates January 1, 2018 Issued Retired December 31, 2018
Water System Junior Lien $ - - % 15-May 2011 $ - $ - $ - $ - Revenue and Refunding 335 NONE 1 67 Serial - 2012 - - - - Bonds, Series 2011A 455 NONE 68 158 Serial - 2013 - - - - Paying Agent: US Bank N.A. 455 NONE 159 249 Serial - 2014 - - - - Bonds Dated: 08-18-11 455 NONE 250 340 Serial 0.350 2015 - - - -
455 NONE 341 431 Serial 0.650 2016 - - - - 460 NONE 432 523 Serial 0.950 2017 - - - - 465 NONE 524 616 Serial 1.250 2018 465 - 465 - 475 NONE 617 711 Serial 1.550 2019 475 - - 475 480 NONE 712 807 Serial 1.800 2020 480 - - 480 490 NONE 808 905 Serial 2.000 2021 490 - - 490 500 (14) 906 1005 Serial 2.200 2022 500 - - 500 510 (14) 1006 1107 Serial 2.400 2023 510 - - 510 525 (14) 1108 1212 Serial 2.550 2024 525 - - 525 540 (14) 1213 1320 Serial 2.700 2025 540 - - 540 555 (14) 1321 1431 Serial 2.850 2026 555 - - 555 570 (14) 1432 1545 Serial 2.950 2027 570 - - 570 590 (14) 1546 1663 Serial 3.050 2028 590 - - 590 605 (14) 1664 1784 Serial 3.150 2029 605 - - 605 625 (14) 1785 1909 Serial 3.250 2030 625 - - 625 645 (14) 1910 2038 Serial 3.300 2031 645 - - 645 670 (14) 2039 2172 Serial 3.400 2032 670 - - 670 690 (14) 2173 2310 Serial 3.500 2033 690 - - 690 715 (14) 2311 2453 Serial 3.550 2034 715 - - 715 745 (14) 2454 2602 Serial 3.650 2035 745 - - 745 770 (14) 2603 2756 Serial 3.700 2036 770 - - 770 800 (14) 2757 2916 Serial 3.700 2037 800 - - 800 830 (14) 2917 3082 Serial 3.700 2038 830 - - 830 860 (14) 3083 3254 Serial 3.700 2039 860 - - 860 895 (14) 3255 3433 Serial 3.700 2040 895 - - 895 930 (14) 3434 3619 Serial 3.900 2041 930 - - 930
$ 18,095 $ 15,480 $ - $ 465 $ 15,015
Note: See Analysis of Changes in Bonded Debt for further explanation of call options.
BondNumbers
143
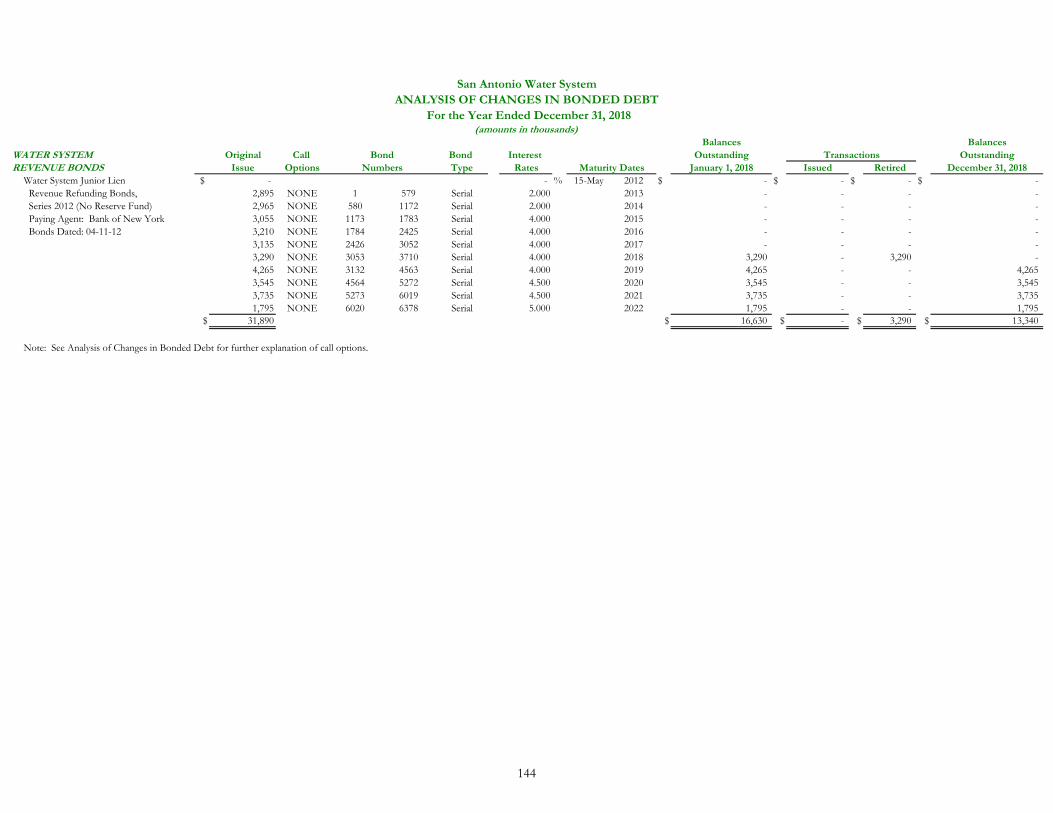
San Antonio Water SystemANALYSIS OF CHANGES IN BONDED DEBT
For the Year Ended December 31, 2018(amounts in thousands)
Balances BalancesWATER SYSTEM Original Call Bond Interest Outstanding Transactions OutstandingREVENUE BONDS Issue Options Type Rates Maturity Dates January 1, 2018 Issued Retired December 31, 2018
Water System Junior Lien $ - - % 15-May 2012 $ - $ - $ - $ - Revenue Refunding Bonds, 2,895 NONE 1 579 Serial 2.000 2013 - - - - Series 2012 (No Reserve Fund) 2,965 NONE 580 1172 Serial 2.000 2014 - - - - Paying Agent: Bank of New York 3,055 NONE 1173 1783 Serial 4.000 2015 - - - - Bonds Dated: 04-11-12 3,210 NONE 1784 2425 Serial 4.000 2016 - - - -
3,135 NONE 2426 3052 Serial 4.000 2017 - - - - 3,290 NONE 3053 3710 Serial 4.000 2018 3,290 - 3,290 - 4,265 NONE 3132 4563 Serial 4.000 2019 4,265 - - 4,265 3,545 NONE 4564 5272 Serial 4.500 2020 3,545 - - 3,545 3,735 NONE 5273 6019 Serial 4.500 2021 3,735 - - 3,735 1,795 NONE 6020 6378 Serial 5.000 2022 1,795 - - 1,795
$ 31,890 $ 16,630 $ - $ 3,290 $ 13,340
Note: See Analysis of Changes in Bonded Debt for further explanation of call options.
BondNumbers
144
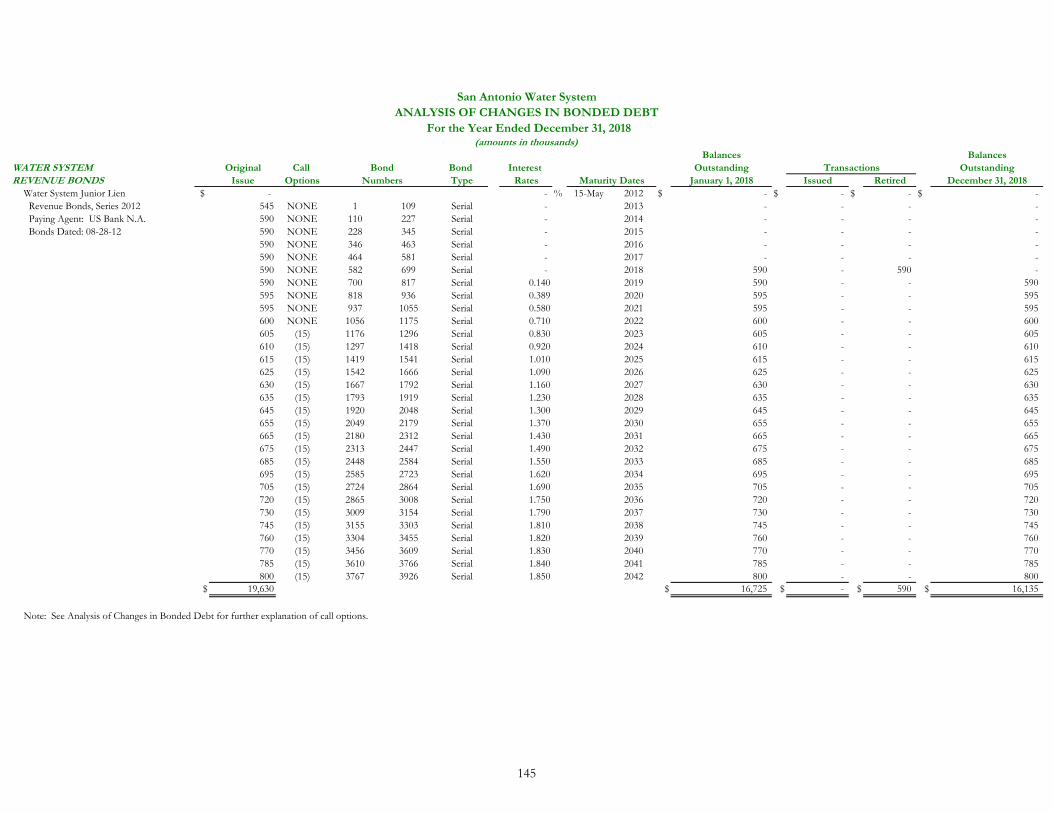
San Antonio Water SystemANALYSIS OF CHANGES IN BONDED DEBT
For the Year Ended December 31, 2018(amounts in thousands)
Balances BalancesWATER SYSTEM Original Call Bond Interest Outstanding Transactions OutstandingREVENUE BONDS Issue Options Type Rates Maturity Dates January 1, 2018 Issued Retired December 31, 2018
Water System Junior Lien $ - - % 15-May 2012 $ - $ - $ - $ - Revenue Bonds, Series 2012 545 NONE 1 109 Serial - 2013 - - - - Paying Agent: US Bank N.A. 590 NONE 110 227 Serial - 2014 - - - - Bonds Dated: 08-28-12 590 NONE 228 345 Serial - 2015 - - - -
590 NONE 346 463 Serial - 2016 - - - - 590 NONE 464 581 Serial - 2017 - - - - 590 NONE 582 699 Serial - 2018 590 - 590 - 590 NONE 700 817 Serial 0.140 2019 590 - - 590 595 NONE 818 936 Serial 0.389 2020 595 - - 595 595 NONE 937 1055 Serial 0.580 2021 595 - - 595 600 NONE 1056 1175 Serial 0.710 2022 600 - - 600 605 (15) 1176 1296 Serial 0.830 2023 605 - - 605 610 (15) 1297 1418 Serial 0.920 2024 610 - - 610 615 (15) 1419 1541 Serial 1.010 2025 615 - - 615 625 (15) 1542 1666 Serial 1.090 2026 625 - - 625 630 (15) 1667 1792 Serial 1.160 2027 630 - - 630 635 (15) 1793 1919 Serial 1.230 2028 635 - - 635 645 (15) 1920 2048 Serial 1.300 2029 645 - - 645 655 (15) 2049 2179 Serial 1.370 2030 655 - - 655 665 (15) 2180 2312 Serial 1.430 2031 665 - - 665 675 (15) 2313 2447 Serial 1.490 2032 675 - - 675 685 (15) 2448 2584 Serial 1.550 2033 685 - - 685 695 (15) 2585 2723 Serial 1.620 2034 695 - - 695 705 (15) 2724 2864 Serial 1.690 2035 705 - - 705 720 (15) 2865 3008 Serial 1.750 2036 720 - - 720 730 (15) 3009 3154 Serial 1.790 2037 730 - - 730 745 (15) 3155 3303 Serial 1.810 2038 745 - - 745 760 (15) 3304 3455 Serial 1.820 2039 760 - - 760 770 (15) 3456 3609 Serial 1.830 2040 770 - - 770 785 (15) 3610 3766 Serial 1.840 2041 785 - - 785 800 (15) 3767 3926 Serial 1.850 2042 800 - - 800
$ 19,630 $ 16,725 $ - $ 590 $ 16,135
Note: See Analysis of Changes in Bonded Debt for further explanation of call options.
BondNumbers
145
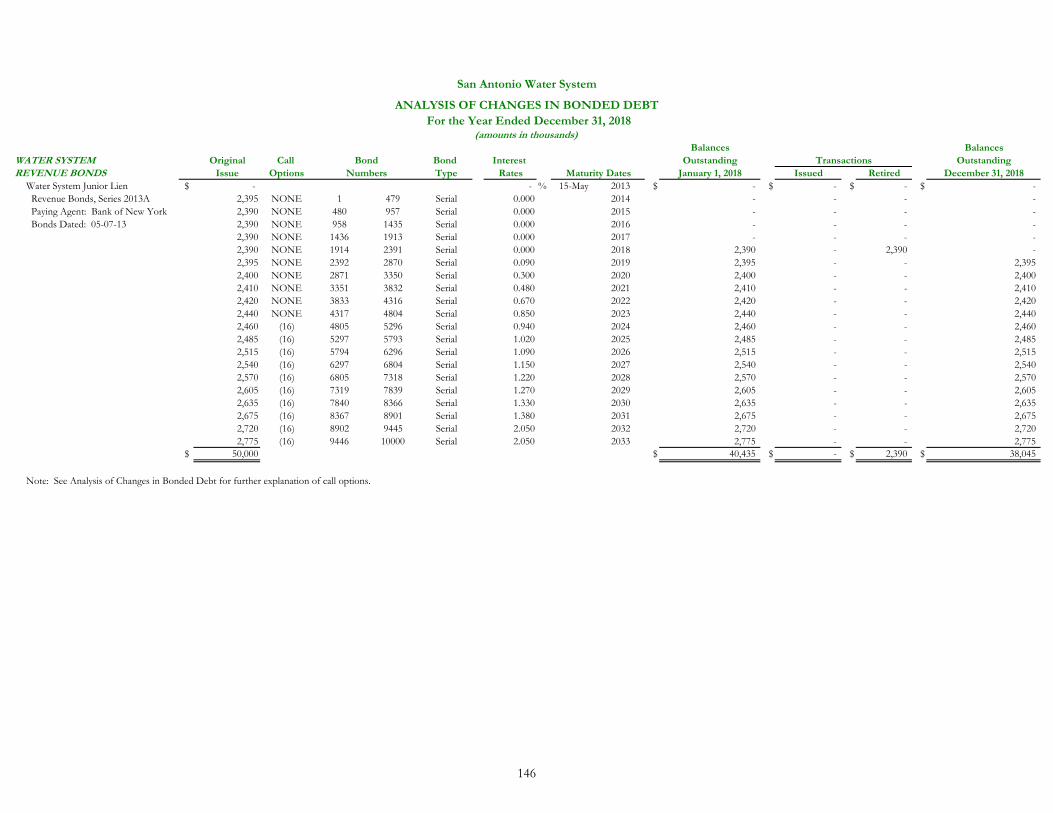
San Antonio Water System
ANALYSIS OF CHANGES IN BONDED DEBT For the Year Ended December 31, 2018
(amounts in thousands)Balances Balances
WATER SYSTEM Original Call Bond Interest Outstanding Transactions OutstandingREVENUE BONDS Issue Options Type Rates Maturity Dates January 1, 2018 Issued Retired December 31, 2018
Water System Junior Lien $ - - % 15-May 2013 $ - $ - $ - $ - Revenue Bonds, Series 2013A 2,395 NONE 1 479 Serial 0.000 2014 - - - - Paying Agent: Bank of New York 2,390 NONE 480 957 Serial 0.000 2015 - - - - Bonds Dated: 05-07-13 2,390 NONE 958 1435 Serial 0.000 2016 - - - -
2,390 NONE 1436 1913 Serial 0.000 2017 - - - - 2,390 NONE 1914 2391 Serial 0.000 2018 2,390 - 2,390 - 2,395 NONE 2392 2870 Serial 0.090 2019 2,395 - - 2,395 2,400 NONE 2871 3350 Serial 0.300 2020 2,400 - - 2,400 2,410 NONE 3351 3832 Serial 0.480 2021 2,410 - - 2,410 2,420 NONE 3833 4316 Serial 0.670 2022 2,420 - - 2,420 2,440 NONE 4317 4804 Serial 0.850 2023 2,440 - - 2,440 2,460 (16) 4805 5296 Serial 0.940 2024 2,460 - - 2,460 2,485 (16) 5297 5793 Serial 1.020 2025 2,485 - - 2,485 2,515 (16) 5794 6296 Serial 1.090 2026 2,515 - - 2,515 2,540 (16) 6297 6804 Serial 1.150 2027 2,540 - - 2,540 2,570 (16) 6805 7318 Serial 1.220 2028 2,570 - - 2,570 2,605 (16) 7319 7839 Serial 1.270 2029 2,605 - - 2,605 2,635 (16) 7840 8366 Serial 1.330 2030 2,635 - - 2,635 2,675 (16) 8367 8901 Serial 1.380 2031 2,675 - - 2,675 2,720 (16) 8902 9445 Serial 2.050 2032 2,720 - - 2,720 2,775 (16) 9446 10000 Serial 2.050 2033 2,775 - - 2,775
$ 50,000 $ 40,435 $ - $ 2,390 $ 38,045
Note: See Analysis of Changes in Bonded Debt for further explanation of call options.
BondNumbers
146
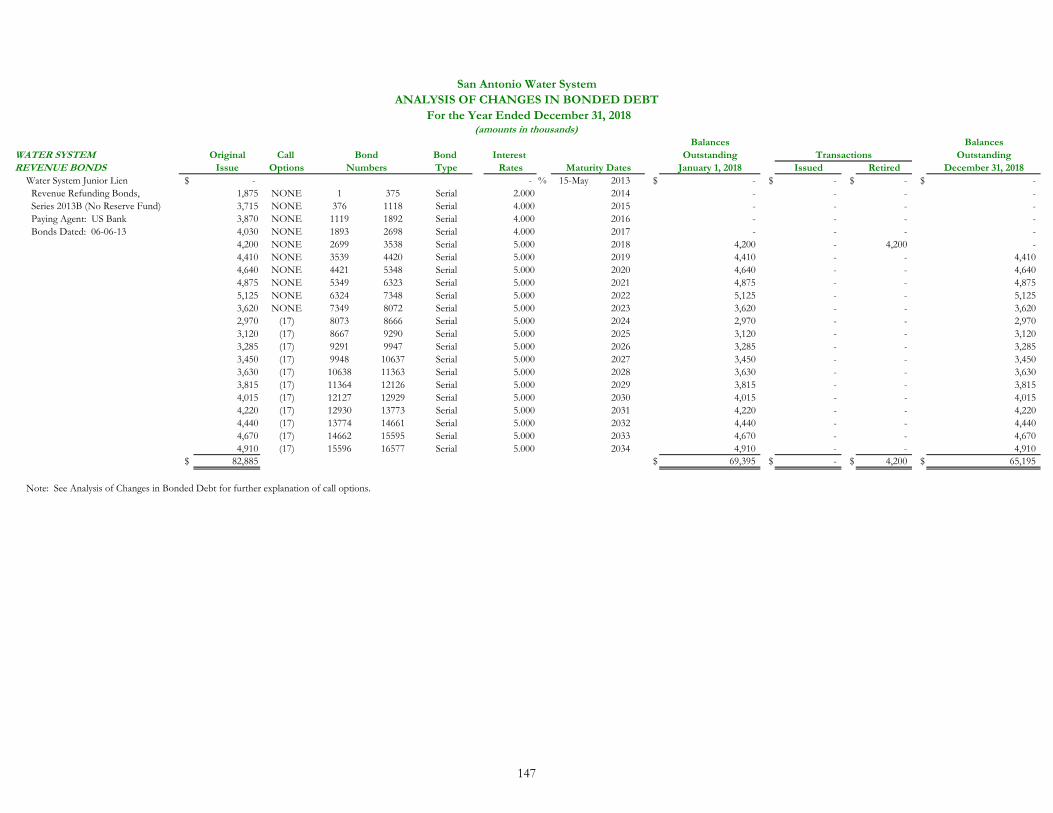
San Antonio Water SystemANALYSIS OF CHANGES IN BONDED DEBT
For the Year Ended December 31, 2018(amounts in thousands)
Balances BalancesWATER SYSTEM Original Call Bond Interest Outstanding Transactions OutstandingREVENUE BONDS Issue Options Type Rates Maturity Dates January 1, 2018 Issued Retired December 31, 2018
Water System Junior Lien $ - - % 15-May 2013 $ - $ - $ - $ - Revenue Refunding Bonds, 1,875 NONE 1 375 Serial 2.000 2014 - - - - Series 2013B (No Reserve Fund) 3,715 NONE 376 1118 Serial 4.000 2015 - - - - Paying Agent: US Bank 3,870 NONE 1119 1892 Serial 4.000 2016 - - - - Bonds Dated: 06-06-13 4,030 NONE 1893 2698 Serial 4.000 2017 - - - -
4,200 NONE 2699 3538 Serial 5.000 2018 4,200 - 4,200 - 4,410 NONE 3539 4420 Serial 5.000 2019 4,410 - - 4,410 4,640 NONE 4421 5348 Serial 5.000 2020 4,640 - - 4,640 4,875 NONE 5349 6323 Serial 5.000 2021 4,875 - - 4,875 5,125 NONE 6324 7348 Serial 5.000 2022 5,125 - - 5,125 3,620 NONE 7349 8072 Serial 5.000 2023 3,620 - - 3,620 2,970 (17) 8073 8666 Serial 5.000 2024 2,970 - - 2,970 3,120 (17) 8667 9290 Serial 5.000 2025 3,120 - - 3,120 3,285 (17) 9291 9947 Serial 5.000 2026 3,285 - - 3,285 3,450 (17) 9948 10637 Serial 5.000 2027 3,450 - - 3,450 3,630 (17) 10638 11363 Serial 5.000 2028 3,630 - - 3,630 3,815 (17) 11364 12126 Serial 5.000 2029 3,815 - - 3,815 4,015 (17) 12127 12929 Serial 5.000 2030 4,015 - - 4,015 4,220 (17) 12930 13773 Serial 5.000 2031 4,220 - - 4,220 4,440 (17) 13774 14661 Serial 5.000 2032 4,440 - - 4,440 4,670 (17) 14662 15595 Serial 5.000 2033 4,670 - - 4,670 4,910 (17) 15596 16577 Serial 5.000 2034 4,910 - - 4,910
$ 82,885 $ 69,395 $ - $ 4,200 $ 65,195
Note: See Analysis of Changes in Bonded Debt for further explanation of call options.
NumbersBond
147
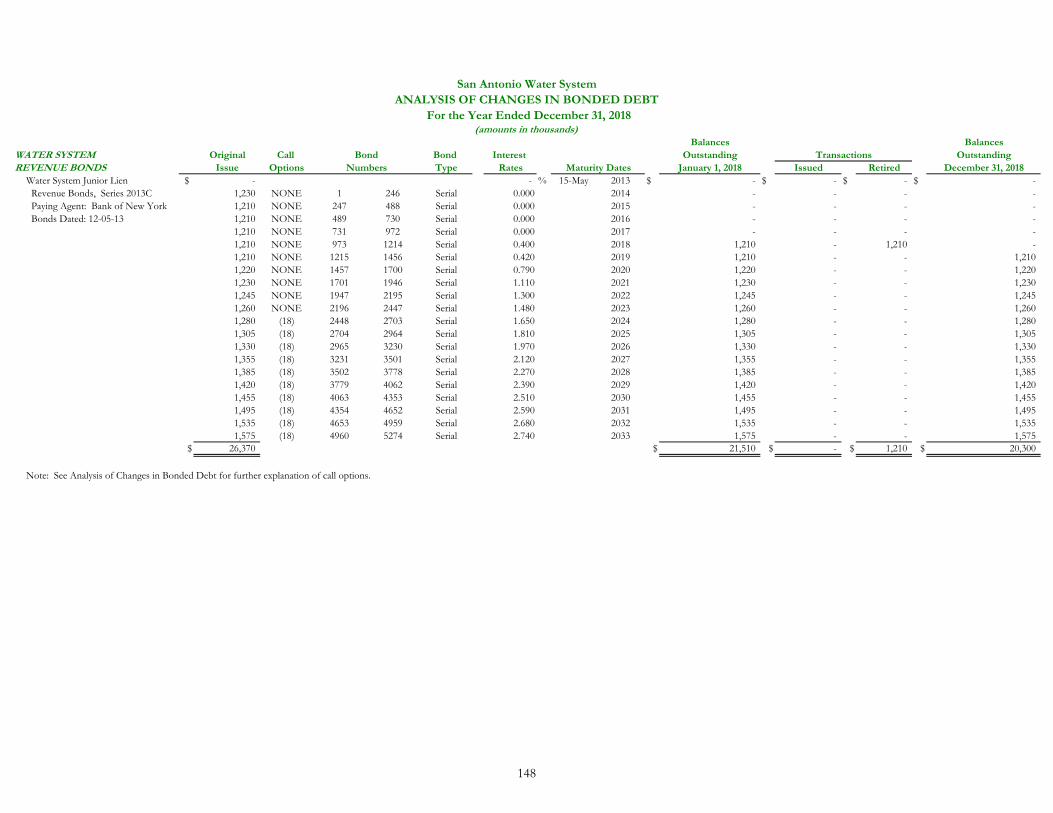
San Antonio Water SystemANALYSIS OF CHANGES IN BONDED DEBT
For the Year Ended December 31, 2018(amounts in thousands)
Balances BalancesWATER SYSTEM Original Call Bond Interest Outstanding Transactions OutstandingREVENUE BONDS Issue Options Type Rates Maturity Dates January 1, 2018 Issued Retired December 31, 2018
Water System Junior Lien $ - - % 15-May 2013 $ - $ - $ - $ - Revenue Bonds, Series 2013C 1,230 NONE 1 246 Serial 0.000 2014 - - - - Paying Agent: Bank of New York 1,210 NONE 247 488 Serial 0.000 2015 - - - - Bonds Dated: 12-05-13 1,210 NONE 489 730 Serial 0.000 2016 - - - -
1,210 NONE 731 972 Serial 0.000 2017 - - - - 1,210 NONE 973 1214 Serial 0.400 2018 1,210 - 1,210 - 1,210 NONE 1215 1456 Serial 0.420 2019 1,210 - - 1,210 1,220 NONE 1457 1700 Serial 0.790 2020 1,220 - - 1,220 1,230 NONE 1701 1946 Serial 1.110 2021 1,230 - - 1,230 1,245 NONE 1947 2195 Serial 1.300 2022 1,245 - - 1,245 1,260 NONE 2196 2447 Serial 1.480 2023 1,260 - - 1,260 1,280 (18) 2448 2703 Serial 1.650 2024 1,280 - - 1,280 1,305 (18) 2704 2964 Serial 1.810 2025 1,305 - - 1,305 1,330 (18) 2965 3230 Serial 1.970 2026 1,330 - - 1,330 1,355 (18) 3231 3501 Serial 2.120 2027 1,355 - - 1,355 1,385 (18) 3502 3778 Serial 2.270 2028 1,385 - - 1,385 1,420 (18) 3779 4062 Serial 2.390 2029 1,420 - - 1,420 1,455 (18) 4063 4353 Serial 2.510 2030 1,455 - - 1,455 1,495 (18) 4354 4652 Serial 2.590 2031 1,495 - - 1,495 1,535 (18) 4653 4959 Serial 2.680 2032 1,535 - - 1,535 1,575 (18) 4960 5274 Serial 2.740 2033 1,575 - - 1,575
$ 26,370 $ 21,510 $ - $ 1,210 $ 20,300
Note: See Analysis of Changes in Bonded Debt for further explanation of call options.
BondNumbers
148
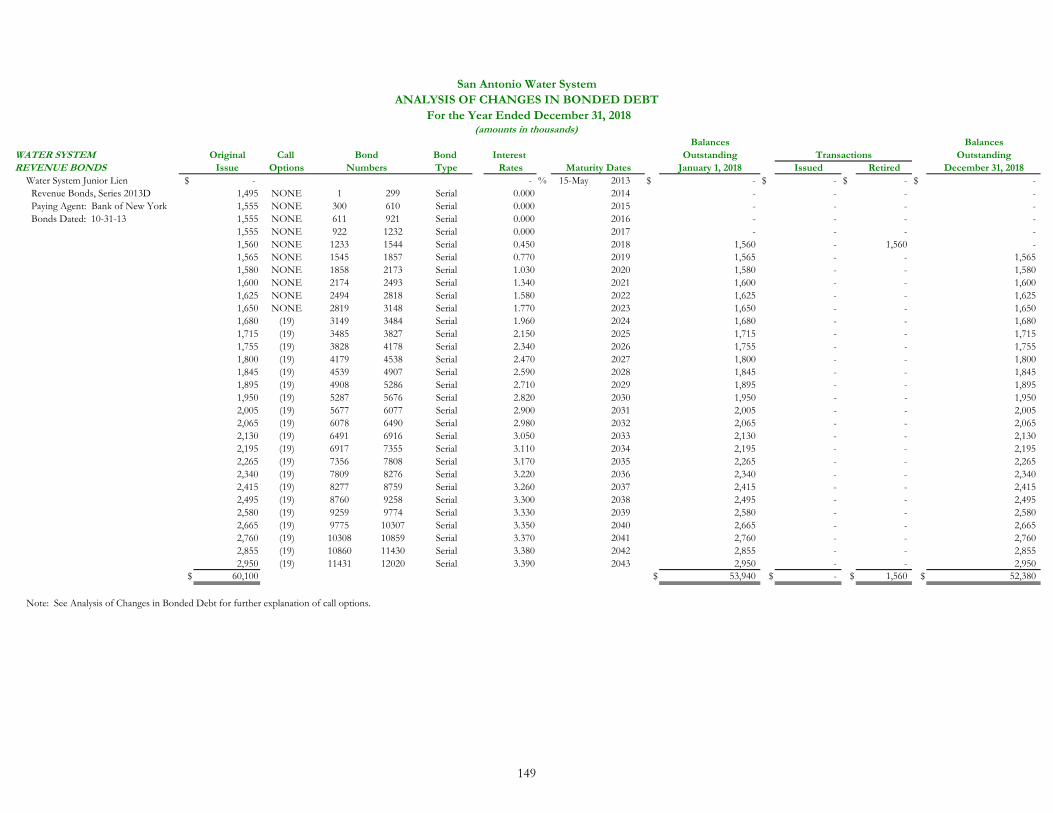
San Antonio Water SystemANALYSIS OF CHANGES IN BONDED DEBT
For the Year Ended December 31, 2018(amounts in thousands)
Balances BalancesWATER SYSTEM Original Call Bond Interest Outstanding Transactions OutstandingREVENUE BONDS Issue Options Type Rates Maturity Dates January 1, 2018 Issued Retired December 31, 2018
Water System Junior Lien $ - - % 15-May 2013 $ - $ - $ - $ - Revenue Bonds, Series 2013D 1,495 NONE 1 299 Serial 0.000 2014 - - - - Paying Agent: Bank of New York 1,555 NONE 300 610 Serial 0.000 2015 - - - - Bonds Dated: 10-31-13 1,555 NONE 611 921 Serial 0.000 2016 - - - -
1,555 NONE 922 1232 Serial 0.000 2017 - - - - 1,560 NONE 1233 1544 Serial 0.450 2018 1,560 - 1,560 - 1,565 NONE 1545 1857 Serial 0.770 2019 1,565 - - 1,565 1,580 NONE 1858 2173 Serial 1.030 2020 1,580 - - 1,580 1,600 NONE 2174 2493 Serial 1.340 2021 1,600 - - 1,600 1,625 NONE 2494 2818 Serial 1.580 2022 1,625 - - 1,625 1,650 NONE 2819 3148 Serial 1.770 2023 1,650 - - 1,650 1,680 (19) 3149 3484 Serial 1.960 2024 1,680 - - 1,680 1,715 (19) 3485 3827 Serial 2.150 2025 1,715 - - 1,715 1,755 (19) 3828 4178 Serial 2.340 2026 1,755 - - 1,755 1,800 (19) 4179 4538 Serial 2.470 2027 1,800 - - 1,800 1,845 (19) 4539 4907 Serial 2.590 2028 1,845 - - 1,845 1,895 (19) 4908 5286 Serial 2.710 2029 1,895 - - 1,895 1,950 (19) 5287 5676 Serial 2.820 2030 1,950 - - 1,950 2,005 (19) 5677 6077 Serial 2.900 2031 2,005 - - 2,005 2,065 (19) 6078 6490 Serial 2.980 2032 2,065 - - 2,065 2,130 (19) 6491 6916 Serial 3.050 2033 2,130 - - 2,130 2,195 (19) 6917 7355 Serial 3.110 2034 2,195 - - 2,195 2,265 (19) 7356 7808 Serial 3.170 2035 2,265 - - 2,265 2,340 (19) 7809 8276 Serial 3.220 2036 2,340 - - 2,340 2,415 (19) 8277 8759 Serial 3.260 2037 2,415 - - 2,415 2,495 (19) 8760 9258 Serial 3.300 2038 2,495 - - 2,495 2,580 (19) 9259 9774 Serial 3.330 2039 2,580 - - 2,580 2,665 (19) 9775 10307 Serial 3.350 2040 2,665 - - 2,665 2,760 (19) 10308 10859 Serial 3.370 2041 2,760 - - 2,760 2,855 (19) 10860 11430 Serial 3.380 2042 2,855 - - 2,855 2,950 (19) 11431 12020 Serial 3.390 2043 2,950 - - 2,950
$ 60,100 $ 53,940 $ - $ 1,560 $ 52,380
Note: See Analysis of Changes in Bonded Debt for further explanation of call options.
BondNumbers
149
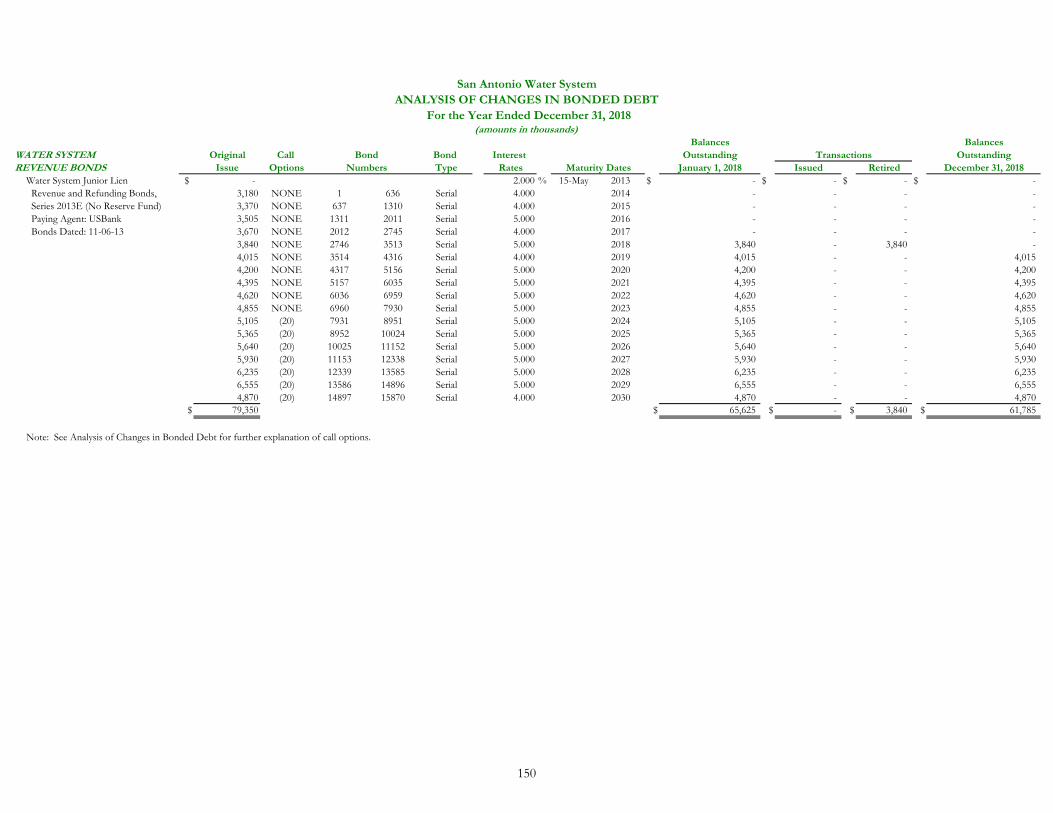
San Antonio Water SystemANALYSIS OF CHANGES IN BONDED DEBT
For the Year Ended December 31, 2018(amounts in thousands)
Balances BalancesWATER SYSTEM Original Call Bond Interest Outstanding Transactions OutstandingREVENUE BONDS Issue Options Type Rates Maturity Dates January 1, 2018 Issued Retired December 31, 2018
Water System Junior Lien $ - 2.000 % 15-May 2013 $ - $ - $ - $ - Revenue and Refunding Bonds, 3,180 NONE 1 636 Serial 4.000 2014 - - - - Series 2013E (No Reserve Fund) 3,370 NONE 637 1310 Serial 4.000 2015 - - - - Paying Agent: USBank 3,505 NONE 1311 2011 Serial 5.000 2016 - - - - Bonds Dated: 11-06-13 3,670 NONE 2012 2745 Serial 4.000 2017 - - - -
3,840 NONE 2746 3513 Serial 5.000 2018 3,840 - 3,840 - 4,015 NONE 3514 4316 Serial 4.000 2019 4,015 - - 4,015 4,200 NONE 4317 5156 Serial 5.000 2020 4,200 - - 4,200 4,395 NONE 5157 6035 Serial 5.000 2021 4,395 - - 4,395 4,620 NONE 6036 6959 Serial 5.000 2022 4,620 - - 4,620 4,855 NONE 6960 7930 Serial 5.000 2023 4,855 - - 4,855 5,105 (20) 7931 8951 Serial 5.000 2024 5,105 - - 5,105 5,365 (20) 8952 10024 Serial 5.000 2025 5,365 - - 5,365 5,640 (20) 10025 11152 Serial 5.000 2026 5,640 - - 5,640 5,930 (20) 11153 12338 Serial 5.000 2027 5,930 - - 5,930 6,235 (20) 12339 13585 Serial 5.000 2028 6,235 - - 6,235 6,555 (20) 13586 14896 Serial 5.000 2029 6,555 - - 6,555 4,870 (20) 14897 15870 Serial 4.000 2030 4,870 - - 4,870
$ 79,350 $ 65,625 $ - $ 3,840 $ 61,785
Note: See Analysis of Changes in Bonded Debt for further explanation of call options.
BondNumbers
150
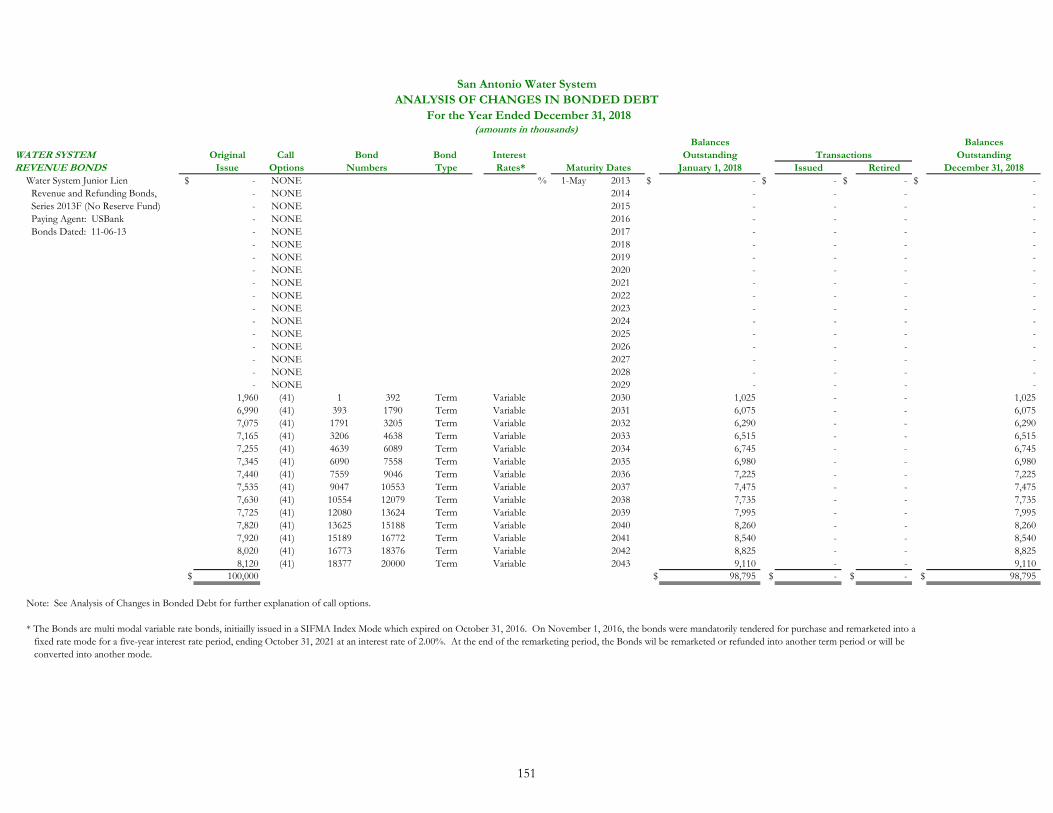
San Antonio Water SystemANALYSIS OF CHANGES IN BONDED DEBT
For the Year Ended December 31, 2018(amounts in thousands)
Balances BalancesWATER SYSTEM Original Call Bond Interest Outstanding Transactions OutstandingREVENUE BONDS Issue Options Type Rates* Maturity Dates January 1, 2018 Issued Retired December 31, 2018
Water System Junior Lien $ - NONE % 1-May 2013 $ - $ - $ - $ - Revenue and Refunding Bonds, - NONE 2014 - - - - Series 2013F (No Reserve Fund) - NONE 2015 - - - - Paying Agent: USBank - NONE 2016 - - - - Bonds Dated: 11-06-13 - NONE 2017 - - - -
- NONE 2018 - - - - - NONE 2019 - - - - - NONE 2020 - - - - - NONE 2021 - - - - - NONE 2022 - - - - - NONE 2023 - - - - - NONE 2024 - - - - - NONE 2025 - - - - - NONE 2026 - - - - - NONE 2027 - - - - - NONE 2028 - - - - - NONE 2029 - - - -
1,960 (41) 1 392 Term Variable 2030 1,025 - - 1,025 6,990 (41) 393 1790 Term Variable 2031 6,075 - - 6,075 7,075 (41) 1791 3205 Term Variable 2032 6,290 - - 6,290 7,165 (41) 3206 4638 Term Variable 2033 6,515 - - 6,515 7,255 (41) 4639 6089 Term Variable 2034 6,745 - - 6,745 7,345 (41) 6090 7558 Term Variable 2035 6,980 - - 6,980 7,440 (41) 7559 9046 Term Variable 2036 7,225 - - 7,225 7,535 (41) 9047 10553 Term Variable 2037 7,475 - - 7,475 7,630 (41) 10554 12079 Term Variable 2038 7,735 - - 7,735 7,725 (41) 12080 13624 Term Variable 2039 7,995 - - 7,995 7,820 (41) 13625 15188 Term Variable 2040 8,260 - - 8,260 7,920 (41) 15189 16772 Term Variable 2041 8,540 - - 8,540 8,020 (41) 16773 18376 Term Variable 2042 8,825 - - 8,825 8,120 (41) 18377 20000 Term Variable 2043 9,110 - - 9,110
$ 100,000 $ 98,795 $ - $ - $ 98,795
Note: See Analysis of Changes in Bonded Debt for further explanation of call options.
* The Bonds are multi modal variable rate bonds, initiailly issued in a SIFMA Index Mode which expired on October 31, 2016. On November 1, 2016, the bonds were mandatorily tendered for purchase and remarketed into a fixed rate mode for a five-year interest rate period, ending October 31, 2021 at an interest rate of 2.00%. At the end of the remarketing period, the Bonds wil be remarketed or refunded into another term period or will be converted into another mode.
BondNumbers
151
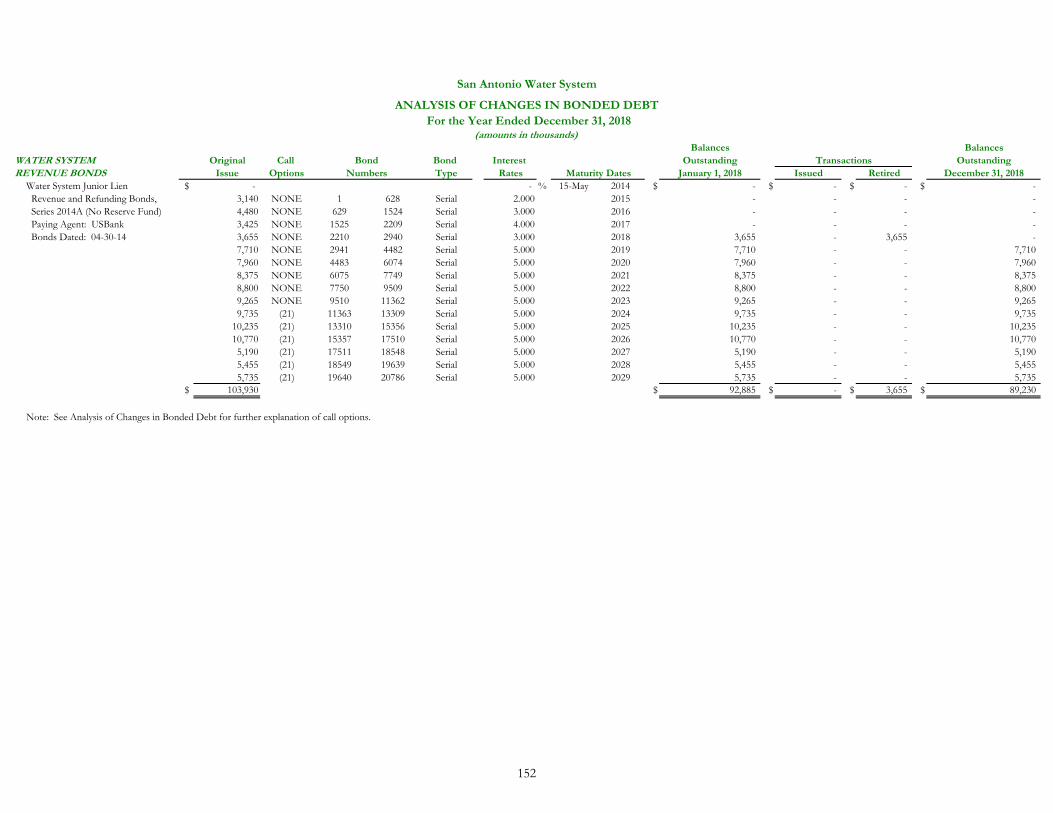
San Antonio Water System
ANALYSIS OF CHANGES IN BONDED DEBT For the Year Ended December 31, 2018
(amounts in thousands)Balances Balances
WATER SYSTEM Original Call Bond Interest Outstanding Transactions OutstandingREVENUE BONDS Issue Options Type Rates Maturity Dates January 1, 2018 Issued Retired December 31, 2018
Water System Junior Lien $ - - % 15-May 2014 $ - $ - $ - $ - Revenue and Refunding Bonds, 3,140 NONE 1 628 Serial 2.000 2015 - - - - Series 2014A (No Reserve Fund) 4,480 NONE 629 1524 Serial 3.000 2016 - - - - Paying Agent: USBank 3,425 NONE 1525 2209 Serial 4.000 2017 - - - - Bonds Dated: 04-30-14 3,655 NONE 2210 2940 Serial 3.000 2018 3,655 - 3,655 -
7,710 NONE 2941 4482 Serial 5.000 2019 7,710 - - 7,710 7,960 NONE 4483 6074 Serial 5.000 2020 7,960 - - 7,960 8,375 NONE 6075 7749 Serial 5.000 2021 8,375 - - 8,375 8,800 NONE 7750 9509 Serial 5.000 2022 8,800 - - 8,800 9,265 NONE 9510 11362 Serial 5.000 2023 9,265 - - 9,265 9,735 (21) 11363 13309 Serial 5.000 2024 9,735 - - 9,735
10,235 (21) 13310 15356 Serial 5.000 2025 10,235 - - 10,235 10,770 (21) 15357 17510 Serial 5.000 2026 10,770 - - 10,770 5,190 (21) 17511 18548 Serial 5.000 2027 5,190 - - 5,190 5,455 (21) 18549 19639 Serial 5.000 2028 5,455 - - 5,455 5,735 (21) 19640 20786 Serial 5.000 2029 5,735 - - 5,735
$ 103,930 $ 92,885 $ - $ 3,655 $ 89,230
Note: See Analysis of Changes in Bonded Debt for further explanation of call options.
BondNumbers
152
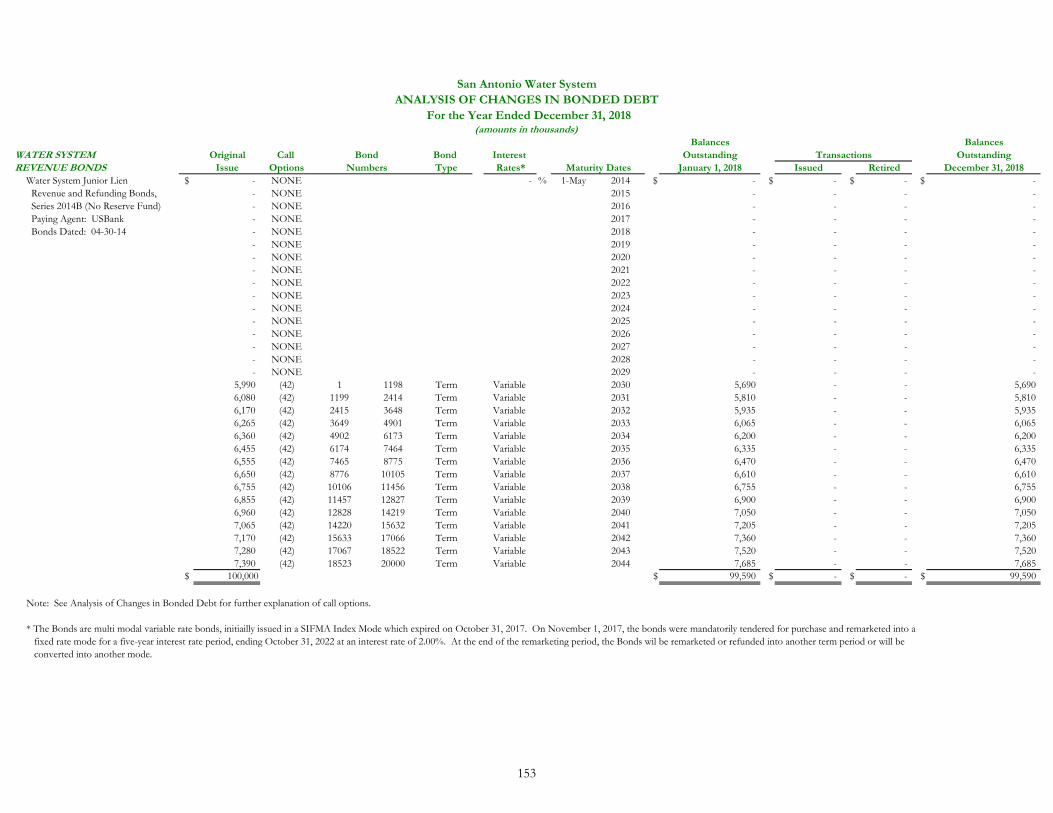
San Antonio Water SystemANALYSIS OF CHANGES IN BONDED DEBT
For the Year Ended December 31, 2018(amounts in thousands)
Balances BalancesWATER SYSTEM Original Call Bond Interest Outstanding Transactions OutstandingREVENUE BONDS Issue Options Type Rates* Maturity Dates January 1, 2018 Issued Retired December 31, 2018
Water System Junior Lien $ - NONE - % 1-May 2014 $ - $ - $ - $ - Revenue and Refunding Bonds, - NONE 2015 - - - - Series 2014B (No Reserve Fund) - NONE 2016 - - - - Paying Agent: USBank - NONE 2017 - - - - Bonds Dated: 04-30-14 - NONE 2018 - - - -
- NONE 2019 - - - - - NONE 2020 - - - - - NONE 2021 - - - - - NONE 2022 - - - - - NONE 2023 - - - - - NONE 2024 - - - - - NONE 2025 - - - - - NONE 2026 - - - - - NONE 2027 - - - - - NONE 2028 - - - - - NONE 2029 - - - -
5,990 (42) 1 1198 Term Variable 2030 5,690 - - 5,690 6,080 (42) 1199 2414 Term Variable 2031 5,810 - - 5,810 6,170 (42) 2415 3648 Term Variable 2032 5,935 - - 5,935 6,265 (42) 3649 4901 Term Variable 2033 6,065 - - 6,065 6,360 (42) 4902 6173 Term Variable 2034 6,200 - - 6,200 6,455 (42) 6174 7464 Term Variable 2035 6,335 - - 6,335 6,555 (42) 7465 8775 Term Variable 2036 6,470 - - 6,470 6,650 (42) 8776 10105 Term Variable 2037 6,610 - - 6,610 6,755 (42) 10106 11456 Term Variable 2038 6,755 - - 6,755 6,855 (42) 11457 12827 Term Variable 2039 6,900 - - 6,900 6,960 (42) 12828 14219 Term Variable 2040 7,050 - - 7,050 7,065 (42) 14220 15632 Term Variable 2041 7,205 - - 7,205 7,170 (42) 15633 17066 Term Variable 2042 7,360 - - 7,360 7,280 (42) 17067 18522 Term Variable 2043 7,520 - - 7,520 7,390 (42) 18523 20000 Term Variable 2044 7,685 - - 7,685
$ 100,000 $ 99,590 $ - $ - $ 99,590
Note: See Analysis of Changes in Bonded Debt for further explanation of call options.
* The Bonds are multi modal variable rate bonds, initiailly issued in a SIFMA Index Mode which expired on October 31, 2017. On November 1, 2017, the bonds were mandatorily tendered for purchase and remarketed into a fixed rate mode for a five-year interest rate period, ending October 31, 2022 at an interest rate of 2.00%. At the end of the remarketing period, the Bonds wil be remarketed or refunded into another term period or will be converted into another mode.
NumbersBond
153
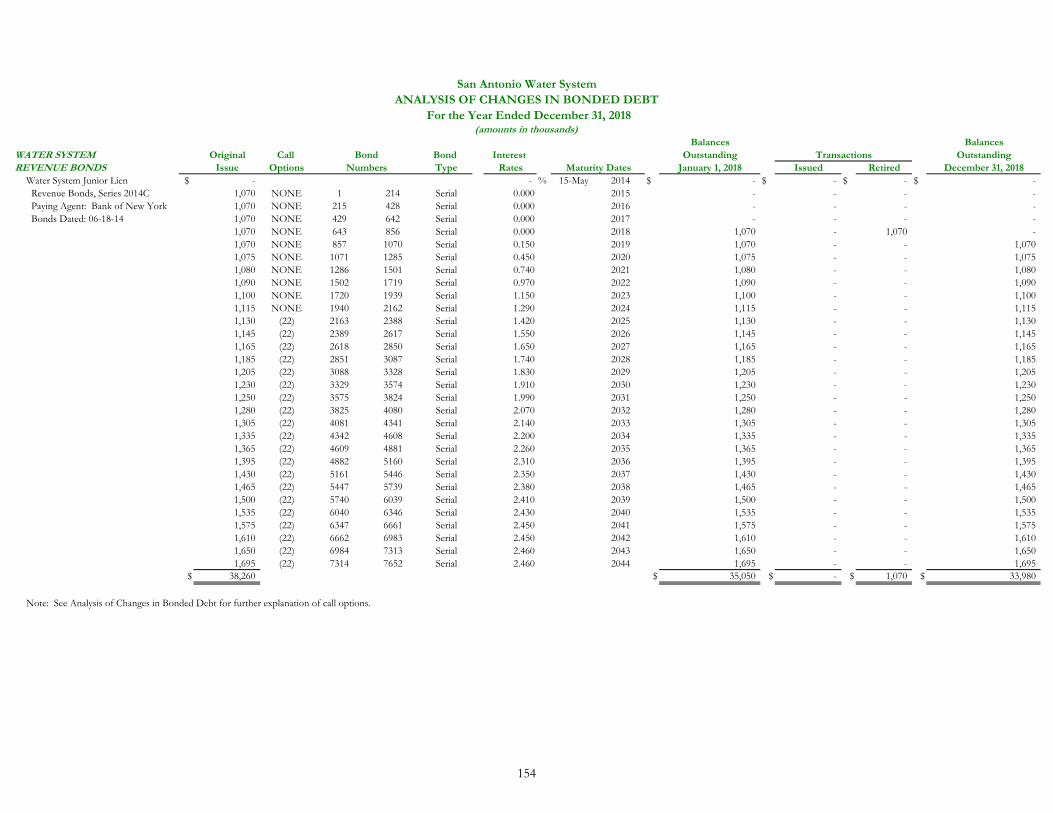
San Antonio Water SystemANALYSIS OF CHANGES IN BONDED DEBT
For the Year Ended December 31, 2018(amounts in thousands)
Balances BalancesWATER SYSTEM Original Call Bond Interest Outstanding Transactions OutstandingREVENUE BONDS Issue Options Type Rates Maturity Dates January 1, 2018 Issued Retired December 31, 2018
Water System Junior Lien $ - - % 15-May 2014 $ - $ - $ - $ - Revenue Bonds, Series 2014C 1,070 NONE 1 214 Serial 0.000 2015 - - - - Paying Agent: Bank of New York 1,070 NONE 215 428 Serial 0.000 2016 - - - - Bonds Dated: 06-18-14 1,070 NONE 429 642 Serial 0.000 2017 - - - -
1,070 NONE 643 856 Serial 0.000 2018 1,070 - 1,070 - 1,070 NONE 857 1070 Serial 0.150 2019 1,070 - - 1,070 1,075 NONE 1071 1285 Serial 0.450 2020 1,075 - - 1,075 1,080 NONE 1286 1501 Serial 0.740 2021 1,080 - - 1,080 1,090 NONE 1502 1719 Serial 0.970 2022 1,090 - - 1,090 1,100 NONE 1720 1939 Serial 1.150 2023 1,100 - - 1,100 1,115 NONE 1940 2162 Serial 1.290 2024 1,115 - - 1,115 1,130 (22) 2163 2388 Serial 1.420 2025 1,130 - - 1,130 1,145 (22) 2389 2617 Serial 1.550 2026 1,145 - - 1,145 1,165 (22) 2618 2850 Serial 1.650 2027 1,165 - - 1,165 1,185 (22) 2851 3087 Serial 1.740 2028 1,185 - - 1,185 1,205 (22) 3088 3328 Serial 1.830 2029 1,205 - - 1,205 1,230 (22) 3329 3574 Serial 1.910 2030 1,230 - - 1,230 1,250 (22) 3575 3824 Serial 1.990 2031 1,250 - - 1,250 1,280 (22) 3825 4080 Serial 2.070 2032 1,280 - - 1,280 1,305 (22) 4081 4341 Serial 2.140 2033 1,305 - - 1,305 1,335 (22) 4342 4608 Serial 2.200 2034 1,335 - - 1,335 1,365 (22) 4609 4881 Serial 2.260 2035 1,365 - - 1,365 1,395 (22) 4882 5160 Serial 2.310 2036 1,395 - - 1,395 1,430 (22) 5161 5446 Serial 2.350 2037 1,430 - - 1,430 1,465 (22) 5447 5739 Serial 2.380 2038 1,465 - - 1,465 1,500 (22) 5740 6039 Serial 2.410 2039 1,500 - - 1,500 1,535 (22) 6040 6346 Serial 2.430 2040 1,535 - - 1,535 1,575 (22) 6347 6661 Serial 2.450 2041 1,575 - - 1,575 1,610 (22) 6662 6983 Serial 2.450 2042 1,610 - - 1,610 1,650 (22) 6984 7313 Serial 2.460 2043 1,650 - - 1,650 1,695 (22) 7314 7652 Serial 2.460 2044 1,695 - - 1,695
$ 38,260 $ 35,050 $ - $ 1,070 $ 33,980
Note: See Analysis of Changes in Bonded Debt for further explanation of call options.
BondNumbers
154

San Antonio Water SystemANALYSIS OF CHANGES IN BONDED DEBT
For the Year Ended December 31, 2018(amounts in thousands)
Balances BalancesWATER SYSTEM Original Call Bond Interest Outstanding Transactions OutstandingREVENUE BONDS Issue Options Type Rates Maturity Dates January 1, 2018 Issued Retired December 31, 2018
Water System Junior Lien $ - - % 15-May 2014 $ - $ - $ - $ - Revenue Bonds, Series 2014D 1,055 NONE 1 211 Serial 0.000 2015 - - - - Paying Agent: Bank of New York 1,050 NONE 212 421 Serial 0.000 2016 - - - - Bonds Dated: 06-19-14 1,050 NONE 422 631 Serial 0.000 2017 - - - -
1,050 NONE 632 841 Serial 0.000 2018 1,050 - 1,050 - 1,055 NONE 842 1052 Serial 0.020 2019 1,055 - - 1,055 1,055 NONE 1053 1263 Serial 0.300 2020 1,055 - - 1,055 1,060 NONE 1264 1475 Serial 0.590 2021 1,060 - - 1,060 1,065 NONE 1476 1688 Serial 0.810 2022 1,065 - - 1,065 1,075 NONE 1689 1903 Serial 1.000 2023 1,075 - - 1,075 1,090 NONE 1904 2121 Serial 1.120 2024 1,090 - - 1,090 1,100 (23) 2122 2341 Serial 1.240 2025 1,100 - - 1,100 1,115 (23) 2342 2564 Serial 1.350 2026 1,115 - - 1,115 1,130 (23) 2565 2790 Serial 1.440 2027 1,130 - - 1,130 1,145 (23) 2791 3019 Serial 1.530 2028 1,145 - - 1,145 1,165 (23) 3020 3252 Serial 1.620 2029 1,165 - - 1,165 1,185 (23) 3253 3489 Serial 1.690 2030 1,185 - - 1,185 1,205 (23) 3490 3730 Serial 1.760 2031 1,205 - - 1,205 1,225 (23) 3731 3975 Serial 1.830 2032 1,225 - - 1,225 1,250 (23) 3976 4225 Serial 1.900 2033 1,250 - - 1,250 1,275 (23) 4226 4480 Serial 1.960 2034 1,275 - - 1,275
$ 22,400 $ 19,245 $ - $ 1,050 $ 18,195
Note: See Analysis of Changes in Bonded Debt for further explanation of call options.
BondNumbers
155
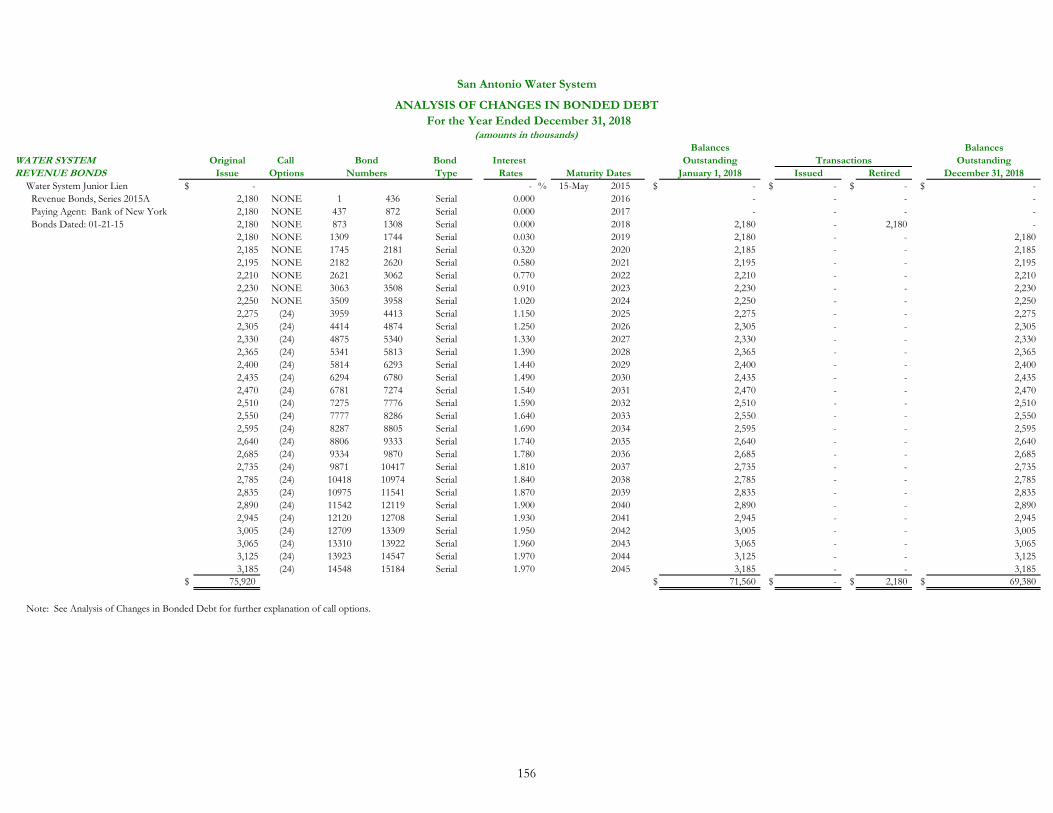
San Antonio Water System
ANALYSIS OF CHANGES IN BONDED DEBT For the Year Ended December 31, 2018
(amounts in thousands)Balances Balances
WATER SYSTEM Original Call Bond Interest Outstanding Transactions OutstandingREVENUE BONDS Issue Options Type Rates Maturity Dates January 1, 2018 Issued Retired December 31, 2018
Water System Junior Lien $ - - % 15-May 2015 $ - $ - $ - $ - Revenue Bonds, Series 2015A 2,180 NONE 1 436 Serial 0.000 2016 - - - - Paying Agent: Bank of New York 2,180 NONE 437 872 Serial 0.000 2017 - - - - Bonds Dated: 01-21-15 2,180 NONE 873 1308 Serial 0.000 2018 2,180 - 2,180 -
2,180 NONE 1309 1744 Serial 0.030 2019 2,180 - - 2,180 2,185 NONE 1745 2181 Serial 0.320 2020 2,185 - - 2,185 2,195 NONE 2182 2620 Serial 0.580 2021 2,195 - - 2,195 2,210 NONE 2621 3062 Serial 0.770 2022 2,210 - - 2,210 2,230 NONE 3063 3508 Serial 0.910 2023 2,230 - - 2,230 2,250 NONE 3509 3958 Serial 1.020 2024 2,250 - - 2,250 2,275 (24) 3959 4413 Serial 1.150 2025 2,275 - - 2,275 2,305 (24) 4414 4874 Serial 1.250 2026 2,305 - - 2,305 2,330 (24) 4875 5340 Serial 1.330 2027 2,330 - - 2,330 2,365 (24) 5341 5813 Serial 1.390 2028 2,365 - - 2,365 2,400 (24) 5814 6293 Serial 1.440 2029 2,400 - - 2,400 2,435 (24) 6294 6780 Serial 1.490 2030 2,435 - - 2,435 2,470 (24) 6781 7274 Serial 1.540 2031 2,470 - - 2,470 2,510 (24) 7275 7776 Serial 1.590 2032 2,510 - - 2,510 2,550 (24) 7777 8286 Serial 1.640 2033 2,550 - - 2,550 2,595 (24) 8287 8805 Serial 1.690 2034 2,595 - - 2,595 2,640 (24) 8806 9333 Serial 1.740 2035 2,640 - - 2,640 2,685 (24) 9334 9870 Serial 1.780 2036 2,685 - - 2,685 2,735 (24) 9871 10417 Serial 1.810 2037 2,735 - - 2,735 2,785 (24) 10418 10974 Serial 1.840 2038 2,785 - - 2,785 2,835 (24) 10975 11541 Serial 1.870 2039 2,835 - - 2,835 2,890 (24) 11542 12119 Serial 1.900 2040 2,890 - - 2,890 2,945 (24) 12120 12708 Serial 1.930 2041 2,945 - - 2,945 3,005 (24) 12709 13309 Serial 1.950 2042 3,005 - - 3,005 3,065 (24) 13310 13922 Serial 1.960 2043 3,065 - - 3,065 3,125 (24) 13923 14547 Serial 1.970 2044 3,125 - - 3,125 3,185 (24) 14548 15184 Serial 1.970 2045 3,185 - - 3,185
$ 75,920 $ 71,560 $ - $ 2,180 $ 69,380
Note: See Analysis of Changes in Bonded Debt for further explanation of call options.
BondNumbers
156
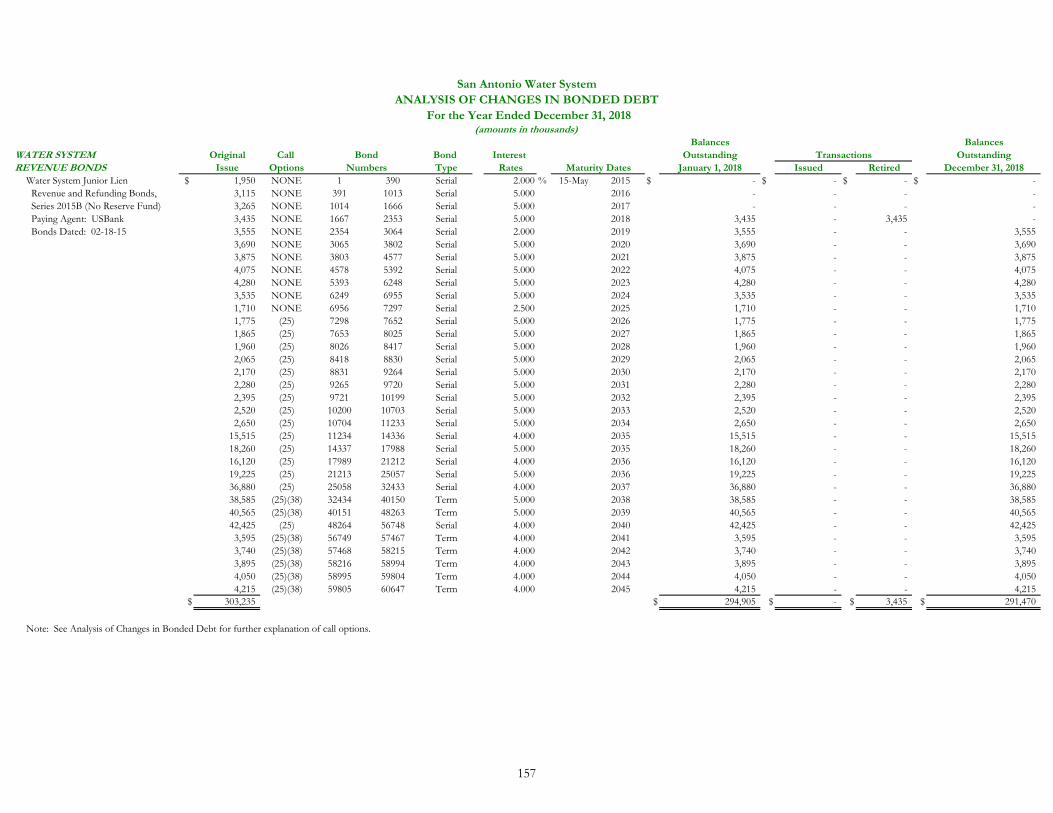
San Antonio Water SystemANALYSIS OF CHANGES IN BONDED DEBT
For the Year Ended December 31, 2018(amounts in thousands)
Balances BalancesWATER SYSTEM Original Call Bond Interest Outstanding Transactions OutstandingREVENUE BONDS Issue Options Type Rates Maturity Dates January 1, 2018 Issued Retired December 31, 2018
Water System Junior Lien $ 1,950 NONE 1 390 Serial 2.000 % 15-May 2015 $ - $ - $ - $ - Revenue and Refunding Bonds, 3,115 NONE 391 1013 Serial 5.000 2016 - - - - Series 2015B (No Reserve Fund) 3,265 NONE 1014 1666 Serial 5.000 2017 - - - - Paying Agent: USBank 3,435 NONE 1667 2353 Serial 5.000 2018 3,435 - 3,435 - Bonds Dated: 02-18-15 3,555 NONE 2354 3064 Serial 2.000 2019 3,555 - - 3,555
3,690 NONE 3065 3802 Serial 5.000 2020 3,690 - - 3,690 3,875 NONE 3803 4577 Serial 5.000 2021 3,875 - - 3,875 4,075 NONE 4578 5392 Serial 5.000 2022 4,075 - - 4,075 4,280 NONE 5393 6248 Serial 5.000 2023 4,280 - - 4,280 3,535 NONE 6249 6955 Serial 5.000 2024 3,535 - - 3,535 1,710 NONE 6956 7297 Serial 2.500 2025 1,710 - - 1,710 1,775 (25) 7298 7652 Serial 5.000 2026 1,775 - - 1,775 1,865 (25) 7653 8025 Serial 5.000 2027 1,865 - - 1,865 1,960 (25) 8026 8417 Serial 5.000 2028 1,960 - - 1,960 2,065 (25) 8418 8830 Serial 5.000 2029 2,065 - - 2,065 2,170 (25) 8831 9264 Serial 5.000 2030 2,170 - - 2,170 2,280 (25) 9265 9720 Serial 5.000 2031 2,280 - - 2,280 2,395 (25) 9721 10199 Serial 5.000 2032 2,395 - - 2,395 2,520 (25) 10200 10703 Serial 5.000 2033 2,520 - - 2,520 2,650 (25) 10704 11233 Serial 5.000 2034 2,650 - - 2,650
15,515 (25) 11234 14336 Serial 4.000 2035 15,515 - - 15,515 18,260 (25) 14337 17988 Serial 5.000 2035 18,260 - - 18,260 16,120 (25) 17989 21212 Serial 4.000 2036 16,120 - - 16,120 19,225 (25) 21213 25057 Serial 5.000 2036 19,225 - - 19,225 36,880 (25) 25058 32433 Serial 4.000 2037 36,880 - - 36,880 38,585 (25)(38) 32434 40150 Term 5.000 2038 38,585 - - 38,585 40,565 (25)(38) 40151 48263 Term 5.000 2039 40,565 - - 40,565 42,425 (25) 48264 56748 Serial 4.000 2040 42,425 - - 42,425 3,595 (25)(38) 56749 57467 Term 4.000 2041 3,595 - - 3,595 3,740 (25)(38) 57468 58215 Term 4.000 2042 3,740 - - 3,740 3,895 (25)(38) 58216 58994 Term 4.000 2043 3,895 - - 3,895 4,050 (25)(38) 58995 59804 Term 4.000 2044 4,050 - - 4,050 4,215 (25)(38) 59805 60647 Term 4.000 2045 4,215 - - 4,215
$ 303,235 $ 294,905 $ - $ 3,435 $ 291,470
Note: See Analysis of Changes in Bonded Debt for further explanation of call options.
NumbersBond
157
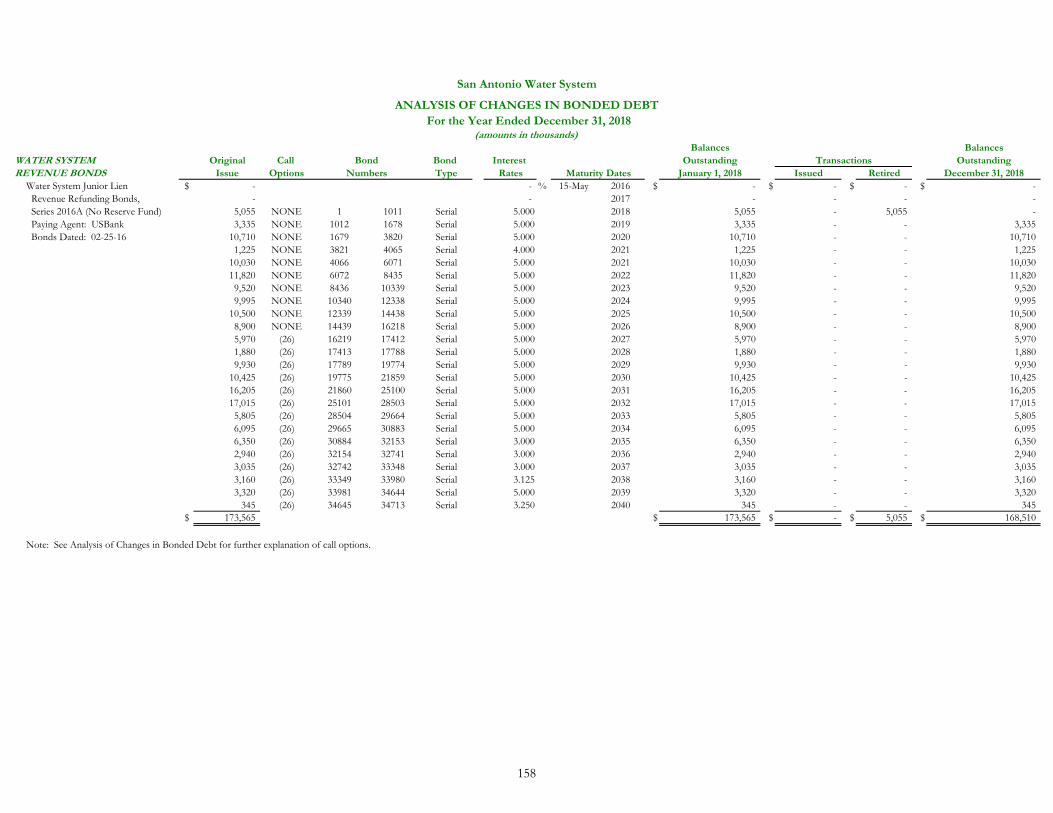
San Antonio Water System
ANALYSIS OF CHANGES IN BONDED DEBT For the Year Ended December 31, 2018
(amounts in thousands)Balances Balances
WATER SYSTEM Original Call Bond Interest Outstanding Transactions OutstandingREVENUE BONDS Issue Options Type Rates Maturity Dates January 1, 2018 Issued Retired December 31, 2018
Water System Junior Lien $ - - % 15-May 2016 $ - $ - $ - $ - Revenue Refunding Bonds, - - 2017 - - - - Series 2016A (No Reserve Fund) 5,055 NONE 1 1011 Serial 5.000 2018 5,055 - 5,055 - Paying Agent: USBank 3,335 NONE 1012 1678 Serial 5.000 2019 3,335 - - 3,335 Bonds Dated: 02-25-16 10,710 NONE 1679 3820 Serial 5.000 2020 10,710 - - 10,710
1,225 NONE 3821 4065 Serial 4.000 2021 1,225 - - 1,225 10,030 NONE 4066 6071 Serial 5.000 2021 10,030 - - 10,030 11,820 NONE 6072 8435 Serial 5.000 2022 11,820 - - 11,820 9,520 NONE 8436 10339 Serial 5.000 2023 9,520 - - 9,520 9,995 NONE 10340 12338 Serial 5.000 2024 9,995 - - 9,995
10,500 NONE 12339 14438 Serial 5.000 2025 10,500 - - 10,500 8,900 NONE 14439 16218 Serial 5.000 2026 8,900 - - 8,900 5,970 (26) 16219 17412 Serial 5.000 2027 5,970 - - 5,970 1,880 (26) 17413 17788 Serial 5.000 2028 1,880 - - 1,880 9,930 (26) 17789 19774 Serial 5.000 2029 9,930 - - 9,930
10,425 (26) 19775 21859 Serial 5.000 2030 10,425 - - 10,425 16,205 (26) 21860 25100 Serial 5.000 2031 16,205 - - 16,205 17,015 (26) 25101 28503 Serial 5.000 2032 17,015 - - 17,015 5,805 (26) 28504 29664 Serial 5.000 2033 5,805 - - 5,805 6,095 (26) 29665 30883 Serial 5.000 2034 6,095 - - 6,095 6,350 (26) 30884 32153 Serial 3.000 2035 6,350 - - 6,350 2,940 (26) 32154 32741 Serial 3.000 2036 2,940 - - 2,940 3,035 (26) 32742 33348 Serial 3.000 2037 3,035 - - 3,035 3,160 (26) 33349 33980 Serial 3.125 2038 3,160 - - 3,160 3,320 (26) 33981 34644 Serial 5.000 2039 3,320 - - 3,320
345 (26) 34645 34713 Serial 3.250 2040 345 - - 345 $ 173,565 $ 173,565 $ - $ 5,055 $ 168,510
Note: See Analysis of Changes in Bonded Debt for further explanation of call options.
BondNumbers
158
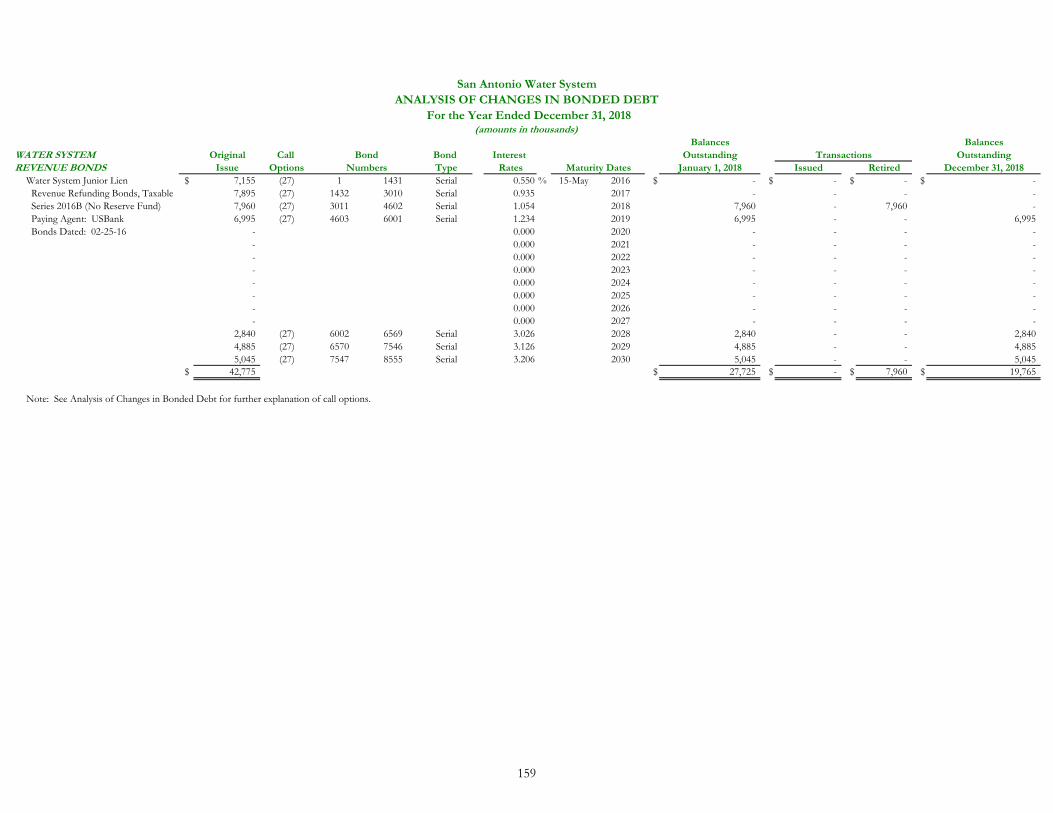
San Antonio Water SystemANALYSIS OF CHANGES IN BONDED DEBT
For the Year Ended December 31, 2018(amounts in thousands)
Balances BalancesWATER SYSTEM Original Call Bond Interest Outstanding Transactions OutstandingREVENUE BONDS Issue Options Type Rates Maturity Dates January 1, 2018 Issued Retired December 31, 2018
Water System Junior Lien $ 7,155 (27) 1 1431 Serial 0.550 % 15-May 2016 $ - $ - $ - $ - Revenue Refunding Bonds, Taxable 7,895 (27) 1432 3010 Serial 0.935 2017 - - - - Series 2016B (No Reserve Fund) 7,960 (27) 3011 4602 Serial 1.054 2018 7,960 - 7,960 - Paying Agent: USBank 6,995 (27) 4603 6001 Serial 1.234 2019 6,995 - - 6,995 Bonds Dated: 02-25-16 - 0.000 2020 - - - -
- 0.000 2021 - - - - - 0.000 2022 - - - - - 0.000 2023 - - - - - 0.000 2024 - - - - - 0.000 2025 - - - - - 0.000 2026 - - - - - 0.000 2027 - - - -
2,840 (27) 6002 6569 Serial 3.026 2028 2,840 - - 2,840 4,885 (27) 6570 7546 Serial 3.126 2029 4,885 - - 4,885 5,045 (27) 7547 8555 Serial 3.206 2030 5,045 - - 5,045
$ 42,775 $ 27,725 $ - $ 7,960 $ 19,765
Note: See Analysis of Changes in Bonded Debt for further explanation of call options.
NumbersBond
159
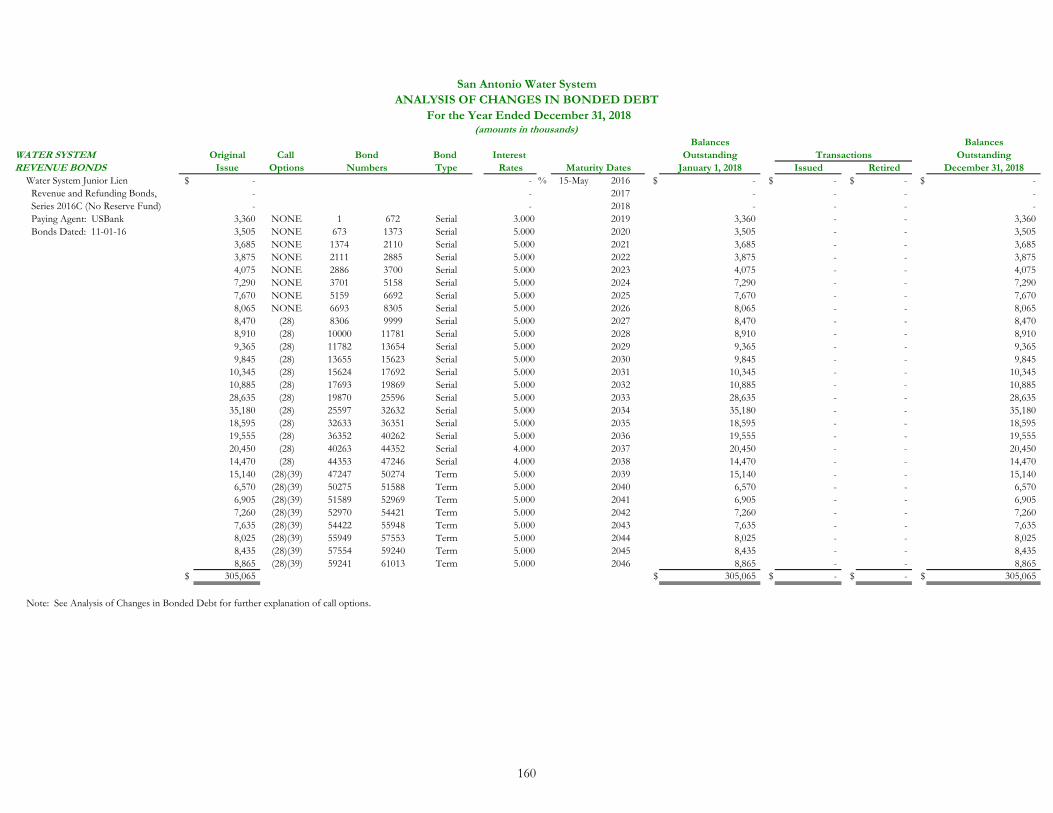
San Antonio Water SystemANALYSIS OF CHANGES IN BONDED DEBT
For the Year Ended December 31, 2018(amounts in thousands)
Balances BalancesWATER SYSTEM Original Call Bond Interest Outstanding Transactions OutstandingREVENUE BONDS Issue Options Type Rates Maturity Dates January 1, 2018 Issued Retired December 31, 2018
Water System Junior Lien $ - - % 15-May 2016 $ - $ - $ - $ - Revenue and Refunding Bonds, - - 2017 - - - - Series 2016C (No Reserve Fund) - - 2018 - - - - Paying Agent: USBank 3,360 NONE 1 672 Serial 3.000 2019 3,360 - - 3,360 Bonds Dated: 11-01-16 3,505 NONE 673 1373 Serial 5.000 2020 3,505 - - 3,505
3,685 NONE 1374 2110 Serial 5.000 2021 3,685 - - 3,685 3,875 NONE 2111 2885 Serial 5.000 2022 3,875 - - 3,875 4,075 NONE 2886 3700 Serial 5.000 2023 4,075 - - 4,075 7,290 NONE 3701 5158 Serial 5.000 2024 7,290 - - 7,290 7,670 NONE 5159 6692 Serial 5.000 2025 7,670 - - 7,670 8,065 NONE 6693 8305 Serial 5.000 2026 8,065 - - 8,065 8,470 (28) 8306 9999 Serial 5.000 2027 8,470 - - 8,470 8,910 (28) 10000 11781 Serial 5.000 2028 8,910 - - 8,910 9,365 (28) 11782 13654 Serial 5.000 2029 9,365 - - 9,365 9,845 (28) 13655 15623 Serial 5.000 2030 9,845 - - 9,845
10,345 (28) 15624 17692 Serial 5.000 2031 10,345 - - 10,345 10,885 (28) 17693 19869 Serial 5.000 2032 10,885 - - 10,885 28,635 (28) 19870 25596 Serial 5.000 2033 28,635 - - 28,635 35,180 (28) 25597 32632 Serial 5.000 2034 35,180 - - 35,180 18,595 (28) 32633 36351 Serial 5.000 2035 18,595 - - 18,595 19,555 (28) 36352 40262 Serial 5.000 2036 19,555 - - 19,555 20,450 (28) 40263 44352 Serial 4.000 2037 20,450 - - 20,450 14,470 (28) 44353 47246 Serial 4.000 2038 14,470 - - 14,470 15,140 (28)(39) 47247 50274 Term 5.000 2039 15,140 - - 15,140 6,570 (28)(39) 50275 51588 Term 5.000 2040 6,570 - - 6,570 6,905 (28)(39) 51589 52969 Term 5.000 2041 6,905 - - 6,905 7,260 (28)(39) 52970 54421 Term 5.000 2042 7,260 - - 7,260 7,635 (28)(39) 54422 55948 Term 5.000 2043 7,635 - - 7,635 8,025 (28)(39) 55949 57553 Term 5.000 2044 8,025 - - 8,025 8,435 (28)(39) 57554 59240 Term 5.000 2045 8,435 - - 8,435 8,865 (28)(39) 59241 61013 Term 5.000 2046 8,865 - - 8,865
$ 305,065 $ 305,065 $ - $ - $ 305,065
Note: See Analysis of Changes in Bonded Debt for further explanation of call options.
BondNumbers
160

San Antonio Water SystemANALYSIS OF CHANGES IN BONDED DEBT
For the Year Ended December 31, 2018(amounts in thousands)
Balances BalancesWATER SYSTEM Original Call Bond Interest Outstanding Transactions OutstandingREVENUE BONDS Issue Options Type Rates Maturity Dates January 1, 2018 Issued Retired December 31, 2018
Water System Junior Lien $ - - % 15-May 2016 $ - $ - $ - $ - Revenue Bonds, Series 2016D 165 NONE 1 33 Serial 0.000 2017 - - - - Paying Agent: USBank 385 NONE 34 110 Serial 0.000 2018 385 - 385 - Bonds Dated: 12-15-16 385 NONE 111 187 Serial 0.000 2019 385 - - 385
385 NONE 188 264 Serial 0.000 2020 385 - - 385 385 NONE 265 341 Serial 0.000 2021 385 - - 385 385 NONE 342 418 Serial 0.080 2022 385 - - 385 390 NONE 419 496 Serial 0.240 2023 390 - - 390 390 NONE 497 574 Serial 0.410 2024 390 - - 390 390 NONE 575 652 Serial 0.550 2025 390 - - 390 390 NONE 653 730 Serial 0.660 2026 390 - - 390 395 (29) 731 809 Serial 0.770 2027 395 - - 395 400 (29) 810 889 Serial 0.880 2028 400 - - 400 400 (29) 890 969 Serial 0.980 2029 400 - - 400 405 (29) 970 1050 Serial 1.050 2030 405 - - 405 410 (29) 1051 1132 Serial 1.120 2031 410 - - 410 415 (29) 1133 1215 Serial 1.190 2032 415 - - 415 420 (29) 1216 1299 Serial 1.250 2033 420 - - 420 425 (29) 1300 1384 Serial 1.300 2034 425 - - 425 430 (29) 1385 1470 Serial 1.340 2035 430 - - 430 435 (29) 1471 1557 Serial 1.370 2036 435 - - 435 440 (29) 1558 1645 Serial 1.400 2037 440 - - 440 450 (29) 1646 1735 Serial 1.430 2038 450 - - 450 455 (29) 1736 1826 Serial 1.460 2039 455 - - 455 460 (29) 1827 1918 Serial 1.470 2040 460 - - 460 465 (29) 1919 2011 Serial 1.480 2041 465 - - 465 475 (29) 2012 2106 Serial 1.490 2042 475 - - 475 480 (29) 2107 2202 Serial 1.500 2043 480 - - 480 490 (29) 2203 2300 Serial 1.510 2044 490 - - 490 495 (29) 2301 2399 Serial 1.520 2045 495 - - 495 505 (29) 2400 2500 Serial 1.530 2046 505 - - 505
$ 12,500 $ 12,335 $ - $ 385 $ 11,950
Note: See Analysis of Changes in Bonded Debt for further explanation of call options.
BondNumbers
161
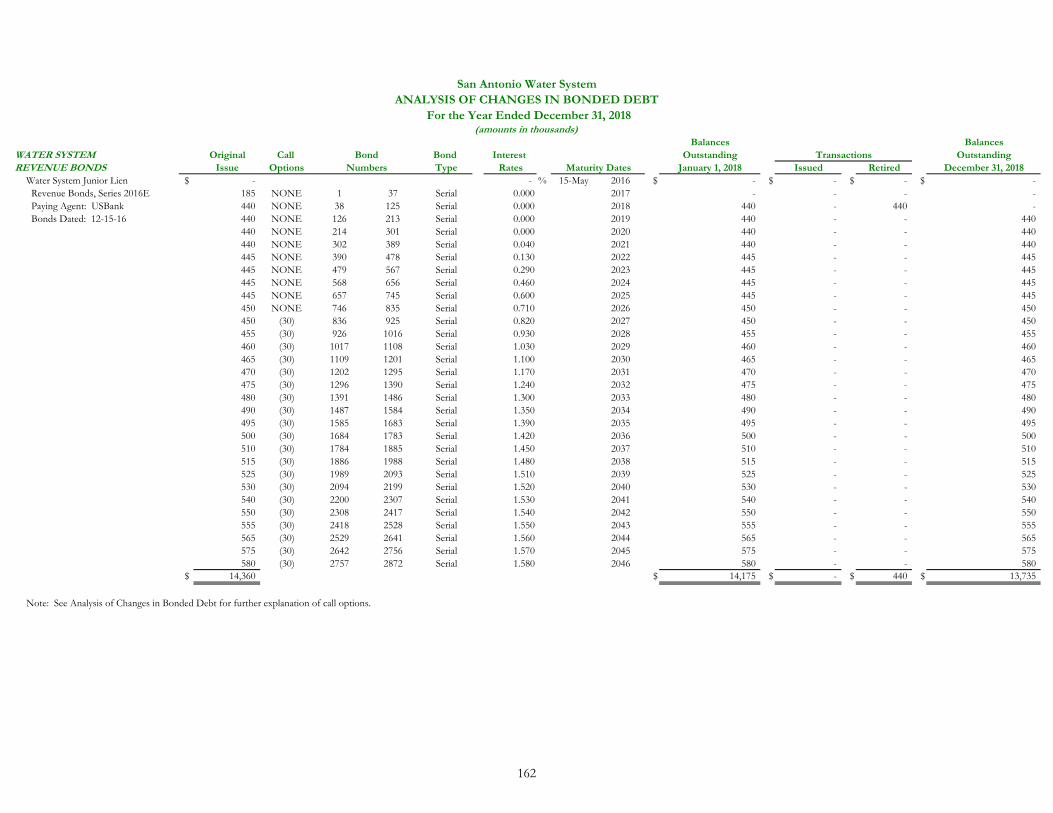
San Antonio Water SystemANALYSIS OF CHANGES IN BONDED DEBT
For the Year Ended December 31, 2018(amounts in thousands)
Balances BalancesWATER SYSTEM Original Call Bond Interest Outstanding Transactions OutstandingREVENUE BONDS Issue Options Type Rates Maturity Dates January 1, 2018 Issued Retired December 31, 2018
Water System Junior Lien $ - - % 15-May 2016 $ - $ - $ - $ - Revenue Bonds, Series 2016E 185 NONE 1 37 Serial 0.000 2017 - - - - Paying Agent: USBank 440 NONE 38 125 Serial 0.000 2018 440 - 440 - Bonds Dated: 12-15-16 440 NONE 126 213 Serial 0.000 2019 440 - - 440
440 NONE 214 301 Serial 0.000 2020 440 - - 440 440 NONE 302 389 Serial 0.040 2021 440 - - 440 445 NONE 390 478 Serial 0.130 2022 445 - - 445 445 NONE 479 567 Serial 0.290 2023 445 - - 445 445 NONE 568 656 Serial 0.460 2024 445 - - 445 445 NONE 657 745 Serial 0.600 2025 445 - - 445 450 NONE 746 835 Serial 0.710 2026 450 - - 450 450 (30) 836 925 Serial 0.820 2027 450 - - 450 455 (30) 926 1016 Serial 0.930 2028 455 - - 455 460 (30) 1017 1108 Serial 1.030 2029 460 - - 460 465 (30) 1109 1201 Serial 1.100 2030 465 - - 465 470 (30) 1202 1295 Serial 1.170 2031 470 - - 470 475 (30) 1296 1390 Serial 1.240 2032 475 - - 475 480 (30) 1391 1486 Serial 1.300 2033 480 - - 480 490 (30) 1487 1584 Serial 1.350 2034 490 - - 490 495 (30) 1585 1683 Serial 1.390 2035 495 - - 495 500 (30) 1684 1783 Serial 1.420 2036 500 - - 500 510 (30) 1784 1885 Serial 1.450 2037 510 - - 510 515 (30) 1886 1988 Serial 1.480 2038 515 - - 515 525 (30) 1989 2093 Serial 1.510 2039 525 - - 525 530 (30) 2094 2199 Serial 1.520 2040 530 - - 530 540 (30) 2200 2307 Serial 1.530 2041 540 - - 540 550 (30) 2308 2417 Serial 1.540 2042 550 - - 550 555 (30) 2418 2528 Serial 1.550 2043 555 - - 555 565 (30) 2529 2641 Serial 1.560 2044 565 - - 565 575 (30) 2642 2756 Serial 1.570 2045 575 - - 575 580 (30) 2757 2872 Serial 1.580 2046 580 - - 580
$ 14,360 $ 14,175 $ - $ 440 $ 13,735
Note: See Analysis of Changes in Bonded Debt for further explanation of call options.
BondNumbers
162
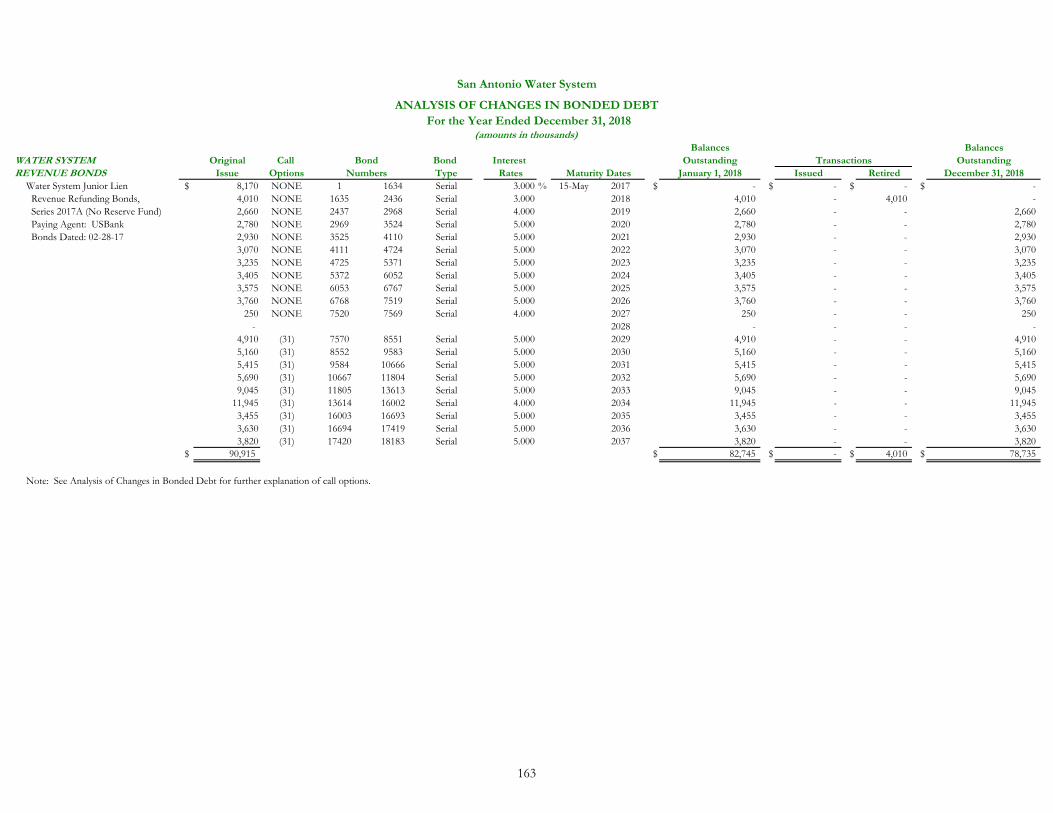
San Antonio Water System
ANALYSIS OF CHANGES IN BONDED DEBT For the Year Ended December 31, 2018
(amounts in thousands)Balances Balances
WATER SYSTEM Original Call Bond Interest Outstanding Transactions OutstandingREVENUE BONDS Issue Options Type Rates Maturity Dates January 1, 2018 Issued Retired December 31, 2018
Water System Junior Lien $ 8,170 NONE 1 1634 Serial 3.000 % 15-May 2017 $ - $ - $ - $ - Revenue Refunding Bonds, 4,010 NONE 1635 2436 Serial 3.000 2018 4,010 - 4,010 - Series 2017A (No Reserve Fund) 2,660 NONE 2437 2968 Serial 4.000 2019 2,660 - - 2,660 Paying Agent: USBank 2,780 NONE 2969 3524 Serial 5.000 2020 2,780 - - 2,780 Bonds Dated: 02-28-17 2,930 NONE 3525 4110 Serial 5.000 2021 2,930 - - 2,930
3,070 NONE 4111 4724 Serial 5.000 2022 3,070 - - 3,070 3,235 NONE 4725 5371 Serial 5.000 2023 3,235 - - 3,235 3,405 NONE 5372 6052 Serial 5.000 2024 3,405 - - 3,405 3,575 NONE 6053 6767 Serial 5.000 2025 3,575 - - 3,575 3,760 NONE 6768 7519 Serial 5.000 2026 3,760 - - 3,760
250 NONE 7520 7569 Serial 4.000 2027 250 - - 250 - 2028 - - - -
4,910 (31) 7570 8551 Serial 5.000 2029 4,910 - - 4,910 5,160 (31) 8552 9583 Serial 5.000 2030 5,160 - - 5,160 5,415 (31) 9584 10666 Serial 5.000 2031 5,415 - - 5,415 5,690 (31) 10667 11804 Serial 5.000 2032 5,690 - - 5,690 9,045 (31) 11805 13613 Serial 5.000 2033 9,045 - - 9,045
11,945 (31) 13614 16002 Serial 4.000 2034 11,945 - - 11,945 3,455 (31) 16003 16693 Serial 5.000 2035 3,455 - - 3,455 3,630 (31) 16694 17419 Serial 5.000 2036 3,630 - - 3,630 3,820 (31) 17420 18183 Serial 5.000 2037 3,820 - - 3,820
$ 90,915 $ 82,745 $ - $ 4,010 $ 78,735
Note: See Analysis of Changes in Bonded Debt for further explanation of call options.
BondNumbers
163
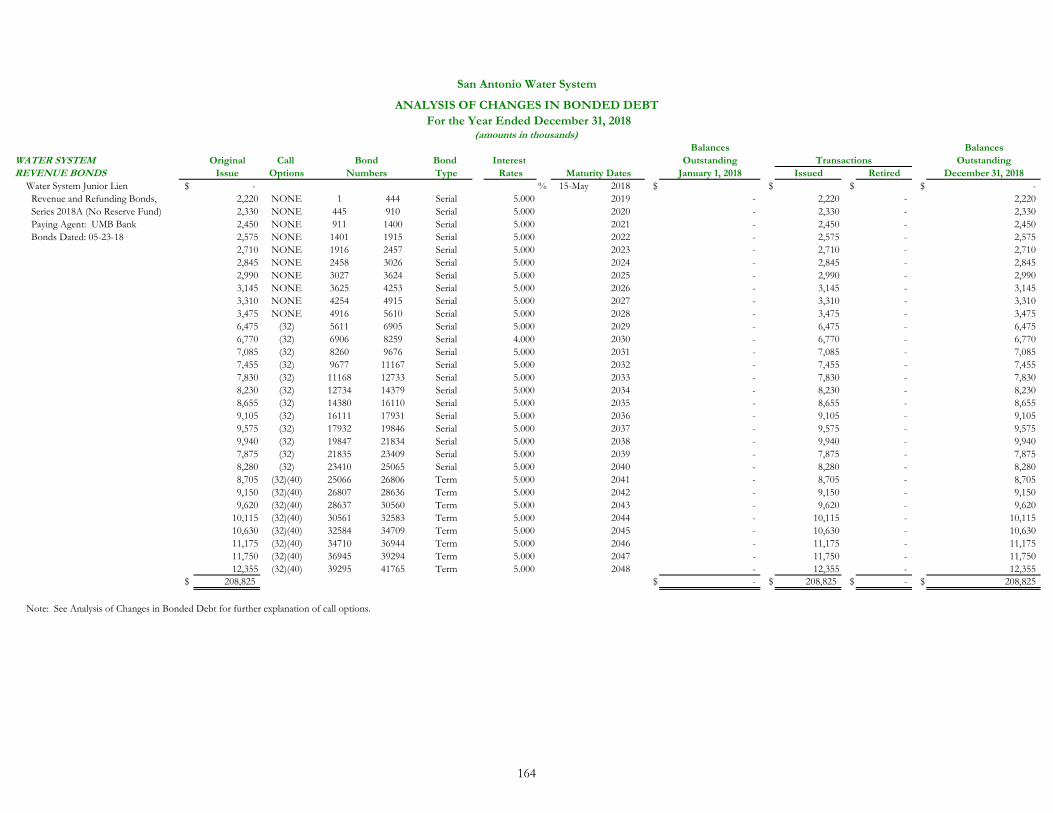
San Antonio Water System
ANALYSIS OF CHANGES IN BONDED DEBT For the Year Ended December 31, 2018
(amounts in thousands)Balances Balances
WATER SYSTEM Original Call Bond Interest Outstanding Transactions OutstandingREVENUE BONDS Issue Options Type Rates Maturity Dates January 1, 2018 Issued Retired December 31, 2018
Water System Junior Lien $ - % 15-May 2018 $ $ $ $ - Revenue and Refunding Bonds, 2,220 NONE 1 444 Serial 5.000 2019 - 2,220 - 2,220 Series 2018A (No Reserve Fund) 2,330 NONE 445 910 Serial 5.000 2020 - 2,330 - 2,330 Paying Agent: UMB Bank 2,450 NONE 911 1400 Serial 5.000 2021 - 2,450 - 2,450 Bonds Dated: 05-23-18 2,575 NONE 1401 1915 Serial 5.000 2022 - 2,575 - 2,575
2,710 NONE 1916 2457 Serial 5.000 2023 - 2,710 - 2,710 2,845 NONE 2458 3026 Serial 5.000 2024 - 2,845 - 2,845 2,990 NONE 3027 3624 Serial 5.000 2025 - 2,990 - 2,990 3,145 NONE 3625 4253 Serial 5.000 2026 - 3,145 - 3,145 3,310 NONE 4254 4915 Serial 5.000 2027 - 3,310 - 3,310 3,475 NONE 4916 5610 Serial 5.000 2028 - 3,475 - 3,475 6,475 (32) 5611 6905 Serial 5.000 2029 - 6,475 - 6,475 6,770 (32) 6906 8259 Serial 4.000 2030 - 6,770 - 6,770 7,085 (32) 8260 9676 Serial 5.000 2031 - 7,085 - 7,085 7,455 (32) 9677 11167 Serial 5.000 2032 - 7,455 - 7,455 7,830 (32) 11168 12733 Serial 5.000 2033 - 7,830 - 7,830 8,230 (32) 12734 14379 Serial 5.000 2034 - 8,230 - 8,230 8,655 (32) 14380 16110 Serial 5.000 2035 - 8,655 - 8,655 9,105 (32) 16111 17931 Serial 5.000 2036 - 9,105 - 9,105 9,575 (32) 17932 19846 Serial 5.000 2037 - 9,575 - 9,575 9,940 (32) 19847 21834 Serial 5.000 2038 - 9,940 - 9,940 7,875 (32) 21835 23409 Serial 5.000 2039 - 7,875 - 7,875 8,280 (32) 23410 25065 Serial 5.000 2040 - 8,280 - 8,280 8,705 (32)(40) 25066 26806 Term 5.000 2041 - 8,705 - 8,705 9,150 (32)(40) 26807 28636 Term 5.000 2042 - 9,150 - 9,150 9,620 (32)(40) 28637 30560 Term 5.000 2043 - 9,620 - 9,620
10,115 (32)(40) 30561 32583 Term 5.000 2044 - 10,115 - 10,115 10,630 (32)(40) 32584 34709 Term 5.000 2045 - 10,630 - 10,630 11,175 (32)(40) 34710 36944 Term 5.000 2046 - 11,175 - 11,175 11,750 (32)(40) 36945 39294 Term 5.000 2047 - 11,750 - 11,750 12,355 (32)(40) 39295 41765 Term 5.000 2048 - 12,355 - 12,355
$ 208,825 $ - $ 208,825 $ - $ 208,825
Note: See Analysis of Changes in Bonded Debt for further explanation of call options.
BondNumbers
164
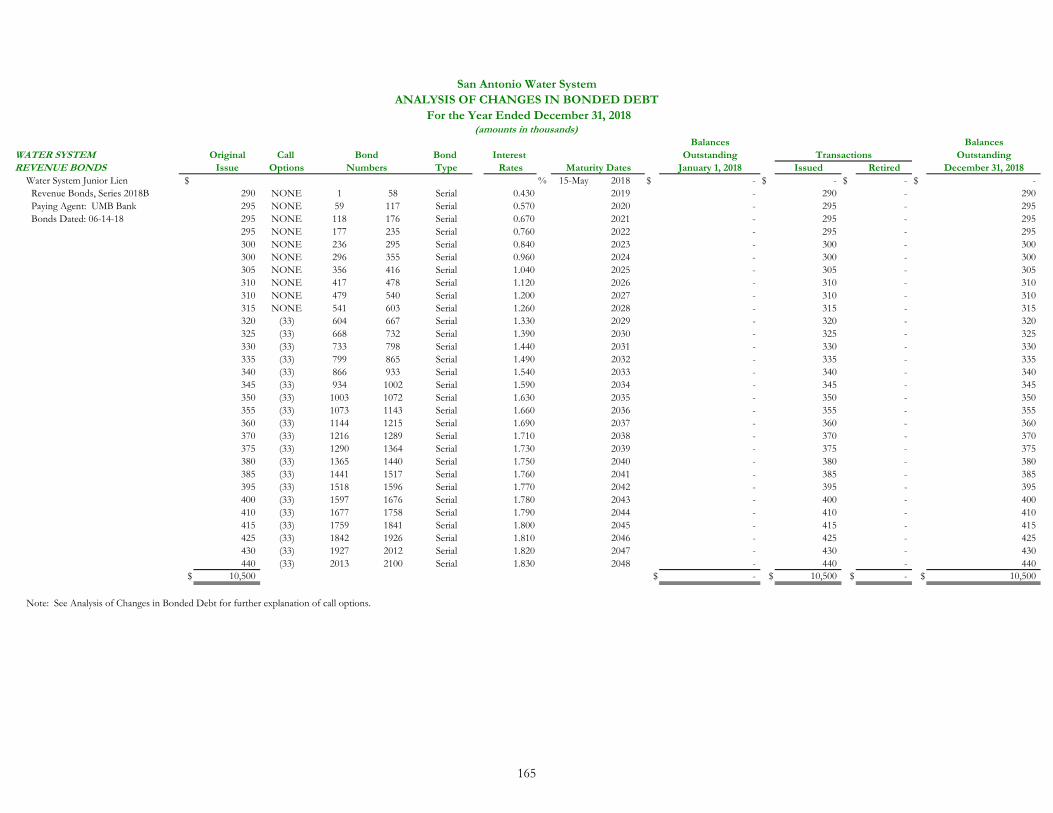
San Antonio Water SystemANALYSIS OF CHANGES IN BONDED DEBT
For the Year Ended December 31, 2018(amounts in thousands)
Balances BalancesWATER SYSTEM Original Call Bond Interest Outstanding Transactions OutstandingREVENUE BONDS Issue Options Type Rates Maturity Dates January 1, 2018 Issued Retired December 31, 2018
Water System Junior Lien $ % 15-May 2018 $ - $ - $ - $ - Revenue Bonds, Series 2018B 290 NONE 1 58 Serial 0.430 2019 - 290 - 290 Paying Agent: UMB Bank 295 NONE 59 117 Serial 0.570 2020 - 295 - 295 Bonds Dated: 06-14-18 295 NONE 118 176 Serial 0.670 2021 - 295 - 295
295 NONE 177 235 Serial 0.760 2022 - 295 - 295 300 NONE 236 295 Serial 0.840 2023 - 300 - 300 300 NONE 296 355 Serial 0.960 2024 - 300 - 300 305 NONE 356 416 Serial 1.040 2025 - 305 - 305 310 NONE 417 478 Serial 1.120 2026 - 310 - 310 310 NONE 479 540 Serial 1.200 2027 - 310 - 310 315 NONE 541 603 Serial 1.260 2028 - 315 - 315 320 (33) 604 667 Serial 1.330 2029 - 320 - 320 325 (33) 668 732 Serial 1.390 2030 - 325 - 325 330 (33) 733 798 Serial 1.440 2031 - 330 - 330 335 (33) 799 865 Serial 1.490 2032 - 335 - 335 340 (33) 866 933 Serial 1.540 2033 - 340 - 340 345 (33) 934 1002 Serial 1.590 2034 - 345 - 345 350 (33) 1003 1072 Serial 1.630 2035 - 350 - 350 355 (33) 1073 1143 Serial 1.660 2036 - 355 - 355 360 (33) 1144 1215 Serial 1.690 2037 - 360 - 360 370 (33) 1216 1289 Serial 1.710 2038 - 370 - 370 375 (33) 1290 1364 Serial 1.730 2039 - 375 - 375 380 (33) 1365 1440 Serial 1.750 2040 - 380 - 380 385 (33) 1441 1517 Serial 1.760 2041 - 385 - 385 395 (33) 1518 1596 Serial 1.770 2042 - 395 - 395 400 (33) 1597 1676 Serial 1.780 2043 - 400 - 400 410 (33) 1677 1758 Serial 1.790 2044 - 410 - 410 415 (33) 1759 1841 Serial 1.800 2045 - 415 - 415 425 (33) 1842 1926 Serial 1.810 2046 - 425 - 425 430 (33) 1927 2012 Serial 1.820 2047 - 430 - 430 440 (33) 2013 2100 Serial 1.830 2048 - 440 - 440
$ 10,500 $ - $ 10,500 $ - $ 10,500
Note: See Analysis of Changes in Bonded Debt for further explanation of call options.
NumbersBond
165
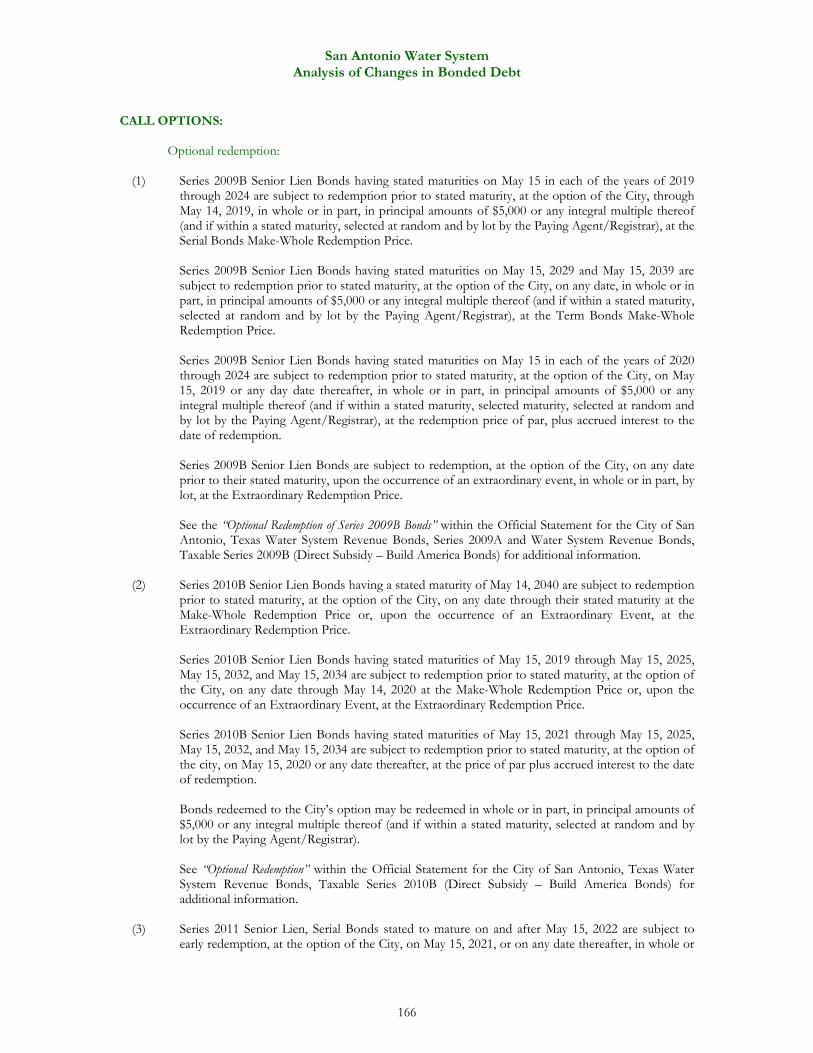
San Antonio Water System Analysis of Changes in Bonded Debt
CALL OPTIONS: Optional redemption:
(1) Series 2009B Senior Lien Bonds having stated maturities on May 15 in each of the years of 2019 through 2024 are subject to redemption prior to stated maturity, at the option of the City, through May 14, 2019, in whole or in part, in principal amounts of $5,000 or any integral multiple thereof (and if within a stated maturity, selected at random and by lot by the Paying Agent/Registrar), at the Serial Bonds Make-Whole Redemption Price.
Series 2009B Senior Lien Bonds having stated maturities on May 15, 2029 and May 15, 2039 are subject to redemption prior to stated maturity, at the option of the City, on any date, in whole or in part, in principal amounts of $5,000 or any integral multiple thereof (and if within a stated maturity, selected at random and by lot by the Paying Agent/Registrar), at the Term Bonds Make-Whole Redemption Price.
Series 2009B Senior Lien Bonds having stated maturities on May 15 in each of the years of 2020 through 2024 are subject to redemption prior to stated maturity, at the option of the City, on May 15, 2019 or any day date thereafter, in whole or in part, in principal amounts of $5,000 or any integral multiple thereof (and if within a stated maturity, selected maturity, selected at random and by lot by the Paying Agent/Registrar), at the redemption price of par, plus accrued interest to the date of redemption.
Series 2009B Senior Lien Bonds are subject to redemption, at the option of the City, on any date prior to their stated maturity, upon the occurrence of an extraordinary event, in whole or in part, by lot, at the Extraordinary Redemption Price.
See the “Optional Redemption of Series 2009B Bonds” within the Official Statement for the City of San Antonio, Texas Water System Revenue Bonds, Series 2009A and Water System Revenue Bonds, Taxable Series 2009B (Direct Subsidy – Build America Bonds) for additional information.
(2) Series 2010B Senior Lien Bonds having a stated maturity of May 14, 2040 are subject to redemption
prior to stated maturity, at the option of the City, on any date through their stated maturity at the Make-Whole Redemption Price or, upon the occurrence of an Extraordinary Event, at the Extraordinary Redemption Price.
Series 2010B Senior Lien Bonds having stated maturities of May 15, 2019 through May 15, 2025, May 15, 2032, and May 15, 2034 are subject to redemption prior to stated maturity, at the option of the City, on any date through May 14, 2020 at the Make-Whole Redemption Price or, upon the occurrence of an Extraordinary Event, at the Extraordinary Redemption Price.
Series 2010B Senior Lien Bonds having stated maturities of May 15, 2021 through May 15, 2025, May 15, 2032, and May 15, 2034 are subject to redemption prior to stated maturity, at the option of the city, on May 15, 2020 or any date thereafter, at the price of par plus accrued interest to the date of redemption.
Bonds redeemed to the City’s option may be redeemed in whole or in part, in principal amounts of $5,000 or any integral multiple thereof (and if within a stated maturity, selected at random and by lot by the Paying Agent/Registrar).
See “Optional Redemption” within the Official Statement for the City of San Antonio, Texas Water System Revenue Bonds, Taxable Series 2010B (Direct Subsidy – Build America Bonds) for additional information.
(3) Series 2011 Senior Lien, Serial Bonds stated to mature on and after May 15, 2022 are subject to
early redemption, at the option of the City, on May 15, 2021, or on any date thereafter, in whole or
166
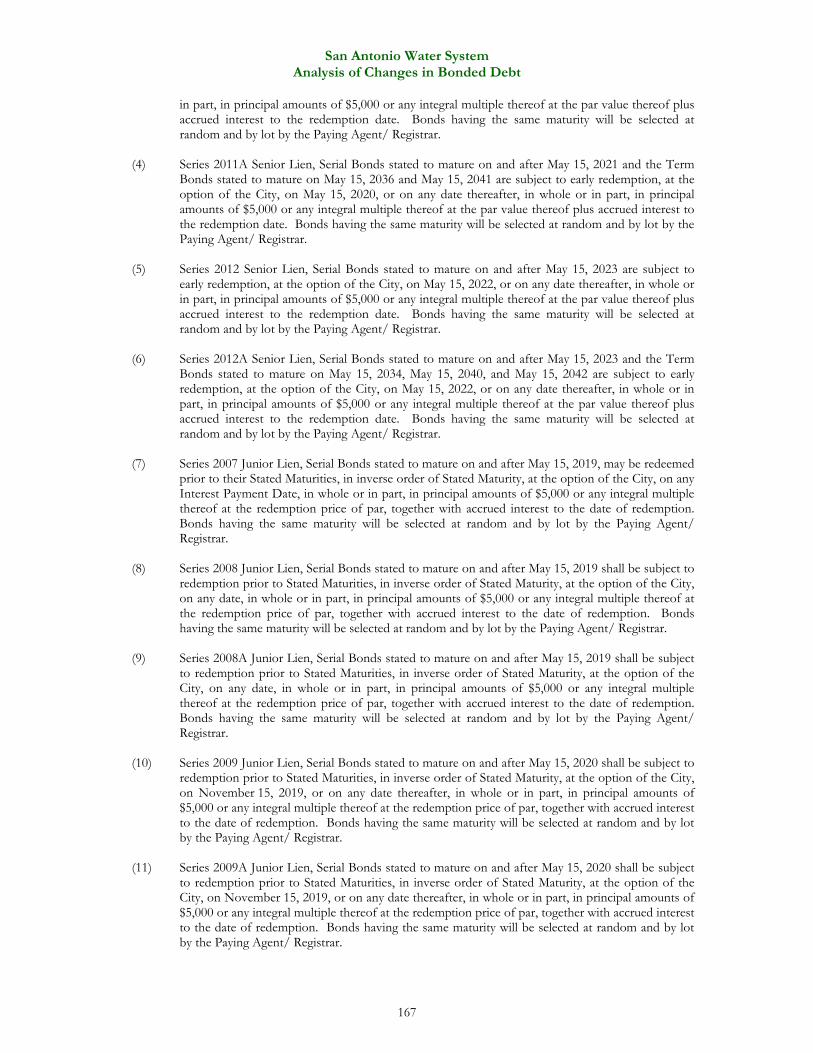
San Antonio Water System Analysis of Changes in Bonded Debt
in part, in principal amounts of $5,000 or any integral multiple thereof at the par value thereof plus accrued interest to the redemption date. Bonds having the same maturity will be selected at random and by lot by the Paying Agent/ Registrar.
(4) Series 2011A Senior Lien, Serial Bonds stated to mature on and after May 15, 2021 and the Term
Bonds stated to mature on May 15, 2036 and May 15, 2041 are subject to early redemption, at the option of the City, on May 15, 2020, or on any date thereafter, in whole or in part, in principal amounts of $5,000 or any integral multiple thereof at the par value thereof plus accrued interest to the redemption date. Bonds having the same maturity will be selected at random and by lot by the Paying Agent/ Registrar.
(5) Series 2012 Senior Lien, Serial Bonds stated to mature on and after May 15, 2023 are subject to
early redemption, at the option of the City, on May 15, 2022, or on any date thereafter, in whole or in part, in principal amounts of $5,000 or any integral multiple thereof at the par value thereof plus accrued interest to the redemption date. Bonds having the same maturity will be selected at random and by lot by the Paying Agent/ Registrar.
(6) Series 2012A Senior Lien, Serial Bonds stated to mature on and after May 15, 2023 and the Term
Bonds stated to mature on May 15, 2034, May 15, 2040, and May 15, 2042 are subject to early redemption, at the option of the City, on May 15, 2022, or on any date thereafter, in whole or in part, in principal amounts of $5,000 or any integral multiple thereof at the par value thereof plus accrued interest to the redemption date. Bonds having the same maturity will be selected at random and by lot by the Paying Agent/ Registrar.
(7) Series 2007 Junior Lien, Serial Bonds stated to mature on and after May 15, 2019, may be redeemed
prior to their Stated Maturities, in inverse order of Stated Maturity, at the option of the City, on any Interest Payment Date, in whole or in part, in principal amounts of $5,000 or any integral multiple thereof at the redemption price of par, together with accrued interest to the date of redemption. Bonds having the same maturity will be selected at random and by lot by the Paying Agent/ Registrar.
(8) Series 2008 Junior Lien, Serial Bonds stated to mature on and after May 15, 2019 shall be subject to
redemption prior to Stated Maturities, in inverse order of Stated Maturity, at the option of the City, on any date, in whole or in part, in principal amounts of $5,000 or any integral multiple thereof at the redemption price of par, together with accrued interest to the date of redemption. Bonds having the same maturity will be selected at random and by lot by the Paying Agent/ Registrar.
(9) Series 2008A Junior Lien, Serial Bonds stated to mature on and after May 15, 2019 shall be subject
to redemption prior to Stated Maturities, in inverse order of Stated Maturity, at the option of the City, on any date, in whole or in part, in principal amounts of $5,000 or any integral multiple thereof at the redemption price of par, together with accrued interest to the date of redemption. Bonds having the same maturity will be selected at random and by lot by the Paying Agent/ Registrar.
(10) Series 2009 Junior Lien, Serial Bonds stated to mature on and after May 15, 2020 shall be subject to
redemption prior to Stated Maturities, in inverse order of Stated Maturity, at the option of the City, on November 15, 2019, or on any date thereafter, in whole or in part, in principal amounts of $5,000 or any integral multiple thereof at the redemption price of par, together with accrued interest to the date of redemption. Bonds having the same maturity will be selected at random and by lot by the Paying Agent/ Registrar.
(11) Series 2009A Junior Lien, Serial Bonds stated to mature on and after May 15, 2020 shall be subject
to redemption prior to Stated Maturities, in inverse order of Stated Maturity, at the option of the City, on November 15, 2019, or on any date thereafter, in whole or in part, in principal amounts of $5,000 or any integral multiple thereof at the redemption price of par, together with accrued interest to the date of redemption. Bonds having the same maturity will be selected at random and by lot by the Paying Agent/ Registrar.
167
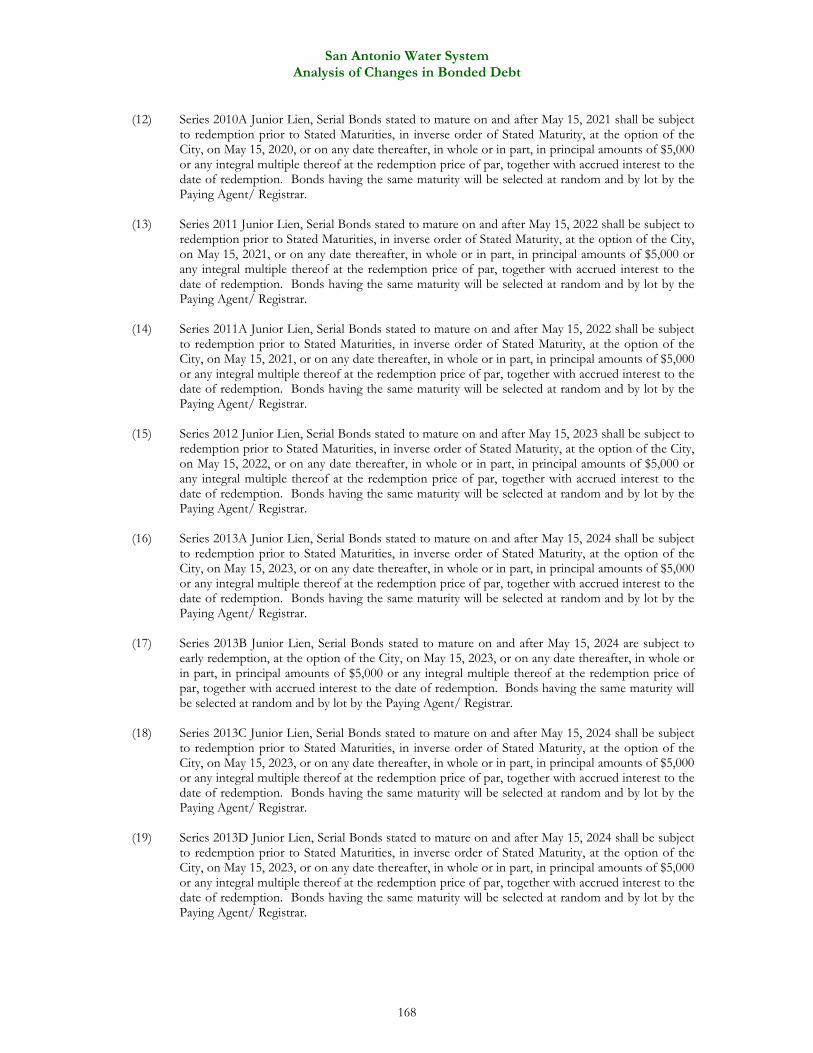
San Antonio Water System Analysis of Changes in Bonded Debt
(12) Series 2010A Junior Lien, Serial Bonds stated to mature on and after May 15, 2021 shall be subject
to redemption prior to Stated Maturities, in inverse order of Stated Maturity, at the option of the City, on May 15, 2020, or on any date thereafter, in whole or in part, in principal amounts of $5,000 or any integral multiple thereof at the redemption price of par, together with accrued interest to the date of redemption. Bonds having the same maturity will be selected at random and by lot by the Paying Agent/ Registrar.
(13) Series 2011 Junior Lien, Serial Bonds stated to mature on and after May 15, 2022 shall be subject to
redemption prior to Stated Maturities, in inverse order of Stated Maturity, at the option of the City, on May 15, 2021, or on any date thereafter, in whole or in part, in principal amounts of $5,000 or any integral multiple thereof at the redemption price of par, together with accrued interest to the date of redemption. Bonds having the same maturity will be selected at random and by lot by the Paying Agent/ Registrar.
(14) Series 2011A Junior Lien, Serial Bonds stated to mature on and after May 15, 2022 shall be subject
to redemption prior to Stated Maturities, in inverse order of Stated Maturity, at the option of the City, on May 15, 2021, or on any date thereafter, in whole or in part, in principal amounts of $5,000 or any integral multiple thereof at the redemption price of par, together with accrued interest to the date of redemption. Bonds having the same maturity will be selected at random and by lot by the Paying Agent/ Registrar.
(15) Series 2012 Junior Lien, Serial Bonds stated to mature on and after May 15, 2023 shall be subject to
redemption prior to Stated Maturities, in inverse order of Stated Maturity, at the option of the City, on May 15, 2022, or on any date thereafter, in whole or in part, in principal amounts of $5,000 or any integral multiple thereof at the redemption price of par, together with accrued interest to the date of redemption. Bonds having the same maturity will be selected at random and by lot by the Paying Agent/ Registrar.
(16) Series 2013A Junior Lien, Serial Bonds stated to mature on and after May 15, 2024 shall be subject
to redemption prior to Stated Maturities, in inverse order of Stated Maturity, at the option of the City, on May 15, 2023, or on any date thereafter, in whole or in part, in principal amounts of $5,000 or any integral multiple thereof at the redemption price of par, together with accrued interest to the date of redemption. Bonds having the same maturity will be selected at random and by lot by the Paying Agent/ Registrar.
(17) Series 2013B Junior Lien, Serial Bonds stated to mature on and after May 15, 2024 are subject to
early redemption, at the option of the City, on May 15, 2023, or on any date thereafter, in whole or in part, in principal amounts of $5,000 or any integral multiple thereof at the redemption price of par, together with accrued interest to the date of redemption. Bonds having the same maturity will be selected at random and by lot by the Paying Agent/ Registrar.
(18) Series 2013C Junior Lien, Serial Bonds stated to mature on and after May 15, 2024 shall be subject to redemption prior to Stated Maturities, in inverse order of Stated Maturity, at the option of the City, on May 15, 2023, or on any date thereafter, in whole or in part, in principal amounts of $5,000 or any integral multiple thereof at the redemption price of par, together with accrued interest to the date of redemption. Bonds having the same maturity will be selected at random and by lot by the Paying Agent/ Registrar.
(19) Series 2013D Junior Lien, Serial Bonds stated to mature on and after May 15, 2024 shall be subject to redemption prior to Stated Maturities, in inverse order of Stated Maturity, at the option of the City, on May 15, 2023, or on any date thereafter, in whole or in part, in principal amounts of $5,000 or any integral multiple thereof at the redemption price of par, together with accrued interest to the date of redemption. Bonds having the same maturity will be selected at random and by lot by the Paying Agent/ Registrar.
168
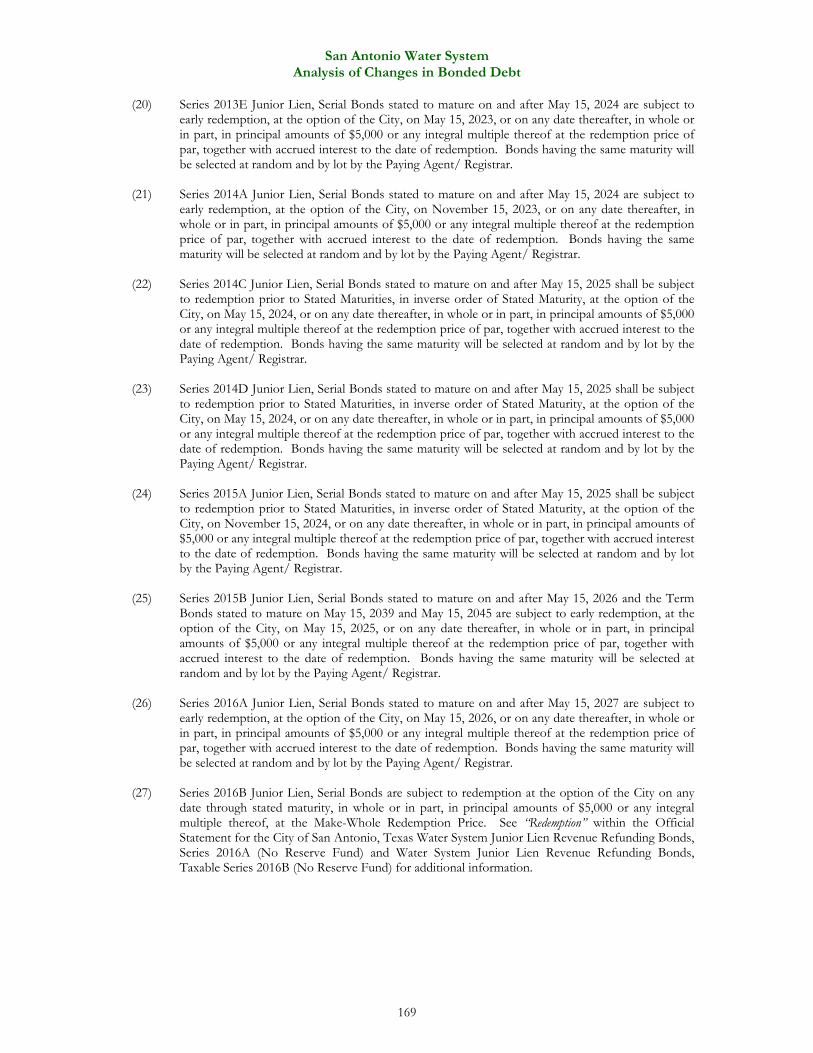
San Antonio Water System Analysis of Changes in Bonded Debt
(20) Series 2013E Junior Lien, Serial Bonds stated to mature on and after May 15, 2024 are subject to early redemption, at the option of the City, on May 15, 2023, or on any date thereafter, in whole or in part, in principal amounts of $5,000 or any integral multiple thereof at the redemption price of par, together with accrued interest to the date of redemption. Bonds having the same maturity will be selected at random and by lot by the Paying Agent/ Registrar.
(21) Series 2014A Junior Lien, Serial Bonds stated to mature on and after May 15, 2024 are subject to early redemption, at the option of the City, on November 15, 2023, or on any date thereafter, in whole or in part, in principal amounts of $5,000 or any integral multiple thereof at the redemption price of par, together with accrued interest to the date of redemption. Bonds having the same maturity will be selected at random and by lot by the Paying Agent/ Registrar.
(22) Series 2014C Junior Lien, Serial Bonds stated to mature on and after May 15, 2025 shall be subject to redemption prior to Stated Maturities, in inverse order of Stated Maturity, at the option of the City, on May 15, 2024, or on any date thereafter, in whole or in part, in principal amounts of $5,000 or any integral multiple thereof at the redemption price of par, together with accrued interest to the date of redemption. Bonds having the same maturity will be selected at random and by lot by the Paying Agent/ Registrar.
(23) Series 2014D Junior Lien, Serial Bonds stated to mature on and after May 15, 2025 shall be subject to redemption prior to Stated Maturities, in inverse order of Stated Maturity, at the option of the City, on May 15, 2024, or on any date thereafter, in whole or in part, in principal amounts of $5,000 or any integral multiple thereof at the redemption price of par, together with accrued interest to the date of redemption. Bonds having the same maturity will be selected at random and by lot by the Paying Agent/ Registrar.
(24) Series 2015A Junior Lien, Serial Bonds stated to mature on and after May 15, 2025 shall be subject
to redemption prior to Stated Maturities, in inverse order of Stated Maturity, at the option of the City, on November 15, 2024, or on any date thereafter, in whole or in part, in principal amounts of $5,000 or any integral multiple thereof at the redemption price of par, together with accrued interest to the date of redemption. Bonds having the same maturity will be selected at random and by lot by the Paying Agent/ Registrar.
(25) Series 2015B Junior Lien, Serial Bonds stated to mature on and after May 15, 2026 and the Term
Bonds stated to mature on May 15, 2039 and May 15, 2045 are subject to early redemption, at the option of the City, on May 15, 2025, or on any date thereafter, in whole or in part, in principal amounts of $5,000 or any integral multiple thereof at the redemption price of par, together with accrued interest to the date of redemption. Bonds having the same maturity will be selected at random and by lot by the Paying Agent/ Registrar.
(26) Series 2016A Junior Lien, Serial Bonds stated to mature on and after May 15, 2027 are subject to
early redemption, at the option of the City, on May 15, 2026, or on any date thereafter, in whole or in part, in principal amounts of $5,000 or any integral multiple thereof at the redemption price of par, together with accrued interest to the date of redemption. Bonds having the same maturity will be selected at random and by lot by the Paying Agent/ Registrar.
(27) Series 2016B Junior Lien, Serial Bonds are subject to redemption at the option of the City on any
date through stated maturity, in whole or in part, in principal amounts of $5,000 or any integral multiple thereof, at the Make-Whole Redemption Price. See “Redemption” within the Official Statement for the City of San Antonio, Texas Water System Junior Lien Revenue Refunding Bonds, Series 2016A (No Reserve Fund) and Water System Junior Lien Revenue Refunding Bonds, Taxable Series 2016B (No Reserve Fund) for additional information.
169
San Antonio Water System Analysis of Changes in Bonded Debt
(28) Series 2016C Junior Lien, Serial Bonds stated to mature on and after May 15, 2027 and the Term Bonds stated to mature on May 15, 2041 and May 15, 2046 are subject to early redemption, at the option of the City, on November 15, 2026, or on any date thereafter, in whole or in part, in principal amounts of $5,000 or any integral multiple thereof at the redemption price of par, together with accrued interest to the date of redemption. Bonds having the same maturity will be selected at random and by lot by the Paying Agent/ Registrar.
(29) Series 2016D Junior Lien, Serial Bonds stated to mature on and after May 15, 2027 shall be subject
to redemption prior to Stated Maturities, in inverse order of Stated Maturity, at the option of the City, on November 15, 2026, or on any date thereafter, in whole or in part, in principal amounts of $5,000 or any integral multiple thereof at the redemption price of par, together with accrued interest to the date of redemption. Bonds having the same maturity will be selected at random and by lot by the Paying Agent/ Registrar.
(30) Series 2016E Junior Lien, Serial Bonds stated to mature on and after May 15, 2027 shall be subject
to redemption prior to Stated Maturities, in inverse order of Stated Maturity, at the option of the City, on November 15, 2026, or on any date thereafter, in whole or in part, in principal amounts of $5,000 or any integral multiple thereof at the redemption price of par, together with accrued interest to the date of redemption. Bonds having the same maturity will be selected at random and by lot by the Paying Agent/ Registrar.
(31) Series 2017A Junior Lien, Serial Bonds stated to mature on and after May 15, 2029 shall be subject
to redemption prior to Stated Maturities at the option of the City, on May 15, 2027, or on any date thereafter, in whole or in part, in principal amounts of $5,000 or any integral multiple thereof at the redemption price of par, together with accrued interest to the date of redemption. Bonds having the same maturity will be selected at random and by lot by the Paying Agent/ Registrar.
(32) Series 2018A Junior Lien, Serial Bonds stated to mature on and after May 15, 2029 shall be subject
to redemption prior to Stated Maturities at the option of the City, on May 15, 2028, or on any date thereafter, in whole or in part, in principal amounts of $5,000 or any integral multiple thereof at the redemption price of par, together with accrued interest to the date of redemption.
(33) Series 2018B Junior Lien, Serial Bonds stated to mature on and after May 15, 2029 shall be subject
to redemption prior to Stated Maturities, in inverse order of Stated Maturity, at the option of the City, on May 15, 2028, or on any date thereafter, in whole or in part, in principal amounts of $5,000 or any integral multiple thereof at the redemption price of par, together with accrued interest to the date of redemption. Bonds having the same maturity will be selected at random and by lot by the Paying Agent/ Registrar.
Mandatory redemption:
(34) The Series 2009B, Term Bonds are subject to mandatory sinking fund redemption prior to their
stated maturities from money required to be deposited in the Debt Service Fund for such purpose and shall be redeemed in part, on a pro rata basis in accordance with the arrangements between the City and the securities depository, at the principal amount thereof plus accrued interest to the date of redemption in the following principal amounts on May 15 in each of the years as follows:
170
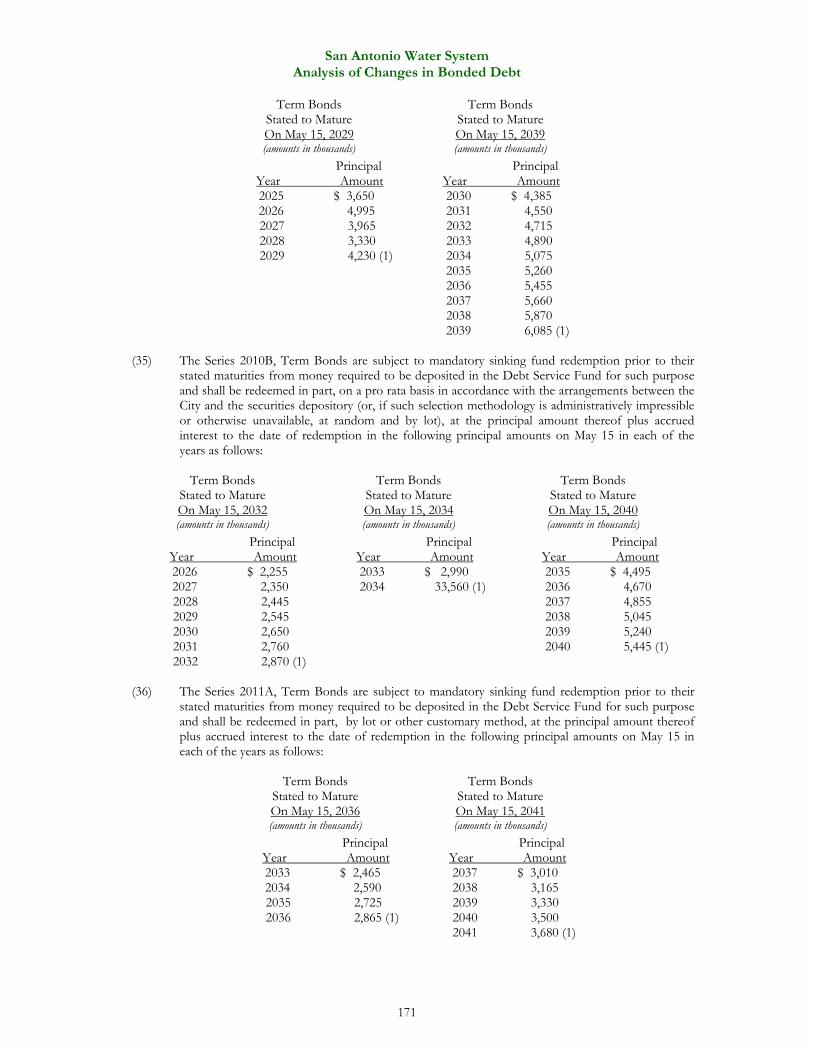
San Antonio Water System Analysis of Changes in Bonded Debt
Term Bonds Term BondsStated to Mature Stated to MatureOn May 15, 2029 On May 15, 2039(amounts in thousands) (amounts in thousands)
Principal Principal Year Amount Year Amount
2025 $ 3,6502026 4,995
2030 $ 4,385 2031 4,550
2027 3,965 2032 4,715 2028 3,330 2033 4,890 2029 4,230 (1) 2034 5,075 2035 5,260 2036 5,455 2037 5,660 2038 5,870 2039 6,085 (1)
(35) The Series 2010B, Term Bonds are subject to mandatory sinking fund redemption prior to their
stated maturities from money required to be deposited in the Debt Service Fund for such purpose and shall be redeemed in part, on a pro rata basis in accordance with the arrangements between the City and the securities depository (or, if such selection methodology is administratively impressible or otherwise unavailable, at random and by lot), at the principal amount thereof plus accrued interest to the date of redemption in the following principal amounts on May 15 in each of the years as follows:
Term Bonds Term Bonds Term Bonds
Stated to Mature Stated to Mature Stated to Mature On May 15, 2032 On May 15, 2034 On May 15, 2040 (amounts in thousands) (amounts in thousands) (amounts in thousands)
Principal Principal Principal Year Amount Year Amount Year Amount
2026 $ 2,255 2027 2,350
2033 $ 2,990 2034 33,560 (1)
2035 $ 4,495 2036 4,670
2028 2,445 2037 4,855 2029 2,545 2038 5,045 2030 2,650 2039 5,240 2031 2,760 2040 5,445 (1) 2032 2,870 (1)
(36) The Series 2011A, Term Bonds are subject to mandatory sinking fund redemption prior to their
stated maturities from money required to be deposited in the Debt Service Fund for such purpose and shall be redeemed in part, by lot or other customary method, at the principal amount thereof plus accrued interest to the date of redemption in the following principal amounts on May 15 in each of the years as follows:
Term Bonds Term BondsStated to Mature Stated to MatureOn May 15, 2036 On May 15, 2041(amounts in thousands) (amounts in thousands)
Principal Principal Year Amount Year Amount
2033 $ 2,4652034 2,590
2037 $ 3,010 2038 3,165
2035 2,725 2039 3,330 2036 2,865 (1) 2040 3,500 2041 3,680 (1)
171
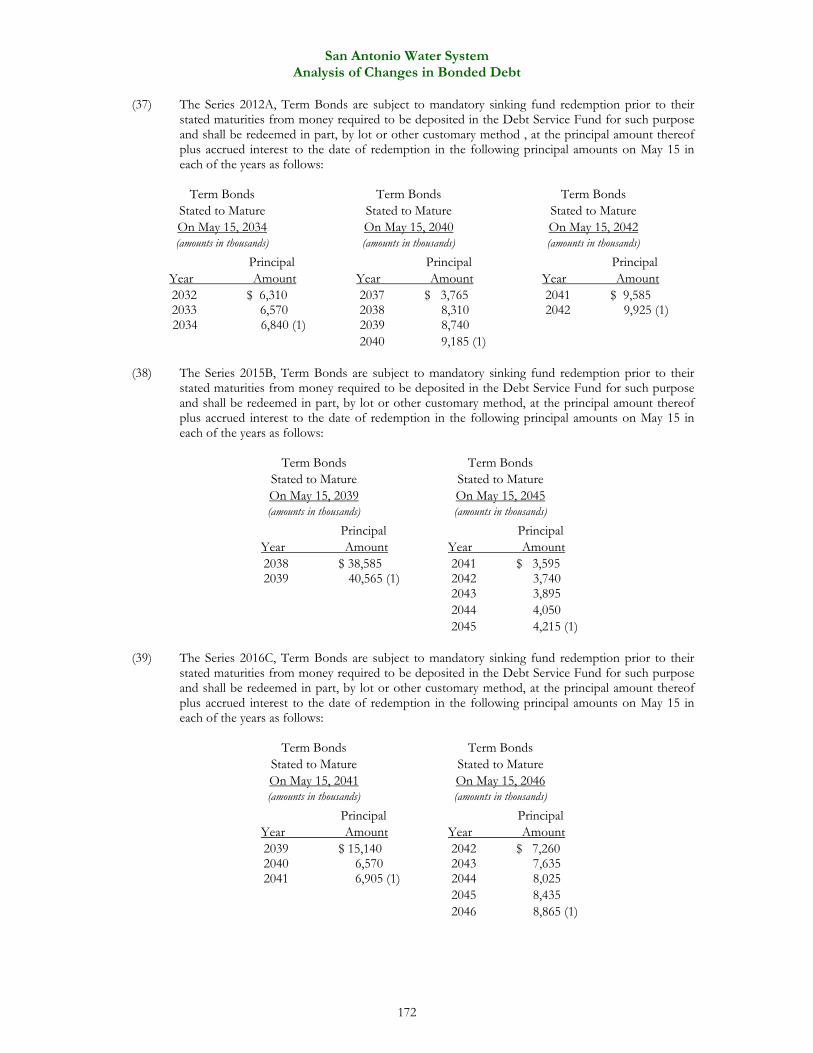
San Antonio Water System Analysis of Changes in Bonded Debt
(37) The Series 2012A, Term Bonds are subject to mandatory sinking fund redemption prior to their stated maturities from money required to be deposited in the Debt Service Fund for such purpose and shall be redeemed in part, by lot or other customary method , at the principal amount thereof plus accrued interest to the date of redemption in the following principal amounts on May 15 in each of the years as follows:
Term Bonds Term Bonds Term Bonds
Stated to Mature Stated to Mature Stated to Mature On May 15, 2034 On May 15, 2040 On May 15, 2042 (amounts in thousands) (amounts in thousands) (amounts in thousands)
Principal Principal Principal Year Amount Year Amount Year Amount
2032 $ 6,310 2033 6,570
2037 $ 3,765 2038 8,310
2041 $ 9,585 2042 9,925 (1)
2034 6,840 (1) 2039 8,740 2040 9,185 (1)
(38) The Series 2015B, Term Bonds are subject to mandatory sinking fund redemption prior to their
stated maturities from money required to be deposited in the Debt Service Fund for such purpose and shall be redeemed in part, by lot or other customary method, at the principal amount thereof plus accrued interest to the date of redemption in the following principal amounts on May 15 in each of the years as follows:
Term Bonds Term BondsStated to Mature Stated to MatureOn May 15, 2039 On May 15, 2045(amounts in thousands) (amounts in thousands)
Principal Principal Year Amount Year Amount
2038 $ 38,5852039 40,565 (1)
2041 $ 3,595 2042 3,740
2043 3,895 2044 4,050 2045 4,215 (1)
(39) The Series 2016C, Term Bonds are subject to mandatory sinking fund redemption prior to their
stated maturities from money required to be deposited in the Debt Service Fund for such purpose and shall be redeemed in part, by lot or other customary method, at the principal amount thereof plus accrued interest to the date of redemption in the following principal amounts on May 15 in each of the years as follows:
Term Bonds Term Bonds
Stated to Mature Stated to MatureOn May 15, 2041 On May 15, 2046(amounts in thousands) (amounts in thousands)
Principal Principal Year Amount Year Amount
2039 $ 15,1402040 6,570
2042 $ 7,260 2043 7,635
2041 6,905 (1) 2044 8,025 2045 8,435 2046 8,865 (1)
172
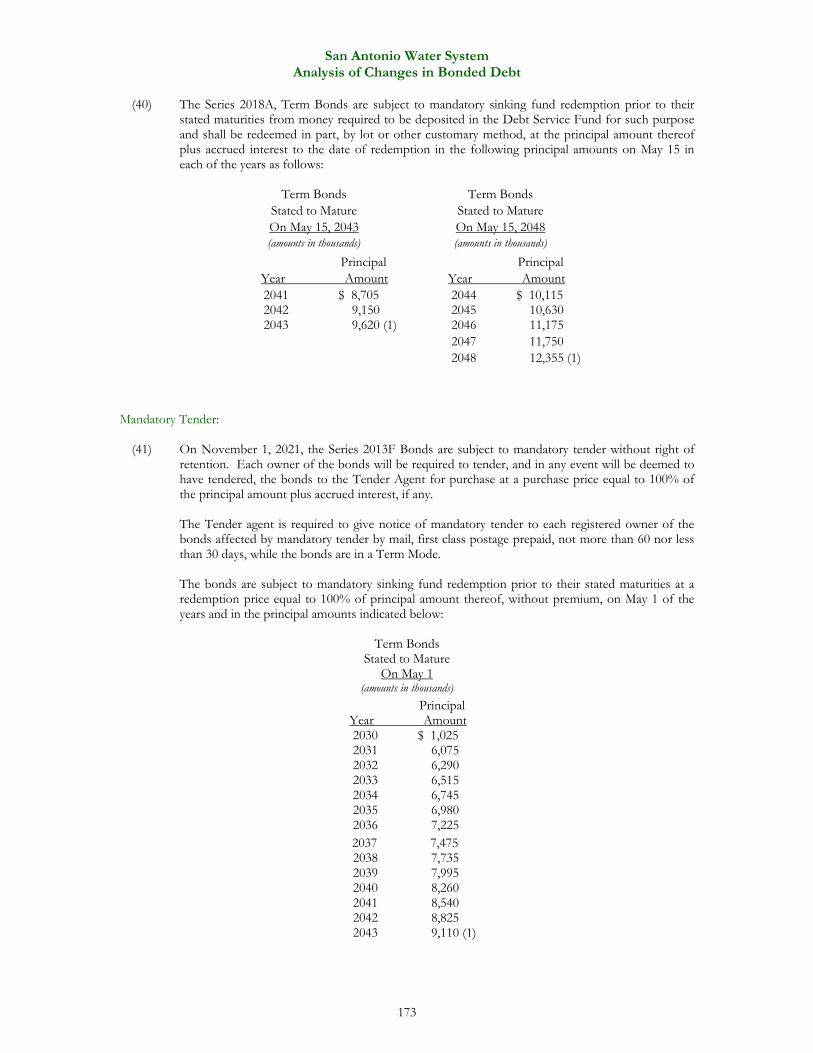
San Antonio Water System Analysis of Changes in Bonded Debt
(40) The Series 2018A, Term Bonds are subject to mandatory sinking fund redemption prior to their stated maturities from money required to be deposited in the Debt Service Fund for such purpose and shall be redeemed in part, by lot or other customary method, at the principal amount thereof plus accrued interest to the date of redemption in the following principal amounts on May 15 in each of the years as follows:
Term Bonds Term Bonds
Stated to Mature Stated to MatureOn May 15, 2043 On May 15, 2048(amounts in thousands) (amounts in thousands)
Principal Principal Year Amount Year Amount
2041 $ 8,7052042 9,150
2044 $ 10,115 2045 10,630
2043 9,620 (1) 2046 11,175 2047 11,750 2048 12,355 (1)
Mandatory Tender:
(41) On November 1, 2021, the Series 2013F Bonds are subject to mandatory tender without right of
retention. Each owner of the bonds will be required to tender, and in any event will be deemed to have tendered, the bonds to the Tender Agent for purchase at a purchase price equal to 100% of the principal amount plus accrued interest, if any.
The Tender agent is required to give notice of mandatory tender to each registered owner of the bonds affected by mandatory tender by mail, first class postage prepaid, not more than 60 nor less than 30 days, while the bonds are in a Term Mode. The bonds are subject to mandatory sinking fund redemption prior to their stated maturities at a redemption price equal to 100% of principal amount thereof, without premium, on May 1 of the years and in the principal amounts indicated below:
Term Bonds
Stated to MatureOn May 1
(amounts in thousands)
Principal Year Amount 2030 $ 1,025 2031 6,075 2032 6,290 2033 6,515 2034 6,745 2035 6,980 2036 7,225
2037 7,475 2038 7,735 2039 7,995 2040 8,260 2041 8,540 2042 8,825 2043 9,110 (1)
173
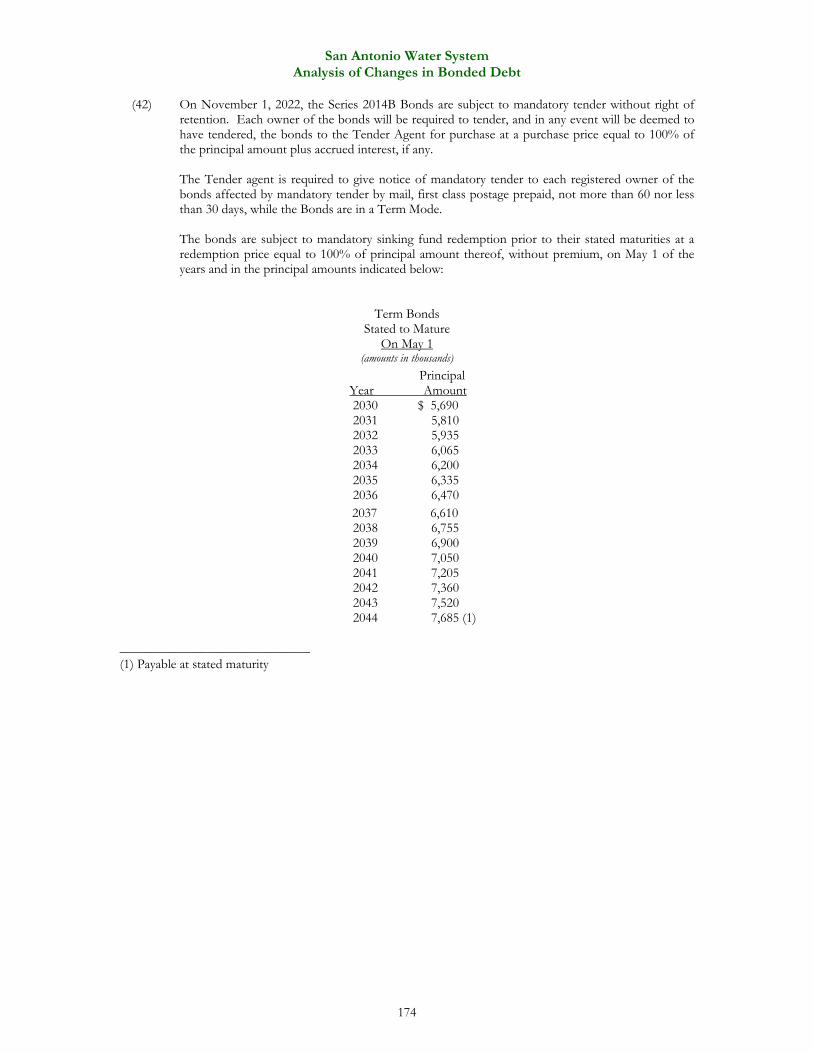
San Antonio Water System Analysis of Changes in Bonded Debt
(42) On November 1, 2022, the Series 2014B Bonds are subject to mandatory tender without right of retention. Each owner of the bonds will be required to tender, and in any event will be deemed to have tendered, the bonds to the Tender Agent for purchase at a purchase price equal to 100% of the principal amount plus accrued interest, if any.
The Tender agent is required to give notice of mandatory tender to each registered owner of the bonds affected by mandatory tender by mail, first class postage prepaid, not more than 60 nor less than 30 days, while the Bonds are in a Term Mode. The bonds are subject to mandatory sinking fund redemption prior to their stated maturities at a redemption price equal to 100% of principal amount thereof, without premium, on May 1 of the years and in the principal amounts indicated below:
Term BondsStated to Mature
On May 1(amounts in thousands)
Principal Year Amount 2030 $ 5,690 2031 5,810 2032 5,935 2033 6,065 2034 6,200 2035 6,335 2036 6,470
2037 6,610 2038 6,755 2039 6,900 2040 7,050 2041 7,205 2042 7,360 2043 7,520 2044 7,685 (1)
__________________________ (1) Payable at stated maturity
174
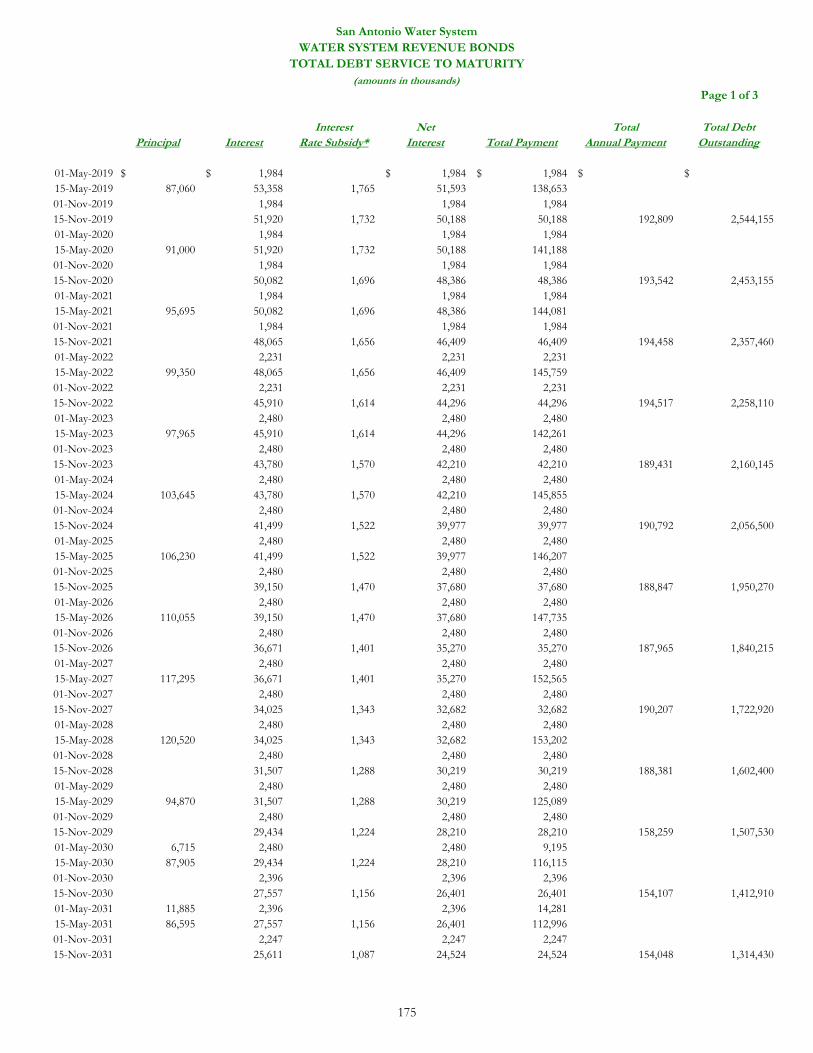
WATER SYSTEM REVENUE BONDS
Page 1 of 3
Interest Net Total Total DebtPrincipal Interest Rate Subsidy* Interest Total Payment Annual Payment Outstanding
01-May-2019 $ 1,984$ 1,984$ 1,984$ $ $15-May-2019 87,060 53,358 1,765 51,593 138,653 01-Nov-2019 1,984 1,984 1,984 15-Nov-2019 51,920 1,732 50,188 50,188 192,809 2,544,155 01-May-2020 1,984 1,984 1,984 15-May-2020 91,000 51,920 1,732 50,188 141,188 01-Nov-2020 1,984 1,984 1,984 15-Nov-2020 50,082 1,696 48,386 48,386 193,542 2,453,155 01-May-2021 1,984 1,984 1,984 15-May-2021 95,695 50,082 1,696 48,386 144,081 01-Nov-2021 1,984 1,984 1,984 15-Nov-2021 48,065 1,656 46,409 46,409 194,458 2,357,460 01-May-2022 2,231 2,231 2,231 15-May-2022 99,350 48,065 1,656 46,409 145,759 01-Nov-2022 2,231 2,231 2,231 15-Nov-2022 45,910 1,614 44,296 44,296 194,517 2,258,110 01-May-2023 2,480 2,480 2,480 15-May-2023 97,965 45,910 1,614 44,296 142,261 01-Nov-2023 2,480 2,480 2,480 15-Nov-2023 43,780 1,570 42,210 42,210 189,431 2,160,145 01-May-2024 2,480 2,480 2,480 15-May-2024 103,645 43,780 1,570 42,210 145,855 01-Nov-2024 2,480 2,480 2,480 15-Nov-2024 41,499 1,522 39,977 39,977 190,792 2,056,500 01-May-2025 2,480 2,480 2,480 15-May-2025 106,230 41,499 1,522 39,977 146,207 01-Nov-2025 2,480 2,480 2,480 15-Nov-2025 39,150 1,470 37,680 37,680 188,847 1,950,270 01-May-2026 2,480 2,480 2,480 15-May-2026 110,055 39,150 1,470 37,680 147,735 01-Nov-2026 2,480 2,480 2,480 15-Nov-2026 36,671 1,401 35,270 35,270 187,965 1,840,215 01-May-2027 2,480 2,480 2,480 15-May-2027 117,295 36,671 1,401 35,270 152,565 01-Nov-2027 2,480 2,480 2,480 15-Nov-2027 34,025 1,343 32,682 32,682 190,207 1,722,920 01-May-2028 2,480 2,480 2,480 15-May-2028 120,520 34,025 1,343 32,682 153,202 01-Nov-2028 2,480 2,480 2,480 15-Nov-2028 31,507 1,288 30,219 30,219 188,381 1,602,400 01-May-2029 2,480 2,480 2,480 15-May-2029 94,870 31,507 1,288 30,219 125,089 01-Nov-2029 2,480 2,480 2,480 15-Nov-2029 29,434 1,224 28,210 28,210 158,259 1,507,530 01-May-2030 6,715 2,480 2,480 9,195 15-May-2030 87,905 29,434 1,224 28,210 116,115 01-Nov-2030 2,396 2,396 2,396 15-Nov-2030 27,557 1,156 26,401 26,401 154,107 1,412,910 01-May-2031 11,885 2,396 2,396 14,281 15-May-2031 86,595 27,557 1,156 26,401 112,996 01-Nov-2031 2,247 2,247 2,247 15-Nov-2031 25,611 1,087 24,524 24,524 154,048 1,314,430
San Antonio Water System
TOTAL DEBT SERVICE TO MATURITY(amounts in thousands)
175
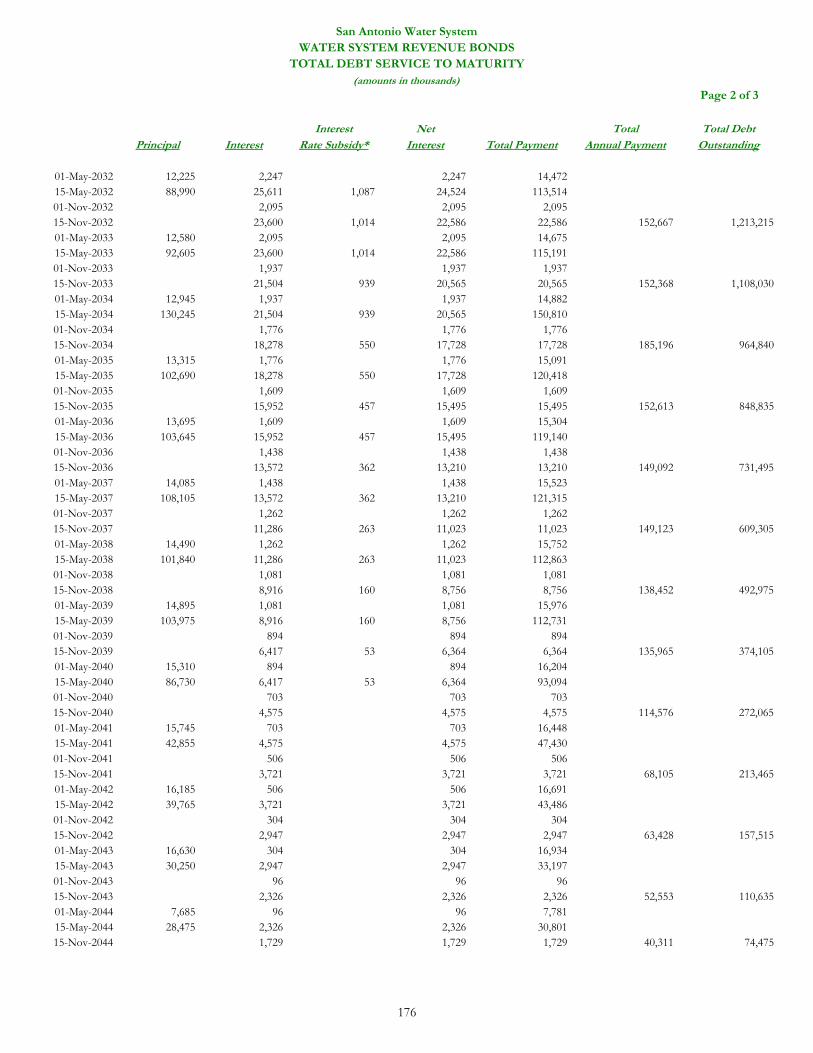
Page 2 of 3
Interest Net Total Total DebtPrincipal Interest Rate Subsidy* Interest Total Payment Annual Payment Outstanding
01-May-2032 12,225 2,247 2,247 14,472 15-May-2032 88,990 25,611 1,087 24,524 113,514 01-Nov-2032 2,095 2,095 2,095 15-Nov-2032 23,600 1,014 22,586 22,586 152,667 1,213,215 01-May-2033 12,580 2,095 2,095 14,675 15-May-2033 92,605 23,600 1,014 22,586 115,191 01-Nov-2033 1,937 1,937 1,937 15-Nov-2033 21,504 939 20,565 20,565 152,368 1,108,030 01-May-2034 12,945 1,937 1,937 14,882 15-May-2034 130,245 21,504 939 20,565 150,810 01-Nov-2034 1,776 1,776 1,776 15-Nov-2034 18,278 550 17,728 17,728 185,196 964,840 01-May-2035 13,315 1,776 1,776 15,091 15-May-2035 102,690 18,278 550 17,728 120,418 01-Nov-2035 1,609 1,609 1,609 15-Nov-2035 15,952 457 15,495 15,495 152,613 848,835 01-May-2036 13,695 1,609 1,609 15,304 15-May-2036 103,645 15,952 457 15,495 119,140 01-Nov-2036 1,438 1,438 1,438 15-Nov-2036 13,572 362 13,210 13,210 149,092 731,495 01-May-2037 14,085 1,438 1,438 15,523 15-May-2037 108,105 13,572 362 13,210 121,315 01-Nov-2037 1,262 1,262 1,262 15-Nov-2037 11,286 263 11,023 11,023 149,123 609,305 01-May-2038 14,490 1,262 1,262 15,752 15-May-2038 101,840 11,286 263 11,023 112,863 01-Nov-2038 1,081 1,081 1,081 15-Nov-2038 8,916 160 8,756 8,756 138,452 492,975 01-May-2039 14,895 1,081 1,081 15,976 15-May-2039 103,975 8,916 160 8,756 112,731 01-Nov-2039 894 894 894 15-Nov-2039 6,417 53 6,364 6,364 135,965 374,105 01-May-2040 15,310 894 894 16,204 15-May-2040 86,730 6,417 53 6,364 93,094 01-Nov-2040 703 703 703 15-Nov-2040 4,575 4,575 4,575 114,576 272,065 01-May-2041 15,745 703 703 16,448 15-May-2041 42,855 4,575 4,575 47,430 01-Nov-2041 506 506 506 15-Nov-2041 3,721 3,721 3,721 68,105 213,465 01-May-2042 16,185 506 506 16,691 15-May-2042 39,765 3,721 3,721 43,486 01-Nov-2042 304 304 304 15-Nov-2042 2,947 2,947 2,947 63,428 157,515 01-May-2043 16,630 304 304 16,934 15-May-2043 30,250 2,947 2,947 33,197 01-Nov-2043 96 96 96 15-Nov-2043 2,326 2,326 2,326 52,553 110,635 01-May-2044 7,685 96 96 7,781 15-May-2044 28,475 2,326 2,326 30,801 15-Nov-2044 1,729 1,729 1,729 40,311 74,475
San Antonio Water System
TOTAL DEBT SERVICE TO MATURITYWATER SYSTEM REVENUE BONDS
(amounts in thousands)
176
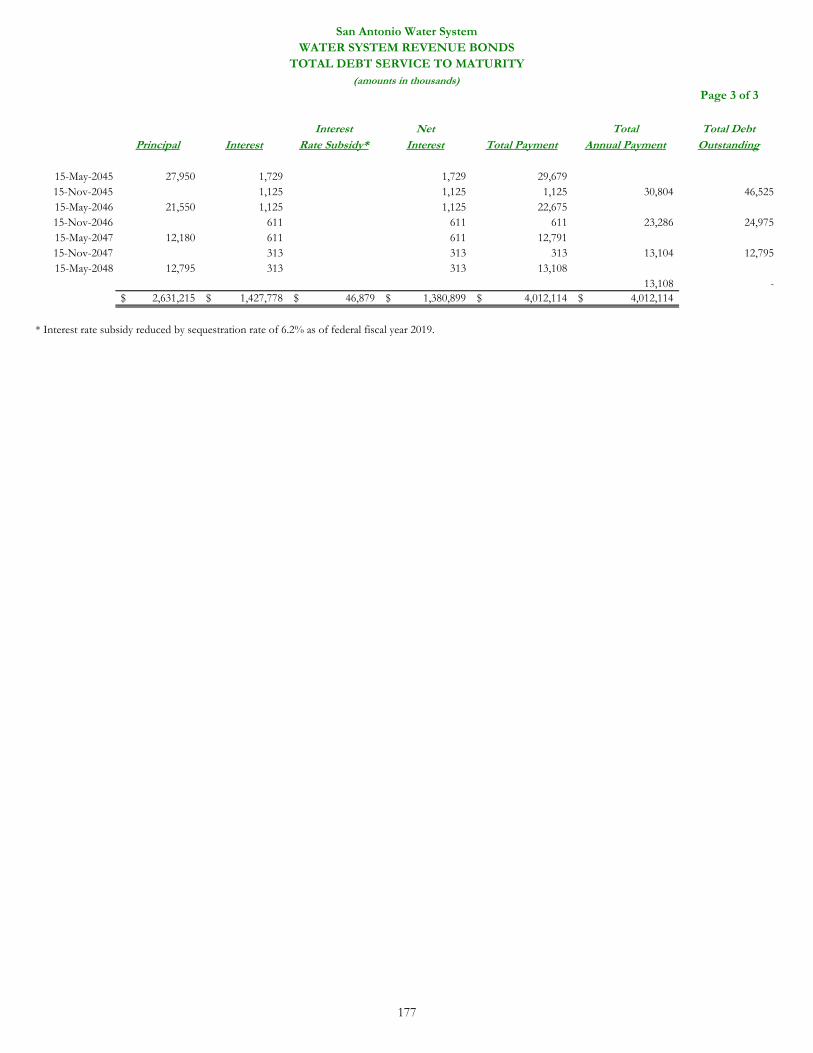
Page 3 of 3
Interest Net Total Total DebtPrincipal Interest Rate Subsidy* Interest Total Payment Annual Payment Outstanding
15-May-2045 27,950 1,729 1,729 29,679 15-Nov-2045 1,125 1,125 1,125 30,804 46,525 15-May-2046 21,550 1,125 1,125 22,675 15-Nov-2046 611 611 611 23,286 24,975 15-May-2047 12,180 611 611 12,791 15-Nov-2047 313 313 313 13,104 12,795 15-May-2048 12,795 313 313 13,108
13,108 - 2,631,215$ 1,427,778$ 46,879$ 1,380,899$ 4,012,114$ 4,012,114$
* Interest rate subsidy reduced by sequestration rate of 6.2% as of federal fiscal year 2019.
San Antonio Water SystemWATER SYSTEM REVENUE BONDS
TOTAL DEBT SERVICE TO MATURITY(amounts in thousands)
177
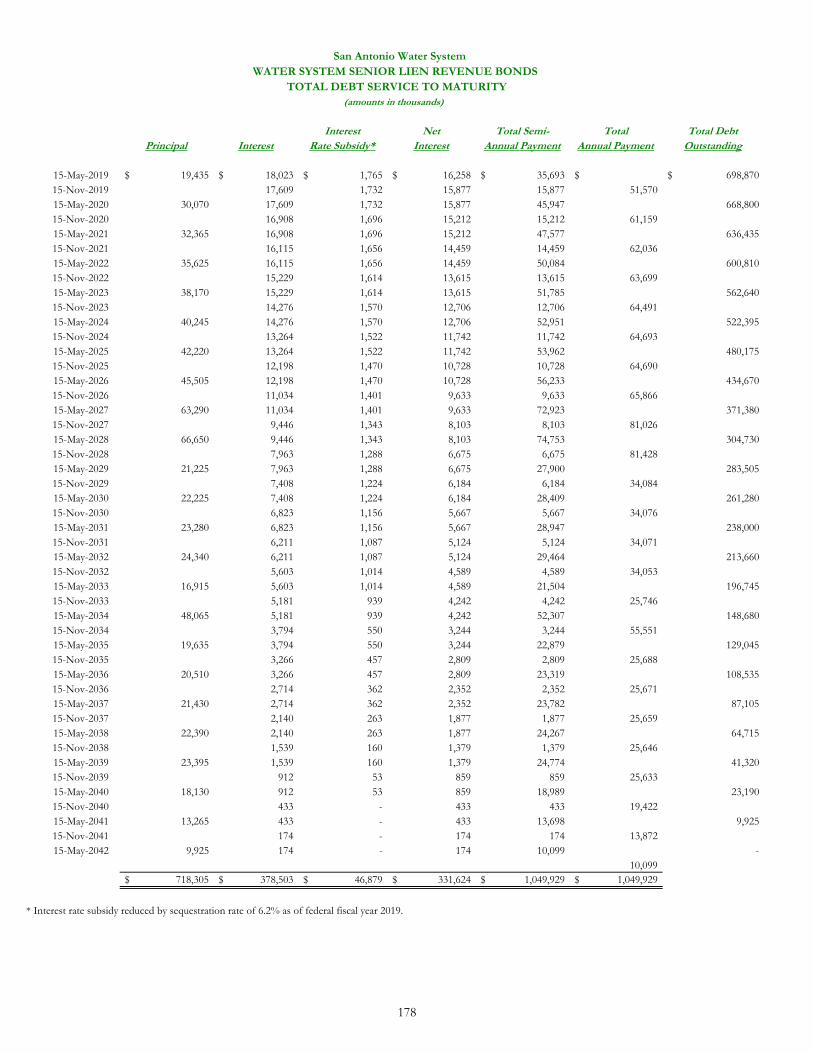
WATER SYSTEM SENIOR LIEN REVENUE BONDS TOTAL DEBT SERVICE TO MATURITY
Interest Net Total Semi- Total Total DebtPrincipal Interest Rate Subsidy* Interest Annual Payment Annual Payment Outstanding
15-May-2019 19,435$ 18,023$ 1,765$ 16,258$ 35,693$ $ 698,870$ 15-Nov-2019 17,609 1,732 15,877 15,877 51,570 15-May-2020 30,070 17,609 1,732 15,877 45,947 668,800 15-Nov-2020 16,908 1,696 15,212 15,212 61,159 15-May-2021 32,365 16,908 1,696 15,212 47,577 636,435 15-Nov-2021 16,115 1,656 14,459 14,459 62,036 15-May-2022 35,625 16,115 1,656 14,459 50,084 600,810 15-Nov-2022 15,229 1,614 13,615 13,615 63,699 15-May-2023 38,170 15,229 1,614 13,615 51,785 562,640 15-Nov-2023 14,276 1,570 12,706 12,706 64,491 15-May-2024 40,245 14,276 1,570 12,706 52,951 522,395 15-Nov-2024 13,264 1,522 11,742 11,742 64,693 15-May-2025 42,220 13,264 1,522 11,742 53,962 480,175 15-Nov-2025 12,198 1,470 10,728 10,728 64,690 15-May-2026 45,505 12,198 1,470 10,728 56,233 434,670 15-Nov-2026 11,034 1,401 9,633 9,633 65,866 15-May-2027 63,290 11,034 1,401 9,633 72,923 371,380 15-Nov-2027 9,446 1,343 8,103 8,103 81,026 15-May-2028 66,650 9,446 1,343 8,103 74,753 304,730 15-Nov-2028 7,963 1,288 6,675 6,675 81,428 15-May-2029 21,225 7,963 1,288 6,675 27,900 283,505 15-Nov-2029 7,408 1,224 6,184 6,184 34,084 15-May-2030 22,225 7,408 1,224 6,184 28,409 261,280 15-Nov-2030 6,823 1,156 5,667 5,667 34,076 15-May-2031 23,280 6,823 1,156 5,667 28,947 238,000 15-Nov-2031 6,211 1,087 5,124 5,124 34,071 15-May-2032 24,340 6,211 1,087 5,124 29,464 213,660 15-Nov-2032 5,603 1,014 4,589 4,589 34,053 15-May-2033 16,915 5,603 1,014 4,589 21,504 196,745 15-Nov-2033 5,181 939 4,242 4,242 25,746 15-May-2034 48,065 5,181 939 4,242 52,307 148,680 15-Nov-2034 3,794 550 3,244 3,244 55,551 15-May-2035 19,635 3,794 550 3,244 22,879 129,045 15-Nov-2035 3,266 457 2,809 2,809 25,688 15-May-2036 20,510 3,266 457 2,809 23,319 108,535 15-Nov-2036 2,714 362 2,352 2,352 25,671 15-May-2037 21,430 2,714 362 2,352 23,782 87,105 15-Nov-2037 2,140 263 1,877 1,877 25,659 15-May-2038 22,390 2,140 263 1,877 24,267 64,715 15-Nov-2038 1,539 160 1,379 1,379 25,646 15-May-2039 23,395 1,539 160 1,379 24,774 41,320 15-Nov-2039 912 53 859 859 25,633 15-May-2040 18,130 912 53 859 18,989 23,190 15-Nov-2040 433 - 433 433 19,422 15-May-2041 13,265 433 - 433 13,698 9,925 15-Nov-2041 174 - 174 174 13,872 15-May-2042 9,925 174 - 174 10,099 -
10,099 718,305$ 378,503$ 46,879$ 331,624$ 1,049,929$ 1,049,929$
San Antonio Water System
(amounts in thousands)
* Interest rate subsidy reduced by sequestration rate of 6.2% as of federal fiscal year 2019.
178
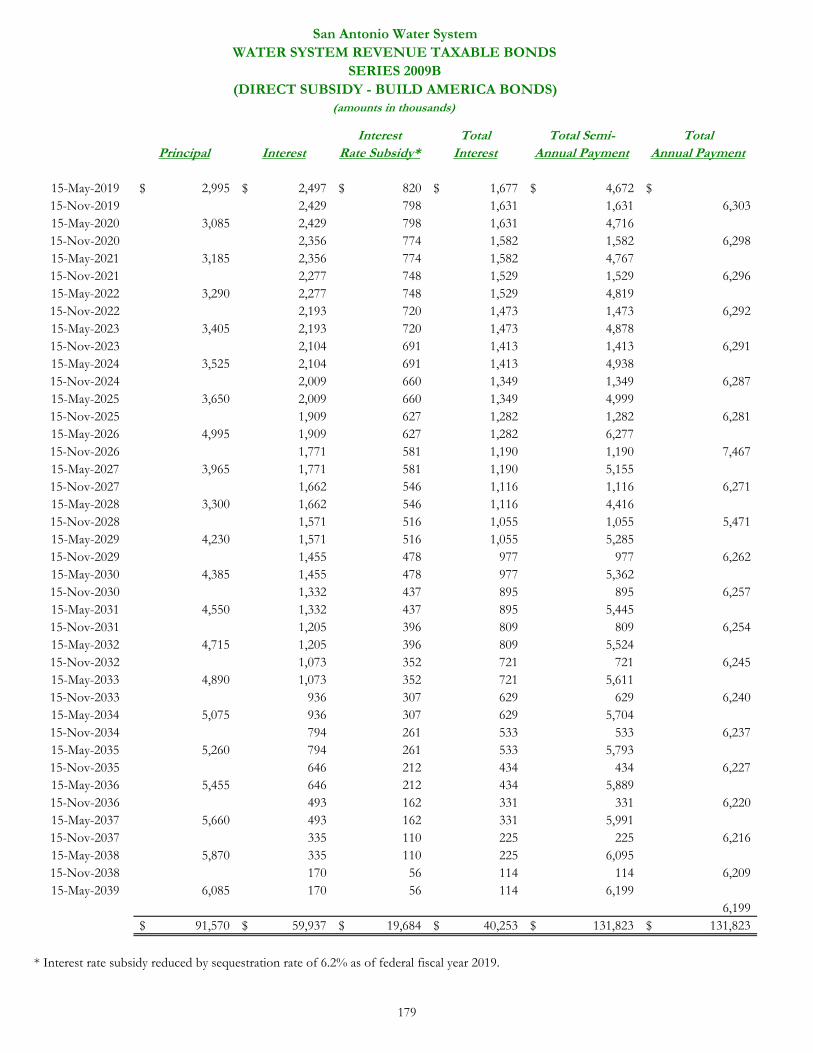
Interest Total Total Semi- TotalPrincipal Interest Rate Subsidy* Interest Annual Payment Annual Payment
15-May-2019 2,995$ 2,497$ 820$ 1,677$ 4,672$ $15-Nov-2019 2,429 798 1,631 1,631 6,303 15-May-2020 3,085 2,429 798 1,631 4,716 15-Nov-2020 2,356 774 1,582 1,582 6,298 15-May-2021 3,185 2,356 774 1,582 4,767 15-Nov-2021 2,277 748 1,529 1,529 6,296 15-May-2022 3,290 2,277 748 1,529 4,819 15-Nov-2022 2,193 720 1,473 1,473 6,292 15-May-2023 3,405 2,193 720 1,473 4,878 15-Nov-2023 2,104 691 1,413 1,413 6,291 15-May-2024 3,525 2,104 691 1,413 4,938 15-Nov-2024 2,009 660 1,349 1,349 6,287 15-May-2025 3,650 2,009 660 1,349 4,999 15-Nov-2025 1,909 627 1,282 1,282 6,281 15-May-2026 4,995 1,909 627 1,282 6,277 15-Nov-2026 1,771 581 1,190 1,190 7,467 15-May-2027 3,965 1,771 581 1,190 5,155 15-Nov-2027 1,662 546 1,116 1,116 6,271 15-May-2028 3,300 1,662 546 1,116 4,416 15-Nov-2028 1,571 516 1,055 1,055 5,471 15-May-2029 4,230 1,571 516 1,055 5,285 15-Nov-2029 1,455 478 977 977 6,262 15-May-2030 4,385 1,455 478 977 5,362 15-Nov-2030 1,332 437 895 895 6,257 15-May-2031 4,550 1,332 437 895 5,445 15-Nov-2031 1,205 396 809 809 6,254 15-May-2032 4,715 1,205 396 809 5,524 15-Nov-2032 1,073 352 721 721 6,245 15-May-2033 4,890 1,073 352 721 5,611 15-Nov-2033 936 307 629 629 6,240 15-May-2034 5,075 936 307 629 5,704 15-Nov-2034 794 261 533 533 6,237 15-May-2035 5,260 794 261 533 5,793 15-Nov-2035 646 212 434 434 6,227 15-May-2036 5,455 646 212 434 5,889 15-Nov-2036 493 162 331 331 6,220 15-May-2037 5,660 493 162 331 5,991 15-Nov-2037 335 110 225 225 6,216 15-May-2038 5,870 335 110 225 6,095 15-Nov-2038 170 56 114 114 6,209 15-May-2039 6,085 170 56 114 6,199
6,199 91,570$ 59,937$ 19,684$ 40,253$ 131,823$ 131,823$
* Interest rate subsidy reduced by sequestration rate of 6.2% as of federal fiscal year 2019.
San Antonio Water SystemWATER SYSTEM REVENUE TAXABLE BONDS
SERIES 2009B
(amounts in thousands)
(DIRECT SUBSIDY - BUILD AMERICA BONDS)
179
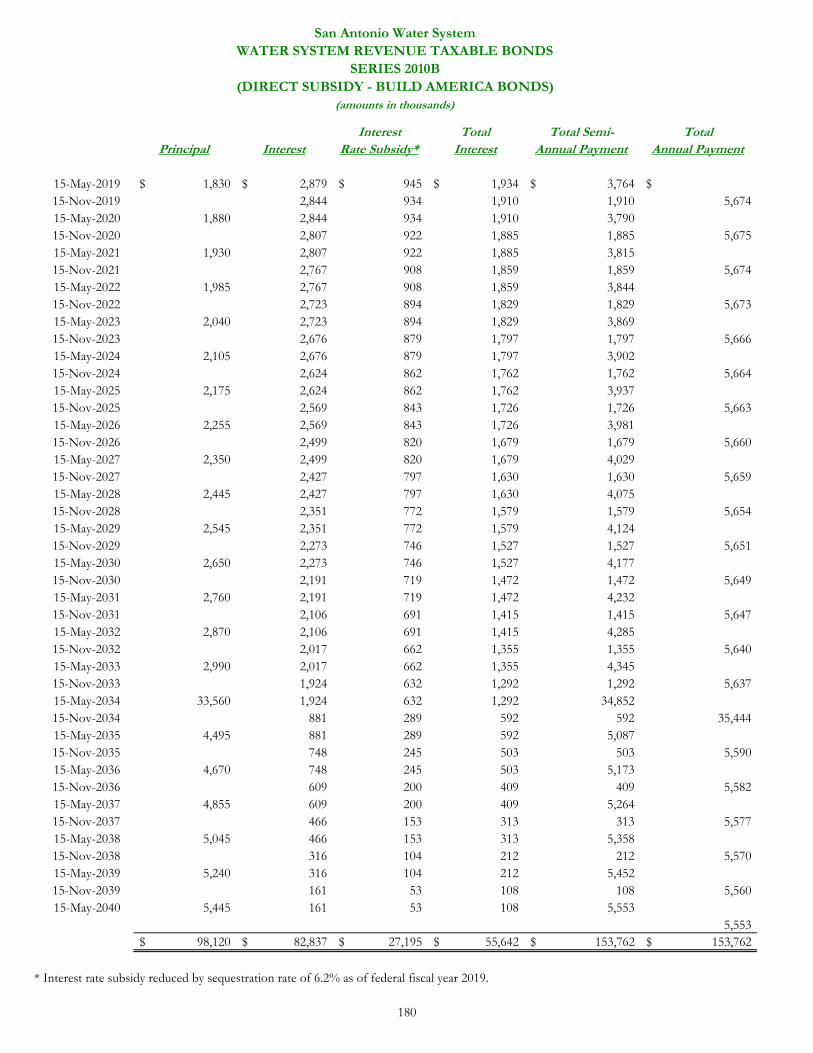
Interest Total Total Semi- TotalPrincipal Interest Rate Subsidy* Interest Annual Payment Annual Payment
15-May-2019 1,830$ 2,879$ 945$ 1,934$ 3,764$ $15-Nov-2019 2,844 934 1,910 1,910 5,674 15-May-2020 1,880 2,844 934 1,910 3,790 15-Nov-2020 2,807 922 1,885 1,885 5,675 15-May-2021 1,930 2,807 922 1,885 3,815 15-Nov-2021 2,767 908 1,859 1,859 5,674 15-May-2022 1,985 2,767 908 1,859 3,844 15-Nov-2022 2,723 894 1,829 1,829 5,673 15-May-2023 2,040 2,723 894 1,829 3,869 15-Nov-2023 2,676 879 1,797 1,797 5,666 15-May-2024 2,105 2,676 879 1,797 3,902 15-Nov-2024 2,624 862 1,762 1,762 5,664 15-May-2025 2,175 2,624 862 1,762 3,937 15-Nov-2025 2,569 843 1,726 1,726 5,663 15-May-2026 2,255 2,569 843 1,726 3,981 15-Nov-2026 2,499 820 1,679 1,679 5,660 15-May-2027 2,350 2,499 820 1,679 4,029 15-Nov-2027 2,427 797 1,630 1,630 5,659 15-May-2028 2,445 2,427 797 1,630 4,075 15-Nov-2028 2,351 772 1,579 1,579 5,654 15-May-2029 2,545 2,351 772 1,579 4,124 15-Nov-2029 2,273 746 1,527 1,527 5,651 15-May-2030 2,650 2,273 746 1,527 4,177 15-Nov-2030 2,191 719 1,472 1,472 5,649 15-May-2031 2,760 2,191 719 1,472 4,232 15-Nov-2031 2,106 691 1,415 1,415 5,647 15-May-2032 2,870 2,106 691 1,415 4,285 15-Nov-2032 2,017 662 1,355 1,355 5,640 15-May-2033 2,990 2,017 662 1,355 4,345 15-Nov-2033 1,924 632 1,292 1,292 5,637 15-May-2034 33,560 1,924 632 1,292 34,852 15-Nov-2034 881 289 592 592 35,444 15-May-2035 4,495 881 289 592 5,087 15-Nov-2035 748 245 503 503 5,590 15-May-2036 4,670 748 245 503 5,173 15-Nov-2036 609 200 409 409 5,582 15-May-2037 4,855 609 200 409 5,264 15-Nov-2037 466 153 313 313 5,577 15-May-2038 5,045 466 153 313 5,358 15-Nov-2038 316 104 212 212 5,570 15-May-2039 5,240 316 104 212 5,452 15-Nov-2039 161 53 108 108 5,560 15-May-2040 5,445 161 53 108 5,553
5,553 98,120$ 82,837$ 27,195$ 55,642$ 153,762$ 153,762$
* Interest rate subsidy reduced by sequestration rate of 6.2% as of federal fiscal year 2019.
San Antonio Water SystemWATER SYSTEM REVENUE TAXABLE BONDS
SERIES 2010B(DIRECT SUBSIDY - BUILD AMERICA BONDS)
(amounts in thousands)
180
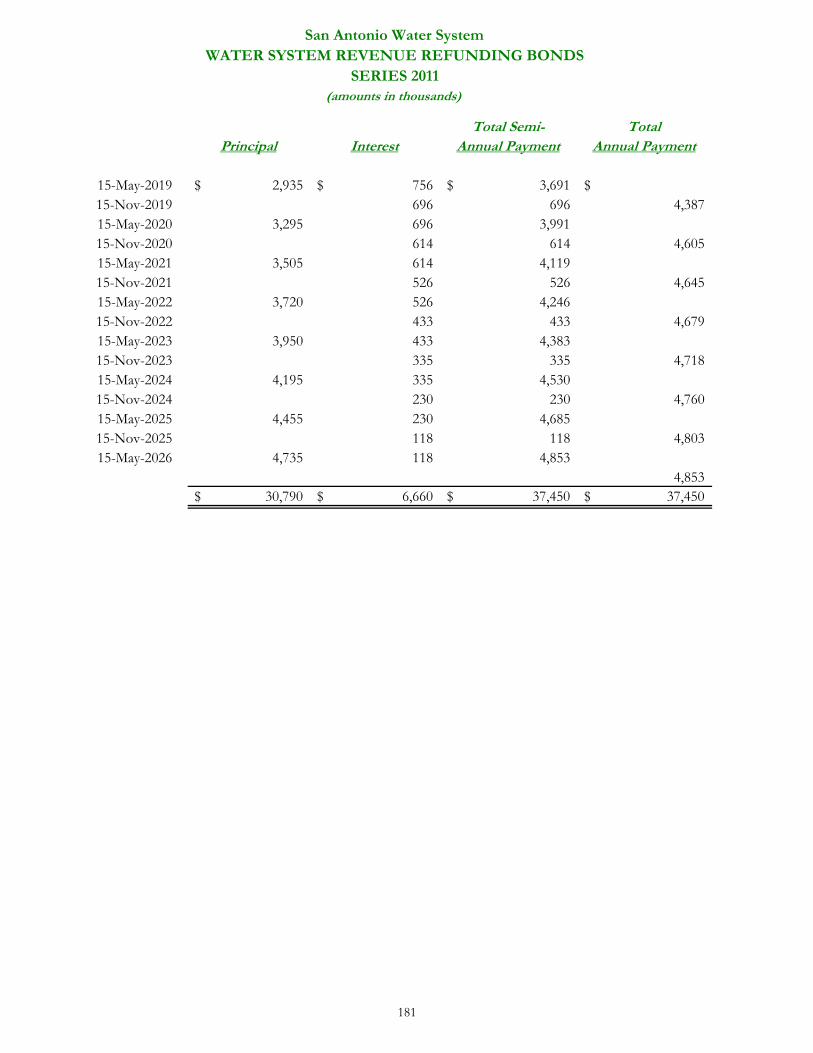
Total Semi- TotalPrincipal Interest Annual Payment Annual Payment
15-May-2019 2,935$ 756$ 3,691$ $15-Nov-2019 696 696 4,387 15-May-2020 3,295 696 3,991 15-Nov-2020 614 614 4,605 15-May-2021 3,505 614 4,119 15-Nov-2021 526 526 4,645 15-May-2022 3,720 526 4,246 15-Nov-2022 433 433 4,679 15-May-2023 3,950 433 4,383 15-Nov-2023 335 335 4,718 15-May-2024 4,195 335 4,530 15-Nov-2024 230 230 4,760 15-May-2025 4,455 230 4,685 15-Nov-2025 118 118 4,803 15-May-2026 4,735 118 4,853
4,853 30,790$ 6,660$ 37,450$ 37,450$
San Antonio Water SystemWATER SYSTEM REVENUE REFUNDING BONDS
SERIES 2011(amounts in thousands)
181
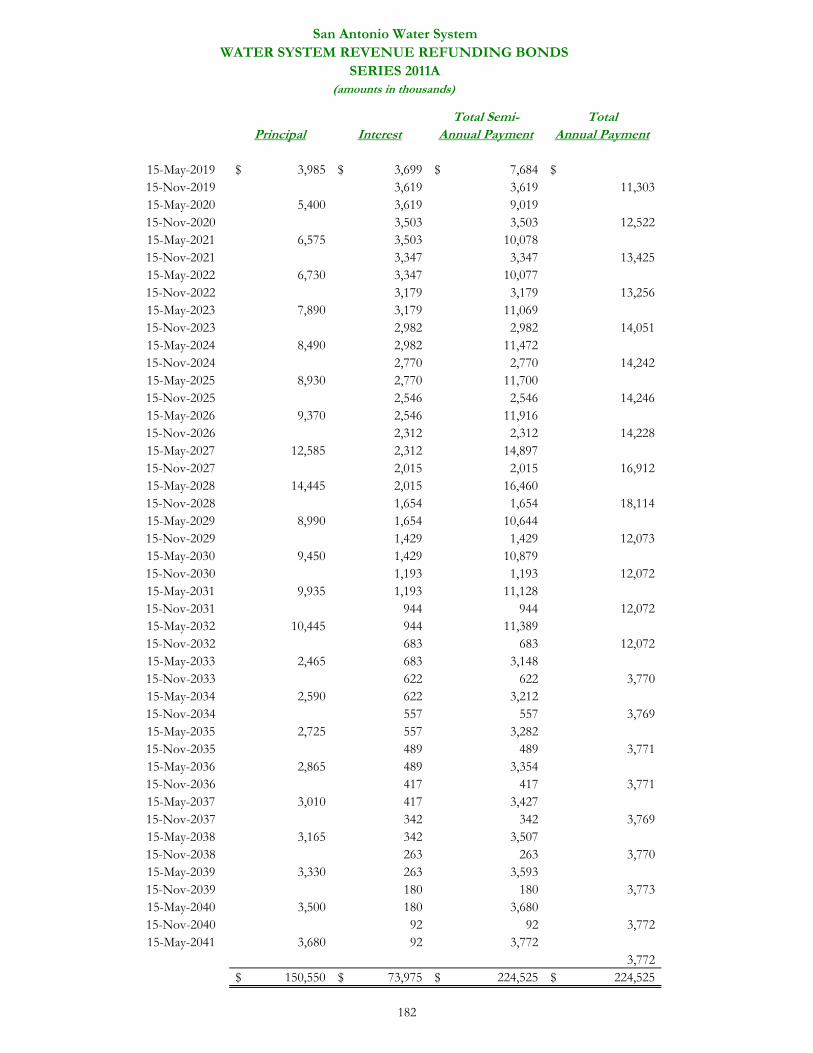
Total Semi- TotalPrincipal Interest Annual Payment Annual Payment
15-May-2019 3,985$ 3,699$ 7,684$ $15-Nov-2019 3,619 3,619 11,303 15-May-2020 5,400 3,619 9,019 15-Nov-2020 3,503 3,503 12,522 15-May-2021 6,575 3,503 10,078 15-Nov-2021 3,347 3,347 13,425 15-May-2022 6,730 3,347 10,077 15-Nov-2022 3,179 3,179 13,256 15-May-2023 7,890 3,179 11,069 15-Nov-2023 2,982 2,982 14,051 15-May-2024 8,490 2,982 11,472 15-Nov-2024 2,770 2,770 14,242 15-May-2025 8,930 2,770 11,700 15-Nov-2025 2,546 2,546 14,246 15-May-2026 9,370 2,546 11,916 15-Nov-2026 2,312 2,312 14,228 15-May-2027 12,585 2,312 14,897 15-Nov-2027 2,015 2,015 16,912 15-May-2028 14,445 2,015 16,460 15-Nov-2028 1,654 1,654 18,114 15-May-2029 8,990 1,654 10,644 15-Nov-2029 1,429 1,429 12,073 15-May-2030 9,450 1,429 10,879 15-Nov-2030 1,193 1,193 12,072 15-May-2031 9,935 1,193 11,128 15-Nov-2031 944 944 12,072 15-May-2032 10,445 944 11,389 15-Nov-2032 683 683 12,072 15-May-2033 2,465 683 3,148 15-Nov-2033 622 622 3,770 15-May-2034 2,590 622 3,212 15-Nov-2034 557 557 3,769 15-May-2035 2,725 557 3,282 15-Nov-2035 489 489 3,771 15-May-2036 2,865 489 3,354 15-Nov-2036 417 417 3,771 15-May-2037 3,010 417 3,427 15-Nov-2037 342 342 3,769 15-May-2038 3,165 342 3,507 15-Nov-2038 263 263 3,770 15-May-2039 3,330 263 3,593 15-Nov-2039 180 180 3,773 15-May-2040 3,500 180 3,680 15-Nov-2040 92 92 3,772 15-May-2041 3,680 92 3,772
3,772 150,550$ 73,975$ 224,525$ 224,525$
San Antonio Water SystemWATER SYSTEM REVENUE REFUNDING BONDS
SERIES 2011A(amounts in thousands)
182
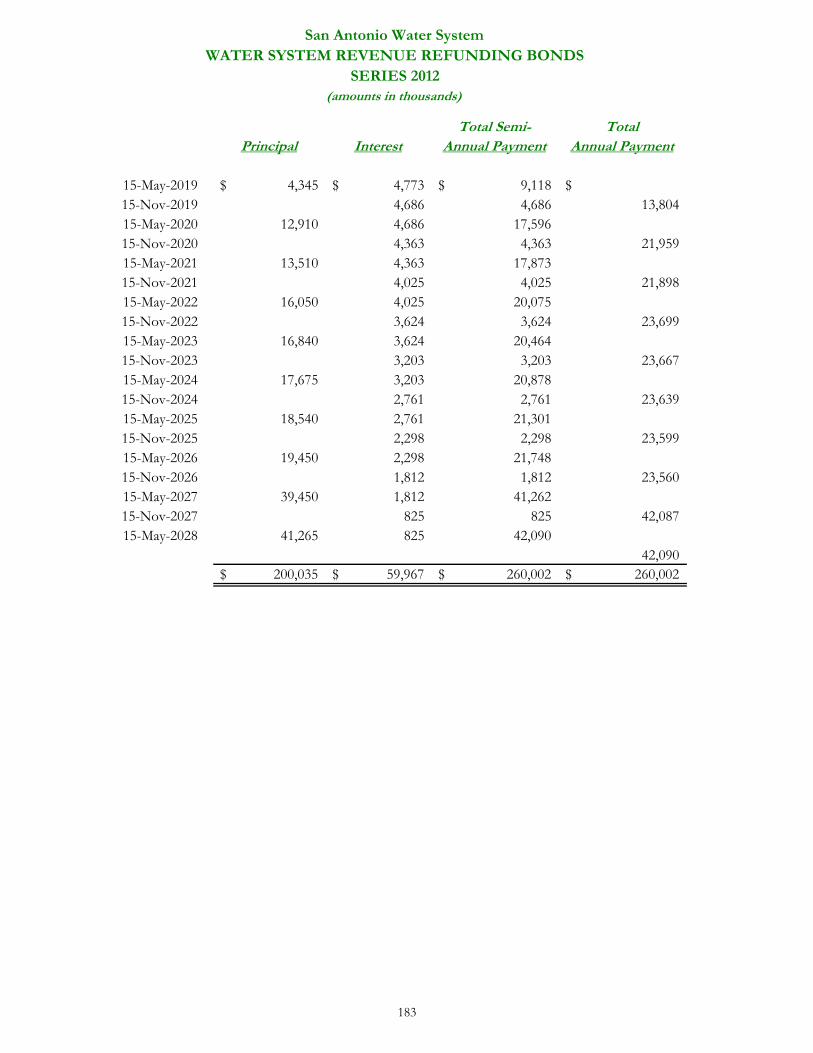
Total Semi- TotalPrincipal Interest Annual Payment Annual Payment
15-May-2019 4,345$ 4,773$ 9,118$ $15-Nov-2019 4,686 4,686 13,804 15-May-2020 12,910 4,686 17,596 15-Nov-2020 4,363 4,363 21,959 15-May-2021 13,510 4,363 17,873 15-Nov-2021 4,025 4,025 21,898 15-May-2022 16,050 4,025 20,075 15-Nov-2022 3,624 3,624 23,699 15-May-2023 16,840 3,624 20,464 15-Nov-2023 3,203 3,203 23,667 15-May-2024 17,675 3,203 20,878 15-Nov-2024 2,761 2,761 23,639 15-May-2025 18,540 2,761 21,301 15-Nov-2025 2,298 2,298 23,599 15-May-2026 19,450 2,298 21,748 15-Nov-2026 1,812 1,812 23,560 15-May-2027 39,450 1,812 41,262 15-Nov-2027 825 825 42,087 15-May-2028 41,265 825 42,090
42,090 200,035$ 59,967$ 260,002$ 260,002$
San Antonio Water SystemWATER SYSTEM REVENUE REFUNDING BONDS
SERIES 2012(amounts in thousands)
183
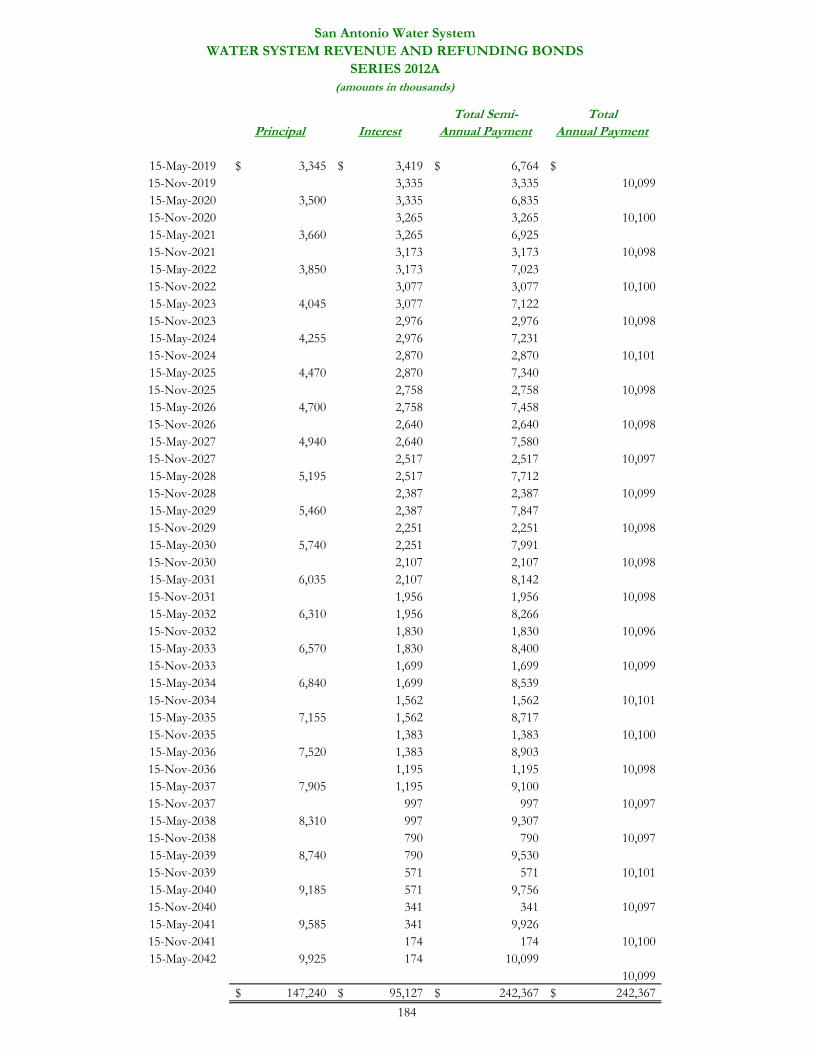
Total Semi- TotalPrincipal Interest Annual Payment Annual Payment
15-May-2019 3,345$ 3,419$ 6,764$ $15-Nov-2019 3,335 3,335 10,099 15-May-2020 3,500 3,335 6,835 15-Nov-2020 3,265 3,265 10,100 15-May-2021 3,660 3,265 6,925 15-Nov-2021 3,173 3,173 10,098 15-May-2022 3,850 3,173 7,023 15-Nov-2022 3,077 3,077 10,100 15-May-2023 4,045 3,077 7,122 15-Nov-2023 2,976 2,976 10,098 15-May-2024 4,255 2,976 7,231 15-Nov-2024 2,870 2,870 10,101 15-May-2025 4,470 2,870 7,340 15-Nov-2025 2,758 2,758 10,098 15-May-2026 4,700 2,758 7,458 15-Nov-2026 2,640 2,640 10,098 15-May-2027 4,940 2,640 7,580 15-Nov-2027 2,517 2,517 10,097 15-May-2028 5,195 2,517 7,712 15-Nov-2028 2,387 2,387 10,099 15-May-2029 5,460 2,387 7,847 15-Nov-2029 2,251 2,251 10,098 15-May-2030 5,740 2,251 7,991 15-Nov-2030 2,107 2,107 10,098 15-May-2031 6,035 2,107 8,142 15-Nov-2031 1,956 1,956 10,098 15-May-2032 6,310 1,956 8,266 15-Nov-2032 1,830 1,830 10,096 15-May-2033 6,570 1,830 8,400 15-Nov-2033 1,699 1,699 10,099 15-May-2034 6,840 1,699 8,539 15-Nov-2034 1,562 1,562 10,101 15-May-2035 7,155 1,562 8,717 15-Nov-2035 1,383 1,383 10,100 15-May-2036 7,520 1,383 8,903 15-Nov-2036 1,195 1,195 10,098 15-May-2037 7,905 1,195 9,100 15-Nov-2037 997 997 10,097 15-May-2038 8,310 997 9,307 15-Nov-2038 790 790 10,097 15-May-2039 8,740 790 9,530 15-Nov-2039 571 571 10,101 15-May-2040 9,185 571 9,756 15-Nov-2040 341 341 10,097 15-May-2041 9,585 341 9,926 15-Nov-2041 174 174 10,100 15-May-2042 9,925 174 10,099
10,099 147,240$ 95,127$ 242,367$ 242,367$
San Antonio Water SystemWATER SYSTEM REVENUE AND REFUNDING BONDS
SERIES 2012A(amounts in thousands)
184
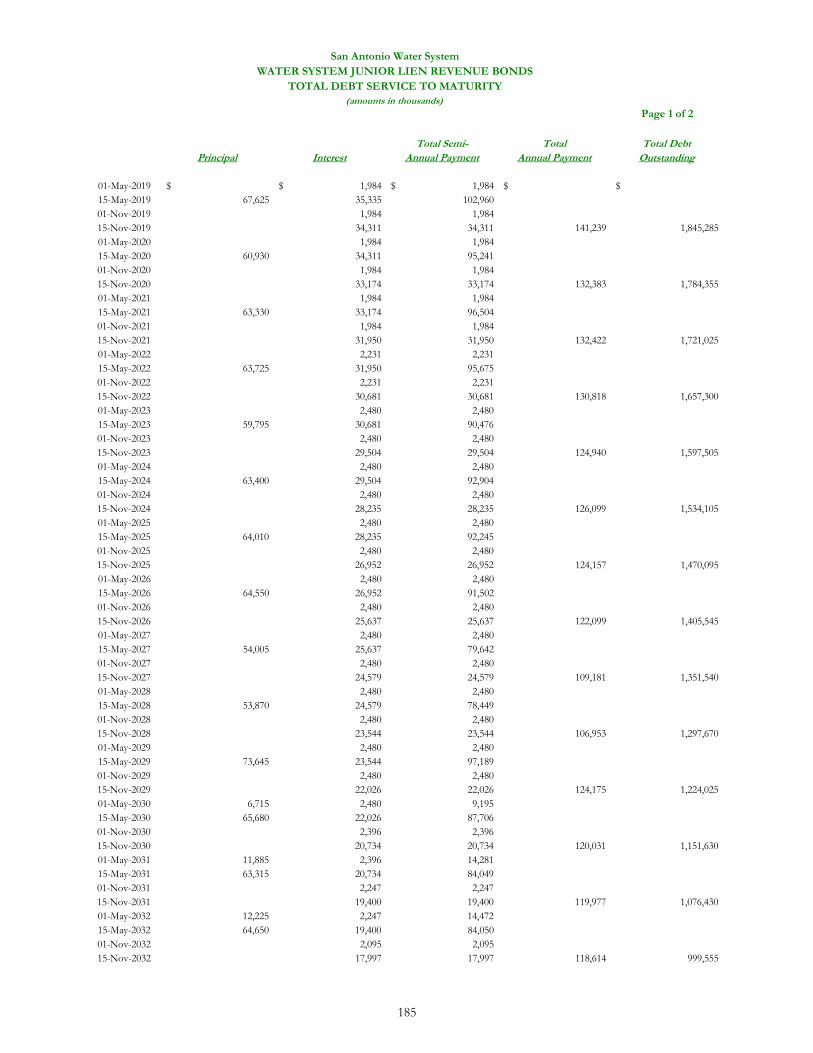
San Antonio Water SystemWATER SYSTEM JUNIOR LIEN REVENUE BONDS
TOTAL DEBT SERVICE TO MATURITY
Page 1 of 2
Total Semi- Total Total DebtPrincipal Interest Annual Payment Annual Payment Outstanding
01-May-2019 $ 1,984$ 1,984$ $ $15-May-2019 67,625 35,335 102,960 01-Nov-2019 1,984 1,984 15-Nov-2019 34,311 34,311 141,239 1,845,285 01-May-2020 1,984 1,984 15-May-2020 60,930 34,311 95,241 01-Nov-2020 1,984 1,984 15-Nov-2020 33,174 33,174 132,383 1,784,355 01-May-2021 1,984 1,984 15-May-2021 63,330 33,174 96,504 01-Nov-2021 1,984 1,984 15-Nov-2021 31,950 31,950 132,422 1,721,025 01-May-2022 2,231 2,231 15-May-2022 63,725 31,950 95,675 01-Nov-2022 2,231 2,231 15-Nov-2022 30,681 30,681 130,818 1,657,300 01-May-2023 2,480 2,480 15-May-2023 59,795 30,681 90,476 01-Nov-2023 2,480 2,480 15-Nov-2023 29,504 29,504 124,940 1,597,505 01-May-2024 2,480 2,480 15-May-2024 63,400 29,504 92,904 01-Nov-2024 2,480 2,480 15-Nov-2024 28,235 28,235 126,099 1,534,105 01-May-2025 2,480 2,480 15-May-2025 64,010 28,235 92,245 01-Nov-2025 2,480 2,480 15-Nov-2025 26,952 26,952 124,157 1,470,095 01-May-2026 2,480 2,480 15-May-2026 64,550 26,952 91,502 01-Nov-2026 2,480 2,480 15-Nov-2026 25,637 25,637 122,099 1,405,545 01-May-2027 2,480 2,480 15-May-2027 54,005 25,637 79,642 01-Nov-2027 2,480 2,480 15-Nov-2027 24,579 24,579 109,181 1,351,540 01-May-2028 2,480 2,480 15-May-2028 53,870 24,579 78,449 01-Nov-2028 2,480 2,480 15-Nov-2028 23,544 23,544 106,953 1,297,670 01-May-2029 2,480 2,480 15-May-2029 73,645 23,544 97,189 01-Nov-2029 2,480 2,480 15-Nov-2029 22,026 22,026 124,175 1,224,025 01-May-2030 6,715 2,480 9,195 15-May-2030 65,680 22,026 87,706 01-Nov-2030 2,396 2,396 15-Nov-2030 20,734 20,734 120,031 1,151,630 01-May-2031 11,885 2,396 14,281 15-May-2031 63,315 20,734 84,049 01-Nov-2031 2,247 2,247 15-Nov-2031 19,400 19,400 119,977 1,076,430 01-May-2032 12,225 2,247 14,472 15-May-2032 64,650 19,400 84,050 01-Nov-2032 2,095 2,095 15-Nov-2032 17,997 17,997 118,614 999,555
(amounts in thousands)
185
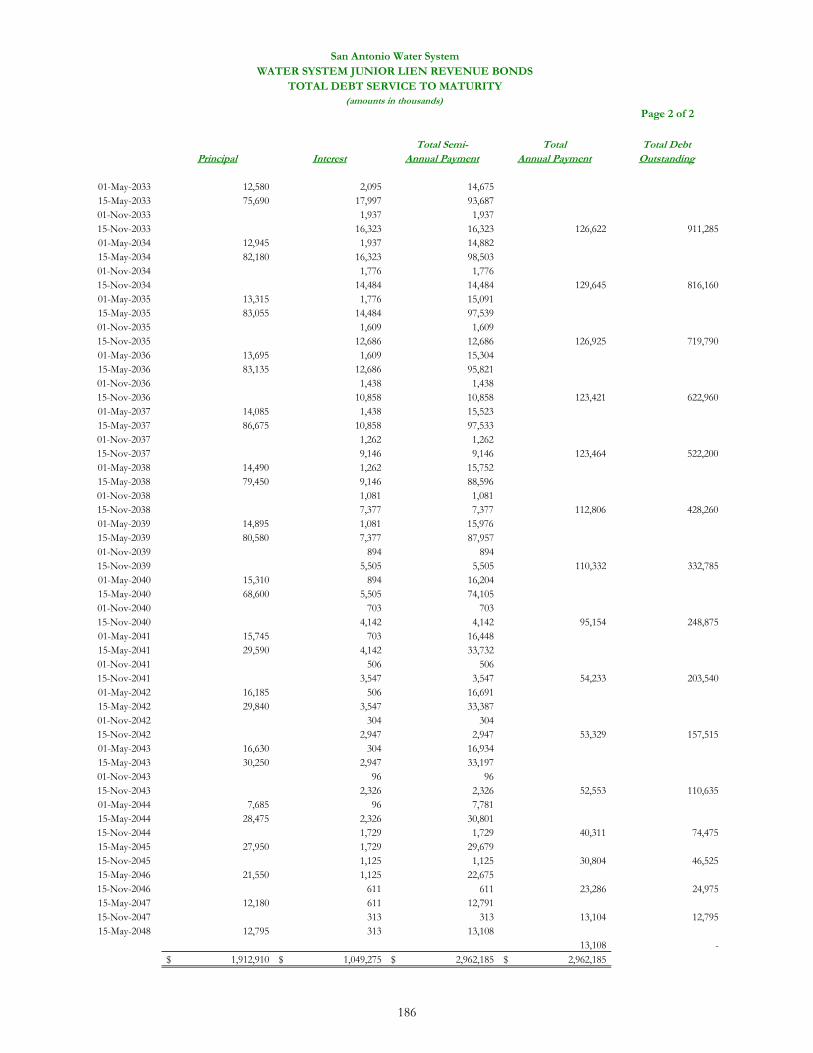
San Antonio Water SystemWATER SYSTEM JUNIOR LIEN REVENUE BONDS
TOTAL DEBT SERVICE TO MATURITY
Page 2 of 2
Total Semi- Total Total DebtPrincipal Interest Annual Payment Annual Payment Outstanding
01-May-2033 12,580 2,095 14,675 15-May-2033 75,690 17,997 93,687 01-Nov-2033 1,937 1,937 15-Nov-2033 16,323 16,323 126,622 911,285 01-May-2034 12,945 1,937 14,882 15-May-2034 82,180 16,323 98,503 01-Nov-2034 1,776 1,776 15-Nov-2034 14,484 14,484 129,645 816,160 01-May-2035 13,315 1,776 15,091 15-May-2035 83,055 14,484 97,539 01-Nov-2035 1,609 1,609 15-Nov-2035 12,686 12,686 126,925 719,790 01-May-2036 13,695 1,609 15,304 15-May-2036 83,135 12,686 95,821 01-Nov-2036 1,438 1,438 15-Nov-2036 10,858 10,858 123,421 622,960 01-May-2037 14,085 1,438 15,523 15-May-2037 86,675 10,858 97,533 01-Nov-2037 1,262 1,262 15-Nov-2037 9,146 9,146 123,464 522,200 01-May-2038 14,490 1,262 15,752 15-May-2038 79,450 9,146 88,596 01-Nov-2038 1,081 1,081 15-Nov-2038 7,377 7,377 112,806 428,260 01-May-2039 14,895 1,081 15,976 15-May-2039 80,580 7,377 87,957 01-Nov-2039 894 894 15-Nov-2039 5,505 5,505 110,332 332,785 01-May-2040 15,310 894 16,204 15-May-2040 68,600 5,505 74,105 01-Nov-2040 703 703 15-Nov-2040 4,142 4,142 95,154 248,875 01-May-2041 15,745 703 16,448 15-May-2041 29,590 4,142 33,732 01-Nov-2041 506 506 15-Nov-2041 3,547 3,547 54,233 203,540 01-May-2042 16,185 506 16,691 15-May-2042 29,840 3,547 33,387 01-Nov-2042 304 304 15-Nov-2042 2,947 2,947 53,329 157,515 01-May-2043 16,630 304 16,934 15-May-2043 30,250 2,947 33,197 01-Nov-2043 96 96 15-Nov-2043 2,326 2,326 52,553 110,635 01-May-2044 7,685 96 7,781 15-May-2044 28,475 2,326 30,801 15-Nov-2044 1,729 1,729 40,311 74,475 15-May-2045 27,950 1,729 29,679 15-Nov-2045 1,125 1,125 30,804 46,525 15-May-2046 21,550 1,125 22,675 15-Nov-2046 611 611 23,286 24,975 15-May-2047 12,180 611 12,791 15-Nov-2047 313 313 13,104 12,795 15-May-2048 12,795 313 13,108
13,108 - 1,912,910$ 1,049,275$ 2,962,185$ 2,962,185$
(amounts in thousands)
186
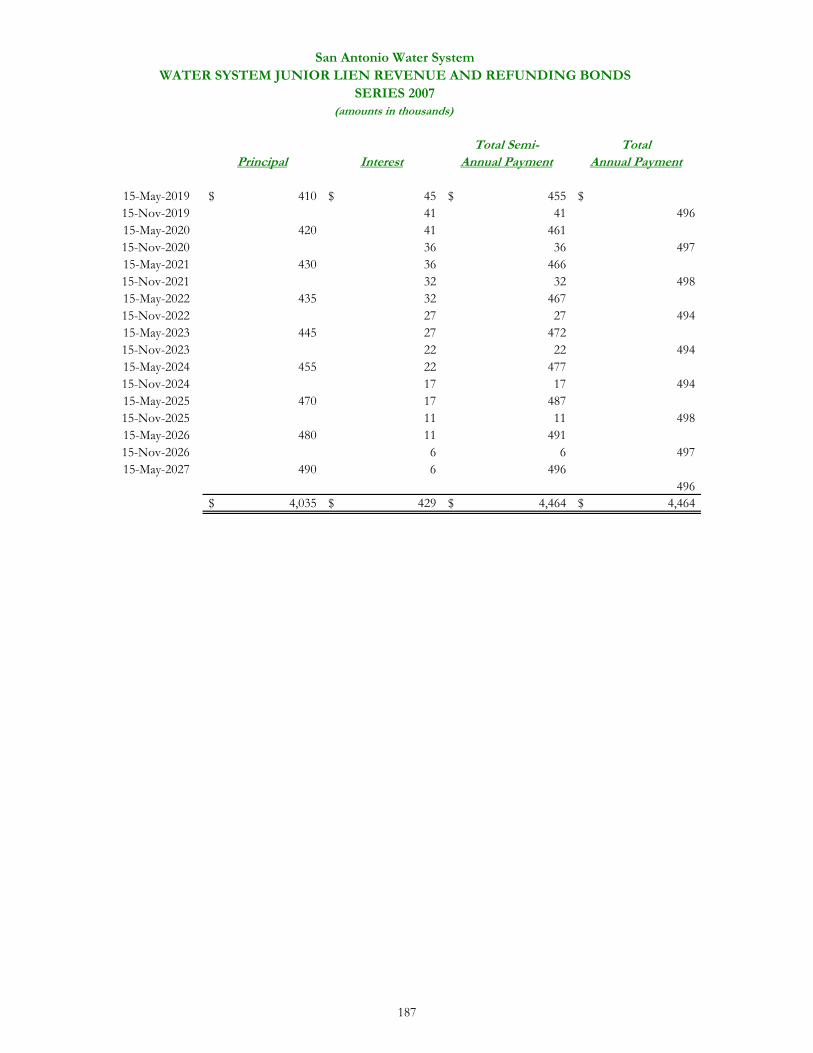
Total Semi- TotalPrincipal Interest Annual Payment Annual Payment
15-May-2019 410$ 45$ 455$ $15-Nov-2019 41 41 496 15-May-2020 420 41 461 15-Nov-2020 36 36 497 15-May-2021 430 36 466 15-Nov-2021 32 32 498 15-May-2022 435 32 467 15-Nov-2022 27 27 494 15-May-2023 445 27 472 15-Nov-2023 22 22 494 15-May-2024 455 22 477 15-Nov-2024 17 17 494 15-May-2025 470 17 487 15-Nov-2025 11 11 498 15-May-2026 480 11 491 15-Nov-2026 6 6 497 15-May-2027 490 6 496
496 4,035$ 429$ 4,464$ 4,464$
San Antonio Water SystemWATER SYSTEM JUNIOR LIEN REVENUE AND REFUNDING BONDS
SERIES 2007(amounts in thousands)
187
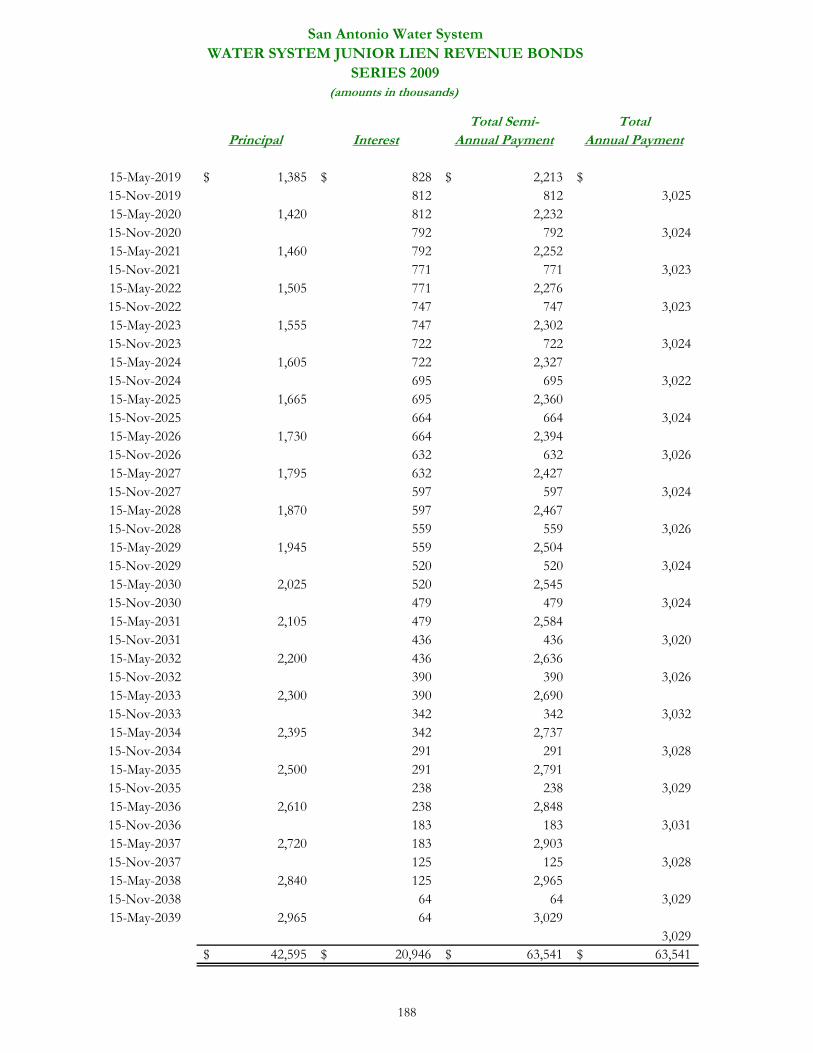
Total Semi- TotalPrincipal Interest Annual Payment Annual Payment
15-May-2019 1,385$ 828$ 2,213$ $15-Nov-2019 812 812 3,025 15-May-2020 1,420 812 2,232 15-Nov-2020 792 792 3,024 15-May-2021 1,460 792 2,252 15-Nov-2021 771 771 3,023 15-May-2022 1,505 771 2,276 15-Nov-2022 747 747 3,023 15-May-2023 1,555 747 2,302 15-Nov-2023 722 722 3,024 15-May-2024 1,605 722 2,327 15-Nov-2024 695 695 3,022 15-May-2025 1,665 695 2,360 15-Nov-2025 664 664 3,024 15-May-2026 1,730 664 2,394 15-Nov-2026 632 632 3,026 15-May-2027 1,795 632 2,427 15-Nov-2027 597 597 3,024 15-May-2028 1,870 597 2,467 15-Nov-2028 559 559 3,026 15-May-2029 1,945 559 2,504 15-Nov-2029 520 520 3,024 15-May-2030 2,025 520 2,545 15-Nov-2030 479 479 3,024 15-May-2031 2,105 479 2,584 15-Nov-2031 436 436 3,020 15-May-2032 2,200 436 2,636 15-Nov-2032 390 390 3,026 15-May-2033 2,300 390 2,690 15-Nov-2033 342 342 3,032 15-May-2034 2,395 342 2,737 15-Nov-2034 291 291 3,028 15-May-2035 2,500 291 2,791 15-Nov-2035 238 238 3,029 15-May-2036 2,610 238 2,848 15-Nov-2036 183 183 3,031 15-May-2037 2,720 183 2,903 15-Nov-2037 125 125 3,028 15-May-2038 2,840 125 2,965 15-Nov-2038 64 64 3,029 15-May-2039 2,965 64 3,029
3,029 42,595$ 20,946$ 63,541$ 63,541$
San Antonio Water SystemWATER SYSTEM JUNIOR LIEN REVENUE BONDS
SERIES 2009(amounts in thousands)
188
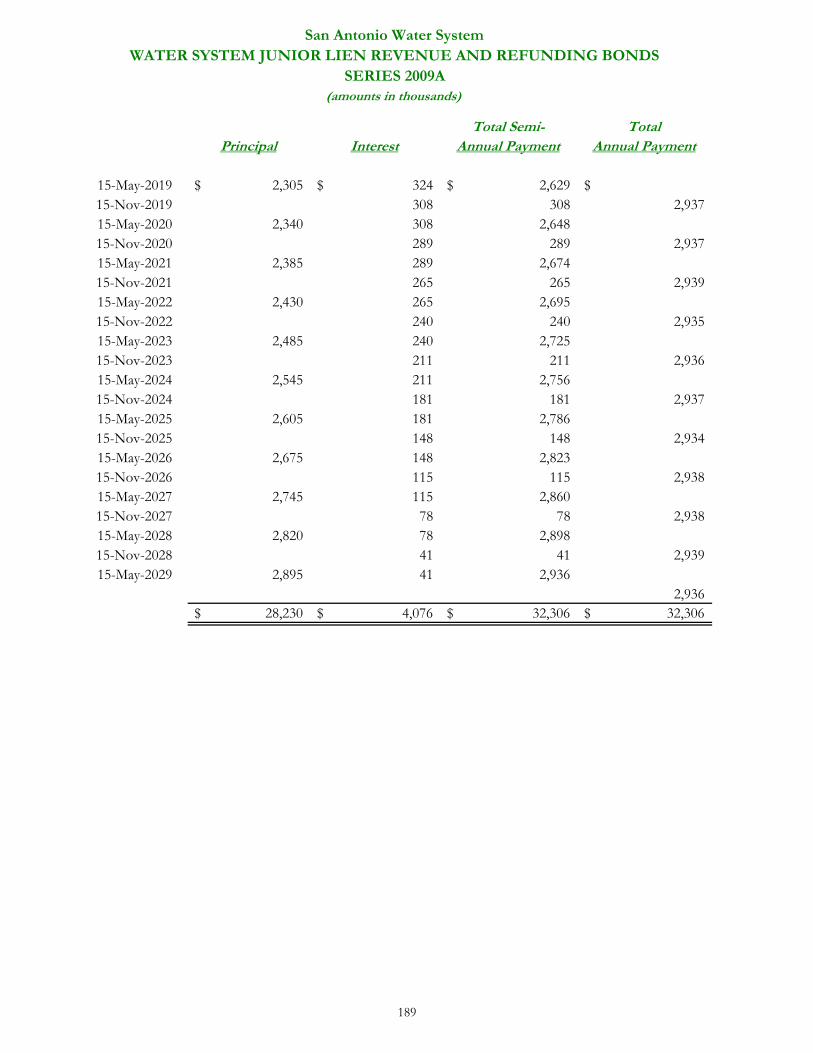
Total Semi- TotalPrincipal Interest Annual Payment Annual Payment
15-May-2019 2,305$ 324$ 2,629$ $15-Nov-2019 308 308 2,937 15-May-2020 2,340 308 2,648 15-Nov-2020 289 289 2,937 15-May-2021 2,385 289 2,674 15-Nov-2021 265 265 2,939 15-May-2022 2,430 265 2,695 15-Nov-2022 240 240 2,935 15-May-2023 2,485 240 2,725 15-Nov-2023 211 211 2,936 15-May-2024 2,545 211 2,756 15-Nov-2024 181 181 2,937 15-May-2025 2,605 181 2,786 15-Nov-2025 148 148 2,934 15-May-2026 2,675 148 2,823 15-Nov-2026 115 115 2,938 15-May-2027 2,745 115 2,860 15-Nov-2027 78 78 2,938 15-May-2028 2,820 78 2,898 15-Nov-2028 41 41 2,939 15-May-2029 2,895 41 2,936
2,936 28,230$ 4,076$ 32,306$ 32,306$
San Antonio Water SystemWATER SYSTEM JUNIOR LIEN REVENUE AND REFUNDING BONDS
SERIES 2009A(amounts in thousands)
189
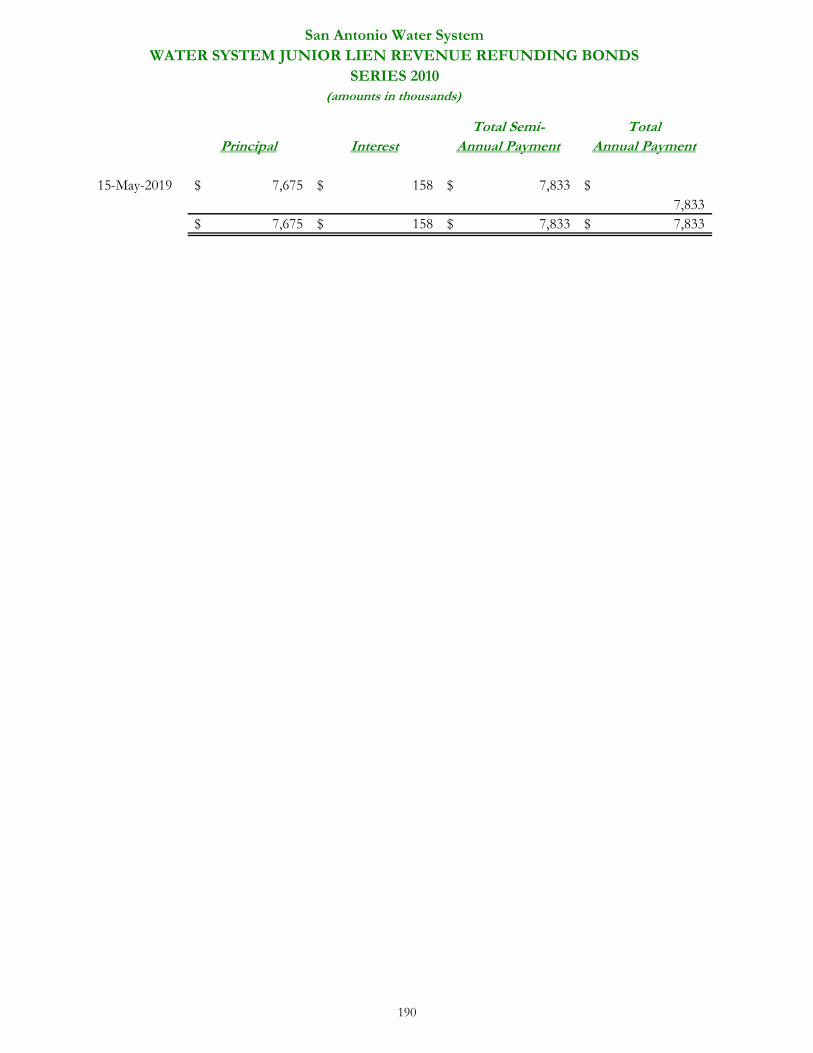
Total Semi- TotalPrincipal Interest Annual Payment Annual Payment
15-May-2019 7,675$ 158$ 7,833$ $7,833
7,675$ 158$ 7,833$ 7,833$
San Antonio Water SystemWATER SYSTEM JUNIOR LIEN REVENUE REFUNDING BONDS
SERIES 2010(amounts in thousands)
190
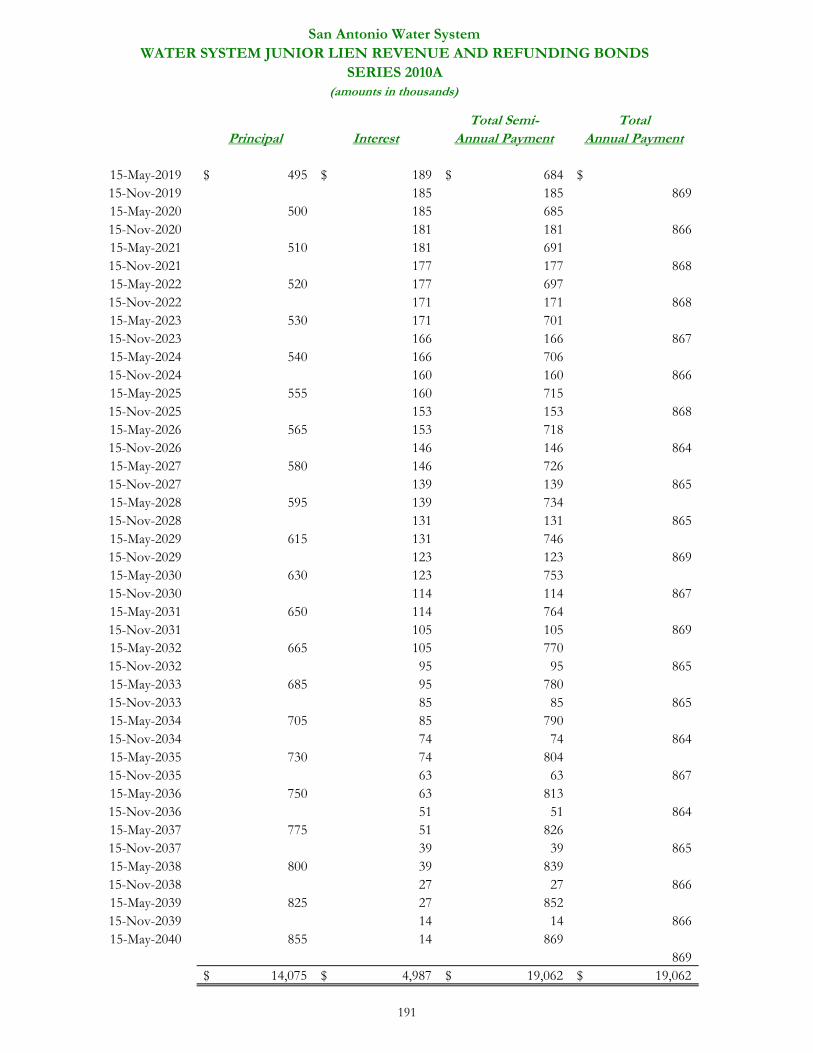
Total Semi- TotalPrincipal Interest Annual Payment Annual Payment
15-May-2019 495$ 189$ 684$ $15-Nov-2019 185 185 869 15-May-2020 500 185 685 15-Nov-2020 181 181 866 15-May-2021 510 181 691 15-Nov-2021 177 177 868 15-May-2022 520 177 697 15-Nov-2022 171 171 868 15-May-2023 530 171 701 15-Nov-2023 166 166 867 15-May-2024 540 166 706 15-Nov-2024 160 160 866 15-May-2025 555 160 715 15-Nov-2025 153 153 868 15-May-2026 565 153 718 15-Nov-2026 146 146 864 15-May-2027 580 146 726 15-Nov-2027 139 139 865 15-May-2028 595 139 734 15-Nov-2028 131 131 865 15-May-2029 615 131 746 15-Nov-2029 123 123 869 15-May-2030 630 123 753 15-Nov-2030 114 114 867 15-May-2031 650 114 764 15-Nov-2031 105 105 869 15-May-2032 665 105 770 15-Nov-2032 95 95 865 15-May-2033 685 95 780 15-Nov-2033 85 85 865 15-May-2034 705 85 790 15-Nov-2034 74 74 864 15-May-2035 730 74 804 15-Nov-2035 63 63 867 15-May-2036 750 63 813 15-Nov-2036 51 51 864 15-May-2037 775 51 826 15-Nov-2037 39 39 865 15-May-2038 800 39 839 15-Nov-2038 27 27 866 15-May-2039 825 27 852 15-Nov-2039 14 14 866 15-May-2040 855 14 869
869 14,075$ 4,987$ 19,062$ 19,062$
San Antonio Water SystemWATER SYSTEM JUNIOR LIEN REVENUE AND REFUNDING BONDS
SERIES 2010A(amounts in thousands)
191
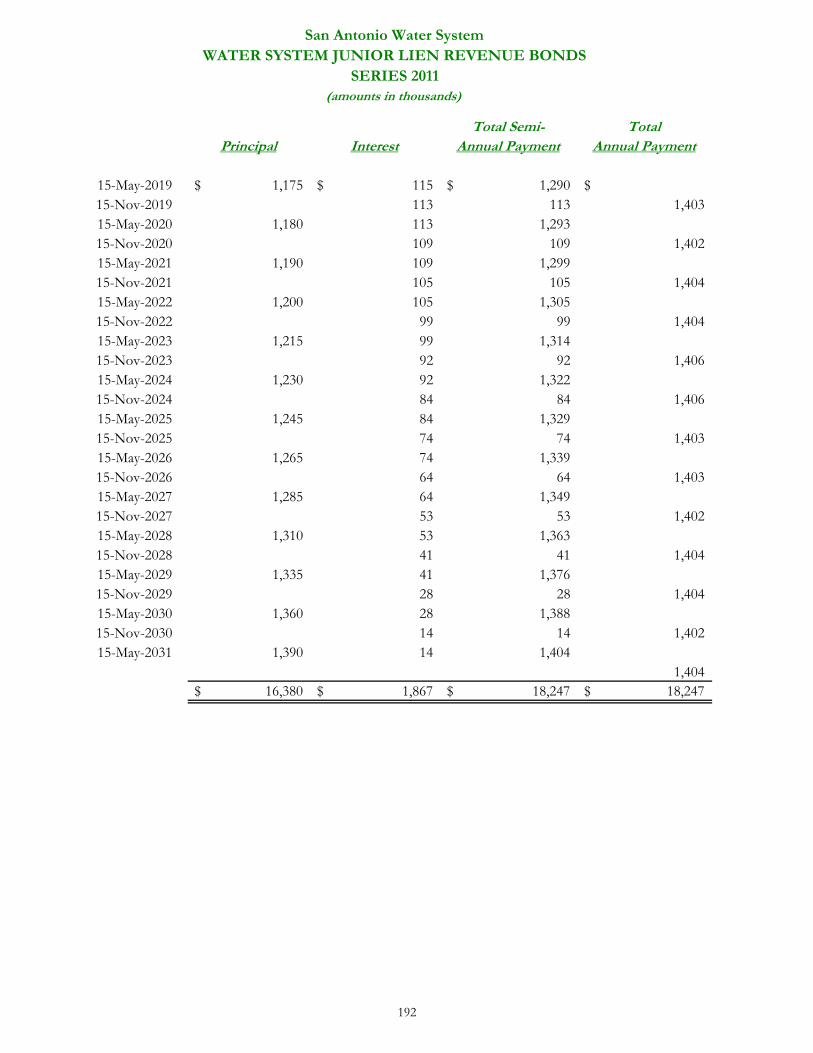
Total Semi- TotalPrincipal Interest Annual Payment Annual Payment
15-May-2019 1,175$ 115$ 1,290$ $15-Nov-2019 113 113 1,403 15-May-2020 1,180 113 1,293 15-Nov-2020 109 109 1,402 15-May-2021 1,190 109 1,299 15-Nov-2021 105 105 1,404 15-May-2022 1,200 105 1,305 15-Nov-2022 99 99 1,404 15-May-2023 1,215 99 1,314 15-Nov-2023 92 92 1,406 15-May-2024 1,230 92 1,322 15-Nov-2024 84 84 1,406 15-May-2025 1,245 84 1,329 15-Nov-2025 74 74 1,403 15-May-2026 1,265 74 1,339 15-Nov-2026 64 64 1,403 15-May-2027 1,285 64 1,349 15-Nov-2027 53 53 1,402 15-May-2028 1,310 53 1,363 15-Nov-2028 41 41 1,404 15-May-2029 1,335 41 1,376 15-Nov-2029 28 28 1,404 15-May-2030 1,360 28 1,388 15-Nov-2030 14 14 1,402 15-May-2031 1,390 14 1,404
1,404 16,380$ 1,867$ 18,247$ 18,247$
San Antonio Water SystemWATER SYSTEM JUNIOR LIEN REVENUE BONDS
SERIES 2011(amounts in thousands)
192
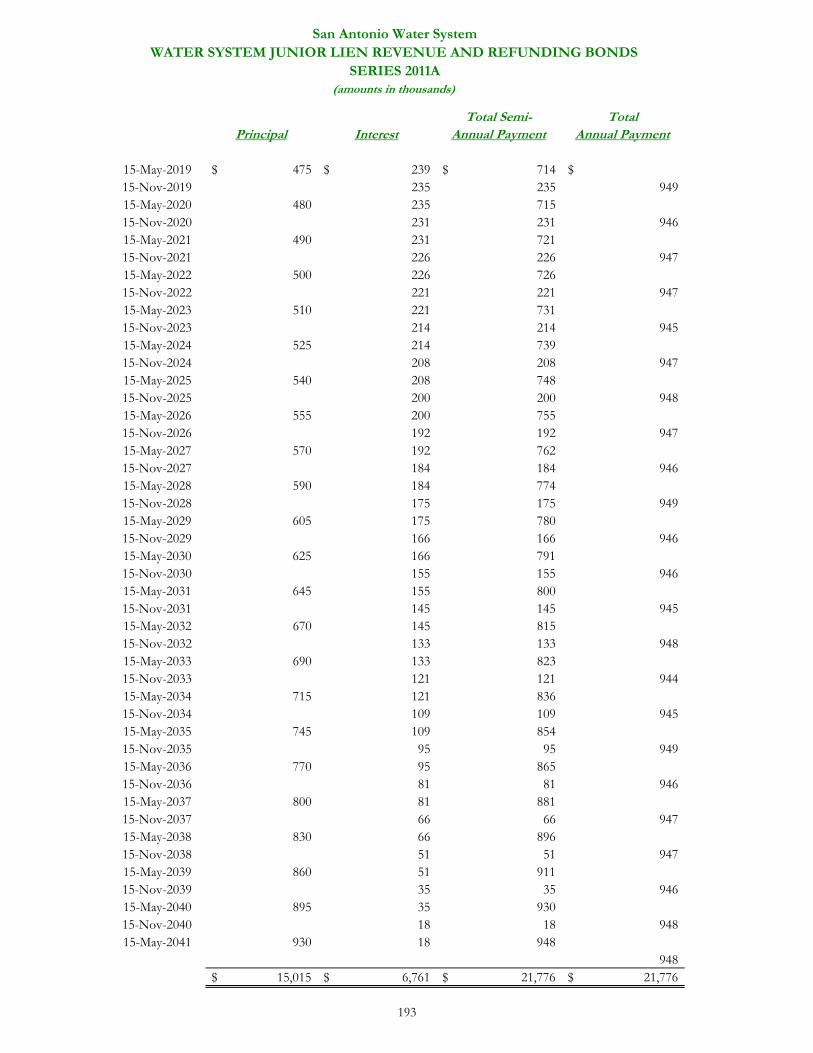
Total Semi- TotalPrincipal Interest Annual Payment Annual Payment
15-May-2019 475$ 239$ 714$ $15-Nov-2019 235 235 949 15-May-2020 480 235 715 15-Nov-2020 231 231 946 15-May-2021 490 231 721 15-Nov-2021 226 226 947 15-May-2022 500 226 726 15-Nov-2022 221 221 947 15-May-2023 510 221 731 15-Nov-2023 214 214 945 15-May-2024 525 214 739 15-Nov-2024 208 208 947 15-May-2025 540 208 748 15-Nov-2025 200 200 948 15-May-2026 555 200 755 15-Nov-2026 192 192 947 15-May-2027 570 192 762 15-Nov-2027 184 184 946 15-May-2028 590 184 774 15-Nov-2028 175 175 949 15-May-2029 605 175 780 15-Nov-2029 166 166 946 15-May-2030 625 166 791 15-Nov-2030 155 155 946 15-May-2031 645 155 800 15-Nov-2031 145 145 945 15-May-2032 670 145 815 15-Nov-2032 133 133 948 15-May-2033 690 133 823 15-Nov-2033 121 121 944 15-May-2034 715 121 836 15-Nov-2034 109 109 945 15-May-2035 745 109 854 15-Nov-2035 95 95 949 15-May-2036 770 95 865 15-Nov-2036 81 81 946 15-May-2037 800 81 881 15-Nov-2037 66 66 947 15-May-2038 830 66 896 15-Nov-2038 51 51 947 15-May-2039 860 51 911 15-Nov-2039 35 35 946 15-May-2040 895 35 930 15-Nov-2040 18 18 948 15-May-2041 930 18 948
948 15,015$ 6,761$ 21,776$ 21,776$
San Antonio Water SystemWATER SYSTEM JUNIOR LIEN REVENUE AND REFUNDING BONDS
SERIES 2011A(amounts in thousands)
193
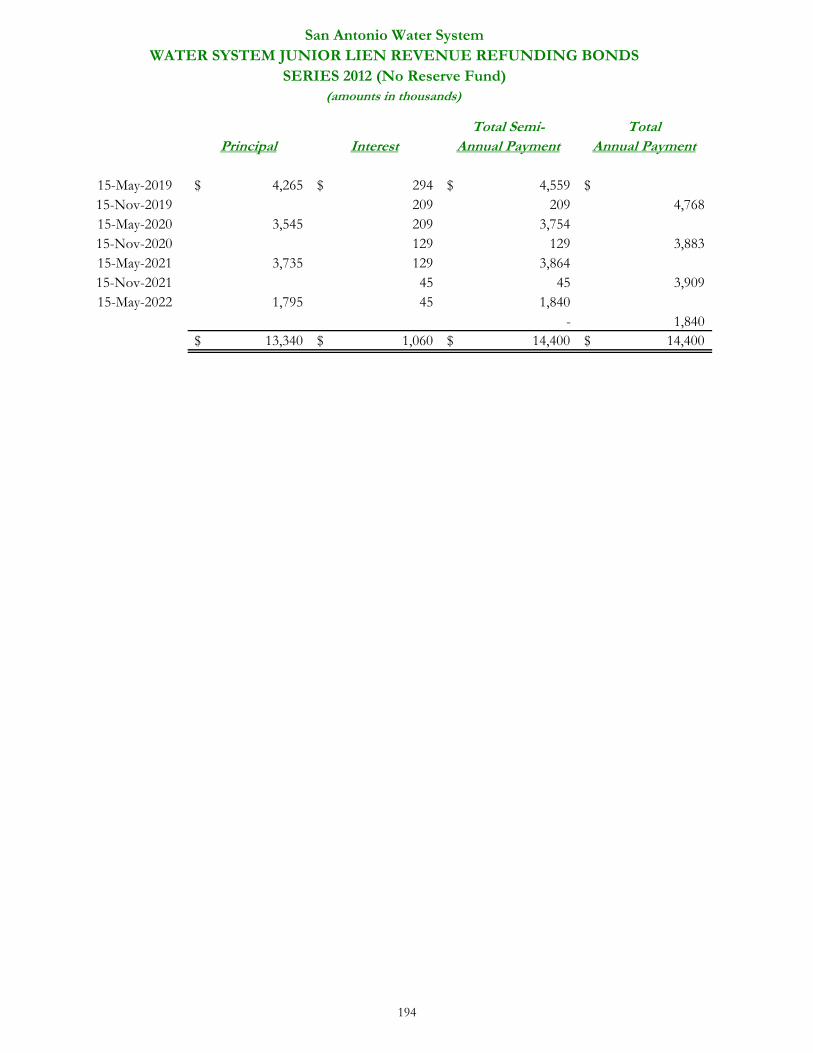
Total Semi- TotalPrincipal Interest Annual Payment Annual Payment
15-May-2019 4,265$ 294$ 4,559$ $15-Nov-2019 209 209 4,768 15-May-2020 3,545 209 3,754 15-Nov-2020 129 129 3,883 15-May-2021 3,735 129 3,864 15-Nov-2021 45 45 3,909 15-May-2022 1,795 45 1,840
- 1,840 13,340$ 1,060$ 14,400$ 14,400$
San Antonio Water SystemWATER SYSTEM JUNIOR LIEN REVENUE REFUNDING BONDS
SERIES 2012 (No Reserve Fund)(amounts in thousands)
194
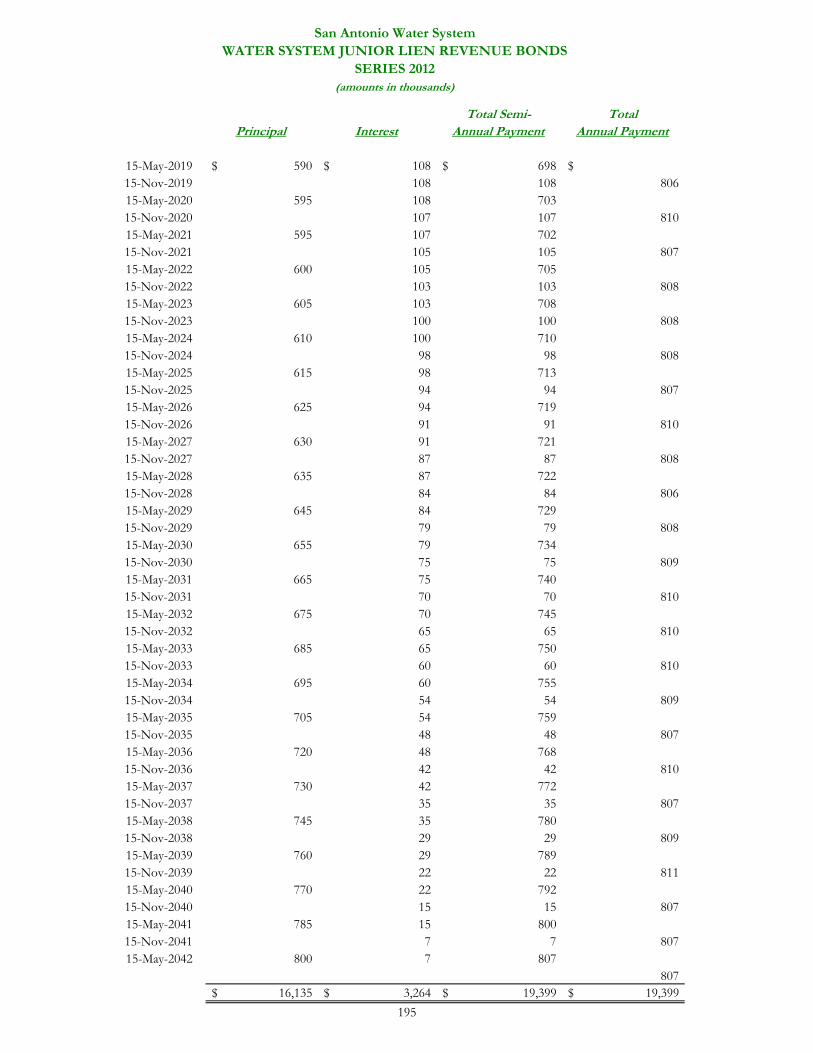
Total Semi- TotalPrincipal Interest Annual Payment Annual Payment
15-May-2019 590$ 108$ 698$ $15-Nov-2019 108 108 806 15-May-2020 595 108 703 15-Nov-2020 107 107 810 15-May-2021 595 107 702 15-Nov-2021 105 105 807 15-May-2022 600 105 705 15-Nov-2022 103 103 808 15-May-2023 605 103 708 15-Nov-2023 100 100 808 15-May-2024 610 100 710 15-Nov-2024 98 98 808 15-May-2025 615 98 713 15-Nov-2025 94 94 807 15-May-2026 625 94 719 15-Nov-2026 91 91 810 15-May-2027 630 91 721 15-Nov-2027 87 87 808 15-May-2028 635 87 722 15-Nov-2028 84 84 806 15-May-2029 645 84 729 15-Nov-2029 79 79 808 15-May-2030 655 79 734 15-Nov-2030 75 75 809 15-May-2031 665 75 740 15-Nov-2031 70 70 810 15-May-2032 675 70 745 15-Nov-2032 65 65 810 15-May-2033 685 65 750 15-Nov-2033 60 60 810 15-May-2034 695 60 755 15-Nov-2034 54 54 809 15-May-2035 705 54 759 15-Nov-2035 48 48 807 15-May-2036 720 48 768 15-Nov-2036 42 42 810 15-May-2037 730 42 772 15-Nov-2037 35 35 807 15-May-2038 745 35 780 15-Nov-2038 29 29 809 15-May-2039 760 29 789 15-Nov-2039 22 22 811 15-May-2040 770 22 792 15-Nov-2040 15 15 807 15-May-2041 785 15 800 15-Nov-2041 7 7 807 15-May-2042 800 7 807
807 16,135$ 3,264$ 19,399$ 19,399$
San Antonio Water SystemWATER SYSTEM JUNIOR LIEN REVENUE BONDS
SERIES 2012(amounts in thousands)
195
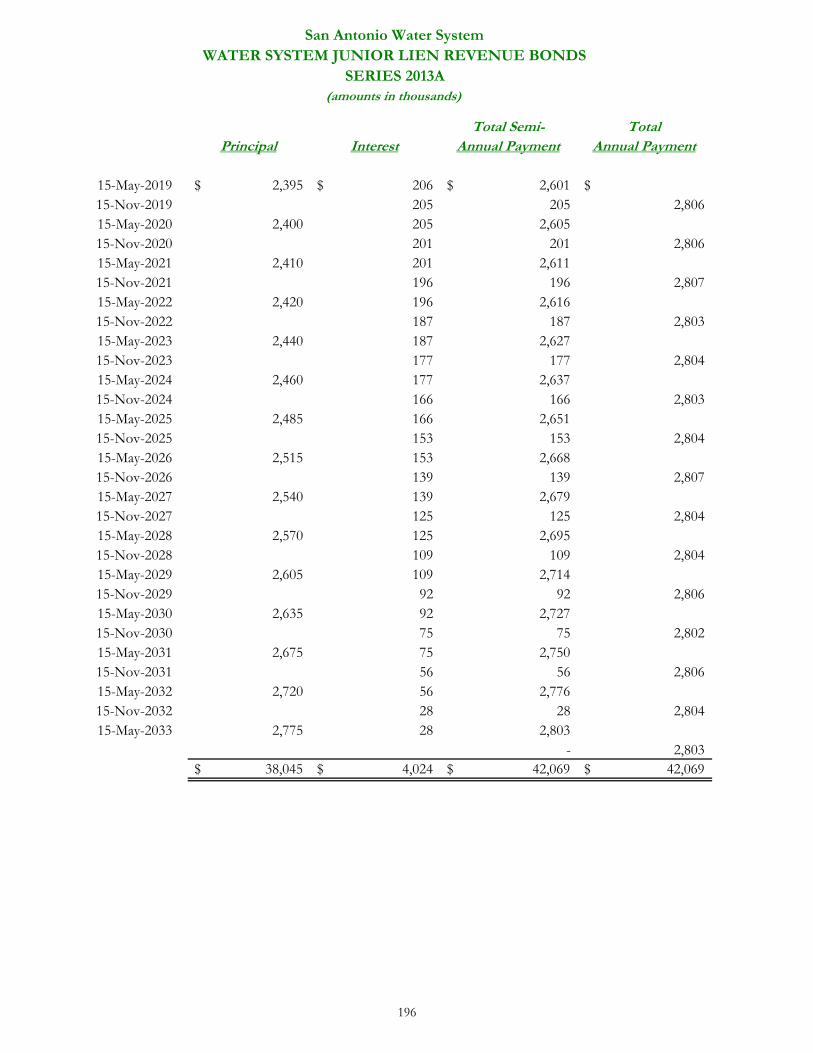
Total Semi- TotalPrincipal Interest Annual Payment Annual Payment
15-May-2019 2,395$ 206$ 2,601$ $15-Nov-2019 205 205 2,806 15-May-2020 2,400 205 2,605 15-Nov-2020 201 201 2,806 15-May-2021 2,410 201 2,611 15-Nov-2021 196 196 2,807 15-May-2022 2,420 196 2,616 15-Nov-2022 187 187 2,803 15-May-2023 2,440 187 2,627 15-Nov-2023 177 177 2,804 15-May-2024 2,460 177 2,637 15-Nov-2024 166 166 2,803 15-May-2025 2,485 166 2,651 15-Nov-2025 153 153 2,804 15-May-2026 2,515 153 2,668 15-Nov-2026 139 139 2,807 15-May-2027 2,540 139 2,679 15-Nov-2027 125 125 2,804 15-May-2028 2,570 125 2,695 15-Nov-2028 109 109 2,804 15-May-2029 2,605 109 2,714 15-Nov-2029 92 92 2,806 15-May-2030 2,635 92 2,727 15-Nov-2030 75 75 2,802 15-May-2031 2,675 75 2,750 15-Nov-2031 56 56 2,806 15-May-2032 2,720 56 2,776 15-Nov-2032 28 28 2,804 15-May-2033 2,775 28 2,803
- 2,803 38,045$ 4,024$ 42,069$ 42,069$
San Antonio Water SystemWATER SYSTEM JUNIOR LIEN REVENUE BONDS
SERIES 2013A(amounts in thousands)
196
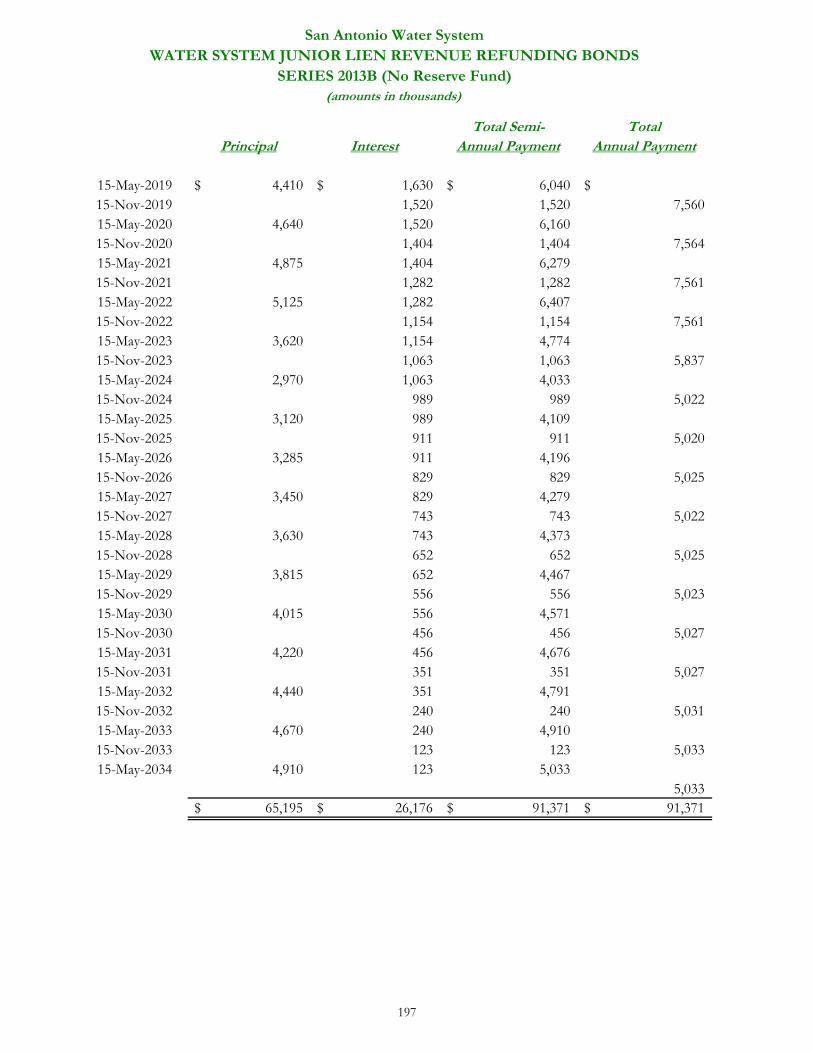
Total Semi- TotalPrincipal Interest Annual Payment Annual Payment
15-May-2019 4,410$ 1,630$ 6,040$ $15-Nov-2019 1,520 1,520 7,560 15-May-2020 4,640 1,520 6,160 15-Nov-2020 1,404 1,404 7,564 15-May-2021 4,875 1,404 6,279 15-Nov-2021 1,282 1,282 7,561 15-May-2022 5,125 1,282 6,407 15-Nov-2022 1,154 1,154 7,561 15-May-2023 3,620 1,154 4,774 15-Nov-2023 1,063 1,063 5,837 15-May-2024 2,970 1,063 4,033 15-Nov-2024 989 989 5,022 15-May-2025 3,120 989 4,109 15-Nov-2025 911 911 5,020 15-May-2026 3,285 911 4,196 15-Nov-2026 829 829 5,025 15-May-2027 3,450 829 4,279 15-Nov-2027 743 743 5,022 15-May-2028 3,630 743 4,373 15-Nov-2028 652 652 5,025 15-May-2029 3,815 652 4,467 15-Nov-2029 556 556 5,023 15-May-2030 4,015 556 4,571 15-Nov-2030 456 456 5,027 15-May-2031 4,220 456 4,676 15-Nov-2031 351 351 5,027 15-May-2032 4,440 351 4,791 15-Nov-2032 240 240 5,031 15-May-2033 4,670 240 4,910 15-Nov-2033 123 123 5,033 15-May-2034 4,910 123 5,033
5,033 65,195$ 26,176$ 91,371$ 91,371$
San Antonio Water SystemWATER SYSTEM JUNIOR LIEN REVENUE REFUNDING BONDS
SERIES 2013B (No Reserve Fund)(amounts in thousands)
197

Total Semi- TotalPrincipal Interest Annual Payment Annual Payment
15-May-2019 1,210$ 194$ 1,404$ $15-Nov-2019 191 191 1,595 15-May-2020 1,220 191 1,411 15-Nov-2020 187 187 1,598 15-May-2021 1,230 187 1,417 15-Nov-2021 180 180 1,597 15-May-2022 1,245 180 1,425 15-Nov-2022 172 172 1,597 15-May-2023 1,260 172 1,432 15-Nov-2023 162 162 1,594 15-May-2024 1,280 162 1,442 15-Nov-2024 152 152 1,594 15-May-2025 1,305 152 1,457 15-Nov-2025 140 140 1,597 15-May-2026 1,330 140 1,470 15-Nov-2026 127 127 1,597 15-May-2027 1,355 127 1,482 15-Nov-2027 112 112 1,594 15-May-2028 1,385 112 1,497 15-Nov-2028 97 97 1,594 15-May-2029 1,420 97 1,517 15-Nov-2029 80 80 1,597 15-May-2030 1,455 80 1,535 15-Nov-2030 62 62 1,597 15-May-2031 1,495 62 1,557 15-Nov-2031 42 42 1,599 15-May-2032 1,535 42 1,577 15-Nov-2032 22 22 1,599 15-May-2033 1,575 22 1,597
1,597 20,300$ 3,646$ 23,946$ 23,946$
San Antonio Water SystemWATER SYSTEM JUNIOR LIEN REVENUE BONDS
SERIES 2013C(amounts in thousands)
198
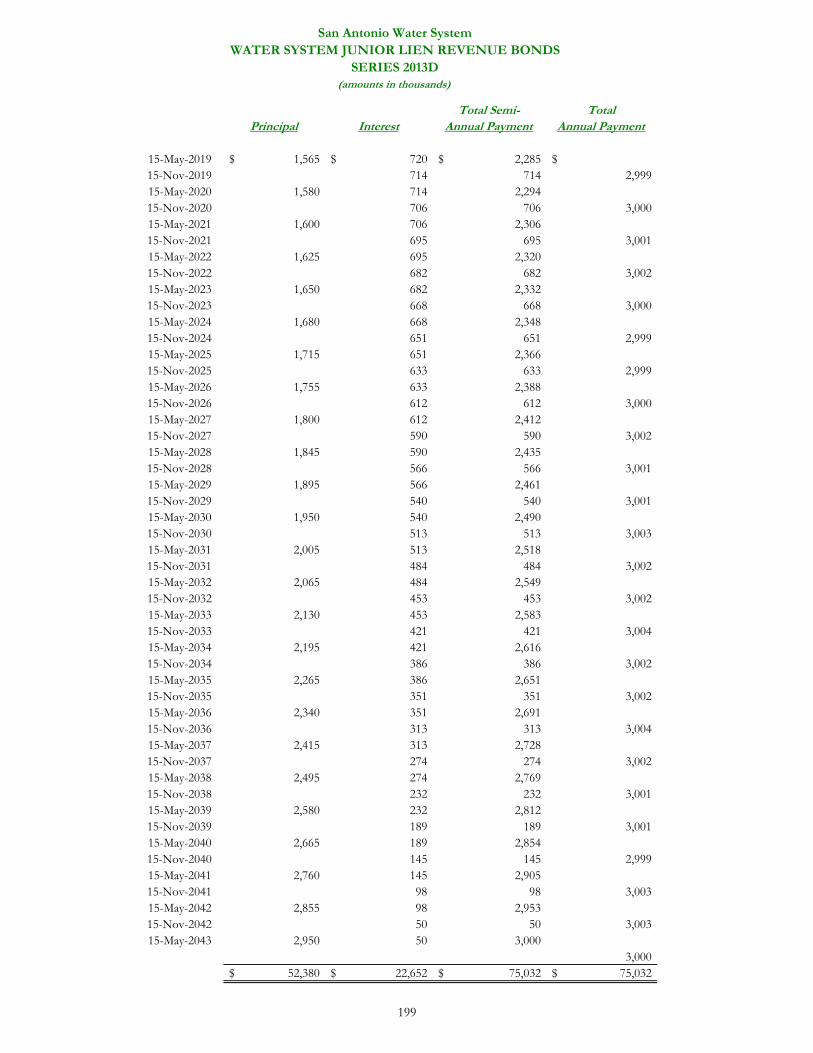
Total Semi- TotalPrincipal Interest Annual Payment Annual Payment
15-May-2019 1,565$ 720$ 2,285$ $15-Nov-2019 714 714 2,999 15-May-2020 1,580 714 2,294 15-Nov-2020 706 706 3,000 15-May-2021 1,600 706 2,306 15-Nov-2021 695 695 3,001 15-May-2022 1,625 695 2,320 15-Nov-2022 682 682 3,002 15-May-2023 1,650 682 2,332 15-Nov-2023 668 668 3,000 15-May-2024 1,680 668 2,348 15-Nov-2024 651 651 2,999 15-May-2025 1,715 651 2,366 15-Nov-2025 633 633 2,999 15-May-2026 1,755 633 2,388 15-Nov-2026 612 612 3,000 15-May-2027 1,800 612 2,412 15-Nov-2027 590 590 3,002 15-May-2028 1,845 590 2,435 15-Nov-2028 566 566 3,001 15-May-2029 1,895 566 2,461 15-Nov-2029 540 540 3,001 15-May-2030 1,950 540 2,490 15-Nov-2030 513 513 3,003 15-May-2031 2,005 513 2,518 15-Nov-2031 484 484 3,002 15-May-2032 2,065 484 2,549 15-Nov-2032 453 453 3,002 15-May-2033 2,130 453 2,583 15-Nov-2033 421 421 3,004 15-May-2034 2,195 421 2,616 15-Nov-2034 386 386 3,002 15-May-2035 2,265 386 2,651 15-Nov-2035 351 351 3,002 15-May-2036 2,340 351 2,691 15-Nov-2036 313 313 3,004 15-May-2037 2,415 313 2,728 15-Nov-2037 274 274 3,002 15-May-2038 2,495 274 2,769 15-Nov-2038 232 232 3,001 15-May-2039 2,580 232 2,812 15-Nov-2039 189 189 3,001 15-May-2040 2,665 189 2,854 15-Nov-2040 145 145 2,999 15-May-2041 2,760 145 2,905 15-Nov-2041 98 98 3,003 15-May-2042 2,855 98 2,953 15-Nov-2042 50 50 3,003 15-May-2043 2,950 50 3,000
3,000 52,380$ 22,652$ 75,032$ 75,032$
San Antonio Water SystemWATER SYSTEM JUNIOR LIEN REVENUE BONDS
SERIES 2013D(amounts in thousands)
199
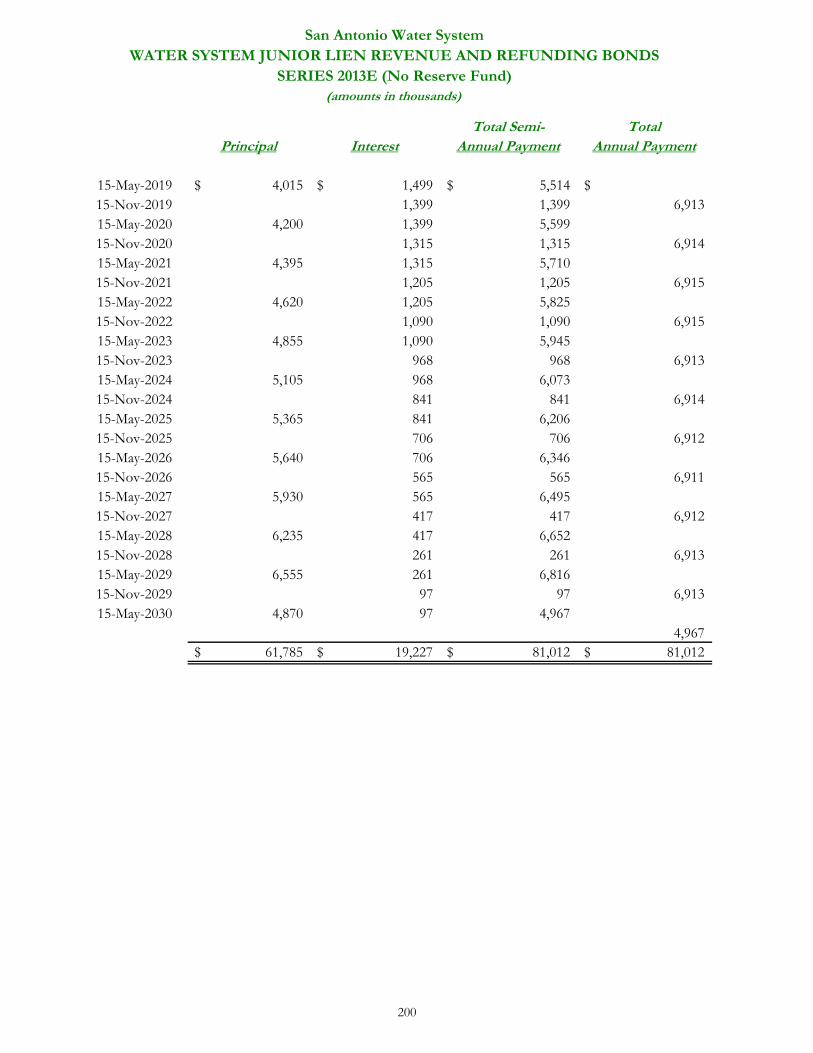
Total Semi- TotalPrincipal Interest Annual Payment Annual Payment
15-May-2019 4,015$ 1,499$ 5,514$ $15-Nov-2019 1,399 1,399 6,913 15-May-2020 4,200 1,399 5,599 15-Nov-2020 1,315 1,315 6,914 15-May-2021 4,395 1,315 5,710 15-Nov-2021 1,205 1,205 6,915 15-May-2022 4,620 1,205 5,825 15-Nov-2022 1,090 1,090 6,915 15-May-2023 4,855 1,090 5,945 15-Nov-2023 968 968 6,913 15-May-2024 5,105 968 6,073 15-Nov-2024 841 841 6,914 15-May-2025 5,365 841 6,206 15-Nov-2025 706 706 6,912 15-May-2026 5,640 706 6,346 15-Nov-2026 565 565 6,911 15-May-2027 5,930 565 6,495 15-Nov-2027 417 417 6,912 15-May-2028 6,235 417 6,652 15-Nov-2028 261 261 6,913 15-May-2029 6,555 261 6,816 15-Nov-2029 97 97 6,913 15-May-2030 4,870 97 4,967
4,967 61,785$ 19,227$ 81,012$ 81,012$
San Antonio Water SystemWATER SYSTEM JUNIOR LIEN REVENUE AND REFUNDING BONDS
SERIES 2013E (No Reserve Fund)(amounts in thousands)
200
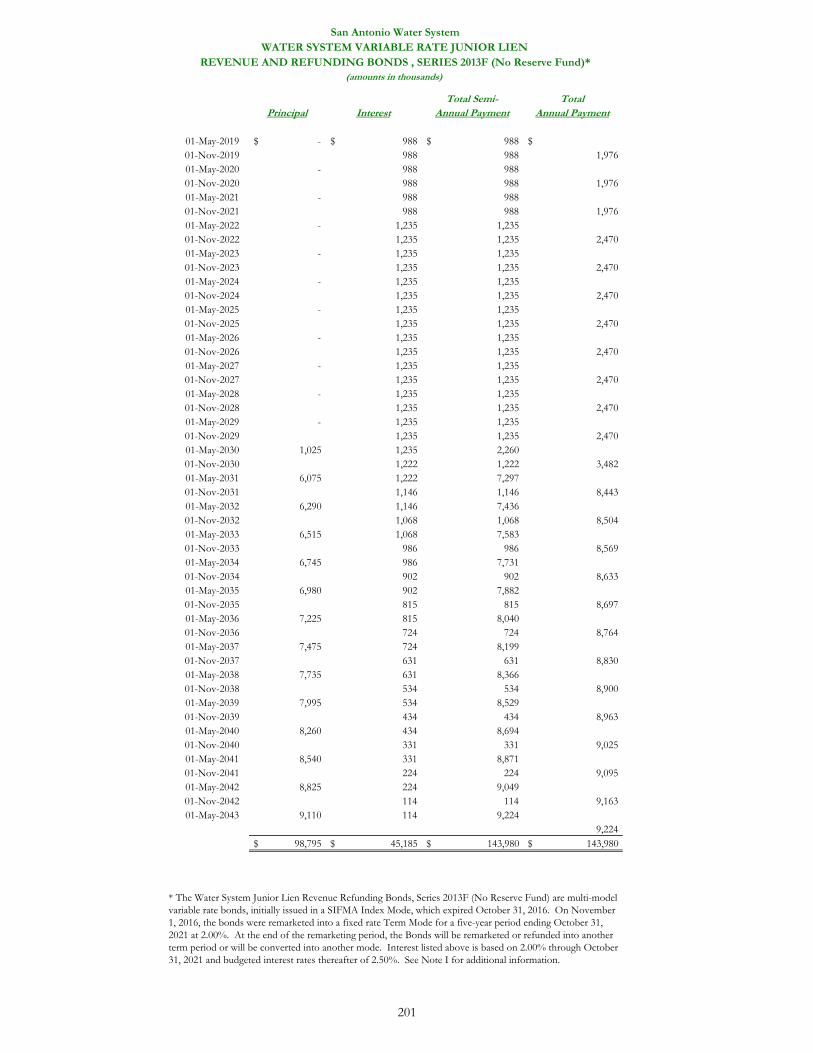
Total Semi- TotalPrincipal Interest Annual Payment Annual Payment
01-May-2019 -$ 988$ 988$ $01-Nov-2019 988 988 1,976 01-May-2020 - 988 988 01-Nov-2020 988 988 1,976 01-May-2021 - 988 988 01-Nov-2021 988 988 1,976 01-May-2022 - 1,235 1,235 01-Nov-2022 1,235 1,235 2,470 01-May-2023 - 1,235 1,235 01-Nov-2023 1,235 1,235 2,470 01-May-2024 - 1,235 1,235 01-Nov-2024 1,235 1,235 2,470 01-May-2025 - 1,235 1,235 01-Nov-2025 1,235 1,235 2,470 01-May-2026 - 1,235 1,235 01-Nov-2026 1,235 1,235 2,470 01-May-2027 - 1,235 1,235 01-Nov-2027 1,235 1,235 2,470 01-May-2028 - 1,235 1,235 01-Nov-2028 1,235 1,235 2,470 01-May-2029 - 1,235 1,235 01-Nov-2029 1,235 1,235 2,470 01-May-2030 1,025 1,235 2,260 01-Nov-2030 1,222 1,222 3,482 01-May-2031 6,075 1,222 7,297 01-Nov-2031 1,146 1,146 8,443 01-May-2032 6,290 1,146 7,436 01-Nov-2032 1,068 1,068 8,504 01-May-2033 6,515 1,068 7,583 01-Nov-2033 986 986 8,569 01-May-2034 6,745 986 7,731 01-Nov-2034 902 902 8,633 01-May-2035 6,980 902 7,882 01-Nov-2035 815 815 8,697 01-May-2036 7,225 815 8,040 01-Nov-2036 724 724 8,764 01-May-2037 7,475 724 8,199 01-Nov-2037 631 631 8,830 01-May-2038 7,735 631 8,366 01-Nov-2038 534 534 8,900 01-May-2039 7,995 534 8,529 01-Nov-2039 434 434 8,963 01-May-2040 8,260 434 8,694 01-Nov-2040 331 331 9,025 01-May-2041 8,540 331 8,871 01-Nov-2041 224 224 9,095 01-May-2042 8,825 224 9,049 01-Nov-2042 114 114 9,163 01-May-2043 9,110 114 9,224
9,224 98,795$ 45,185$ 143,980$ 143,980$
San Antonio Water SystemWATER SYSTEM VARIABLE RATE JUNIOR LIEN
REVENUE AND REFUNDING BONDS , SERIES 2013F (No Reserve Fund)*(amounts in thousands)
* The Water System Junior Lien Revenue Refunding Bonds, Series 2013F (No Reserve Fund) are multi-model variable rate bonds, initially issued in a SIFMA Index Mode, which expired October 31, 2016. On November 1, 2016, the bonds were remarketed into a fixed rate Term Mode for a five-year period ending October 31, 2021 at 2.00%. At the end of the remarketing period, the Bonds will be remarketed or refunded into another term period or will be converted into another mode. Interest listed above is based on 2.00% through October 31, 2021 and budgeted interest rates thereafter of 2.50%. See Note I for additional information.
201
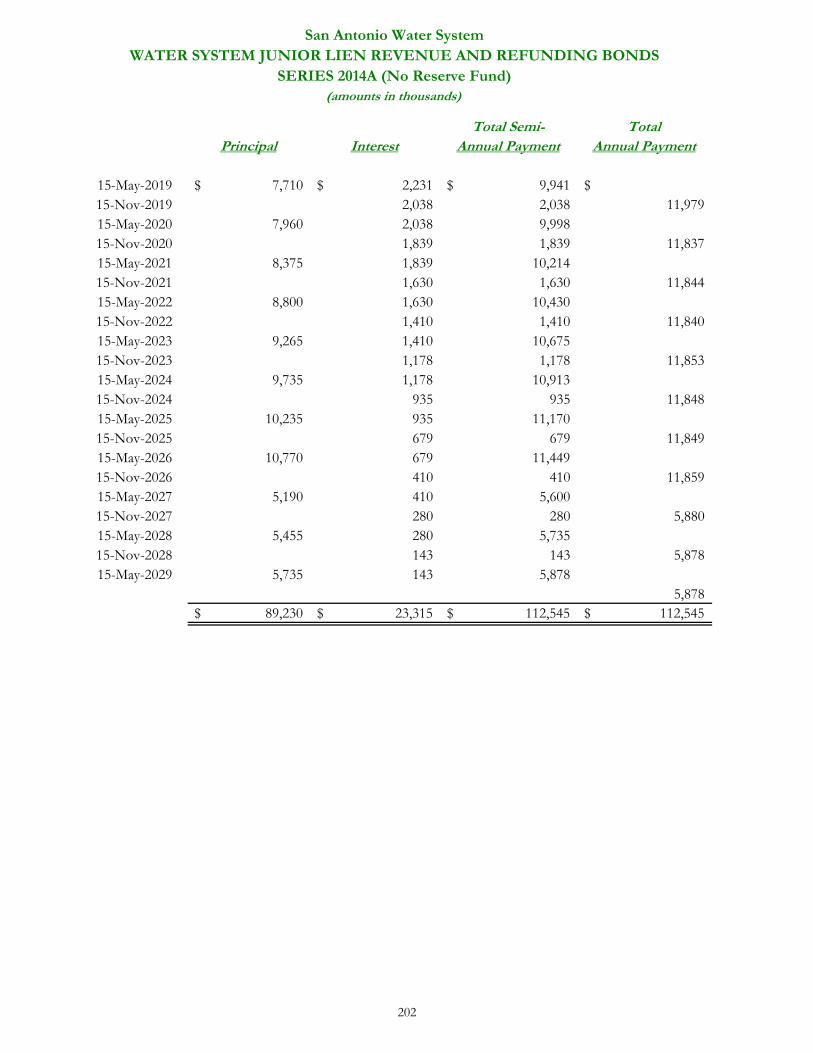
Total Semi- TotalPrincipal Interest Annual Payment Annual Payment
15-May-2019 7,710$ 2,231$ 9,941$ $15-Nov-2019 2,038 2,038 11,979 15-May-2020 7,960 2,038 9,998 15-Nov-2020 1,839 1,839 11,837 15-May-2021 8,375 1,839 10,214 15-Nov-2021 1,630 1,630 11,844 15-May-2022 8,800 1,630 10,430 15-Nov-2022 1,410 1,410 11,840 15-May-2023 9,265 1,410 10,675 15-Nov-2023 1,178 1,178 11,853 15-May-2024 9,735 1,178 10,913 15-Nov-2024 935 935 11,848 15-May-2025 10,235 935 11,170 15-Nov-2025 679 679 11,849 15-May-2026 10,770 679 11,449 15-Nov-2026 410 410 11,859 15-May-2027 5,190 410 5,600 15-Nov-2027 280 280 5,880 15-May-2028 5,455 280 5,735 15-Nov-2028 143 143 5,878 15-May-2029 5,735 143 5,878
5,878 89,230$ 23,315$ 112,545$ 112,545$
San Antonio Water SystemWATER SYSTEM JUNIOR LIEN REVENUE AND REFUNDING BONDS
SERIES 2014A (No Reserve Fund)(amounts in thousands)
202
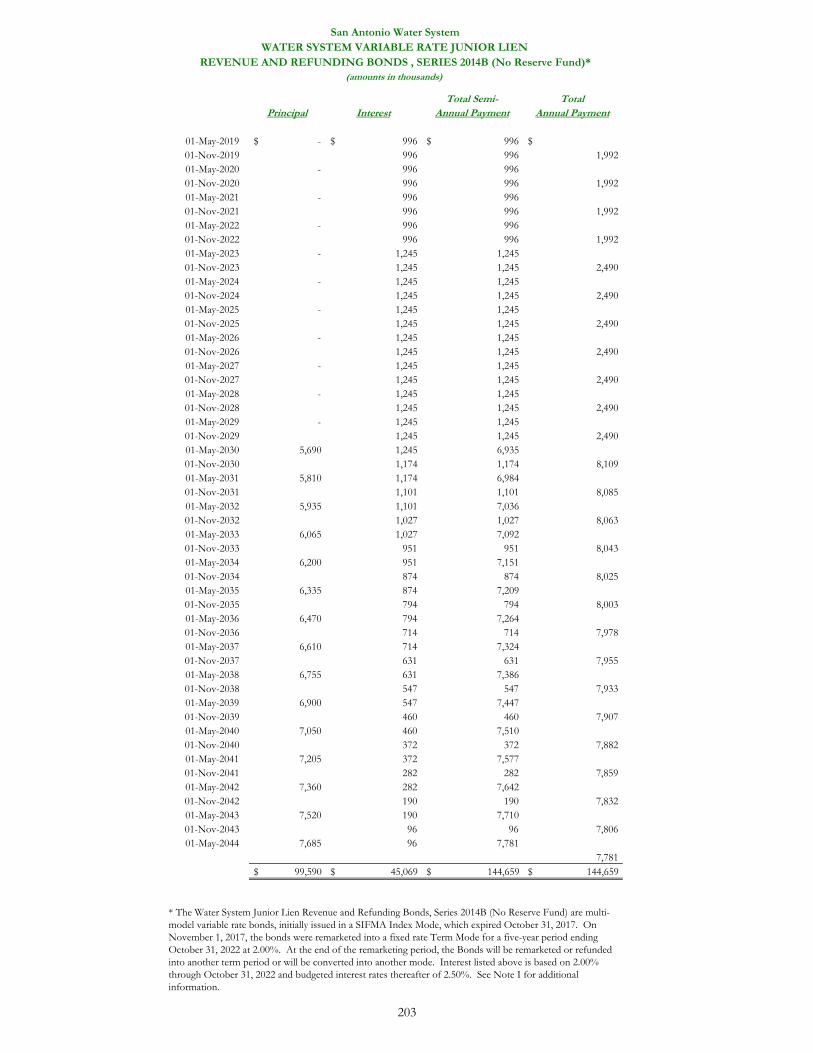
Total Semi- TotalPrincipal Interest Annual Payment Annual Payment
01-May-2019 -$ 996$ 996$ $01-Nov-2019 996 996 1,992 01-May-2020 - 996 996 01-Nov-2020 996 996 1,992 01-May-2021 - 996 996 01-Nov-2021 996 996 1,992 01-May-2022 - 996 996 01-Nov-2022 996 996 1,992 01-May-2023 - 1,245 1,245 01-Nov-2023 1,245 1,245 2,490 01-May-2024 - 1,245 1,245 01-Nov-2024 1,245 1,245 2,490 01-May-2025 - 1,245 1,245 01-Nov-2025 1,245 1,245 2,490 01-May-2026 - 1,245 1,245 01-Nov-2026 1,245 1,245 2,490 01-May-2027 - 1,245 1,245 01-Nov-2027 1,245 1,245 2,490 01-May-2028 - 1,245 1,245 01-Nov-2028 1,245 1,245 2,490 01-May-2029 - 1,245 1,245 01-Nov-2029 1,245 1,245 2,490 01-May-2030 5,690 1,245 6,935 01-Nov-2030 1,174 1,174 8,109 01-May-2031 5,810 1,174 6,984 01-Nov-2031 1,101 1,101 8,085 01-May-2032 5,935 1,101 7,036 01-Nov-2032 1,027 1,027 8,063 01-May-2033 6,065 1,027 7,092 01-Nov-2033 951 951 8,043 01-May-2034 6,200 951 7,151 01-Nov-2034 874 874 8,025 01-May-2035 6,335 874 7,209 01-Nov-2035 794 794 8,003 01-May-2036 6,470 794 7,264 01-Nov-2036 714 714 7,978 01-May-2037 6,610 714 7,324 01-Nov-2037 631 631 7,955 01-May-2038 6,755 631 7,386 01-Nov-2038 547 547 7,933 01-May-2039 6,900 547 7,447 01-Nov-2039 460 460 7,907 01-May-2040 7,050 460 7,510 01-Nov-2040 372 372 7,882 01-May-2041 7,205 372 7,577 01-Nov-2041 282 282 7,859 01-May-2042 7,360 282 7,642 01-Nov-2042 190 190 7,832 01-May-2043 7,520 190 7,710 01-Nov-2043 96 96 7,806 01-May-2044 7,685 96 7,781
7,781 99,590$ 45,069$ 144,659$ 144,659$
* The Water System Junior Lien Revenue and Refunding Bonds, Series 2014B (No Reserve Fund) are multi-model variable rate bonds, initially issued in a SIFMA Index Mode, which expired October 31, 2017. On November 1, 2017, the bonds were remarketed into a fixed rate Term Mode for a five-year period ending October 31, 2022 at 2.00%. At the end of the remarketing period, the Bonds will be remarketed or refunded into another term period or will be converted into another mode. Interest listed above is based on 2.00% through October 31, 2022 and budgeted interest rates thereafter of 2.50%. See Note I for additional information.
San Antonio Water SystemWATER SYSTEM VARIABLE RATE JUNIOR LIEN
REVENUE AND REFUNDING BONDS , SERIES 2014B (No Reserve Fund)*(amounts in thousands)
203
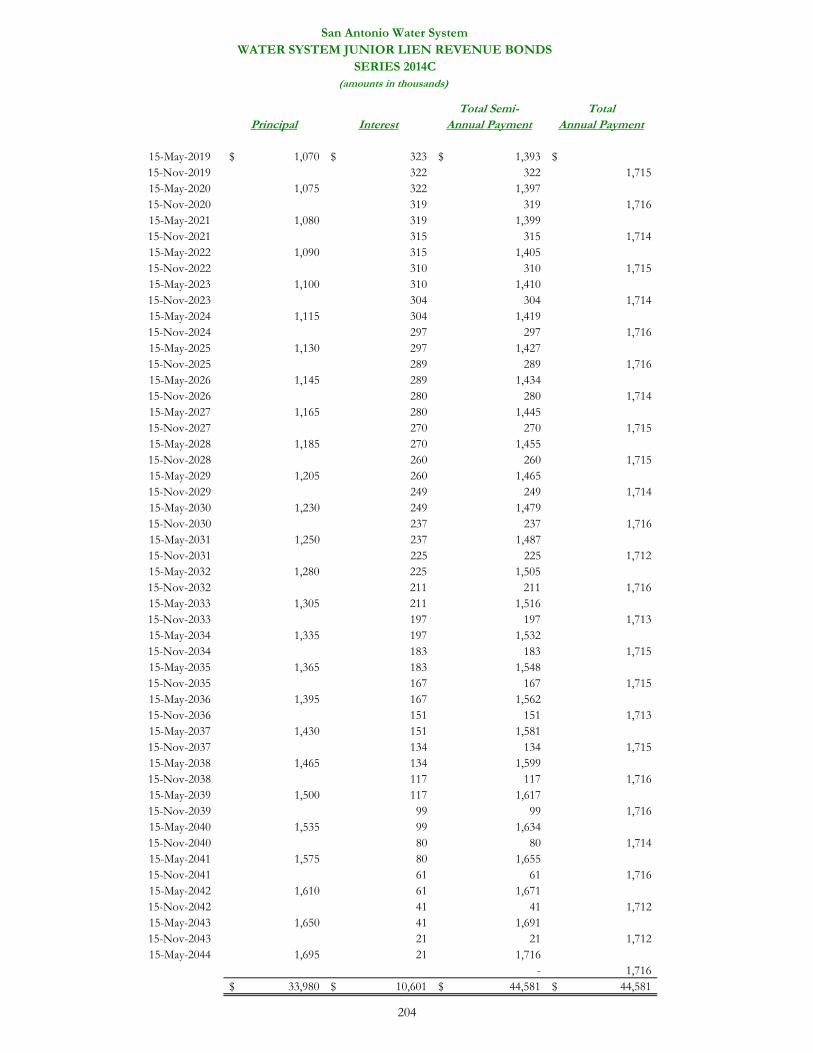
Total Semi- TotalPrincipal Interest Annual Payment Annual Payment
15-May-2019 1,070$ 323$ 1,393$ $15-Nov-2019 322 322 1,715 15-May-2020 1,075 322 1,397 15-Nov-2020 319 319 1,716 15-May-2021 1,080 319 1,399 15-Nov-2021 315 315 1,714 15-May-2022 1,090 315 1,405 15-Nov-2022 310 310 1,715 15-May-2023 1,100 310 1,410 15-Nov-2023 304 304 1,714 15-May-2024 1,115 304 1,419 15-Nov-2024 297 297 1,716 15-May-2025 1,130 297 1,427 15-Nov-2025 289 289 1,716 15-May-2026 1,145 289 1,434 15-Nov-2026 280 280 1,714 15-May-2027 1,165 280 1,445 15-Nov-2027 270 270 1,715 15-May-2028 1,185 270 1,455 15-Nov-2028 260 260 1,715 15-May-2029 1,205 260 1,465 15-Nov-2029 249 249 1,714 15-May-2030 1,230 249 1,479 15-Nov-2030 237 237 1,716 15-May-2031 1,250 237 1,487 15-Nov-2031 225 225 1,712 15-May-2032 1,280 225 1,505 15-Nov-2032 211 211 1,716 15-May-2033 1,305 211 1,516 15-Nov-2033 197 197 1,713 15-May-2034 1,335 197 1,532 15-Nov-2034 183 183 1,715 15-May-2035 1,365 183 1,548 15-Nov-2035 167 167 1,715 15-May-2036 1,395 167 1,562 15-Nov-2036 151 151 1,713 15-May-2037 1,430 151 1,581 15-Nov-2037 134 134 1,715 15-May-2038 1,465 134 1,599 15-Nov-2038 117 117 1,716 15-May-2039 1,500 117 1,617 15-Nov-2039 99 99 1,716 15-May-2040 1,535 99 1,634 15-Nov-2040 80 80 1,714 15-May-2041 1,575 80 1,655 15-Nov-2041 61 61 1,716 15-May-2042 1,610 61 1,671 15-Nov-2042 41 41 1,712 15-May-2043 1,650 41 1,691 15-Nov-2043 21 21 1,712 15-May-2044 1,695 21 1,716
- 1,716 33,980$ 10,601$ 44,581$ 44,581$
San Antonio Water SystemWATER SYSTEM JUNIOR LIEN REVENUE BONDS
SERIES 2014C(amounts in thousands)
204
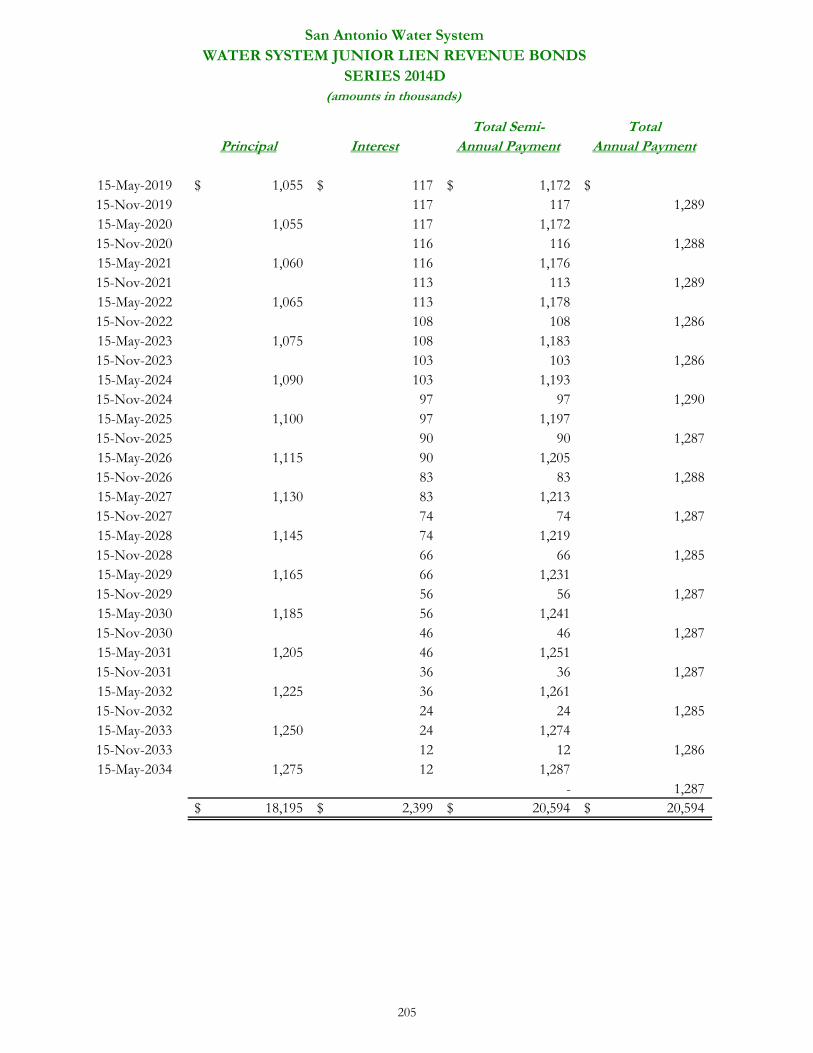
Total Semi- TotalPrincipal Interest Annual Payment Annual Payment
15-May-2019 1,055$ 117$ 1,172$ $15-Nov-2019 117 117 1,289 15-May-2020 1,055 117 1,172 15-Nov-2020 116 116 1,288 15-May-2021 1,060 116 1,176 15-Nov-2021 113 113 1,289 15-May-2022 1,065 113 1,178 15-Nov-2022 108 108 1,286 15-May-2023 1,075 108 1,183 15-Nov-2023 103 103 1,286 15-May-2024 1,090 103 1,193 15-Nov-2024 97 97 1,290 15-May-2025 1,100 97 1,197 15-Nov-2025 90 90 1,287 15-May-2026 1,115 90 1,205 15-Nov-2026 83 83 1,288 15-May-2027 1,130 83 1,213 15-Nov-2027 74 74 1,287 15-May-2028 1,145 74 1,219 15-Nov-2028 66 66 1,285 15-May-2029 1,165 66 1,231 15-Nov-2029 56 56 1,287 15-May-2030 1,185 56 1,241 15-Nov-2030 46 46 1,287 15-May-2031 1,205 46 1,251 15-Nov-2031 36 36 1,287 15-May-2032 1,225 36 1,261 15-Nov-2032 24 24 1,285 15-May-2033 1,250 24 1,274 15-Nov-2033 12 12 1,286 15-May-2034 1,275 12 1,287
- 1,287 18,195$ 2,399$ 20,594$ 20,594$
San Antonio Water SystemWATER SYSTEM JUNIOR LIEN REVENUE BONDS
SERIES 2014D(amounts in thousands)
205
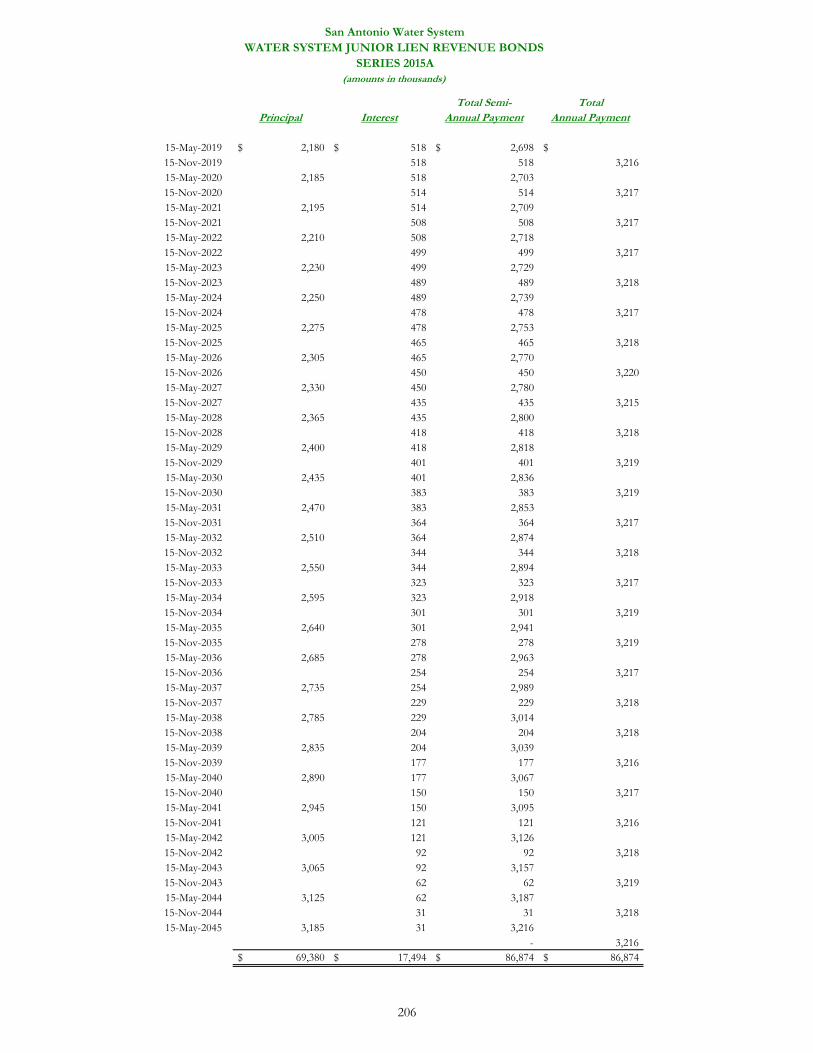
Total Semi- TotalPrincipal Interest Annual Payment Annual Payment
15-May-2019 2,180$ 518$ 2,698$ $15-Nov-2019 518 518 3,216 15-May-2020 2,185 518 2,703 15-Nov-2020 514 514 3,217 15-May-2021 2,195 514 2,709 15-Nov-2021 508 508 3,217 15-May-2022 2,210 508 2,718 15-Nov-2022 499 499 3,217 15-May-2023 2,230 499 2,729 15-Nov-2023 489 489 3,218 15-May-2024 2,250 489 2,739 15-Nov-2024 478 478 3,217 15-May-2025 2,275 478 2,753 15-Nov-2025 465 465 3,218 15-May-2026 2,305 465 2,770 15-Nov-2026 450 450 3,220 15-May-2027 2,330 450 2,780 15-Nov-2027 435 435 3,215 15-May-2028 2,365 435 2,800 15-Nov-2028 418 418 3,218 15-May-2029 2,400 418 2,818 15-Nov-2029 401 401 3,219 15-May-2030 2,435 401 2,836 15-Nov-2030 383 383 3,219 15-May-2031 2,470 383 2,853 15-Nov-2031 364 364 3,217 15-May-2032 2,510 364 2,874 15-Nov-2032 344 344 3,218 15-May-2033 2,550 344 2,894 15-Nov-2033 323 323 3,217 15-May-2034 2,595 323 2,918 15-Nov-2034 301 301 3,219 15-May-2035 2,640 301 2,941 15-Nov-2035 278 278 3,219 15-May-2036 2,685 278 2,963 15-Nov-2036 254 254 3,217 15-May-2037 2,735 254 2,989 15-Nov-2037 229 229 3,218 15-May-2038 2,785 229 3,014 15-Nov-2038 204 204 3,218 15-May-2039 2,835 204 3,039 15-Nov-2039 177 177 3,216 15-May-2040 2,890 177 3,067 15-Nov-2040 150 150 3,217 15-May-2041 2,945 150 3,095 15-Nov-2041 121 121 3,216 15-May-2042 3,005 121 3,126 15-Nov-2042 92 92 3,218 15-May-2043 3,065 92 3,157 15-Nov-2043 62 62 3,219 15-May-2044 3,125 62 3,187 15-Nov-2044 31 31 3,218 15-May-2045 3,185 31 3,216
- 3,216 69,380$ 17,494$ 86,874$ 86,874$
San Antonio Water SystemWATER SYSTEM JUNIOR LIEN REVENUE BONDS
SERIES 2015A(amounts in thousands)
206
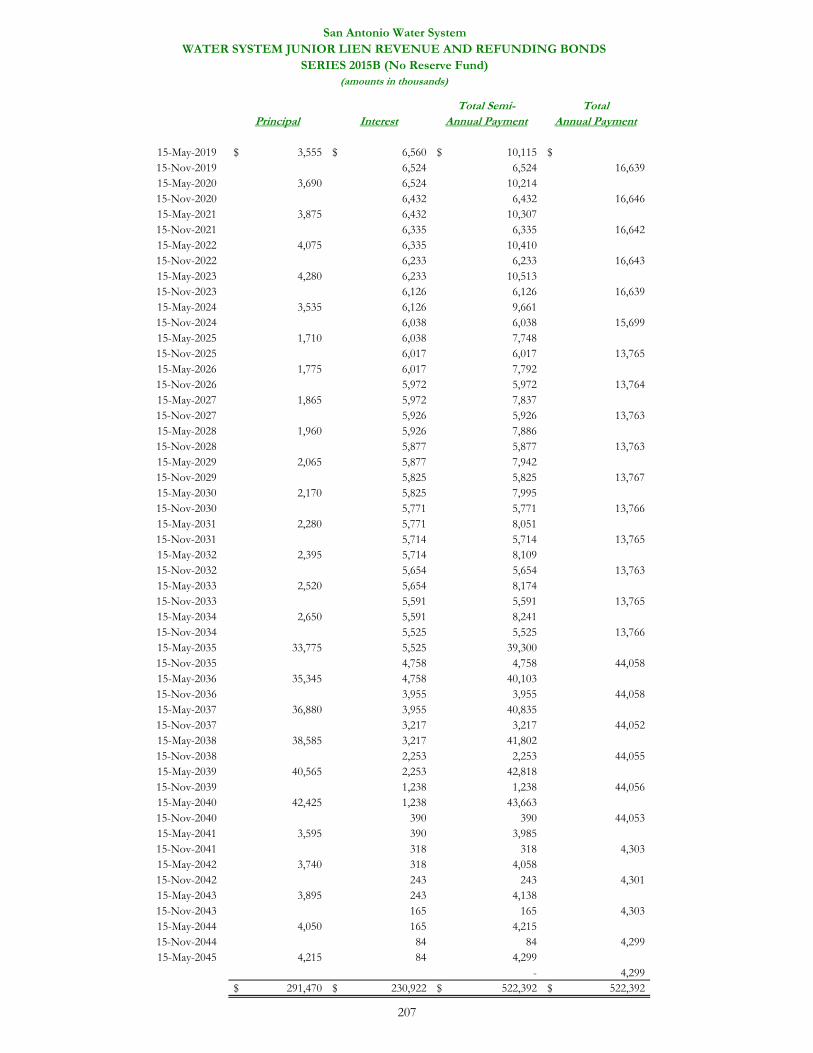
Total Semi- TotalPrincipal Interest Annual Payment Annual Payment
15-May-2019 3,555$ 6,560$ 10,115$ $15-Nov-2019 6,524 6,524 16,639 15-May-2020 3,690 6,524 10,214 15-Nov-2020 6,432 6,432 16,646 15-May-2021 3,875 6,432 10,307 15-Nov-2021 6,335 6,335 16,642 15-May-2022 4,075 6,335 10,410 15-Nov-2022 6,233 6,233 16,643 15-May-2023 4,280 6,233 10,513 15-Nov-2023 6,126 6,126 16,639 15-May-2024 3,535 6,126 9,661 15-Nov-2024 6,038 6,038 15,699 15-May-2025 1,710 6,038 7,748 15-Nov-2025 6,017 6,017 13,765 15-May-2026 1,775 6,017 7,792 15-Nov-2026 5,972 5,972 13,764 15-May-2027 1,865 5,972 7,837 15-Nov-2027 5,926 5,926 13,763 15-May-2028 1,960 5,926 7,886 15-Nov-2028 5,877 5,877 13,763 15-May-2029 2,065 5,877 7,942 15-Nov-2029 5,825 5,825 13,767 15-May-2030 2,170 5,825 7,995 15-Nov-2030 5,771 5,771 13,766 15-May-2031 2,280 5,771 8,051 15-Nov-2031 5,714 5,714 13,765 15-May-2032 2,395 5,714 8,109 15-Nov-2032 5,654 5,654 13,763 15-May-2033 2,520 5,654 8,174 15-Nov-2033 5,591 5,591 13,765 15-May-2034 2,650 5,591 8,241 15-Nov-2034 5,525 5,525 13,766 15-May-2035 33,775 5,525 39,300 15-Nov-2035 4,758 4,758 44,058 15-May-2036 35,345 4,758 40,103 15-Nov-2036 3,955 3,955 44,058 15-May-2037 36,880 3,955 40,835 15-Nov-2037 3,217 3,217 44,052 15-May-2038 38,585 3,217 41,802 15-Nov-2038 2,253 2,253 44,055 15-May-2039 40,565 2,253 42,818 15-Nov-2039 1,238 1,238 44,056 15-May-2040 42,425 1,238 43,663 15-Nov-2040 390 390 44,053 15-May-2041 3,595 390 3,985 15-Nov-2041 318 318 4,303 15-May-2042 3,740 318 4,058 15-Nov-2042 243 243 4,301 15-May-2043 3,895 243 4,138 15-Nov-2043 165 165 4,303 15-May-2044 4,050 165 4,215 15-Nov-2044 84 84 4,299 15-May-2045 4,215 84 4,299
- 4,299 291,470$ 230,922$ 522,392$ 522,392$
San Antonio Water SystemWATER SYSTEM JUNIOR LIEN REVENUE AND REFUNDING BONDS
SERIES 2015B (No Reserve Fund)(amounts in thousands)
207
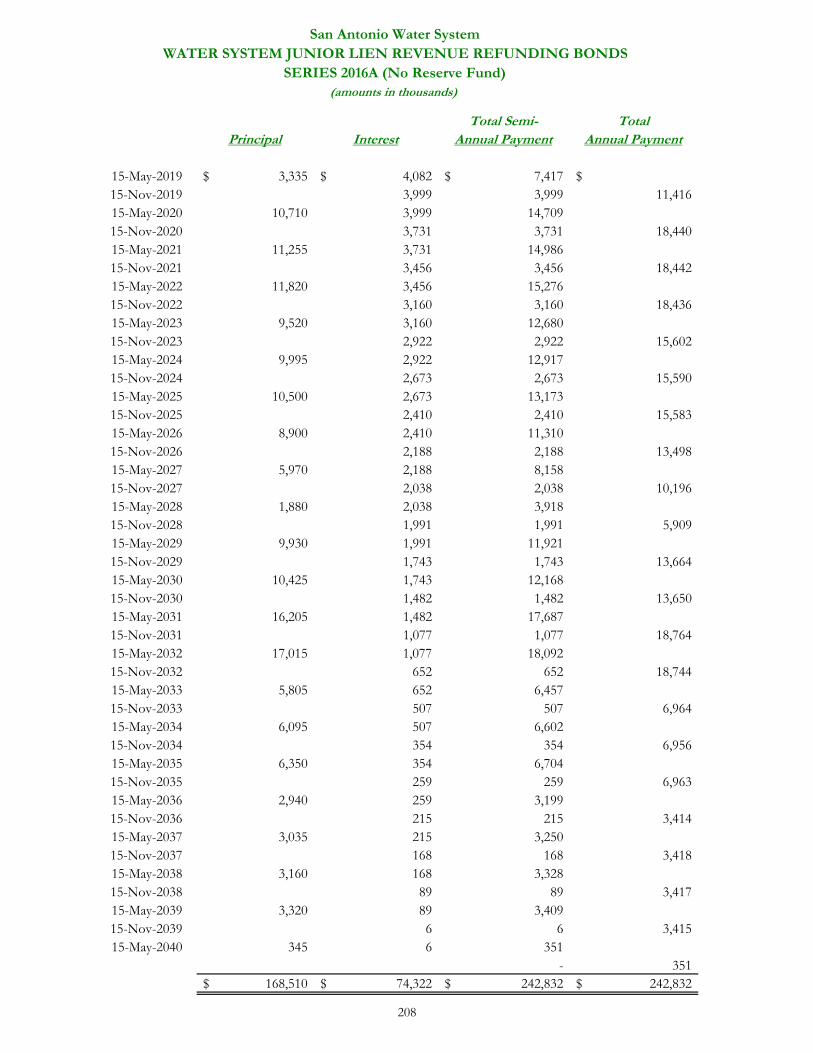
Total Semi- TotalPrincipal Interest Annual Payment Annual Payment
15-May-2019 3,335$ 4,082$ 7,417$ $15-Nov-2019 3,999 3,999 11,416 15-May-2020 10,710 3,999 14,709 15-Nov-2020 3,731 3,731 18,440 15-May-2021 11,255 3,731 14,986 15-Nov-2021 3,456 3,456 18,442 15-May-2022 11,820 3,456 15,276 15-Nov-2022 3,160 3,160 18,436 15-May-2023 9,520 3,160 12,680 15-Nov-2023 2,922 2,922 15,602 15-May-2024 9,995 2,922 12,917 15-Nov-2024 2,673 2,673 15,590 15-May-2025 10,500 2,673 13,173 15-Nov-2025 2,410 2,410 15,583 15-May-2026 8,900 2,410 11,310 15-Nov-2026 2,188 2,188 13,498 15-May-2027 5,970 2,188 8,158 15-Nov-2027 2,038 2,038 10,196 15-May-2028 1,880 2,038 3,918 15-Nov-2028 1,991 1,991 5,909 15-May-2029 9,930 1,991 11,921 15-Nov-2029 1,743 1,743 13,664 15-May-2030 10,425 1,743 12,168 15-Nov-2030 1,482 1,482 13,650 15-May-2031 16,205 1,482 17,687 15-Nov-2031 1,077 1,077 18,764 15-May-2032 17,015 1,077 18,092 15-Nov-2032 652 652 18,744 15-May-2033 5,805 652 6,457 15-Nov-2033 507 507 6,964 15-May-2034 6,095 507 6,602 15-Nov-2034 354 354 6,956 15-May-2035 6,350 354 6,704 15-Nov-2035 259 259 6,963 15-May-2036 2,940 259 3,199 15-Nov-2036 215 215 3,414 15-May-2037 3,035 215 3,250 15-Nov-2037 168 168 3,418 15-May-2038 3,160 168 3,328 15-Nov-2038 89 89 3,417 15-May-2039 3,320 89 3,409 15-Nov-2039 6 6 3,415 15-May-2040 345 6 351
- 351 168,510$ 74,322$ 242,832$ 242,832$
San Antonio Water SystemWATER SYSTEM JUNIOR LIEN REVENUE REFUNDING BONDS
SERIES 2016A (No Reserve Fund)(amounts in thousands)
208
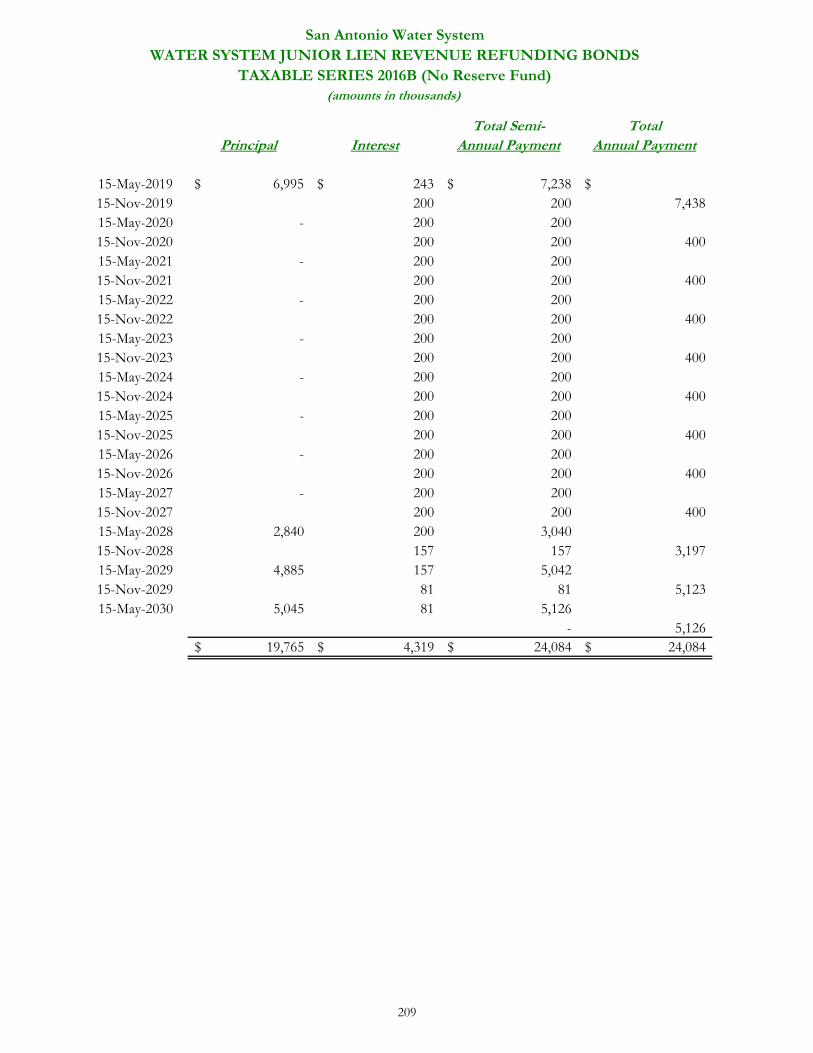
Total Semi- TotalPrincipal Interest Annual Payment Annual Payment
15-May-2019 6,995$ 243$ 7,238$ $15-Nov-2019 200 200 7,438 15-May-2020 - 200 200 15-Nov-2020 200 200 400 15-May-2021 - 200 200 15-Nov-2021 200 200 400 15-May-2022 - 200 200 15-Nov-2022 200 200 400 15-May-2023 - 200 200 15-Nov-2023 200 200 400 15-May-2024 - 200 200 15-Nov-2024 200 200 400 15-May-2025 - 200 200 15-Nov-2025 200 200 400 15-May-2026 - 200 200 15-Nov-2026 200 200 400 15-May-2027 - 200 200 15-Nov-2027 200 200 400 15-May-2028 2,840 200 3,040 15-Nov-2028 157 157 3,197 15-May-2029 4,885 157 5,042 15-Nov-2029 81 81 5,123 15-May-2030 5,045 81 5,126
- 5,126 19,765$ 4,319$ 24,084$ 24,084$
San Antonio Water SystemWATER SYSTEM JUNIOR LIEN REVENUE REFUNDING BONDS
TAXABLE SERIES 2016B (No Reserve Fund)(amounts in thousands)
209
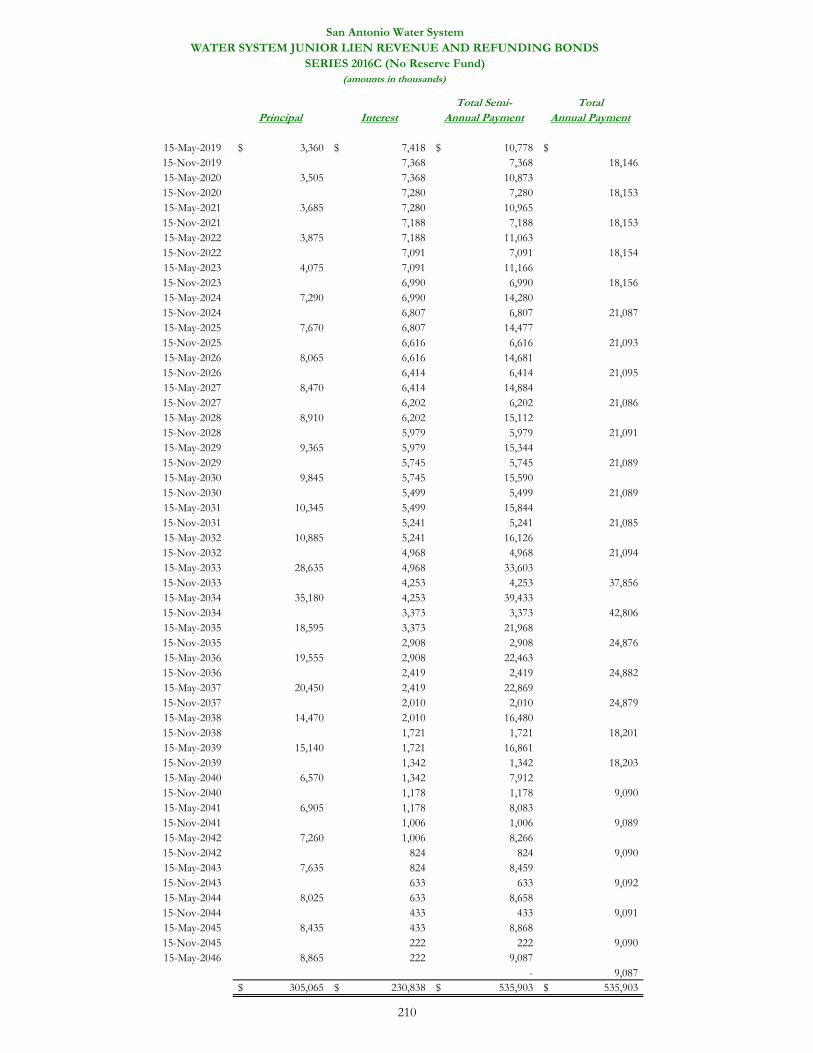
Total Semi- TotalPrincipal Interest Annual Payment Annual Payment
15-May-2019 3,360$ 7,418$ 10,778$ $15-Nov-2019 7,368 7,368 18,146 15-May-2020 3,505 7,368 10,873 15-Nov-2020 7,280 7,280 18,153 15-May-2021 3,685 7,280 10,965 15-Nov-2021 7,188 7,188 18,153 15-May-2022 3,875 7,188 11,063 15-Nov-2022 7,091 7,091 18,154 15-May-2023 4,075 7,091 11,166 15-Nov-2023 6,990 6,990 18,156 15-May-2024 7,290 6,990 14,280 15-Nov-2024 6,807 6,807 21,087 15-May-2025 7,670 6,807 14,477 15-Nov-2025 6,616 6,616 21,093 15-May-2026 8,065 6,616 14,681 15-Nov-2026 6,414 6,414 21,095 15-May-2027 8,470 6,414 14,884 15-Nov-2027 6,202 6,202 21,086 15-May-2028 8,910 6,202 15,112 15-Nov-2028 5,979 5,979 21,091 15-May-2029 9,365 5,979 15,344 15-Nov-2029 5,745 5,745 21,089 15-May-2030 9,845 5,745 15,590 15-Nov-2030 5,499 5,499 21,089 15-May-2031 10,345 5,499 15,844 15-Nov-2031 5,241 5,241 21,085 15-May-2032 10,885 5,241 16,126 15-Nov-2032 4,968 4,968 21,094 15-May-2033 28,635 4,968 33,603 15-Nov-2033 4,253 4,253 37,856 15-May-2034 35,180 4,253 39,433 15-Nov-2034 3,373 3,373 42,806 15-May-2035 18,595 3,373 21,968 15-Nov-2035 2,908 2,908 24,876 15-May-2036 19,555 2,908 22,463 15-Nov-2036 2,419 2,419 24,882 15-May-2037 20,450 2,419 22,869 15-Nov-2037 2,010 2,010 24,879 15-May-2038 14,470 2,010 16,480 15-Nov-2038 1,721 1,721 18,201 15-May-2039 15,140 1,721 16,861 15-Nov-2039 1,342 1,342 18,203 15-May-2040 6,570 1,342 7,912 15-Nov-2040 1,178 1,178 9,090 15-May-2041 6,905 1,178 8,083 15-Nov-2041 1,006 1,006 9,089 15-May-2042 7,260 1,006 8,266 15-Nov-2042 824 824 9,090 15-May-2043 7,635 824 8,459 15-Nov-2043 633 633 9,092 15-May-2044 8,025 633 8,658 15-Nov-2044 433 433 9,091 15-May-2045 8,435 433 8,868 15-Nov-2045 222 222 9,090 15-May-2046 8,865 222 9,087
- 9,087 305,065$ 230,838$ 535,903$ 535,903$
San Antonio Water SystemWATER SYSTEM JUNIOR LIEN REVENUE AND REFUNDING BONDS
SERIES 2016C (No Reserve Fund)(amounts in thousands)
210
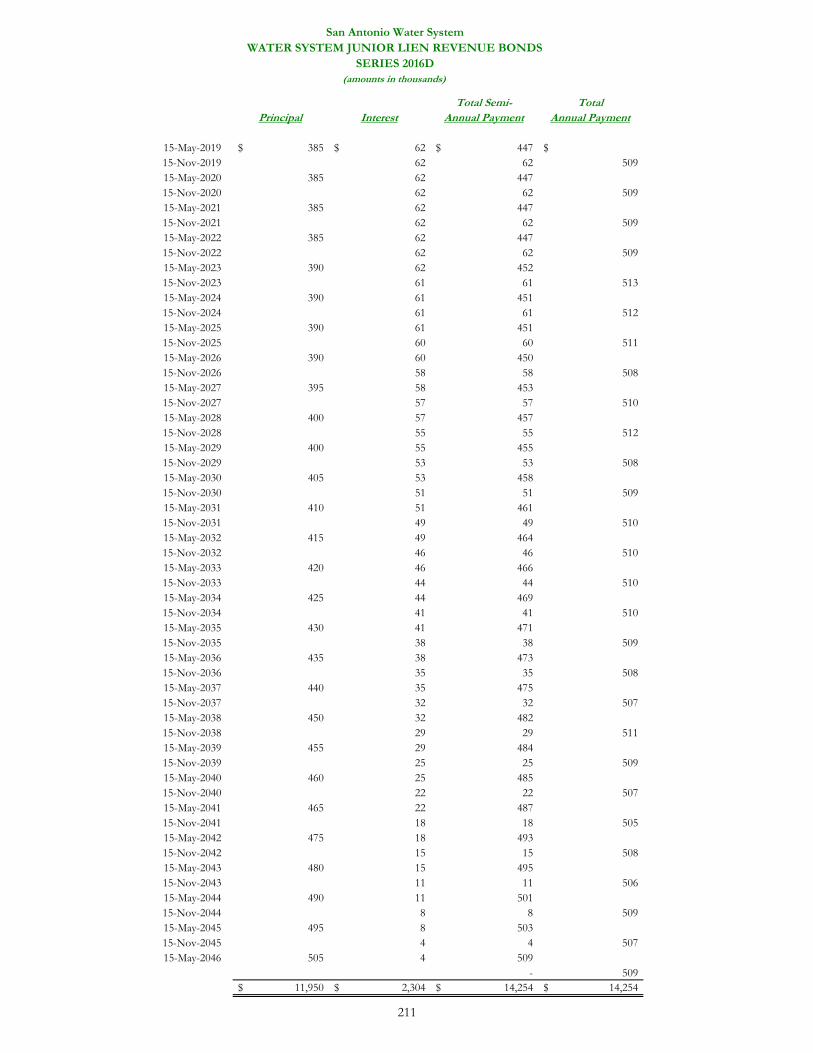
Total Semi- TotalPrincipal Interest Annual Payment Annual Payment
15-May-2019 385$ 62$ 447$ $15-Nov-2019 62 62 509 15-May-2020 385 62 447 15-Nov-2020 62 62 509 15-May-2021 385 62 447 15-Nov-2021 62 62 509 15-May-2022 385 62 447 15-Nov-2022 62 62 509 15-May-2023 390 62 452 15-Nov-2023 61 61 513 15-May-2024 390 61 451 15-Nov-2024 61 61 512 15-May-2025 390 61 451 15-Nov-2025 60 60 511 15-May-2026 390 60 450 15-Nov-2026 58 58 508 15-May-2027 395 58 453 15-Nov-2027 57 57 510 15-May-2028 400 57 457 15-Nov-2028 55 55 512 15-May-2029 400 55 455 15-Nov-2029 53 53 508 15-May-2030 405 53 458 15-Nov-2030 51 51 509 15-May-2031 410 51 461 15-Nov-2031 49 49 510 15-May-2032 415 49 464 15-Nov-2032 46 46 510 15-May-2033 420 46 466 15-Nov-2033 44 44 510 15-May-2034 425 44 469 15-Nov-2034 41 41 510 15-May-2035 430 41 471 15-Nov-2035 38 38 509 15-May-2036 435 38 473 15-Nov-2036 35 35 508 15-May-2037 440 35 475 15-Nov-2037 32 32 507 15-May-2038 450 32 482 15-Nov-2038 29 29 511 15-May-2039 455 29 484 15-Nov-2039 25 25 509 15-May-2040 460 25 485 15-Nov-2040 22 22 507 15-May-2041 465 22 487 15-Nov-2041 18 18 505 15-May-2042 475 18 493 15-Nov-2042 15 15 508 15-May-2043 480 15 495 15-Nov-2043 11 11 506 15-May-2044 490 11 501 15-Nov-2044 8 8 509 15-May-2045 495 8 503 15-Nov-2045 4 4 507 15-May-2046 505 4 509
- 509 11,950$ 2,304$ 14,254$ 14,254$
San Antonio Water SystemWATER SYSTEM JUNIOR LIEN REVENUE BONDS
SERIES 2016D(amounts in thousands)
211
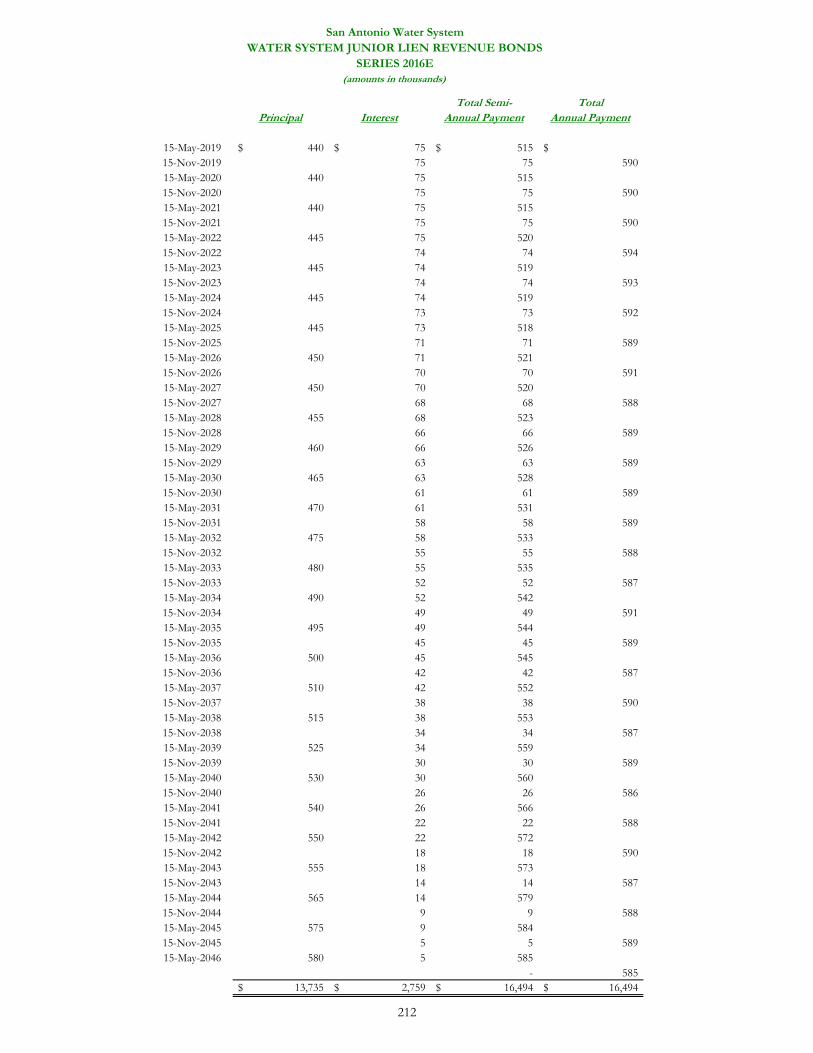
Total Semi- TotalPrincipal Interest Annual Payment Annual Payment
15-May-2019 440$ 75$ 515$ $15-Nov-2019 75 75 590 15-May-2020 440 75 515 15-Nov-2020 75 75 590 15-May-2021 440 75 515 15-Nov-2021 75 75 590 15-May-2022 445 75 520 15-Nov-2022 74 74 594 15-May-2023 445 74 519 15-Nov-2023 74 74 593 15-May-2024 445 74 519 15-Nov-2024 73 73 592 15-May-2025 445 73 518 15-Nov-2025 71 71 589 15-May-2026 450 71 521 15-Nov-2026 70 70 591 15-May-2027 450 70 520 15-Nov-2027 68 68 588 15-May-2028 455 68 523 15-Nov-2028 66 66 589 15-May-2029 460 66 526 15-Nov-2029 63 63 589 15-May-2030 465 63 528 15-Nov-2030 61 61 589 15-May-2031 470 61 531 15-Nov-2031 58 58 589 15-May-2032 475 58 533 15-Nov-2032 55 55 588 15-May-2033 480 55 535 15-Nov-2033 52 52 587 15-May-2034 490 52 542 15-Nov-2034 49 49 591 15-May-2035 495 49 544 15-Nov-2035 45 45 589 15-May-2036 500 45 545 15-Nov-2036 42 42 587 15-May-2037 510 42 552 15-Nov-2037 38 38 590 15-May-2038 515 38 553 15-Nov-2038 34 34 587 15-May-2039 525 34 559 15-Nov-2039 30 30 589 15-May-2040 530 30 560 15-Nov-2040 26 26 586 15-May-2041 540 26 566 15-Nov-2041 22 22 588 15-May-2042 550 22 572 15-Nov-2042 18 18 590 15-May-2043 555 18 573 15-Nov-2043 14 14 587 15-May-2044 565 14 579 15-Nov-2044 9 9 588 15-May-2045 575 9 584 15-Nov-2045 5 5 589 15-May-2046 580 5 585
- 585 13,735$ 2,759$ 16,494$ 16,494$
San Antonio Water SystemWATER SYSTEM JUNIOR LIEN REVENUE BONDS
SERIES 2016E(amounts in thousands)
212
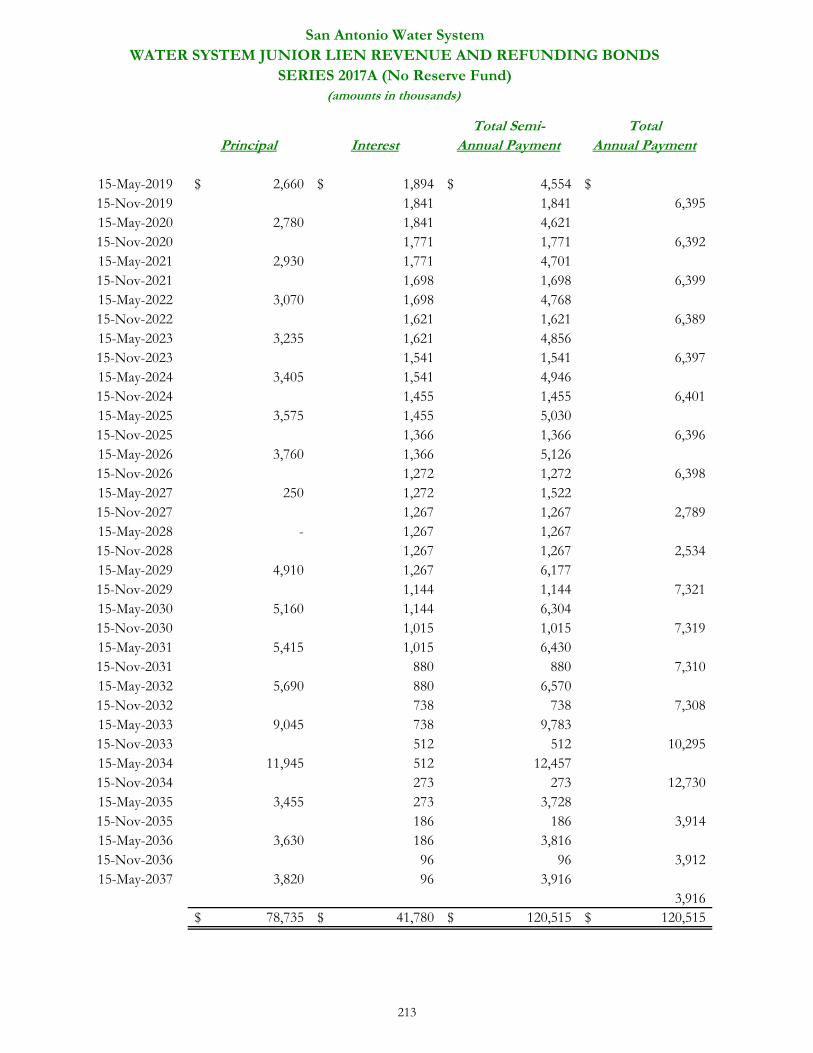
Total Semi- TotalPrincipal Interest Annual Payment Annual Payment
15-May-2019 2,660$ 1,894$ 4,554$ $15-Nov-2019 1,841 1,841 6,395 15-May-2020 2,780 1,841 4,621 15-Nov-2020 1,771 1,771 6,392 15-May-2021 2,930 1,771 4,701 15-Nov-2021 1,698 1,698 6,399 15-May-2022 3,070 1,698 4,768 15-Nov-2022 1,621 1,621 6,389 15-May-2023 3,235 1,621 4,856 15-Nov-2023 1,541 1,541 6,397 15-May-2024 3,405 1,541 4,946 15-Nov-2024 1,455 1,455 6,401 15-May-2025 3,575 1,455 5,030 15-Nov-2025 1,366 1,366 6,396 15-May-2026 3,760 1,366 5,126 15-Nov-2026 1,272 1,272 6,398 15-May-2027 250 1,272 1,522 15-Nov-2027 1,267 1,267 2,789 15-May-2028 - 1,267 1,267 15-Nov-2028 1,267 1,267 2,534 15-May-2029 4,910 1,267 6,177 15-Nov-2029 1,144 1,144 7,321 15-May-2030 5,160 1,144 6,304 15-Nov-2030 1,015 1,015 7,319 15-May-2031 5,415 1,015 6,430 15-Nov-2031 880 880 7,310 15-May-2032 5,690 880 6,570 15-Nov-2032 738 738 7,308 15-May-2033 9,045 738 9,783 15-Nov-2033 512 512 10,295 15-May-2034 11,945 512 12,457 15-Nov-2034 273 273 12,730 15-May-2035 3,455 273 3,728 15-Nov-2035 186 186 3,914 15-May-2036 3,630 186 3,816 15-Nov-2036 96 96 3,912 15-May-2037 3,820 96 3,916
3,916 78,735$ 41,780$ 120,515$ 120,515$
San Antonio Water SystemWATER SYSTEM JUNIOR LIEN REVENUE AND REFUNDING BONDS
SERIES 2017A (No Reserve Fund)(amounts in thousands)
213
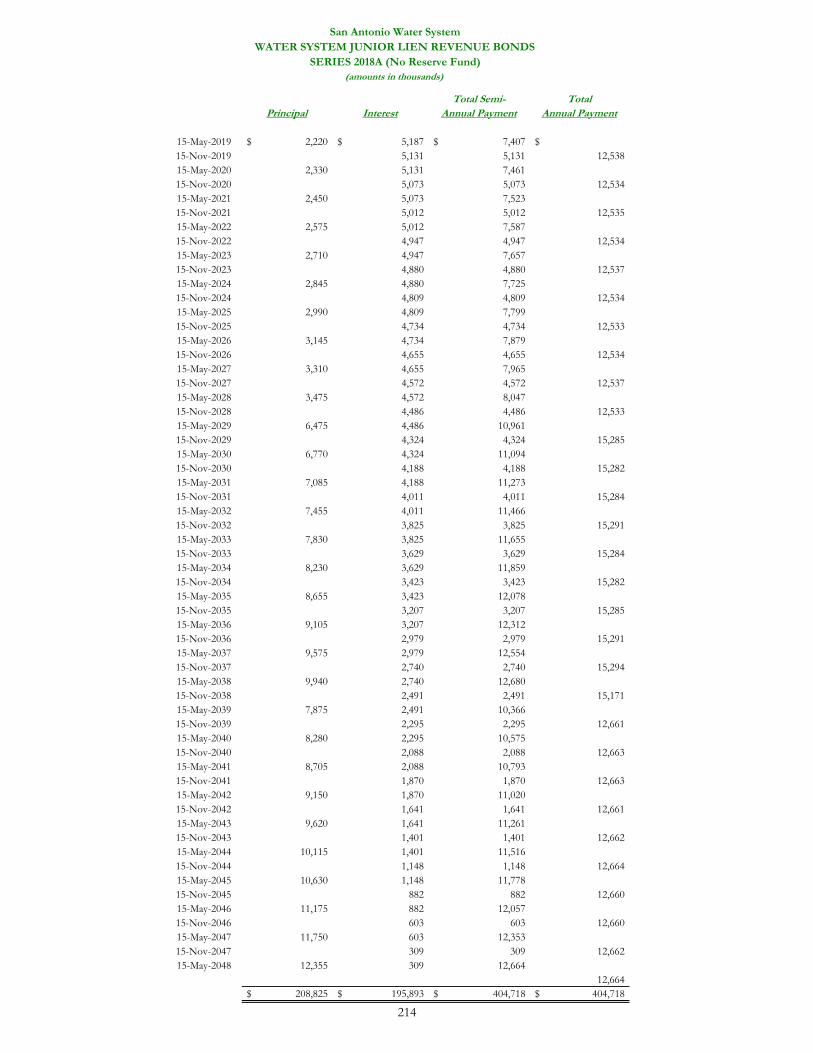
Total Semi- TotalPrincipal Interest Annual Payment Annual Payment
15-May-2019 2,220$ 5,187$ 7,407$ $15-Nov-2019 5,131 5,131 12,538 15-May-2020 2,330 5,131 7,461 15-Nov-2020 5,073 5,073 12,534 15-May-2021 2,450 5,073 7,523 15-Nov-2021 5,012 5,012 12,535 15-May-2022 2,575 5,012 7,587 15-Nov-2022 4,947 4,947 12,534 15-May-2023 2,710 4,947 7,657 15-Nov-2023 4,880 4,880 12,537 15-May-2024 2,845 4,880 7,725 15-Nov-2024 4,809 4,809 12,534 15-May-2025 2,990 4,809 7,799 15-Nov-2025 4,734 4,734 12,533 15-May-2026 3,145 4,734 7,879 15-Nov-2026 4,655 4,655 12,534 15-May-2027 3,310 4,655 7,965 15-Nov-2027 4,572 4,572 12,537 15-May-2028 3,475 4,572 8,047 15-Nov-2028 4,486 4,486 12,533 15-May-2029 6,475 4,486 10,961 15-Nov-2029 4,324 4,324 15,285 15-May-2030 6,770 4,324 11,094 15-Nov-2030 4,188 4,188 15,282 15-May-2031 7,085 4,188 11,273 15-Nov-2031 4,011 4,011 15,284 15-May-2032 7,455 4,011 11,466 15-Nov-2032 3,825 3,825 15,291 15-May-2033 7,830 3,825 11,655 15-Nov-2033 3,629 3,629 15,284 15-May-2034 8,230 3,629 11,859 15-Nov-2034 3,423 3,423 15,282 15-May-2035 8,655 3,423 12,078 15-Nov-2035 3,207 3,207 15,285 15-May-2036 9,105 3,207 12,312 15-Nov-2036 2,979 2,979 15,291 15-May-2037 9,575 2,979 12,554 15-Nov-2037 2,740 2,740 15,294 15-May-2038 9,940 2,740 12,680 15-Nov-2038 2,491 2,491 15,171 15-May-2039 7,875 2,491 10,366 15-Nov-2039 2,295 2,295 12,661 15-May-2040 8,280 2,295 10,575 15-Nov-2040 2,088 2,088 12,663 15-May-2041 8,705 2,088 10,793 15-Nov-2041 1,870 1,870 12,663 15-May-2042 9,150 1,870 11,020 15-Nov-2042 1,641 1,641 12,661 15-May-2043 9,620 1,641 11,261 15-Nov-2043 1,401 1,401 12,662 15-May-2044 10,115 1,401 11,516 15-Nov-2044 1,148 1,148 12,664 15-May-2045 10,630 1,148 11,778 15-Nov-2045 882 882 12,660 15-May-2046 11,175 882 12,057 15-Nov-2046 603 603 12,660 15-May-2047 11,750 603 12,353 15-Nov-2047 309 309 12,662 15-May-2048 12,355 309 12,664
12,664 208,825$ 195,893$ 404,718$ 404,718$
San Antonio Water SystemWATER SYSTEM JUNIOR LIEN REVENUE BONDS
SERIES 2018A (No Reserve Fund)(amounts in thousands)
214
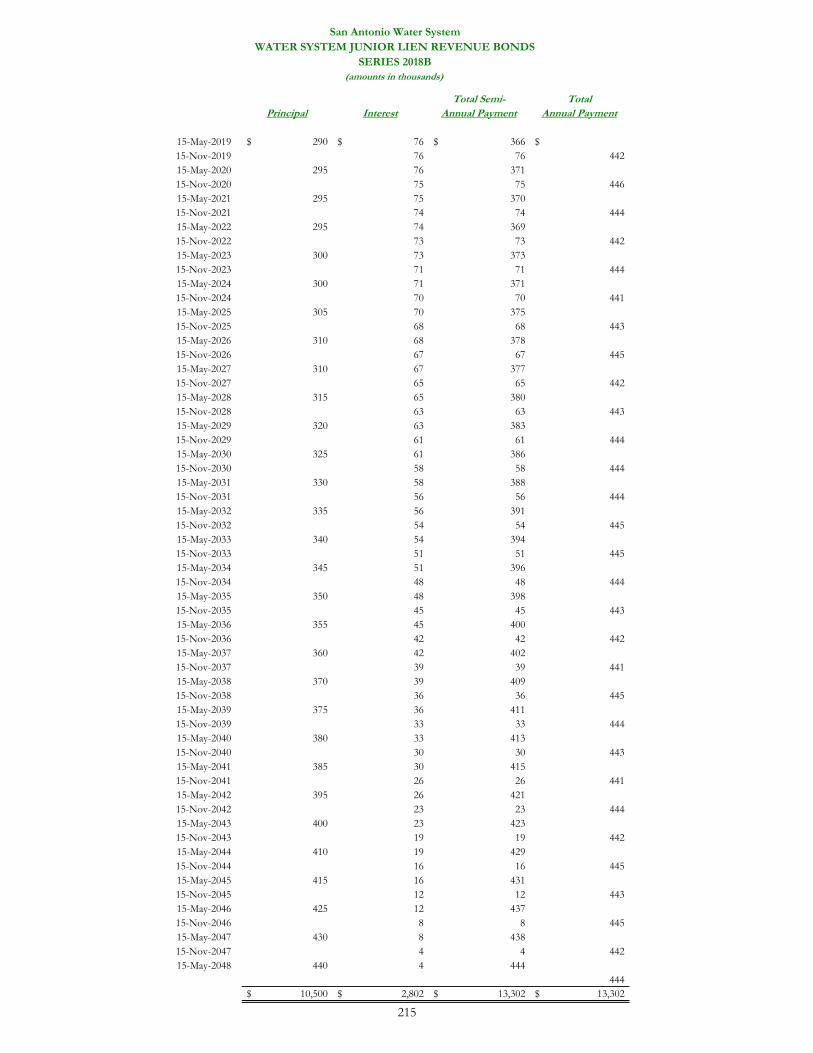
Total Semi- TotalPrincipal Interest Annual Payment Annual Payment
15-May-2019 290$ 76$ 366$ $15-Nov-2019 76 76 442 15-May-2020 295 76 371 15-Nov-2020 75 75 446 15-May-2021 295 75 370 15-Nov-2021 74 74 444 15-May-2022 295 74 369 15-Nov-2022 73 73 442 15-May-2023 300 73 373 15-Nov-2023 71 71 444 15-May-2024 300 71 371 15-Nov-2024 70 70 441 15-May-2025 305 70 375 15-Nov-2025 68 68 443 15-May-2026 310 68 378 15-Nov-2026 67 67 445 15-May-2027 310 67 377 15-Nov-2027 65 65 442 15-May-2028 315 65 380 15-Nov-2028 63 63 443 15-May-2029 320 63 383 15-Nov-2029 61 61 444 15-May-2030 325 61 386 15-Nov-2030 58 58 444 15-May-2031 330 58 388 15-Nov-2031 56 56 444 15-May-2032 335 56 391 15-Nov-2032 54 54 445 15-May-2033 340 54 394 15-Nov-2033 51 51 445 15-May-2034 345 51 396 15-Nov-2034 48 48 444 15-May-2035 350 48 398 15-Nov-2035 45 45 443 15-May-2036 355 45 400 15-Nov-2036 42 42 442 15-May-2037 360 42 402 15-Nov-2037 39 39 441 15-May-2038 370 39 409 15-Nov-2038 36 36 445 15-May-2039 375 36 411 15-Nov-2039 33 33 444 15-May-2040 380 33 413 15-Nov-2040 30 30 443 15-May-2041 385 30 415 15-Nov-2041 26 26 441 15-May-2042 395 26 421 15-Nov-2042 23 23 444 15-May-2043 400 23 423 15-Nov-2043 19 19 442 15-May-2044 410 19 429 15-Nov-2044 16 16 445 15-May-2045 415 16 431 15-Nov-2045 12 12 443 15-May-2046 425 12 437 15-Nov-2046 8 8 445 15-May-2047 430 8 438 15-Nov-2047 4 4 442 15-May-2048 440 4 444
444 10,500$ 2,802$ 13,302$ 13,302$
San Antonio Water SystemWATER SYSTEM JUNIOR LIEN REVENUE BONDS
SERIES 2018B(amounts in thousands)
215
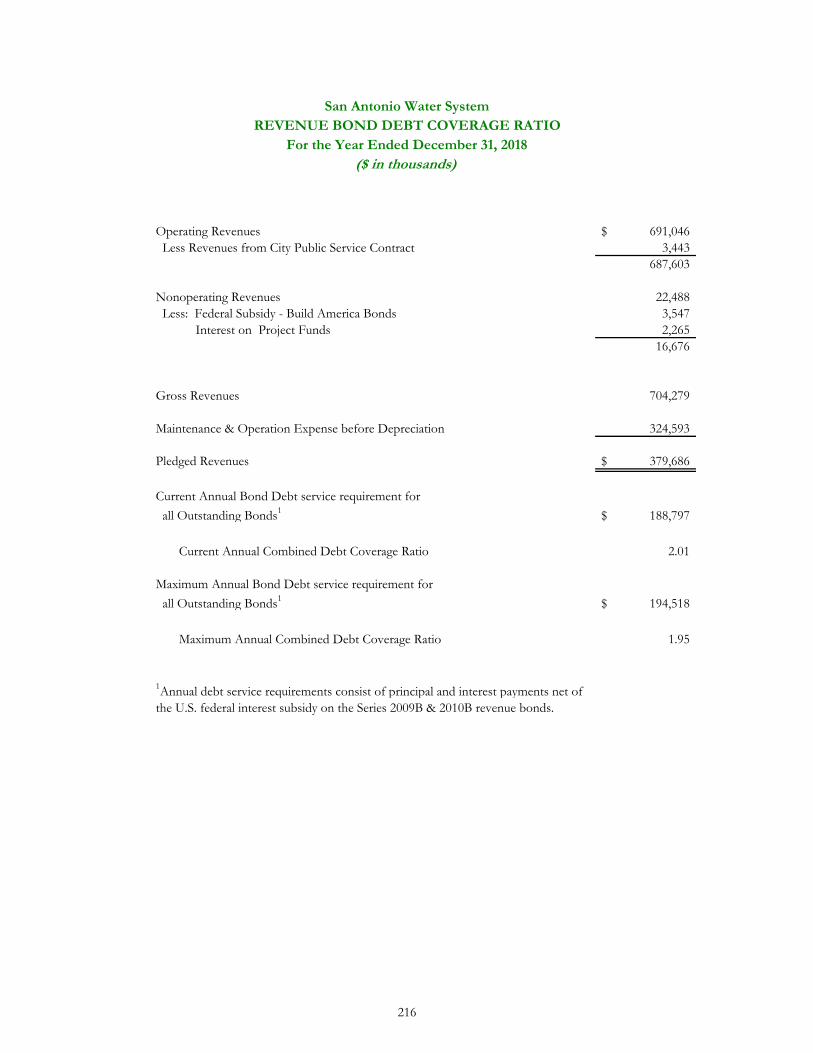
Operating Revenues 691,046$ Less Revenues from City Public Service Contract 3,443
687,603
Nonoperating Revenues 22,488 Less: Federal Subsidy - Build America Bonds 3,547 Interest on Project Funds 2,265
16,676
Gross Revenues 704,279
Maintenance & Operation Expense before Depreciation 324,593
Pledged Revenues 379,686$
Current Annual Bond Debt service requirement for all Outstanding Bonds1 188,797$
Current Annual Combined Debt Coverage Ratio 2.01
Maximum Annual Bond Debt service requirement for all Outstanding Bonds1 194,518$
Maximum Annual Combined Debt Coverage Ratio 1.95
1Annual debt service requirements consist of principal and interest payments net of the U.S. federal interest subsidy on the Series 2009B & 2010B revenue bonds.
San Antonio Water SystemREVENUE BOND DEBT COVERAGE RATIO
($ in thousands)For the Year Ended December 31, 2018
216

2800 U.S. Hwy 281 North • P.O. Box 2449 • San Antonio, Texas 78298-2449 • 210-704-SAWS (7297) • www.saws.org