Embed Size (px)
Citation preview
year ended December 31, 2016
ANNUALFINANCIALREPORT
gruppocln.com
Corso Susa, 13/1510040 Caselette (TO)
Italy

2
C.L.N. Coils Lamiere Nastri S.p.A.Corso Susa, 13/15 • 10040 Caselette (TO) • ItalyFully Paid-up Share Capital Euro 235,000,000R.E.A. n. 400722 C.C.I.A.A. TOM TO 000538 • Registro ImpreseC.F. 00521230011VAT IT00521230011
CONTENTS
01 Letter to the shareholders
02 Corporate bodies
03 Summary of Group results
MAnAGEMEnT REPORT05 CLn Group and the market
08 Revenues by geographical area and division
09 Consolidated results
13 Structure of the Group - Main operating entities
14 Information concerning risks and uncertanties
18 Risk management system
19 Research and development
21 Environment, health and safety
24 Other information
COnSOLIdATEd FInAnCIAL STATEMEnTS28 Consolidated statement of financial position
29 Consolidated statement of comprehensive income
30 Consolidated statement of cash flows
31 Consolidated statement of changes in net equity
nOTES TO ThE FInAnCIAL STATEMEnTS32 notes to the consolidated financial statements
AudITORS’ REPORT83 Auditors’ report
1
2
34
1Annual Financial Report 2016
LEttEr to thE ShArEhoLdErS
dear Shareholders,
2016 has been a year of stabilization for the Group’s new operational structure, which just came out of last year’s reorganization activities. The operative results we achieved during the past year, partially thanks to such reorganization, confirm a positive growth trend in our turnover as well as in our profitability.
In particular, among the Group’s consolidated results for 2016 are a 4.1% increase in the revenues compared to 2015, with a consequent improvement of the operating margin in terms of adjusted EBITdA (which increased by EuR 4,801 thousand). Moreover, in 2016 the Group achieved a positive net result of EuR 2,381 thousand (with EuR 1,232 thousand being the result attributable to the Group), entirely due to the Group’s continuing operations.
The revenue growth was surely aided by the positive automotive market trend in Europe, which is increasingly becoming the Group’s target market. 2016 saw an increase in private and commercial vehicle registrations, for the third consecutive year. This year’s growth amounted to 7.3%, for a total of 16.6 million registered vehicles against 15.4 million in 2015.
Furthermore, the Group continued its investments policy to support and promote its clients’ development. The growth projects that required investments in 2016 were mostly located in Germany, Italy and France. The Group’s results only partially profited from such investments so far, which lays the basis for further growth in the coming years.
Finally, the first results of Europe’s automotive market in 2017 seem to be quite positive (+8.4% vehicle registrations in March compared to 2015). This allows the Group to proceed with short and medium-long term planning for the future with a certain optimism.
2
CorporAtE bodiESIn accordance with the resolution of the Shareholder’s Meeting of C.L.n. S.p.A., held on 24 June 2016, the Corporate Bodies are constituted as follows as of 31 december 2016.
boArd oF dirECtorS
ChAirMAN Aurora Magnetto
MANAGiNG dirECtorS ANd CEo Aurora Magnetto
Gabriele Perris Magnetto
MANAGiNG dirECtorS Vincenzo Perris
dirECtorS Mario Astengo
Amulio Cipriani
Gianni Coda
Nishio Fumitaka
Vijay Goyal
Alain Marie Legrix de la Salle
Raffaella Perris Magnetto
José Manuel Arias García
boArd oF AUditorS (*)
ChAirMAN Colin Shearer Johnston
StAtUtorY AUditorS Ivana Clara Azzollini
Mauro Messi
SUbStitUtE AUditorS Alessandra Odorisio
Riccardo Ronchi
(*) Serving the Role of Internal Control Committee and Auditing as per art. 19 Legislative Decree 39/2010
AUdit CoMpANY
PricewaterhouseCoopers S.p.A.
3Annual Financial Report 2016
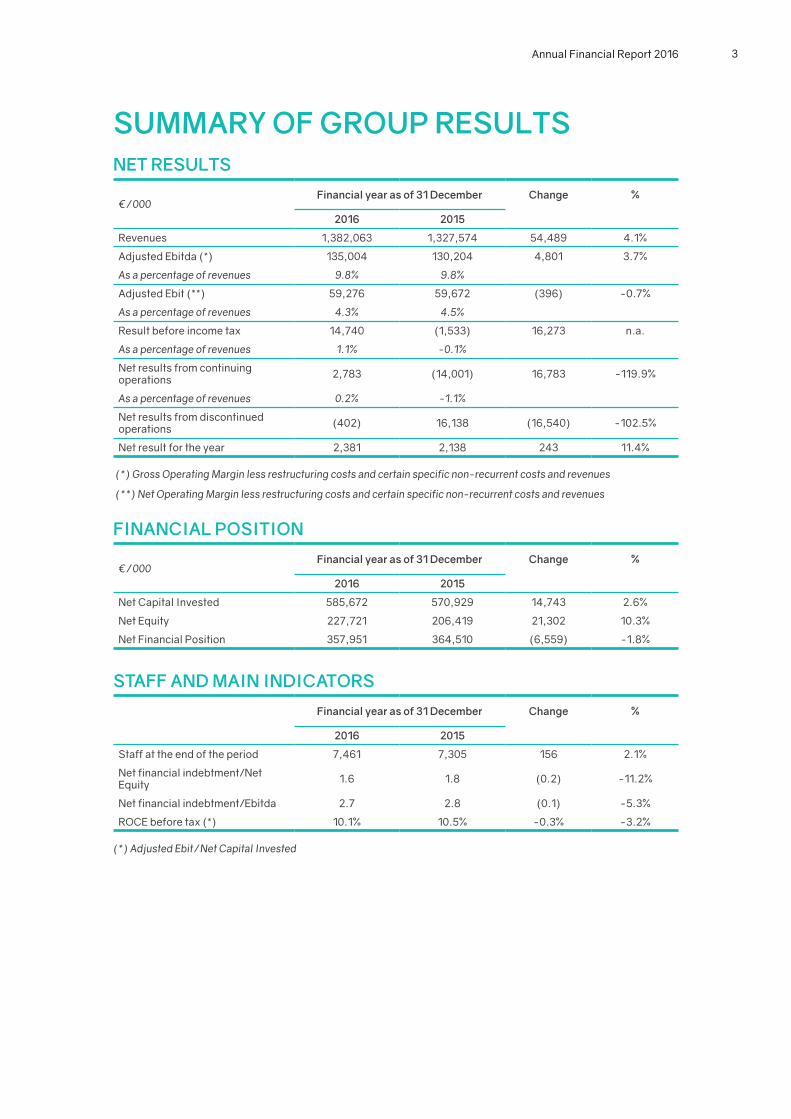
SUMMArY oF GroUp rESULtSNEt rESULtS
€/000Financial year as of 31 december Change %
2016 2015
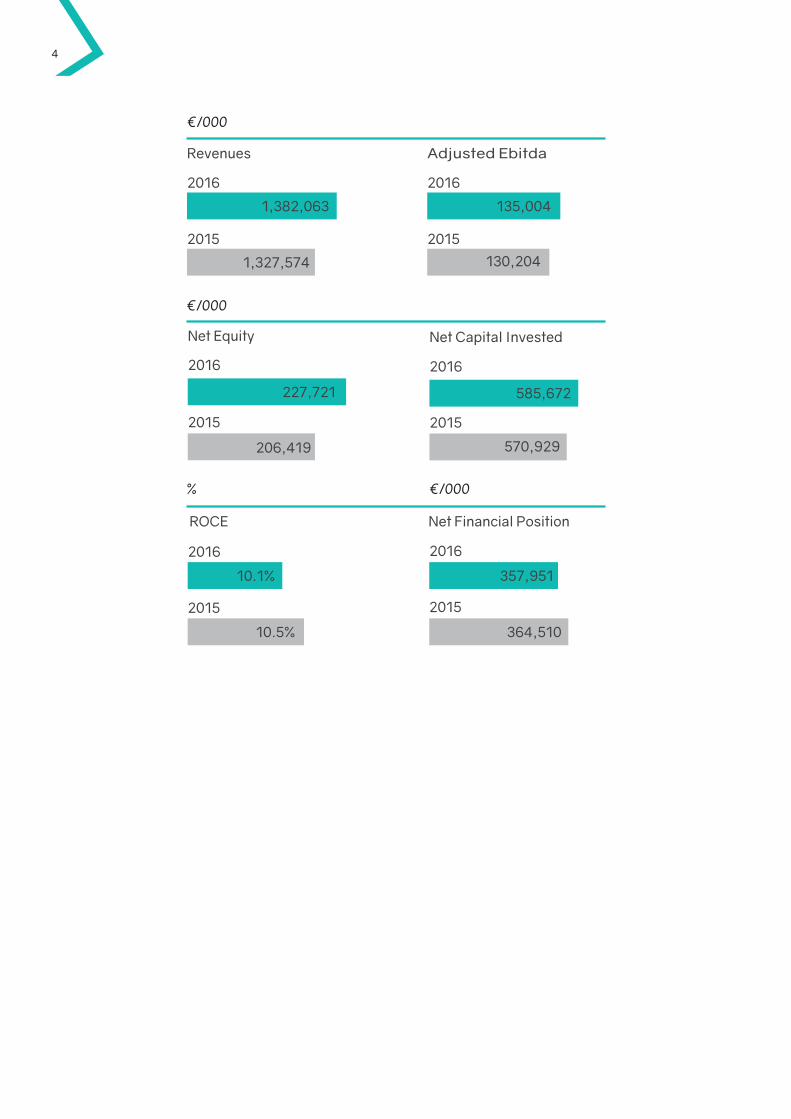
Revenues 1,382,063 1,327,574 54,489 4.1%
Adjusted Ebitda (*) 135,004 130,204 4,801 3.7%
As a percentage of revenues 9.8% 9.8%
Adjusted Ebit (**) 59,276 59,672 (396) -0.7%
As a percentage of revenues 4.3% 4.5%
Result before income tax 14,740 (1,533) 16,273 n.a.
As a percentage of revenues 1.1% -0.1%
net results from continuing operations 2,783 (14,001) 16,783 -119.9%
As a percentage of revenues 0.2% -1.1%
net results from discontinued operations (402) 16,138 (16,540) -102.5%
net result for the year 2,381 2,138 243 11.4%
(*) Gross Operating Margin less restructuring costs and certain specific non-recurrent costs and revenues
(**) Net Operating Margin less restructuring costs and certain specific non-recurrent costs and revenues
FiNANCiAL poSitioN
€/000Financial year as of 31 december Change %
2016 2015
net Capital Invested 585,672 570,929 14,743 2.6%
net Equity 227,721 206,419 21,302 10.3%
net Financial Position 357,951 364,510 (6,559) -1.8%
StAFF ANd MAiN iNdiCAtorS
Financial year as of 31 december Change %
2016 2015
Staff at the end of the period 7,461 7,305 156 2.1%
net financial indebtment/net Equity 1.6 1.8 (0.2) -11.2%
net financial indebtment/Ebitda 2.7 2.8 (0.1) -5.3%
ROCE before tax (*) 10.1% 10.5% -0.3% -3.2%
(*) Adjusted Ebit/Net Capital Invested
4
1,382,063
1,327,574
2016
2015
2016
2015
135,004
130,204
Revenues Adjusted Ebitda
€/000
2016
2015
2016
2015
206,419
227,721 585,672
570,929
Net Equity Net Capital Invested
€/000
2016
2015
2016
2015
10.1%
10.5%
357,951
364,510
Net Financial PositionROCE
% €/000
1 MANAGEMENt rEport
CLN GroUp ANd thE MArKEtMACroECoNoMiC SCENArioThe world GdP, according to data published by the International Monetary Fund (IMF) in January 2017, recorded a growth of 3.1% in 2016, confirming the previous year’s trend (+3.2%).
The so-called “Advanced Economies” (united States, Eurozone, Japan, and Canada) recorded a 1.6% growth. Europe and the united States closed with similar results (+1.7% and +1.6% respectively), with a slight decrease from 2015 (average growth of 2.1%).
In particular, the u.S. were marked by a particularly weak growth in the first semester, followed by a stronger and more encouraging second semester. The Eurozone, on the contrary, again displayed a growth level below expectations, although with several differences among Member States. The situation is partially due to the same political uncertainty that led to the approval of “Brexit” in June’s elections in the u.K.
Within the Eurozone, Italy maintained a growth trend below average (+0.9%), although higher compared to the previous year (+0.7%).
The economic progress of emerging countries was in line with 2015 trends (+4.1% in total). however, significant differences were recorded among BRICS countries: Russia showed evident recovery signals (GdP reduction was only -0.7% against -3.7% in 2015), while Brazil confirmed its recession trend (-3.5%, in line with 2015), and China stabilized its growth rate (+6.7%) after four years of recession.
According to IMF estimates, 2017 will bring about a global growth of about 3.4% (+1.9% in advanced economies and +4.5% in emerging economies). Significant changes compared to 2016 are expected for Brazil, which seems about to reverse its recession trend after three years, and for Russia, whose GdP is expected to increase by 1% after two years of slowdown.
Lastly, as regards currency markets, the most relevant event of 2016 was the progressive depreciation of the British Pound after Brexit: British currency lost over 15% against the Euro and the u.S. dollar during 2016. For what concerns the currencies most relevant to the Group’s activities, 2016 saw a considerable revaluation of the South African Rand (+15% compared to end of 2015) and the Brazilian Real (+20% compared to end of 2015). Both currencies basically returned to the values they had at the end of 2014, after a strong fall endured in 2015.
6 MANAGEMENT REPORT
GroUp ACtivitY ANd rEFErENCE MArKEtS
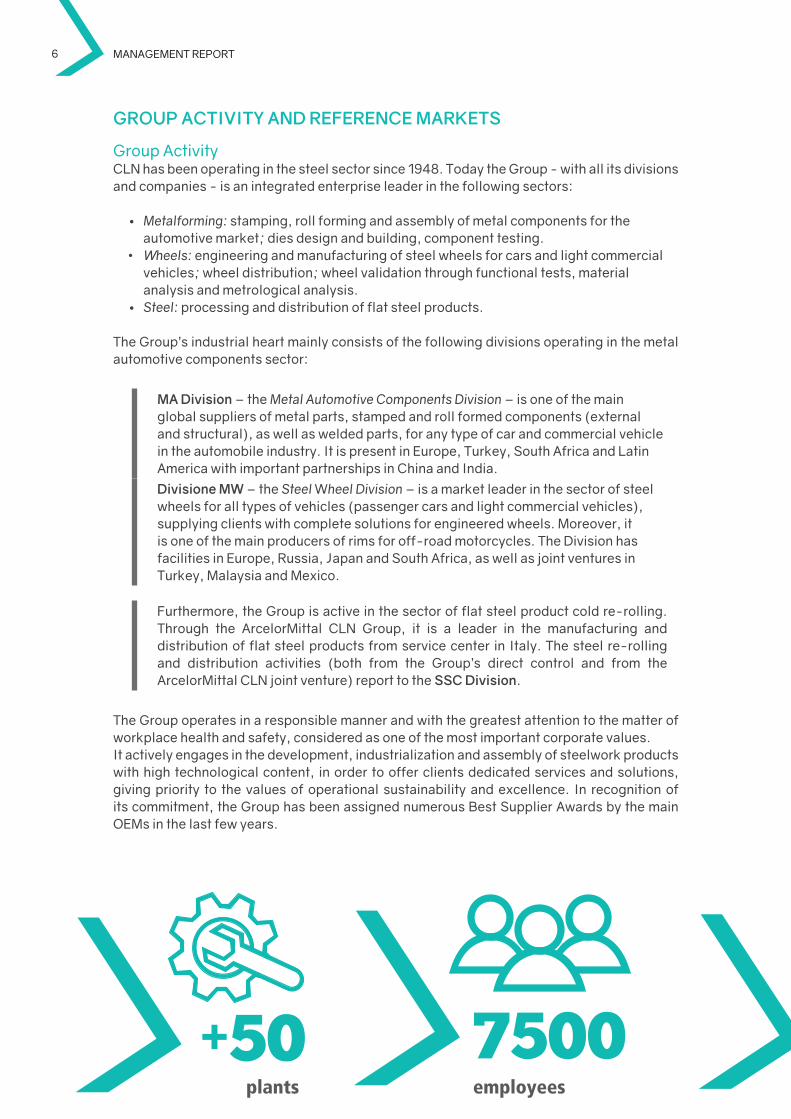
Group ActivityCLn has been operating in the steel sector since 1948. Today the Group - with all its divisions and companies - is an integrated enterprise leader in the following sectors:
• Metalforming: stamping, roll forming and assembly of metal components for the automotive market; dies design and building, component testing.
• Wheels: engineering and manufacturing of steel wheels for cars and light commercial vehicles; wheel distribution; wheel validation through functional tests, material analysis and metrological analysis.
• Steel: processing and distribution of flat steel products.
The Group’s industrial heart mainly consists of the following divisions operating in the metal automotive components sector:
MA division – the Metal Automotive Components Division – is one of the main global suppliers of metal parts, stamped and roll formed components (external and structural), as well as welded parts, for any type of car and commercial vehicle in the automobile industry. It is present in Europe, Turkey, South Africa and Latin America with important partnerships in China and India.
divisione MW – the Steel Wheel Division – is a market leader in the sector of steel wheels for all types of vehicles (passenger cars and light commercial vehicles), supplying clients with complete solutions for engineered wheels. Moreover, it is one of the main producers of rims for off-road motorcycles. The division has facilities in Europe, Russia, Japan and South Africa, as well as joint ventures in Turkey, Malaysia and Mexico.
Furthermore, the Group is active in the sector of flat steel product cold re-rolling. Through the ArcelorMittal CLn Group, it is a leader in the manufacturing and distribution of flat steel products from service center in Italy. The steel re-rolling and distribution activities (both from the Group’s direct control and from the ArcelorMittal CLn joint venture) report to the SSC division.
The Group operates in a responsible manner and with the greatest attention to the matter of workplace health and safety, considered as one of the most important corporate values.It actively engages in the development, industrialization and assembly of steelwork products with high technological content, in order to offer clients dedicated services and solutions, giving priority to the values of operational sustainability and excellence. In recognition of its commitment, the Group has been assigned numerous Best Supplier Awards by the main OEMs in the last few years.
+50 18 1.4 bln7500 4
countries continentsplants employees turnover
Annual Financial Report 2016 7
The Group is also constantly committed to internationalization and to the development of new products, with particular attention to new steel types and their innovative developments. At the same time, the Group works to strengthen its close and long-term relations with its clients. In its constant pursuit of innovation, the Group recently engaged in a Corporate Capital Venture program. The plan is to invest in start-ups in close collaboration with scientific and technological parks, incubators and universities in sectors such as automotive, robotics, environmental sustainability and social responsibility.
rEFErENCE MArKEtSThe Group’s main market of reference is represented by manufacturers of cars and light commercial vehicles (Original Equipment Manufacturers – OEM). Operating on this market are divisions MA and MW in their capacities as direct suppliers of components mainly made of steel. A smaller portion of the production is also intended for the so-called aftermarket, mainly consisting in steel wheels.
In 2016, the number of new car and light commercial vehicle registrations increased globally by about 5.6% compared to 2015 (84.2 million in the top 52 markets). In Europe, the growth was equal to 7.3% (16.6 million registrations), in China it was 14.2% (25.5 million), and 0.4% in the u.S. (17.5 million). negative results were recorded in Brazil (-19.8% with 2 million), Japan (-1.6% with 4.9 million) and Russia (-2.8% with 1.4 million).
In Europe, the Group’s main market, the growth rate was 18.4% in Italy (2 million registrations), 5.6% in France (2.4 million), 4.8% in Germany (3.6 million), 2.1% in the united Kingdom (3.1 million) and 10.9% in Spain (1.3 million).
In addition to the automotive market, as mentioned, the Group is active in steel re-rolling and distribution. World steel production increased by about 0.8% in 2016 (1.6 billion tons produced, around half of which in China), mostly thanks to Far East countries (China alone brought about a 1.2% increase compared to 2015).
With regard to Italy, internal raw steel production was equal to 23.3 million tons in 2016, with an increase of around 6% compared to the previous year.
For what concerns actual steel consumption, an increase of the demand was recorded in 2016, especially in the automotive sector.
In Europe, the price of the main steel products gradually increased after the lows touched at the end of 2015: at the end of 2016, steel product prices were almost double as high as at the beginning of the year, partially thanks to the anti-dumping measures adopted by the Eu Commission against imports from specific external countries.
+50 18 1.4 bln7500 4
countries continentsplants employees turnover
8 MANAGEMENT REPORT
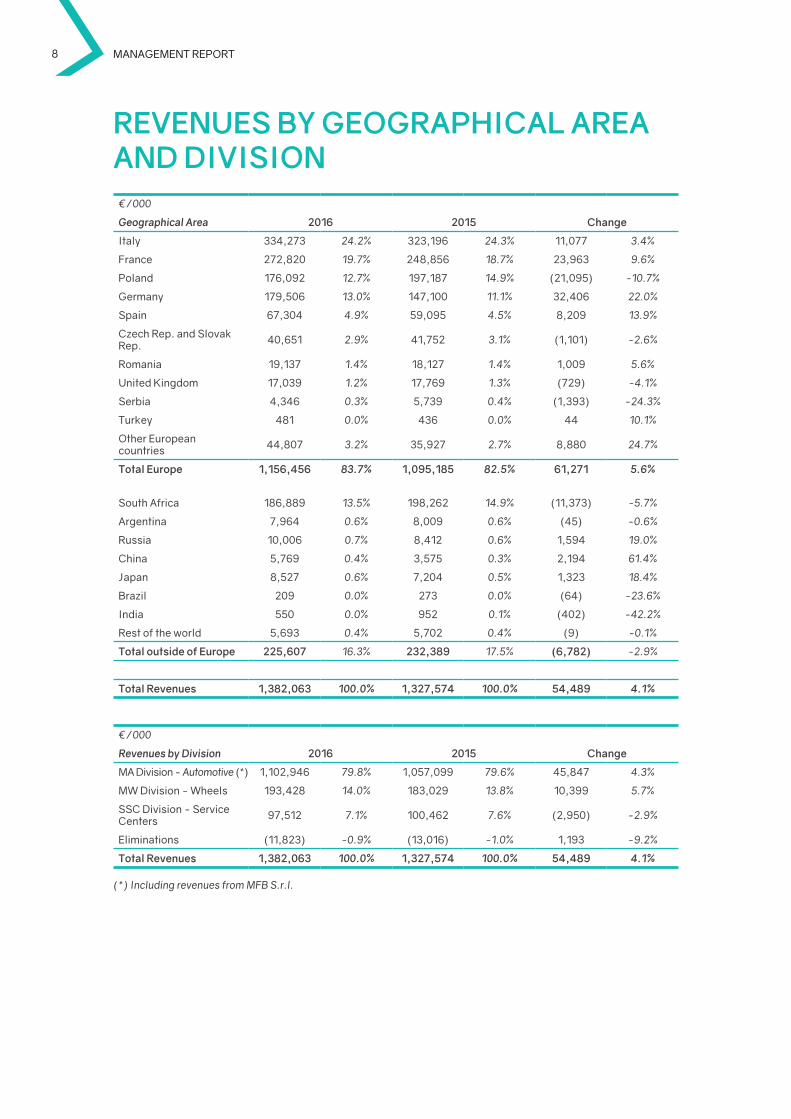
rEvENUES bY GEoGrAphiCAL ArEA ANd diviSioN
€/000
2016 2015 ChangeGeographical Area
Italy 334,273 24.2% 323,196 24.3% 11,077 3.4%
France 272,820 19.7% 248,856 18.7% 23,963 9.6%
Poland 176,092 12.7% 197,187 14.9% (21,095) -10.7%
Germany 179,506 13.0% 147,100 11.1% 32,406 22.0%
Spain 67,304 4.9% 59,095 4.5% 8,209 13.9%
Czech Rep. and Slovak Rep. 40,651 2.9% 41,752 3.1% (1,101) -2.6%
Romania 19,137 1.4% 18,127 1.4% 1,009 5.6%
united Kingdom 17,039 1.2% 17,769 1.3% (729) -4.1%
Serbia 4,346 0.3% 5,739 0.4% (1,393) -24.3%
Turkey 481 0.0% 436 0.0% 44 10.1%
Other European countries 44,807 3.2% 35,927 2.7% 8,880 24.7%
total Europe 1,156,456 83.7% 1,095,185 82.5% 61,271 5.6%
South Africa 186,889 13.5% 198,262 14.9% (11,373) -5.7%
Argentina 7,964 0.6% 8,009 0.6% (45) -0.6%
Russia 10,006 0.7% 8,412 0.6% 1,594 19.0%
China 5,769 0.4% 3,575 0.3% 2,194 61.4%
Japan 8,527 0.6% 7,204 0.5% 1,323 18.4%
Brazil 209 0.0% 273 0.0% (64) -23.6%
India 550 0.0% 952 0.1% (402) -42.2%
Rest of the world 5,693 0.4% 5,702 0.4% (9) -0.1%
total outside of Europe 225,607 16.3% 232,389 17.5% (6,782) -2.9%
total revenues 1,382,063 100.0% 1,327,574 100.0% 54,489 4.1%
€/000
2016 2015 ChangeRevenues by Division
MA division - Automotive (*) 1,102,946 79.8% 1,057,099 79.6% 45,847 4.3%
MW division - Wheels 193,428 14.0% 183,029 13.8% 10,399 5.7%
SSC division - Service Centers 97,512 7.1% 100,462 7.6% (2,950) -2.9%
Eliminations (11,823) -0.9% (13,016) -1.0% 1,193 -9.2%
total revenues 1,382,063 100.0% 1,327,574 100.0% 54,489 4.1%
(*) Including revenues from MFB S.r.l.
Annual Financial Report 2016 9
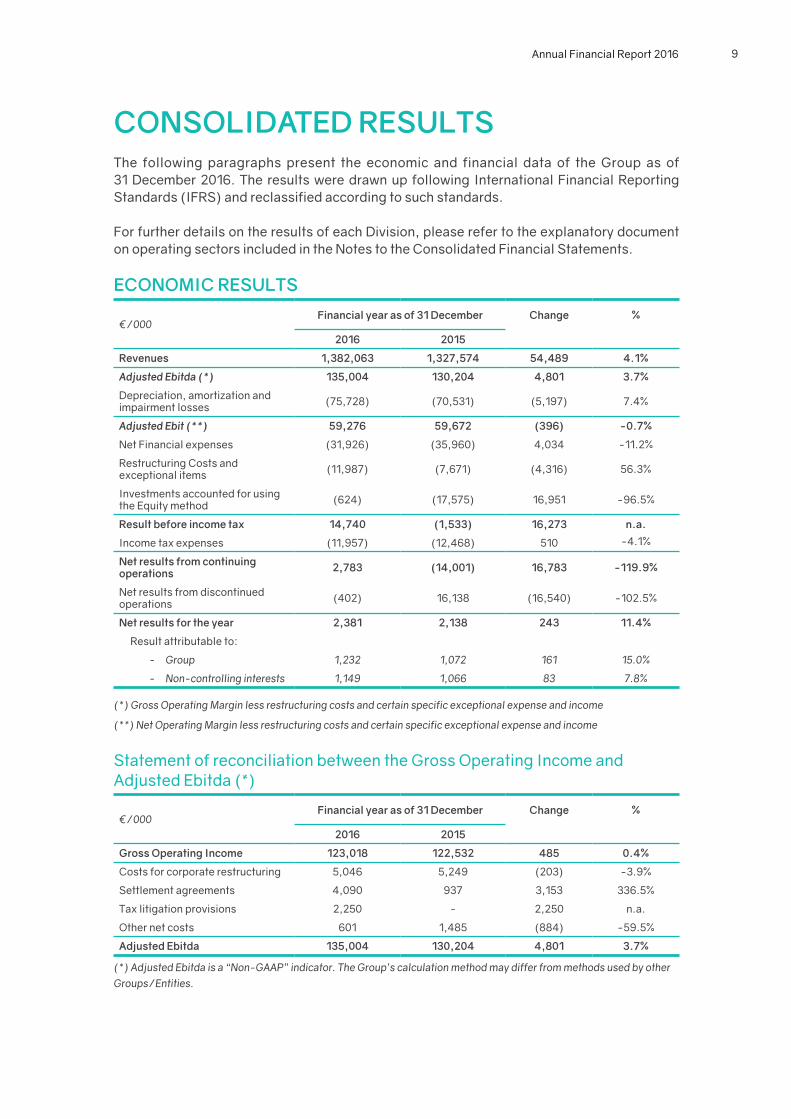
CoNSoLidAtEd rESULtSThe following paragraphs present the economic and financial data of the Group as of 31 december 2016. The results were drawn up following International Financial Reporting Standards (IFRS) and reclassified according to such standards.
For further details on the results of each division, please refer to the explanatory document on operating sectors included in the notes to the Consolidated Financial Statements.
ECoNoMiC rESULtS
€/000Financial year as of 31 december Change %
2016 2015
revenues 1,382,063 1,327,574 54,489 4.1%
Adjusted Ebitda (*) 135,004 130,204 4,801 3.7%
depreciation, amortization and impairment losses (75,728) (70,531) (5,197) 7.4%
Adjusted Ebit (**) 59,276 59,672 (396) -0.7%
net Financial expenses (31,926) (35,960) 4,034 -11.2%
Restructuring Costs and exceptional items (11,987) (7,671) (4,316) 56.3%
Investments accounted for using the Equity method (624) (17,575) 16,951 -96.5%
result before income tax 14,740 (1,533) 16,273 n.a.
Income tax expenses (11,957) (12,468) 510 -4.1%
Net results from continuing operations 2,783 (14,001) 16,783 -119.9%
net results from discontinued operations (402) 16,138 (16,540) -102.5%
Net results for the year 2,381 2,138 243 11.4%
Result attributable to:
- Group 1,232 1,072 161 15.0%
- Non-controlling interests 1,149 1,066 83 7.8%
(*) Gross Operating Margin less restructuring costs and certain specific exceptional expense and income
(**) Net Operating Margin less restructuring costs and certain specific exceptional expense and income
Statement of reconciliation between the Gross Operating Income and Adjusted Ebitda (*)
€/000Financial year as of 31 december Change %
2016 2015
Gross operating income 123,018 122,532 485 0.4%
Costs for corporate restructuring 5,046 5,249 (203) -3.9%
Settlement agreements 4,090 937 3,153 336.5%
Tax litigation provisions 2,250 - 2,250 n.a.
Other net costs 601 1,485 (884) -59.5%
Adjusted Ebitda 135,004 130,204 4,801 3.7%
(*) Adjusted Ebitda is a “Non-GAAP” indicator. The Group’s calculation method may differ from methods used by other Groups/Entities.
10 MANAGEMENT REPORT
The trend in revenues during 2016 was particularly positive in comparison with the previous financial year. Revenues at the end of 2016 amounted to EuR 1,382,063 thousand, with a 4.1% increase compared to 2015 (EuR 1,327,574 thousand). With exchange rates being equal (especially with the South African Rand), the 2016 growth would be equal to about 7%, in line with the growth trend in Europe’s automotive market in 2016.
At the geographical level, the most significant growth was recorded in Germany (+22%), thanks to the turnover generated by a new plant in Bremen dedicated to assembly activities for daimler.
With regard to non-European countries, the decrease observed in South Africa (-5.7%) is entirely due to the fall of the local currency’s exchange rate against the Euro. If calculated in the local currency, the turnover actually increased by 8.2% compared to the previous year’s values.
In 2016, the Group’s Adjusted Ebitda was equal to EuR 135,004 thousand (9.8% of revenues), a significant improvement compared to the previous year (EuR 130,204 thousand). The rise of the Adjusted Ebitda in 2016, equal to 3.7%, is mainly due to the aforementioned growth in volumes.
The Group’s Adjusted Ebit is equal to EuR 59,276 thousand (4.3% of revenues), a slight decrease from the EuR 59,672 thousand (4.5% of revenues) recorded in 2015. The value was particularly affected by depreciation and amortization of the period for a total of EuR 75,728 thousand, which represents an increase compared to 2015 (EuR 70,531 thousand). This is mostly due to the start of the depreciation process of new, recently implemented investments.
The total amount of the net financial expenses was equal to EuR 31,926 thousand (EuR 35,960 thousand in 2015). This value depends on a general improvement of economic conditions for funding, as well as on a smaller impact of exchange rate differences compared to 2015.
during 2016, the Group sustained restructuring costs and other exceptional costs of EuR 11,987 thousand (EuR 7,671 thousand in 2015). The item includes restructuring costs of EuR 5,046 thousand, in line with the previous year’s expenses (EuR 5,249 thousand in 2015), and other net cost components of EuR 6,941 thousand mainly associated to settlement agreements and tax litigation provisions.
The net cost deriving from Investments accounted for using the Equity method was EuR 624 thousand, with a significant improvement compared to 2015 (net devaluation of EuR 17,575 thousand). This value mostly includes the pro-quota of the positive results achieved by ArcelorMittal CLn distribuzione Italia srl [AMCLn] (EuR 6,825 thousand), which was almost entirely compensated by the devaluation following the losses of the Group’s companies operating in South America.
taxes amounted to EuR 11,957 thousand in 2016, a slight decrease compared to 2015 (EuR 12,468 thousand), mostly due to the activation of deferred tax assets.
The net result for the year 2016 was equal to EuR 2,381 thousand, an increase compared to 2015 (EuR 2,138). The component attributable to the Group amounted to EuR 1,232 thousand (against EuR 1,072 thousand in 2015). This value mostly derives from the Group’s continuing operations, while the 2015 value also included a significant benefit (EuR 16,138 thousand) from discontinued operations.
Annual Financial Report 2016 11
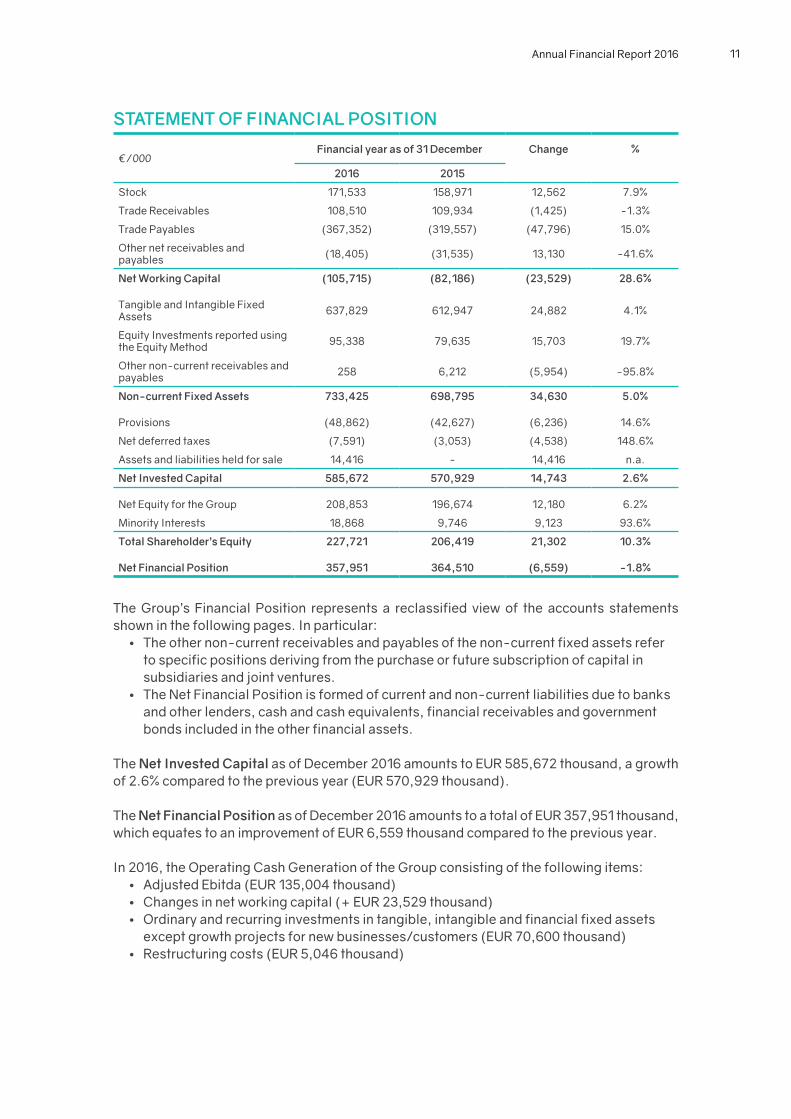
StAtEMENt oF FiNANCiAL poSitioN
€/000Financial year as of 31 december Change %
2016 2015
Stock 171,533 158,971 12,562 7.9%
Trade Receivables 108,510 109,934 (1,425) -1.3%
Trade Payables (367,352) (319,557) (47,796) 15.0%
Other net receivables and payables (18,405) (31,535) 13,130 -41.6%
Net Working Capital (105,715) (82,186) (23,529) 28.6%
Tangible and Intangible Fixed Assets 637,829 612,947 24,882 4.1%
Equity Investments reported using the Equity Method 95,338 79,635 15,703 19.7%
Other non-current receivables and payables 258 6,212 (5,954) -95.8%
Non-current Fixed Assets 733,425 698,795 34,630 5.0%
Provisions (48,862) (42,627) (6,236) 14.6%
net deferred taxes (7,591) (3,053) (4,538) 148.6%
Assets and liabilities held for sale 14,416 - 14,416 n.a.
Net invested Capital 585,672 570,929 14,743 2.6%
net Equity for the Group 208,853 196,674 12,180 6.2%
Minority Interests 18,868 9,746 9,123 93.6%
total Shareholder’s Equity 227,721 206,419 21,302 10.3%
Net Financial position 357,951 364,510 (6,559) -1.8%
The Group’s Financial Position represents a reclassified view of the accounts statements shown in the following pages. In particular:
• The other non-current receivables and payables of the non-current fixed assets refer to specific positions deriving from the purchase or future subscription of capital in subsidiaries and joint ventures.
• The net Financial Position is formed of current and non-current liabilities due to banks and other lenders, cash and cash equivalents, financial receivables and government bonds included in the other financial assets.
The Net invested Capital as of december 2016 amounts to EuR 585,672 thousand, a growth of 2.6% compared to the previous year (EuR 570,929 thousand).
The Net Financial position as of december 2016 amounts to a total of EuR 357,951 thousand, which equates to an improvement of EuR 6,559 thousand compared to the previous year.
In 2016, the Operating Cash Generation of the Group consisting of the following items:• Adjusted Ebitda (EuR 135,004 thousand)• Changes in net working capital (+ EuR 23,529 thousand)• Ordinary and recurring investments in tangible, intangible and financial fixed assets
except growth projects for new businesses/customers (EuR 70,600 thousand)• Restructuring costs (EuR 5,046 thousand)
12 MANAGEMENT REPORT
amounted to EuR 82,887 thousand, a remarkable increase compared to 2015 (EuR 45,115 thousand). This value indicates an Adjusted Ebitda cash conversion rate of 61.4% (34.6% in 2015).
detailed information on the composition of the single items composing the financial position is given in the notes to the Consolidated Financial Statements
The Shareholder’s Equity attributable to the Group amounts to a total of EuR 208,853 thousand with an increase of EuR 12,180 thousand compared to the previous financial year. This increase is mainly due to the conversion of the separate statements of the South African subsidiaries and the MA Automotive Brasil Ltda joint venture originally expressed in Rand and Brazilian Real into Euros.
Annual Financial Report 2016 13
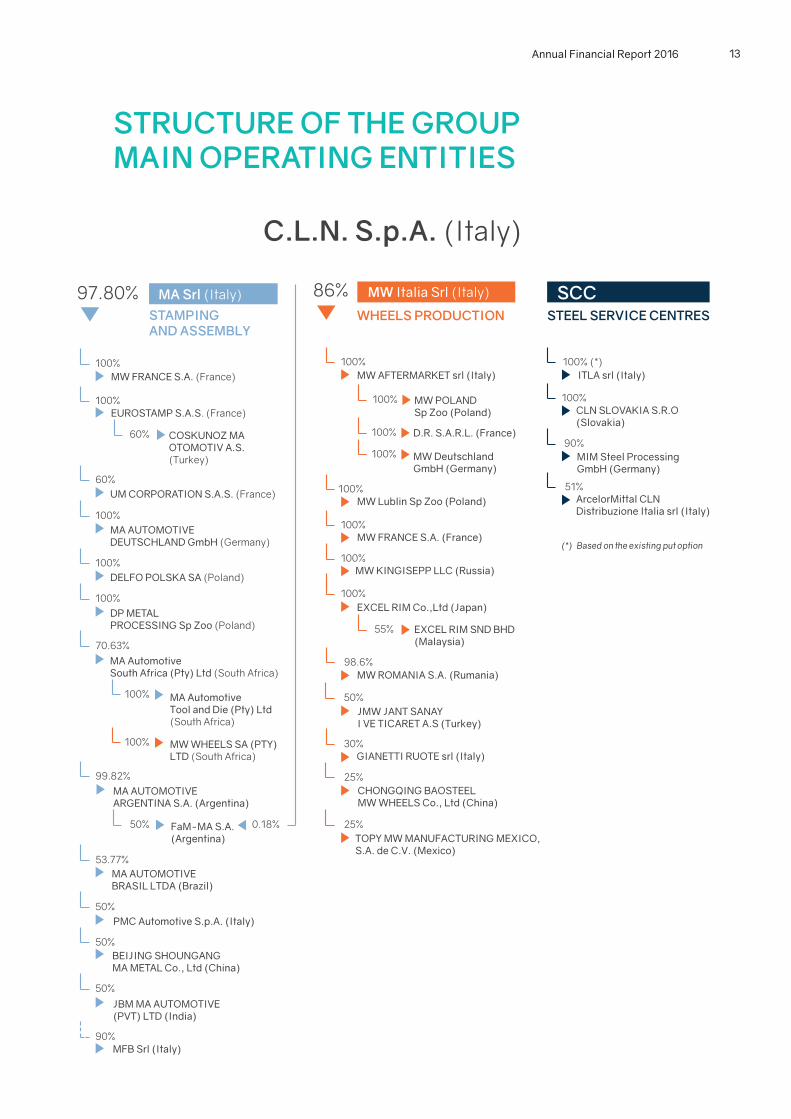
StrUCtUrE oF thE GroUp MAiN opErAtiNG ENtitiES
97.80%
100%MW FRANCE S.A. (France)
70.63%
MA AUTOMOTIVEDEUTSCHLAND GmbH (Germany)
DELFO POLSKA SA (Poland)
DP METALPROCESSING Sp Zoo (Poland)
EUROSTAMP S.A.S. (France)
UM CORPORATION S.A.S. (France)
MA AutomotiveSouth Africa (Pty) Ltd (South Africa)
MW WHEELS SA (PTY)LTD (South Africa)
MA AutomotiveTool and Die (Pty) Ltd(South Africa)
MA AUTOMOTIVE ARGENTINA S.A. (Argentina)
FaM-MA S.A.(Argentina)
MA AUTOMOTIVEBRASIL LTDA (Brazil)
PMC Automotive S.p.A. (Italy)
BEIJING SHOUNGANGMA METAL Co., Ltd (China)
JBM MA AUTOMOTIVE(PVT) LTD (India)
MFB Srl (Italy)
COSKUNOZ MAOTOMOTIV A.S.(Turkey)
100%
60%
100%
100%
100%
60%
100%
99.82%
53.77%
50%
50%
50%
90%
50% 0.18%
100%
86%
MW AFTERMARKET srl (Italy)
D.R. S.A.R.L. (France)
MW POLANDSp Zoo (Poland)
MW DeutschlandGmbH (Germany)
MW Lublin Sp Zoo (Poland)
MW FRANCE S.A. (France)
JMW JANT SANAYI VE TICARET A.S (Turkey)
GIANETTI RUOTE srl (Italy)
CHONGQING BAOSTEELMW WHEELS Co., Ltd (China)
MW ROMANIA S.A. (Rumania)
TOPY MW MANUFACTURING MEXICO,S.A. de C.V. (Mexico)
EXCEL RIM Co.,Ltd (Japan)
EXCEL RIM SND BHD(Malaysia)
MW KINGISEPP LLC (Russia)
100%
100%
100%
100%
100%
100%
100%
100%
98.6%
50%
30%
25%
25%
55%
ITLA srl (Italy)
CLN SLOVAKIA S.R.O(Slovakia)
MIM Steel ProcessingGmbH (Germany)
ArcelorMittal CLNDistribuzione Italia srl (Italy)
100% (*)
100%
90%
51%
Based on the existing put option(*)
SCCMW Italia Srl (Italy)MA Srl (Italy)
STEEL SERVICE CENTRESWHEELS PRODUCTIONSTAMPINGAND ASSEMBLY
C.L.N. S.p.A. (Italy)
14 MANAGEMENT REPORT
iNForMAtioN CoNCErNiNG riSKS ANd UNCErtAiNtiESGiven the nature of its activity, the Group is effectively exposed to certain risks, divided below in risks of a financial nature and business risks.
riSKS oF A FiNANCiAL NAtUrE
Credit riskThe Group proves to be exposed to credit risk deriving from its commercial activities with clients. The risk is represented by effects that could potentially emerge if one of the counterparties were not able to fulfil its obligations in a temporary or definitive manner.
Moreover, the main clients of the Group are represented by car manufacturers (OEM), concerning which prompt information is available about their operating/financial trends and to the ratings supplied by the main agencies. The Group also adopts specific commercial policies aimed at monitoring the solvency of smaller clients and implements agreements for the transfer of trade receivables without recourse, thereby transferring the related risk.
Liquidity riskThe liquidity risk concerns the availability of financial resources and access to the credit market.The main internal factors affecting the situation of liquidity of the CLn Group are, on the one hand, the resources generated and absorbed by operational management, and on the other hand, those engaged in investments aimed at productive and strategic development and in the debt service. The Group constantly monitors the trend of its liquid assets, financial flows (final and forecast) and lines available by means of treasury reports.
Lastly, a significant external factor which can influence the availability of adequate financial resources for the Group is represented by the trend of credit markets at a national and supranational level.
Risk of fluctuations in exchange ratesCLn Group is exposed to financial risk deriving from variation in exchange rates, which occurs when operating in an international context in which commercial and financial transactions may be denominated in a currency other than the accounting currency. This risk can also derive from conversion into Euro of individual balance sheets drawn up in foreign currency by the consolidated companies. These oscillations can significantly influence the Group’s operating and financial result.
The main exchange rate ratios against the Euro representing a risk for the Group concern the Polish Zloty, South African Rand, Rumanian Leu, Brazilian Real and the Russian Rouble.
Risk of fluctuations in interest ratesA significant component of the medium/long-term debt subscribed by the Group is repaid at variable rates. Moreover, the Group regularly transfers receivables (with and without recourse) deriving from its commercial activity and avails of other forms of short-term borrowing. Therefore, variations in the levels of market interest rates affect the level of the Group’s net financial expenses.
Annual Financial Report 2016 15
Risk of variation in the mix of revenues between countries with different tax regimesThe Group operates in countries with different tax regimes: income tax rates indicatively vary from 19% in Poland to 33% in France. In other countries, amongst which Italy, the option of using tax losses from previous tax years to offset current taxable income is available. Consolidated pre-tax results being equal, a mix of geographic origins of such results can lead to a significant change in tax burden and, therefore, affect the profit for the year.
Risk of failure to observe financial Covenants on medium/long-term loans The Group has subscribed some loan agreements bound to complying with financial covenants (ratio between net Financial Position and Ebitda, ratio between Ebitda and net Financial Expenses, ratio between the financial debt of subsidiaries and the total consolidated assets). Failure to observe such contractual covenants could lead to a request for early repayment of the outstanding debt unless agreed otherwise with the lending entities.
It should be pointed out that, as of 31 december 2016, the financial covenants have been observed.
bUSiNESS riSKS
Global economy and automotive market trendsMore than 90% of the Group’s revenues is directly or indirectly attributable to vehicle manufacturers throughout the world. The automotive market follows cyclic fluctuations caused by factors such as general economy trends, growth or decrease in the gross domestic product, interest rates, fuel prices, consumer loyalty, etc.
These factors mean that fluctuations in the automotive market, even significant ones, are hard to predict and consequently the Group’s business, as recently testified by the crisis which hit world economies between 2008 and 2014.
Moreover, more than 80% of the Group’s revenues are achieved in Europe. Europe proved to be particularly vulnerable during the years of the economic crisis: the sovereign debt crisis and austerity measures introduced in order to mitigate the crisis’ effects have given rise to a situation of recession, followed by stagnation, from which the countries of the Eurozone have only recently started to come out. The situation has recently been aggravated by specific tensions concerning Greece and by Great Britain’s exit from the European union.
Fluctuations in market shares of clients and supplied models In addition to the general automotive market trends, the Group is exposed to specific risk linked to the success of the models/platforms produced by its clients, which can have a positive or negative multiplying effect on the general market trend.
Steel price trendThe cost of raw material affects the Group’s comprehensive turnover by about 60%. The steel market has been historically characterized by high volatility. Such volatility mainly lies in the cyclic nature of the main steel outlet sectors, above all the automotive and construction sectors.
In the MA and MW divisions, raw material price fluctuations are normally transferred to the client, while sudden price changes for the SSC division can expose the Group to sales margin risks.
16 MANAGEMENT REPORT
Presence in Foreign Countries and Emerging CountriesAbout 76% of the Group’s sales revenues is achieved outside of Italy: of this, almost one-fourth comes from emerging countries (South Africa in particular). Business activities conducted overseas are subject to risks such as exposure to local economic and political conditions, implementation of restrictive policies regarding import and/or export, and subjection to multiple tax regimes.
With regard to emerging countries, the Group operates directly in South Africa and Russia and, by means of joint ventures, in Brazil, India and China. negative developments in the economies and political systems of such countries, such as possible decreases in public investments for infrastructures or lack of adequate supplies of gas and electricity, may represent an additional factor or risk for the Group.
Risk of production interruptionThe Group’s profitability depends on its ability to promptly supply clients with specific products in their facilities. The Group is therefore subject to the risk of interruptions in production, for reasons that may vary from mechanical line faults to union-related tensions, up to the most remote events such as environmental disasters, wars and terrorist attacks.
In order to mitigate the risk of interruptions linked to production plant faults, the Group applies careful maintenance policies aimed at promptly identifying any anomalies and possible causes of fault.
high level of competitionThe market of vehicle component supplies for OEMs is characterized by a highly competitive nature, with regard to the production of both wheels and stamped items. The Group has to compete with a high number of competitors having degrees of financial and industrial strength very different from each other. Some of them are in dominant positions in some areas, while others have to deal with intense restructuring and reorganization processes. In some emerging countries, new players are appearing on the scene which could further heighten the level of competition.
This is one of the reasons that lead clients to ask for progressive price reductions during the lifecycle or the produced models.
The level of competition and discounts granted to clients can reduce the Group’s profitability, should they not be absorbed by means of a constant improvement in productive efficiency.
Clients’ outsourcing policiesBoth the wheel and stamped parts production markets are strongly affected by outsourcing policies adopted by OEMs. For every facility/model, the outsourcing decisions taken by OEMs are subject to the availability of internal productive capacity, perception of the strategic relevance of certain components versus others, financial availability, production costs, quality and delivery times, and existing technical skills. The OEMs’ choices/strategies determine the size of current/potential markets for all suppliers of automotive components.
Risks associated with joint venture agreementsThe Group is pursuing a policy of search for joint venture opportunities and alliances in order to achieve production verticalization, loyalty marketing, commercial expansion, capital commitment optimizations and risk reduction, particularly concerning risks deriving from entry into developing countries. These agreements are usually established through the acquisition of majority shareholdings, but also equal or minority shareholdings. The achievement of such
Annual Financial Report 2016 17
objectives, which is the motivation for stipulating such agreements, is influenced by multiple factors. Among the main factors are relations with respective partners, a shared vision of future strategies to be pursued, as well as problems of a technical and financial nature, together with local regulations.
The Group’s main joint ventures were created with unipres in Brazil, Coskunoz and Jansta in Turkey, JBM in India and Topy in Mexico. Starting from 2015, the distribution of steel in Italy is managed in partnership with ArcelorMittal.
Competition from materials alternative to steelThe Group’s business mainly depends on the use of steel in car components. The growing use of alternative materials, especially aluminum for wheels and plastic for certain assembled components, can be a factor of risk for the Group.
Risk in the development of new products and production sitesThe launch of new programs and the introduction of new production technologies and new sites entail risks deriving from initial productive inefficiency, functioning of production equipment, initial production quality, and adequate personnel training.
Product qualityAny lack in quality of the items supplied to clients could lead to significant costs for indemnity and reworking. The Group considers the quality of its products as a matter of priority and is committed, in such sense, to mitigate such risk as much as possible by means of robust quality check actions on the materials and production processes used.
Environment, health and SafetyThe Group is required to comply with a wide range of normatives and regulations concerning the environment and the workers’ health and safety. Such normatives, which differ from country to country, impose increasingly stricter safety standards. The costs to comply with such norms and pay any sanctions in case of failure to adapt to the required standards have been constantly increasing. Failure to observe the norms also leads to the risk of civil and criminal actions, and to the revocation of production authorizations.
Concentration of clientsApproximately 76% of the Group’s sales revenues comes from its main eight clients. Although such level of concentration is not uncommon in the sector, the loss of one of the clients or a significant volume reduction could give rise to profitability losses.
In order to mitigate such risk, the Group constantly monitors the levels of satisfaction of clients, and designs with them development programs and opportunities for present and future collaborations.
Costs associated to closing facilitiesIf, for any reason, the Group were forced to close down one of its production plants, the costs of closing operations would be huge. For this reason, the usage level of the facilities’ productive capacity is constantly monitored and re-balanced, where necessary, by means of commercial actions and/or productive relocation.
Acquisition and sale of operating activitiesIn the past, the Group has carried out strategic acquisitions and disposals of operations and this could take place again in the future. In particular, acquisitions can entail risks for what concerns return on investment, obtaining sufficient financial cover, diversion of management from recurrent activities, burdening of the Group’s net financial position and working cash flow.
18 MANAGEMENT REPORT
In order to mitigate such risk, any strategic acquisitions is analysed beforehand from a commercial, productive and financial point of view.
Legal & ComplianceThe Group is exposed to the risk of failing to promptly adapt to changes in normatives and regulations issued in the markets and countries in which it operates.
riSK MANAGEMENt SYStEMEffective risk management is key to the successful achievement of the Group’s short- and medium/long-term objectives. In order to constantly improve its internal monitoring system, in 2016 the Group engaged in a project to redefine its Enterprise Risk Management (ERM) system.
The ERM system consists of all organizational structures, protocols and procedures aimed at identifying, measuring, managing and monitoring the main enterprise risks, allowing the Group to make educated decisions in line with its propensity to risk taking.
The project was submitted to the Board of directors on 16 June 2016, and consists in a long-term plan articulated in the following phases:
• Assessment of cybersecurity systems and subsequent adaptation to commonly accepted security standards, if necessary.
• Assessment of the state of segregation of duties in the IT systems used by the Group’s subsidiaries for the management of integrated accounting, followed by introduction of commonly accepted best practices if necessary.
• Introduction of an Internal Monitoring and Risk Management System to consolidate current practices, integrate them should they not be completely exhaustive, and make them universally applicable to all subsidiaries pertaining to the Group.
Annual Financial Report 2016 19
rESEArCh ANd dEvELopMENtThe Group internally conducts research and development activities on products, processes and productive methodologies. In particular, these activities concern the following sectors:
Selection of materials: study of solutions to optimize product weights and performances and reduce costs.• In particular, the MA division is constantly in search of technological solutions
able to reduce the amount of materials used, in collaboration with suppliers, car manufacturers and academia.
• Similarly, the MW division works with the main steel suppliers to test out new material types able to improve forming processes and reduce the wheels’ thickness (and subsequently their weight). These experiments aim to minimize fuel consumption and improve vehicle dynamics.
optimization of production processes: research for new production techniques aimed at improving production performance in terms of efficiency, workload and safety.• With regard to the MA division, activities are mainly focused on the constant
development of roll forming processes and on the introduction of hot forming processes, which allow the realization of high-resistance details with complex shapes and reduced elastic return effects.
• The MW Wheel division recently started a wide range of activities in its production plants:
› measurement of finite products and semi-components (discs/rims) with contactless solutions for lab activities and for 100% accurate production checks;
› specific equipment to improve quality performances (concerning run-out) and rim-disk joints;
› new solutions to optimize consumptions and air flows using specific turbines and nozzles;
› new electronic three-shaft transfer on transfer press aimed at product quality improvement, waste reduction, and production capacity increase, specifically designed for styled wheels (X-Free, semi full-face SFF) and light commercial vehicle wheels;
› vision system for defect identification and wheel checking (mixing risk); › development of a new rim-disk assembly line with integration of the latest solutions
designed to improve run-out (new concept of a lap joint press), welding times (CMT technology with robots) and line monitoring.
New product concepts: solutions aimed at specific applications by product type (e.g. multi-material solutions, components for electric vehicles, etc.).• With 2016, the Eu-funded “PLuS-MOBY” project has been completed. The project
led to the realization of a working prototype of a light vehicle for urban use with modular bodywork and electric traction equipped with various innovative technologies (solar on-board, low-tension power conversion, distributed propulsion). The project was followed in particular by the MA division for what concerns material selection, bodywork structure optimization, and industrialization study.
Aiming to increase business opportunities and improve the quality of customer-oriented services, the technical area of the MA division created a new Product Engineering function. The new function, an addition to the usual Process Engineering function, is meant as a tool to involve clients in the design of the product. This step would allow an early assessment of the practical solutions that work best with the available technologies and proposed materials.
20 MANAGEMENT REPORT
• With regard to the MW Wheel division, the French plant consolidated the process of thrust flow rim forming (Flow-Type2) and launched new productions of styled wheels with large vent holes (called “X-free”) with integrated aesthetic cups.
As regards product innovation, the MW division started important research projects concerning the following:
› styled wheels with complex-shape disc in pressed steel sheet, with improved aesthetics without plastic cups; in parallel, research is being done on new high-formability steels with superior mechanical properties (the project is a collaboration with a top steel producer);
› wheels of non-metallic materials (materials with a polymer matrix and reinforcing fibers) for a new generation of products with a considerably lower weight, similar in look to aluminum alloy wheels;
› “hybrid” wheels with different combinations of rim and disc materials, disc forming technologies, and disc-rim junction.
New simulation procedures: analyses finalized at improving the efficiency and accuracy of the simulation processes, in both the product design and pressing phases.• In particular, the MA division is conducting a project in collaboration with Politecnico
of Turin to assess the most widely used pressing simulation programs in the automotive sector and to improve numerical-experimental correlation.
• Similarly, the MW division completed some research projects carried out within the CLn-Politecnico of Turin partnership program. The division is currently setting up a new project concerning the improvement of wheel design simulation methods. The project will have a duration of about three years and will aim to introduce new analysis types as well as new software to improve the robustness of product design, with numerous benefits in the subsequent industrialization phase in terms of time and cost reduction.
New homologation procedures: activities designed by the MW division and aimed at defining new bench testing methods and specifications agreed upon with clients to validate security components.
These are the bases of the Group’s strategy, which is currently aimed at the realization of partnerships and collaboration projects with suppliers, clients, universities and research centers, to create synergies and new development opportunities.
Annual Financial Report 2016 21
ENviroNMENt, hEALth ANd SAFEtYThe Group is aware that the creation of value, sustained by a prosperous and socially responsible growth, is promoted by the persons operating therein. Consequently, all persons working within the Group need to be guaranteed the highest form of respect and individual protection. Moreover, the Group considers environmental protection as a key factor to be promoted in the general approach to corporate activities, and recognizes workplace health and safety as fundamental rights of its employees as well as a key element of the Group’s sustainability.
Environmental integrity and the protection of all those working in the Group’s facilities are essential values for the Group’s management as well as for every worker, each according to their own attributions and competences.
In accordance with pursuing such values and objectives, the Group operates in observance of all provisions in force on the matter of environmental protection and safeguarding of individual and collective health and safety. Moreover, the Group is committed to promoting initiatives inspired by the wish for continuous improvement and risk prevention in production processes. This entails developing and extending efficient and certified Environmental Management, health and Safety Systems based on the fundamental principles of environmental impact minimization, resources optimization, and workplace health and safety safeguarding. In particular, the Group’s activities can be considered as of low environmental impact in terms of treated materials, energy consumption, and processing waste production.
As regards the REACh normative, based on European Regulation EC no. 1907/2006 (introduction of a system for the registration, assessment and authorization of chemical substances circulating in the European union), the Group has been keeping updated – also in 2016 – on the development of the normative. In particular, the Candidate List (a list issued by the EChA concerning forbidden substances) is constantly monitored to make sure the substances of the list are not present in products manufactured or in materials purchased by the Group’s companies.
As regards the aspects of health and Safety at the workplace, activities related to the Safety Project, launched in 2009, continued further with an extension of the latter to all Group companies, including those recently acquired (whether subsidiaries or investees) in order to guarantee homogeneity in objectives and methods aimed at improving the performance of every division of the Group.The main purposes of said project are:
• to guarantee the observance of regulatory provisions on the matter of health and safety and promote initiatives based on a rationale of constant improvement and prevention;
• to define and implement plans of action, maintenance and control aimed at risk prevention;
• to continuously improve corporate performance and constantly monitor risks deriving from work activities;
• to provide corporate management with an efficient and effective managerial system that allows a permanent activity of identification and management of emerging problems as well as an orderly information flow able to adequately support decision-making and operational responsibilities;
• to increase the involvement, motivation and awareness of the staff;• to contribute to improving the levels of workplace health and safety;• to improve its internal and external image, so as to gain a greater reliability with clients,
22 MANAGEMENT REPORT
suppliers and supervisory bodies/authorities;• to progressively reduce costs of workplace health and safety.
Furthermore, the Safety Policy adopted and circulated within the various companies of CLn Group establishes that the protection of health and Safety is to be considered as a priority and precise responsibility of the entire corporate hierarchy, as well as a constant commitment to be pursued in all activities. The objective of the CLn Group is to reduce and prevent workplace-related injuries and occupational diseases.
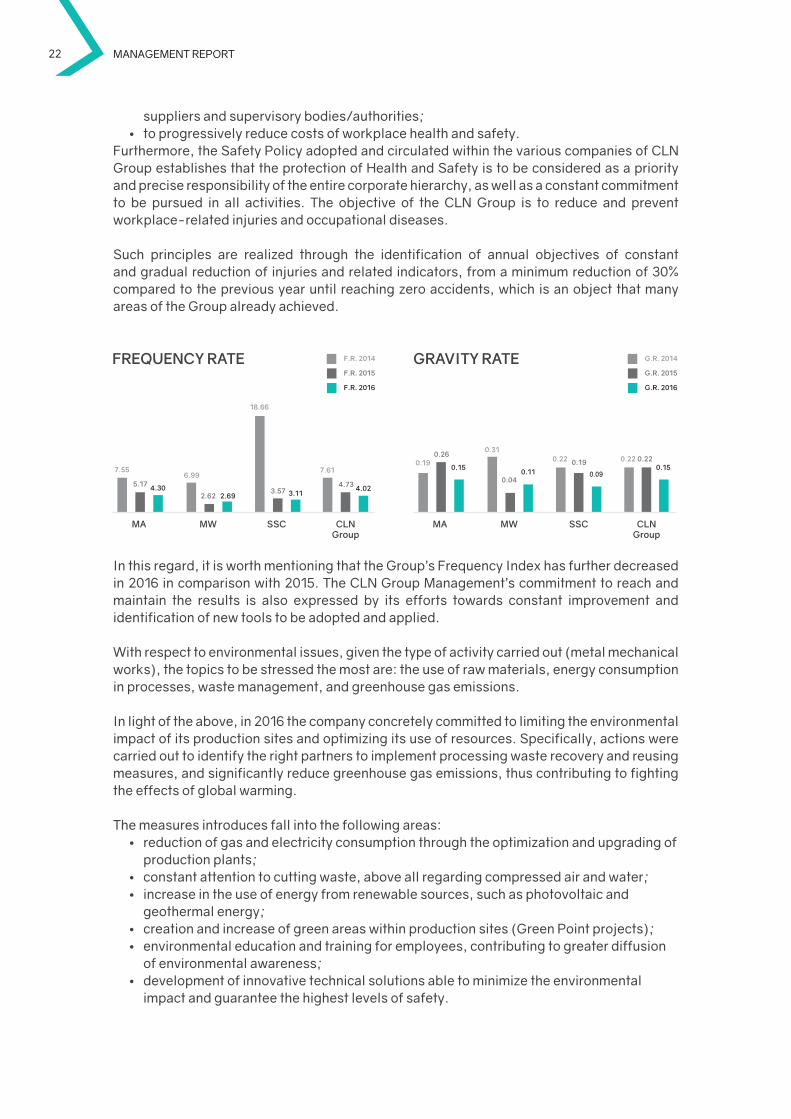
Such principles are realized through the identification of annual objectives of constant and gradual reduction of injuries and related indicators, from a minimum reduction of 30% compared to the previous year until reaching zero accidents, which is an object that many areas of the Group already achieved.
In this regard, it is worth mentioning that the Group’s Frequency Index has further decreased in 2016 in comparison with 2015. The CLn Group Management’s commitment to reach and maintain the results is also expressed by its efforts towards constant improvement and identification of new tools to be adopted and applied.
With respect to environmental issues, given the type of activity carried out (metal mechanical works), the topics to be stressed the most are: the use of raw materials, energy consumption in processes, waste management, and greenhouse gas emissions.
In light of the above, in 2016 the company concretely committed to limiting the environmental impact of its production sites and optimizing its use of resources. Specifically, actions were carried out to identify the right partners to implement processing waste recovery and reusing measures, and significantly reduce greenhouse gas emissions, thus contributing to fighting the effects of global warming.
The measures introduces fall into the following areas:• reduction of gas and electricity consumption through the optimization and upgrading of
production plants;• constant attention to cutting waste, above all regarding compressed air and water;• increase in the use of energy from renewable sources, such as photovoltaic and
geothermal energy;• creation and increase of green areas within production sites (Green Point projects);• environmental education and training for employees, contributing to greater diffusion
of environmental awareness;• development of innovative technical solutions able to minimize the environmental
impact and guarantee the highest levels of safety.
F.R. 2014
F.R. 2015
F.R. 2016
7.55
5.176.99
2.62 2.69
18.66
3.114.30
7.61
4.73 4.023.57
FREQUENCY RATE
MA MW SSC CLNGroup
G.R. 2014
G.R. 2015
G.R. 2016
0.190.26
0.31
0.040.11
0.22 0.22 0.22
0.090.15 0.15
0.19
GRAVITY RATE
MA MW SSC CLNGroup
Annual Financial Report 2016 23
The Group believes in circulating a culture of environmental protection, accident prevention and risk awareness among workers. Employees need to consider themselves personally responsible to take the preventive measures established by the Group to protect their health and safety.
In a perspective of continuous improvement, it is worth reporting 27 facilities within the Group hold the environmental certification ISO 14001 (67% of the total) as of december 2016. At the same time, 14 facilities (35% of the total) hold the OhSAS health and safety certification. This guarantees the Group’s legal conformity and the implementation of systems for monitoring and improving safety and environmental aspects in all facilities.
however, the consolidation of good results in the field of environment, health and safety is not to be regarded as a point of arrival, but rather as a starting point. The Group is committed to persevering on its path, continuing to work on the behavioral aspect of all employees: for the Group, this constitutes the most significant added value for dealing with such matters.
The involvement of all employees is key to making environment and safety not just abstract ideas, but rather something real, concrete and tangible. Only by stimulating employees to play an active role in the application of such principles will it be possible to reach increasingly more ambitious goals.
24 MANAGEMENT REPORT
othEr iNForMAtioNSiGNiFiCANt EvENtS iN thE FiNANCiAL YEAr 2016
The CLn Group and Seojin, a Korean automotive component manufacturer, signed a bilateral agreement that provides for future collaborations projects of research and development for vehicle components as well as business development plans.
South African subsidiaries MW South Africa and MA Automotive tool & die received a special award at the Toyota Annual Supplier Awards for their performance in the management of the new hilux pick-up truck project.
The MA plant in Melfi was the first among the division’s Italian plants to receive the OhSAS 18001 certification. The certificate was awarded in an exceptionally short time, less than a year after the beginning of the process.
C.L.n. S.p.A. acquired 80% of the social capital of MiM Steel processing Gmbh, a German company operating in the steel supply market. As a consequence of the acquisition, the Group now holds the 90% of the company, considering the 10% minority share previously held.
MW italia and topy industries Ltd. signed a new capital alliance: Topy, in aggregation to its previous shareholding, acquired a MWI participation equal to 14% of its share capital through a dedicated share capital increase. At the same time, MWI acquired a 1.53% stock in Topy through the acquisition of ordinary shares.
MA won the best Supplier Award at the PSA Group’s Supplier Awards 2016 in the “Technical Cost Reduction” category. The award recognized MA’s ability to propose solutions for reducing the cost of standard components with a smart approach to the supply chain and to the marketing and purchase drivers that contribute to the competitiveness of the Group.
The MW Lab stepped on the market with a new brand and a new identity: TO PROVE LAB. The essence of the new brand is summarized by its name, which can be read both as “Torino Prove [tests]” and “to prove”. It will be a specialized lab for the testing of automotive components, and specifically for wheel homologation, through functional tests, material analyses, and metrological analyses. The project’s new website is already online. Moreover, in the course of 2016 the lab completed a full renovation of its bending machines for the execution of rotating bending tests.
MA
rC
hA
pr
iLM
AY
Annual Financial Report 2016 25
JbM MA Automotive, the MA division’s Indian joint venture, was honored by GM India with the General Motors Supplier Quality Excellence Award for Assessment Year 2015.
MW Kingisepp, the Group’s Russian plant for steel wheel production, achieved a record 1,500 accident-free day streak.
MW Kingisepp was awarded the Q1 status, an official recognition by Ford Motor Company testifying how the plant’s quality system satisfied Ford’s demanding quality requisites. The ceremony for the official presentation of the Q1 diploma took place in Kingisepp in February 2017.
ArcelorMittal CLN distribuzione italia through its French subsidiary Acierplus, acquired the facilities of Biars-sur-Cère, Châteaubriant and héricourt, owned by ArcelorMittal distribution Solutions. The plants manufacture semi-finished medium/heavy weight steelwork products for the railway, earth-moving, agriculture, and heavy lifting sectors.
rELEvANt EvENtS AFtEr thE CLoSiNG oF thE FiNANCiAL YEAr
The Lucchini S.p.A. Extraordinary Administration sold MW Italia its Condove plant (ex Vertek) in Susa Valley. The agreement ratified the sale of the company branch consisting in the building complex of Condove and its factory halls, and the hiring of all its current employees starting from 1 March.
MA S.r.l. sold its stocks in Emarc italia to a company belonging to the Baosteel Group.
JULY
oC
to
bEr
dEC
EMb
ErF
Ebr
UA
rY
20
17A
pr
iL2
017
26 MANAGEMENT REPORT
rELAtioNS With rELAtEd pArtiESReference is made to the notes to the financial statements for quantitative and qualitative information regarding relations with Related Parties.
bUSiNESS oUtLooKThe European automotive market trend (+8.4% registrations as of March 2017 compared to the previous year) and the encouraging results achieved in the early months of 2017 by the Group’s divisions allow the Group to look ahead with optimism to the business outlook for 2017.
28 april 2017
Board of directorsthe Chairman
Aurora Magnetto
2CoNSoLidAtEd FiNANCiAL StAtEMENtS For FiNANCiAL YEAr 2016
28 CONSOLIDATED FINANCIAL STATEMENTS
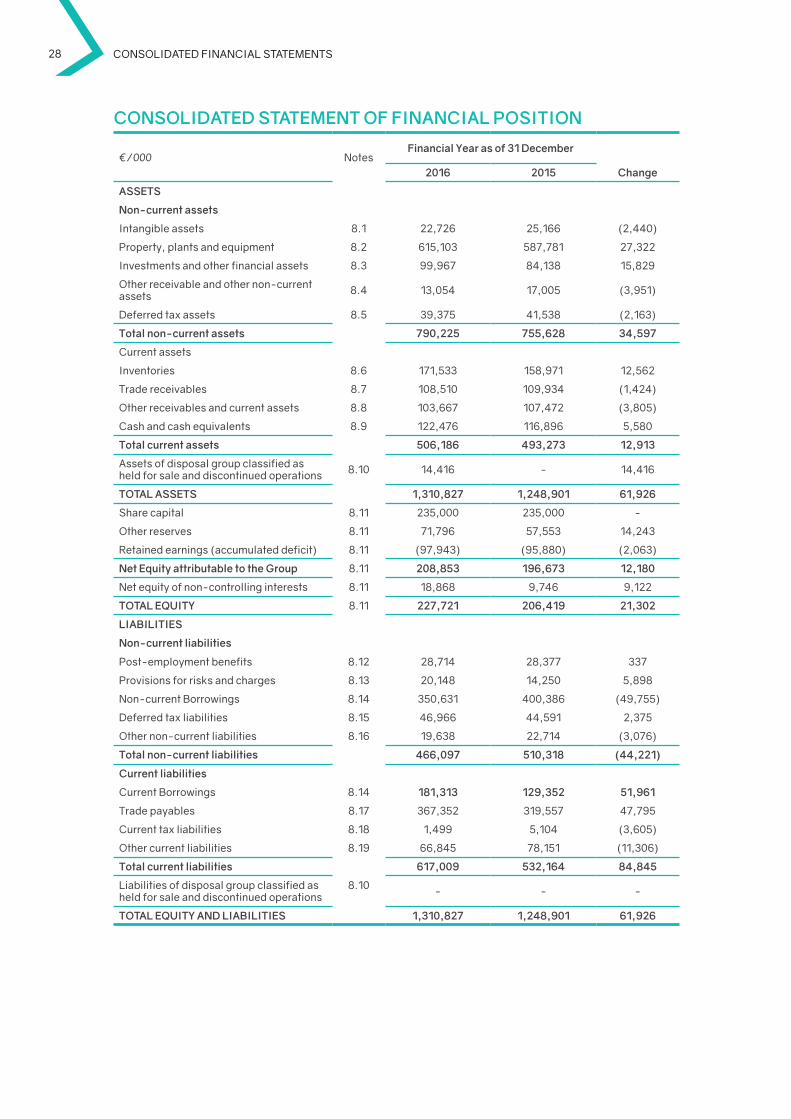
CoNSoLidAtEd StAtEMENt oF FiNANCiAL poSitioN
€/000 notesFinancial Year as of 31 december
2016 2015 Change
ASSEtS
Non-current assets
Intangible assets 8.1 22,726 25,166 (2,440)
Property, plants and equipment 8.2 615,103 587,781 27,322
Investments and other financial assets 8.3 99,967 84,138 15,829
Other receivable and other non-current assets 8.4 13,054 17,005 (3,951)
deferred tax assets 8.5 39,375 41,538 (2,163)
total non-current assets 790,225 755,628 34,597
Current assets
Inventories 8.6 171,533 158,971 12,562
Trade receivables 8.7 108,510 109,934 (1,424)
Other receivables and current assets 8.8 103,667 107,472 (3,805)
Cash and cash equivalents 8.9 122,476 116,896 5,580
total current assets 506,186 493,273 12,913
Assets of disposal group classified as held for sale and discontinued operations 8.10 14,416 - 14,416
totAL ASSEtS 1,310,827 1,248,901 61,926
Share capital 8.11 235,000 235,000 -
Other reserves 8.11 71,796 57,553 14,243
Retained earnings (accumulated deficit) 8.11 (97,943) (95,880) (2,063)
Net Equity attributable to the Group 8.11 208,853 196,673 12,180
net equity of non-controlling interests 8.11 18,868 9,746 9,122
totAL EQUitY 8.11 227,721 206,419 21,302
LiAbiLitiES
Non-current liabilities
Post-employment benefits 8.12 28,714 28,377 337
Provisions for risks and charges 8.13 20,148 14,250 5,898
non-current Borrowings 8.14 350,631 400,386 (49,755)
deferred tax liabilities 8.15 46,966 44,591 2,375
Other non-current liabilities 8.16 19,638 22,714 (3,076)
total non-current liabilities 466,097 510,318 (44,221)
Current liabilities
Current Borrowings 8.14 181,313 129,352 51,961
Trade payables 8.17 367,352 319,557 47,795
Current tax liabilities 8.18 1,499 5,104 (3,605)
Other current liabilities 8.19 66,845 78,151 (11,306)
total current liabilities 617,009 532,164 84,845
Liabilities of disposal group classified as held for sale and discontinued operations
8.10 - - -
totAL EQUitY ANd LiAbiLitiES 1,310,827 1,248,901 61,926
Annual Financial Report 2016 29
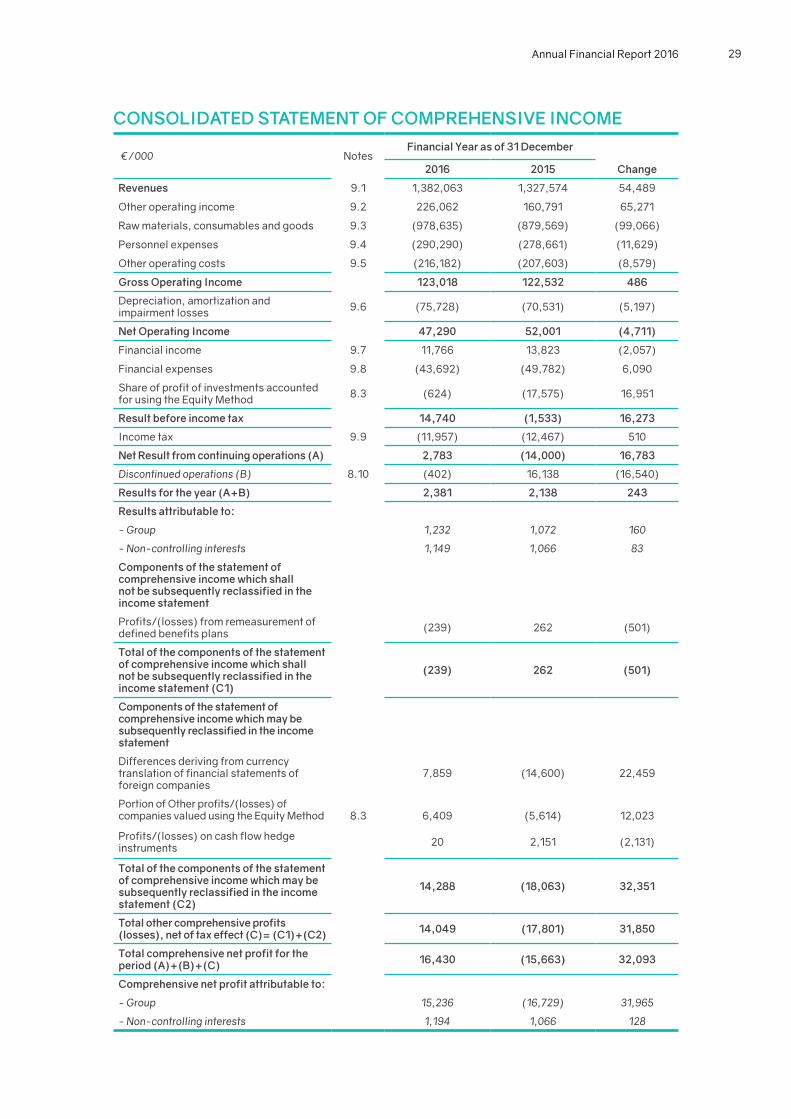
CoNSoLidAtEd StAtEMENt oF CoMprEhENSivE iNCoME
€/000 notesFinancial Year as of 31 december
2016 2015 Change
revenues 9.1 1,382,063 1,327,574 54,489
Other operating income 9.2 226,062 160,791 65,271
Raw materials, consumables and goods 9.3 (978,635) (879,569) (99,066)
Personnel expenses 9.4 (290,290) (278,661) (11,629)
Other operating costs 9.5 (216,182) (207,603) (8,579)
Gross operating income 123,018 122,532 486
depreciation, amortization and impairment losses 9.6 (75,728) (70,531) (5,197)
Net operating income 47,290 52,001 (4,711)
Financial income 9.7 11,766 13,823 (2,057)
Financial expenses 9.8 (43,692) (49,782) 6,090
Share of profit of investments accounted for using the Equity Method 8.3 (624) (17,575) 16,951
result before income tax 14,740 (1,533) 16,273
Income tax 9.9 (11,957) (12,467) 510
Net result from continuing operations (A) 2,783 (14,000) 16,783
Discontinued operations (B) 8.10 (402) 16,138 (16,540)
results for the year (A+b) 2,381 2,138 243
results attributable to:
- Group 1,232 1,072 160
- Non-controlling interests 1,149 1,066 83
Components of the statement of comprehensive income which shall not be subsequently reclassified in the income statement
Profits/(losses) from remeasurement of defined benefits plans (239) 262 (501)
total of the components of the statement of comprehensive income which shall not be subsequently reclassified in the income statement (C1)
(239) 262 (501)
Components of the statement of comprehensive income which may be subsequently reclassified in the income statement
differences deriving from currency translation of financial statements of foreign companies
7,859 (14,600) 22,459
Portion of Other profits/(losses) of companies valued using the Equity Method 8.3 6,409 (5,614) 12,023
Profits/(losses) on cash flow hedge instruments 20 2,151 (2,131)
total of the components of the statement of comprehensive income which may be subsequently reclassified in the income statement (C2)
14,288 (18,063) 32,351
total other comprehensive profits (losses), net of tax effect (C)= (C1)+(C2) 14,049 (17,801) 31,850
total comprehensive net profit for the period (A)+(b)+(C) 16,430 (15,663) 32,093
Comprehensive net profit attributable to:
- Group 15,236 (16,729) 31,965
- Non-controlling interests 1,194 1,066 128
30 CONSOLIDATED FINANCIAL STATEMENTS
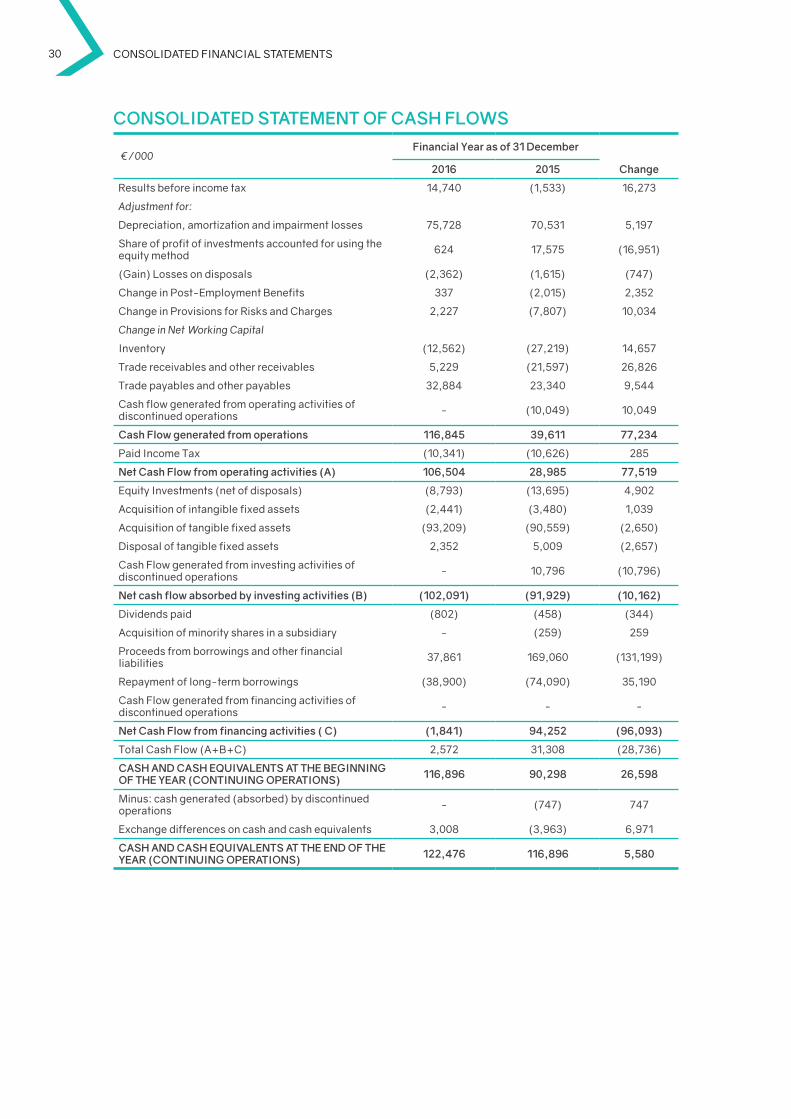
CoNSoLidAtEd StAtEMENt oF CASh FLoWS
€/000Financial Year as of 31 december
2016 2015 Change
Results before income tax 14,740 (1,533) 16,273
Adjustment for:
depreciation, amortization and impairment losses 75,728 70,531 5,197
Share of profit of investments accounted for using the equity method 624 17,575 (16,951)
(Gain) Losses on disposals (2,362) (1,615) (747)
Change in Post-Employment Benefits 337 (2,015) 2,352
Change in Provisions for Risks and Charges 2,227 (7,807) 10,034
Change in NetWorking Capital
Inventory (12,562) (27,219) 14,657
Trade receivables and other receivables 5,229 (21,597) 26,826
Trade payables and other payables 32,884 23,340 9,544
Cash flow generated from operating activities of discontinued operations - (10,049) 10,049
Cash Flow generated from operations 116,845 39,611 77,234
Paid Income Tax (10,341) (10,626) 285
Net Cash Flow from operating activities (A) 106,504 28,985 77,519
Equity Investments (net of disposals) (8,793) (13,695) 4,902
Acquisition of intangible fixed assets (2,441) (3,480) 1,039
Acquisition of tangible fixed assets (93,209) (90,559) (2,650)
disposal of tangible fixed assets 2,352 5,009 (2,657)
Cash Flow generated from investing activities of discontinued operations - 10,796 (10,796)
Net cash flow absorbed by investing activities (b) (102,091) (91,929) (10,162)
dividends paid (802) (458) (344)
Acquisition of minority shares in a subsidiary - (259) 259
Proceeds from borrowings and other financial liabilities 37,861 169,060 (131,199)
Repayment of long-term borrowings (38,900) (74,090) 35,190
Cash Flow generated from financing activities of discontinued operations - - -
Net Cash Flow from financing activities ( C) (1,841) 94,252 (96,093)
Total Cash Flow (A+B+C) 2,572 31,308 (28,736)
CASh ANd CASh EQUivALENtS At thE bEGiNNiNG oF thE YEAr (CoNtiNUiNG opErAtioNS) 116,896 90,298 26,598
Minus: cash generated (absorbed) by discontinued operations - (747) 747
Exchange differences on cash and cash equivalents 3,008 (3,963) 6,971
CASh ANd CASh EQUivALENtS At thE ENd oF thE YEAr (CoNtiNUiNG opErAtioNS) 122,476 116,896 5,580
Annual Financial Report 2016 31
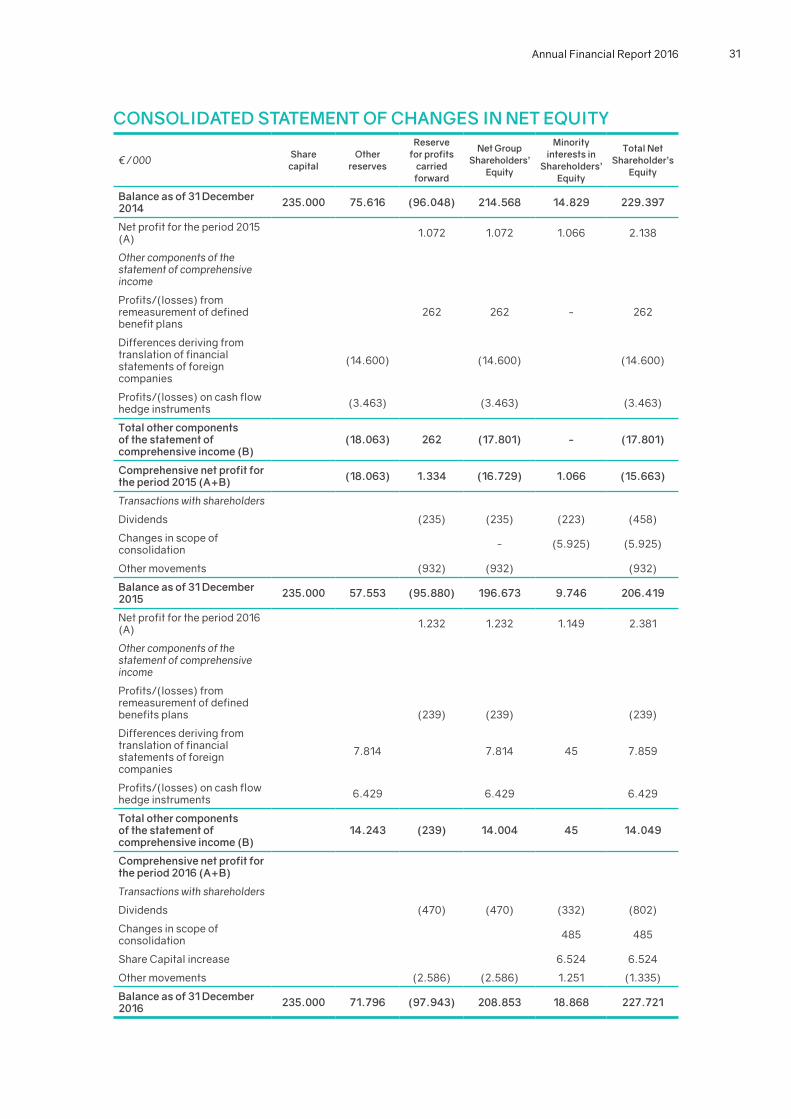
CoNSoLidAtEd StAtEMENt oF ChANGES iN NEt EQUitY
€/000 Share capital
other reserves
reserve for profits
carried forward
Net Group Shareholders’
Equity
Minority interests in
Shareholders’ Equity
total Net Shareholder’s
Equity
balance as of 31 december 2014 235.000 75.616 (96.048) 214.568 14.829 229.397
net profit for the period 2015 (A) 1.072 1.072 1.066 2.138
Other components of the statement of comprehensive income
Profits/(losses) from remeasurement of defined benefit plans
262 262 - 262
differences deriving from translation of financial statements of foreign companies
(14.600) (14.600) (14.600)
Profits/(losses) on cash flow hedge instruments (3.463) (3.463) (3.463)
total other components of the statement of comprehensive income (b)
(18.063) 262 (17.801) - (17.801)
Comprehensive net profit for the period 2015 (A+b) (18.063) 1.334 (16.729) 1.066 (15.663)
Transactions with shareholders
dividends (235) (235) (223) (458)
Changes in scope of consolidation - (5.925) (5.925)
Other movements (932) (932) (932)
balance as of 31 december 2015 235.000 57.553 (95.880) 196.673 9.746 206.419
net profit for the period 2016 (A) 1.232 1.232 1.149 2.381
Other components of the statement of comprehensive income
Profits/(losses) from remeasurement of defined benefits plans (239) (239) (239)
differences deriving from translation of financial statements of foreign companies
7.814 7.814 45 7.859
Profits/(losses) on cash flow hedge instruments 6.429 6.429 6.429
total other components of the statement of comprehensive income (b)
14.243 (239) 14.004 45 14.049
Comprehensive net profit for the period 2016 (A+b)
Transactions with shareholders
dividends (470) (470) (332) (802)
Changes in scope of consolidation 485 485
Share Capital increase 6.524 6.524
Other movements (2.586) (2.586) 1.251 (1.335)
balance as of 31 december 2016 235.000 71.796 (97.943) 208.853 18.868 227.721
3 NotES to thE CoNSoLidAtEdFiNANCiALStAtEMENt
1. ovErviEW C.L.n. S.p.A. (“the Company” or “CLn”) and its subsidiaries (the “CLn Group” or “the Group”) operate in the transformation and marketing of flat steel products in several application fields. The Group’s activities span from the automotive sector (vehicle component stamping and assembly) to steel wheels for any other vehicle type, from home appliances to earth-moving machines, and in general in all application sectors of steel.
CLn has been operating in the steel sector since 1948. Today the Group - with all its divisions and companies - is an integrated enterprise leader in the following sectors:
Metalforming: stamping, roll forming and assembly of metal components for the automotive market; dies design and building, component testing.
Wheels: engineering and manufacturing of steel wheels for cars and light commercial vehicles; wheel distribution; wheel validation through functional tests, material analysis and metrological analysis.
Steel: processing and distribution of flat steel products.
The Group’s industrial heart mainly consists of three divisions operating in the metal automotive components sector:
MA division – the Metal Automotive Components Division – is one of the main global suppliers of metal parts, stamped and roll formed components (external and structural), as well as welded parts, for any type of car and commercial vehicle in the automobile industry. It is present in Europe, Turkey, South Africa and Latin America with important partnerships in China and India.
MW division – the Steel Wheel Division – is a market leader in the sector of steel wheels for all types of vehicles (cars and light commercial vehicles), supplying clients with complete solutions for engineered wheels. Moreover, it is one of the main producers of rims for off-road motorcycles. The division has facilities in Europe, Russia, Japan and South Africa, as well as joint ventures in Turkey, Malaysia and Mexico.
Furthermore, the Group is active in the sector of flat steel product cold re-rolling. Through the ArcelorMittal CLn Group, it is a leader in the manufacturing and distribution of service center flat steel products in Italy. The steel re-rolling and distribution activities (both from the Group’s direct control and from the ArcelorMittal CLn joint venture) report to the SSC division.
Annual Financial Report 2016 33
C.L.n. S.p.A. is a company incorporated and based in Italy and organized according to the legal system of the Republic of Italy. The registered office of the company is in Caselette (TO), Corso Susa 13/15.
2. SUMMArY oF thE AdoptEd ACCoUNtiNG StANdArdSShown below are the main criteria and accounting standards applied when preparing and drawing up the consolidated financial statements for the Group (“Consolidated Financial Statements”). These accounting standards were applied consistently for all the financial years presented in this document.
2.1 bASiS oF prEpArAtioN European Regulation (EC) no. 1606/2002 of 19 July 2002 introduced the obligation, starting from financial year 2005, to apply the International Financial Reporting Standards (“IFRS”). These were issued by the International Accounting Standards Board (“IASB”) and adopted by the European union (“Eu IFRS” or “International Accounting Standards) for drawing up consolidated financial statements of companies having equity and/or debt securities listed in one of the regulated markets of the European Community. On 31 July 2015, CLn issued a bond worth a nominal amount of EuR 100 million fully subscribed under private placement by Morgan Stanley in its role as sole underwriter, and proceeded with listing it on the Irish Stock Exchange. In compliance with the legislative provisions recalled above, CLn is therefore bound to drawing up the consolidated financial statements and financial statements for the year in accordance with the Eu IFRS starting from the financial year closed on 31 december 2015.
The date of transition to the IFRS was thereby identified as 1st January 2014 (the “date of Transition”).
The present financial statements were drawn up in conformity with the Eu IFRS in force on the approval date. Eu IFRS include all the “International Financial Reporting Standards”, all the “International Accounting Standards” (IAS) and all interpretations of the “International Reporting Interpretations Committee (IFRIC)”, formerly called the “Standing Interpretations Committee (SIC)”, approved and adopted by the European union.
Furthermore, it should be mentioned that the Eu IFRS were applied in a consistent manner to all the periods presented in this document. These consolidated financial statements were drawn up according to the best knowledge of the Eu IFRS and considering the best doctrine on the matter. Any future orientations and interpretative updates shall be reflected in subsequent financial years, according to the procedures established by the accounting standards of reference from time to time.
These consolidated financial statements were drawn up with a view to corporate continuity and based on the conventional criterion of historical cost, with the exception of some accounts entries that are recognized at fair value, in accordance with the provisions contained in the International Accounting Standards.
The present consolidated financial statements were approved by the Board of directors of the Company on 28 April 2017.
34 Notes to the fiNaNcial statemeNts
2.2 ForM ANd CoNtENt oF thE ACCoUNtS StAtEMENtSIn relation to the form and content of the consolidated accounts statements, the Group made the following choices:
a. the Consolidated Statement of Financial Position separately shows current and non-current assets, and similarly shows current and non-current liabilities;
b. the Consolidated Statement of Comprehensive Income gives a classification of costs and revenues by nature;
c. the Consolidated Statement of Cash Flows is shown according to the indirect method.
The Company has chosen to draw up a statement of comprehensive income which includes both the net profit for the period and changes in net equity depending on economic entries classified under the components of the net equity by express provision of the International Accounting Standards.
The structure used, as specified above, is the one which best represents the Group’s financial position, results, equity and cash flow situation.
These financial statements were drawn up in Euros, the Group’s operating currency. The values shown in the balance sheets as well as in the detailed tables included in the explanatory notes are expressed in thousands of Euros, unless indicated otherwise.
These financial statements are subject to auditing by the audit company PricewaterhouseCoopers S.p.A., the audit firm of the Company and the Group.
2.3 ArEA oF CoNSoLidAtioN ANd itS ChANGESThese consolidated financial statements include the financial statements for the year of the parent company C.L.n. S.p.A. and the financial statements for the year for the subsidiaries, approved by the respective governing bodies. Such financial statements have been appropriately adjusted, where necessary, in order to standardize them with the accounting principles of the Parent Company and the Eu IFRS.
A list of the companies included in the area of consolidation as of 31 december 2016 and 2015 with an indication of share capital and the method of consolidation used for preparing the consolidated financial statements for the Group are indicated in attachments 1 to 4 to this document.
2.4 priNCipLES oF CoNSoLidAtioNThe criteria adopted by the Group for defining the area of consolidation and related consolidation principles are explained below.
SubsidiariesSubsidiaries are companies that are controlled by the Group. The Group controls a company when it is exposed to the variability of the results for such company and has the power to affect the results by means of its power over the company. Generally speaking, the existence of control is presumed when the Company holds, directly or indirectly, more than half the voting rights, also considering potentially exercisable or convertible voting rights.
All subsidiaries are consolidated using the full consolidation method from the date in which the control was transferred to the Group. They are excluded from consolidation starting from the date on which such control ceases to exist.
Annual Financial Report 2016 35
The Group uses the acquisition method for accounting corporate aggregations. According to this method:
a. The amount transferred with a corporate aggregation is valued at fair value, calculated as the sum of the fair value of the transferred assets and liabilities assumed by the Group on the date of acquisition, as well as the capital instruments issued in exchange for control of the acquired company. Supplementary expenses of the transition are recognized in the income statement at the time they were sustained.
b. At the date of acquisition, the identifiable assets acquired and liabilities assumed are recognized at their fair value as of the date of acquisition. Exceptions to this are the deferred tax assets and liabilities, assets and liabilities for employee benefits, liabilities or capital instruments concerning payments based on shares of the acquired company or share-based payments related to the Group issued in replacement of contracts of the acquired company, and the assets (or groups of assets and liabilities) bound for sale, which, unlike the other assets, are valued according to their reference principle.
c. Goodwill is defined as the excess of the total compensation transferred with the corporate aggregation, the value of the net equity belonging to third party minority interests, and the fair value of any stakes previously held in the acquired company compared to the fair value of the net assets and liabilities received on the date of acquisition. If the value of the net assets and liabilities received on the date of acquisition exceeds the total of the transferred compensation, the value of the net equity belonging to minority interests, and the fair value of any stakes held previously in the acquired company, such excess is recognized in the income statement immediately as income deriving from the concluded transaction.
d. Any compensations subjected to conditions posed by the corporate aggregation contract are estimated at fair value on the date of acquisition, and they are included in the value of the compensations transferred with the corporate aggregation for the purposes of defining goodwill.
In the case of corporate aggregations taking place in stages, the stake previously held in the acquired company is revalued at fair value on the date of control acquisition, and any consequent profits or losses are included in the income statement.
Should the initial values of a corporate aggregation be incomplete on the date of closure of the financial statements for the year in which the corporate aggregation took place, the Group will include in its consolidated financial statements the provisional values of the elements that cannot be transferred. The provisional values are adjusted during the measurement period to account for new information obtained concerning facts and circumstances that existed as at the date of acquisition and that, if known, could have affected the value of the assets and liabilities recognized on such date.
Associated companiesAssociated companies are those regarding which the Group exercises a notable influence, which is presumed to exist when the holding is between 20% and 50% of the voting rights. Shareholdings in associated companies are estimated using the equity method. Such criterion can be described as follows:
a. The profits and losses for the Group are booked from the date on which the notable influence or joint control began until the date on which they end. Should a company valued through the method described above record a negative net equity by effect of the losses, the book value of such holding is written-off; any excess pertaining to the Group, if the latter has committed to fulfilling the legal or implied obligations of the associated company, or in any case to cover the losses, is recognized in a specific provision.
36 Notes to the fiNaNcial statemeNts
b. unrealized profits and losses generated on operations carried out between the parent company and the associated company valued using the net equity method are eliminated according to the value of the shareholding of the Group in the associated company. unrealized losses are eliminated except in case they represent a reduction in value.
Other companiesInvestments in other companies (lower than 20% of voting rights) are evaluated using the equity method if the financial information are available. Otherwise, these investments are recorded using cost method adjusted in case of impairment losses. Any investments in listed companies are instead evaluated at fair value represented by the related year-end stock value.
Joint arrangementsThe Group applies IFRS 11 when assessing joint control arrangements. In accordance with the provisions contained in IFRS 11, a joint control agreement can be classified as both a joint operation and a joint venture depending on a substantial analysis of the parties’ rights and obligations. Joint ventures are joint control agreements in which the parties, or joint ventures holding joint control, avail, amongst others, of rights on the net assets of the agreement. Joint operations are joint control agreements attributing to the participants both rights on the assets and obligations on the liabilities related to such agreement. Joint ventures are booked using the net equity method, whereas investments in a joint operation entail the acquisition of the assets/liabilities and costs/revenues associated to the agreement based on the rights/obligations of competence, regardless of the participatory interest held.
Currency translation of the financial statements of foreign companiesThe financial statements of subsidiaries are drawn up using the currency of the primary economic environment in which they operate. The rules for translating financial statements expressed in currencies other than the Euro are the following:
a. Assets and liabilities are translated using the exchange rates existing as at the date of reference of the financial statements.
b. Costs and revenues are translated at the average exchange rate for the period.c. The “translation reserve” included among the items of the statement of
comprehensive income includes both the exchange rate difference generated by the conversion of financial values at a different exchange rate from that of closure, and those generated by the conversion of net opening equities at an exchange rate different from the rate at the closure of the final accounting period;
d. Goodwill and fair value adjustments related to the acquisition of a foreign entity, if existing, are treated as assets and liabilities of the foreign entity and translated using the exchange rate of the closing of the period.
Exchange rates used for conversion of the financial and income values into Euros for companies having an operating currency other than the Euro have been the following so far:
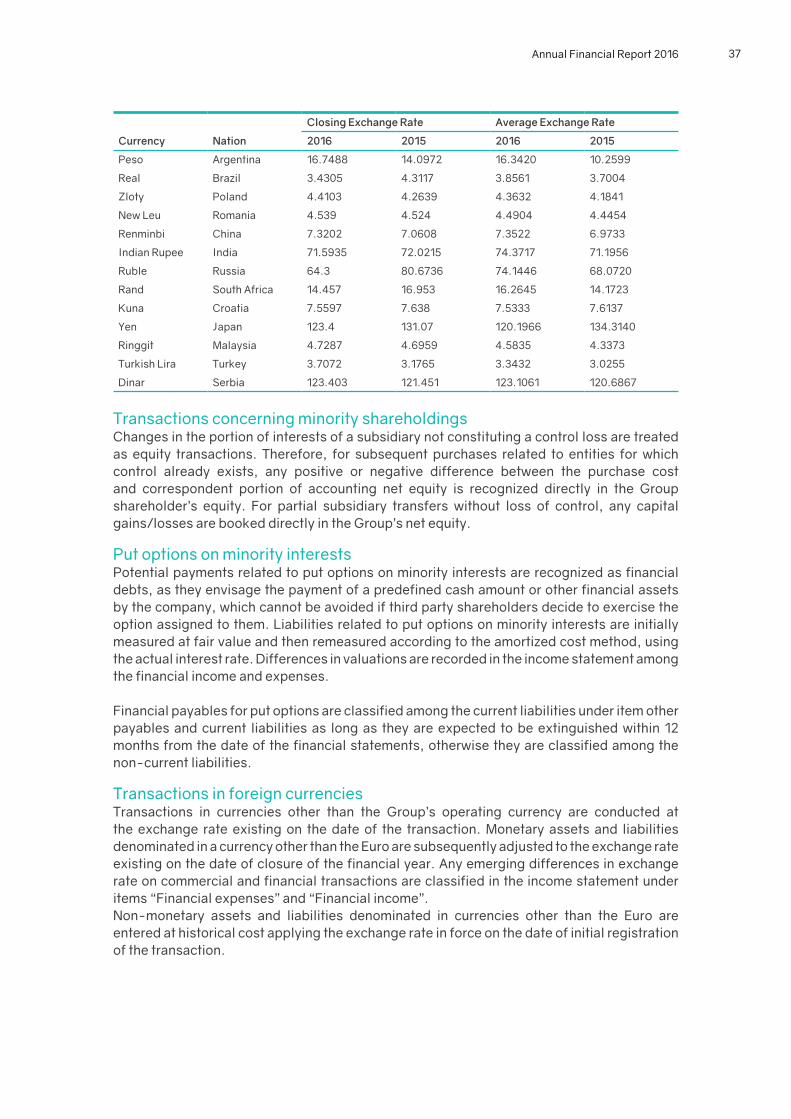
Annual Financial Report 2016 37
Closing Exchange rate Average Exchange rate
Currency Nation 2016 2015 2016 2015
Peso Argentina 16.7488 14.0972 16.3420 10.2599
Real Brazil 3.4305 4.3117 3.8561 3.7004
Zloty Poland 4.4103 4.2639 4.3632 4.1841
new Leu Romania 4.539 4.524 4.4904 4.4454
Renminbi China 7.3202 7.0608 7.3522 6.9733
Indian Rupee India 71.5935 72.0215 74.3717 71.1956
Ruble Russia 64.3 80.6736 74.1446 68.0720
Rand South Africa 14.457 16.953 16.2645 14.1723
Kuna Croatia 7.5597 7.638 7.5333 7.6137
Yen Japan 123.4 131.07 120.1966 134.3140
Ringgit Malaysia 4.7287 4.6959 4.5835 4.3373
Turkish Lira Turkey 3.7072 3.1765 3.3432 3.0255
dinar Serbia 123.403 121.451 123.1061 120.6867
Transactions concerning minority shareholdingsChanges in the portion of interests of a subsidiary not constituting a control loss are treated as equity transactions. Therefore, for subsequent purchases related to entities for which control already exists, any positive or negative difference between the purchase cost and correspondent portion of accounting net equity is recognized directly in the Group shareholder’s equity. For partial subsidiary transfers without loss of control, any capital gains/losses are booked directly in the Group’s net equity.
Put options on minority interestsPotential payments related to put options on minority interests are recognized as financial debts, as they envisage the payment of a predefined cash amount or other financial assets by the company, which cannot be avoided if third party shareholders decide to exercise the option assigned to them. Liabilities related to put options on minority interests are initially measured at fair value and then remeasured according to the amortized cost method, using the actual interest rate. differences in valuations are recorded in the income statement among the financial income and expenses.
Financial payables for put options are classified among the current liabilities under item other payables and current liabilities as long as they are expected to be extinguished within 12 months from the date of the financial statements, otherwise they are classified among the non-current liabilities.
Transactions in foreign currenciesTransactions in currencies other than the Group’s operating currency are conducted at the exchange rate existing on the date of the transaction. Monetary assets and liabilities denominated in a currency other than the Euro are subsequently adjusted to the exchange rate existing on the date of closure of the financial year. Any emerging differences in exchange rate on commercial and financial transactions are classified in the income statement under items “Financial expenses” and “Financial income”.non-monetary assets and liabilities denominated in currencies other than the Euro are entered at historical cost applying the exchange rate in force on the date of initial registration of the transaction.
38 Notes to the fiNaNcial statemeNts
Consolidating discontinued operationsFor what concerns the method of representation of discontinued Operations required under IFRS 5, it should be specified that these were included in the consolidation area. Therefore, the comprehensive balances of the Group were determined by applying all due eliminations of the economic and financial transactions that took place between Continuing and discontinued Operations. More detail is given in the following paragraphs.
The single items of the income statement related to Continuing Operations and single items of detail concerning net profit/(loss) of the discontinued Operations shown in these financial statements are presented without considering the elimination of intergroup transactions completed between the two Operations, whereas the item profit/(loss) for the period includes the comprehensive effects of the elimination of such transactions.
At the financial/cash flow level, the consolidation of Continuing and discontinued Operations implies the elimination of intergroup transactions completed between them, as described previously, so that the totals entered under Continuing Operations and discontinued Operations represent the balances of the assets and liabilities resulting from transactions with subjects outside of the Group. As a result, such balances may not be representative of the financial and cash flow situation of the Group subsequent to the effective termination of the discontinued Operations.
2.5 CritEriA oF vALUAtioN
Goodwill and other intangible assetsGoodwill deriving from corporate aggregations is initially entered as the cost on acquisition date. Goodwill is not amortized, but it does undergo assessments in order to identify any value reductions on an annual basis or even more frequently, if specific events or changing circumstances indicate the possibility that it has suffered a loss in value. After the initial acquisition, goodwill is valued at cost net of any accumulated losses in value.
The other intangible assets are formed of non-monetary elements, identifiable and devoid of physical substance, controllable and able to generate future economic benefits. Such elements are disclosed at purchase and/or production cost, including expenses directly attributable to preparing the asset for its use, net of accumulated amortizations and any losses in value. The other intangible assets of the Group mainly include costs for the development of new products, licenses and patents. development costs concerning new products in the Wheels division are only entered under assets if all the following conditions are observed (as per IAS 38 under “Intangible Assets”): the costs can be determined in a reliable manner, and the technical feasibility of the product as well as the predicted volumes and prices indicate that the costs sustained during the development phase will generate future economic benefits. Capitalized development costs include all direct and indirect costs that can be attributed directly to the development process. Licenses and patents are recognized at purchase cost and then measured at cost net of losses in value and amortization reserves.The amortization of the other intangible fixed assets begins once the asset is available for use and is systematically divided in relation to the remaining possibility of its use, that is to say, depending its estimated useful life.Amortization rates applied vary between 10% and 20%.
Property, plant and equipmentProperty, plant and equipment are valued at purchase or production cost, net of accumulated
Annual Financial Report 2016 39
depreciations and any losses in value. The cost includes expenses directly sustained in order to make their use possible, as well as any dismantling and removal expenses that could be sustained as a consequence of contractual obligations requiring that the asset be restored to its original conditions.
The financial expenses directly attributable to the acquisition, construction or production of an asset justifying capitalization pursuant to IAS 23 are capitalized on such asset as part of its cost.
Expenses sustained for ordinary and/or cyclic maintenance and repair are directly inscribed in the income statement when sustained. Capitalization of costs concerning expansion, modernization or improvement of the structural elements owned or used by third parties is performed within the limits in which they fulfil the requisites for being separately classified as an asset or part of an asset.
Improvements on third party assets include costs sustained for the fitting and modernization of properties possessed for reasons other than ownership.
Amortizations are calculated at constant quotas by means of rates allowing the assets to be amortized until the end of their useful life.
The useful life estimated by the Group for each class of property, plant and equipment is shown below:
tax rate %
Buildings 3% - 10%
Forming presses 5% - 10%
Plant and machinery 6.7% - 20%
Industrial and commercial equipment 6.7% - 16.7%
Other assets 10% - 20%
Improvements on third party assets The lesser between remaining duration of the lease agreement and useful life of improvements
LeasingProperty, plant and equipment kept by virtue of finance lease agreements, by means of which the risks and benefits associated to ownership are substantially transferred to the Group, are recognized as assets of the Group at their current value or, if lower, at the current value of the minimum payments due for the lease, including any amount to be paid for exercising the purchase option. Assets are amortized by applying the above described criteria and rates for tangible fixed assets, unless the duration of the lease agreement is shorter than the useful life represented by such rates and there is no reasonable certainty of transferring ownership of the leased asset on the natural expiry of the agreement. In this case, the period of amortization shall be represented by the duration of the lease agreement.
Leases in which the lessor effectively maintains the risks and benefits associated to ownership are classified as operating leases. The minimum guaranteed fees for operating leases are linearly disclosed in the income statement throughout the duration of the lease agreement, also considering any periods of renewal, if from the very start of the agreement there is reasonable certainty that the lessee will exercise such option. Potential lease fees, on the contrary, are disclosed in the income statement as they appear.
40 Notes to the fiNaNcial statemeNts
Impairment of intangible and tangible assetsAt least once a year, the Group assesses recoverability of the book value of intangible assets with a defined useful life and of property, plants and equipment, in order to determine whether any indicators suggest that such assets have suffered a loss in value. If such evidence exists, the book value of the asset is reduced to their recoverable value.When it is not possible to estimate the recoverable value of a single asset, the Group estimates the recoverable value of the cash-flow generating unit to which the asset belongs. The recoverable value of an asset is the higher amount between its fair value net of the sale costs and its value of use. In order to determine the value of use of an asset, the Group calculates the current value of future estimated financial flows, gross of taxes, applying a discount rate, before tax, which reflects the current market valuations of the temporal value of money and the specific risks of the activity. A loss in value is entered if the recoverable value is lower than the book value.When the circumstances that caused the loss are no longer valid, the book value of the asset is increased up to its recoverable value. Such value cannot be higher than the total which would have been determined if no loss due to value reduction had been identified. The recovery of a loss in value is entered in the income statement immediately.
Trade receivables and other current and non-current assetsTrade receivables and other current and non-current receivables are defined as financial instruments mainly concerning credits from clients, not derivative and not listed on an active market, from which fixed or definable payments are expected. Trade receivables and other receivables are classified in the balance sheet among the current assets, with the exception of those having contractual expiry longer than twelve months from the date of the balance sheet, which are classified in the non-current assets.Such long-term receivables are entered among the balance sheet assets once the company becomes part of the contracts associated to them, and they are eliminated from the balance sheet assets when the right to receive cash flows is transferred together with all the risks and benefits associated to the transferred asset.Trade receivables and other current and non-current assets are originally entered at their fair value, and later at their amortized cost using the effective interest rate reduced for any losses in value.Receivables losses in value are booked in the income statement when objective evidence is found that the Group will not be able to recover the credit based on contractual terms.The amount of the devaluation is measured as the difference between the book value of the asset and the actual value of expected future financial flows.The value of the receivables is shown in the balance sheet net of the related provision for loss.
Investments held to maturityInvestments held to maturity are non-derivative financial assets with fixed or definable payments and not listed on an active market, which the company intends to keep until expiry. Such financial assets are classified among the current assets if their expiry effectively takes place within 12 months, otherwise they are classified among the non-current assets. Investments are initially acquired at fair value, including the additional costs to the transaction. After initial acquisition, financial assets held to maturity are valued at the amortized cost with the criterion of effective interest rate and are subject to assessment regarding value reduction.
On every balance sheet date, the Group assesses whether there is objective evidence that an investment or group of investments has lost value. An investment or group of investments has lost value and must be devalued if and only if there is objective evidence of the loss in value as a consequence of events subsequent to the first booking of the investment, and
Annual Financial Report 2016 41
of the fact that the loss has an impact on reliably predicted future cash flows. Objective evidence of losses in value of the asset can be found in the following circumstances:
a. Significant financial difficulties of the debtor.b. Contractual non-fulfillments, such as insolvency in the payment of interests or
capital.c. The creditor, for economic or legal reasons connected to the financial difficulties
of the debtor, grants the debtor subsidies which they would not have taken into consideration otherwise.
d. The debtor is likely to become bankrupt or subject to arrangement with creditors.e. disappearance of the financial assets from an active market.
InventoriesStocks of raw materials, semi-finished goods and finished products are valued at the lower amount between cost and the net realizable value, the cost being determined with the First In-First Out method (FIFO). The valuation of Inventories includes both the direct and indirect (variable and fixed) costs of materials and work. Write-down provisions are calculated for materials, finished products, spare parts and other supplies considered as obsolete or slow-moving, considering their expected future use and realizable value. The realizable value is the estimated price of sale during normal management, net of all the costs estimated for the completion of the goods and costs of sale and distribution to be sustained.
Contract work in progress related to dies are valued according to their percentage of completion based on the ratio between job order costs sustained on the date of the balance sheet and the estimate of total costs. These are shown net of payments on account billed to clients. Any losses on such contracts are disclosed in the income statement at their full amount once they are known of.
derivative financial instrumentsAll derivative financial instruments (including implicit, so-called embedded, derivatives) are measured at fair value.
The Group uses derivative financial instruments to cover risks concerning exchange rates and changes in interest rates. As established by IAS 39, derivative financial instruments can be booked according to the methods established for hedge accounting only when:
• formal designation and the documents for such hedge account exist at the start of cover;
• it is presumed that coverage is highly efficient;• efficiency can be reliably measured;• such hedge is highly efficient during the various accounting periods for which it is
designated.When the derivative instruments qualify to be booked under hedge accounting, the following accounting treatments are applied:
a. Fair value hedge – if this is a derivative financial instrument designated for the purposes of hedging exposure to changes in the current value of an entered asset or liability, the changes in the fair value of the hedge derivative are included in the income statement coherently with the valuation of the fair value of the assets and liabilities subject matter of cover.
b. Cash flow hedge – when this is a derivative financial instrument designated for the purposes of hedging exposure to the variability of the cash flows of an asset or liability in the balance sheet or a transaction predicted as highly likely and which
42 Notes to the fiNaNcial statemeNts
could have effects on the income statement, the effective portion of profits or losses on the financial instrument which is recognized in the shareholder’s equity; the accumulated profit or loss are transferred from the shareholder’s equity and booked in the income statement during the same period in which the transaction subject matter of hedging is disclosed; the profit or loss associated to a hedge, or that part of the hedge that has become inefficient, are entered in the income statement when the inefficiency is established.
If conditions are not met for applying hedge accounting, the changes in fair value of the derivative financial instrument are attributed to the income statement.
determining the fair value of financial instrumentsThe fair value of the financial instruments listed in an active market is based on the market prices as of the date of the financial statements. The fair value of financial instruments not listed in an active market is instead determined by using valuation techniques based on methods and assumptions associated to market conditions as of the date of the financial statement.
Operating segment informationThe information related to the segments of activity was drawn up according to the provisions of IFRS 8 “Operating Segments”, which prescribe the presentation of relevant information in compliance with the procedures adopted by the management for taking operational decisions. The identification of operating segments and the information presented are defined according to internal reports used by the management for the purposes of allocating resources to the various segments and for analyzing the related performances. IFRS 8 defines an operating segment as a component of an entity which: (i) engages in business activities from which it may earn revenues and incur expenses (including revenues and expenses related to transactions with other components of the same entity); (ii) whose operating results are reviewed regularly by the entity’s chief operating decision maker to make decisions about resources to be allocated to the segment and assess its performance; (iii) for which discrete financial information is available.The operating segments identified by the management, within which all the main services and products supplied to clients merge, are identified with the three main divisions of the Group:
MA division
MW division
SSC division
Cash and Cash EquivalentsCash and Cash Equivalents include cash, bank current accounts, refundable deposits on demand and other short-term financial investments with high liquidity which can be readily convertible into cash or transformed into liquid assets within 90 days from the date of original acquisition and which are subject to a non-significant risk of variation in value.
Financial liabilities, trade payables and other liabilitiesFinancial liabilities (excluding derivative financial instruments), trade payables and other payables are initially entered at fair value, net of supplementary costs of direct imputation, and are valued thereafter at their amortized cost, applying the criterion of the effective interest rate. If there is a predictable change in expected cash flows, the value of the liability is recalculated to reflect such change based on the actual value of new expected cash flow and the internal return rate as initially determined. Financial liabilities are classified among current liabilities unless the Group has an
Annual Financial Report 2016 43
unconditional right to defer their payment for at least 12 months after the date of reference.Financial liabilities are removed from the balance sheet upon their extinction and when the Group has transferred all the risks and charges related to such instrument.Significant changes to financial liabilities giving rise to a difference of at least 10% between the actual value of the net cash flows at the new conditions and the value of the remaining cash flows of the original liability, discounted with the effective interest rate of the original debt or a relevant change in the characteristics of the financial liability, lead to the extinction of the financial liability and the recognition of a new one. under such circumstance, any costs or expenses sustained are included as part of the profits or losses connected to the extinction, except in case they are strictly related to the acquisition of the new financial liability and, therefore, amortized throughout its duration.In case the change is not defined as an extinction, any costs or expenses sustained modify the book value of the liability and are amortized on the remaining term of the modified liability.
Provisions related to personnelProvisions related to personnel include: i) defined contribution plans and ii) defined benefit plans.With reference to defined contribution plans, the costs related to such plans are included in the income statement when sustained.With reference to defined benefit plans, the Group’s net liabilities are determined separately for each plan, estimating the actual value of the future benefits that employees have accrued during the current financial year and previous years, and deducing the fair value of any assets serving the plan. The current value of the obligations is based on the use of actuarial methods attributing the benefit deriving from the plan to the periods in which the obligation to issue it arises (Projected unit Credit Cost Method) and is based on actuarial assumptions which are objective and mutually comparable. Assets serving the plan are included and valued at fair value.Should a potential asset be established by such calculation, the amount to be credited is limited to the actual value of each economic benefit available under the form of future refunds or reductions in future contributions to the plan (limit of the asset).The components of the cost of defined benefits are the following:
• Costs related to provided services are included in the income statement under item “staff costs”.
• The net financial expenses on the liability or asset with defined benefit are included in the income statement as “Financial income/(expenses)” and are defined by multiplying the value of the net asset/(liability) by the rate used for actualizing the obligations, considering payments of contributions and benefits that took place during the period.
• The components for remeasuring the net liability, which include actuarial profits and losses, the performance of the asset (excluding active interests included in the Income statement) and any changes in the limit of the asset are entered under Other comprehensive profits (losses) immediately. Such components must not be reclassified in the Income statement in a subsequent period.
Provisions for risks and chargesProvisions for risks and charges are entered in case of losses and expenses of a defined nature, of certain or probable existence, regarding which, nonetheless, the total amount and/or date of occurrence cannot be defined.Such provisions are only entered when there is a current obligation (legal or implicit) for a future outgoing of economic resources as a result of past events and such outgoing is likely to be required in order to fulfill the obligation. Such amount represents the best estimate of the charge in order to extinguish the obligation. The rate used when determining the current value of the liabilities reflects the current market values and considers the specific risk that can be associated to each liability.
44 Notes to the fiNaNcial statemeNts
When the financial effect of time is significant and the payment dates of the obligations can be reliably estimated, the funds are assessed at the current value of the envisaged disbursement using a rate that reflects market conditions, variation of the cost of money over time, and the specific risk linked to the obligation. The increase in value of the fund determined by variations in the cost of money over time is accounted for as a payable interest.Risks for which the appearance of a liability is only possible are indicated in a dedicated informatory section on potential liabilities, and no provisions are made for them.
Government grantsGovernment grants are included at their fair value when there is a reasonable certainty that all the conditions necessary for obtaining them are satisfied and that they shall be received. Grants received for specific expenses are entered as liabilities and credited to the income statement using a systematic criterion in the financial years necessary to match them with the related expenses. Grants received for specific assets whose value is entered among the fixed assets are entered as non-current liabilities and credited to the Income statement in relation to the period of amortization of the asset to which they refer.
Assets and liabilities held for sale and discontinued OperationsAssets and liabilities held for sale and discontinued operations are classified as such if their book value shall mainly be recovered through sale rather than continued use. These conditions are considered as effective once the sale or discontinuance of the group of activities under divestment are considered highly likely and the assets and liabilities are immediately available for sale in their current condition as found.When the Group is involved in a divestment plan leading to the loss of control of a subsidiary, all the assets and liabilities of such subsidiary are classified as held for sale when the conditions described above are realized, even in the event that, after divestment, the Group continues to hold a minority shareholding in the subsidiary.Assets held for sale are valued at the lower amount between their net book value and the fair value net of the costs of sale.
Revenue recognition Revenues from the sale of goods are entered in the income statement upon transferal of the risks and benefits related to the sold product to the client, which normally coincides with the delivery or shipment of the merchandise to the client. Revenues from services are recorded in the accounting period in which the services are provided.Revenues are disclosed at the fair value of the received payment. The revenue is entered net of value added tax, expected returns, allowances and discounts. The Group records revenues when their total amount can be reliably estimated and it is likely that the related future economic benefits will be recognized as well.
Recognition of costsCosts are recognized upon acquisition of the goods or service.
TaxesCurrent taxes are calculated on the basis of the taxable income for the period, applying tax rates in force as of the date of the financial statements.Prepaid and deferred taxes are calculated against all the differences arising between the fiscal value of an asset or liability and the related book value. Prepaid taxes, including those related to previous fiscal losses, for the portion not offset by deferred fiscal liabilities, are recognized to the extent in which it is likely that a future taxable income will be available so that they can be recovered. deferred and prepaid taxes are defined using the tax rates expected to be applied during the financial years in which the differences shall be realized
Annual Financial Report 2016 45
or extinguished, based on the tax rates in force or substantially in force as of the date of the financial statements.Current, deferred and prepaid taxes are entered in the income statement with the exception of those related to items directly debited or credited in the shareholder’s equity, in which case the related tax effect is also directly included in the shareholder’s equity. Taxes are offset when they are applied by the same tax authority and there is a legal right of compensation.
3. EStiMAtES ANd ASSUMptioNSThe preparation of financial statements requires the directors to apply accounting principles and methods that, in certain circumstances, rely on assessments and estimates based on past experience and on assumptions deemed to be reasonable and realistic at any given time depending on the particular circumstances.The application of such estimates and assumptions influences the amounts entered in the financial statements as well as the explanatory notes. The final results of the balance entries for the determination of which such estimates and assumptions were used may therefore differ, even significantly, from those shown in the financial statements, due to the uncertainty characterizing the assumptions and conditions upon which such estimates are based.
With regard to the Group, the items that require a more subjective appraisal by the directors when preparing the estimates and for which a change in the conditions underlying the first assumptions could have a significant effect on the financial results for the Group are briefly described below.
a. provision for doubtful debts: the provision for doubtful debts reflects the directors’ best estimates concerning losses related to the receivables from clients. This estimate is based on the Group’s expected losses, which is defined according to past experience concerning similar receivables, current and historical past dues and careful monitoring of the quality of the credit as well as forecasts concerning economic and market conditions.
b. prepaid taxes: accounting for prepaid taxes is done according to the expected taxable income forecast for future years for their recovery. The assessment of expected income for the purpose of accounting for deferred taxes depends on factors which may vary over time and have a significant impact on the assessment of deferred tax receivables.
c. provisions for risks and charges: provisions are made representing the risk of a negative outcome in order to counter legal and fiscal risks. The value of the provisions shown in the financial statements in relation to such risks represents the best possible estimate as of the date considered by the directors. This estimate involves assumptions which depend on factors that may change over time and may therefore have a significant impact on the current estimates made by the directors to prepare the Group’s financial statements.
d. Fair value of derivative financial instruments: defining the fair value of unlisted financial assets, such as derivative financial instruments, is done through financial valuation techniques commonly used that require basic assumptions and estimates. Such assumptions might not come true in the terms and procedures envisaged. Therefore, estimates carried out by the Group could deviate from the data in the final balance.
46 Notes to the fiNaNcial statemeNts
4. ACCoUNtiNG priNCipLES, AMENdMENtS ANd iNtErprEtAtioNSNot YEt AppLiCAbLE ANd Not AdoptEd bY thE GroUp iN AdvANCEShown below are the international accounting standards, interpretations, amendments to existing accounting standards and interpretations, or specific provisions contained in the standards and interpretations approved by the IASB, with an indication of those approved or not approved for adoption in Europe as of the date of approval of this document.
description Envisaged date of effectiveness of the principle
IFRS 16 Leases Financial years starting from 1 January 2019
IFRS 9 Financial Instruments Financial years starting from 1 January 2018
IFRS 15 Revenue from Contracts with Customers Financial years starting from 1 January 2018
Amendments to IFRS 2Share-Based Payment Financial years starting from 1 January 2018
Amendments to IFRS 10 and IAS 28: Sale or Contribution of Assets between an Investor and its Associate or Joint Venture
not specified
Amendments to IAS 12: Recognition of Deferred Tax
Assets for Unrealized Losses Financial years starting from 1 January 2017
Amendments to IAS 7: Disclosure Initiative Financial years starting from 1 January 2017
Clarifications to IFRS 15 Revenue from Contracts with
Customers Financial years starting from 1 January 2018
IFRIC 22 Foreign Currency Transactions and Advance Consideration Financial years starting from 1 January 2018
Amendments to IAS 40 Investment Properties Financial years starting from 1 January 2018
It should be specified that the accounting standards and/or interpretations having obligatory application for the financial years starting from 1 January 2017 have not been applied in advance.Possible impacts on the Group’s consolidated financial statements arising from new principles and interpretations are currently being assessed. Specific projects have been activated within the Group for the adoption of IFRS 15, IFRS 16 and IFRS 9. Reliable estimates of the effects deriving from these principles will be available upon completion of each project.
Annual Financial Report 2016 47
5. iNForMAtioN AboUt FiNANCiAL riSKSIn the context of corporate risks, the main risks identified, monitored and, inasmuch as specified hereunder, actively managed by the Group are as follows:
Market risk (defined as risk of exchange rate, interest rate and changes in price of some raw materials used in production).
Credit risk (concerning both normal commercial relations with clients and loan activities).
Liquidity risk (with reference to the availability of financial resources and access to the credit market and financial instruments in general).
The Group’s objective is to maintain a balanced management of its financial exposure over time, aimed at guaranteeing balance between the structure of the liabilities and the composition of payable assets, and able to ensure the required operational flexibility through the liquidity generated by current operating assets as well as recourse to bank loans.
The management of the related financial risks is guided and monitored at central level. In particular, the main finance department has the task of valuing and approving provisional financial demands, monitoring their performance, and implementing appropriate corrective actions where required.
The borrowing instruments mainly used by the Group are:
Medium/long-term loans to cover investments in the fixed assets.
Short-term loans and use of current account credit lines to fund the working capital.
The following section provides qualitative and quantitative descriptions of the effect of such risks on the Group.
5.1 MArKEt riSK
5.1.1 Exchange rate risk The exposure to the risk of changes in exchange rates derives from the Group’s commercial and financial activities that are also conducted in currencies other than the Euro. Moreover, fluctuations in exchange rates reflect in the consolidated results and shareholder’ equity as the financial statements of the subsidiaries are drawn up in a currency different from the Euro and then translated (currency translation risk).
The main exchange relations to which the Group is exposed mainly concern:
• Euro/Rand• Euro/Zloty• Euro/Brazilian Real • Euro/Leu• Euro/Ruble• Euro/Argentine Peso
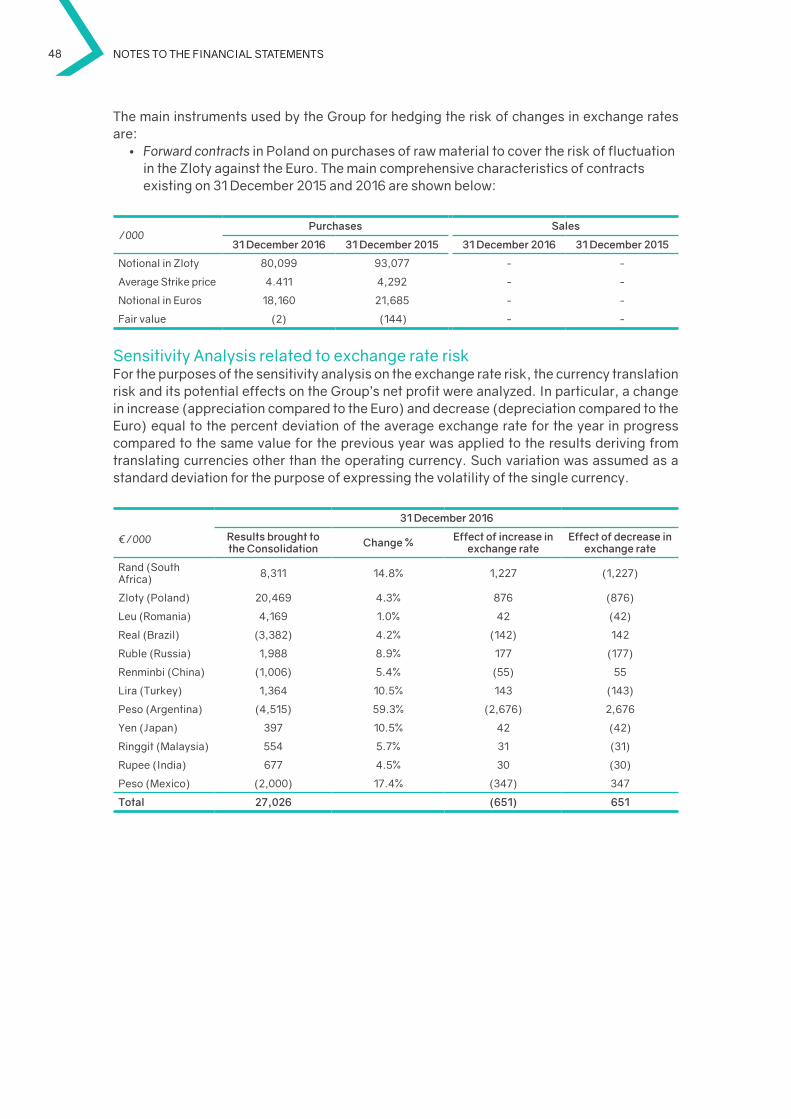
48 Notes to the fiNaNcial statemeNts
The main instruments used by the Group for hedging the risk of changes in exchange rates are:
• Forward contracts in Poland on purchases of raw material to cover the risk of fluctuation in the Zloty against the Euro. The main comprehensive characteristics of contracts existing on 31 december 2015 and 2016 are shown below:
/000purchases Sales
31 december 2016 31 december 2015 31 december 2016 31 december 2015
notional in Zloty 80,099 93,077 - -
Average Strike price 4.411 4,292 - -
notional in Euros 18,160 21,685 - -
Fair value (2) (144) - -
Sensitivity Analysis related to exchange rate riskFor the purposes of the sensitivity analysis on the exchange rate risk, the currency translation risk and its potential effects on the Group’s net profit were analyzed. In particular, a change in increase (appreciation compared to the Euro) and decrease (depreciation compared to the Euro) equal to the percent deviation of the average exchange rate for the year in progress compared to the same value for the previous year was applied to the results deriving from translating currencies other than the operating currency. Such variation was assumed as a standard deviation for the purpose of expressing the volatility of the single currency.
€/000
31 december 2016
results brought to the Consolidation Change % Effect of increase in
exchange rate Effect of decrease in
exchange rate
Rand (South Africa) 8,311 14.8% 1,227 (1,227)
Zloty (Poland) 20,469 4.3% 876 (876)
Leu (Romania) 4,169 1.0% 42 (42)
Real (Brazil) (3,382) 4.2% (142) 142
Ruble (Russia) 1,988 8.9% 177 (177)
Renminbi (China) (1,006) 5.4% (55) 55
Lira (Turkey) 1,364 10.5% 143 (143)
Peso (Argentina) (4,515) 59.3% (2,676) 2,676
Yen (Japan) 397 10.5% 42 (42)
Ringgit (Malaysia) 554 5.7% 31 (31)
Rupee (India) 677 4.5% 30 (30)
Peso (Mexico) (2,000) 17.4% (347) 347
total 27,026 (651) 651
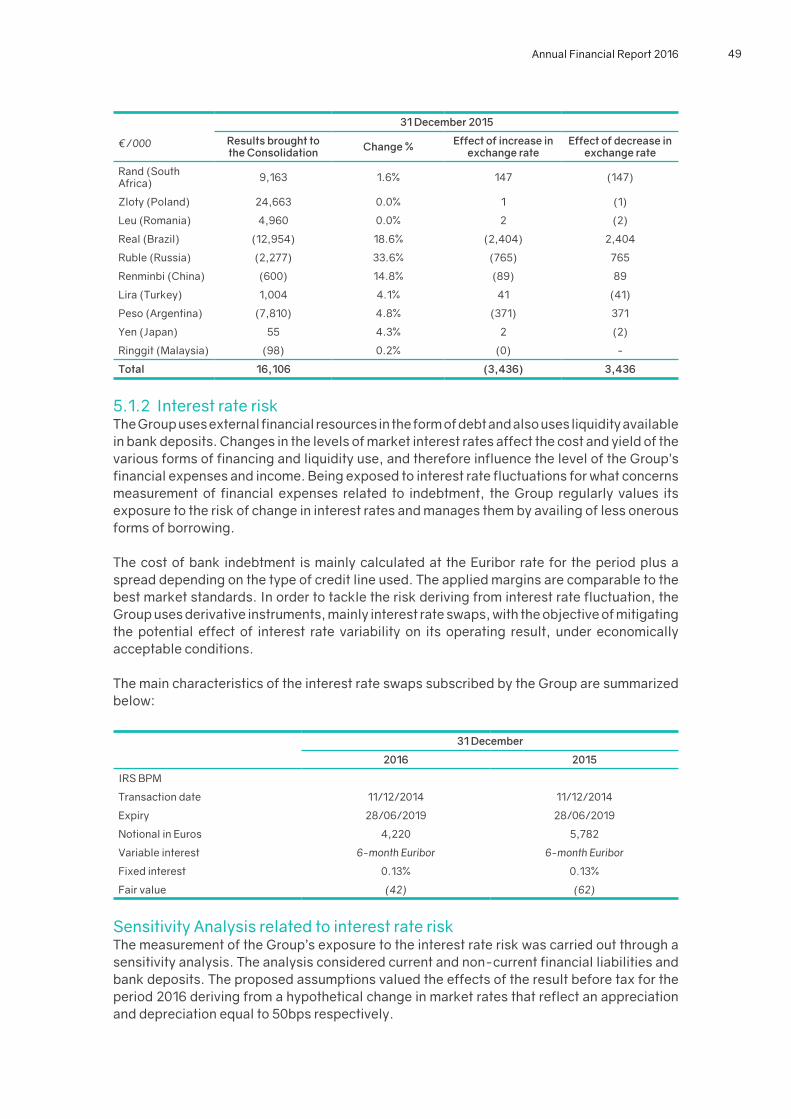
Annual Financial Report 2016 49
€/000
31 december 2015
results brought to the Consolidation Change % Effect of increase in
exchange rate Effect of decrease in
exchange rate
Rand (South Africa) 9,163 1.6% 147 (147)
Zloty (Poland) 24,663 0.0% 1 (1)
Leu (Romania) 4,960 0.0% 2 (2)
Real (Brazil) (12,954) 18.6% (2,404) 2,404
Ruble (Russia) (2,277) 33.6% (765) 765
Renminbi (China) (600) 14.8% (89) 89
Lira (Turkey) 1,004 4.1% 41 (41)
Peso (Argentina) (7,810) 4.8% (371) 371
Yen (Japan) 55 4.3% 2 (2)
Ringgit (Malaysia) (98) 0.2% (0) -
total 16,106 (3,436) 3,436
5.1.2 Interest rate riskThe Group uses external financial resources in the form of debt and also uses liquidity available in bank deposits. Changes in the levels of market interest rates affect the cost and yield of the various forms of financing and liquidity use, and therefore influence the level of the Group’s financial expenses and income. Being exposed to interest rate fluctuations for what concerns measurement of financial expenses related to indebtment, the Group regularly values its exposure to the risk of change in interest rates and manages them by availing of less onerous forms of borrowing.
The cost of bank indebtment is mainly calculated at the Euribor rate for the period plus a spread depending on the type of credit line used. The applied margins are comparable to the best market standards. In order to tackle the risk deriving from interest rate fluctuation, the Group uses derivative instruments, mainly interest rate swaps, with the objective of mitigating the potential effect of interest rate variability on its operating result, under economically acceptable conditions.
The main characteristics of the interest rate swaps subscribed by the Group are summarized below:
31 december
2016 2015
IRS BPM
Transaction date 11/12/2014 11/12/2014
Expiry 28/06/2019 28/06/2019
notional in Euros 4,220 5,782
Variable interest 6-month Euribor 6-month Euribor
Fixed interest 0.13% 0.13%
Fair value (42) (62)
Sensitivity Analysis related to interest rate riskThe measurement of the Group’s exposure to the interest rate risk was carried out through a sensitivity analysis. The analysis considered current and non-current financial liabilities and bank deposits. The proposed assumptions valued the effects of the result before tax for the period 2016 deriving from a hypothetical change in market rates that reflect an appreciation and depreciation equal to 50bps respectively.
50 Notes to the fiNaNcial statemeNts
The potential impacts of the sensitivity analysis were calculated on the financial assets and liabilities at variable rate as of 31 december 2016. Such variation in the interest rates would lead to a higher (or lower) net pre-tax expense equal to EuR 2,047 thousand on an annual basis.
5.1.3 Commodity risk The Group’s exposure to the risk of change in the price of commodities derives from the risk of change in the prices of certain raw materials (mainly steel) used in production. The change in the price of steel can have a significant impact on the Group’s net profit, indirectly influencing the costs and profitability of the products.
Furthermore, the risk can be considered as limited only to the SSC division: in the other divisions, changes in the price of raw materials are usually transferred to clients by adjusting the sales price lists.
5.2 CrEdit riSKCredit risk represents the Group’s exposure to potential losses deriving from non-fulfillment of obligations by counterparties.
The Group’s exposure to risk concerning trade receivables is in any case limited to the solidity of its main trade counterparts, which are of high credit rating. The Group’s main clients are car manufacturers (OEM), about which prompt information is available about their operating/financial performance and the ratings supplied by the main agencies. The Group also adopts specific commercial policies aimed at monitoring the solvency of smaller clients and implements agreements for the transfer of trade receivables without recourse, thereby transferring the related risk.
Trade receivables are recognized in the balance sheet net of the impairment calculated on the basis of the risk of counterparty defaulting, determined on the basis of the information available on the client’s solvency as well as on historical data. Subject to individual devaluation are positions regarding which an objective condition of partial or total unenforceability is established, taking account of any insurance covers and the performance of the suffering practices.
Provisions have been allocated on a collective basis against receivables not subject to individual devaluation, considering past experience.
5.3 LiQUiditY riSKLiquidity risk can arise with the inability to procure financial resources needed for the Group’s operations under economical conditions. The two main factors that can affect the Group’s liquidity are:
• Financial resources generated or absorbed by operating and investment activities.• The characteristics of expiry and renewal of the financial debt.
Careful management of liquidity risk originating from normal operations implies maintaining an adequate level of cash, short-term securities and the availability of funds obtainable by means of an adequate amount of credit lines. The Group’s liquidity demand is monitored by the treasury department with a view to guaranteeing an efficient procurement of financial resources and adequate investment/return of liquidity. The Group’s objective is to implement a financial structure which, in accordance with business objectives, guarantees an adequate level of liquidity, minimizing the related opportunity cost and keeping a balance in terms of duration and composition of the debt.
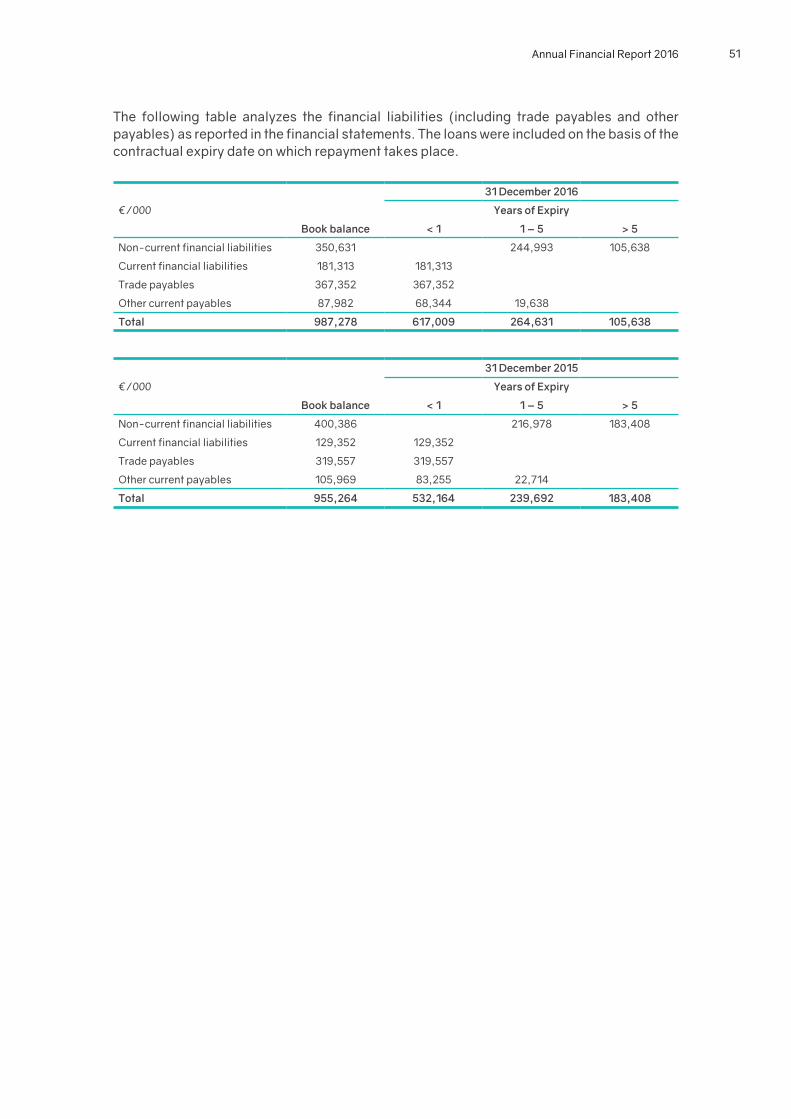
Annual Financial Report 2016 51
The following table analyzes the financial liabilities (including trade payables and other payables) as reported in the financial statements. The loans were included on the basis of the contractual expiry date on which repayment takes place.
€/000
31 december 2016
Years of Expiry
book balance < 1 1 – 5 > 5
non-current financial liabilities 350,631 244,993 105,638
Current financial liabilities 181,313 181,313
Trade payables 367,352 367,352
Other current payables 87,982 68,344 19,638
total 987,278 617,009 264,631 105,638
€/000
31 december 2015
Years of Expiry
book balance < 1 1 – 5 > 5
non-current financial liabilities 400,386 216,978 183,408
Current financial liabilities 129,352 129,352
Trade payables 319,557 319,557
Other current payables 105,969 83,255 22,714
total 955,264 532,164 239,692 183,408
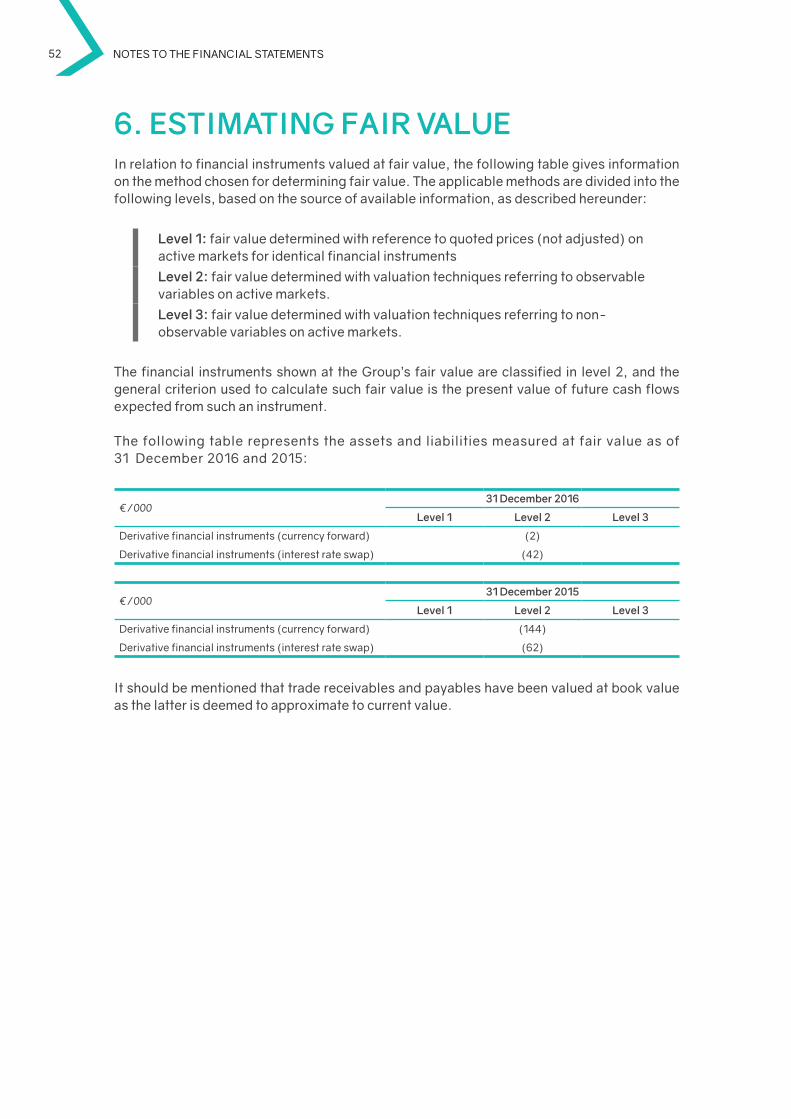
52 Notes to the fiNaNcial statemeNts
6. EStiMAtiNG FAir vALUEIn relation to financial instruments valued at fair value, the following table gives information on the method chosen for determining fair value. The applicable methods are divided into the following levels, based on the source of available information, as described hereunder:
Level 1: fair value determined with reference to quoted prices (not adjusted) on active markets for identical financial instruments
Level 2: fair value determined with valuation techniques referring to observable variables on active markets.
Level 3: fair value determined with valuation techniques referring to non-observable variables on active markets.
The financial instruments shown at the Group’s fair value are classified in level 2, and the general criterion used to calculate such fair value is the present value of future cash flows expected from such an instrument.
The following table represents the assets and liabilities measured at fair value as of 31 december 2016 and 2015:
€/00031 december 2016
Level 1 Level 2 Level 3
derivative financial instruments (currency forward) (2)
derivative financial instruments (interest rate swap) (42)
€/00031 december 2015
Level 1 Level 2 Level 3
derivative financial instruments (currency forward) (144)
derivative financial instruments (interest rate swap) (62)
It should be mentioned that trade receivables and payables have been valued at book value as the latter is deemed to approximate to current value.
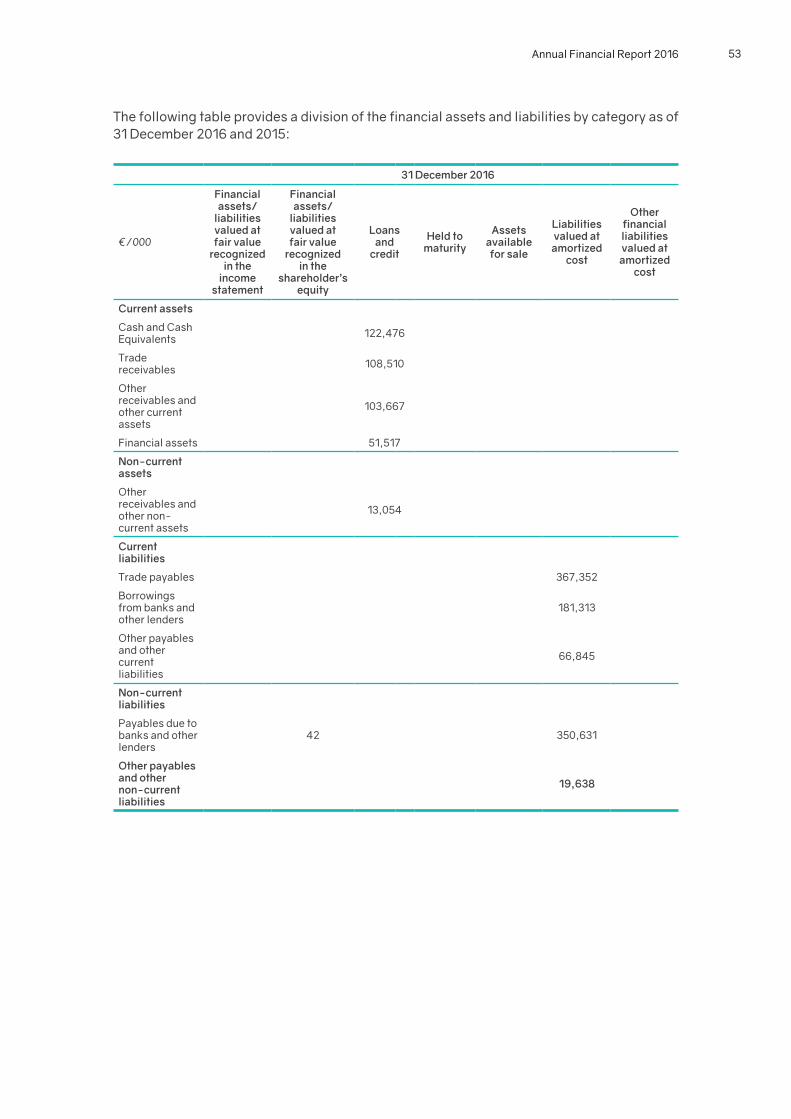
Annual Financial Report 2016 53
The following table provides a division of the financial assets and liabilities by category as of 31 december 2016 and 2015:
31 december 2016
€/000
Financial assets/
liabilities valued at fair value
recognized in the
income statement
Financial assets/
liabilities valued at fair value
recognized in the
shareholder’s equity
Loans and
credit
held to maturity
Assets available for sale
Liabilities valued at
amortized cost
other financial liabilities valued at
amortized cost
Current assets
Cash and Cash Equivalents 122,476
Trade receivables 108,510
Other receivables and other current assets
103,667
Financial assets 51,517
Non-current assets
Other receivables and other non-current assets
13,054
Current liabilities
Trade payables 367,352
Borrowings from banks and other lenders
181,313
Other payables and other current liabilities
66,845
Non-current liabilities
Payables due to banks and other lenders
42 350,631
other payables and other non-current liabilities
19,638
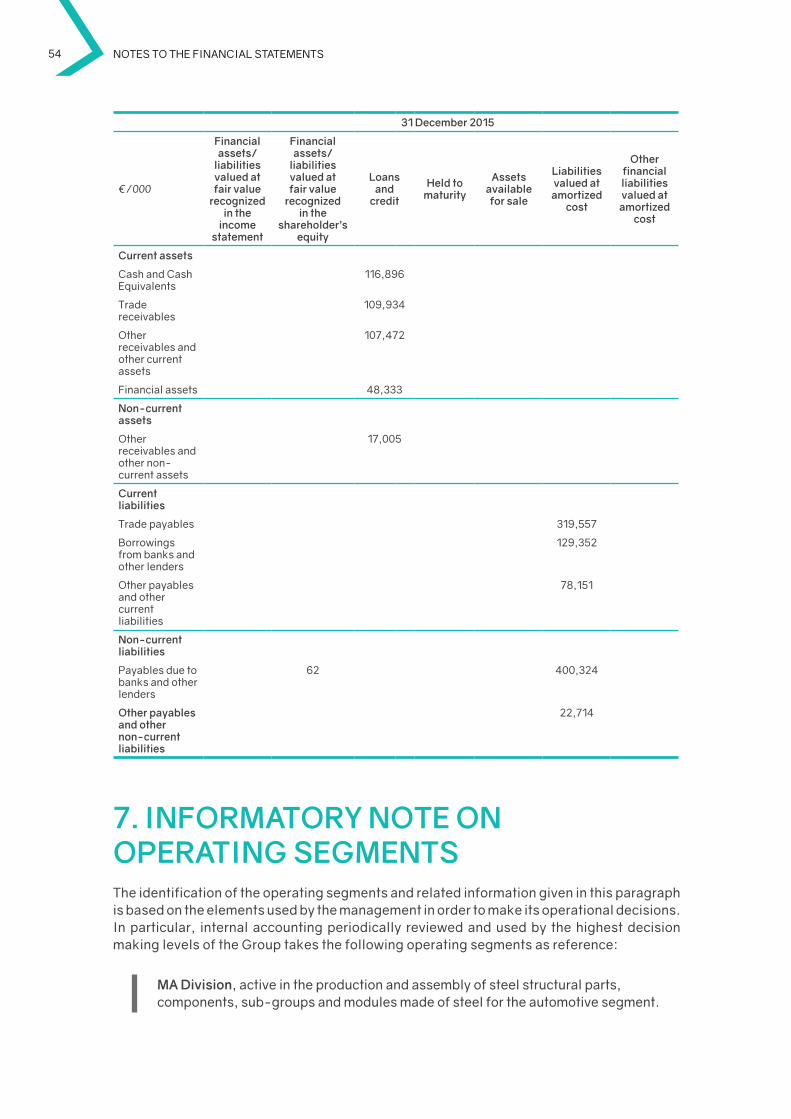
54 Notes to the fiNaNcial statemeNts
31 december 2015
€/000
Financial assets/
liabilities valued at fair value
recognized in the
income statement
Financial assets/
liabilities valued at fair value
recognized in the
shareholder’s equity
Loans and
credit
held to maturity
Assets available for sale
Liabilities valued at
amortized cost
other financial liabilities valued at
amortized cost
Current assets
Cash and Cash Equivalents
116,896
Trade receivables
109,934
Other receivables and other current assets
107,472
Financial assets 48,333
Non-current assets
Other receivables and other non-current assets
17,005
Current liabilities
Trade payables 319,557
Borrowings from banks and other lenders
129,352
Other payables and other current liabilities
78,151
Non-current liabilities
Payables due to banks and other lenders
62 400,324
other payables and other non-current liabilities
22,714
7. iNForMAtorY NotE oN opErAtiNG SEGMENtSThe identification of the operating segments and related information given in this paragraph is based on the elements used by the management in order to make its operational decisions. In particular, internal accounting periodically reviewed and used by the highest decision making levels of the Group takes the following operating segments as reference:
MA division, active in the production and assembly of steel structural parts, components, sub-groups and modules made of steel for the automotive segment.
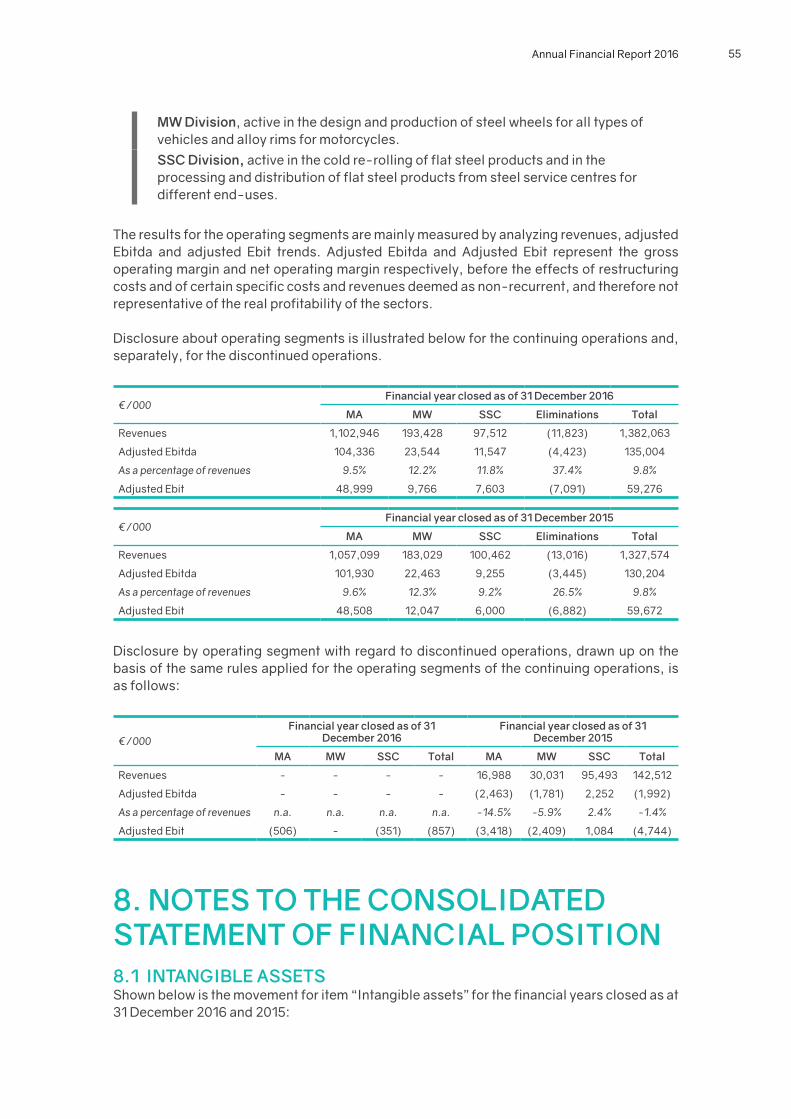
Annual Financial Report 2016 55
MW division, active in the design and production of steel wheels for all types of vehicles and alloy rims for motorcycles.
SSC division, active in the cold re-rolling of flat steel products and in the processing and distribution of flat steel products from steel service centres for different end-uses.
The results for the operating segments are mainly measured by analyzing revenues, adjusted Ebitda and adjusted Ebit trends. Adjusted Ebitda and Adjusted Ebit represent the gross operating margin and net operating margin respectively, before the effects of restructuring costs and of certain specific costs and revenues deemed as non-recurrent, and therefore not representative of the real profitability of the sectors.
disclosure about operating segments is illustrated below for the continuing operations and, separately, for the discontinued operations.
€/000Financial year closed as of 31 december 2016
MA MW SSC Eliminations total
Revenues 1,102,946 193,428 97,512 (11,823) 1,382,063
Adjusted Ebitda 104,336 23,544 11,547 (4,423) 135,004
As a percentage of revenues 9.5% 12.2% 11.8% 37.4% 9.8%
Adjusted Ebit 48,999 9,766 7,603 (7,091) 59,276
€/000Financial year closed as of 31 december 2015
MA MW SSC Eliminations total
Revenues 1,057,099 183,029 100,462 (13,016) 1,327,574
Adjusted Ebitda 101,930 22,463 9,255 (3,445) 130,204
As a percentage of revenues 9.6% 12.3% 9.2% 26.5% 9.8%
Adjusted Ebit 48,508 12,047 6,000 (6,882) 59,672
disclosure by operating segment with regard to discontinued operations, drawn up on the basis of the same rules applied for the operating segments of the continuing operations, is as follows:
€/000Financial year closed as of 31
december 2016Financial year closed as of 31
december 2015
MA MW SSC total MA MW SSC total
Revenues - - - - 16,988 30,031 95,493 142,512
Adjusted Ebitda - - - - (2,463) (1,781) 2,252 (1,992)
As a percentage of revenues n.a. n.a. n.a. n.a. -14.5% -5.9% 2.4% -1.4%
Adjusted Ebit (506) - (351) (857) (3,418) (2,409) 1,084 (4,744)
8. NotES to thE CoNSoLidAtEd StAtEMENt oF FiNANCiAL poSitioN8.1 iNtANGibLE ASSEtSShown below is the movement for item “Intangible assets” for the financial years closed as at 31 december 2016 and 2015:
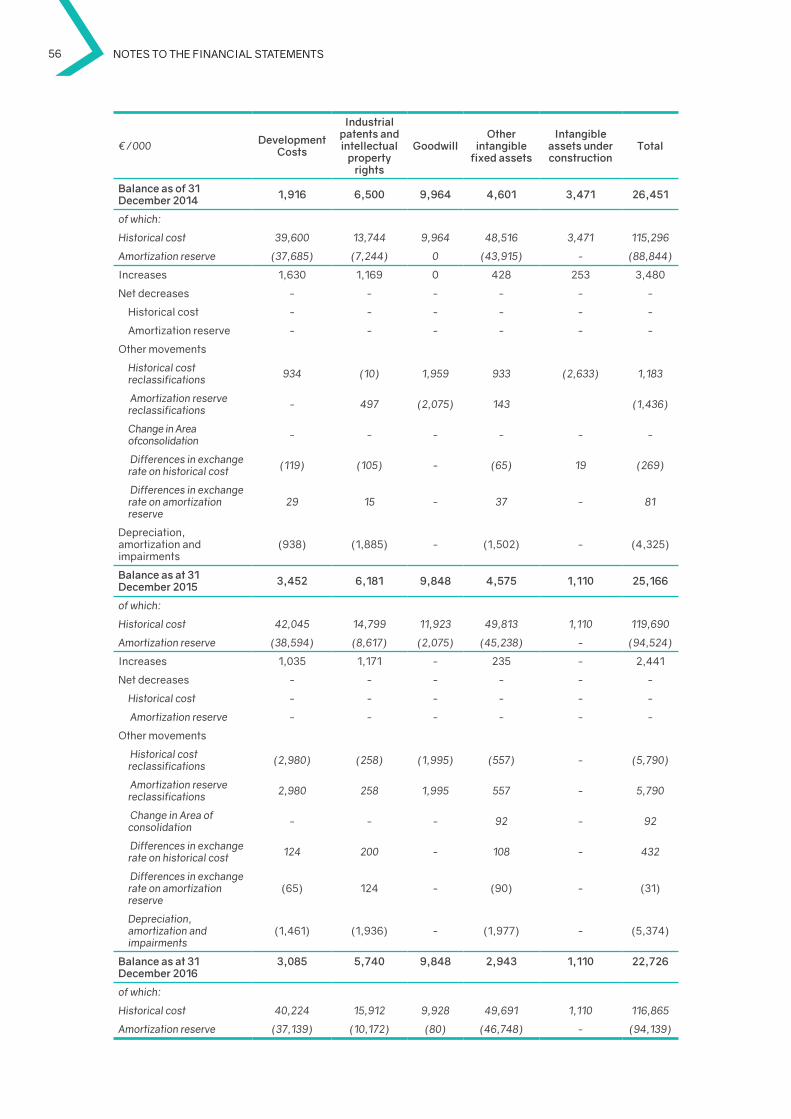
56 Notes to the fiNaNcial statemeNts
€/000 development Costs
industrial patents and intellectual
property rights
Goodwillother
intangible fixed assets
intangible assets under construction
total
balance as of 31 december 2014 1,916 6,500 9,964 4,601 3,471 26,451
of which:
Historical cost 39,600 13,744 9,964 48,516 3,471 115,296
Amortization reserve (37,685) (7,244) 0 (43,915) - (88,844)
Increases 1,630 1,169 0 428 253 3,480
net decreases - - - - - -
historical cost - - - - - -
Amortization reserve - - - - - -
Other movements
Historical cost reclassifications 934 (10) 1,959 933 (2,633) 1,183
Amortization reserve reclassifications - 497 (2,075) 143 (1,436)
Change in Area ofconsolidation - - - - - -
Differences in exchange rate on historical cost (119) (105) - (65) 19 (269)
Differences in exchange rate on amortization reserve
29 15 - 37 - 81
depreciation, amortization and impairments
(938) (1,885) - (1,502) - (4,325)
balance as at 31 december 2015 3,452 6,181 9,848 4,575 1,110 25,166
of which:
Historical cost 42,045 14,799 11,923 49,813 1,110 119,690
Amortization reserve (38,594) (8,617) (2,075) (45,238) - (94,524)
Increases 1,035 1,171 - 235 - 2,441
net decreases - - - - - -
Historical cost - - - - - -
Amortization reserve - - - - - -
Other movements
Historical cost reclassifications (2,980) (258) (1,995) (557) - (5,790)
Amortization reserve reclassifications 2,980 258 1,995 557 - 5,790
Change in Area of consolidation - - - 92 - 92
Differences in exchange rate on historical cost 124 200 - 108 - 432
Differences in exchange rate on amortization reserve
(65) 124 - (90) - (31)
Depreciation, amortization and impairments
(1,461) (1,936) - (1,977) - (5,374)
balance as at 31 december 2016
3,085 5,740 9,848 2,943 1,110 22,726
of which:
Historical cost 40,224 15,912 9,928 49,691 1,110 116,865
Amortization reserve (37,139) (10,172) (80) (46,748) - (94,139)
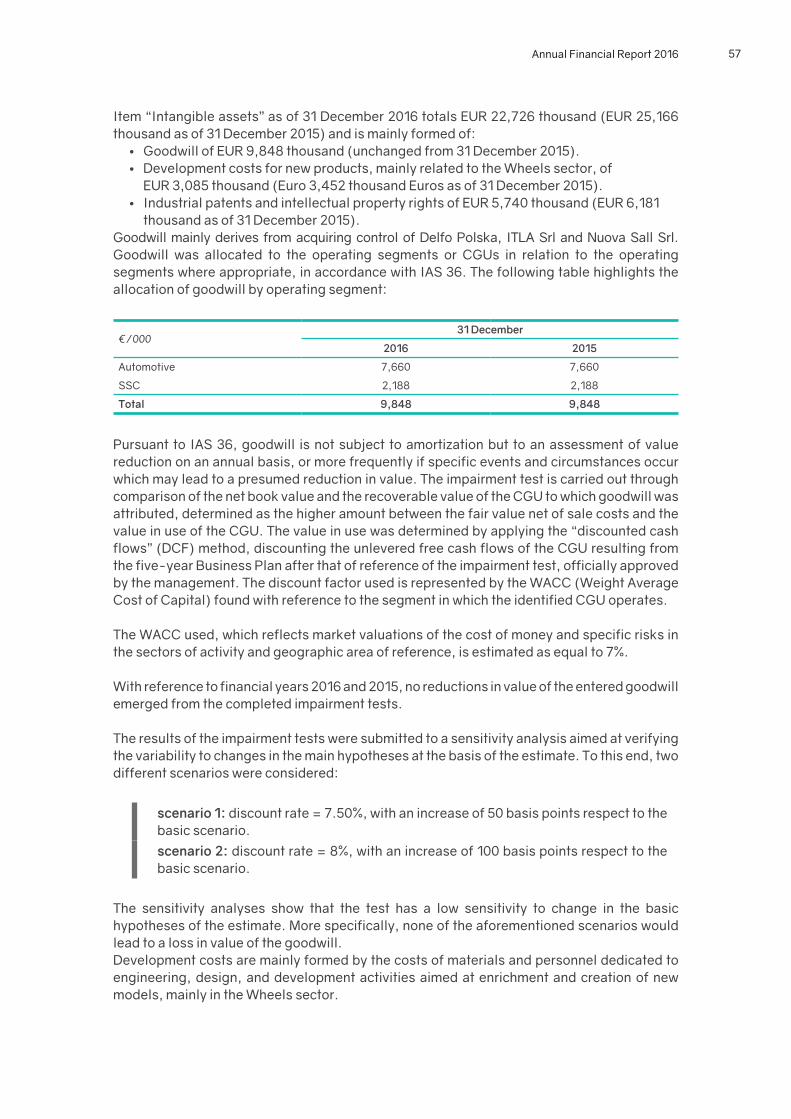
Annual Financial Report 2016 57
Item “Intangible assets” as of 31 december 2016 totals EuR 22,726 thousand (EuR 25,166 thousand as of 31 december 2015) and is mainly formed of:
• Goodwill of EuR 9,848 thousand (unchanged from 31 december 2015).• development costs for new products, mainly related to the Wheels sector, of
EuR 3,085 thousand (Euro 3,452 thousand Euros as of 31 december 2015).• Industrial patents and intellectual property rights of EuR 5,740 thousand (EuR 6,181
thousand as of 31 december 2015).Goodwill mainly derives from acquiring control of delfo Polska, ITLA Srl and nuova Sall Srl. Goodwill was allocated to the operating segments or CGus in relation to the operating segments where appropriate, in accordance with IAS 36. The following table highlights the allocation of goodwill by operating segment:
€/00031 december
2016 2015
Automotive 7,660 7,660
SSC 2,188 2,188
total 9,848 9,848
Pursuant to IAS 36, goodwill is not subject to amortization but to an assessment of value reduction on an annual basis, or more frequently if specific events and circumstances occur which may lead to a presumed reduction in value. The impairment test is carried out through comparison of the net book value and the recoverable value of the CGu to which goodwill was attributed, determined as the higher amount between the fair value net of sale costs and the value in use of the CGu. The value in use was determined by applying the “discounted cash flows” (dCF) method, discounting the unlevered free cash flows of the CGu resulting from the five-year Business Plan after that of reference of the impairment test, officially approved by the management. The discount factor used is represented by the WACC (Weight Average Cost of Capital) found with reference to the segment in which the identified CGu operates.
The WACC used, which reflects market valuations of the cost of money and specific risks in the sectors of activity and geographic area of reference, is estimated as equal to 7%.
With reference to financial years 2016 and 2015, no reductions in value of the entered goodwill emerged from the completed impairment tests.
The results of the impairment tests were submitted to a sensitivity analysis aimed at verifying the variability to changes in the main hypotheses at the basis of the estimate. To this end, two different scenarios were considered:
scenario 1: discount rate = 7.50%, with an increase of 50 basis points respect to the basic scenario.
scenario 2: discount rate = 8%, with an increase of 100 basis points respect to the basic scenario.
The sensitivity analyses show that the test has a low sensitivity to change in the basic hypotheses of the estimate. More specifically, none of the aforementioned scenarios would lead to a loss in value of the goodwill.development costs are mainly formed by the costs of materials and personnel dedicated to engineering, design, and development activities aimed at enrichment and creation of new models, mainly in the Wheels sector.
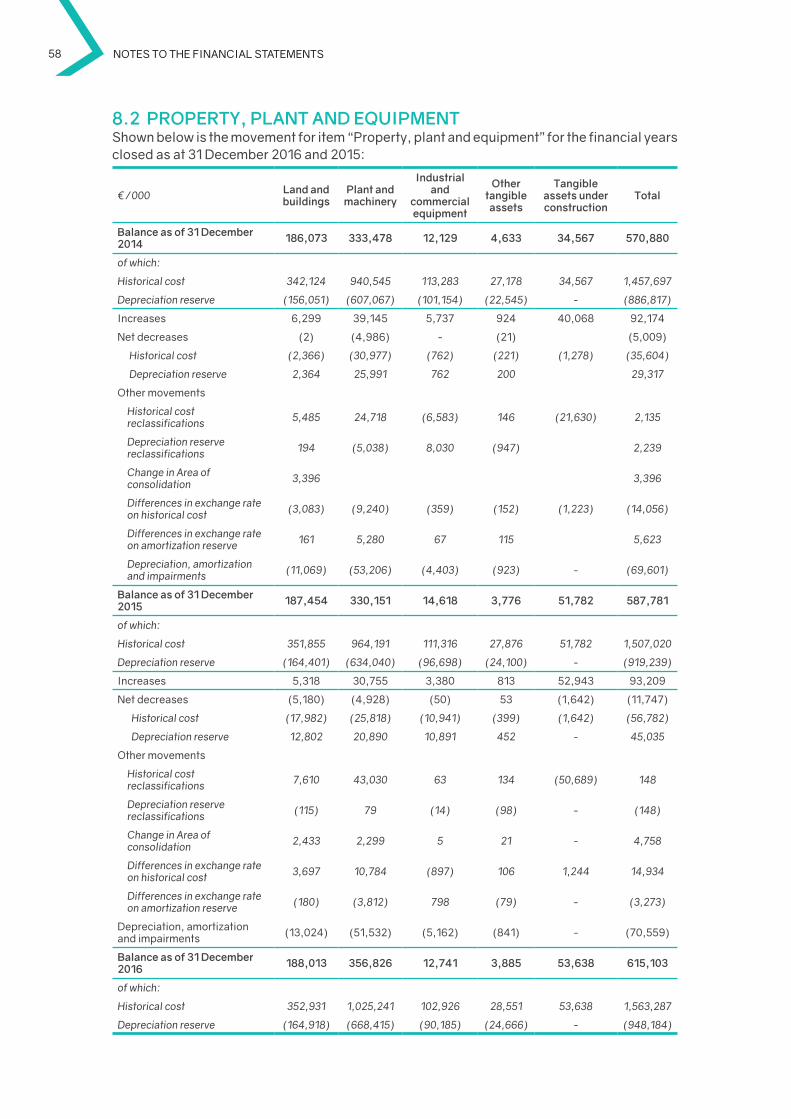
58 Notes to the fiNaNcial statemeNts
8.2 propErtY, pLANt ANd EQUipMENtShown below is the movement for item “Property, plant and equipment” for the financial years closed as at 31 december 2016 and 2015:
€/000 Land and buildings
plant and machinery
industrial and
commercial equipment
other tangible assets
tangible assets under construction
total
balance as of 31 december 2014 186,073 333,478 12,129 4,633 34,567 570,880
of which:
Historical cost 342,124 940,545 113,283 27,178 34,567 1,457,697
Depreciation reserve (156,051) (607,067) (101,154) (22,545) - (886,817)
Increases 6,299 39,145 5,737 924 40,068 92,174
net decreases (2) (4,986) - (21) (5,009)
Historical cost (2,366) (30,977) (762) (221) (1,278) (35,604)
Depreciation reserve 2,364 25,991 762 200 29,317
Other movements
Historical cost reclassifications 5,485 24,718 (6,583) 146 (21,630) 2,135
Depreciation reserve reclassifications 194 (5,038) 8,030 (947) 2,239
Change in Area of consolidation 3,396 3,396
Differences in exchange rate on historical cost (3,083) (9,240) (359) (152) (1,223) (14,056)
Differences in exchange rate on amortization reserve 161 5,280 67 115 5,623
Depreciation, amortization and impairments (11,069) (53,206) (4,403) (923) - (69,601)
balance as of 31 december 2015 187,454 330,151 14,618 3,776 51,782 587,781
of which:
Historical cost 351,855 964,191 111,316 27,876 51,782 1,507,020
Depreciation reserve (164,401) (634,040) (96,698) (24,100) - (919,239)
Increases 5,318 30,755 3,380 813 52,943 93,209
net decreases (5,180) (4,928) (50) 53 (1,642) (11,747)
Historical cost (17,982) (25,818) (10,941) (399) (1,642) (56,782)
Depreciation reserve 12,802 20,890 10,891 452 - 45,035
Other movements
Historical cost reclassifications 7,610 43,030 63 134 (50,689) 148
Depreciation reserve reclassifications (115) 79 (14) (98) - (148)
Change in Area of consolidation 2,433 2,299 5 21 - 4,758
Differences in exchange rate on historical cost 3,697 10,784 (897) 106 1,244 14,934
Differences in exchange rate on amortization reserve (180) (3,812) 798 (79) - (3,273)
depreciation, amortization and impairments (13,024) (51,532) (5,162) (841) - (70,559)
balance as of 31 december 2016 188,013 356,826 12,741 3,885 53,638 615,103
of which:
Historical cost 352,931 1,025,241 102,926 28,551 53,638 1,563,287
Depreciation reserve (164,918) (668,415) (90,185) (24,666) - (948,184)
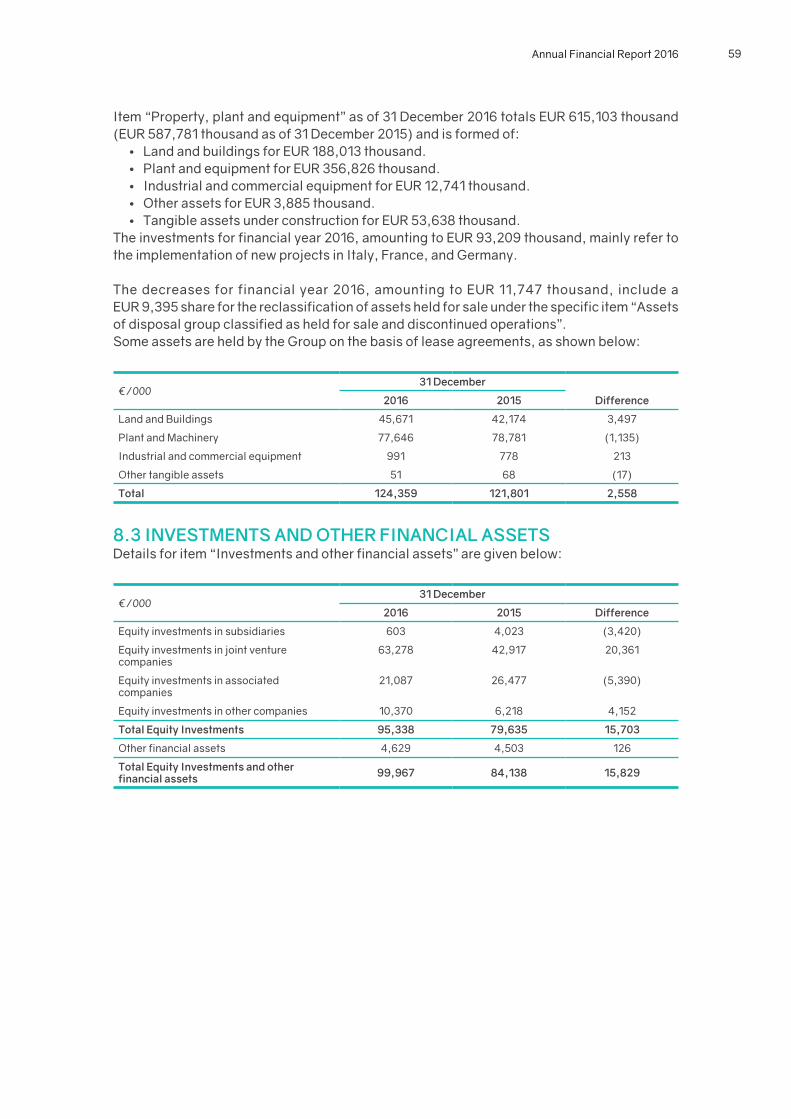
Annual Financial Report 2016 59
Item “Property, plant and equipment” as of 31 december 2016 totals EuR 615,103 thousand (EuR 587,781 thousand as of 31 december 2015) and is formed of:
• Land and buildings for EuR 188,013 thousand.• Plant and equipment for EuR 356,826 thousand.• Industrial and commercial equipment for EuR 12,741 thousand.• Other assets for EuR 3,885 thousand.• Tangible assets under construction for EuR 53,638 thousand.
The investments for financial year 2016, amounting to EuR 93,209 thousand, mainly refer to the implementation of new projects in Italy, France, and Germany.
The decreases for financial year 2016, amounting to EuR 11,747 thousand, include a EuR 9,395 share for the reclassification of assets held for sale under the specific item “Assets of disposal group classified as held for sale and discontinued operations”.Some assets are held by the Group on the basis of lease agreements, as shown below:
€/00031 december
2016 2015 difference
Land and Buildings 45,671 42,174 3,497
Plant and Machinery 77,646 78,781 (1,135)
Industrial and commercial equipment 991 778 213
Other tangible assets 51 68 (17)
total 124,359 121,801 2,558
8.3 iNvEStMENtS ANd othEr FiNANCiAL ASSEtSdetails for item “Investments and other financial assets” are given below:
€/00031 december
2016 2015 difference
Equity investments in subsidiaries 603 4,023 (3,420)
Equity investments in joint venture companies
63,278 42,917 20,361
Equity investments in associated companies
21,087 26,477 (5,390)
Equity investments in other companies 10,370 6,218 4,152
total Equity investments 95,338 79,635 15,703
Other financial assets 4,629 4,503 126
total Equity investments and other financial assets 99,967 84,138 15,829
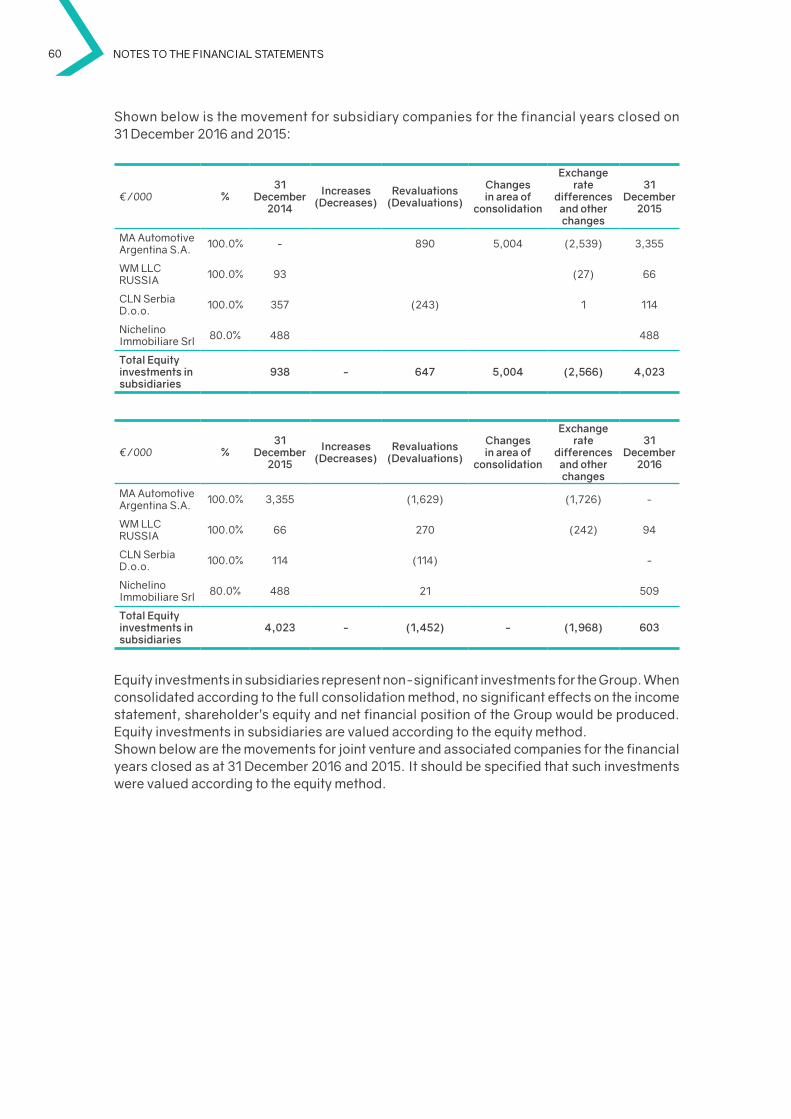
60 Notes to the fiNaNcial statemeNts
Shown below is the movement for subsidiary companies for the financial years closed on 31 december 2016 and 2015:
€/000 %31
december 2014
increases(decreases)
revaluations(devaluations)
Changes in area of
consolidation
Exchange rate
differences and other changes
31 december
2015
MA Automotive Argentina S.A. 100.0% - 890 5,004 (2,539) 3,355
WM LLC RuSSIA 100.0% 93 (27) 66
CLn Serbia d.o.o. 100.0% 357 (243) 1 114
nichelino Immobiliare Srl 80.0% 488 488
total Equity investments in subsidiaries
938 - 647 5,004 (2,566) 4,023
€/000 %31
december 2015
increases(decreases)
revaluations(devaluations)
Changes in area of
consolidation
Exchange rate
differences and other changes
31 december
2016
MA Automotive Argentina S.A. 100.0% 3,355 (1,629) (1,726) -
WM LLC RuSSIA 100.0% 66 270 (242) 94
CLn Serbia d.o.o. 100.0% 114 (114) -
nichelino Immobiliare Srl 80.0% 488 21 509
total Equity investments in subsidiaries
4,023 - (1,452) - (1,968) 603
Equity investments in subsidiaries represent non-significant investments for the Group. When consolidated according to the full consolidation method, no significant effects on the income statement, shareholder’s equity and net financial position of the Group would be produced. Equity investments in subsidiaries are valued according to the equity method.Shown below are the movements for joint venture and associated companies for the financial years closed as at 31 december 2016 and 2015. It should be specified that such investments were valued according to the equity method.
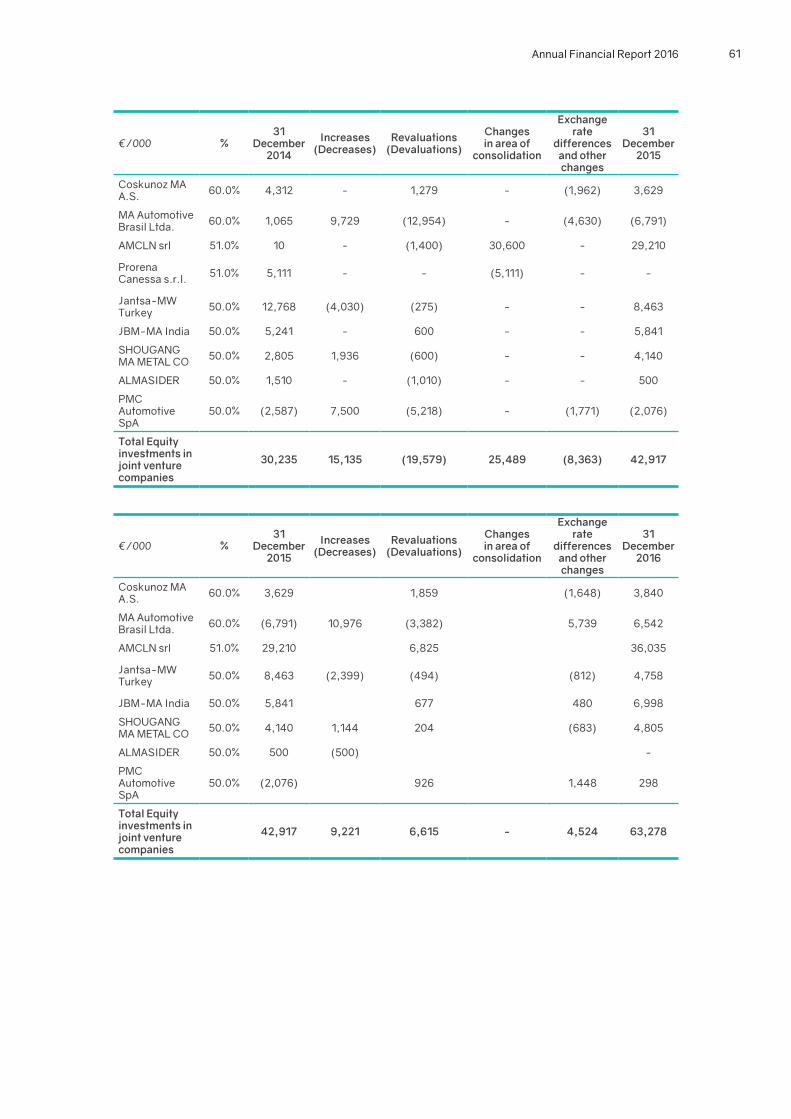
Annual Financial Report 2016 61
€/000 %31
december 2014
increases(decreases)
revaluations(devaluations)
Changes in area of
consolidation
Exchange rate
differences and other changes
31 december
2015
Coskunoz MA A.S. 60.0% 4,312 - 1,279 - (1,962) 3,629
MA Automotive Brasil Ltda. 60.0% 1,065 9,729 (12,954) - (4,630) (6,791)
AMCLn srl 51.0% 10 - (1,400) 30,600 - 29,210
Prorena Canessa s.r.l. 51.0% 5,111 - - (5,111) - -
Jantsa-MW Turkey 50.0% 12,768 (4,030) (275) - - 8,463
JBM-MA India 50.0% 5,241 - 600 - - 5,841
ShOuGAnG MA METAL CO 50.0% 2,805 1,936 (600) - - 4,140
ALMASIdER 50.0% 1,510 - (1,010) - - 500
PMC Automotive SpA
50.0% (2,587) 7,500 (5,218) - (1,771) (2,076)
total Equity investments in joint venture companies
30,235 15,135 (19,579) 25,489 (8,363) 42,917
€/000 %31
december 2015
increases(decreases)
revaluations(devaluations)
Changes in area of
consolidation
Exchange rate
differences and other changes
31 december
2016
Coskunoz MA A.S. 60.0% 3,629 1,859 (1,648) 3,840
MA Automotive Brasil Ltda. 60.0% (6,791) 10,976 (3,382) 5,739 6,542
AMCLn srl 51.0% 29,210 6,825 36,035
Jantsa-MW Turkey 50.0% 8,463 (2,399) (494) (812) 4,758
JBM-MA India 50.0% 5,841 677 480 6,998
ShOuGAnG MA METAL CO 50.0% 4,140 1,144 204 (683) 4,805
ALMASIdER 50.0% 500 (500) -
PMC Automotive SpA
50.0% (2,076) 926 1,448 298
total Equity investments in joint venture companies
42,917 9,221 6,615 - 4,524 63,278
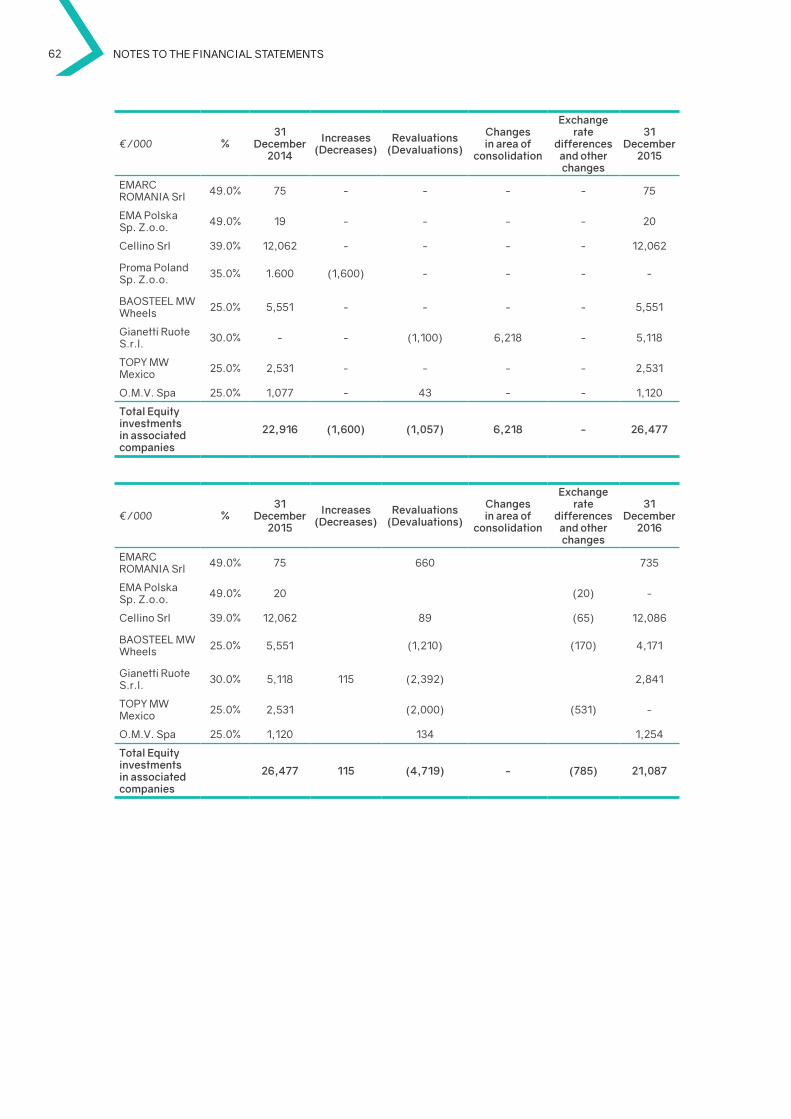
62 Notes to the fiNaNcial statemeNts
€/000 %31
december 2014
increases(decreases)
revaluations(devaluations)
Changes in area of
consolidation
Exchange rate
differences and other changes
31 december
2015
EMARC ROMAnIA Srl 49.0% 75 - - - - 75
EMA Polska Sp. Z.o.o. 49.0% 19 - - - - 20
Cellino Srl 39.0% 12,062 - - - - 12,062
Proma Poland Sp. Z.o.o. 35.0% 1.600 (1,600) - - - -
BAOSTEEL MW Wheels 25.0% 5,551 - - - - 5,551
Gianetti Ruote S.r.l. 30.0% - - (1,100) 6,218 - 5,118
TOPY MW Mexico 25.0% 2,531 - - - - 2,531
O.M.V. Spa 25.0% 1,077 - 43 - - 1,120
total Equity investments in associated companies
22,916 (1,600) (1,057) 6,218 - 26,477
€/000 %31
december 2015
increases(decreases)
revaluations(devaluations)
Changes in area of
consolidation
Exchange rate
differences and other changes
31 december
2016
EMARC ROMAnIA Srl 49.0% 75 660 735
EMA Polska Sp. Z.o.o. 49.0% 20 (20) -
Cellino Srl 39.0% 12,062 89 (65) 12,086
BAOSTEEL MW Wheels 25.0% 5,551 (1,210) (170) 4,171
Gianetti Ruote S.r.l. 30.0% 5,118 115 (2,392) 2,841
TOPY MW Mexico 25.0% 2,531 (2,000) (531) -
O.M.V. Spa 25.0% 1,120 134 1,254
total Equity investments in associated companies
26,477 115 (4,719) - (785) 21,087
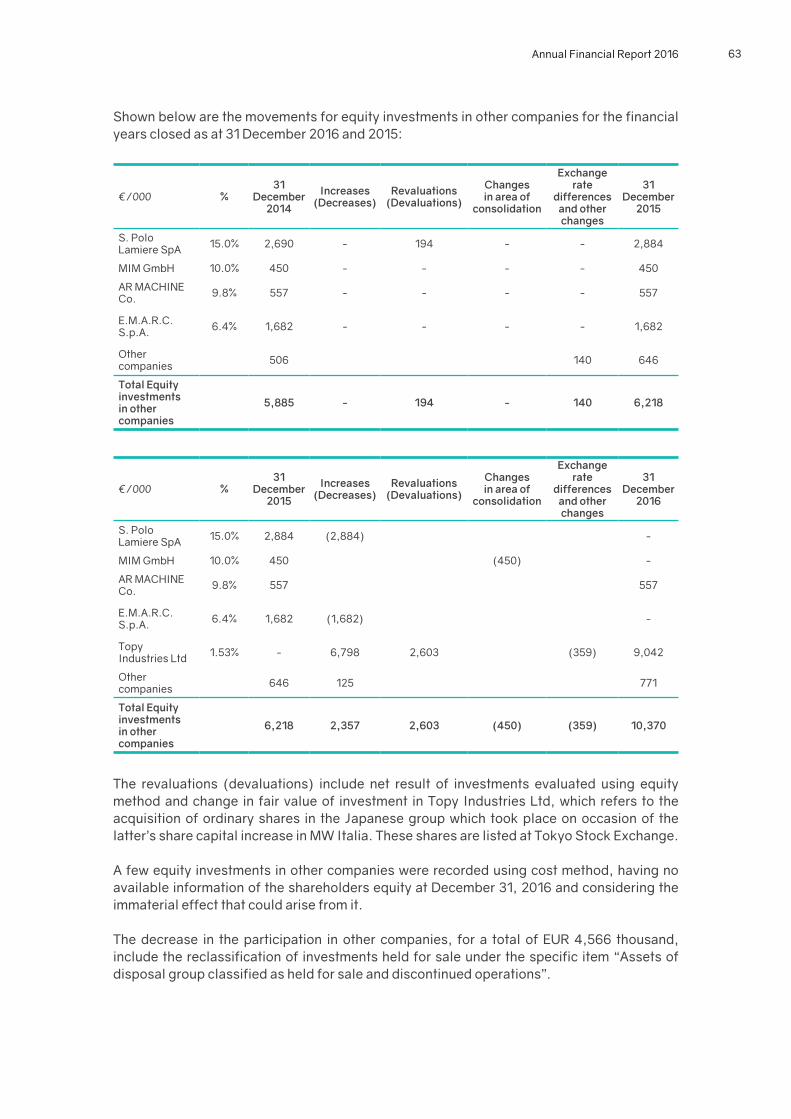
Annual Financial Report 2016 63
Shown below are the movements for equity investments in other companies for the financial years closed as at 31 december 2016 and 2015:
€/000 %31
december 2014
increases(decreases)
revaluations(devaluations)
Changes in area of
consolidation
Exchange rate
differences and other changes
31 december
2015
S. Polo Lamiere SpA 15.0% 2,690 - 194 - - 2,884
MIM Gmbh 10.0% 450 - - - - 450
AR MAChInE Co. 9.8% 557 - - - - 557
E.M.A.R.C. S.p.A. 6.4% 1,682 - - - - 1,682
Other companies 506 140 646
total Equity investments in other companies
5,885 - 194 - 140 6,218
€/000 %31
december 2015
increases(decreases)
revaluations(devaluations)
Changes in area of
consolidation
Exchange rate
differences and other changes
31 december
2016
S. Polo Lamiere SpA 15.0% 2,884 (2,884) -
MIM Gmbh 10.0% 450 (450) -
AR MAChInE Co. 9.8% 557 557
E.M.A.R.C. S.p.A. 6.4% 1,682 (1,682) -
Topy Industries Ltd 1.53% - 6,798 2,603 (359) 9,042
Other companies 646 125 771
total Equity investments in other companies
6,218 2,357 2,603 (450) (359) 10,370
The revaluations (devaluations) include net result of investments evaluated using equity method and change in fair value of investment in Topy Industries Ltd, which refers to the acquisition of ordinary shares in the Japanese group which took place on occasion of the latter’s share capital increase in MW Italia. These shares are listed at Tokyo Stock Exchange.
A few equity investments in other companies were recorded using cost method, having no available information of the shareholders equity at december 31, 2016 and considering the immaterial effect that could arise from it.
The decrease in the participation in other companies, for a total of EuR 4,566 thousand, include the reclassification of investments held for sale under the specific item “Assets of disposal group classified as held for sale and discontinued operations”.
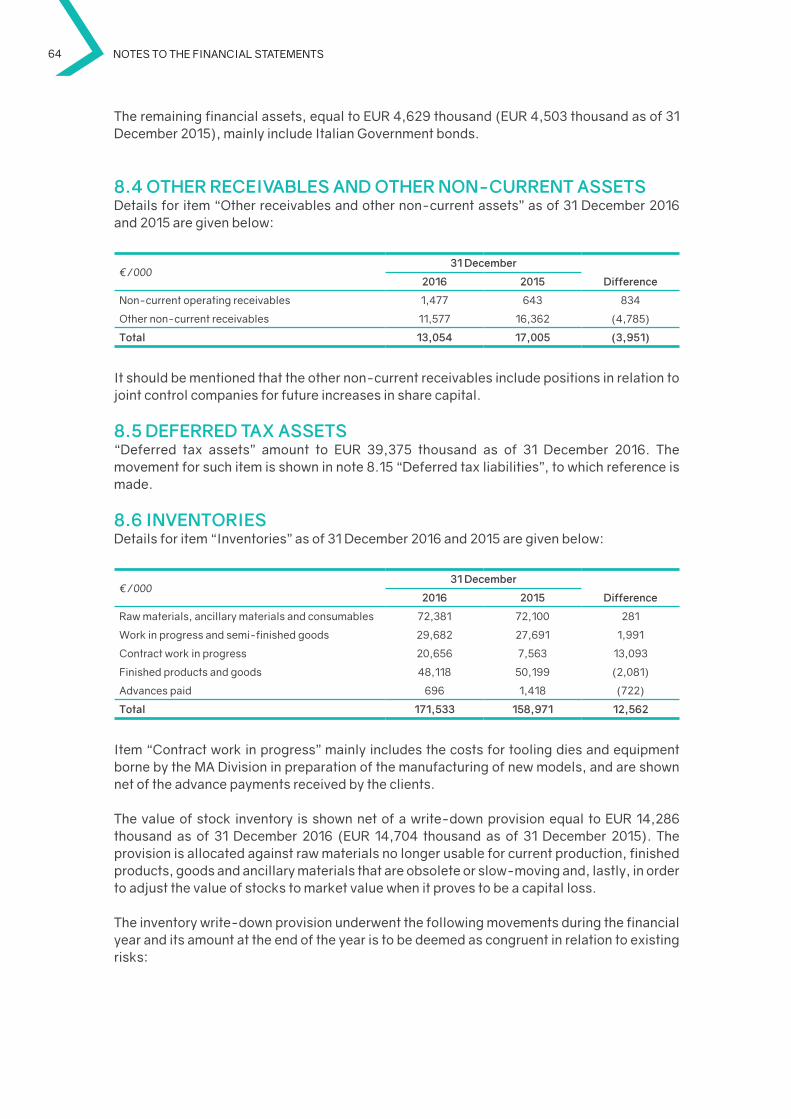
64 Notes to the fiNaNcial statemeNts
The remaining financial assets, equal to EuR 4,629 thousand (EuR 4,503 thousand as of 31 december 2015), mainly include Italian Government bonds.
8.4 othEr rECEivAbLES ANd othEr NoN-CUrrENt ASSEtSdetails for item “Other receivables and other non-current assets” as of 31 december 2016 and 2015 are given below:
€/00031 december
2016 2015 difference
non-current operating receivables 1,477 643 834
Other non-current receivables 11,577 16,362 (4,785)
total 13,054 17,005 (3,951)
It should be mentioned that the other non-current receivables include positions in relation to joint control companies for future increases in share capital.
8.5 dEFErrEd tAx ASSEtS“deferred tax assets” amount to EuR 39,375 thousand as of 31 december 2016. The movement for such item is shown in note 8.15 “deferred tax liabilities”, to which reference is made.
8.6 iNvENtoriESdetails for item “Inventories” as of 31 december 2016 and 2015 are given below:
€/00031 december
2016 2015 difference
Raw materials, ancillary materials and consumables 72,381 72,100 281
Work in progress and semi-finished goods 29,682 27,691 1,991
Contract work in progress 20,656 7,563 13,093
Finished products and goods 48,118 50,199 (2,081)
Advances paid 696 1,418 (722)
total 171,533 158,971 12,562
Item “Contract work in progress” mainly includes the costs for tooling dies and equipment borne by the MA division in preparation of the manufacturing of new models, and are shown net of the advance payments received by the clients.
The value of stock inventory is shown net of a write-down provision equal to EuR 14,286 thousand as of 31 december 2016 (EuR 14,704 thousand as of 31 december 2015). The provision is allocated against raw materials no longer usable for current production, finished products, goods and ancillary materials that are obsolete or slow-moving and, lastly, in order to adjust the value of stocks to market value when it proves to be a capital loss.
The inventory write-down provision underwent the following movements during the financial year and its amount at the end of the year is to be deemed as congruent in relation to existing risks:
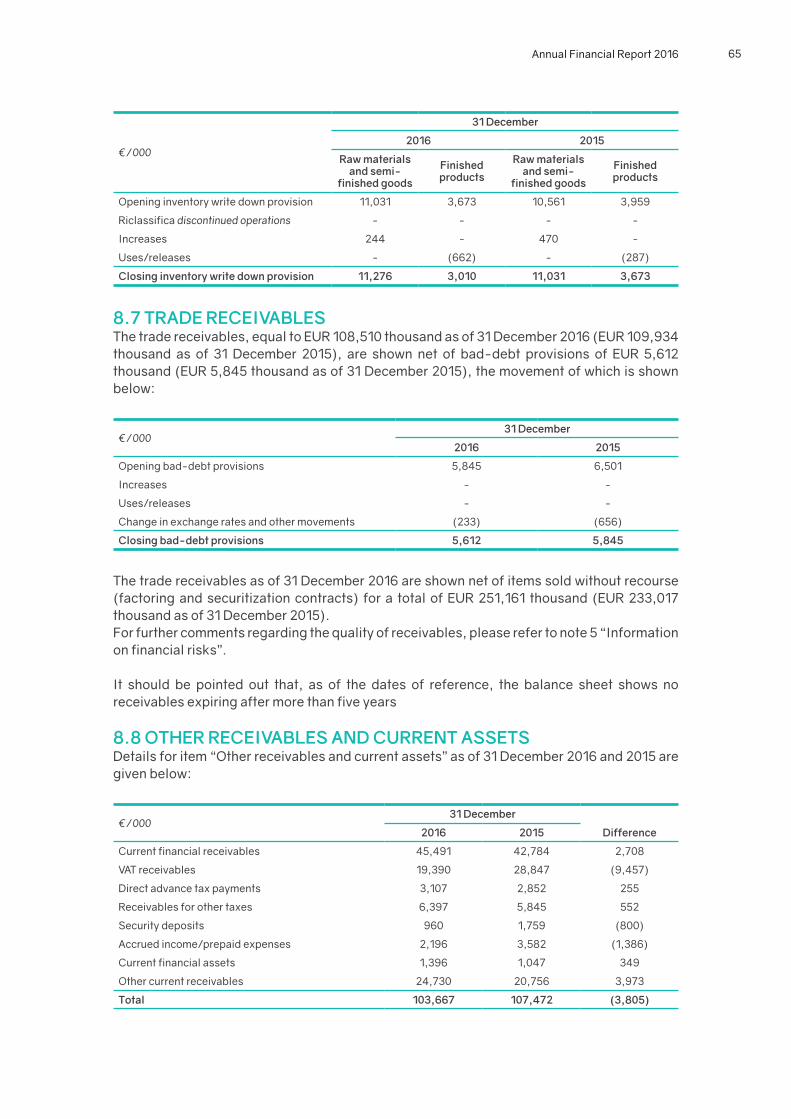
Annual Financial Report 2016 65
€/000
31 december
2016 2015
raw materials and semi-
finished goods
Finished products
raw materials and semi-
finished goods
Finished products
Opening inventory write down provision 11,031 3,673 10,561 3,959
Riclassifica discontinued operations - - - -
Increases 244 - 470 -
uses/releases - (662) - (287)
Closing inventory write down provision 11,276 3,010 11,031 3,673
8.7 trAdE rECEivAbLESThe trade receivables, equal to EuR 108,510 thousand as of 31 december 2016 (EuR 109,934 thousand as of 31 december 2015), are shown net of bad-debt provisions of EuR 5,612 thousand (EuR 5,845 thousand as of 31 december 2015), the movement of which is shown below:
€/00031 december
2016 2015
Opening bad-debt provisions 5,845 6,501
Increases - -
uses/releases - -
Change in exchange rates and other movements (233) (656)
Closing bad-debt provisions 5,612 5,845
The trade receivables as of 31 december 2016 are shown net of items sold without recourse (factoring and securitization contracts) for a total of EuR 251,161 thousand (EuR 233,017 thousand as of 31 december 2015).For further comments regarding the quality of receivables, please refer to note 5 “Information on financial risks”.
It should be pointed out that, as of the dates of reference, the balance sheet shows no receivables expiring after more than five years
8.8 othEr rECEivAbLES ANd CUrrENt ASSEtSdetails for item “Other receivables and current assets” as of 31 december 2016 and 2015 are given below:
€/00031 december
2016 2015 difference
Current financial receivables 45,491 42,784 2,708
VAT receivables 19,390 28,847 (9,457)
direct advance tax payments 3,107 2,852 255
Receivables for other taxes 6,397 5,845 552
Security deposits 960 1,759 (800)
Accrued income/prepaid expenses 2,196 3,582 (1,386)
Current financial assets 1,396 1,047 349
Other current receivables 24,730 20,756 3,973
total 103,667 107,472 (3,805)
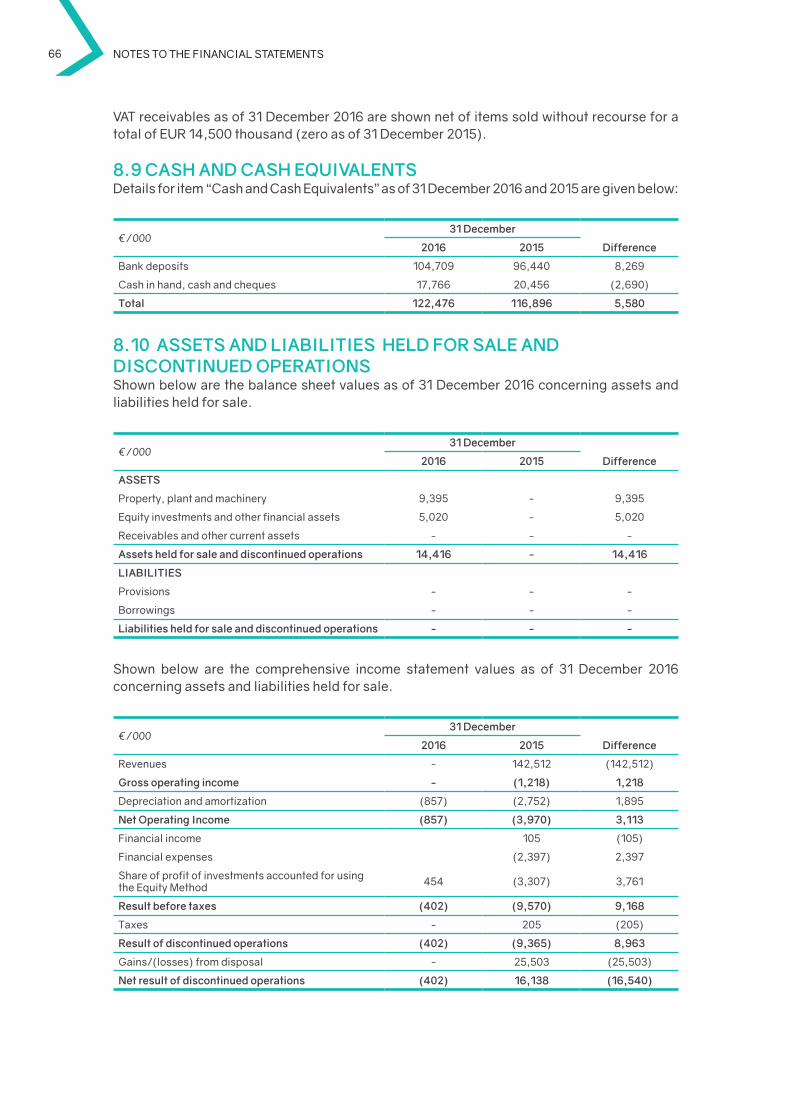
66 Notes to the fiNaNcial statemeNts
VAT receivables as of 31 december 2016 are shown net of items sold without recourse for a total of EuR 14,500 thousand (zero as of 31 december 2015).
8.9 CASh ANd CASh EQUivALENtSdetails for item “Cash and Cash Equivalents” as of 31 december 2016 and 2015 are given below:
€/00031 december
2016 2015 difference
Bank deposits 104,709 96,440 8,269
Cash in hand, cash and cheques 17,766 20,456 (2,690)
total 122,476 116,896 5,580
8.10 ASSEtS ANd LiAbiLitiES hELd For SALE ANddiSCoNtiNUEd opErAtioNSShown below are the balance sheet values as of 31 december 2016 concerning assets and liabilities held for sale.
€/00031 december
2016 2015 difference
ASSEtS
Property, plant and machinery 9,395 - 9,395
Equity investments and other financial assets 5,020 - 5,020
Receivables and other current assets - - -
Assets held for sale and discontinued operations 14,416 - 14,416
LiAbiLitiES
Provisions - - -
Borrowings - - -
Liabilities held for sale and discontinued operations - - -
Shown below are the comprehensive income statement values as of 31 december 2016 concerning assets and liabilities held for sale.
€/00031 december
2016 2015 difference
Revenues - 142,512 (142,512)
Gross operating income - (1,218) 1,218
depreciation and amortization (857) (2,752) 1,895
Net operating income (857) (3,970) 3,113
Financial income 105 (105)
Financial expenses (2,397) 2,397
Share of profit of investments accounted for using the Equity Method 454 (3,307) 3,761
result before taxes (402) (9,570) 9,168
Taxes - 205 (205)
result of discontinued operations (402) (9,365) 8,963
Gains/(losses) from disposal - 25,503 (25,503)
Net result of discontinued operations (402) 16,138 (16,540)
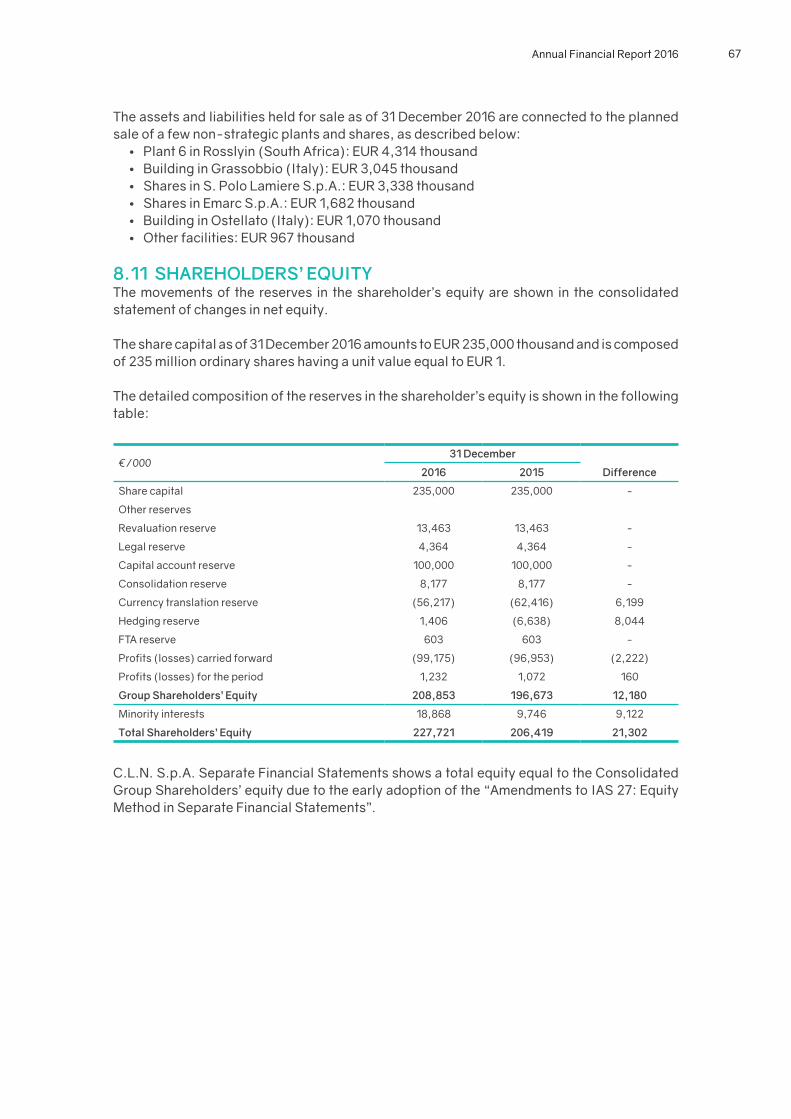
Annual Financial Report 2016 67
The assets and liabilities held for sale as of 31 december 2016 are connected to the planned sale of a few non-strategic plants and shares, as described below:
• Plant 6 in Rosslyin (South Africa): EuR 4,314 thousand• Building in Grassobbio (Italy): EuR 3,045 thousand• Shares in S. Polo Lamiere S.p.A.: EuR 3,338 thousand• Shares in Emarc S.p.A.: EuR 1,682 thousand• Building in Ostellato (Italy): EuR 1,070 thousand• Other facilities: EuR 967 thousand
8.11 ShArEhoLdErS’ EQUitYThe movements of the reserves in the shareholder’s equity are shown in the consolidated statement of changes in net equity.
The share capital as of 31 december 2016 amounts to EuR 235,000 thousand and is composed of 235 million ordinary shares having a unit value equal to EuR 1.
The detailed composition of the reserves in the shareholder’s equity is shown in the following table:
€/00031 december
2016 2015 difference
Share capital 235,000 235,000 -
Other reserves
Revaluation reserve 13,463 13,463 -
Legal reserve 4,364 4,364 -
Capital account reserve 100,000 100,000 -
Consolidation reserve 8,177 8,177 -
Currency translation reserve (56,217) (62,416) 6,199
hedging reserve 1,406 (6,638) 8,044
FTA reserve 603 603 -
Profits (losses) carried forward (99,175) (96,953) (2,222)
Profits (losses) for the period 1,232 1,072 160
Group Shareholders’ Equity 208,853 196,673 12,180
Minority interests 18,868 9,746 9,122
total Shareholders’ Equity 227,721 206,419 21,302
C.L.n. S.p.A. Separate Financial Statements shows a total equity equal to the Consolidated Group Shareholders’ equity due to the early adoption of the “Amendments to IAS 27: Equity Method in Separate Financial Statements”.
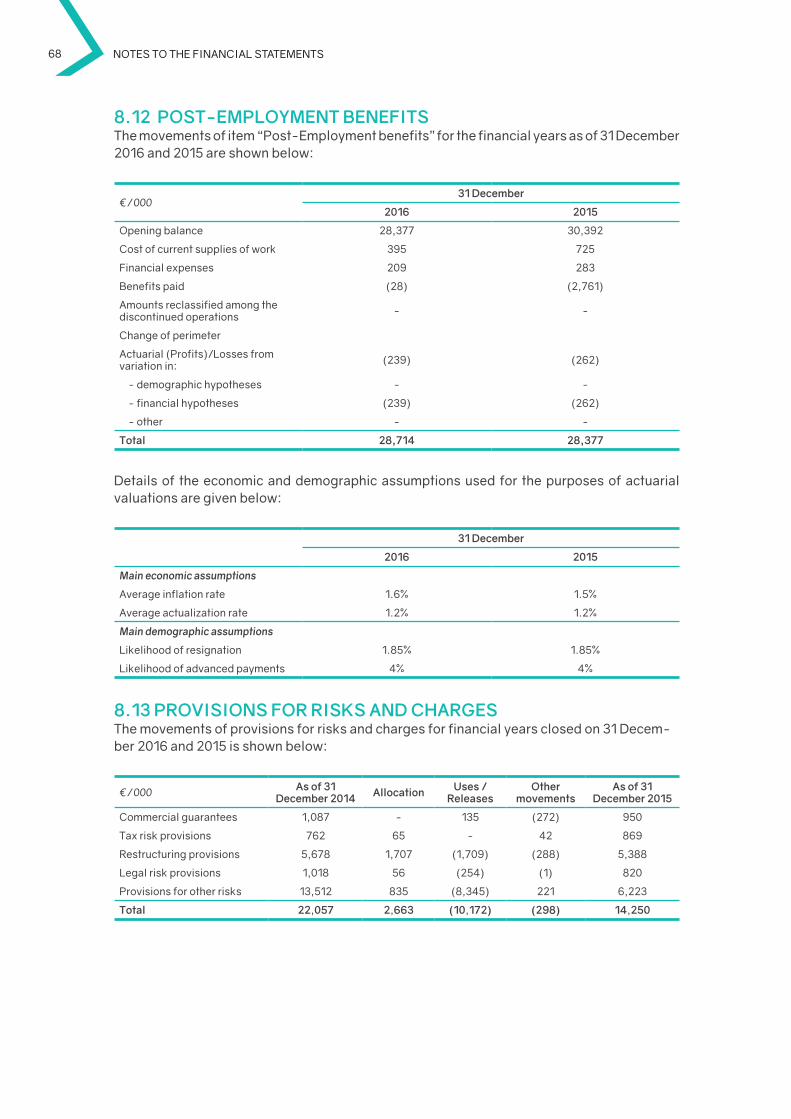
68 Notes to the fiNaNcial statemeNts
8.12 poSt-EMpLoYMENt bENEFitSThe movements of item “Post-Employment benefits” for the financial years as of 31 december 2016 and 2015 are shown below:
€/00031 december
2016 2015
Opening balance 28,377 30,392
Cost of current supplies of work 395 725
Financial expenses 209 283
Benefits paid (28) (2,761)
Amounts reclassified among the discontinued operations - -
Change of perimeter
Actuarial (Profits)/Losses from variation in: (239) (262)
- demographic hypotheses - -
- financial hypotheses (239) (262)
- other - -
total 28,714 28,377
details of the economic and demographic assumptions used for the purposes of actuarial valuations are given below:
31 december
2016 2015
Main economic assumptions
Average inflation rate 1.6% 1.5%
Average actualization rate 1.2% 1.2%
Main demographic assumptions
Likelihood of resignation 1.85% 1.85%
Likelihood of advanced payments 4% 4%
8.13 proviSioNS For riSKS ANd ChArGESThe movements of provisions for risks and charges for financial years closed on 31 decem-ber 2016 and 2015 is shown below:
€/000 As of 31 december 2014 Allocation Uses /
releasesother
movementsAs of 31
december 2015
Commercial guarantees 1,087 - 135 (272) 950
Tax risk provisions 762 65 - 42 869
Restructuring provisions 5,678 1,707 (1,709) (288) 5,388
Legal risk provisions 1,018 56 (254) (1) 820
Provisions for other risks 13,512 835 (8,345) 221 6,223
total 22,057 2,663 (10,172) (298) 14,250
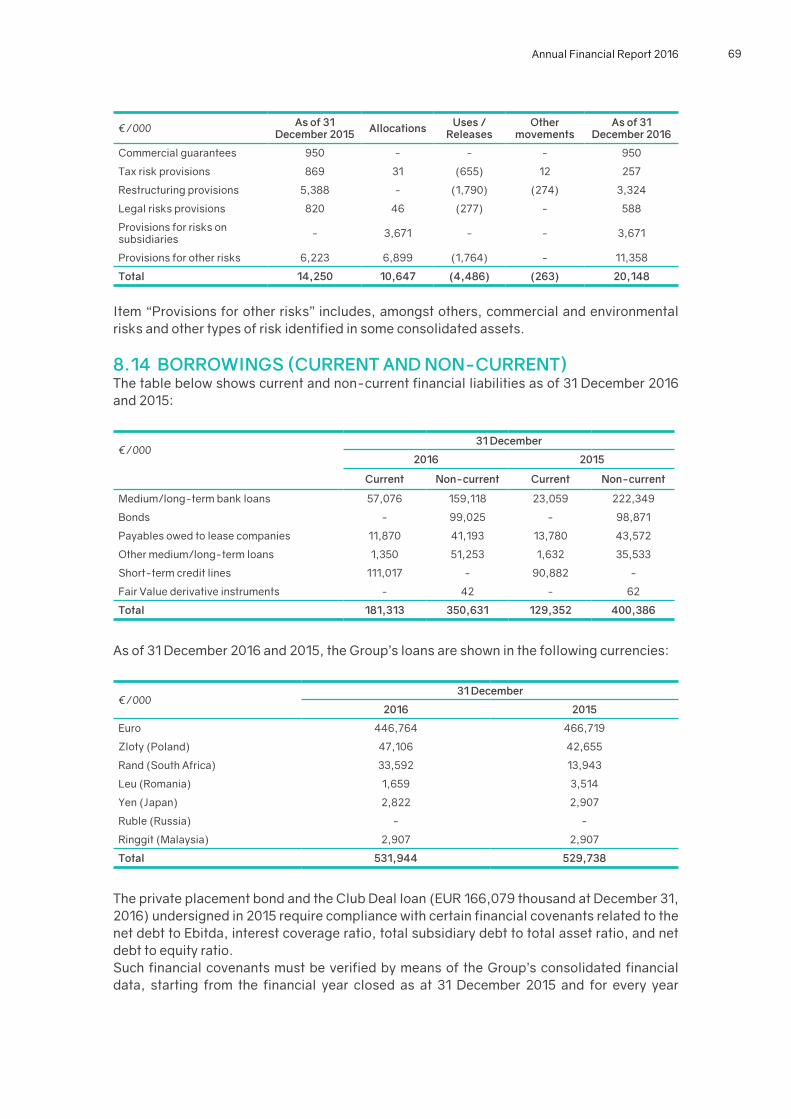
Annual Financial Report 2016 69
€/000 As of 31 december 2015 Allocations Uses /
releasesother
movementsAs of 31
december 2016
Commercial guarantees 950 - - - 950
Tax risk provisions 869 31 (655) 12 257
Restructuring provisions 5,388 - (1,790) (274) 3,324
Legal risks provisions 820 46 (277) - 588
Provisions for risks on subsidiaries - 3,671 - - 3,671
Provisions for other risks 6,223 6,899 (1,764) - 11,358
total 14,250 10,647 (4,486) (263) 20,148
Item “Provisions for other risks” includes, amongst others, commercial and environmental risks and other types of risk identified in some consolidated assets.
8.14 borroWiNGS (CUrrENt ANd NoN-CUrrENt)The table below shows current and non-current financial liabilities as of 31 december 2016 and 2015:
€/00031 december
2016 2015
Current Non-current Current Non-current
Medium/long-term bank loans 57,076 159,118 23,059 222,349
Bonds - 99,025 - 98,871
Payables owed to lease companies 11,870 41,193 13,780 43,572
Other medium/long-term loans 1,350 51,253 1,632 35,533
Short-term credit lines 111,017 - 90,882 -
Fair Value derivative instruments - 42 - 62
total 181,313 350,631 129,352 400,386
As of 31 december 2016 and 2015, the Group’s loans are shown in the following currencies:
€/00031 december
2016 2015
Euro 446,764 466,719
Zloty (Poland) 47,106 42,655
Rand (South Africa) 33,592 13,943
Leu (Romania) 1,659 3,514
Yen (Japan) 2,822 2,907
Ruble (Russia) - -
Ringgit (Malaysia) 2,907 2,907
total 531,944 529,738
The private placement bond and the Club deal loan (EuR 166,079 thousand at december 31, 2016) undersigned in 2015 require compliance with certain financial covenants related to the net debt to Ebitda, interest coverage ratio, total subsidiary debt to total asset ratio, and net debt to equity ratio. Such financial covenants must be verified by means of the Group’s consolidated financial data, starting from the financial year closed as at 31 december 2015 and for every year
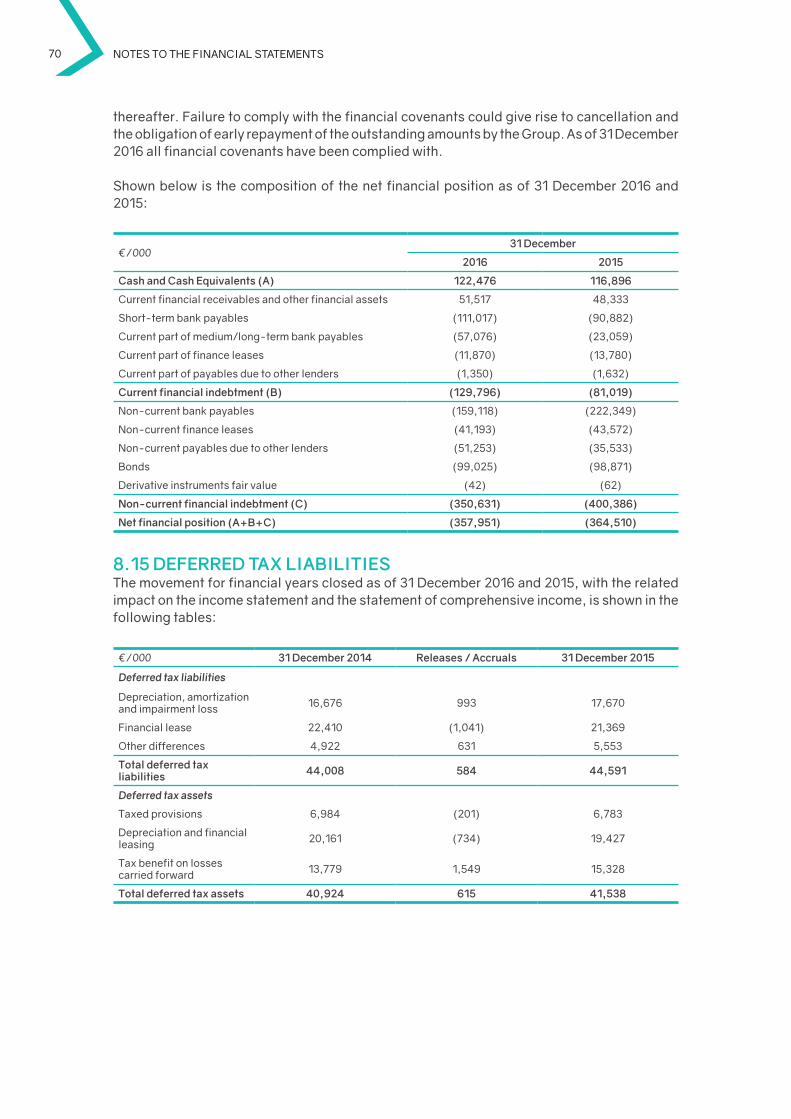
70 Notes to the fiNaNcial statemeNts
thereafter. Failure to comply with the financial covenants could give rise to cancellation and the obligation of early repayment of the outstanding amounts by the Group. As of 31 december 2016 all financial covenants have been complied with.
Shown below is the composition of the net financial position as of 31 december 2016 and 2015:
€/00031 december
2016 2015
Cash and Cash Equivalents (A) 122,476 116,896
Current financial receivables and other financial assets 51,517 48,333
Short-term bank payables (111,017) (90,882)
Current part of medium/long-term bank payables (57,076) (23,059)
Current part of finance leases (11,870) (13,780)
Current part of payables due to other lenders (1,350) (1,632)
Current financial indebtment (b) (129,796) (81,019)
non-current bank payables (159,118) (222,349)
non-current finance leases (41,193) (43,572)
non-current payables due to other lenders (51,253) (35,533)
Bonds (99,025) (98,871)
derivative instruments fair value (42) (62)
Non-current financial indebtment (C) (350,631) (400,386)
Net financial position (A+b+C) (357,951) (364,510)
8.15 dEFErrEd tAx LiAbiLitiESThe movement for financial years closed as of 31 december 2016 and 2015, with the related impact on the income statement and the statement of comprehensive income, is shown in the following tables:
€/000 31 december 2014 releases / Accruals 31 december 2015
Deferred tax liabilities
depreciation, amortization and impairment loss 16,676 993 17,670
Financial lease 22,410 (1,041) 21,369
Other differences 4,922 631 5,553
total deferred tax liabilities 44,008 584 44,591
Deferred tax assets
Taxed provisions 6,984 (201) 6,783
depreciation and financial leasing 20,161 (734) 19,427
Tax benefit on losses carried forward 13,779 1,549 15,328
total deferred tax assets 40,924 615 41,538
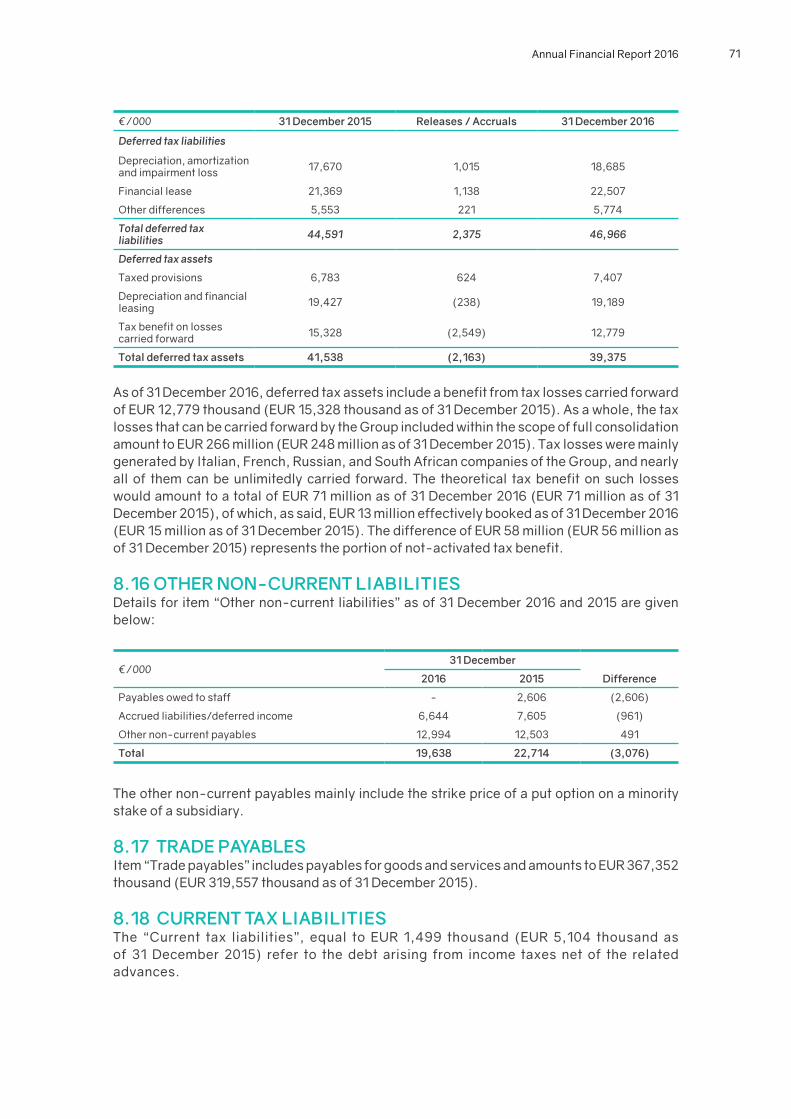
Annual Financial Report 2016 71
€/000 31 december 2015 releases / Accruals 31 december 2016
Deferred tax liabilities
depreciation, amortization and impairment loss 17,670 1,015 18,685
Financial lease 21,369 1,138 22,507
Other differences 5,553 221 5,774
Total deferred tax liabilities 44,591 2,375 46,966
Deferred tax assets
Taxed provisions 6,783 624 7,407
depreciation and financial leasing 19,427 (238) 19,189
Tax benefit on losses carried forward 15,328 (2,549) 12,779
total deferred tax assets 41,538 (2,163) 39,375
As of 31 december 2016, deferred tax assets include a benefit from tax losses carried forward of EuR 12,779 thousand (EuR 15,328 thousand as of 31 december 2015). As a whole, the tax losses that can be carried forward by the Group included within the scope of full consolidation amount to EuR 266 million (EuR 248 million as of 31 december 2015). Tax losses were mainly generated by Italian, French, Russian, and South African companies of the Group, and nearly all of them can be unlimitedly carried forward. The theoretical tax benefit on such losses would amount to a total of EuR 71 million as of 31 december 2016 (EuR 71 million as of 31 december 2015), of which, as said, EuR 13 million effectively booked as of 31 december 2016 (EuR 15 million as of 31 december 2015). The difference of EuR 58 million (EuR 56 million as of 31 december 2015) represents the portion of not-activated tax benefit.
8.16 othEr NoN-CUrrENt LiAbiLitiESdetails for item “Other non-current liabilities” as of 31 december 2016 and 2015 are given below:
€/00031 december
2016 2015 difference
Payables owed to staff - 2,606 (2,606)
Accrued liabilities/deferred income 6,644 7,605 (961)
Other non-current payables 12,994 12,503 491
total 19,638 22,714 (3,076)
The other non-current payables mainly include the strike price of a put option on a minority stake of a subsidiary.
8.17 trAdE pAYAbLESItem “Trade payables” includes payables for goods and services and amounts to EuR 367,352 thousand (EuR 319,557 thousand as of 31 december 2015).
8.18 CUrrENt tAx LiAbiLitiESThe “Current tax liabilities”, equal to EuR 1,499 thousand (EuR 5,104 thousand as of 31 december 2015) refer to the debt arising from income taxes net of the related advances.
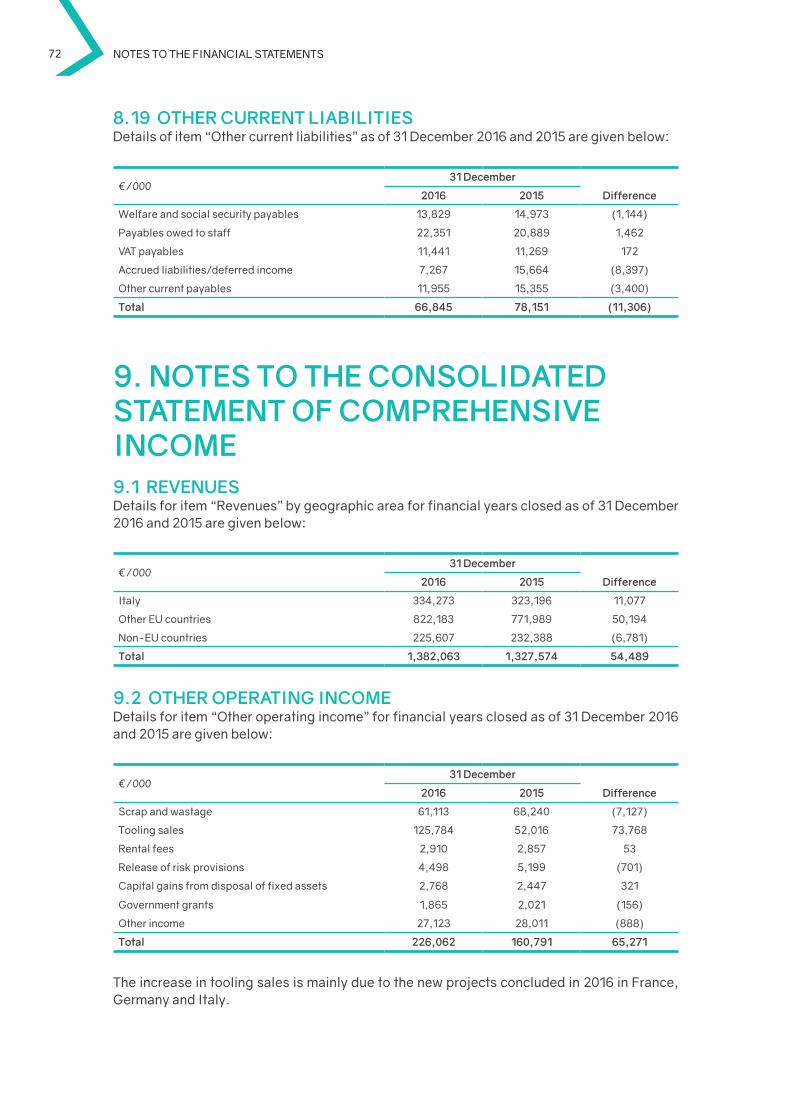
72 Notes to the fiNaNcial statemeNts
8.19 othEr CUrrENt LiAbiLitiESdetails of item “Other current liabilities” as of 31 december 2016 and 2015 are given below:
€/00031 december
2016 2015 difference
Welfare and social security payables 13,829 14,973 (1,144)
Payables owed to staff 22,351 20,889 1,462
VAT payables 11,441 11,269 172
Accrued liabilities/deferred income 7,267 15,664 (8,397)
Other current payables 11,955 15,355 (3,400)
total 66,845 78,151 (11,306)
9. NotES to thE CoNSoLidAtEdStAtEMENt oF CoMprEhENSivE iNCoME9.1 rEvENUESdetails for item “Revenues” by geographic area for financial years closed as of 31 december 2016 and 2015 are given below:
€/00031 december
2016 2015 difference
Italy 334,273 323,196 11,077
Other Eu countries 822,183 771,989 50,194
non-Eu countries 225,607 232,388 (6,781)
total 1,382,063 1,327,574 54,489
9.2 othEr opErAtiNG iNCoMEdetails for item “Other operating income” for financial years closed as of 31 december 2016 and 2015 are given below:
€/00031 december
2016 2015 difference
Scrap and wastage 61,113 68,240 (7,127)
Tooling sales 125,784 52,016 73,768
Rental fees 2,910 2,857 53
Release of risk provisions 4,498 5,199 (701)
Capital gains from disposal of fixed assets 2,768 2,447 321
Government grants 1,865 2,021 (156)
Other income 27,123 28,011 (888)
total 226,062 160,791 65,271
The increase in tooling sales is mainly due to the new projects concluded in 2016 in France, Germany and Italy.
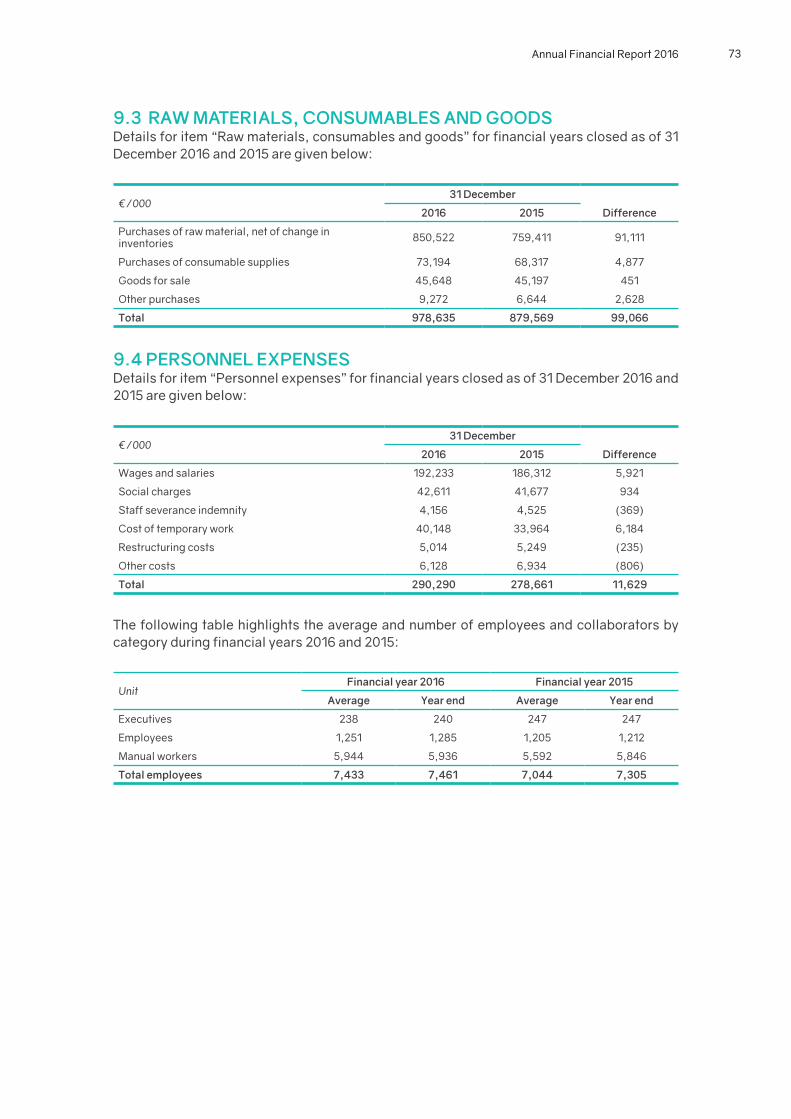
Annual Financial Report 2016 73
9.3 rAW MAtEriALS, CoNSUMAbLES ANd GoodS details for item “Raw materials, consumables and goods” for financial years closed as of 31 december 2016 and 2015 are given below:
€/00031 december
2016 2015 difference
Purchases of raw material, net of change in inventories 850,522 759,411 91,111
Purchases of consumable supplies 73,194 68,317 4,877
Goods for sale 45,648 45,197 451
Other purchases 9,272 6,644 2,628
total 978,635 879,569 99,066
9.4 pErSoNNEL ExpENSESdetails for item “Personnel expenses” for financial years closed as of 31 december 2016 and 2015 are given below:
€/00031 december
2016 2015 difference
Wages and salaries 192,233 186,312 5,921
Social charges 42,611 41,677 934
Staff severance indemnity 4,156 4,525 (369)
Cost of temporary work 40,148 33,964 6,184
Restructuring costs 5,014 5,249 (235)
Other costs 6,128 6,934 (806)
total 290,290 278,661 11,629
The following table highlights the average and number of employees and collaborators by category during financial years 2016 and 2015:
Unit Financial year 2016 Financial year 2015
Average Year end Average Year end
Executives 238 240 247 247
Employees 1,251 1,285 1,205 1,212
Manual workers 5,944 5,936 5,592 5,846
total employees 7,433 7,461 7,044 7,305
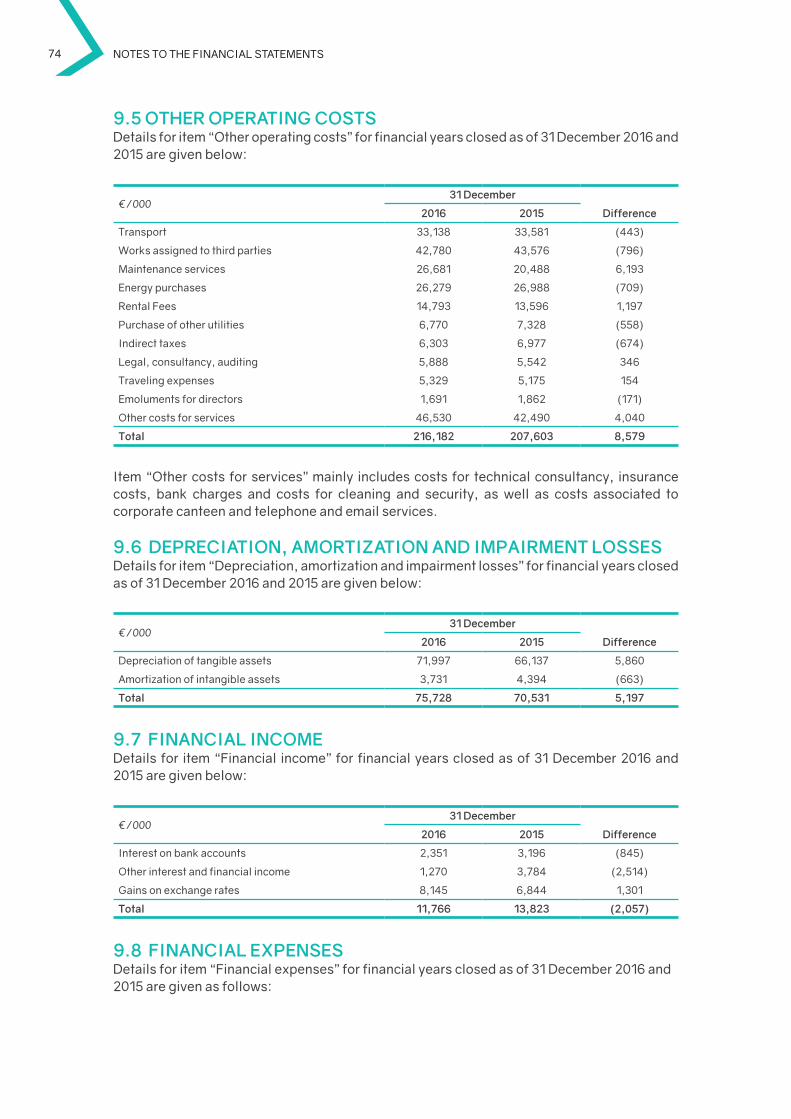
74 Notes to the fiNaNcial statemeNts
9.5 othEr opErAtiNG CoStSdetails for item “Other operating costs” for financial years closed as of 31 december 2016 and 2015 are given below:
€/00031 december
2016 2015 difference
Transport 33,138 33,581 (443)
Works assigned to third parties 42,780 43,576 (796)
Maintenance services 26,681 20,488 6,193
Energy purchases 26,279 26,988 (709)
Rental Fees 14,793 13,596 1,197
Purchase of other utilities 6,770 7,328 (558)
Indirect taxes 6,303 6,977 (674)
Legal, consultancy, auditing 5,888 5,542 346
Traveling expenses 5,329 5,175 154
Emoluments for directors 1,691 1,862 (171)
Other costs for services 46,530 42,490 4,040
total 216,182 207,603 8,579
Item “Other costs for services” mainly includes costs for technical consultancy, insurance costs, bank charges and costs for cleaning and security, as well as costs associated to corporate canteen and telephone and email services.
9.6 dEprECiAtioN, AMortizAtioN ANd iMpAirMENt LoSSESdetails for item “depreciation, amortization and impairment losses” for financial years closed as of 31 december 2016 and 2015 are given below:
€/00031 december
2016 2015 difference
depreciation of tangible assets 71,997 66,137 5,860
Amortization of intangible assets 3,731 4,394 (663)
total 75,728 70,531 5,197
9.7 FiNANCiAL iNCoMEdetails for item “Financial income” for financial years closed as of 31 december 2016 and 2015 are given below:
€/00031 december
2016 2015 difference
Interest on bank accounts 2,351 3,196 (845)
Other interest and financial income 1,270 3,784 (2,514)
Gains on exchange rates 8,145 6,844 1,301
total 11,766 13,823 (2,057)
9.8 FiNANCiAL ExpENSESdetails for item “Financial expenses” for financial years closed as of 31 december 2016 and 2015 are given as follows:
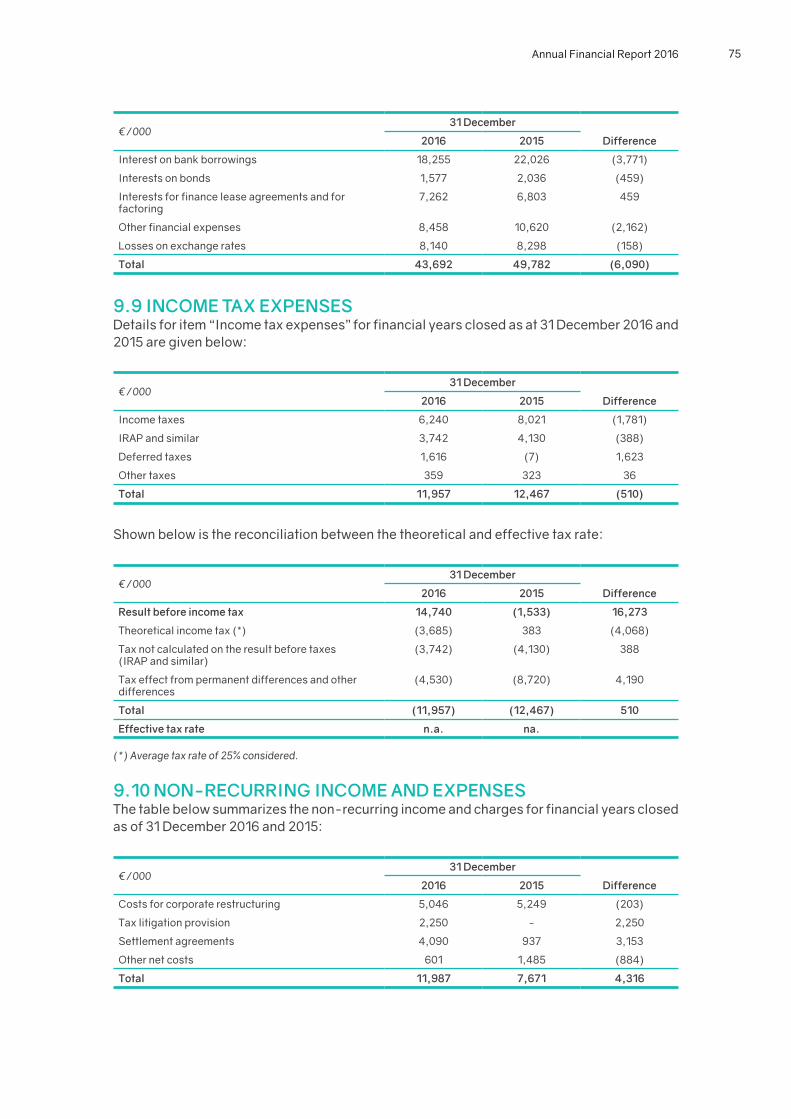
Annual Financial Report 2016 75
€/00031 december
2016 2015 difference
Interest on bank borrowings 18,255 22,026 (3,771)
Interests on bonds 1,577 2,036 (459)
Interests for finance lease agreements and for factoring
7,262 6,803 459
Other financial expenses 8,458 10,620 (2,162)
Losses on exchange rates 8,140 8,298 (158)
total 43,692 49,782 (6,090)
9.9 iNCoME tAx ExpENSESdetails for item “Income tax expenses” for financial years closed as at 31 december 2016 and 2015 are given below:
€/00031 december
2016 2015 difference
Income taxes 6,240 8,021 (1,781)
IRAP and similar 3,742 4,130 (388)
deferred taxes 1,616 (7) 1,623
Other taxes 359 323 36
total 11,957 12,467 (510)
Shown below is the reconciliation between the theoretical and effective tax rate:
€/00031 december
2016 2015 difference
result before income tax 14,740 (1,533) 16,273
Theoretical income tax (*) (3,685) 383 (4,068)
Tax not calculated on the result before taxes(IRAP and similar)
(3,742) (4,130) 388
Tax effect from permanent differences and other differences
(4,530) (8,720) 4,190
total (11,957) (12,467) 510
Effective tax rate n.a. na.
(*) Average tax rate of 25% considered.
9.10 NoN-rECUrriNG iNCoME ANd ExpENSESThe table below summarizes the non-recurring income and charges for financial years closed as of 31 december 2016 and 2015:
€/00031 december
2016 2015 difference
Costs for corporate restructuring 5,046 5,249 (203)
Tax litigation provision 2,250 - 2,250
Settlement agreements 4,090 937 3,153
Other net costs 601 1,485 (884)
total 11,987 7,671 4,316
76 Notes to the fiNaNcial statemeNts
Accruals on tax litigations derive from litigations in financial years 2008 and 2009 which arose on companies under joint control. Tax liabilities were deemed to be unlikely in previous financial years, according to the opinions provided by the Company’s consultants.
The settlement agreements refer to the closing of litigations born in past financial years and settled within the date of completion of the financial statement. Previously conducted assessments suggested that the event of liabilities arising from these litigations was remote.
10. trANSACtioNS With rELAtEdpArtiESRelations between the Group’s companies and other related parties are governed under market conditions. Relations between C.L.n. S.p.A. and its subsidiary and associated companies, as well as between such companies, are mainly of a commercial and financial nature.
details of the financial and income balances concerning transactions with related parties for the financial year closed as of 31 december 2016 are given as follows:
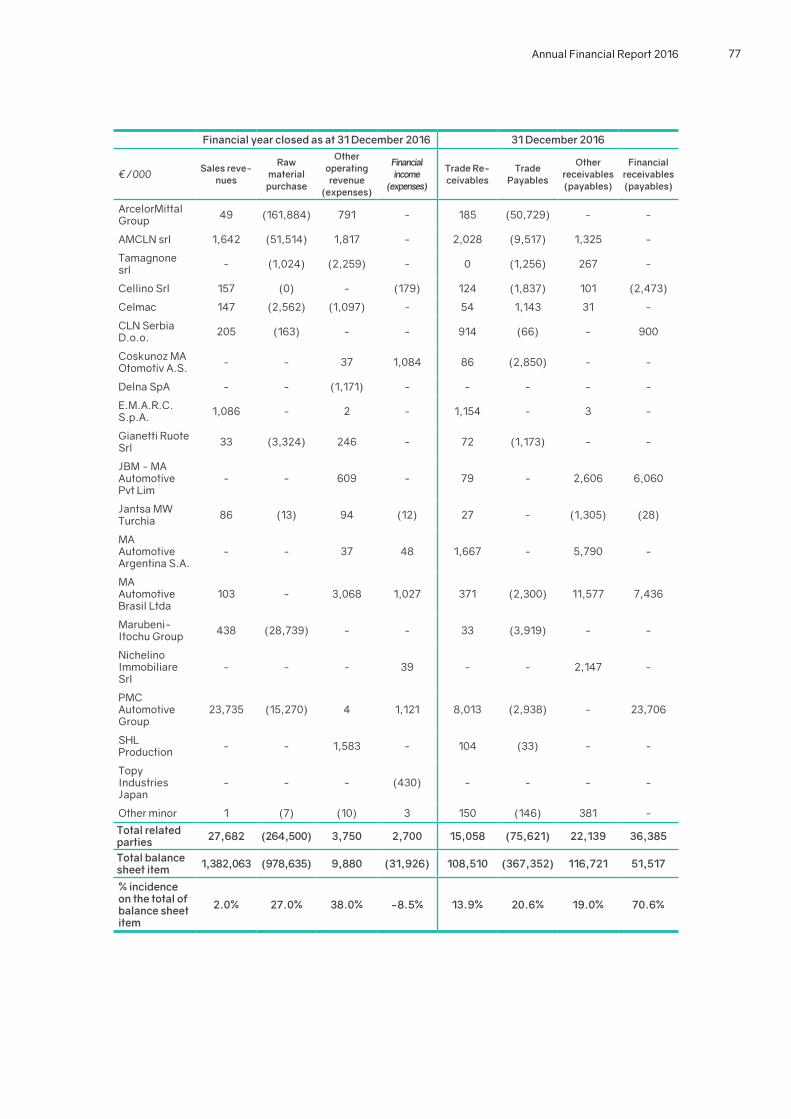
Annual Financial Report 2016 77
Financial year closed as at 31 december 2016 31 december 2016
€/000 Sales reve-nues
raw material
purchase
other operating revenue
(expenses)
Financial income
(expenses)
trade re-ceivables
trade payables
other receivables (payables)
Financial receivables (payables)
ArcelorMittal Group 49 (161,884) 791 - 185 (50,729) - -
AMCLn srl 1,642 (51,514) 1,817 - 2,028 (9,517) 1,325 -
Tamagnone srl - (1,024) (2,259) - 0 (1,256) 267 -
Cellino Srl 157 (0) - (179) 124 (1,837) 101 (2,473)
Celmac 147 (2,562) (1,097) - 54 1,143 31 -
CLn Serbia d.o.o. 205 (163) - - 914 (66) - 900
Coskunoz MA Otomotiv A.S. - - 37 1,084 86 (2,850) - -
delna SpA - - (1,171) - - - - -
E.M.A.R.C. S.p.A. 1,086 - 2 - 1,154 - 3 -
Gianetti Ruote Srl 33 (3,324) 246 - 72 (1,173) - -
JBM - MA Automotive Pvt Lim
- - 609 - 79 - 2,606 6,060
Jantsa MW Turchia 86 (13) 94 (12) 27 - (1,305) (28)
MA Automotive Argentina S.A.
- - 37 48 1,667 - 5,790 -
MA Automotive Brasil Ltda
103 - 3,068 1,027 371 (2,300) 11,577 7,436
Marubeni-Itochu Group 438 (28,739) - - 33 (3,919) - -
nichelino Immobiliare Srl
- - - 39 - - 2,147 -
PMC Automotive Group
23,735 (15,270) 4 1,121 8,013 (2,938) - 23,706
ShL Production - - 1,583 - 104 (33) - -
Topy Industries Japan
- - - (430) - - - -
Other minor 1 (7) (10) 3 150 (146) 381 -
total related parties 27,682 (264,500) 3,750 2,700 15,058 (75,621) 22,139 36,385
total balance sheet item 1,382,063 (978,635) 9,880 (31,926) 108,510 (367,352) 116,721 51,517
% incidence on the total of balance sheet item
2.0% 27.0% 38.0% -8.5% 13.9% 20.6% 19.0% 70.6%
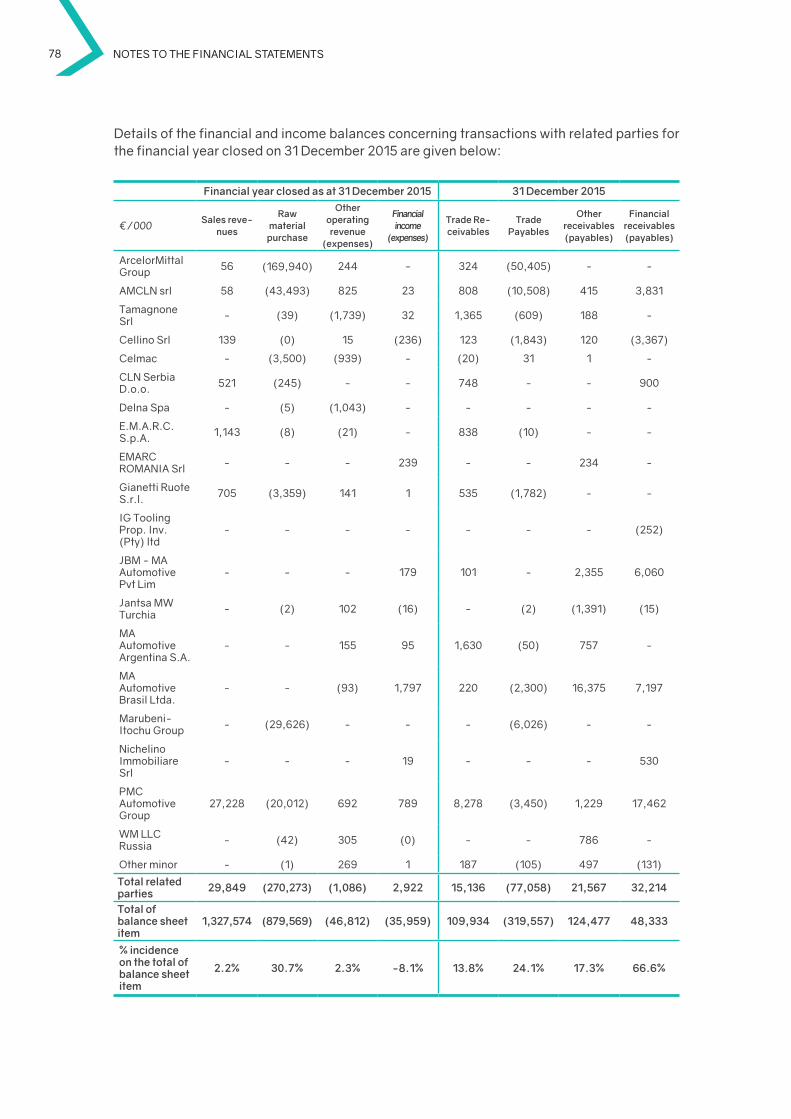
78 Notes to the fiNaNcial statemeNts
details of the financial and income balances concerning transactions with related parties for the financial year closed on 31 december 2015 are given below:
Financial year closed as at 31 december 2015 31 december 2015
€/000 Sales reve-nues
raw material
purchase
other operating revenue
(expenses)
Financial income
(expenses)
trade re-ceivables
trade payables
other receivables (payables)
Financial receivables (payables)
ArcelorMittal Group 56 (169,940) 244 - 324 (50,405) - -
AMCLn srl 58 (43,493) 825 23 808 (10,508) 415 3,831
Tamagnone Srl - (39) (1,739) 32 1,365 (609) 188 -
Cellino Srl 139 (0) 15 (236) 123 (1,843) 120 (3,367)
Celmac - (3,500) (939) - (20) 31 1 -
CLn Serbia d.o.o. 521 (245) - - 748 - - 900
delna Spa - (5) (1,043) - - - - -
E.M.A.R.C. S.p.A. 1,143 (8) (21) - 838 (10) - -
EMARC ROMAnIA Srl - - - 239 - - 234 -
Gianetti Ruote S.r.l. 705 (3,359) 141 1 535 (1,782) - -
IG Tooling Prop. Inv. (Pty) ltd
- - - - - - - (252)
JBM - MA Automotive Pvt Lim
- - - 179 101 - 2,355 6,060
Jantsa MW Turchia - (2) 102 (16) - (2) (1,391) (15)
MA Automotive Argentina S.A.
- - 155 95 1,630 (50) 757 -
MA Automotive Brasil Ltda.
- - (93) 1,797 220 (2,300) 16,375 7,197
Marubeni-Itochu Group - (29,626) - - - (6,026) - -
nichelino Immobiliare Srl
- - - 19 - - - 530
PMC Automotive Group
27,228 (20,012) 692 789 8,278 (3,450) 1,229 17,462
WM LLC Russia - (42) 305 (0) - - 786 -
Other minor - (1) 269 1 187 (105) 497 (131)
total related parties 29,849 (270,273) (1,086) 2,922 15,136 (77,058) 21,567 32,214
total of balance sheet item
1,327,574 (879,569) (46,812) (35,959) 109,934 (319,557) 124,477 48,333
% incidence on the total of balance sheet item
2.2% 30.7% 2.3% -8.1% 13.8% 24.1% 17.3% 66.6%
Annual Financial Report 2016 79
11. pAYMENtS For dirECtorS ANd StAtUtorY AUditorSdetails of the payments for directors and statutory auditors of C.L.n. S.p.A. for financial years closed as of 31 december 2016 and 2015 are given below:
€/000 directors Statutory auditors
31 december 2016 1,691 76
31 december 2015 1,862 72
12. ExtErNAL AUdit FEESThe fees due to the audit firm PricewaterhouseCoopers S.p.A., for auditing services on the consolidated financial statements 2016, amount to EuR 100 thousand(*). (*) the indicated fees refer to the audit of the separate and consolidated financial statements of C.L.N. S.p.A. Such fees do not include any amounts related to the audit activities carried out on the Group’s subsidiaries.
13. GUArANtEES GivENThe guarantees given by the Group as of 31 december 2016 amount to EuR 54,846 thousand (EuR 67,360 thousand in 2015) and mainly refer to sureties issued to credit institutes in favour of jointly controlled companies.
28 April 2017
Board of directorsthe Chairman
Aurora Magnetto
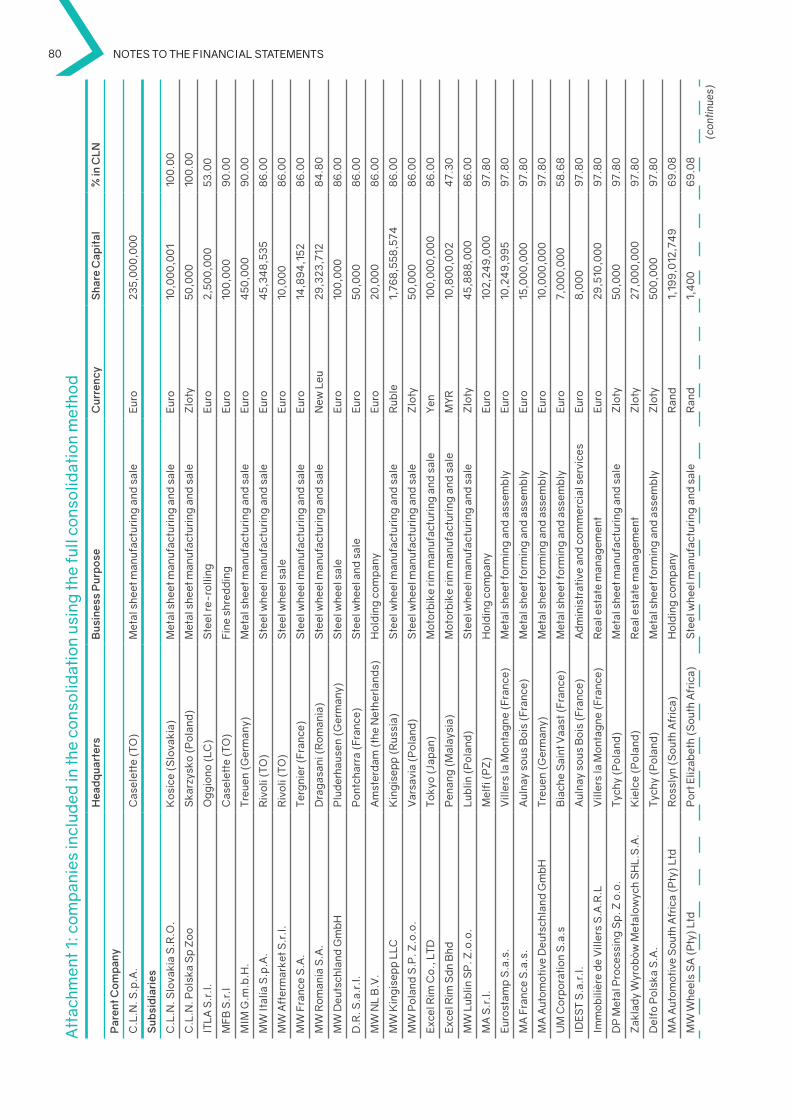
80 Notes to the fiNaNcial statemeNts
Att
achm
ent 1
: com
pan
ies
incl
uded
in th
e co
nsol
idat
ion
usin
g th
e fu
ll co
nsol
idat
ion
met
hod
h
ead
qua
rter
sb
usin
ess
pur
pos
eC
urre
ncy
Sha
re C
apit
al%
in C
LN
par
ent C
omp
any
C.L
.n. S
.p.A
. C
asel
ette
(TO
)M
etal
she
et m
anuf
actu
ring
and
sal
eEu
ro23
5,0
00
,00
0
Sub
sid
iari
es
C.L
.n. S
lova
kia
S.R
.O.
Kos
ice
(Slo
vaki
a)M
etal
she
et m
anuf
actu
ring
and
sal
eEu
ro10
,00
0,0
01
100
.00
C.L
.n. P
olsk
a S
p Z
ooS
karz
ysko
(P
olan
d)M
etal
she
et m
anuf
actu
ring
and
sal
eZ
loty
50,0
00
100
.00
ITLA
S.r
.l.
Og
gio
no (
LC)
Ste
el re
-rol
ling
Euro
2,50
0,0
00
53.0
0
MFB
S.r
.l
Cas
elet
te (
TO)
Fine
shr
eddi
ngEu
ro10
0,0
00
90
.00
MIM
G.m
.b.h
.Tr
euen
(G
erm
any)
Met
al s
heet
man
ufac
turi
ng a
nd s
ale
Euro
450
,00
09
0.0
0
MW
Ital
ia S
.p.A
.R
ivol
i (TO
)S
teel
whe
el m
anuf
actu
ring
and
sal
eEu
ro4
5,34
8,5
358
6.0
0
MW
Aft
erm
arke
t S.r
.l.
Riv
oli (
TO)
Ste
el w
heel
sal
eEu
ro10
,00
08
6.0
0
MW
Fra
nce
S.A
.Te
rgni
er (
Fran
ce)
Ste
el w
heel
man
ufac
turi
ng a
nd s
ale
Euro
14,8
94
,152
86
.00
MW
Rom
ania
S.A
.d
rag
asan
i (R
oman
ia)
Ste
el w
heel
man
ufac
turi
ng a
nd s
ale
new
Leu
29,3
23,7
128
4.8
0
MW
deu
tsch
land
Gm
bh
Plu
derh
ause
n (G
erm
any)
Ste
el w
heel
sal
eEu
ro10
0,0
00
86
.00
d.R
. S.a
.r.l
.P
ontc
harr
a (F
ranc
e)S
teel
whe
el a
nd s
ale
Euro
50,0
00
86
.00
MW
nL
B.V
.A
mst
erda
m (
the
net
herl
ands
)h
oldi
ng c
omp
any
Euro
20,0
00
86
.00
MW
Kin
gis
epp
LLC
Kin
gis
epp
(R
ussi
a)S
teel
whe
el m
anuf
actu
ring
and
sal
eR
uble
1,76
8,5
58,5
748
6.0
0
MW
Pol
and
S.P
. Z.o
.o.
Var
savi
a (P
olan
d)S
teel
whe
el m
anuf
actu
ring
and
sal
eZ
loty
50,0
00
86
.00
Exce
l Rim
Co.
, LTd
Toky
o (J
apan
)M
otor
bik
e ri
m m
anuf
actu
ring
and
sal
eYe
n10
0,0
00
,00
08
6.0
0
Exce
l Rim
Sdn
Bhd
Pen
ang
(M
alay
sia)
Mot
orb
ike
rim
man
ufac
turi
ng a
nd s
ale
MYR
10,8
00
,00
24
7.30
MW
Lub
lin S
P. Z
.o.o
.Lu
blin
(P
olan
d)S
teel
whe
el m
anuf
actu
ring
and
sal
eZ
loty
45,
88
8,0
00
86
.00
MA
S.r
.l.
Mel
fi (
PZ
)h
oldi
ng c
omp
any
Euro
102,
249
,00
09
7.8
0
Euro
stam
p S
.a.s
.V
iller
s la
Mon
tag
ne (
Fran
ce)
Met
al s
heet
form
ing
and
ass
emb
lyEu
ro10
,24
9,9
95
97.
80
MA
Fra
nce
S.a
.s.
Aul
nay
sous
Boi
s (F
ranc
e)M
etal
she
et fo
rmin
g a
nd a
ssem
bly
Euro
15,0
00
,00
09
7.8
0
MA
Aut
omot
ive
deu
tsch
land
Gm
bh
Treu
en (
Ger
man
y)M
etal
she
et fo
rmin
g a
nd a
ssem
bly
Euro
10,0
00
,00
09
7.8
0
uM
Cor
por
atio
n S
.a.s
Bia
che
Sai
nt V
aast
(Fr
ance
)M
etal
she
et fo
rmin
g a
nd a
ssem
bly
Euro
7,0
00
,00
058
.68
IdES
T S
.a.r
.l.
Aul
nay
sous
Boi
s (F
ranc
e)A
dmin
istr
ativ
e an
d co
mm
erci
al s
ervi
ces
Euro
8,0
00
97.
80
Imm
obili
ère
de V
iller
s S
.A.R
.LV
iller
s la
Mon
tag
ne (
Fran
ce)
Rea
l est
ate
man
agem
ent
Euro
29,5
10,0
00
97.
80
dP
Met
al P
roce
ssin
g S
p. Z
o.o
.Ty
chy
(Pol
and)
Met
al s
heet
man
ufac
turi
ng a
nd s
ale
Zlo
ty50
,00
09
7.8
0
Zak
lady
Wyr
obòw
Met
alow
ych
Sh
L.S
.A.
Kie
lce
(Pol
and)
Rea
l est
ate
man
agem
ent
Zlo
ty27
,00
0,0
00
97.
80
del
fo P
olsk
a S
.A.
Tych
y (P
olan
d)M
etal
she
et fo
rmin
g a
nd a
ssem
bly
Zlo
ty50
0,0
00
97.
80
MA
Aut
omot
ive
Sou
th A
fric
a (P
ty)
Ltd
Ros
slyn
(S
outh
Afr
ica)
hol
ding
com
pan
yR
and
1,19
9,0
12,7
49
69
.08
MW
Whe
els
SA
(P
ty)
Ltd
Por
t Eliz
abet
h (S
outh
Afr
ica)
Ste
el w
heel
man
ufac
turi
ng a
nd s
ale
Ran
d1,
40
06
9.0
8
(con
tinue
s)
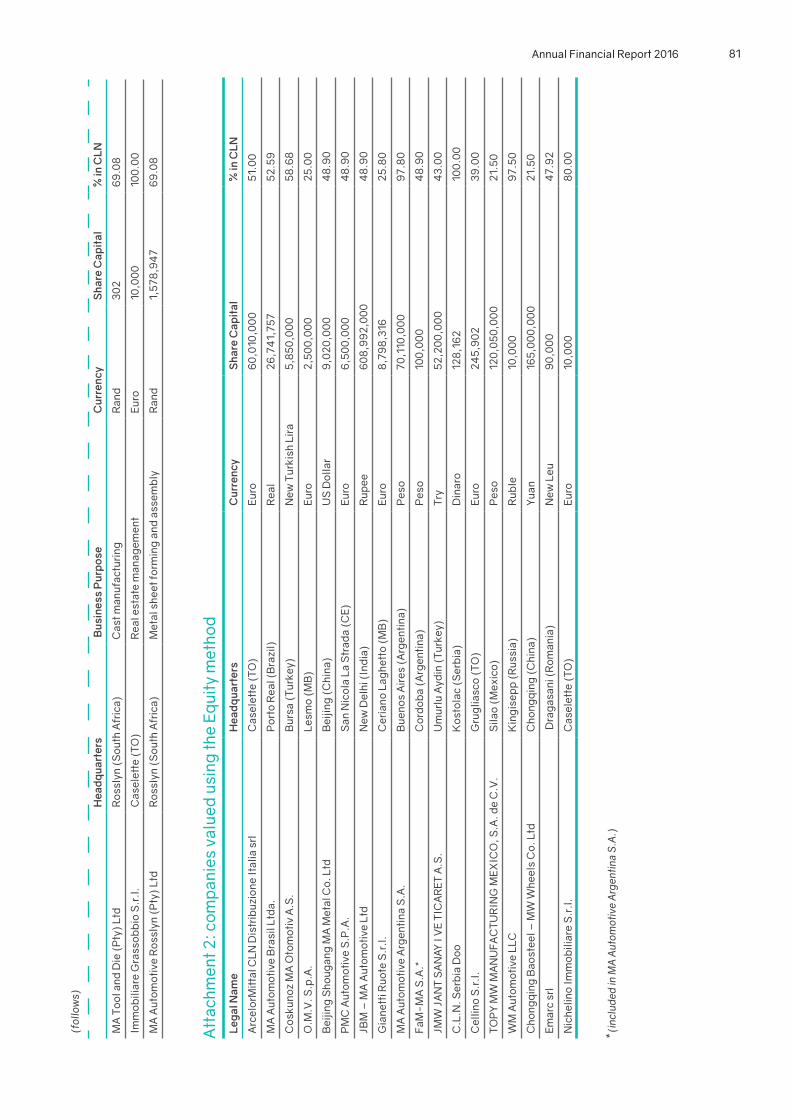
Annual Financial Report 2016 81
(fol
low
s)
h
ead
qua
rter
s b
usin
ess
pur
pos
eC
urre
ncy
Sha
re C
apit
al%
in C
LN
MA
Too
l and
die
(P
ty)
Ltd
Ros
slyn
(S
outh
Afr
ica)
Cas
t man
ufac
turi
ngR
and
302
69
.08
Imm
obili
are
Gra
ssob
bio
S.r
.l.
Cas
elet
te (
TO)
Rea
l est
ate
man
agem
ent
Euro
10,0
00
100
.00
MA
Aut
omot
ive
Ros
slyn
(P
ty)
Ltd
Ros
slyn
(S
outh
Afr
ica)
Met
al s
heet
form
ing
and
ass
emb
lyR
and
1,57
8,9
47
69
.08
Att
achm
ent 2
: com
pan
ies
valu
ed u
sing
the
Equi
ty m
etho
dLe
gal
Nam
eh
ead
qua
rter
sC
urre
ncy
Sha
re C
apit
al%
in C
LN
Arc
elor
Mit
tal C
Ln d
istr
ibuz
ione
Ital
ia s
rlC
asel
ette
(TO
)Eu
ro6
0,0
10,0
00
51.0
0
MA
Aut
omot
ive
Bra
sil L
tda.
Por
to R
eal (
Bra
zil)
Rea
l26
,74
1,75
752
.59
Cos
kuno
z M
A O
tom
otiv
A.S
.B
ursa
(Tu
rkey
)n
ew T
urki
sh L
ira
5,8
50,0
00
58.6
8
O.M
.V. S
.p.A
.Le
smo
(MB
)Eu
ro2,
500
,00
025
.00
Bei
jing
Sho
ugan
g M
A M
etal
Co.
Ltd
Bei
jing
(C
hina
)u
S d
olla
r9
,020
,00
04
8.9
0
PM
C A
utom
otiv
e S
.P.A
.S
an n
icol
a La
Str
ada
(CE)
Euro
6,5
00
,00
04
8.9
0
JBM
– M
A A
utom
otiv
e Lt
dn
ew d
elhi
(In
dia)
Rup
ee6
08
,99
2,0
00
48
.90
Gia
nett
i Ruo
te S
.r.l
.C
eria
no L
aghe
tto
(MB
)Eu
ro8
,79
8,3
1625
.80
MA
Aut
omot
ive
Arg
enti
na S
.A.
Bue
nos
Air
es (
Arg
enti
na)
Pes
o70
,110
,00
09
7.8
0
FaM
-MA
S.A
.*C
ordo
ba
(Arg
enti
na)
Pes
o10
0,0
00
48
.90
JMW
JA
nT
SA
nAY
I V
E TI
CA
RET
A.S
.u
mur
lu A
ydin
(Tu
rkey
)Tr
y52
,20
0,0
00
43.
00
C.L
.n. S
erb
ia d
ooK
osto
lac
(Ser
bia
)d
inar
o12
8,1
62
100
.00
Cel
lino
S.r
.l.
Gru
glia
sco
(TO
)Eu
ro24
5,9
02
39.0
0
TOP
Y M
W M
An
uFA
CTu
RIn
G M
EXIC
O, S
.A. d
e C
.V.
Sila
o (M
exic
o)P
eso
120
,050
,00
021
.50
WM
Aut
omot
ive
LLC
Kin
gis
epp
(R
ussi
a)R
uble
10,0
00
97.
50
Cho
ngqi
ng B
aost
eel –
MW
Whe
els
Co.
Ltd
Cho
ngqi
ng (
Chi
na)
Yuan
165,
00
0,0
00
21.5
0
Emar
c sr
l d
rag
asan
i (R
oman
ia)
new
Leu
90
,00
04
7.9
2
nic
helin
o Im
mob
iliar
e S
.r.l
.C
asel
ette
(TO
)Eu
ro10
,00
08
0.0
0
*(in
clud
ed in
MA
Aut
omot
ive
Arg
entin
a S
.A.)
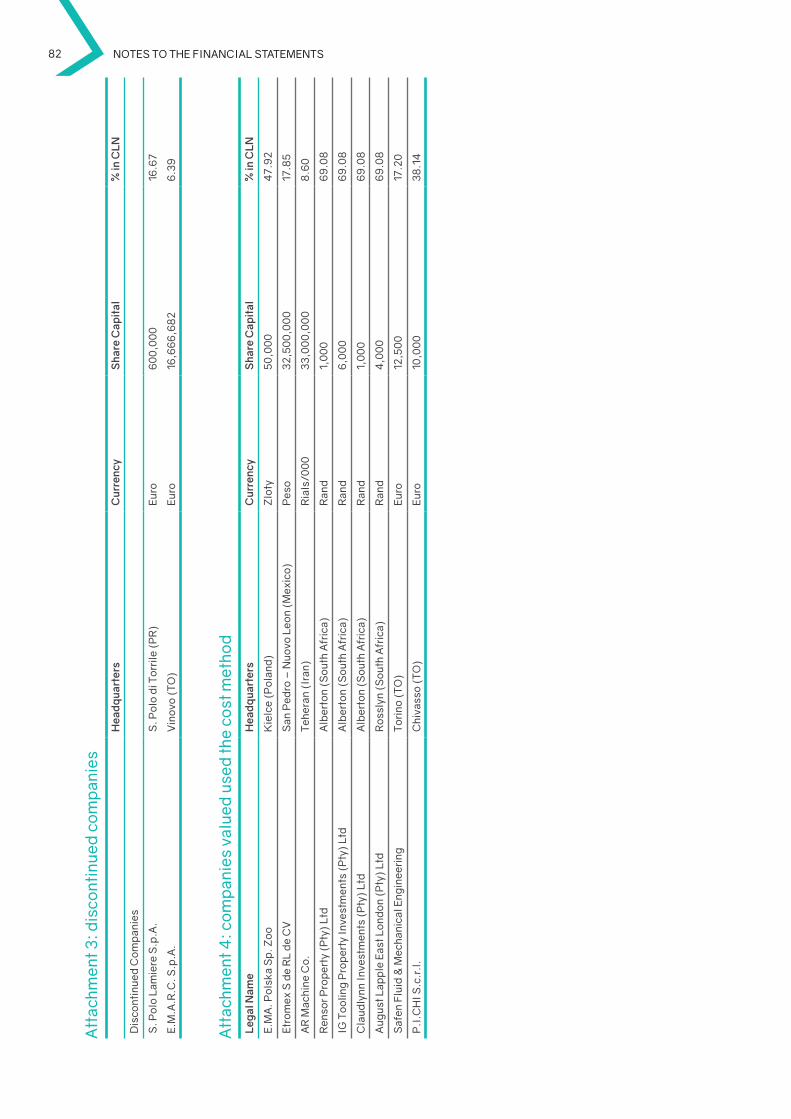
82 Notes to the fiNaNcial statemeNts
Att
achm
ent 3
: dis
cont
inue
d co
mp
anie
s
hea
dq
uart
ers
Cur
renc
yS
hare
Cap
ital
% in
CLN
dis
cont
inue
d C
omp
anie
s
S. P
olo
Lam
iere
S.p
.A.
S. P
olo
di T
orri
le (
PR
)Eu
ro6
00
,00
016
.67
E.M
.A.R
.C. S
.p.A
.V
inov
o (T
O)
Euro
16,6
66
,68
26
.39
Att
achm
ent 4
: com
pan
ies
valu
ed u
sed
the
cost
met
hod
Leg
al N
ame
hea
dq
uart
ers
Cur
renc
yS
hare
Cap
ital
% in
CLN
E.M
A. P
olsk
a S
p. Z
ooK
ielc
e (P
olan
d)Z
loty
50,0
00
47.
92
Etro
mex
S d
e R
L de
CV
San
Ped
ro –
nuo
vo L
eon
(Mex
ico)
Pes
o32
,50
0,0
00
17.8
5
AR
Mac
hine
Co.
Tehe
ran
(Ira
n)R
ials
/00
033
,00
0,0
00
8.6
0
Ren
sor P
rop
erty
(P
ty)
Ltd
Alb
erto
n (S
outh
Afr
ica)
Ran
d1,
00
06
9.0
8
IG T
oolin
g P
rop
erty
Inve
stm
ents
(P
ty)
Ltd
Alb
erto
n (S
outh
Afr
ica)
Ran
d6
,00
06
9.0
8
Cla
udly
nn In
vest
men
ts (
Pty
) Lt
dA
lber
ton
(Sou
th A
fric
a)R
and
1,0
00
69
.08
Aug
ust L
app
le E
ast L
ondo
n (P
ty)
Ltd
Ros
slyn
(S
outh
Afr
ica)
Ran
d4
,00
06
9.0
8
Saf
en F
luid
& M
echa
nica
l Eng
inee
ring
Tori
no (
TO)
Euro
12,5
00
17.2
0
P.I
.Ch
I S.c
.r.l
.C
hiva
sso
(TO
)Eu
ro10
,00
038
.14
4 AUditorS’rEport
INDEPENDENT AUDITORS’ REPORT IN ACCORDANCE WITH ARTICLES 14 AND 16 OF LEGISLATIVE DECREE NO. 39 OF 27 JANUARY 2010
C.L.N. GROUP
CONSOLIDATED FINANCIAL STATEMENTS AS OF 31 DECEMBER 2016
84 AUDITORS’ REPORT
INDEPENDENT AUDITORS’ REPORT IN ACCORDANCE WITH ARTICLES 14 AND 16 OF LEGISLATIVE DECREE No. 39 OF 27 JANUARY 2010
To the shareholders ofC.L.N. SpA
Report on the consolidated financial statements
We have audited the accompanying consolidated financial statements of C.L.N. SpA and its subsidiaries (“CLN Group”), which comprise the statement of financial position as of 31 December 2016, the statement of comprehensive income, the statement of changes in net equity and the cash flow statement for the year then ended, a summary of significant accounting policies and the related notes.
Directors’ responsibility for the consolidated financial statements
The directors of C.L.N. SpA are responsible for the preparation of consolidated financial statements that give a true and fair view in compliance with International Financial Reporting Standards asadopted by the European Union.
Auditors’ responsibility
Our responsibility is to express an opinion on these consolidated financial statements based on our audit. We conducted our audit in accordance with International Standards on Auditing (ISA Italia) drawn up pursuant to article 11 of Legislative Decree No. 39 of 27 January 2010. Those standards require that we comply with ethical requirements and plan and perform the audit to obtain reasonable assurance about whether the consolidated financial statements are free from material misstatement.
An audit involves performing audit procedures to obtain audit evidence about the amounts and disclosures in the consolidated financial statements. The audit procedures selected depend on the auditor’s professional judgment, including the assessment of the risks of material misstatement of the consolidated financial statements, whether due to fraud or error. In making those risk assessments, the auditor considers internal control relevant to the entity’s preparation of consolidated financial statements that give a true and fair view, in order to design audit procedures that are appropriate in the circumstances, but not for the purpose of expressing an opinion on the effectiveness of the entity’s internal control. An audit also includes evaluating the appropriateness of accounting policies used and the reasonableness of accounting estimates made by the directors, as well as evaluating the overall presentation of the consolidated financial statements.
We believe that the audit evidence we have obtained is sufficient and appropriate to provide a basis for our audit opinion.
Annual Financial Report 2016 85
3 of 3
Opinion
In our opinion, the consolidated financial statements give a true and fair view of the financial position of the CLN Group as of 31 December 2016 and of the result of its operations and cash flows for the year then ended in compliance with International Financial Reporting Standards as adopted by the European Union.
Report on compliance with other laws and regulations
Opinion on the consistency of the management report with the consolidated financial statements
We have performed the procedures required under auditing standard (SA Italia) No. 720B in order to express an opinion, as required by law, on the consistency of the management report, which is the responsibility of the directors of C.L.N. SpA, with the consolidated financial statements of the CLNGroup as of 31 December 2016. In our opinion, the management report is consistent with the consolidated financial statements of the CLN Group as of 31 December 2016.
Turin, 12 May 2017
PricewaterhouseCoopers SpA
Signed by
Piero De Lorenzi(Partner)
This report has been translated from the original which was issued in accordance with Italian legislation. We have not examined the translation of the consolidated financial statements referred to in this report.
edited byCLn Group Communications
printed in Italy © 2017
graphic designMassi Corporation

Cover photoMW Kingisepp’s employees during the ceremony for the presentation of Ford Q1 diploma (see page 25)
88
year ended December 31, 2016
ANNUALFINANCIALREPORT
CLN
Gro
up
Ann
ual F
inan
cial
Rep
ort 2
016
gruppocln.com
Corso Susa, 13/1510040 Caselette (to)
Italy