Embed Size (px)
Citation preview
A N N U A L F I N A N C I A L R E P O R T 2014-2015

O U R A S P I R A T I O N :
The University of Florida
will be a premier university
that the state, nation and
world look to for leadership.
2014‐2015 Annual Financial Report
A Component Unit of the State of Florida | 1
TABLE OF CONTENTS
Introduction from the Vice President and Chief Financial Officer ............................................ 2
Independent Auditor’s Report on Financial Statements ............................................................ 4
Management’s Discussion and Analysis ................................................................................... 6
Basic Financial Statements Statement of Net Position ................................................................................................. 12 Statement of Revenues, Expenses, and Changes in Net Position ..................................... 14 Statement of Cash Flows .................................................................................................. 15 Notes to the Financial Statements ..................................................................................... 17
Other Required Supplementary Information Schedule of Funding Progress – Other Postemployment
Benefits Plan ............................................................................................................... 43 Schedules of University’s Proportionate Share of the Net Pension Liability and
Schedules of University Contributions ....................................................................... 44
Independent Auditor’s Report on Internal Control Over Financial Reporting and on Compliance and Other Matters ............................................. 46
Executive Officers and Principal Finance and Accounting Officials ...................................... 48
2 | University of Florida
INTRODUCTION FROM THE VICE PRESIDENT AND CHIEF
FINANCIAL OFFICER
I am pleased to present the University of Florida Annual Financial Report for the fiscal year ended June 30, 2015. This report includes Management’s Discussion and Analysis (MD&A), financial statements, and notes to the financial statements which provide useful information concerning the University’s financial position and activities for the year. A summary is provided in the Financial Highlights section of the MD&A on page six.
The mission of the Office of the Vice President and Chief Financial Officer is to “Provide leadership in financial planning, decision making and process improvement.” We continually seek opportunities that allow us to implement our mission and return monies back to units accomplishing the University’s missions of education, research and public service. Highlights of some of our accomplishments include:
In an effort to help improve business intelligencetools, “myinvestiGator” was created. This is aweb-based, intuitive, easy to use decision makingtool to help faculty and staff track the nearly $700million in annual research funding at the Universityof Florida. The estimated annual time and effortsavings from the creation of myinvestiGator isapproximately $5 million.
We continue to implement a managed print solutionfor campus. This solution has a multiyear rollingimplementation timeframe that will encompasscopiers, fax machines, scanners and printers.Estimated annualized savings accruing to the userunits of approximately $1.1 million are expected tocontinue from this implementation.
We have established the Business ProcessImprovement Office that seeks to find ways toimprove, streamline and simplify the way we dobusiness at the University.
Our Gator Business Administrator Servicesprogram provides professional developmentopportunities and resources to assist businessadministrators in their roles at UF. This programcontinues to grow in scope of service offerings aswell as number of participants.
In addition to the business processes improvements and efforts noted above, fiscal year 2015 included the completion or near completion of several major construction projects:
Heavener Hall - houses the undergraduate programfor the Warrington College of Business;
Cypress Hall - a residence hall designed forundergraduate students and students withdisabilities; and
Several renovation projects on various residencehalls.
Construction continues on several major projects including the George T. Harrell, MD Medical Education Building, and the J. Wayne Reitz Union construction and renovation project. The Harrell Medical Education Building, expected to be completed in 2016, is named after the College of Medicine’s founding dean and aspires to be a national model for active learning and medical simulation. The Reitz Union project is expected to be completed later this year. The dramatic expansion and renovation project adds 100,000 square feet of new space for student clubs and organizations, quiet study spaces, lounges and dance rehearsal studios.
The University enterprise continues to advance its mission with UF Health constructing two new hospital towers in Gainesville and one in Jacksonville. The University Athletic Association has completed work on an indoor practice facility and continues work on renovations to the Office of Student Life. In addition, much needed renovations to the Stephen O’Connell Center, jointly funded by UF and the University Athletic Association, are scheduled to begin in the spring of 2016. The University of Florida Foundation continues to raise essential private funds that help advance the mission of UF. Finally, the research enterprise led by the Office of Research and the University of Florida Research Foundation has continued to grow and expand the business of scholarly research.
The State of Florida has continued its investment in higher education by providing new performance funding as well as additional funding for the preeminence initiative enabling the University to add new faculty. In addition, the State appropriated $13 million for the Nuclear Science Building renovations (NEXUS Engineering Addition).
We remain steadfast in our commitment to invest in the best solutions and successes for educating current and future generations.
Sincerely,
Michael V. McKee Vice President and Chief Financial Officer

2014‐2015 Annual Financial Report
A Component Unit of the State of Florida | 3
4 | University of Florida
Phone: (850) 412-2722Fax: (850) 488-6975
Sherrill F. Norman, CPA Auditor General
AUDITOR GENERAL STATE OF FLORIDA
Claude Denson Pepper Building, Suite G74 111 West Madison Street
Tallahassee, Florida 32399-1450
ThePresidentoftheSenate,theSpeakeroftheHouseofRepresentatives,andthe LegislativeAuditingCommittee
INDEPENDENTAUDITOR’SREPORT
ReportontheFinancialStatements
Wehave audited the accompanying financial statements of theUniversity of Florida, a component unit of the State of Florida, and itsaggregatediscretelypresentedcomponentunitsasofandforthefiscalyearendedJune30,2015,andtherelatednotestothefinancialstatements,whichcollectivelycomprisetheUniversity’sbasicfinancialstatementsaslistedinthetableofcontents.
Management’sResponsibilityfortheFinancialStatements
ManagementisresponsibleforthepreparationandfairpresentationofthesefinancialstatementsinaccordancewithaccountingprinciplesgenerallyacceptedintheUnitedStatesofAmerica;thisincludesthedesign,implementation,andmaintenanceofinternalcontrolrelevanttothepreparationandfairpresentationoffinancialstatementsthatarefreefrommaterialmisstatement,whetherduetofraudorerror.
Auditor’sResponsibility
Ourresponsibilityistoexpressopinionsonthesefinancialstatementsbasedonouraudit.Wedidnotauditthefinancialstatementsoftheaggregatediscretelypresentedcomponentunits,whichrepresent100percentofthetransactionsandaccountbalancesoftheaggregatediscretelypresentedcomponentunits’columns.Thosestatementswereauditedbyotherauditorswhosereportshavebeenfurnishedtous,andouropinions,insofarastheyrelatetotheamountsincludedfortheaggregatediscretelypresentedcomponentunits,arebasedsolelyonthereportsoftheotherauditors.WeconductedourauditinaccordancewithauditingstandardsgenerallyacceptedintheUnitedStatesofAmericaandthestandardsapplicabletofinancialauditscontainedinGovernmentAuditingStandards,issuedbytheComptrollerGeneraloftheUnitedStates.Thosestandardsrequirethatweplanandperformtheaudittoobtainreasonableassuranceaboutwhetherthefinancialstatementsarefreefrommaterialmisstatement.
Anaudit involvesperformingprocedures toobtain audit evidenceabout the amounts anddisclosures in the financial statements. Theprocedures selected depend on the auditor’s judgment, including the assessment of the risks ofmaterialmisstatement of the financialstatements,whetherduetofraudorerror.Inmakingthoseriskassessments,theauditorconsidersinternalcontrolrelevanttotheentity’spreparationandfairpresentationofthefinancialstatementsinordertodesignauditproceduresthatareappropriateinthecircumstances,butnotforthepurposeofexpressinganopinionontheeffectivenessoftheentity’sinternalcontrol.Accordingly,weexpressnosuchopinion.Anauditalsoincludesevaluatingtheappropriatenessofaccountingpoliciesusedandthereasonablenessofsignificantaccountingestimatesmadebymanagement,aswellasevaluatingtheoverallpresentationofthefinancialstatements.
Webelievethattheauditevidencewehaveobtainedissufficientandappropriatetoprovideabasisforourauditopinions.
Opinions
Inouropinion,basedonourauditandthereportsofotherauditors,thefinancialstatementsreferredtoabovepresentfairly,inallmaterialrespects, the respective financial position of theUniversity of Florida and of its aggregate discretely presented component units as ofJune30,2015,andtherespectivechangesinfinancialpositionand,whereapplicable,cashflowsthereofforthefiscalyearthenended,inaccordancewithaccountingprinciplesgenerallyacceptedintheUnitedStatesofAmerica.
ReportonPartialComparativeInformation
Wehavepreviouslyaudited theUniversityofFlorida’s2013‐14 fiscalyear financial statements,andweexpressedanunmodifiedauditopiniononthoseauditedfinancialstatementsinourreportdatedDecember16,2014.Inouropinion,thepartialcomparativeinformation
2014‐2015 Annual Financial Report
A Component Unit of the State of Florida | 5
presentedasofandforthefiscalyearendedJune30,2014,isconsistent,inallmaterialrespects,withtheauditedfinancialstatementsfromwhichithasbeenderived.
EmphasisofMatters
AsdiscussedinNotes2and3tothefinancialstatements,theUniversityimplementedGovernmentalAccountingStandardsBoard(GASB)StatementNo.68,AccountingandFinancialReportingforPensions,anamendmentofGASBStatementNo.27,whichisachangeinaccountingprinciplethatrequiresanemployerparticipatinginacost‐sharingmultiple‐employerdefinedbenefitpensionplantoreporttheemployer’sproportionateshareofthenetpensionliabilityofthedefinedbenefitpensionplan.Additionally,Universitymanagementdeterminedthatthe University of Florida Self‐Insurance Program and the University of Florida Healthcare Education Insurance Company, previouslyreportedasblendedcomponentunits,shouldbereportedasdiscretelypresentedcomponentunits,whichisachangeinreportingentity.Thesechangesaffectthecomparabilityofamountsreportedinthe2014‐15fiscalyearwiththeamountsreportedforthe2013‐14fiscalyear.Ouropinionisnotmodifiedwithrespecttothesematters.
OtherMatters
RequiredSupplementaryInformation
Accounting principles generally accepted in the United States of America require thatMANAGEMENT’SDISCUSSIONANDANALYSIS,ScheduleofFundingProgress–OtherPostemploymentBenefitsPlan,ScheduleoftheUniversity’sProportionateShareoftheNetPensionLiability–FloridaRetirementSystemPensionPlan,ScheduleofUniversityContributions–FloridaRetirementSystemPensionPlan,ScheduleoftheUniversity’sProportionateShareoftheNetPensionLiability–HealthInsuranceSubsidyPensionPlan, and ScheduleofUniversityContributions –Health Insurance SubsidyPensionPlan, be presented to supplement the basicfinancialstatements.Suchinformation,althoughnotapartofthebasicfinancialstatements,isrequiredbytheGovernmentalAccountingStandardsBoardwhoconsidersittobeanessentialpartoffinancialreportingforplacingthebasicfinancialstatementsinanappropriateoperational,economic,orhistoricalcontext. Wehaveappliedcertain limitedprocedures to therequiredsupplementary information inaccordancewithauditingstandardsgenerallyacceptedintheUnitedStatesofAmerica,whichconsistedofinquiriesofmanagementaboutthemethodsofpreparingtheinformationandcomparingtheinformationforconsistencywithmanagement’sresponsestoourinquiries,thebasicfinancialstatements,andotherknowledgeweobtainedduringourauditofthebasicfinancialstatements.Wedonotexpressanopinionorprovideanyassuranceontheinformationbecausethelimitedproceduresdonotprovideuswithsufficientevidencetoexpressanopinionorprovideanyassurance.
OtherInformation
OurauditwasconductedforthepurposeofformingopinionsonthefinancialstatementsthatcollectivelycomprisetheUniversityofFlorida’sbasic financial statements. The Introduction from theVicePresident andChiefFinancialOfficer ispresented forpurposeof additionalanalysisandisnotarequiredpartofthebasicfinancialstatements.
TheIntroductionfromtheVicePresidentandChiefFinancialOfficerhasnotbeensubjectedtotheauditingproceduresappliedintheauditofthebasicfinancialstatementsand,accordingly,wedonotexpressanopinionorprovideanyassuranceonit.
OtherReportingRequiredbyGovernmentAuditingStandards
InaccordancewithGovernmentAuditingStandards,wehavealsoissuedareportonourconsiderationoftheUniversityofFlorida’sinternalcontroloverfinancialreportingandonourtestsofitscompliancewithcertainprovisionsoflaws,rules,regulations,contracts,andgrantagreements and other matters included under the heading INDEPENDENT AUDITOR’S REPORT ON INTERNAL CONTROL OVERFINANCIAL REPORTING AND ON COMPLIANCE AND OTHER MATTERS BASED ON AN AUDIT OF FINANCIAL STATEMENTSPERFORMEDINACCORDANCEWITHGOVERNMENTAUDITINGSTANDARDS.Thepurposeofthatreportistodescribethescopeofourtestingofinternalcontroloverfinancialreportingandcomplianceandtheresultsofthattesting,andnottoprovideanopinionontheinternalcontroloverfinancialreportingoroncompliance. ThatreportisanintegralpartofanauditperformedinaccordancewithGovernmentAuditingStandardsinconsideringtheUniversityofFlorida’sinternalcontroloverfinancialreportingandcompliance.
Respectfullysubmitted,
SherrillF.Norman,CPATallahassee,FloridaFebruary17,2016AuditReportNo.2016‐098
6 | University of Florida
MANAGEMENT’S DISCUSSION AND ANALYSIS From the Vice President and Chief Financial Officer
Introduction and Background
The Management’s Discussion and Analysis (MD&A) provides an overview of the financial position and activities of the University of Florida (the University) for the fiscal year ended June 30, 2015, and should be read in conjunction with the financial statements and notes thereto. This overview is required by Governmental Accounting Standards Board (GASB) Statement No. 35, Basic Financial Statements – and Management’s Discussion and Analysis – for Public Colleges and Universities, as amended by GASB Statements Nos. 37 and 38. The MD&A, financial statements, and notes thereto, are theresponsibility of University management. The MD&A containsfinancial activity of the University for the fiscal years endedJune 30, 2015, and June 30, 2014.
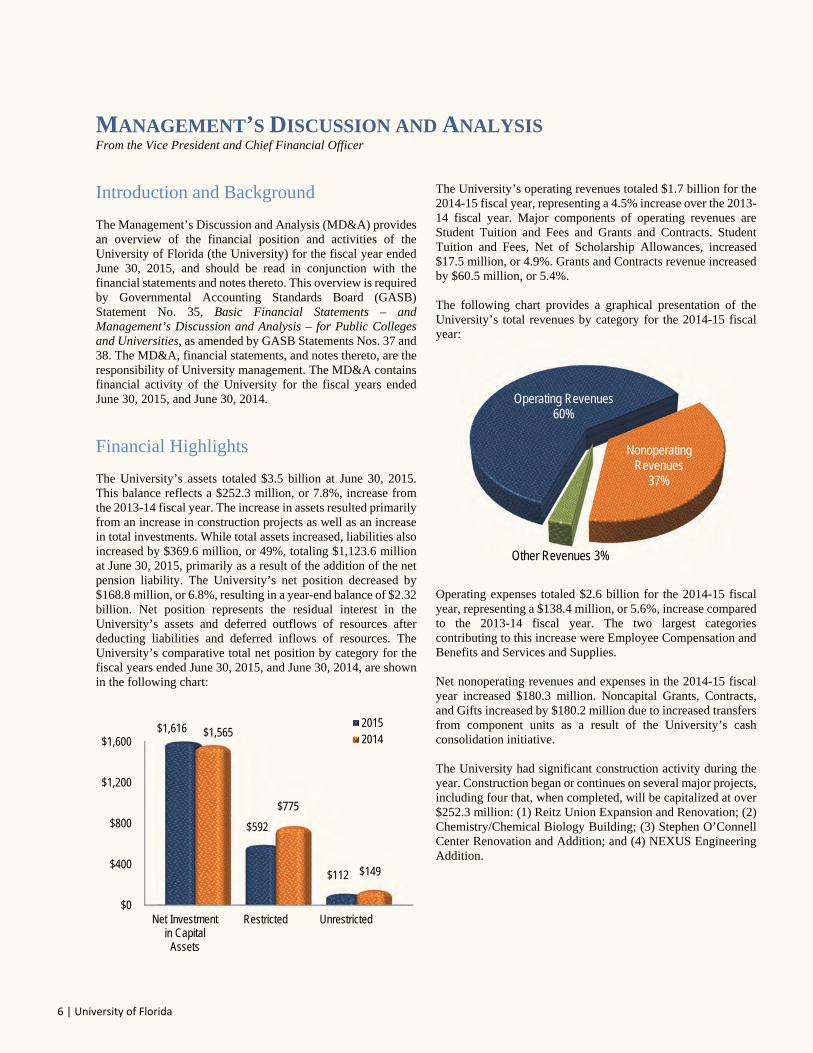
Financial Highlights
The University’s assets totaled $3.5 billion at June 30, 2015. This balance reflects a $252.3 million, or 7.8%, increase from the 2013-14 fiscal year. The increase in assets resulted primarily from an increase in construction projects as well as an increase in total investments. While total assets increased, liabilities also increased by $369.6 million, or 49%, totaling $1,123.6 million at June 30, 2015, primarily as a result of the addition of the net pension liability. The University’s net position decreased by $168.8 million, or 6.8%, resulting in a year-end balance of $2.32 billion. Net position represents the residual interest in the University’s assets and deferred outflows of resources after deducting liabilities and deferred inflows of resources. The University’s comparative total net position by category for the fiscal years ended June 30, 2015, and June 30, 2014, are shown in the following chart:
The University’s operating revenues totaled $1.7 billion for the 2014-15 fiscal year, representing a 4.5% increase over the 2013-14 fiscal year. Major components of operating revenues are Student Tuition and Fees and Grants and Contracts. Student Tuition and Fees, Net of Scholarship Allowances, increased $17.5 million, or 4.9%. Grants and Contracts revenue increased by $60.5 million, or 5.4%.
The following chart provides a graphical presentation of the University’s total revenues by category for the 2014-15 fiscal year:
Operating expenses totaled $2.6 billion for the 2014-15 fiscal year, representing a $138.4 million, or 5.6%, increase compared to the 2013-14 fiscal year. The two largest categories contributing to this increase were Employee Compensation and Benefits and Services and Supplies.
Net nonoperating revenues and expenses in the 2014-15 fiscal year increased $180.3 million. Noncapital Grants, Contracts, and Gifts increased by $180.2 million due to increased transfers from component units as a result of the University’s cash consolidation initiative.
The University had significant construction activity during the year. Construction began or continues on several major projects, including four that, when completed, will be capitalized at over $252.3 million: (1) Reitz Union Expansion and Renovation; (2) Chemistry/Chemical Biology Building; (3) Stephen O’Connell Center Renovation and Addition; and (4) NEXUS Engineering Addition.
$0
$400
$800
$1,200
$1,600
Net Investmentin Capital
Assets
Restricted Unrestricted
$1,616
$592
$112
$1,565
$775
$149
20152014
Operating Revenues60%
Nonoperating Revenues
37%
Other Revenues 3%
2014‐2015 Annual Financial Report
A Component Unit of the State of Florida | 7
Overview of Financial Statements
Pursuant to GASB Statement No. 35, the University’s financial report includes three basic financial statements: the Statement of Net Position; the Statement of Revenues, Expenses, and Changes in Net Position; and the Statement of Cash Flows. The financial statements and notes thereto encompass the University and its component units.
The Statement of Net Position reflects the assets, deferred outflows of resources, liabilities, and deferred inflows of resources of the University, using the accrual basis of accounting, and presents the financial position of the University at a specified time. Net position, the difference between total assets and deferred outflows of resources and total liabilities and deferred inflows of resources, is one indicator of the University’s current financial condition. The changes in net position that occur over time indicate improvement or deterioration in the University’s financial condition.
The Statement of Revenues, Expenses, and Changes in Net Position presents the University’s revenue and expense activity, categorized as operating and nonoperating. Revenues and expenses are recognized when earned or incurred, regardless of when cash is received or paid. GASB Statement No. 35 categorizes revenues and expenses as either operating or nonoperating. Operating revenues generally result from exchange transactions where each of the parties to the transaction either gives or receives something of equal or similar value.
The majority of the University’s expenses are operating expenses as defined by GASB Statement No. 35. GASB gives financial reporting entities the choice of reporting operating expenses in the functional or the natural classifications. The University has chosen to report the expenses in their natural classifications on the Statement of Revenues, Expenses, and Changes in Net Position and has displayed the functional classifications below and in the notes to the financial statements.
Certain revenue sources that the University relies on to provide funding for operations, including Noncapital State Appropriations, certain gifts and grants, and investment income, are defined by GASB as nonoperating. Nonoperating expenses include capital financing costs, other costs related to capital assets, and transfers to component units.
Other Revenues, Expenses, Gains or Losses is composed of Capital State Appropriations and Capital Grants, Contracts, and Donations.
The Statement of Cash Flows provides information about the University’s financial results by reporting the major sources and uses of Cash and Cash Equivalents. This statement assists in evaluating the University’s ability to generate net cash flows, its ability to meet its financial obligations as they come due, and its need for external financing. Cash flows from operating activities reflect the net cash used by the operating activities of the University. Cash flows from capital and related financing activities include activities of the capital funds and related long-term debt. Cash flows from investing activities reflect the net source and use of cash related to the purchases and sales of investments and income earned on those investments. Cash flows from noncapital financing activities include those activities not covered in the other sections.
The University’s basic financial statements include discretely presented component units categorized as follows:
Direct-Support Organizations – These are separate, not-for-profit corporations organized and operated exclusively to assist the University in achieving excellence by providing supplemental resources from private gifts, bequests, and valuable education support services.
Health Science Center Affiliates – These are the several corporations closely affiliated with the University of Florida J. Hillis Miller Health Science Center, including the Faculty Practice Plans.
Shands Hospital and Others – This includes Shands Teaching Hospital and Clinics, Inc., a not-for-profit corporation that is contractually obligated to manage, operate, maintain, and insure the hospital facilities in support of the programs of the Health Science Center at the University of Florida.
The University of Florida Self-Insurance Program and the University of Florida Healthcare Education Insurance Company are included in this category. In prior years, both of these organizations were blended with the University but are now reported as discretely presented component units.
MD&A
8 | University of Florida
Statement of Net Position
The following table summarizes the University’s assets, deferred outflows of resources, liabilities, deferred inflows of resources, and net position at June 30:
Condensed Statement of Net Position (in millions)
2015 2014Assets:Current Assets 1,425.7$ 1,338.5$ Capital Assets, Net 1,796.2 1,714.7 Other Noncurrent Assets 273.2 189.6 Total Assets 3,495.1 3,242.8
Deferred Outflows of Resources 108.8 -
Total Assets and DeferredOutflows of Resources 3,603.9 3,242.8
Liabilities:Current Liabilities 376.9 214.9 Noncurrent Liabilities 746.7 539.1 Total Liabilities 1,123.6 754.0
Deferred Inflows of Resources 160.3 -
Total Liabilities and DeferredInflows of Resources 1,283.9 754.0
Net Position:Net Investment in Capital Assets 1,616.0 1,565.3 Restricted 591.9 774.9 Unrestricted 112.1 148.6
Total Net Position 2,320.0$ 2,488.8$
The increase in assets resulted primarily from an increase in construction in progress as well as total investments, which increased by $94.8 million and $168.8 million, respectively. Investments grew as a result of the University’s cash consolidation initiative. As part of this initiative, the University of Florida Foundation, Inc., transferred the ownership of approximately $165.0 million in non-endowed funds to the University during the 2014-15 fiscal year. In addition, the University started to invest additional funds from various component units during the 2014-15 fiscal year. The increase in current liabilities primarily relates to instances whereby the ownership of the funds was not transferred to the University. The University reports this liability as Due to Component Units.
The large increase in noncurrent liabilities is primarily due to the addition of the $219.9 million net pension liability following the adoption of GASB Statement No. 68, Accounting and Financial Reporting for Pensions, which requires employers participating in cost-sharing multiple-employer defined benefit pension plans to report the employers’ proportionate share of the net pension liabilities of the defined benefit pension plans.
The reported deferred outflows of resources and deferred inflows of resources are a result of the University’s implementation of GASB Statement No. 68.
Statement of Revenues, Expenses, and Changes in Net Position
The following table summarizes the University’s activity for the 2014-15 and 2013-14 fiscal years:
2014-15 2013-14
Operating Revenues $ 1,735.3 $ 1,659.9 Operating Expenses (2,594.3) (2,455.9)
Operating Loss (859.0) (796.0)
Net Nonoperating Revenues 1,034.8 854.5
Income Before Other Revenues,Expenses, Gains, or Losses 175.8 58.5
Other Revenues, Expenses,Gains, or Losses 86.2 61.3
Increase in Net Position 262.0 119.8
Net Position, Beginning of Year 2,488.8 2,369.0
Adjustments to Beginning Net Position (430.8) -
Net Position, Beginning of Year,
as Restated 2,058.0 2,369.0
Net Position, End of Year $ 2,320.0 $ 2,488.8
Condensed Statement of Revenues, Expenses, and Changes in Net Position (in millions)
The University’s Net Position decreased by $168.8 million, primarily due to the addition of the net pension liability. Beginning Net Position was adjusted due to the implementation of GASB Statement No. 68 and the change in reporting of the University of Florida Self-Insurance Program and the University of Florida Healthcare Education Insurance Company. These entities were included within the University reporting entity as blended component units in prior fiscal years but were reported as discretely presented component units for the 2014-15 fiscal year.
2014‐2015 Annual Financial Report
A Component Unit of the State of Florida | 9
Operating Revenues
The following table summarizes the operating revenues by source that were used to fund operating activities during the 2014-15 and 2013-14 fiscal years:
Operating Revenues (in millions)
2014-15 2013-14
Grants and Contracts $ 1,176.2 $ 1,115.7 Student Tuition and Fees, Net of Scholarship Allowances 376.2 358.7 Sales and Services of Auxiliary Enterprises 126.1 129.9 Sales and Services of
Educational Departments 52.1 52.0 Other 4.7 3.6
Total Operating Revenues $ 1,735.3 $ 1,659.9
Increases in operating revenues during the 2014-15 fiscal year resulted primarily from increases in awards of Federal Grants and Contracts and Nongovernmental Grants and Contracts, which increased by $20.6 million and $39.9 million, respectively.
Operating Expenses
The following table summarizes the operating expenses for each method of classification for the 2014-15 and 2013-14 fiscal years:
Operating Expenses (in millions)
Natural Classifications 2014-15 2013-14
Employee Compensation and Benefits 1,811.8$ 1,724.9$ Services and Supplies 496.4 472.5 Depreciation 134.5 123.1 Scholarships, Fellowships and Waivers * 83.9 78.4 Utilities and Communications 67.7 62.8 Self-Insured Claims and Expenses - (5.8)
Total Operating Expenses 2,594.3$ 2,455.9$
Functional Classifications 2014-15 2013-14
Instruction 716.3$ 686.8$ Research 606.1 584.7 Public Service 475.7 432.1 Academic Support 176.2 167.2 Institutional Support 164.4 162.3 Depreciation 134.5 123.1 Auxiliary Operations 118.6 112.3 Operation and Maintenance of Plant 104.6 94.9 Scholarships, Fellowships and Waivers * 61.5 56.7 Student Services 36.4 35.8
Total Operating Expenses 2,594.3$ 2,455.9$
* Net of Scholarship Allowances of $146.2 million in the 2014-15 fiscal yearand $149.8 million in the 2013-14 fiscal year.
Operating expenses increased primarily due to an $86.9 million increase in Employee Compensation and Benefits related to an increase in Other Postemployment Benefits Payable and pay raises.
Nonoperating Revenues and Expenses
The following table summarizes the University’s nonoperating revenues and expenses for the 2014-15 and 2013-14 fiscal years:
Nonoperating Revenues (Expenses) (in millions)
2014-15 2013-14
Noncapital State Appropriations $ 643.6 $ 605.9 Federal and State Student Financial Aid 115.8 117.0 Noncapital Grants, Contracts, and Gifts 262.2 82.0 Investment Income, Net of Expenses 30.5 33.9 Increase (Decrease) in
Fair Market Value of Investments (1.1) 32.5 Loss on Disposal of Capital Assets (2.4) (2.7)Interest on Capital Asset-Related Debt (8.6) (8.0)Other Net Nonoperating Expenses (5.2) (6.1)
Net Nonoperating Revenues $ 1,034.8 $ 854.5
The increase in Net Nonoperating Revenues of $180.3 million resulted primarily from increases in Noncapital State Appropriations and Noncapital Grants, Contracts, and Gifts, which are partially offset by a decrease in the fair market value of investments.
Other Revenues, Expenses, Gains, or Losses
The following table summarizes the University’s other revenues, expenses, gains, or losses for the 2014-15 and 2013-14 fiscal years:
Other Revenues, Expenses, Gains, or Losses (in millions)
2014-15 2013-14
Capital State Appropriations 54.2$ 43.6$ Capital Grants, Contracts, and Donations 32.0 17.7
Total Other Revenues, Expenses, Gains, or Losses 86.2$ 61.3$
MD&A
10 | University of Florida
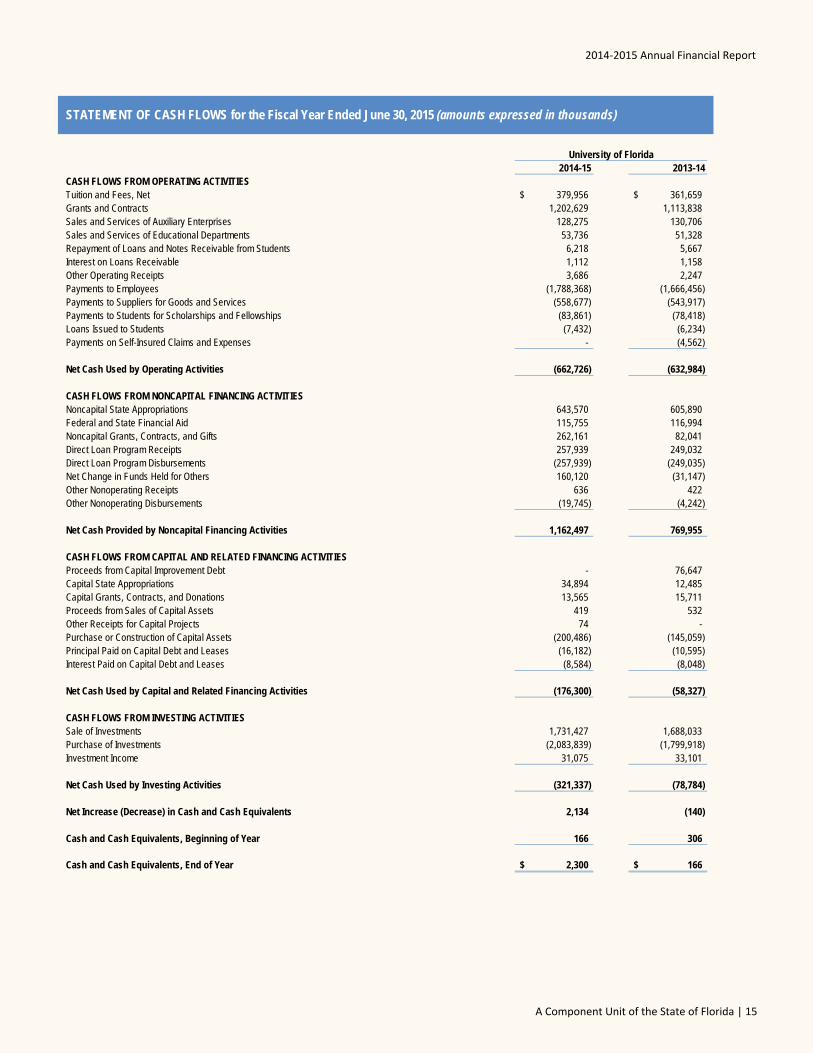
Statement of Cash Flows
The following table summarizes cash flows for the 2014-15 and 2013-14 fiscal years:
Condensed Statement of Cash Flows (in millions)
2014-15 2013-14Cash Provided (Used) by:Operating Activities (662.7)$ (633.0)$ Noncapital Financing Activities 1,162.4 770.0 Capital and Related Financing Activities (176.3) (58.3) Investing Activities (321.3) (78.8)
Net Increase (Decrease) in Cash and Cash Equivalents 2.1 (0.1)
Cash and Cash Equivalents, Beginning of Year 0.2 0.3
Cash and Cash Equivalents, End of Year 2.3$ 0.2$
Major sources of funds came from Grants and Contracts ($1,202.6 million), Noncapital State Appropriations ($643.6 million), Student Tuition and Fees, Net ($380 million), and Sales and Services of Auxiliary Enterprises ($128.3 million). Major uses of funds were for Payments to Employees ($1,788.4 million), Payments to Suppliers for Goods and Services ($558.7 million), and the Purchase or Construction of Capital Assets ($200.5 million).
Capital Assets, Capital Expenses and Commitments, and Debt Administration
CAPITAL ASSETS
At June 30, 2015, the University had approximately $3.7 billion in capital assets, less accumulated depreciation of $1.9 billion, for net capital assets of $1.8 billion. Depreciation charges for the current fiscal year totaled $134.5 million. The following table summarizes the University’s capital assets, net of accumulated depreciation, at June 30:
Total Capital Assets, Net (in millions)
2015 2014
Land 11.9$ 11.3$ Buildings 1,261.1 1,277.0 Infrastructure and Other Improvements 51.1 47.0 Furniture and Equipment 180.8 182.9 Library Resources 51.9 53.9 Property Under Capital Lease and Leashold Improvements 9.8 7.9 Other Capital Assets 4.4 4.3 Construction in Progress 225.2 130.4
Total Capital Assets (Nondepreciableand Depreciable, Net) 1,796.2$ 1,714.7$
Additional information about the University's capital assets is presented in Note 9 to the financial statements.
CAPITAL EXPENSES AND COMMITMENTS
Major capital expenses were incurred on the following ongoing projects for the fiscal year ended June 30, 2015: Reitz Union Expansion and Renovation ($29.6 million); Harrell Medical Education Building ($23.4 million); Cypress Hall – Single Student Housing ($12.7 million) and Chemistry/Chemical Biology Building ($11.0 million).
The University’s construction commitments at June 30, 2015, are as follows:
Major Capital Commitments (in millions)
Amount
Total Commitments 596.5$ Completed to Date 225.2
Balance Committed 371.3$
Additional information about the University's capital commitments is presentedin Note 16 to the financial statements.
2014‐2015 Annual Financial Report
A Component Unit of the State of Florida | 11
DEBT ADMINISTRATION
At June 30, 2015, the University had $184.3 million in outstanding Capital Asset-Related Debt, representing a decrease of $15.1 million, or 7.6%, from the prior fiscal year. The following table summarizes the outstanding capital asset-related debt by type of debt at June 30:
Capital Asset-Related Debt (in millions)
2015 2014
Capital Improvement Debt 167.2$ 181.6$ Loans and Notes 11.2 11.5 Installment Purchase Agreements 3.1 3.4 Capital Leases 2.8 2.9
Total Capital Asset-Related Debt 184.3$ 199.4$
Additional information about the University's capital asset-related debt ispresented in Note 13 to the financial statements.
Economic Factors That Will Affect the Future
The University’s economic condition is closely tied to that of the State of Florida. The Florida Economic Estimating Conference held on July 17, 2015, revealed the State’s economy is growing at a slow to moderate pace. The forecast suggests overall stability for the Florida economy, with modest, yet uneven growth in all of the key economic indicators – personal income, employment, housing starts, light vehicle registrations and tourism. With job growth and increased reasons for optimism in the labor market, the State’s unemployment rate continues to improve. The forecast expects the downward trend
to continue towards a long-term rate of unemployment around 4.9%. Housing starts, light vehicle registrations and tourism are all on an upward growth trend and the forecast expects this trend to continue.
The modest economic conditions are reflected in the University’s $30.4 million increase in State Appropriations for the coming fiscal year. The State budget for the 2015-2016 fiscal year includes, for the University, $39.8 million in performance funding allocation and a reduction of $7.1 million in other non-recurring items. An additional $5 million was added to the preeminence initiative enabling the University to add new faculty.
Major Capital State Appropriations include $13 million for the Nuclear Science Building renovations and a new boiler installation.
The 2015-2016 fiscal year budget reflects the sustained commitment of the Legislature and the Governor to support the University of Florida in its quest to become one of the nation’s top ten public research universities.
Requests for Information
Questions concerning information provided in the MD&A or other required supplementary information, and financial statements and notes thereto, or requests for additional financial information should be addressed to Alan M. West, Assistant Vice President and University Controller, P.O. Box 113200, Gainesville, Florida 32611.
Basic Financial Statements
12 | University of Florida
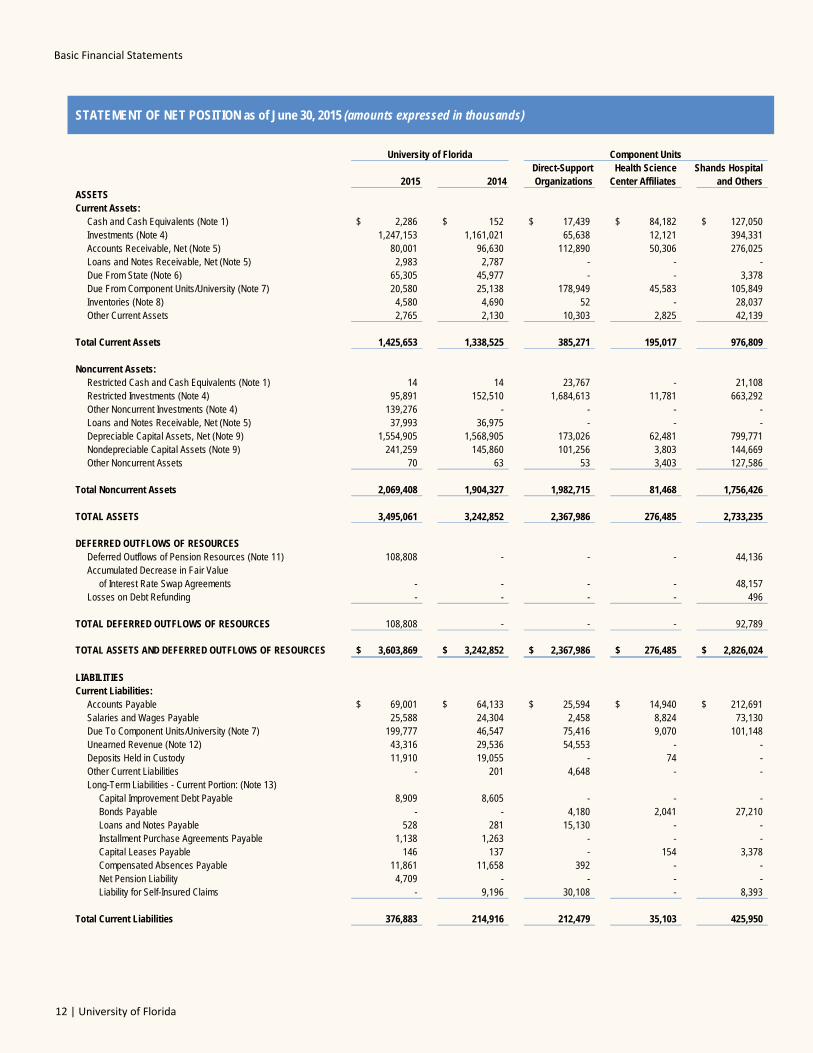
STATEMENT OF NET POSITION as of June 30, 2015 (amounts expressed in thousands)
University of FloridaDirect-Support Health Science Shands Hospital
2015 2014 Organizations Center Affiliates and OthersASSETSCurrent Assets:
Cash and Cash Equivalents (Note 1) 2,286$ 152$ 17,439$ 84,182$ 127,050$ Investments (Note 4) 1,247,153 1,161,021 65,638 12,121 394,331 Accounts Receivable, Net (Note 5) 80,001 96,630 112,890 50,306 276,025 Loans and Notes Receivable, Net (Note 5) 2,983 2,787 - - - Due From State (Note 6) 65,305 45,977 - - 3,378 Due From Component Units/University (Note 7) 20,580 25,138 178,949 45,583 105,849 Inventories (Note 8) 4,580 4,690 52 - 28,037 Other Current Assets 2,765 2,130 10,303 2,825 42,139
Total Current Assets 1,425,653 1,338,525 385,271 195,017 976,809
Noncurrent Assets:Restricted Cash and Cash Equivalents (Note 1) 14 14 23,767 - 21,108 Restricted Investments (Note 4) 95,891 152,510 1,684,613 11,781 663,292 Other Noncurrent Investments (Note 4) 139,276 - - - - Loans and Notes Receivable, Net (Note 5) 37,993 36,975 - - - Depreciable Capital Assets, Net (Note 9) 1,554,905 1,568,905 173,026 62,481 799,771 Nondepreciable Capital Assets (Note 9) 241,259 145,860 101,256 3,803 144,669 Other Noncurrent Assets 70 63 53 3,403 127,586
Total Noncurrent Assets 2,069,408 1,904,327 1,982,715 81,468 1,756,426
TOTAL ASSETS 3,495,061 3,242,852 2,367,986 276,485 2,733,235
DEFERRED OUTFLOWS OF RESOURCESDeferred Outflows of Pension Resources (Note 11) 108,808 - - - 44,136 Accumulated Decrease in Fair Value
of Interest Rate Swap Agreements - - - - 48,157 Losses on Debt Refunding - - - - 496
TOTAL DEFERRED OUTFLOWS OF RESOURCES 108,808 - - - 92,789
TOTAL ASSETS AND DEFERRED OUTFLOWS OF RESOURCES 3,603,869$ 3,242,852$ 2,367,986$ 276,485$ 2,826,024$
LIABILITIESCurrent Liabilities:
Accounts Payable 69,001$ 64,133$ 25,594$ 14,940$ 212,691$ Salaries and Wages Payable 25,588 24,304 2,458 8,824 73,130 Due To Component Units/University (Note 7) 199,777 46,547 75,416 9,070 101,148 Unearned Revenue (Note 12) 43,316 29,536 54,553 - - Deposits Held in Custody 11,910 19,055 - 74 - Other Current Liabilities - 201 4,648 - - Long-Term Liabilities - Current Portion: (Note 13)
Capital Improvement Debt Payable 8,909 8,605 - - - Bonds Payable - - 4,180 2,041 27,210 Loans and Notes Payable 528 281 15,130 - - Installment Purchase Agreements Payable 1,138 1,263 - - - Capital Leases Payable 146 137 - 154 3,378 Compensated Absences Payable 11,861 11,658 392 - - Net Pension Liability 4,709 - - - - Liability for Self-Insured Claims - 9,196 30,108 - 8,393
Total Current Liabilities 376,883 214,916 212,479 35,103 425,950
Component Units
2014‐2015 Annual Financial Report
A Component Unit of the State of Florida | 13
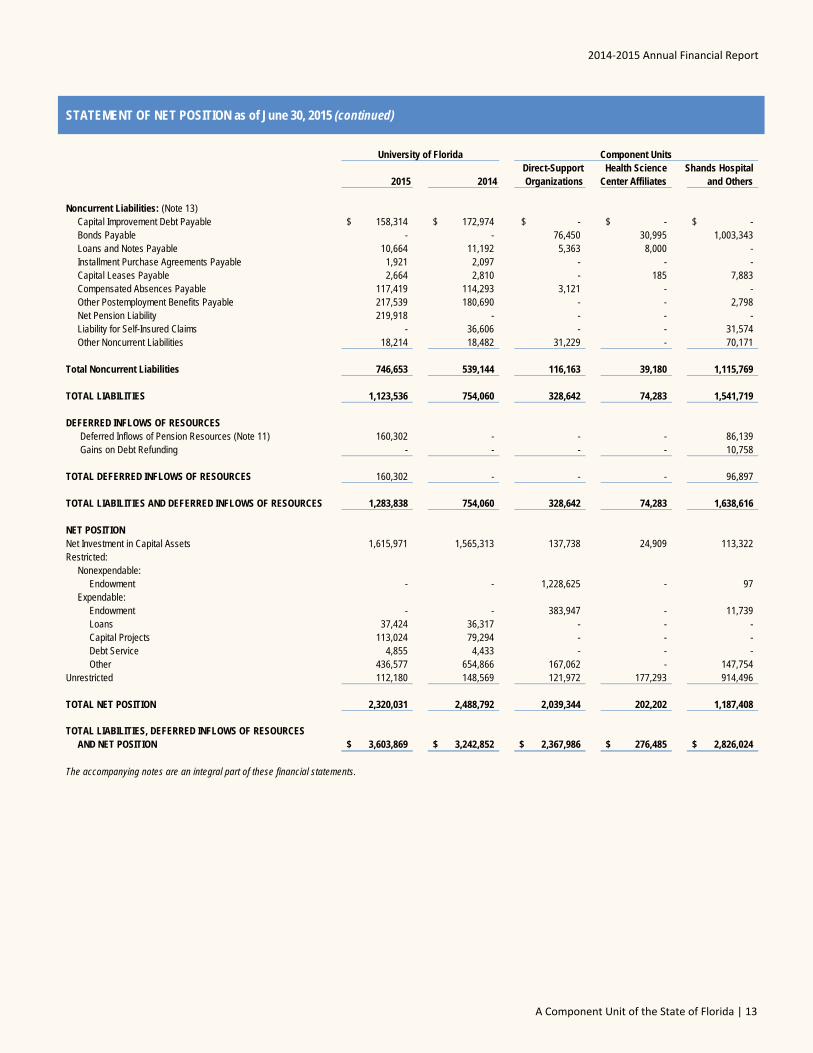
STATEMENT OF NET POSITION as of June 30, 2015 (continued)
University of FloridaDirect-Support Health Science Shands Hospital
2015 2014 Organizations Center Affiliates and Others
Noncurrent Liabilities: (Note 13)Capital Improvement Debt Payable 158,314$ 172,974$ -$ -$ -$ Bonds Payable - - 76,450 30,995 1,003,343 Loans and Notes Payable 10,664 11,192 5,363 8,000 - Installment Purchase Agreements Payable 1,921 2,097 - - - Capital Leases Payable 2,664 2,810 - 185 7,883 Compensated Absences Payable 117,419 114,293 3,121 - - Other Postemployment Benefits Payable 217,539 180,690 - - 2,798 Net Pension Liability 219,918 - - - - Liability for Self-Insured Claims - 36,606 - - 31,574 Other Noncurrent Liabilities 18,214 18,482 31,229 - 70,171
Total Noncurrent Liabilities 746,653 539,144 116,163 39,180 1,115,769
TOTAL LIABILITIES 1,123,536 754,060 328,642 74,283 1,541,719
DEFERRED INFLOWS OF RESOURCES Deferred Inflows of Pension Resources (Note 11) 160,302 - - - 86,139 Gains on Debt Refunding - - - - 10,758
TOTAL DEFERRED INFLOWS OF RESOURCES 160,302 - - - 96,897
TOTAL LIABILITIES AND DEFERRED INFLOWS OF RESOURCES 1,283,838 754,060 328,642 74,283 1,638,616
NET POSITIONNet Investment in Capital Assets 1,615,971 1,565,313 137,738 24,909 113,322 Restricted:
Nonexpendable:Endowment - - 1,228,625 - 97
Expendable:Endowment - - 383,947 - 11,739 Loans 37,424 36,317 - - - Capital Projects 113,024 79,294 - - - Debt Service 4,855 4,433 - - - Other 436,577 654,866 167,062 - 147,754
Unrestricted 112,180 148,569 121,972 177,293 914,496
TOTAL NET POSITION 2,320,031 2,488,792 2,039,344 202,202 1,187,408
TOTAL LIABILITIES, DEFERRED INFLOWS OF RESOURCESAND NET POSITION 3,603,869$ 3,242,852$ 2,367,986$ 276,485$ 2,826,024$
Component Units
The accompanying notes are an integral part of these financial statements.
Basic Financial Statements
14 | University of Florida
University of FloridaDirect-Support Health Science Shands Hospital
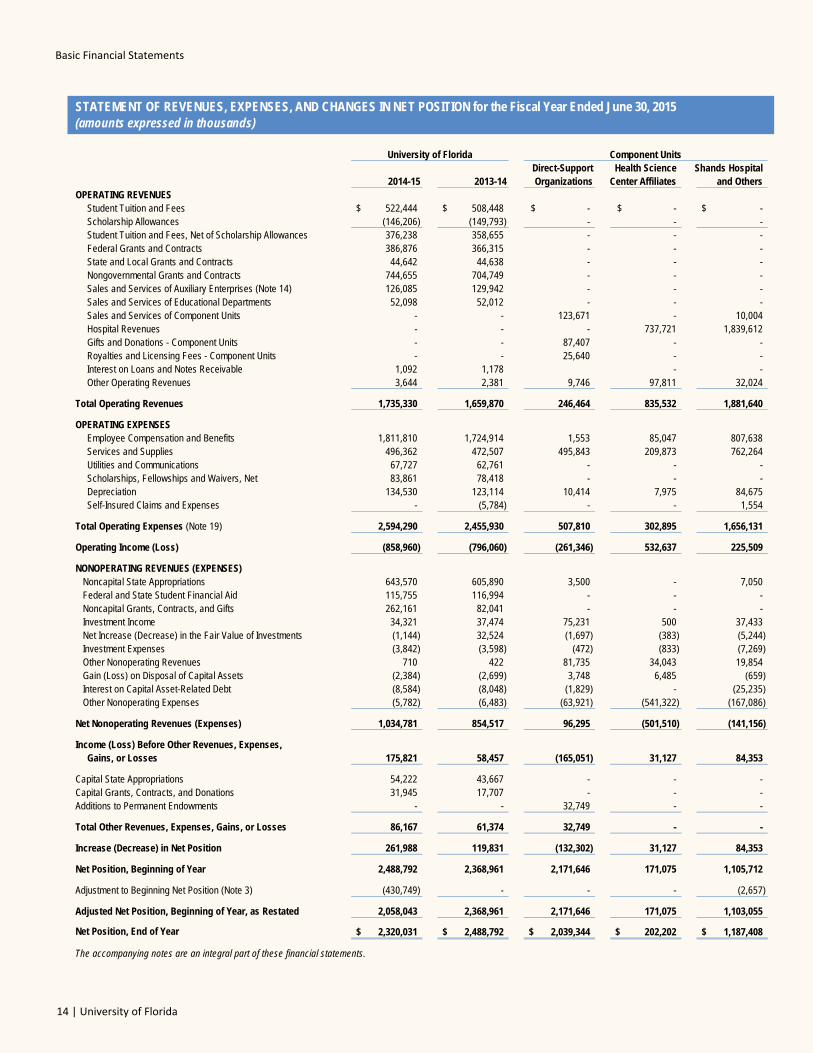
2014-15 2013-14 Organizations Center Affiliates and OthersOPERATING REVENUES
Student Tuition and Fees 522,444$ 508,448$ -$ -$ -$ Scholarship Allowances (146,206) (149,793) - - - Student Tuition and Fees, Net of Scholarship Allowances 376,238 358,655 - - - Federal Grants and Contracts 386,876 366,315 - - - State and Local Grants and Contracts 44,642 44,638 - - - Nongovernmental Grants and Contracts 744,655 704,749 - - - Sales and Services of Auxiliary Enterprises (Note 14) 126,085 129,942 - - - Sales and Services of Educational Departments 52,098 52,012 - - - Sales and Services of Component Units - - 123,671 - 10,004 Hospital Revenues - - - 737,721 1,839,612 Gifts and Donations - Component Units - - 87,407 - - Royalties and Licensing Fees - Component Units - - 25,640 - - Interest on Loans and Notes Receivable 1,092 1,178 - - Other Operating Revenues 3,644 2,381 9,746 97,811 32,024
Total Operating Revenues 1,735,330 1,659,870 246,464 835,532 1,881,640
OPERATING EXPENSESEmployee Compensation and Benefits 1,811,810 1,724,914 1,553 85,047 807,638 Services and Supplies 496,362 472,507 495,843 209,873 762,264 Utilities and Communications 67,727 62,761 - - - Scholarships, Fellowships and Waivers, Net 83,861 78,418 - - - Depreciation 134,530 123,114 10,414 7,975 84,675 Self-Insured Claims and Expenses - (5,784) - - 1,554
Total Operating Expenses (Note 19) 2,594,290 2,455,930 507,810 302,895 1,656,131
Operating Income (Loss) (858,960) (796,060) (261,346) 532,637 225,509
NONOPERATING REVENUES (EXPENSES) Noncapital State Appropriations 643,570 605,890 3,500 - 7,050 Federal and State Student Financial Aid 115,755 116,994 - - - Noncapital Grants, Contracts, and Gifts 262,161 82,041 - - - Investment Income 34,321 37,474 75,231 500 37,433 Net Increase (Decrease) in the Fair Value of Investments (1,144) 32,524 (1,697) (383) (5,244) Investment Expenses (3,842) (3,598) (472) (833) (7,269) Other Nonoperating Revenues 710 422 81,735 34,043 19,854 Gain (Loss) on Disposal of Capital Assets (2,384) (2,699) 3,748 6,485 (659) Interest on Capital Asset-Related Debt (8,584) (8,048) (1,829) - (25,235) Other Nonoperating Expenses (5,782) (6,483) (63,921) (541,322) (167,086)
Net Nonoperating Revenues (Expenses) 1,034,781 854,517 96,295 (501,510) (141,156)
Income (Loss) Before Other Revenues, Expenses, Gains, or Losses 175,821 58,457 (165,051) 31,127 84,353
Capital State Appropriations 54,222 43,667 - - - Capital Grants, Contracts, and Donations 31,945 17,707 - - - Additions to Permanent Endowments - - 32,749 - -
Total Other Revenues, Expenses, Gains, or Losses 86,167 61,374 32,749 - -
Increase (Decrease) in Net Position 261,988 119,831 (132,302) 31,127 84,353
Net Position, Beginning of Year 2,488,792 2,368,961 2,171,646 171,075 1,105,712
Adjustment to Beginning Net Position (Note 3) (430,749) - - - (2,657)
Adjusted Net Position, Beginning of Year, as Restated 2,058,043 2,368,961 2,171,646 171,075 1,103,055
Net Position, End of Year 2,320,031$ 2,488,792$ 2,039,344$ 202,202$ 1,187,408$
The accompanying notes are an integral part of these financial statements.
Component Units
STATEMENT OF REVENUES, EXPENSES, AND CHANGES IN NET POSITION for the Fiscal Year Ended June 30, 2015(amounts expressed in thousands)
2014‐2015 Annual Financial Report
A Component Unit of the State of Florida | 15
2014-15 2013-14CASH FLOWS FROM OPERATING ACTIVITIESTuition and Fees, Net 379,956$ 361,659$ Grants and Contracts 1,202,629 1,113,838 Sales and Services of Auxiliary Enterprises 128,275 130,706 Sales and Services of Educational Departments 53,736 51,328 Repayment of Loans and Notes Receivable from Students 6,218 5,667 Interest on Loans Receivable 1,112 1,158 Other Operating Receipts 3,686 2,247 Payments to Employees (1,788,368) (1,666,456) Payments to Suppliers for Goods and Services (558,677) (543,917) Payments to Students for Scholarships and Fellowships (83,861) (78,418) Loans Issued to Students (7,432) (6,234) Payments on Self-Insured Claims and Expenses - (4,562)
Net Cash Used by Operating Activities (662,726) (632,984)
CASH FLOWS FROM NONCAPITAL FINANCING ACTIVITIESNoncapital State Appropriations 643,570 605,890 Federal and State Financial Aid 115,755 116,994 Noncapital Grants, Contracts, and Gifts 262,161 82,041 Direct Loan Program Receipts 257,939 249,032 Direct Loan Program Disbursements (257,939) (249,035) Net Change in Funds Held for Others 160,120 (31,147) Other Nonoperating Receipts 636 422 Other Nonoperating Disbursements (19,745) (4,242)
Net Cash Provided by Noncapital Financing Activities 1,162,497 769,955
CASH FLOWS FROM CAPITAL AND RELATED FINANCING ACTIVITIESProceeds from Capital Improvement Debt - 76,647 Capital State Appropriations 34,894 12,485 Capital Grants, Contracts, and Donations 13,565 15,711 Proceeds from Sales of Capital Assets 419 532 Other Receipts for Capital Projects 74 - Purchase or Construction of Capital Assets (200,486) (145,059) Principal Paid on Capital Debt and Leases (16,182) (10,595) Interest Paid on Capital Debt and Leases (8,584) (8,048)
Net Cash Used by Capital and Related Financing Activities (176,300) (58,327)
CASH FLOWS FROM INVESTING ACTIVITIESSale of Investments 1,731,427 1,688,033 Purchase of Investments (2,083,839) (1,799,918) Investment Income 31,075 33,101
Net Cash Used by Investing Activities (321,337) (78,784)
Net Increase (Decrease) in Cash and Cash Equivalents 2,134 (140)
Cash and Cash Equivalents, Beginning of Year 166 306
Cash and Cash Equivalents, End of Year 2,300$ 166$
STATEMENT OF CASH FLOWS for the Fiscal Year Ended June 30, 2015 (amounts expressed in thousands)
University of Florida
Basic Financial Statements
16 | University of Florida
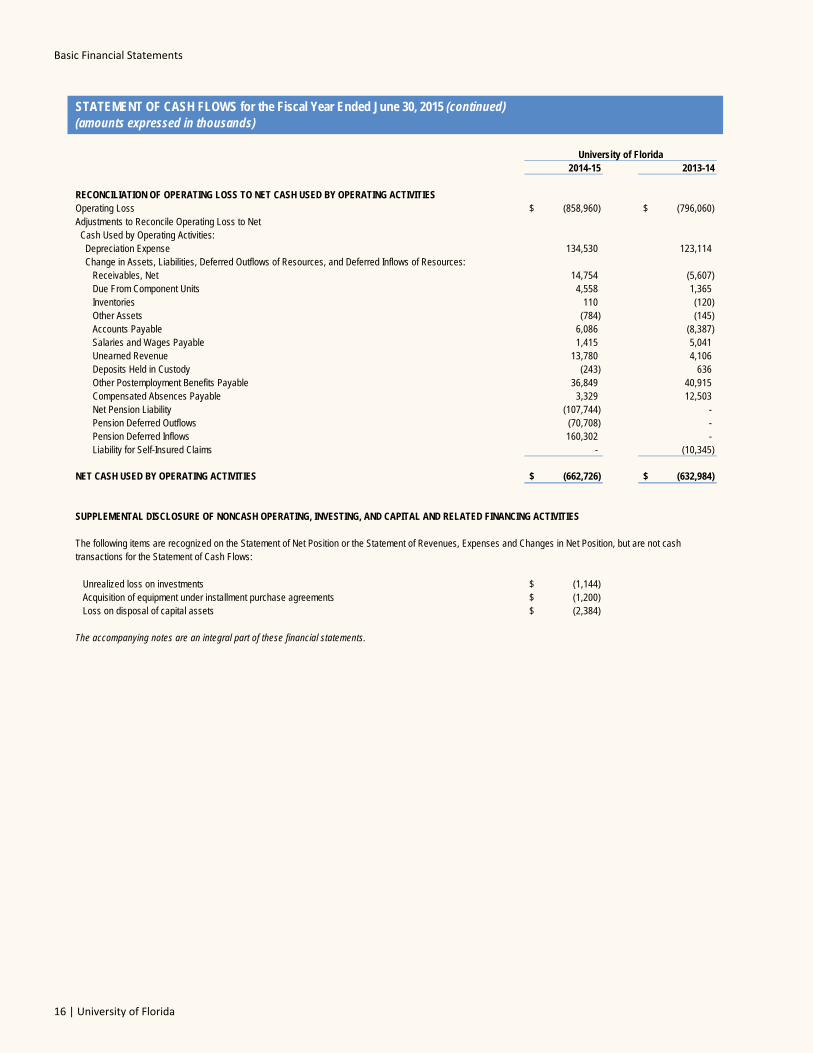
2014-15 2013-14
RECONCILIATION OF OPERATING LOSS TO NET CASH USED BY OPERATING ACTIVITIESOperating Loss (858,960)$ (796,060)$ Adjustments to Reconcile Operating Loss to Net Cash Used by Operating Activities: Depreciation Expense 134,530 123,114 Change in Assets, Liabilities, Deferred Outflows of Resources, and Deferred Inflows of Resources:
Receivables, Net 14,754 (5,607) Due From Component Units 4,558 1,365 Inventories 110 (120) Other Assets (784) (145) Accounts Payable 6,086 (8,387) Salaries and Wages Payable 1,415 5,041 Unearned Revenue 13,780 4,106 Deposits Held in Custody (243) 636 Other Postemployment Benefits Payable 36,849 40,915 Compensated Absences Payable 3,329 12,503 Net Pension Liability (107,744) - Pension Deferred Outflows (70,708) - Pension Deferred Inflows 160,302 -
Liability for Self-Insured Claims - (10,345)
NET CASH USED BY OPERATING ACTIVITIES (662,726)$ (632,984)$
Unrealized loss on investments (1,144)$ Acquisition of equipment under installment purchase agreements (1,200)$ Loss on disposal of capital assets (2,384)$
The accompanying notes are an integral part of these financial statements.
STATEMENT OF CASH FLOWS for the Fiscal Year Ended June 30, 2015 (continued)(amounts expressed in thousands)
The following items are recognized on the Statement of Net Position or the Statement of Revenues, Expenses and Changes in Net Position, but are not cash
University of Florida
SUPPLEMENTAL DISCLOSURE OF NONCASH OPERATING, INVESTING, AND CAPITAL AND RELATED FINANCING ACTIVITIES
transactions for the Statement of Cash Flows:
2014‐2015 Annual Financial Report
A Component Unit of the State of Florida | 17
NOTES TO THE FINANCIAL STATEMENTS For the Fiscal Year Ended June 30, 2015
1. SUMMARY OF SIGNIFICANT ACCOUNTINGPOLICIES
The significant accounting policies followed by the University of Florida are described below to enhance the usefulness of the financial statements.
A. REPORTING ENTITY
The University of Florida is a separate public instrumentality that is part of the State university system of public universities, which is under the general direction and control of the Florida Board of Governors. The University is directly governed by a Board of Trustees (Trustees) consisting of thirteen members. The Governor appoints six citizen members and the Board of Governors appoints five citizen members. These members are confirmed by the Florida Senate and serve staggered terms of five years. The chair of the faculty senate and the president of the student body of the University are also members. The Board of Governors establishes the powers and duties of the Trustees.
The Trustees are responsible for setting policies for the University, which provide governance in accordance with State law and Florida Board of Governors Regulations. The Trustees select the University President. The University President serves as the executive officer and the corporate secretary of the Trustees, and is responsible for administering the policies prescribed by the Trustees.
Criteria for defining the reporting entity are identified and described in the Governmental Accounting Standards Board’s (GASB) Codification of Governmental Accounting and Financial Reporting Standards, Sections 2100 and 2600. These criteria were used to evaluate potential component units for which the primary government is financially accountable and other organizations for which the nature and significance of their relationship with the primary government are such that exclusion would cause the primary government’s financial statements to be misleading or incomplete. Based on the application of these criteria, the University of Florida is a component unit of the State of Florida, and its financial balances and activities are discretely presented in the State’s Comprehensive Annual Financial Report.
B. DISCRETELY PRESENTED COMPONENT UNITS
Based on the application of the criteria for determining component units, certain affiliated organizations are required to be included within the University reporting entity as discretely presented component units because of the significance of their relationship with the University. These organizations are legally separate from the University and are governed by separate boards. The University further categorizes its component units as Direct-Support Organizations, Health Science Center Affiliates, and Shands Hospital and Others. An annual audit of each organization’s financial statements is conducted by
independent certified public accountants. The annual reports are submitted to the Auditor General and the University Board of Trustees. Additional information is presented in Note 20.
However, financial activities of certain component units are not included in the University’s financial statements and are denoted below with an asterisk (*). The total assets and operating revenues related to these component units are $47 million and $27 million, respectively. These amounts represent less than one percent of the total aggregate component units’ assets and operating revenues.
C. DIRECT-SUPPORT ORGANIZATIONS
The University’s direct-support organizations, as provided for in Section 1004.28, Florida Statutes, and Board of Governors Regulation 9.011, are considered component units of the University of Florida and therefore the latest audited financial statements of these organizations are discretely presented in the financial statements of the University. These legally separate, not-for-profit corporations are organized and operated exclusively to assist the University to achieve excellence by providing supplemental resources from private gifts and bequests, and valuable education support services. The Statute authorizes these organizations to receive, hold, invest, and administer property and to make expenditures to or for the benefit of the University. These organizations and their purposes are explained as follows:
University of Florida Foundation, Inc., solicits, collects, manages, and directs contributions to the various academic departments and programs of the University, and assists the University in fund raising, public relations, and maintenance of alumni records. Their financial statements include the activities of the University of Florida Alumni Association, Inc.
The University Athletic Association, Inc., conducts various inter-collegiate athletic programs for and on behalf of the University.
University of Florida Research Foundation, Inc., promotes, encourages, and assists research activities of the University through income derived from or related to the development and commercialization of intellectual properties, which include inventions, discoveries, processes, and work products.
GatorCare Health Management Corporation coordinates and facilitates the management of the self-insured health insurance plan of the University and its participating affiliated employers, collecting and paying employer and employee premiums.
Gator Boosters, Inc., solicits funds for the benefit of the University athletic programs.
Notes
18 | University of Florida
University of Florida Development Corporation develops and maintains Innovation Square where the University-owned Florida Innovation Hub is located.
Citrus Research and Development Foundation, Inc., was formed to advance disease and production research and product development activities to ensure the survival and competitiveness of Florida’s citrus growers through innovation.
University of Florida Alumni Association, Inc., supports activities of the alumni of the University of Florida. Its financial transactions are reflected in the financial statements of the University of Florida Foundation, Inc.
Florida Foundation Seed Producers, Inc.,* supplies Florida farmers and producers with crop seed and nursery stock. This organization stocks foundation seed of the best-known varieties acceptable to Florida climate and soils in adequate quantities and at reasonable prices.
The University of Florida Law Center Association, Inc.,* promotes, supports and improves legal education, legal research, the legal profession and the administration of justice; and assists the Levin College of Law in the development and maintenance of a law center.
Florida 4-H Club Foundation, Inc.,* promotes the educational objectives of the 4-H Youth Development Program, an official part of the Florida Cooperative Extension Service.
University of Florida Leadership and Education Foundation, Inc.,* was formed to further agriculture and natural resource education and related activities, promote agriculture and natural resources leadership, and make contributions to and confer benefits upon the University.
University of Florida Investment Corporation* promotes the educational purposes of the University of Florida by providing investment research, advice, counsel, and management to and for the University Board of Trustees and affiliated organizations of the University.
Citrus Research and Education Foundation, Inc.,* expedites citrus production, propagates new plant materials, collects and analyzes environmental impact research data, and provides research and education support to the University of Florida Citrus Research and Education Center at Lake Alfred.
Treasure Coast Agricultural Research Foundation, Inc.,* supports, encourages, and fosters research, education, and extension at the Institute of Food and Agricultural Sciences of the University on issues related to the citrus industry within the Indian River region.
UF Historic St. Augustine, Inc.,* ensures the long-term preservation and interpretation of State-owned historic properties in St. Augustine.
Southwest Florida Research and Education Foundation, Inc.,* provides research and educational support to the
University of Florida Southwest Florida Research and Education Center.
D. HEALTH SCIENCE CENTER AFFILIATES
The corporations listed below, except University of Florida Jacksonville Healthcare, Inc., and Faculty Clinic, Inc., are Faculty Practice Plans, as provided for in Board of Governors Regulation 9.017. The Faculty Practice Plans provide educationally-oriented clinical practice settings and opportunities through which faculty members provide health, medical, veterinary, and dental care to patients as an integral part of their academic activities and their employment as faculty. Because these faculty practice activities generate income, the colleges are authorized to regulate fees generated from faculty practice and maintain Faculty Practice Plans for the orderly collection and distribution of fees. These organizations provide significant support for the clinical instruction function of the University of Florida J. Hillis Miller Health Science Center (JHMHC) and are component units of the University of Florida.
Florida Clinical Practice Association, Inc., bills and collects clinical professional fees to support the educational, research, and service programs of the University of Florida College of Medicine.
University of Florida Jacksonville Physicians, Inc., bills and collects clinical professional fees to support the educational, research, and service programs of the University of Florida College of Medicine – Jacksonville.
Florida Veterinary Medicine Faculty Association, Inc., bills and collects clinical professional fees to support the educational, research, and service programs of the University of Florida College of Veterinary Medicine.
University of Florida Jacksonville Healthcare, Inc., is a not-for-profit health services support organization, as provided for in Board of Governors Regulation 9.011, the purpose of which is to further medical education and operate outpatient clinic facilities, by engaging in strategic alliances and partnerships with non-academic entities, effecting managed care contracting and provider network development for the JHMHC. Its operations are funded by University of Florida Jacksonville Physicians, Inc., and Shands Jacksonville.
Faculty Associates, Inc., bills and collects clinical professional fees to support the educational, research, and service programs of the University of Florida College of Dentistry.
Faculty Clinic, Inc.,* a not-for-profit, tax-exempt corporation operates primarily as a facility management company that leases space to Shands Jacksonville and University of Florida Jacksonville Physicians, Inc.
University of Florida College of Nursing Faculty Practice Association, Inc.,* performs billing and collection of professional fees to support the educational, research and service programs of the University of Florida College of Nursing.
2014‐2015 Annual Financial Report
A Component Unit of the State of Florida | 19
Florida Health Professions Association, Inc.,* performs billing and collection of clinical professional fees to support the educational, research, and service programs of the University of Florida College of Public Health and Health Professions. University of Florida College of Pharmacy Faculty Practice Association, Inc.,* performs billing and collection of fees to support the educational, research, and service programs of the University of Florida College of Pharmacy. E. SHANDS HOSPITAL AND OTHERS Shands Teaching Hospital and Clinics, Inc., (Shands) was incorporated October 15, 1979, as a not-for-profit corporation. Shands, a major tertiary care teaching institution, is a leading referral center in the State of Florida and the southeast United States and facilitates medical education programs at the University. Shands entered into a contractual agreement, as of July 1, 1980, as subsequently restated and amended, with the Florida Board of Education, to provide for the use of hospital facilities at the JHMHC through December 31, 2030, with renewal provisions. The contractual agreement also provides for the transfer to Shands of all other assets and liabilities arising from the operation of the hospital facilities prior to July 1, 1980. At termination of the contractual agreement, the net position of Shands reverts to the State Board of Education. Legal title to all buildings and improvements transferred to Shands remains with the State of Florida during the term of the contractual agreement. The contractual agreement provides for a 12-month grace period for any event of default, other than the bankruptcy of Shands. In addition, the contractual agreement limits the right of the State Board of Education to terminate the contractual agreement solely to the circumstance in which Shands declares bankruptcy and, in such event, requires net revenues derived from the operation of the hospital facilities to continue to be applied to the payment of Shands’ debts. Under the terms of the contractual agreement, Shands is obligated to manage, operate, maintain, and insure the hospital facilities in support of the programs of the JHMHC and further agrees to contract with the State Board of Education for the provision of these programs. By operation of law, the University of Florida Board of Trustees has become the successor-in-interest to the State Board of Education. Shands Jacksonville HealthCare, Inc., (Shands Jacksonville) is a Florida not-for-profit corporation. Shands Jacksonville was organized primarily to provide healthcare and related services to the community including the City of Jacksonville and surrounding counties, and to support the teaching and research missions of the University. University Village Apartments, Inc., (the Corporation) was established in 1969, for the purpose of providing housing for low- and moderate-income families, especially those affiliated with the University of Florida. Capital was contributed at inception by the University of Florida Foundation, Inc., but no capital stock was issued because the Corporation does not operate for the benefit of any special interest. The Corporation
provided housing under Section 221(d)(3) of the National Housing Act. The facility consists of 28 two-story buildings and was regulated by the United States Department of Housing and Urban Development (HUD) as to rent charges and operating methods. The Corporation is no longer regulated by HUD since it has repaid in full its Section 221 insured loan. The Corporation dissolved as of June 17, 2015, and merged into the University Department of Housing and Residence Education. All transactions during the 2014-15 fiscal year are included in the University’s financial statements. University of Florida Self-Insurance Program (the Program) was created by the Florida Board of Regents, succeeded by the Florida Board of Governors, pursuant to Section 1004.24, Florida Statutes. The Program provides comprehensive general liability and professional liability (malpractice) coverage for the University of Florida and affiliated teaching hospitals that are providing education in healthcare or veterinary services. University of Florida Healthcare Education Insurance Company (HEIC), was created on September 1, 1994, as a self-insurance mechanism created pursuant to Section 1004.24, Florida Statutes. HEIC writes coverage for the participants in the Self-Insurance Program (the Program) for loss exposure above the Program’s retention. HEIC obtains excess loss reinsurance coverage from commercial insurance carriers for certain layers of exposure. F. BASIS OF PRESENTATION The University’s accounting policies conform with accounting principles generally accepted in the United States of America applicable to public colleges and universities as prescribed by GASB. The National Association of College and University Business Officers (NACUBO) also provides the University with recommendations prescribed in accordance with generally accepted accounting principles promulgated by GASB and the Financial Accounting Standards Board (FASB). GASB allows public universities various reporting options. The University of Florida has elected to report as an entity engaged in only business-type activities. This election requires the adoption of the accrual basis of accounting and entity-wide reporting including the following components:
• Management’s Discussion and Analysis
• Basic Financial Statements:
1) Statement of Net Position
2) Statement of Revenues, Expenses, and Changes in Net Position
3) Statement of Cash Flows
4) Notes to the Financial Statements
• Other Required Supplementary Information G. BASIS OF ACCOUNTING Basis of accounting refers to when revenues, expenses, and related assets, deferred outflows of resources, liabilities, and deferred inflows of resources are recognized in the accounts and
Notes
20 | University of Florida
reported in the financial statements. Specifically, it relates to the timing of the measurements made, regardless of the measurement focus applied. The University’s financial statements are presented using the economic resources measurement focus and the accrual basis of accounting. Revenues, expenses, gains, losses, assets, deferred outflows of resources, liabilities, and deferred inflows of resources resulting from exchange and exchange-like transactions are recognized when the exchange takes place. Revenues, expenses, gains, losses, assets, deferred outflows of resources, liabilities, and deferred inflows of resources resulting from nonexchange activities are generally recognized when all applicable eligibility requirements, including time requirements, are met. The University follows GASB standards of accounting and financial reporting.
The University’s component units use the economic resources measurement focus and accrual basis of accounting whereby revenues are recognized when earned and expenses are recognized when incurred. Twenty-three component units follow GASB standards of accounting and financial reporting. Eight component units (University of Florida Foundation, Inc., Florida Foundation Seed Producers, Inc., Southwest Florida Research and Education Foundation, Inc., Citrus Research and Education Foundation, Inc., Citrus Research and Development Foundation, Inc., Treasure Coast Agricultural Research Foundation, Inc., University of Florida Alumni Association, Inc., and University of Florida Investment Corporation) follow FASB standards of accounting and financial reporting for not-for-profit organizations.
Significant interdepartmental sales between auxiliary service departments and other institutional departments have been eliminated from revenues and expenses for reporting purposes.
The University’s principal operating activities consist of instruction, research and public service. Operating revenues and expenses generally include all fiscal transactions directly related to these activities as well as administration, operation and maintenance of capital assets, and depreciation on capital assets. Nonoperating revenues include Noncapital State Appropriations, Federal and State student financial aid, investment income and Capital State Appropriations for construction projects. Interest on capital asset-related debt is a nonoperating expense.
The Statement of Net Position is presented in a classified format to distinguish between current and noncurrent assets and liabilities. When both restricted and unrestricted resources are available to fund certain programs, it is the University’s policy to first apply the restricted resources to such programs, followed by the use of the unrestricted resources.
The Statement of Revenues, Expenses, and Changes in Net Position is presented by major sources and is reported net of tuition scholarships, discounts, and allowances. Tuition scholarships, discounts, and allowances are the differences between the stated charge for goods and services provided by the University and the amount that is actually paid by a student or a third party making payment on behalf of the student. The University applied “The Alternate Method” as prescribed in
NACUBO Advisory Report 2000-05 to determine the reported net tuition scholarships, discounts, and allowances. Under this method, the University computes these amounts by allocating the cash payments to students, excluding payments for services, on a ratio of total aid to the aid not considered to be third-party aid.
The Statement of Cash Flows is presented using the direct method in compliance with GASB Statement No. 9, Reporting Cash Flows of Proprietary and Nonexpendable Trust Funds and Governmental Entities That Use Proprietary Fund Accounting.
H. CASH AND CASH EQUIVALENTS
The amount reported by the University as cash and cash equivalents consists of cash on hand and cash in demand accounts. University cash deposits are held in banks qualified as public depositories under Florida law. All such deposits are insured by Federal depository insurance, up to specified limits, or collateralized with securities held in Florida’s multiple financial institution collateral pool required by Chapter 280, Florida Statutes. Cash and cash equivalents that are externally restricted to make debt service payments, maintain sinking or reserve funds, or to purchase or construct capital assets or other restricted assets, are classified as restricted.
I. CAPITAL ASSETS
University capital assets consist of land, construction in progress, buildings, infrastructure and other improvements, furniture and equipment, library resources, property under capital lease and leasehold improvements, works of art and historical treasures, computer software, and other capital assets. These assets are capitalized and recorded at cost at the date of acquisition or at estimated fair value on the date received in the case of gifts and purchases of State surplus property. Additions, improvements, and other outlays that significantly extend the useful life of an asset are capitalized. Other costs incurred for repairs and maintenance are expensed as incurred. The University has a capitalization threshold of $4 million for intangible assets, which includes computer software, $5,000 for tangible personal property, and $250 for library resources. The costs of all new buildings and projects adding new square footage are capitalized. Infrastructure and leasehold improvements have a $250,000 capitalization threshold. For building renovations, the threshold is $250,000 or less if the amount expended is at least 25% of the cost basis of the building. Depreciation is computed on the straight-line basis over the following estimated useful lives:
Buildings – 5 to 50 years, depending on construction Infrastructure and Other Improvements –
10 to 50 years Furniture and Equipment – 3 to 20 years Library Resources – 10 years Property Under Capital Lease and Leasehold
Improvements – 10 to 50 years Computer Software – 5 years
2014‐2015 Annual Financial Report
A Component Unit of the State of Florida | 21
J. NONCURRENT LIABILITIES Noncurrent liabilities include principal amounts of capital improvement debt payable, loans and notes payable, installment purchase agreements payable, capital leases payable, compensated absences payable, other postemployment benefits payable, net pension liabilities, and other noncurrent liabilities that are not scheduled to be paid within the next fiscal year. Capital improvement debt payable is reported net of unamortized premiums or discounts and losses on refunding. The University amortizes debt premiums and discounts over the life of the debt using the straight-line method. Losses on refunding are amortized over the life of the old debt or new debt (whichever is shorter) using the straight-line method. K. PENSIONS For purposes of measuring the net pension liabilities, deferred outflows of resources and deferred inflows of resources related to pensions, and pension expense, information about the fiduciary net position of the Florida Retirement System (FRS) defined benefit plan and the Health Insurance Subsidy (HIS) defined benefit plan and additions to/deductions from the FRS’s and the HIS’s fiduciary net position have been determined on the same basis as they are reported by the FRS and the HIS plans. For this purpose, benefit payments (including refunds of employee contributions) are recognized when due and payable in accordance with benefit terms. Investments are reported at fair value. 2. REPORTING CHANGES The University participates in the Florida Retirement System (FRS) defined benefit pension plan and the Health Insurance Subsidy (HIS) defined benefit plan administered by the Florida Department of Management Services, Division of Retirement. As a participating employer, the University implemented Governmental Accounting Standards Board (GASB) Statement No. 68, Accounting and Financial Reporting for Pensions, which requires employers participating in cost-sharing multiple-employer defined benefit pension plans to report the employers’ proportionate share of the net pension liabilities of the defined benefit pension plans. The requirements of this Statement are being implemented prospectively, with the University reporting its proportionate share of the actuarially determined liabilities of $224,627,083 at the July 1, 2014, date of transition. The impact of the implementation of this Statement is discussed in Notes 3 and 15. In prior fiscal years, the University of Florida Self-Insurance Program and the University of Florida Healthcare Education Insurance Company were included within the University reporting entity as blended component units. However, University management determined during the 2014-15 fiscal year that these entities should be reported as discretely presented component units.
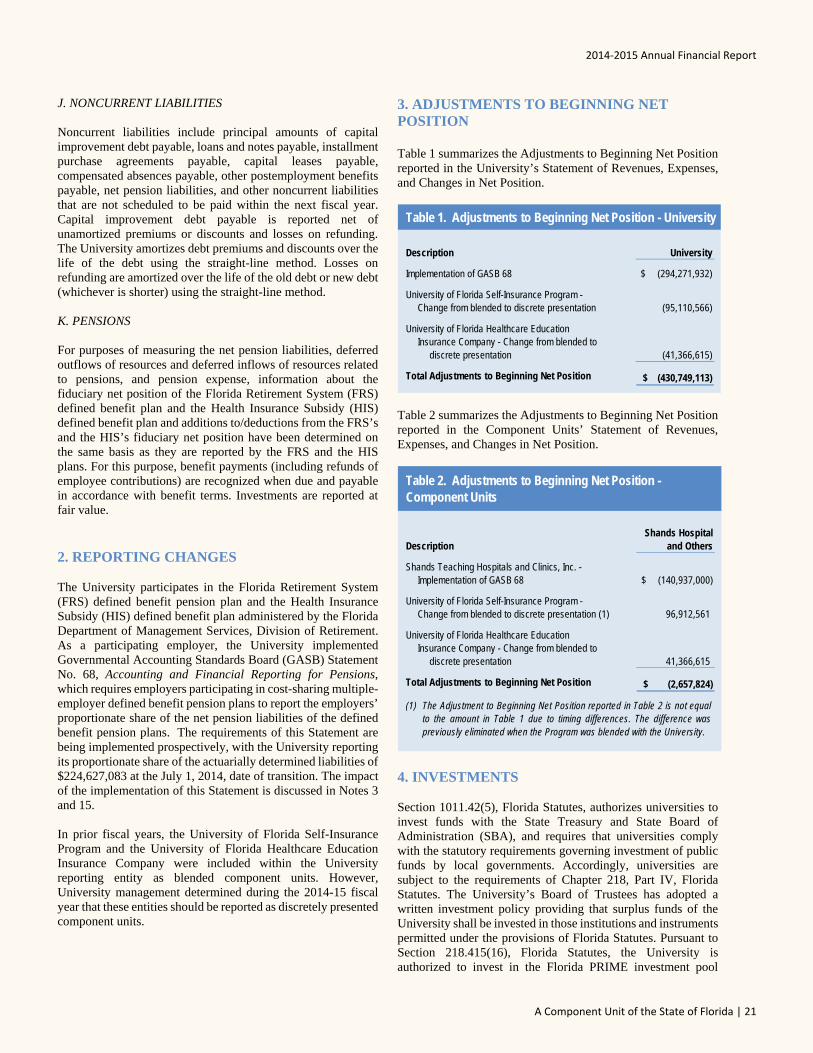
3. ADJUSTMENTS TO BEGINNING NET POSITION Table 1 summarizes the Adjustments to Beginning Net Position reported in the University’s Statement of Revenues, Expenses, and Changes in Net Position.
Table 1. Adjustments to Beginning Net Position - University
Description University
Implementation of GASB 68 (294,271,932)$
University of Florida Self-Insurance Program -Change from blended to discrete presentation (95,110,566)
University of Florida Healthcare EducationInsurance Company - Change from blended to
discrete presentation (41,366,615)
Total Adjustments to Beginning Net Position (430,749,113)$
Table 2 summarizes the Adjustments to Beginning Net Position reported in the Component Units’ Statement of Revenues, Expenses, and Changes in Net Position.
DescriptionShands Hospital
and Others
Shands Teaching Hospitals and Clinics, Inc. - Implementation of GASB 68 (140,937,000)$
University of Florida Self-Insurance Program -Change from blended to discrete presentation (1) 96,912,561
University of Florida Healthcare EducationInsurance Company - Change from blended to
discrete presentation 41,366,615
Total Adjustments to Beginning Net Position (2,657,824)$
(1) The Adjustment to Beginning Net Position reported in Table 2 is not equalto the amount in Table 1 due to timing differences. The difference waspreviously eliminated when the Program was blended with the University.
Table 2. Adjustments to Beginning Net Position - Component Units
4. INVESTMENTS Section 1011.42(5), Florida Statutes, authorizes universities to invest funds with the State Treasury and State Board of Administration (SBA), and requires that universities comply with the statutory requirements governing investment of public funds by local governments. Accordingly, universities are subject to the requirements of Chapter 218, Part IV, Florida Statutes. The University’s Board of Trustees has adopted a written investment policy providing that surplus funds of the University shall be invested in those institutions and instruments permitted under the provisions of Florida Statutes. Pursuant to Section 218.415(16), Florida Statutes, the University is authorized to invest in the Florida PRIME investment pool
Notes
22 | University of Florida
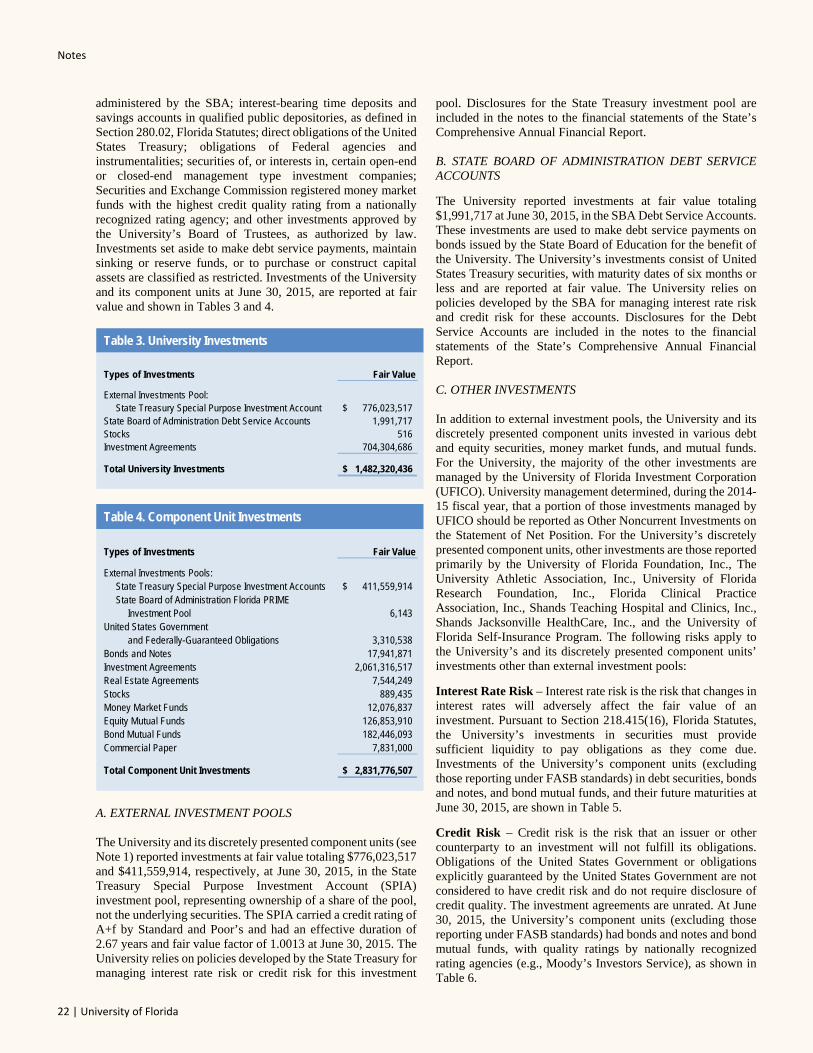
administered by the SBA; interest-bearing time deposits and savings accounts in qualified public depositories, as defined in Section 280.02, Florida Statutes; direct obligations of the United States Treasury; obligations of Federal agencies and instrumentalities; securities of, or interests in, certain open-end or closed-end management type investment companies; Securities and Exchange Commission registered money market funds with the highest credit quality rating from a nationally recognized rating agency; and other investments approved by the University’s Board of Trustees, as authorized by law. Investments set aside to make debt service payments, maintain sinking or reserve funds, or to purchase or construct capital assets are classified as restricted. Investments of the University and its component units at June 30, 2015, are reported at fair value and shown in Tables 3 and 4.
Table 3. University Investments
Types of Investments Fair Value
External Investments Pool:State Treasury Special Purpose Investment Account 776,023,517$
State Board of Administration Debt Service Accounts 1,991,717 Stocks 516 Investment Agreements 704,304,686
Total University Investments 1,482,320,436$
Table 4. Component Unit Investments
Types of Investments Fair Value
External Investments Pools:State Treasury Special Purpose Investment Accounts 411,559,914$ State Board of Administration Florida PRIME
Investment Pool 6,143 United States Government
and Federally-Guaranteed Obligations 3,310,538 Bonds and Notes 17,941,871 Investment Agreements 2,061,316,517 Real Estate Agreements 7,544,249 Stocks 889,435 Money Market Funds 12,076,837 Equity Mutual Funds 126,853,910 Bond Mutual Funds 182,446,093 Commercial Paper 7,831,000
Total Component Unit Investments 2,831,776,507$
A. EXTERNAL INVESTMENT POOLS
The University and its discretely presented component units (see Note 1) reported investments at fair value totaling $776,023,517 and $411,559,914, respectively, at June 30, 2015, in the State Treasury Special Purpose Investment Account (SPIA) investment pool, representing ownership of a share of the pool, not the underlying securities. The SPIA carried a credit rating of A+f by Standard and Poor’s and had an effective duration of 2.67 years and fair value factor of 1.0013 at June 30, 2015. The University relies on policies developed by the State Treasury for managing interest rate risk or credit risk for this investment
pool. Disclosures for the State Treasury investment pool are included in the notes to the financial statements of the State’s Comprehensive Annual Financial Report.
B. STATE BOARD OF ADMINISTRATION DEBT SERVICEACCOUNTS
The University reported investments at fair value totaling $1,991,717 at June 30, 2015, in the SBA Debt Service Accounts. These investments are used to make debt service payments on bonds issued by the State Board of Education for the benefit of the University. The University’s investments consist of United States Treasury securities, with maturity dates of six months or less and are reported at fair value. The University relies on policies developed by the SBA for managing interest rate risk and credit risk for these accounts. Disclosures for the Debt Service Accounts are included in the notes to the financial statements of the State’s Comprehensive Annual Financial Report.
C. OTHER INVESTMENTS
In addition to external investment pools, the University and its discretely presented component units invested in various debt and equity securities, money market funds, and mutual funds. For the University, the majority of the other investments are managed by the University of Florida Investment Corporation (UFICO). University management determined, during the 2014-15 fiscal year, that a portion of those investments managed by UFICO should be reported as Other Noncurrent Investments on the Statement of Net Position. For the University’s discretely presented component units, other investments are those reported primarily by the University of Florida Foundation, Inc., The University Athletic Association, Inc., University of Florida Research Foundation, Inc., Florida Clinical Practice Association, Inc., Shands Teaching Hospital and Clinics, Inc., Shands Jacksonville HealthCare, Inc., and the University of Florida Self-Insurance Program. The following risks apply to the University’s and its discretely presented component units’ investments other than external investment pools:
Interest Rate Risk – Interest rate risk is the risk that changes in interest rates will adversely affect the fair value of an investment. Pursuant to Section 218.415(16), Florida Statutes, the University’s investments in securities must provide sufficient liquidity to pay obligations as they come due. Investments of the University’s component units (excluding those reporting under FASB standards) in debt securities, bonds and notes, and bond mutual funds, and their future maturities at June 30, 2015, are shown in Table 5.
Credit Risk – Credit risk is the risk that an issuer or other counterparty to an investment will not fulfill its obligations. Obligations of the United States Government or obligations explicitly guaranteed by the United States Government are not considered to have credit risk and do not require disclosure of credit quality. The investment agreements are unrated. At June 30, 2015, the University’s component units (excluding those reporting under FASB standards) had bonds and notes and bond mutual funds, with quality ratings by nationally recognized rating agencies (e.g., Moody’s Investors Service), as shown in Table 6.
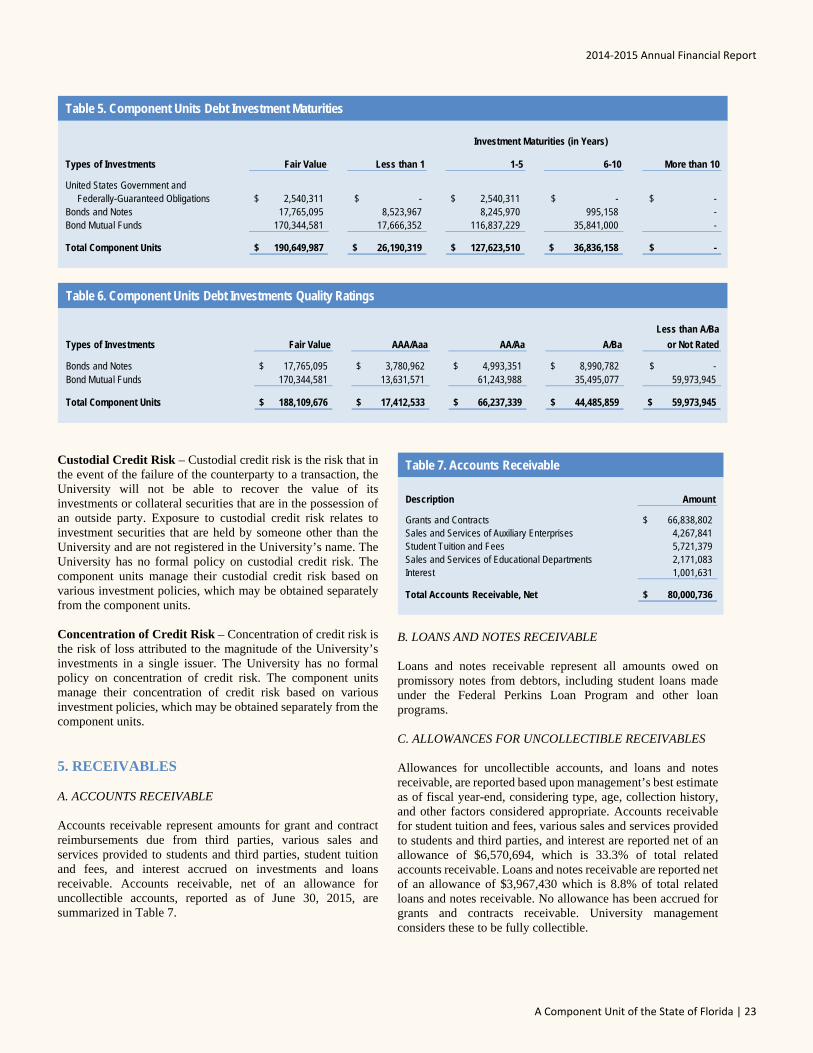
2014‐2015 Annual Financial Report
A Component Unit of the State of Florida | 23
Table 5. Component Units Debt Investment Maturities
Types of Investments Fair Value Less than 1 1-5 6-10 More than 10
United States Government and Federally-Guaranteed Obligations 2,540,311$ -$ 2,540,311$ -$ -$
Bonds and Notes 17,765,095 8,523,967 8,245,970 995,158 - Bond Mutual Funds 170,344,581 17,666,352 116,837,229 35,841,000 -
Total Component Units 190,649,987$ 26,190,319$ 127,623,510$ 36,836,158$ -$
Investment Maturities (in Years)
Table 6. Component Units Debt Investments Quality Ratings
Less than A/Ba
Types of Investments Fair Value AAA/Aaa AA/Aa A/Ba or Not Rated
Bonds and Notes 17,765,095$ 3,780,962$ 4,993,351$ 8,990,782$ -$ Bond Mutual Funds 170,344,581 13,631,571 61,243,988 35,495,077 59,973,945
Total Component Units 188,109,676$ 17,412,533$ 66,237,339$ 44,485,859$ 59,973,945$
Custodial Credit Risk – Custodial credit risk is the risk that in the event of the failure of the counterparty to a transaction, the University will not be able to recover the value of its investments or collateral securities that are in the possession of an outside party. Exposure to custodial credit risk relates to investment securities that are held by someone other than the University and are not registered in the University’s name. The University has no formal policy on custodial credit risk. The component units manage their custodial credit risk based on various investment policies, which may be obtained separately from the component units.
Concentration of Credit Risk – Concentration of credit risk is the risk of loss attributed to the magnitude of the University’s investments in a single issuer. The University has no formal policy on concentration of credit risk. The component units manage their concentration of credit risk based on various investment policies, which may be obtained separately from the component units.
5. RECEIVABLES
A. ACCOUNTS RECEIVABLE
Accounts receivable represent amounts for grant and contract reimbursements due from third parties, various sales and services provided to students and third parties, student tuition and fees, and interest accrued on investments and loans receivable. Accounts receivable, net of an allowance for uncollectible accounts, reported as of June 30, 2015, are summarized in Table 7.
Table 7. Accounts Receivable
Description Amount
Grants and Contracts 66,838,802$ Sales and Services of Auxiliary Enterprises 4,267,841 Student Tuition and Fees 5,721,379 Sales and Services of Educational Departments 2,171,083 Interest 1,001,631
Total Accounts Receivable, Net 80,000,736$
B. LOANS AND NOTES RECEIVABLE
Loans and notes receivable represent all amounts owed on promissory notes from debtors, including student loans made under the Federal Perkins Loan Program and other loan programs.
C. ALLOWANCES FOR UNCOLLECTIBLE RECEIVABLES
Allowances for uncollectible accounts, and loans and notes receivable, are reported based upon management’s best estimate as of fiscal year-end, considering type, age, collection history, and other factors considered appropriate. Accounts receivable for student tuition and fees, various sales and services provided to students and third parties, and interest are reported net of an allowance of $6,570,694, which is 33.3% of total related accounts receivable. Loans and notes receivable are reported net of an allowance of $3,967,430 which is 8.8% of total related loans and notes receivable. No allowance has been accrued for grants and contracts receivable. University management considers these to be fully collectible.
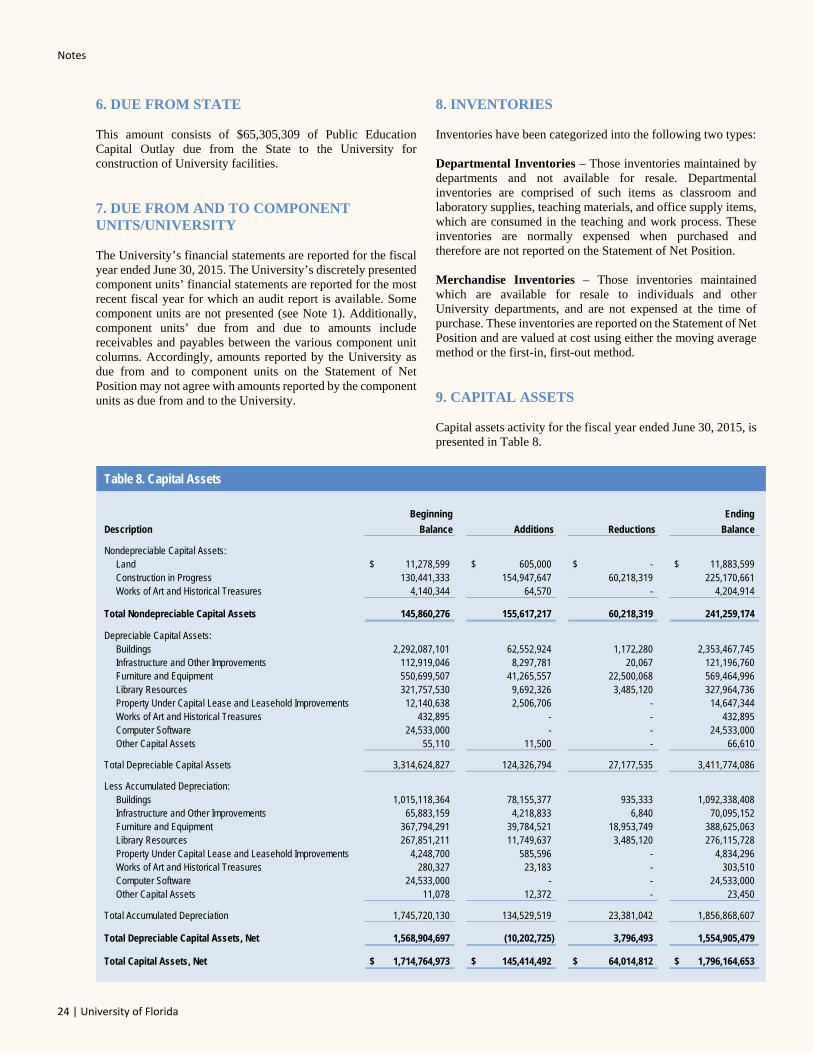
Notes
24 | University of Florida
6. DUE FROM STATE
This amount consists of $65,305,309 of Public Education Capital Outlay due from the State to the University for construction of University facilities.
7. DUE FROM AND TO COMPONENTUNITS/UNIVERSITY
The University’s financial statements are reported for the fiscal year ended June 30, 2015. The University’s discretely presented component units’ financial statements are reported for the most recent fiscal year for which an audit report is available. Some component units are not presented (see Note 1). Additionally, component units’ due from and due to amounts include receivables and payables between the various component unit columns. Accordingly, amounts reported by the University as due from and to component units on the Statement of Net Position may not agree with amounts reported by the component units as due from and to the University.
8. INVENTORIES
Inventories have been categorized into the following two types:
Departmental Inventories – Those inventories maintained by departments and not available for resale. Departmental inventories are comprised of such items as classroom and laboratory supplies, teaching materials, and office supply items, which are consumed in the teaching and work process. These inventories are normally expensed when purchased and therefore are not reported on the Statement of Net Position.
Merchandise Inventories – Those inventories maintained which are available for resale to individuals and other University departments, and are not expensed at the time of purchase. These inventories are reported on the Statement of Net Position and are valued at cost using either the moving average method or the first-in, first-out method.
9. CAPITAL ASSETS
Capital assets activity for the fiscal year ended June 30, 2015, is presented in Table 8.
Table 8. Capital Assets
Beginning Ending
Description Balance Additions Reductions Balance
Nondepreciable Capital Assets:Land 11,278,599$ 605,000$ -$ 11,883,599$ Construction in Progress 130,441,333 154,947,647 60,218,319 225,170,661 Works of Art and Historical Treasures 4,140,344 64,570 - 4,204,914
Total Nondepreciable Capital Assets 145,860,276 155,617,217 60,218,319 241,259,174
Depreciable Capital Assets:Buildings 2,292,087,101 62,552,924 1,172,280 2,353,467,745 Infrastructure and Other Improvements 112,919,046 8,297,781 20,067 121,196,760 Furniture and Equipment 550,699,507 41,265,557 22,500,068 569,464,996 Library Resources 321,757,530 9,692,326 3,485,120 327,964,736 Property Under Capital Lease and Leasehold Improvements 12,140,638 2,506,706 - 14,647,344Works of Art and Historical Treasures 432,895 - - 432,895Computer Software 24,533,000 - - 24,533,000Other Capital Assets 55,110 11,500 - 66,610
Total Depreciable Capital Assets 3,314,624,827 124,326,794 27,177,535 3,411,774,086
Less Accumulated Depreciation:Buildings 1,015,118,364 78,155,377 935,333 1,092,338,408 Infrastructure and Other Improvements 65,883,159 4,218,833 6,840 70,095,152 Furniture and Equipment 367,794,291 39,784,521 18,953,749 388,625,063 Library Resources 267,851,211 11,749,637 3,485,120 276,115,728 Property Under Capital Lease and Leasehold Improvements 4,248,700 585,596 - 4,834,296Works of Art and Historical Treasures 280,327 23,183 - 303,510Computer Software 24,533,000 - - 24,533,000Other Capital Assets 11,078 12,372 - 23,450
Total Accumulated Depreciation 1,745,720,130 134,529,519 23,381,042 1,856,868,607
Total Depreciable Capital Assets, Net 1,568,904,697 (10,202,725) 3,796,493 1,554,905,479
Total Capital Assets, Net 1,714,764,973$ 145,414,492$ 64,014,812$ 1,796,164,653$
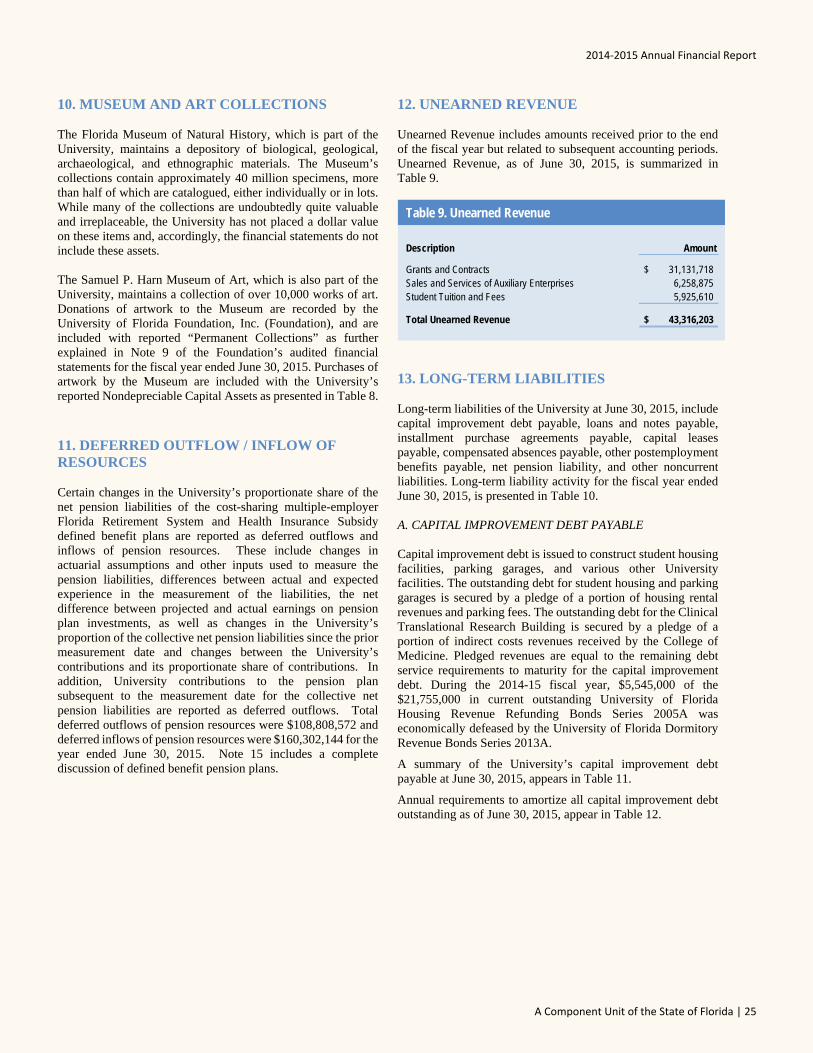
2014‐2015 Annual Financial Report
A Component Unit of the State of Florida | 25
10. MUSEUM AND ART COLLECTIONS The Florida Museum of Natural History, which is part of the University, maintains a depository of biological, geological, archaeological, and ethnographic materials. The Museum’s collections contain approximately 40 million specimens, more than half of which are catalogued, either individually or in lots. While many of the collections are undoubtedly quite valuable and irreplaceable, the University has not placed a dollar value on these items and, accordingly, the financial statements do not include these assets. The Samuel P. Harn Museum of Art, which is also part of the University, maintains a collection of over 10,000 works of art. Donations of artwork to the Museum are recorded by the University of Florida Foundation, Inc. (Foundation), and are included with reported “Permanent Collections” as further explained in Note 9 of the Foundation’s audited financial statements for the fiscal year ended June 30, 2015. Purchases of artwork by the Museum are included with the University’s reported Nondepreciable Capital Assets as presented in Table 8. 11. DEFERRED OUTFLOW / INFLOW OF RESOURCES Certain changes in the University’s proportionate share of the net pension liabilities of the cost-sharing multiple-employer Florida Retirement System and Health Insurance Subsidy defined benefit plans are reported as deferred outflows and inflows of pension resources. These include changes in actuarial assumptions and other inputs used to measure the pension liabilities, differences between actual and expected experience in the measurement of the liabilities, the net difference between projected and actual earnings on pension plan investments, as well as changes in the University’s proportion of the collective net pension liabilities since the prior measurement date and changes between the University’s contributions and its proportionate share of contributions. In addition, University contributions to the pension plan subsequent to the measurement date for the collective net pension liabilities are reported as deferred outflows. Total deferred outflows of pension resources were $108,808,572 and deferred inflows of pension resources were $160,302,144 for the year ended June 30, 2015. Note 15 includes a complete discussion of defined benefit pension plans.
12. UNEARNED REVENUE Unearned Revenue includes amounts received prior to the end of the fiscal year but related to subsequent accounting periods. Unearned Revenue, as of June 30, 2015, is summarized in Table 9.
Table 9. Unearned Revenue
Description Amount
Grants and Contracts 31,131,718$ Sales and Services of Auxiliary Enterprises 6,258,875 Student Tuition and Fees 5,925,610
Total Unearned Revenue 43,316,203$
13. LONG-TERM LIABILITIES Long-term liabilities of the University at June 30, 2015, include capital improvement debt payable, loans and notes payable, installment purchase agreements payable, capital leases payable, compensated absences payable, other postemployment benefits payable, net pension liability, and other noncurrent liabilities. Long-term liability activity for the fiscal year ended June 30, 2015, is presented in Table 10. A. CAPITAL IMPROVEMENT DEBT PAYABLE Capital improvement debt is issued to construct student housing facilities, parking garages, and various other University facilities. The outstanding debt for student housing and parking garages is secured by a pledge of a portion of housing rental revenues and parking fees. The outstanding debt for the Clinical Translational Research Building is secured by a pledge of a portion of indirect costs revenues received by the College of Medicine. Pledged revenues are equal to the remaining debt service requirements to maturity for the capital improvement debt. During the 2014-15 fiscal year, $5,545,000 of the $21,755,000 in current outstanding University of Florida Housing Revenue Refunding Bonds Series 2005A was economically defeased by the University of Florida Dormitory Revenue Bonds Series 2013A.
A summary of the University’s capital improvement debt payable at June 30, 2015, appears in Table 11.
Annual requirements to amortize all capital improvement debt outstanding as of June 30, 2015, appear in Table 12.
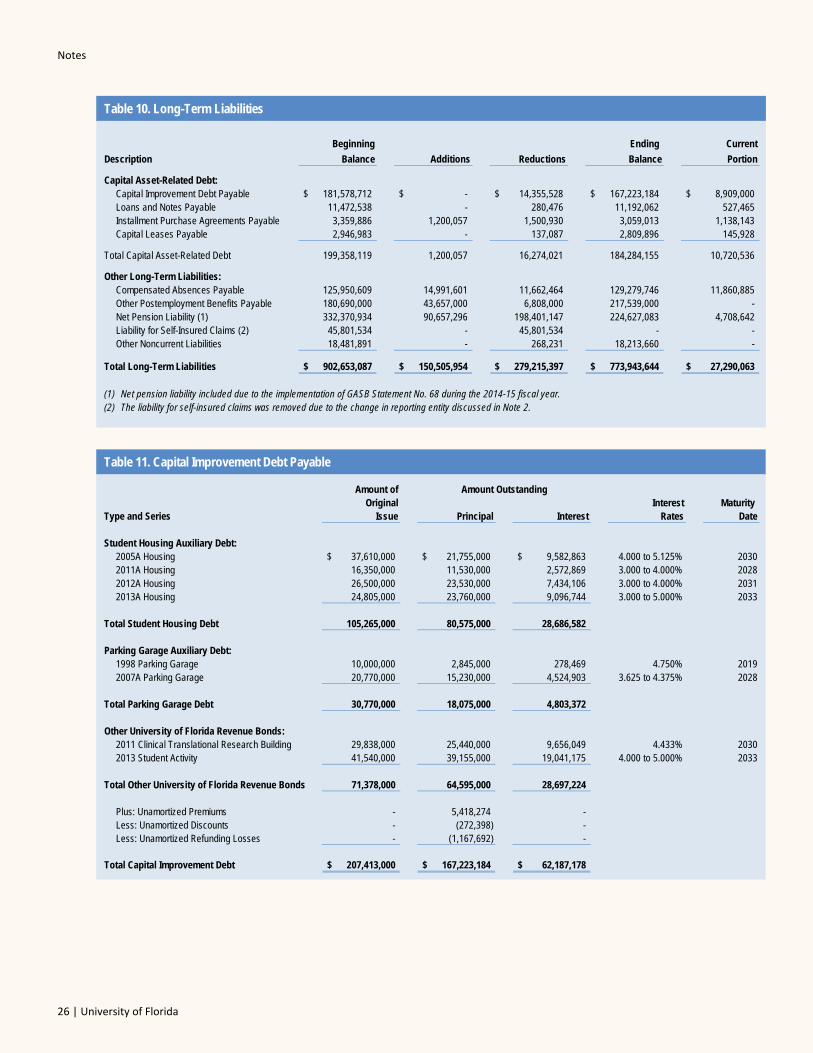
Notes
26 | University of Florida
Table 10. Long-Term Liabilities
Beginning Ending Current
Description Balance Additions Reductions Balance Portion
Capital Asset-Related Debt:Capital Improvement Debt Payable 181,578,712$ -$ 14,355,528$ 167,223,184$ 8,909,000$ Loans and Notes Payable 11,472,538 - 280,476 11,192,062 527,465 Installment Purchase Agreements Payable 3,359,886 1,200,057 1,500,930 3,059,013 1,138,143 Capital Leases Payable 2,946,983 - 137,087 2,809,896 145,928
Total Capital Asset-Related Debt 199,358,119 1,200,057 16,274,021 184,284,155 10,720,536
Other Long-Term Liabilities:Compensated Absences Payable 125,950,609 14,991,601 11,662,464 129,279,746 11,860,885 Other Postemployment Benefits Payable 180,690,000 43,657,000 6,808,000 217,539,000 - Net Pension Liability (1) 332,370,934 90,657,296 198,401,147 224,627,083 4,708,642 Liability for Self-Insured Claims (2) 45,801,534 - 45,801,534 - - Other Noncurrent Liabilities 18,481,891 - 268,231 18,213,660 -
Total Long-Term Liabilities 902,653,087$ 150,505,954$ 279,215,397$ 773,943,644$ 27,290,063$
(1) Net pension liability included due to the implementation of GASB Statement No. 68 during the 2014-15 fiscal year.(2) The liability for self-insured claims was removed due to the change in reporting entity discussed in Note 2.
Table 11. Capital Improvement Debt Payable
Amount ofOriginal Interest Maturity
Type and Series Issue Principal Interest Rates Date
Student Housing Auxiliary Debt:2005A Housing 37,610,000$ 21,755,000$ 9,582,863$ 4.000 to 5.125% 20302011A Housing 16,350,000 11,530,000 2,572,869 3.000 to 4.000% 20282012A Housing 26,500,000 23,530,000 7,434,106 3.000 to 4.000% 20312013A Housing 24,805,000 23,760,000 9,096,744 3.000 to 5.000% 2033
Total Student Housing Debt 105,265,000 80,575,000 28,686,582
Parking Garage Auxiliary Debt:1998 Parking Garage 10,000,000 2,845,000 278,469 4.750% 20192007A Parking Garage 20,770,000 15,230,000 4,524,903 3.625 to 4.375% 2028
Total Parking Garage Debt 30,770,000 18,075,000 4,803,372
Other University of Florida Revenue Bonds:2011 Clinical Translational Research Building 29,838,000 25,440,000 9,656,049 4.433% 20302013 Student Activity 41,540,000 39,155,000 19,041,175 4.000 to 5.000% 2033
Total Other University of Florida Revenue Bonds 71,378,000 64,595,000 28,697,224
Plus: Unamortized Premiums - 5,418,274 - Less: Unamortized Discounts - (272,398) - Less: Unamortized Refunding Losses - (1,167,692) -
Total Capital Improvement Debt 207,413,000$ 167,223,184$ 62,187,178$
Amount Outstanding
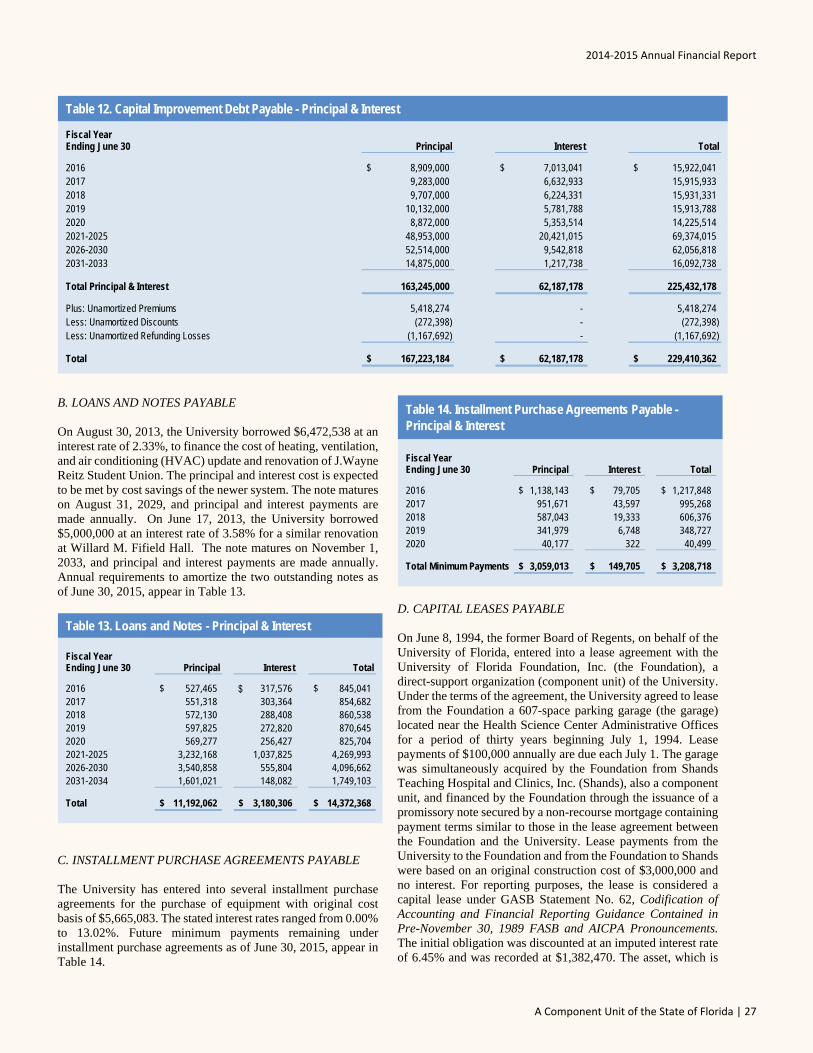
2014‐2015 Annual Financial Report
A Component Unit of the State of Florida | 27
Table 12. Capital Improvement Debt Payable - Principal & Interest
Fiscal YearEnding June 30 Principal Interest Total
2016 8,909,000$ 7,013,041$ 15,922,041$ 2017 9,283,000 6,632,933 15,915,933 2018 9,707,000 6,224,331 15,931,331 2019 10,132,000 5,781,788 15,913,788 2020 8,872,000 5,353,514 14,225,514 2021-2025 48,953,000 20,421,015 69,374,015 2026-2030 52,514,000 9,542,818 62,056,818 2031-2033 14,875,000 1,217,738 16,092,738
Total Principal & Interest 163,245,000 62,187,178 225,432,178
Plus: Unamortized Premiums 5,418,274 - 5,418,274 Less: Unamortized Discounts (272,398) - (272,398) Less: Unamortized Refunding Losses (1,167,692) - (1,167,692)
Total 167,223,184$ 62,187,178$ 229,410,362$
B. LOANS AND NOTES PAYABLE
On August 30, 2013, the University borrowed $6,472,538 at an interest rate of 2.33%, to finance the cost of heating, ventilation, and air conditioning (HVAC) update and renovation of J.Wayne Reitz Student Union. The principal and interest cost is expected to be met by cost savings of the newer system. The note matures on August 31, 2029, and principal and interest payments are made annually. On June 17, 2013, the University borrowed $5,000,000 at an interest rate of 3.58% for a similar renovation at Willard M. Fifield Hall. The note matures on November 1, 2033, and principal and interest payments are made annually. Annual requirements to amortize the two outstanding notes as of June 30, 2015, appear in Table 13.
Table 13. Loans and Notes - Principal & Interest
Fiscal YearEnding June 30 Principal Interest Total
2016 527,465$ 317,576 845,041$ 2017 551,318 303,364 854,6822018 572,130 288,408 860,5382019 597,825 272,820 870,6452020 569,277 256,427 825,7042021-2025 3,232,168 1,037,825 4,269,9932026-2030 3,540,858 555,804 4,096,6622031-2034 1,601,021 148,082 1,749,103
Total 11,192,062$ 3,180,306$ 14,372,368$
C. INSTALLMENT PURCHASE AGREEMENTS PAYABLE
The University has entered into several installment purchase agreements for the purchase of equipment with original cost basis of $5,665,083. The stated interest rates ranged from 0.00% to 13.02%. Future minimum payments remaining under installment purchase agreements as of June 30, 2015, appear in Table 14.
Fiscal YearEnding June 30 Principal Interest Total
2016 1,138,143$ 79,705$ 1,217,848$ 2017 951,671 43,597 995,268 2018 587,043 19,333 606,376 2019 341,979 6,748 348,727 2020 40,177 322 40,499
Total Minimum Payments 3,059,013$ 149,705$ 3,208,718$
Table 14. Installment Purchase Agreements Payable - Principal & Interest
D. CAPITAL LEASES PAYABLE
On June 8, 1994, the former Board of Regents, on behalf of the University of Florida, entered into a lease agreement with the University of Florida Foundation, Inc. (the Foundation), a direct-support organization (component unit) of the University. Under the terms of the agreement, the University agreed to lease from the Foundation a 607-space parking garage (the garage) located near the Health Science Center Administrative Offices for a period of thirty years beginning July 1, 1994. Lease payments of $100,000 annually are due each July 1. The garage was simultaneously acquired by the Foundation from Shands Teaching Hospital and Clinics, Inc. (Shands), also a component unit, and financed by the Foundation through the issuance of a promissory note secured by a non-recourse mortgage containing payment terms similar to those in the lease agreement between the Foundation and the University. Lease payments from the University to the Foundation and from the Foundation to Shands were based on an original construction cost of $3,000,000 and no interest. For reporting purposes, the lease is considered a capital lease under GASB Statement No. 62, Codification of Accounting and Financial Reporting Guidance Contained in Pre-November 30, 1989 FASB and AICPA Pronouncements. The initial obligation was discounted at an imputed interest rate of 6.45% and was recorded at $1,382,470. The asset, which is
$
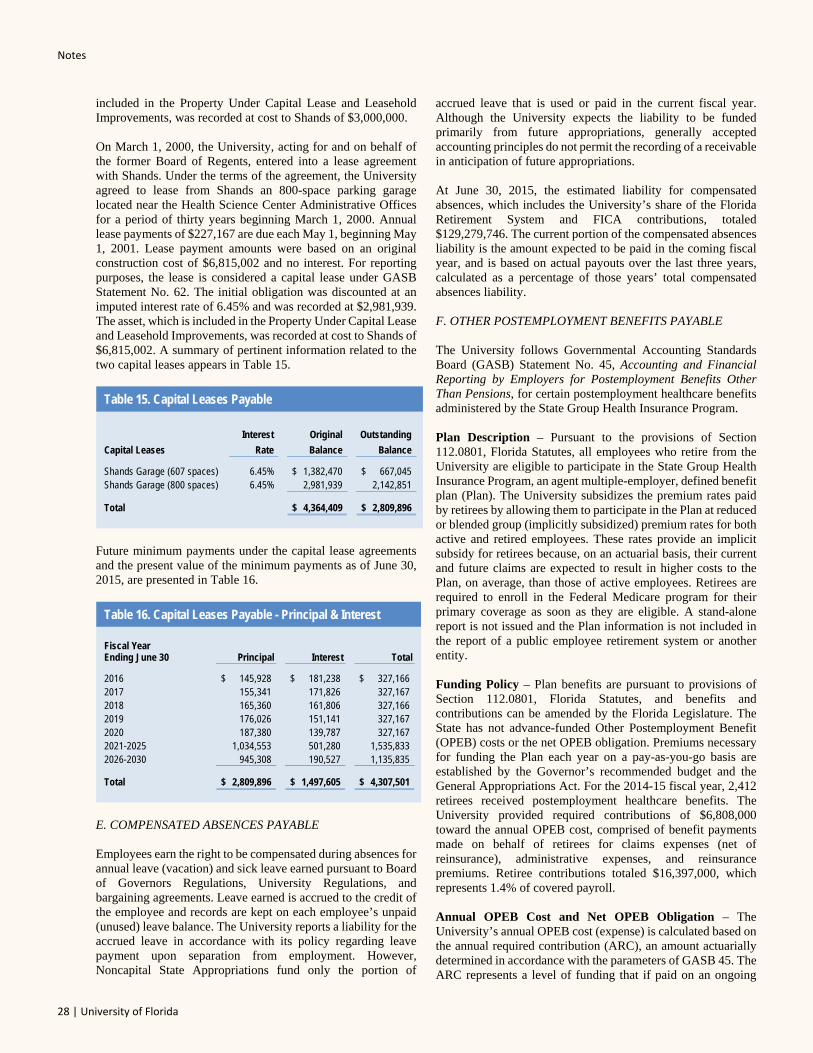
Notes
28 | University of Florida
included in the Property Under Capital Lease and Leasehold Improvements, was recorded at cost to Shands of $3,000,000. On March 1, 2000, the University, acting for and on behalf of the former Board of Regents, entered into a lease agreement with Shands. Under the terms of the agreement, the University agreed to lease from Shands an 800-space parking garage located near the Health Science Center Administrative Offices for a period of thirty years beginning March 1, 2000. Annual lease payments of $227,167 are due each May 1, beginning May 1, 2001. Lease payment amounts were based on an original construction cost of $6,815,002 and no interest. For reporting purposes, the lease is considered a capital lease under GASB Statement No. 62. The initial obligation was discounted at an imputed interest rate of 6.45% and was recorded at $2,981,939. The asset, which is included in the Property Under Capital Lease and Leasehold Improvements, was recorded at cost to Shands of $6,815,002. A summary of pertinent information related to the two capital leases appears in Table 15.
Table 15. Capital Leases Payable
Interest Original Outstanding
Capital Leases Rate Balance Balance
Shands Garage (607 spaces) 6.45% 1,382,470$ 667,045$ Shands Garage (800 spaces) 6.45% 2,981,939 2,142,851
Total 4,364,409$ 2,809,896$
Future minimum payments under the capital lease agreements and the present value of the minimum payments as of June 30, 2015, are presented in Table 16.
Table 16. Capital Leases Payable - Principal & Interest
Fiscal YearEnding June 30 Principal Interest Total
2016 145,928$ 181,238$ 327,166$ 2017 155,341 171,826 327,167 2018 165,360 161,806 327,166 2019 176,026 151,141 327,167 2020 187,380 139,787 327,167 2021-2025 1,034,553 501,280 1,535,833 2026-2030 945,308 190,527 1,135,835
Total 2,809,896$ 1,497,605$ 4,307,501$
E. COMPENSATED ABSENCES PAYABLE Employees earn the right to be compensated during absences for annual leave (vacation) and sick leave earned pursuant to Board of Governors Regulations, University Regulations, and bargaining agreements. Leave earned is accrued to the credit of the employee and records are kept on each employee’s unpaid (unused) leave balance. The University reports a liability for the accrued leave in accordance with its policy regarding leave payment upon separation from employment. However, Noncapital State Appropriations fund only the portion of
accrued leave that is used or paid in the current fiscal year. Although the University expects the liability to be funded primarily from future appropriations, generally accepted accounting principles do not permit the recording of a receivable in anticipation of future appropriations. At June 30, 2015, the estimated liability for compensated absences, which includes the University’s share of the Florida Retirement System and FICA contributions, totaled $129,279,746. The current portion of the compensated absences liability is the amount expected to be paid in the coming fiscal year, and is based on actual payouts over the last three years, calculated as a percentage of those years’ total compensated absences liability. F. OTHER POSTEMPLOYMENT BENEFITS PAYABLE The University follows Governmental Accounting Standards Board (GASB) Statement No. 45, Accounting and Financial Reporting by Employers for Postemployment Benefits Other Than Pensions, for certain postemployment healthcare benefits administered by the State Group Health Insurance Program. Plan Description – Pursuant to the provisions of Section 112.0801, Florida Statutes, all employees who retire from the University are eligible to participate in the State Group Health Insurance Program, an agent multiple-employer, defined benefit plan (Plan). The University subsidizes the premium rates paid by retirees by allowing them to participate in the Plan at reduced or blended group (implicitly subsidized) premium rates for both active and retired employees. These rates provide an implicit subsidy for retirees because, on an actuarial basis, their current and future claims are expected to result in higher costs to the Plan, on average, than those of active employees. Retirees are required to enroll in the Federal Medicare program for their primary coverage as soon as they are eligible. A stand-alone report is not issued and the Plan information is not included in the report of a public employee retirement system or another entity. Funding Policy – Plan benefits are pursuant to provisions of Section 112.0801, Florida Statutes, and benefits and contributions can be amended by the Florida Legislature. The State has not advance-funded Other Postemployment Benefit (OPEB) costs or the net OPEB obligation. Premiums necessary for funding the Plan each year on a pay-as-you-go basis are established by the Governor’s recommended budget and the General Appropriations Act. For the 2014-15 fiscal year, 2,412 retirees received postemployment healthcare benefits. The University provided required contributions of $6,808,000 toward the annual OPEB cost, comprised of benefit payments made on behalf of retirees for claims expenses (net of reinsurance), administrative expenses, and reinsurance premiums. Retiree contributions totaled $16,397,000, which represents 1.4% of covered payroll. Annual OPEB Cost and Net OPEB Obligation – The University’s annual OPEB cost (expense) is calculated based on the annual required contribution (ARC), an amount actuarially determined in accordance with the parameters of GASB 45. The ARC represents a level of funding that if paid on an ongoing
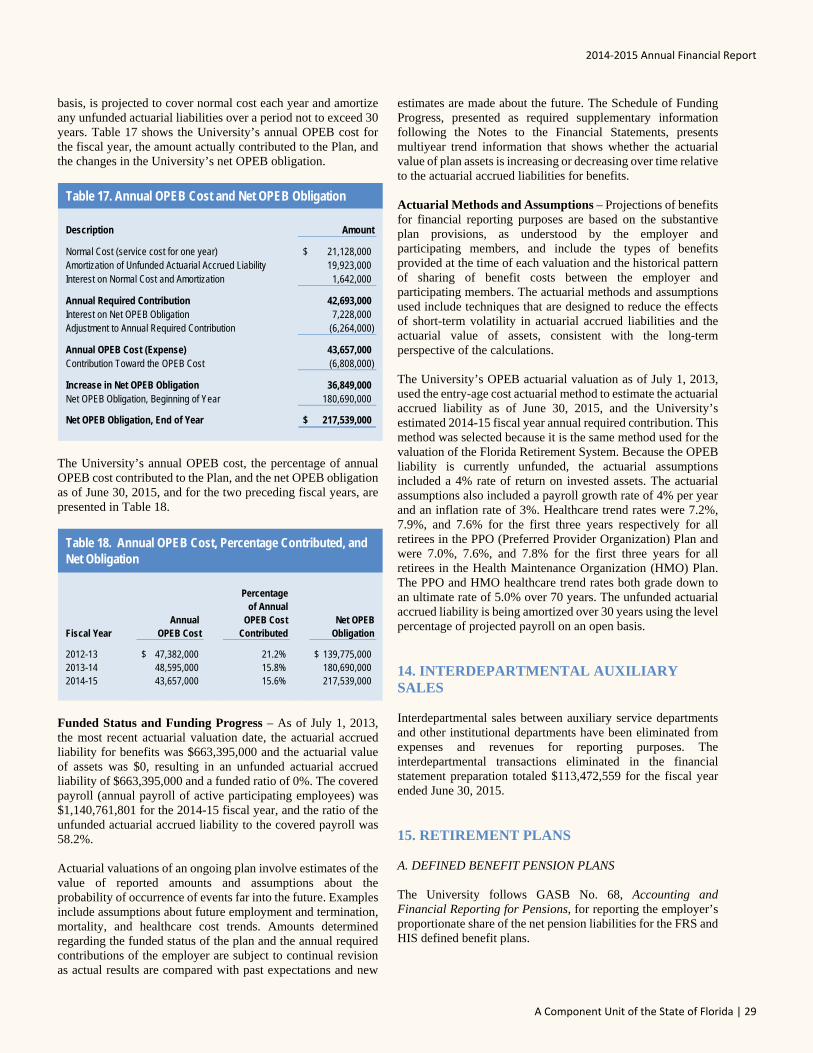
2014‐2015 Annual Financial Report
A Component Unit of the State of Florida | 29
basis, is projected to cover normal cost each year and amortize any unfunded actuarial liabilities over a period not to exceed 30 years. Table 17 shows the University’s annual OPEB cost for the fiscal year, the amount actually contributed to the Plan, and the changes in the University’s net OPEB obligation.
Table 17. Annual OPEB Cost and Net OPEB Obligation
Description Amount
Normal Cost (service cost for one year) 21,128,000$ Amortization of Unfunded Actuarial Accrued Liability 19,923,000 Interest on Normal Cost and Amortization 1,642,000
Annual Required Contribution 42,693,000 Interest on Net OPEB Obligation 7,228,000 Adjustment to Annual Required Contribution (6,264,000)
Annual OPEB Cost (Expense) 43,657,000 Contribution Toward the OPEB Cost (6,808,000)
Increase in Net OPEB Obligation 36,849,000 Net OPEB Obligation, Beginning of Year 180,690,000
Net OPEB Obligation, End of Year 217,539,000$
The University’s annual OPEB cost, the percentage of annual OPEB cost contributed to the Plan, and the net OPEB obligation as of June 30, 2015, and for the two preceding fiscal years, are presented in Table 18.
Percentageof Annual
Annual OPEB Cost Net OPEBFiscal Year OPEB Cost Contributed Obligation
2012-13 47,382,000$ 21.2% 139,775,000$ 2013-14 48,595,000 15.8% 180,690,000 2014-15 43,657,000 15.6% 217,539,000
Table 18. Annual OPEB Cost, Percentage Contributed, and Net Obligation
Funded Status and Funding Progress – As of July 1, 2013, the most recent actuarial valuation date, the actuarial accrued liability for benefits was $663,395,000 and the actuarial value of assets was $0, resulting in an unfunded actuarial accrued liability of $663,395,000 and a funded ratio of 0%. The covered payroll (annual payroll of active participating employees) was $1,140,761,801 for the 2014-15 fiscal year, and the ratio of the unfunded actuarial accrued liability to the covered payroll was 58.2%. Actuarial valuations of an ongoing plan involve estimates of the value of reported amounts and assumptions about the probability of occurrence of events far into the future. Examples include assumptions about future employment and termination, mortality, and healthcare cost trends. Amounts determined regarding the funded status of the plan and the annual required contributions of the employer are subject to continual revision as actual results are compared with past expectations and new
estimates are made about the future. The Schedule of Funding Progress, presented as required supplementary information following the Notes to the Financial Statements, presents multiyear trend information that shows whether the actuarial value of plan assets is increasing or decreasing over time relative to the actuarial accrued liabilities for benefits. Actuarial Methods and Assumptions – Projections of benefits for financial reporting purposes are based on the substantive plan provisions, as understood by the employer and participating members, and include the types of benefits provided at the time of each valuation and the historical pattern of sharing of benefit costs between the employer and participating members. The actuarial methods and assumptions used include techniques that are designed to reduce the effects of short-term volatility in actuarial accrued liabilities and the actuarial value of assets, consistent with the long-term perspective of the calculations. The University’s OPEB actuarial valuation as of July 1, 2013, used the entry-age cost actuarial method to estimate the actuarial accrued liability as of June 30, 2015, and the University’s estimated 2014-15 fiscal year annual required contribution. This method was selected because it is the same method used for the valuation of the Florida Retirement System. Because the OPEB liability is currently unfunded, the actuarial assumptions included a 4% rate of return on invested assets. The actuarial assumptions also included a payroll growth rate of 4% per year and an inflation rate of 3%. Healthcare trend rates were 7.2%, 7.9%, and 7.6% for the first three years respectively for all retirees in the PPO (Preferred Provider Organization) Plan and were 7.0%, 7.6%, and 7.8% for the first three years for all retirees in the Health Maintenance Organization (HMO) Plan. The PPO and HMO healthcare trend rates both grade down to an ultimate rate of 5.0% over 70 years. The unfunded actuarial accrued liability is being amortized over 30 years using the level percentage of projected payroll on an open basis. 14. INTERDEPARTMENTAL AUXILIARY SALES Interdepartmental sales between auxiliary service departments and other institutional departments have been eliminated from expenses and revenues for reporting purposes. The interdepartmental transactions eliminated in the financial statement preparation totaled $113,472,559 for the fiscal year ended June 30, 2015. 15. RETIREMENT PLANS A. DEFINED BENEFIT PENSION PLANS The University follows GASB No. 68, Accounting and Financial Reporting for Pensions, for reporting the employer’s proportionate share of the net pension liabilities for the FRS and HIS defined benefit plans.
Notes
30 | University of Florida
General information about the Florida Retirement System (FRS) and Health Insurance Subsidy (HIS) Program
The Florida Retirement System (FRS) was created in Chapter 121, Florida Statutes. The FRS was created to provide a defined benefit pension plan for participating public employees. The FRS was amended in 1998 to add the Deferred Retirement Option Program under the defined benefit plan and amended in 2000 to provide a defined contribution plan alternative to the defined benefit plan for FRS members effective July 1, 2002. This integrated defined contribution pension plan is the FRS Investment Plan. Chapter 112, Florida Statutes, established the Retiree Health Insurance Subsidy (HIS) Program, a cost-sharing multiple-employer defined benefit pension plan to assist retired members of any State-administered retirement system in paying the costs of health insurance. Chapter 121, Florida Statutes, also provides for nonintegrated, optional retirement programs in lieu of the FRS to certain members of the Senior Management Service Class (SMSC) employed by the State and faculty and specified employees in the State university system.
Essentially all regular employees of the University are eligible to enroll as members of the State-administered FRS. Provisions relating to the FRS are established by Chapters 121 and 122, Florida Statutes; Chapter 112, Part IV, Florida Statutes; Chapter 238, Florida Statutes; and Florida Retirement System Rules, Chapter 60S, Florida Administrative Code; wherein eligibility, contributions, and benefits are defined and described in detail. Such provisions may be amended at any time by further action from the Florida Legislature. The FRS is a single retirement system administered by the Department of Management Services, Division of Retirement, and consists of two cost-sharing, multiple-employer defined benefit plans and other nonintegrated programs. A comprehensive annual financial report of the FRS, which includes its financial statements, required supplementary information, actuarial report, and other relevant information, is available from the Florida Department of Management Services’ Web site (ww.dms.myflorida.com). The University’s pension expense totaled $26,107,645 for the 2014-15 fiscal year for both the FRS Pension Plan and HIS Program. 1. Florida Retirement System Defined Benefit Pension Plan
Plan Description – The FRS Pension Plan (Plan) is a cost-sharing multiple-employer defined benefit pension plan, with a Deferred Retirement Option Program (DROP) for eligible employees. The general classes of membership are as follows:
Regular Class – Members of the FRS who do not qualify for membership in the other classes.
Senior Management Service Class (SMSC) – Members in senior management level positions.
Special Risk Class – Members who are employed as law enforcement officers and meet the criteria to qualify for this class.
Employees enrolled in the Plan prior to July 1, 2011, vest at six years of creditable service and employees enrolled in the Plan
on or after July 1, 2011, vest at eight years of creditable service. All vested members, enrolled prior to July 1, 2011, are eligible for normal retirement benefits at age 62 or at any age after 30 years of service, except for members classified as special risk who are eligible for normal retirement benefits at age 55 or at any age after 25 years of service. All members enrolled in the Plan on or after July 1, 2011, once vested, are eligible for normal retirement benefits at age 65 or any time after 33 years of creditable service, except for members classified as special risk who are eligible for normal retirement benefits at age 60 or at any age after 30 years of service. Employees enrolled in the Plan may include up to 4 years of credit for military service toward creditable service. The Plan also includes an early retirement provision; however, there is a benefit reduction for each year a member retires before his or her normal retirement date. The Plan provides retirement, disability, death benefits, and annual cost-of-living adjustments to eligible participants.
DROP, subject to provisions of Section 121.091, Florida Statutes, permits employees eligible for normal retirement under the Plan to defer receipt of monthly benefit payments while continuing employment with an FRS-participating employer. An employee may participate in DROP for a period not to exceed 60 months after electing to participate. During the period of DROP participation, deferred monthly benefits are held in the FRS Trust Fund and accrue interest. The net pension liability does not include amounts for DROP participants, as these members are considered retired and are not accruing additional pension benefits.
Benefits Provided – Benefits under the Plan are computed on the basis of age, and/or years of service, average final compensation, and service credit. Credit for each year of service is expressed as a percentage of the average final compensation. For members initially enrolled before July 1, 2011, the average final compensation is the average of the five highest fiscal years’ earnings; for members initially enrolled on or after July 1, 2011, the average final compensation is the average of the eight highest fiscal years’ earnings. The total percentage value of the benefit received is determined by calculating the total value of all service, which is based on retirement plan and/or the class to which the member belonged when the service credit was earned. Members are eligible for in-line-of-duty or regular disability and survivors’ benefits. Table 19 shows the percentage value for each year of service credit earned. As provided in Section 121.101, Florida Statutes, if the member is initially enrolled in the FRS before July 1, 2011, and all service credit was accrued before July 1, 2011, the annual cost-of-living adjustment is 3% per year. If the member is initially enrolled before July 1, 2011, and has service credit on or after July 1, 2011, there is an individually calculated cost-of-living adjustment. The annual cost-of-living adjustment is a proportion of 3% determined by dividing the sum of the pre-July 2011 service credit by the total service credit at retirement multiplied by 3%. Plan members initially enrolled on or after July 1, 2011, will not have a cost-of-living adjustment after retirement.
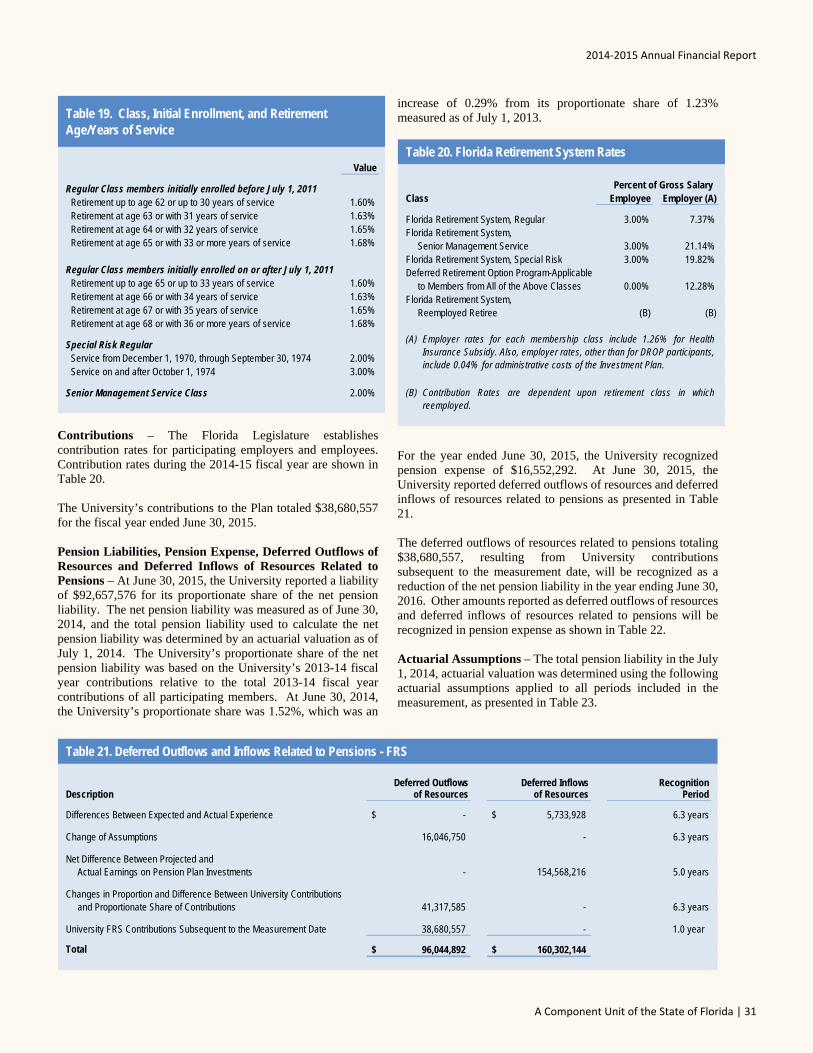
2014‐2015 Annual Financial Report
A Component Unit of the State of Florida | 31
Value
Regular Class members initially enrolled before July 1, 2011 Retirement up to age 62 or up to 30 years of service 1.60% Retirement at age 63 or with 31 years of service 1.63% Retirement at age 64 or with 32 years of service 1.65% Retirement at age 65 or with 33 or more years of service 1.68%
Regular Class members initially enrolled on or after July 1, 2011 Retirement up to age 65 or up to 33 years of service 1.60% Retirement at age 66 or with 34 years of service 1.63% Retirement at age 67 or with 35 years of service 1.65% Retirement at age 68 or with 36 or more years of service 1.68%
Special Risk Regular Service from December 1, 1970, through September 30, 1974 2.00% Service on and after October 1, 1974 3.00%
Senior Management Service Class 2.00%
Table 19. Class, Initial Enrollment, and RetirementAge/Years of Service
Contributions – The Florida Legislature establishes contribution rates for participating employers and employees. Contribution rates during the 2014-15 fiscal year are shown in Table 20. The University’s contributions to the Plan totaled $38,680,557 for the fiscal year ended June 30, 2015. Pension Liabilities, Pension Expense, Deferred Outflows of Resources and Deferred Inflows of Resources Related to Pensions – At June 30, 2015, the University reported a liability of $92,657,576 for its proportionate share of the net pension liability. The net pension liability was measured as of June 30, 2014, and the total pension liability used to calculate the net pension liability was determined by an actuarial valuation as of July 1, 2014. The University’s proportionate share of the net pension liability was based on the University’s 2013-14 fiscal year contributions relative to the total 2013-14 fiscal year contributions of all participating members. At June 30, 2014, the University’s proportionate share was 1.52%, which was an
increase of 0.29% from its proportionate share of 1.23% measured as of July 1, 2013.
Table 20. Florida Retirement System Rates
Class Employee Employer (A)
Florida Retirement System, Regular 3.00% 7.37%Florida Retirement System,
Senior Management Service 3.00% 21.14%Florida Retirement System, Special Risk 3.00% 19.82%Deferred Retirement Option Program-Applicable
to Members from All of the Above Classes 0.00% 12.28%Florida Retirement System,
Reemployed Retiree (B) (B)
(A)
(B) Contribution Rates are dependent upon retirement class in whichreemployed.
Percent of Gross Salary
Employer rates for each membership class include 1.26% for HealthInsurance Subsidy. Also, employer rates, other than for DROP participants, include 0.04% for administrative costs of the Investment Plan.
For the year ended June 30, 2015, the University recognized pension expense of $16,552,292. At June 30, 2015, the University reported deferred outflows of resources and deferred inflows of resources related to pensions as presented in Table 21. The deferred outflows of resources related to pensions totaling $38,680,557, resulting from University contributions subsequent to the measurement date, will be recognized as a reduction of the net pension liability in the year ending June 30, 2016. Other amounts reported as deferred outflows of resources and deferred inflows of resources related to pensions will be recognized in pension expense as shown in Table 22. Actuarial Assumptions – The total pension liability in the July 1, 2014, actuarial valuation was determined using the following actuarial assumptions applied to all periods included in the measurement, as presented in Table 23.
Table 21. Deferred Outflows and Inflows Related to Pensions - FRS
Deferred Outflows Deferred Inflows RecognitionDescription of Resources of Resources Period
Differences Between Expected and Actual Experience -$ 5,733,928$ 6.3 years
Change of Assumptions 16,046,750 - 6.3 years
Net Difference Between Projected andActual Earnings on Pension Plan Investments - 154,568,216 5.0 years
Changes in Proportion and Difference Between University Contributions and Proportionate Share of Contributions 41,317,585 - 6.3 years
University FRS Contributions Subsequent to the Measurement Date 38,680,557 - 1.0 year
Total 96,044,892$ 160,302,144$
Notes
32 | University of Florida
Fiscal Year Ending June 30 Amount
2016 (28,900,468)$ 2017 (28,900,468) 2018 (28,900,468) 2019 (28,900,468) 2020 9,741,586 Thereafter 2,922,477
Total (102,937,809)$
Table 22. Recognition of Deferred Outflows and Inflows Related to Pensions - FRS
Table 23. Actuarial Assumptions - FRS
Inflation 2.60%Salary Increases 3.25% , average, including inflationInvestment rate of return 7.65% , net of pension plan investment expense,
including inflation
Mortality rates were based on the Generational RP-2000 with Projection Scale BB. The actual assumptions used in the July 1, 2014, valuation were based on the results of an actuarial experience study for the period July 1, 2008, through June 30, 2013. The long-term expected rate of return on pension plan investments was not based on historical returns, but instead is based on a forward-looking capital market economic model. The allocation policy’s description of each asset class was used to map the target allocation to the asset classes shown below. Each asset class assumption is based on a consistent set of underlying assumptions, and includes an adjustment for the inflation assumption. The target allocation and best estimates of long-term expected rates of arithmetic return for each major asset class are summarized in Table 24.
Table 24. Target Allocation and Expected Rate of Return
Asset Class Target Allocation
Long-Term Expected Rate of
Return
Cash 1.00% 3.11%Intermediate-Term Bonds 18.00% 4.18%High Yield Bonds 3.00% 6.79%Broad US Equities 26.50% 8.51%Developed Foreign Equities 21.20% 8.66%Emerging Market Equities 5.30% 11.58%Private Equity 6.00% 11.80%Hedge Funds / Absolute Return 7.00% 5.81%Real Estate (Property) 12.00% 7.11%
Total 100.00%
Discount Rate – The discount rate used to measure the total pension liability was 7.65%. The plan’s fiduciary net position was projected to be available to make all projected future benefit payments of current active and inactive employees. Therefore, the discount rate for calculating the total pension liability is equal to the long-term expected rate of return. Sensitivity of the University’s Proportionate Share of the Net Position Liability to Changes in the Discount Rate – Table 25 presents the University’s proportionate share of the net pension liability calculated using the discount rate of 7.65%, as well as what the University’s proportionate share of the net pension liability would be if it were calculated using a discount rate that is 1-percentage-point lower (6.65%) or 1-percentage-point higher (8.65%) than the current rate.
Table 25. Sensitivity to Changes in Discount Rate - FRS
Current1% Decrease Discount Rate 1% Increase
6.65% 7.65% 8.65%
University'sProportionateShare of the NetPension Liability 396,308,759$ 92,657,576$ (159,922,269)$
Pension Plan Fiduciary Net Position – Detailed information about pension plan’s fiduciary net position is available in the separately issued FRS Pension Plan and Other State Administered Systems Comprehensive Annual Financial Report. 2. Health Insurance Subsidy Defined Benefit Pension Plan Plan Description – The HIS Pension Plan (HIS Plan) is a cost-sharing multiple-employer defined benefit pension plan established under Section 112.363, Florida Statutes. The benefit is a monthly payment to assist retirees of State-administered retirement systems in paying their health insurance costs and is administered by the Division of Retirement within the Florida Department of Management Services. Benefits Provided – For the fiscal year ended June 30, 2015, eligible retirees and beneficiaries received a monthly HIS payment equal to the number of years of creditable service completed at the time of retirement multiplied by $5. The payments are at least $30 but not more than $150 per month, pursuant to Section 112.363, Florida Statutes. To be eligible to receive a HIS Plan benefit, a retiree under a State-administered retirement system must provide proof of health insurance coverage, which can include Medicare. Contributions – The HIS Plan is funded by required contributions from FRS participating employers as set by the Florida Legislature. Employer contributions are a percentage of gross compensation for all active FRS members. For the fiscal year ended June 30, 2015, the contribution rate was 1.26% of payroll pursuant to Section 112.363, Florida Statues. The University contributed 100% of its statutorily required
2014‐2015 Annual Financial Report
A Component Unit of the State of Florida | 33
contributions for the current and preceding three years. HIS Plan contributions are deposited in a separate trust fund from which HIS payments are authorized. HIS Plan benefits are not guaranteed and are subject to annual legislative appropriation. In the event the legislative appropriation or available funds fail to provide full subsidy benefits to all participants, benefits may be reduced or canceled. The University’s contributions to the HIS Plan totaled $5,578,364 for the fiscal year ended June 30, 2015. Pension Liabilities, Pension Expense, and Deferred Outflows of Resources Related to Pensions – At June 30, 2015, the University reported a liability of $131,969,507 for its proportionate share of the net pension liability. The current portion of the net pension liability is the University’s proportionate share of benefit payments expected to be paid within one year, net of the University’s proportionate share of the pension plan’s fiduciary net position available to pay that amount. The net pension liability was measured as of June 30, 2014, and the total pension liability used to calculate the net pension liability was determined by an actuarial valuation as of July 1, 2014. The University’s proportionate share of the net pension liability was based on the University’s 2013-14 fiscal year contributions relative to the total 2013-14 fiscal year contributions of all participating members. At June 30, 2014, the University’s proportionate share was 1.41%, which was an increase of 0.03% from its proportionate share of 1.38% measured as of June 30, 2013. For the fiscal year ended June 30, 2015, the University recognized pension expense of $9,555,353. In addition, the University reported deferred outflows of resources related to pensions as presented in Table 26.
Table 26. Deferred Outflows Related to Pensions - HIS
DeferredOutflows Recognition
Description of Resources Period
Change of Assumptions 4,695,999$ 7.2 yearsNet Difference Between Projected and
Actual Earnings on Pension PlanInvestments 63,349 5.0 years
Changes in Proportion and DifferenceBetween University Contributions and
Proportionate Share of Contributions 2,425,968 7.2 yearsUniversity HIS Contributions Subsequent
to the Measurement Date 5,578,364 1.0 year
Total 12,763,680$
The deferred outflows of resources totaling $5,578,364 was related to pensions resulting from University contributions subsequent to the measurement date and will be recognized as a reduction of the net pension liability in the fiscal year ending June 30, 2016. Other amounts reported as deferred outflows of resources related to pensions will be recognized in pension expense as showed in Table 27.
Fiscal Year Ending June 30 Amount
2016 1,164,542$ 2017 1,164,542 2018 1,164,542 2019 1,164,542 2020 1,148,704 Thereafter 1,378,444
Total 7,185,316$
Table 27. Recognition of Deferred Outflows Related to Pensions - HIS
Actuarial Assumptions - The total pension liability in the July 1, 2014, actuarial valuation was determined using the following actuarial assumptions applied to all periods included in the measurement, as presented in Table 28.
Table 28. Actuarial Assumptions - HIS
Inflation 2.60%Salary Increases 3.25% , average, including inflationMunicipal Bond Rate 4.29%
Mortality rates were based on the Generational RP-2000 with Projected Scale BB. While an experience study had not been completed for the plan, the Florida Retirement System Actuarial Assumptions Conference reviewed the actuarial assumptions for the plan. Discount Rate – The discount rate used to measure the total pension liability was 4.29%. In general, the discount rate for calculating the total pension liability is equal to the single rate equivalent to discounting at the long-term expected rate of return for benefit payments prior to the projected depletion date. Because the HIS benefit is essentially funded on a pay-as-you-go basis, the depletion date is considered to be immediate, and the single equivalent discount rate is equal to the municipal bond rate selected by the plan sponsor. The Bond Buyer General Obligation 20-Bond Municipal Bond Index was adopted as the applicable municipal bond index. Sensitivity of the University’s Proportionate Share of the Net Pension Liability to Changes in the Discount Rate – Table 29 presents the University’s proportionate share of the net pension liability calculated using the discount rate of 4.29%, as well as what the University’s proportionate share of the net pension liability would be if it were calculated using a discount rate that is 1-percentage-point lower (3.29%) or 1-percentage-point higher (5.29%) than the current rate.
Notes
34 | University of Florida
Table 29. Sensitivity to Changes in Discount Rate - HIS
Current 1% Decrease Discount Rate 1% Increase
3.29% 4.29% 5.29%
University'sProportionateShare of the NetPension Liability 150,104,628$ 131,969,507$ 116,831,871$
Pension Plan Fiduciary Net Position – Detailed information about pension plan’s fiduciary net position is available in the separately issued FRS Pension Plan and Other State Administered Systems Comprehensive Annual Financial Report.
B. DEFINED CONTRIBUTION PENSION PLANS
1. FRS Investment Plan
The State Board of Administration (SBA) administers the defined contribution plan officially titled the FRS Investment Plan (Investment Plan). The Investment Plan is reported in the SBA’s annual financial statements and in the State of Florida Comprehensive Annual Financial Report.
As provided in Section 121.4501, Florida Statutes, eligible FRS members may elect to participate in the Investment Plan in lieu of the FRS defined benefit plan. University employees already participating in the State University System Optional Retirement Program or DROP are not eligible to participate in this program. Employer and employee contributions are defined by law, but the ultimate benefit depends in part on the performance of investment funds. Service retirement benefits are based upon the value of the member’s account upon retirement. Benefit terms, including contribution requirements, are established and may be amended by the Florida Legislature. The Investment Plan is funded with the same employer and employee contributions, that are based on salary and membership class (Regular Class, Senior Management Service Class, etc.), as the FRS defined benefit plan. Contributions are directed to individual member accounts, and the individual members allocate contributions and account balances among various approved investment choices. Costs of administering the plan, including the FRS Financial Guidance Program, are funded through an employer contribution of 0.04% of payroll and by forfeited benefits of plan members. Allocations to the Investment Plan member accounts during the 2014-15 fiscal year are presented in Table 30.
Table 30. Florida Retirement System - Investment Plan Rates
ClassPercent of Gross
Compensation
Florida Retirement System, Regular 6.30%Florida Retirement System, Senior Management Service 7.67%Florida Retirement System, Special Risk 14.00%
For all membership classes, employees are immediately vested in their own contributions and are vested after one year of service for employer contributions and investment earnings regardless of membership class. If an accumulated benefit obligation for service credit originally earned under the FRS Pension Plan is transferred to the FRS Investment Plan, the member must have the years of service required for FRS Pension Plan vesting (including the service credit represented by the transferred funds) to be vested for these funds and the earnings on the funds. Nonvested employer contributions are placed in a suspense account for up to five years. If the employee returns to FRS-covered employment within the five year period, the employee will regain control over his account. If the employee does not return within the five year period, the employee will forfeit the accumulated account balance. For the fiscal year ended June 30, 2015, the information for the amount of forfeitures was unavailable from the SBA; however, management believes these amounts, if any, would be immaterial to the University.
After termination and applying to receive benefits, the member may rollover vested funds to another qualified plan, structure a periodic payment under the Investment Plan, receive a lump-sum distribution, leave the funds invested for future distribution, or select any combination of these options. Disability coverage is provided in which the member may either transfer the account balance to the FRS Pension Plan when approved for disability retirement to receive guaranteed lifetime monthly benefits under the FRS Pension Plan, or remain in the Investment Plan and rely upon that account balance for retirement income.
There were 1,936 University participants during the 2014-15 fiscal year. The University’s Investment Plan pension expense totaled $6,623,159 for the fiscal year ended June 30, 2015.
2. State University System Optional Retirement Program
Section 121.35, Florida Statutes, provides for an Optional Retirement Program (Program) for eligible university instructors and administrators. The Program is designed to aid State universities in recruiting employees by offering more portability to employees not expected to remain in FRS for eight or more years.
The Program is a defined contribution plan, which provides full and immediate vesting of all contributions submitted to the participating companies on behalf of the participant. Employees in eligible positions can make an irrevocable election to participate in the Program, rather than the FRS, and purchase retirement and death benefits through contracts provided by certain insurance carriers. The employing university contributes 5.14% of the participant’s salary to the participant’s account, 2.54% to cover the unfunded actuarial liability of the FRS pension plan, and 0.01% to cover administrative costs. Employees contribute 3% of their salary. Additionally, the employee may contribute, by payroll deduction, an amount not to exceed the percentage contributed by the University to the participant’s annuity account. The contributions are invested in the company or companies selected by the participant to create a fund for the purchase of annuities at retirement.
2014‐2015 Annual Financial Report
A Component Unit of the State of Florida | 35
There were 5,962 University participants during the 2014-15 fiscal year. The University’s contributions to the Program totaled $35,136,871 and employee contributions totaled $24,828,214 for the 2014-15 fiscal year. C. OTHER RETIREMENT PROGRAMS 1. U.S. Civil Service Retirement System Some University employees participate in the U.S. Civil Service Retirement System. Twenty-three employees were covered by the U.S. Civil Service Retirement System during the 2014-15 fiscal year. Employer contributions totaled $150,206, and employee contributions totaled $150,210. The University’s participation in the Federal retirement system is not considered material by University management. 2. Institute of Food and Agricultural Sciences Supplemental Retirement In 1984, the Florida Legislature enacted the Institute of Food and Agricultural Sciences Supplemental Retirement Act to provide a supplement to the monthly retirement benefit being paid under the Federal Civil Service Retirement System to retirees of the Institute of Food and Agricultural Sciences (IFAS) at the University of Florida. The supplement is designated for IFAS cooperative extension employees employed before July 1, 1983, who are not entitled to benefits from either a State-supported retirement system or social security based on their service with IFAS. It was intended to compensate these IFAS employees for the difference between their Civil Service benefit and the benefits an FRS member receives, which include a social security benefit. No additional persons can become eligible for this supplement.
There were 20 University participants during the 2014-15 fiscal year. Required employer contributions made to the program totaled $372,910. Employees do not contribute to this program. 16. CONSTRUCTION COMMITMENTS The University’s construction commitments at June 30, 2015, are presented in Table 31. 17. RISK MANAGEMENT PROGRAMS A. STATE SELF-INSURANCE PROGRAMS The University is exposed to various risks of loss related to torts; damage to, and destruction of assets; errors and omissions; injuries to employees; and natural disasters. Pursuant to Section 1001.72(2), Florida Statutes, the University participates in State self-insurance programs providing insurance for property and casualty, workers’ compensation, general liability, fleet automotive liability, Federal Civil Rights, and employment discrimination liability. During the 2014-15 fiscal year, for property losses, the State retained the first $2 million per
occurrence for all perils except named windstorm and flood. The State retained the first $2 million of losses per occurrence with an annual aggregate retention of $40 million for named windstorm and flood losses. After the annual aggregate retention, losses in excess of $2 million per occurrence were commercially insured up to $54 million for named windstorm and flood losses. For perils other than named windstorm and flood, losses in excess of $2 million per occurrence were commercially insured up to $200 million; and losses exceeding those amounts were retained by the State. No excess insurance coverage is provided for workers’ compensation, general and automotive liability, Federal Civil Rights and employment action coverage; all losses in these categories are completely self-insured by the State through the State Risk Management Trust Fund established pursuant to Chapter 284, Florida Statutes. Payments on tort claims are limited to $200,000 per person, and $300,000 per occurrence as set by Section 768.28(5), Florida Statutes. Calculation of premiums considers the cash needs of the program and the amount of risk exposure for each participant. There have been no significant reductions in insurance coverage from the prior year coverage. Settlements have not exceeded insurance coverage during the past three fiscal years.
Pursuant to Section 110.123, Florida Statutes, University employees may obtain healthcare services through participation in the State’s group health insurance plan or through membership in a health maintenance organization plan under contract with the State. The State’s risk financing activities associated with State group health insurance, such as risk of loss related to medical and prescription drug claims, are administered through the State Employees’ Group Health Insurance Trust Fund. It is the practice of the State not to purchase commercial coverage for the risk of loss covered by this Fund. Additional information on the State’s group health insurance plan, including the actuarial report, is available from the Florida Department of Management Services, Division of State Group Insurance.
B. UNIVERSITY SELF-INSURANCE PROGRAMS The University of Florida Self-Insurance Program (Program) and the University of Florida Healthcare Education Insurance Company (HEIC), which are included in the University’s reporting entity as discretely presented component units (see Notes 1, 2, and 3), provide general and professional liability protection for the University of Florida Board of Trustees (UFBOT) on behalf of the six health colleges of the JHMHC, the College of Veterinary Medicine teaching hospitals, the Student Health Care Center, its direct-support organization, and their employees and agents. Hospital professional liability protection, including general liability, is provided to Shands Teaching Hospital and Clinics, Inc., Shands Jacksonville Medical Center, Inc. (a subsidiary of Shands Jacksonville HealthCare, Inc. - Shands Jacksonville), other entities statutorily authorized to participate in the Program, and their employees and agents.
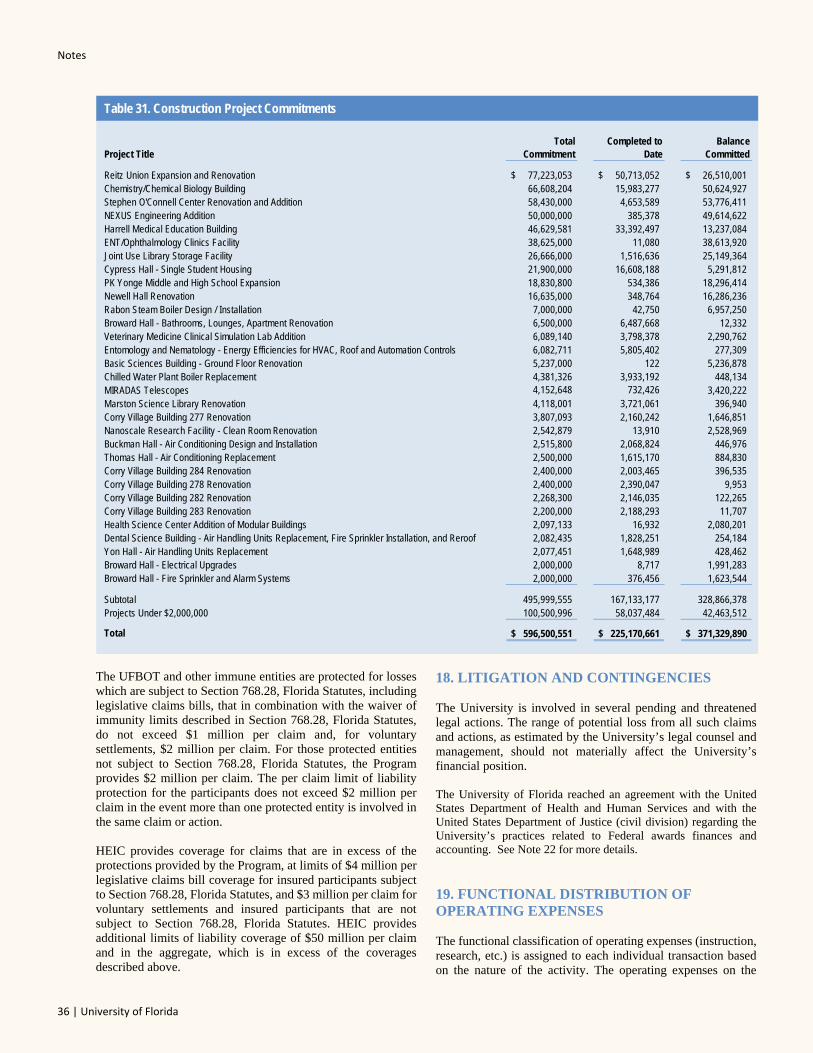
Notes
36 | University of Florida
Total Commitment
Completed to Date
Balance Committed
77,223,053$ 50,713,052$ 26,510,001$ 66,608,204 15,983,277 50,624,92758,430,000 4,653,589 53,776,41150,000,000 385,378 49,614,62246,629,581 33,392,497 13,237,08438,625,000 11,080 38,613,92026,666,000 1,516,636 25,149,36421,900,000 16,608,188 5,291,81218,830,800 534,386 18,296,41416,635,000 348,764 16,286,236
7,000,000 42,750 6,957,2506,500,000 6,487,668 12,3326,089,140 3,798,378 2,290,7626,082,711 5,805,402 277,3095,237,000 122 5,236,8784,381,326 3,933,192 448,1344,152,648 732,426 3,420,2224,118,001 3,721,061 396,9403,807,093 2,160,242 1,646,8512,542,879 13,910 2,528,9692,515,800 2,068,824 446,976
Table 31. Construction Project Commitments
Project Title
Reitz Union Expansion and RenovationChemistry/Chemical Biology BuildingStephen O'Connell Center Renovation and AdditionNEXUS Engineering AdditionHarrell Medical Education BuildingENT/Ophthalmology Clinics FacilityJoint Use Library Storage FacilityCypress Hall - Single Student HousingPK Yonge Middle and High School ExpansionNewell Hall RenovationRabon Steam Boiler Design / InstallationBroward Hall - Bathrooms, Lounges, Apartment RenovationVeterinary Medicine Clinical Simulation Lab AdditionEntomology and Nematology - Energy Efficiencies for HVAC, Roof and Automation Controls Basic Sciences Building - Ground Floor RenovationChilled Water Plant Boiler ReplacementMIRADAS TelescopesMarston Science Library RenovationCorry Village Building 277 RenovationNanoscale Research Facility - Clean Room RenovationBuckman Hall - Air Conditioning Design and InstallationThomas Hall - Air Conditioning Replacement 2,500,000 1,615,170 884,830Corry Village Building 284 Renovation 2,400,000 2,003,465 396,535Corry Village Building 278 Renovation 2,400,000 2,390,047 9,953Corry Village Building 282 Renovation 2,268,300 2,146,035 122,265Corry Village Building 283 Renovation 2,200,000 2,188,293 11,707Health Science Center Addition of Modular Buildings 2,097,133 16,932 2,080,201Dental Science Building - Air Handling Units Replacement, Fire Sprinkler Installation, and Reroof 2,082,435 1,828,251 254,184Yon Hall - Air Handling Units Replacement 2,077,451 1,648,989 428,462Broward Hall - Electrical Upgrades 2,000,000 8,717 1,991,283Broward Hall - Fire Sprinkler and Alarm Systems 2,000,000 376,456 1,623,544
Subtotal 495,999,555 167,133,177 328,866,378 Projects Under $2,000,000 100,500,996 58,037,484 42,463,512
Total 596,500,551$ 225,170,661$ 371,329,890$
The UFBOT and other immune entities are protected for losses which are subject to Section 768.28, Florida Statutes, including legislative claims bills, that in combination with the waiver of immunity limits described in Section 768.28, Florida Statutes, do not exceed $1 million per claim and, for voluntary settlements, $2 million per claim. For those protected entities not subject to Section 768.28, Florida Statutes, the Program provides $2 million per claim. The per claim limit of liability protection for the participants does not exceed $2 million per claim in the event more than one protected entity is involved in the same claim or action.
HEIC provides coverage for claims that are in excess of the protections provided by the Program, at limits of $4 million per legislative claims bill coverage for insured participants subject to Section 768.28, Florida Statutes, and $3 million per claim for voluntary settlements and insured participants that are not subject to Section 768.28, Florida Statutes. HEIC provides additional limits of liability coverage of $50 million per claim and in the aggregate, which is in excess of the coverages described above.
18. LITIGATION AND CONTINGENCIES
The University is involved in several pending and threatened legal actions. The range of potential loss from all such claims and actions, as estimated by the University’s legal counsel and management, should not materially affect the University’s financial position.
The University of Florida reached an agreement with the United States Department of Health and Human Services and with the United States Department of Justice (civil division) regarding the University’s practices related to Federal awards finances and accounting. See Note 22 for more details.
19. FUNCTIONAL DISTRIBUTION OFOPERATING EXPENSES
The functional classification of operating expenses (instruction, research, etc.) is assigned to each individual transaction based on the nature of the activity. The operating expenses on the
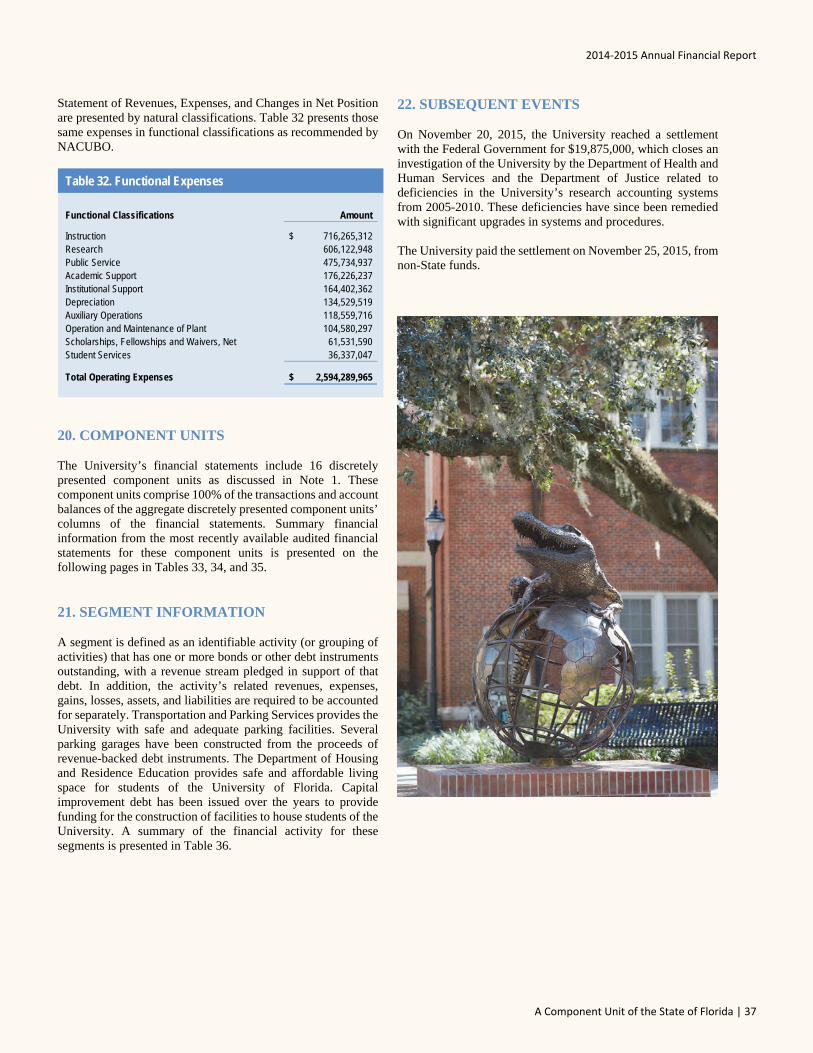
2014‐2015 Annual Financial Report
A Component Unit of the State of Florida | 37
Statement of Revenues, Expenses, and Changes in Net Position are presented by natural classifications. Table 32 presents those same expenses in functional classifications as recommended by NACUBO.
Table 32. Functional Expenses
Functional Classifications Amount
Instruction 716,265,312$ Research 606,122,948 Public Service 475,734,937 Academic Support 176,226,237 Institutional Support 164,402,362 Depreciation 134,529,519 Auxiliary Operations 118,559,716 Operation and Maintenance of Plant 104,580,297 Scholarships, Fellowships and Waivers, Net 61,531,590 Student Services 36,337,047
Total Operating Expenses 2,594,289,965$
20. COMPONENT UNITS
The University’s financial statements include 16 discretely presented component units as discussed in Note 1. These component units comprise 100% of the transactions and account balances of the aggregate discretely presented component units’ columns of the financial statements. Summary financial information from the most recently available audited financial statements for these component units is presented on the following pages in Tables 33, 34, and 35.
21. SEGMENT INFORMATION
A segment is defined as an identifiable activity (or grouping of activities) that has one or more bonds or other debt instruments outstanding, with a revenue stream pledged in support of that debt. In addition, the activity’s related revenues, expenses, gains, losses, assets, and liabilities are required to be accounted for separately. Transportation and Parking Services provides the University with safe and adequate parking facilities. Several parking garages have been constructed from the proceeds of revenue-backed debt instruments. The Department of Housing and Residence Education provides safe and affordable living space for students of the University of Florida. Capital improvement debt has been issued over the years to provide funding for the construction of facilities to house students of the University. A summary of the financial activity for these segments is presented in Table 36.
22. SUBSEQUENT EVENTS
On November 20, 2015, the University reached a settlement with the Federal Government for $19,875,000, which closes an investigation of the University by the Department of Health and Human Services and the Department of Justice related to deficiencies in the University’s research accounting systems from 2005-2010. These deficiencies have since been remedied with significant upgrades in systems and procedures.
The University paid the settlement on November 25, 2015, from non-State funds.
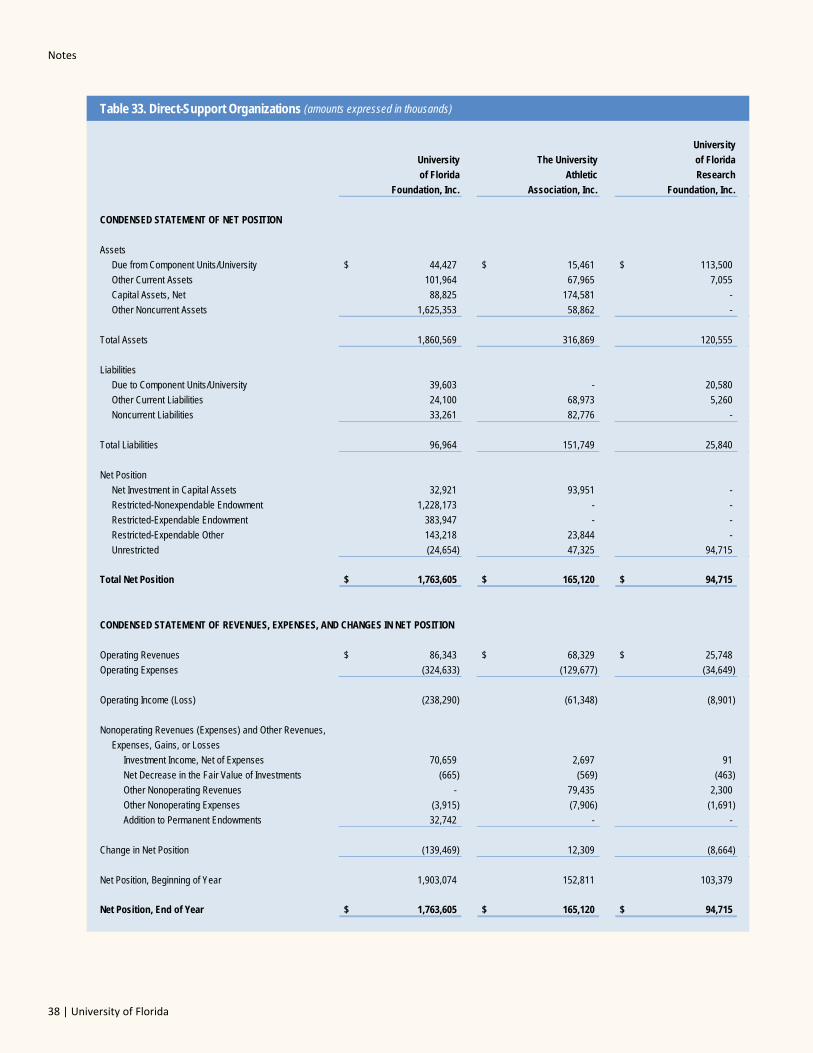
Notes
38 | University of Florida
Table 33. Direct-Support Organizations (amounts expressed in thousands)
University
University The University of Florida
of Florida Athletic Research
Foundation, Inc. Association, Inc. Foundation, Inc.
CONDENSED STATEMENT OF NET POSITION
Assets
Due from Component Units/University 44,427$ 15,461$ 113,500$
Other Current Assets 101,964 67,965 7,055
Capital Assets, Net 88,825 174,581 -
Other Noncurrent Assets 1,625,353 58,862 -
Total Assets 1,860,569 316,869 120,555
Liabilities
Due to Component Units/University 39,603 - 20,580
Other Current Liabilities 24,100 68,973 5,260
Noncurrent Liabilities 33,261 82,776 -
Total Liabilities 96,964 151,749 25,840
Net Position
Net Investment in Capital Assets 32,921 93,951 -
Restricted-Nonexpendable Endowment 1,228,173 - -
Restricted-Expendable Endowment 383,947 - -
Restricted-Expendable Other 143,218 23,844 -
Unrestricted (24,654) 47,325 94,715
Total Net Position 1,763,605$ 165,120$ 94,715$
CONDENSED STATEMENT OF REVENUES, EXPENSES, AND CHANGES IN NET POSITION
Operating Revenues 86,343$ 68,329$ 25,748$
Operating Expenses (324,633) (129,677) (34,649)
Operating Income (Loss) (238,290) (61,348) (8,901)
Nonoperating Revenues (Expenses) and Other Revenues,
Expenses, Gains, or Losses
Investment Income, Net of Expenses 70,659 2,697 91
Net Decrease in the Fair Value of Investments (665) (569) (463)
Other Nonoperating Revenues - 79,435 2,300
Other Nonoperating Expenses (3,915) (7,906) (1,691)
Addition to Permanent Endowments 32,742 - -
Change in Net Position (139,469) 12,309 (8,664)
Net Position, Beginning of Year 1,903,074 152,811 103,379
Net Position, End of Year 1,763,605$ 165,120$ 94,715$
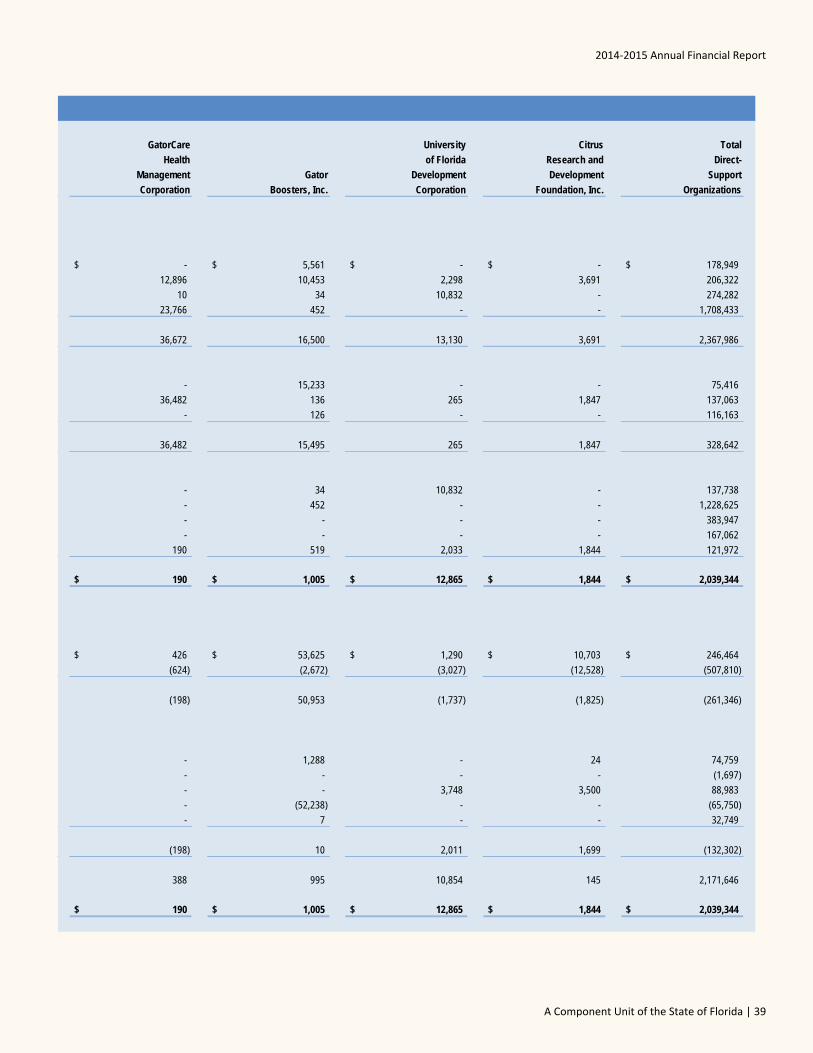
2014‐2015 Annual Financial Report
A Component Unit of the State of Florida | 39
GatorCare University Citrus Total
Health of Florida Research and Direct-
Management Gator Development Development Support
Corporation Boosters, Inc. Corporation Foundation, Inc. Organizations
-$ 5,561$ -$ -$ 178,949$
12,896 10,453 2,298 3,691 206,322
10 34 10,832 - 274,282
23,766 452 - - 1,708,433
36,672 16,500 13,130 3,691 2,367,986
- 15,233 - - 75,416
36,482 136 265 1,847 137,063
- 126 - - 116,163
36,482 15,495 265 1,847 328,642
- 34 10,832 - 137,738
- 452 - - 1,228,625
- - - - 383,947
- - - - 167,062
190 519 2,033 1,844 121,972
190$ 1,005$ 12,865$ 1,844$ 2,039,344$
426$ 53,625$ 1,290$ 10,703$ 246,464$
(624) (2,672) (3,027) (12,528) (507,810)
(198) 50,953 (1,737) (1,825) (261,346)
- 1,288 - 24 74,759
- - - - (1,697)
- - 3,748 3,500 88,983
- (52,238) - - (65,750)
- 7 - - 32,749
(198) 10 2,011 1,699 (132,302)
388 995 10,854 145 2,171,646
190$ 1,005$ 12,865$ 1,844$ 2,039,344$
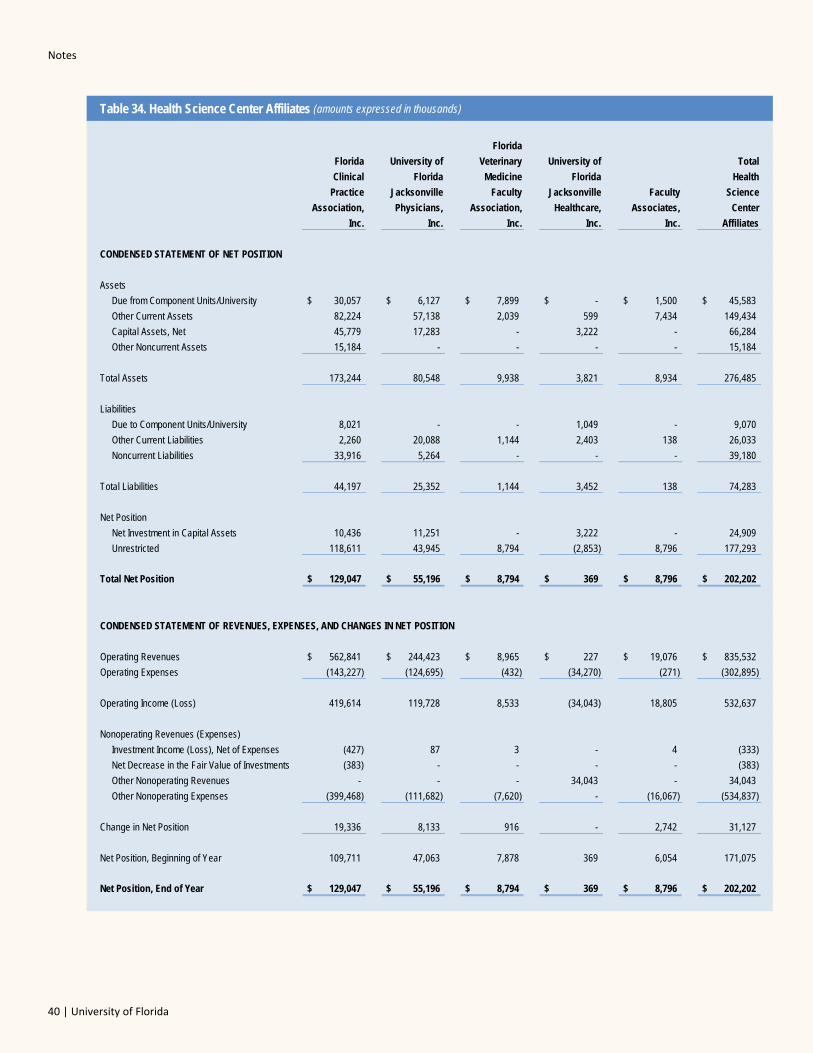
Notes
40 | University of Florida
Table 34. Health Science Center Affiliates (amounts expressed in thousands)
Florida
Florida University of Veterinary University of Total
Clinical Florida Medicine Florida Health
Practice Jacksonville Faculty Jacksonville Faculty Science
Association, Physicians, Association, Healthcare, Associates, Center
Inc. Inc. Inc. Inc. Inc. Affiliates
CONDENSED STATEMENT OF NET POSITION
Assets
Due from Component Units/University 30,057$ 6,127$ 7,899$ -$ 1,500$ 45,583$
Other Current Assets 82,224 57,138 2,039 599 7,434 149,434
Capital Assets, Net 45,779 17,283 - 3,222 - 66,284
Other Noncurrent Assets 15,184 - - - - 15,184
Total Assets 173,244 80,548 9,938 3,821 8,934 276,485
Liabilities
Due to Component Units/University 8,021 - - 1,049 - 9,070
Other Current Liabilities 2,260 20,088 1,144 2,403 138 26,033
Noncurrent Liabilities 33,916 5,264 - - - 39,180
Total Liabilities 44,197 25,352 1,144 3,452 138 74,283
Net Position
Net Investment in Capital Assets 10,436 11,251 - 3,222 - 24,909
Unrestricted 118,611 43,945 8,794 (2,853) 8,796 177,293
Total Net Position 129,047$ 55,196$ 8,794$ 369$ 8,796$ 202,202$
CONDENSED STATEMENT OF REVENUES, EXPENSES, AND CHANGES IN NET POSITION
Operating Revenues 562,841$ 244,423$ 8,965$ 227$ 19,076$ 835,532$
Operating Expenses (143,227) (124,695) (432) (34,270) (271) (302,895)
Operating Income (Loss) 419,614 119,728 8,533 (34,043) 18,805 532,637
Nonoperating Revenues (Expenses)
Investment Income (Loss), Net of Expenses (427) 87 3 - 4 (333)
Net Decrease in the Fair Value of Investments (383) - - - - (383)
Other Nonoperating Revenues - - - 34,043 - 34,043
Other Nonoperating Expenses (399,468) (111,682) (7,620) - (16,067) (534,837)
Change in Net Position 19,336 8,133 916 - 2,742 31,127
Net Position, Beginning of Year 109,711 47,063 7,878 369 6,054 171,075
Net Position, End of Year 129,047$ 55,196$ 8,794$ 369$ 8,796$ 202,202$
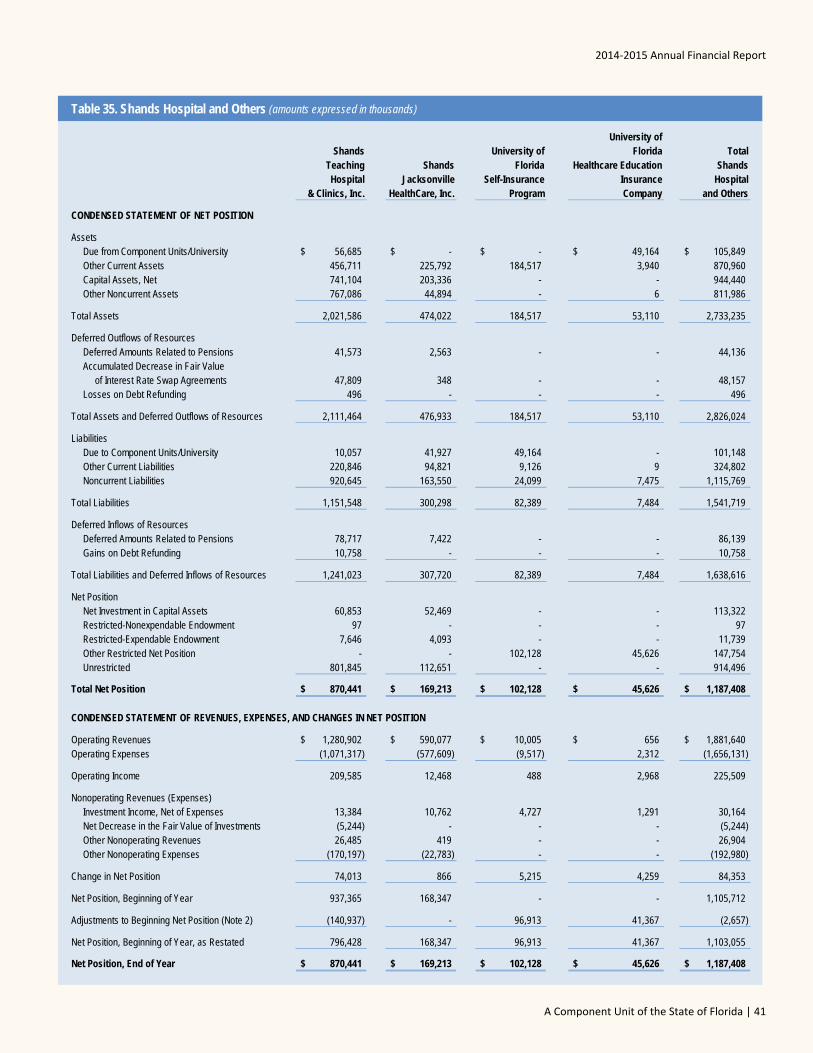
2014‐2015 Annual Financial Report
A Component Unit of the State of Florida | 41
Table 35. Shands Hospital and Others (amounts expressed in thousands)
University ofShands University of Florida Total
Teaching Shands Florida Healthcare Education ShandsHospital Jacksonville Self-Insurance Insurance Hospital
& Clinics, Inc. HealthCare, Inc. Program Company and Others
CONDENSED STATEMENT OF NET POSITION
AssetsDue from Component Units/University 56,685$ -$ -$ 49,164$ 105,849$ Other Current Assets 456,711 225,792 184,517 3,940 870,960 Capital Assets, Net 741,104 203,336 - - 944,440 Other Noncurrent Assets 767,086 44,894 - 6 811,986
Total Assets 2,021,586 474,022 184,517 53,110 2,733,235
Deferred Outflows of ResourcesDeferred Amounts Related to Pensions 41,573 2,563 - - 44,136 Accumulated Decrease in Fair Value
of Interest Rate Swap Agreements 47,809 348 - - 48,157 Losses on Debt Refunding 496 - - - 496
Total Assets and Deferred Outflows of Resources 2,111,464 476,933 184,517 53,110 2,826,024
LiabilitiesDue to Component Units/University 10,057 41,927 49,164 - 101,148 Other Current Liabilities 220,846 94,821 9,126 9 324,802 Noncurrent Liabilities 920,645 163,550 24,099 7,475 1,115,769
Total Liabilities 1,151,548 300,298 82,389 7,484 1,541,719
Deferred Inflows of ResourcesDeferred Amounts Related to Pensions 78,717 7,422 - - 86,139 Gains on Debt Refunding 10,758 - - - 10,758
Total Liabilities and Deferred Inflows of Resources 1,241,023 307,720 82,389 7,484 1,638,616
Net PositionNet Investment in Capital Assets 60,853 52,469 - - 113,322 Restricted-Nonexpendable Endowment 97 - - - 97 Restricted-Expendable Endowment 7,646 4,093 - - 11,739 Other Restricted Net Position - - 102,128 45,626 147,754 Unrestricted 801,845 112,651 - - 914,496
Total Net Position 870,441$ 169,213$ 102,128$ 45,626$ 1,187,408$
CONDENSED STATEMENT OF REVENUES, EXPENSES, AND CHANGES IN NET POSITION
Operating Revenues 1,280,902$ 590,077$ 10,005$ 656$ 1,881,640$ Operating Expenses (1,071,317) (577,609) (9,517) 2,312 (1,656,131)
Operating Income 209,585 12,468 488 2,968 225,509
Nonoperating Revenues (Expenses)Investment Income, Net of Expenses 13,384 10,762 4,727 1,291 30,164 Net Decrease in the Fair Value of Investments (5,244) - - - (5,244) Other Nonoperating Revenues 26,485 419 - - 26,904 Other Nonoperating Expenses (170,197) (22,783) - - (192,980)
Change in Net Position 74,013 866 5,215 4,259 84,353
Net Position, Beginning of Year 937,365 168,347 - - 1,105,712
Adjustments to Beginning Net Position (Note 2) (140,937) - 96,913 41,367 (2,657)
Net Position, Beginning of Year, as Restated 796,428 168,347 96,913 41,367 1,103,055
Net Position, End of Year 870,441$ 169,213$ 102,128$ 45,626$ 1,187,408$
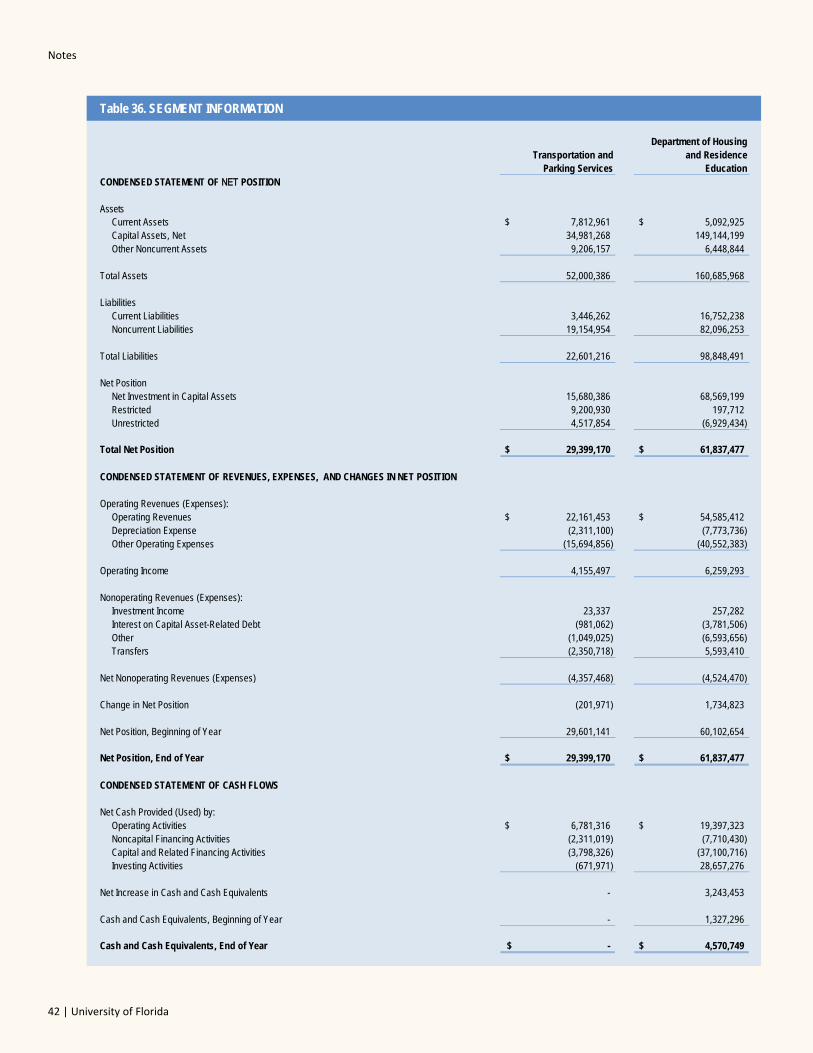
Notes
42 | University of Florida
Table 36. SEGMENT INFORMATION
Department of Housing Transportation and and Residence
Parking Services Education CONDENSED STATEMENT OF NET POSITION
AssetsCurrent Assets 7,812,961$ 5,092,925$ Capital Assets, Net 34,981,268 149,144,199 Other Noncurrent Assets 9,206,157 6,448,844
Total Assets 52,000,386 160,685,968
LiabilitiesCurrent Liabilities 3,446,262 16,752,238 Noncurrent Liabilities 19,154,954 82,096,253
Total Liabilities 22,601,216 98,848,491
Net PositionNet Investment in Capital Assets 15,680,386 68,569,199 Restricted 9,200,930 197,712 Unrestricted 4,517,854 (6,929,434)
Total Net Position 29,399,170$ 61,837,477$
CONDENSED STATEMENT OF REVENUES, EXPENSES, AND CHANGES IN NET POSITION
Operating Revenues (Expenses):Operating Revenues 22,161,453$ 54,585,412$ Depreciation Expense (2,311,100) (7,773,736) Other Operating Expenses (15,694,856) (40,552,383)
Operating Income 4,155,497 6,259,293
Nonoperating Revenues (Expenses):Investment Income 23,337 257,282 Interest on Capital Asset-Related Debt (981,062) (3,781,506) Other (1,049,025) (6,593,656) Transfers (2,350,718) 5,593,410
Net Nonoperating Revenues (Expenses) (4,357,468) (4,524,470)
Change in Net Position (201,971) 1,734,823
Net Position, Beginning of Year 29,601,141 60,102,654
Net Position, End of Year 29,399,170$ 61,837,477$
CONDENSED STATEMENT OF CASH FLOWS
Net Cash Provided (Used) by:Operating Activities 6,781,316$ 19,397,323$ Noncapital Financing Activities (2,311,019) (7,710,430) Capital and Related Financing Activities (3,798,326) (37,100,716) Investing Activities (671,971) 28,657,276
Net Increase in Cash and Cash Equivalents - 3,243,453
Cash and Cash Equivalents, Beginning of Year - 1,327,296
Cash and Cash Equivalents, End of Year -$ 4,570,749$
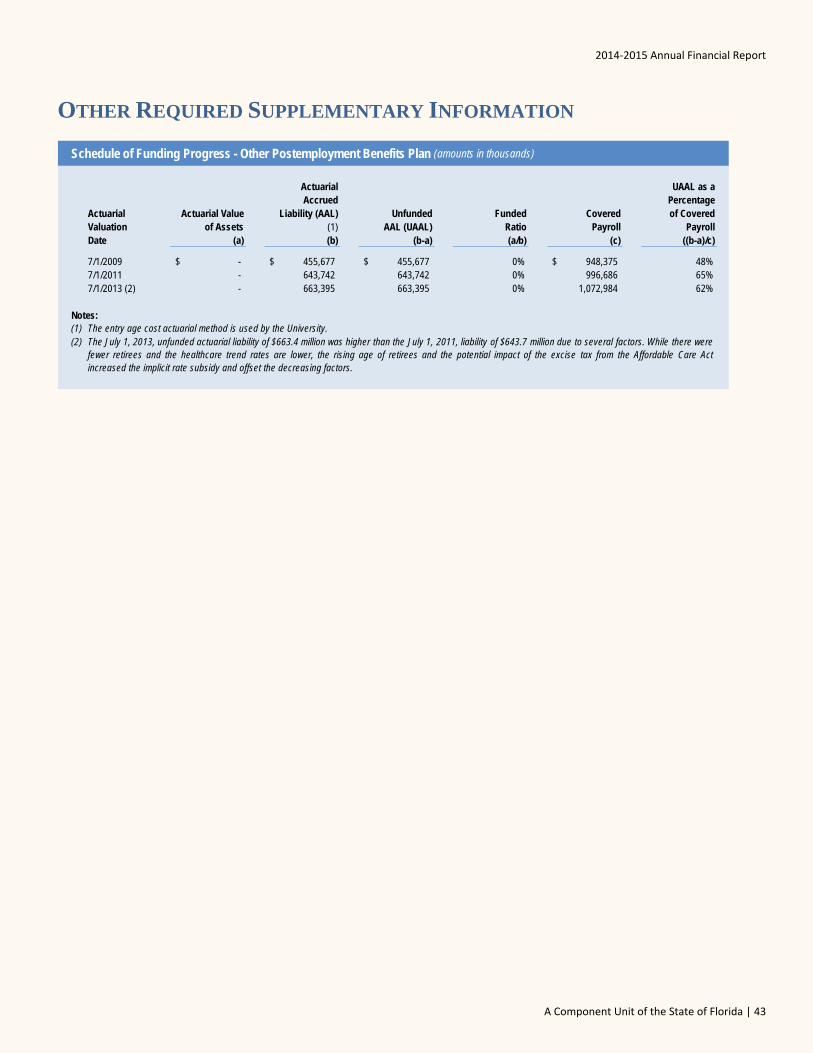
2014‐2015 Annual Financial Report
A Component Unit of the State of Florida | 43
OTHER REQUIRED SUPPLEMENTARY INFORMATION
Schedule of Funding Progress - Other Postemployment Benefits Plan (amounts in thousands)
Actuarial UAAL as a Accrued Percentage
Actuarial Actuarial Value Liability (AAL) Unfunded Funded Covered of CoveredValuation of Assets (1) AAL (UAAL) Ratio Payroll PayrollDate (a) (b) (b-a) (a/b) (c) ((b-a)/c)
7/1/2009 -$ 455,677$ 455,677$ 0% 948,375$ 48%7/1/2011 - 643,742 643,742 0% 996,686 65%7/1/2013 (2) - 663,395 663,395 0% 1,072,984 62%
Notes:(1) The entry age cost actuarial method is used by the University.(2) The July 1, 2013, unfunded actuarial liability of $663.4 million was higher than the July 1, 2011, liability of $643.7 million due to several factors. While there were
fewer retirees and the healthcare trend rates are lower, the rising age of retirees and the potential impact of the excise tax from the Affordable Care Actincreased the implicit rate subsidy and offset the decreasing factors.
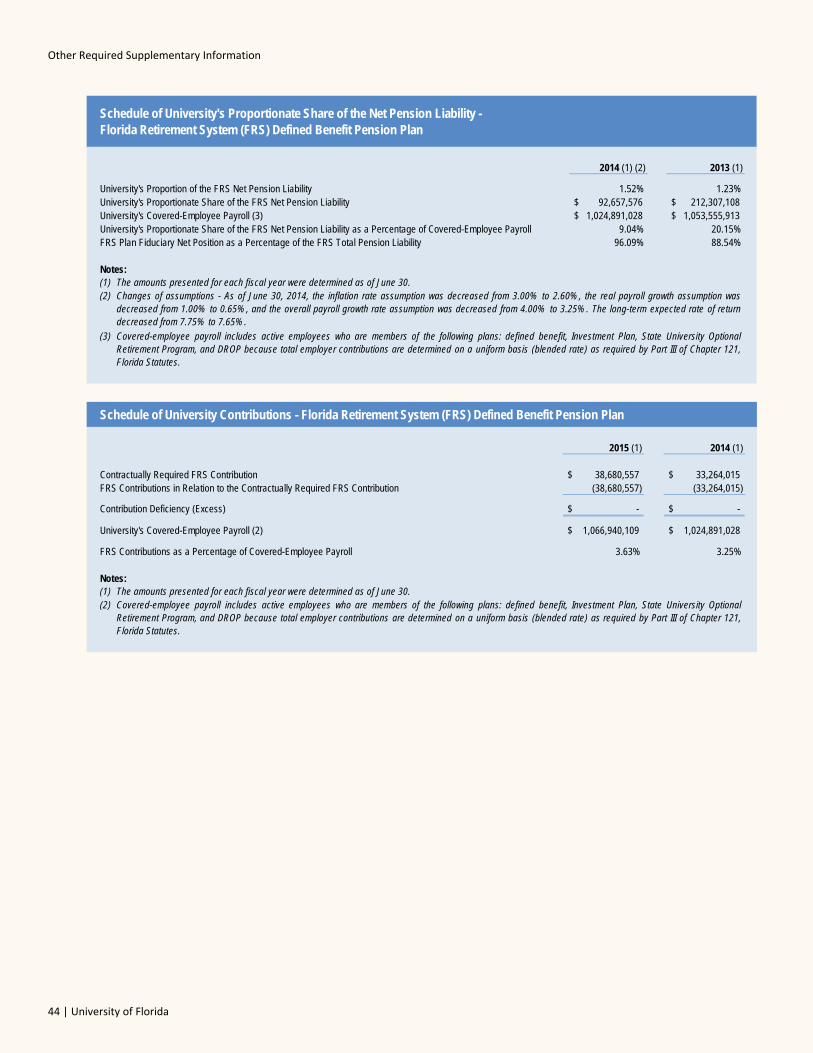
Other Required Supplementary Information
44 | University of Florida
2014 (1) (2) 2013 (1)
University's Proportion of the FRS Net Pension Liability 1.52% 1.23%University's Proportionate Share of the FRS Net Pension Liability 92,657,576$ 212,307,108$ University's Covered-Employee Payroll (3) 1,024,891,028$ 1,053,555,913$ University's Proportionate Share of the FRS Net Pension Liability as a Percentage of Covered-Employee Payroll 9.04% 20.15%FRS Plan Fiduciary Net Position as a Percentage of the FRS Total Pension Liability 96.09% 88.54%
Notes:(1) The amounts presented for each fiscal year were determined as of June 30.(2)
(3)
Schedule of University's Proportionate Share of the Net Pension Liability -Florida Retirement System (FRS) Defined Benefit Pension Plan
Covered-employee payroll includes active employees who are members of the following plans: defined benefit, Investment Plan, State University OptionalRetirement Program, and DROP because total employer contributions are determined on a uniform basis (blended rate) as required by Part III of Chapter 121,Florida Statutes.
Changes of assumptions - As of June 30, 2014, the inflation rate assumption was decreased from 3.00% to 2.60% , the real payroll growth assumption wasdecreased from 1.00% to 0.65% , and the overall payroll growth rate assumption was decreased from 4.00% to 3.25% . The long-term expected rate of returndecreased from 7.75% to 7.65% .
Schedule of University Contributions - Florida Retirement System (FRS) Defined Benefit Pension Plan
2015 (1) 2014 (1)
Contractually Required FRS Contribution 38,680,557$ 33,264,015$ FRS Contributions in Relation to the Contractually Required FRS Contribution (38,680,557) (33,264,015)
Contribution Deficiency (Excess) -$ -$
University's Covered-Employee Payroll (2) 1,066,940,109$ 1,024,891,028$
FRS Contributions as a Percentage of Covered-Employee Payroll 3.63% 3.25%
Notes:(1) The amounts presented for each fiscal year were determined as of June 30.(2) Covered-employee payroll includes active employees who are members of the following plans: defined benefit, Investment Plan, State University Optional
Retirement Program, and DROP because total employer contributions are determined on a uniform basis (blended rate) as required by Part III of Chapter 121,Florida Statutes.
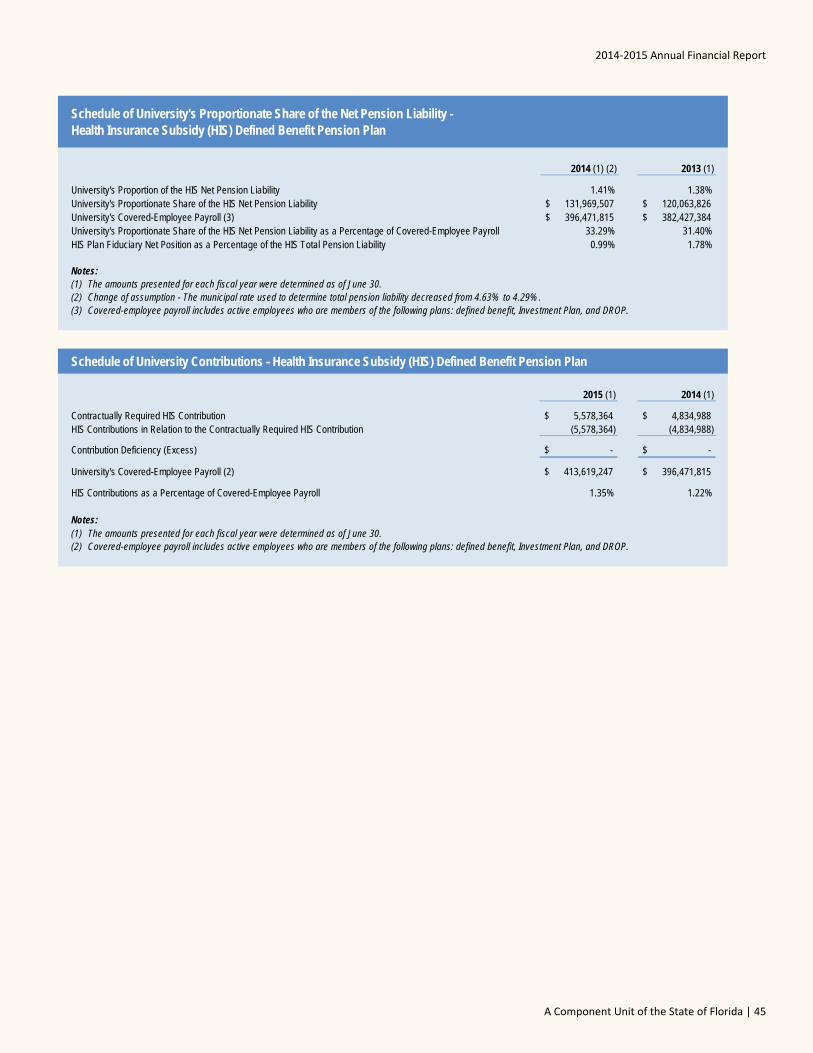
2014‐2015 Annual Financial Report
A Component Unit of the State of Florida | 45
2014 (1) (2) 2013 (1)
University's Proportion of the HIS Net Pension Liability 1.41% 1.38%University's Proportionate Share of the HIS Net Pension Liability 131,969,507$ 120,063,826$ University's Covered-Employee Payroll (3) 396,471,815$ 382,427,384$ University's Proportionate Share of the HIS Net Pension Liability as a Percentage of Covered-Employee Payroll 33.29% 31.40%HIS Plan Fiduciary Net Position as a Percentage of the HIS Total Pension Liability 0.99% 1.78%
Notes:(1) The amounts presented for each fiscal year were determined as of June 30.(2) Change of assumption - The municipal rate used to determine total pension liability decreased from 4.63% to 4.29% .(3) Covered-employee payroll includes active employees who are members of the following plans: defined benefit, Investment Plan, and DROP.
Schedule of University's Proportionate Share of the Net Pension Liability - Health Insurance Subsidy (HIS) Defined Benefit Pension Plan
2015 (1) 2014 (1)
Contractually Required HIS Contribution 5,578,364$ 4,834,988$ HIS Contributions in Relation to the Contractually Required HIS Contribution (5,578,364) (4,834,988)
Contribution Deficiency (Excess) -$ -$
University's Covered-Employee Payroll (2) 413,619,247$ 396,471,815$
HIS Contributions as a Percentage of Covered-Employee Payroll 1.35% 1.22%
Notes:(1) The amounts presented for each fiscal year were determined as of June 30.(2) Covered-employee payroll includes active employees who are members of the following plans: defined benefit, Investment Plan, and DROP.
Schedule of University Contributions - Health Insurance Subsidy (HIS) Defined Benefit Pension Plan
46 | University of Florida
Phone: (850) 412-2722Fax: (850) 488-6975
Sherrill F. Norman, CPA Auditor General
AUDITOR GENERAL STATE OF FLORIDA
Claude Denson Pepper Building, Suite G74 111 West Madison Street
Tallahassee, Florida 32399-1450
The President of the Senate, the Speaker of the House of Representatives, and the Legislative Auditing Committee
INDEPENDENT AUDITOR’S REPORT ON INTERNAL CONTROL OVER
FINANCIAL REPORTING AND ON COMPLIANCE AND OTHER MATTERS
BASED ON AN AUDIT OF FINANCIAL STATEMENTS PERFORMED
IN ACCORDANCE WITH GOVERNMENT AUDITING STANDARDS
We have audited, in accordance with the auditing standards generally accepted in the United States of America and the standards
applicable to financial audits contained in Government Auditing Standards issued by the Comptroller General of the United States, the
financial statements of the University of Florida, a component unit of the State of Florida, and its aggregate discretely presented
component units as of and for the fiscal year ended June 30, 2015, and the related notes to the financial statements, which collectively
comprise the University’s basic financial statements, and have issued our report thereon dated February 17, 2016, included under the
heading INDEPENDENT AUDITOR’S REPORT. Our report includes a reference to other auditors who audited the financial statements
of the aggregate discretely presented component units, as described in our report on the University’s financial statements. This report
does not include the results of the other auditors’ testing of internal control over financial reporting or compliance and other matters that
are reported on separately by those auditors.
Internal Control Over Financial Reporting
In planning and performing our audit of the financial statements, we considered the University’s internal control over financial reporting
(internal control) to determine audit procedures that are appropriate in the circumstances for the purpose of expressing our opinions on
the financial statements, but not for the purpose of expressing an opinion on the effectiveness of the University’s internal control.
Accordingly, we do not express an opinion on the effectiveness of the University’s internal control.
A deficiency in internal control exists when the design or operation of a control does not allow management or employees, in the normal
course of performing their assigned functions, to prevent, or detect and correct, misstatements on a timely basis. A material weakness
is a deficiency, or a combination of deficiencies, in internal control such that there is a reasonable possibility that a material misstatement
of the University’s financial statements will not be prevented, or detected and corrected on a timely basis. A significant deficiency is a
deficiency, or a combination of deficiencies, in internal control that is less severe than a material weakness, yet important enough to
merit attention by those charged with governance.
Our consideration of internal control was for the limited purpose described in the first paragraph of this section and was not designed to
identify all deficiencies in internal control that might be material weaknesses or significant deficiencies. Given these limitations, during
our audit we did not identify any deficiencies in internal control that we consider to be material weaknesses. However, material
weaknesses may exist that have not been identified.
Compliance and Other Matters
As part of obtaining reasonable assurance about whether the University’s financial statements are free from material misstatement, we
performed tests of its compliance with certain provisions of laws, rules, regulations, contracts, and grant agreements, noncompliance
with which could have a direct and material effect on the determination of financial statement amounts. However, providing an opinion
on compliance with those provisions was not an objective of our audit and, accordingly, we do not express such an opinion. The results
of our tests disclosed no instances of noncompliance or other matters that are required to be reported under Government Auditing
Standards.
We noted certain matters that we reported to University management in our operational audit report No. 2016-058.
2014‐2015 Annual Financial Report
A Component Unit of the State of Florida | 47
Purpose of this Report
The purpose of the INDEPENDENT AUDITOR’S REPORT ON INTERNAL CONTROL OVER FINANCIAL REPORTING AND ON
COMPLIANCE AND OTHER MATTERS BASED ON AN AUDIT OF FINANCIAL STATEMENTS PERFORMED IN ACCORDANCE
WITH GOVERNMENT AUDITING STANDARDS is solely to describe the scope of our testing of internal control and compliance and
the results of that testing, and not to provide an opinion on the effectiveness of the University’s internal control or on compliance. This
report is an integral part of an audit performed in accordance with Government Auditing Standards in considering the University’s internal
control and compliance. Accordingly, this report is not suitable for any other purpose.
Respectfully submitted,
Sherrill F. Norman, CPA Tallahassee, Florida February 17, 2016 Audit Report No. 2016-098
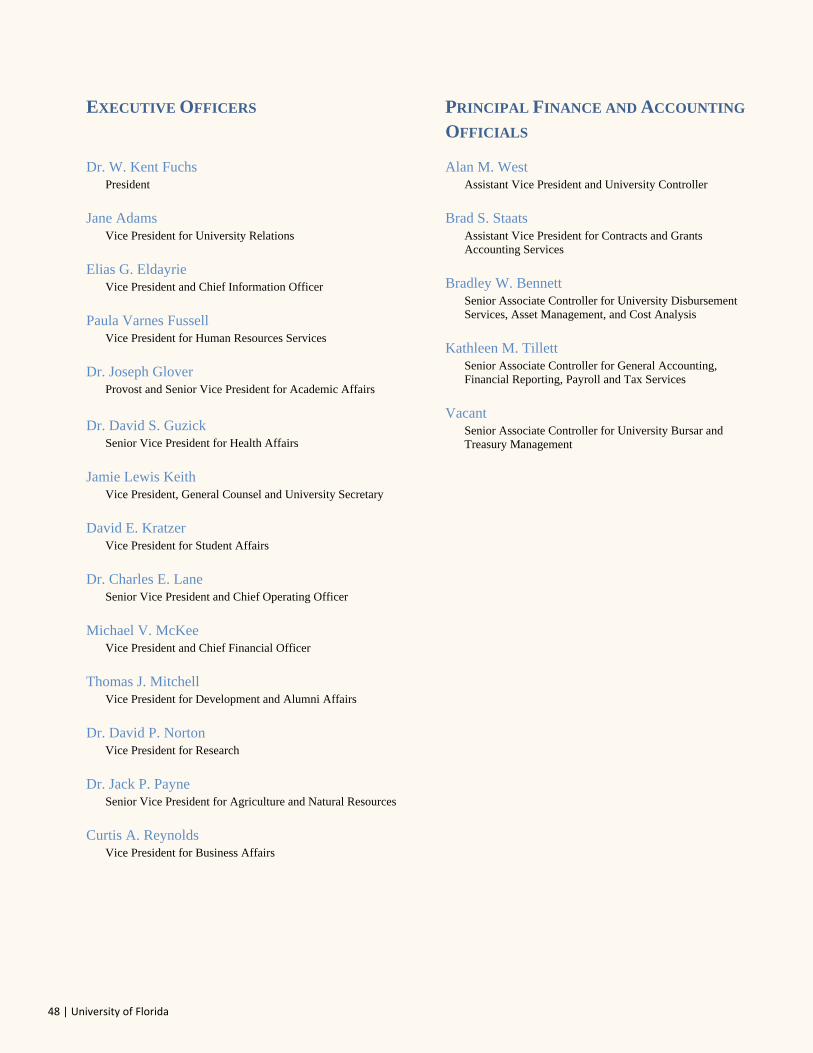
48 | University of Florida
EXECUTIVE OFFICERS PRINCIPAL FINANCE AND ACCOUNTING
OFFICIALS
Dr. W. Kent Fuchs President
Jane Adams
Vice President for University Relations
Elias G. Eldayrie
Vice President and Chief Information Officer
Paula Varnes Fussell
Vice President for Human Resources Services
Dr. Joseph Glover
Provost and Senior Vice President for Academic Affairs
Dr. David S. Guzick Senior Vice President for Health Affairs
Jamie Lewis Keith
Vice President, General Counsel and University Secretary
David E. Kratzer
Vice President for Student Affairs
Dr. Charles E. Lane
Senior Vice President and Chief Operating Officer
Michael V. McKee
Vice President and Chief Financial Officer
Thomas J. Mitchell
Vice President for Development and Alumni Affairs
Dr. David P. Norton
Vice President for Research
Dr. Jack P. Payne
Senior Vice President for Agriculture and Natural Resources
Curtis A. Reynolds
Vice President for Business Affairs
Alan M. West Assistant Vice President and University Controller
Brad S. Staats
Assistant Vice President for Contracts and Grants Accounting Services
Bradley W. Bennett
Senior Associate Controller for University Disbursement Services, Asset Management, and Cost Analysis
Kathleen M. Tillett
Senior Associate Controller for General Accounting, Financial Reporting, Payroll and Tax Services
Vacant
Senior Associate Controller for University Bursar and Treasury Management

Dr. Steven M. Scott ChairBoca Raton, FL
David L. Brandon Palm Harbor, FL
Susan M. Cameron Fort Lauderdale, FL
Christopher T. Corr Jacksonville, FL
Dr. Paul W. DavenportUniversity of FloridaFaculty Senate Chair
Charles B. Edwards Fort Myers, FL
Joselin Padron-RasinesUniversity of FloridaStudent Body President
Rahul PatelAtlanta, GA
Dr. Jason J. Rosenberg Gainesville, FL
James W. Heavener Winter Park, FL
Anita G. Zucker Charleston, SC
Robert G. Stern Tampa, FL
David M. Thomas Windermere, FL
UNIVERSITY OF FLORIDA BOARD OF TRUSTEES
Alan M. WestAssistant Vice President and
University ControllerPost Office Box 113200Tigert Hall, Room 207
Gainesville, FL 32611-3200 [email protected]