Embed Size (px)
Citation preview

2014-2015 Comprehensive Annual
Financial Report

CityofWestJordan
StateofUtah
ComprehensiveAnnualFinancialReport
ForthefiscalyearendedJune30,2015
Prepared by: Finance Department

CITY OF WEST JORDAN
Comprehensive Annual Financial Report For the Fiscal Year Ended June 30, 2015
TABLE OF CONTENTS
INTRODUCTORY SECTION
Letter of Transmittal ................................................................................................................ 1-5
GFOA Certificate of Achievement ............................................................................................. 6
Organizational Chart .................................................................................................................. 7
List of Principal Officials............................................................................................................ 8
FINANCIAL SECTION
Report of Independent Certified Public Accountants ............................................................ 9-10
Management’s Discussion and Analysis ............................................................................. 11-23
Basic Financial Statements
Government-wide Financial Statements:
Statement of Net Position .................................................................................................... 25-26
Statement of Activities ............................................................................................................. 27
Fund Financial Statements:
Balance Sheet – Governmental Funds ...................................................................................... 28
Reconciliation of the Balance Sheet of Governmental Funds to the Statement of Net Position .................................................................................................................................................. 29
Statement of Revenues, Expenditures and Changes in Fund Balances – Governmental Funds .................................................................................................................................................. 30
Reconciliation of the Statement of Revenues, Expenditures and Changes in Fund Balances of Governmental Funds to the Statement of Activities ................................................................ 31
General Fund Statement of Revenues, Expenditures, and Changes in Fund Balance – Budget and Actual ............................................................................................................................... 32
Redevelopment Agency Statement of Revenues, Expenditures, and Changes in Fund Balance – Budget and Actual ................................................................................................................... 33
Statement of Net Position – Proprietary Funds ........................................................................ 34

Statement of Revenues, Expenses, and Changes in Net Position – Proprietary Funds ............ 35
Statement of Cash Flows – Proprietary Funds .................................................................... 36-37
Notes to the Basic Financial Statements ............................................................................. 38-76
Combining and Individual Fund Financial Statements and Schedules
Combining Financial Statements – Nonmajor Governmental Funds:
Combining Balance Sheet – Nonmajor Governmental Funds ............................................ 78-79
Combining Statement of Revenues, Expenditures and Changes in Fund Balance – Nonmajor Governmental Funds .......................................................................................................... 80-81
Schedules Of Revenues, Expenditures and Changes in Fund Balance – Budget and Actual
Fairway Estates Fund ............................................................................................................... 83
KraftMaid SID Fund ................................................................................................................ 84
Municipal Building Authority Fund ......................................................................................... 85
Capital Support Fund ................................................................................................................ 86
Road Capital Improvement Fund ............................................................................................. 87
Parks Capital Improvement Fund ............................................................................................. 88
Buildings Capital Improvement Fund ...................................................................................... 89
Community Development Block Grant Fund .......................................................................... 90
Combining Financial Statements – Internal Service Funds
Internal Service Funds – Combining Statement of Net Position .............................................. 92
Internal Service Fund – Combining Statements of Revenues, Expenses, and Changes in Net Position ..................................................................................................................................... 93
Internal Service Funds – Combining Statements of Cash Flows ............................................. 94
STATISTICAL SECTION
Financial Trends
Schedule 1 – Net Position by Component ........................................................................... 96-97
Schedule 2 – Changes in Net Position ............................................................................... 98-101
Schedule 3 – Fund Balances, Governmental Funds ........................................................ 102-103
Schedule 4 – Changes in Fund Balances, Governmental Funds ..................................... 104-107
Schedule 5 – Tax Revenues by Source, Governmental Funds ............................................... 108
Revenue Capacity
Schedule 6 – Direct Taxable Sales by Category .................................................................... 109
Schedule 7 – Assessed Value and Estimated Actual Value of Taxable Property .................. 110
Schedule 8 – Property Tax Levies and Collections ................................................................ 111
Schedule 9 – Direct and Overlapping Sales Tax Rates .......................................................... 112
Schedule 10 – Direct and Overlapping Property Tax Rates ................................................... 113
Schedule 11 – Principal Sales Tax Payers .............................................................................. 114
Schedule 12 – Principal Property Tax Payers ........................................................................ 115
Debt Capacity
Schedule 13 – Ratios of Outstanding Debt by Type ....................................................... 116-117
Schedule 14 – Ratios of General Bonded Debt Outstanding ................................................. 118
Schedule 15 – Direct and Overlapping Governmental Activities Debt ................................. 119
Schedule 16 – Legal Debt Margin Information ............................................................... 120-121
Schedule 17 – Pledged Revenue Coverage Water Revenue Bonds ....................................... 122
Schedule 18 – Pledged Revenue Coverage Sales Tax Revenue Bonds ................................. 123
Schedule 19 – Pledged Revenue Coverage Excise Tax Road Bonds ..................................... 124
Schedule 20 – Pledged Revenue Coverage Tax Increment Revenue Bonds.......................... 125
Schedule 21 – Pledged Revenue Coverage HUD Contract Payable ...................................... 126
Demographic and Economic Information
Schedule 22 – Demographic and Economic Statistics ........................................................... 127
Schedule 23 – Principal Employers ........................................................................................ 128
Operating Information
Schedule 24 – Full-time Equivalent City Government Employees by Function/Program .... 129
Schedule 25 – Operating Indicators by Function/Program ............................................. 130-131
Schedule 26 – Capital Asset Statistics by Function/Program ......................................... 132-133
INTRODUCTORY SECTION Letter of Transmittal December 8, 2015 Honorable Mayor, Members of the City Council, and Citizens of West Jordan: The Comprehensive Annual Financial Report (CAFR) of the City of West Jordan, Utah (the City) for the Fiscal Year ended June 30, 2015 is submitted herewith. This report has been prepared by the City’s Finance Department in accordance with Generally Accepted Accounting Principles (GAAP) for local governments as prescribed by the Governmental Accounting Standards Board. Overview State law requires that general-purpose local governments publish a complete set of financial statements in accordance with GAAP within six months of the close of each fiscal year. State law also requires that the report be audited in accordance with generally accepted auditing standards by a licensed certified public accounting firm. As required by State law, an annual audit has been completed by Keddington & Christensen, LLC, an independent public accounting firm, in order to provide reasonable assurance that the financial statements for the fiscal year ended June 30, 2015, are free of material misstatements. The independent audit involved examining, on a test basis, evidence supporting the amounts and disclosures in the financial statements, assessing the accounting principles used and significant estimates made by management, and evaluating the overall financial statement presentation. The independent auditor concluded, based upon the audit, that there was a reasonable basis for rendering an unqualified opinion that the City’s financial statements for the fiscal year ended June 30, 2015 are fairly presented in conformity with GAAP. The independent auditors’ report is included in the financial section of this report. The City is required to undergo a single audit in accordance with the provisions of the Office of Management and Budget’s (OMB) circular A-133 “Audits of States, Local Governments, and Non-Profit Organizations.” Information related to the single audit, including the opinion on the schedule of expenditures of federal awards, the auditors’ reports on compliance and internal controls over financial reporting in accordance with Generally Accepted Governmental Auditing
City of West Jordan8000 South Redwood Road
West Jordan, UT 84088 (801) 569-5000
1
Standards (GAGAS), and the auditors’ report on compliance with requirements applicable to each major program and internal control over compliance in accordance with OMB Circular A-133, are available in a separate report. GAAP require that management provide a narrative introduction, overview, and analysis to accompany the basic financial statements in the form of Management’s Discussion and Analysis (MD&A). This letter of transmittal is designed to complement the MD&A and should be read in conjunction with it. The City’s MD&A immediately follows the independent auditors’ report. This CAFR has been prepared by the City’s Finance Department. Responsibility for both the accuracy of the presented data and the completeness and fairness of the presentation, including all disclosures and supplementary information, rests with the City’s management. Management is also responsible for establishing and maintaining an internal control structure designed to ensure that the assets of the City are protected from loss, theft, or misuse; and to ensure that adequate accounting data is compiled to allow for the preparation of financial statements in conformity with GAAP. The City’s internal control structure is designed to provide reasonable, rather than absolute, assurance that these objectives are met. Government Profile The City of West Jordan was incorporated on January 10, 1941. The City of West Jordan has a population of 110,171 making it the fourth-largest city in the state, and a city of the first class, as defined by the State of Utah. At build-out, the City is projected to have a population of 175,000. The City of West Jordan is located within the Salt Lake metropolitan area, and is approximately 32.02 square miles in size. The City provides a full range of services to its businesses and residents. These include police and fire protection, culinary water, sanitary sewer, solid waste and recycling collection and disposal, construction and maintenance of roadways, parks and recreation facilities, street lighting, celebrations, and other cultural events. West Jordan operates under the council-manager form of municipal government. The City Council, composed of the mayor and six City Council members, is the legislative branch of city government. The mayor and council members each serve four-year terms. The City Council is responsible for passing ordinances, adopting the budget, and appointing committees and the city manager. The city manager, subordinate officers, and employees are the executive branch of city government. The city manager is responsible for directing the day-to-day operations of the city, and for carrying out the ordinances and policies adopted by the City Council. Component units are entities for which the government is considered to be financially accountable. Blended component units, although legally separate entities, are considered to be part of governmental operations, and so are included in the City’s budget reporting and financial statements. Utah state law requires the City to adopt a budget for all funds on an annual basis, and requires that all funds maintain a balanced budget, with some limited exceptions. State law also requires that departmental expenditures do not exceed appropriated funding levels, except in cases of
2
emergency (such as a natural disaster). Budgetary control is maintained at the department level for the General Fund and at the fund level for all other funds. Authority to revise approved budgets rests with the City Council, which may be accomplished following the completion of noticing and hearing requirements. Economic Condition The national economy continues to expand at a steady rate. The Commerce Department reports that Gross Domestic Product (GDP) grew 3.9 percent in the second quarter of 2015. In the short term, it is expected that the economy will continue to grow at a modest rate, driven by continued growth in consumer spending and net exporting. Long range forecasts expect the most significant threat to economic growth to continue to be inflation, which is currently projected to remain below 3.0% for the upcoming year. If inflation were to climb above 3.0%, it would likely become a significant drag on national economic growth, leading to a likely change in economic policy by the Federal Reserve Board. Due to improved economic conditions, it is widely anticipated that the Federal Reserve will begin implementing a series of interest rate adjustments starting in December. Locally, the Utah economy continues to post solid growth numbers. Zion’s Bank reports that the Utah Consumer Attitude index is rated at 110 as of September, 2015, which has remained generally constant during the current year. The Zion’s Bank Consumer Price Index posted a 1.4% increase in August, 2015, when compared to the same month the prior year. In West Jordan, the US Bureau of Labor Statistics reports the unemployment rate continues to decline, from 4.3% in 2013 to 3.6% in 2014, reaching 3.3% through the first three quarters of 2015. It is not anticipated that unemployment will continue to fall much further, as a rate of 3.0% is generally considered full employment. Long-term Financial Planning The City continues to be responsive to trends and the effects of our underlying economy on our ability to sustain city-provided services. Our reporting systems provide adequate tracking and warning of potential problems, and our efforts to design and implement a comprehensive performance-based program and accountability budgeting and management system to improve accountability and transparency are firmly in place. Growing net position and, consequently, the City’s ability to appropriately address any contingency is a priority. In the past year, we were successful in significantly increasing our general operating net position. Our efforts are firmly focused now on the development of a long-term fiscal strategic plan, which will provide policies for financial management, set the philosophy and values of the City pertaining to financial management, provide five-year projections of revenue and expenditures, and prescribe specific methodologies to address the contingencies of the future. Meanwhile, the City has been and will continue to be judicious in the use of debt financing. Currently, the City enjoys a strong bond rating and remarkably low debt for a typical community of West Jordan’s size. Better monitoring and evaluation tools will help assure measured and safe progress while still addressing the challenging needs of a growth community.
3
Relevant Financial Policies Cash during the year was invested in the Public Treasurer’s Investment Fund, statement savings, and repurchase agreements. The City’s investment policy is to minimize credit and market risks while maintaining a competitive yield on its portfolio. The City’s bank deposits are un-collateralized and insured up to $250,000 per institution by the FDIC. Utah operates under state statute allowing investments to be un-collateralized if state guidelines are followed. The City is self-insured for unemployment costs. The City purchases commercial insurance coverage for liability claims exceeding $250,000; as well as workers’ compensation, property, automobile physical damage and crime coverages. The City pays unused vacation, holiday, compensatory time, and executive leave balances at termination. Retired employees are eligible to apply their remaining unused sick leave toward their monthly health insurance premium at a rate of 40-70%, depending on their length of service. In order to qualify, the employee is required to notify their department head at least one year prior to retirement. Utah state law requires the City to adopt a budget for all funds on an annual basis, and requires that all funds maintain a balanced budget, with some limited exceptions. State law also requires that departmental expenditures do not exceed appropriated funding levels, except in cases of emergency (such as a natural disaster). Management cannot overspend at the department level without approval of City Council. This may be accomplished following the completion of noticing and hearing requirements. Awards & Acknowledgements The Government Finance Officers Association (GFOA) awarded a Certificate of Achievement for Excellence in Financial Reporting to the City of West Jordan for its Comprehensive Annual Financial Report for the fiscal year ended June 30, 2014. This marks the 34rd consecutive year the City has received this award. The Certificate of Achievement is a prestigious national award and recognizes the conformance with the highest standards for preparation of state and local government financial reports. In order to be awarded a Certificate of Achievement, a government unit must publish an easily readable and efficiently organized Comprehensive Annual Financial Report, with contents conforming to program standards. A Certificate of Achievement is valid for a period of one year. This report has been prepared to strictly follow the guidelines recommended by the GFOA, and has been submitted to determine its eligibility for a Certificate of Achievement. Additionally, the City received the GFOA’s Distinguished Budget Presentation Award for its annual budget document for fiscal year 2015. In order to qualify for the Distinguished Budget Presentation Award, the government’s budget document was judged to be proficient in several categories, including as a policy document, a financial plan, an operations guide, and a communications device.
4
The preparation of this report on a timely basis could not have been accomplished without the efficient and dedicated service of the entire Finance Department staff. Each member of the department has our sincere appreciation for the contributions made in the preparation of this report. In closing, without the leadership and support of the governing body of the City, preparation of this report would not have been possible. Respectfully Submitted,
Mark R Palesh Ryan Bradshaw City Manager Finance Director
5

GFOA Certificate of Achievement
6
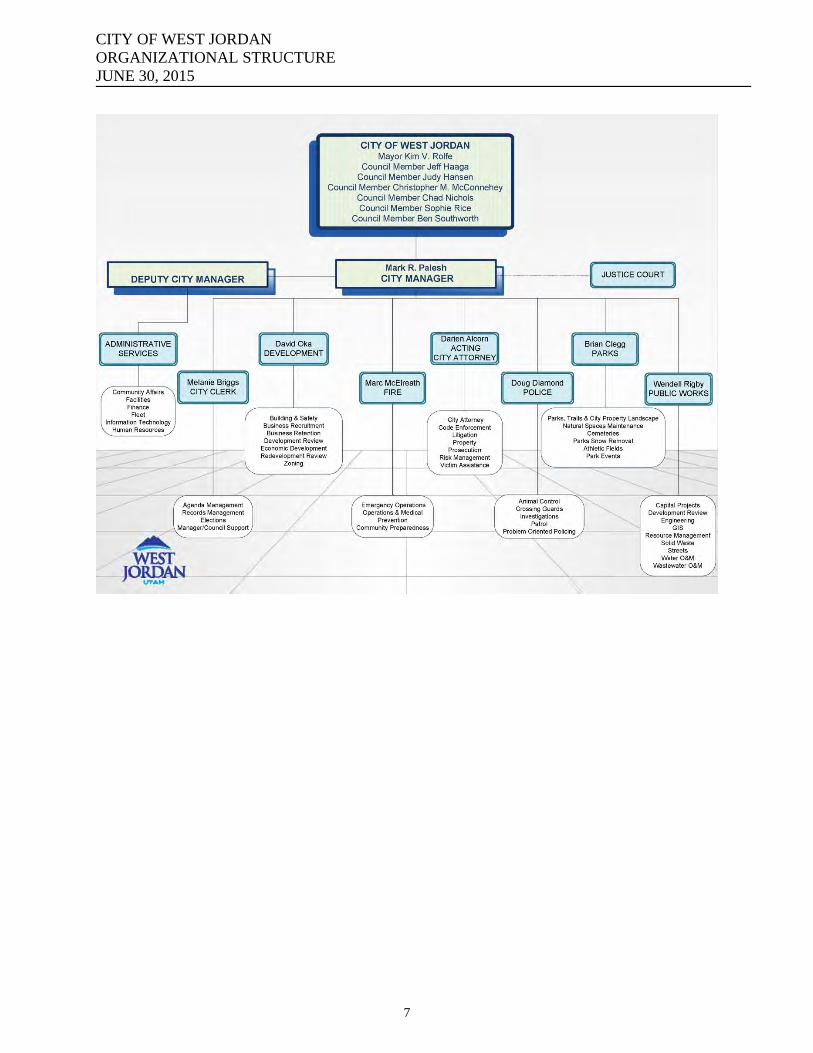
CITY OF WEST JORDAN ORGANIZATIONAL STRUCTURE JUNE 30, 2015
Organizational Chart
7

CITY OF WEST JORDAN LIST OF PRINCIPAL OFFICIALS JUNE 30, 2015
PRINCIPAL OFFICIALS AS OF THE DATE OF THE REPORT (DECEMBER 8, 2015) Title Name Mayor Kim V. Rolfe Mayor Pro-Tem/Councilmember Judy Hansen Councilmember Sophie Rice Councilmember Christopher McConnehey Councilmember Chad Nichols Councilmember Ben Southworth Councilmember Jeff Haaga City Manager Mark R. Palesh Acting City Attorney Darien Alcorn City Clerk Melanie Briggs City Treasurer David Zobell Chief Information Officer Michael Oliver Community Development Director David Oka Finance Director Ryan Bradshaw Fire Chief Marc McElreath Justice Court Judge Ronald Kunz Police Chief Doug Diamond Public Works Director Wendell Rigby
8
Telephone (801)-590-2600 5292 So. College Dr., Suite 102 Fax (801) 265-9405 Salt Lake City, Utah 84123
INDEPENDENT AUDITOR’S REPORT
Honorable Mayor and Members of City Council City of West Jordan West Jordan City, Utah We have audited the accompanying financial statements of the governmental activities, the business-type activities, each major fund, and the aggregate remaining fund information of City of West Jordan as of and for the year ended June 30, 2015, and the related notes to the financial statements, which collectively comprise the City’s basic financial statements as listed in the table of contents. Management’s Responsibility for the Financial Statements Management is responsible for the preparation and fair presentation of these financial statements in accordance with accounting principles generally accepted in the United States of America; this includes the design, implementation, and maintenance of internal control relevant to the preparation and fair presentation of financial statements that are free from material misstatement, whether due to fraud or error. Auditor’s Responsibility Our responsibility is to express opinions on these financial statements based on our audit. We conducted our audit in accordance with auditing standards generally accepted in the United States of America. Those standards require that we plan and perform the audit to obtain reasonable assurance about whether the financial statements are free from material misstatement. An audit involves performing procedures to obtain audit evidence about the amounts and disclosures in the financial statements. The procedures selected depend on the auditor’s judgment, including the assessment of the risks of material misstatement of the financial statements, whether due to fraud or error. In making those risk assessments, the auditor considers internal control relevant to the entity’s preparation and fair presentation of the financial statements in order to design audit procedures that are appropriate in the circumstances, but not for the purpose of expressing an opinion on the effectiveness of the entity’s internal control. Accordingly, we express no such opinion. An audit also includes evaluating the appropriateness of accounting policies used and the reasonableness of significant accounting estimates made by management, as well as evaluating the overall presentation of the financial statements. We believe that the audit evidence we have obtained is sufficient and appropriate to provide a basis for our audit opinions. Opinion In our opinion, the financial statements referred to above present fairly, in all material respects, the respective financial position of the governmental activities, the business-type activities, each major fund, and the aggregate remaining fund information of City of West Jordan as of June 30, 2015, and the respective changes in financial position, and the respective budgetary comparison for the General Fund and the Major Special Revenue Funds and, where applicable, cash flows thereof for the year then ended in accordance with accounting principles generally accepted in the United States of America.
9
Other Matters Required Supplementary Information Accounting principles generally accepted in the United States of America require that the management’s discussion and analysis and budgetary comparison information, as noted on the table of contents, be presented to supplement the basic financial statements. Such information, although not a part of the basic financial statements, is required by the Governmental Accounting Standards Board, who considers it to be an essential part of financial reporting for placing the basic financial statements in the appropriate operational, economic, or historical context. We have applied certain limited procedures to the required supplementary information in accordance with auditing standards generally accepted in the United States of America, which consisted of inquires of management about the methods of preparing the information and comparing the information for consistency with management’s responses to our inquiries, the basic financial statements, and other knowledge we obtained during our audit of the basic financial statements. We do not express an opinion or provide any assurance on the information because the limited procedures do not provide us with sufficient evidence to express an opinion or provide any assurance. Our audit was conducted for the purpose of forming opinions on the financial statements that collectively comprise City of West Jordan’s basic financial statements. The introductory section, combining and individual nonmajor fund financial statements, and statistical section are presented for purposes of additional analysis and are not a required part of the basic financial statements. The combining and individual nonmajor fund financial statements are the responsibility of management and were derived from and relate directly to the underlying accounting and other records used to prepare the basic financial statements. Such information has been subjected to the auditing procedures applied in the audit of the basic financial statements and certain additional procedures, including comparing and reconciling such information directly to the underlying accounting and other records used to prepare the basic financial statements or to the basic financial statements themselves, and other additional procedures in accordance with auditing standards generally accepted in the United States of America. In our opinion, the combining and individual nonmajor fund financial statements are fairly stated, in all material respects, in relation to the basic financial statements as a whole. The introductory and statistical sections have not been subjected to the auditing procedures applied in the audit of the basic financial statements and, accordingly, we do not express an opinion or provide any assurance on them. Other Reporting Required by Government Auditing Standards In accordance with Government Auditing Standards, we have also issued our report dated December 8, 2015, on our consideration of the City’s internal control over financial reporting and on our tests of its compliance with certain provisions of laws, regulations, contracts, and grant agreements and other matters. The purpose of that report is to describe the scope of our testing of internal control over financial reporting and compliance and the results of that testing, and not to provide an opinion on internal control over financial reporting or on compliance. That report is an integral part of an audit performed in accordance with Government Auditing Standards in considering the City’s internal control over financial reporting and compliance.
Keddington & Christensen, LLC December 8, 2015 port of Independent Certified Public Accoun
10

CITY OF WEST JORDAN MANAGEMENT’S DISCUSSION AND ANALYSIS JUNE 30, 2015
Introduction As management of the City of West Jordan, we offer readers of the City’s financial statements this narrative overview and analysis of the financial activities for the fiscal year ended June 30, 2015. The Management’s Discussion and Analysis (MD&A) is designed to provide an overview of the City’s financial activity. It is also intended to assist the reader in focusing on significant financial issues including identifying changes in the City’s financial position, identifying any material deviations from the approved budget, and identifying individual fund issues or concerns. Please read the MD&A in conjunction with the Transmittal Letter and the City’s financial statements. Financial Highlights The City’s net position has increased by $1,633,280. The governmental net position decreased by $5,629,238 and the business-type net position increased by $7,262,518. At the close of the current fiscal year, the assets of the City exceeded its liabilities by $509,871,733. Of this amount, $53,734,948 (unrestricted net position) may be used to meet the government’s ongoing obligations to citizens and creditors. As of the close of the current fiscal year, the City’s governmental funds (reflected on a current financial resource basis) reported combined ending net positions of $47,176,877, an increase of $2,104,863 in comparison with the prior year. The unassigned net position for the General fund at year end was $11,362,288 or approximately 25.8% of total General fund expenditures. The total net position for the General fund has decreased by $1,508,308, from the previous year. Overview of the Financial Statements This discussion and analysis are intended to serve as an introduction to the City’s basic financial statements. The City’s basic financial statements comprise three components: 1) government-wide financial statements, 2) fund financial statements, and 3) notes to the financial statements. This report also contains other supplementary information in addition to the basic financial statements themselves. Government-wide financial statements – The government-wide financial statements are designed to provide readers with a broad overview of the City’s finances, in a manner similar to a private-sector business. The statement of net position presents information on all of the City of West Jordan’s assets and liabilities, with the difference between the two reported as net position. Over time, increases or decreases in net position may serve as a useful indicator of whether the financial position of the City of West Jordan is improving or deteriorating. The statement of activities presents information showing how the City’s net position changed during the most recent fiscal year. All changes in net position are reported as soon as the underlying events giving rise to the change occur, regardless of the timing of related cash flows. Thus, revenues and expenses are reported in this statement for some items that will only result in cash flows in future fiscal periods (e.g., uncollected taxes and earned but unused vacation leave).
11
CITY OF WEST JORDAN MANAGEMENT’S DISCUSSION AND ANALYSIS JUNE 30, 2015
Both of the government-wide financial statements distinguish functions of the City of West Jordan that are primarily supported by taxes and intergovernmental revenues (governmental activities) from other functions that are intended to cover all or a significant portion of their costs through user fees and charges (business-type activities). The governmental activities of the City of West Jordan include general government, community development, police, fire, public works, and parks and recreation. The business-type activities of the City of West Jordan include water, sewer, solid waste, and storm water. The government-wide financial statements include not only the City itself (known as the primary government), but also two legally separate entities, the Redevelopment Agency and the Municipal Building Authority, for which the City is financially accountable. Financial information for these component units is blended with the financial information presented for the primary government itself. The government-wide financial statements can be found on pages 25-27 of this report. Fund financial statements – A fund is a grouping of related accounts that is used to maintain control over resources that have been segregated for specific activities or objectives. The City of West Jordan, like other state and local governments, uses fund accounting to ensure and demonstrate compliance with finance-related legal requirements. All funds of the City of West Jordan can be divided into two categories: governmental funds and proprietary funds. Governmental funds – Governmental funds are used to account for essentially the same functions reported as governmental activities in the government-wide financial statements. However, unlike the government-wide financial statements, governmental fund financial statements focus on the near-term inflows and outflows of spendable resources, as well as on balances of spendable resources available at the end of the fiscal year. Such information may be useful in evaluating a government’s near-term financing requirements. Because the focus of governmental funds is narrower than that of the government-wide financial statements, it is useful to compare the information presented for governmental funds with similar information presented for governmental activities in the government-wide financial statements. By doing so, readers may better understand the long-term impact of the government’s near-term financing decisions. Both the governmental net position sheet and the governmental fund statement of revenues, expenditures, and changes in net positions provide a reconciliation to facilitate this comparison between the two. The City maintains 13 individual governmental funds, four major funds, and nine non-major funds. Information is presented separately in the governmental net position sheet and in the governmental fund statement of revenues, expenditures, and changes in net positions for the General fund, the redevelopment agency fund, the capital support fund, and the road capital improvement fund, which are considered major funds. Financial information for the other nine funds is combined into a single, aggregated presentation. Individual fund data for each of these non-major governmental funds is provided in the form of combining statements elsewhere in this report. The basic governmental fund financial statements can be found on pages 29-33 of this report. The City adopts an annual appropriated budget for all governmental funds. The basic financial statements include budgetary comparison statements for the General fund and the redevelopment agency fund to demonstrate compliance with these budgets.
12

CITY OF WEST JORDAN MANAGEMENT’S DISCUSSION AND ANALYSIS JUNE 30, 2015
Proprietary funds – The City of West Jordan maintains two different types of proprietary funds. Enterprise funds are used to report the same functions presented as business-type activities in the government-wide financial statements. The City maintains three individual enterprise funds. Information is presented separately in the proprietary statement of net position and the proprietary statement of revenues, expenses, and changes in fund net position for the water fund, sewer fund and the solid waste fund which are all considered major funds. Internal service funds are used to accumulate and allocate costs internally among the City’s various functions. The City of West Jordan uses internal service funds to account for its fleet maintenance, risk management activities and a fund for computer replacement (Information Technologies Fund). Because these services predominantly benefit governmental rather than business-type activities, they have been included principally within the governmental activities in the government-wide financial statements but are combined into a single, aggregated presentation in the proprietary fund financial statements. Individual fund data for the internal service funds is provided in the form of combining statements elsewhere in the report. The basic proprietary fund financial statements can be found on pages 34-37 of this report. Notes to the financial statements – The notes provide additional information that is essential to the full understanding of the data provided in the government-wide and fund financial statements. The notes to the financial statements can be found on pages 38-76 of this report. Other information – In addition to the basic financial statements and accompanying notes, this report also presents certain required supplementary information. The combining statements referred to earlier in connection with non-major funds and internal service funds are presented as supplementary information. Government-wide Financial Analysis As noted earlier, net position may serve over time as a useful indicator of a government’s financial position. On June 30, 2015, the City’s assets exceeded liabilities by $509,871,733. By far the largest portion, approximately 85.6%, of the City’s net position are composed of capital assets, less any debt used to acquire those assets that is still outstanding. Capital assets are used to provide services to citizens and are not available for future spending. Although the investment in capital assets is reported net of any related outstanding debt, it should be noted that the resources needed to repay this debt must be provided from other sources, since the capital assets themselves cannot be used to liquidate these liabilities.
13
CITY OF WEST JORDAN MANAGEMENT’S DISCUSSION AND ANALYSIS JUNE 30, 2015
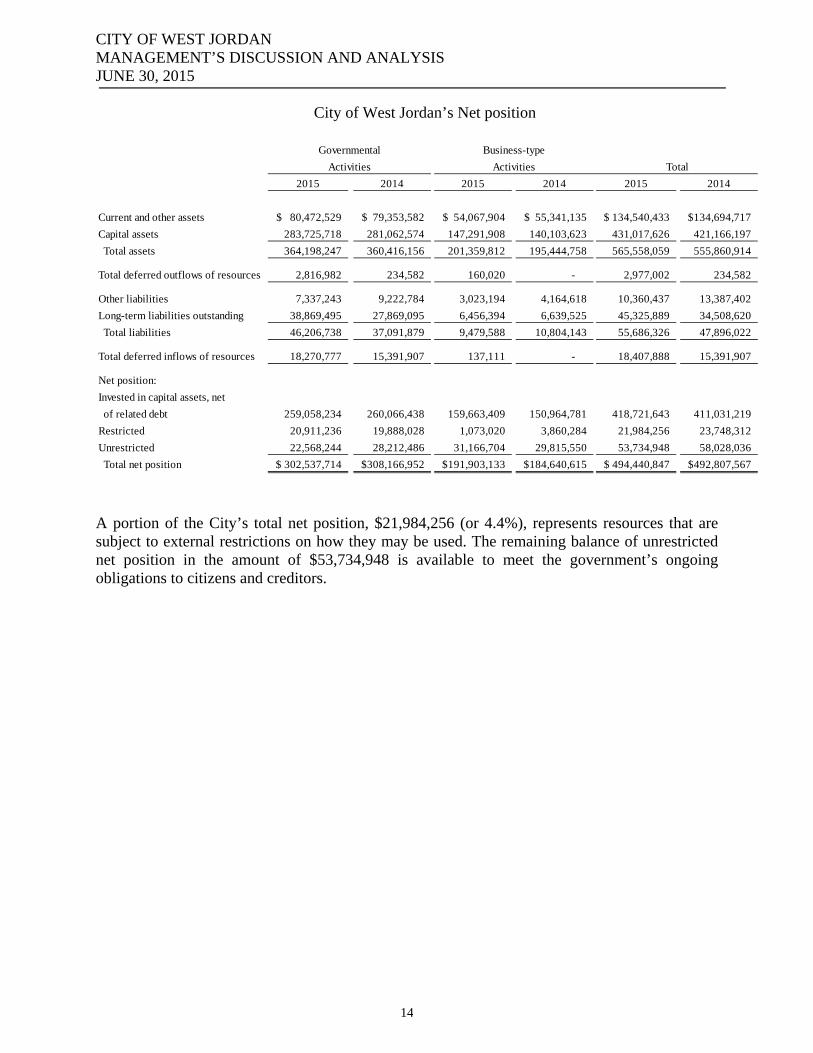
City of West Jordan’s Net position
2015 2014 2015 2014 2015 2014
Current and other assets 80,472,529$ 79,353,582$ 54,067,904$ 55,341,135$ 134,540,433$ 134,694,717$
Capital assets 283,725,718 281,062,574 147,291,908 140,103,623 431,017,626 421,166,197
Total assets 364,198,247 360,416,156 201,359,812 195,444,758 565,558,059 555,860,914
Total deferred outflows of resources 2,816,982 234,582 160,020 - 2,977,002 234,582
7,337,243 9,222,784 3,023,194 4,164,618 10,360,437 13,387,402
Long-term liabilities outstanding 38,869,495 27,869,095 6,456,394 6,639,525 45,325,889 34,508,620
Total liabilities 46,206,738 37,091,879 9,479,588 10,804,143 55,686,326 47,896,022
Total deferred inflows of resources 18,270,777 15,391,907 137,111 - 18,407,888 15,391,907
Net position:
Invested in capital assets, net
of related debt 259,058,234 260,066,438 159,663,409 150,964,781 418,721,643 411,031,219
Restricted 20,911,236 19,888,028 1,073,020 3,860,284 21,984,256 23,748,312
Unrestricted 22,568,244 28,212,486 31,166,704 29,815,550 53,734,948 58,028,036
Total net position 302,537,714$ 308,166,952$ 191,903,133$ 184,640,615$ 494,440,847$ 492,807,567$
Total
Other liabilities
Governmental Business-type
Activities Activities
A portion of the City’s total net position, $21,984,256 (or 4.4%), represents resources that are subject to external restrictions on how they may be used. The remaining balance of unrestricted net position in the amount of $53,734,948 is available to meet the government’s ongoing obligations to citizens and creditors.
14

CITY OF WEST JORDAN MANAGEMENT’S DISCUSSION AND ANALYSIS JUNE 30, 2015
2015 2014 2015 2014 2015 2014Revenues: Program revenues: Charges for services 8,450,467$ 7,825,234$ 30,180,291$ 30,733,069$ 38,630,758$ 38,558,303$ Operating grants and contributions 3,991,215 3,702,428 3,185,887 - 7,177,102 3,702,428 Capital grants and contributions 3,114,390 13,962,510 2,617,774 3,835,397 5,732,164 17,797,907 General revenues: Property taxes 17,213,650 17,066,769 - - 17,213,650 17,066,769 Sales taxes 16,845,871 15,976,144 - - 16,845,871 15,976,144 Other taxes 7,871,219 8,112,830 - - 7,871,219 8,112,830 Other 1,474,767 1,189,723 112,917 120,091 1,587,684 1,309,814 Total revenues 58,961,579 67,835,638 36,096,869 34,688,557 95,058,448 102,524,195
Expenses: General government 7,929,819 6,773,182 - - 7,929,819 6,773,182 Community development 2,955,072 3,825,771 - - 2,955,072 3,825,771 Police 15,465,279 14,705,289 - - 15,465,279 14,705,289 Fire 8,555,754 9,816,334 - - 8,555,754 9,816,334 Public works 14,002,468 14,175,755 - - 14,002,468 14,175,755 Parks and recreation 4,055,172 4,144,507 - - 4,055,172 4,144,507 Interest on long-term debt 627,550 803,748 - - 627,550 803,748 Water - - 16,113,765 15,132,025 16,113,765 15,132,025 Sewer - - 7,997,176 7,606,052 7,997,176 7,606,052 Solid waste - - 4,070,686 3,639,087 4,070,686 3,639,087 Storm water - - 2,011,798 1,982,908 2,011,798 1,982,908 Total expenses 53,591,114 54,244,586 30,193,425 28,360,072 83,784,539 82,604,658
Increase in net position before transfers 5,370,465 13,591,052 5,903,444 6,328,485 11,273,909 19,919,537
Transfers (1,950,000) 80,000 1,950,000 (80,000) - -
Changes in net position 3,420,465 13,671,052 7,853,444 6,248,485 11,273,909 19,919,537
Net position, beginning 308,166,952 294,495,900 184,640,615 178,392,130 492,807,567 472,888,030
Prior period adjustment (9,049,703) - (590,926) - (9,640,629) -
Net position, ending 302,537,714$ 308,166,952$ 191,903,133$ 184,640,615$ 494,440,847$ 492,807,567$
Governmental Business-typeActivities Activities Total
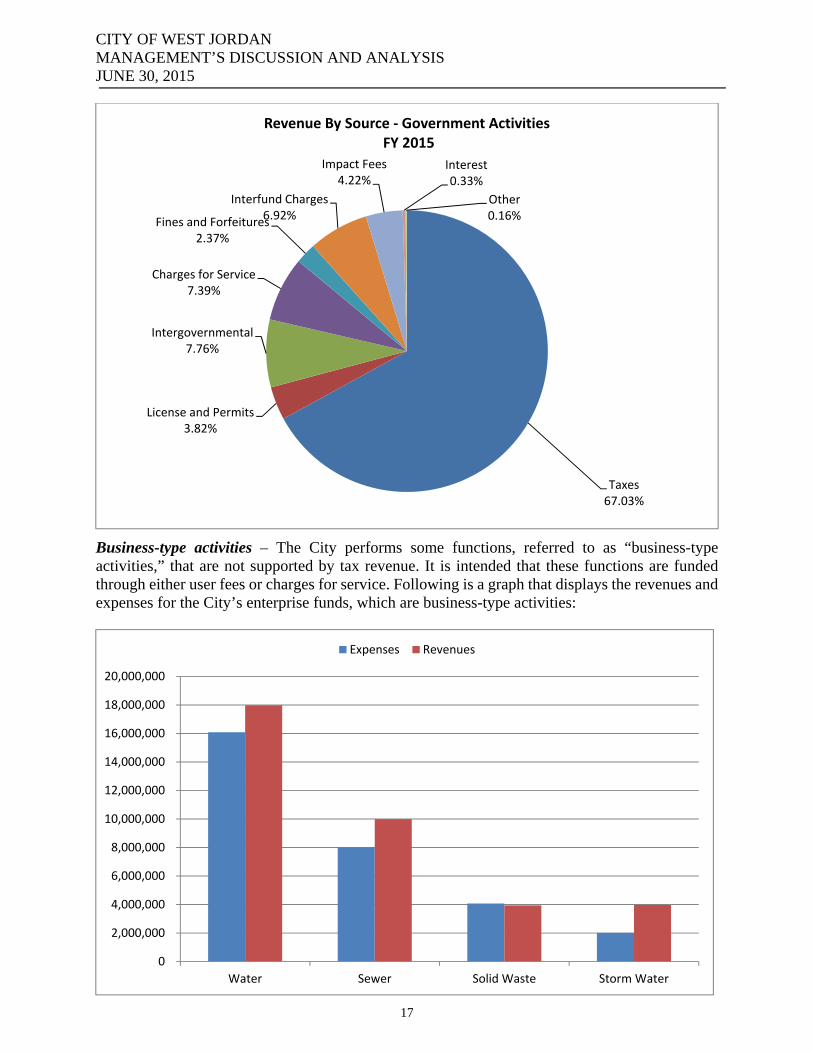
Governmental activities – Functions that the City performs which are supported by the collection of taxes and intergovernmental revenues are “governmental activities.” The governmental activities reflected in the table “City of West Jordan’s Net Position” (above) are displayed in the following chart, “Expenses and Program Revenues – Governmental Activities FY 2015.”
15

CITY OF WEST JORDAN MANAGEMENT’S DISCUSSION AND ANALYSIS JUNE 30, 2015
In the current year, governmental activities decreased the City’s net position by $5,629,238. Key elements of the City governmental activities are as follows:
Property tax revenue increased $1,039,538 due to increased development within the City.
Sales tax revenue increased $869,727. The increase is likely a result of an increase in consumer confidence in the national economy.
The City received $10,848,120 less than the previous year from Capital Grants and Contributions. This is likely a result of a $9,900,000 one-time award received from the State of Utah in 2014.
The City’s Capital Outlay Expenditures increase due to the construction of Ron Wood Park Phase I and road projects at 7800 south and 5600 west.
The City received Bond Proceeds in the amount of $6,530,000 for upgrading of parks and to complete a project to change streetlights throughout the city into LED lights
In fiscal year 2015, the City implemented GASB Statement No. 68, Accounting and Financial Reporting for Pensions. As a result, the City has established the following at the government-wide and proprietary fund financial statement level to account for its defined benefit plans with the Utah State Retirement System: net pension asset, deferred outflows of resources – pensions, net pension liability, and deferred inflows of resources – pensions. The net effect of this accounting required a prior period adjustment reducing net position to governmental activities by $9,615,060 and business-type activities by $590,926.
16
CITY OF WEST JORDAN MANAGEMENT’S DISCUSSION AND ANALYSIS JUNE 30, 2015
Business-type activities – The City performs some functions, referred to as “business-type activities,” that are not supported by tax revenue. It is intended that these functions are funded through either user fees or charges for service. Following is a graph that displays the revenues and expenses for the City’s enterprise funds, which are business-type activities:
Taxes67.03%
License and Permits3.82%
Intergovernmental7.76%
Charges for Service7.39%
Fines and Forfeitures2.37%
Interfund Charges6.92%
Impact Fees4.22%
Interest 0.33%
Other0.16%
Revenue By Source ‐ Government ActivitiesFY 2015
0
2,000,000
4,000,000
6,000,000
8,000,000
10,000,000
12,000,000
14,000,000
16,000,000
18,000,000
20,000,000
Water Sewer Solid Waste Storm Water
Expenses Revenues
17

CITY OF WEST JORDAN MANAGEMENT’S DISCUSSION AND ANALYSIS JUNE 30, 2015
Business-type activities increased the City’s net position by $7,262,518. Key elements of this increase are as follows:
The City’s business-type activities received $3,185,887 from operating grants and contributions and $2,617,774 from capital grants and contributions.
The majority of these contributions include capital assets donated to the City by developers ($2,617,774) and impact fees ($3,052,734) used to fund capital projects required by new growth and development within the City.
Charges for services decreased in the business-type activities by a net amount of $552,778 over the previous year.
Total Revenues in the Water Fund decreased $703,206 due to a decrease in water usage from 2014
Charges for Services in the Sewer Fund increased $134,783 due to growth within the City in 2015
Financial Analysis of the Government’s Funds As noted earlier, the City of West Jordan uses fund accounting to ensure and demonstrate compliance with finance-related legal requirements. Governmental funds. The focus of the City’s governmental funds is to provide information on near-term inflows, outflows, and balances of spendable resources. Such information is useful in assessing the City’s financial requirements. In particular, unassigned fund balance in the General fund and assigned funds in other governmental funds may serve as a useful measure of a government’s net resources available for spending at the end of the fiscal year. At the end of the current fiscal year, the City’s governmental funds reported combined ending net positions of $47,176,887, a net increase from the previous year of $2,104,863.
Charges for services83%
Capital grants and contributions
7%
Impact Fees9%
Other 1%
Revenue by Source ‐ Business TypeActivities FY 2015
18

CITY OF WEST JORDAN MANAGEMENT’S DISCUSSION AND ANALYSIS JUNE 30, 2015
Of the ending net position, less than 1% ($163,491) is in a non-spendable form, including prepaid expenditures and inventory. Another 44.3% ($20,911,236) constitutes restricted net position. The funds are restricted by enabling legislation, third-party creditors or grantors, debt service payments, or capital projects funded through bond proceeds, C-road revenues, and impact fee revenues. Committed net position is 0% ($0) of the total net position. Committed funds are not available for new spending because they can only be used for specific purposes, pursuant to constraints imposed by formal action of the City Council, through contracts or legislation. The remainder of the net position is comprised of both assigned and unassigned amounts, totaling $26,102,150, and represents the amounts available for spending at the government’s discretion. Of this total, 31.2% ($14,739,862) is assigned and 24.1% ($11,362,288) is unassigned. The General fund is the chief operating fund of the City of West Jordan. At the end of the current fiscal year, unassigned and assigned Net Position of the General fund was $11,362,288 and $769,975 respectively. Total Net Position reached $17,528,632. As a measure of the General fund’s liquidity, it may be useful to compare both unassigned net position and total net position to total fund expenditures. Unassigned net position represents 25.8% of total General fund expenditures, while total net position represents 39.8% of that same amount. The City’s total General fund net position experienced a $1,508,308 decrease during the current fiscal year. Total revenues in the General fund were $2,199,081 higher than the original budget amount, due mostly to tax revenues exceeding original budgeted revenues in the amount of $1,202,876. This decrease in the general fund is due to an increase in expenditures in salary and benefits. These increases allowed the city to retain more of their workforce and resulted in less turnover savings. This decrease is also due to transfers of funds for capital projects. Of the total net position, restricted net position decreased by $725,717. Restricted cash in the General fund represents C-Road revenue restricted for qualifying road maintenance and road capital projects. Utah Code Section 17-36-16(3) provides a floor set at 5% of the total budgeted General fund revenues, below which cities may not spend their resources, except in emergencies. As of June 30, 2015, the City’s unassigned net position is 23.1% of fiscal year 2015 General fund revenues. Unassigned net position was $11,362,288, a decrease in comparison to the prior year unassigned net position in the amount of $1,151,535. During fiscal year 2015, the City did the following to manage net position in the General fund:
The City’s General Fund has forgiven a $2,000,000 loan in unrestricted cash to the Storm Water Fund to construct a detention basis near 7800 South and 5600 West.
The City increase wages to employees to remain competitive in the marketplace. This has resulted in less turnover savings.
The Redevelopment Agency fund had a total net position of $7,335,639, an increase from the previous year in the amount of $1,759,095. The increase results from an increase in tax increment revenues and a decrease in debt service expenditures. The Redevelopment Agency fund has net position restricted for debt service in the amount of $138,452.
19
CITY OF WEST JORDAN MANAGEMENT’S DISCUSSION AND ANALYSIS JUNE 30, 2015
The Capital Support fund has a net position of $696,908, a decrease in the amount of $202,039 from the prior year. The Capital Support fund activity is primarily the receipt of property tax revenues and payment of debt service in the amount of $1,240,496. The debt consists of a General Obligation Bond which was refunded to a lower interest rate in FY 2014. Other activity included expenditures in the amount $136,712 for various facility repairs and maintenance. The total net position in the amount of $696,908 is assigned for building replacement and repair projects, as designated by council. The Road Capital Improvement fund has a total net position of $10,276,788, a increase from the prior year of $919,077. The projects in the Road Capital fund are funded by impact fee revenues, telecommunication tax revenues transferred from the General fund, and B&C Road fund revenues transferred in from the General fund. Net position in the Road fund is restricted for road projects funded by grants in the amount of $9,420,837. Proprietary funds – The City of West Jordan’s proprietary funds provide the same type of information found in the government-wide financial statements business-type activities, but in more detail. At the end of the year, unrestricted net position in the water fund were $9,104,403. In the current year, the water fund had a net operating loss of $193,680, compared to an operating gain of $381,350 in FY 2014. Unrestricted net position of the sewer fund are $9,875,422 as of June 30, 2015. This total increased due to the fund having an operating income of $487,858. The unrestricted net position in solid waste are $5,779,843, remaining relatively unchanged from the previous year. Unrestricted net position in the amount of $6,407,036 are being reported for the storm water fund.
20
CITY OF WEST JORDAN MANAGEMENT’S DISCUSSION AND ANALYSIS JUNE 30, 2015
General Fund Budgetary Highlights During the year, there was an increase in appropriation between the original and final amended budget in the amount of $9,313,404 and can be briefly summarized as follows:
Budgeted transfers out to the Road Capital Improvement Fund, totaled $8,700,000, for projects qualifying for use of Class B&C Road revenues.
Budgeted transfers out to the Storm Water Fund of $2,000,000 to construct a detention basis at 7800 South and 5600 West
Budgeted expenditures (not including transfers out) increased in the amount of $2,005,660, reflecting increased budget in the following departments: police operational costs, grant funded police programs, fire operational costs, public works operational costs and administration costs.
Based on budgeted revenues and expenditures, net position was projected to decrease in the amount of $15,562,333. During the year, expenditures were $8,358,317 less than budgeted, while transfers out were $3,814,363 less than budgeted. The transfers were primarily due to C-Road capital projects that were budgeted, but not completed in FY 2015. The lower expenditures were primarily a result of unfilled personnel positions and carryover projects. Revenues were higher than budgeted estimates in the following areas: municipal tax revenues, licenses and permits revenues, and ambulance fee revenues. The variance in revenues combined with the variance in expenditures resulted in a net position decrease in the amount of $1,508,308 Capital Assets and Debt Administration Capital assets – The City of West Jordan’s investment in capital assets for its governmental and business-type activities as of June 30, 2015 amounts to $431,017,626, (net of accumulated depreciation). This investment in capital assets includes land, water rights, construction in process, machinery and equipment, computer equipment, building, building improvements, improvements other than buildings, and infrastructure. Major capital asset events during the current fiscal year included the following:
Infrastructure and land were donated to the City by developers and became the City’s responsibility to maintain. The estimated fair value of the infrastructure and land donated in the proprietary funds totaled $2,617,774.
The City spent the following amounts for improvements over the course of the fiscal year: $4,324,161 on roads, $2,831,264 on storm water, $6,857,518 on water, and $1,596,489 on sewer.
Additional information on the City’s capital assets can be found in Note 4 to the basic financial statements. Long-term debt – At the end of the current fiscal year, the City had $36,657,556 in outstanding long-term debt.
21
CITY OF WEST JORDAN MANAGEMENT’S DISCUSSION AND ANALYSIS JUNE 30, 2015
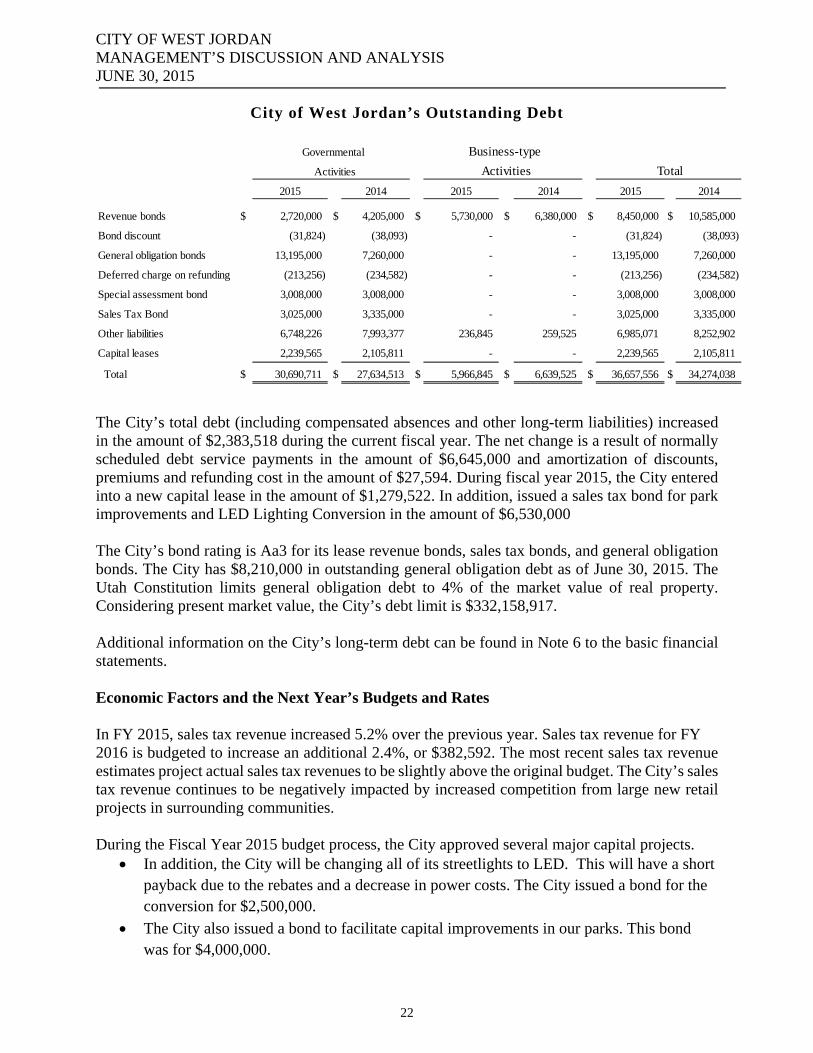
City of West Jordan’s Outstanding Debt
Governmental Business-type
Activities Activities Total
2015 2014 2015 2014 2015 2014
Revenue bonds $ 2,720,000 $ 4,205,000 $ 5,730,000 $ 6,380,000 $ 8,450,000 $ 10,585,000
Bond discount (31,824) (38,093) - - (31,824) (38,093)
General obligation bonds 13,195,000 7,260,000 - - 13,195,000 7,260,000
Deferred charge on refunding (213,256) (234,582) - - (213,256) (234,582)
Special assessment bond 3,008,000 3,008,000 - - 3,008,000 3,008,000
Sales Tax Bond 3,025,000 3,335,000 - - 3,025,000 3,335,000
Other liabilities 6,748,226 7,993,377 236,845 259,525 6,985,071 8,252,902
Capital leases 2,239,565 2,105,811 - - 2,239,565 2,105,811
Total $ 30,690,711 $ 27,634,513 $ 5,966,845 $ 6,639,525 $ 36,657,556 $ 34,274,038
The City’s total debt (including compensated absences and other long-term liabilities) increased in the amount of $2,383,518 during the current fiscal year. The net change is a result of normally scheduled debt service payments in the amount of $6,645,000 and amortization of discounts, premiums and refunding cost in the amount of $27,594. During fiscal year 2015, the City entered into a new capital lease in the amount of $1,279,522. In addition, issued a sales tax bond for park improvements and LED Lighting Conversion in the amount of $6,530,000 The City’s bond rating is Aa3 for its lease revenue bonds, sales tax bonds, and general obligation bonds. The City has $8,210,000 in outstanding general obligation debt as of June 30, 2015. The Utah Constitution limits general obligation debt to 4% of the market value of real property. Considering present market value, the City’s debt limit is $332,158,917. Additional information on the City’s long-term debt can be found in Note 6 to the basic financial statements. Economic Factors and the Next Year’s Budgets and Rates In FY 2015, sales tax revenue increased 5.2% over the previous year. Sales tax revenue for FY 2016 is budgeted to increase an additional 2.4%, or $382,592. The most recent sales tax revenue estimates project actual sales tax revenues to be slightly above the original budget. The City’s sales tax revenue continues to be negatively impacted by increased competition from large new retail projects in surrounding communities. During the Fiscal Year 2015 budget process, the City approved several major capital projects.
In addition, the City will be changing all of its streetlights to LED. This will have a short payback due to the rebates and a decrease in power costs. The City issued a bond for the conversion for $2,500,000.
The City also issued a bond to facilitate capital improvements in our parks. This bond was for $4,000,000.
22
CITY OF WEST JORDAN MANAGEMENT’S DISCUSSION AND ANALYSIS JUNE 30, 2015
Development activity is expected to continue to grow in the near future. This trend will result in revenue increases from impact and building permit fees, as well as other general revenues. Interest in future development on the City’s west side continues to be relatively strong for both residential and commercial. City Council and management will continue to monitor the economic outlook and proactively deal with the challenges the City is experiencing. Requests for Information This financial report is designed to provide a general overview of the City of West Jordan’s finances for all those with an interest in the government’s finances. Questions concerning any of the information provided in this report or requests for additional financial information should be addressed to the Finance Department, 8000 South Redwood Road, West Jordan, Utah, 84088.
23

BASIC FINANCIAL STATEMENTS Government-wide Financial Statements
24

CITY OF WEST JORDAN STATEMENT OF NET POSITION JUNE 30, 2015
Governmental Business-typeActivities Activities Total
AssetsCash and cash equivalents 34,463,169$ 25,954,198$ 60,417,367$ Accounts receivable, net 480,368 3,936,177 4,416,545 Taxes receivable 20,471,931 - 20,471,931 Loans receivable 753,902 - 753,902 Intergovernmental receivable 158,335 - 158,335 Internal balances - - - Prepaid items 163,491 - 163,491 Inventory 48,356 196,474 244,830 Investement in joint venture - 4,718,439 4,718,439 Restricted assets:
Cash and cash equivalents 23,389,853 1,127,735 24,517,588 Intangible - 18,101,501 18,101,501 Capital assets not being depreciated 164,734,740 4,781,990 169,516,730 Capital assets being depreciated, net 118,990,978 142,509,918 261,500,896 Net pension asset 543,124 33,380 576,504
Total Assets 364,198,247 201,359,812 565,558,059
Deferred Outflows of ResourcesPensions 2,603,726 160,020 2,763,746 Deferred charge on refunding 213,256 - 213,256
Total Deferred Outflows of Resources 2,816,982 160,020 2,977,002
Total Assets and Deferred Outflows of Resources 367,015,229$ 201,519,832$ 568,535,061$
25
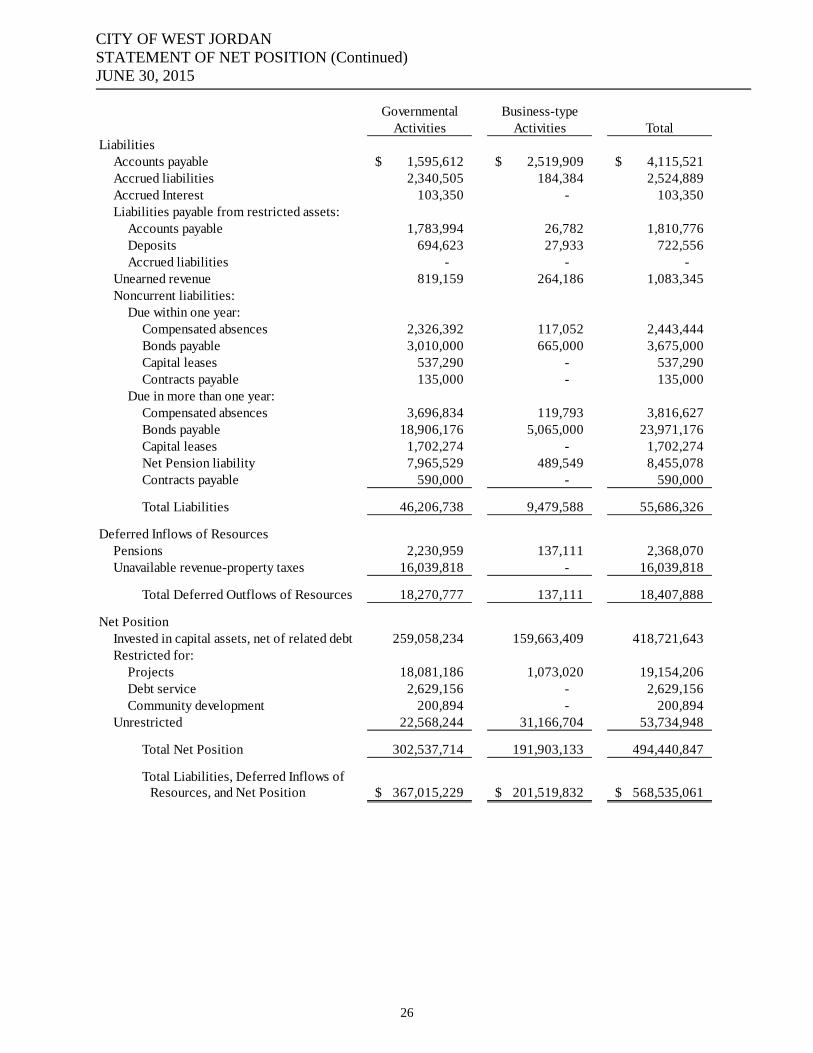
CITY OF WEST JORDAN STATEMENT OF NET POSITION (Continued) JUNE 30, 2015
Governmental Business-typeActivities Activities Total
LiabilitiesAccounts payable 1,595,612$ 2,519,909$ 4,115,521$ Accrued liabilities 2,340,505 184,384 2,524,889 Accrued Interest 103,350 - 103,350 Liabilities payable from restricted assets:
Accounts payable 1,783,994 26,782 1,810,776 Deposits 694,623 27,933 722,556 Accrued liabilities - - -
Unearned revenue 819,159 264,186 1,083,345 Noncurrent liabilities:
Due within one year:Compensated absences 2,326,392 117,052 2,443,444 Bonds payable 3,010,000 665,000 3,675,000 Capital leases 537,290 - 537,290 Contracts payable 135,000 - 135,000
Due in more than one year:Compensated absences 3,696,834 119,793 3,816,627 Bonds payable 18,906,176 5,065,000 23,971,176 Capital leases 1,702,274 - 1,702,274 Net Pension liability 7,965,529 489,549 8,455,078 Contracts payable 590,000 - 590,000
Total Liabilities 46,206,738 9,479,588 55,686,326
Deferred Inflows of ResourcesPensions 2,230,959 137,111 2,368,070 Unavailable revenue-property taxes 16,039,818 - 16,039,818
Total Deferred Outflows of Resources 18,270,777 137,111 18,407,888
Net PositionInvested in capital assets, net of related debt 259,058,234 159,663,409 418,721,643Restricted for:
Projects 18,081,186 1,073,020 19,154,206Debt service 2,629,156 - 2,629,156Community development 200,894 - 200,894
Unrestricted 22,568,244 31,166,704 53,734,948
Total Net Position 302,537,714 191,903,133 494,440,847
Total Liabilities, Deferred Inflows of Resources, and Net Position 367,015,229$ 201,519,832$ 568,535,061$
26
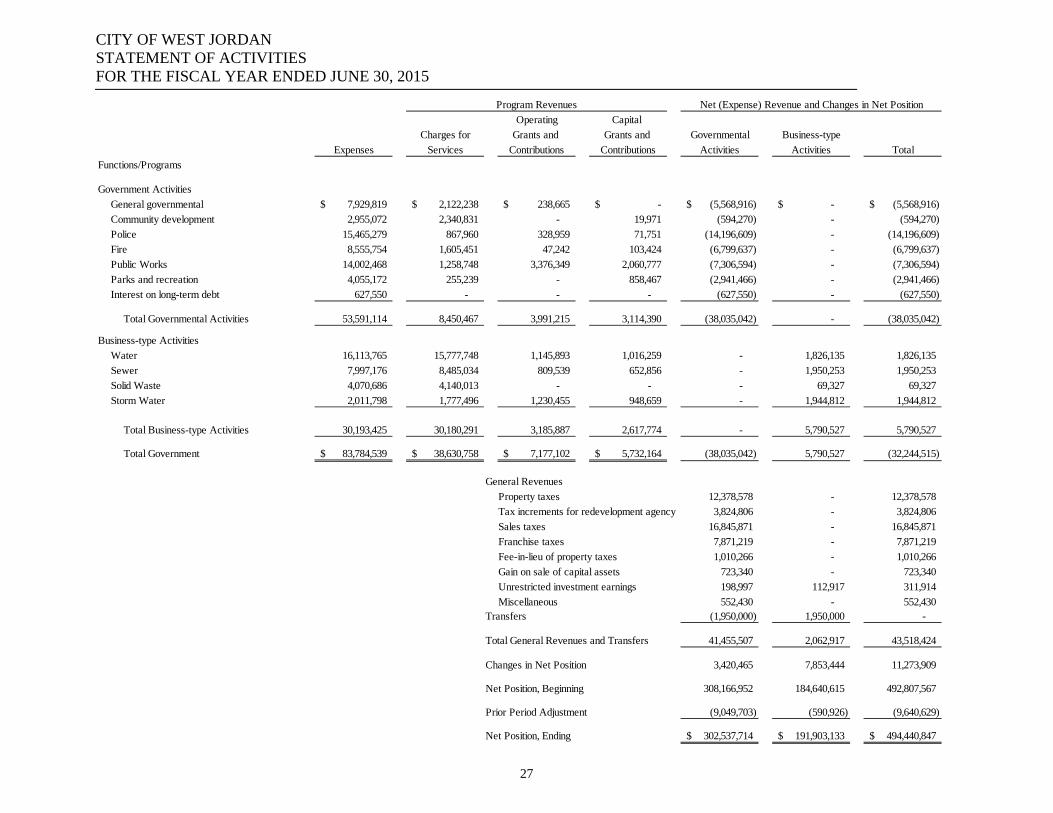
CITY OF WEST JORDAN STATEMENT OF ACTIVITIES FOR THE FISCAL YEAR ENDED JUNE 30, 2015
Operating Capital
Charges for Grants and Grants and Governmental Business-type
Expenses Services Contributions Contributions Activities Activities Total
Functions/Programs
Government Activities
General governmental 7,929,819$ # 2,122,238$ # 238,665$ # -$ # (5,568,916)$ -$ (5,568,916)$
Community development 2,955,072 # 2,340,831 # - # 19,971 # (594,270) - (594,270)
Police 15,465,279 # 867,960 # 328,959 # 71,751 # (14,196,609) - (14,196,609)
Fire 8,555,754 # 1,605,451 # 47,242 # 103,424 # (6,799,637) - (6,799,637)
Public Works 14,002,468 # 1,258,748 # 3,376,349 # 2,060,777 # (7,306,594) - (7,306,594)
Parks and recreation 4,055,172 # 255,239 # - # 858,467 # (2,941,466) - (2,941,466)
Interest on long-term debt 627,550 # - - - (627,550) - (627,550)
Total Governmental Activities 53,591,114 8,450,467 3,991,215 3,114,390 (38,035,042) - (38,035,042)
Business-type Activities
Water 16,113,765 15,777,748 1,145,893 1,016,259 - 1,826,135 1,826,135
Sewer 7,997,176 8,485,034 809,539 652,856 - 1,950,253 1,950,253
Solid Waste 4,070,686 4,140,013 - - - 69,327 69,327
Storm Water 2,011,798 1,777,496 1,230,455 948,659 - 1,944,812 1,944,812
Total Business-type Activities 30,193,425 30,180,291 3,185,887 2,617,774 - 5,790,527 5,790,527
Total Government 83,784,539$ 38,630,758$ 7,177,102$ 5,732,164$ (38,035,042) 5,790,527 (32,244,515)
General Revenues
Property taxes 12,378,578 - 12,378,578
Tax increments for redevelopment agency 3,824,806 - 3,824,806
Sales taxes 16,845,871 # - 16,845,871
Franchise taxes 7,871,219 # - 7,871,219
Fee-in-lieu of property taxes 1,010,266 # - 1,010,266
Gain on sale of capital assets 723,340 # - 723,340
Unrestricted investment earnings 198,997 # 112,917 311,914
Miscellaneous 552,430 # - 552,430 Transfers (1,950,000) # 1,950,000 -
Total General Revenues and Transfers 41,455,507 2,062,917 43,518,424
Changes in Net Position 3,420,465 7,853,444 11,273,909
Net Position, Beginning 308,166,952 184,640,615 492,807,567
Prior Period Adjustment (9,049,703) (590,926) (9,640,629)
Net Position, Ending 302,537,714$ 191,903,133$ 494,440,847$
Program Revenues Net (Expense) Revenue and Changes in Net Position
27

CITY OF WEST JORDAN BALANCE SHEET GOVERNMENTAL FUNDS JUNE 30, 2015
Balance Sheet – Governmental Funds Capital Road Capital Other Total
Redevelopment Support Improvement Governmental GovernmentalGeneral Agency Fund Fund Funds Funds
AssetsCash and cash equivalents 10,427,408$ 7,277,425$ 680,309$ 917,825$ 5,506,254$ 24,809,221$ Accounts receivable - net 470,368 - 10,000 - - 480,368 Taxes receivable 15,880,293 3,824,807 756,542 - 10,289 20,471,931 Loans receivable - - - - 753,902 753,902 Prepaid items 163,491 - - - - 163,491 Due from other governments - - - - 158,335 158,335 Due from other fund 90,419 - - - - 90,419 Restricted assets:
Cash and cash equivalents 5,949,524 138,452 6,600 11,107,137 6,188,140 23,389,853
Total Assets 32,981,503$ 11,240,684$ 1,453,451$ 12,024,962$ 12,616,920$ 70,317,520$
LiabilitiesAccounts payable 765,964$ 80,237$ -$ 61,874$ 343,089$ 1,251,164$ Accrued liabilities 2,309,937 - - - 4,500 2,314,437 Unearned revenue 64,927 - - - 754,232 819,159 Due to other funds - - - - 90,419 90,419 Liabilities payable from restrictedassets:
Accounts payable 22,023 - - 1,686,300 75,671 1,783,994 Accrued liabilities - - - - - - Deposits 694,623 - - - - 694,623
Total Liabilities 3,857,474 80,237 - 1,748,174 1,267,911 6,953,796
Deferred Inflows of ResourcesUnavailable revenue-property taxes 11,448,368 3,824,808 756,543 - 10,099 16,039,818 Unavailable revenue-ambulance 89,762 - - - - 89,762 Unavailable revenue-grants 57,267 - - - - 57,267
Total Deferred Inflows of Resources 11,595,397 3,824,808 756,543 - 10,099 16,186,847
Fund Balance
Nonspendable 163,491 - - - - 163,491 Restricted 5,232,878 138,452 6,600 9,420,837 6,112,469 20,911,236 Committed - - - - - - Assigned 769,975 7,197,187 690,308 855,951 5,226,441 14,739,862 Unassigned 11,362,288 - - - - 11,362,288
Total Net Position 17,528,632 7,335,639 696,908 10,276,788 11,338,910 47,176,877
Total Liabilities, Deferred Inflows ofResources, and Fund Balance 32,981,503$ 11,240,684$ 1,453,451$ 12,024,962$ 12,616,920$ 70,317,520$
28
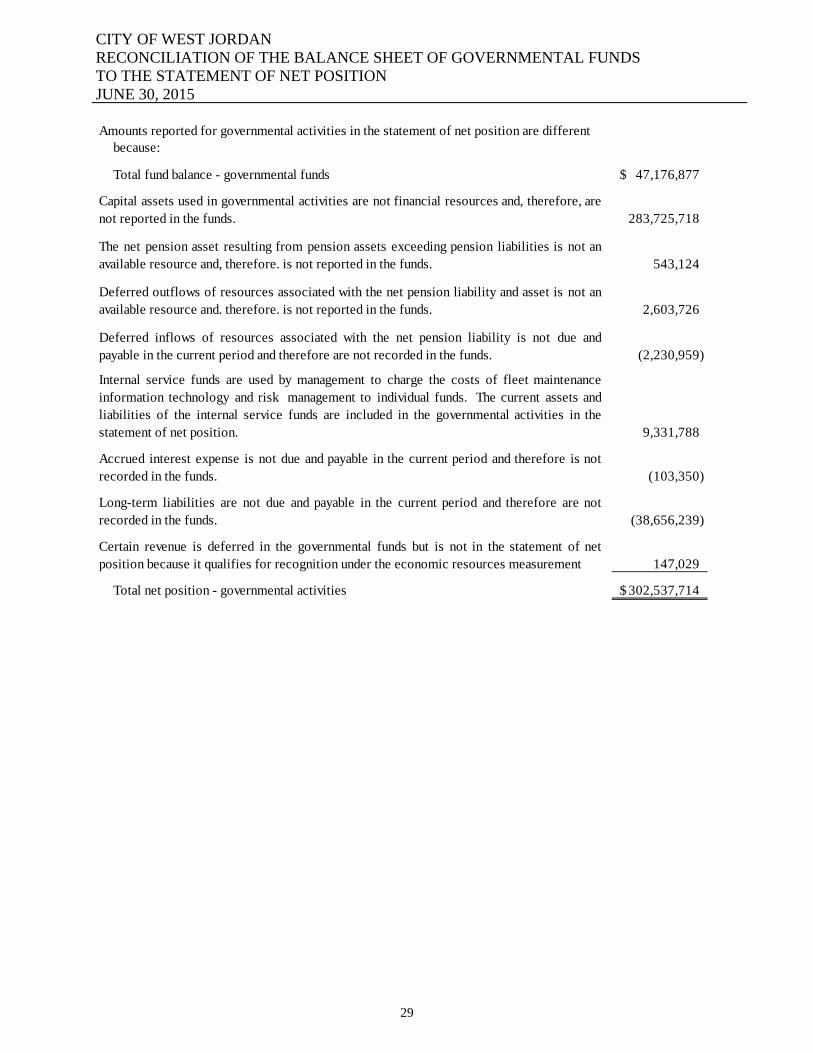
CITY OF WEST JORDAN RECONCILIATION OF THE BALANCE SHEET OF GOVERNMENTAL FUNDS TO THE STATEMENT OF NET POSITION JUNE 30, 2015
Balance Sheet of Governmental Funds to the Statement of Net Assets Amounts reported for governmental activities in the statement of net position are different
because:
Total fund balance - governmental funds 47,176,877$
283,725,718
543,124
2,603,726
Deferred inflows of resources associated with the net pension liability is not due andpayable in the current period and therefore are not recorded in the funds. (2,230,959)
9,331,788
(103,350)
(38,656,239)
147,029
Total net position - governmental activities 302,537,714$
Certain revenue is deferred in the governmental funds but is not in the statement of netposition because it qualifies for recognition under the economic resources measurement
Capital assets used in governmental activities are not financial resources and, therefore, arenot reported in the funds.
Internal service funds are used by management to charge the costs of fleet maintenanceinformation technology and risk management to individual funds. The current assets andliabilities of the internal service funds are included in the governmental activities in thestatement of net position.
Accrued interest expense is not due and payable in the current period and therefore is notrecorded in the funds.
Long-term liabilities are not due and payable in the current period and therefore are notrecorded in the funds.
The net pension asset resulting from pension assets exceeding pension liabilities is not anavailable resource and, therefore. is not reported in the funds.
Deferred outflows of resources associated with the net pension liability and asset is not anavailable resource and. therefore. is not reported in the funds.
29

CITY OF WEST JORDAN STATEMENT OF REVENUES, EXPENDITURES AND CHANGES IN FUND BALANCES GOVERNMENTAL FUNDS FOR THE FISCAL YEAR ENDED JUNE 30, 2015
Statement of Revenues, Expenditures and Changes in Fund Balances – Governmental Funds Capital Road Capital Other Total
Redevelopment Support Improvement Governmental GovernmentalGeneral Agency Fund Fund Funds Funds
RevenuesTaxes 36,952,271$ 3,824,806$ 1,142,596$ -$ 11,067$ 41,930,740$ Licenses and permits 2,392,798 - - - - 2,392,798 Intergovernmental 4,356,169 - - 47,000 500,955 4,904,124 Charges for services 3,766,990 - - - 856,648 4,623,638 Fines and forfeitures 1,481,938 - - - - 1,481,938 Impact fees - - - 1,613,344 1,028,121 2,641,465 Interest 86,073 29,831 2,573 37,607 47,938 204,022 Miscellaneous 98,876 - - - - 98,876
Total Revenues 49,135,115 3,854,637 1,145,169 1,697,951 2,444,729 58,277,601
ExpendituresCurrent:
General government 8,489,415 - - - - 8,489,415 Community development 1,614,245 995,342 27,900 - 457,630 3,095,117 Police 16,160,702 - - - - 16,160,702 Fire 9,993,547 - - - - 9,993,547 Public works 4,788,872 108,480 - - - 4,897,352 Parks and recreation 2,973,971 - 108,812 - 5,663 3,088,446
Debt service:Principal 36,543 655,000 1,005,000 - 960,000 2,656,543 Interest - 135,103 235,496 - 179,383 549,982
Capital outlay:Roads - - - 8,164,511 - 8,164,511 Building - - - - 3,112,702 3,112,702 Parks - - - - 959,287 959,287
Total Expenditures 44,057,295 1,893,925 1,377,208 8,164,511 5,674,665 61,167,604
Excess (Deficiency) of Revenues Over (Under) Expenditures 5,077,820 1,960,712 (232,039) (6,466,560) (3,229,936) (2,890,003)
Other Financing Sources (Uses)Transfers in - - - 7,385,637 4,201,617 11,587,254 Transfers out (6,885,637) (201,617) (6,500,000) - - (13,587,254) Issuance of bonds - - 6,530,000 - - 6,530,000 Issuance of Capital Lease 135,009 - - - - 135,009 Sale of capital assets 164,500 - - - - 164,500
Total Other Financing Sources (Uses) (6,586,128) (201,617) 30,000 7,385,637 4,201,617 4,829,509
Net Change in Fund Balances (1,508,308) 1,759,095 (202,039) 919,077 971,681 1,939,506
Fund Balance, Beginning 19,036,940 5,576,544 898,947 9,357,711 10,201,872 45,072,014
Prior Period Adj - - - - 165,357 165,357
Fund Balance, Ending 17,528,632$ 7,335,639$ 696,908$ 10,276,788$ 11,338,910$ 47,176,877$
30
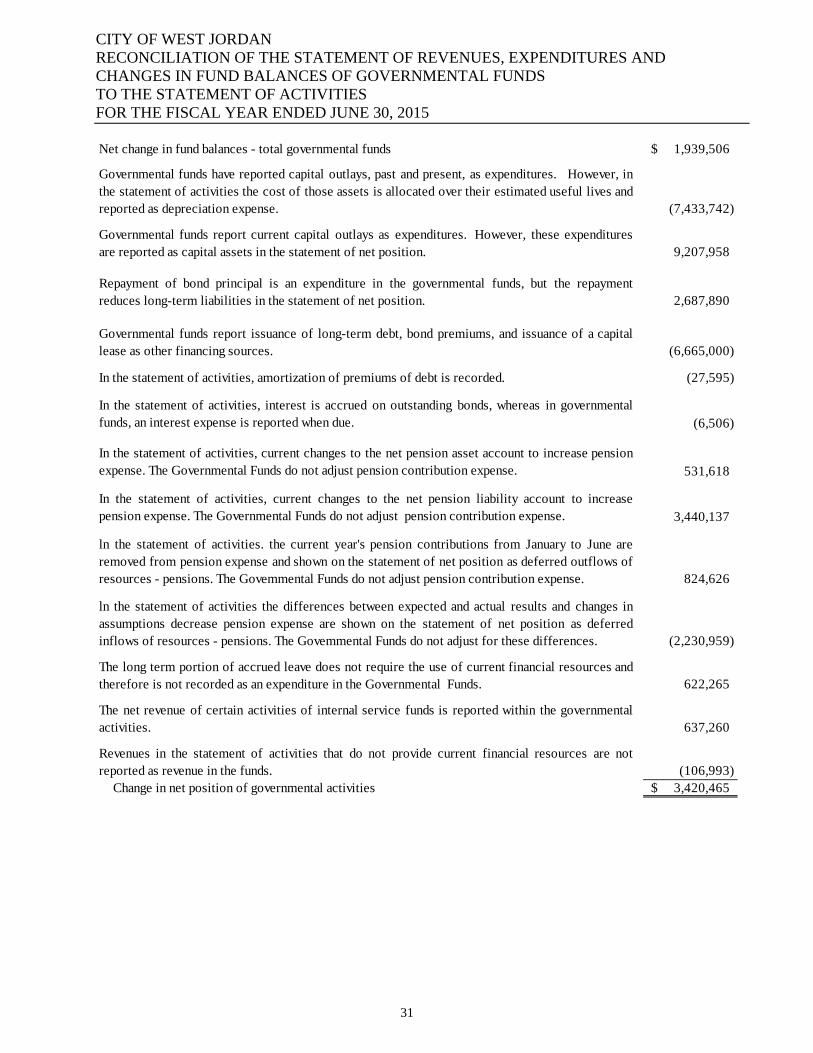
CITY OF WEST JORDAN RECONCILIATION OF THE STATEMENT OF REVENUES, EXPENDITURES AND CHANGES IN FUND BALANCES OF GOVERNMENTAL FUNDS TO THE STATEMENT OF ACTIVITIES FOR THE FISCAL YEAR ENDED JUNE 30, 2015
Net change in fund balances - total governmental funds 1,939,506$
(7,433,742)
9,207,958
2,687,890
(6,665,000)
In the statement of activities, amortization of premiums of debt is recorded. (27,595)
(6,506)
531,618
3,440,137
824,626
(2,230,959)
622,265
637,260
(106,993)Change in net position of governmental activities 3,420,465$
ln the statement of activities. the current year's pension contributions from January to June areremoved from pension expense and shown on the statement of net position as deferred outflows ofresources - pensions. The Govemmental Funds do not adjust pension contribution expense.
ln the statement of activities the differences between expected and actual results and changes inassumptions decrease pension expense are shown on the statement of net position as deferredinflows of resources - pensions. The Govemmental Funds do not adjust for these differences.
Governmental funds have reported capital outlays, past and present, as expenditures. However, inthe statement of activities the cost of those assets is allocated over their estimated useful lives andreported as depreciation expense.
Governmental funds report current capital outlays as expenditures. However, these expendituresare reported as capital assets in the statement of net position.
Repayment of bond principal is an expenditure in the governmental funds, but the repaymentreduces long-term liabilities in the statement of net position.
In the statement of activities, interest is accrued on outstanding bonds, whereas in governmentalfunds, an interest expense is reported when due.
The long term portion of accrued leave does not require the use of current financial resources andtherefore is not recorded as an expenditure in the Governmental Funds.
The net revenue of certain activities of internal service funds is reported within the governmentalactivities.
Revenues in the statement of activities that do not provide current financial resources are notreported as revenue in the funds.
Governmental funds report issuance of long-term debt, bond premiums, and issuance of a capitallease as other financing sources.
In the statement of activities, current changes to the net pension asset account to increase pensionexpense. The Governmental Funds do not adjust pension contribution expense.
In the statement of activities, current changes to the net pension liability account to increasepension expense. The Governmental Funds do not adjust pension contribution expense.
31
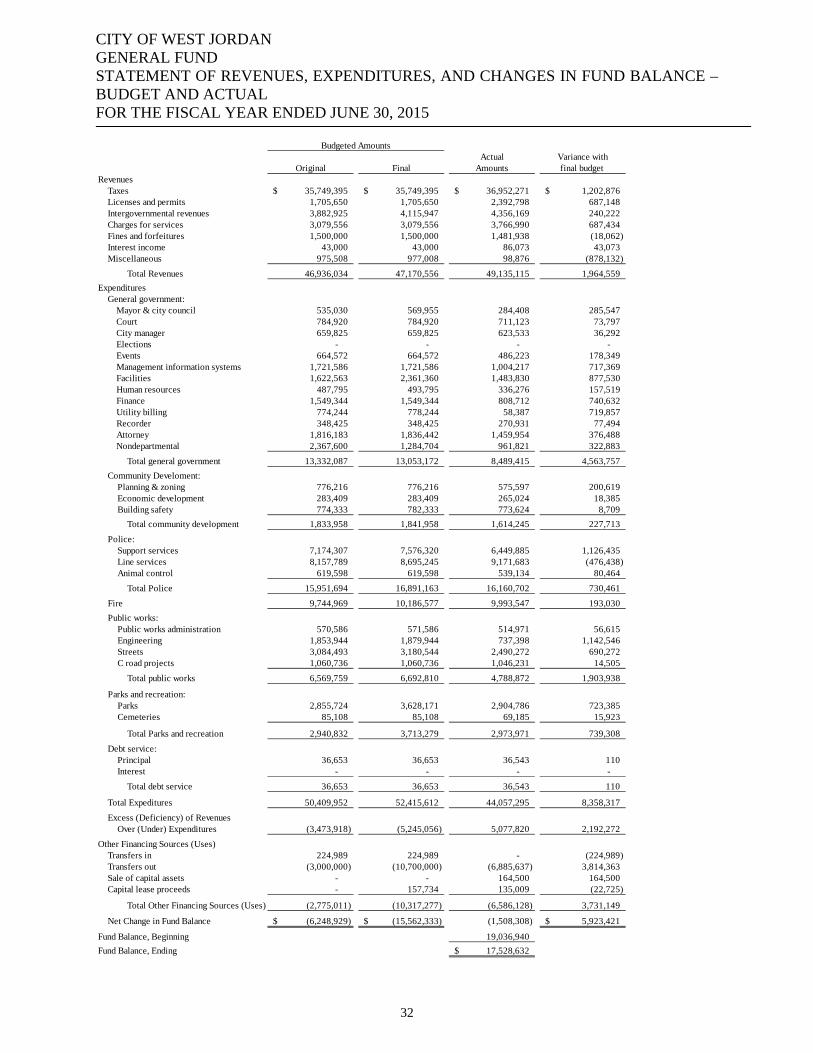
CITY OF WEST JORDAN GENERAL FUND STATEMENT OF REVENUES, EXPENDITURES, AND CHANGES IN FUND BALANCE – BUDGET AND ACTUAL FOR THE FISCAL YEAR ENDED JUNE 30, 2015
Actual Variance withOriginal Final Amounts final budget
RevenuesTaxes 35,749,395$ 35,749,395$ 36,952,271$ 1,202,876$ Licenses and permits 1,705,650 1,705,650 2,392,798 687,148 Intergovernmental revenues 3,882,925 4,115,947 4,356,169 240,222 Charges for services 3,079,556 3,079,556 3,766,990 687,434 Fines and forfeitures 1,500,000 1,500,000 1,481,938 (18,062) Interest income 43,000 43,000 86,073 43,073 Miscellaneous 975,508 977,008 98,876 (878,132)
Total Revenues 46,936,034 47,170,556 49,135,115 1,964,559
ExpendituresGeneral government: Mayor & city council 535,030 569,955 284,408 285,547 Court 784,920 784,920 711,123 73,797 City manager 659,825 659,825 623,533 36,292 Elections - - - - Events 664,572 664,572 486,223 178,349 Management information systems 1,721,586 1,721,586 1,004,217 717,369 Facilities 1,622,563 2,361,360 1,483,830 877,530 Human resources 487,795 493,795 336,276 157,519 Finance 1,549,344 1,549,344 808,712 740,632 Utility billing 774,244 778,244 58,387 719,857 Recorder 348,425 348,425 270,931 77,494 Attorney 1,816,183 1,836,442 1,459,954 376,488 Nondepartmental 2,367,600 1,284,704 961,821 322,883
Total general government 13,332,087 13,053,172 8,489,415 4,563,757
Community Develoment:Planning & zoning 776,216 776,216 575,597 200,619 Economic development 283,409 283,409 265,024 18,385 Building safety 774,333 782,333 773,624 8,709
Total community development 1,833,958 1,841,958 1,614,245 227,713
Police:Support services 7,174,307 7,576,320 6,449,885 1,126,435 Line services 8,157,789 8,695,245 9,171,683 (476,438) Animal control 619,598 619,598 539,134 80,464
Total Police 15,951,694 16,891,163 16,160,702 730,461
Fire 9,744,969 10,186,577 9,993,547 193,030
Public works:Public works administration 570,586 571,586 514,971 56,615 Engineering 1,853,944 1,879,944 737,398 1,142,546 Streets 3,084,493 3,180,544 2,490,272 690,272 C road projects 1,060,736 1,060,736 1,046,231 14,505
Total public works 6,569,759 6,692,810 4,788,872 1,903,938
Parks and recreation:Parks 2,855,724 3,628,171 2,904,786 723,385 Cemeteries 85,108 85,108 69,185 15,923
Total Parks and recreation 2,940,832 3,713,279 2,973,971 739,308
Debt service:Principal 36,653 36,653 36,543 110 Interest - - - -
Total debt service 36,653 36,653 36,543 110
Total Expeditures 50,409,952 52,415,612 44,057,295 8,358,317
Excess (Deficiency) of Revenues Over (Under) Expenditures (3,473,918) (5,245,056) 5,077,820 2,192,272
Other Financing Sources (Uses)Transfers in 224,989 224,989 - (224,989) Transfers out (3,000,000) (10,700,000) (6,885,637) 3,814,363 Sale of capital assets - - 164,500 164,500 Capital lease proceeds - 157,734 135,009 (22,725)
Total Other Financing Sources (Uses) (2,775,011) (10,317,277) (6,586,128) 3,731,149
Net Change in Fund Balance (6,248,929)$ (15,562,333)$ (1,508,308) 5,923,421$
Fund Balance, Beginning 19,036,940
Fund Balance, Ending 17,528,632$
Budgeted Amounts
32
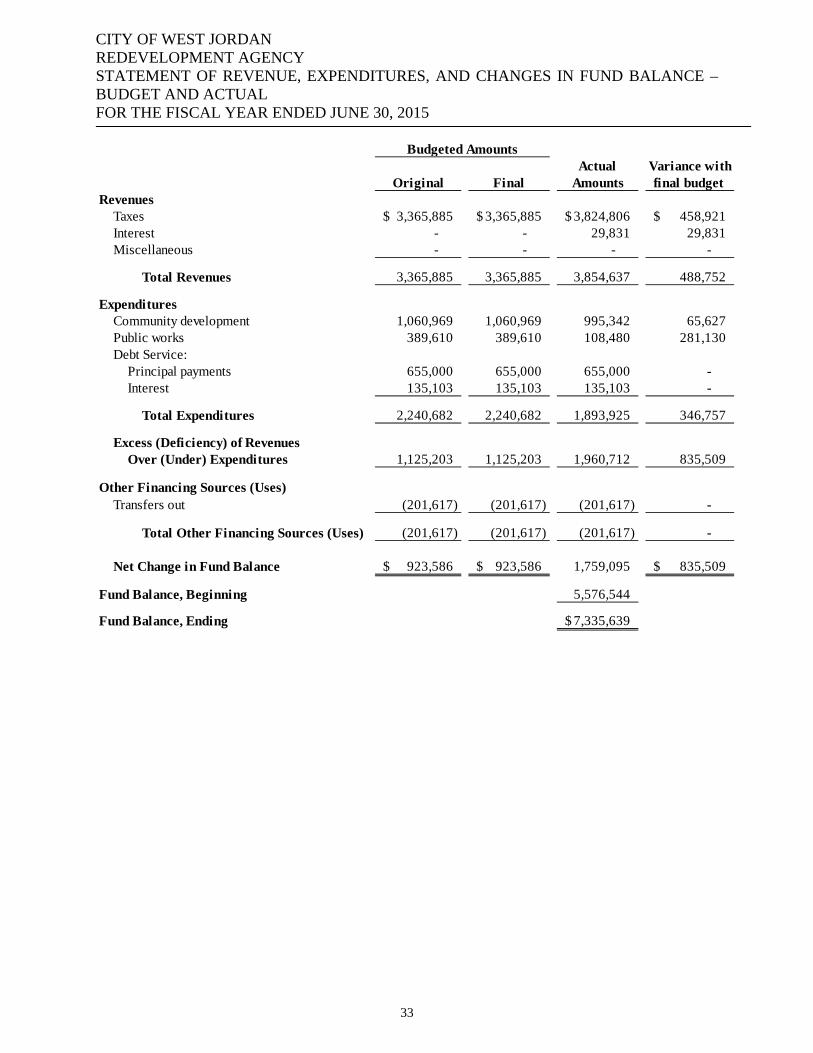
CITY OF WEST JORDAN REDEVELOPMENT AGENCY STATEMENT OF REVENUE, EXPENDITURES, AND CHANGES IN FUND BALANCE – BUDGET AND ACTUAL FOR THE FISCAL YEAR ENDED JUNE 30, 2015
Actual Variance withOriginal Final Amounts final budget
RevenuesTaxes 3,365,885$ 3,365,885$ 3,824,806$ 458,921$ Interest - - 29,831 29,831 Miscellaneous - - - -
Total Revenues 3,365,885 3,365,885 3,854,637 488,752
ExpendituresCommunity development 1,060,969 1,060,969 995,342 65,627 Public works 389,610 389,610 108,480 281,130 Debt Service:
Principal payments 655,000 655,000 655,000 - Interest 135,103 135,103 135,103 -
Total Expenditures 2,240,682 2,240,682 1,893,925 346,757
Excess (Deficiency) of Revenues Over (Under) Expenditures 1,125,203 1,125,203 1,960,712 835,509
Other Financing Sources (Uses)Transfers out (201,617) (201,617) (201,617) -
Total Other Financing Sources (Uses) (201,617) (201,617) (201,617) -
Net Change in Fund Balance 923,586$ 923,586$ 1,759,095 835,509$
Fund Balance, Beginning 5,576,544
Fund Balance, Ending 7,335,639$
Budgeted Amounts
33
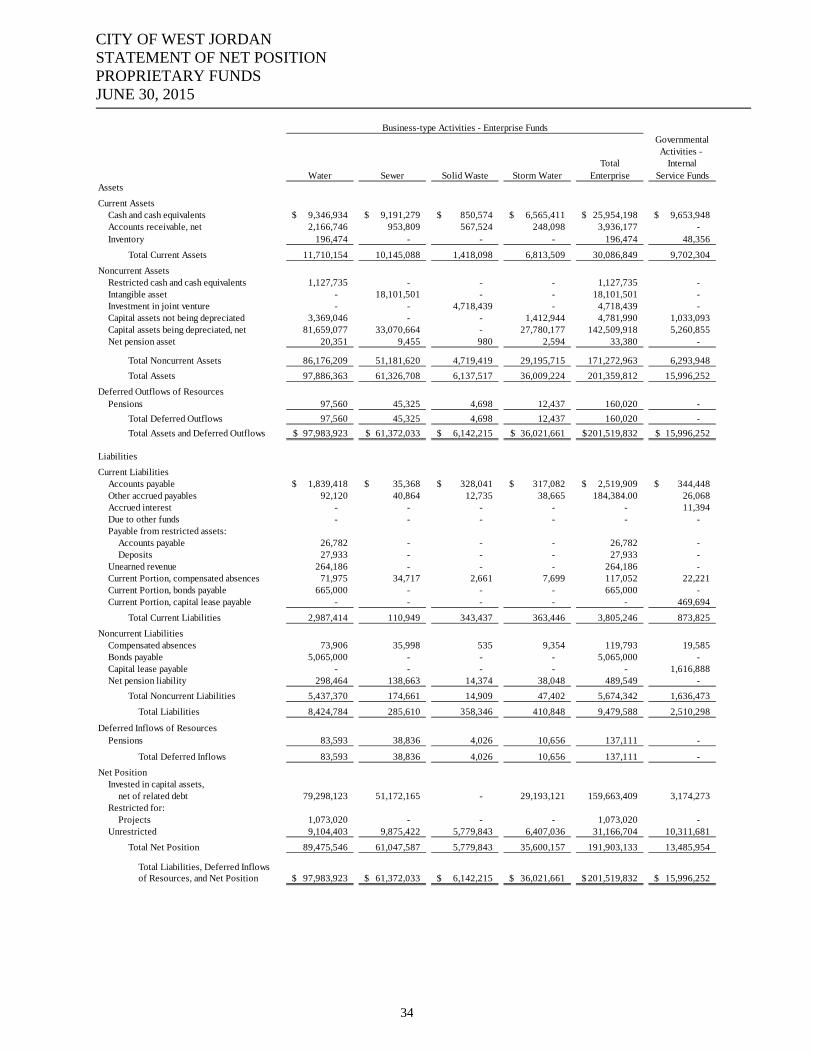
CITY OF WEST JORDAN STATEMENT OF NET POSITION PROPRIETARY FUNDS JUNE 30, 2015
GovernmentalActivities -
Total InternalWater Sewer Solid Waste Storm Water Enterprise Service Funds
Assets
Current AssetsCash and cash equivalents 9,346,934$ 9,191,279$ 850,574$ 6,565,411$ 25,954,198$ 9,653,948$ Accounts receivable, net 2,166,746 953,809 567,524 248,098 3,936,177 - Inventory 196,474 - - - 196,474 48,356
Total Current Assets 11,710,154 10,145,088 1,418,098 6,813,509 30,086,849 9,702,304
Noncurrent AssetsRestricted cash and cash equivalents 1,127,735 - - - 1,127,735 - Intangible asset - 18,101,501 - - 18,101,501 - Investment in joint venture - - 4,718,439 - 4,718,439 - Capital assets not being depreciated 3,369,046 - - 1,412,944 4,781,990 1,033,093 Capital assets being depreciated, net 81,659,077 33,070,664 - 27,780,177 142,509,918 5,260,855 Net pension asset 20,351 9,455 980 2,594 33,380 -
Total Noncurrent Assets 86,176,209 51,181,620 4,719,419 29,195,715 171,272,963 6,293,948
Total Assets 97,886,363 61,326,708 6,137,517 36,009,224 201,359,812 15,996,252
Deferred Outflows of ResourcesPensions 97,560 45,325 4,698 12,437 160,020 -
Total Deferred Outflows 97,560 45,325 4,698 12,437 160,020 -
Total Assets and Deferred Outflows 97,983,923$ 61,372,033$ 6,142,215$ 36,021,661$ 201,519,832$ 15,996,252$
Liabilities
Current LiabilitiesAccounts payable 1,839,418$ 35,368$ 328,041$ 317,082$ 2,519,909$ 344,448$ Other accrued payables 92,120 40,864 12,735 38,665 184,384.00 26,068 Accrued interest - - - - - 11,394 Due to other funds - - - - - - Payable from restricted assets:
Accounts payable 26,782 - - - 26,782 - Deposits 27,933 - - - 27,933 -
Unearned revenue 264,186 - - - 264,186 - Current Portion, compensated absences 71,975 34,717 2,661 7,699 117,052 22,221 Current Portion, bonds payable 665,000 - - - 665,000 - Current Portion, capital lease payable - - - - - 469,694
Total Current Liabilities 2,987,414 110,949 343,437 363,446 3,805,246 873,825
Noncurrent LiabilitiesCompensated absences 73,906 35,998 535 9,354 119,793 19,585 Bonds payable 5,065,000 - - - 5,065,000 - Capital lease payable - - - - - 1,616,888 Net pension liability 298,464 138,663 14,374 38,048 489,549 -
Total Noncurrent Liabilities 5,437,370 174,661 14,909 47,402 5,674,342 1,636,473
Total Liabilities 8,424,784 285,610 358,346 410,848 9,479,588 2,510,298
Deferred Inflows of ResourcesPensions 83,593 38,836 4,026 10,656 137,111 -
Total Deferred Inflows 83,593 38,836 4,026 10,656 137,111 -
Net PositionInvested in capital assets,
net of related debt 79,298,123 51,172,165 - 29,193,121 159,663,409 3,174,273 Restricted for:
Projects 1,073,020 - - - 1,073,020 - Unrestricted 9,104,403 9,875,422 5,779,843 6,407,036 31,166,704 10,311,681
Total Net Position 89,475,546 61,047,587 5,779,843 35,600,157 191,903,133 13,485,954
Total Liabilities, Deferred Inflows of Resources, and Net Position 97,983,923$ 61,372,033$ 6,142,215$ 36,021,661$ 201,519,832$ 15,996,252$
Business-type Activities - Enterprise Funds
Proprietary Funds S
34
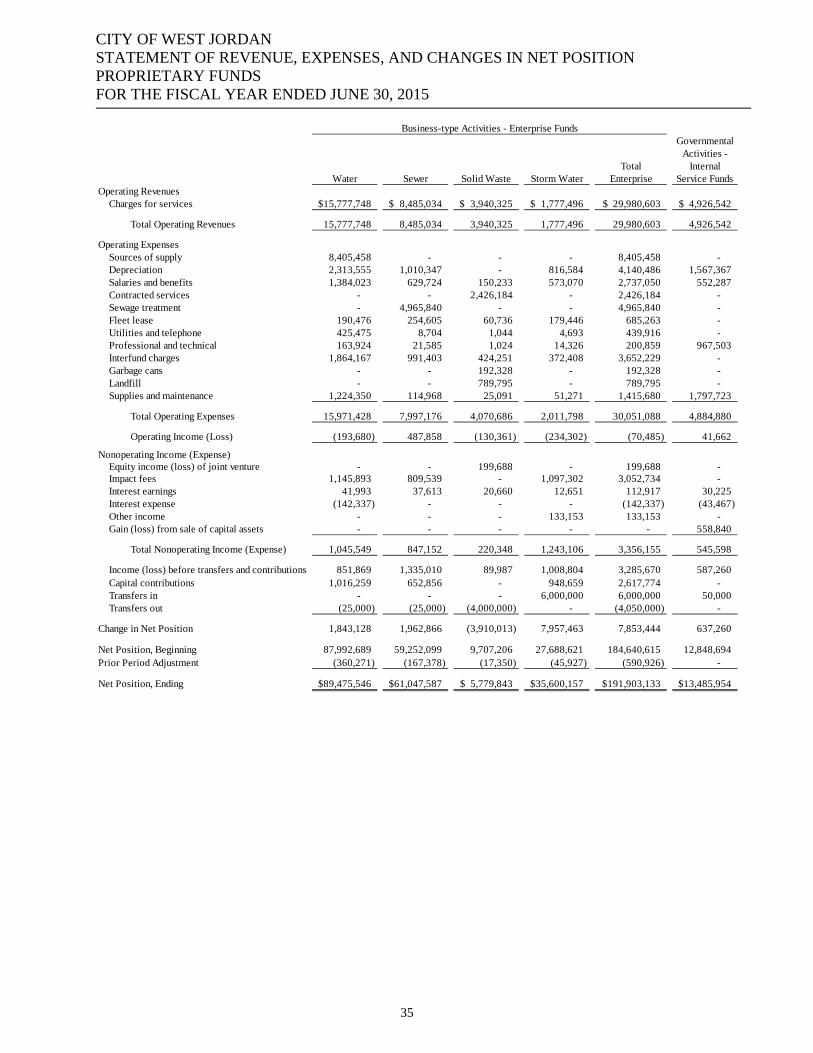
CITY OF WEST JORDAN STATEMENT OF REVENUE, EXPENSES, AND CHANGES IN NET POSITION PROPRIETARY FUNDS FOR THE FISCAL YEAR ENDED JUNE 30, 2015
GovernmentalActivities -
Total InternalWater Sewer Solid Waste Storm Water Enterprise Service Funds
Operating RevenuesCharges for services 15,777,748$ 8,485,034$ 3,940,325$ 1,777,496$ 29,980,603$ 4,926,542$
Total Operating Revenues 15,777,748 8,485,034 3,940,325 1,777,496 29,980,603 4,926,542
Operating ExpensesSources of supply 8,405,458 - - - 8,405,458 - Depreciation 2,313,555 1,010,347 - 816,584 4,140,486 1,567,367 Salaries and benefits 1,384,023 629,724 150,233 573,070 2,737,050 552,287 Contracted services - - 2,426,184 - 2,426,184 - Sewage treatment - 4,965,840 - - 4,965,840 - Fleet lease 190,476 254,605 60,736 179,446 685,263 - Utilities and telephone 425,475 8,704 1,044 4,693 439,916 - Professional and technical 163,924 21,585 1,024 14,326 200,859 967,503 Interfund charges 1,864,167 991,403 424,251 372,408 3,652,229 - Garbage cans - - 192,328 - 192,328 - Landfill - - 789,795 - 789,795 - Supplies and maintenance 1,224,350 114,968 25,091 51,271 1,415,680 1,797,723
Total Operating Expenses 15,971,428 7,997,176 4,070,686 2,011,798 30,051,088 4,884,880
Operating Income (Loss) (193,680) 487,858 (130,361) (234,302) (70,485) 41,662
Nonoperating Income (Expense)Equity income (loss) of joint venture - - 199,688 - 199,688 - Impact fees 1,145,893 809,539 - 1,097,302 3,052,734 - Interest earnings 41,993 37,613 20,660 12,651 112,917 30,225 Interest expense (142,337) - - - (142,337) (43,467) Other income - - - 133,153 133,153 - Gain (loss) from sale of capital assets - - - - - 558,840
Total Nonoperating Income (Expense) 1,045,549 847,152 220,348 1,243,106 3,356,155 545,598
Income (loss) before transfers and contributions 851,869 1,335,010 89,987 1,008,804 3,285,670 587,260 Capital contributions 1,016,259 652,856 - 948,659 2,617,774 - Transfers in - - - 6,000,000 6,000,000 50,000 Transfers out (25,000) (25,000) (4,000,000) - (4,050,000) -
Change in Net Position 1,843,128 1,962,866 (3,910,013) 7,957,463 7,853,444 637,260
Net Position, Beginning 87,992,689 59,252,099 9,707,206 27,688,621 184,640,615 12,848,694 Prior Period Adjustment (360,271) (167,378) (17,350) (45,927) (590,926) -
Net Position, Ending 89,475,546$ 61,047,587$ 5,779,843$ 35,600,157$ 191,903,133$ 13,485,954$
Business-type Activities - Enterprise Funds
Chant Assets
35

CITY OF WEST JORDAN STATEMENT OF CASH FLOWS PROPRIETARY FUNDS FOR THE FISCAL YEAR ENDED JUNE 30, 2015
Governmental
Activities -
Total Internal
Water Sewer Solid Waste Storm Water Enterprise Service Funds
Cash Flows From Operating Activities
Receipts from customers and users 15,872,326$ 8,419,766$ 3,897,186$ 1,759,109$ 29,948,387$ -$
Receipts from interfund services provided - - - - - 4,926,542
Payments for goods/services (11,544,903) (5,100,008) (3,355,794) 5,052 (19,995,653) (2,945,189)
Payments for interfund services used (2,054,643) (1,246,008) (484,987) (551,854) (4,337,492) -
Payments to employees (1,465,828) (642,240) (150,998) (618,792) (2,877,858) (539,298)
Net cash flows from operating activities 806,952 1,431,510 (94,593) 593,515 2,737,384 1,442,055
Cash Flows From Non-Capital Financing
Activities
Receipts from other entities - - - 133,153 133,153 -
Transfers in - - - 6,000,000 6,000,000 50,000
Transfers out (25,000) (25,000) (4,000,000) - (4,050,000) -
Net cash flows from non-capital financing
activities (25,000) (25,000) (4,000,000) 6,133,153 2,083,153 50,000
Cash Flows From Capital and Related Financing
ActivitiesAcquisition of capital assets (5,841,259) (943,633) - (1,926,106) (8,710,998) (1,838,596) Purchase of intangible assets - (860,343) - - (860,343) - Proceeds from sales of capital assets - - - - - 560,140 Payment on advances from general fund - - - (2,000,000) (2,000,000) - Principal payments on bonds (650,000) - - - (650,000) - Interest paid on revenue bonds (142,337) - - - (142,337) - Payments on capital leases - - - - - (552,357) Interest paid on capital leases - - - - - (40,025)
Impact fees collected 1,145,893 809,539 - 1,097,302 3,052,734 -
Net cash flows from capital and
related financing activities (5,487,703) (994,437) - (2,828,804) (9,310,944) (1,870,838)
Cash Flows From Investing Activities
Change in equity investment - - 258,953 - 258,953 -
Interest on investments 41,993 37,613 20,660 12,651 112,917 30,225
Net cash flows from investing activities 41,993 37,613 279,613 12,651 371,870 30,225
Net Increase (Decrease) In Cash and Cash
Equivalents (4,663,758) 449,686 (3,814,980) 3,910,515 (4,118,537) (348,558)
Cash and Cash Equivalents, Beginning 15,138,427 8,741,593 4,665,554 2,654,896 31,200,470 10,002,506
Cash and Cash Equivalents, Ending 10,474,669$ 9,191,279$ 850,574$ 6,565,411$ 27,081,933$ 9,653,948$
Business-type Activities - Enterprise Funds
36
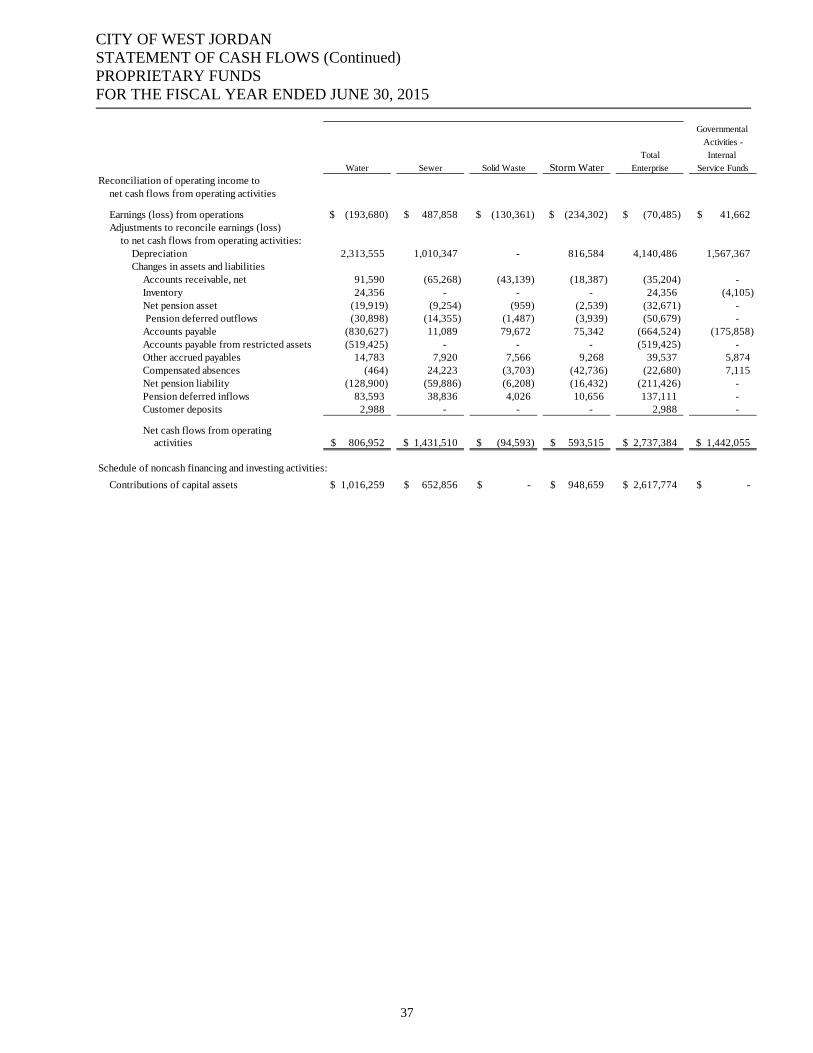
CITY OF WEST JORDAN STATEMENT OF CASH FLOWS (Continued) PROPRIETARY FUNDS FOR THE FISCAL YEAR ENDED JUNE 30, 2015
Governmental
Activities -
Total Internal
Water Sewer Solid Waste Storm Water Enterprise Service Funds
Reconciliation of operating income tonet cash flows from operating activities
Earnings (loss) from operations (193,680)$ 487,858$ (130,361)$ (234,302)$ (70,485)$ 41,662$ Adjustments to reconcile earnings (loss)
to net cash flows from operating activities:Depreciation 2,313,555 1,010,347 - 816,584 4,140,486 1,567,367 Changes in assets and liabilities
Accounts receivable, net 91,590 (65,268) (43,139) (18,387) (35,204) - Inventory 24,356 - - - 24,356 (4,105) Net pension asset (19,919) (9,254) (959) (2,539) (32,671) - Pension deferred outflows (30,898) (14,355) (1,487) (3,939) (50,679) - Accounts payable (830,627) 11,089 79,672 75,342 (664,524) (175,858) Accounts payable from restricted assets (519,425) - - - (519,425) - Other accrued payables 14,783 7,920 7,566 9,268 39,537 5,874 Compensated absences (464) 24,223 (3,703) (42,736) (22,680) 7,115 Net pension liability (128,900) (59,886) (6,208) (16,432) (211,426) - Pension deferred inflows 83,593 38,836 4,026 10,656 137,111 - Customer deposits 2,988 - - - 2,988 -
Net cash flows from operatingactivities 806,952$ 1,431,510$ (94,593)$ 593,515$ 2,737,384$ 1,442,055$
Schedule of noncash financing and investing activities:
Contributions of capital assets 1,016,259$ 652,856$ -$ 948,659$ 2,617,774$ -$
37
CITY OF WEST JORDAN NOTES TO THE BASIC FINANCIAL STATEMENTS JUNE 30, 2015
NOTE 1 - SUMMARY OF SIGNIFICANT ACCOUNTING POLICIES
The basic financial statements of the City of West Jordan, Utah (the City) have been prepared in accordance with generally accepted accounting principles (GAAP) as applied to governmental units. The Governmental Accounting Standards Board (GASB) is the accepted standard-setting body for establishing GAAP. The more significant of the City’s accounting policies are described below: A. The Reporting Entity The City, incorporated in 1941, is a municipal corporation governed by an elected mayor and six-member council. The reporting entity consists of the primary government and component units. Component units are entities for which the government is considered to be financially accountable. Blended component units, although legally separate entities, are, in substance, part of the government's operations. Data from these units is combined with data from the primary government. The West Jordan Redevelopment Agency (RDA) and the West Jordan Municipal Building Authority (MBA) are included as blended component units. The RDA, a separate legal entity, is governed by a board composed of the members of the city council. Therefore, the RDA is reported as if it were part of the primary government because of the city’s ability to impose its will upon the operations of the RDA. The RDA is reported as a Special Revenue Fund. The MBA, a separate legal entity, is governed by a board composed of the members of the city council. Therefore, the MBA is reported as if it were part of the primary government because of the city’s ability to impose its will upon the operations of the MBA. The MBA is reported as a Capital Projects Fund. Separate financial statements are not issued for either of these component units. The City has no discretely presented component units. B. Basic Financial Statements – Government-wide Financial Statements The basic financial statements include both government-wide (reporting the City as a whole) and fund financial statements (reporting the City’s major funds). Both the government-wide financial statements and fund financial statements distinguish between those activities of the City that are governmental and those that are considered business-type activities. The statement of net position and the statement of activities are government-wide and include the financial activities of the primary government. Assets and liabilities are reported on a full accrual, economic resource basis, which recognizes all long term assets and receivables as well as long term debt and obligations. The City’s net position is reported in three parts; invested in capital assets-net of related debt, restricted net position, and unrestricted net position. The City first utilizes restricted resources to finance qualifying activities. The statement of net position presents the financial condition of the governmental and business-type activities of the City as of the end of the fiscal year.
38

CITY OF WEST JORDAN NOTES TO THE BASIC FINANCIAL STATEMENTS JUNE 30, 2015
NOTE 1 - SUMMARY OF SIGNIFICANT ACCOUNTING POLICIES (Continued)
B. Basic Financial Statements – Government-wide Financial Statements (Continued) The statement of activities demonstrates the degree to which the direct expenses of a given function or segment, are offset by program revenues. Direct expenses are those which are clearly identifiable with a specific function or segment. Program revenues include 1) charges to customers or applicants who purchase, use or directly benefit from goods, services or privileges provided be a given function or segment and 2) grants and contributions that are restricted to meeting the operational or capital requirements of a particular function or segment. Taxes and other items not properly included among program revenues are reported instead as general revenues. C. Basic Financial Statements – Fund Financial Statements The financial structure of the City has been organized on the basis of individual funds. Each fund is a self-balancing set of accounts consisting of its assets, liabilities, fund balance or retained earnings, revenue, and expenditures or expenses. Detailed accounting records are maintained for each individual fund; however, to provide maximum interest earnings on all idle funds of the City, all cash of the City is pooled for investment purposes. Interest earnings are allocated based upon a percentage method using the month-end cash balances of the individual funds. The various funds are summarized by type in the basic financial statements. These statements focus on the major funds. Major individual governmental funds and major individual enterprise funds are presented in separate columns while non-major funds are aggregated and then presented in a single column. GOVERNMENTAL FUND TYPES The focus of the governmental funds’ measurement (in the fund financial statements) is upon determination of financial position (sources, uses and balances of financial resources). The following is a description of the governmental funds of the City: General Fund – The General Fund is the primary operating fund of the City. It is used to account for all financial resources except those to be accounted for in another fund. Administrative services rendered to other funds are charged to such funds and are shown as charges for services. Special Revenue Funds – Special Revenue Funds are used to account for and report the proceeds of specific revenue sources that are restricted or committed to expenditure for specified purposes other than debt service or capital projects.
Capital Projects Funds – The Capital Projects Funds are used to account for financial resources to be used for the acquisition or construction of the major capital facilities of the City other than those financed by the proprietary funds.
39

CITY OF WEST JORDAN NOTES TO THE BASIC FINANCIAL STATEMENTS JUNE 30, 2015
NOTE 1 - SUMMARY OF SIGNIFICANT ACCOUNTING POLICIES (Continued) C. Basic Financial Statements – Fund Financial Statements (Continued) The following four funds are presented as major funds in the financial statements; (1) the General Fund (2) the Redevelopment Agency, to account for the financial activity of the Agency which derives its revenue from tax increment financing that will be utilized to rehabilitate and develop the defined redevelopment area. (3) Capital Support Fund, a capital project fund used to account for the construction of buildings and other improvements (4) Road Capital Improvement Fund, a capital project fund used to account for major road projects. PROPRIETARY FUND TYPES The proprietary financial statements are reported using the economic resources measurement focus and the accrual basis of accounting. Revenues are recorded when earned and expenses are recorded when a liability is incurred, regardless of the timing of related cash flows. The cities proprietary funds consist of: Enterprise Funds – Enterprise Funds are used to account for operations that are financed and operated in a manner similar to private business enterprises where the intent of the governing body is that the cost (expenses, including depreciation) of providing goods or services to the general public on a continuing basis be financed or recovered primarily through user charges. The existing enterprise funds account for construction, operation, maintenance, related debt, and property, plant and equipment within each fund. The City-owned water utility, wastewater utility, solid waste service, and storm water are presented as major funds. Internal Service Funds – Internal Service Funds are used to account for the financing of goods or services provided to other departments or agencies of the City on a cost-reimbursement basis. The City maintains internal service funds for fleet management, information technologies (computer replacement & management), and insurance/claims.
D. Measurement Focus and Basis of Accounting The government-wide financial statements and the proprietary fund statements are reported using the economic resources measurement focus and the accrual basis of accounting. Revenues are recorded when earned, and expenses are recorded when a liability is incurred. The proprietary fund statements distinguish operating revenues and expenses from non-operating items. Operating revenues and expenses generally result from providing services and delivering goods in connection with a proprietary fund’s principal ongoing operations. Operating revenues are charges for services. Operating expenses include costs of services as well as materials, contracts, personnel, and depreciation. All revenues and expenses not meeting these definitions are reported as non-operating revenues and expenses.
Unbilled services in the proprietary funds have been recorded as revenue and accounts receivable at June 30, 2015. The accounts receivable for these revenues are reported net of the allowance for doubtful accounts.
40
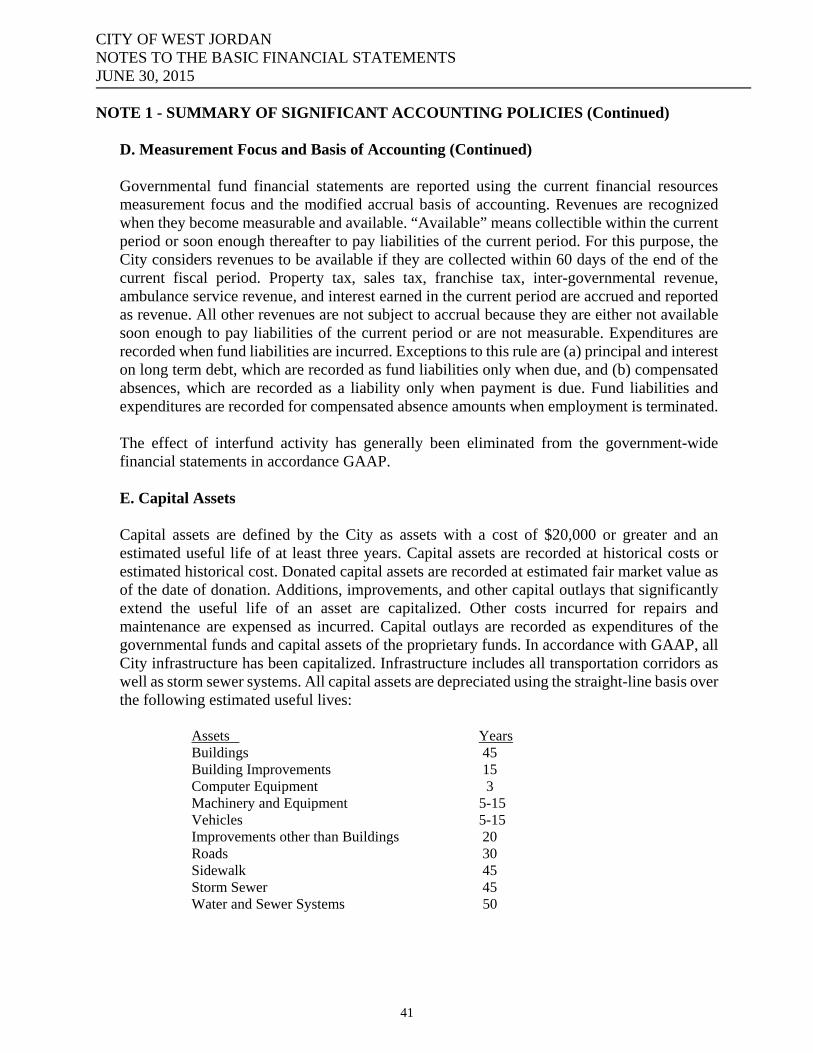
CITY OF WEST JORDAN NOTES TO THE BASIC FINANCIAL STATEMENTS JUNE 30, 2015
NOTE 1 - SUMMARY OF SIGNIFICANT ACCOUNTING POLICIES (Continued) D. Measurement Focus and Basis of Accounting (Continued) Governmental fund financial statements are reported using the current financial resources measurement focus and the modified accrual basis of accounting. Revenues are recognized when they become measurable and available. “Available” means collectible within the current period or soon enough thereafter to pay liabilities of the current period. For this purpose, the City considers revenues to be available if they are collected within 60 days of the end of the current fiscal period. Property tax, sales tax, franchise tax, inter-governmental revenue, ambulance service revenue, and interest earned in the current period are accrued and reported as revenue. All other revenues are not subject to accrual because they are either not available soon enough to pay liabilities of the current period or are not measurable. Expenditures are recorded when fund liabilities are incurred. Exceptions to this rule are (a) principal and interest on long term debt, which are recorded as fund liabilities only when due, and (b) compensated absences, which are recorded as a liability only when payment is due. Fund liabilities and expenditures are recorded for compensated absence amounts when employment is terminated. The effect of interfund activity has generally been eliminated from the government-wide financial statements in accordance GAAP.
E. Capital Assets Capital assets are defined by the City as assets with a cost of $20,000 or greater and an estimated useful life of at least three years. Capital assets are recorded at historical costs or estimated historical cost. Donated capital assets are recorded at estimated fair market value as of the date of donation. Additions, improvements, and other capital outlays that significantly extend the useful life of an asset are capitalized. Other costs incurred for repairs and maintenance are expensed as incurred. Capital outlays are recorded as expenditures of the governmental funds and capital assets of the proprietary funds. In accordance with GAAP, all City infrastructure has been capitalized. Infrastructure includes all transportation corridors as well as storm sewer systems. All capital assets are depreciated using the straight-line basis over the following estimated useful lives: Assets Years Buildings 45 Building Improvements 15 Computer Equipment 3 Machinery and Equipment 5-15 Vehicles 5-15 Improvements other than Buildings 20 Roads 30 Sidewalk 45 Storm Sewer 45 Water and Sewer Systems 50
41
CITY OF WEST JORDAN NOTES TO THE BASIC FINANCIAL STATEMENTS JUNE 30, 2015
NOTE 1 - SUMMARY OF SIGNIFICANT ACCOUNTING POLICIES (Continued) F. Intangible Asset The City has an intangible asset related to South Valley Water Reclamation Facility (SVWRF). The City has capitalized their contributions that helped build the SVWRF sewage treatment plant for which the City has certain capacity rights for sewage treatment. G. Cash, Cash Equivalents, and Investments Cash and cash equivalents include amounts in demand deposits as well as short term investments with an original maturity date of less than 90 days. Investments are stated at their fair value or amortized cost at June 30, 2015. H. Restricted Assets Restricted assets include cash and investments that are legally restricted to their use. Impact fees are restricted within the capital projects, water, and sewer funds. Also, cash and investments are held by trustees for the debt service payments on bonded debt and for acquisition and construction of capital projects.
I. Inventory Inventory is valued at cost using the first-in first-out method (FIFO). The cost is recorded as an expenditure at the time individual items are used (Consumption Method). Reported inventories are equally offset by fund balance non-spendable which indicates that they do not constitute available spendable resources even though they are component of current assets. J. Prepaid Expenditures Prepaid amounts appear in the General Fund for health insurance premiums and the Western Stampede fund for expenditures related to the July 4th celebrations. Reported prepaid expenditures are equally offset by fund balance non-spendable which indicates that they do not constitute available spendable resources. K. Investment in Joint Venture The City has an investment in Trans-Jordan Cities Landfill, a joint venture. The City’s 21.70% interest in this joint venture is accounted for using the equity method. The City’s equity interest represents its explicit, measurable right to the net present or future resources of the joint ventures. Under this method, the Solid Waste Fund (Enterprise Fund) records its share of the joint venture's net income or loss for each period. This joint venture does not meet the criteria for inclusion in the City’s financial reports as a component unit because the City does not exercise administrative control. The complete financial statements for the Trans-Jordan Landfill, for the year ended June 30, 2015, can be obtained from the Trans-Jordan Landfill at 10873 South 7200 West, South Jordan, Utah 84095.
42

CITY OF WEST JORDAN NOTES TO THE BASIC FINANCIAL STATEMENTS JUNE 30, 2015
NOTE 1 - SUMMARY OF SIGNIFICANT ACCOUNTING POLICIES (Continued) L. Compensated Absences Vacation is earned on a biweekly basis at a rate determined by an employee’s years of service. Proprietary funds recognize an expense for all accrued vacation amounts when the vacation is earned. Governmental funds recognize an expenditure when vacation leave is used by employees or at termination. Comp-time is earned by non-exempt employees at a rate of time and one-half, while exempt employees earn comp time on an hour for hour basis. Exempt employees can earn a maximum of 80 hours of comp-time annually. The recognition of a liability is treated similarly to vacation. Employees also accumulate sick leave on a biweekly basis. Each year employees are eligible to be paid out 25% of their current year accrued, unused sick leave. Governmental funds recognize an expenditure when the sick leave is used. Proprietary funds recognize 25% of the current year accrued, unused sick leave at the end of the fiscal year.
In the governmental funds, the liability for compensated absences is reported only if they have matured (i.e., unused reimbursable leave still outstanding following an employee’s resignation or retirement). These compensated absences are typically liquidated through the General Fund. The noncurrent portion of these amounts for government funds is recognized within the government-wide statements and will appear as a reconciling item between the fund and government-wide statements and the fund statements. M. Deferred outflows/inflows of resources In addition to assets, the statement of financial position will sometimes report a separate section for deferred outflows of resources. This separate financial statement element, deferred outflows of resources, represents a consumption of net position that applies to a future period(s) and so will not be recognized as an outflow of resources (expense/expenditure) until then. The government only has one item that qualifies for reporting in this category. It is the deferred charge on refunding reported in the government-wide statement of net position. A deferred charge on refunding results from the difference in the carrying value of refunded debt and its reacquisition price. This amount is deferred and amortized over the shorter of the life of the refunded or refunding debt. In addition to liabilities, the statement of financial position will sometimes report a separate section for deferred inflows of resources. This separate financial statement element, deferred inflows of resources, represents an acquisition of net position that applies to a future period(s) and so will not be recognized as an inflow of resources (revenue) until that time. The government has items that qualify for reporting in this category. The governmental funds report unavailable revenues from four sources: property taxes, school district, ambulance and grants. These amounts are deferred and recognized as an inflow of resources in the period in which the amounts become available.
43
CITY OF WEST JORDAN NOTES TO THE BASIC FINANCIAL STATEMENTS JUNE 30, 2015
NOTE 1 - SUMMARY OF SIGNIFICANT ACCOUNTING POLICIES (Continued) N. Unearned Revenue Unearned revenue arises when resources are received by the City before it has earned them, as when grant monies are received prior to the incurrence of qualifying expenditures. In subsequent periods, when both revenue recognition criteria are met, or when the City has earned the resources, the revenue is recognized. O. Interfund Transactions During the course of normal operations, the City has transactions between funds to distribute administrative costs. These transactions are generally reflected as a reduction to the originally booked expenditure. In addition, short term loans have been made between funds and are reflected as “due to, due from” on the respective funds’ balance sheets.
P. Taxes On or before June 22 of each year, the City sets the property tax rate for various municipal purposes. If the City intends to increase property tax revenues above the certified tax rate, state law requires the City to provide public notice to property owners and hold public hearings. When these special public hearings are necessary, the adoption of the final budget is made subsequent to June 22. All property taxes levied by the City are assessed and collected by Salt Lake County. Taxes are attached as an enforceable lien as of January 1, are levied as of October 1, and are due November 30; any delinquent taxes are subject to a penalty. Unless the delinquent taxes and penalties are paid before January 15, a lien is attached to the property, and the amount of taxes and penalties bears interest from January 1 until paid. If after five years, delinquent taxes have not been paid, the County sells the property at a tax sale. Tax collections are remitted to the City from the County on a monthly basis. Sales taxes and telecommunications related taxes are collected by the Utah State Tax Commission and remitted to the City monthly. Franchise taxes are collected by natural gas, electric utilities, and cable television companies and remitted to the City periodically.
44

CITY OF WEST JORDAN NOTES TO THE BASIC FINANCIAL STATEMENTS JUNE 30, 2015
NOTE 1 - SUMMARY OF SIGNIFICANT ACCOUNTING POLICIES (Continued) Q. Fund Equity Classification Presentation of net position is classified in the government-wide financial statements as net position and is displayed in three components: 1. Invested in capital assets, net of related debt - consists of capital assets including restricted
capital assets, net of accumulated depreciation and reduced by the outstanding balances of any bonds, mortgages, notes, or other borrowings that are attributable to the acquisition, construction, or improvement of those assets.
2. Restricted net position – consists of net position with constraints placed on the use either by (a) external groups such as creditors, grantors, contributors, or laws or regulations of other governments; or (b) law through constitutional provisions or enabling legislation.
3. Unrestricted net position – all other net position that do not meet the definition of “restricted” or “invested in capital assets, net of related debt.”
The governmental fund equity is presented as Fund Balance; and is further classified as Non-spendable, Restricted, Committed, Assigned or Unassigned. 1. Non-spendable fund balance classification includes amounts that cannot be spent because
they are either (a) not in spendable form, or (b) legally or contractually required to be maintained intact.
2. Restricted fund balance is fund balance with constraints placed on the use either by (1) external groups such as creditors, grantors, contributors, or laws or regulations of other governments; or (2) law through constitutional provisions or enabling legislations.
3. Committed fund balance classification include those funds that can only be used for specific purpose pursuant to constraints imposed by formal action of the City Council (ordinance for the City, RDA and MBA), which is this government’s highest level of decision making authority and remain binding unless removed in the same manner.
4. Assigned fund balance classification includes amounts that are constrained by the government’s intent to use the funds for specific purposes, but are neither restricted nor committed, as established by the City Council. The City Council has authorized the City Manager to recommend accounts to be included in assigned fund balance. This also includes all remaining amounts that are reported in governmental funds, other than the General Fund that are not classified as non-spendable, restricted nor committed or in the General Fund, that are intended to be used for specific purposes.
5. Unassigned fund balance classification is the residual classification for the General Fund. This classification represents fund balance that has not been assigned to other funds and that has not been restricted, committed, or assigned to specific purposes.
45

CITY OF WEST JORDAN NOTES TO THE BASIC FINANCIAL STATEMENTS JUNE 30, 2015
NOTE 1 - SUMMARY OF SIGNIFICANT ACCOUNTING POLICIES (Continued)
Q. Fund Equity Classification (Continued) Proprietary Fund equity is classified the same as in the government-wide statements. When restricted, committed, assigned, or unassigned resources are available for use, it is the City’s policy to use restricted resources first, followed by committed, and assigned resources, and then unassigned resources as they are needed. R. Contributions of Capital Contributions of capital in the proprietary fund financial statements arise from outside contributions of capital assets, or from grants or outside contributions of resources restricted to capital acquisition and construction.
S. Estimates and Assumptions The preparation of financial statements in conformity with generally accepted accounting principles requires management to make estimates and assumptions that affect the reported amounts of assets and liabilities and disclosure of contingent assets and liabilities at the date of financial statements and the reported amounts of revenues, expenditures and expenses during the reporting period. Actual results could differ from those estimates. T. Budgets Utah State statute establishes budgetary procedures for the City. The basis of accounting applied to each fund budget is the same basis as the related fund’s financial statements. Accordingly, the Budgetary Comparison Schedule for the General Fund presents actual expenditures in accordance with the accounting principles generally accepted in the United States on a basis consistent with the legally adopted budget as amended. In accordance with state law, all appropriations lapse at the end of the budget year. However, unexpended capital projects may be re-appropriated. The following are the legal procedures followed by the City: 1. On or before the first regularly scheduled meeting of the City Council in May, the City
Manager, authorized under state statute to be appointed Budget Officer, submits a proposed operating budget for all governmental fund types and an operating and capital budget for all proprietary fund types for the subsequent fiscal year. The budget documents include financing sources and the proposed budget amounts requested by the department heads along with the proposed budget amounts requested by the City Manager.
46
CITY OF WEST JORDAN NOTES TO THE BASIC FINANCIAL STATEMENTS JUNE 30, 2015
NOTE 1 - SUMMARY OF SIGNIFICANT ACCOUNTING POLICIES (Continued)
T. Budgets (Continued) 2. A public hearing is held to receive input on all aspects of the proposed budget. The hearing
is preceded by a notice in the local newspaper. The notice is given at least seven days before the hearing and includes the time, date, and place of the hearing. All budget documents are required to be available for public inspection ten days prior to the public hearing.
3. On or before June 30, a final balanced budget must be adopted for the subsequent fiscal
year beginning July 1. If a tax increase is proposed, a hearing must be held on or before August 10, which does not conflict with other taxing entities that have proposed a tax increase. At this time the final balanced budget is adopted.
4. The City Manager, acting as Budget Officer, has the authority to transfer budget
appropriations between individual line items within any department of any budgetary fund. Budgetary control is maintained at the department level for the General Fund and at the fund level for all other funds.
5. The City Council, by resolution, has the authority to transfer budget appropriations
between the individual departments of any budgetary fund. 6. A public hearing, as required in (2) above, must be held to increase the total appropriations
of any one governmental fund type. However, after the original public hearing, operating and capital budgets of proprietary fund types may be increased by resolution without an additional hearing.
7. The appropriate director or department head is the authorized officer charged with the
responsibility of staying within the department budget and authorizing no expenditures in excess of said budget as required by the Utah Fiscal Procedures Act.
8. Monthly financial reports are prepared by the Finance Manager and reviewed by the City
Manager. They are also presented to the City Council. These reports contain a budgetary statement showing a comparison of budget to actual for all budgetary funds of the City.
9. Budgets for the governmental funds are prepared on the modified accrual basis of accounting. Accordingly, the Budgetary Comparison Schedule for the General Fund presents actual expenditures in accordance with the accounting principles generally accepted in the United States on a basis consistent with the legally adopted budgets as amended. Encumbrances lapse at year-end and are automatically re-appropriated and re-encumbered as part of the subsequent year’s budget.
47
CITY OF WEST JORDAN NOTES TO THE BASIC FINANCIAL STATEMENTS JUNE 30, 2015
NOTE 1 - SUMMARY OF SIGNIFICANT ACCOUNTING POLICIES (Continued)
U. Pension
Pensions: For purposes of measuring the net pension liability, deferred outflows of resources and deferred inflows of resources related to pensions, and pension expense, information about the fiduciary net position of the Utah Retirement Systems Pension Plan (URS) and additions to/deductions from URS's fiduciary net position have been determined on the same basis as they are reported by URS. For this purpose, benefit payments (including refunds of employee contributions) are recognized when due and payable in accordance with the benefit terms. Investments are reported at fair value.
NOTE 2 – CASH, CASH EQUIVALENTS, AND INVESTMENTS The City’s deposits and investments are governed by the Utah Money Management Act (Utah Code, Title 51, Chapter 7) and rules of the State of Utah Money Management Council. Also, the City has its own written investment policies. City funds are invested only in the following: (1) negotiable or non-negotiable deposits of qualified depositories (see definition of "qualified depository" in the Utah Money Management Act), (2) repurchase agreements with qualified depositories or certified dealers, acting as principal for securities of the United States Treasury or other authorized investments (only if these securities are delivered to the custody of the City Treasurer or the City's safekeeping bank or are conducted with a qualified depository), (3) commercial paper which is rated P-1 by Moody's Investor Services or A-1 by Standard and Poor's, Inc. and having a remaining term to maturity of 270 days or less (commercial paper can be purchased directly from the issuer provided proper delivery and safekeeping procedures are followed with a qualified depository or the City Treasurer's safekeeping bank or trust company), (4) bankers' acceptances that are eligible for discount at a federal reserve bank and which have a remaining term to maturity of 270 days or less, (5) negotiable certificates of deposit of $100,000 or more which have a remaining term to maturity of 365 days or less, (6) obligations of the United States Treasury including United States Treasury Bills, United States Treasury Notes, and United States Treasury Bonds, and (7) the Utah Public Treasurer's Investment Fund which is a pooled investment fund managed by the Utah State Treasurer. The City maintains pooled cash and investments that are available for use by all funds. The pooled interest earned is allocated to the funds based on average month-end cash and investment balances.
Cash 16,527,266$ Utah Public Treasurer's Investment Fund 68,407,689 Total 84,934,955$
Included in the accompanying statement of net assets as follows:Cash and cash equivalents 60,417,367$ Restricted assets - cash and cash equivalents 24,517,588 Total 84,934,955$
48

CITY OF WEST JORDAN NOTES TO THE BASIC FINANCIAL STATEMENTS JUNE 30, 2015
NOTE 2 – CASH, CASH EQUIVALENTS, AND INVESTMENTS (Continued)
A. Cash Deposits Custodial Credit Risk Custodial credit risk for investments is the risk that, in the event of a failure of the counter
party, the City will not be able to recover the value of the investment or collateral securities that are in the possession of an outside party. The city complies with the custody requirement of the Utah Money Management Act and Rules of the Money Management Council. All investment securities are required to be held by the public treasurer, in safekeeping by a bank or trust company, or in a book-entry-only record maintained by a securities depository, in the federal book entry system or in the book-entry records of the issuer of the security in the name of the public entity. All investment securities are held in a qualified depository certified by the Commissioner of Financial Institutions as adhering to the rules of the Utah Money Management Council or in the book-entry records of the issuer of the security.
The Act requires the depositing of public funds only in a “qualified depository” or a “permitted
depository”. A “qualified depository” is a Utah depository institution which complies with capital ratios and public deposit limits established by rule of the Council and which has been certified by the State Commissioner of Financial Institutions for deposit of public funds. A “permitted depository” is an out-of-state financial institution that meets quality criteria established by rule of the Council. The City’s deposits are insured up to $250,000 per institution by the Federal Deposit Insurance Corporation. The deposits in the bank in excess of the insured amount are uninsured and uncollateralized. Uninsured deposits are not collateralized nor are they required to be by State statute. At June 30, 2015 the bank balance was $11,709,179. Of this amount, $500,000 was covered by federal depository insurance, and the remaining bank balance of $11,209,179 was uninsured. Deposits are not collateralized nor are they required to be by the State statute. The City does not have a formal policy relating to custodial credit risk for deposits.
B. Investments The Money Management Act defines the types of securities authorized as appropriate investments and the conditions for making investment transactions. Investment transactions may be conducted only through qualified depositories, certified dealers, or directly with issuers of investment securities. As of June 30, 2015, the City had the following investment:
Investment Type AmountInvestment Maturity
Debt SecuritiesUtah Public Treasurer's Investment Fund 68,407,689$ 65.04
49
CITY OF WEST JORDAN NOTES TO THE BASIC FINANCIAL STATEMENTS JUNE 30, 2015
NOTE 2 – CASH, CASH EQUIVALENTS, AND INVESTMENTS (Continued)
B. Investments (Continued) Interest Rate Risk Interest rate risk is the risk that changes in interest rates will adversely affect the fair value of an investment. The City’s policy for managing its exposure to interest rate risk is to comply with the Money Management Act. Section 51-7-11 of the Act requires that the remaining term to maturity of investments may not exceed the period of availability of the funds to be invested. The Money Management Act further limits the remaining term to maturity on all investments in commercial paper, bankers’ acceptances, fixed rate negotiable deposits, and fixed rate corporate obligations to 270 days or less. In addition, variable rate negotiable deposits and variable rate securities may not have a remaining term to final maturity exceeding two years. Credit Risk Credit risk is the risk that an issuer or other counterparty to an investment will not fulfill its obligations. The City’s policy for reducing its exposure to credit risk is to comply with the Money Management Act. The Act details authorized investments which are high-grade securities and, therefore, subject to very little credit risk except in the most unusual and unforeseen circumstances. The City’s only investment is with the Utah Public Treasurer’s Investment Fund and the Fund is unrated as to credit risk. Custodial Credit Risk Custodial credit risk for investments is the risk that, in the event of a failure of the counterparty, the City will not be able to recover the value of the investment or collateral securities that are in the possession of an outside party. The City does not have a formal policy for managing custodial credit risk. All of the City’s investments at June 30, 2015 were with the Utah Public Treasurer’s Investment Fund and therefore are not categorized as to custodial credit risk. Additional information regarding the Utah Public Treasurer’s Investment Fund is available in Note 3. Concentration of Credit Risk – Investments Concentration of credit risk is the risk of a loss attributed to the magnitude of a government’s investment in a single issuer. The City’s policy for reducing the risk of loss is to comply with the Rules of the Money Management Council. Rule 17 of the Money Management Council limits investments in a single issuer of commercial paper and corporate obligations to between 5-10% depending upon the total dollar amount held in the portfolio. The Money Management Council limitations do not apply to securities issued by the U.S. government and its agencies.
50
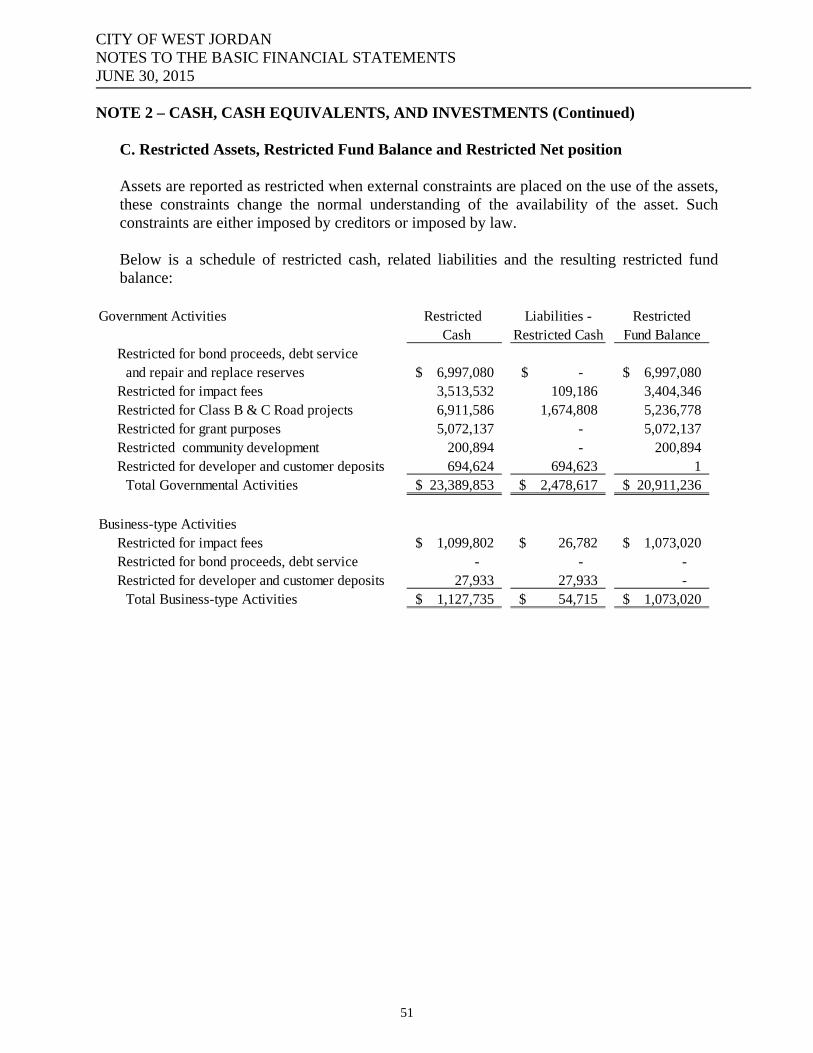
CITY OF WEST JORDAN NOTES TO THE BASIC FINANCIAL STATEMENTS JUNE 30, 2015
NOTE 2 – CASH, CASH EQUIVALENTS, AND INVESTMENTS (Continued) C. Restricted Assets, Restricted Fund Balance and Restricted Net position Assets are reported as restricted when external constraints are placed on the use of the assets, these constraints change the normal understanding of the availability of the asset. Such constraints are either imposed by creditors or imposed by law. Below is a schedule of restricted cash, related liabilities and the resulting restricted fund balance:
Government Activities Restricted Liabilities - Restricted Cash Restricted Cash Fund Balance
Restricted for bond proceeds, debt serviceand repair and replace reserves 6,997,080$ -$ 6,997,080$
Restricted for impact fees 3,513,532 109,186 3,404,346 Restricted for Class B & C Road projects 6,911,586 1,674,808 5,236,778 Restricted for grant purposes 5,072,137 - 5,072,137 Restricted community development 200,894 - 200,894 Restricted for developer and customer deposits 694,624 694,623 1
Total Governmental Activities 23,389,853$ 2,478,617$ 20,911,236$
Business-type ActivitiesRestricted for impact fees 1,099,802$ 26,782$ 1,073,020$ Restricted for bond proceeds, debt service - - - Restricted for developer and customer deposits 27,933 27,933 -
Total Business-type Activities 1,127,735$ 54,715$ 1,073,020$
51
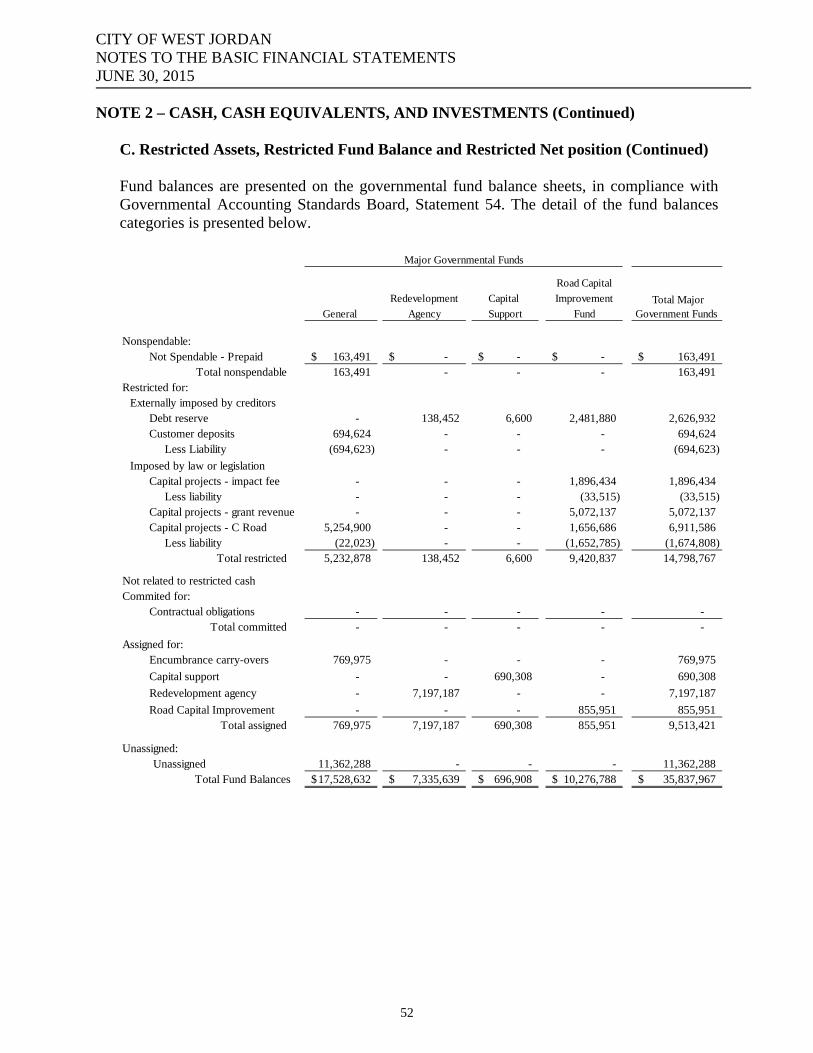
CITY OF WEST JORDAN NOTES TO THE BASIC FINANCIAL STATEMENTS JUNE 30, 2015
NOTE 2 – CASH, CASH EQUIVALENTS, AND INVESTMENTS (Continued)
C. Restricted Assets, Restricted Fund Balance and Restricted Net position (Continued)
Fund balances are presented on the governmental fund balance sheets, in compliance with Governmental Accounting Standards Board, Statement 54. The detail of the fund balances categories is presented below.
Major Governmental Funds
Road Capital
Redevelopment Capital Improvement
General Agency Support Fund
Nonspendable:Not Spendable - Prepaid 163,491$ -$ -$ -$ 163,491$
Total nonspendable 163,491 - - - 163,491 Restricted for:
Externally imposed by creditorsDebt reserve - 138,452 6,600 2,481,880 2,626,932 Customer deposits 694,624 - - - 694,624
Less Liability (694,623) - - - (694,623)
Imposed by law or legislationCapital projects - impact fee - - - 1,896,434 1,896,434
Less liability - - - (33,515) (33,515) Capital projects - grant revenue - - - 5,072,137 5,072,137 Capital projects - C Road 5,254,900 - - 1,656,686 6,911,586
Less liability (22,023) - - (1,652,785) (1,674,808) Total restricted 5,232,878 138,452 6,600 9,420,837 14,798,767
Not related to restricted cashCommited for:
Contractual obligations - - - - - Total committed - - - - -
Assigned for:Encumbrance carry-overs 769,975 - - - 769,975
Capital support - - 690,308 - 690,308
Redevelopment agency - 7,197,187 - - 7,197,187
Road Capital Improvement - - - 855,951 855,951 Total assigned 769,975 7,197,187 690,308 855,951 9,513,421
Unassigned:Unassigned 11,362,288 - - - 11,362,288
Total Fund Balances 17,528,632$ 7,335,639$ 696,908$ 10,276,788$ 35,837,967$
Total Major Government Funds
52

CITY OF WEST JORDAN NOTES TO THE BASIC FINANCIAL STATEMENTS JUNE 30, 2015
NOTE 2 – CASH, CASH EQUIVALENTS, AND INVESTMENTS (Continued)
C. Restricted Assets, Restricted Fund Balance and Restricted Net position (Continued)
Park Capital Building Capital Community Municipal
Fairway Kraftmaid Improvement Improvement Development Building
Estates SID Fund Fund Block Grant Authority
Nonspendable:Not Spendable - Prepaid -$ -$ -$ -$ -$ -$ -$
Total nonspendable - - - - - - - Restricted for:
Externally imposed by creditorsBond Proceeds - 2,224 - - - - 2,224
Imposed by law or legislationCapital projects - impact fee - - 4,936,666 1,048,356 - - 5,985,022
Less liability - - (75,671) - - - (75,671) Community Dev/Deposits - - - - 200,894 - 200,894
Less liability - - - - - - - Total restricted - 2,224 4,860,995 1,048,356 200,894 - 6,112,469
Assigned to respective funds:Total assigned 33,158 479,424 2,222,926 406,194 55,183 2,029,556 5,226,441
Total Fund Balances 33,158$ 481,648$ 7,083,921$ 1,454,550$ 256,077$ 2,029,556$ 11,338,910$
Total Nonmajor Governmental
Funds
Capital Projects FundsSpecial Revenue Funds
NOTE 3 – EXTERNAL INVESTMENT POOL
The Public Treasurer’s Investment Fund (PTIF) is not registered with the SEC as an investment company. The PTIF is authorized and regulated by the Money Management Act, Chapter 51-7, Utah Code Annotated, 1953, as amended. The Act establishes the Money Management Council, which oversees the activities of the State Treasurer and the PTIF. The Act details the investments that are authorized which are high-grade securities and, therefore, there is very little credit risk except in the most unusual and unforeseen circumstances. Deposits in the PTIF are not insured or otherwise guaranteed by the State of Utah and participants share proportionally in any realized gains or losses on investments.
The PTIF has securities maturing on a regular basis to fund day-to-day operating expenses. However, due to the current lack of liquidity in financial markets, if the need arose to liquidate an investment prior to maturity, a substantial loss would be realized. Any loss will be allocated fairly to pool participants. Large, extraordinary withdrawals by participants will be reviewed on a case by case basis until liquidity returns to the markets. The PTIF allocates income and issues statements on a monthly basis. The PTIF operates and reports to participants on an amortized cost basis. The participants’ balance is their investment deposited in the PTIF plus their share of income, gains and losses, net of administration fees, which are allocated to each participant on the ratio of each participant’s share to the total funds in the PTIF.
53
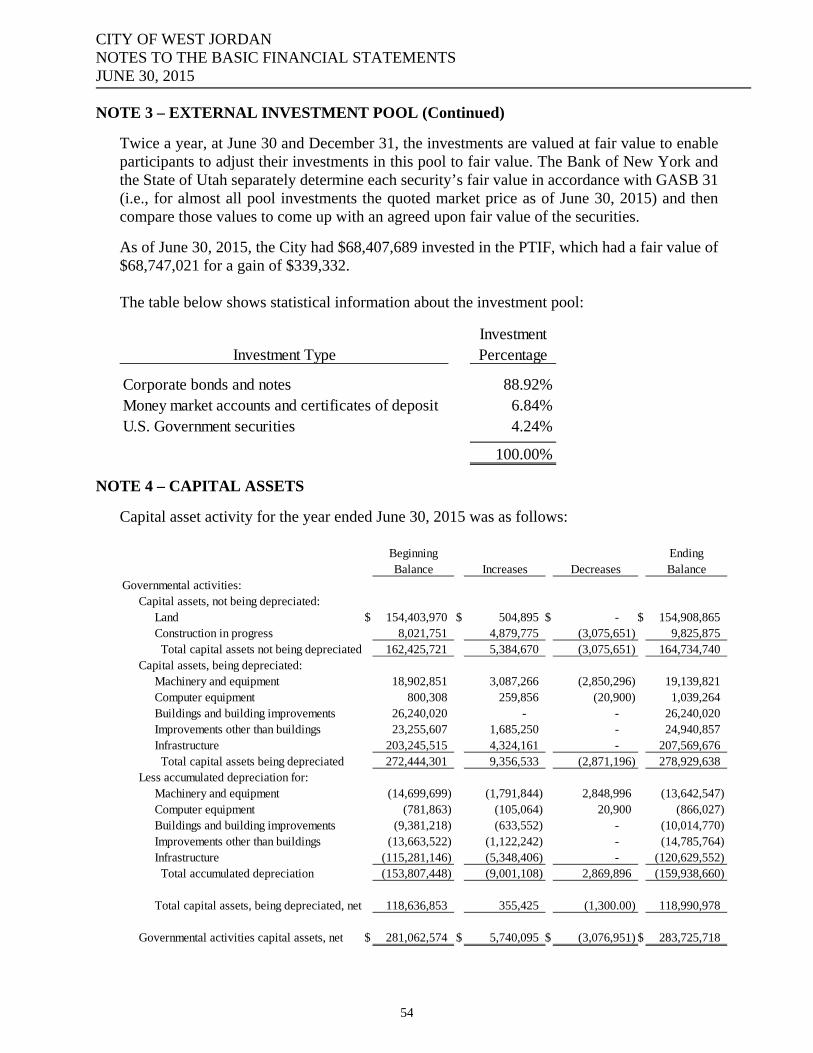
CITY OF WEST JORDAN NOTES TO THE BASIC FINANCIAL STATEMENTS JUNE 30, 2015
NOTE 3 – EXTERNAL INVESTMENT POOL (Continued)
Twice a year, at June 30 and December 31, the investments are valued at fair value to enable participants to adjust their investments in this pool to fair value. The Bank of New York and the State of Utah separately determine each security’s fair value in accordance with GASB 31 (i.e., for almost all pool investments the quoted market price as of June 30, 2015) and then compare those values to come up with an agreed upon fair value of the securities.
As of June 30, 2015, the City had $68,407,689 invested in the PTIF, which had a fair value of $68,747,021 for a gain of $339,332. The table below shows statistical information about the investment pool:
Investment Percentage
Corporate bonds and notes 88.92%Money market accounts and certificates of deposit 6.84%U.S. Government securities 4.24%
100.00%
Investment Type
NOTE 4 – CAPITAL ASSETS
Capital asset activity for the year ended June 30, 2015 was as follows:
Beginning EndingBalance Increases Decreases Balance
Governmental activities:Capital assets, not being depreciated:
Land $ 154,403,970 $ 504,895 $ - $ 154,908,865 Construction in progress 8,021,751 4,879,775 (3,075,651) 9,825,875 Total capital assets not being depreciated 162,425,721 5,384,670 (3,075,651) 164,734,740
Capital assets, being depreciated:Machinery and equipment 18,902,851 3,087,266 (2,850,296) 19,139,821 Computer equipment 800,308 259,856 (20,900) 1,039,264 Buildings and building improvements 26,240,020 - - 26,240,020 Improvements other than buildings 23,255,607 1,685,250 - 24,940,857 Infrastructure 203,245,515 4,324,161 - 207,569,676 Total capital assets being depreciated 272,444,301 9,356,533 (2,871,196) 278,929,638
Less accumulated depreciation for:Machinery and equipment (14,699,699) (1,791,844) 2,848,996 (13,642,547) Computer equipment (781,863) (105,064) 20,900 (866,027) Buildings and building improvements (9,381,218) (633,552) - (10,014,770) Improvements other than buildings (13,663,522) (1,122,242) - (14,785,764) Infrastructure (115,281,146) (5,348,406) - (120,629,552) Total accumulated depreciation (153,807,448) (9,001,108) 2,869,896 (159,938,660)
Total capital assets, being depreciated, net 118,636,853 355,425 (1,300.00) 118,990,978
Governmental activities capital assets, net $ 281,062,574 $ 5,740,095 $ (3,076,951) $ 283,725,718
54
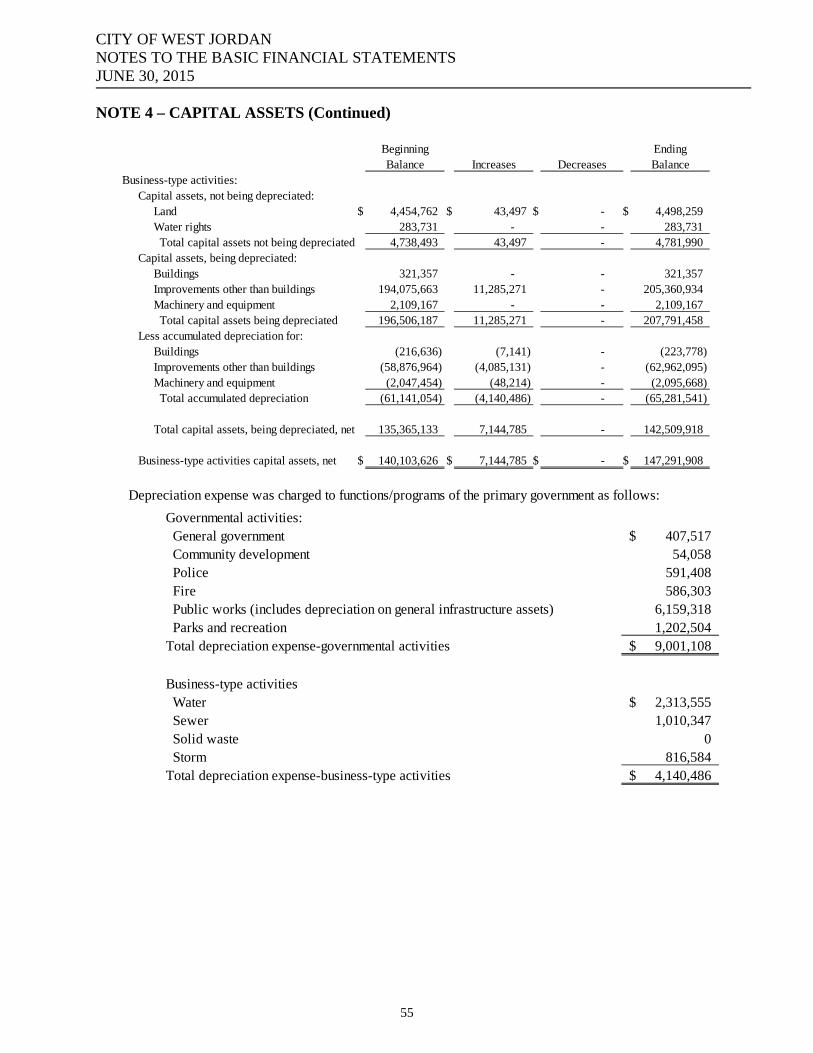
CITY OF WEST JORDAN NOTES TO THE BASIC FINANCIAL STATEMENTS JUNE 30, 2015
NOTE 4 – CAPITAL ASSETS (Continued)
Beginning EndingBalance Increases Decreases Balance
Business-type activities:Capital assets, not being depreciated:
Land $ 4,454,762 $ 43,497 $ - $ 4,498,259 Water rights 283,731 - - 283,731 Total capital assets not being depreciated 4,738,493 43,497 - 4,781,990
Capital assets, being depreciated:Buildings 321,357 - - 321,357 Improvements other than buildings 194,075,663 11,285,271 - 205,360,934 Machinery and equipment 2,109,167 - - 2,109,167 Total capital assets being depreciated 196,506,187 11,285,271 - 207,791,458
Less accumulated depreciation for:Buildings (216,636) (7,141) - (223,778) Improvements other than buildings (58,876,964) (4,085,131) - (62,962,095) Machinery and equipment (2,047,454) (48,214) - (2,095,668) Total accumulated depreciation (61,141,054) (4,140,486) - (65,281,541)
Total capital assets, being depreciated, net 135,365,133 7,144,785 - 142,509,918
Business-type activities capital assets, net $ 140,103,626 $ 7,144,785 $ - $ 147,291,908
Depreciation expense was charged to functions/programs of the primary government as follows:
Governmental activities: General government 407,517$ Community development 54,058 Police 591,408 Fire 586,303 Public works (includes depreciation on general infrastructure assets) 6,159,318 Parks and recreation 1,202,504 Total depreciation expense-governmental activities 9,001,108$
Business-type activities Water 2,313,555$ Sewer 1,010,347 Solid waste 0 Storm 816,584Total depreciation expense-business-type activities 4,140,486$
55
CITY OF WEST JORDAN NOTES TO THE BASIC FINANCIAL STATEMENTS JUNE 30, 2015
NOTE 5 – INTANGIBLE ASSET
South Valley Water Reclamation Facility (SVWR) was created by an Interlocal Cooperative Agreement dated June 23, 1978 for the purpose of developing, acquiring, constructing, financing, maintaining and repairing, owning and operating a regional sewage and water treatment plant and related facilities located in the south part of Salt Lake County, Utah. On May 20, 2004, the Interlocal Agreement was amended for the purpose of converting SVWRF to a separate legal entity (a special district under State law rather than a joint administrative entity) and to clarify ownership status, facilitate transfers of ownership, and clarify capacity rights. The City has determined that this should be accounted for using the cost method, rather than the equity method. During fiscal year 2012, SVWRF completed an expansion project increasing the operation from 38 MGD (Million Gallons per Day) to 50 MGD. The right to the capacity has been adjusted in accordance with the proportion of the expansion paid by the participating entity. Participation in plant expansion is not required. The following entities have rights to the Facility’s capacity as of December 31, 2014 as follows:
Percent MGDSouth Valley Sewer District 32.40% 16.20West Jordan City Corporation 36.44% 18.22Sandy Suburban Improvement District 17.32% 8.66Midvalley Improvement District 7.68% 3.84Midvale City Corporation 6.16% 3.08Total 100.00% 50.00
SVWRF is administered by a board of trustees with representatives from the five participating entities. Each entity appoints one member to the board, and voting power is not related to ownership. Therefore, each entity is equal to another for voting privileges. Each entity is billed its share of operating costs based on the entity’s metered usage. The City paid operating costs of $3,882,710 and capital contributions of $0.00 to SVWRF for the year ended December 31, 2014. The City annually assesses whether an impairment of this intangible has occurred. Impairment would occur if SVWRF could not provide the capacity the City has a right to receive.
56
CITY OF WEST JORDAN NOTES TO THE BASIC FINANCIAL STATEMENTS JUNE 30, 2015
NOTE 6 – LONG TERM DEBT
Long-term obligations at June 30, 2015 consist of the following:
Beginning Ending Due WithinGovernmental Activities: Balance Additions Reductions Balance One YearBonds payable: Lease revenue refunding bonds 2011 1,670,000$ -$ (830,000)$ 840,000$ 840,000$ Tax increment revenue bonds 2005 2,535,000 - (655,000) 1,880,000 650,000 Special assessment bonds 2008 3,008,000 - - 3,008,000 - General Obligation Bonds 2014 7,260,000 - (595,000) 6,665,000 620,000 Sales Tax Bonds 2013 3,335,000 - (310,000) 3,025,000 305,000 Sales Tax Bonds 2015 - 6,530,000 - 6,530,000 595,000 Less deferred amounts
For issuance discounts (38,093) - 6,269 (31,824) - Total bonds payable 17,769,907 6,530,000 (2,383,731) 21,916,176 3,010,000 Other liabilities: Capital leases 2,105,812 754,000 (620,248) 2,239,564 537,290 Contracts payable 1,355,000 - (630,000) 725,000 135,000 Compensated absences 6,638,380 457,294 (1,072,448) 6,023,226 2,326,392 Total other liabilities 10,099,192 1,211,294 (2,322,696) 8,987,790 2,998,682 Governmental activities long-termliabilities 27,869,099$ 7,741,294$ (4,706,427)$ 30,903,966$ 6,008,682$ Deferred Outflows of Resources Deferred charge on refunding of general obligation bond** (234,582)$ - 21,326$ (213,256)$ 21,326$
** To be amortized as interest expense. Balance is shown as a deferred outflow and would act as a reduction of bnds payable.
Business-type Activities: Water bond - 2011 520,000$ -$ (520,000)$ -$ -$ Water Revenue Bonds - 2014 5,860,000 - (130,000) 5,730,000 665,000 Total bonds payable 6,380,000 - (650,000) 5,730,000 665,000 Other liabilities: Compensated absences 260,449 35,125 (58,728) 236,845 117,052 Business-type activities long-term liabilities 6,640,449$ 35,125$ (708,728)$ 5,966,845$ 782,052$
57

CITY OF WEST JORDAN NOTES TO THE BASIC FINANCIAL STATEMENTS JUNE 30, 2015
NOTE 6 – LONG TERM DEBT (Continued)
Long-term obligations at June 30, 2015 consist of the following:
Governmental Activities
Lease Revenue Bonds
840,000$
Tax Increment Revenue Bonds
1,880,000 Discount on bond (18,330) Total Tax Increment Revenue Bond 1,861,670
Special Assessment Bonds
3,008,000 Discount on bond (13,494)
Total Special Assessment Bonds 2,994,506
General obligation
6,665,000
Sales Tax
3,025,000
6,530,000
The City issued 2011 lease revenue refunding bonds in the amount of $3,290,000 to refund the1998 lease revenue bonds and the 2001 lease revenue bonds. The bonds are due in annualprincipal installments of $805,000 to $840,000 through December 2015; interest at 1.11% to2.00%, secured by City Hall and a fire station and to be repaid by the Municipal BuildingAuthority.
The City issued 2005 tax increment revenue bonds in the amount of $8,020,000 to pay forinfrastructure and improvements in the redevelopment area. The bonds are due in annualinstallments of $530,000 and $865,000 through June of 2018; interest at 4.790% to 5.375%, tobe repaid by taxes levied on property in one of the City’s redevelopment areas.
On February 6, 2014 the City issued $7,260,000 in General Obligation Refunding Bonds, Series2014, which have a maturity date of April 1, 2025 with interest rates between 0.85% to 3.30%,to advance refund $7,240,000 of the outstanding 2006 Series bonds with interest rates of 3.70%to 4.00%.
On April 15, 2015 the City issued $6,530,000 in Sales Tax Revenue Bonds, Series 2015, which have a maturity date of October 15, 2024 with an interest rate of 2.05%. Currently the bond annual principal installments are due in payments of $595,000 to $715,000 beginning in October 2015 through October 2024, secured by the City's sales tax revenue.
On December 20, 2013 the City issued $3,335,000 in Sales Tax Revenue Bonds, Series 2013, which have a maturity date of April 15, 2024 with an interest rate of 2.290%. Currently the bond annual principal installments are due in payments of $310,000 to $370,000 beginning in October 2014 through April 2024, secured by the City's sales tax revenue.
On January 28, 2008, the City issued special assessment bonds in the amount of $4,497,000 tofinance infrastructure within the KraftMaid Special Assessment District. Interest only paymentsat 4.45% are due in annual installments of $200,117 beginning in June 2010 through June 2013.In 2014 the city made a principal payment of $1,489,000. Due to this payment the bondamortization schedule was restructured. The interest rate is currently 2.225%. Currently thebond annual principal installments are due in payments of $135,000 to $905,000, beginning inJune 2018 through June 2022. The bonds are to be repaid by taxes levied on property in one ofthe City’s redevelopment areas.
58
CITY OF WEST JORDAN NOTES TO THE BASIC FINANCIAL STATEMENTS JUNE 30, 2015
NOTE 6 – LONG TERM DEBT (Continued)
Governmental Activities
Capital Leases
200,180$
52,590
557,789
803,354
100,392
525,259 Total capital leases 2,239,564
In February, 2014, the City entered into a lease agreement as lessee for financing the acquisitionof six new trucks in the amount of $1,125,000. The terms of the lease require annual paymentsof $168,760 through February 2020, at which time ownership will transfer to the City. Thestated rate of interest in the lease agreement is 1.66%.
On May 31, 2013 the City entered into a lease agreement as lessee for financing the acquisitionof a new sewer vactor truck. The original amount of the lease was $346,498. The terms of thelease require annual payments of $53,045 through May 2019, at which time ownership willtransfer to the City. The stated rate of interest in the lease agreement is 2.37%.
On September 29, 2009, the City entered into a lease agreement as lessee for financing theacquisition of fire apparatus in the amount of $220,000. The terms of the lease require twoannual payments, each year, of $18,271 through September 2016, at which time ownership willtransfer to the City. The stated rate of interest in the lease agreement is 4.2%.
On May 1, 2012, the City entered into a lease agreement as lessee for financing the acquisitionof two new fire engines in the amount of $1,279,552. The terms of the lease require annualpayments of $192,543 through May 2018, at which time ownership will transfer to the City. Thestated rate of interest in the lease agreement is 1.77%.
On July 15, 2014, the City entered into a lease agreement as lessee for financing the acquisitionof commercial lawn mowers in the amount of $135,000. The terms of the lease require oneannual payment between $34,608 and $32,901 through July of 2017, at which time ownershipwill transfer to the City. The stated rate of interest in the lease agreement is 1.7%.
On December 15, 2014, the City entered into a lease agreement as lessee for financing theacquisition of three utility vehicles in the amount of $619,000. The terms of the lease requireone annual payment, between $93,741 and 83,288 through December 2020, at which timeownership will transfer to the City. The stated rate of interest in the lease agreement is 1.99%.
59

CITY OF WEST JORDAN NOTES TO THE BASIC FINANCIAL STATEMENTS JUNE 30, 2015
NOTE 6 – LONG TERM DEBT (Continued) Contracts Payable
725,000
Compensated Absences 6,023,226
Total Governmental Activities 30,903,966$
Business-type activities
5,730,000
Compensated Absences 236,845
5,966,845$
On November 19, 2013, the City issued $6,045,000 in Water Revenue Bonds, which have amaturity date of June 1, 2023, at an interest rate of 2.200%. The series 2013 bonds were issuedto finance water system improvements throughout the City. Secured by revenue from the waterfund.
The City borrowed $2,090,000 from HUD to finance the construction of a senior center. Thecontract payable is due to HUD in annual principal installments of $65,000 to $155,000 throughAugust of 2019; interest at 7.5% to 7.9%.
60
CITY OF WEST JORDAN NOTES TO THE BASIC FINANCIAL STATEMENTS JUNE 30, 2015
NOTE 6 – LONG TERM DEBT (Continued)
As of June 30, 2015, annual debt service requirements to maturity are as follows:
Governmental Activities-Contrac
Year Ended Year EndedJune 30 Principal Interest June 30 Principal Interest
2016 840,000 16,800 2016 135,000 19,223 2017 - - 2017 140,000 15,877 2018 - - 2018 145,000 11,905 2019 - - 2019 150,000 7,455 2020 - - 2020 155,000 2,558
2021 - - 2021 - - Total 840,000$ 16,800$ Total 725,000$ 57,018$
Governmental Activities-BondsLease revenue
refundingContract
Year EndedJune 30 Principal Interest Principal Interest Principal Interest Principal Interest
2016 650,000 100,388 - 133,856 620,000 133,542 900,000 193,547 2017 700,000 65,938 - 133,856 625,000 127,156 920,000 174,154 2018 530,000 28,488 135,000 133,856 635,000 119,968 935,000 154,384 2019 - - 755,000 127,849 645,000 111,396 955,000 134,237 2020 - - 815,000 94,251 655,000 101,721 975,000 113,663 2021-2025 - - 1,303,000 75,695 3,485,000 296,947 4,870,000 283,602 2026-2030 - - - - - - - -
Total 1,880,000 194,814$ 3,008,000 699,363$ 6,665,000$ 890,730$ 9,555,000$ 1,053,585$
Less unamortizedissuance discounts (18,330) (13,494) issuance premiums - -
1,861,670$ 2,994,506$
Tax increment Special assessment General obligation Sales TaxGovernmental Activities-Bonds
Year Ended Year EndedJune 30 Principal Interest June 30 Principal Interest
2016 665,000$ 126,060$ 2016 -$ -$ 2017 675,000 111,430 Total -$ -$
2018 690,000 96,580 2019 710,000 81,400 2020 725,000 65,780 2021-2025 2,265,000 100,320 Total 5,730,000$ 581,570$
Revenue Bond 2014 Water revenue bonds
Business-type Activities Business-type ActivitiesRevenue Bond 2011Water revenue bonds
61

CITY OF WEST JORDAN NOTES TO THE BASIC FINANCIAL STATEMENTS JUNE 30, 2015
NOTE 7 – CAPITAL LEASES
The City has entered into certain capital lease agreements under which the related equipment will become the property of the City when the terms of the lease agreement are met. The following is a schedule by year of future minimum lease payments as of June 30, 2015.
Fiscal Year Governmental
Ending June 30 Activities
2016 $ 579,239 2017 560,968 2018 542,697 2019 315,546 2020 262,5012021 93,741Total minimum lease payments 2,354,691 Less: Amount representing interest (115,127)Present value of net minimum lease payments $ 2,239,564
Equipment and related accumulated depreciation under capital lease areas follows:
Cost of equipment $ 3,613,240
Accumulated depreciation 935,031 NOTE 8 - DEFERRED INFLOWS OF RESOURCES
Unavailable Property Taxes In conjunction with the implementation of GASB Statement No. 33, “Accounting and Financial Reporting for Nonexchange Transactions” the City has accrued a property tax receivable and a deferred inflow of resources for unavailable property tax revenue in the General Fund, Redevelopment Agency, Capital Support, and Fairway Estates in the amounts of $11,448,368, $3,824,808, $756,543, and $10,099 respectively. Property taxes in the governmental funds are recorded using the modified accrual basis of accounting, wherein revenues are recognized when they are both measurable and available (expected to be received within 60 days). Property taxes attach as an enforceable lien on property as of the first day of January. Taxes are levied on October 1, and then are due and payable at November 30. Since the property tax to be levied on October 1, 2015 is not expected to be received within 60 days after the year ended June 30, 2015, the City is required to record a receivable and a deferred inflow of resource of the estimated amount of the total property tax to be levied on October 1, 2015.
62

CITY OF WEST JORDAN NOTES TO THE BASIC FINANCIAL STATEMENTS JUNE 30, 2015
NOTE 8 - DEFERRED INFLOWS OF RESOURCES (Continued) Unavailable Ambulance Revenue Ambulance revenue in the governmental fund is recorded using the modified accrual basis of accounting, wherein revenues are recognized when they are both measurable and available (expected to be received within 60 days). A portion of the ambulance receivable at June 30, 2015 was not received within 60 days therefore the City is required to record a receivable and a deferred inflow of resources of $89,726. Unavailable Grant Revenue Grant revenue in the governmental fund is recorded using the modified accrual basis of accounting, wherein revenues are recognized when they are both measurable and available (expected to be received within 60 days). A portion of grant revenue was not received within 60 days after the year ended June 30, 2015, the City is required to record a receivable and a deferred inflow of resources of $57,267.
NOTE 9 – PLEDGED REVENUES
A tax increment bond and a special assessment bond have been issued to finance infrastructure within the KraftMaid Special Improvement District. The bonds are payable solely from the incremental property tax generated by the increased property tax in the district. Incremental property taxes were projected to produce 140% of the debt service requirements over the life of the bonds. The first bond was issued through the redevelopment agency in 2005 in the amount of $8,020,000. The principal and interest remaining on the bonds is $2,074,813, payable through fiscal year 2018. For the current year, principal and interest paid was $655,000 and $135,103, respectively. The second bond was issued in 2008 through the KraftMaid SID in the amount of $4,497,000. The principal and interest remaining on the bonds is $3,707,362, payable through fiscal year 2022. In the current year, principal and interest paid was $0 and $133,856, respectively. Total incremental property tax revenues were $993,947.
63
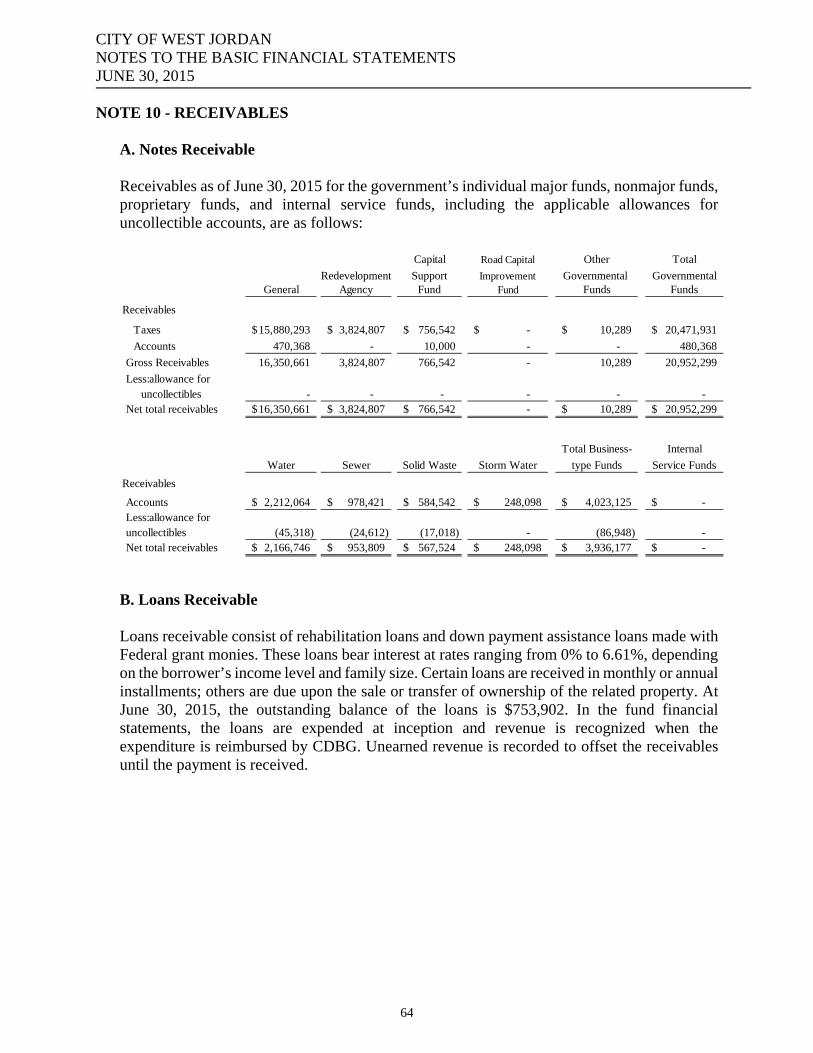
CITY OF WEST JORDAN NOTES TO THE BASIC FINANCIAL STATEMENTS JUNE 30, 2015
NOTE 10 - RECEIVABLES
A. Notes Receivable Receivables as of June 30, 2015 for the government’s individual major funds, nonmajor funds, proprietary funds, and internal service funds, including the applicable allowances for uncollectible accounts, are as follows:
Capital Road Capital Other Total
Redevelopment Support Improvement Governmental GovernmentalGeneral Agency Fund Fund Funds Funds
Receivables
Taxes 15,880,293$ 3,824,807$ 756,542$ -$ 10,289$ 20,471,931$
Accounts 470,368 - 10,000 - - 480,368
Gross Receivables 16,350,661 3,824,807 766,542 - 10,289 20,952,299
Less:allowance foruncollectibles - - - - - -
Net total receivables 16,350,661$ 3,824,807$ 766,542$ - 10,289$ 20,952,299$
Total Business- Internal
Water Sewer Solid Waste Storm Water type Funds Service Funds
Receivables
Accounts 2,212,064$ 978,421$ 584,542$ 248,098$ 4,023,125$ -$ Less:allowance foruncollectibles (45,318) (24,612) (17,018) - (86,948) - Net total receivables 2,166,746$ 953,809$ 567,524$ 248,098$ 3,936,177$ -$
B. Loans Receivable Loans receivable consist of rehabilitation loans and down payment assistance loans made with Federal grant monies. These loans bear interest at rates ranging from 0% to 6.61%, depending on the borrower’s income level and family size. Certain loans are received in monthly or annual installments; others are due upon the sale or transfer of ownership of the related property. At June 30, 2015, the outstanding balance of the loans is $753,902. In the fund financial statements, the loans are expended at inception and revenue is recognized when the expenditure is reimbursed by CDBG. Unearned revenue is recorded to offset the receivables until the payment is received.
64
CITY OF WEST JORDAN NOTES TO THE BASIC FINANCIAL STATEMENTS JUNE 30, 2015
NOTE 11 – RETIREMENT PLANS
General Information about the Pension Plans Plan description: Eligible plan participants are provided with pensions through the Utah Retirement Systems. The Utah Retirement Systems are comprised of the following pension trust funds:
Public Employees Noncontributory Retirement System (Noncontributory System);
Public Employees Contributory Retirement System (Contributory System); Firefighters Retirement System (Firefighters System); are multiple employer, cost sharing, public employees, retirement systems.
The Public Safety Retirement System (Public Safety System) is a mixed agent and cost-sharing, multiple employer retirement system;
Tier 2 Public Employees Contributory Retirement System (Tier 2 Public Employees System); and the Tier 2 Public Safety and Firefighter Contributory Retirement System (Tier 2 Public Safety and Firefighters System) are multiple-employer, cost sharing, public employees, retirement systems.
The Tier 2 Public Employees System became effective July 1, 2011. All eligible employees beginning on or after July 1, 2011, who have no previous service credit with any of the Utah Retirement Systems, are members of the Tier 2 Retirement System. The Utah Retirement Systems (Systems) are established and governed by the respective sections of Title 49 of the Utah Code Annotated 1953, as amended. The System’s defined benefit plans are amended statutorily by the State Legislature. The Utah State Retirement Office Act in Title 49 provides for the administration of the Systems under the direction of the Board, whose members are appointed by the Governor. The Systems are fiduciary funds defined as pension (and other employee benefit) trust funds. URS is a component unit of the State of Utah. Title 49 of the Utah Code grants the authority to establish and amend the benefit terms. URS issues a publicly available financial report that can be obtained by writing Utah Retirement Systems, 560 E. 200 S. Salt Lake City, Utah 84102 or visiting the website: www.urs.org.
65
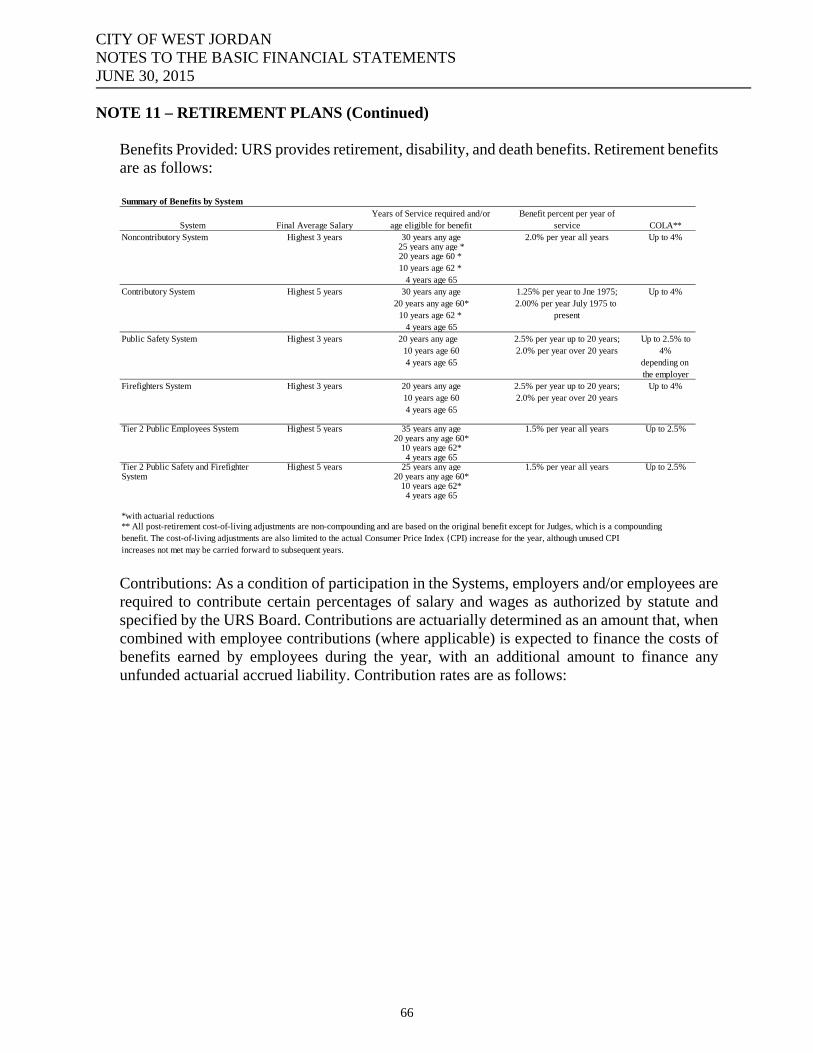
CITY OF WEST JORDAN NOTES TO THE BASIC FINANCIAL STATEMENTS JUNE 30, 2015
NOTE 11 – RETIREMENT PLANS (Continued) Benefits Provided: URS provides retirement, disability, and death benefits. Retirement benefits are as follows: Summary of Benefits by System
System Final Average SalaryYears of Service required and/or
age eligible for benefitBenefit percent per year of
service COLA**Noncontributory System Highest 3 years 30 years any age 2.0% per year all years Up to 4%
25 years any age *20 years age 60 * 10 years age 62 *
4 years age 65Contributory System Highest 5 years 30 years any age 1.25% per year to Jne 1975; Up to 4%
20 years any age 60* 2.00% per year July 1975 to 10 years age 62 * present
4 years age 65Public Safety System Highest 3 years 20 years any age 2.5% per year up to 20 years; Up to 2.5% to
10 years age 60 2.0% per year over 20 years 4%4 years age 65 depending on
the employerFirefighters System Highest 3 years 20 years any age 2.5% per year up to 20 years; Up to 4%
10 years age 60 2.0% per year over 20 years4 years age 65
Tier 2 Public Employees System Highest 5 years 35 years any age 1.5% per year all years Up to 2.5%20 years any age 60*
10 years age 62*4 years age 65
Tier 2 Public Safety and Firefighter Highest 5 years 25 years any age 1.5% per year all years Up to 2.5%System 20 years any age 60*
10 years age 62*4 years age 65
*with actuarial reductions** All post-retirement cost-of-living adjustments are non-compounding and are based on the original benefit except for Judges, which is a compoundingbenefit. The cost-of-living adjustments are also limited to the actual Consumer Price Index {CPI) increase for the year, although unused CPIincreases not met may be carried forward to subsequent years. Contributions: As a condition of participation in the Systems, employers and/or employees are required to contribute certain percentages of salary and wages as authorized by statute and specified by the URS Board. Contributions are actuarially determined as an amount that, when combined with employee contributions (where applicable) is expected to finance the costs of benefits earned by employees during the year, with an additional amount to finance any unfunded actuarial accrued liability. Contribution rates are as follows:
66

CITY OF WEST JORDAN NOTES TO THE BASIC FINANCIAL STATEMENTS JUNE 30, 2015
NOTE 11 – RETIREMENT PLANS (Continued)
Utah Retirement Systems Paid by EmployerEmployee Employer Contribution
Paid for Rates
Contributory System 11 - Local Governmental Division Tier 1 6.00% N/A 14.460% 111- Local Governmental Division Tier 2 N/A N/A 14.830%Noncontributory System 15- Local Governmental Division Tier 1 N/A N/A 18.470%Public Safety Retirement System 43 - Other Division A Noncontributory Tier 1 N/A N/A 34.040% 49 - Other Division B Noncontributory Tier 1 N/A N/A 32.200% 122 - Other Division A Contributory Tier 2 N/A N/A 20.440%Firefighters System 32 - Division B Tier 1 7.650% 9.060% 6.590% 132 - Division B Tier 2 N/A N/A 10.800% Pension Assets, Liabilities, Expense, and Deferred Outflows of Resources and Deferred Inflows of Resources Related to Pensions At December 31, 2014, we reported a net pension asset of $576,503 and a net pension liability of $8,455,078.
Net Net Proportionate Pension Pension
Share Asset Liability
Noncontributory System 1.1701100% -$ 5,080,893$ Contributory System 0.3240027% - 93,456 Public Safety System 8.2965555% - 3,280,729 Firefighters System 4.9048915% 539,773 - Tier 2 Public Employees System 0.2024813% 6,136 - Tier 2 Public Safety and Firefighter System 2.0681995% 30,595 -
Total Net Pension Asset / Liability 576,504$ 8,455,078$
The net pension asset and liability was measured as of December 31, 2014, and the total pension liability used to calculate the net pension asset and liability was determined by an actuarial valuation as of January 1, 2014 and rolled-forward using generally accepted actuarial procedures. The proportion of the net pension asset and liability was based upon actual historical employer contributions to the plan from the census data submitted to the plan for pay periods ending in 2014. For the year ended December 31, 2014, we recognized pension expense of $2,057,049. At December 31, 2014, we reported deferred outflows of resources and deferred inflows of resources related to pensions from the following sources:
67
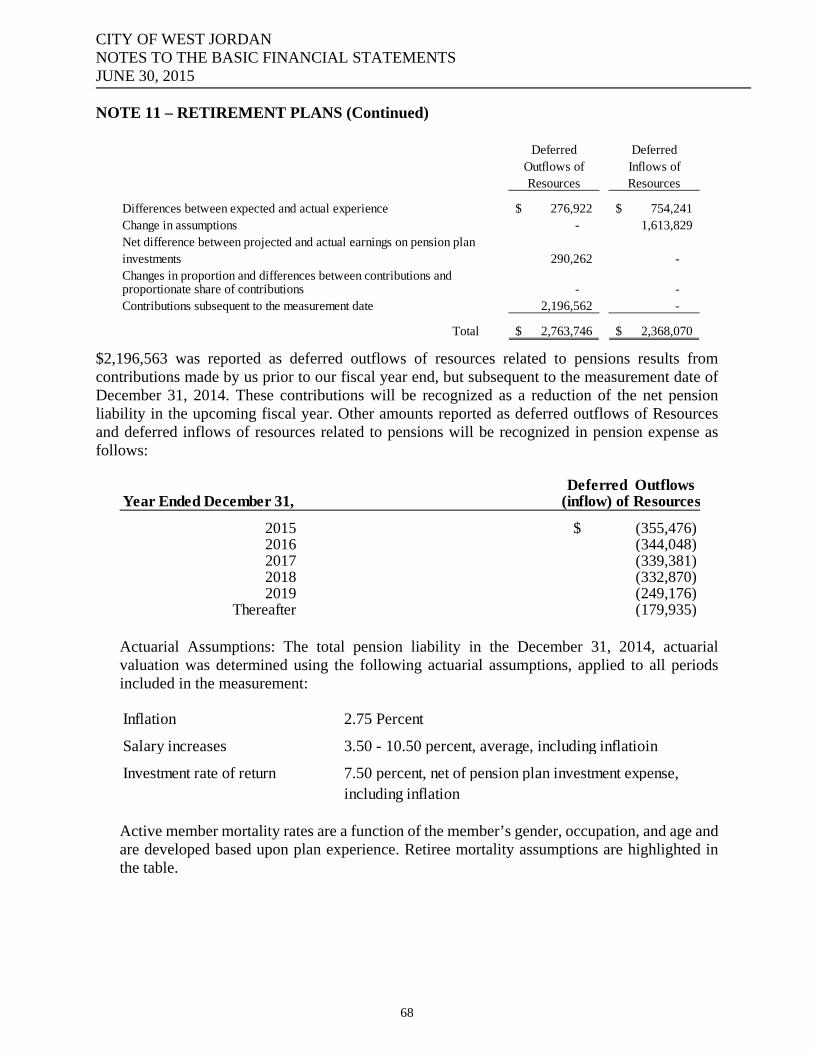
CITY OF WEST JORDAN NOTES TO THE BASIC FINANCIAL STATEMENTS JUNE 30, 2015
NOTE 11 – RETIREMENT PLANS (Continued)
Deferred Outflows of Resources
Deferred Inflows of Resources
Differences between expected and actual experience 276,922$ 754,241$ Change in assumptions - 1,613,829 Net difference between projected and actual earnings on pension planinvestments 290,262 - Changes in proportion and differences between contributions and proportionate share of contributions - - Contributions subsequent to the measurement date 2,196,562 -
Total 2,763,746$ 2,368,070$
$2,196,563 was reported as deferred outflows of resources related to pensions results from contributions made by us prior to our fiscal year end, but subsequent to the measurement date of December 31, 2014. These contributions will be recognized as a reduction of the net pension liability in the upcoming fiscal year. Other amounts reported as deferred outflows of Resources and deferred inflows of resources related to pensions will be recognized in pension expense as follows:
Deferred OutflowsYear Ended December 31, (inflow) of Resources
2015 (355,476)$ 2016 (344,048) 2017 (339,381) 2018 (332,870) 2019 (249,176)
Thereafter (179,935) Actuarial Assumptions: The total pension liability in the December 31, 2014, actuarial valuation was determined using the following actuarial assumptions, applied to all periods included in the measurement: Inflation 2.75 Percent
Salary increases 3.50 - 10.50 percent, average, including inflatioin
Investment rate of return 7.50 percent, net of pension plan investment expense, including inflation
Active member mortality rates are a function of the member’s gender, occupation, and age and are developed based upon plan experience. Retiree mortality assumptions are highlighted in the table.
68
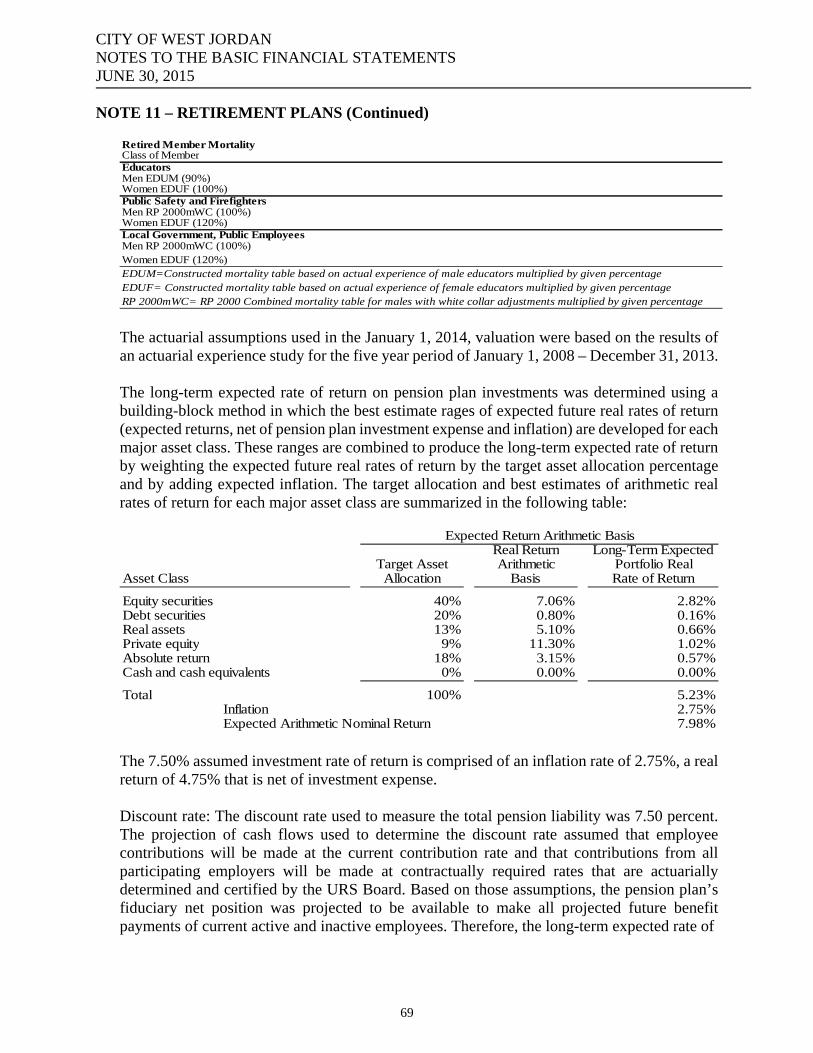
CITY OF WEST JORDAN NOTES TO THE BASIC FINANCIAL STATEMENTS JUNE 30, 2015
NOTE 11 – RETIREMENT PLANS (Continued)
The actuarial assumptions used in the January 1, 2014, valuation were based on the results of an actuarial experience study for the five year period of January 1, 2008 – December 31, 2013.
The long-term expected rate of return on pension plan investments was determined using a building-block method in which the best estimate rages of expected future real rates of return (expected returns, net of pension plan investment expense and inflation) are developed for each major asset class. These ranges are combined to produce the long-term expected rate of return by weighting the expected future real rates of return by the target asset allocation percentage and by adding expected inflation. The target allocation and best estimates of arithmetic real rates of return for each major asset class are summarized in the following table:
The 7.50% assumed investment rate of return is comprised of an inflation rate of 2.75%, a real return of 4.75% that is net of investment expense.
Discount rate: The discount rate used to measure the total pension liability was 7.50 percent. The projection of cash flows used to determine the discount rate assumed that employee contributions will be made at the current contribution rate and that contributions from all participating employers will be made at contractually required rates that are actuarially determined and certified by the URS Board. Based on those assumptions, the pension plan’s fiduciary net position was projected to be available to make all projected future benefit payments of current active and inactive employees. Therefore, the long-term expected rate of
Retired Member MortalityClass of MemberEducatorsMen EDUM (90%)Women EDUF (100%)Public Safety and FirefightersMen RP 2000mWC (100%)Women EDUF (120%)Local Government, Public EmployeesMen RP 2000mWC (100%) Women EDUF (120%)EDUM=Constructed mortality table based on actual experience of male educators multiplied by given percentage EDUF= Constructed mortality table based on actual experience of female educators multiplied by given percentageRP 2000mWC= RP 2000 Combined mortality table for males with white collar adjustments multiplied by given percentage
Real Return Long-Term ExpectedTarget Asset Arithmetic Portfolio Real
Asset Class Allocation Basis Rate of Return
Equity securities 40% 7.06% 2.82%Debt securities 20% 0.80% 0.16%Real assets 13% 5.10% 0.66%Private equity 9% 11.30% 1.02%Absolute return 18% 3.15% 0.57%Cash and cash equivalents 0% 0.00% 0.00%
Total 100% 5.23%Inflation 2.75%Expected Arithmetic Nominal Return 7.98%
Expected Return Arithmetic Basis
69
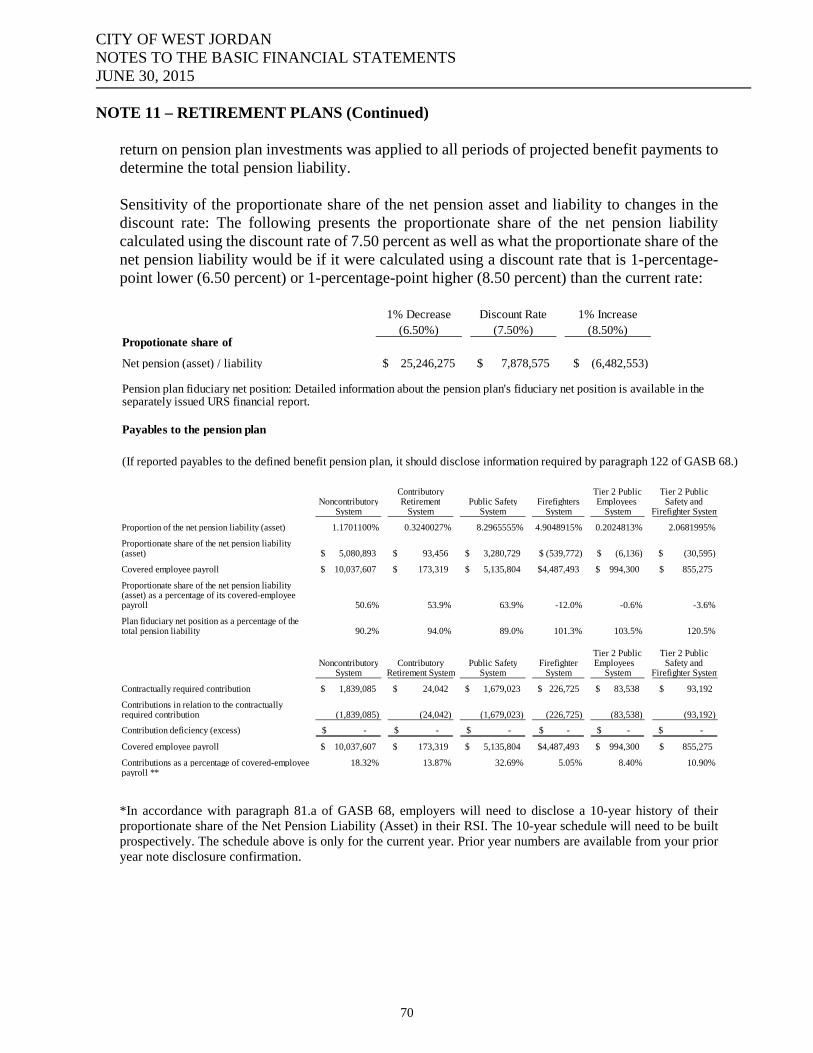
CITY OF WEST JORDAN NOTES TO THE BASIC FINANCIAL STATEMENTS JUNE 30, 2015
NOTE 11 – RETIREMENT PLANS (Continued) return on pension plan investments was applied to all periods of projected benefit payments to determine the total pension liability. Sensitivity of the proportionate share of the net pension asset and liability to changes in the discount rate: The following presents the proportionate share of the net pension liability calculated using the discount rate of 7.50 percent as well as what the proportionate share of the net pension liability would be if it were calculated using a discount rate that is 1-percentage-point lower (6.50 percent) or 1-percentage-point higher (8.50 percent) than the current rate:
1% Decrease (6.50%)
Discount Rate (7.50%)
1% Increase (8.50%)
Propotionate share of
Net pension (asset) / liability 25,246,275$ 7,878,575$ (6,482,553)$
Pension plan fiduciary net position: Detailed information about the pension plan's fiduciary net position is available in theseparately issued URS financial report.
Payables to the pension plan
(If reported payables to the defined benefit pension plan, it should disclose information required by paragraph 122 of GASB 68.)
Contributory Tier 2 Public Tier 2 Public
Noncontributory Retirement Public Safety Firefighters Employees Safety and System System System System System Firefighter System
Proportion of the net pension liability (asset) 1.1701100% 0.3240027% 8.2965555% 4.9048915% 0.2024813% 2.0681995%
Proportionate share of the net pension liability(asset) 5,080,893$ 93,456$ 3,280,729$ (539,772)$ (6,136)$ (30,595)$
Covered employee payroll 10,037,607$ 173,319$ 5,135,804$ 4,487,493$ 994,300$ 855,275$
Proportionate share of the net pension liability(asset) as a percentage of its covered-employee payroll 50.6% 53.9% 63.9% -12.0% -0.6% -3.6%
Plan fiduciary net position as a percentage of the total pension liability 90.2% 94.0% 89.0% 101.3% 103.5% 120.5%
Tier 2 Public Tier 2 Public Noncontributory Contributory Public Safety Firefighter Employees Safety and
System Retirement System System System System Firefighter System
Contractually required contribution 1,839,085$ 24,042$ 1,679,023$ 226,725$ 83,538$ 93,192$
Contributions in relation to the contractuallyrequired contribution (1,839,085) (24,042) (1,679,023) (226,725) (83,538) (93,192)
Contribution deficiency (excess) -$ -$ -$ -$ -$ -$
Covered employee payroll 10,037,607$ 173,319$ 5,135,804$ 4,487,493$ 994,300$ 855,275$
Contributions as a percentage of covered-employee 18.32% 13.87% 32.69% 5.05% 8.40% 10.90%payroll ** *In accordance with paragraph 81.a of GASB 68, employers will need to disclose a 10-year history of their proportionate share of the Net Pension Liability (Asset) in their RSI. The 10-year schedule will need to be built prospectively. The schedule above is only for the current year. Prior year numbers are available from your prior year note disclosure confirmation.
70

CITY OF WEST JORDAN NOTES TO THE BASIC FINANCIAL STATEMENTS JUNE 30, 2015
NOTE 12 – DEFERRED COMPENSATION PLAN
The City offers its employees a deferred compensation plan (the plan) through ICMA Retirement Corporation or through the Utah State Retirement System (USRS) created in accordance with Internal Revenue Code (IRC) Section 457. The ICMA plan, available to all City employees, permits them to defer a portion of their salary until future years. Participation in this plan is optional. The USRS plan is only available to part-time employees on a noncontributory basis. Both investment plans are managed by the plans’ trustee under one of four investment options or a combination thereof. The choice of investment options are made by the participants. The deferred compensation is not available to employees until termination, retirement, death or unforeseeable emergency. These investments are within the legal provisions of the State of Utah. Defined Contribution Money Purchase Plan The City also participates in insured, contributory defined contribution retirement plans administered by ICMA Retirement Corporation. Under the plan, the City contributes amounts from 0% to 34.4% depending upon the defined contribution system to which each employee class belongs. Employees are classified as follows: Management, General Employees, Police, and Fire. An employee is vested immediately with the first contribution to ICMA Retirement Corporation. Contributions to the plan were authorized by Council resolution. The plan was established by, and can be amended by City Council. No other federal or state laws obligate the City to participate in this plan. The program is pursuant to section 401(A) and 401(C) the Internal Revenue Service Code. Withdrawals of monies, per federal law are subject to a mandatory withdrawal penalty in the amount of 10% unless the employee has attained the age of 59 1/2. All of the City’s full-time employees participate in the ICMA Retirement Corporation. Sick Leave Conversions At retirement employees may choose to participate in the City’s health insurance programs at their own cost. Qualified employees may convert their sick leave balance, upon leaving City employment, to pay for continued medical and dental insurance premiums. To qualify for the City’s sick leave conversion benefit, an employee must be a full-time employee with at least ten (10) years of service with the City or five (5) years of service with the City at age 60 to be considered a retired employee with the City of West Jordan. The percentage of convertible sick leave hours varies based on the retiree’s years of service, as follows: employees with 5 to 9 years of service are eligible to convert 40% of their sick leave hours; employees with 10 to 14 years of service are eligible to convert 50% of their sick leave hours; employees with 15 to 19 years of service are eligible to convert 60% of their sick leave hours; employees with 20 or more years of service are eligible to convert 70% of their sick leave hours. The City’s regular health and dental care benefit providers underwrite the retiree’s policies and 100% of the cost is the responsibility of the retiree. As of year-end, there were 15 employees participating in this program.
71

CITY OF WEST JORDAN NOTES TO THE BASIC FINANCIAL STATEMENTS JUNE 30, 2015
NOTE 12 – DEFERRED COMPENSATION PLAN (Continued) In the governmental funds, the liability for sick leave conversion is reported only if they have matured, (i.e., unused sick leave has been converted to pay a health insurance premium for a retired employee). These conversion costs are typically liquidated through the General Fund. The noncurrent portion of these amounts for government funds is recognized within the government-wide statements. A liability for the sick leave conversion has been accrued in the amount of $2,456,206 for the governmental funds, and $93,735 in the proprietary funds, for a total accrual amount of $2,549,941.
NOTE 13 – REDEVELOPMENT AGENCY
Tax increment money was generated by the following project areas within the Redevelopment Agency:
Oracle Data Center 1,491,575$ 1700 West 6600-7000 South 460,994 7800 South 1300-1600 West 146,914 9000 South 1300-1700 West 432,792 Independence Square Area 298,585 Kraftmaid 993,947 Total 3,824,807$
During the year, the RDA expended monies in the categories below as follows:
Administration Costs 1,103,822$ Interest 135,103 Principal 655,000 Total 1,893,925$
Outstanding loans to finance RDA projects as of June 30, 2015: Tax increment revenue bonds 2005 $1,880,000
72
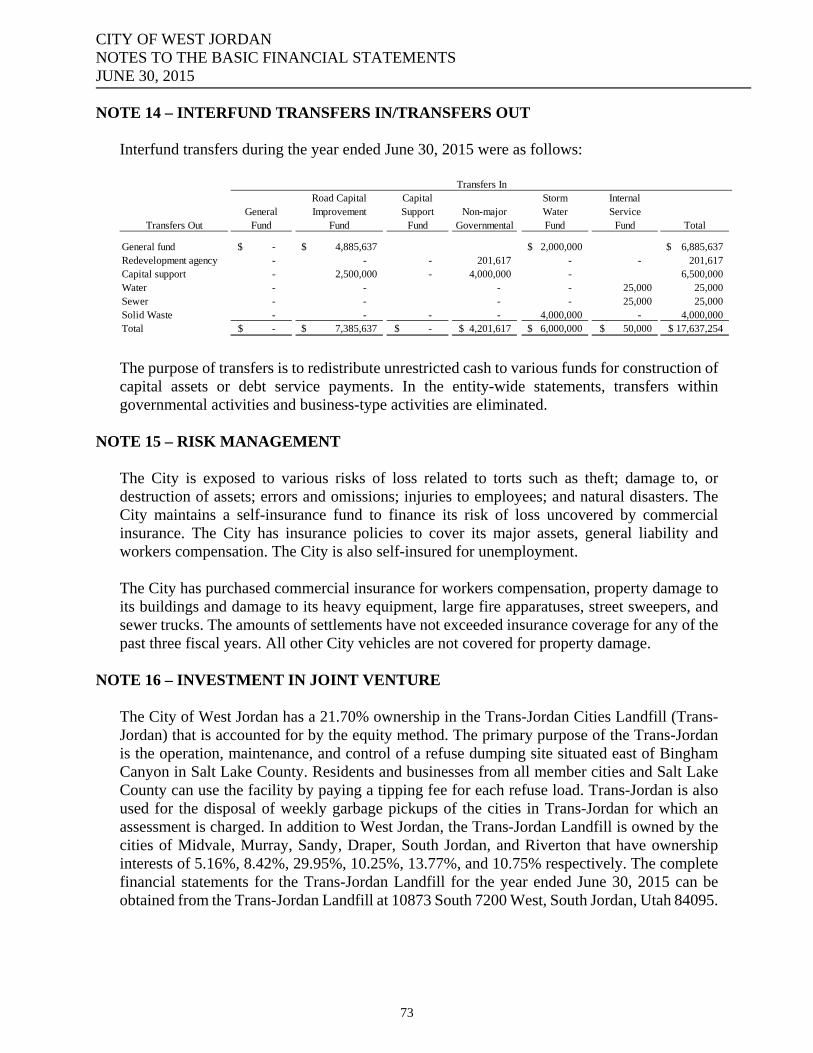
CITY OF WEST JORDAN NOTES TO THE BASIC FINANCIAL STATEMENTS JUNE 30, 2015
NOTE 14 – INTERFUND TRANSFERS IN/TRANSFERS OUT
Interfund transfers during the year ended June 30, 2015 were as follows:
Road Capital Capital Storm Internal General Improvement Support Non-major Water Service
Transfers Out Fund Fund Fund Governmental Fund Fund Total
General fund -$ 4,885,637$ 2,000,000$ 6,885,637$ Redevelopment agency - - - 201,617 - - 201,617 Capital support - 2,500,000 - 4,000,000 - 6,500,000 Water - - - - 25,000 25,000 Sewer - - - - 25,000 25,000 Solid Waste - - - - 4,000,000 - 4,000,000 Total -$ 7,385,637$ -$ 4,201,617$ 6,000,000$ 50,000$ 17,637,254$
Transfers In
The purpose of transfers is to redistribute unrestricted cash to various funds for construction of capital assets or debt service payments. In the entity-wide statements, transfers within governmental activities and business-type activities are eliminated.
NOTE 15 – RISK MANAGEMENT
The City is exposed to various risks of loss related to torts such as theft; damage to, or destruction of assets; errors and omissions; injuries to employees; and natural disasters. The City maintains a self-insurance fund to finance its risk of loss uncovered by commercial insurance. The City has insurance policies to cover its major assets, general liability and workers compensation. The City is also self-insured for unemployment. The City has purchased commercial insurance for workers compensation, property damage to its buildings and damage to its heavy equipment, large fire apparatuses, street sweepers, and sewer trucks. The amounts of settlements have not exceeded insurance coverage for any of the past three fiscal years. All other City vehicles are not covered for property damage.
NOTE 16 – INVESTMENT IN JOINT VENTURE
The City of West Jordan has a 21.70% ownership in the Trans-Jordan Cities Landfill (Trans-Jordan) that is accounted for by the equity method. The primary purpose of the Trans-Jordan is the operation, maintenance, and control of a refuse dumping site situated east of Bingham Canyon in Salt Lake County. Residents and businesses from all member cities and Salt Lake County can use the facility by paying a tipping fee for each refuse load. Trans-Jordan is also used for the disposal of weekly garbage pickups of the cities in Trans-Jordan for which an assessment is charged. In addition to West Jordan, the Trans-Jordan Landfill is owned by the cities of Midvale, Murray, Sandy, Draper, South Jordan, and Riverton that have ownership interests of 5.16%, 8.42%, 29.95%, 10.25%, 13.77%, and 10.75% respectively. The complete financial statements for the Trans-Jordan Landfill for the year ended June 30, 2015 can be obtained from the Trans-Jordan Landfill at 10873 South 7200 West, South Jordan, Utah 84095.
73
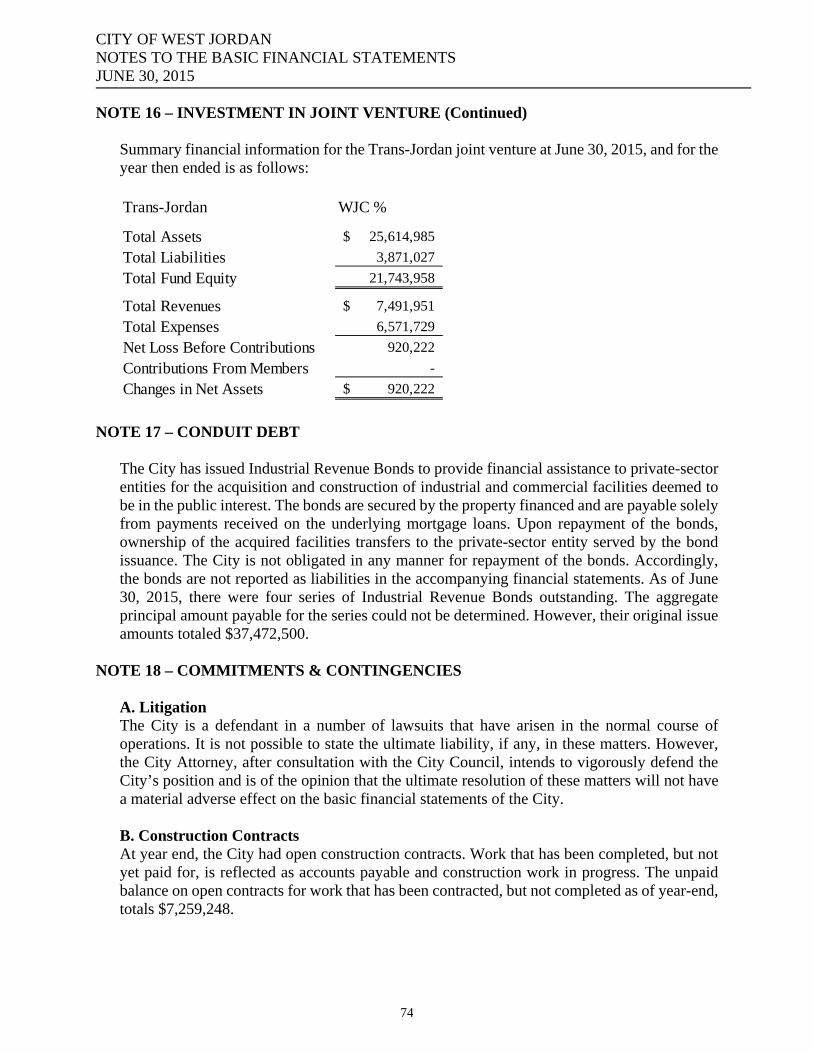
CITY OF WEST JORDAN NOTES TO THE BASIC FINANCIAL STATEMENTS JUNE 30, 2015
NOTE 16 – INVESTMENT IN JOINT VENTURE (Continued) Summary financial information for the Trans-Jordan joint venture at June 30, 2015, and for the year then ended is as follows: Trans-Jordan WJC %
Total Assets 25,614,985$
Total Liabilities 3,871,027
Total Fund Equity 21,743,958
Total Revenues 7,491,951$
Total Expenses 6,571,729
Net Loss Before Contributions 920,222
Contributions From Members -
Changes in Net Assets 920,222$
NOTE 17 – CONDUIT DEBT
The City has issued Industrial Revenue Bonds to provide financial assistance to private-sector entities for the acquisition and construction of industrial and commercial facilities deemed to be in the public interest. The bonds are secured by the property financed and are payable solely from payments received on the underlying mortgage loans. Upon repayment of the bonds, ownership of the acquired facilities transfers to the private-sector entity served by the bond issuance. The City is not obligated in any manner for repayment of the bonds. Accordingly, the bonds are not reported as liabilities in the accompanying financial statements. As of June 30, 2015, there were four series of Industrial Revenue Bonds outstanding. The aggregate principal amount payable for the series could not be determined. However, their original issue amounts totaled $37,472,500.
NOTE 18 – COMMITMENTS & CONTINGENCIES
A. Litigation The City is a defendant in a number of lawsuits that have arisen in the normal course of operations. It is not possible to state the ultimate liability, if any, in these matters. However, the City Attorney, after consultation with the City Council, intends to vigorously defend the City’s position and is of the opinion that the ultimate resolution of these matters will not have a material adverse effect on the basic financial statements of the City. B. Construction Contracts At year end, the City had open construction contracts. Work that has been completed, but not yet paid for, is reflected as accounts payable and construction work in progress. The unpaid balance on open contracts for work that has been contracted, but not completed as of year-end, totals $7,259,248.
74
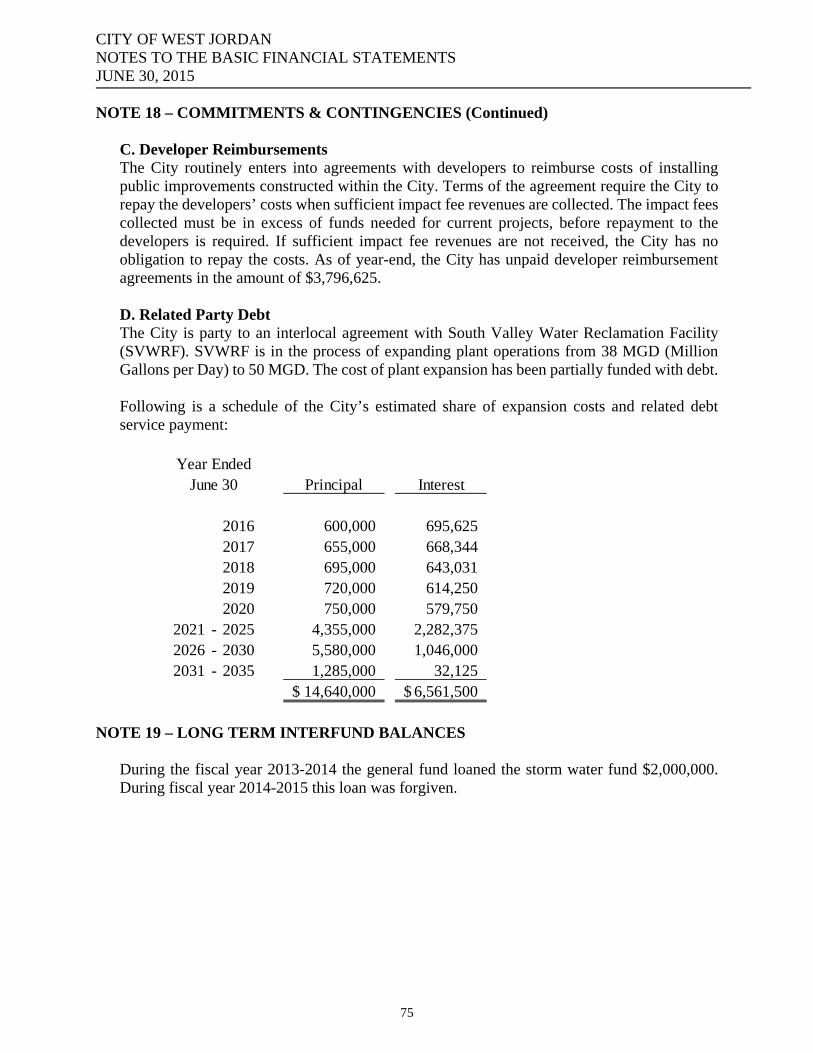
CITY OF WEST JORDAN NOTES TO THE BASIC FINANCIAL STATEMENTS JUNE 30, 2015
NOTE 18 – COMMITMENTS & CONTINGENCIES (Continued) C. Developer Reimbursements The City routinely enters into agreements with developers to reimburse costs of installing public improvements constructed within the City. Terms of the agreement require the City to repay the developers’ costs when sufficient impact fee revenues are collected. The impact fees collected must be in excess of funds needed for current projects, before repayment to the developers is required. If sufficient impact fee revenues are not received, the City has no obligation to repay the costs. As of year-end, the City has unpaid developer reimbursement agreements in the amount of $3,796,625. D. Related Party Debt The City is party to an interlocal agreement with South Valley Water Reclamation Facility (SVWRF). SVWRF is in the process of expanding plant operations from 38 MGD (Million Gallons per Day) to 50 MGD. The cost of plant expansion has been partially funded with debt.
Following is a schedule of the City’s estimated share of expansion costs and related debt service payment:
Principal Interest
2016 600,000 695,625 2017 655,000 668,344 2018 695,000 643,031 2019 720,000 614,250 2020 750,000 579,750
2021 - 2025 4,355,000 2,282,375 2026 - 2030 5,580,000 1,046,000 2031 - 2035 1,285,000 32,125
14,640,000$ 6,561,500$
Year EndedJune 30
NOTE 19 – LONG TERM INTERFUND BALANCES
During the fiscal year 2013-2014 the general fund loaned the storm water fund $2,000,000. During fiscal year 2014-2015 this loan was forgiven.
75
CITY OF WEST JORDAN NOTES TO THE BASIC FINANCIAL STATEMENTS JUNE 30, 2015
NOTE 20 – PRIOR PERIOD ADJUSTMENT
GASB 68 In fiscal year 2015, the City implemented GASB Statement No. 68, Accounting and Financial Reporting for Pensions. As a result, the City has established the following at the government-wide and proprietary fund financial statement level to account for its defined benefit plans with the Utah State Retirement System: net pension asset, deferred outflows of resources – pensions, net pension liability, and deferred inflows of resources – pensions. The net effect of this accounting required a prior period adjustment reducing net position to governmental activities by $9,615,060 and business-type activities by $590,926. The business-type reduction of $590,926 is broken out by fund as follows: Water $360,271, Sewer $167,378, Solid Waste $17,350, and Storm Water $45,927. Change in Accounting Process in the Community Development Block Grant Additionally in fiscal year 2015, it was determined by management of a more effective way to account for the funds in the Community Development Block Grant Fund. The net effect of this accounting change required a prior period adjustment increasing net position to governmental activities and increasing the fund balance in the Community Development Block Grant by $165,357. Change in Contracts Payable Additionally in fiscal year 2015, it was determined by management that the city fulfilled the obligation, in prior years, to Salt Lake County related to the library agreement. The net effect of this accounting change required a prior period adjustment increasing net position to governmental activities by $400,000.
NOTE 21 – SUBSEQUENT EVENTS
On December 3, 2015 the city entered into a capital lease of $1,286,703 to purchase equipment. The interest rate on the lease is 1.97% and the terms of the lease require annual payments of $194,745 through December 3, 2021, at which time ownership will transfer to the City.
76

Combining and Individual Fund Financial Statements and Schedules
Combining Financial Statements – Nonmajor Governmental Funds
Special Revenue Funds
Special Revenue Funds are used to account for specific revenues that are legally restricted to expenditures for particular purposes. Fairway Estates Special Service District – This fund is used to develop and maintain recreation areas within the Fairway Estates subdivision. KraftMaid Special Improvement District – This fund is used to account for the collection of revenue to service debt related to the KraftMaid business development.
Capital Projects Funds Capital Projects Funds are used to account for the acquisition and construction of major capital facilities other than those financed by proprietary funds. Park Capital Improvement Fund – This fund is used for the acquisition or construction of major park capital facilities. Building Capital Improvement Fund – This fund is used to account for impact fee revenue and to construct buildings or major building improvements. Community Development Block Grant – This fund is used to account for programs funded by Community Development Block Grant funds. Municipal Building Authority – This fund is used to collect revenues to service debt related to Municipal Buildings constructed in the City.
77

CITY OF WEST JORDAN COMBINING BALANCE SHEET NONMAJOR GOVERNMENTAL FUNDS JUNE 30, 2015
Fairway KraftmaidEstates SID Total
AssetsCash and cash equivalents 33,272$ 479,424$ 512,696$ Accounts receivable - net - - - Taxes receivable 10,289 - 10,289 Loans receivable - - - Prepaid items - - - Due from other governments - - - Restricted assets:
Cash and cash equivalents - 2,224 2,224
Total Assets 43,561$ 481,648$ 525,209$
Liabilities, Deferred Inflows of Resources and Net Position
LiabilitiesAccounts payable 304$ -$ 304$ Accrued liabilities - - - Unearned revenue - - - Due to other funds - - - Liabilities payable from restricted assets:
Accounts payable - - - Accrued liabilities - - -
Total Liabilities 304 - 304
Deferred Inflows of ResourcesUnavailable revenue-property taxes 10,099 - 10,099
Total Deferred Inflows of Resources 10,099 - 10,099
Net Position
Nonspendable - - - Restricted - 2,224 2,224 Committed - - - Assigned 33,158 479,424 512,582
Total Net Position 33,158 481,648 514,806
Total Liabilities, Deferred Inflows ofResources, and Net Position 43,561$ 481,648$ 525,209$
Special Revenue Funds
Com
78

CITY OF WEST JORDAN COMBINING BALANCE SHEET NONMAJOR GOVERNMENTAL FUNDS JUNE 30, 2015
Capital Projects FundsTotal
Park Capital Building Capital Community Municipal NonmajorImprovement Improvement Development Building Governmental
Fund Fund Block Grant Authority Total Funds
2,383,225$ 580,777$ -$ 2,029,556$ 4,993,558$ 5,506,254$ - - - - - - - - - - - 10,289 - - 753,902 - 753,902 753,902 - - - - - - - - 158,335 - 158,335 158,335
- - 4,936,666 1,048,356 200,894 - 6,185,916 6,188,140
7,319,891$ 1,629,133$ 1,113,131$ 2,029,556$ 12,091,711$ 12,616,920$
160,299$ 174,583$ 7,903$ -$ 342,785$ 343,089$ - - 4,500 - 4,500 4,500 - - 754,232 - 754,232 754,232 - - 90,419 - 90,419 90,419
- - 75,671 - - - 75,671 75,671
- - - - - -
235,970 174,583 857,054 - 1,267,607 1,267,911
- - - - 10,099
- - - - - 10,099
- - - - - - 4,860,995 1,048,356 200,894 - 6,110,245 6,112,469
- - - - - - 2,222,926 406,194 55,183 2,029,556 4,713,859 5,226,441
7,083,921 1,454,550 256,077 2,029,556 10,824,104 11,338,910
7,319,891$ 1,629,133$ 1,113,131$ 2,029,556$ 12,091,711$ 12,616,920$
79

CITY OF WEST JORDAN COMBINING STATEMENT OF REVENUES, EXPENDITURES AND CHANGES IN FUND BALANCE NONMAJOR GOVERNMENTAL FUNDS FOR THE FISCAL YEAR ENDED JUNE 30, 2015
Special Revenue
Fairway KraftmaidEstates SID Total
RevenuesTaxes 11,067$ -$ 11,067$ Intergovernmental - - - Charges for services - - - Impact fees - - - Interest 135 2,025 2,160 Miscellaneous - - -
Total Revenues 11,202 2,025 13,227
ExpendituresCommunity development - - - Parks and recreation 5,663 - 5,663 Debt service:
Principal - - - Interest - 133,856 133,856
Capital Outlay:Parks - - - Building - - - Storm Water - - -
Total Expenditures 5,663 133,856 139,519
Excess (Deficiency) of Revenues Over (Under) Expenditures 5,539 (131,831) (126,292)
Other Financing Sources (Uses)Transfer in - 201,617 201,617 Transfer out - - - Developer contribution - - - Bond Proceeds - - -
Total Other Financing Sources (Uses) - 201,617 201,617
Net Change in Fund Balances 5,539 69,786 75,325
Fund Balance, Beginning 27,619 411,862 439,481
Prior Period Adj - - -
Fund Balance, Ending 33,158$ 481,648$ 514,806$
80
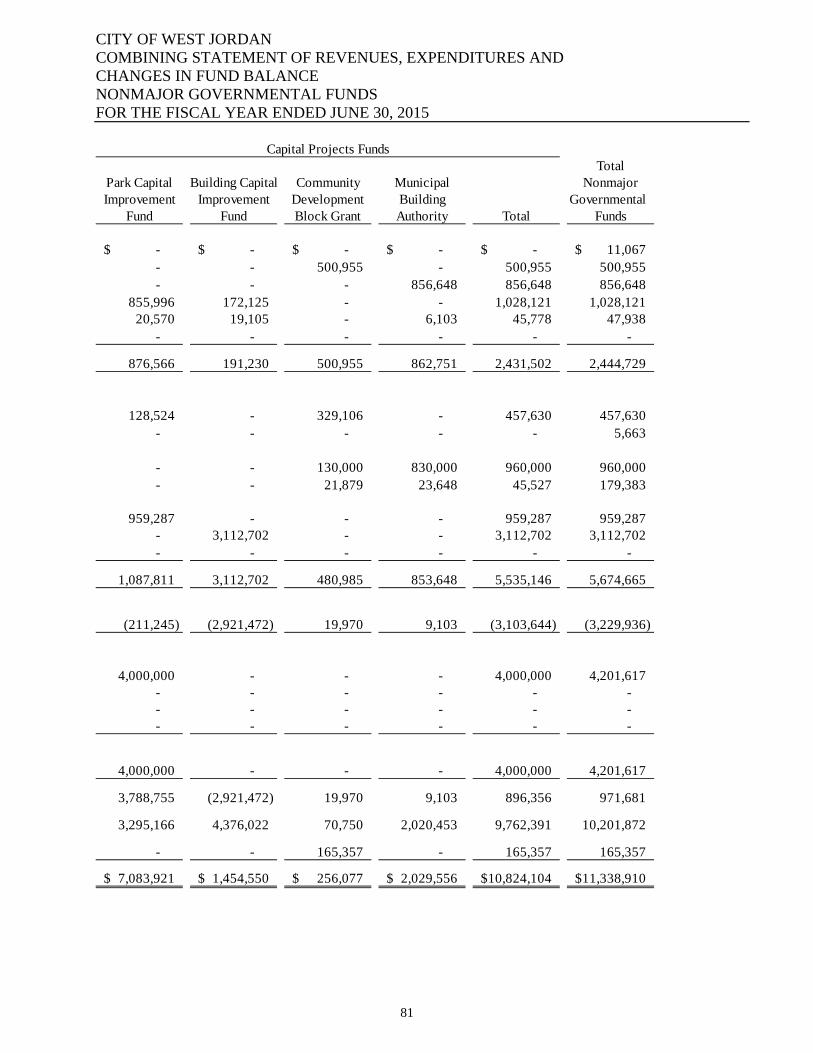
CITY OF WEST JORDAN COMBINING STATEMENT OF REVENUES, EXPENDITURES AND CHANGES IN FUND BALANCE NONMAJOR GOVERNMENTAL FUNDS FOR THE FISCAL YEAR ENDED JUNE 30, 2015
Capital Projects FundsTotal
Park Capital Building Capital Community Municipal NonmajorImprovement Improvement Development Building Governmental
Fund Fund Block Grant Authority Total Funds
-$ -$ -$ -$ -$ 11,067$ - - 500,955 - 500,955 500,955 - - - 856,648 856,648 856,648
855,996 172,125 - - 1,028,121 1,028,121 20,570 19,105 - 6,103 45,778 47,938
- - - - - -
876,566 191,230 500,955 862,751 2,431,502 2,444,729
128,524 - 329,106 - 457,630 457,630 - - - - - 5,663
- - 130,000 830,000 960,000 960,000 - - 21,879 23,648 45,527 179,383
959,287 - - - 959,287 959,287 - 3,112,702 - - 3,112,702 3,112,702 - - - - - -
1,087,811 3,112,702 480,985 853,648 5,535,146 5,674,665
(211,245) (2,921,472) 19,970 9,103 (3,103,644) (3,229,936)
4,000,000 - - - 4,000,000 4,201,617 - - - - - - - - - - - - - - - - - -
4,000,000 - - - 4,000,000 4,201,617
3,788,755 (2,921,472) 19,970 9,103 896,356 971,681
3,295,166 4,376,022 70,750 2,020,453 9,762,391 10,201,872
- - 165,357 - 165,357 165,357
7,083,921$ 1,454,550$ 256,077$ 2,029,556$ 10,824,104$ 11,338,910$
81

SCHEDULES OF REVENUES, EXPENDITURES AND CHANGES IN FUND BALANCE –
BUDGET AND ACTUAL
Special Revenue and Capital Projects Funds
82

CITY OF WEST JORDAN FAIRWAY ESTATES FUND SCHEDULE OF REVENUES, EXPENDITURES, AND CHANGES IN FUND BALANCE – BUDGET AND ACTUAL FOR THE FISCAL YEAR ENDED JUNE 30, 2015
Actual Variance withOriginal Final Amounts final budget
RevenuesTaxes 11,244$ 11,244$ 11,067$ (177)$ Interest - - 135 135
Total Revenues 11,244 11,244 11,202 (42)
ExpendituresParks and recreation 9,454 9,454 5,663 3,791$
Total Expenditures 9,454 9,454 5,663 3,791
Excess (Deficiency) of Revenues Over (Under) Expenditures 1,790 1,790 5,539 3,749
Net Change in Fund Balance 1,790$ 1,790$ 5,539 3,749$
Fund Balance, Beginning 27,619
Fund Balance, Ending 33,158$
Budgeted Amounts
Western Stampede airway Estates Fu
83
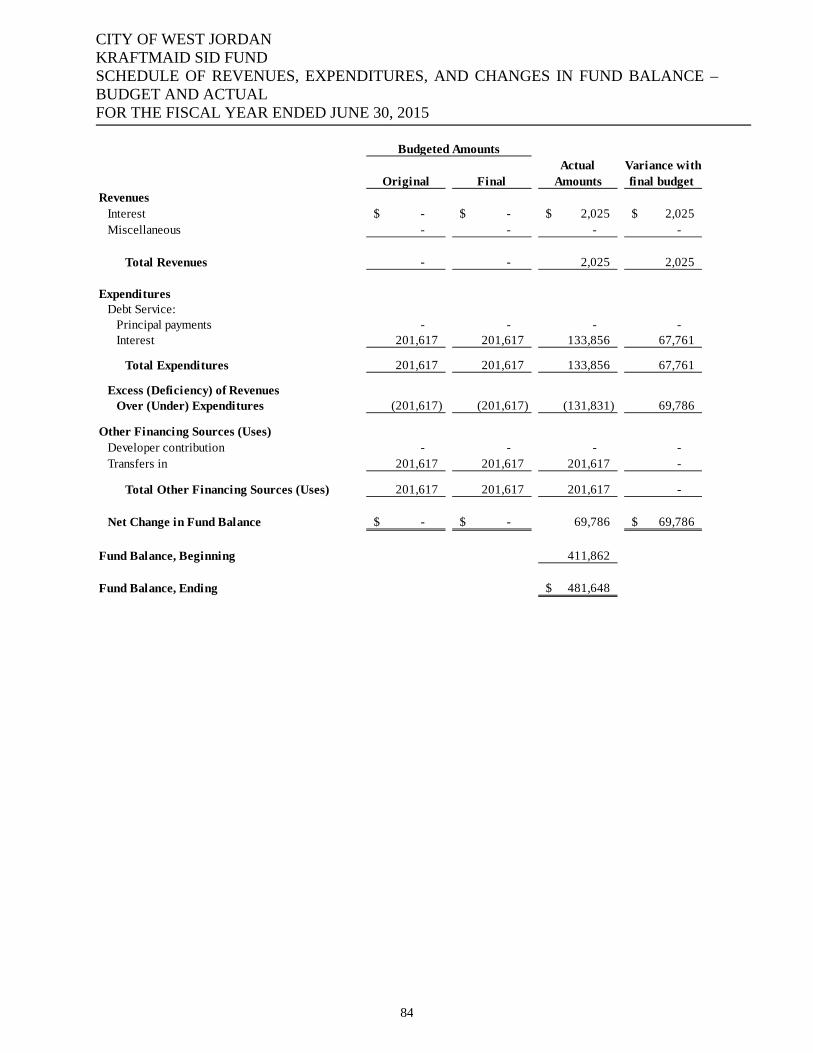
CITY OF WEST JORDAN KRAFTMAID SID FUND SCHEDULE OF REVENUES, EXPENDITURES, AND CHANGES IN FUND BALANCE – BUDGET AND ACTUAL FOR THE FISCAL YEAR ENDED JUNE 30, 2015
Actual Variance withOriginal Final Amounts final budget
RevenuesInterest -$ -$ 2,025$ 2,025$ Miscellaneous - - - -
Total Revenues - - 2,025 2,025
ExpendituresDebt Service:
Principal payments - - - - Interest 201,617 201,617 133,856 67,761
Total Expenditures 201,617 201,617 133,856 67,761
Excess (Deficiency) of Revenues Over (Under) Expenditures (201,617) (201,617) (131,831) 69,786
Other Financing Sources (Uses)Developer contribution - - - - Transfers in 201,617 201,617 201,617 -
Total Other Financing Sources (Uses) 201,617 201,617 201,617 -
Net Change in Fund Balance -$ -$ 69,786 69,786$
Fund Balance, Beginning 411,862
Fund Balance, Ending 481,648$
Budgeted Amounts
SID Fund
84
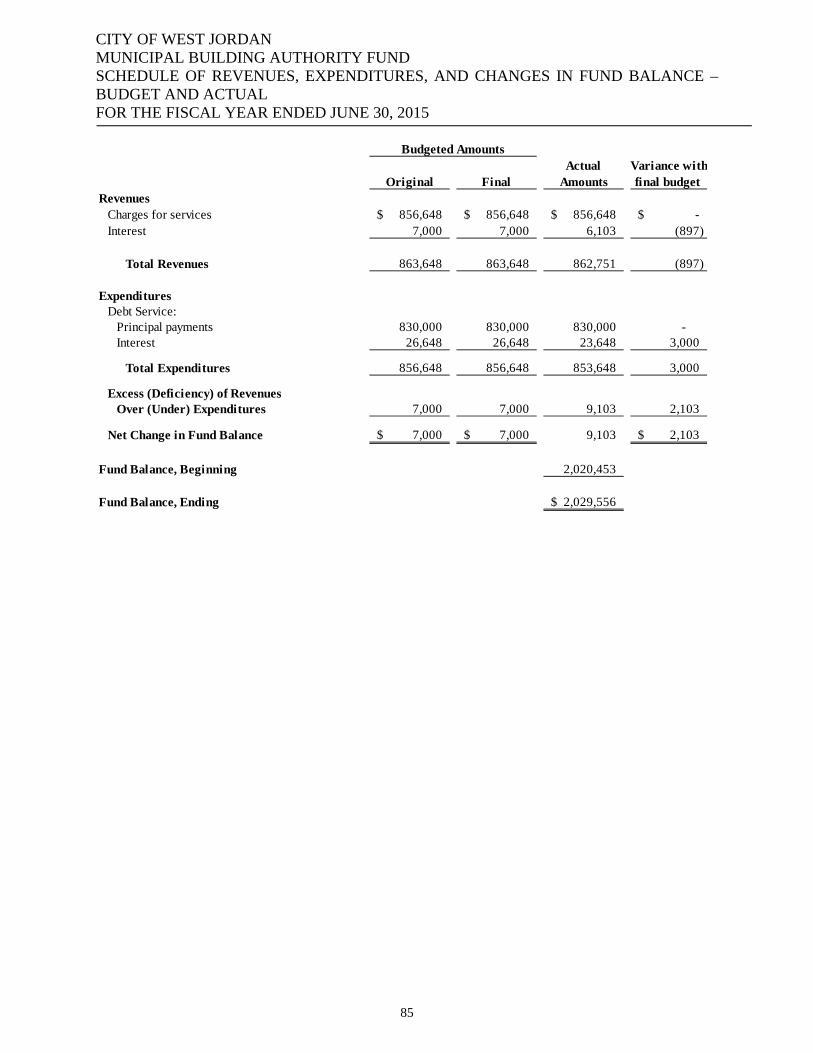
CITY OF WEST JORDAN MUNICIPAL BUILDING AUTHORITY FUND SCHEDULE OF REVENUES, EXPENDITURES, AND CHANGES IN FUND BALANCE – BUDGET AND ACTUAL FOR THE FISCAL YEAR ENDED JUNE 30, 2015
Actual Variance withOriginal Final Amounts final budget
RevenuesCharges for services 856,648$ 856,648$ 856,648$ -$ Interest 7,000 7,000 6,103 (897)
Total Revenues 863,648 863,648 862,751 (897)
ExpendituresDebt Service:
Principal payments 830,000 830,000 830,000 - Interest 26,648 26,648 23,648 3,000
Total Expenditures 856,648 856,648 853,648 3,000
Excess (Deficiency) of Revenues Over (Under) Expenditures 7,000 7,000 9,103 2,103
Net Change in Fund Balance 7,000$ 7,000$ 9,103 2,103$
Fund Balance, Beginning 2,020,453
Fund Balance, Ending 2,029,556$
Budgeted Amounts
Municipal B
85
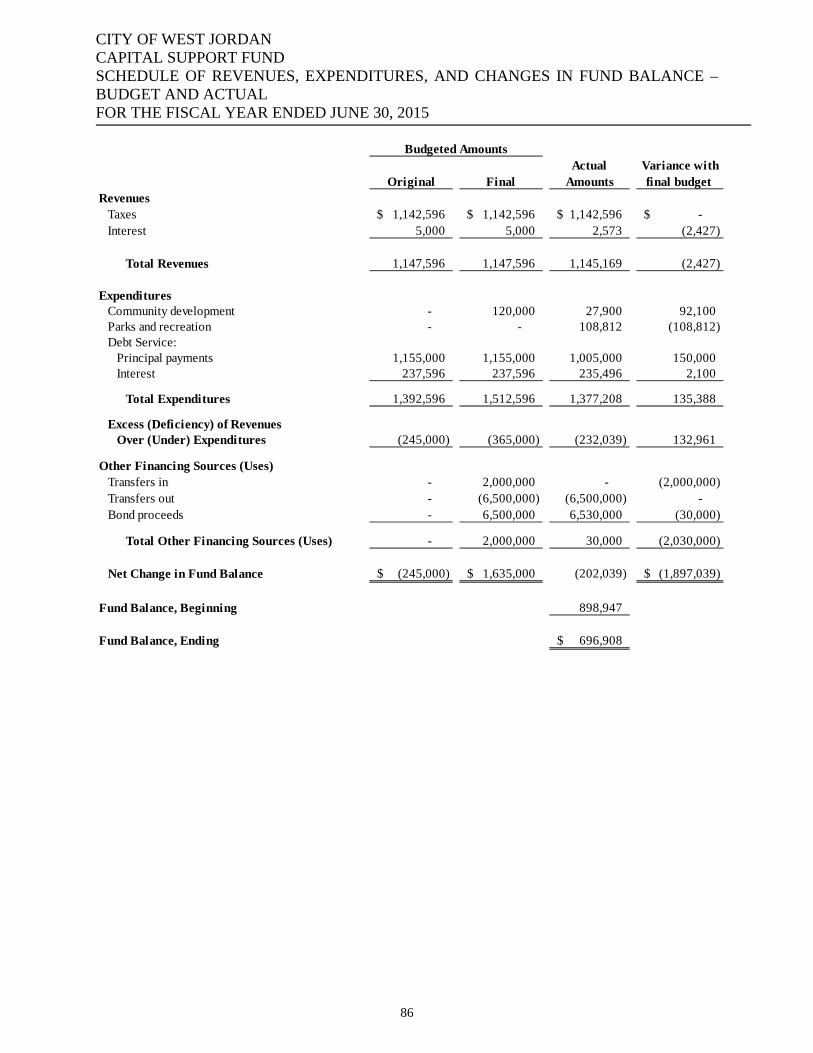
CITY OF WEST JORDAN CAPITAL SUPPORT FUND SCHEDULE OF REVENUES, EXPENDITURES, AND CHANGES IN FUND BALANCE – BUDGET AND ACTUAL FOR THE FISCAL YEAR ENDED JUNE 30, 2015
Actual Variance withOriginal Final Amounts final budget
RevenuesTaxes 1,142,596$ 1,142,596$ 1,142,596$ -$ Interest 5,000 5,000 2,573 (2,427)
Total Revenues 1,147,596 1,147,596 1,145,169 (2,427)
ExpendituresCommunity development - 120,000 27,900 92,100 Parks and recreation - - 108,812 (108,812) Debt Service:
Principal payments 1,155,000 1,155,000 1,005,000 150,000 Interest 237,596 237,596 235,496 2,100
Total Expenditures 1,392,596 1,512,596 1,377,208 135,388
Excess (Deficiency) of Revenues Over (Under) Expenditures (245,000) (365,000) (232,039) 132,961
Other Financing Sources (Uses)Transfers in - 2,000,000 - (2,000,000) Transfers out - (6,500,000) (6,500,000) - Bond proceeds - 6,500,000 6,530,000 (30,000)
Total Other Financing Sources (Uses) - 2,000,000 30,000 (2,030,000)
Net Change in Fund Balance (245,000)$ 1,635,000$ (202,039) (1,897,039)$
Fund Balance, Beginning 898,947
Fund Balance, Ending 696,908$
Budgeted Amounts
Capital Support Fund
86
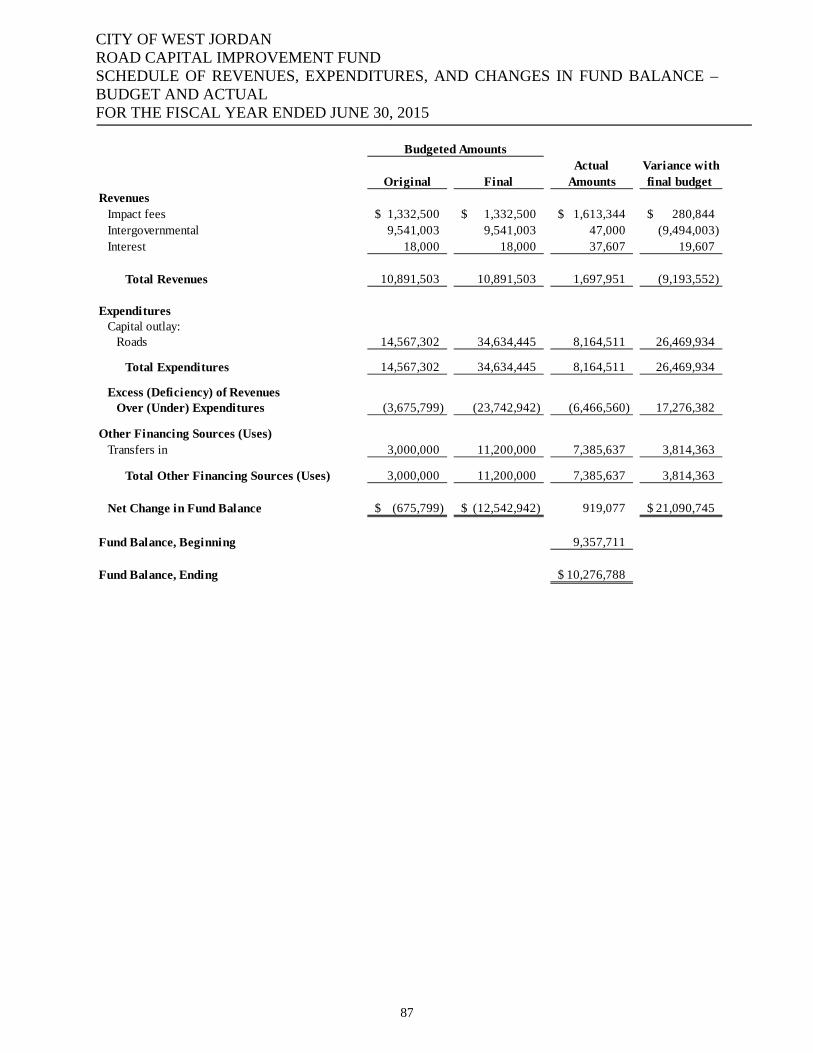
CITY OF WEST JORDAN ROAD CAPITAL IMPROVEMENT FUND SCHEDULE OF REVENUES, EXPENDITURES, AND CHANGES IN FUND BALANCE – BUDGET AND ACTUAL FOR THE FISCAL YEAR ENDED JUNE 30, 2015
Actual Variance withOriginal Final Amounts final budget
RevenuesImpact fees 1,332,500$ 1,332,500$ 1,613,344$ 280,844$ Intergovernmental 9,541,003 9,541,003 47,000 (9,494,003) Interest 18,000 18,000 37,607 19,607
Total Revenues 10,891,503 10,891,503 1,697,951 (9,193,552)
ExpendituresCapital outlay:
Roads 14,567,302 34,634,445 8,164,511 26,469,934
Total Expenditures 14,567,302 34,634,445 8,164,511 26,469,934
Excess (Deficiency) of Revenues Over (Under) Expenditures (3,675,799) (23,742,942) (6,466,560) 17,276,382
Other Financing Sources (Uses)Transfers in 3,000,000 11,200,000 7,385,637 3,814,363
Total Other Financing Sources (Uses) 3,000,000 11,200,000 7,385,637 3,814,363
Net Change in Fund Balance (675,799)$ (12,542,942)$ 919,077 21,090,745$
Fund Balance, Beginning 9,357,711
Fund Balance, Ending 10,276,788$
Budgeted Amounts
87

CITY OF WEST JORDAN PARKS CAPITAL IMPROVEMENT FUND SCHEDULE OF REVENUES, EXPENDITURES, AND CHANGES IN FUND BALANCE – BUDGET AND ACTUAL FOR THE FISCAL YEAR ENDED JUNE 30, 2015
Actual Variance withOriginal Final Amounts final budget
RevenuesImpact fees 768,750$ 768,750$ 855,996$ 87,246$ Interest 53,000 53,000 20,570 (32,430)
Total Revenues 821,750 821,750 876,566 54,816
ExpendituresCommunity development - - 128,524 (128,524) Capital Outlay:
Parks 1,525,547 6,919,122 959,287 5,959,835
Total Expenditures 1,525,547 6,919,122 1,087,811 5,831,311
Excess (Deficiency) of Revenues Over (Under) Expenditures (703,797) (6,097,372) (211,245) (5,886,127)
Other Financing Sources (Uses)Transfers in - 4,000,000 4,000,000 -
Total Other Financing Sources (Uses) - 4,000,000 4,000,000 -
Net Change in Fund Balance (703,797)$ (2,097,372)$ 3,788,755 (5,886,127)$
Fund Balance, Beginning 3,295,166
Fund Balance, Ending 7,083,921$
Budgeted Amounts
Parks Capital Improvement Fund
88
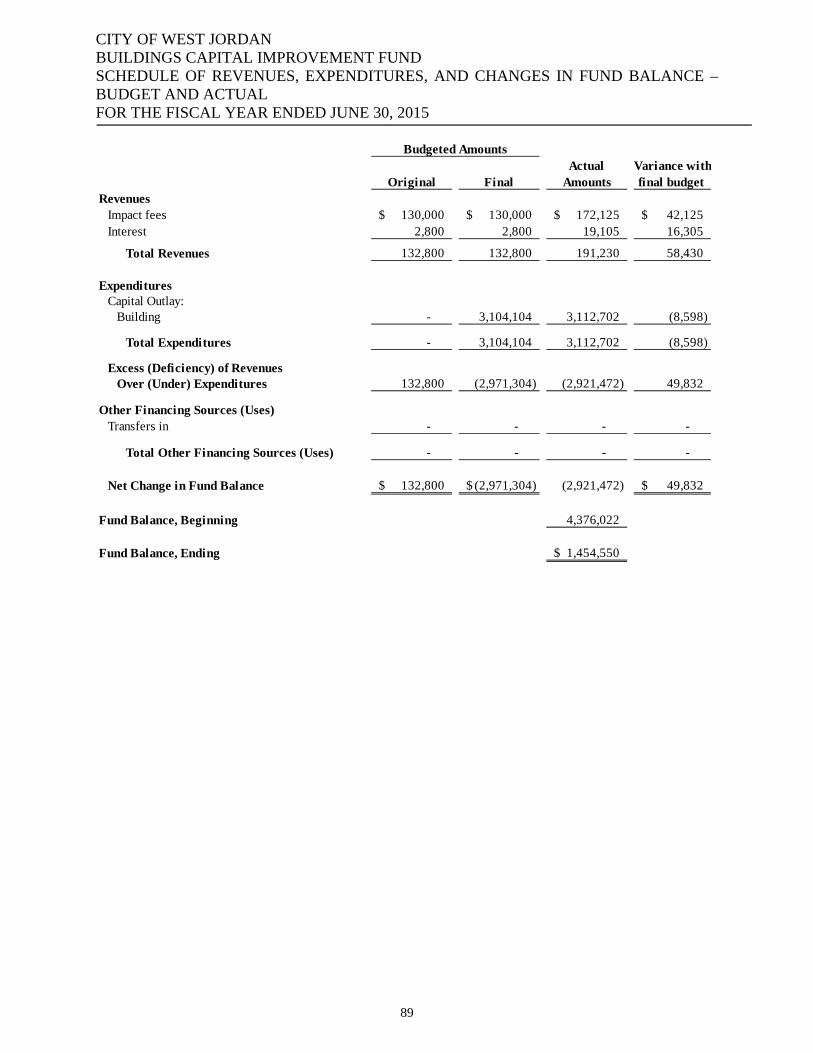
CITY OF WEST JORDAN BUILDINGS CAPITAL IMPROVEMENT FUND SCHEDULE OF REVENUES, EXPENDITURES, AND CHANGES IN FUND BALANCE – BUDGET AND ACTUAL FOR THE FISCAL YEAR ENDED JUNE 30, 2015
Actual Variance withOriginal Final Amounts final budget
RevenuesImpact fees 130,000$ 130,000$ 172,125$ 42,125$ Interest 2,800 2,800 19,105 16,305
Total Revenues 132,800 132,800 191,230 58,430
ExpendituresCapital Outlay:
Building - 3,104,104 3,112,702 (8,598)
Total Expenditures - 3,104,104 3,112,702 (8,598)
Excess (Deficiency) of Revenues Over (Under) Expenditures 132,800 (2,971,304) (2,921,472) 49,832
Other Financing Sources (Uses)Transfers in - - - -
Total Other Financing Sources (Uses) - - - -
Net Change in Fund Balance 132,800$ (2,971,304)$ (2,921,472) 49,832$
Fund Balance, Beginning 4,376,022
Fund Balance, Ending 1,454,550$
Budgeted Amounts
89
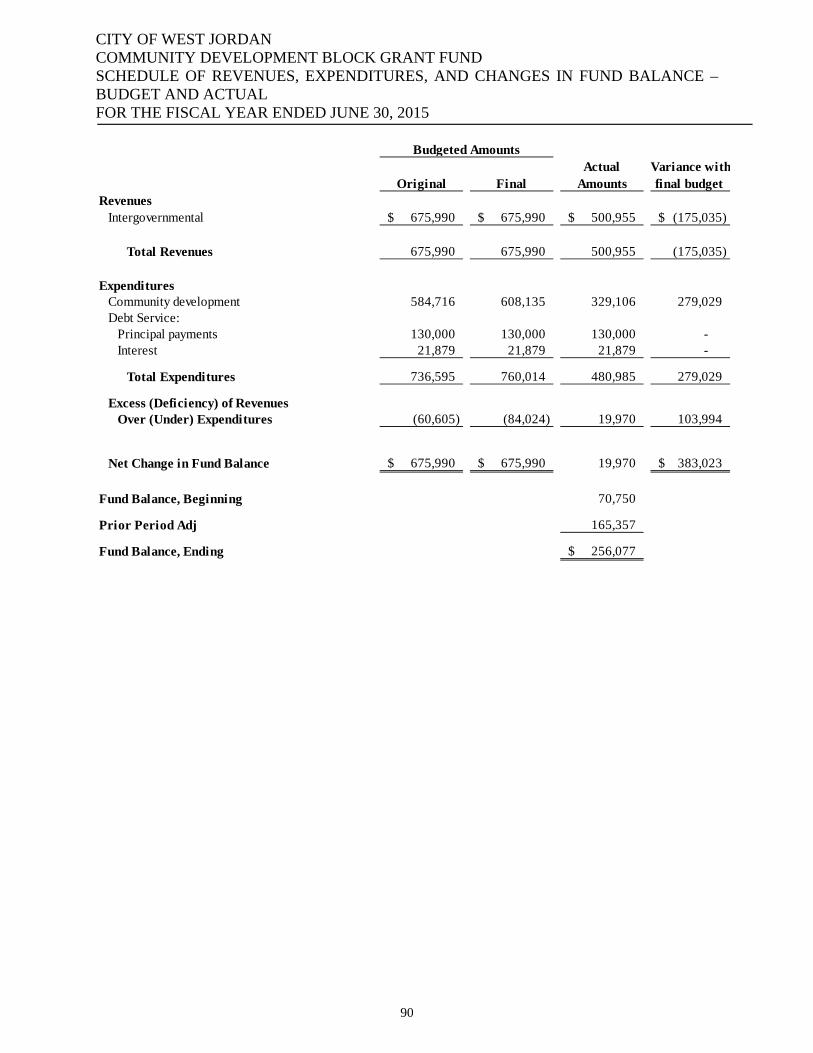
CITY OF WEST JORDAN COMMUNITY DEVELOPMENT BLOCK GRANT FUND SCHEDULE OF REVENUES, EXPENDITURES, AND CHANGES IN FUND BALANCE – BUDGET AND ACTUAL FOR THE FISCAL YEAR ENDED JUNE 30, 2015
Actual Variance withOriginal Final Amounts final budget
RevenuesIntergovernmental 675,990$ 675,990$ 500,955$ (175,035)$
Total Revenues 675,990 675,990 500,955 (175,035)
ExpendituresCommunity development 584,716 608,135 329,106 279,029 Debt Service:
Principal payments 130,000 130,000 130,000 - Interest 21,879 21,879 21,879 -
Total Expenditures 736,595 760,014 480,985 279,029
Excess (Deficiency) of Revenues Over (Under) Expenditures (60,605) (84,024) 19,970 103,994
Net Change in Fund Balance 675,990$ 675,990$ 19,970 383,023$
Fund Balance, Beginning 70,750
Prior Period Adj 165,357
Fund Balance, Ending 256,077$
Budgeted Amounts
Community Development Block Grant Fund
90
Combining Financial Statements – Internal Service Funds Internal service funds are used to account for the financing of goods or services provided by one department or agency to other departments or agencies of the City and to other government units. Fleet Operations Fund – This fund is used to account for the costs of operating a maintenance facility for automotive equipment used by other City departments. A service fee is charged to the other departments monthly. Information Technologies Lease Fund – This fund is used to account for the costs of replacing, updating, or adding computer equipment within the City. A replacement schedule has been implemented ensuring that equipment is replaced in order of the highest need. A service fee is charged to the other departments monthly. Risk Management – This fund is used to account for the costs of insurance premiums and claims made against the City. Monies are accumulated in this fund to pay premiums for liability and property damage insurance and other claims. The City participates in the Utah Risk Management Mutual Association for its liability and property damage insurance and is responsible for annual premiums as well as 100% of losses above the deductible in an amount equal to 20% of all net loss payments made during the previous five years on behalf of the City.
91
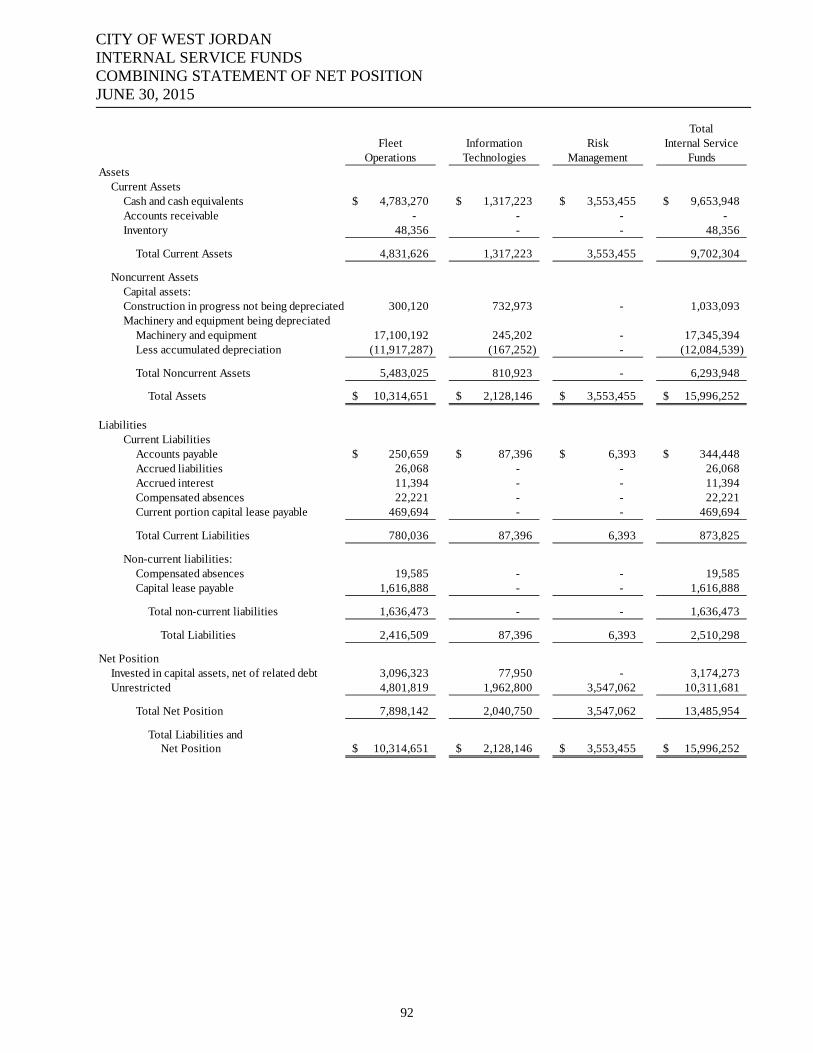
CITY OF WEST JORDAN INTERNAL SERVICE FUNDS COMBINING STATEMENT OF NET POSITION JUNE 30, 2015
TotalFleet Information Risk Internal Service
Operations Technologies Management FundsAssets
Current AssetsCash and cash equivalents 4,783,270$ 1,317,223$ 3,553,455$ 9,653,948$ Accounts receivable - - - - Inventory 48,356 - - 48,356
Total Current Assets 4,831,626 1,317,223 3,553,455 9,702,304
Noncurrent AssetsCapital assets:Construction in progress not being depreciated 300,120 732,973 - 1,033,093 Machinery and equipment being depreciated
Machinery and equipment 17,100,192 245,202 - 17,345,394 Less accumulated depreciation (11,917,287) (167,252) - (12,084,539)
Total Noncurrent Assets 5,483,025 810,923 - 6,293,948
Total Assets 10,314,651$ 2,128,146$ 3,553,455$ 15,996,252$
LiabilitiesCurrent Liabilities
Accounts payable 250,659$ 87,396$ 6,393$ 344,448$ Accrued liabilities 26,068 - - 26,068 Accrued interest 11,394 - - 11,394 Compensated absences 22,221 - - 22,221 Current portion capital lease payable 469,694 - - 469,694
Total Current Liabilities 780,036 87,396 6,393 873,825
Non-current liabilities:Compensated absences 19,585 - - 19,585 Capital lease payable 1,616,888 - - 1,616,888
Total non-current liabilities 1,636,473 - - 1,636,473
Total Liabilities 2,416,509 87,396 6,393 2,510,298
Net PositionInvested in capital assets, net of related debt 3,096,323 77,950 - 3,174,273 Unrestricted 4,801,819 1,962,800 3,547,062 10,311,681
Total Net Position 7,898,142 2,040,750 3,547,062 13,485,954
Total Liabilities andNet Position 10,314,651$ 2,128,146$ 3,553,455$ 15,996,252$
Assets – Internal Service Funds
92
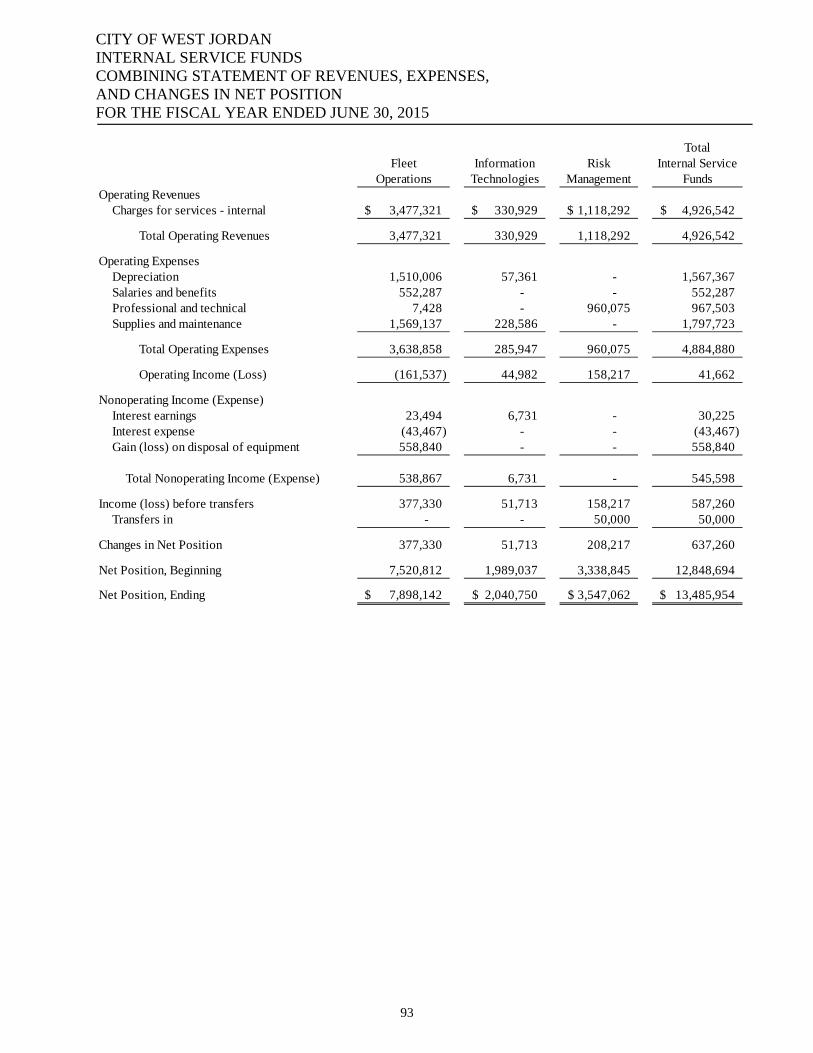
CITY OF WEST JORDAN INTERNAL SERVICE FUNDS COMBINING STATEMENT OF REVENUES, EXPENSES, AND CHANGES IN NET POSITION FOR THE FISCAL YEAR ENDED JUNE 30, 2015
TotalFleet Information Risk Internal Service
Operations Technologies Management FundsOperating Revenues
Charges for services - internal 3,477,321$ 330,929$ 1,118,292$ 4,926,542$
Total Operating Revenues 3,477,321 330,929 1,118,292 4,926,542
Operating ExpensesDepreciation 1,510,006 57,361 - 1,567,367 Salaries and benefits 552,287 - - 552,287 Professional and technical 7,428 - 960,075 967,503 Supplies and maintenance 1,569,137 228,586 - 1,797,723
Total Operating Expenses 3,638,858 285,947 960,075 4,884,880
Operating Income (Loss) (161,537) 44,982 158,217 41,662
Nonoperating Income (Expense)Interest earnings 23,494 6,731 - 30,225 Interest expense (43,467) - - (43,467) Gain (loss) on disposal of equipment 558,840 - - 558,840
Total Nonoperating Income (Expense) 538,867 6,731 - 545,598
Income (loss) before transfers 377,330 51,713 158,217 587,260 Transfers in - - 50,000 50,000
Changes in Net Position 377,330 51,713 208,217 637,260
Net Position, Beginning 7,520,812 1,989,037 3,338,845 12,848,694
Net Position, Ending 7,898,142$ 2,040,750$ 3,547,062$ 13,485,954$
Com Expenses, and Changes in Net Assets – Internal Service Fun Combining Statements of Net Assets
93
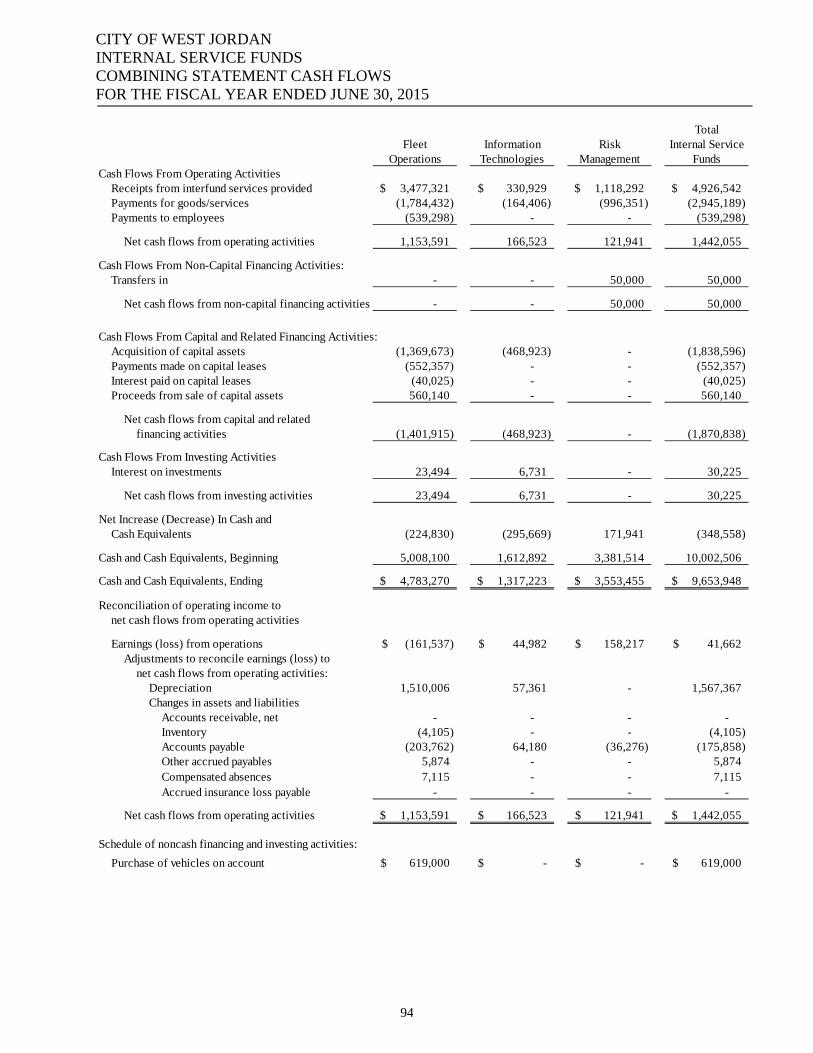
CITY OF WEST JORDAN INTERNAL SERVICE FUNDS COMBINING STATEMENT CASH FLOWS FOR THE FISCAL YEAR ENDED JUNE 30, 2015
TotalFleet Information Risk Internal Service
Operations Technologies Management FundsCash Flows From Operating Activities
Receipts from interfund services provided 3,477,321$ 330,929$ 1,118,292$ 4,926,542$ Payments for goods/services (1,784,432) (164,406) (996,351) (2,945,189) Payments to employees (539,298) - - (539,298)
Net cash flows from operating activities 1,153,591 166,523 121,941 1,442,055
Cash Flows From Non-Capital Financing Activities:Transfers in - - 50,000 50,000
Net cash flows from non-capital financing activities - - 50,000 50,000
Cash Flows From Capital and Related Financing Activities:Acquisition of capital assets (1,369,673) (468,923) - (1,838,596) Payments made on capital leases (552,357) - - (552,357) Interest paid on capital leases (40,025) - - (40,025) Proceeds from sale of capital assets 560,140 - - 560,140
Net cash flows from capital and relatedfinancing activities (1,401,915) (468,923) - (1,870,838)
Cash Flows From Investing ActivitiesInterest on investments 23,494 6,731 - 30,225
Net cash flows from investing activities 23,494 6,731 - 30,225
Net Increase (Decrease) In Cash and Cash Equivalents (224,830) (295,669) 171,941 (348,558)
Cash and Cash Equivalents, Beginning 5,008,100 1,612,892 3,381,514 10,002,506
Cash and Cash Equivalents, Ending 4,783,270$ 1,317,223$ 3,553,455$ 9,653,948$
Reconciliation of operating income tonet cash flows from operating activities
Earnings (loss) from operations (161,537)$ 44,982$ 158,217$ 41,662$ Adjustments to reconcile earnings (loss) to
net cash flows from operating activities:Depreciation 1,510,006 57,361 - 1,567,367 Changes in assets and liabilities
Accounts receivable, net - - - - Inventory (4,105) - - (4,105) Accounts payable (203,762) 64,180 (36,276) (175,858) Other accrued payables 5,874 - - 5,874 Compensated absences 7,115 - - 7,115 Accrued insurance loss payable - - - -
Net cash flows from operating activities 1,153,591$ 166,523$ 121,941$ 1,442,055$
Schedule of noncash financing and investing activities:
Purchase of vehicles on account 619,000$ -$ -$ 619,000$
94

STATISTICAL SECTION The Statistical Section of the Comprehensive Annual Financial Report for the City of West Jordan presents detailed information as a context for understanding what the information in the financial statements, note disclosers, and required supplementary information says about the City’s overall financial health. Contents Page Financial Trends These schedules provide information to help the reader understand how the City’s financial performance and economic condition have changed over time.
96-108
Revenue Capacity These schedules present information to help the reader assess the City’s most significant local revenue sources: sales taxes and property taxes
109-115
Debt Capacity These schedules provide information to help the reader assess the affordability of the City’s current levels of outstanding debt and the City’s ability to issue additional debt in the future.
116-126
Demographic and Economic Information These schedules present demographic and economic indicators to help the reader understand the environment within which the City’s financial activities take place
127-128
Operating Information These schedules contain service and infrastructure data to help the reader understand how the information in the City’s financial report relates to the services the City provides and the activities it performs.
129-133
Note: Unless otherwise noted, the information in these schedules is derived from the comprehensive annual financial reports for the relevant year.
95

Schedule 1CITY OF WEST JORDANNet Position by ComponentLast Ten Fiscal Years(accrual basis of accounting)
Fiscal Year2006 2007 2008 2009 2010
Governmental activitiesInvested in capital assets, net of related debt 238,532,908$ 252,848,661$ 254,489,657$ 257,846,259$ 281,944,748$ Restricted 19,323,489 11,723,148 13,780,323 17,459,735 16,705,648
Unrestricted 32,970,642 21,389,034 23,859,937 21,460,099 15,392,021
Total governmental activities net assets 290,827,039 285,960,843 292,129,917 296,766,093 314,042,417
Business-type activitiesInvested in capital assets, net of related debt 88,067,808 95,458,024 99,404,483 102,008,613 107,511,850 Restricted 12,271,910 15,125,623 14,371,221 5,602,588 4,474,702 Unrestricted 23,441,691 18,472,701 17,783,716 26,631,846 26,375,873
Total business-type activities net assets 123,781,409 129,056,348 131,559,420 134,243,047 138,362,425
Primary governmentInvested in capital assets, net of related debt 326,600,716 348,306,685 353,894,140 359,854,872 389,456,598 Restricted 31,595,399 26,848,771 28,151,544 23,062,323 21,180,350 Unrestricted 56,412,333 39,861,735 41,643,653 48,091,945 41,767,894
Total primary government net assets 414,608,448$ 415,017,191$ 423,689,337$ 431,009,140$ 452,404,842$
96
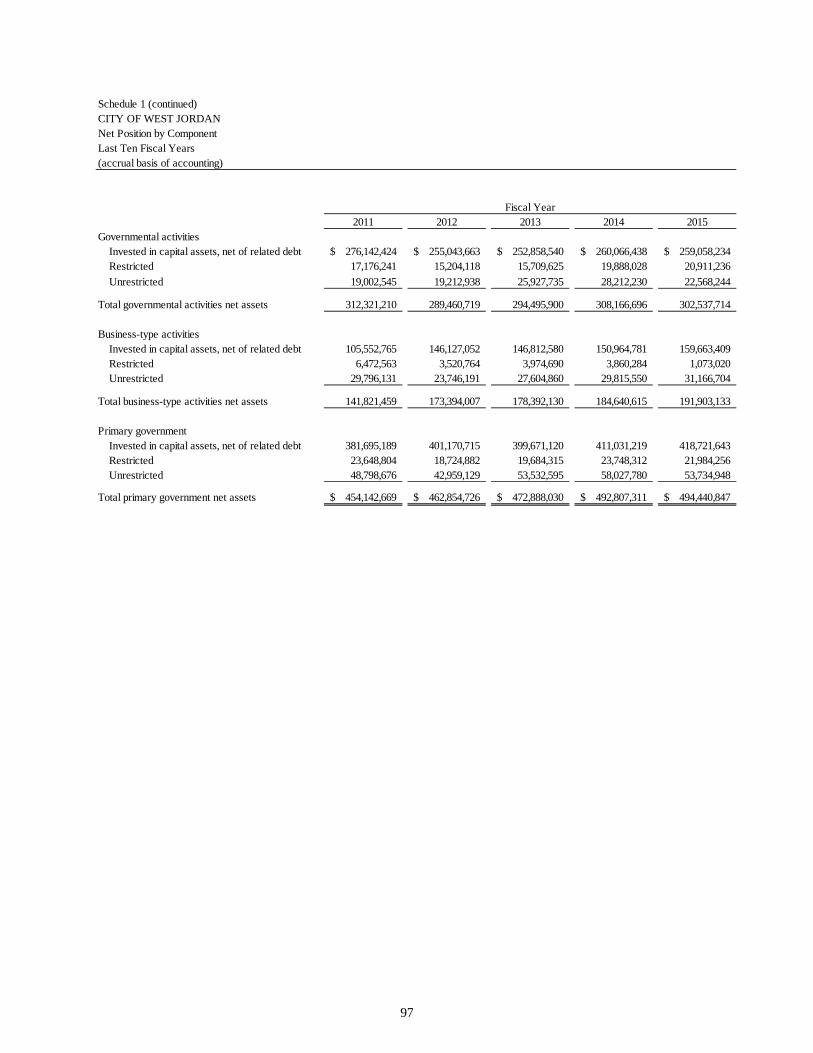
Schedule 1 (continued)CITY OF WEST JORDANNet Position by ComponentLast Ten Fiscal Years(accrual basis of accounting)
Fiscal Year2011 2012 2013 2014 2015
Governmental activitiesInvested in capital assets, net of related debt 276,142,424$ 255,043,663$ 252,858,540$ 260,066,438$ 259,058,234$ Restricted 17,176,241 15,204,118 15,709,625 19,888,028 20,911,236
Unrestricted 19,002,545 19,212,938 25,927,735 28,212,230 22,568,244
Total governmental activities net assets 312,321,210 289,460,719 294,495,900 308,166,696 302,537,714
Business-type activitiesInvested in capital assets, net of related debt 105,552,765 146,127,052 146,812,580 150,964,781 159,663,409 Restricted 6,472,563 3,520,764 3,974,690 3,860,284 1,073,020 Unrestricted 29,796,131 23,746,191 27,604,860 29,815,550 31,166,704
Total business-type activities net assets 141,821,459 173,394,007 178,392,130 184,640,615 191,903,133
Primary governmentInvested in capital assets, net of related debt 381,695,189 401,170,715 399,671,120 411,031,219 418,721,643 Restricted 23,648,804 18,724,882 19,684,315 23,748,312 21,984,256 Unrestricted 48,798,676 42,959,129 53,532,595 58,027,780 53,734,948
Total primary government net assets 454,142,669$ 462,854,726$ 472,888,030$ 492,807,311$ 494,440,847$
97
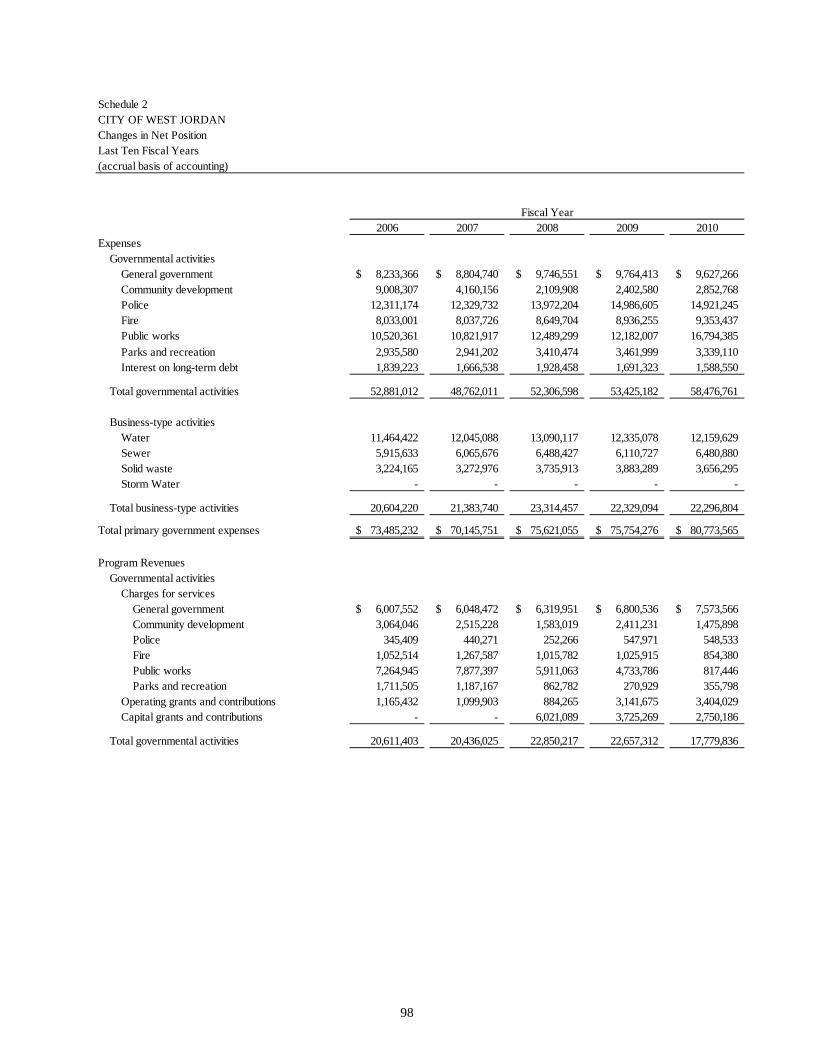
Schedule 2CITY OF WEST JORDANChanges in Net PositionLast Ten Fiscal Years(accrual basis of accounting)
Fiscal Year2006 2007 2008 2009 2010
ExpensesGovernmental activities
General government 8,233,366$ 8,804,740$ 9,746,551$ 9,764,413$ 9,627,266$ Community development 9,008,307 4,160,156 2,109,908 2,402,580 2,852,768 Police 12,311,174 12,329,732 13,972,204 14,986,605 14,921,245 Fire 8,033,001 8,037,726 8,649,704 8,936,255 9,353,437 Public works 10,520,361 10,821,917 12,489,299 12,182,007 16,794,385
Parks and recreation 2,935,580 2,941,202 3,410,474 3,461,999 3,339,110 Interest on long-term debt 1,839,223 1,666,538 1,928,458 1,691,323 1,588,550
Total governmental activities 52,881,012 48,762,011 52,306,598 53,425,182 58,476,761
Business-type activitiesWater 11,464,422 12,045,088 13,090,117 12,335,078 12,159,629 Sewer 5,915,633 6,065,676 6,488,427 6,110,727 6,480,880 Solid waste 3,224,165 3,272,976 3,735,913 3,883,289 3,656,295 Storm Water - - - - -
Total business-type activities 20,604,220 21,383,740 23,314,457 22,329,094 22,296,804
Total primary government expenses 73,485,232$ 70,145,751$ 75,621,055$ 75,754,276$ 80,773,565$
Program RevenuesGovernmental activities
Charges for servicesGeneral government 6,007,552$ 6,048,472$ 6,319,951$ 6,800,536$ 7,573,566$ Community development 3,064,046 2,515,228 1,583,019 2,411,231 1,475,898 Police 345,409 440,271 252,266 547,971 548,533 Fire 1,052,514 1,267,587 1,015,782 1,025,915 854,380 Public works 7,264,945 7,877,397 5,911,063 4,733,786 817,446 Parks and recreation 1,711,505 1,187,167 862,782 270,929 355,798
Operating grants and contributions 1,165,432 1,099,903 884,265 3,141,675 3,404,029 Capital grants and contributions - - 6,021,089 3,725,269 2,750,186
Total governmental activities 20,611,403 20,436,025 22,850,217 22,657,312 17,779,836
98
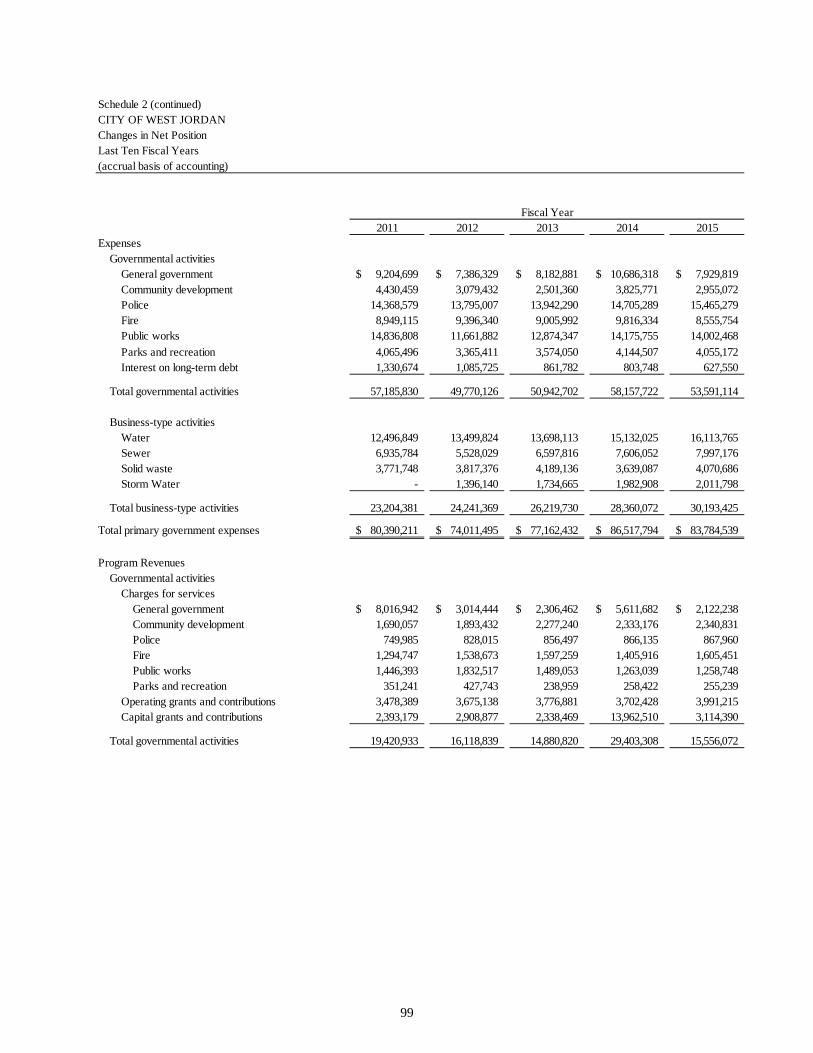
Schedule 2 (continued)CITY OF WEST JORDANChanges in Net PositionLast Ten Fiscal Years(accrual basis of accounting)
Fiscal Year2011 2012 2013 2014 2015
ExpensesGovernmental activities
General government 9,204,699$ 7,386,329$ 8,182,881$ 10,686,318$ 7,929,819$ Community development 4,430,459 3,079,432 2,501,360 3,825,771 2,955,072 Police 14,368,579 13,795,007 13,942,290 14,705,289 15,465,279 Fire 8,949,115 9,396,340 9,005,992 9,816,334 8,555,754 Public works 14,836,808 11,661,882 12,874,347 14,175,755 14,002,468
Parks and recreation 4,065,496 3,365,411 3,574,050 4,144,507 4,055,172 Interest on long-term debt 1,330,674 1,085,725 861,782 803,748 627,550
Total governmental activities 57,185,830 49,770,126 50,942,702 58,157,722 53,591,114
Business-type activitiesWater 12,496,849 13,499,824 13,698,113 15,132,025 16,113,765 Sewer 6,935,784 5,528,029 6,597,816 7,606,052 7,997,176 Solid waste 3,771,748 3,817,376 4,189,136 3,639,087 4,070,686 Storm Water - 1,396,140 1,734,665 1,982,908 2,011,798
Total business-type activities 23,204,381 24,241,369 26,219,730 28,360,072 30,193,425
Total primary government expenses 80,390,211$ 74,011,495$ 77,162,432$ 86,517,794$ 83,784,539$
Program RevenuesGovernmental activities
Charges for servicesGeneral government 8,016,942$ 3,014,444$ 2,306,462$ 5,611,682$ 2,122,238$ Community development 1,690,057 1,893,432 2,277,240 2,333,176 2,340,831 Police 749,985 828,015 856,497 866,135 867,960 Fire 1,294,747 1,538,673 1,597,259 1,405,916 1,605,451 Public works 1,446,393 1,832,517 1,489,053 1,263,039 1,258,748 Parks and recreation 351,241 427,743 238,959 258,422 255,239
Operating grants and contributions 3,478,389 3,675,138 3,776,881 3,702,428 3,991,215 Capital grants and contributions 2,393,179 2,908,877 2,338,469 13,962,510 3,114,390
Total governmental activities 19,420,933 16,118,839 14,880,820 29,403,308 15,556,072
99
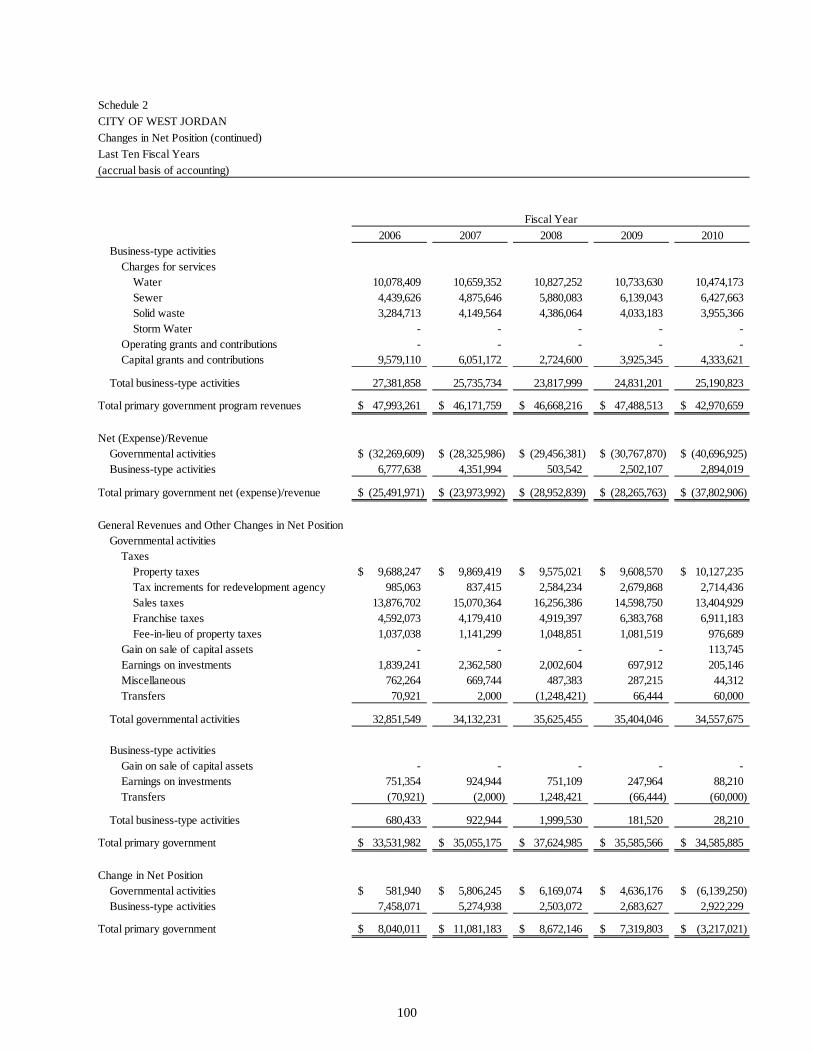
Schedule 2
CITY OF WEST JORDAN
Changes in Net Position (continued)
Last Ten Fiscal Years
(accrual basis of accounting)
Fiscal Year
2006 2007 2008 2009 2010Business-type activities
Charges for servicesWater 10,078,409 10,659,352 10,827,252 10,733,630 10,474,173 Sewer 4,439,626 4,875,646 5,880,083 6,139,043 6,427,663 Solid waste 3,284,713 4,149,564 4,386,064 4,033,183 3,955,366 Storm Water - - - - -
Operating grants and contributions - - - - - Capital grants and contributions 9,579,110 6,051,172 2,724,600 3,925,345 4,333,621
Total business-type activities 27,381,858 25,735,734 23,817,999 24,831,201 25,190,823
Total primary government program revenues 47,993,261$ 46,171,759$ 46,668,216$ 47,488,513$ 42,970,659$
Net (Expense)/RevenueGovernmental activities (32,269,609)$ (28,325,986)$ (29,456,381)$ (30,767,870)$ (40,696,925)$ Business-type activities 6,777,638 4,351,994 503,542 2,502,107 2,894,019
Total primary government net (expense)/revenue (25,491,971)$ (23,973,992)$ (28,952,839)$ (28,265,763)$ (37,802,906)$
General Revenues and Other Changes in Net PositionGovernmental activities
TaxesProperty taxes 9,688,247$ 9,869,419$ 9,575,021$ 9,608,570$ 10,127,235$ Tax increments for redevelopment agency 985,063 837,415 2,584,234 2,679,868 2,714,436 Sales taxes 13,876,702 15,070,364 16,256,386 14,598,750 13,404,929 Franchise taxes 4,592,073 4,179,410 4,919,397 6,383,768 6,911,183 Fee-in-lieu of property taxes 1,037,038 1,141,299 1,048,851 1,081,519 976,689
Gain on sale of capital assets - - - - 113,745 Earnings on investments 1,839,241 2,362,580 2,002,604 697,912 205,146 Miscellaneous 762,264 669,744 487,383 287,215 44,312 Transfers 70,921 2,000 (1,248,421) 66,444 60,000
Total governmental activities 32,851,549 34,132,231 35,625,455 35,404,046 34,557,675
Business-type activitiesGain on sale of capital assets - - - - - Earnings on investments 751,354 924,944 751,109 247,964 88,210 Transfers (70,921) (2,000) 1,248,421 (66,444) (60,000)
Total business-type activities 680,433 922,944 1,999,530 181,520 28,210
Total primary government 33,531,982$ 35,055,175$ 37,624,985$ 35,585,566$ 34,585,885$
Change in Net PositionGovernmental activities 581,940$ 5,806,245$ 6,169,074$ 4,636,176$ (6,139,250)$ Business-type activities 7,458,071 5,274,938 2,503,072 2,683,627 2,922,229
Total primary government 8,040,011$ 11,081,183$ 8,672,146$ 7,319,803$ (3,217,021)$
100

Schedule 2 (continued)
CITY OF WEST JORDAN
Changes in Net Position (continued)
Last Ten Fiscal Years
(accrual basis of accounting)
Fiscal Year
2011 2012 2013 2014 2015Business-type activities
Charges for servicesWater 12,885,254 14,071,562 15,117,355 16,480,954 15,777,748 Sewer 7,548,753 7,790,530 7,642,599 8,350,251 8,485,034 Solid waste 4,089,160 4,149,462 4,242,337 4,032,845 4,140,013 Storm Water - 806,368 1,540,476 1,869,019 1,777,496
Operating grants and contributions - - - - 3,185,887 Capital grants and contributions 2,141,867 3,867,206 4,631,560 3,835,397 2,617,774
Total business-type activities 26,665,034 30,685,128 33,174,327 34,568,466 35,983,952
Total primary government program revenues 46,085,967$ 46,803,967$ 48,055,147$ 63,971,774$ 51,540,024$
Net (Expense)/RevenueGovernmental activities (37,764,897)$ (33,651,287)$ (36,061,882)$ (28,754,414)$ (38,035,042)$ Business-type activities 3,460,653 6,443,759 6,954,597 6,208,394 5,790,527
Total primary government net (expense)/revenue (34,304,244)$ (27,207,528)$ (29,107,285)$ (22,546,020)$ (32,244,515)$
General Revenues and Other Changes in Net PositionGovernmental activities
TaxesProperty taxes 10,494,095$ 9,811,737$ 12,949,847$ 12,668,980$ 12,378,578$ Tax increments for redevelopment agency 2,651,201 2,282,629 2,794,439 3,398,395 3,824,806 Sales taxes 13,559,906 14,467,761 15,161,672 15,976,144 16,845,871 Franchise taxes 7,129,083 7,409,499 7,964,188 8,112,830 7,871,219 Fee-in-lieu of property taxes 992,661 814,006 1,143,559 999,394 1,010,266
Gain on sale of capital assets 780,903 188,175 102,560 28,548 723,340 Earnings on investments 157,793 179,373 195,920 213,766 198,997 Miscellaneous 909,826 261,443 247,671 947,153 552,430 Transfers 63,458 (21,118,076) 925,000 80,000 (1,950,000)
Total governmental activities 36,738,926 14,296,547 41,484,856 42,425,210 41,455,507
Business-type activitiesGain on sale of capital assets - 389,957 189,161 - - Earnings on investments 61,839 115,005 135,529 120,091 112,917 Transfers (63,458) 21,118,076 (925,000) (80,000) 1,950,000
Total business-type activities (1,619) 21,623,038 (600,310) 40,091 2,062,917
Total primary government 36,737,307$ 35,919,585$ 40,884,546$ 42,465,301$ 43,518,424$
Change in Net PositionGovernmental activities (1,025,971)$ (19,354,740)$ 5,422,974$ 13,670,796$ 3,420,465$ Business-type activities 3,459,034 28,066,797 6,354,287 6,248,485 7,853,444
Total primary government 2,433,063$ 8,712,057$ 11,777,261$ 19,919,281$ 11,273,909$
101
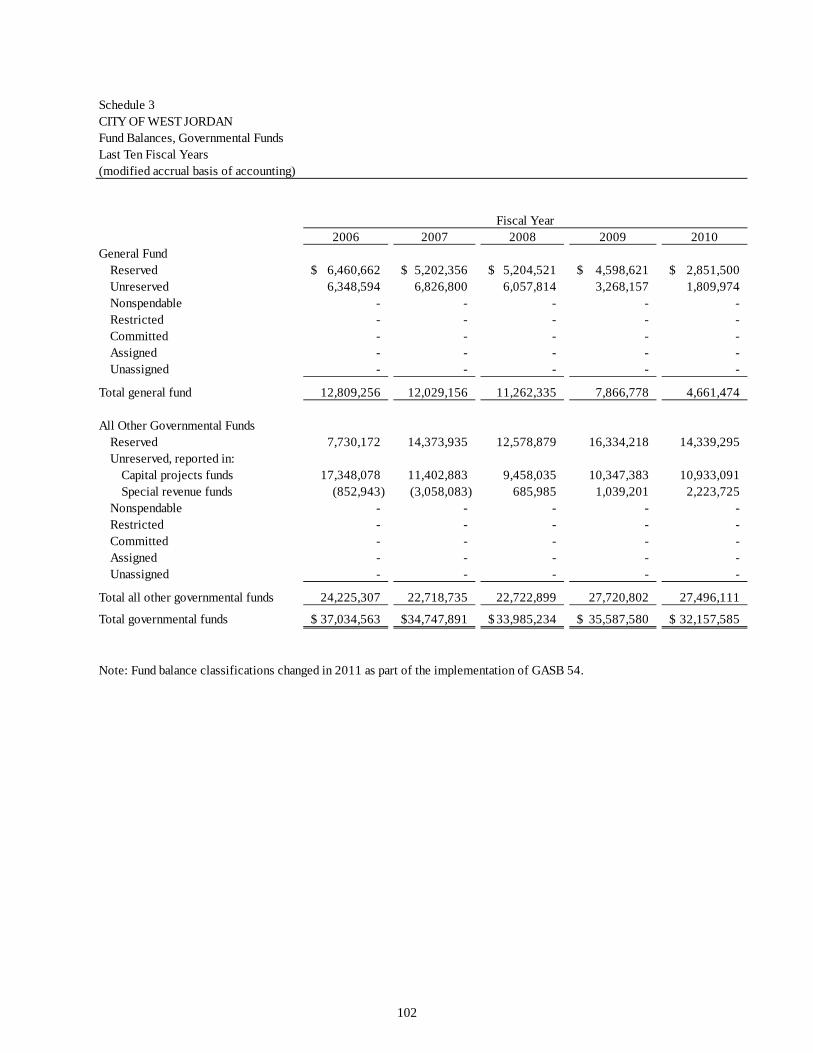
Schedule 3CITY OF WEST JORDANFund Balances, Governmental FundsLast Ten Fiscal Years(modified accrual basis of accounting)
Fiscal Year2006 2007 2008 2009 2010
General FundReserved 6,460,662$ 5,202,356$ 5,204,521$ 4,598,621$ 2,851,500$ Unreserved 6,348,594 6,826,800 6,057,814 3,268,157 1,809,974 Nonspendable - - - - - Restricted - - - - - Committed - - - - - Assigned - - - - - Unassigned - - - - -
Total general fund 12,809,256 12,029,156 11,262,335 7,866,778 4,661,474
All Other Governmental FundsReserved 7,730,172 14,373,935 12,578,879 16,334,218 14,339,295 Unreserved, reported in:
Capital projects funds 17,348,078 11,402,883 9,458,035 10,347,383 10,933,091 Special revenue funds (852,943) (3,058,083) 685,985 1,039,201 2,223,725
Nonspendable - - - - - Restricted - - - - - Committed - - - - - Assigned - - - - - Unassigned - - - - -
Total all other governmental funds 24,225,307 22,718,735 22,722,899 27,720,802 27,496,111
Total governmental funds 37,034,563$ 34,747,891$ 33,985,234$ 35,587,580$ 32,157,585$
Note: Fund balance classifications changed in 2011 as part of the implementation of GASB 54.
102

Schedule 3 (continued)CITY OF WEST JORDANFund Balances, Governmental FundsLast Ten Fiscal Years(modified accrual basis of accounting)
Fiscal Year2011 2012 2013 2014 2015
General FundReserved -$ -$ -$ -$ -$ Unreserved - - - - - Nonspendable 282,415 6,313 90,343 160,717 163,491 Restricted 4,411,953 6,002,475 6,307,594 5,794,095 5,232,878 Committed - - - - - Assigned 18,931 620,108 597,766 568,305 769,975 Unassigned 5,015,139 8,262,619 13,042,225 12,513,823 11,362,288
Total general fund 9,728,438 14,891,515 20,037,928 19,036,940 17,528,632
All Other Governmental FundsReserved - - - - - Unreserved, reported in:
Capital projects funds - - - - - Special revenue funds - - - - -
Nonspendable 48,070 80,180 - - - Restricted 12,461,286 9,201,643 9,402,031 14,093,933 15,678,358 Committed 1,001,680 1,849,200 500,000 500,000 - Assigned 10,564,353 7,184,366 10,896,667 11,501,153 13,113,936 Unassigned - - (133,766) (60,012) 855,951
Total all other governmental funds 24,075,389 18,315,389 20,664,932 26,035,074 29,648,245
Total governmental funds 33,803,827$ 33,206,904$ 40,702,860$ 45,072,014$ 47,176,877$
103

Schedule 4CITY OF WEST JORDANChanges in Fund Balances, Governmental FundsLast Ten Fiscal Years(modified accrual basis of accounting)
Fiscal Year2006 2007 2008 2009 2010
RevenuesTaxes 29,571,835$ 31,097,907$ 34,383,889$ 34,352,462$ 34,134,473$ Licenses and permits 2,735,206 2,311,943 1,695,805 1,673,568 1,673,932 Intergovernmental 4,490,199 4,124,606 4,352,402 8,472,052 4,198,469 Charges for services 1,949,034 2,794,074 2,185,107 2,751,936 2,993,569 Fines and forfeitures 1,883,114 2,056,503 1,959,221 1,799,419 1,663,079 Interfund charges 3,846,938 3,746,899 3,968,247 4,041,904 4,608,585 Impact fees 5,683,401 4,907,779 2,752,946 3,326,905 2,513,126 Interest 1,531,230 2,021,415 1,653,469 468,217 220,715 Miscellaneous 762,264 720,675 489,512 626,272 240,797
Total revenues 52,453,221 53,781,801 53,440,598 57,512,735 52,246,745
ExpendituresGeneral government 7,942,655 8,209,678 9,444,899 9,303,529 8,665,800 Community development 9,943,412 4,255,681 2,889,794 2,366,317 2,813,022 Police 12,006,929 12,524,025 13,837,413 13,968,643 13,878,366 Fire 7,658,183 7,952,181 8,385,349 8,498,186 8,951,999 Public works 4,959,686 5,616,994 6,210,680 6,084,022 5,514,854 Parks and recreation 2,082,308 2,157,249 2,471,939 2,276,192 2,162,521 Debt Service
Principal payments 2,815,000 2,983,226 3,963,380 4,035,472 4,214,011 Interest and fiscal charges 1,850,473 1,674,021 1,897,585 1,703,130 1,542,530 Bond issuance costs 214,576 180,920 45,686 - -
Capital outlay 7,613,265 9,167,932 8,731,613 7,342,494 9,057,433
Total expenditures 57,086,487 54,721,907 57,878,338 55,577,985 56,800,536
Excess (deficiency) of revenuesover (under) expenditures (4,633,266) (940,106) (4,437,740) 1,934,750 (4,553,791)
104
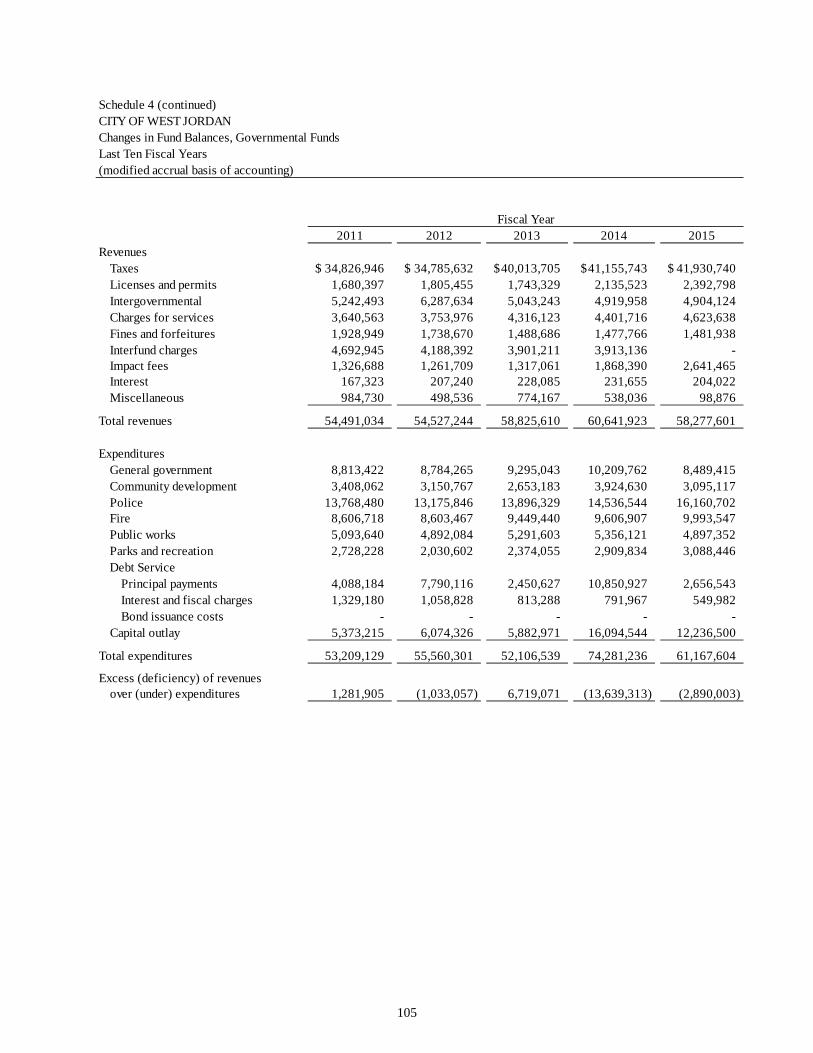
Schedule 4 (continued)CITY OF WEST JORDANChanges in Fund Balances, Governmental FundsLast Ten Fiscal Years(modified accrual basis of accounting)
Fiscal Year2011 2012 2013 2014 2015
RevenuesTaxes 34,826,946$ 34,785,632$ 40,013,705$ 41,155,743$ 41,930,740$ Licenses and permits 1,680,397 1,805,455 1,743,329 2,135,523 2,392,798 Intergovernmental 5,242,493 6,287,634 5,043,243 4,919,958 4,904,124 Charges for services 3,640,563 3,753,976 4,316,123 4,401,716 4,623,638 Fines and forfeitures 1,928,949 1,738,670 1,488,686 1,477,766 1,481,938 Interfund charges 4,692,945 4,188,392 3,901,211 3,913,136 - Impact fees 1,326,688 1,261,709 1,317,061 1,868,390 2,641,465 Interest 167,323 207,240 228,085 231,655 204,022 Miscellaneous 984,730 498,536 774,167 538,036 98,876
Total revenues 54,491,034 54,527,244 58,825,610 60,641,923 58,277,601
ExpendituresGeneral government 8,813,422 8,784,265 9,295,043 10,209,762 8,489,415 Community development 3,408,062 3,150,767 2,653,183 3,924,630 3,095,117 Police 13,768,480 13,175,846 13,896,329 14,536,544 16,160,702 Fire 8,606,718 8,603,467 9,449,440 9,606,907 9,993,547 Public works 5,093,640 4,892,084 5,291,603 5,356,121 4,897,352 Parks and recreation 2,728,228 2,030,602 2,374,055 2,909,834 3,088,446 Debt Service
Principal payments 4,088,184 7,790,116 2,450,627 10,850,927 2,656,543 Interest and fiscal charges 1,329,180 1,058,828 813,288 791,967 549,982 Bond issuance costs - - - - -
Capital outlay 5,373,215 6,074,326 5,882,971 16,094,544 12,236,500
Total expenditures 53,209,129 55,560,301 52,106,539 74,281,236 61,167,604
Excess (deficiency) of revenuesover (under) expenditures 1,281,905 (1,033,057) 6,719,071 (13,639,313) (2,890,003)
105

Schedule 4CITY OF WEST JORDANChanges in Fund Balances, Governmental Funds (continued)Last Ten Fiscal Years(modified accrual basis of accounting)
Fiscal Year2006 2007 2008 2009 2010
Other Financing Sources (Uses)Issuance of bonds 8,515,000 7,535,000 4,497,000 - - Discount on bonds issued - - (26,982) - - Payment to bond refunding escrow agen - (7,531,718) - - - Interim warrants - (495,000) - - - Issuance of capital lease - - - - 220,000 Road project proceeds - - - - - Developer contributions - - - - - Sale of capital assets - - 2,936 8,645 234,834 Transfers in 8,023,776 7,789,531 7,036,428 6,912,152 8,615,346 Transfers out (7,973,776) (8,644,379) (7,834,299) (7,253,201) (8,784,092)
Total other financing sources (uses) 8,565,000 (1,346,566) 3,675,083 (332,404) 286,088
Net change in fund balances 3,931,734$ (2,286,672)$ (762,657)$ 1,602,346$ (4,267,703)$
Debt service as a percentageof noncapital expenditures 10.5% 10.5% 12.0% 11.8% 10.9%
Note: Noncapital expenditures are total expenditures less capital outlay and expenditures for capitalized assets included within the functional expenditure categories.
106

Schedule 4 (continued)CITY OF WEST JORDANChanges in Fund Balances, Governmental Funds (continued)Last Ten Fiscal Years(modified accrual basis of accounting)
Fiscal Year2011 2012 2013 2014 2015
Other Financing Sources (Uses)Issuance of bonds - 3,290,000 - 10,595,000 6,530,000 Discount on bonds issued - - - - - Payment to bond refunding escrow agen - - - - - Interim warrants - - - - - Issuance of capital lease - - - - 135,009 Road project proceeds - - - 9,900,000 - Developer contributions - - - 683,467 - Sale of capital assets 747,390 - - - 164,500 Transfers in 4,783,521 5,191,299 6,206,245 11,684,277 11,587,254 Transfers out (5,069,776) (4,539,413) (5,429,359) (14,854,277) (13,587,254)
Total other financing sources (uses) 461,135 3,941,886 776,886 18,008,467 4,829,509
Net change in fund balances 1,743,040$ 2,908,829$ 7,495,957$ 4,369,154$ 1,939,506$
Debt service as a percentageof noncapital expenditures 10.8% 17.2% 6.6% 19.4% 6.2%
107
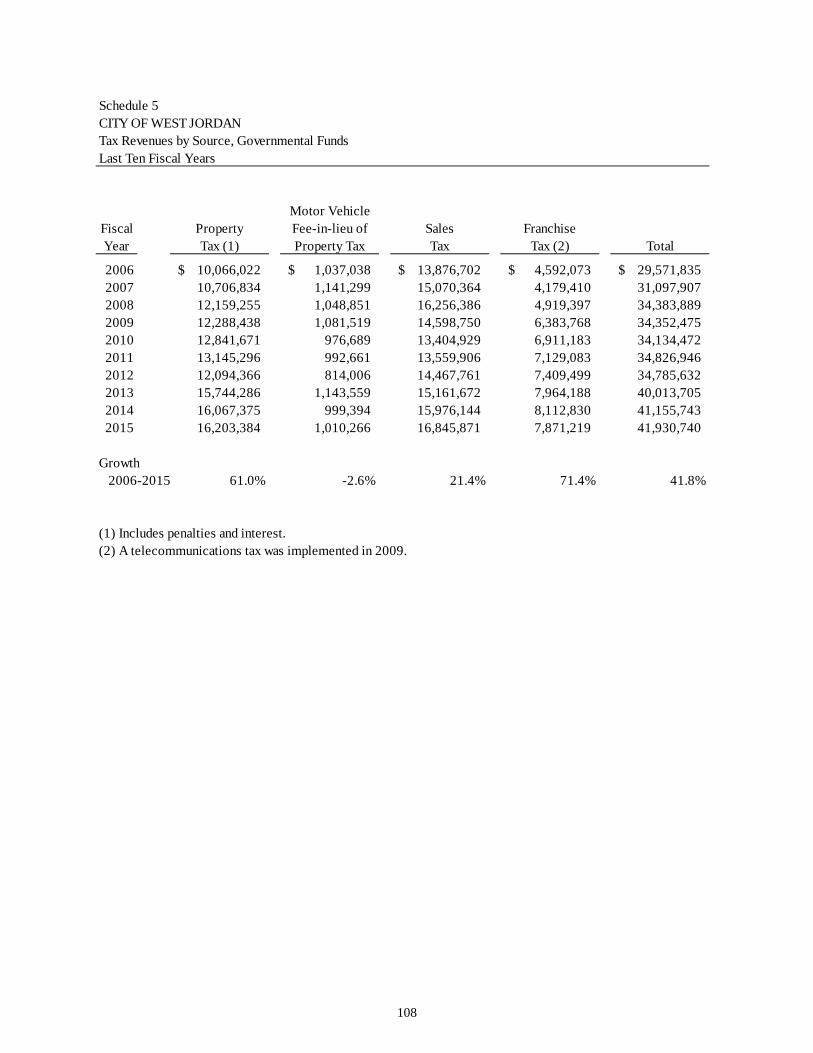
Schedule 5CITY OF WEST JORDANTax Revenues by Source, Governmental FundsLast Ten Fiscal Years
Motor VehicleFiscal Property Fee-in-lieu of Sales FranchiseYear Tax (1) Property Tax Tax Tax (2) Total
2006 10,066,022$ 1,037,038$ 13,876,702$ 4,592,073$ 29,571,835$ 2007 10,706,834 1,141,299 15,070,364 4,179,410 31,097,907 2008 12,159,255 1,048,851 16,256,386 4,919,397 34,383,889 2009 12,288,438 1,081,519 14,598,750 6,383,768 34,352,475 2010 12,841,671 976,689 13,404,929 6,911,183 34,134,472 2011 13,145,296 992,661 13,559,906 7,129,083 34,826,946 2012 12,094,366 814,006 14,467,761 7,409,499 34,785,632 2013 15,744,286 1,143,559 15,161,672 7,964,188 40,013,705 2014 16,067,375 999,394 15,976,144 8,112,830 41,155,743 2015 16,203,384 1,010,266 16,845,871 7,871,219 41,930,740
Growth 2006-2015 61.0% -2.6% 21.4% 71.4% 41.8%
(1) Includes penalties and interest.(2) A telecommunications tax was implemented in 2009.
2 – Chang
108
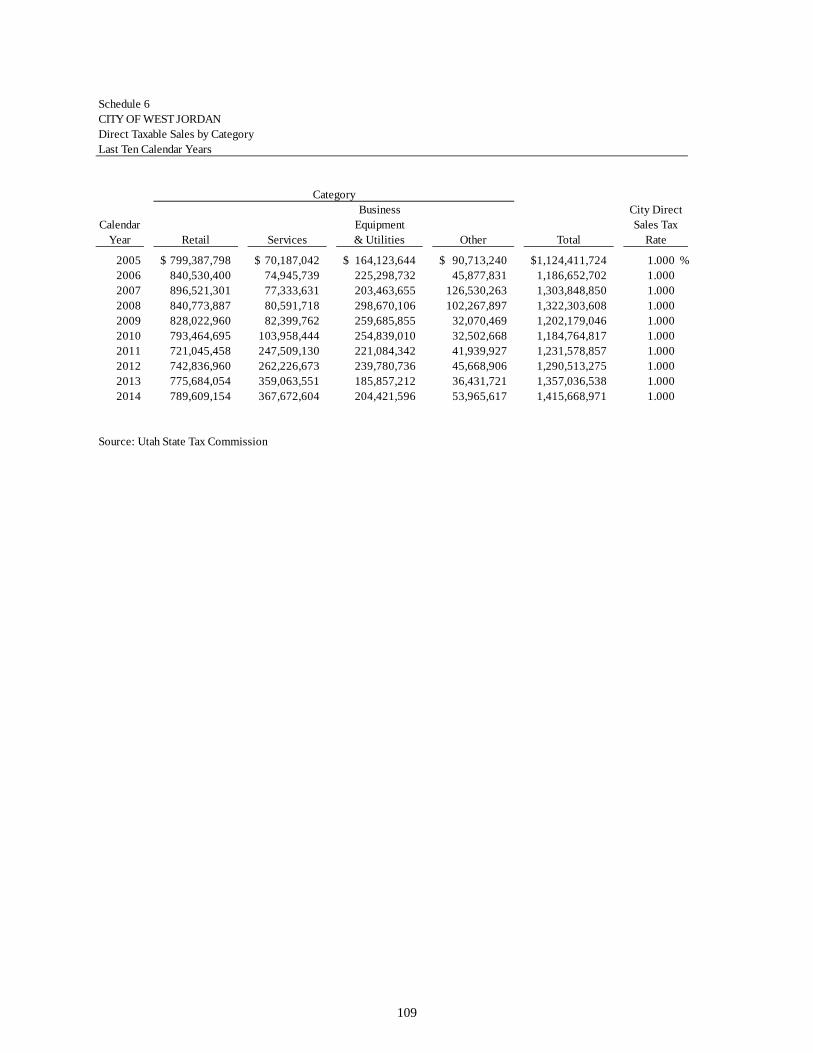
Schedule 6CITY OF WEST JORDANDirect Taxable Sales by CategoryLast Ten Calendar Years
CategoryBusiness City Direct
Calendar Equipment Sales TaxYear Retail Services & Utilities Other Total Rate
2005 799,387,798$ 70,187,042$ 164,123,644$ 90,713,240$ 1,124,411,724$ 1.000 %2006 840,530,400 74,945,739 225,298,732 45,877,831 1,186,652,702 1.0002007 896,521,301 77,333,631 203,463,655 126,530,263 1,303,848,850 1.0002008 840,773,887 80,591,718 298,670,106 102,267,897 1,322,303,608 1.0002009 828,022,960 82,399,762 259,685,855 32,070,469 1,202,179,046 1.0002010 793,464,695 103,958,444 254,839,010 32,502,668 1,184,764,817 1.0002011 721,045,458 247,509,130 221,084,342 41,939,927 1,231,578,857 1.0002012 742,836,960 262,226,673 239,780,736 45,668,906 1,290,513,275 1.0002013 775,684,054 359,063,551 185,857,212 36,431,721 1,357,036,538 1.0002014 789,609,154 367,672,604 204,421,596 53,965,617 1,415,668,971 1.000
Source: Utah State Tax Commission
Net
109
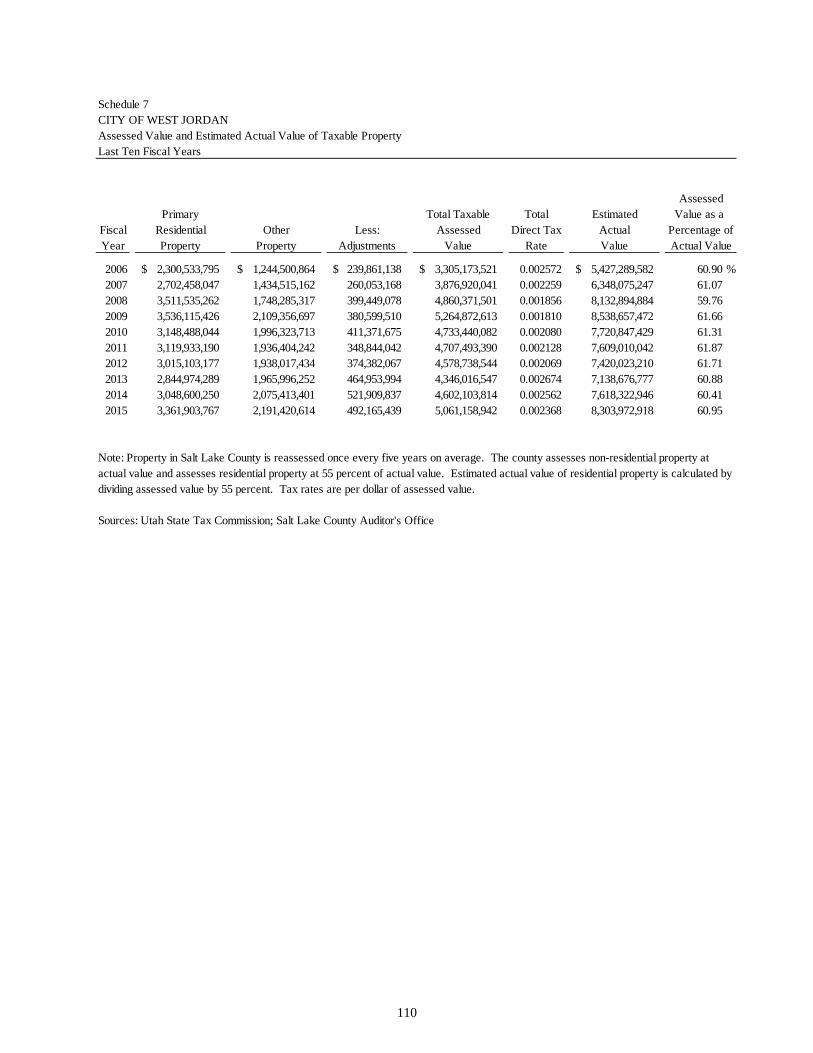
Schedule 7CITY OF WEST JORDANAssessed Value and Estimated Actual Value of Taxable PropertyLast Ten Fiscal Years
AssessedPrimary Total Taxable Total Estimated Value as a
Fiscal Residential Other Less: Assessed Direct Tax Actual Percentage ofYear Property Property Adjustments Value Rate Value Actual Value
2006 2,300,533,795$ 1,244,500,864$ 239,861,138$ 3,305,173,521$ 0.002572 5,427,289,582$ 60.90 %2007 2,702,458,047 1,434,515,162 260,053,168 3,876,920,041 0.002259 6,348,075,247 61.072008 3,511,535,262 1,748,285,317 399,449,078 4,860,371,501 0.001856 8,132,894,884 59.762009 3,536,115,426 2,109,356,697 380,599,510 5,264,872,613 0.001810 8,538,657,472 61.662010 3,148,488,044 1,996,323,713 411,371,675 4,733,440,082 0.002080 7,720,847,429 61.312011 3,119,933,190 1,936,404,242 348,844,042 4,707,493,390 0.002128 7,609,010,042 61.872012 3,015,103,177 1,938,017,434 374,382,067 4,578,738,544 0.002069 7,420,023,210 61.712013 2,844,974,289 1,965,996,252 464,953,994 4,346,016,547 0.002674 7,138,676,777 60.882014 3,048,600,250 2,075,413,401 521,909,837 4,602,103,814 0.002562 7,618,322,946 60.412015 3,361,903,767 2,191,420,614 492,165,439 5,061,158,942 0.002368 8,303,972,918 60.95
Sources: Utah State Tax Commission; Salt Lake County Auditor's Office
Note: Property in Salt Lake County is reassessed once every five years on average. The county assesses non-residential property at actual value and assesses residential property at 55 percent of actual value. Estimated actual value of residential property is calculated by dividing assessed value by 55 percent. Tax rates are per dollar of assessed value.
Assets
110

Schedule 8CITY OF WEST JORDANProperty Tax Levies and CollectionsLast Ten Fiscal Years
Collected within theTotal Fiscal Year of the Levy Collections Total Collections to Date
Fiscal Tax Percentage in Subsequent PercentageYear Levy Amount of Levy Years Amount of Levy
2006 9,085,903$ 8,747,963$ 96.28 238,919$ 8,986,882$ 98.912007 9,394,263 9,049,085 96.33 241,308 9,290,393 98.892008 9,847,784 9,327,041 94.71 286,962 9,614,003 97.632009 10,259,693 9,351,921 91.15 341,370 9,693,291 94.482010 10,564,715 9,722,647 92.03 448,949 10,171,595 96.282011 10,784,995 10,091,756 93.57 271,188 10,362,944 96.092012 10,135,638 9,533,958 94.06 242,444 9,776,402 96.462013 12,678,409 12,321,900 97.19 224,274 12,546,175 98.962014 13,017,951 12,671,927 97.34 142,823 12,814,750 98.442015 13,166,025 12,919,871 98.13 - 12,919,871 98.13
Source: Salt Lake County Treasurer
111

Schedule 9CITY OF WEST JORDANDirect and Overlapping Sales Tax RatesLast Ten Fiscal Years
Overlapping RatesCity Botanical,
Fiscal Direct State of Salt Lake Mass Cultural,Year Rate (1) Utah County Transit Zoo Total
2006 1.000 % 4.750 % 0.250 % 0.500 % 0.100 % 6.600 %2007 1.000 4.750 0.500 0.500 0.100 6.8502008 1.000 4.650 0.500 0.550 0.100 6.8002009 1.000 4.700 0.500 0.550 0.100 6.8502010 1.000 4.700 0.500 0.550 0.100 6.8502011 1.000 4.700 0.500 0.550 0.100 6.8502012 1.000 4.700 0.500 0.550 0.100 6.8502013 1.000 4.700 0.500 0.550 0.100 6.8502014 1.000 4.700 0.500 0.550 0.100 6.8502015 1.000 4.700 0.500 0.550 0.100 6.850
Note: Overlapping rates are those of other governments and agencies that apply to taxable sales within the City.
Source: Utah State Tax Commission
(1) Of the total sales taxes assessed by municipalities within the state, 50 percent is distributed based on point of sale and 50 percent is pooled and distributed based on population.
112
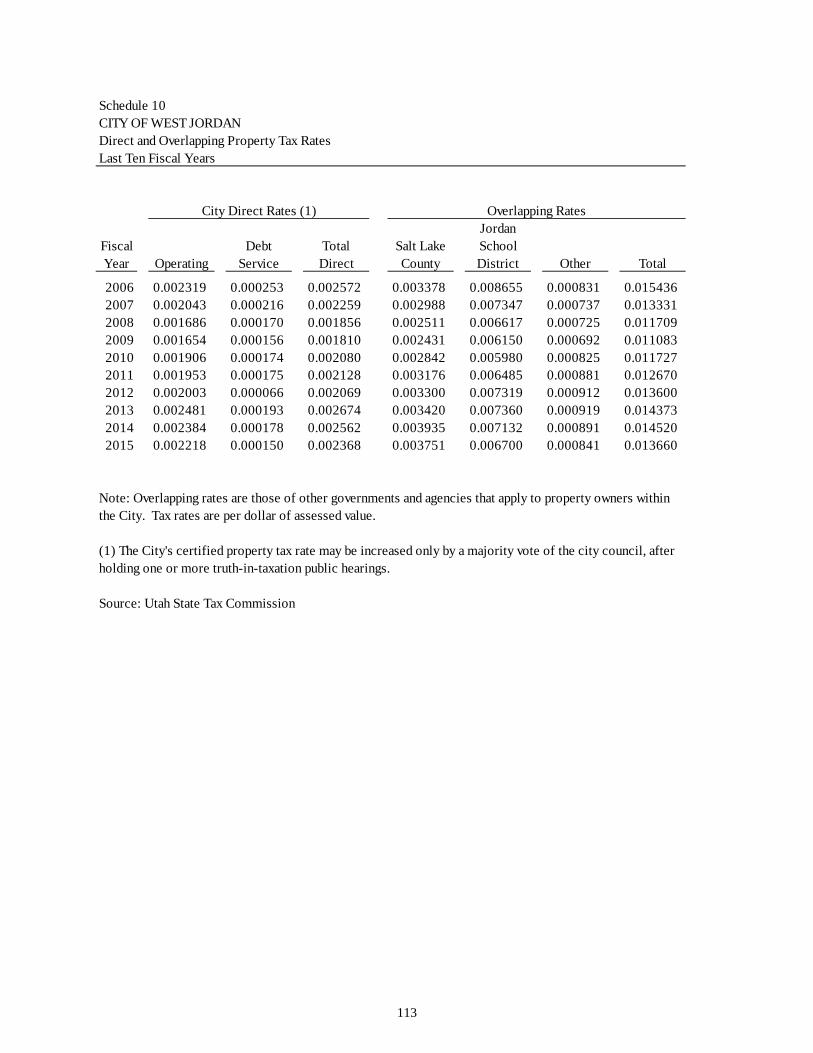
Schedule 10CITY OF WEST JORDANDirect and Overlapping Property Tax RatesLast Ten Fiscal Years
City Direct Rates (1) Overlapping RatesJordan
Fiscal Debt Total Salt Lake SchoolYear Operating Service Direct County District Other Total
2006 0.002319 0.000253 0.002572 0.003378 0.008655 0.000831 0.0154362007 0.002043 0.000216 0.002259 0.002988 0.007347 0.000737 0.0133312008 0.001686 0.000170 0.001856 0.002511 0.006617 0.000725 0.0117092009 0.001654 0.000156 0.001810 0.002431 0.006150 0.000692 0.0110832010 0.001906 0.000174 0.002080 0.002842 0.005980 0.000825 0.0117272011 0.001953 0.000175 0.002128 0.003176 0.006485 0.000881 0.0126702012 0.002003 0.000066 0.002069 0.003300 0.007319 0.000912 0.0136002013 0.002481 0.000193 0.002674 0.003420 0.007360 0.000919 0.0143732014 0.002384 0.000178 0.002562 0.003935 0.007132 0.000891 0.0145202015 0.002218 0.000150 0.002368 0.003751 0.006700 0.000841 0.013660
Source: Utah State Tax Commission
Note: Overlapping rates are those of other governments and agencies that apply to property owners within the City. Tax rates are per dollar of assessed value.
(1) The City's certified property tax rate may be increased only by a majority vote of the city council, after holding one or more truth-in-taxation public hearings.
113

Schedule 11CITY OF WEST JORDANPrincipal Sales Tax PayersCurrent Year and Nine Years Ago
2015 2006Percentage of Percentage of
Sales Total Sales TotalTaxpayer Tax (1) Rank Sales Tax (1) Tax (1) Rank Sales Tax (1)
Smith's N/A 1 N/A N/A 3 N/AWal-Mart Stores N/A 2 N/A N/A 1 N/ARocky Mountain Power N/A 3 N/A N/A 9 N/ASam's Club N/A 4 N/A N/A 2 N/ATarget N/A 5 N/A N/A 8 N/AThe Home Depot N/A 6 N/A N/A 6 N/ABMC West N/A 7 N/A N/A 5 N/ALowe's N/A 8 N/A N/A 7 N/ASysco Foods N/A 9 N/A N/A N/AStock Building Supply N/A 10 N/A N/A 4 N/ASears Roebuck N/A N/A N/A 10 N/A
Total 4,829,047$ 28.67 % 4,320,944$ 31.14 %
N/A = Not applicable
Source: Utah State Tax Commission
(1) Sales tax information is considered proprietary and cannot be shown by individual payer, so the group is shown in the aggregate.
114

Schedule 12CITY OF WEST JORDANPrincipal Property Tax PayersCurrent Year and Nine Years Ago
2015 2006Percentage of Percentage of
Assessed Total Assessed Assessed Total AssessedTaxpayer Valuation Rank Valuation Valuation Rank Valuation
Jordan Landing LLC 120,020,900$ 1 2.37 % 128,591,800$ 1 3.89 %Boeing 46,044,100 2 0.91 - - Jordan Valley Medical Ctr 39,315,500 3 0.78 31,871,600 2 0.96Mtn America Credit Union 37,633,700 4 0.74 21,828,500 4 0.66Oracle America Inc 36,388,800 5 0.72 - - Willowcove Intntl LLC 33,026,125 6 0.65 20,802,155 5 0.63Campus View LLC 21,876,200 7 0.43 - - South Willow LLC 20,310,950 8 0.40 - - Serengeti Springs 19,860,852 9 0.39 - - Broadmoor Village LLC 19,414,945 10 0.38 - - WRI West Jordan LLC - - 23,080,500 3 0.70Wal-Mart Stores - - 17,485,900 6 0.53Dannon Company Inc - - 15,667,400 7 0.47Sysco Foods - - 15,437,400 8 0.47Sears Roebuck - - 15,100,600 9 0.46IS Properties - - 13,340,400 10 0.40
Total 393,892,072$ 7.78 % 303,206,255$ 9.17 %
Source: Salt Lake County Assessor
115
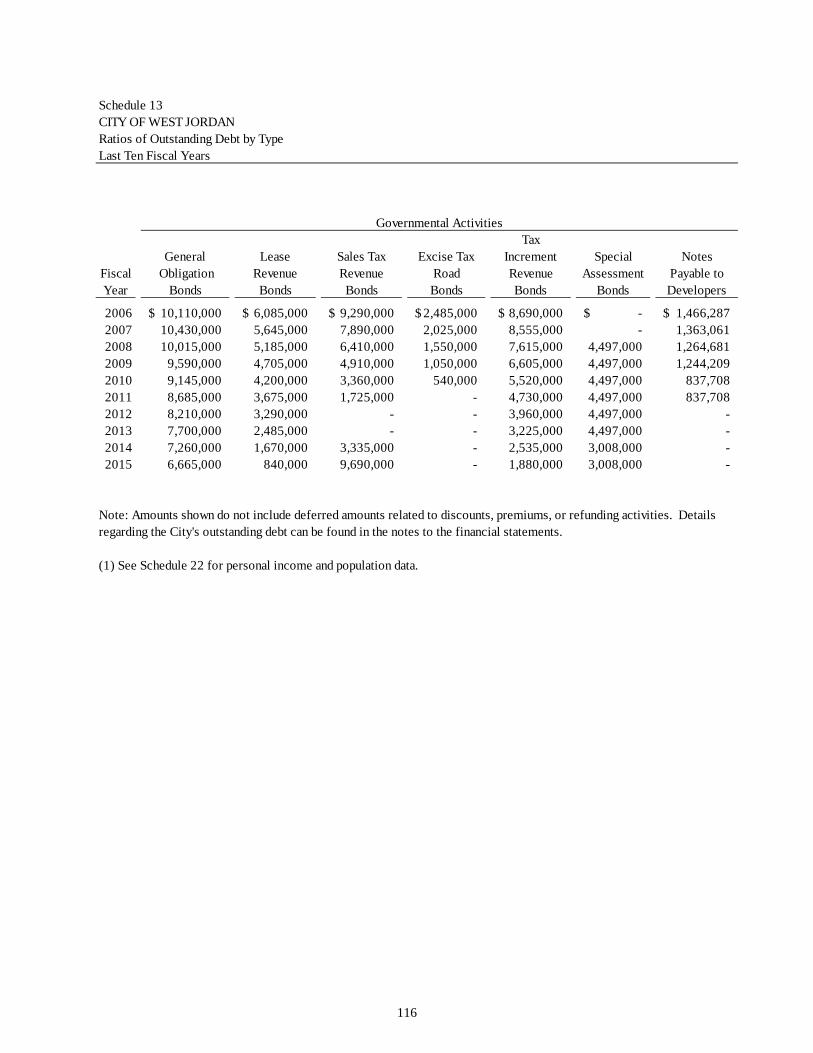
Schedule 13CITY OF WEST JORDANRatios of Outstanding Debt by TypeLast Ten Fiscal Years
Governmental ActivitiesTax
General Lease Sales Tax Excise Tax Increment Special NotesFiscal Obligation Revenue Revenue Road Revenue Assessment Payable toYear Bonds Bonds Bonds Bonds Bonds Bonds Developers
2006 10,110,000$ 6,085,000$ 9,290,000$ 2,485,000$ 8,690,000$ -$ 1,466,287$ 2007 10,430,000 5,645,000 7,890,000 2,025,000 8,555,000 - 1,363,061 2008 10,015,000 5,185,000 6,410,000 1,550,000 7,615,000 4,497,000 1,264,681 2009 9,590,000 4,705,000 4,910,000 1,050,000 6,605,000 4,497,000 1,244,209 2010 9,145,000 4,200,000 3,360,000 540,000 5,520,000 4,497,000 837,708 2011 8,685,000 3,675,000 1,725,000 - 4,730,000 4,497,000 837,708 2012 8,210,000 3,290,000 - - 3,960,000 4,497,000 - 2013 7,700,000 2,485,000 - - 3,225,000 4,497,000 - 2014 7,260,000 1,670,000 3,335,000 - 2,535,000 3,008,000 - 2015 6,665,000 840,000 9,690,000 - 1,880,000 3,008,000 -
(1) See Schedule 22 for personal income and population data.
Note: Amounts shown do not include deferred amounts related to discounts, premiums, or refunding activities. Details regarding the City's outstanding debt can be found in the notes to the financial statements.
116

Schedule 13 (continued)CITY OF WEST JORDANRatios of Outstanding Debt by TypeLast Ten Fiscal Years
Business-TypeGovernmental Activities Activities
Water Total PercentageFiscal Capital Contracts Revenue Capital Primary of Personal PerYear Leases Payable Bonds Leases Government Income (1) Capita (1)
2006 998,890$ 1,715,000$ 7,835,000$ 441,223$ 49,116,400$ 1.51 % 504$ 2007 847,843 1,625,000 5,375,000 294,427 44,050,331 1.18 432 2008 704,204 1,530,000 3,790,000 143,000 42,703,885 1.08 416 2009 574,059 1,430,000 2,465,000 - 37,070,268 0.91 357 2010 644,762 1,325,000 1,040,000 - 31,109,470 0.80 296 2011 778,951 1,215,000 2,530,000 - 28,673,659 0.73 270 2012 1,617,873 1,850,000 1,710,000 - 25,134,873 0.60 235 2013 1,480,783 1,480,000 1,030,000 - 21,897,783 0.50 203 2014 2,105,811 1,355,000 6,380,000 - 27,648,811 0.62 255 2015 2,239,565 725,000 5,730,000 - 30,777,565 0.66 279
117
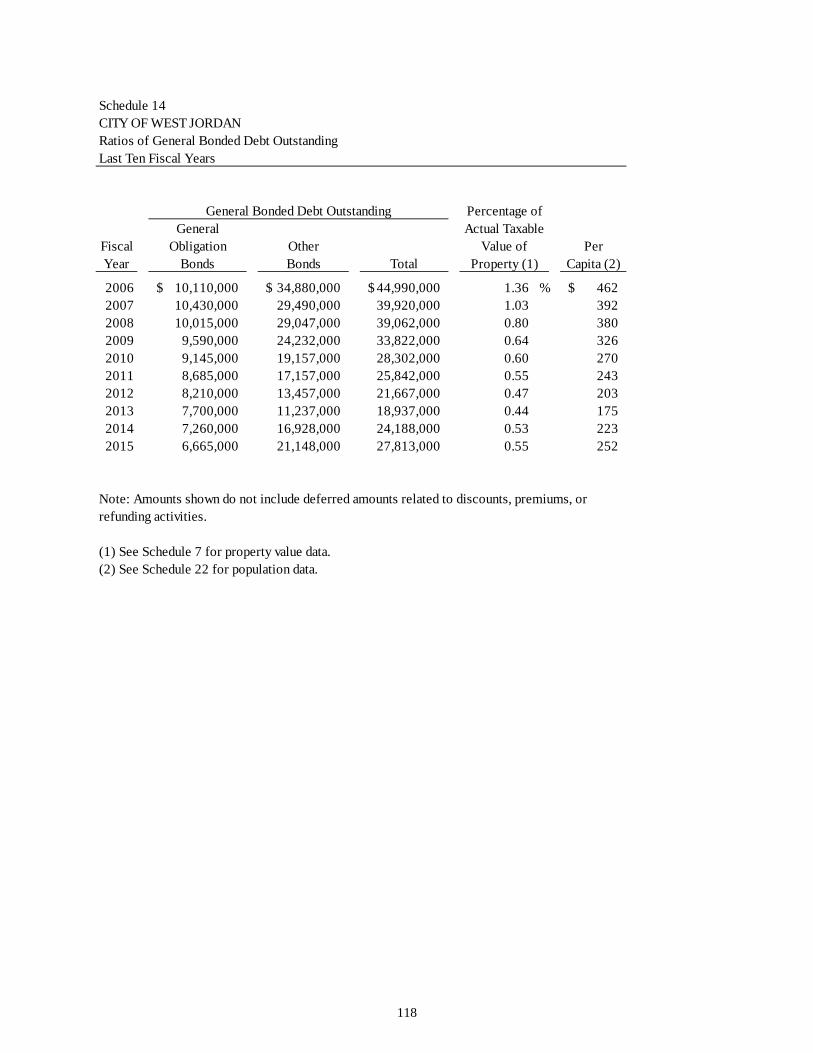
Schedule 14CITY OF WEST JORDANRatios of General Bonded Debt OutstandingLast Ten Fiscal Years
General Bonded Debt Outstanding Percentage ofGeneral Actual Taxable
Fiscal Obligation Other Value of PerYear Bonds Bonds Total Property (1) Capita (2)
2006 10,110,000$ 34,880,000$ 44,990,000$ 1.36 % 462$ 2007 10,430,000 29,490,000 39,920,000 1.03 392 2008 10,015,000 29,047,000 39,062,000 0.80 380 2009 9,590,000 24,232,000 33,822,000 0.64 326 2010 9,145,000 19,157,000 28,302,000 0.60 270 2011 8,685,000 17,157,000 25,842,000 0.55 243 2012 8,210,000 13,457,000 21,667,000 0.47 203 2013 7,700,000 11,237,000 18,937,000 0.44 175 2014 7,260,000 16,928,000 24,188,000 0.53 223 2015 6,665,000 21,148,000 27,813,000 0.55 252
(1) See Schedule 7 for property value data.(2) See Schedule 22 for population data.
Note: Amounts shown do not include deferred amounts related to discounts, premiums, or refunding activities.
118
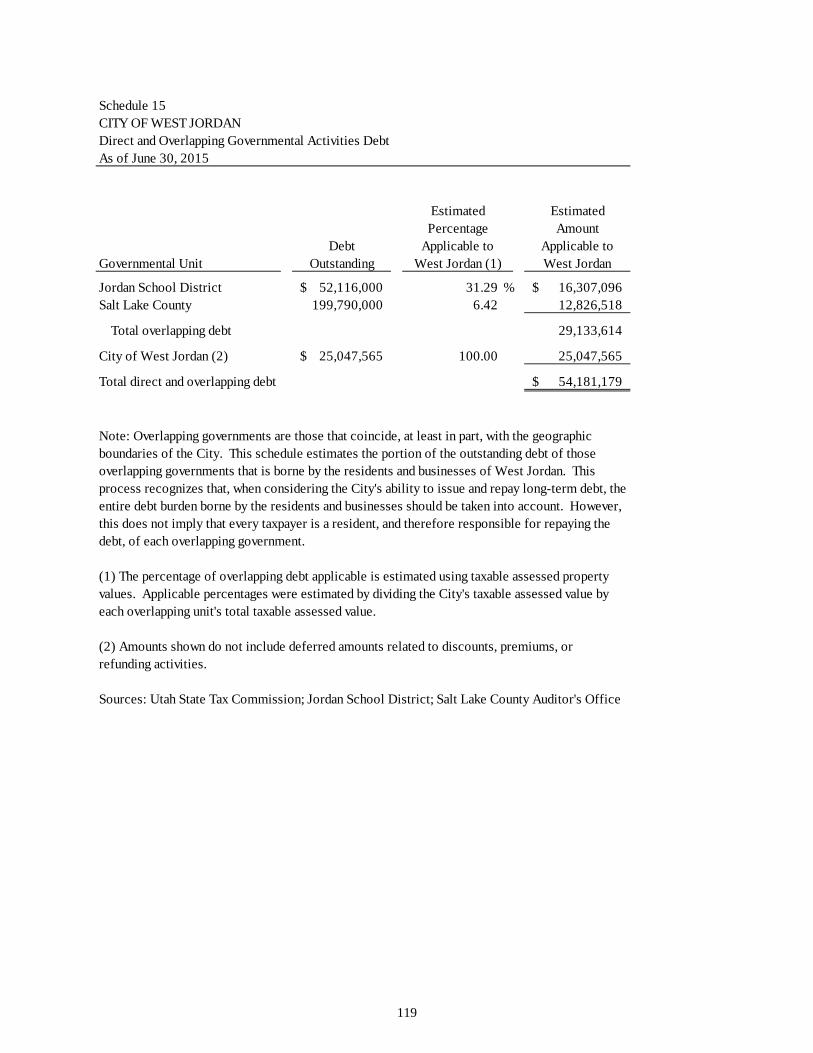
Schedule 15CITY OF WEST JORDANDirect and Overlapping Governmental Activities DebtAs of June 30, 2015
Estimated EstimatedPercentage Amount
Debt Applicable to Applicable toGovernmental Unit Outstanding West Jordan (1) West Jordan
Jordan School District 52,116,000$ 31.29 % 16,307,096$ Salt Lake County 199,790,000 6.42 12,826,518
Total overlapping debt 29,133,614
City of West Jordan (2) 25,047,565$ 100.00 25,047,565
Total direct and overlapping debt 54,181,179$
Note: Overlapping governments are those that coincide, at least in part, with the geographic boundaries of the City. This schedule estimates the portion of the outstanding debt of those overlapping governments that is borne by the residents and businesses of West Jordan. This process recognizes that, when considering the City's ability to issue and repay long-term debt, the entire debt burden borne by the residents and businesses should be taken into account. However, this does not imply that every taxpayer is a resident, and therefore responsible for repaying the debt, of each overlapping government.
(1) The percentage of overlapping debt applicable is estimated using taxable assessed property values. Applicable percentages were estimated by dividing the City's taxable assessed value by each overlapping unit's total taxable assessed value.
Sources: Utah State Tax Commission; Jordan School District; Salt Lake County Auditor's Office
(2) Amounts shown do not include deferred amounts related to discounts, premiums, or refunding activities.
119

Schedule 16CITY OF WEST JORDANLegal Debt Margin InformationLast Ten Fiscal Years
Fiscal Year2006 2007 2008 2009 2010
Debt Limit 217,091,583$ 253,923,010$ 325,315,795$ 341,546,299$ 308,833,897$
Total debt applicable to limit (1 10,110,000 10,430,000 10,015,000 9,590,000 9,145,000
Legal debt margin 206,981,583$ 243,493,010$ 315,300,795$ 331,956,299$ 299,688,897$
Total debt applicable to thelimit as a percentage ofdebt limit 4.66% 4.11% 3.08% 2.81% 2.96%
Legal Debt Margin Calculation for Fiscal Year 2015
Estimated market valueDebt limit (4% of market value)Debt applicable to limit (1)
Legal debt margin
(1) Amounts shown do not include deferred amounts related to discounts, premiums, or refunding activities.
Sources: Utah State Tax Commission; Salt Lake County Auditor's Office
6,665,000
$ 325,493,917
$ 8,303,972,918 332,158,917
120
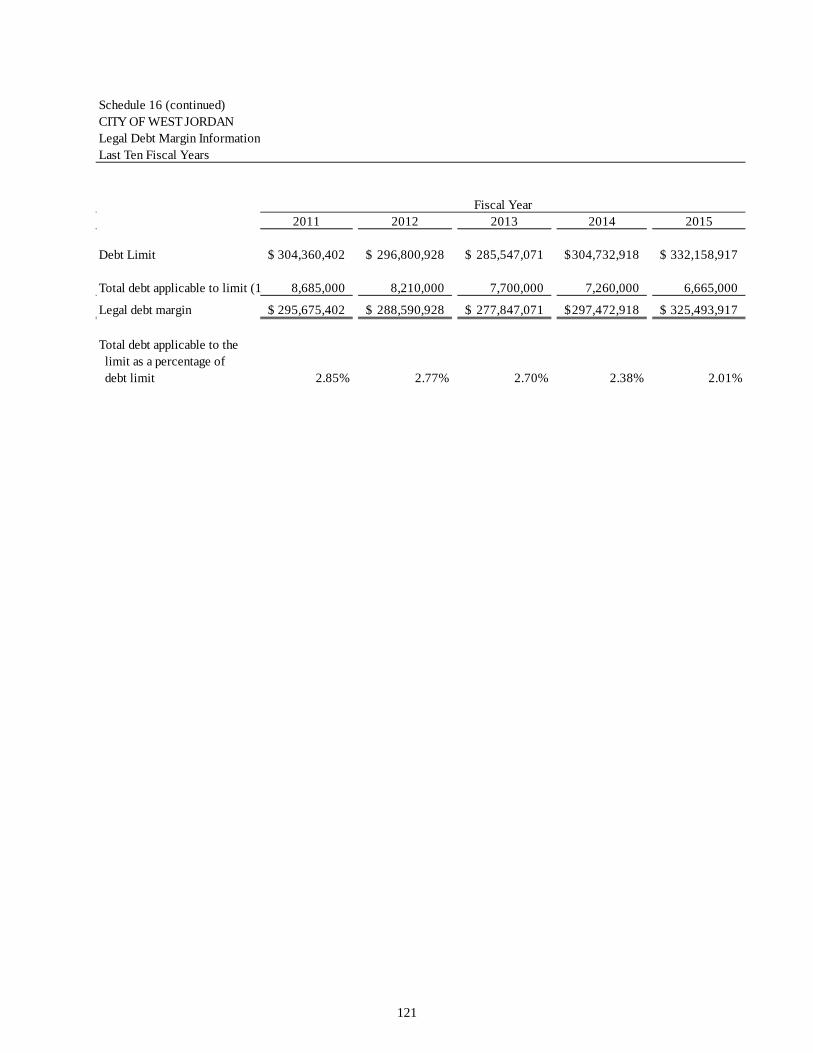
Schedule 16 (continued)CITY OF WEST JORDANLegal Debt Margin InformationLast Ten Fiscal Years
Fiscal Year2011 2012 2013 2014 2015
Debt Limit 304,360,402$ 296,800,928$ 285,547,071$ 304,732,918$ 332,158,917$
Total debt applicable to limit (1 8,685,000 8,210,000 7,700,000 7,260,000 6,665,000
Legal debt margin 295,675,402$ 288,590,928$ 277,847,071$ 297,472,918$ 325,493,917$
Total debt applicable to thelimit as a percentage ofdebt limit 2.85% 2.77% 2.70% 2.38% 2.01%
121
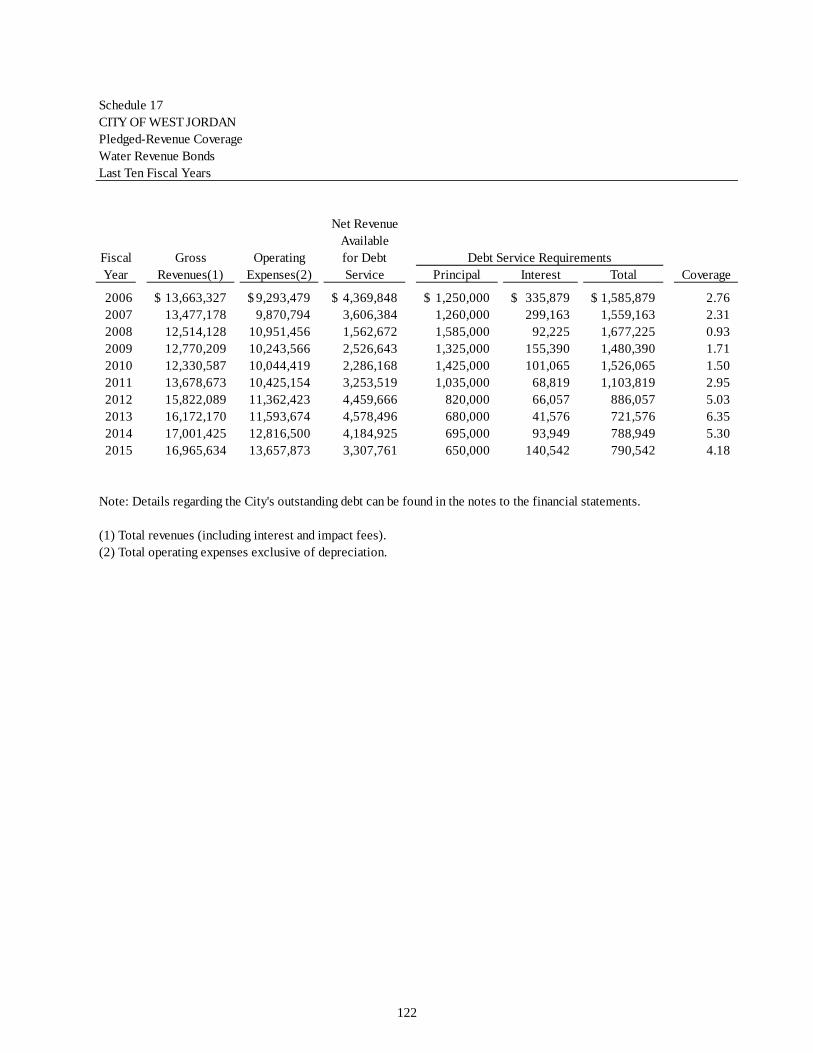
Schedule 17CITY OF WEST JORDANPledged-Revenue CoverageWater Revenue BondsLast Ten Fiscal Years
Net RevenueAvailable
Fiscal Gross Operating for Debt Debt Service RequirementsYear Revenues(1) Expenses(2) Service Principal Interest Total Coverage
2006 13,663,327$ 9,293,479$ 4,369,848$ 1,250,000$ 335,879$ 1,585,879$ 2.76 2007 13,477,178 9,870,794 3,606,384 1,260,000 299,163 1,559,163 2.31 2008 12,514,128 10,951,456 1,562,672 1,585,000 92,225 1,677,225 0.93 2009 12,770,209 10,243,566 2,526,643 1,325,000 155,390 1,480,390 1.71 2010 12,330,587 10,044,419 2,286,168 1,425,000 101,065 1,526,065 1.50 2011 13,678,673 10,425,154 3,253,519 1,035,000 68,819 1,103,819 2.95 2012 15,822,089 11,362,423 4,459,666 820,000 66,057 886,057 5.03 2013 16,172,170 11,593,674 4,578,496 680,000 41,576 721,576 6.35 2014 17,001,425 12,816,500 4,184,925 695,000 93,949 788,949 5.30 2015 16,965,634 13,657,873 3,307,761 650,000 140,542 790,542 4.18
Note: Details regarding the City's outstanding debt can be found in the notes to the financial statements.
(1) Total revenues (including interest and impact fees).(2) Total operating expenses exclusive of depreciation.
122
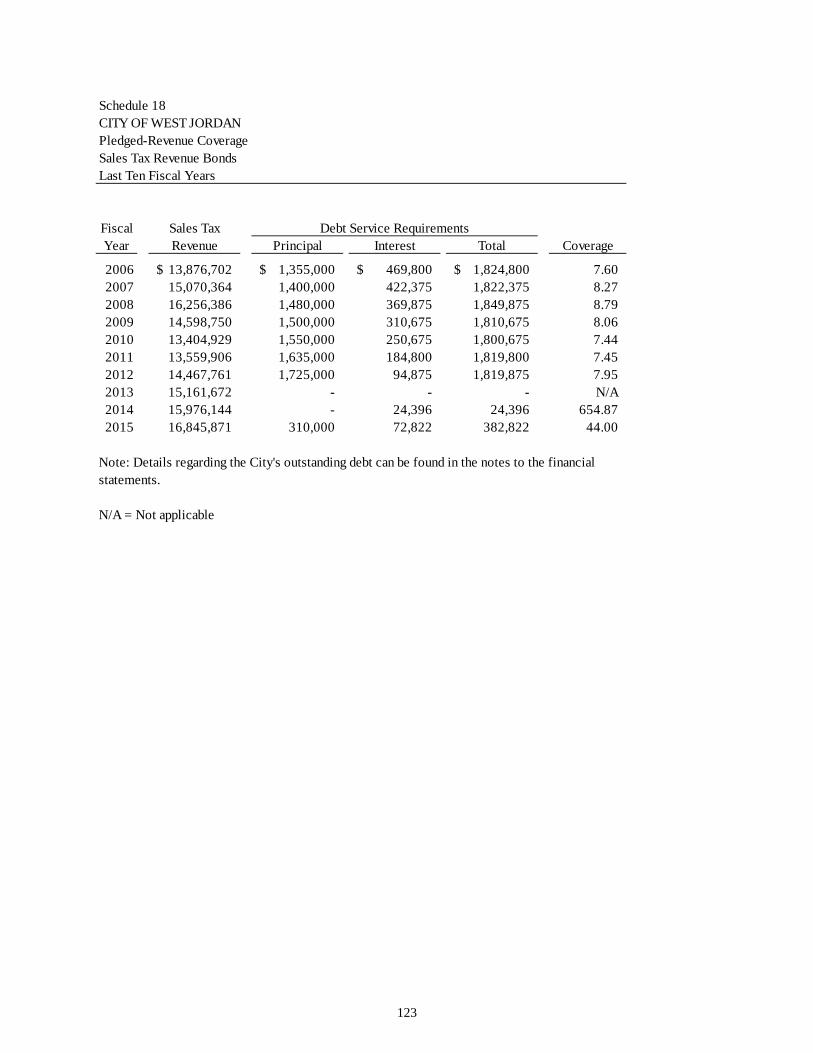
Schedule 18CITY OF WEST JORDANPledged-Revenue CoverageSales Tax Revenue BondsLast Ten Fiscal Years
Fiscal Sales Tax Debt Service RequirementsYear Revenue Principal Interest Total Coverage
2006 13,876,702$ 1,355,000$ 469,800$ 1,824,800$ 7.60 2007 15,070,364 1,400,000 422,375 1,822,375 8.27 2008 16,256,386 1,480,000 369,875 1,849,875 8.79 2009 14,598,750 1,500,000 310,675 1,810,675 8.06 2010 13,404,929 1,550,000 250,675 1,800,675 7.44 2011 13,559,906 1,635,000 184,800 1,819,800 7.45 2012 14,467,761 1,725,000 94,875 1,819,875 7.95 2013 15,161,672 - - - N/A2014 15,976,144 - 24,396 24,396 654.87 2015 16,845,871 310,000 72,822 382,822 44.00
N/A = Not applicable
Note: Details regarding the City's outstanding debt can be found in the notes to the financial statements.
123
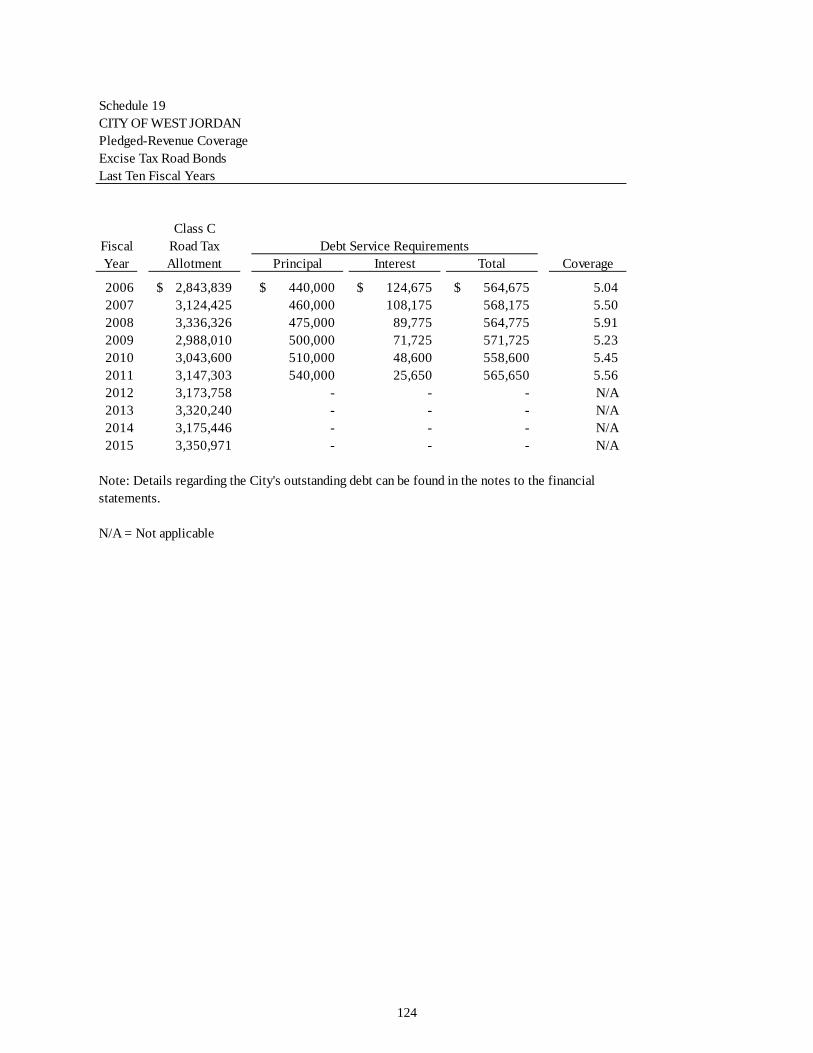
Schedule 19CITY OF WEST JORDANPledged-Revenue CoverageExcise Tax Road BondsLast Ten Fiscal Years
Class CFiscal Road Tax Debt Service RequirementsYear Allotment Principal Interest Total Coverage
2006 2,843,839$ 440,000$ 124,675$ 564,675$ 5.04 2007 3,124,425 460,000 108,175 568,175 5.50 2008 3,336,326 475,000 89,775 564,775 5.91 2009 2,988,010 500,000 71,725 571,725 5.23 2010 3,043,600 510,000 48,600 558,600 5.45 2011 3,147,303 540,000 25,650 565,650 5.56 2012 3,173,758 - - - N/A2013 3,320,240 - - - N/A2014 3,175,446 - - - N/A2015 3,350,971 - - - N/A
N/A = Not applicable
Note: Details regarding the City's outstanding debt can be found in the notes to the financial statements.
124

Schedule 20CITY OF WEST JORDANPledged-Revenue CoverageTax Increment Revenue BondsLast Ten Fiscal Years
TaxFiscal Increment Debt Service RequirementsYear Revenue Principal Interest Total Coverage
2006 985,063$ 165,000$ 266,915$ 431,915$ 2.28 2007 1,366,587 135,000 440,083 575,083 2.38 2008 2,584,234 940,000 434,413 1,374,413 1.88 2009 2,679,868 1,010,000 390,213 1,400,213 1.91 2010 2,714,436 1,085,000 341,565 1,426,565 1.90 2011 2,651,201 790,000 289,315 1,079,315 2.46 2012 2,282,629 770,000 249,341 1,019,341 2.24 2013 2,794,439 735,000 209,686 944,686 2.96 2014 3,398,395 690,000 171,466 861,466 3.94 2015 3,824,806 655,000 135,103 790,103 4.84
Note: Details regarding the City's outstanding debt can be found in the notes to the financial statements.
Function/Program
125

Schedule 21CITY OF WEST JORDANPledged-Revenue CoverageHUD Contract PayableLast Ten Fiscal Years
CommunityDevelopment
Fiscal Block Grant Debt Service RequirementsYear Revenue Principal Interest Total Coverage
2006 541,696$ 85,000$ 134,048$ 219,048$ 2.47 2007 555,568 90,000 127,805 217,805 2.55 2008 501,969 95,000 121,167 216,167 2.32 2009 743,878 100,000 114,127 214,127 3.47 2010 451,102 105,000 106,740 211,740 2.13 2011 613,096 110,000 98,865 208,865 2.94 2012 496,435 115,000 26,078 141,078 3.52 2013 647,419 120,000 25,240 145,240 4.46 2014 514,068 125,000 23,886 148,886 3.45 2015 500,955 130,000 21,879 151,879 3.30
Note: Details regarding the City's outstanding debt can be found in the notes to the financial statements.
126

Schedule 22CITY OF WEST JORDANDemographic and Economic StatisticsLast Ten Fiscal Years
Per CapitaFiscal Personal Personal UnemploymentYear Population Income (1) Income (2) Rate (3)
2006 97,365 3,256,080,330$ 33,442$ 4.0 %2007 101,915 3,721,935,800 36,520 2.92008 102,660 3,951,794,040 38,494 2.52009 103,740 4,067,749,140 39,211 3.42010 104,969 3,870,941,813 36,877 7.12011 106,286 3,945,442,606 37,121 7.92012 106,954 4,172,596,402 39,013 6.62013 108,062 4,389,802,626 40,623 5.32014 108,362 4,471,991,378 41,269 4.52015 110,171 4,686,123,485 42,535 3.7
(1) Estimates of total personal income are derived by multiplying per capita personal income amounts by the corresponding population.(2) Per capita personal income amounts are for Salt Lake County. The amounts shown are for the calendar year that ended during the specified fiscal year, e.g., amounts for calendar year 2014 are shown in fiscal year 2015.(3) Unemployment rates are for the Salt Lake City, UT metropolitan area. The rates shown are for the calendar year that ended during the specified fiscal year, e.g., rates for calendar year 2014 are shown in fiscal year 2015.
Sources: Population information provided by the West Jordan City Manager's Office. Per capita personal income information provided by the U.S. Department of Commerce, Bureau of Economic Analysis. Unemployment rates provided by the U.S. Department of Labor, Bureau of Labor Statistics.
127

Schedule 23CITY OF WEST JORDANPrincipal EmployersCurrent Year and Nine Years Ago
2015 2006Percentage of Percentage of
Total City Total CityEmployer Employees Rank Employment Employees Rank Employment
Jordan School District 3,389 1 5.78 % 2,322 1 5.81 %Smith's 730 2 1.24 364 7 0.91Jordan Valley Medical Center 691 3 1.18 387 6 0.97West Jordan City 590 4 1.01 523 4 1.31Mountain America Credit Union 510 5 0.87 266 8 0.67Sysco Intermountain Food Services 431 6 0.73 496 5 1.24Fairchild Semi-conductor 404 7 0.69 575 3 1.44SME Industries 375 8 0.64 - Wal-Mart 372 9 0.63 581 2 1.45National Benefit Services 298 10 0.51 - Sam's Club - - 250 9 0.63Sears Roebuck - - 238 10 0.60
Total 7,790 13.28 % 6,002 15.02 %
Sources: West Jordan Business License Division; Jordan School District; U.S. Department of Labor, Bureau of Labor Statistics
128

Schedule 24CITY OF WEST JORDANFull-time Equivalent City Government Employees by Function/ProgramLast Ten Fiscal Years
Function/Program 2006 2007 2008 2009 2010 2011 2012 2013 2014 2015
General government
Mayor & city council 4.10 4.60 4.60 4.60 4.56 4.62 4.62 4.62 5.11 5.61
Administration 14.40 13.90 15.90 15.10 6.45 6.07 7.07 10.42 8.84 8.84
Support services - - - - - - - - - -
Finance/Admin. services 27.50 23.00 23.33 23.33 31.51 29.25 30.00 30.35 33.74 34.74
Information Technologies - 7.00 7.00 7.00 - - - -
Facilities 4.93 5.93 6.93 6.93 4.00 4.00 4.00 4.00 5.00 5.27
Attorney 10.75 11.00 11.00 11.00 10.00 11.90 12.50 15.38 18.50 19.50
Court 11.00 11.00 11.00 11.00 10.00 10.00 10.00 10.00 10.00 10.00
Community development
Planning & zoning 10.50 10.50 10.50 10.50 11.29 9.79 9.79 7.10 7.50 7.90
Economic development - - - - 1.71 1.71 1.71 0.40 - 1.00
Building safety 12.27 11.62 11.62 10.20 9.23 9.23 9.23 8.23 8.23 8.23
Police
Support services 58.70 60.70 62.50 64.50 61.97 60.62 61.52 78.50 72.00 73.00
Line services 86.35 90.25 89.25 90.10 89.78 89.13 89.23 82.53 84.30 85.30
Animal control 5.00 5.00 6.00 6.00 6.28 6.28 9.28 9.00 9.50 9.50
Fire 85.00 85.00 85.00 86.00 86.00 86.00 86.00 85.00 85.00 85.00
Public works
Public works admin. 6.00 7.00 7.00 6.75 6.00 6.00 6.00 5.26 5.26 5.26
Engineering 23.15 24.40 24.40 24.90 17.75 17.75 17.25 15.61 15.96 16.69
Streets 21.00 21.00 24.00 24.00 21.60 21.10 23.10 22.09 22.03 23.03
Storm drain - - 2.00 2.00 2.00 - - - - -
Fleet operations 8.00 8.00 8.00 9.00 7.00 7.00 8.00 8.47 6.13 8.13
Parks and recreation 14.50 15.50 18.00 18.00 15.00 15.00 14.00 14.75 15.00 16.00
Water 15.00 15.00 18.00 17.25 18.00 19.00 17.00 17.54 19.38 21.38
Sewer 11.00 11.00 11.00 11.00 11.00 13.00 12.00 9.07 9.26 11.26
Solid waste 1.00 1.00 1.50 1.50 1.90 2.40 2.40 2.10 2.05 2.05
Stormwater - - - - - - - 9.12 9.12 11.12
Total 430.15 442.40 458.53 460.66 433.03 429.85 434.70 449.54 451.91 468.81
Source: West Jordan Human Resources Division
Note: Full-time equivalent employees shown are based on authorized positions as determined by the salary schedule and the personnel budgets for the specified year.
129
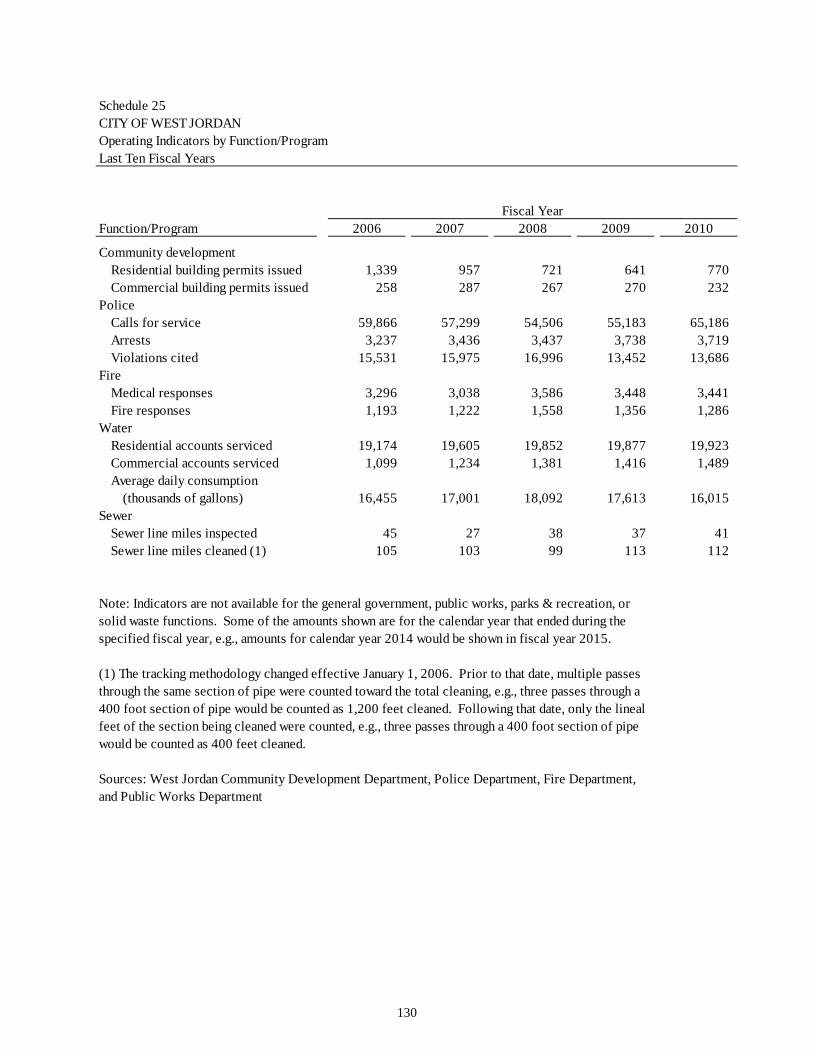
Schedule 25CITY OF WEST JORDANOperating Indicators by Function/ProgramLast Ten Fiscal Years
Fiscal YearFunction/Program 2006 2007 2008 2009 2010
Community developmentResidential building permits issued 1,339 957 721 641 770 Commercial building permits issued 258 287 267 270 232
PoliceCalls for service 59,866 57,299 54,506 55,183 65,186 Arrests 3,237 3,436 3,437 3,738 3,719 Violations cited 15,531 15,975 16,996 13,452 13,686
FireMedical responses 3,296 3,038 3,586 3,448 3,441 Fire responses 1,193 1,222 1,558 1,356 1,286
WaterResidential accounts serviced 19,174 19,605 19,852 19,877 19,923 Commercial accounts serviced 1,099 1,234 1,381 1,416 1,489 Average daily consumption
(thousands of gallons) 16,455 17,001 18,092 17,613 16,015 Sewer
Sewer line miles inspected 45 27 38 37 41 Sewer line miles cleaned (1) 105 103 99 113 112
Note: Indicators are not available for the general government, public works, parks & recreation, or solid waste functions. Some of the amounts shown are for the calendar year that ended during the specified fiscal year, e.g., amounts for calendar year 2014 would be shown in fiscal year 2015.
(1) The tracking methodology changed effective January 1, 2006. Prior to that date, multiple passes through the same section of pipe were counted toward the total cleaning, e.g., three passes through a 400 foot section of pipe would be counted as 1,200 feet cleaned. Following that date, only the lineal feet of the section being cleaned were counted, e.g., three passes through a 400 foot section of pipe would be counted as 400 feet cleaned.
Sources: West Jordan Community Development Department, Police Department, Fire Department, and Public Works Department
130

Schedule 25 (continued)CITY OF WEST JORDANOperating Indicators by Function/ProgramLast Ten Fiscal Years
Fiscal YearFunction/Program 2011 2012 2013 2014 2015
Community developmentResidential building permits issued 611 682 727 809 965 Commercial building permits issued 188 211 186 197 229
PoliceCalls for service 66,820 62,414 61,501 60,017 64,291 Arrests 3,654 3,514 3,042 2,981 2,900 Violations cited 14,610 13,170 11,113 12,144 13,868
FireMedical responses 3,562 3,792 3,798 3,902 4,341 Fire responses 1,233 1,218 1,879 1,760 1,934
WaterResidential accounts serviced 20,072 20,315 20,545 20,761 21,055 Commercial accounts serviced 1,549 1,569 1,567 1,605 1,657 Average daily consumption
(thousands of gallons) 16,596 18,530 18,817 18,517 17,488 Sewer
Sewer line miles inspected 39 22 18 20 13 Sewer line miles cleaned (1) 124 93 83 87 88
131
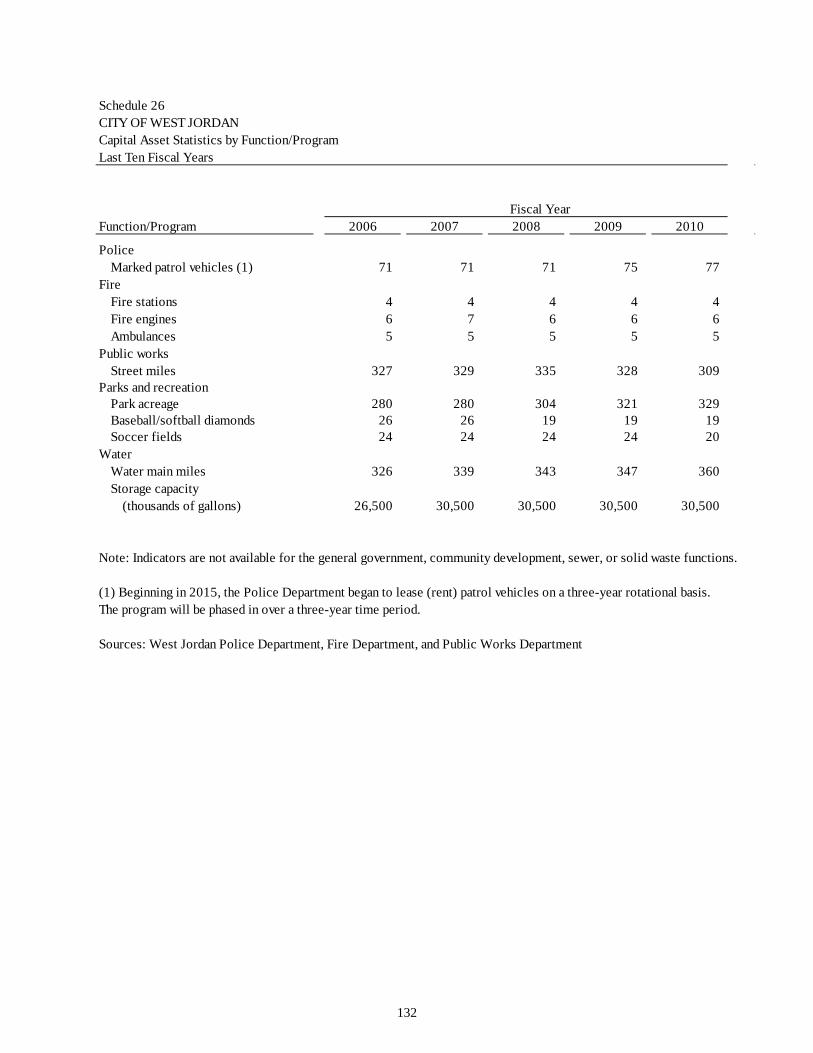
Schedule 26CITY OF WEST JORDANCapital Asset Statistics by Function/ProgramLast Ten Fiscal Years
Fiscal YearFunction/Program 2006 2007 2008 2009 2010
PoliceMarked patrol vehicles (1) 71 71 71 75 77
FireFire stations 4 4 4 4 4 Fire engines 6 7 6 6 6 Ambulances 5 5 5 5 5
Public worksStreet miles 327 329 335 328 309
Parks and recreationPark acreage 280 280 304 321 329 Baseball/softball diamonds 26 26 19 19 19 Soccer fields 24 24 24 24 20
WaterWater main miles 326 339 343 347 360 Storage capacity
(thousands of gallons) 26,500 30,500 30,500 30,500 30,500
Note: Indicators are not available for the general government, community development, sewer, or solid waste functions.
Sources: West Jordan Police Department, Fire Department, and Public Works Department
(1) Beginning in 2015, the Police Department began to lease (rent) patrol vehicles on a three-year rotational basis. The program will be phased in over a three-year time period.
132

Schedule 26 (continued)CITY OF WEST JORDANCapital Asset Statistics by Function/ProgramLast Ten Fiscal Years
Fiscal YearFunction/Program 2011 2012 2013 2014 2015
PoliceMarked patrol vehicles (1) 77 77 77 77 49
FireFire stations 4 4 4 4 4 Fire engines 6 6 6 6 6 Ambulances 5 5 5 5 5
Public worksStreet miles 316 329 329 334 336
Parks and recreationPark acreage 331 336 338 348 354 Baseball/softball diamonds 19 19 19 19 19 Soccer fields 20 20 20 20 20
WaterWater main miles 362 378 380 436 439 Storage capacity
(thousands of gallons) 30,500 30,500 30,500 30,500 37,500
133