Embed Size (px)
Citation preview
Annual Economic Review
2013
Ministry of Finance, Republic of Liberia

i
FOREWORD
In this second edition of the Annual Economic Review we present highlights of the developments in the real, fiscal, monetary and external sectors of the economy; report on the progress in the implementation of a number of the projects in the Agenda for Transformation, as well as the steps Government is taking to remove the binding constraints to growth.
Despite a slow global recovery, the Liberian economy continues to be resilient. In 2013, the economy experienced steady growth in real GDP of 8.1%, well above the African average by 2.5 percentage points. This strong economic performance is driven partly by increased activities in the mining sector, which, along with other concessions activity, is expected to continue to perform well in the medium-term. This highlights both the opportunities for Liberia – in terms of employment, business growth and government revenue – and the challenges we face in achieving broad based growth that achieves development for all members of our society.
Accordingly, the Government is currently striving to create more diversified output, higher up the value chain, particularly in the industrial and agricultural sectors. Already the government has worked to create opportunities for small and medium enterprises by reducing the barriers to business registration and instituting fiscal rules that will ensure local contents of consumables for government and the concession companies.
In continuation of its expansionary fiscal policy, the Government of Liberia (GoL), in 2013, made concrete efforts to focus resources onto the development priorities set out in the Agenda for Transformation. In particular this has meant ensuring investment in the key infrastructure needed, to address the infrastructure deficit and enhance private sector led growth. These included the rehabilitation of the Mt. Coffee Hydroelectric Plant, participation in the West Africa Power Pool, the construction of new Heavy Fuel Oil (HFO) power plants, and the commencement of major road projects linking growth corridors, such as the Monrovia-Ganta Highway and a major urban artery expansion to Somalia Drive.

ii
We would like to thank all of the ministries, agencies and commissions, and donor partners for providing the necessary data to compile this report. We welcome any comments and suggestions that will help us improve on the coverage and quality of subsequent editions of the Economic Review.
Amara M. Konneh Minister of Finance, Republic of Liberia March 2014

3
TABLE OF CONTENTS
TABLE OF CONTENTS ..................................................................................................................................... 3
LIST OF FIGURES ............................................................................................................................................ 4
LIST OF TABLES .............................................................................................................................................. 4
EXECUTIVE SUMMARY ................................................................................................................................... 6
1. INTRODUCTION ....................................................................................................................................... 12
2. GLOBAL ECONOMIC DEVELOPMENTS AND OUTLOOK ............................................................................ 13
3. DOMESTIC MACROECONOMIC DEVELOPMENTS .................................................................................... 14
3.1 DOMESTIC DEVELOPMENT STRATEGY ............................................................................................... 15
3.2 ECONOMIC CHALLENGES .................................................................................................................. 15
3.3 REMOVING BOTTLENECKS TO CONCESSIONAIRES ............................................................................ 16
3.4 FISCAL RULES ..................................................................................................................................... 16
3.4.1 EXPENDITURE ............................................................................................................................. 16
3.4.2 BORROWING .............................................................................................................................. 17
3.5 MONETARY POLICY ............................................................................................................................ 17
4. REAL SECTOR DEVELOPMENTS ................................................................................................................ 18
4.1 AGRICULTURE .................................................................................................................................... 18
4.1.1 DONOR FUNDED PROJECTS IN AGRICULTURE ............................................................................ 19
4.1.2 AGRICULTURAL CONCESSIONS ................................................................................................... 19
4.2 FORESTRY SUB-SECTOR ..................................................................................................................... 20
4.3 COMMERCE AND INDUSTRIES ........................................................................................................... 22
4.3.1 OUTPUT OF THE INDUSTRIAL SECTOR ........................................................................................ 23
4.4 MINING AND PETROLEUM ................................................................................................................ 24
4.5 SOCIAL AND BASIC SERVICES ............................................................................................................. 25
4.5.1 EDUCATION ................................................................................................................................ 25
4.5.2 HEALTH AND SOCIAL WELFARE .................................................................................................. 26
4.5.3 PRIORITY INFRASTRUCTURE PROJECTS ....................................................................................... 28
4.5.4 WATER AND SEWERAGE SERVICES ............................................................................................. 31
4.5.5 TRANSPORT SERVICES ................................................................................................................ 33
4.5.6 ENERGY GENERATION, TRANSMISSION AND DISTRIBUTION ...................................................... 33
5. FISCAL SECTOR DEVELOPMENTS ............................................................................................................. 36
5.1 FISCAL OVERVIEW ............................................................................................................................. 36
5.1.1 REVENUE .................................................................................................................................... 37
5.1.2 EXPENDITURE ............................................................................................................................. 37

4
5.1.3 GOL TREASURY BILLS .................................................................................................................. 38
5.2 FISCAL YEAR 2013/14 ........................................................................................................................ 39
5.3 TAX EXPENDITURES ........................................................................................................................... 41
6. MONETARY SECTOR DEVELOPMENTS ..................................................................................................... 43
6.1 MONETARY INDICATORS ................................................................................................................... 43
6.2 MONETARY AGGREGATES ................................................................................................................. 44
6.2.1 LIBERIAN DOLLARS IN CIRCULATION .......................................................................................... 44
6.2.2 MONEY SUPPLY (M1) .................................................................................................................. 45
6.2.3 BROAD MONEY (M2) .................................................................................................................. 45
6.3 INFLATION ......................................................................................................................................... 46
6.4 EXCHANGE RATE DEVELOPMENT ...................................................................................................... 46
6.4.1 FOREIGN EXCHANGE AUCTIONS ................................................................................................. 47
6.5 INTEREST RATES AND BANK LENDING ............................................................................................... 48
6.5.1 DEPOSIT RATE ............................................................................................................................. 48
6.5.2 LENDING RATE ............................................................................................................................ 48
6.5.3 COMMERCIAL BANK CREDITS ..................................................................................................... 49
6.6 EXPANSION OF THE MONEY MARKET ............................................................................................... 52
6.6.1 CBL NOTES .................................................................................................................................. 52
7. EXTERNAL SECTOR DEVELOPMENTS ....................................................................................................... 53
7.1 EXPORT OF GOODS AND SERVICES .................................................................................................... 54
7.2 IMPORT OF GOODS AND SERVICES ................................................................................................... 55
REFERENCE DOCUMENTS ............................................................................................................................ 57
L IST OF FIGURES
Figure 1: SECTORAL DISTRIBUTION OF THE AGENDA FOR TRANSFORMATION FUNDING .......................... 29 Figure 2: TRENDS IN THE GOL REVENUE ..................................................................................................... 37 Figure 3: TRENDS IN GOL EXPENDITURES .................................................................................................... 38 Figure 4: TRENDS IN EXPENDITURES ON PRODUCTIVE AND NON-PRODUCTIVE SECTORS ......................... 38 Figure 5: CBL NET FOREIGN RESERVE POSITION, OCTOBER 2012- JULY 2013 ............................................. 43 Figure 6: LIBERIA DOLLAR PRICE PER US$, JAN - JUNE, 2013 ...................................................................... 47 Figure 7: COMMERCIAL BANK LOANS TO ECONOMIC SECTORS, 2011: Q3 & 2013:Q3 ............................... 50 Figure 8: TREASURY BILLS AND CBL NOTES ISSUED ..................................................................................... 52 Figure 9: BALANCE OF PAYMENTS 2011-13 (US$ MILLIONS) ...................................................................... 54
L IST OF TABLES

5
Table 1: COMPARATIVE GDP GROWTH RATES FOR SELECTED WEST AFRICAN COUNTRIES ....................... 14 Table 2: 2013 AGRICULTURAL OUTPUT (US$) ............................................................................................. 18 Table 3: REVENUES FROM THE AGRICULTURE SECTOR ............................................................................... 19 Table 4: DONOR-FUNDED PROJECTS IN THE AGRICULTURE SECTOR .......................................................... 19 Table 5: AGRICULTURAL CONCESSIONS OPERATING IN LIBERIA ................................................................. 20 Table 6: LAND USE RIGHTS .......................................................................................................................... 20 Table 7: EXPORT AND GDP CONTRIBUTION OF THE FORESTRY SECTOR ..................................................... 21 Table 8: REVENUES FROM THE FORESTRY SECTOR ..................................................................................... 22 Table 9: BUSINESSES OPERATING IN LIBERIA .............................................................................................. 22 Table 10: INDUSTRIAL OUTPUT ................................................................................................................... 23 Table 11: MINERAL EXPLORATION AND MINING COMPANIES OPERATING IN LIBERIA ............................... 24 Table 12: REVENUES FROM THE MINING SECTOR ...................................................................................... 25 Table 13: REVENUES FROM THE PETROLEUM SECTOR ............................................................................... 25 Table 14: HEALTH INDICATORS ................................................................................................................... 28 Table 15: PRIORITY INFRASTRUCTURE PROJECTS ........................................................................................ 30 Table 16: ROADS - WORK UNDERWAY ........................................................................................................ 30 Table 17: WATER AND SEWER DEVELOPMENTS IN LIBERIA FOR 2013 ........................................................ 32 Table 18: REGISTERED VEHICLES ................................................................................................................. 33 Table 19: DRIVER'S LISCENSES ISSUED ........................................................................................................ 33 Table 20: ELECTRICITY INDICATORS BETWEEN 2010 AND 2013 .................................................................. 34 Table 21: LEC CUSTOMER SEGMENTATION................................................................................................. 35 Table 22: MONTHLY KWH OF POWER SUPPLIED ......................................................................................... 35 Table 23: BREAKDOWN OF THE UNIT COST OF POWER .............................................................................. 35 Table 24: GOL TREASURY BILLS (MAY - DECEMBER 2013) ........................................................................... 39 Table 25: QUARTERLY REVENUE PERFORMANCE FOR FY 2013/2014 ......................................................... 39 Table 26: PRELIMINARY GFS TABLE FOR FY 2013/2014............................................................................... 40 Table 27: CUMULATIVE MID-YEAR (FY2013/14) DISBURSEMENTS BY SECTOR ........................................... 40 Table 28: MONTHLY TAX EXPENDITURES FOR 2013 .................................................................................... 42 Table 29: LIBERIAN DOLLAR CURRENCY IN CIRCULATION (L$) .................................................................... 44 Table 30: LIBERIAN DOLLAR MONETARY AGGREGATES (L$) ....................................................................... 45 Table 31: MID-MARKET EXCHANGE RATES: L$ PRICE PER US$ .................................................................... 46 Table 32: CENTRAL BANK OF LIBERIA FOREIGN EXCHANGE ........................................................................ 48 Table 33: COMMERCIAL BANKS’ INTEREST RATES, 2012-2013 ................................................................... 49 Table 34: COMMERCIAL BANKS’ LOANS TO ECONOMIC SECTORS (L$) ....................................................... 51 Table 35: CBL BILL ISSUANCE (JULY – NOVEMBER 2013) ............................................................................ 52 Table 36: BALANCE OF PAYMENTS 20011-2013 (US$ MILLIONS) ............................................................... 53 Table 37: EXPORT OF COMMODITIES, 2008-2013 ....................................................................................... 55 Table 38: IMPORT OF GOODS, 2008-2013 .................................................................................................. 56

6
EXECUTIVE SUMMARY
MACROECONOMIC DEVELOPMENTS & CHALLENGES
In 2013, Liberia’s real Gross Domestic Product (GDP) growth was estimated at 8.1 percent, slightly lower than the 8.3 percent growth recorded in 2012. The growth in 2013 was driven largely by increased activities in the mining sector, and this is expected to continue in the medium-term, particularly with the commencement of iron ore exports by China Union and the ramping up of production by Arcelor Mittal.
Despite the macroeconomic stability that has prevailed and the successes in supporting the private sector to date, a number of challenges are facing the Liberian economy in the near-term. Many of them are structural in nature, but exogenous factors also play a leading role around both domestic and external demand, as Liberia is a recipient of large aid and security related inflows, which are likely to fall over time; and is subject to global demand and prices, having a productive base mostly characterized by the export of primary commodities.
The draw-down of the United Nations Mission in Liberia (UNMIL) (including secondary effects) and arguably lower levels of NGO activity are likely to be causing a slowdown in domestic demand for services – with a corresponding impact on employment and secondary effect on economic activity. The government is also facing difficulties in achieving high rates of public capital expenditure as a constrained resource envelope and pressures on the recurrent side consume resources that could otherwise have gone towards investment projects. The budget for FY2014/15 will look to address these issues, with a focus on investment and enhancing the productive capacity of the economy.
REAL ECONOMY
Agriculture and Forestry
According to the Central Bank of Liberia (CBL), rubber production declined by 12.8 percent in 2013 compared to 2012. The fall in rubber production is mainly attributed to aging rubber trees and the longevity in the gestation period of newly planted rubber trees, which are further exacerbated by the decline in global rubber prices.
The CBL reports that cocoa and coffee production for 2013 increased by 3.2 percent and 49.6 percent, respectively, compared to 2012. The improved performance is attributed to increases in the maturity of newly planted cocoa and coffee trees. Owing to the moratorium on the export of timber, round logs production declined by 51.1 percent in 2013 relative to 2012.
About US$36 million in recently ratified credits are being invested to boost smallholder productivity, providing micro-loans, inputs and enhancing access to market. Palm Oil Concessionaires are also expanding their activity, creating thousands of new jobs. The government through the Ministry of Agriculture is working with concessionaires and civil society partners to operationalize the agreed upon out-grower schemes, which will provide training and financing to independent farmers, allowing them to grow palm oil and sell it back to the concessionaires.
Manufacturing
In 2013, the manufacturing sector expanded by 13 percent as compared to 21 percent for 2012. Despite this expansion, the manufacturing sector still faces major binding constraints, including an insufficient supply and prohibitively high cost of energy generation, which makes products expensive and reduces

7
demand for locally manufactured goods. The industrial sector is also faced with a shortage of skilled labor and limited local inputs.
As a result, in the short-term, manufacturing – especially of cement, beverages, woodwork, printing, and various consumer goods – is expected to continue to have a limited impact on output and growth and correspondingly on jobs creation and improvements in socioeconomic conditions.
Cement output increased by 49.5 percent in 2013 as compared to 2012. This can be directly attributed to an expansion in local construction and the corresponding increase in the demand for cement, which necessitated additional manufacturing capacity that is being met by expansion at the cement plant.
Beverage production, on the other hand, increased slightly by 3.9 percent in 2013 as compared to the volume produced in 2012.
Mining and petroleum
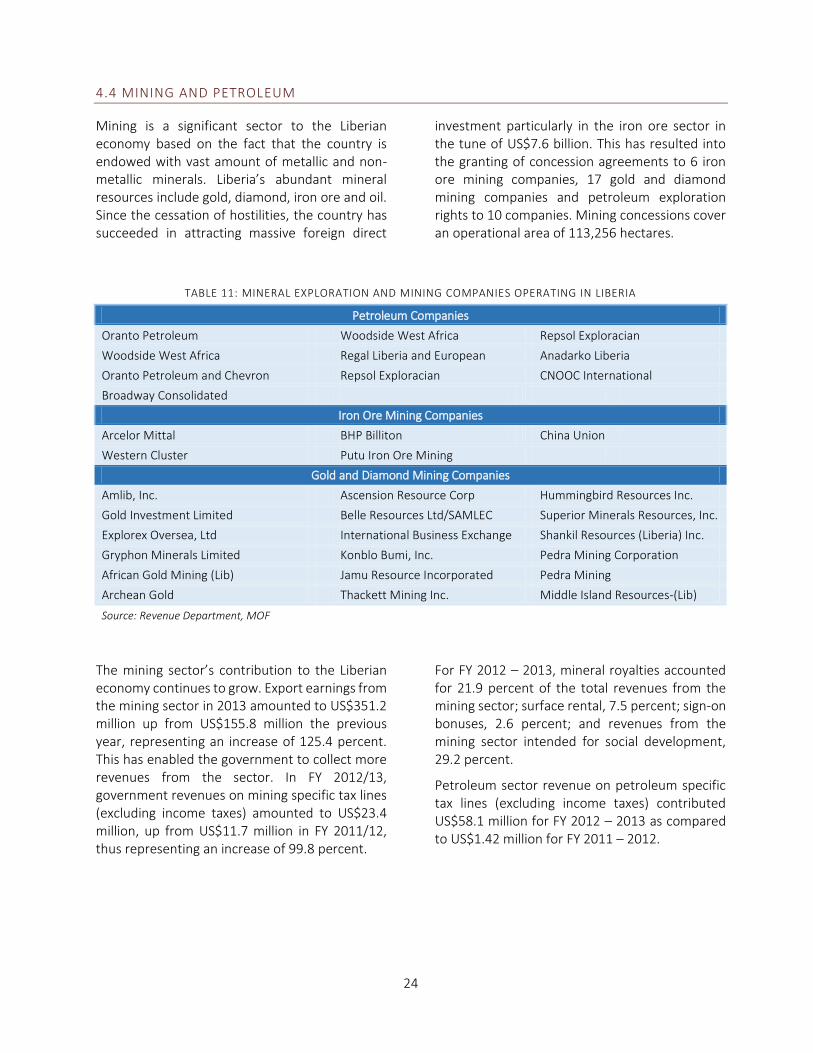
Mining is a significant sector to the Liberian economy, given that the country is endowed with a vast amount of metallic and non-metallic minerals. Liberia’s abundant mineral resources include gold, diamond, iron ore and oil. Concession agreements have been granted to six iron ore mining companies and 17 gold and diamond mining companies, and petroleum exploration rights have been awarded to 10 companies. Mining concessions cover an operational area of 113,256 hectares.
Production of iron ore increased dramatically in 2013 resulting in export earnings from the mining sector rising to US$351.2 million in 2013, up from US$155.8 million the previous year, representing an increase of 125.4 percent. This has enabled the government to collect more revenues from the sector; in FY 2012/13 government revenues on mining specific tax lines (excluding income taxes) amounted to US$23.4 million, up from US$11.7 million in FY 2011/12, driven by higher mineral royalties.
Removing Bottlenecks to Concessionaires
In order to achieve the growth trajectory necessary for achieving the Liberia RISING National Vision 2030, the government made significant efforts in 2013 to expand the private sector and more importantly remove the bottlenecks to concessionaires. The Inter-Ministerial Concessions Commission (IMCC) conducted a national dialogue between key ministries, government agencies, NGO’s and concessionaires to remove bottlenecks to production and exportation timelines. These actions could increase capital investment by approximately US$7.5 billion over the AfT period, boost tax revenue collection by approximately US$400 million per annum, and enhance employment by approximately 80,000-90,000 jobs in the next 10-15 years.
Major strides have also been taken to resolve the infrastructure, bureaucratic and community interest issues facing concessionaires across the board (mining, forestry and palm oil industries) through numerous roundtable discussions between relevant government stakeholders and concessionaires. In the mining sector, through an inter-Ministerial effort, GoL successfully settled the housing unit issue with China Union, paying US$4 million to former Bong Mines workers and approximately US$500,000 to resettle squatters. This enabled China Union to reach its intended production capacity and exportation timeline. Concerned about the slowdown in exports, GoL has targeted logistical bottlenecks in the forestry sector and is signing memorandums with forestry companies, authorizing them to rehabilitate primary roads in exchange for clearance of their tax arrears.

8
SOCIAL AND BASIC SERVICES
Education
Achievements in the education sector reflect the priority that the government and its development partners have placed on education, and are consistent with the previously agreed 2009 Education Sector Plan, the five-year (2012-2017) Medium Term Plan for Education Reform and Development in Liberia, the Education Reform Act of 2011 and the draft Technical and Vocational Education and Training (TVET) Policy of 2011. As a result in 2013 key achievements recorded in the educational sector included successfully developing an Education Management Information System, the construction and furnishing of County Education Offices, Learning Resources Centers and schools, and the provision of grants to school boards amongst others.
Health and social welfare
The health sector succeeded in increasing the percentage of deliveries assisted by skilled birth attendants; the number of families with access to family planning; the percentage of children under the age of one-year who received DPT3/pentavalent-3 vaccinations against diphtheria, pertussis (whopping cough) and tetanus; the percentage of pregnant women provided with second dose of Intermittent Preventative Treatment (IPT) for malaria; the percentage of pregnant women testing HIV+ that are receiving antiretroviral (ARV) prophylaxis to reduce mother-to-child-transmission (MTCT); and the percentage of facilities with no out-of-stock tracer drugs.
Priority Infrastructure Projects
Investment in infrastructure is a critical step towards generating and sustaining rapid economic growth and development. The Agenda for Transformation (AfT), Liberia’s poverty reduction strategy plan, identifies the government’s priority projects, a large portion of which cover infrastructure. The total cost of the AfT is estimated at US$3.2 billion over the five-year period (2012-2017); the Government has succeeded in mobilizing more than US$2 billion in committed financing for the AfT, including US$114 million of its own resources through the Public Sector Investment Plan (PSIP) and US$393 million from borrowing. During the period under review, as part of efforts to finance the AfT, donors have disbursed US$673,824,913 while the government under its PSIP has disbursed US$100,120,870.
Notably, the needs of the energy and environment sector under the AfT have been met by commitments from government and donors. However, due to the infrastructure needs of the country, a significant funding gap estimated at US$825 million remains in the infrastructure sector.
Roads and Bridges
The Government, with the help of its development partners, has embarked upon a nation-wide effort to rehabilitate roads and bridges prominent among which are: Red Light to Ganta (180.4 km), Gbarnga to Ganta to Guinea border (68.6 km), Caldwell to Louisiana road (12km); S.K.D. Blvd. (5.1 km), Somalia Drive linking the Freeport of Monrovia to Red Light (13.2 km), Kolahun junction to Vahun to Bomaru road, and Kaweaken to Barclayville road (86km). These roads constitute segments of a vital transport artery linking the country, from Harper to Ganta to Monrovia and across to the border with Sierra Leone. The Liberian government is working to secure funds for outstanding segments that will boost the domestic economy

9
and enhance international trade. The government is also rehabilitating the symbolically important Caldwell Bridge (385 ft.).
Water and Sewerage Services
In 2013, the Liberia Water and Sewer Corporation’s overall coverage decreased by 17.6 percent compared to 2012, with its business and family customers decreasing by 11.8 percent and 21.8 percent respectively compared to 2012. This can be attributed to the 87.7 percent increase in the cost per cubic meter of water.
Transport Services
The number of registered vehicles in 2013 amounted to 33,309, representing an increase of 13.7 percent over the number of registered vehicles for 2012. The most notable increase in registration was motorcycles at 231.3 percent. The most notable decrease occurred with respect to the Gratis (NGO) registration which fell by 33.9 percent. There were 15,972 driver’s licenses issued in 2013 - representing a decrease of 23.2 percent as compared to that of 2012.
Energy Generation and Distribution
The government of Liberia has made significant strides in increasing access to energy. With the Liberia Accelerated Electricity Expansion Project (LACEEP), the government has concluded plans to expand 66 KV lines from Paynesville to Kakata. Consequently, the distribution chain will commence from Duport Road North through Soul Clinic, Pipeline Road, Mount Barclay, and Careysburg up to 15th Gate Community, with further expansion from Kakata up to Weala in Margibi County.
The GoL has also garnered support for the West Africa Power Pool (WAPP – CLSG) project along with Côte d’Ivoire, Sierra Leone and Guinea. Partners supporting this project – namely World Bank International Development Assistance (IDA), the African Development Bank (AfDB), KFW, and the European Investment Bank – are providing resources for construction of a 225 KV transmission line. The transmission lines run from Mahn, Ivory Coast to Yekepa for onward transmission to N’Zerekore in Guinea and Bo Waterside in Sierra Leone. Through the WAPP cross border electrification project, 33km of lines have been constructed to supply power to 18 communities in Nimba, Grand Gedeh and Maryland Counties.
The government in 2013 made payments toward Liberia’s capital contribution and Resettlement Action Plan (RAP) compensation to ensure the effective implementation of WAPP.
The government also commenced the rehabilitation of the Mt. Coffee Hydroelectric Power Plant, which will provide an additional 80 Mega Watts (MW) when completed, and made disbursements towards the government funded 10 MW Heavy Fuel Oil (HFO) Plant project.
Other energy projects include the 10MW HFO Plant sponsored by the Japan International Cooperation Agency (JICA), and the World Bank’S US$10 million 10MW HFO Plant, both of which will be installed at the Liberia Electricity Corporation (LEC) Bushrod Island Site. Also included is the ELTEL Accelerated Transmission and Distribution (T&D) Project, which involves rehabilitation of four substations, construction of distribution lines from downtown Monrovia up to Sinkor 20thStreet, and installation of 66KV lines between Capitol Hill and Paynesville Substation as well as New Kru Town Substation. The project will connect 6,000 new consumers to the national energy grid. The Liberian Government in September 2013 signed a line of credit agreement in the amount of US$144 million with the Indian Exim Bank for a Transmission and Distribution project from Ganta to Kakata and Buchanan.

10
FISCAL SECTOR DEVELOPMENTS
FY2012/13 saw the successful execution of the first year of the Medium Term Expenditure Framework (MTEF) budget process, with the FY2013/14 budget now building on the successes and lessons learned. Crucially, the MTEF process and other improvements in Public Financial Management have allowed the government to focus resources on priorities linked to the Agenda for Transformation, including energy and road projects.
Revenues have increased from US$148.5 million in FY 2006/2007 to a projection of US$582 million in FY 2013/2014, although recent revenue performance has fallen short of projections, which has had an adverse effect on expenditure execution.
In May 2013 the Central Bank of Liberia, began the issuance of Liberian-Dollar denominated Treasury Bills (T-bills). These T-bills will be used in the short run to manage revenue volatility and, in the longer run, to expand the money market and provide an additional policy instrument to manage Liberian dollar liquidity. Between L$81 million and L$228 million (US$1 million and US$3 million equivalent, respectively) 91-day T-bills were issued in each month from May through December 2013, at record low interest rates averaging 2.06 percent.
MONETARY SECTOR DEVELOPMENTS
The Central Bank of Liberia (CBL) maintained its monetary policy stance with the overarching goal of achieving overall price stability, stable exchange rate and promoting economic growth.
The dominance of the US dollar in the Liberian economy continues to pose significant challenges for the formulation and implementation of monetary policy. In 2013, monetary policymakers heavily relied on the use of foreign exchange reserves to stabilize the exchange rate in order to achieve the objective of price level stability, though this was complemented by the issuance for the first time of CBL bills (short term debt instruments) and the easing of the reserve requirement for US dollar deposits.
During the course of 2013 the Liberian Dollar depreciated against the US Dollar, alongside currencies in a number of other low-income and emerging markets, including South Africa, Nigeria and Ghana. Partly due to the high demand for foreign exchange needed for rising imports payments for goods and services, the average Liberian dollar exchange rate depreciated by 4.6 percent to L$80/US$1.00 at end September 2013 and by December 2013 the rate was L$87/US$1.00. In response, the CBL enhanced interventions through foreign exchange operations and commenced the issuance of CBL bills, and the Ministry of Finance engaged in a taxpayer education campaign to enhance Liberian Dollar revenue in order to reduce pressure on the exchange rate.
The Liberian Dollars in circulation as at end of September 2013 totaled L$8.6 billion. The average savings deposit rate at the end of the third quarter showed a year-on-year decrease by 4.3 percent compared to the same period in 2012. Over the course of 2013, up to end-September 2013, the average lending rate decreased by 70 basis points. Commercial banks credit to major sectors of the economy at end September 2013 amounted to L$25.6 billion, a 39 percent increase on than that recorded at the end of the same period in 2012. The increase in credit to important sectors of the economy supports a deepening of financial services and is expected to expand economic activities.
11
EXTERNAL SECTOR DEVELOPMENTS
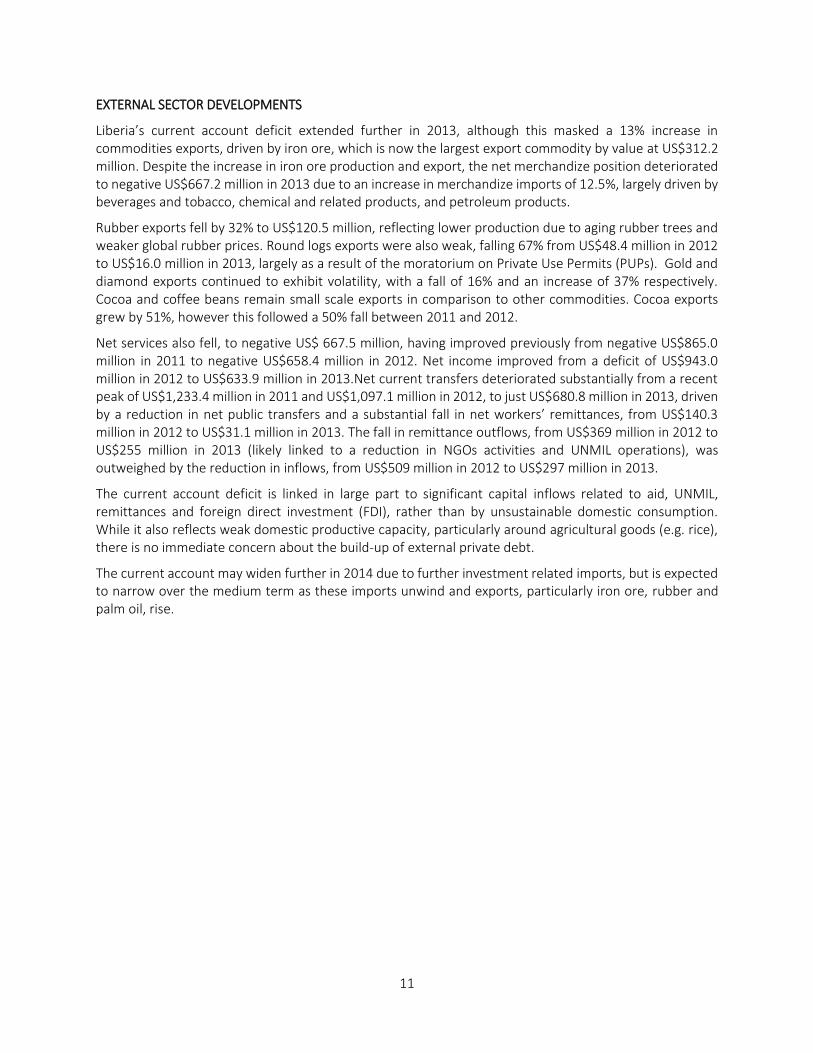
Liberia’s current account deficit extended further in 2013, although this masked a 13% increase in commodities exports, driven by iron ore, which is now the largest export commodity by value at US$312.2 million. Despite the increase in iron ore production and export, the net merchandize position deteriorated to negative US$667.2 million in 2013 due to an increase in merchandize imports of 12.5%, largely driven by beverages and tobacco, chemical and related products, and petroleum products.
Rubber exports fell by 32% to US$120.5 million, reflecting lower production due to aging rubber trees and weaker global rubber prices. Round logs exports were also weak, falling 67% from US$48.4 million in 2012 to US$16.0 million in 2013, largely as a result of the moratorium on Private Use Permits (PUPs). Gold and diamond exports continued to exhibit volatility, with a fall of 16% and an increase of 37% respectively. Cocoa and coffee beans remain small scale exports in comparison to other commodities. Cocoa exports grew by 51%, however this followed a 50% fall between 2011 and 2012.
Net services also fell, to negative US$ 667.5 million, having improved previously from negative US$865.0 million in 2011 to negative US$658.4 million in 2012. Net income improved from a deficit of US$943.0 million in 2012 to US$633.9 million in 2013.Net current transfers deteriorated substantially from a recent peak of US$1,233.4 million in 2011 and US$1,097.1 million in 2012, to just US$680.8 million in 2013, driven by a reduction in net public transfers and a substantial fall in net workers’ remittances, from US$140.3 million in 2012 to US$31.1 million in 2013. The fall in remittance outflows, from US$369 million in 2012 to US$255 million in 2013 (likely linked to a reduction in NGOs activities and UNMIL operations), was outweighed by the reduction in inflows, from US$509 million in 2012 to US$297 million in 2013.
The current account deficit is linked in large part to significant capital inflows related to aid, UNMIL, remittances and foreign direct investment (FDI), rather than by unsustainable domestic consumption. While it also reflects weak domestic productive capacity, particularly around agricultural goods (e.g. rice), there is no immediate concern about the build-up of external private debt.
The current account may widen further in 2014 due to further investment related imports, but is expected to narrow over the medium term as these imports unwind and exports, particularly iron ore, rubber and palm oil, rise.

12
1. INTRODUCTION
This report covers key achievements made during the course of 2013 and measures progress against the baseline established in the 2012 Economic Review. The report has slightly expanded in scope and focus as a result of changes in data availability. The completion of the Establishment Survey in 2013 and the commencement of the Household Income Expenditure Survey in January 2014 by LISGIS is expected to significantly contribute to improved data in the near-term, particularly the government’s ability to construct accurate national accounts (required to re-estimate GDP). As data availability and quality improves this will be reflected in future Economic Reviews.
The report focuses on:
The real sector - agriculture and fisheries, forestry, mining and commerce, and industry;
The social services sector - the activities of institutions providing basic social services such as health and sanitation, education, electricity generation and distribution, water and sewage, transportation and the government’s priority projects;
The fiscal sector - the central government operations;
The monetary sector - the changes in interest and inflation rates as well as other monetary developments; and
The external sector - the country’s trade performance and changes in the balance of payments.
The review of social conditions and living standards has selected a few specific variables – from education levels to road completion – to present a picture of the changing living conditions in Liberia. This is a sample of information available intended to provide some overview of the situation. Fiscal data up to quarter 2 of fiscal year 2012/13 is recorded by the Ministry of Finance and the Central Bank, with most data now being captured on automated systems – increasing the accuracy and speed of data access.
This report is not intended as a policy document; it merely sets out the current economic conditions and highlights some areas of growth and potential risks to the economy. The Ministry of Finance would like to thank the Central Bank, Ministries and Agencies and donor partners for their efforts in data provision.

13
2. GLOBAL ECONOMIC DEVELOPMENTS AND OUTLOOK
According to the IMF World Economic Outlook, in 2013 the global economy grew at a rate of 3.0 percent, slightly lower than the 3.1 percent estimate for 2012. This slower global growth is attributed to weaker output in emerging and developing economies, despite the fact that advanced economies have made modest relative gains.
Advanced Economies grew by 1.3 percent in 2013, down from 1.4 percent in 2012. The growth has occurred largely on account of the ease of fiscal consolidation in the USA coupled with the country’s accommodative monetary policy; this resulted in a gradual recovery of the housing sector, easier bank lending conditions and increased borrowing. Owing to the gradual recovery of the US economy coupled with the increased business confidence in the Euro Area, global output for 2014 is projected to grow by 3.7 percent.
Emerging and Developing Economies expanded by 4.7 percent in 2013 as compared to 4.9 percent in 2012. This relatively slower output growth can be attributed to tightening capacity constraints in emerging and developing economies, stabilizing or falling commodity prices which are the major exports of emerging and developing economies. However, growth in emerging and developing economies is projected at 5.1 percent in 2014.
Of the emerging and developing economies, output in Sub-Saharan Africa (SSA) expanded by 5.1 percent in 2013 as compared to 4.8 percent in 2012. Growth in SSA is projected at 6.1 percent in 2014 and 5.8 percent in 2015.
Table 1 provides a comparative analysis of economic growth rates for selected West African countries.
In 2013, world trade volumes increased by 2.9 percent as compared to 2.7 percent in 2012. A more optimistic forecast projects world trade volumes to increase by 4.9 percent in 2014.
Imports of advanced economies increased by 1.5 percent in 2013 as compared to 1.0 percent in 2012 while imports of emerging and developing economies increased by 5.0 percent in 2013 as compared to 5.5 percent in 2012. However, going forward into 2014, imports of advanced economies are projected to increase by 4.0 percent while imports for emerging and developing economies are projected to increase by 5.9 percent.
On the other hand, exports of advanced economies expanded by 2.7 percent in 2013 as compared to 2.0 percent in 2012 while exports of emerging and developing economies increased by 3.5 percent in 2013 as compared to 4.2 percent in 2012. For 2014, exports of advanced economies have been projected to increase by 4.7 percent as compared to 5.8 percent for emerging and developing economies.
Oil prices decreased by 0.5 percent in 2013 as compared to an increase of 1.0 percent in 2012 while prices for non-fuel commodities decreased by 1.5 percent in 2013 as compared to a decrease of 9.9 percent in 2012. For 2014, oil prices are projected to decrease by 3.0 percent while non-fuel prices are projected to decrease by 4.2 percent.
Consumer prices in advanced economies increased by 1.4 percent in 2013 as compared to 2.0 percent in 2012 while in emerging and developing economies, consumer prices increased by 6.2 percent in 2013 as compared to 6.1 percent in 2012. For 2014, consumer prices are projected to increase by 1.8 percent and 5.7 percent respectively for advanced economies and emerging and developing economies.

14
3. DOMESTIC MACROECONOMIC DEVELOPMENTS
From 2006 to 2013, the Liberian economy grew on average by 8.0 percent per annum. In 2013, Liberia’s real Gross Domestic Product (GDP) is estimated to have grown by 8.1 percent, slightly
lower than the 8.3 percent growth recorded in 2012. Real GDP is expected to grow at 5.9 percent in 2014. Table 1 provides trends in Liberia’s real GDP growth rate.
TABLE 1: COMPARATIVE GDP GROWTH RATES FOR SELECTED WEST AFRICAN COUNTRIES
2006 2007 2008 2009 2010 2011 2012 2013 2014 Cote D’Ivoire 0.7 1.6 2.3 3.8 2.4 -4.7 9.8 8.0 8.0 Ghana 6.1 6.5 8.4 4.0 8.0 15.0 7.9 7.9 6.1 Guinea 2.5 1.8 4.9 -0.3 1.9 3.9 3.9 2.9 5.2 Liberia 8.9 13.2 6.2 5.3 6.1 7.9 8.3 8.1 6.8 Niger 5.8 0.6 9.6 -1.0 10.7 2.2 11.2 6.2 6.3 Nigeria 6.2 7.0 6.0 7.0 8.0 7.4 6.6 6.2 7.4 Sierra Leone 4.2 8.0 5.2 3.2 5.3 6.0 15.2 13.3 14.0 Source: World Economic Outlook, October 2013
Liberia’s strong economic performance over preceding years is attributed to the revitalization of economic activities, including from 2011 resumption in iron ore production, and expansion of the construction and services sectors. As a result of the economic expansion, there has been a concomitant rise in government revenue, which increased the fiscal space and enabled the Government to expand the provision of basic social services and fund public sector investment projects (PSIPs), especially infrastructure.
The growth in the mining sector is expected to continue in the medium-term, particularly with the commencement of iron ore exports by China Union and the ramping up of production by Acerlor Mittal, facilitated by government efforts to unlock bottlenecks to concession production.
In 2013, the mining sector accounted for 10 percent of GDP. During the same period, non-resource real GDP grew by 5.2 percent; a
downward revision of the previous estimates due to the sluggish pace of implementation of public investment projects which were in part due to delays in the passage of the National Budget by the Legislator.
In 2006, the Ellen Johnson-Sirleaf led Administration inherited an economy that was hugely driven by activities in the agricultural sector. Since 2006, the Liberian economy has undergone considerable transformation. Over time, there has been a shift in focus from agriculture towards service-led growth. In 2013, the services sector contributed around 42 percent of GDP, while agriculture, fisheries and forestry contributed around 35 percent. The main activities within this sector include trade and hotels, government services, real estate, transportation, communication and construction.

15
3.1 DOMESTIC DEVELOPMENT STRATEGY
Liberia’s domestic development strategies are outlined in two prominent documents; the Agenda for Transformation (AfT) and the Liberia Rising 2030. The AfT is the country’s five-year development plan which serves as a platform for achieving the objectives of the country’s long-term development plan – Liberia Rising 2030. The AfT focuses on investment in five strategic pillars intended to increase productivity, boost economic growth, and improve social inclusion, particularly among the youth. The pillars are:
Peace, Security and the Rule of Law;
Economic Transformation;
Human Development;
Governance and Public Institutions; and
Cross-cutting Issues.
To achieve the objectives of the Agenda for Transformation, the Government continues with the implementation of the Medium Term Expenditure Framework (MTEF). To ensure that key policy objectives are successfully implemented, the Government formulated fiscal rules which are being implemented to guide Government spending of revenue and its borrowing.
3.2 ECONOMIC CHALLENGES
Despite the macroeconomic stability that has prevailed and the successes in supporting the private sector to date, a number of challenges are facing the Liberian economy, including negative demand-shocks related to UNMIL drawdown, difficulties in achieving high rates of public capital expenditure and constraints to business investment and productivity, such as access to finance.
In 2006 agriculture was the largest contributor to GDP. Over time this has shifted towards the services sector, which in 2013 accounted for 42% of GDP, up from 22% in 2006. It is likely that UNMIL and NGOs consume a large proportion of this service sector output. As such, the UNMIL draw-down and arguably lower levels of NGO activity are thought to be causing a slowdown in domestic demand for services – with a corresponding impact on employment and secondary effect on economic activity.
The government is committed to increasing capital expenditure to meet the infrastructure deficit in line with the Public Sector Investment Plan, However, finding the fiscal space to achieve this continues to prove challenging. Government headcount/employees and recurrent spending has continued to rise quickly, with unclear outputs and benefits for the Liberian economy. Headcount has increased from around 38,800 in
FY1983/1984 to 45,600 in FY2006/2007 and 50,500 in FY2012/2013.
As a result, resources available for capital expenditure as part of the PSIP have come under pressure as large recurrent budgets use up resources that could otherwise have gone towards investment projects. In addition, both recurrent and capital expenditure is focused on using foreign rather than local firms and goods and services, leaving government as a weak driver of demand for Liberian products and services.
Although the current binding constraint to private sector investment (and through this, sustainable economic growth) has been identified as infrastructure – particularly energy and roads – and is now a focus of government capital expenditure, access to finance is also likely to be a major barrier to private investment. A significant percentage of Liberian businesses face difficulties in gaining access to finance from financial institutions owing to stringent requirements, including the lack of collateral. Moreover, the tenor of loans provided by financial institutions are relatively short, meaning that businesses may be unable to invest in long-term projects and instead invest in risky short-term projects that may increase the likelihood of loan default and business bankruptcy.

16
3.3 REMOVING BOTTLENECKS TO CONCESSIONAIRES
In order to achieve the growth trajectory necessary for achieving Vision 2030, during 2013 the government made significant efforts to expand the private sector and more importantly to remove the bottlenecks to concessionaires.
The Ministry of Finance facilitated a national dialogue between key ministries, government agencies, NGO’s and concessionaires to remove bottlenecks to production and exportation timelines. These actions could increase capital investment by approximately $7.5 billion, boost tax revenue collection by approximately $400 million per annum, and enhance employment by approximately 80,000-90,000 jobs in the next 10-15 years.
Major strides have been taken to resolve the infrastructure, bureaucratic and community
interest issues facing concessionaires across the board (mining, forestry and palm oil industries) via numerous roundtable discussions between relevant government stakeholders and concessionaires.
In the mining sector, through an inter-Ministerial effort, GoL successfully settled the housing unit issue with China Union, paying US$4 million to former Bong Mines workers and approximately $500,000 to resettle squatters. This enabled China Union to reach its intended production capacity and exportation timeline. Concerned about the slowdown in exports, GoL has targeted logistical bottlenecks in the forestry sector and is signing memorandums with forestry companies, authorizing them to rehabilitate primary roads in exchange for clearance of their tax arrears.
3.4 FISCAL RULES
3.4.1 EXPENDITURE
In the formulation of the 2012/13 and 2013/14 National Budgets, the Government crafted a set of fiscal rules to help guide spending and ensure it is in line with the Government’s priorities. These rules are as follow:
Twenty-five (25) percent of the Budget should be on investment, of which, at least ten (10) percent should be expenditure on the energy sector (i.e. at least 2.5 percent of the Budget);
No more than thirty-four (34) percent of the Budget should be on personnel costs;
At least twenty-five (25) percent of the Government spending should be on Goods and Services provided by Liberian businesses;
At least twenty-five percent of Government spending on furniture should be from capable local manufacturers;
Transfers from investment to recurrent should be no more than five (5) percent of M&A investment appropriations in a given year; and
No more than fifteen (15) percent of capital projects should be administrative overheads.

17
3.4.2 BORROWING
Following the completion of the Heavily Indebted Poor Countries (HIPC) debt relief program in 2010, and the corresponding forgiveness and write-down of around US$4.5 billion debt, the Government put in place fiscal rules as part of the FY2012/2013 and FY2013/2014 Budgets to guide borrowing and ensure that future borrowing is undertaken with fiscal prudence and sustainability in mind:
All borrowing must be undertaken for the purposes of investment, consistent with the Public Sector Investment Plan (PSIP);
Total debt stock must not exceed sixty (60) percent of the given calendar year’s
GDP as contained in the PFM regulations (2009);
Prior to new borrowing being undertaken, a Debt Sustainability Analysis (DSA) must be carried out and presented to the Debt Management Committee (DMC) to ensure debt rules are not breached; and
Individual loans are governed by rules stating that concessional loans are those with a grant element of above thirty-five (35) percent.
3.5 MONETARY POLICY
The Central Bank of Liberia seeks to support macroeconomic and financial stability by formulating and implementing policies geared towards:
Promoting, achieving and maintaining price level stability in the Liberian economy;
Maintaining constant regulatory surveillance and effective prudential controls over the domestic financial sector while at the same time encouraging competition, improving financial services and accessibility for the benefit of the public;
Encouraging the mobilization of domestic as well as foreign savings and
their efficient allocation for productive economic activities to engender sustained economic growth and development;
Facilitating the creation of financial and capital markets that are capable of responding to the needs of the national economy;
Fostering monetary, credit and financial conditions conducive to orderly, balanced and sustained economic growth and development; and
Providing sound economic and financial advice to the Government.

18
4. REAL SECTOR DEVELOPMENTS
Growth in the real sector of the economy has historically been, and remains, driven by concession activities in the agriculture and mining sectors and, more recently, activities in the services sector. Small household farming and artisanal mining activities as well as commercial activities in urban and semi-urban areas by
retailers and other service providers—mainly in Monrovia and a few satellite cities around the country—serve as key contributors to the output of the national economy. This section provides highlights of the major activities ongoing in this sector of the economy for the period under review.
4.1 AGRICULTURE
Agriculture contributes significantly to export trade and earnings and it serves as a major source of livelihood for a significant proportion of Liberia’s population. Based on estimates from the 2008 National Population and Housing Census, about 53 percent of Liberia’s population lives in rural areas of which 70 percent of those who are economically active are engaged in agricultural activities. However, this sector is characterized by the lack of modern technology which means that traditional subsistence farming is prevalent. The most dominant production method of farming in Liberia is slash and burn coupled with mixed crop farming. Other sources of agricultural output for Liberia are commercial and concessional farming.
Agriculture contributed 35 percent of Liberia’s Gross Domestic Product in 2013 with the food crops sub-sector being the most dominant component of the agricultural sector while rubber is the most dominant cash crop produced in Liberia.
Rice is Liberia’s staple food followed by cassava. In 2012, rice production decreased by 2.4 percent compared to 2011; this can be attributed to the increased importation of rice. Cassava production, however, increased significantly, potentially due to the fact that cassava to some extent serves as a substitute for rice.
Looking at a selection of agriculture specific revenue lines (excluding income taxes) shows that revenues generated from the agricultural sector decreased by 10.8 percent between FY2011/12 and FY2012/13 due to a fall in taxes received from levies on exported goods.
TABLE 2: 2013 AGRICULTURAL OUTPUT (US$)
COMMODITY 2011 2012 Cassava 51,500 500,000 Rice, Paddy 298,000 291,000 Sugar Cane 265,000 265,000 Bananas 125,000 127,000 Vegetables, Fresh 84,300 85,000 Rubber, natural 63,000 63,000 Plantains 46,500 47,000 Oil, Palm 42,000 43,500 Taro (cocoyam) 27,000 27,500 Maize, green 23,000 24,500 Sweet potatoes 22,000 23,000 Yams 21,000 21,500 Cocoa, beans 11,700 12,000 Meat indigenous, Chicken 11,421 12,000 Palm kernels 11,000 11,581 Meat indigenous, Pig 9,720 9,800 Oranges 8,000 8,500 Pineapples 8,000 8,250 Meat, game 8,000 8,000 Coconuts 6,500 6,600 Source: Food and Agriculture Organization

19
TABLE 3: REVENUES FROM THE AGRICULTURE SECTOR
4.1.1 DONOR FUNDED PROJECTS IN AGRICULTURE
According to the Global Hunger Index, Liberia remains a highly food insecure country. In an effort to contribute to food security and poverty reduction in Liberia on a sustainable basis, the government along with its international development partners have launched and implemented a number of agricultural projects, detailed below.
TABLE 4: DONOR-FUNDED PROJECTS IN THE AGRICULTURE SECTOR
PROJECT NAME FUNDING TYPE PROJECT COST (US$ MILLION)
PROJECT DURATION
Agriculture Sector Rehabilitation Project (ASRP-AfDB)
Grant 18.30 2010 - 2015
Agriculture Sector Rehabilitation Project (ASRP-IFAD)
Grant 5.00 2010 - 2013
Smallholder Tree Crop Revitalization Support Project (STCRSP-IFAD)
Loan 24.90 2012 - 2017
Smallholder Tree Crop Revitalization Support Project (STCRSP-IDA)
Grant & Loan 23.10 2013 - 2017
West African Agricultural Productivity Project (WAAPP-Liberia) IDA & Japanese Trust Fund)
Grant (Japanese Trust Fund) & Loan (IDA)
14.60 2012 - 2017
Agriculture Infrastructure Development Project (AIDP- IDA)
Grant 8.00 2007 - 2014
Enhancing Resilience to Climate Change by Mainstreaming Adaptation Concerns into Agricultural Sector (GEF-UNDP)
Grant 2.58 2012 - 2016
Smallholder Productivity Enhancement and Commercialization Enhancement (SAPEC) Project (IDA-AfDB)
Grant (GAFSP/WB) & Loan (AfDB)+J8
54.40 2013 - 2018
West Africa Regional Fisheries Project (WARFP) Grants (IDA and GEF) 14.00 2010 - 2014
(Phase I)
Total Resource Mobilized 164.88
Source: PMU, Ministry of Agriculture
4.1.2 AGRICULTURAL CONCESSIONS
Foreign investment in the agricultural sector has increased tremendously since 2006. To date, agricultural concessions cover an operational area
of 1,140,408 hectares. The major cash crop being grown by agricultural concessions are rubber and oil palm.
(US$ '000s) FY11/12 FY12/13
Taxes on export 493 256
Social devt contributions 50 57
Surface rental 450 574
Royalties / fees 0 0
Sign-on bonus 0 0
Total 993 886
Source: Ministry of Finance Note: Figures for selected revenue lines only

20
TABLE 5: AGRICULTURAL CONCESSIONS OPERATING IN LIBERIA
Concession Location Sub-Sector
Libinc Oil Palm Grand Bassa Oil Palm
Equatorial Palm Oil Grand Bassa Oil Palm
Liberia Forest Inc./LFPI (EBF) Sinoe Oil Palm
Decoris Maryland Oil Palm
Golden Veroleum Sinoe Oil Palm
Sime Darby Cape Mount Oil Palm & Rubber
Firestone Plantation Company Margibi Rubber
Salala Rubber Corporation Margibi Rubber
Liberia Agriculture Company Grand Bassa Rubber
Maryland Oil Palm Plantation Maryland Oil Palm
Sinoe Rubber Corporation Sinoe Rubber
Cavalla Rubber Corporation Maryland Rubber
Liberia Company Nimba Rubber
Source: Revenue Department/MOF; MOA
4.2 FORESTRY SUB-SECTOR
Liberia is endowed with a vast and diverse forestry resource which in the past has contributed significantly to economic growth and development. However, a significant challenge facing the forestry sector in the past has been the lack of capacity to manage the resources in a
sustainable manner as most of the forest revenue was used to fund the country’s civil war. This resulted into the imposition of a sanction on timber exports by a resolution of the United Nations.
TABLE 6: LAND USE RIGHTS
Land Use Rights Actually issued
(hectares) Potential to be issued
(hectares) Agricultural Concessions 1,140,408.00 1,140,408.00
Forest Management Concessions (FMC)
1,007,266.00 2,270,097.00
Timber Sale Contracts (TSC) 65,000.00 230,000.00
Community Forest Management Agreements (CFMA)
126,785.00 194,102.00
Mining Concessions 113,256.00 113,256.00
Private Use Permits 2,239,630.00 2,239,630.00
Protected Areas 193,932.00 1,037,865.00
Total 4,886,277.00 7,225,358.00
% of Liberian Land Mass 50.95 75.33 Source: Land Rights, Private Use Permits and Forest Communities; a Land Commission Report
With the ushering in of a democratically elected government in 2006, a Forest Concession Review was conducted to assess the state of the country’s forest concessions, the outcome of which revealed that all forest concessionaires were in
gross violation with the government’s logging regulations and that the total arrears in forest charges amounted to US$64 million. This prompted the issuance of Executive Order #1 in 2006 declaring all existing forest contracts null
21
and void thus setting the basis for the conduct of a forestry reform. In 2006, a new National Forest Reform Law was passed and in 2007 a Forest Strategy was developed.
Based on the new National Forest Reform Law and the Forest Strategy, forest resource licenses were characterized into the following:
Forest Management Contract (FMC): which is granted to forest concessionaires for an operational period of twenty-five years and covers an operational area of around 50,000 to 400,000 hectares excluding private land;
Timber Sale Contract (TSC): which is granted for an operational period of three years and covers an operational area not exceeding not 5,000 hectares and excluding private land;
Private Use Permit (PUP): this is granted to private landowners (individual, group and community) for the purpose of extracting wood. However, there is no specific regulation for handling PUPs thus all PUPs operations are currently suspended;
Forest Use Permit (FUP): this is a forest license issued for small scale forest exploitation, research, NTFP activities or other uses with no detail on land size or land ownership type; and
Community Forest Management Agreement (CFMA): this is a license issued to communities for the purpose of community based forest management and covers an operational area of less than 50 hectares.
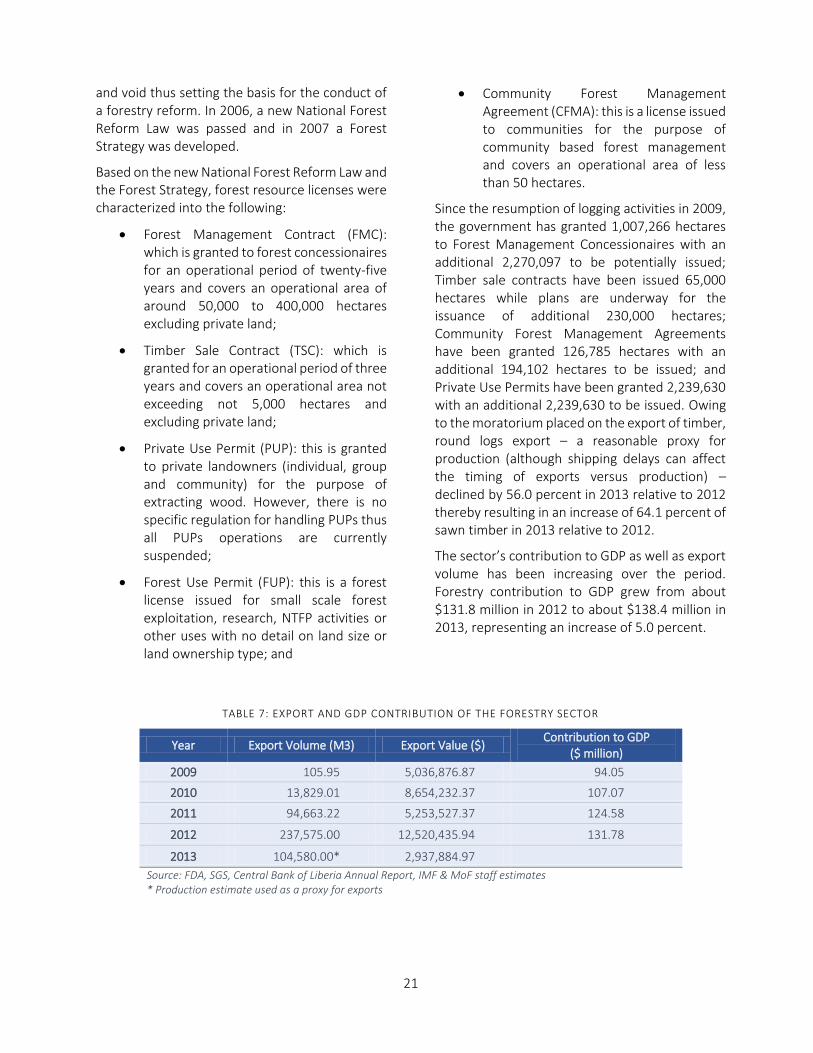
Since the resumption of logging activities in 2009, the government has granted 1,007,266 hectares to Forest Management Concessionaires with an additional 2,270,097 to be potentially issued; Timber sale contracts have been issued 65,000 hectares while plans are underway for the issuance of additional 230,000 hectares; Community Forest Management Agreements have been granted 126,785 hectares with an additional 194,102 hectares to be issued; and Private Use Permits have been granted 2,239,630 with an additional 2,239,630 to be issued. Owing to the moratorium placed on the export of timber, round logs export – a reasonable proxy for production (although shipping delays can affect the timing of exports versus production) – declined by 56.0 percent in 2013 relative to 2012 thereby resulting in an increase of 64.1 percent of sawn timber in 2013 relative to 2012.
The sector’s contribution to GDP as well as export volume has been increasing over the period. Forestry contribution to GDP grew from about $131.8 million in 2012 to about $138.4 million in 2013, representing an increase of 5.0 percent.
TABLE 7: EXPORT AND GDP CONTRIBUTION OF THE FORESTRY SECTOR
Year Export Volume (M3) Export Value ($) Contribution to GDP
($ million)
2009 105.95 5,036,876.87 94.05
2010 13,829.01 8,654,232.37 107.07
2011 94,663.22 5,253,527.37 124.58
2012 237,575.00 12,520,435.94 131.78
2013 104,580.00* 2,937,884.97
Source: FDA, SGS, Central Bank of Liberia Annual Report, IMF & MoF staff estimates * Production estimate used as a proxy for exports

22
Over the course of FY 2012/13, the forestry specific revenues collected from the forestry sector (excluding income taxes) amounted to US$6.6 million, down from US$8.46 million for FY 2011/12, representing a decrease of 22.0 percent.
This fall in revenues from the forestry sector came from lower receipt of export taxes and can be attributed to the poor transport infrastructure affecting the industry.
TABLE 8: REVENUES FROM THE FORESTRY SECTOR
FORESTRY (US$ '000s)
FY11/12 FY12/13
Taxes on export 2,896.77 24.80
Social development contributions 0.00 0.00
Surface rental 982.21 1,571.30
Royalties / fees 4,577.00 4,998.97
Sign-on bonus 0.00 0.00
Total 8,455.97 6,595.07
Source: Ministry of Finance Note: Figures for selected revenue lines only
4.3 COMMERCE AND INDUSTRIES
As the economy continues to diversify, commercial and industrial activities have shown remarkable improvement in the country. In 2013, of the total number of registered businesses in the economy, Liberian-owned businesses accounted for 84.0 percent while foreign owned businesses accounted for 16.0 percent.
Corporations and branches of corporations accounted for 35.3 percent of the registered businesses in Liberia in 2013 of which Liberian-owned businesses accounted for 73.9 percent
while foreign owned businesses accounted for 26.1 percent.
Partnerships and branches of partnership accounted for 6.0 percent of the registered businesses in 2013 of which Liberian-owned partnership accounted for 48.1 percent while foreign-owned partnership accounted for 52.05 percent.
Sole proprietorships accounted for 58.7 percent of the registered businesses in 2013 of which 93.7 percent while foreign-owned sole proprietorships accounted for 6.3 percent.
TABLE 9: BUSINESSES OPERATING IN LIBERIA
Business Category FY 2012 – 2013
Liberian owned Foreign owned Total
Corporations 2,174 646 2,820
Branches of corporations 391 262 653
Partnerships 220 215 435
Branches of partnerships 64 92 156
Sole proprietorships 5,406 362 5,768
Total 8,255 1,577 9,832 Source: Revenue Department, MOF

23
4.3.1 OUTPUT OF THE INDUSTRIAL SECTOR
Liberia’s industrial sector is characterized by light manufacturing. In 2013, cement production increased 49.5 percent. This can be attributed to an increase in activities within the construction sector over the course of 2013.
In 2013, beverages production increased slightly by 4.1 percent. This can be attributed to the increased importation of beverages which serve as substitute for locally produced beverages.
Despite the rapid increase in activities within the construction sector, paint output over the course of 2013 declined by 40.1 percent compared to 2012. The decrease in paint output can in part be attributed to depreciation in the Liberian dollar/US dollar exchange rate which has resulted into the decline in the paint input imports.
Candle production over the course of 2013 declined by 45.3 percent as compared to 2012. This can be attributed to the increased expansion of coverage by the Liberia Electricity Corporation in Monrovia and its environs and in Ganta coupled with the increased use of dry cell lamps.
Chlorox production over the course of 2013 increased by 19.9 percent as compared to 2012; this is linked to the expansion of activities within the services sector as Chlorox is used for hygiene purposes.
In 2013, rubbing alcohol production increased by 14.7 percent as compared to 2012. This may be linked to an increase in demand for the commodity as a result of increased activities in the health sector.
Mattress production in 2013 declined by 7.3 percent as compared to 2012.
Gold production over the course of 2013 declined by 6.4 percent as compared to 2012; this can be attributed to a fall in the global demand for the commodity as the global economy stabilizes owing to the fact that gold is used as a store of value. However, diamond production over the course of 2013 increased by 29.4 percent as compared to 2012; this can be attributed to an increase in the global demand of diamonds.
Iron ore production over the course of 2013 increased by 98.3 percent as compared to 2012; this can be attributed to rapid mechanization of the mining sector.
Finished water production over the course of 2013 increased by 3.3 percent in 2013 as compared to 2012; this can be attributed to an increase in production of beverages and an expansion of activities within the services sector.
TABLE 10: INDUSTRIAL OUTPUT
Commodity
Unit 2011 2012 2013
Cement Mt. 80,594 121,592 181,829
Beverages Liter 30,503,151 28,099,740 29,239,260 Paints Liter 295,179 354,005 212,226
Candle Kg. 442,575 299,229 163,682
Chlorox Liter 694,593 681,160 816,800
Rubbing Alcohol Liter 221,184 198,620 227,901
Mattresses Pcs. 142,000 108,667 100,704 Gold Ounce 14,427 20,609 19,298
Diamond Carat 39,866 34,271 44,334
Iron Ore Mt. 386,968 2,369,850 4,698,281
Finished Water Gallon 930,159,178 1,752,158,793 1,809,781,771
24
4.4 MINING AND PETROLEUM
Mining is a significant sector to the Liberian economy based on the fact that the country is endowed with vast amount of metallic and non-metallic minerals. Liberia’s abundant mineral resources include gold, diamond, iron ore and oil. Since the cessation of hostilities, the country has succeeded in attracting massive foreign direct
investment particularly in the iron ore sector in the tune of US$7.6 billion. This has resulted into the granting of concession agreements to 6 iron ore mining companies, 17 gold and diamond mining companies and petroleum exploration rights to 10 companies. Mining concessions cover an operational area of 113,256 hectares.
TABLE 11: MINERAL EXPLORATION AND MINING COMPANIES OPERATING IN LIBERIA
Petroleum Companies
Oranto Petroleum Woodside West Africa Repsol Exploracian
Woodside West Africa Regal Liberia and European Anadarko Liberia
Oranto Petroleum and Chevron Repsol Exploracian CNOOC International
Broadway Consolidated
Iron Ore Mining Companies
Arcelor Mittal BHP Billiton China Union
Western Cluster Putu Iron Ore Mining
Gold and Diamond Mining Companies
Amlib, Inc. Ascension Resource Corp Hummingbird Resources Inc.
Gold Investment Limited Belle Resources Ltd/SAMLEC Superior Minerals Resources, Inc.
Explorex Oversea, Ltd International Business Exchange Shankil Resources (Liberia) Inc.
Gryphon Minerals Limited Konblo Bumi, Inc. Pedra Mining Corporation
African Gold Mining (Lib) Jamu Resource Incorporated Pedra Mining
Archean Gold Thackett Mining Inc. Middle Island Resources-(Lib)
Source: Revenue Department, MOF
The mining sector’s contribution to the Liberian economy continues to grow. Export earnings from the mining sector in 2013 amounted to US$351.2 million up from US$155.8 million the previous year, representing an increase of 125.4 percent. This has enabled the government to collect more revenues from the sector. In FY 2012/13, government revenues on mining specific tax lines (excluding income taxes) amounted to US$23.4 million, up from US$11.7 million in FY 2011/12, thus representing an increase of 99.8 percent.
For FY 2012 – 2013, mineral royalties accounted for 21.9 percent of the total revenues from the mining sector; surface rental, 7.5 percent; sign-on bonuses, 2.6 percent; and revenues from the mining sector intended for social development, 29.2 percent.
Petroleum sector revenue on petroleum specific tax lines (excluding income taxes) contributed US$58.1 million for FY 2012 – 2013 as compared to US$1.42 million for FY 2011 – 2012.

25
TABLE 12: REVENUES FROM THE MINING SECTOR
Mining (US$ '000s) FY11/12 FY12/13
CIT mining 0.00 0.70
Social development contributions 10,134.00 11,149.00
Surface rental 2,322.00 2,859.96
Royalties 3,932.00 8,367.40
Fees 0.00 67.48
Sign-on bonus 1,400.00 1,000.00
Other (e.g. transfers) 0.00 14,775.00
Total 17,788.00 38,219.55 Source: Ministry of Finance Note: Figures for selected revenue lines only
TABLE 13: REVENUES FROM THE PETROLEUM SECTOR
Petroleum (US$ '000s) FY11/12 FY12/13
CIT petroleum 0.0 162.7
Social development contributions 0.0 8.7
Surface rental 1,418.7 1,500.0
Royalties 0.0 0.0
Sign-on bonus 0.0 0.0
NOCAL 0.0 11,416.9
Other (e.g. transfers) 0.0 45,000.0
Total 1,418.7 58,088.2
Source: Ministry of Finance Note: Figures for selected revenue lines only
4.5 SOCIAL AND BASIC SERVICES
4.5.1 EDUCATION
Education is essential for developing the necessary human capital needed for maintaining and sustaining rapid economic growth and development. Realizing this potential benefit, the government has placed education as a high priority issue along with its development partners. Investment in the sector is intended to increase classroom infrastructure as well as to increase the knowledge and skills of teachers. This is consistent with the 2009 Education Sector Plan, the five-year (2012-2017) Medium Term Plan for Education Reform and Development in Liberia, the Education Reform Act of 2011 and
the draft Technical and Vocational Education and Training (TVET) Policy of 2011. The aim of the government investment in education is five-fold:
To ensure equitable access to free basic education for all children and youth, including the most marginalized in society;
To improve quality, relevance and accessibility of secondary, tertiary, vocational/technical education programs and to alternative basic education programs for out-of-school adolescents and youth;
26
To efficiently strengthen educational services and information management at the national level with focus at the community level;
To improve Parent Teacher Associations (PTA) and national oversights, standards and coordination to ensure quality education; including non-government early child care and development (ECCD) programs for children aged 0 to 5 years; and
To increase the numbers of and improve competencies of teachers in formal schools and alternative basic education programs.
Key achievements recorded in the educational sector in 2013 are:
Successful implementation of an Education Management Information System (EMIS) data collection for the period 2012/2013 that compiles education statistics, personal listings and GIS school verification;
Construction, including the furnishing and equipping with all needed furniture and
equipment, of County Education Offices and Learning Resources Centers in four counties (Bomi, Grand Cape Mount, Gbarpolu and Margibi);
Provision of School Grants for School based management and strengthening of school administrations across the country;
Construction of eight new primary schools in Rivercess, Nimba, Maryland, Lofa, Grand Cape Mount and Gbarpolu and one combined primary and junior high school in Grand Cape Mount. Moreover, thirty-three out of forty schools were renovated in Rivercess, Sinoe, Nimba, Montserrado, Grand Gedeh, Bong and Bomi; and
Development of a diagnostic report on higher education resulting in the formulation of a five-year Higher Education Strategic Plan (HESP) to guide the sector and the decentralization of education. Thus the Grand Gedeh Community College was established with 65 percent of construction work on facilities completed.
4.5.2 HEALTH AND SOCIAL WELFARE
Good health is an important development outcome, with improved health care delivery services bringing broader benefits, including enhanced economic development.
Health impacts economic growth by reducing production losses due to worker illnesses, increasing the productivity of adult as a result of better nutrition, lowering absenteeism rates and improving learning among school children. Moreover, it permits for the use of natural resources that used to be totally or partially inaccessible due to illness and the different use of financial resources that might normally be destined for the treatment of ill health.
The Ministry of Health and Social Welfare in 2011 published the National Health and Social Welfare Policy and Plan 2011-2021 which sets the sector strategy for 2012-2017 and beyond. Consistent
with the strategy, the goal of the heath sector is to improve the health and social welfare status of the population of Liberia on an equitable basis by means of a three-pronged strategic objective:
Increasing access to and utilization of quality health and social welfare services to be delivered to communities endowed with the necessary resources and offering a comprehensive package of interventions of proven effectiveness;
Ensuring that health and social welfare services are more responsive to people’s needs, demands and expectations by transferring management and decision making in order to lower administration levels thus ensuring a fair degree of equity;
27
Ensuring that health care and social protection available to all of Liberia’s population, regardless of an individual’s position in society, at a cost that is affordable to the country.
Combined efforts by the government and its development partners to improve the country’s health systems have resulted in:
An increase in the percentage of deliveries assisted by skilled birth attendants;
An increase in the number of families with access to family planning;
An increase in the percentage of children under the age of one year who received DPT3/pentavalent-3 vaccination;
An increase in the out-patient-delivery (OPD) consultations per inhabitant per year;
An increase in the percentage of pregnant women provided with second dose of IPT for malaria;
An increase in the percentage of pregnant women testing HIV+ that are receiving ARV prophylaxis to reduce mother-to-child-transmission (MTCT);
A reduction in the number of smear positive TB cases notified per 100,000 population;
An increase in the number of skilled birth attendants (physicians, nurses, midwives and physician assistants) per 10,000 population;
An increase in the percentage of facilities with no stock-out of tracer drug during the period (amoxicillin, cotrimoxazole, paracetamol, ORS, iron folate, ACT and FP commodity).
The Malaria Control Program successfully distributed 1,000,000 long lasting mosquito nets to the general population and pregnant women attending antenatal clinics in six counties. Moreover, an in-door spraying exercise of 40,000 rural households along with an awareness campaign on malaria prevention and distribution
of tracer drugs to all public health facilities was conducted during the period under review.
In an attempt to improve the eye sight of the citizenry, 23,959 persons were provided health services with respect to cataract surgery, trauma, glaucoma, refractive error and other eye condition while 5,711 persons were provided mental health services to treat anxiety disorder, mood disorder, impulse control, substance abuse, etc.).
In an attempt to increase the expansion of health services so as to improve access to the delivery of under skilled birth attendants for pregnant women with poor geographic access,
Three maternal waiting rooms and four maternal wings were constructed at various health facilities;
Five microscopic laboratories were constructed in five counties;
Eight incinerators were constructed to improve waste management and sanitation at eight health facilities;
Four clinics and one health center constructed;
Two staff housing at health facilities were constructed;
Finalized infrastructure design work for the National Drug Services (NDS) central warehouse;
Installed 53 solar panels at health facilities in six counties and
Developed a national Health Infrastructure Policy.
In an effort to build the much needed capacity in the health sector, 22 international scholarships along with 257 local scholarships were provided to students at various universities and health training institutions. Training initiatives undertaken during the period included:
The launch of the Post Graduate Residency Program which resulted into the training of 19 residents in the areas of general surgery,

28
obstetrics and gynecology, internal medicine and pediatrics;
Supported 20 employees to acquire additional skills and knowledge at the Liberia Institute of Public Administration (LIPA)
Deployed graduates of the A.M. Dogliotti College of Medicine to be trained in basic surgical emergencies in 6 hospitals for subsequent assignment in county hospitals
Integrated EPSS and EPHS by training 28 social workers in new EPSS services in 2 counties
Launched of Promise Renewed initiative in line with international “Child Survival Call to Action”
Provided 83 orphanages and 3,357 orphans with support
Developed a concept paper to initiate national health insurance to jumpstart universal health coverage; health and social protection for all.
Six counties contracted-in for the delivery of health and social welfare services in line with Ministry’s decentralization plan.
TABLE 14: HEALTH INDICATORS
Outcome Indicators Baseline
2012 Achievement
2013 Target 2021
Percentage of deliveries assisted by skilled birth attendant 44 50 80 Couple-years protection with family planning methods 54,414 70,034 N/A Percentage of Children under one year who received DPT3/pentavalent-3 vaccination
80 90 90
OPD consultations per inhabitant per year 0.94 1.04 2 Percentage of pregnant women provided with 2nd dose of IPT for malaria
37 45 80
Number of pregnant women testing HIV+ and receiving ARV prophylaxis to reduce the risk of MTCT
990 2,987 TBD
Number of smear positive TB cases notified per 100,000 population
114 104 127
Number of skilled birth attendants (physicians, nurses, midwives and physician assistant)/10,000 population
6.7 7.02 14
Percentage of facilities with no stock-out of tracer drugs during the period (amoxicillin, cotrimoxazole, paracetamol, ORS, iron folate, ACT, FP commodity)
62.3 70 95
4.5.3 PRIORITY INFRASTRUCTURE PROJECTS
Investment in infrastructure is a critical step towards generating and sustaining rapid economic growth and development. Infrastructure provides services that support economic growth by increasing the productivity of factor inputs (specifically labor and capital) in the production process thereby reducing the costs of production and raising profitability, production, income and employment.
Realizing the critical role infrastructure plays in the economy, the Government developed the Agenda for Transformation (AfT), Liberia’s poverty reduction strategy, which identifies the government’s priority projects, a large portion of which cover infrastructure development. The total cost of implementing the AfT is estimated at approximately US$3.2 billion over the five-year period (2012-2017); the Government has

29
succeeded in mobilizing over US$2 billion in committed financing for the AfT, including US$114 million of its own resources through the Public Sector Investment Plan (PSIP) and US$393 million from borrowing. During the period under review, in an attempt to finance the AfT, donors have disbursed US$673,824,913 while the government under its PSIP has disbursed US$100,120,870. Figure 1 below provides details
on the sectorial distribution of the AfT disbursements and the funding gap.
Notably, the needs of the energy and environment sector under the AfT have been met by commitments from government and donors; however, due to the infrastructure needs of the country, a significant funding gap, estimated at US$825 million, remains in the infrastructure sector.
FIGURE 1: SECTORAL DISTRIBUTION OF THE AGENDA FOR TRANSFORMATION FUNDING
Source: Liberia Development Alliance, Ministry of Finance
The country’s priority infrastructure projects are classified into three categories as shown in Table 15. Funding for Category I projects, which cost US$1.33 billion, has been secured, feasibility studies completed, and some of the projects are currently being implemented. With respect to Category II projects, which cost US$486 million, feasibility studies have been completed, however, funding is still lacking. Finally, Category III projects, which cost US$705 million, are those projects whose feasibility
studies are yet to be conducted and for which funding is also lacking.
A good and reliable road network is vital for Liberia’s economic growth and development. Roads are essential in that they enhance accessibility to markets and services. Hence, there is a strong positive correlation between a country’s economic development and the quality of its roads. In 2013, the government made significant efforts aimed at improving the road network in the country. Prominent of the road network projects initiated during the course of 2013 are provided in Table 16.

30
TABLE 15: PRIORITY INFRASTRUCTURE PROJECTS
CATEGORY I CATEGORY II CATEGORY III
ENERGY
Mt. Coffee Hydro
HFO (GOL)
HFO (JICA)
HFO (World Bank)
Paynesville-Kakata (T&D)
ENERGY
Monrovia – RIA-Firestone (T&D)
Monrovia-Tubmanburg (T&D)
Monrovia Consolidation
ENERGY
VIA Reservoir
ROADS & BRIDGES
Paynesville-Ganta-Guinea Border
Fish Town – Harper
Ganta-Yekepa (AML)
Somalia Drive- Red Light
Caldwell Bridge
Zwedru-Greenville (PUTU)
ROADS & BRIDGES
Gbarnga – Voinjama-Mendikorma (Lot 1)
Ganta – Zwedru-Fishtown
ROADS & BRIDGES
Bo waterside
AGRICULTURE
West Africa Agricultural Productivity Program (WAAPP)
Smallholder Tree Crop Revitalization Support Project (STCRSP)
Smallholder productivity enhancement project (SAPEC)
PORTS
RIA Runway
Greenville Port (wharf etc.)
TABLE 16: ROADS - WORK UNDERWAY
Road Network Type Of Road
Kolahun Junction – Vahun Rehabilitation Laterite Bong Mines – Kakata Asphalt Bopolu – Belleyallah Rehabilitation Laterite Mt. Coffee Access Road Rehabilitation Laterite Redlight – Gbarnga – Guinea Border Asphalt Compound #1 – Buchanan Rehabilitation Asphalt Shufflin – Marshall Road Asphalt Caldwell – Louisiana Road Rehabilitation Asphalt Claratown Road Rehabilitation Asphalt Jamaica Road Rehabilitation Asphalt A.B. Tolbert – Duport Road Rehabilitation Asphalt SKD Boulevard Road Rehabilitation Asphalt Duport Road – Soul Clinic Road Rehabilitation Asphalt Logan – Duala Bye Pass Road Rehabilitation Asphalt Sinkor Streets Road Rehabilitation Asphalt Barnesville Road Rehabilitation Asphalt Somalia Drive Road Rehabilitation Asphalt Police Academy Road Rehabilitation Asphalt
The Ministry of Finance through the Liberia Development Alliance (LDA) tracked the implementation of AfT projects and it was

31
revealed that of the 26 projects tracked, two were considered problematic, eleven were delayed and thirteen were satisfactory thus representing an overall performance rate of about 50 percent. Significant progress was recorded in the implementation of roads and energy projects. Prominent among these projects was the ground breaking on the Mt. Coffee Power Plant, the commencement of pavement works of the Red Light – Ganta Highway and the Fishtown – Harper Highway. Of the 180.36 km of road from Red Light to Ganta, 11.5 km has been completed and Resettlement Action Plan (RAP) payment amounting to US$2,386,177.43 has been effected for a total of 48 – 180 km. Moreover, rehabilitation of the 68.61 km Gbarnga to Ganta to Guinea border has also commenced. The Government of Liberia has committed efforts aimed at improving the road network. Several roads in the country are under construction and/or rehabilitation. These roads include:
The 12km Caldwell to Louisiana road;
The 5.1 km SKD Blvd road which is being upgraded to a 4-lane asphalt paved road;
The 2.8 km Police Academy Road which links SKD Blvd to Greater Paynesville community via Police Academy Community;
The 6.6km AB Tolbert Road to Duport Road which links ELWA Junction to the Duport River via the A. B. Tolbert road through Greater Paynesville and Duport Road;
The 4.2 km Duport to Soul Clinic through Zayzay Community Road;
The 1.1 km Jamaica road which links the Jamaica road to the Somalia and UN Drive;
The 1.6 km Clara town road;
The 4 km Logan Town to Mombo Town Road;
The rehabilitation of the 13.2 km Somalia Drive road that links the Freeport of Monrovia to Redlight;
The rehabilitation of the Kolahun junction to Vahun to Bomaru road; and
The rehabilitation of the 86km Kaweaken to Barclayville road.
The construction of bridges completed during 2013 includes:
Sanquin River bridge (220 ft.);
Mechlin River bridge (290 ft.);
Klay Bridge (48 ft.);
Guie Town Bridge (60 ft.);
Konola Bridge (75ft);
Caldwell Bridge (385 ft.).
The safety of the following bridges was re-assessed:
Nyanforlah Bridge (150 ft.)geotechnical investigation completed, demolition of existing bridge pier completed, works on construction of new abutments to commence in 2014;
The Lofa River bridge (645 ft.);
The Gabriel Tucker bridge, and
The Timbo river bridge.
Hence improvement in the road network will enhance accessibility to social infrastructure (schools, churches, mosques and health centers), increase access to education and health facilities, improve social interaction and mobility thereby improving access to markets through the reduction in transport costs and improving the marketability of perishable goods through timely and affordable transportation. The supply side benefits of an improved road network include reduced vehicle operating costs, savings in travel time, reduced accident costs resulting from the upgrading of roads and possible savings in maintenance costs as these roads are bound to withstand harsh weather if they are well maintained.
4.5.4 WATER AND SEWERAGE SERVICES

32
The growth in Liberia’s population has adversely impacted on the domestic supply of water and sanitation services. Access to safe drinking water and basic sanitation services positively impact on people thereby leading to significant social, economic and environmental benefits. As of 2013, an estimated 63 percent of the population now has access to protected water resources which consists mainly of wells, boreholes with hand pumps, springs and harvested water. Despite these gains, only a third of the population has access to water resources with adequate yield all year round with an estimated 63 percent of households storing water in open containers. With respect to sanitation, 25 percent of households (53 percent urban and 17 percent rural) have access to improved sanitation. However, there is a prevalence of high open defecation (77 percent of rural households and 30 percent of urban households) and the lack of solid waste disposal or sewerage systems, poor drainage and poor disposal of garbage. This prompted the government along with its development partners to focus on the water and sanitation sector with the intent of increasing access to safe water supply and sanitation and improve hygiene practices with the objectives of:
Managing, expanding and sustaining Liberia’s WASH services through a clear, functional and inclusive WASH governance structure and with strengthened operational guidelines, training and financing;
Expanding equitable access to environmentally-friendly and sustainable water, sanitation services and solid waste management – including for the poorest and most vulnerable communities;
Increasing safe hygiene practices (e.g., hand washing and reduced open
defecation) and strengthening community organizations and schools;
Improving WASH sector capacity and engagement with stakeholders and strengthening WASH monitoring and information management systems.
Given these objectives, the following interventions were made within the sector during the period under consideration:
Developed and published the WASH Sector Investment Plan;
Developed and published the WASH Sector Capacity Development Plan;
Supported 20 employees to acquire additional skills and knowledge at the Liberia Institute of Public Administration (LIPA);
Deployed graduates of the A.M. Dogliotti College of Medicine to be trained in basic surgical emergencies in 6 hospitals for subsequent assignment in county hospitals;
Integrated EPSS and EPHS by training 28 social workers in new EPSS services in 2 counties;
Launched of Promise Renewed initiative in line with international “Child Survival Call to Action”;
Provided 83 orphanages and 3,357 orphans with support;
Developed a concept paper to initiate national health insurance to jumpstart universal health coverage, health and social protection for all.
Six counties contracted-in for the delivery of health and social welfare services in line with Ministry’s decentralization plan.
TABLE 17: WATER AND SEWER DEVELOPMENTS IN LIBERIA FOR 2013
Description Years
2010 2011 2012 2013

33
Cost of cubic meter of water per business customer (US$) 2.06 2.06 2.11 3.96
Total number of business customers 1,099 574 630 556
Total number of family customers 3,014 3,218 3,474 2,716
SEWER (Special Sewer Customers) 725 871 840 869
DESLU (Desludging Customers) 2 2 3 3
KIOSK (Community Stand Pipe) 101 92 93 4
BUSD (Demand Business Customers) 6 6 4 4
WTBS (Water Trucking Customers) 8 8 7 12
Total Coverage of LWSC Services 5,855 4,771 5,051 4,164 Source: Liberia Water and Sewer Corporation
Over the course of 2013, Liberia Water and Sewer Services coverage decrease by 17.56 percent relative to 2012. Moreover, its business and family customers decreased by 11.75 percent
and 21.82 percent respectively as compared to 2012. This can be attributed to an increase (87.68 percent) in the cost of cubic meter of water.
4.5.5 TRANSPORT SERVICES
Transport occupies a central role in the Liberian economy; as it connects employees with places of work, people seeking for leisure activities, resources with centers of production and products with markets and consumers. In so doing, transport is an enabler of economic and social activities and supporting economic growth and development.
Over the course of 2013, the number of registered vehicles amounted to 33,309, representing an increase of 13.73 percent over the number of registered vehicles for 2012.The increase in vehicle registration can be attributed to an increase in economic activities and incomes. The most notable increase in registration were motorcycles, 231.34 percent and others, 3,626.7 percent while the most notable decrease occurred with respect to the Gratis (NGO) registration which represents a decrease of 33.9 percent. The sharp decrease in gratis vehicle registration can be attributed to the winding down of NGO activities as the country stabilizes.
In 2013, 15,972 driver’s licenses were issued thereby certifying the holders to operate vehicles
and motorcycles in the country. Compared with 2012, this represents a decrease of 23.2 percent. This can be attributed to huge drops in chauffeur (43.6 percent), Heavy duty (62 percent) and motorcycle (77.8 percent) operating licenses issuance.
TABLE 18: REGISTERED VEHICLES
TABLE 19: DRIVER'S LISCENSES ISSUED
4.5.6 ENERGY GENERATION, TRANSMISSION AND DISTRIBUTION
CATEGORY 2012 2013
Business 6,262 6,837 Commercial 5,649 6,036 Private 11,396 10,352 Gratis (NGO) 2,298 1,519 Motorcycles 1,640 5,434 Others 30 1,118 TOTAL 29,287 33,309 Source: Ministry of Transport
CATEGORY 2012 2013
Ordinary 13,416 11,007 Chauffeur 4,973 2,807 Heavy Duty 361 137 Motorcycle 36 8 TOTAL 20,798 15,972
Source: Ministry Of Transport

34
Electricity plays a vital role in the socio-economic development of a nation. As both agricultural and industrial activities increase, the demand for energy similarly increases. Thus the Government has identified the provision of a greater access to energy as an important step to grow the Liberian economy and improve the living standard of the people. As a consequence, progress is being made to provide energy to as many customers as possible. In 2013, the total number of power subscribers amounted to 18,510 which represent
a 38.68 percent increase over the 2012 customer base. The increase was attributable to the streamlining of processes at the Liberia Electricity Corporation which resulted in the creation of an electronic database. Moreover, to reduce operating cost and delinquency payment, the prepaid metering system was introduced. The total benefit of these reforms has seen an increase of 14.53 percent in total kilo-watt-hour (KWH) supplied in 2013 as compared to 2012.
TABLE 20: ELECTRICITY INDICATORS BETWEEN 2010 AND 2013
Description Years
2010 2011 2012 2013
Total Number of Customers 2,423 5,313 13,347 18,510 Total KWH of Power Supplied 29,513,390 38,848954 48,670932 55,741,648 Unit Cost of Power (US$) 0.53 0.56 0.60 0.55 Demand Forecast (%) 31.63 25.28 14.52 Source: Liberia Electricity Corporation
Achieving nation-wide access to electricity is a major priority for the government. Access to electricity is particularly important to human development as sustainable provision of electricity can free large amounts of time and labor and promotes better health and education. Hence the government, along with its development partners, has committed resources towards the rehabilitation of the Mt. Coffee power plant and the importation of electricity from the Ivory Coast. More than 95 percent of the Liberian population lack access to electricity, while electricity connectivity in rural Liberia is non-existent. Currently, access to the national power grid is restricted to a few communities in Monrovia and Ganta. The Connected Communities In Monrovia are Bushrod Island, Buzzi Quarter, Clara Town, Congo Town,
Gardnersville, Jamaica Road, Logan Town, Monrovia, New Kru Town, New Port Street, Paynesville, Point Four, Sinkor, Slipway, St. Paul Bridge, Vai Town And West Point while the connected community in Ganta is Ganta city. Currently, all of the LEC subscribers are prepaid.
Table 21 provides a categorization of the LEC power subscribers.

35
TABLE 21: LEC CUSTOMER SEGMENTATION
Customer Segmentation
Years
2010 2011 2012 2013 Residential 1,136 2,854 82 77 Commercial 1,152 2,213 114 113 Government of Liberia 97 109 123 135 Non-Governmental Organization 21 36 5 5 Public Corporation 6 6 5 8 Liberia Electricity Corporation 7 8 7 7 Tax Exempt 2 2 2 4 Prepaid Customers 2 86 13,009 18,161 TOTAL 2,423 5,313 13,347 18,510 Source: Liberia Electricity Corporation
TABLE 22: MONTHLY KWH OF POWER SUPPLIED
Month
Years 2010 2011 2012 2013
January 2,316,642 2,481,210 4,477,582 4,417,098 February 2,237,887 2,517,349 4,234,777 4,354,292 March 2,632,610 2,859,134 4,297,688 5,059,622 April 2,471,904 3,159,134 4,024,182 5,123,560 May 2,437,682 3,347,588 3,824,321 4,587,759 June 2,195,848 2,865,927 3,600,823 4,641,655 July 2,321,005 3,108,954 3,322,665 4,185,494 August 2,342,260 3,228,708 3,549,647 4,374,340 September 2,418,193 3,227,842 4,073,176 4,304,428 October 2,672,148 3,641,757 4,516,546 4,713,158 November 2,717,218 4,093,742 4,261,433 4,864,219 December 2,749,993 4,317,609 4,488,092 5,116,023 TOTAL 29,513,390 38,848,954 48,670,932 55,741,648 Source: Liberia Electricity Corporation
The cost of generating power in Liberia is astronomically high as Liberia’s power tariff is three times that of the regional average. Hence to ensure greater access to electricity, the government has decided to subsidize the cost of
generating electricity. This, coupled with the introduction of the prepaid metering system has resulted into a reduction in the unit cost of power from US$0.60 per KWH in 2012 to US$0.55 per KWH in 2013.
TABLE 23: BREAKDOWN OF THE UNIT COST OF POWER
Description 2010 2011 2012 2013 Fuel Adjustment Cost (FAQ) 0.04 0.07 0.11 0.00 Tariff 0.42 0.42 0.42 0.48 Goods & Services Tax (GST) 0.07 0.07 0.07 0.07 Unit Cost of Power 0.53 0.56 0.60 0.55
Source: Liberia Electricity Corporation

36
The Government has made significant strides in increasing access to energy. By means of the Liberia Accelerated Electricity Expansion Project (LACEEP), the government has concluded plans to expand 66 KV lines from Paynesville to Kakata. Thus the distribution chain will commence from Duport Road North through Soul Clinic, Pipeline Road, Mount Barclay, and Careysburg up to 15th Gate Community with further expansion from Kakata up to Weala, Margibi County. Moreover, by means of the West Africa Power Pool (WAPP – CLSG), the government along with the European Union and the Government of Ivory Coast, plans to import 225 KV of energy from Mahn – Ivory Coast to Yekepa for onward transmission to N’Zerekore in Guinea and Bo Waterside in Sierra Leone. Of the 1,349 KM of transmission lines intended to supply power to 18 communities in
Nimba, Grand Gedeh and Maryland Counties, 33 KV of lines have been constructed.
Other energy projects include the JICA-10 Mega Watts (MW) Heavy Fuel Oil (HFO) Plant which is intended to build a 10 MW HFO Plant at the Bushrod Island Site of the Liberia Electricity Corporation; the World Bank (WB) $10 million project which will deliver a 10 MW HFO Plant at LEC Bushrod Plant Site, the ELTEL Accelerated transmission and distribution (T & D) Project which involves four substations rehabilitation; distribution lines construction in downtown Monrovia up to Sinkor 20thStreet; installation of 66KV lines between Capitol Hill and Paynesville Substation as well as New Kru Town Substation. The project will see the connection of 6000 new consumers.
5. FISCAL SECTOR DEVELOPMENTS
5.1 FISCAL OVERVIEW
Increasing economic activity has enabled the GOL to collect more revenues and increase the fiscal space in order to provide basic social services in education, health and to make public sector investments in infrastructure development. With the continuation of the MTEF budgeting process, the Government has been able to focus resources on crucial infrastructure projects, that is, the Public Sector Investment Projects (PSIPs), including the rehabilitation of the Mt. Coffee Hydro Dam, construction of HFO plants and construction and maintenance of roads and bridges..
Public Financial Management Reforms continue to remain a focus of the Ministry of Finance, with key milestones in 2013 including:
Completed the Medium Term Debt Strategy for FY 2013-2016, with it now pending approval by the Debt Management Committee;
Commenced the pilot of monthly sweeping of idle balances in ministries and agencies accounts into the consolidated account in
advance of daily sweeping commencing in 2014;
IFMIS rolled out to additional ten (10) Ministries and Agencies. To date, nineteen (19) entities to which IFMIS has been rolled out cover 62% of the approved national budget for 2013/14;
Continued biometric registration of all employees of government on a phased basis in an attempt to clean the payroll of ghost names and to determine the actual labor force of government;
Ratification of the Liberia Revenue Authority Act; and
The SIGTAS core module for Small Taxpayers went live: Payments for 18 Withholding Taxes configured, 7 Corporate Income Tax (CIT) tax types, Personal Income Tax (PIT), Excise, Goods and Services Tax (GST), GSM gross margin and Business registration fee for all small taxpayers are now being processed using this module.

37
5.1.1 REVENUE
Revenues have increased from US$148.5 million in FY 2006/2007 to a projection of US$582 million in FY 2013/2014. Figure 2 provides trends in the GOL revenue.
Revenues have been consistently increasing since FY 2006/2007 averaging about 18.5 percent over
the period under review, driven by tax revenue (as opposed to non-tax revenue and grants). Tax revenues over the corresponding period have increased from US$82.0 million in FY 2006/2007 to US$380.0 million for FY 2012/2013, averaging about 17.7 percent.
FIGURE 2: TRENDS IN THE GOL REVENUE
Source: Department of Revenue, Ministry of Finance
5.1.2 EXPENDITURE
Expenditures on the other hand have increased from US$135.0 million in FY 2006/2007 to US$593.48 million for FY 2012/2013; representing an average increase of 21.9 percent and reflecting the government’s prudent use of domestic and external financing. Figure 3 provides trends in the GOL expenditures.
Expenditures can be classified as either productive or non-productive. Productive expenditures are mainly the expenditures, for example, on infrastructure development and the real sectors (e.g. energy, agriculture). The non-productive expenditures include expenditures
such as foreign travels, vehicle maintenance and public administration. Productive expenditures have increased from US$45.49 million in FY 2006/2007 to US$507.5 million (inclusive of expenditures by both the GOL and Donor partners as of FY 2009/2010) in FY 2012/2013, while non-productive expenditures have increased from US$89.3 million in FY 2006/2007 to US$509.5 million (inclusive of expenditures by both the GOL and Donor partners as of FY 2009/2010) in FY 2012/2013. Figure 4 provides trends in productive and non-productive expenditures overtime.

38
FIGURE 3: TRENDS IN GOL EXPENDITURES
Source: Ministry of Finance
FIGURE 4: TRENDS IN EXPENDITURES ON PRODUCTIVE AND NON-PRODUCTIVE SECTORS
Source: Ministry of Finance
5.1.3 GOL TREASURY BILLS
The Government of Liberia, through the Central Bank of Liberia, began the issuance of Treasury Bills (T-Bills) in early March 2013 as part of the process to manage revenue volatility in the short run and, in the longer run, expand the money market and further provide an additional policy instrument to manage Liberian dollar liquidity.
The T-Bills auction is limited to financial institutions and currently there is one bill type with a maturity of 91 days. As at 5 December 2013, 8 issues have been conducted, totaling L$1,077 million. The average discount rate over the 8 issue period was 2.06 percent.

39
TABLE 24: GOL TREASURY BILLS (MAY - DECEMBER 2013)
Auction # Date Maturity Date Value of T-Bill
(L$ million) Cut-off Interest
Rate Weighted Average
Discount Rate
8 5-Dec-13 4-Mar-13 81.0 2.55 2.07
7 8-Nov-13 7-Feb-14 160.0 2 1.62
6 3-Oct-13 2-Jan-14 79.5 2.05 1.96
5 5-Sep-13 5-Dec-13 77.5 2.15 2.01
4 1-Aug-13 7-Nov-13 149.0 2.33 2.04
3 4-Jul-13 3-Oct-13 153.0 2.55 2.29
2 6-Jun-13 5-Sep-13 228.0 2.89 2.31
1 2-May-13 1-Aug-13 149.0 3 2.19
Total/Average 1077.0 2.44 2.06
Source: CBL Quarterly Bulletin 2013, Ministry of Finance
5.2 FISCAL YEAR 2013/14
Fiscal year 2013/2014 marked the continuation of the implementation of the country’s Medium Term Expenditure Framework (MTEF) budget. The National Legislature approved a budget of US$582.9 million as compared to a revenue outturn of US$554.0 million for FY 2012/2013 and expenditure of US$593 million.
For the first two quarters of FY 2013/2014, actual revenues collected have consistently fallen below the projected amount. Preliminary revenue projections up to the end of the first two quarters amounted to US$269.6 million; however, actual revenue collected during the corresponding period amounted to US$251.1 million; representing a revenue shortfall of US$18.5 million.
TABLE 25: QUARTERLY REVENUE PERFORMANCE FOR FY 2013/2014
Category (US$m) FY 2013/2014
Approved Budget Q1
Proj. Q1
Actual Q2
Proj. Q2
Actual Total Q1
& Q2 Proj. Total Q1 & Q2 Actual
Grand Total Revenue 582.9 115.4 113.1 154.2 138.0 269.6 251.1
Total Core Revenue 572.9 115.4 107.6 154.2 138.0 269.6 245.6
Total Tax Revenue 433.8 102.4 93.2 110.6 87.9 213.0 181.1
Non-Tax Revenue 87.9 13.0 11.7 25.4 21.7 38.4 33.4
Grants 51.2 0.0 2.7 18.2 28.4 18.2 31.1
Borrowing 10.0 0.0 5.5 0.0 0.0 0.0 5.5
Source: Ministry of Finance
The tax revenue shortfall of US$31.9 million has been concentrated around the income, goods and services, and international tax lines. The latter two are thought to be driven by a weaker than expected domestic environment, which has resulted in less goods and services consumption, including of duty-paid imports. The income tax line has been affected by particularly low tax collection on non-residents, likely reflecting less foreign business activity.
Non-tax shortfalls of US$5 million have resulted from poor forestry royalties/rents and from slightly weak performance of administrative fees. Property income related to minerals has performed better than expected.
During the first two quarters of the FY 2013/2014 spending against the budget (including capital expenditure) amounted to US$210.5 million on a commitment basis and US$209.4 million on a cash basis.

40
TABLE 26: PRELIMINARY GFS TABLE FOR FY 2013/2014
Budget Commitment Cash
REVENUE 582.9 245.6 245.6 Tax 433.8 181.1 181.1 Non-Tax 87.9 33.4 33.4 Grants 51.2 31.1 31.1 Borrowing 10.0 0.0 0.0
EXPENDITURE 578.5 203.7 203.6 Compensation of employees 221.0 92.0 88.2 Use of goods and services 126.0 73.0 73.0 Interest 0.0 0.0 4.4 Subsidies 0.0 0.0 0.0 Grants 130.0 38.7 37.5 Social Benefits 7.4 0.5 0.5 National Claim 95.0 0.0 0.0
Sale of Non-Financial Assets 0.0 0.0 0.0 Acquisition of Non-Financial Assets 4.5 6.3 5.8
Spending on Capital 4.5 6.3 5.8 Source: Ministry of Finance
Over the years, the Liberian national budget has undergone significant structural transformation; from that of a four (4) sector budget to that of an eleven (11) sector budget. The objective of the reclassification of the budget was to enhance the GOL service delivery potentials. Table 27 provides information on the GOL disbursement for the first two quarters of FY 2013/14.
Of the US$582.9 million approved by the National Legislator for the administration of the affairs of the state, US$219.9 million was disbursed during the first two quarters of FY 2013/2014; thus representing a disbursement rate of 37.7 percent.
TABLE 27: CUMULATIVE MID-YEAR (FY2013/14) DISBURSEMENTS BY SECTOR
Appropriations (US$m)
Disbursements (US$m)
Agriculture 7.1 2.2 Education 69.7 33.4 Energy and Environment 16.4 7.0 Health 68.9 22.9 Industry and Commerce 20.9 10.5 Infrastructure and Basic Services 14.2 10.2 Municipal Government 29.7 6.2 Public Administration 148.4 74.9 Security and Rule of Law 77.4 35.2 Social Development Services 13.0 4.9 Transparency and Accountability 20.5 12.6 National Claims 96.7 0.0
TOTAL 582.9 219.9 Source: Ministry of Finance

41
5.3 TAX EXPENDITURES
This section assesses the costs, in terms of forgone revenues, of various tax provisions that provide tax breaks for certain taxpayers and activities. Tax expenditures are revenue losses attributable to tax provisions that often result from the use of the country’s tax system to promote social goals without incurring direct expenditures. Consistent with the Government of Liberia’s policy to promote private sector led growth and development, a tax expenditure of US$78.4 million in 2013 was incurred.
Table 28 provides information on monthly tax expenditures for 2013. The largest beneficiary of
the GOL’s tax expenditures is concession firms, accounting for US$24.6 million (31 percent) of the total tax expenditures for 2013. Other noticeable tax expenditures categories are: Diplomatic Missions, US$15.2 million (19.3 percent); petroleum products, US$11.4 million (14.5 percent); GOL Ministries and Agencies, US$10.6 million (13.5 percent); and Companies US$6.1 million (7.8 percent). Tax expenditures are volatile; analysis of the total amounts showed that they peaked in March 2013 before falling thereafter.

42
TABLE 28: MONTHLY TAX EXPENDITURES FOR 2013
Jan Feb Mar Apr May June July Aug Sept Oct Nov Dec
Concessions 1,444,739 1,703,634 5,564,073 2,417,886 2,428,339 2,067,764 1,522,837 2,654,490 655,535 1,069,748 1,448,443 1,630,481
Companies 492,091 437,727 546,400 248,682 401,196 1,382,454 892,595 357,120 432,127 322,541 328,887 299,047
Diplomatic Missions 869,388 559,626 1,890,192 2,037,026 1,121,242 587,419 1,156,682 2,135,602 725,176 1,891,590 584,015 1,605,792
GoL/Ministries & Agencies 1,011,093 646,401 944,763 845,613 1,278,953 1,031,309 402,898 820,679 281,201 892,364 1,616,046 843,328
International NGOs 78,620 165,767 96,863 52,219 216,714 179,854 158,429 243,782 115,385 137,606 229,801 128,806
Local NGOs 76,496 23,903 27,419 18,260 17,365 4,098 12,634 - 56,235 5,130 12,759 3,087
Public Corporation 55,840 12,404 25,363 37,859 83,211 30,162 96,714 69,997 18,947 96,084 18,194
Religious Institutions 28,056 19,180 39,897 21,079 28,806 26,260 15,240 21,440 18,548 43,549 3,428 10,572
Educational Institutions 28,418 153,401 6,375 33,344 6,525 2,378 - 5,431 11,549 2,979 1,480
Medical Institutions 27,955 59,535 2,732 28,081 28,978 98,388 5,536 40,624 13,616 18,490 3,144
National Legislators 27,802 52,368 60,939 42,672 20,738 17,425 24,072 61,180 28,841 62,136 33,536 38,930
Individuals/Returnees 17,133 1,252 43,506 23,525 17,411 47,832 37,245 17,850 35,767 26,642 42,531 37,347
Executive Order 387,109 161,415 134,488 2,164,335 - - - - - - - -
Embassies - - - - - - - - 1,134 1,373,856 969,851 45,813
Petroleum Products 742,531 931,893 1,069,287 112,442 1,189,853 2,645,695 914,781 830,256 855,300 764,500 729,830 593,450
Stimulus Act Section 16 - - - - - - - - - - - -
Amendment Act 1708 93,043 88,791 73,004 115,740 73,033 23,496 10,298 32,804 37,201 5,586 45,394 115,109
Refund Entry - - - - - - - - - - - 13,761
Local Government 194,746 3,893 18,466 - - - - - - -
5,575,062 5,021,189 10,525,302 8,198,764 6,930,831 8,142,156 5,252,339 7,285,825 3,280,443 6,721,371 6,068,840 5,367,004
Source: Ministry of Finance

43
6. MONETARY SECTOR DEVELOPMENTS
The Central Bank of Liberia (CBL) maintained its monetary policy strategy with the overarching goal of achieving overall price stability, a stable exchange rate and promoting economic growth.
In order to achieve this target, the CBL used its readily available policy instruments: foreign exchange interventions and reserve requirement for liquidity management purposes. The CBL, at instruction by the Ministry of Finance, launched an auction for Treasury bills (T-bills) in May 2013 in an attempt to deepen the country’s financial
market and provide a mechanism for smoothing government revenue. The CBL also commenced the issuance of CBL bills, identical in nature to Treasury bills, in order to help manage Liberian dollar liquidity in the economy.
In the future it is hoped that the Government’s Treasury bills and the CBL bills will become increasingly utilized for managing Liberian-dollar liquidity in order to control domestic inflation and stabilize the exchange rate.
6.1 MONETARY INDICATORS
This dominance of the US dollar in the Liberian economy continues to pose significant challenges for the formulation and implementation of monetary policy. Monetary policymakers most often rely on the use of foreign exchange reserves to stabilize the exchange rate in order to achieve its objective of price level stability.
The Central Bank of Liberia official international reserves amounted to US$276.8 million as at end July 2013, including the Special Drawing Rights (SDRs); it increased by 3 percent compared to end June of the same period. The reserves position as at end-June 2013 represents a decrease of 8 percent over the same period in 2012; see Error! Reference source not found..
FIGURE 5: CBL NET FOREIGN RESERVE POSITION, OCTOBER 2012- JULY 2013
Source: Central Bank of Liberia

44
The fall in the foreign exchange reserve is mainly due to the high demand for US dollar to meet the country’s voracious appetite for imported goods, in addition to the stimulus packages carried out by the CBL to boost small and medium enterprises (SMEs) development and support to a real estate mortgage scheme. The stimulus loan is a one-time payment, with expected repayment of 36 months commencing in FY 2012/2013.
The CBL is anticipating a stronger foreign exchange reserve position which will enable its
intervention in the domestic foreign exchange market in order to stabilize the exchange rate. Currently the Liberia dollar is depreciating against the US Dollars as are many currencies in emerging markets including South Africa, Nigeria and Ghana. As at end June 2013, the CBL intervened in the foreign exchange market through auctioning of US$26 million, a drop of 114 basis points from previous quarter ended March 2013 and an increase of approximately eight percent compared to the same period in 2012.
6.2 MONETARY AGGREGATES
6.2.1 LIBERIAN DOLLARS IN CIRCULATION
Liberian dollars in circulation as at end of September 2013 totaled L$8,513.8 million, representing an increase of 4.5 percent over the second quarter, end June 2013. The increase in the circulation of Liberian dollars is attributable to a 1.3 percent increase in currency outside the banking system from L$6,474.7 million at end-June, 2013 to L$6,558.9 million at end of September 2013. On the same note, currency in
banks increased significantly by 16.9 percent from L$1,672.5 at end June to L$1,954.9 at end September 2013. Comparing year-on-year, currency in circulation at end-September increased by 22.7 percent over the same period of 2012, driven mostly by a 24.1 percent increase in currency in banks.
TABLE 29: LIBERIAN DOLLAR CURRENCY IN CIRCULATION (L$)
(All figure are in Liberian dollars unless otherwise indicated)
2012 2013
End of period L$ in Banks L$ outside
banks L$ in
Circulation L$ in
Banks L$ outside
banks L$ in
Circulation
(in Millions of Liberian Dollars)
Quarter 1 1,245.3 6,094.3 7,340.0 1,525.2 6,672.4 8,197.6
Quarter 2 1,395.5 5,778.0 7,173.5 1,672.5 6,474.7 8,147.2
Quarter 3 1,575.7 5,364.1 6,939.8 1,954.9 6,558.9 8,513.8
Quarter 4 1,322.9 7,291.3 8,614.2 -
Percentage Change
2012 2013
Quarterly 12.9% -7.2% -3.3% 16.9% 1.3% 4.5%
Year-on-year, quarterly
Quarter 1 41.7% 28.9% 30.9% 22.5% 9.5% 11.7%
Quarter 2 93.1% 17.3% 27.0% 19.8% 12.1% 13.6%
Quarter 3 168.8% 4.7% 21.5% 24.1% 22.3% 22.7%
Source: Central bank of Liberia (Quarterly bulletin, 2013)

45
6.2.2 MONEY SUPPLY (M1)
Money supply (M1) amounted to L$ 33,648 million, representing a 1.6 percent increase over the L$33,117.7 million recorded at end-June, 2013. The expansion in money supply is mainly
due to larger portion of demand deposits, increasing by 1.7 percent over quarter two, end June 2013. The increase in inflation is evident by the increase in the money supply; see Table 30.
6.2.3 BROAD MONEY (M2)
Broad Money or M2 increased by 2.5 percent at end-September, 2013 to L$49,285 million from L$ 8,085.5 at end-June, 2013. The main drivers
for growth in broad money were M1, contributing 1.6 percent and quasi money, contributing 4.5 percent; see Table 30.
TABLE 30: LIBERIAN DOLLAR MONETARY AGGREGATES (L$)
Liberia: Monetary Survey and Aggregate, 2010-2013
2012 2013
2012 2013 2013 2013 % Change % Change Dec Q1 Q2 Q3 Q3 Quarterly
(In millions of Liberian Dollars; end of period)
Net foreign assets 25,418.7 23,822.0 24,080.7 20,476.0 -1.3% -15.0%
Central Bank 14,191.4 14,788.7 14,685.0 -3.1% -0.7%
Banking Institutions 9,630.6 9,292.0 5,791.0 1.8% -37.7%
Net domestic assets 19,670 22,470 24,005 28,809 5.8% 20.0%
Domestic credit 37,765 39,925 40,824 46,277 5.6% 13.4%
Claims on government (net) 15,577.7 17,168.3 15,143.8 16,750.0 6.4% 10.6%
Claims on private sector other public sector (net) 22,187.5 227,455.0 25,680.1 29,527.0 5.1% 15.0%
Claims on private sector
Other items net (assets +) …. …. …. 6.9% ….
Discrepancy (A/L) 0 0 0 0
Broad Money (M2) 45,089.1 46,292.1 48,085.5 49,285.0 1.7% 2.5%
Money Supply (Liberian dollar M1) 30,479.4 31,839.3 33,117.7 33,648.0 -3.0% 1.6%
Currency outside bank 7,291.3 6,672.4 6,474.7 6,559.0 -7.2% 1.3%
Total Liberian dollar deposits 37,797.8 39,619.7 41,610.8 42,726.0 3.1% 2.7%
Demand deposits 23,188.1 25,166.9 26,643.0 27,089.0 -2.0% 1.7%
US dollars savings deposits -4.9% ….
Liberian dollars time and savings deposits 23.4% ….
Quasi Money 14,609.7 14,452.8 14,967.8 15,637.0 13.2% 4.5%
Time and savings deposits 13,273.2 14,094.2 14,902.4 15,583.0 14.8% 4.6%
US dollars savings deposits 17.4% ….
Liberian dollars time and savings deposits 8.1% ……
Other deposits 1,336.5 358.6 65.4 54.0 -50.1% -17.4%
(in millions of U.S. dollars) -51.8% ……
(in millions of Liberian dollars) -25.2% …… Source: Central Bank of Liberia, Quarterly bulletin 2013
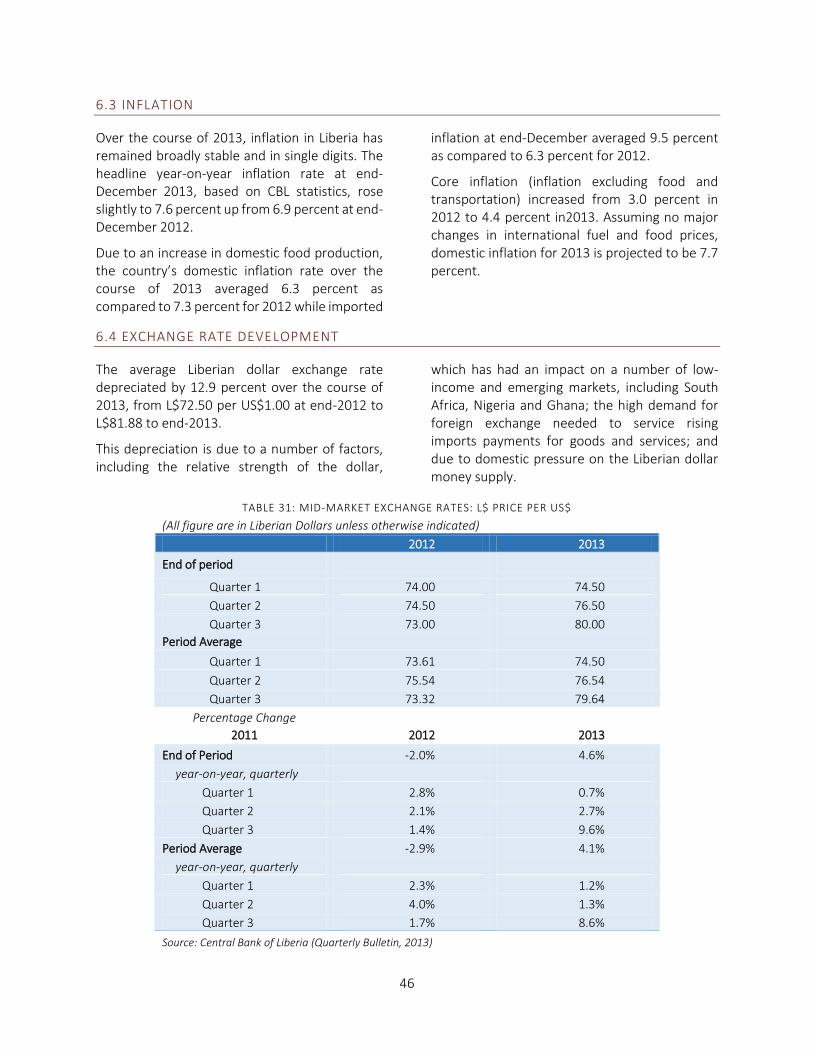
46
6.3 INFLATION
Over the course of 2013, inflation in Liberia has remained broadly stable and in single digits. The headline year-on-year inflation rate at end-December 2013, based on CBL statistics, rose slightly to 7.6 percent up from 6.9 percent at end-December 2012.
Due to an increase in domestic food production, the country’s domestic inflation rate over the course of 2013 averaged 6.3 percent as compared to 7.3 percent for 2012 while imported
inflation at end-December averaged 9.5 percent as compared to 6.3 percent for 2012.
Core inflation (inflation excluding food and transportation) increased from 3.0 percent in 2012 to 4.4 percent in2013. Assuming no major changes in international fuel and food prices, domestic inflation for 2013 is projected to be 7.7 percent.
6.4 EXCHANGE RATE DEVELOPMENT
The average Liberian dollar exchange rate depreciated by 12.9 percent over the course of 2013, from L$72.50 per US$1.00 at end-2012 to L$81.88 to end-2013.
This depreciation is due to a number of factors, including the relative strength of the dollar,
which has had an impact on a number of low-income and emerging markets, including South Africa, Nigeria and Ghana; the high demand for foreign exchange needed to service rising imports payments for goods and services; and due to domestic pressure on the Liberian dollar money supply.
TABLE 31: MID-MARKET EXCHANGE RATES: L$ PRICE PER US$
(All figure are in Liberian Dollars unless otherwise indicated)
2012 2013
End of period
Quarter 1 74.00 74.50
Quarter 2 74.50 76.50
Quarter 3 73.00 80.00
Period Average
Quarter 1 73.61 74.50
Quarter 2 75.54 76.54
Quarter 3 73.32 79.64
Percentage Change
2011 2012 2013
End of Period -2.0% 4.6%
year-on-year, quarterly
Quarter 1 2.8% 0.7%
Quarter 2 2.1% 2.7%
Quarter 3 1.4% 9.6%
Period Average -2.9% 4.1%
year-on-year, quarterly
Quarter 1 2.3% 1.2%
Quarter 2 4.0% 1.3%
Quarter 3 1.7% 8.6%
Source: Central Bank of Liberia (Quarterly Bulletin, 2013)

47
The average bid/ask spread during the first two quarters of 2013 stood at 1.33 percent; an indication of the trading frequency between the two currencies; see Table 32.
In response to the exchange rate pressure, the authorities took a number of actions. The CBL issued for the first time CBL bills, similar in nature to Treasury bills, in order to mop up Liberian
dollar liquidity. Towards the end of 2013 the CBL also reduced the reserve requirement for US dollar deposits to improve US dollar liquidity. The Ministry of Finance meanwhile has engaged in a public education campaign to enhance Liberian dollar revenues, in order to reduce pressure on the Liberian dollar money supply through the need to exchange US dollars with the CBL for Liberian dollars.
FIGURE 6: LIBERIA DOLLAR PRICE PER US$, JAN - JUNE, 2013
6.4.1 FOREIGN EXCHANGE AUCTIONS
The CBL’s regular intervention through auction in an attempt to stabilize the exchange rate decreased by 45.2 percent at end September, 2013 to US$14.25 million, down from US$26.0 million at end June 2013. The reduction is mainly due to CBL’s strong desire to buffer up the foreign
exchange reserve and cushion against increased foreign exchange pressure on the exchange rate. The foreign exchange sale reduced by 15.7 percent at end-September 2013 compared to the same period in 2012.

48
TABLE 32: CENTRAL BANK OF LIBERIA FOREIGN EXCHANGE
Liberia: Central Bank FOREX Auctions (All figure are in US dollars unless otherwise indicated)
2012 2013
FOREX Sold (in Millions of US Dollars)
Quarter 1 12.80 26.30
Quarter 2 24.20 26.00
Quarter 3 16.90 14.25
Percentage Change
2012 2013
Quarterly -30.2% -45.2%
Year-on-year, quarterly
Quarter 1 48.8% 105.5%
Quarter 2 227.0% 7.4%
Quarter 3 106.1% -15.7%
Source: Central Bank of Liberia (Quarterly Bulletin,2013)
6.5 INTEREST RATES AND BANK LENDING
6.5.1 DEPOSIT RATE
The average saving deposit rate remained unchanged at the end of quarter three, but year-on-year quarterly comparison shows a decrease by 4.3 percent compared to the same period in 2012. Average time deposit rate decreased by 1.6
percent for two straight quarters in 2013. The year on year analysis shows that the average time deposit rate increased by 5.6 percent from 1.6 percent in quarter two of the same period in 2012.
6.5.2 LENDING RATE
Up to end-September 2013, the average lending rate decreased by 70 basis points. Average personal loan rates increased by 90 basis points and mortgage rates increased by 5.2 percent. The average personal loan rate registered a decrease for three straight quarters of 2013 due to the banking efforts to stimulate domestic demand for loan.
At end-September 2012, total-lending rates decreased by another 70 basis points compared to the same period in 2012. The wide spread between bank average lending and saving deposit rates reflect the riskiness associated with lending from the perception of the commercial banks, coupled with the high cost of capital in the
banking sector due to increased overhead and operational costs, especially for electricity.
The high ratio of non-performing loans is clear evidence of the risky environment in the market place, which can be mitigated by structuring of the financial system through policy measures such as an improved national identification system, credit reference bureau and an improved collateral registration system.
In the meantime, the Central Bank of Liberia is working with the country’s financial institutions in an attempt to lower interest rate on borrowing and raise interest rate on savings deposits which are linked to the stimulus package for Small Medium Enterprises (SMEs).

49
TABLE 33: COMMERCIAL BANKS’ INTEREST RATES, 2012-2013
Commercial Bank Rates 2012 2013 Year on Year, Quarterly
Percentage Change-2013 over 2012
Q1 Q2 Q3 Q1 Q2 Q3 Q1 Q2 Q3
Lending Rates
Average Lending Rate 13.26 13.42 13.62 13.02 13.63 13.53 -1.8% 1.6% -0.7%
Average Personal Loan Rate 13.90 14.02 14.06 13.21 13.91 14.03 -5.0% -0.8% -0.2%
Average Mortgage Rate 15.00 13.86 13.76 12.00 14.25 14.99 -20.0% 2.8% 8.9%
Deposit Rates
Average Time Deposit Rate 3.80 3.80 3.60 3.90 3.86 3.80 2.6% 1.6% 5.6%
Average Saving Deposit Rate 2.02 2.02 2.10 2.00 2.01 2.01 -1.0% -0.5% -4.3%
Other Market Rates
Average Rate on CD'S 2.00 3.00 3.00 3.00 3.00 3.00 50.0% 0.0% 0.0%
Percentage Change 2012 2013
Quarterly Q2 Q3 Q2 Q3 Q3+/-1
Average Lending Rate … 1.2% 1.5% … 4.7% -0.7% -0.1
Average Personal Loan Rate … 0.9% 0.3% … 5.3% 0.9% 0.12
Average Mortgage Rate … -7.6% -0.7% … 18.8% 5.2% 0.74
Average Time Deposit Rate … 0.0% -5.3% … -1.0% -1.6% -0.06
Average Saving Rate … 0.0% 4.0% … 0.5% 0.0% 0
Average Rate on CD'S … 50.0% 0.0% … 0.0% 0.0% 0
Source: Central bank of Liberia (Quarterly Bulletin, 2013)
1/ Refers to nominal rise or decrease in the growth rate
6.5.3 COMMERCIAL BANK CREDITS
Commercial banks credit to major sectors of the economy at end September 2013 amounted to L$25.6 billion, which was L$2,531.1 billion or 10 percent more than the amount recorded at end June 2013 or 39 percent more than what was recorded at the end of the same period in 2012. The increased credits to important sectors of the economy supports a deepening of financial services and will expand economic activities.
At end-September 2013, loans to individuals and other service-related businesses accounted for 35 percent of total outstanding loans. Trade, Hotels and Restaurants were loaned 38 percent, being the largest portion of the portfolio and Mining & Quarrying accounted 33 percent.
Additionally, credits to the Mining & Quarrying sector decreased by 50 percent from quarter two, and approximately 22.6 percent comparing year-on-year with the same period in 2012.The banking sector credits have channeled more towards individual loans than other sectors. The large concessionaires in agriculture and mining hardly received any credits from the financial system as most of their capital needs are met from off-shore. Loans and advances to the Agriculture sector accounted for 5 percent; Manufacturing, 1 percent; Construction, 11 percent and Transportation, 9 percent. Notably, the average share of loans to the economic sectors has increased on average to 15.9 percent at end September 2013 from 14.3 percent in previous quarters since the beginning of 2011.

50
FIGURE 7: COMMERCIAL BANK LOANS TO ECONOMIC SECTORS, 2011: Q3 & 2013:Q3
Source: Central Bank of Liberia

51
TABLE 34: COMMERCIAL BANKS’ LOANS TO ECONOMIC SECTORS (L$)
Liberia: Commercial Banks Loans to Economic Sectors,2012-2013
(All figure are in Liberian Dollars unless otherwise indicated)
Sector 2012 2013 Year on Year, Quarterly
Percentage Change-2013 over 2012
Q2 % Share Q3 % Share Q2 % Share Q3 % Share Q2 Q3
(in Millions of Liberian dollar)
Agriculture 654.10 3.7 681.7 3.7 1,105.0 4.8 1,337.0 5.8 68.9% 96.1%
Mining & Quarrying 118.80 0.7 109.7 0.6 170.1 0.7 84.9 0.4 43.2% -22.6%
Manufacturing 418.10 2.3 340.8 1.8 376.4 1.6 378.9 1.6 -10.0% 11.2%
Construction 1,484.30 8.3 1,577.3 8.5 2,216.1 9.6 2,774.7 12.0 49.3% 75.9%
Transportation1 1,347.20 7.5 1,280.1 6.9 1,363.4 5.9 2,322.4 10.1 1.2% 81.4%
Trade, Hotel and Restaurant 7,691.40 43.1 7,367.5 39.9 9,867.0 42.8 9,799.2 42.5 28.3% 33.0%
Others2 6,143.40 34.4 7,095.4 38.5 7,933.0 34.4 8,865.0 38.5 29.1% 24.9%
Total3 17,857.30 18,452.51 23,031.00 25,562.09
Average 14.3 14.3 14.3 15.9
Percentage Change
2013
Quarterly Q2 Q3
Agriculture 71.8% 21.0%
Mining & Quarrying -26.6% -50.1%
Manufacturing 8.7% 0.7%
Construction 67.9% 25.2%
Transportation1 -22.0% 70.3%
Trade, Hotel and Restaurant 32.4% -0.7%
Others2 38.5% 11.7%
1/ Include storage and Commission

52
6.6 EXPANSION OF THE MONEY MARKET
Two Significant money market instruments have been added to the readily available instrument to deepen the money market and serve liquidity management of the Liberian dollar: the Ministry of Finance T-bills (which also serve an important revenue smoothing role) and the Central Bank of Liberia Notes.
The Central Bank of Liberia has issued notes with value more than L$1.25 billion. Two big monthly issued have taken effect by the CBL. In August 2013 the CBL effected 3 auctions of notes with total value of L$1.04 billion while the GoL T-bill in the same August amounts to L$149 million. In the month of November 2013, the CBL issue note with value of $1.13 billion, while L$160 million of T-bills were issued by GoL.
FIGURE 8: TREASURY BILLS AND CBL NOTES ISSUED
6.6.1 CBL NOTES
In an attempt to further manage the Liberian dollar liquidity, the Central Bank of Liberian began the issuance of its own notes “CBL notes” in addition to the readily available foreign exchange (FX) auction. Since the start of the
issuance of the notes in July 2013 alongside the GoL T-bills, the CBL has done 5 issues in the total amount of L$2,327.5 million. The weighted average discount rate on the notes since the issue began was 2.21 percent.
TABLE 35: CBL BILL ISSUANCE (JULY – NOVEMBER 2013)
Auction # Date Maturity Date Value of CBL Bill
(L$m) Cut-off
Weighted Average Discount Rate
5 19-Nov-13 18-Feb-14 1130.0 3 2.44
4 28-Aug-13 27-Nov-13 387.5 2.21 2.02
3 15-Aug-13 14-Nov-13 387.5 2.23 1.99
2 7-Aug-13 6-Nov-13 269.5 2.25 2.04
1 30-Jul-13 31-Oct-13 153.0 3.0 2.56
Total/Average 2,327.5 2.538 2.21 Source: CBL Quarterly Bulletin 2013; Ministry of Finance
Source: MoF, CBL Quarterly bulletin, 2013
0
200
400
600
800
1000
1200
May June July Aug. Sept. Oct. Nov. Dec.
in m
illio
ns
of
L$
T-bill vs CBL Notes(Value issued)
T-Bill
CBL Bill

53
7. EXTERNAL SECTOR DEVELOPMENTS
Liberia’s current account deficit extended further in 2013, although this masked a 13% increase in commodities exports, driven by iron ore, which is now the largest export commodity by value. Despite the increase in iron ore production and export, the net merchandize position deteriorated to negative US$667.2 million in 2013 due to an increase in merchandize imports of 12.5%, largely driven by beverages and
tobacco, chemical and related products, and petroleum products.
Similarly, net services also fell, to negative US$ 667.5 million, having improved previously from negative US$865.0 million in 2011 to negative US$658.4 million in 2012. Net income improved from a deficit of US$943.0 million in 2012 to US$633.9 million in 2013.
TABLE 36: BALANCE OF PAYMENTS 20011-2013 (US$ MILLIONS)
2011 2012 2013*
Current Account -996.38 -1137.25 -1287.80
o/w Net Merchandise -677.28 -632.00 -667.20
o/w Net Services -865.00 -658.40 -667.50
o/w Net Income -687.50 -943.99 -633.90
o/w Net Current Transfers 1233.40 1097.14 680.80
Capital Account 0.00 312.15 133.50
Financial Account 1231.10 1559.30 1395.88
Balancing item 234.72 734.20 241.58 Source: Central Bank of Liberia, Ministry of Finance and Ministry of Commerce and Industry * Preliminary data
Net current transfers deteriorated substantially from a recent peak of US$1,233.4 million in 2011 and US$1,097.1 million in 2012, to just US$680.8 million in 2013, driven by a reduction in net public transfers and a substantial fall in net workers’ remittances, from US$140.3 million in 2012 to US$31.1 million in 2013. The fall in remittance outflows, from US$369 million in 2012 to US$255 million in 2013 (likely linked to a reduction in UNMIL operations), was outweighed by the reduction in inflows, from US$509 million in 2012 to US$297 million in 2013.The current account deficit is linked in large part to significant capital
inflows related to aid, UNMIL, remittances and foreign direct investment (FDI), rather than by unsustainable domestic consumption. While it also reflects weak domestic productive capacity, particularly around agricultural goods (e.g. rice), there is no immediate concern about the build-up of external private debt.
The current account may widen further in 2014 due to further investment related imports, but is expected to narrow over the medium term as these imports unwind and exports, particularly iron ore, rubber and palm oil, rise.

54
FIGURE 9: BALANCE OF PAYMENTS 2011-13 (US$ MILLIONS)
Source: Central Bank of Liberia, Ministry of Finance and Ministry of Commerce and Industry * Preliminary data
7.1 EXPORT OF GOODS AND SERVICES
Total commodity exports grew by 13% in 2013, from US$479.4 million to US$543.7 million. This was driven by growth in iron ore production, which more than doubled in export value when compared to 2012, overtaking rubber exports for the first time, and constituted over half of total commodity exports.
Rubber exports fell by 32% to US$120.5 million, reflecting lower production due to aging rubber trees and weaker global rubber prices.
While iron ore and rubber constitute the main export commodities, logs, gold, diamond, coffee and cocoa are also contributing to the export earnings of the economy.
Round logs exports were however also weak, falling 67% from US$48.4 million in 2012 to US$16.0 million in 2013, largely as a result of the moratorium on Private Use Permits (PUPs).
Gold and diamond exports continued to exhibit volatility, with a fall of 16% and an increase of 37% respectively.
Cocoa and coffee beans remain small scale exports in comparison to other commodities. Cocoa exports grew by 51%, however this followed a 50% fall between 2011 and 2012.
(1,500.00)
(1,000.00)
(500.00)
-
500.00
1,000.00
1,500.00
2,000.00
2,500.00
2011 2012 2013*
Current Account Capital Account Financial Account

55
TABLE 37: EXPORT OF COMMODITIES, 2008-2013
2008 2009 2010 2011 2012 2013*
Rubber 114.1 93.1 148.1 226.1 176.8 120.5
Cocoa Beans 3.6 4.3 14.3 6.6 9.9
Coffee 2.0 0.5 0.1 0.1 0.1
Round Logs 1.1 2.7 21.3 48.4 16.0
Iron Ore 0.3 0.4 3.1 22.2 117.1 312.2
Gold 7.4 12.4 19.8 17.2 26.2 22.0
Diamond 5.0 7.5 15.3 15.4 12.4 17.0
Other Commodities 9.8 31.2 18.8 50.4 92.0 46.0
TOTAL 246.5 212.6 212.7 367.0 479.4 543.7 Source: Central Bank of Liberia, Ministry of Finance and Ministry of Commerce and Industry * Preliminary
As China Union commenced iron ore exports in early 2014, Arcelor Mittal are entering into phase 2 of their production and Western Cluster is due to come online within 2 years, iron ore output is expected to increase substantially and to remain the primary export earner of the economy.
Despite the upward trend in commodity exports, the contribution of services to exports remains
very low, falling from US$326.6 million in 2012 to 240.49 million in 2013.
However, with the reconstruction of the wharf at Monrovia Freeport, other port developments, and the planned reconstruction of the Roberts International Airport, the transportation component of the service industry is expected to increase its contribution to the service export earnings over the coming years.
7.2 IMPORT OF GOODS AND SERVICES
Liberia’s merchandize imports have been increasing steadily since 2009 and continued the trend in 2013, with a 13% rise from US$1,076.4 million in 2012 to US$1,210.9 million in 2013.
Beverages and tobacco recorded the biggest increase, followed by crude materials and chemical and related products. Machinery and Transport equipment exhibited a small decrease of 3%, but remained the single largest component (25% of total merchandize imports), partly a result of it capturing capital imports related to concession firms and the rehabilitation of public infrastructure, including roads.
Petroleum products continued to grow steadily by 7%, compared to 18% in 2012, and made up 23% of imports.
The other significant component of imports, food and live animals, which makes up 15% of total merchandize imports, fell by 6% to US$183.9 million.
Despite the depreciation in the Liberian dollar, rice imports actually grew by US$19.6 million, to US$88.3 million in 2013.

56
TABLE 38: IMPORT OF GOODS, 2008-2013
2008 2009 2010 2011 2012 2013*
Food & Live Animals 203.9 92.2 185.4 306.1 195.3 183.9
o/w Rice 121.8 68.7 88.3
Beverages & Tobacco 13.9 14.0 14.7 20.4 21.4 100.8
Crude Materials 12.9 6.7 7.4 5.4 6.3 17.7
Minerals, Fuel & Lubricants 278.9 318.9 322.5
o/w Petroleum products 216.9 256.9 275.6
Animal & Vegetable Oil 2.9 6.7 18.8 11.5 31.3 23.1
Chemical & Related Products 27.6 21.1 31.8 35.4 48.0 79.2
Manufactured Goods 104.7 44.9 66.2 94.1 115.4 154.7
Machinery & Transport Equipment 215.2 73.9 181.4 250.9 310.9 300.8
Miscellaneous Articles 60.1 17.2 44.8 41.4 28.8 28.3
TOTAL 654.6 282.9 608.7 1044.3 1076.4 1210.9
Source: Central Bank of Liberia, Ministry of Finance and Ministry of Commerce and Industry * Preliminary

57
REFERENCE DOCUMENTS
Agenda for Transformation Annual Progress Reports Central Bank of Liberia Annual Reports Central Bank of Liberia Financial and Economic Bulletins Liberia Maritime Authority Releases Liberia Water and Sewer Corporation Releases Ministry of Agriculture Reports Ministry of Commerce and Industry Reports Ministry of Education Reports Ministry of Finance Fiscal Outturns Ministry of lands, Mines and Energy Reports Ministry of Transport Reports World Bank databases International Monetary Fund World Economic Outlook Liberia Electricity Corporation Reports