Embed Size (px)
Citation preview

NOAA Technical Memorandum NWS WR-189
ANNUAL DATA AND VERIFICATION TABULATION EASTERN NORTH PACIFIC TROPICAL STORMS AND HURRICANES 1984
Salt Lake City, Utah April 1985
u.s. DEPARTMENT OF I COMMERCE
National Oceanic and
Atmospheric Administration I National Weather
Service

NOAA TECHNICAL MEMORANDA National Weather Service, Western Region Subseries
The National Weather Service (NWS) Western Region (WR) Subseries provides an informal medium for the documentation and quick dissemination of results not appropriate, or not yet ready, for formal publication, The series is used to report on work in progress, to describe techni ca 1 procedures and practices, or to relate progress to a 1 imited audience, These Techni ca 1 Memoranda will report on i nvesti gati ons devoted primarily to region a 1 and 1 oca 1 problem' of interest mainly to personnel, and hence will not be widely distributed.
Papers 1 to 25 are in the former series, ESSA Technical Memoranda, Western Region Techni ca 1 Memoranda (WRTN); papers 24 to 59 are in the forme•· series, ESSA Techni ca 1 Memoranda, Weather Bureau Technical Memoranda (WBTM), Beginning with 6,0, the papers are part of the series, NOAA Technical Memorada NWS. Out-of-print memoranda are not 1 is ted.
Papers 2 to 22, except for 5' (revised edition), are available from the National Weather Service Western Region, Scientific Services Division, P. 0. Box 11188, Federa 1 Sui 1 ding, 125 South State Street, Sa 1t Lake City, Utah 84147. Paper 5 (revised edition), and all others beginning with 25 ar,; ~~ail.i!b 1 e from the National Technical Information Service, U. S. Department of Commerce, Sill~ Building, 5285 Port Royal Road, Springfield, Virginia ..!Z 1·b !Price5 vary for all paper copy; $3.50 microfiche. Order by accession number shown in parentheses at end of each entry. .
ESSA Technical Memoranda (WRTM)
2 Climatological Precipitation Probabilities. Compiled by Lucianne Miller, December 1965. 3 western Region Pre- and Post-FP-3 Program, December 1, 1965, to February 20, 1966, Edward D. Diemer, March 1966. 5 Station Descriptions of Local Effects on Synoptic Weather Patterns. Philip Williams, Jr., April 1966 (~evised Novembet· 1967,0ctober !969). (PB-17800) 8 Interpreting the RAREP. Herbert P, Benner, May 1966 (revised January 1967). 11 Some Electrical Processes in the Atmosphere. J. Latham, June 1966. 17 A Digitalized Summary of Radar Echoes within 100 Miles of Sacramento, California. J. A. Youngberg and L. B. Overaas, December 1966. 21 An Objective Aid for Forecasting the End of East Winds in the Columbia Gorge, July through October. D. John Coparanis, April 1967. 22 Derivation of Radar Horizons in Mountainous Terrain, Roger G. Pappas, April 1967,
ESSA Technical Memoranda, Weather Bureau Techni ca 1 Memoranda (WBTM)
25 Verification of Operational Probability of Precipitation Forecasts, April 1966-March 1967. W. W. Qickey, October 1967. (PB-176240) 26 A Study of Winds in the Lake Mead Recreation Are\. R. P. All9Ulis, Januar,y 1968, (_PB-177830) 28 Weather Extremes. R. J. Schmidli, April 1968 Revi-sed December 1983) 29 Small-Scale Analysis and Prediction. Philip Wil iams, Jr., May 1968. (PB-178425) 30 Numerical Weather Prediction and Synoptic Meteorology, Capt. Thomas D. Murphy, U.S.A.F., May 1968. (AD-673365) 31 Precipitation Detection Probabilities by Salt Lake ARTC Radars. Robert K. Belesky, July 1968. (PB-179084) 32 Probability Forecasting--A Problem Analysis with Reference to the Portland Fire Weather District. Harold S. Ayer, July 1968. (PB-179289) 35 Joint ESSA/FAA ARTC Radar Weather Surveillance Program. Herbert P. Benner and DeVon B. Smith, December 1968 (revised June 1970). AD-681857) 36 Temperature Trends in Sacramento--Another Heat Island. Anthony D, Lentini, February 1969. (PB-183055) 37 Disposal of Logging Resid4es without Damage to Air Quality. Owen P. Cramer, March 1969. (PB-183057) 39 Upper"Air Lows over Northwestern United States. A. L. Jacobson, April 1969. (PB-184296) 40 The Man-Machine Mix in Applied Weather Forecasting in the 1970's. L. W. Snellman, August 1969. (PB-185068) 42 Analysis of the Southern California Santa Ana of January 15-17, 1966. Barry B. Aronovitch, August 1969. ( PB-185670) 43 Forecasting Maximum Temperatures at Helena, Montana. David E. Olsen, October 1969. (PB-185762) 44 Estimated Return Periods for Short-Duration Precipitation in Arizona. Paul C. Kangieser, October 1969. (PB-187763) 46 Applications of the Net Radiometer to Short-Range Fog and Stratus Forecasting at Eugene, Oregon. L. Vee and E. Bates, December 1969, ( PB-190476) 47 Statistical Analysis as a Flood Routing Tool. Robert J. C. Burnash, December 1969. (PB-188744) 48 Ts·unami. Richard P. Augulis, February 1970·. (PB-190157) 49 Predicting Pr~cipitation Type. Robert J. C. Burnash and Floyd E. Hug, March 1970. (PB-190962) SO Statistical Report on Aeroall~rgens (Pollens and Molds) Fort Huachuca, Arizona, 1969. Wayne S. Johnson, April 1970. (PB-191743) 51 Western Region Sea State and Surf Forecaster's Manual. Gordon c. Shields and Gerald B. Burdwell, July 1970. (PB-193102) 52 Sacramento Weather Radar Climatology. R. G. Pappas and C. M. Veliquette, July 1970, (PB-193347) 54 A Refinement of the Vorticity Field to Delineate Areas of Significant Precipitation. Barry B. Aronovitch, August 1970. 55 Appli~ation of t~e SSARR Model to a Basin without Discharge Record. Vail Schermerhorn and Donal W. Kuehl, August 197D. (Ps-194394) 56 Areal Coverage of Precipitation in Northwestern Utah. philip Wi"lliams, Jr., and Werner J. Heck, September 1970. (PB-194389) 67 Preliminary Report.on Agricultural Field Burning vs, Atmospheric Visibility in the Willamette Valley of Oregon. Earl M. Bates and David 0. Chilcote,
September 1970. (PB-19471D) · 58 Air Pollution by Jet Aircraft at Seattle-Tacoma Airport. Wallace R. Donaldson, October 1970, (COM-71-00017) 59 Application of PE Model Forecast Parameters to Local-Area Forecasting. Leonard W. Snellman, October 1970. (COM-71-00016)
NOAA Technical Memoranda (NWS WR)
60 An Aid for Forecasting the Minimum Temperature at Medford, Oregon. Arthur W. Fritz, October 1970. (COM-71-00120) 63 700-mb Warm Air Advection as a Forecasting Tool for Montana and Northern Idaho. Norris E. Woerner, February 1971. (COM-71-00349) 64 Wind and Weather Regimes at G1·eat Falls, Montana. Warren B. Pr.ice, March 1971. 66 A Preliminary Report on Correlation of ARTCC Radar Echoes and Precipitation. Wilbur K. Hall, June 197). (COM-71-00829) 69 National Weather Service Support to Soaring Activities. Ellis Burton, August 1971. (COM-71-00956) 71 Western Region Synoptic Analysis-Problems and Methods. Philip Williams, Jr., February 1972. (COM-72-10433) 74 Thunderstorms and Hail Days Probabilities in Nevada. Clarence M. Sakamoto, April 1972. (COM-72-10554) 75 A Study of the Low Level det Stream of the San Joaquin Valley. Ronald A. Willis and Philip Williams, Jr., May 1972. (COM-72-10(07) 76 Monthly Climatological Charts of the Behavior of Fog and Low Stratus at Los Angeles International Airport. Donald M. Gales, July 1972. (COM-72-11)40) 77 A Study of Radar Echo Distribution in Arizona During July and August. John E. Hales, Jr., July 1972. (COM-72-11136) 78 Forecasting Precipitation at Bakersfield, California, Using Pressure Gradient Vectors. Earl T. Riddiough, July 1972. (COM-72-11146) 79 Climate of Stockton, California. Robert C. Nelson, July 1972. (COM-72-10920) 80 Estimation of Number of Pays Above or Below Selected Temperatures, Clarence M. Sakamoto, October 1972. (COM-72-10021) 81 An Aid for Forecasting Summer Maximum Temperatures at Seattle, Washington. Edgar G. Johnson, November 1972. (COM·73-10150) 82 Flash Flood Forecasting and Warning Program in the Western Region. Philip Williams, Jr., Chester L. Glenn, and Roland L. Raetz, December !972,
(revised March 1978). (COM-73-10251) · 83 A Comparison of Manual and Semiautomatic Methods of Digitizing Analog llind Records. Glenn E. Rasch, March 1973. (COM-73-10669) 86 Conditional Probabilities for Sequences of Wet Days at Phoenix, Arizona. Paul C. Kangieser, June 1973. (COM-73-11264) 87 A Refinement of the Use of K-Values in Forecasting Thunderstorms in Washington and Oregon. Robert Y. G. Lee, June 1973. (COM-73-11276) 89 Objective Forecast Precipitation over the Western Region of the United States. Julia N1 Paegle and Larry P. Kierulff, Sept. 1973. (COM-73-11946/3AS) 91 Arizona "Eddy" Tornadoes. Robert s, Ingram, October 1973. (COM-73-10465) 92 Smoke Management in the llillamette Valley. Earl M. Bates, May 1974. (COM·74-11277/AS) 93 An Operational Evaluation of 500-mb Type Regression Equations. Alexander E. MacDonald, June 1974. (COM-74-11407/AS) 94 Conditional Probability of Visibility Less than One-Half Mile in Radiation Fog at Fresno, California. John D. Thomas, August )974. (COM-74·ll555/AS) 96 Map Type Precipitation Probabilities for the Western Region. Glenn E. Rasch and Alexander E. MacDonald, February 1975. (COM-75-10428/AS) 97 Ea~tern Pacific Cut-Off Low of April 21-28, 1974. William J. Alder and George R. Miller, January 1976. (PB-250-711/AS) 98 Study on a Significant Precipitation Episode in Western United States. Ira S. Brenner, April 1976, (COM-75-10719/AS) 99 A Study of Flash Flooq Susceptibility--A Basin in Southern Arizona. Gerald Williams, August 1975. (COM-75-11360/AS) 102 A Set of Rules for Forecasting Temperatures in Napo and Sonoma Counties. Wesley L. Tuft, October 1975. (PB-246-902/AS) 103 Application of. the National Weather Service Flash-Flood Program in the Western Region. Gerald Williams, January 1976. (PB-253-053/AS) 104 Objective Aids for Forecasting Minimum Temperatures at Reno, Nevada, During the Summer Months. Christopher D. Hill, January 1976. (PB-252-866/AS) 105 Forecasting the Mono Wind. Charles P. Ruscha, Jr., February 1976. (PB-254-650) 106 Use of MOS Forecast Parameters in Temperature Forecasting. John C. Plankinton, Jr., March 1976. (PB-254-649) 107 Map Types as Aids in Using MOS PoPs in Western United States. Ira S. Brenner, August 1976. (PB-259-5941 108 Other Kinds of Wind Shear. Christopher D. Hill, August 1976. (PB-260-437/AS) · · 109 Forecasting North Winds in the Upper Sacramento Valley and Adjoining Forests. Christopher E. Fontana, September 1976. (PB-273-677/AS) 110 Cool InfloYI as a Weakening Influence on Eastern Pacific Tropical Cyclones. William J. Denney, November 1976. (PB-264-655/AS) 112 The MAN/MOS Prpgram. A 1 exander E. MacDona 1 d, February 1977. ( PB-265-941/AS) 113 Winter Season Minimum Temperature Formula for Bakersfield, California, Using Multiple Regression. Michael J. Oard, February 1977. (PB-273-694/AS) 114 Tropical Cyclone Kathleen. James R. Fors, February 1977. (PB-273-676/AS) 116 A Study of ,Wind Gusts on Lake Mead. Bradley Colman, April 1977. (PB-268-847) 117 The Relative F~equency of C~mul ?nimbus Clouds at the Nevada Test Site as a Function of K-Va 1 ue, R, F. Quiring, April 1977, ( PS-272-831) 118 Mo1sture D1stnbut1on Mod1f1~at10n by Upward Vertical ~lotion. Ira S. Brenner, April lg77. (PB-268-740) 119 RelatiVe Frequency of Occurrence of Harm Season Echo Activity as a Function of Stability Indices Computed from the Yucca Flat, Nevada Rawinsonde.
Darryl Randerson, June 1977. (PB-271-290/AS) '
(..),

\ !
NOAA Technical Memorandum NWS WR-189
ANNUAL DATA AND VERIFICATION TABULATION EASTERN NORTH PACIFIC TROPICAL STORMS AND HURRICANES 1984
E. B. Gunther and R. L. Cross
Eastern Pacific Hurricane Center San Francisco, California Apri 1 1985
UNITED STATES I National Oceanic and I NatiOnal Weather DEPARTMENT OF COMMERCE Atmospheric Administration Service Malcolm Baldrige, Secretary John V. Byrne. Administrator Richard E. Hallgren. Drrector

c
/ ',, \
! ~ / ~-
This publication has been reviewed
and is approved for publication by
Scientific Services Division,
Western Region.
i i
Glenn E. Rasch, Chief Scientific Services Division Western Region Headquarters Salt Lake City, Utah

TABLE OF CONTENTS
PAGE
List of Tables iv
I. Introduction 1
II. Objective Forecast Techniques 1
I I I. Verification 1
\ IV. Data Summaries 1
I I
~_. / v. References 2
G
i i i

/---\ !
0
TABLE 1
TABLE 2
TABLES 3-21
\.~;
LIST OF TABLES
Verification of 1984 Tropical Storms and Hurricane Forecasts
Summary of Eastern North Pacific Tropical Cyclones, 1984
iv
PAGE
3
3
4-22

/
I. INTRODUCTION
This is the sixth report of an annual series covering eastern north Pacific tropical cyclone activity. Data are provided by the National Weather Service, the National Earth Satellite Service Field Station - San Francisco, California, and the Chief, Aerial Reconnaissance Coordination, all Hurricanes (CARCAH), Miami, Florida.
II. OBJECTIVE FORECAST TECHNIQUES
Tropi ca 1 cyclone prediction models used by Eastern Pacific Hurricane Center (EPHC) forecasters include:
1. EPHC77 (Leftwich and Neumann, 1977). A statistical-synoptic model.
2. EPHC81 (Leftwich, 1981). A statistical-dynamic model.
3. EPCLIPER (Neumann, 1982). A simulated analog model based on persistence and climatology.
4. EPANALOG (Jarrell, Mauck, and Renard, 1975). An analog model.
5. SANBAR (Sanders and Burpee, 1968). A filtered barotropic model.
In addition to the above models, forecasters also make use of NMC analyses and prognoses.
III. VERIFICATION
Verification statistics for the 1984 season are shown in Table 1. The forecast displacement error is the vector difference between the forecast displacement and the actual displacement computed from best-track positions. The initial position error is not subtracted from the forecast error, and depressions are not verified.
IV. DATA SUMMARIES
A summary of the 1984 eastern north Pacific tropical cyclone statistics is given in Table 2. Best track, operational positions, and position errors are given in Tables 3-26.
Reconnaissance aircraft flew into three of the 1984 cyclones as they moved up the west coast of Baja California in September and October. The first flight, with two penetrations, was made by the U.S. Air Force into Hurricane Marie on 8 September. The following day, two more penetrations of the hurricane were made. The next reconnaissance flights were made by NOAA research aircraft into Hurricane Norbert on 22 September. Three penetrations of the hurricane were made on that day, two the next, and three on the following day. The final reconnaissance of the 1984 season was made by the U.S. Air Force into Tropical Storm Polo on 2 October. Two penetrations of the storm were made.
1

Even as satellite imagery continues to improve and is one of the more important tools used by tropical forecasters, aircraft reconnaissance and ship reports are invaluable in providing comparative observations.
V. REFERENCES
[l] Jarrell, J.D., C.M. Mauck, and R.J. Renard, 1985: 11 The Navy's Analog Scheme for Forecasting Tropical Cyclone Motion Over the Northeastern Pacific Ocean". Techni ca 1 Paper No. 6-75, Environmental Prediction Research Facility, Naval Postgraduate School, Monterey, California, 27 pp.
[2] Leftwich, P.W., and C.J. Neumann, 1977: "Statistical Guidance on the Prediction of Eastern North Pacific Tropical Cyclone Motion". NOAA Technical Memorandum NWS WR-125, National Oceanic and Atmospheric Administration, U.S. Department of Commerce, National Weather Service Western Regi·on, 15 pp.
[3] Neumann, C.J., 1972: "An Alternate to the HURRAN Tropical Cyclone Forecast System. NOAA Technical Memorandum NWS SR-62, National Oceanic and Atmospheric Administration, U.S. Department of Commerce, National Weather Service Southern Region, 24 pp.
[4] J.R. Hope, and B.I. Miller, 1972: "A Statistical Method of Combining Synoptic and Empirical Cyclone Prediction Systems''. NOAA Technical Memorandum NWS SR-63, National Oceanic and Atmospheric Administration, U.S. Department of Commerce, National Weather Service Southern Region, 32 pp.
[5] Sanders, F., and R.W. Burpee, .1968: "Experiments in Barotropic Hurricane Track Forecasting. Journal of Applied Meteorology, Vol. 7, No. 3, 313-323.
[6] Leftwich, P.W., 1981: 11 A Statistical-Dynamical Model for Predic-tion of Tropical Cyclone Motion in the Eastern North Pacific Ocean". First draft of manuscript. NOAA National Weather Service, National Hurricane Center, Coral Gables, Florida.
2
/
EPHC Forecasters
EPANALOG
EPHC77
CLI PER
EPHC81
TABLE 1 1984 FORECAST ERRORS*
Forecast Period
24 HR 48 HR
165(89)/343 334(180)/269
167(90)/325 334(180)/259
167(90)/327 326(176)/262
167(90)/333 358(193)/268
158(85)/145 313 (169) /116
72 HR
513(277)/203
506(273)/193
497(268)/196
562(303)/201
517(279)/86
*Average error in kilometers (nautical miles) I number of cases.
TABLE 2
Summary of Eastern North Pacific Tropical Cyclones of 1984
(Includes only those Storms that Reached Hurricane HU or Tropical Storm TS)
NO.
1 2 3 4 5 6' 7 8 9 10 11 12 13 14 15 16 17 18
NAME CLASS
ALMA TS BORIS HU CRISTINA HU DOUGLAS HU ELIDA HU FAUSTO HU GENEVIEVE HU HERNAN TS !SELLE HU JULIO TS KENNA TS LOWELL HU MARIE HU NORBERT HU ODILE HU POLO HU RACHEL TS SIMON TS
DATES
17-21 MAY 28 MAY-18 JUN 17-26 JUN 25 JUN-3 JUL 28 JUN-8 JUL 3-10 JUL 7-14 JUL 27 JUL-1 AUG 3-12 AUG 15-20 AUG 16-18 AUG 26-30 AUG 5-11 SEP 14-26 SEP 71-22 SEP 26 SEP-3 OCT 7-16 OCT 31 OCT-8 NOV
3
MAX(KTS) DAMAGE DEATHS
50 65 90
125 115
95 100
45 115
55 40 75 80
115 90
100 55 55
($MILLION)
UNKNOWN UNKNOWN

c
~ .. l /
T ,S, ALMA
OPEF:ATIONAL F'OSITION 24 HOUR FOF:ECAST 48 HOUF: FOF:ECAST 72 HOUR FORECAST DATE/TIME BEST TRACK POSITION ERROR ERROF: ERROR ERROf\
(GMT> L,n, LONG. LAT. LONG, CN.MI. l LAT, LONG. OLMil LAT. LONG. (N,MI, l LAT. LONG, < N, MI, l -----------------------------------------------------------------------------------------------------
51700 o.o o.o o.o o.o o.o o.o o.o o. o.o o.o o. o.o o.o o. 51706 o.o o.o o.o o.o o.o o.o o.o o. o.o o.o 0. o.o o .o· o. 51712 o.o o.o o.o o.o o.o o.o o.o o. o.o o.o 0. o.o o.o o. 51718 9.7 99.8 9.0 99.5 45.6 9; 3. 103.1 118. 9.5 106.2 361. 9.6 109.2 497. 51800 9.9 101.3 9.3 101.0 40.1 9.6 105.5 89. 9.7 109.3 261. 9.5 113.1 331. 51806 9.1 102.3 9.1 102,8 o.o 10.0 108.9 36. 11.1 112.0 212. 12.3 115.6 285. 51812 9.2 104.3 9.1 104.2 8.4 9.6 107.3 189. 10.9 110,5 364, 13.1 114.2 429. 51818 9.3 105.8 9.3 105.1 41.0 10.5 109.9 154. 12.5 114.1 274. 14.9 117.3 395. 51900 9.5 107.4 9.5 107.0 23.5 10.1 112.0 107. 10.5 115.8 184. 1.2.0 118.1 o. 51906 9.5 109.0 9.4 109,0 6.0 10.0 114.4 56. 10.7 119.7 73. 11.5 123.8 o. 51912 9.5 110.5 9.6 110,5 6.0 10.7 116.0 78. 12.7 120.1 193. 16.6 121.0 0. 51918 9.5 112.0 9.5 112'. 3 17.6 10.2 118.3 59. 12.2 121.5 156, 16.0 122.7 0. 52000 9.5 113.6 9.5 113.7 5.9 9.7 119.3 40. 10.0 123.5 o. 10.4 128.0 o. 52006 9.5 115.1 9.5 115.2 5.9 9.8 120.1 40. 10.0 123.7 o. 10.3 126.8 0 <·
52012 9.5 116.4 9.5 116.5 5.9 9.8 121.6 68. 10.6 125.8 o. 12.2 129.7 0. 52018 9.5 117.6 9.5 117,6 o.o 9.6 121.9 35. 10.0 126.0 o. 10.0 130.1 o. 52100 9.5 118.7 9.4 118.7 6.0 9.5 123.0 o. 9.8 126.9 o. 10.2 130.9 o. 52106 9.5 119.6 9.5 119.5 5.9 9.7 122.9 o. 10.3 126.0 o. 10.8 128.!3 o. 52112 9.5 120.5 9.5 120i5 o.o 9.7 123.9 o. 10.7 127.0 o. 12.2 129.8 o. 52118 9.6 121.3 9.6 121.3 o.o 10.0 124.8 o. o.o o.o 0. o.o o.o 0.
MEAN VECTOF: ERRORS (N,MI) 82+ 231. 387. NUMBER OF CASES 13 9 5
TABLE 3,
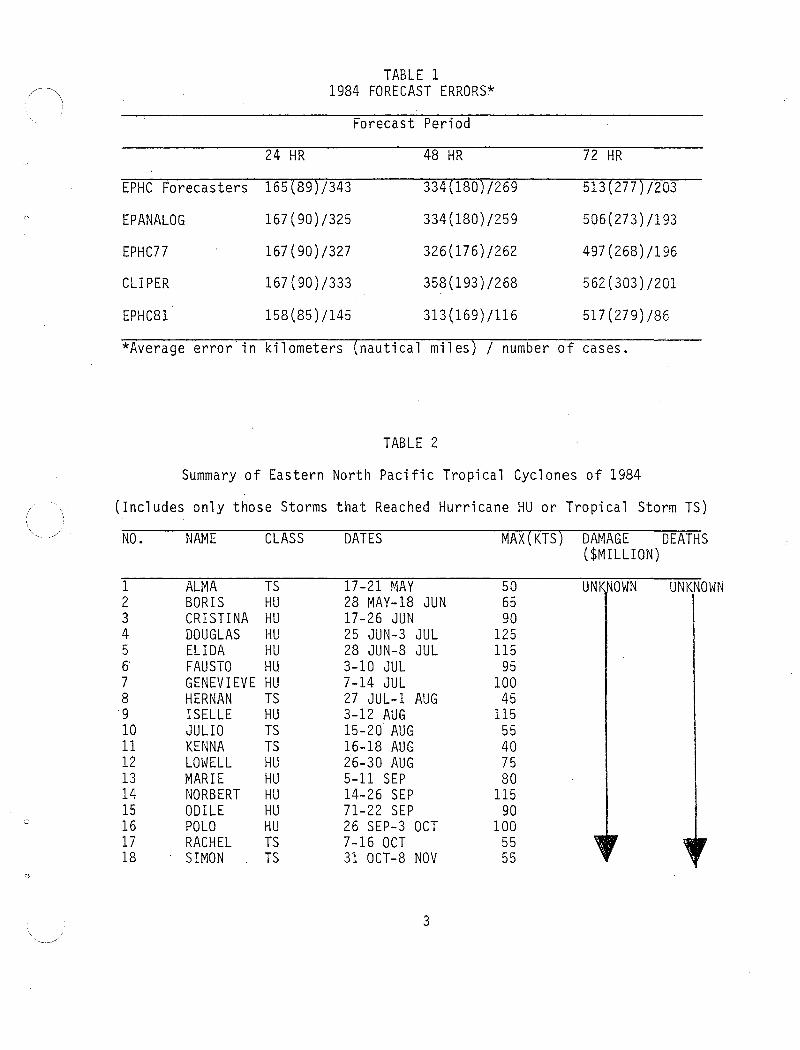
DATE/TIME BEST TRACK <GMT) LAT. LONG.
52800 52806 52812 52818 52900 52906 52912 52918 53000 53006 53012 53018 53100 53106 53112 53118 6 100 6 106 6 112 6 118 6 200 6 206 6 212 6 218 6 300 6 306 6 312 6 318 6 400 6 406 6 412 6 418 6 500 6 506 6 512 6 518 6 600 6 606 6 612 6 618 6 700 6 706 6 712 6 718
o.o o.o o.o
11.6 11.7 12.0 12.3 12.7 13.0 13.2 13.4 13.1 13.5 13.6 13.6 13.6 13.7 13.5 13.4 13.2 12.9 12.6 12.3 12.1 11.8 11.7 11.5 11.3 11.2 11.4 11.8 12.3 12.9 13.6 14.4 14.6 14.7 14.8 o.o o.o o.o o.o o.o OtO
o.o o.o o.o
94.0 94.6 95.0 95.3 95.8 96.2 96.6 97.1 97.6 98.1 98.3 98.6 98.8 99,0 99.1 99.2 99.3 99.3 99.2 99.1 99.1 99.2 99.3 99.5 99.7 99.9
100.1 100•1 100.0 99.7 99.4 99,8
100.4 101.0 101.6
o.o o.o o.o o.o o.o 0 .·J
MEAN VECTOR ERRORS !N.Mil NUMBER OF CASES
OPERATIONAL POSITION LAT, LONG,
o.o o.o o.o
11.2 11.4 11.6 11.8 12.6 13.2 13.3 13.5 13.4 13.3 13.6 13.6 13.4 13.4 13.7 13.7 13.7 13.7 14.0 o.o
12.0 11.5 11.2 12.0 11.7 11.2 10.8 10.8 11.1 l.2.9 13.5 14.4 14.9 14.2 14.5 o.o o.o o.o o.o o.o o.o
o.o o.o o.o
94.2 94.8 95.1 95.6 95.7 96.3 96.6 96.8 97.7 97.8 98.6 99.0 99.4 99.7 99.2 99.2 99.5 99.5
100.0 o.o
99.5 98.9
100.0 99.5 99.7
100.0 99.6 99.6
100.0 99.6 99.7 99.5
100.1. 100.9 101.6
o.o o.o o.o o.o o.o o.o
BORIS
POSITION 24 HOUR FORECAST ERROR ERROR (N,MI.l LAT. LONG, (N,Mil
o.o o.o o.o
26.7 21.4 24.7 34.7
8.3 13.3
6.0 18.4 18.9 21.3 17.5 23.4 37.1 44.8 13.3 18.0 32.2 49.4 9&.2 o.o
24.0 25.1 50.7 30.0 24.0 5.8
46.4 66.7 72.0 5.8
18.5 17.5 25.1 30.6 18.0 o.o o.o o.o o.o o.o o.o
o.o o.o o.o o.o o.o o.o
12.1. 96.8 12.7 97,4 12.6 97.2 13.0 97.9 14.2 97.5 15.0 98.7 14.8 98.1 14.3 98.4 13.8 99,8 13.4 98.6 13.9 100.7 13.8 101.1 13.3 101.1 13.5 101.6 14.1 100.3 13.9 99.7 14.0 100.3 13.9 100.1 o.o o.o o.o o.o
12.3 100.0 10.8 99.3 11.2 102.9 11.9 100.1 11.6 100.9 11.2 101,4 10.7 99.5 10.6 99.8 11.8 101.0 15.5 98.,1 16.1 99.1 0.0 o.o o.o o.o
13.3 103.0 o.o o.o o.o o.o o.c· o .o o.o o.o o.o o.o o.o o.o o.o o.o
TABLE 4. BORIS - PART 1
o. o. o.
71. 71. C"C" ._r.Jt
71. 49.
115. 78. 55. 33. 64. 88.
111. 96.
123. 18. o.
129. 160.
o. o.
40. 48.
196. 72. 61.
147. 168. 229. 193. 165. 174.
o. 0. o. 0. o. o. o. o. o. o.
103; 28
48 HOUR FORECAST 72 HOUR FORECAST ERROR ERROR
LAT. LONG, (N,MI,) LAT. LONG, (N,MI.l
o.o o.o o.o
12.2 13.8 13.8 13.9 15.5 16.5 15.9 15.0 14.2 13.8 14.2 14.0 13.2 13.6 14.4 14.1 o.o o.o o.o o.o
12.5 10.8 11.5 o.o o.o o.o o.o o.o o.o o.o o.o o.o o.o o.o o.o o.o o.o o.o o.o o.o o.o
o.o o.o o.o
99.5 100.4
99.8 100.6
99.6 101.2
99.8 100.5 102.5 101.1 102.8 103.3 102.8 104.0 101.9 100.4
o.o o.o o.o o.o
100.8 101.4 105.1
o.o o.o o.o o.o o.o o.o o.o o.o o.o o.o o.o o.o o.o o.o o.o o.o o.o 0 .•J
0. 0. o.
128. 155,
71. 95.
127. 205, 137. 109. 177. 93.
163. o.
206. 324. 222. 137.
o. o. o. o.
96. 164. 338.
0. o. o. o. 0. o. 0. o. 0. o. o. o. o. 0. 'J. 0. 0. o.
164. 18
o.o o.o o.o
11.9 14.5 14.5 14.6 16.6 17.4 16.8 15.8 14.2 14.0 15.1 14.0 13.2 13.8 15.0 14.5 o.o o.o o.o o.o
13.1 11.2 12.0 o.o o.o o.o o.o o.o o.o o.o o.o ··J.O o.o o.o o.o o.o o.o o.o o.o o.o ;) • 0
o.o o.o o.o
'102.4 104.6 103.0 103,2 102.4 103.3 102.7 102.8 106.3 104.9 106.0 105.4 105.0 106.8 103.7 101.7
o.o o.o o.o o.o
101.7 103.8 106.9
o.o o.o o.o o.o o.o o.o o.o o.c.:>.o o.o o.o o.o o.o 0.0 o.o o.o OtO 0 f', . ,
o. o. o.
197. 293. 226 • 239. 242. 312. 229.
o. 419. 382. 421. 365. 323. 428. 348. 254.
o. o. o. o.
143. 247. 344.
o. o. o. o. o. o. 0. o. o. o. o. o. o. o. o. Ot · .. :+
o .
301. 18

c
DATE/TIME BEST TRACK IGMTI LAT, LONG,
6 800 6 806 6 812 6 818
. 6 900 6 906 6 912 6 918 61000 61006 61012 61018 61100 61106 61112 61118 61200 61206 61212 61218 61300 61306 61312 61318 61400 61406 61412 61418 61500 61506 61512 61518 61600 61606 61612 61618 61700 61706 61712 61718 61800 61806 61812 61818
o.o o.o o.o o.o o.o
' o. 0 o.o o.o o.o o.o o.o o.o o.o o.o o.o o.o o.o o.o o.o
14.1 14.1 14.0 14.0 14.1 14.3 14.5 14.8 15.6 16.3 17.0 17.7 18.4 18.'7 19.3 19.5 19.7 19.9 20.1 20t2 20Y3 20.3 o.o o.o o.o
o.o o.o o.o o.o o.o o.o o.o o.o o.o o.o o.o o.o o.o o.o o.o o.o o.o o.o o.o
109,9 110.1 110.4 110.7 110.8 111.2 111.6 112.2 112.6 . 112.9 113.1 113.3 113,6 113.7 113.7 113.8 113.9 114.0 114 f .3
114 '6 115.0 115.1
o.o oio o.o
MEAN VECTOR ERRORS !N.MI! NUMBER OF CASES
OPERATIONAL POSIT I ON LAT. LONG,
oio o.o o.o o.o o.o o.o o.o o.o o.o o.o o.o o.o o.o o.o o.o o.o o.o o.o o.o
13.9 14.0 14.0 13.9 13.8 13.8 13.9 13.8 15.6 16.2 17.0 17,8 18.7 19.1 19.4 19.5 19.6 20.1 20.7 20.2 20.2 20i2 2{•.2
C·.O o.o
o.o o.o o.o o.o o.o o.o o.o o.o o.o o.o o.o o.o o.o o.o o.o o.o o.o o.o o.o
109.6 109.7 110. 1 110.3 110.8 111.3 111.7 112.0 112.6 112.5 113,0 112.9 113.3 113.5 113.4 i13,4 113.4 113.4 112.9 114 d)
11 ~L 7 1.15.2 115.6
0 ()
o.o
BORIS
POSITION 24 HOUR FORECAST 48 HOUR FORECAST ERROR ERROR ERROR !N.MI,I LAT. LONG, IN,MII LAT. LONG, IN.MI,)
o.o o.o o.o o.o o.o o.o o.o o.o o.o o.o o.o o.o o.o o.o 0.0 o.o o.o o.o o.o
21.0 23.8 17.2 23.6 18,0 30.5 36.4 61.1 o.o
23.2 ..,,
23. 2·L 16.4 17.9 22.4 28t7 35~7
86.4 3:L6 17.9 12,7 o.o u.o oio
o.o o.o o.o OtO. o.o o.o o.o o.o o.o o.o o.o o.o o.o o.o o.o o.o o.o o.o o.o
14.0 14.0 13.9 14 ol 13.8 14.2 14.5 14.2 17.5 19.! 20.9 21,5 22~5
21..7 21.3 20.7 20.8 21.5 22.4 20.5 o.o 0.0 o.o Ott) OtO
o.o o.o o.o o.o o.o o.o o.o o.o o.o o.o o.o o.o o.o o.o o.o o.o o.o o.o o.o
110.0 110.0 111.2 111.7 11::?.8 113.2 113.6 114.2 113.5 l:l3.o 114.6 112.5 113.7 1J.4,:~
113.1 iLLS 113.6 113.5 11 i. 8 114.4
o.o o.o o.o o.o VtV
TABLE 5. BORIS - PART 2
o. o. o. o. o. o. 0. 0. o. o. o. o. o. 0' o. o. o. o, o.
48. 77. 29. 25.
109. 127. 154. 229.
73. 28.
113. 130. :i 75 ~ 108.
38. <)[,
72~
123. 250.
0,. o, •) T
O, 1,),
o,
J.(l~;.
1'>
o.o o.o o.o o.o o.o o.o o.o o.o o.o o.o o.o o.o o.o o.o o.o o.o o.o o.o o.o
14.1 14.2 14.0 14.5 14.4 15.1 16.0 15.1 20.4 2:1..0 25.6 o.o o.o f),()
o.o 21.4
OtO 22tR 23.8 o.o o.o o.o (J f 0 o.o o.o
o.o o.o o.o o.o o.o o.o o.o o.o \),0 o.o o.o o.o o.o o.o o.o o.o o.o o.o o.o
111.2 111.5 112.6 113.7 114.8 114.8 115.1 116.3 113.4 114.4 115.8
o.o o.o o.o o.o
113.7 t) t 0
113.7 11 (1 + 3
o.o o.o o.o o.o o.o 0+/:-
o. o. o. o. o. o. o. o. o. 0, o. 0. o. o. 0. o. 0. o. 0.
121. 133, 181. 203, 272. 251. 226. 312.
48. 78 ..
..,."}!;:' ..jw..Jc
0.
0' 0. o. 0. o~
0. 0. o. o. 0. o. \f,
0 ,.
196. 11
72 HOUR FORECAST ERROR
LAT. LONG, IN,MI,)
o.o o.o o.o o.o o.o o.o o.o o.o o.o o.o o.o o.o o.o o.o o.o o.o o.o o.o o.o
14.2 14.2 14.2 15,8 15.8 16.2 18.5 17.0 21.5 o.o o.o o.o o.o o.o o.o
·o .o (),0
24.0 o~o
o.o o.o o.o o.o o.o o.o
o.o o.o· o.o o.o o.o o.o o.o o.o o.o o.o o.o o.o o.o o.o o.o o.o o.o o.o o.o
112 .o 112.2 114.1 116.8 116.8 116.9 116.2 1n.a 111.2
o.o o.o o.o o.o o.o o.o o.o o.o
114.2 o.o o.o o.o o.o (J,(i
1),0 o.o
o. 0. o. o. 0. o. o. o. o. 0. o. o. o. 0. o. o. o. o. o.
280. 303. 315. 295. 300. 308. 229. 289. 211.
o. o • 0. o. 0. o. o. 0 t
~) .. 0 +
\!i
(i ..
'J. o. o. o.
28l. 9
)

DATE/TIME BEST TRACK <GMT) LAT. LONG,
61700 61706 61712 61718 61800 61806 61812 61818 61900 61906 61912 61918 62000 62006 62012 62018 62100 62106 62112 62118 62200 62206 62212 62218 62300 62306 62312 62318 62400 62406 . 62412 62418 62500 62506 62512 62518 62600 62606 62612 62618
o.o o.o 14.0 103.3 14.0 103.6 14.0 104.1 14.0 104.1 14.0 105.3 14.0 105.9 14.0 106.5 14.1 106.9 14.2 107.3 14.3 107.7 14.4 108.2 14.7 108.7 14.8 109.4 14.8 110.2 14.6 111.0 14.5 111.8 14.6 111.9 14.8 112.0 15.1 112.1 15.5 112.5 16.0 112.9 16.4 113.3 16.9 113.8 17.3 114.2 17.8 114.7 18.3 115.2 18.8 115.6 19.4 116.2 19.8 116 .• 8 20.0 117 •. 6 20.1 118.3 20.2 119.1 20.2 120.1 20.5 121.9 21.0 121.9 21.5 122.6 o.o o.o o. 0 o.o o.o o.o
MEAN VECTOR ERRORS IN.MII NUMBER OF CASES
OPERATIONAL POSITION LAT, LONG.
o.o 14.0 14.0 14.1 14.2 14.2 14.3 14.0 14.0 14.1
"14.2 14.4 14.6 15.0 15.0 15.0 14.5 14.5 14.5 15.1 15.6 16.0 16.5 16.9 17.4 18.0 18.6 18.9 19.4 20.0 20.4 20.1 20.2 20.2 20.5 21.3 21.6 21.0 o.o o.o
o.o 102.2 103.0 103.9 104.6 105.0 105.8 106.5 106.7 107.1 107.8 108.1 109.7 109.7 110.3 111.0 111.8 112.3 112.3 112.2 112.4 112.9 113.3 113.7 113.9 114.5 114.8 115.6 116.1 116.7 117.6 118.2 119.0 120.0 121.0 121.8 122.6 124.0
o.o o.o
CF:ISTINA
POSITION 24 HOUR FORECAST ERROR ERROR (N,MI.I LAT. LONG, IN.Mil
o.o 63.8 34.8 13.0 31.3 21.0 18.9 o.o
13.0 13.0 8.3 5.7 6.0
21.0 13.3 24.0 o.o
23.7 24.9 5.7 8.2 o.o 6.0 5.6
17.7 16.4 28.6 6.0 5.6
13.2 24.0
5.6 5.6 5.6
50.1 18.8 6.0 o.o o.o O .. ·J
TABLE 6.
o.o 14.3 14.4 14.9 14.6 15.0 14.7 14.4 14.6 14.3 14.5 15.0 15.3 15.4 15.6 15.0 14.3 14.8 14.8 15.5 17.6 17.5 18.2 19.7 19.2 19.8 20.8 21.0 21~3
21.9 21.8 20.2 20.7 20.4 21.4 23.5 24.2
o.o o.o o.o
o.o 102.9 104.9 106.3 106.2 107.7 108.6 109.2 106.2 108.9 uo.o 109.8 111.1 112.9 113.2 114.1 115.1 114.8 113.0 113.1 113.3 114 .a 114.9 115.3 114.5 116 .o 116.3 117.5 118.0 119.2 120.8 120.7 122.0 123.8 125.0 124.8 125.[
o.o 0 .G· o.o
o. 122. 53. ~~ .. J..J.
46. 64. 55. 64.
145. 63. 35. 70. 63. 64. 84.
110. 175. 131. 103.
91. 36. 35. 25. 21. 91. 41. 77. 67. 87.
111. 79. 90. 64. 38. o. 0. o. o. o. o.
74. 33
48 HOUR FORECAST ERROR
LAT. LONG, (N,MI,)
o.o 14.3 14.9 15.4 15.4 16.8 16.0 15.1 14.4 14.7 15.3 15.8 16.3 15.8 16.4 15.5 14.4 14.9 15.0 15.9 19.2 18.8 19.4 20.1 21.1 'l1 ~ .:...a.t.J
22.1 22.3 22.7 23.0 22.8 20.4 21.2 21.0 o.o o.o o.o o.o o.o o.o
o.o 104.8 107.2 108.7 109.7 110.0 111.2 112.0 110.6 111.1 115.0 112.0 113.6 116.2 116.2 117.2 119.1 117.6 114.6 114.5 114.8 116.9 116.7 116.7 115.0 117.1 117.4 118.9 119.6 121.4 122.8 123.2 124.6 126.5
o.o o.o o.o o.o o.o o.o
o. 134. ~~
""' 69. 75.
109. 79. 58. 70. 71.
164. 44. 81.
191. 167. 218. 350. 2~8. 216. 191. 75. 73. 79. 85.
231. 180. 223. 172. 179. 188.
0. o. o. o. o. o. tj.
o. o. o.
141. 29
72 HOUR FORECAST ERROR
LAT. LONG, <N.MI.l
o.o 14.7 15.1 15.8 16.5 19.0 17.1 16.4 15.2 15.2 16.0 16.3 17.3 16.1 17.2 16.0 14.6 15.1 15.0 16.5 20,2 19.5 20.4 20.9 23.0 22.7 22.8 22.9 24.0 23.8 21.0 20.4 o.o ·:·. 0 o.o o.o o.o o.o o.o o.o
o.o 107.4 109.7 111.0 112.1 111.7 114.7 115.0 113.0 113.5 115.0 114.6 116.2 119.5 119.5 1'20.3 123.1 120.4 117.0 116.5 116.9 119.3 118.9 118.4 115.2 118.5 118.9 120.4 120.6 123.5 121.0 123.2
o.o o.o o.o o.o o.o o.o o.o o.o
o. 135. 35. 48.
121. 272. 209. 180. 42. 59.
102. 63.
132. 309. 281. 320. 494. 362. 326. 237. 118. 58.
118. 192. 419. 323 •
o. o. o. 0. o. o. o. o. o. o. o. iJ.
0. o.
1.98. 22

/ ~
DATE/TIME BEST TRACK IGMTl LAT. LONG,
62500 62506 62512 62518 62600 62606 62612 62618 62700 62706 62712 62718 62800 62806 62812 62818 62900 62906 62912 62918 63000 63006 63012 63018 7 100 7 106 7 112 7 118 7 200 7 206 7 212 7 218 7 300 7 306 7 312 7 318
10.3 10.3 10.4 10.4 10.5 10.6 10.9 11.3 11.9 12.4 12.6 12.7 12.8 13.0 13.1 13.4 13.8 14.0 14.3 14.6 14.9 15.1 15.3 15.6 15.9 16.3 16.7 17.1 17.4 17.7 17.7 17.8 17f8 17.8 17.9 o.o
106.5 107.4 108.3 109.3 110.4 111.5 112.5 113.5 114.3 115.3 116.1 117 .o 117.9 118.9 119.8 120.7 121.8 122.8 123.9 125.0 126.1 127.2 128.1 128.8 129.6 130.2 130.8 131.5 132.2 133.3 134.4 135.4 136.5 137.6 138.8
o.o
MEAN VECTOR ERRORS (N,Mil NUMBER OF CASES
OPERATIONAL POSITION L?1T, LONG,
10.5 10.5 10.5 10.5 10.5 10.6 10.8 11.4 11.7 12.7 13.2 13.0 12.8 13.0 13.0 13.3 13.7 14.0 14.1 14.6 14.9 15.2 15.4 15.5 15.8 16.3 16.7 17.3 17.4 18.0 18.0 17.9 17.8 17.9 o.o o.o
106.5 108.5 108.2 109.4 110.3 111.8 112.8 113.2 114.0 115.2 116.2 116.8 118.1 118.9 119.8 120.4 121 :a 122.8 123.8 125.0 126.1 127.2 128.2 123.9 129.8 130.2 130.9 131.4 132.2 133.0 134,0 135.4 136.3 137.4
o.o o.o
DOUGLAS
POSITION 24 HOUR FORECAST ERROR ERROR IN.MI.l LAT. LONG, <N.Mil
12.0 65.5 8.4 8.4 5.8
17.5 18.5 18.4 21.1 18.9 36.5 21.4 11.6 o.o 6.0
18.3 6.0 o.o
13.3 o.o o.o 6.0 8.3 8.3
12.9 o.o 5.7
13.3 o.o
24.9 29.1
6.0 11.4 12.9 o.o o.o
TABLE 7.
11.4 11.1 10.6 11.2 11.3 11.1 11.4 12.8 12.9 15.8 14.8 13.7 13.0 13.5 13.3 14.2 14.8 15.2 14.4 15.4 15.9 16.3 16.4 16.2 16.8 17.7 18.3 18.7 18.2 19.4 18.5 18.0 17.7 18.1 18.4 o.o
110.7 112.0 111.9 113.0 114.3 116.7 117.2 117.0 117.2 118.2 119.6 120.1 121.8 122.7 123.8 123.5 126.3 127.3 127.7 128.8 130.4 131.7 132.3 132.5 133.2 132.7 133.3 134.2 135. Jl 136.4 137.7 139.9 140.3 14L4 143.9
o.o
59. 32. 54. 17. 30.
130. 123. . 17.
53. 173. 109.
30. 42. 31. 48. 90. 13.
6. 67.
8. 35. 86. 83. 91. 68. 25. 44. 8 1L 57.
101;. o. o. o. 0. o. o.
60. 30
48 HOUR FORECAST ERROR
LAT. LONG, \N.MI,l
12.4 12.0 11.5 12.8 12.4 12.2 12.3 14.2 13.9 17.5 16.2 13.9 13.3 13.8 13.7 14.4
·15 I 5 16.1 14.5 15.8 16.3 17.1 17.1 17.0 17.4 19.1 19.6 19.7 18.5 20.0 18.8 18.2 17.7 o.o
18.9 o.o
114.7 115.4 115.3 116.6 118.1 120.5 121.2 120.4 120.1 120.5 123.1 123.5 125.6 126.4 128.3 126.7 131.6 131.9 131.4 132.5 134.8 136.0 136.4 136.2 136.8 135.2 136.0 137.0 138.6 139.7 141.4 144.1 144.0
o.o 154.6
o.o
59. 44.
115. 17. 24.
105. 92. 54.
100, 248. 132.
97. 100.
96. 102. 144. 106.
99. 135. 110. 163. 180. 148.
71. 37.
144. 0. o. 0. 0. o. o. o. o. o. o.
105i 26
72 HOUR FORECAST ERROH
LAT, LONG, (N,MI,J
13.1 12.5 12.3 14.3 14.1 13.6 13.2 15.7 14.4 18.6 16.3 13.7 13.6 13.8 13.7 14.7 15.8 17.4 14.7 15.8 16.8 17.6 17.8 17.9 18.4 20.6 20.5 20.3 18.4 20,3. 18.9 18.4 17.6 o.o
"19.4 o.o
118.9 118.5 118.9 120.0 121.7 123.2 125.5 123.9 123.3 123.5 127.2 126.9 129.5 130.1 132.7 130.0 136.8 136.3 135.1 136.1 139.3 140.3 139.9 140.4 140.4 137.9 139.6 140.2 141.7 143.0 145.1 148.3 147.7
o.o J.54.6
o.o
50. 38. 67. 64. 25. 33.
113. 92.
165. 295. 79.
159. 133. 150, 208. 176. 281. 192. 208. 132. 182. 167.
o. o. o. o. o. o. o. 0. o. o. o. o. o. 0.
137. 22
\

DATE/TIME BEST TRACK <GMTl LAT. LONG,
62800 62806 62812 62818 62900 62906 62912 62918 63000 63006 63012 63018 7 100 7 106 7 112 7 118 7 200 7 206 7 212 7 218 7 300 7 306 7 312 7 318 7 400 7 406 7 412 7 418 7 500 7 506 7 512 7 518 7 600 7 606 7 612 . 7 618 7 700 7 706 7 712 7 718 7 800 7 806 7 812 7 818
10.1 101.8 10.2 102.6 10.4 103.3 10.5 104.0 10.9 104.8 11.7 105.6 12.5 106.3 13.2 107.0 13.9 107.6 14.3 108.3 14.6 109.1 15.0 109.9 15.3 110.6 15.5 111.4 15.7 112.0 15.9 112.8 16.0 113.6 16.1 114.3 16.2 115.1 16.4 116.0 16.6 116.9 16.8 117.8 17.0 118.7 17.0 119.6 17.0 120.6 16.9 121.4 16.8 122.0 16.7 122.5 16.6 122.8 16.3 123.1 15;9 123.3 15.5 123.5 15.1 123.7 15.0 123.7 14.8 123.6 14.9 123.3 15.0 123.0 15.1 122.6 15.2 122.0 15.3 121.2 15.4 120.4 15.4 119.5 15.6 117.2 15.8 115.8
MEAN VECTOR ERRORS (N,Mil NUMBER OF CASES
OPERATIONAL POSITION LAT. LONG,
9.5 101.5 9.6 102.2 9.7 102.9
10.0 104.0 10.5 105.0 11.3 105.9 12.4 106.0 13.2 107.0 13.9 107.6 14.2 108.3 14.6 109.1 14.9 109.9 15.3 110.7 15.5 111.4 15.7 112.0 15.6 112.8 16.0 113.7 16.3 114.3 16.1 115.0 16.4 116.0 16.6 116.9 16.8 117.8 17.1 118.8 17.1 119.6 17.2 120.5 17.2 121.7 17.2 122.6 17.2 122.6 16.9 123.2 16.6 123.4 16.5 123.6 15.5 123.5 15.1 123.5 15.0 123.6 14.8 123.5 14.9 123.3 15.0 123.0 15.0 122.7 15.2 122.3 15.3 121.2 15.1 120.0 15.4 119.5 15.6 117.2 15.8 115.8
ELIDA
POSITION ERROR (N.MI. l
40.0 42.9 48.1 30.0 26.7 29.6 18.3 o.o o.o 6.0 o.o 6.0 5.7 o.o o.o
18.0 5.7
12.0 8.3 o.o o.o o.o 8.3 6.0
13.3 24.9 42.0 30.5 29.2 25.0 39.9 o.o
11.6 5.8 5.8 o.o o.o 8.3
17.4 o.o
29.4 o.o o.o o.o
TABLE 8.
24 HOUR FORECAST ERROR
LAT. LONG, (N,Mil
9.9 104.4 10.1 105.6 10.1 105.8 11.1. 107.7 12.0 108.9 12.6 109.7 14.6 108.7 14.3 110.2 16.0 110.5 15.9 111.1 15.9 112.4 16.2 113.2 16.5 113.8 16.2 114.7 16.6 115.0 16.8 115.9 16.6 117.0 17.0 117.7 16.5 118.2 17.4 119.3 17.3 120.6 17.5 121.3 18.1 123.0 17.9 123.4 17.4 124.2 17.4 125.7 17.5 126.4 17.3 125.6 16.8 126.3 16.4 126.1 16.2 125.2 14.4 124.7 14.5 123.9 14.4 124.3 13.9 123.9 15.2 124.1 16.0 123.3 15.1 121.8 15.3 121.0 16.1 119.7 15.4 117.2 15.8 116.1 18.0 113.0 13.8 109.9
51. 74.
139. 133. 137. 126. 23. 40. 44. 30. 26. 43. 31. 24. 30. 25. 6.
13. 50. 25. a.
29. 59. 62. 65.
140. 171. 162. 191. 167. 129.
87. 60.
100, 121. 168. 198. 134. 220. 226.
o. o. o. 0.
89. 40
48 HOUR FORECAST ERROR
LAT. LONG. (N,MI, l
10.3 107.6 10.9 109.2 10.4 108.7 12.6 111.3 13:1 113.0 13.7 113.6 15.6 112.0 14.5 113.2 18.0 113.4 17.2 114.2 16.9 115.4 17.1 116.4 18.0 113.4 16.8 118.1 17.4 118.0 17.8 119.0 17.2 120.4 17.6 121.1 17.0 121.7 18.0 122.7 18.0 124.2 17.8 124.9 19.0 126.8 18.4 127.3 17.7 126.9 18.1 128.8 17.7 130.3 17.5 129.0 17.1 129.4 16.3 129.2 16.4 127.2 14.0 127.0 15.0 124.5 o.o o.o
13.9 124.9 15.7 124.7 o.o o.o o.o o.o
15.0 120.2 17.0 118.0 o.o o.o o.o o.o o.o o.o o.o o.o
216. 205. 253. 160. 188. 167.
6. 70.
121. 54. 53. 48.
217. 17. 49. 54. 6.
42. 53. 48. 87.
112. 237. 279. 250. 352 •. 429. 364. 390. 384. 292. 346. 261.
o. 459. 514.
o. 0. o. o. o. o. o. 0.
194. 35
72 HOUR FORECAST ERROR
LAT. LONG, (N,MI.l
11.3 110.7 11.5 112.6 10.8 111.5 14.0 114.~
13.6 117.2 14.0 117.6 16.8 115.2 14.6 114.0 19.3 116.5 18.0 117.7 17.7 118.8 17.8 119.8 18.1 120.3 17.1 121.5 18.0 121.0 18.0 123.0 17.7 124.2 18.1 124.7 17.5 125.0 18.6 126.3 18.3 128.0 18.1 128.4 19.9 130.3 18.7 131.4 17.7 131.7 18.4 132.7 17.9 134.3 17.9 132.8 17.2 132.7 16.4 132.7 16.4 130.6 14.0 129.8 16.2 125.4 o.o o.o
15.9 127.2 16.8 126.5 o.o o.o o.o o.o
15.0 119.3 18.6 117.4 o.o o.o o.o o.o o.o o.o o.o 0 .o
240. 250. 295. 142. 249. 236.
44. 158. 164. 72. 36. 44. 55. 13.
103. 53. 75.
.117. 100. 246. 322. 333. 495. 518. 526. 610. 709. 685. 743. 764. 774. 819.
o. o. o. o. o. 0. o. o. o. o. o. o.
312. 32

c
DATE/TIME BEST TRACK IGMTl LAT. LONG.
7 300 7 306 7 312 7 318 7 400 7 406 7 412 7 418 7 300 7 306 7 312 7 318 7 600 7 606 7 612 7 618 7 700 7 706 7 712 7 718 7 800 7 806 7 812 7 818 7 900 7 906 7 912 7 918 71000 71006 71012 71018
o.o o.o
15.8 16.1 16.4 16.7 17.0 17.3 17.5 17.6 17.8 17.9 18f2 18.7 19.3 19.9 20.3 20.7 21.1 21.5 22.0 22.7 23.3 23.9 24.0 24.0 23.9 23.9 23.9 o.o OtO o.o
o.o o.o
103.9 104.0 105.5 106.1 106.6 107.0 107.5 107.7 108.0 108.1 108.3 108.6 108.8 109.1 109.6 110.1 110.4 110.7 111. 3 112 .o 112.7 113.5 114.6 115.5 116.2 117.0 117.8
o.o 0·. 0 o.o
MEAN VECTOR ERRORS IN.Mil NUMBER OF CASES
OPER,HIONAL POSITION LAT, LONG,
o.o o.o
'15. 5 15.5 16.4 16.5 16.9 17.4 17t5 17.6 17.7 18.0 18.2 18.7 19.3 19.8 20.3 20.5 21.2 21.5 22.0 22.8 23.7 24.0 24.3 24.3 24.3 23,9 23.9 23.9 o.o o.o
o.o o.o
103.5 103.9 105.9 106.7 107.2 107.3 107.6 108.0 108.1 108.0 108.3 108.6 108,8 109.0 109.6 110.1 110.4 110.7 111.3 111.9 112.7 113.5 114.9 115.6 116.5 117.0 117.8 117.9
o.o o.o
\., __ /
FAUSTO
POSITION 24 HOUR FORECAST 48 HOUR FORECAST 72 HOUR FORECAST ERROR ERROR ERROR ERROR !N.MI,l LAT. LONG, CN.Mil LAT. LONG, IN.MI,I LAT. LONG, CN.MI.I
o.o o.o
29.1 36.4 22.6 36.0 34.~
17.8 5.6
16.8 8.2 8.2 o.o o.o o.o 8.1 o.o
12.0 6.0 o.o o.o 8.1
24.0 6.0
24.4 18.8 29.1 o.o o.o o.o o.o o.o
TABLE 9.
0. 0 o.o 0 .o 0. 0
15.8 106.8 16.3 107.3 17.5 109.8 17.2 110.3 17.8 110.3 19.0 109.2 18.6 109.9 18.3 110.3 18.7 108,8 19.2 108,9 19.2 109.5 20.5 109.9 21.4 110.0 21.8 110.1 21.9 111.9 21.3 112.5 22.9 112.1 23.0 112.2 23.6 113.3 25.1 114.3 26.4 114.3 25.7 115.3 25-.2 119.9 25.0 120.2 24.4 119.9 21ji4 119.2 24.1 120,9
0.0 0 tO o. 0 0 .o o.o o.o
o. o.
70. 66,
126. 134. 126.
91. 94.
100. :36. 36. 66, 11. <
25. 38. 34. 96. 58. 93. 97. 86,
174. 142. 139, 142.
o. Ot
o. 0 7
o. o.
87¥ 24
o.o o.o
16.3 17.2 18.6 17.7 19.0 20.0 19.8 19.2 20.0 20.4 19.7 21.6 23.5 23.2 23.3 21.9 24.0 24.3 24.7 26.4 29.1 27,5 25.7 o.o o.o o.o o.o o;o o.o o.o
o.o o.o
110 .o 111.2 113.5 114.0 113.4 111.4 112.2 113.0 109.8 110.4 110.8 111.5 111. 9 111.5 114.3 115.() 114.4 113.8 115.5 116.5 116.0 <
117 .o 124.3
o.o o.o o.o o.o o.o o.o o.o
o. o.
138, 189. 297. 314. 261. 136. 150. 181. 79. 68.
141. 75. 46.
120. 68.
148. 116. 177. 135. 168.
o. o. o. o. o. 0. 0.
0' 0. o.
150. 20
o.o o.o
16.8 17.8 19.4 18.6 19.8 20.7 20.9 20.0 20.9 21.4 20.3 22.3 25.0 24.2 24.4 23.0 24.7 24.9 25.5 27.1 32.1 29.7 26.1 o.o o.o o.o o.o o. o· o.o o.o
o.o o.o
113.4 11~5.2
117.0 117.0 117.0 113.8 114.8 115.6 111.8 113.0 112.3 113.2 114.0 113.5 116.9 117.3 117.0 115.9 118.7 118.8 117.1 118.5 128.4
o.o o.o o.o o.o o.o o.o o.o
o. o.
302. 372. 421. 406. 380, 180. 206t 266. 175. 158~
280, 179. 143. 193. 58. 63. o. o. o. o. o. o. o. 0. o. 0. o. o. o. o.
236. 16
) /

DATE/TIME BEST TRACK (GMTl LAT. LONG,
7 700 7 706 7 712 7 718 7 800 7 806 7 812 7 818 7 900 7 906 7 912 7 918 71000 71006 71012 71018 71100 71106 71112 71118 71200 71206 71212 71218 71300 71306 71312 71318 71400 71406 71412 71418
o.o 10.5 10.9 11.3 11.7 11.7 12.0 12.3 13.0 13.7 14.5 15.3 16.1 17.0 17.9 18.8 19.4 20.0 20.4 20.7 20.9 21.1 21.3 21.4 21.7 21.8 22.0 22.9 22.7 23.5 o.o o.o
o.o 95.5 96.1 96.8 97.8 98.8 99.7
100.4 101.4 102.2 103.2 104.3 105.1 106.1 107.0 107.8 108.4 108.9 109.0 109.0 109.0 109.0 109.1 109.3 109,6 110.0 110.3 110.6 110.8 uo. 9
o.o o.o
MEAN VECTOR ERRORS (N,Mil NUMBER OF CASES
OPERATIONAL POSITION LAT. LONG.
o.o 10.5 11.0 11.3 11.8 12.1 12.3 12.6 13.1 14.0 14.8 15.5 16.1 17.1 17.9 18.8 19.6 20.1 20.4 20.6 20.8 21.0 21.5 21.5 21.5 22.1 22.4 22.2 22.6 23.5 o.o o.o
o.o 95.5 96.0 96.8 97.8 98.8
100.3 100,7 101.3 102.0 102.8 104.3 105.2 106.0 107.0 107.7 108.5 109.3 109.4 109.4 109.4 109.0 108.7 109.1 109.6 109.4 109.7 110.7 111.1 111.0
o.o o.o
GENEVIEVE
POSITION ERROF: <N.MI. l
o.o o.o 8.3 o.o 6.0
24.0 38.6 24.8 8.3
21.2 28.8 12.0 5.6 8.2 o.o 5.5
13.2 22.8 22.0 22.8 22.8
6.0 25.0 12.5 12.0 37.5 40.8 42.4 17,5 I
5.5 o.o o.o
TABLE 10.
24 HOUR FORECAST ERROR
UH. LONG, (N.Mil
o.o 0 .o 11.7 97.6 12.7 99.0 12.6. 99.7 13.2 101.3 13.7 102.7 13.8 104.8 14.0 104.6 14.5 104.5 16.4 105.8 17.2 106.3 17.0 107.0 18.1 108.9 19.3 110.0 20.1 110.8 21.4 111.4 21.9 111.4 22.2 112.2 22.0 111.7 21.8 110.2 21.5 109.5 21.9 109.1 22.4 108.4 22.0 110.2 22.0 111.1 23.4 110.7 23.3 111.1 23.2 112.7 24.0 112.7 o.o 0 .o o.o o.o o.o o.o
o. 74. so. 59. 6.
45~
131. 92.
104. 44. 58.
115. 93. 62. 81.
122. 130. 192. 170.
64. 6.
21. 72. 30. 36. 18. o. o. o. o. o. o.
76. 25
48 HOUR FORECAST ERROR
LAT. LONG, <N.MI.l
o.o 12.4 13.5 12.4 14.4 15.4 15.0 15.2 15.8 18.0 18.1 18.2 19.3 20.6 21.3 23.0 23.4 23.4 23.0 22.8 22.4 22.8 23.2 22.6 22.8 24.5 24.0 24.0 o.o o.o o.o o.o
o.o 100.3 101.4 102.6 104.7 105.7 108.2 108.7 107.9 109.7 109.9 110.0 112.5 113.5 113.8 114.1 114.3 114.8 113.8 111.9 111.4 110.0 108.8 110.9 112.1 113.2 112.0 115.5
o.o o.o o.o o.o
o. 138. 113. 211. 106. 103. 187. 223. 231. 128. 141. 148. 197. 254. 285. 292. 284. 309. 230.
76. 21. 69. o. o. o. o. 0. o. 0. o. o. o.
178. 21
72 HOUR FORECAST ERROR
LAT. LONG. <N.MI.l
o.o o.o 13.7 103.1 14.1 103.6 14.3 105.6 15.5 108.1 16.2 108.7 16.4 111.7 16.3 113.0 16.9 111.1 19.0 114.0 18.8 113.5 19.2 113.0 20.2 115.6 21.3 117.2 21.9 116.0 23.8 116.0 24.1 117.0 24.1 117.7 23.5 116.0 23.0 114.0 22.9 114.7 23.8 112.0 23.8 109.6 23.0 112.3 23.8 112.9, o.o o.o o.o o.o
24.5 119.0 o.o o.o o.o o.o o.o o.o o.o o.o
o. 264. 30.1. 296. 247. 236. 273. 329. 253. 306. 315. 259. 345. 437. 351. 308. 337. 370.
o. o. o. o. o. o. o. o. o. o. o. o. o. o.
308, 17

I ,,
HERNAN
OPERATIONAL POSITION 24 HOUR FORECAST 48 HOUR FORECAST 72 HOUR FORECAST DATE/TIME BEST TRACK POSITION ERROR ERROR ERF:OR ERROR
<GMTl LAT. LONG, LAT. LONG. \N,MI, l LAT. LONG, 0~, Mil LAT. LONG. (N,l1I.) LAT. LONG. <N.Ml. l --------------------------------·---------------------------------·---------------------------------------------
72700 o.o o.o o.o o.o o.o o.o o.o o. o.o o. 0' o. o.o o.o o. 72706 o.o o.o o.o o.o o.o o.o o.o 0. o.o o.o 0. o.o o.o o. 72712 16.0 110.6 16.1 111.0 23. •i 18.3 114.3 68. 20.5 116.5 188. 22.1 118.8 319. 72718 16.4 111.4 16.6 112.0 36.1 18.0 115.7 49. 19.3 119.5 114. 20.2 123.3 183. 72800 16.6 112.3 16.8 112.5 16.5 18.1 116.3 49. 19.5 120,0 115. 20.0 123.1 153. 72806 16.9 113.1 17.2 113.5 29.0 18.5 117 .o 60. 19.8 120.6 146. 20.7 123.7 199. 72812 17.0 114.0 17.2 114.0 12.0 18.1 117.3 47. 19.2 120.6 122. 20.0 123.9 151. 72818 17.2 115 .o 17.2 115.5 28.6 17.6 119.7 63. 17 .. 8 124.0 1.27. 17.8 128.2 231. 72900 17.3 115.9 17.3 116.1 11.4 17.9 119,3 29. 18.7 122.7 72. 19. 1 126.3 138. 72906 17.4 116.7 17.5 117.0 18.1 18.3 120,6 59~ 19.3 123.7 120. 19.9 126.2 o. 72912 17.5 117.6 17.7 118 .o 25.8 18.6 122.1 105. 20.1 125.9 203. 22.0 129.8 o. 72918 17.5 118.4 17.6 118.6 12.9 18.4 122.0 55. 19.4 125 t ~1 141. 20.4 128.6 o. 73000 17.5 119.2 17.6 119.7 29.1 17.9 123.6 82. 18.7 127.3 158. 19.4 131. :l o. 73006 17.4 120.0 17.4 120.2 11.4 17.3 123.9 64. 17.7 127.5 o. 18.3 131.0 o. 73012 17.5 120.7 17.2 121.0 24.8 16.9 124.9 83. o.o o.o 0. o.o o.o o. 73018 17,5 121.5 17,5 121.8 17.1 17.5 125,0 47. o.o o.o 0. o.o o.o o. 73100 17.6 122.2 17.6 122.2 o.o 17.7 124.8 40. o.o o.o o. o.o o.o o. 73106 17.5 122.9 17.5 122.8 5.7 o.o o.o o,. o.o o.o o. o.o o.o o. 73112 17.4 123.6 17.5 123.6 6.0 o.o o.o o. o.o o.o o·. o.o o.o o. 73118 17.3 124.2 17.3 124.2 o.o o.o o.o o. o.o o.o o. o.o o.o o. 8 100 17.1 125.1 17.1 125.1 o.o o.o o.o o. o.o o.o o. o.o o.o o. 8 106 o.o o.o o.o o.o o.o o.o o.o 0. o.o o.o 0. o.o o.o o. 8 112 o.o o.o o.o o.o o.o o.o o.o o. o.o o.o ' o. o.o o.o o. 8 118 o.o o.o o.o o.o o.o o.o o.o 0. o.o o.o o. o.o o.o o.
MEAN VECTOR ERRORS (N,MII 60. 137. 196. NUMBER OF CASES 15 11 7
TABLE 11.

DATE/TIME BEST TRACK CGMTl LAT. LONG,
8 300 8 306 8 312 8 318 8 400 8 406 B 412 8 418 8 500 8 506 8 512 8 518 8 600 8 606 B 612 8 618 8 700 8 706 B 712 8 718 8 BOO 8 806 8 812 8 818 8 900 8 906 8 912 8 918 81000 81006 81012 81018 81100 81106 81112 81118 81200 81206 81212 81218
o.o o.o o.o
14.0 14.1 14.2 14.3 14.4 14.6 14.8 15.0 15.4 16.0 16.6 16.8 17.0 17.2 17.4 17.7 17.9 18.0 18.1 18.2 18.3 18.5 18.8 19.1 19,5 20.0 20.5 21.3 22.1 22.9 23.7 24.3 24.9 25.4 25.8 26.4 o.o
o.o o.o o.o
96.4 97.2 97.9 98.7 99.3
100.0 100.7 101.5 102.5 103.5 104.5 105.6 106.9 108.1 109.3 110.6 112.0 113.1 114.0 114.8 115.5 116.3 117.0 117.7 118.2 118.7 119.2 119.8 120.4 121.0 121.7 122.3 122.9 123.5 124.0 124.2
o.o
MEAN VECTOR ERRORS (N,MII NUMBER OF CASES
OPERATIONAL POSITION LAT • LONG,
o.o o.o o.o o.o o.o o.o
13.0 99.0 14.2 96.5 14.2 97.2 14.1 99.4 14.4 99.6 14.9 100.1 14.9 100.8 15.0 101.5 15.3 102.5 15.8 102.8 16.1 103.6 16. a. 104.7 17.0 106,9 17.2 108.1 17.4 109.4 17.6 110.7 18.0 112.1 18.0 113.1 18.0 113.9 18.1 114.8 18.1 115.4 18.4 116.4 18.6 117.1 18.9 117.9 19.3 118,6 19.8 118.9 20.5 119.7 21.2 120.0 22.1 120.0 22.9 121.1 23.8 122.0 24.8 122.8 25.0 123.0 25.2 123.3 25.8 124.0 26.3 124.2 o.o o.o
!SELLE
POSITION 24 HOUR FORECAST ERROR ERROR (N,MI,) LAT. LONG, (N,Mll
o.o o.o o.o
161.8 40.8 40.2 42.1 17.2 18.9
8.3 o.o 6.0
41.5 59.1 50.8 o.o o.o 5.6 8.2 8.2 o.o 8.2 6.0
13.2 8.2
13.2 16.2 25.0 16.2 27.4 12.5 21.9 5.5
17.5 40.6 8.1
16.2 o.o 6.0 o.o
o.o o.o o.o
13.3. 14.2 14.4 14.3 15.0 16.2 15.5 15.7 16.4 17.5 17.4 18.4 17.7 17.6 18.2 18.4 19.0 18.1 18.1 18.5 18.3 18.8 19.8 19,9 20.6 20.7 22.0 24.2 25.5 25.5 26.5 28.7 27.3 26.1 o.o o.o o.o
o.o o.o o.o
102.7 97.8 99.6
101.7 103.0 102.9 103.9 104.6 105.8 105.4 106.8 107.9 111.7 113.0 114.3 115.5 117.7 117.1 117 o4 118.4 118.6 120.3 120.0 121.1 121.6 121.6 122.3 121.9 121.3 123.0 125.8 125.4 125.1 124.7
o.o o.o o.o
o. 0. o.
192. 140.
76. 44. 34. 25. 40. 66. 73.
156. 149. 167.
29. 25. 26. 44.
142. 44. 35. 37. 60. 99. 45.
100. 127. 135. 109. 61. 97. 24.
106. 158.
0. o. o. o. o.
83. 32
TABLE 12.
48 HOUR FORECAST 72 HOUR FORECAST ERROR ERROR
LAT. LONG. (N,MI,J LAT. LONG. (N,MI,J
o.o o.o o.o
13.7 14.3 15.2 14.5 15.8 17.4 16.2 16.5 17.7 18.8 18,8 19.8 18.4 18.4 19.3 19.5 20.3 18.4 18.5 19.2 18 .• 5 19.5 20.9 21.0 22.0 21.7 23.2 27.0 28.5 27.4 28.0 31.2 o.o o.o o.o o.o o.o
o.o o.o o.o
106.3 99.4
102.9 104.2 106.6 106.1 106.9 107.9 109.3 108.1 110.2 111.1 115.3 116.7 119.1 120.2 122.5 121.5 120.7 122.0 121.8 124.0 122.9 124.2 125.0 124.6 125.0 124.0 122.9 124.2 129.0 127.6
o.o o.o o.o o.o o.o
o. o. o.
241. 217.
67. 141.
74. 115. 161. 174. 161. 289. 216. 233.
19. 17.
121. 135. 228. 170. 133. 165. 239. 261. 181. 241. 211. 222. 165.
43. 0. o. o. o. o. o. o. o. o.
166. 28
o.o o.o o.o
14.2 14.8 16.5 14.8 16.5 18.3 17.6 17.5 18.9 19.9 20.0 20.6 19.3 19.4 20.3 20.6 21.2 18.9 19.3 20.0 19.0 20.1 21.4 22.0 24.2 21.9 24.1 28.7 29.0 28.1 29.3 o.o o.o o.o o.o o.o o.o
o.o o.o o.o
109.5 102.5 107.0 107.0 110.2 109.8 111.5 112.0 113.0 111.6 113.7 113.9 119.0 119.8 123.8 124.5 128.0 126.0 123.5 125.5 125.0 127.7 125.8 127.5 127.3 127.7 128.0 126.5 124.9 125.1 132.3
o.o o.o o.o o.o o.o o.o
o. o. o.
225. 354. 148. 271. 141. 189. 139. 164. 145. 287. 210. 248. 23. 56.
231. 255. 449. 365. 283. 325. 377. 391. 282. 315.
o. o. o. o. o. 0. o. o. o. o. o. o. o.
245. 24

I ./ ) \-...._
r ' ""
OPERATIONAL POSITION 24 HOUR FORECAST 48 HOUR FORECAST 72 HOUR FORECAST DATE/TIME BEST TRACK F'OS I TI ON ERF:OR ERROR ERROR ERROR
<GMT> L1iT, LONG, LAT. LONG, (N,ML) LAT. LONG, \N,MIJ LAT. LONG, <N .MI.) LAT. LONG. (N, MI,)
---------------------------------------------------------------------------------------------------------------81500 H.5 98.8 14.4 99.0 12.9 15.1 101.5 68. 16.3 104.5 59. 17.6 108.6 155. 81506 14.5 99.5 14.4 99.7 12.9 15.0 102.7 49. 16.0 105.8 187. 17.2 109 .·9 217. 81512 14.6 100.4 14.4 100.3 13,3 15.0 103.4 72. 16.4 106.8 238, 18.0 110.2 230. 81518 15.0 101.3 15,0 101.5 11.3 16.5 105.4 81. 18.4 109.2 196, 20.0 113.5 341. 81600 15.4 102.1 15.5 102.6 28.8 17.7 106.7 152. 19.6 110.4 243. 21.3 114.0 381. 81606 15.8 102.7 15.8 102.9 11.3 17.4 106.2 170. 19.1 109.4 159. 20.7 112.7 285. 81612 16.1 103.3 16.2 103.5 12.8 17.9 106.8 212. 19.5 110.1 190. 21.0 114.0 346. 81618 16.5 103.9 16.4 104.0 8.2 18.1 106,8 71. 19.8 110.2 154. 21.6 114.0 341. 81700 16.8 104.5 17.2 104.1 32.9 19.0 104.5 97. o.o o.o 0. o.o o.o o. 81706 17. 2. 105.0 18.0 103.3 106.8 o.o o.o o. o.o o.o 0. o.o o.o o. 81712 17.6 105.5. 18.2 103.1 139.4 o.o o.o o. o.o o.o 0. o.o o.o o. 81718 17.9 105.9 17.2 106.0 42.4 18.9 108.6 69. 22.0 110.0 161. 25.0 108.5 330. 81800 18.3 106.3 18.8 106.2 30.5 22.3 108.•1 175. 25.4 110.7 352. o.o o.o o. 81806 18.7 106.7 19.0 106.6 18.8 21.5 108.1 121. 24.3 108.1 259. o.o o.o o. 81812 18.9 106.9 20.1 106.8 72.2 23.7 107.8 240. o.o o.o 0. o.o o.o o. 81818 19.1 107.1 19.4 107.5 28.6 20.9 108.8 69. o.o o.o 0' o.o o.o o. 81900 19.3 107.4 19.5 107.5 13.2 20.3 108.2 18. o.o o.o o. o.o o.o o. 81906 19.5 107.6 19.5 107.8 11.1 20.6 109.4 67. 22.0 111.0 o. 23.5 111.2 o. 81912 19.7 107.8 19.7 108,0 11.1 20.9 109.4 82. o.o o.o o. o.o o.o o. 81918 19.9 108.0 19.9 108.2 11.1 21.1 109.4 109, o.o o.o 0. o.o o.o 0. 82000 20.0 108,1 20.0 108.2 5.6 20.7 108.7 o. o.o o.o o. o.o o.o o. 82006 20.0 108.3 20.0 108.4 5.6 20.6 109.0 o. o.o o.o o. o.o o.o o. 82012 o.o o.o 19.7 108.7 o.o o.o o.o o; o.o o.o o. o.o o.o o. 82018 o.o o.o 19.5 108.5 o.o o.o o.o o. o.o o.o o. o.o o.o o.
MEAN VECTOR ERRORS CN.MIJ 107. 200. 292. NUMBER OF CASES 18 u 9
TABLE 13. JULIO
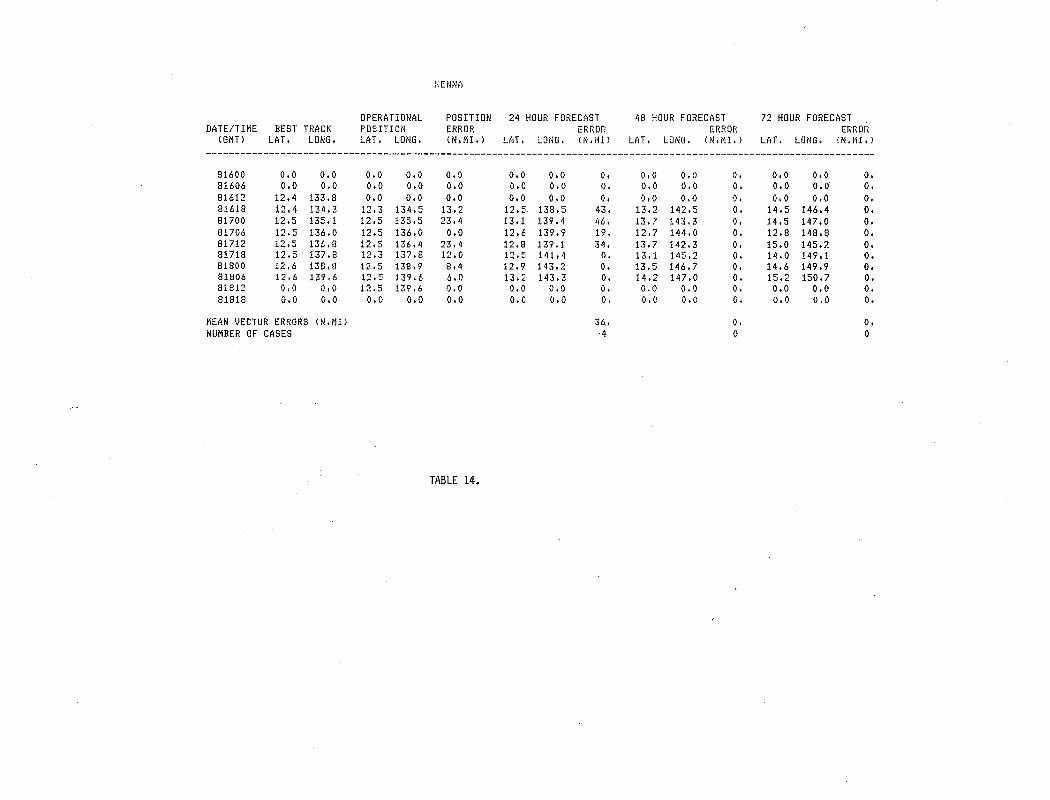
KENNA
OPERATIONAL POSITION 24 HOUR FORECAST 48 HOUR FORECAST 72 HOUR FORECAST DATE/TIME BEST TRACK POSITION ERROR ERROF: ERF:OR ERROR
<GMT> LAT. LONG. LAT. LONG. <N.rf!. > LAT. LONG. <N.Mil LAT. LONG. <N .MI. l LAT. LONG. \N,MI. l
---------------------------------------------------------------------------------------------------------------------81600 o.o o.o o.o o.o o.o o.o o.o o. o.o o.o o. o.o o.o o. 81606 o.o o.o o.o o.o o.o o.o o.o o. o.o o.o o. o.o o.o o. 81612 12.4 133.8 o.o o.o o.o o.o o.o o. o.o o.o 0. o.o o.o o. 81618 12.4 134.3 12.3 134.5 13.2 12.5. 138.5 43. 13.2 142.5 0. 14.5 146.4 o. 81700 12.5 135.1 12.5 135.5 23.4 13.1 139.4 46. 13.7 143.3 o. 14.5 147.0 o. 81706 12.5 136.0 12.5 136.0 o.o 12.6 139.9 19. 12.7 144.0 o. 12.8 148.8 o. 81712 12.5 136.8 12.5 136.4 23.4 12.8 139.1 34. 13.7 142.3 0. 15.0 145.2 o. 81718 12.5 137.8 12.3 137.8 12.0 12.5 141.4 0. 13.1 145.2 o. 14.0 149.1 o. 81800 12.6 138.8 12t5 138.9 8.4 12.9 143.2 o. 13.5 146.7 o. 14.6 149.9 o. 81806 12.6 139.6 12.5 139.6 6.0 13.2 143.3 o. 14.2 147.0 0. 15.2 150.7 o. 81812 o.o o.o 12.5 139.6 o.o o.o o.o 0. 0.0 o.o o. o.o o.o o. 81818 o.o o.o o.o o.o o.o o.o o.o o. o.o o.o 0. o.o 0.0 o.
MEAN VECTOR ERRORS <N.Mil 36 .• o. o. NUMBER OF CASES '4 0 0
TABLE 14.

\
LOWELL
OPERATIONAL POSITION 24 HOUR FORECAST 48 HOUR FORECAST 72 HOUR FORECAST D?lTE/THIE BEST TRACK POSITION ERROR ERROR ERROR ERROR
\GMTl LAT. LONG, LtH. LONG, (N,MI. l LAT. LONG. (N.MI) LAT. LONG. \N, MI. l LAT. LONG. (N,MI.)
------------------------------------------------------------------82600 o.o o.o o.o o.o o.o o.o o.o o. o.o o.o o. o.o o.o o. 82606 15.6 114. 1 13.1 117.0 223t5 13. 1 120.8 252~ 13.8 123.8 253. 15.2 126.7 327. 82612 15.7 114.8 13.2 118.0 237.1 13,3 121.. 9 263. 13.3 125.8 333. 13.4 130,0 484. 82618 15.8 115.7 15.8 115.7 o.o 16.2 119 .o 68. 16.9 122i7 96. 18.0 125.7 300. 82700 16.0 116,8 16.0 116., 8 o.o 17.0 121.3 13. 18.2 125.5 104, 19.4 129.1 265. 82706 16.2 117.8 16.3 118.0 12.6 17.7 122.2 31. 19.4 126.0 82. 21.3 129.2 214. 82712 16.5 118.9 16.5 118.6 ~ ~
,Jo.J 17.5 122.7 26. 19.2 126.0 78. 20.1 129.8 o. 82718 16.7 120.0 16.8 120.0 6.0 18.0 123.7 21. 19.2 127.7 210. 20.3 131.5 o. 82800 17.0 120.9 17.2 121.2 20.5 18.7 126.0 108. 20.0 129.3 230. 21.8 132.7 o. 82806 17.4 121.6 17.5 121.7 8,2 18.5 124.9 114. 19.8 128.2 314. 20.9 131.1 o. 82812 17.8 122.6 17.7 122.3 17.6 18.7 125.1 119. 19.8 128.0 o. 21.2 131.3 o. 82818 18.7 123.7 18.3 123.5 26.4 20.1 126.6 164. 21.7 129.6 0. 23.0 132.9 o. 82900 19.7 124,7 19.5 124.3 25.1 23,0 126.9 110. 25.7 129.1 o. o.o o.o o. 82906 20.6 125.6 20.4 125.0 35.2 22.9 127.7 166. 24.0 129.2 o. o.o o.o 0. 82912 21.7 126.7 20.5 126.0 81.7 22.6 129.2 o. 24.0 132.1 0. o.o o.o o. 82918 22.7 127.5 22.7 127.5 o.o 26.2 131.0 0. o.o o.o 0. o.o o.o o. 83000 23.8 128,7 23.8 128.7 o.o 27.1 133.5 o. o.o o.o 0. o.o o.o o. 83006 24.8 129.9 24.8 129.9 o.o o.o o.o 0. o.o o.o o. o.o o.o o. 83012 o.o o.o o.o o.o o.o o.o o.o o. o.o o.o 0. o.o o.o o. 83018 o.o o.o o.o o.o o.o o.o o.o o. o.o o.o 0. o.o o.o o.
MEAN VECTOR ERRORS <N.Mil 112. 189. 318. NUMBER OF CASES 13 9 5
TABLE 15.

DATE/TIME BEST TRACK !GMTI LAT. LONG.
9 500 9 506 9 512 9 518 9 600 9 606 9 612 9 618 9 700 9 706 9 712 9 718 9 800 9 806 9 812 9 818 9 900 9 906 9 912 9 918 91000 91006 91012 91018 91100 91106 91112 91118
o.o o.o
16.8 17.2 17.6 18,0 18.7 19.3 20.0 20.8 21.5 22.4 23.4 24.3 25.0 25.9 27.0 28.0 28.6 29.0 29.3 29.8 30.2 30.4 30.5 o.o o.o o.o
o.o o.o
104.4 105.3 106.1 107.3 108.3 109.5 110.6 111.6 112.3 112.9 113.3 113.9 115.0 115.9 116.2 117.0 118.0 119.0 119.6 120.0 120.3 120.5 120.6
o.o o.o o.o
MEAN VECTOR ERRORS (N,MII NUMBER OF CASES
OPERATIONAL POSITION LAT. LONG.
o.o o.o
16.0 16.5 17.2 17.6 18.4 19.3 20.0 20.9 21.7 22.7 23.5 24.3 25.0 25.9 27.0 28.0 28.8 28.9 29.4 29.7 30.3 30.4 30.5 o.o o.o o.o
o.o o.o
106.0 106.3 106.0 107.4 -109.2 110.0 111.0 111.7 112.3 112.7 113.5 113.9 115.0 115.9 116.2 117.1 117.7 119.4 119.9 120.0 120.3 120.5 120.6
o.o o.o o.o
MARIE
POSITION 24 HOUR FORECAST 48 HOUR FORECAST 72 HOUR FORECAST ERROR ERROR ERROR ERROR IN.MI.I LAT. LONG. IN.MII LAT. LONG. IN.MI.I LAT. LONG. IN.MI.I
o.o o.o
101.0 69.2 24.6 24.6 51.4 26.5 21.3 a.o
12.0 20.8 11.9 o.o o.o o.o o.o 5.2
19.6 21.5 16.6
6.0 6.0 o.o o.o o.o o.o o.o
o.o o.o
16.5 17.6 18.4 19.2 20.4 22.8 22.2 24.1 25.5 25.9 26,8 27.8 28.1 29.0 31.2 31.3 32.2 29.6 30.5 o.o o.o o.o o.o o.o o.o o.o
o.o o.o
108.0 108.6 108.6 111.8 113.9 115.0 114.2 115 .o 114.5 114.0 115.1 115.1 117.4 118 .s 116.6 119.9 120.8 121.8 122.7
o.o o.o o.o o.o o.o o.o o.o
0, 0.
133. 129. 166, 102. 119. 127. 87. 61. 40.
103. 60.
107. 45. 32.
202. 96.
117. 83.
109, o. o. 0. o. o. o. 0.
101. 19
o.o o.o
' 17.7 19.8 19.5 21.0 22.7 26.0 24.5 26.7 29.5 28.4 29.3 30.4 30.0 31.0 o.o
33.6 33.0 30.5 31.8 o.o o.o o.o o.o o.o o.o o.o
o.o o.o
110.1 111.3 111.3 115.6 117.6 116.6 116.6 116.7 113.8 116.0 116.1 115.9 120.0 122.2
o.o 123.0 123.5 124.2 124.9
o.o o.o o.o o.o o.o o.o o.o
o. 0.
270. 191. 270. 219. 198.
38. 152.
81. 209. 182. 199. 217.
24t 95. 0. o. o. o. 0. o. 0. 0. o. o. o. 0.
167. 14
o.o o.o
19.5 21.2 21.1 22.8 25.0 27.3 25.0 29.0 o.o
29.8 31.0 o.o
30.8 o.o
'o.o o.o o.o o.o o.o o.o o.o o.o o.o o.o o.o o.o
o.o o.o
113.8 113.9 114 .o 119.3 120.2 118.0 118.9 118.0
o.o 118.5 118.3
o.o 123.3
o.o o.o o.o o.o o.o o.o o.o o.o o.o o.o o.o o.o o.o
o. o.
337. 303. 374. 334. 264. 121. 269, 113.
o. 110. 122.
o. o. o. o. o. o. o. o. o. o. o. o. o. o. o.
235. 10
TABLE 16.

(
\
DATE/TIME BEST TRACK IGMTI LAT. LONG,
91400 91406 91412 91418 91500 91-506 91512 91518 91600 91606 91612 9.1618 91700 91706 91712 91718 91800 91806 91812 91818 91900 91906 91912 91918 92000 92006 9.2012 92018 92100 92106 92112 92118 92200 92206 92212 92218 92300 92306 92312 92318 92400 92406 92412 92418 92500 92506 92512 9251:3
o.o o.o o.o 0 .o o.o o.o
18.5 115._5 18.1 115.5 17.9 115.2 17.8 115.0 17.7 114.8 17.5 114.3 17.3 113.7 17.2 113.0 17.1 112.5 17.1 112.-{) 17.4 .111.8 17.7 111.7 17.9 111.8 18.3 112.0 18.6 112.5 18.9 112.9 19.1 113.4 19.4 113.9 19.5 114.6 19.6 115.1 19.5 115.8 19.4 1.16.3 18.9 116.7 18.3 116.7 17.8 116,5 17.3 116.1 16.9 115.4 16.6 114.4 16.5 113.3 16.5 111.9 16.5 110.8 16.6 109.7 17.0 108.9 17.4 108.4 17.8 108.3 18.3 108.3 18.8 108.7 19.3_ 109.1 19.9 109.6 20.7 110.3 21.5 111*1 22i3 23.1 24.1 25.1
112.0 112.6 113.1 113.5
MEAN VECTOR ERRORS IN.Mil NUMBER OF CASES
OPERATIONAL POSITION LAT. LONG.
o.o o.o -o.o o.o o.o o.o
18.5 115.6 18.1 115.5 17.9 115.1 18.0 115.3 17.8 114.9 17.7 114.7 17.7 114.5 17.2 113.0 17.2 112.7 17.2 112.1 17.2 111.7 17.3 111.7 18.0 111.8 18.4 112.2 18.8 112.7 18.9 113.0 19.0 113.5 19.4 114.2 1-9.6 114.5 19.8 115.2 19.7 115.8 19.4 116.4 19.1 116.8 18.6 116.9 17.8 116.6 17.5 116.3 17.1 115.4 16.8 114.6 16.6 113.3 16.5 112.0 16.5 110.8 16.7 109.7 17.1 109.0 17.5 108.5 17.6 108.4 18.4 108.5 18.9 108.8 19.3 109.0 19.9 109.6 20.7 110.5 21.5 111.4 22.3 23.1 24 I 1 'l~ -, ..:.....Jtu
112.1 112.7 113.2 113.6
TABLE 17o
', ---- _.--/
NORBERT
POSITION 24 HOUR FORECAST 48 HOUF: FORECAST 72 HOUR FORECAST ERROR ERROR ERROR ERF:OR IN.MI.l LAT. LONG. IN;MII LAT. LONG. 0N.MI.l LAT. LONG, (N,MI,)
o.o o.o o.o 5.7 o.o 5.7
20.8 8,3
25.4 51.1 o.o
12.8 8.2
13.3 24.0 a.o
12.7 16.4 5.7 8.3
17.0 8.3
13.3 12.0 5.7
13.3 21.3 5.7
16.5 12.0 16.4
6.0 5.6 o.o 6.0 8.2 8,2
13 .• 3 12.8 8.2 5.6 o.o
11.3 16.9 5.6 5.6 5.6
13.3
o.o o.o o. 0 o. 0 o.o o.o
18.6 117.2 17.3 1i6.5 17.6 114.1 18.5 115.7 18.2 115.0 18.0 113.4 17.9 113.7 17.5 111.9 17.5 111.7 17.4 111.0 17.8 110.5 17.8 111.2 19.5 112.0 20.6 114.9 20.3 115.7 19.9 115.0 19.2 115.6 20.5 116.3 20.4 116.5 20.7 . 117.7 19.6 118.4 19.2 118.5 17.7 118.4 17.3 118.0 17.0 116.0 17.2 114.0 17.3 113.0 17.5 111.8 17.0 110.0 18.7 106.4 18.5_ 106.8 19.1 106.7 21.1 106.0 20.0 106.7 19.2 107.8 20.9 108.1 20.9 111.3 21.1 110.3 21.9 111.7 23.1 113.7 25.7 115.7 26.3 26.1 o.o
30.1
115.3 115.1
o.o 112, B
o. o. o.
140. 106.
24. 173. 145. 88.
122. 17. 31. 91.
139. 122.
90. 82. 80. 13. 32. 66. 80.
134. 149. 162. 175. 197. 157. 122. 135. 130,
58. 140. 106. 111. 206. 137. 110. 13~.
36. 124.
91. 66.
116. o .. o. o, 0 ~
103. ~1
o.o 1l .-o o.o
18.9 17.-8
o.-o 18.9 18. -s 19 • .3 19.3 18.-1 18.3 18.2 18.7 -18.4 21.0 22.J 22.1 20.4 19.5 21.·6 2t.1 21.8 20.0 18.9 17.0 17.)' 17.7 17.8 18.1 18.2 17.9 o.o o.o
22.3 o.o o.o
21.8 -24 .o 22.2 22.8 .,-, ~
..:.,,_. t I
25.3 30.3
o.o o.o o.o
119.0 117.6
.o-.o 116.4 115.4 112.1. 114.4 111."5 111.1 110.3 11-Q. 0 110.8. 113.0 11.8.3 118.5 117.0 117.8 118.7 118.5 120.0 120.9 120.8 120.2 120.4 115.4 11.3. 0 111.0 111.0 109.4
o.o o.o
105.0 0,() o.o
107.7 107.3 114.4 112.8 113.t• 116.7 118.5
30.5 117.5 27'.t2 11iL9
OTO o.o (•;o 0 0 f 0
o. o. o.
374. 317.
o. 285. 207. 54.
101. 98.
143. 233. 261. 263. 176. 'l'l~ .:..4.Jt
2{)4. 108. 123. 281. 297. 428. 479. 523. 541. 616. 368. 258. 151. 143.
69. o. o.
322. o. o.
288. 323. 191.
o. 0 I
o, o. 0. o. :)
o.
264{ 32
o.o o.o o.o
19.3 18.0 o.o
19.2 18.8
.23 .o 20.0 18.9 19 • .3 19.7 19.8 19.0 22.1 24.8 2:4.1 20.4 19.9 22.3 21.5 22.9 20.~
19.3 16.6 18.3 20.1 18.8 19.9 21.6 18,9 o.o o.o o.o o.o
. o. 0 23.7
-0.0 22.9 24~2
2t.i4 27.6 32.9 0~0
O, C• OvO G ~ C·
o.o o.o o.o
121.5 119.2
o.o 117.2 115.8 111.0 116.6 111.3 110.9 110.2 109.9 110.4 114.5 122.0 120,8 119.1 120.3 121.2 120.5 122.7 123.4 122.8 122.2 125.3 114.0 111.2 110.0 110.4 109.7
o.o o.o o.o o.o o.o
107.2 o.o
117.7 115! 7 113.3 118,3 11P. I·::
(L·:• -{i 10 •) ~ 0 (·to')
o. o. o.
557. 400-.
o. 239. 131. 281. 121. 227. 278. 351. 393. 370. 284. -542 • 518. 335. 44~.
626. h27. 823. 847. 821. 794. 957. 303, 128.
23. 54i
183, o. o. o. o. o. o. o. o. {) t
1.), .
Ot o. i}, vj 01· 0~
·~ t.; • .-:i
:I

OIIILE
'OPEF:ATIONAL POSITION 24 HOUR FORECAST 48 HOUR FORECAST '72 HOUR FORECAST DATE/.:YIME BEST TRACK POSITION ERROR ERROR ERROF' ERROR
<GMTl LAT. LONG. LAT, 'LONG, <N .MI. l LAT. LONG, <N.MI l LAT. LONG, <N.MI. l LAT. LONG, <N.MI.l ----------------------------------------------------------------------------------------------------------------------.
91700 o.o o.o o.o o.o o.o . o.o o.o o. .·o. o o.o o. o.o o.o o. 91706 o.o o.o o.o· o.o o.o o.o o.o 0. . ... o.o o.o o. o.o . o.o . o. 91712 o.o o.o o.o o.o o.o o.o o.o o. o.o .o .o 0. o.o o.o . o. 91718 14.3 101.5 14.0 101.7 21.4 14.6 105.1 54. 15.8 108.2 205. 17.1 111.2 460. .91800 14.5 102.2 14.4 102.2 6.0 15.0 105.7 68. 16.6 ·109 .5 276. t-8.3 .113.2 622. 91806 14.7 102.9 15.0 103.2 24.8 16.8 106.0 104. 18.3 108.6 258. 19.8 111.5 '577. 91812 15.0 103.6 15.0 103.7 5.7 16.3 106.5 65. 17.5 109.3 283. 18.7. 112.0 640.
. 91818 15.2 104.1 15.2 104.4 17.2 16.1 107.3 151. 17.3 110.3 409. 18.8 113.2 ~ 718. 91900 15.4 104.5 15.4 104.6 5.7 16.4 106.6 109. 18.0 109.3 400. '19.8 112.6 700.
,91906 15.7 104.9 15.5 104.8 13.3 16.4 106.7 127. 17.8. 108.7 .392. 19.7 110.8 602. . 91912 16.0 105.0 15.8 105.5 30.9 16.9 107.9 198 •.. 18.3: 110.4 546. 20.0 113.3 668. . ?1918 16.3 104.7 16.4 104.7 6 .o· 16.4 106.7 202. 17.3 109.5 497 • 18.9 -112.4 ·594. . 92000 " 16.5 104.5 16.4 104.7 12.9 16.7 104.9 139. 17.8'·:·107.0 361. 19.0 109.4 o.
92006 16.6: 104.1 16.5 104.5 23.5 17.4 104.4 148. 19.0 105.5 308. ·'20.9"'•·107.8 o. 92012 16.6 103.6 16.4 . 104.5 52.6 17.5 104.7 219. 19.0 105.7 243. . 21.3 107.3 o.
. 92018 16.6 ·103.2 16.7 103.2 6.0 17.3 101.7 71. o.o o.o o. o.o o.o o. . ,5,'2100 16.6 102.6 16.5- ~.102.5 8.3 " 16.6 100.2 44. •. '0.0 ;<· o.o o. o.o. o.o o.
9.2106 16.4 101.9 H.:;i 102.0 8.3 16.8 100.l 44. ., .·o.o· . , o.o o. o.o o.o o. 92112 16.3 101.2 16.3 101.1 5.7 16.4 98.6 199. :o.o. . o.o o. o.o o.o o.
.. 92118 16.4 100.9 16.4 100.9 o.o 16.7 101.7 so. •17.3 103.1 o. 17.? 104.7 o. 92200 16.4 100.8 16.3 100.9 8.3 17.2 101.1 o. o.o .o.o 0. 0.0 o.o o.
!: . 92206 i6.~ 100.7 16.5 100.8 5.7 17.1 100.7 0. o.o ·; o.o o. o.o., o.o o. 92212 17.0 . 102.0 t7 .o '102.0 o.o 19.5 106.7 0. ~· o.o· o.o o. o.o·· o.o o. 92218 18.0 102.0 18.0 102.0 o.o o.o o.o 0. o.o ,Q .o o. o.o o.o o.
cMEAN VECTOR ERRORS <N.Mil 119. 348. 620. NUMBER OF CASES 17 12 9
. '
TABLE 18.

/ \ '·
DATE/TIME BEST TRACK (GMTJ LAT. LONG.
92600 92606 92612 92618 92700 92706 92712 92718 92800 92806 92812 92818 92900 92906 92912 92918 93000 93006 93012 93018
10 100 10 106 10 112 10 118 10 200 10 206 10 212 10 218 10 300 10 306 10 312 10 318
12.9 12.8 12.7 12.6 12.5 12.4 12.3 12.2 12.3 12.4 12.7 13.0 13.4 13.9 14.4 15.1 15.6 16.1 16.7 17.3 18.0 18.6
-19.4 20.0 20.8 21.7 22.2 22.6 23.2 23.8 24.5 o.o
97.6 98.2 98.8 99.5
100.4 101.3 102.4 103.5 104.2 104.8 105.5 106.2 106.7 107.3 107.9 108.6 109.3 110 .o 110.7 111.5 112.5 113.4 114.1 114.5 114.4 114.2
. 113,8 113. 1 112.3 111.3 109.9
o.o
MEAN VECTOR ERRORS (N,MIJ NUMBER OF CASES
OPERATIONAL POSITION LAT, LONG,
13.6 11.6 13.5 13.5 12.5 12.4 12;2 12.2 12.2 12.2 12.6 13.0 13.4 13.6 14.4 15.1 15.6 15.9 16.9 17.3 17.9 18.6 19.4 20.0 20.7 21.6 22.5 22.8 23.1 23.8
.24 .8 o.o
100.5 100.1 97.0 96.0
100.5 100.5 102.3 103.5 104.5 104.9 105.0 106.1 106.7 107.3 107.9 108.5 109.2 109.7 110.4 111.3 112.2 113.5 114 .o 114.4 114.3 114.0 113.8 113.0 112,3 111.2 109.9
o.o
. .,
POLO
POSITION 24 HOUR FORECAST 48 HOUR FORECAST 72 HOUR FORECAST ERROR ERROR ERROR ERROR <N,MI,J LAT. LONG, (N,MII LAT. LONG, <N.MI,I LAT. LONG, (N,MI.I
173.8 131.7 115.1 210.3
5.8 46.3 8.3 o.o
18.3 13.3 29.3
5.7 o.o
18.0 o.o 5.5 5.6
20.4 20.4 11.0 17.6 5.5 5t5 ~ r. .Jo.J
8.1 12.6 18.0 13.2 6.0 5.5
18.0 o.o
TABLE 19.
14.1 12.0 13.5 13.6 12.9 12.7 12.8 12.8 12.5 12.4 13.1 14.7 14.7 14.9 16.4 17.9 17.2 17.4 19.6 19.9 20.2 21.4 24.0 23.4 24.0 25.5 25.7 24.5 24.5 o.o 0. 0 . o.o
104.6 103.6 98.1 97.1
102.9 102.3 105.3 107.8 108.3 107.7 106.9 109.0 109.4 109.5 110.2 110.5 111.8 110.6 112.6 113.7 119.4 116.3 113.6 114.0 112.5 111.1 112.6 112.6 110.2
o.o o.o o.o
258. 183. 258. 384. 103. 155, 21.
100, 108,
76. 97. 38. 55. 61. 32. sa. 48.
180. so. 40.
288. 129. 91. 66. 55.
102. 156.
o. o. o. o. o.
119. 27
14.7 13.3 13,9 13.8 14.0 13.7 14.2 17.4 13.7 13.4 13.7 16.6 15.7 16,0 19.0 21.0 18.4 20.0 23.6 23.3 22t1 25.5 o.o o.o o.o o.o o.o o.o o.o o.o o.o o.o
107.7 106.7 100.0
99.3 105.5 104.6 108.0 111.5 111.8 110 .a 109.3 112.0 112.2 112.0 112.0 111.6 114.4 112.5 112.3 114.2 113.9 114·. 8
o.o o.o o.o o.o o.o o.o o.o o.o o.o o.o
240. 124. 302. 400. 79.
158. 13.
221. 189. 163, 202.
58. 132. 178. 116. 168. 138. 128. 106.
73. 107. 221.
0. 0. o. o. 0. o. o. o. o. 0.
160. 22
15.0 16.0 14.3 14.1 14.5 15.0 15.6 15.9 15.1 15.1 14.3 18.5 16.0 17.0 21.7 24.0 19.0 22.7 o.o o.o o.o o.o o.o o.o o.o o.o o.o o.o o.o o.o o.o o.o
110.6 111.0 101.9 103.0 108.0 107.1 110.5 115.0 115.3 114.3 111.9 114.6 115.2 115.1 112.0 112.0 116.9 110.9
o.o o.o o.o o.o o.o o.o o.o o.o o.o o.o o.o o.o o.o o.o
246. '>~n .::...JOt
349, 325t 96.
160. 78.
229. 245, 215,. 329,
91. 287. .,nor ..;...0-..~
111. 91.
356. 68. 0. 0. o. o. 0. o. o. 0. o. o. o. o. 0. 0.
212. 18
.(
\1

DATE/TIME BEST TRACK (GMTl LAT. LONG,
10 700 10 706 . 10 712 10 718 10 BOO 10 806 10 812 10 818 10 900 10 906 10 912 10 918 101000 101006 101012 101018 101100 101106 101112 101118 101200 101206 101212 101218 101300 101306 101312 101318 101400 101406 101412 101418 101500 101506 101512 101518 101600 101606 101612 101618
o.o o.o o.o o.o o.o o.o
11.2 97.0 11.3 98.0 11.4 99.0 11.4 100.0 11.5 101.0 11.6 102.1 11.8 103.0 11.9 103.8 12.1 104.5 12.3 105.2 12.6. 105.9 12.9 106.7 13.2 107.3 13.4 108.2 13.5 109.1 13.6 109.9 13.6 110.5 14.0 111.9 14.2 112.9 14.4 113.9 14.6 114.8 14.8 115.4 15.0 115.9 15.3 116.4 15.5 117.0 15.6 117.5 15.6 117.9 15.6 118.3 15.5 118.5 15.5 118.7 15.4 118.9 15.3 119.1 15.3 119.3 15.3 119.5 15.2 119.7 15.2 119.9 o.o o.o
MEAN VECTOR ERRORS <N.Mil NUMBER OF CASES
OPERATIONAL POSITION LAT. LONG,
o.o o.o o.o
11.2 11.2 11.4 11.5 11.5 11.6 11.8 12.1 12.3 12.3 12.4 12.5 12.9 13.3 13.5 13.8 13.7 14.1 14.2 14.5 14.6 15.0 16.0 16.0 15.5 15.8 16 •. 1 1·5 f 2 o.o o.o o.o o.o
15.8 15.4 15.3 15.2 o.o
o.o o.o o.o
97.0 97.2 99.0
100.0 101.0 101.9 103 • .2 104.2 104.6 105.3 105 •. 6 106.1 106 •. 8 106,7 106.6 106.6 110.8 112.0 112.9 113.9 114.8 11.5.8 114.8 114 .a 116.9 117.6 118.1 117.7
o.o o.o o.o o.o
118.8 119.9 120.1 119.9
o.o
RACHEL
POSITION 24 HOUR FORECAST 48 HOUR FORECAST 72 HOUR FORECAST ERROR ERROR ERROR ERROR CN.MI,l LAT. LONG, (N,Mil LAT. LONG, <N.MI.l LAT. LONG. (N,MI.l
o.o o.o o.o o.o
47.1 o,o 6.0 o.o
11.6 11 •. 6 26.0 13.3 5.8
21.1 42.0 33.9 85 •. 9
142.7 188.7
18.1 8.3 o.o 6.0 o.o
25.8 86.8
100.5 5.7
13.3 32.1 41.8 o.o o.o o.o o.o
41.4 23.6 23·6 o.o o.o
o.o o.o o.o
12.0 11.4 11.6 11.9 12.1 12.2 13.1 12.5 13.7 13.4 13.4 13.5 14.3 15.4 15.0 15.7 14.6 16.0 15.0 15.6 15.6 16.2 18.4 16,6 16.3 o.o o.o o.o o.o o.o o.o o.o
17.0 16.1 15.4 1.1)42 o.o
o.o o.o o.o
100 •. 6 99.7
103.0 103.7 104.7 105.6 107.3 107.7 107.6 108.3 108.0 108.3 108.7 107.3 106.0 106,2 114.3 115.4 114 .a 117.4 117.1 119.6 114.5 115.5 119 .o
o.o o.o o.o o.o o.o o.o o.o
120.1 120.6 121.4 120.7
o.o
o. o. o.
38. 130,
17. 32. 13. 19.
108. 94. 67. 94. 82.
101. 127. 284. 403. 452.
29. 64. 60,
152. 13.
118. 248. 152.
o. o. o. o. o. o. 0. o. o. o. o. o. o.
121. 24
o.o o.o o.o
13.5 12.3 12.7 12.6 12.9 13.3 14.7 15.2 15.6 15.0 14.8 15.1 16.3 17.8 17.5 17.8 o.o o.o o.o o.o o.o o.o o.o o.o o.o o.o o.o o.o o.o o.o (\,0 o.o o.o o.o o.o o.o o.o
o.o o.o o.o
104,3 102.9 106.8 106.8 108.0 109.1 110.8 110.0 110.1 111.6 110.8 110.6 110.5 107.2 105.4 105,9
o.o o.o o.o o.o o.o o.o o.o o.o o.o o.o o.o o.o o.o o.o o.o o.o o.o o.o o.o o.o o.o
o. o. o.
74. 141.
73. 41. 70.
140. 255. 215. 121. 59.
127. 195. 269. 523. 548. 522.
o. 0. o. 0. o. o. o. o. o. 0. o. o. o. 0. 0. 0. o •. 0. 0. 0. o.
211. 16
o.o o.o o.o o.o o.o o.o
15.3 107.9 13.7 106.1 13.8 110.4 13.6 109.8 14.0 111.0 14.7 112.5 17.0 114.0 18.2 112.5 18.1 112.6 17.0 114.6 16.0 113.7 17.3 113.2 18.5 112.1 20.0 105.6 o.o o.o
20.7 105,3 o.o o.o o.o o.o o.o o.o o.o o.o o.o o.o o.o o.o o.o o.o o.o o.o o.o o.o o.o o,o o.o o.o o.o o.o o.o o.o o.o o.o o.o o.o o.o o.o o.o o.o o.o o.o 0.0 C• .0 o.o o.o o.o o.o
o. o, o.
158. 42.
222. 187,
21. 46.
180. 236. 245 .. 139.
63. 121. 329. 730.
o. 781.
o. o. o. o. o. o. o. o. o. o. o. 0. o. o. o. o. o. ),
o. o. o.
233. 15
TABLE 20.

(l
DATE/TIME BEST TRACK IGMTI LAT. LONG,
103100 103106 103112 103118 11 100 11 106 11 112 11 113 11 200 11 206 11 212 11 218 11 300 11 306 11 312 11 318 11 400 11 406 11 412 11 418 11 500 11 506 11 512 11 518 11 600 11 606 11 612 11 618 11 700 11 706 11 712 11 718
13.1 13.1 13.1 13.3 13.6 14.0 14.3 14,5 14.6 14.8 15.0 15.3 15~4
15.2 14.9 14.5 14.2 13 .a 13.6 13.7 14.2 14.6 15.0 15.6 16.0 16.2 16.2 16,3 16.2 16.2 16.0 17.7
98.4 99.2
100.2 101.4 102~7
104.0 105.7 107.3 108.7 110.4 112.1 113.8 115.4 117.0 118.7 120.1 121.6 123.2 124.6 126.1 127.4 128.4 129.2 1 ~0 Q
.:.. 1 tu
130.2 130.4 130.7 130.9 13L 1 131.4 132.3 133.3
MEAN VECTOR ERRORS IN,MII NUMBER OF CASES
OPERATIONAL POSiTION LAT, LONG,
13,2 13.3 13.5 13.3 13.1 13.9 14.4 16.0 17.6 14.8 15.0 15.2 16.1 16.5 16.5 14.6 14.2 13.7 13.3 13.5 13.4 14.2 14·. 9 15.4 16.0 16.8 17.4 17 .o 16.9 17.0 17.0 16.1
98.5 99.3
100.2 101.3 102,2 103,9 105.0 107.0 107.6 110.4 112.2 113.8 115.6 117.6 119.3 120.0 122.0 123.0 124.3 126.0 127,8 128.7 129.5 129.9 130 ., , 130.3 130.6 130.5 130.8 131.0 131.3 131.8
SIM011
POSITION 24 HOUR FORECAST ERROR ERROR IN.MI.I LAT. LONG, IN,MII
n -z Ot>.~
13.3 24.0 ~ Q .Jou
41.7 8.3
40.6 91.6
190.7 o.o 5.7 6 .o .
43.5 85.2
101. 9 8.3
23.1 13.0 25.0 13.3 53t3 29d~
18.3 13.3 11.5 36.5 72~2
47.9 45.4 53.3 83.3
129.3
13.7 102.4 14.1 103.0 14.6 104.0 13.7. 105.2 13i5 106')2 15.3 108.4 16.0 109.7 17.9 111.9 23t7 109~2
17.0 115.0 17.0 116.9 17.2 119.0 18.2 121.4 18v6 123.7 17.5 125.1 14.0 124~7
13.5 127.8 13.2 127.4 12.4 129.9 13.8 130.4 13.7 133.7 15.3 132.7 16.4 133.0 16.2 132.1 o. 0 0 .o 0 .o 0 .o
19.6 .l30t4 o. 0 o.o
17.2 131.1 17.4 132~0
17.4 132.6 16.0 133.1
38. 54. 59.
173. 259. 120. 157. 195. 582. 152. 141. 166. 242. 297. 256.
81. 6.
97. 154. 100. 236. 156. 150. 104.
o. 0.
164. 0' o. o. o. o.
1t.6. 25
TABLE 21.
48 HOUR ~DRECAST 72 HOUR FORECAST ERROR ERROR
LAT. LONG, IN.MI,J LAT. LONG. IN.MI,)
15.0 14.9 15.8 15.3 14.5 16.2 17.5 19.7 o.o
20.4 20.7 20.4 19.0 20.6 18.3 14.6 13.7 14.0 12. '7 14.3 o.o o.o o.o o.o o.o o.o o.o o.o 0.0 o.o O,•:J o.o
106.2 105.9 107.9 108,3 109.6 111.8 114.0 112.4
o.o 116.0 118.5 122.3 126.6 128.5 127.5 127.7 133.0 131. 1 132.7 132.7
o.o o.o o.o o.o {).0 o.o o.o o.o •) ~ 0 o.o o.o o.o
176. 261. 253. 318. 360. 334. 310, 53:·~ i
of 568, "~~ ..... •.J..Jl
465. 343. 384. 234. 136, 204. 172. 296. 206,
0. 0. o. o. o. 0. 0. 0' 0. o~
o. of
322. 19
17.0 108.0 16.7 108.4 18.6 110.8 17.7 110.4 16.6 112.1 16.5 115.6 21.1 115.0 2i·7 111.0
0+0 o.o 24.6 113.5 24.0 118.9 23.3 124.6 19.9 131.8 o.o (• .o
18.6 130.2 16.2 129.6 14.0 138.1 o.o o.o
14.5 135.2 o.o o.o o.o o.o o.o o.o o.o o.o o.o o.o o.o o.o o.o o.o o.o o.o o.o o.o o.o o.o G, 0 · 0 .o o.o o.o o.o o.o
440. 529. 502t 584, 590. 460. 709, 989,
0. 1063, 811. 561 .. 247.
o. 76. 71.
457. o.
271. o. o. 0. o. o. o. o. o. o. o. 0. 0. o.
52:3 f
16

'·
NOAA Technical Memoranda NWS WR: (Continued)
121 Clirniltological Prediction of Cumulonirnbus Clouds in the Vicinity of the Yucca Flat Weather Station. R. F. Quiring, June 1977. (PB-271-704/AS) 122 A l-1ethoo for Transforming Temperature Distribution to Normality. Morris S. Webb, Jr., June 1977. (PB-271-742/AS) 12~ Statistical Guidanco for Prediction of Eastern Nm·th Pacific Tropical Cyc:lone Motion- Part I. Charles J. Neumann and Preston W. Left~;ich, August 1977.
(PB-272-661) 125 Statistical Guidance on the Prediction of Eastern North Pacific Tropical Cyclone Motion - Part II. Preston W. Leftwich and Charles J. Neumann, August
1977. (PB-273-155/AS) . 127 Development of a Probability Equation for Winter~Type Precipitation Patt!!rns in Great Falls, Montana. Kenneth B. Mielke, February !978.(PG-281-387/!IS) 128 Hand Calculator Program to Compute Parcel Thermal Dynamics. Dan Gudgel, April 1978. (PB-283-080/AS) 129 Fire Whirls. David W. Goens, May 1978. (PB-283-866/AS) . · 130 Flash-Flood Procedure. Ralph C. Hatch and Gerald Williams, May 1978. (PB-286-014/AS) 131 !lutomated Fire-Weather Forecasts. Mark A. Mollner and David E. Olsen, September 1978. (PB-289-916/AS) 132 Estimates of the Effects of Terrain Blocking on the Los Angeles WSR-74C Weather Radar. R. G. Pappas, R. Y. Lee, B. W. Finke, October 1978. (PB289767/AS) 133 Spectral Techniques in Ocean Wave Forecasting. John A. Jannuzzi, October 1978. (PB291317/AS) 134 Solar Radiation. John A. Jannuzzi, November 1978. (PB291195/AS) 135 Application of a Spectrum Analyzer in Forecasting Ocean Swell in Southern California Coasta 1 Waters. La~<rence P. Ki erulff, January 1979. ( PB292716/ !IS) 136 Basic Hydrologic Principles. Thomas L. Dietrich, January 1979. (PB292247/AS) 137 LFM 24-Hour Prediction of Eastern ,Pacific Cyclones Refined by Satellite Images. John R. Zimmerman and Charles P. Ruscha, Jr., Jan. 1979. (PB294324/AS) 138 A Simp1e Analysis/Diagnosis System for Real Time Evaluation of Vertical Motion. Scott Heflick and James R. Fors, February.l979. (PB294216/!IS) 139 Aids for Forecasting Minimum Temperature in the Wenatchee Frost District. Robert S. Robinson, April 1979. (PB298339/AS) 140 Influence of Cloudiness on Summertime Temperatures in the Eastern Washington Fire Weather District. James Holcomb, April 1979. (PB298674/AS) 141 Campa rison of LFM and MFM Preci pi tati on Guidance for Nevada During Doreen. Christopher Hi 11, Apri 1 1979. ( PB298613/AS) 142 The Usefulness of Data from Mountaintop Fire Lookout Stations in Determining Atmospheric Stability. Jonathan W. Corey, April 1979. (PB298899/AS) 143 The Depth of the Ma.rine Layer at San Diego as Related to Subsequent Cool Season Precipitation Episodes in Arizona. Ira S. Brenner, May 1979.
(PB298817/AS) 144 Arizona Cool Season Cl imatol ogi ca 1 Surface Wind and Pressure Gradient Study. Ira S. Brenner, May 1979. ( PB298900/AS) 145 On the Use of Solar Radiation and Temperature Models to Estimate the Snap Bean Maturity Date in the Willamette Valley. Earl M. Bates, August 1979.
(PBSD-160971) 146 The BART Experiment. Morris S. Webb, October 1979. (PBB0-155112) !47 Oocurrence and Distribution of Flash Floods in the Western Region. Thomas L. Dietrich, December 1979. (PB80-160344) 149 ~1isinterpretations ot Precipitatiun Pr·obai.dlity f"orecusts. !\l1J.n H. Murphy~ Snr~h Lichtenstein, 3uruclt Fischhoff, and Robert L. Winkler, February
1980. (PBS0-174576) 150 Annual Data and Verification Tabulation - Eastern and Central North Pacific Tropical Storms and Hurricanes 1979. Emil B. Gunther and Staff, EPHC,
Apri 1 1980. ( PBS0-220486) 151 NMC Model Performance in the Northeast Pacific. James E. Overland, PMEL-ERL, April 19P.O. (PBR0-196033) 152 Climate of Salt Lake City, Utah. Wilbur E. Figgins, October 1984. 2nd Revision. (PB85 123875) . !53 An Automatic Lightning Detection System in Northern California. James· E. Rea alld Chris E. Fontana, June 1980. ( PBB0-225592) 154 Regression Equation for the Peak Wind Gust 6 to 12 Hours in Advance at Great Falls During Strong Downslope Wind Storms. Michael J. Oard, July 1980.
(PB81-108367) 155 A Raininess Index for the Arizona Monsoon. John H. TenHarkel, July 1980. (PBSl-106494) !56 The Effects of Terrain Distribution on Summer Thunderstorm Activity at Reno, Nevada. Christopher Dean Hill, July 1980. (PBBl-102501) 157 An Operational Evaluation of the Scofield/Oliver Technique for Estimating Precipitation Rates from Satellite Imagery. Richard Ochoa, August 1980.
(PBSl-108227) 158 Hydrology Practicum. Thomas Dietrich, September 1980. (PB81-134033) , !59 Tropical Cyclone Effectson California. Arnold Court, October 1980. (?881-133779) 160 Eastern North Pacific Tropica 1 Cyc,-one Occurrences Ouri ng Intraseasonal Periods. Preston W. Leftwich and Gail M. Brown, February 1981. ( PB81-205494) 161 Solar ~adiation as a Sole Source of Energy for Photovoltaics in Las Vegas, .Nevada, for July and December. Darryl Randerson, April 1981. (PBB!-224503) lo? A Systems Approach to Reol-Time Runoff Analysis with a Detenninistic Rainfall-Runoff Model. Robert J. C. Burnosh and R. Lrwry frTr;,l, April l9R\.
I "I''(] -?24~9b) 16:.< ~ Cr<mporison of Tl-10 Methods for F01·ecasting Thunderstorms at Luke A·ir Force llase, Arizona. Lt. Colonel Keith R. Cooley, April 1981. (riJBl-2?.5393) 164 Ao Objective Aid for Forecasting Afternoon Relative Humidity Along the Washington Cascade East Slopes. RobertS. Robinson, April 1981. (P!1H1-2JI11i\) JGj Annua I Data and Verification Tabulation, Eastern North Pacific Tropical Storms and Hurricanes 1980. Ernil 8. Gunt.her and Staff May J98l. (Pgf\2-2303.16) 166 Preliminary Estimates of Wind Power Potential at the Nevada Test Site. Howard G. Booth, June 1981. (PB82-127036) ' 167 ARAP User's Guide. Mark Mathewson, July 198!. (revised September 198!). (PBR2-1967R3) 168 Forecasting the Onset of Coastal Gales Off Washington-Oregon. John R. Zimmerman and William D. Burton, August 1981. (PB82-127051) 169 A Statistical-Dynamical·Model for Prediction of Tropical Cyclone Motion in the Eastern North Pacific Ocean. Preston W. Leftwich, Jr., October 1981. 170 An Enhanced Plotter for· Surface Air~<ays Observations. Andrew ,1. Spry and ,lrffrr.y L. Anderson, October 19fl!. (PP.R2-l53RB3) 171 Verification of 72-Hour 500-mb Map-Type Predictions. R. F. Quirin9, November 1981. iPilR2-15Rngs) 172 Forecasting Heavy Snow at Wenatchee, Washington. James W. Holcomb, December 1981. (PSHZ-177783) 173 Central San Joaquin Valley Type Maps. Thomus R. Crossan, Oecomhor 1981. (PBfQ-l%0n4) 174 ARAP Test Results. Mark A. Mathewson, December 1981. IPB82-193!03) 175 .n.nnual Data anrl Veri 'i cation Tabulation Eastern ~lorth racifi c Tropical Storms anrl Huni canes 1931. Emi 1 ·~- Gunther and Staff, ,lune 1982. ( P1182-252420) 176 Approximations to the Peak Surface Wind Gu-sts from Desert. Thunrlerstorms. Darryl RandPrson, Junre 1.982. (PB82-253089) 177 Climate of Phoenix, ft.ri zona. Robert J. Schr1i dl i, Arril 1 ~6° (revised Ma'rch 1983). (PB83246801) 178 Annual Data and Verification Tabulation, Eastern North Pacific Tropical Storms and Hurricanes 1982. E. B. Gunther, .June 1983. (PB85 106078)
179 Stratified Maxim~ Temperature Relationships Between Sixteen Zone Stations in Arizona and Respective Key Stations. Ira s. Brenner, June 1983 • (PB83-24Sl.904) 180 Standard HydrologJ.c Exchange Format (SHEF) Version I. Phillip A. Pasteries, Vernon C. Bissel, David G. Bennett, August, 1983. (PB85 i06052) 181 Quantitative and Spacial Dist-ribution of Winter Precipitatic•n Along Utah 1 s Wasatch Front. Lawrence B. Dunn, AuguE:t~ 1983. (PBSS 106912) 182 500 Millibar sign Frequency Teleconnection Cha't'tS - Hinter. l~awrence B. Dunn .• Decembe't' ~ 1983.
183 500 Millibar S~gn Frequency Teleconnection Charts - Spring. Lawrep.ce B. Dunn, January, 1984. (PB85 111367
)
184 Collection and Use of Lightning Strike Data in the Western U.S. During Summer 1983. Glenn Rasch and Hark Mathewson, February, 1984, (PB85 11nc:'',l:)
i~~ ~~u~i1t!~:r a~~g~e~~f1~:~t~n T~;~~~~~~~~i~~s~~~~t~o;t~u~~ific 1~~~~~~i1BSt~~~' a~~r~~r~~~~nes(PlB9~53.11 Jt? 9i • Gunther' Harch 1984. (PB85 109635)
187 500 Milibar Sign Frequency Teleconnection Charts - Fall. Lawrence B. Dunn, May 1984. (PB85 110930) 188 The Use and Interpretation of Isentropic Analyses. Jeffrey L. Anderson, October 1984o (PB85 132694)

NOAA SCIENTIFIC AND TECHNICAL PUBLICATIONS
The National Oceanic and Atmospheric Administration was established as part of the Department of Commerce on October 3, 1970. The mission responsibilities of NOAA arc to assess the socioeconomic impact of natural and technological changes in the environment and to monitor and pcedict the state of the solid Ea1."th, the oceans and their living resources, the atmosphere, and the space environment of the Earth.
The major components of NOAA regularly produce various types of scientific and technical information in the following kinds of publications:
PROFESSIONAL PAPERS- Important definitive research results. major techniques, and special investigations.
CONTRACT AND GRANT REPORTS- Reports prepared hy contractors or grantees under NOAA sponsorship.
ATLAS- Presentation of analyzed data generally in the form of maps showing distribution of rainfall. chemical and physical conditions of oceans and atmosphere, distribution of fishes and marine mammals, ionospheric conditions, etc.
TECHNICAL SERVICE PUBLICATIONS- Reports containing data. observations, instructions, etc. A partial listing includes data serials; prediction and outlook periodicals; technical manuals, training papers, planning reports. and information serials; and miscellaneous technical publications.
TECHNICAL REPORTS- Journal quality with extensive details, mathematical developments, or data listings.
TECHNICAL MEMORANDUMS- Reports of preliminary, partial, or negative research or technology results, interim instructions, and the like.
Information on availability of NOAA. publications can be obtained from:
ENVIRONMENTAL SCIENCE INFORMATION CENTER (D822) ENVIRONMENTAL DATA AND INFORMATION SERVICE
NATIONAL OCEANIC AND ATMOSPHERIC ADMINISTRATION U.S. DEPARTMENT OF COMMERCE
6009 Executive Boulevard Rockville, MD 20852