Embed Size (px)
Citation preview

U.S. Department of CommerceEconomics and Statistics AdministrationU.S. CENSUS BUREAU
Annual Benchmark Report forRetail Trade and Food Services:January 1992 Through March 2002
BR/01-A
Current Business Reports
A Detailed Summary of Retail Sales, Purchases, AccountsReceivable, and Inventories, and Food Services Sales
Issued May 2002

Anne Russell, Assistant Division Chieffor Service Sector Statistics Division’sRetail and Wholesale Indicator Programs,provided general direction in preparingthis report. Nancy Piesto, Chief, MonthlyRetail Surveys Branch, supervised the plan-ning, implementation, and compilation ofthe monthly retail sales and inventory esti-mates with assistance from Vicki Garrettand Jean Swann. Patricia Borgstede,Gary Buffington, Gwenn Byrne, JohnBywaters, Eleanor Daniels, KelvenJones, Siretta Kelly, Marian Martin,Christopher Pece, Anthony Rivetti,Amelia Sharpe, Sandra Wise, andRussell Young performed analyses andprocessing.
Scott Scheleur, Chief, Retail and Whole-sale Indicators Branch, supervised thecompilation of annual sales, inventories,purchases, and accounts receivables withassistance from Judy Ross Davis,Maggie Anderson, Joan Brown,Kathleen Denton, Dorothy Engleking,James Erbacher, Louis Garner, CherylGeter, Mark Govoni, EldridginaHouston, Jan Lattimore, James Millet,Eddie Moy, and Danielle Murrie-Robinson.
Richard E. Hanks, Chief, Annual SurveysProcessing Branch and Willard E.Caldwell, Chief, Indicators ProcessingBranch, coordinated the collection andprocessing of data through the NationalProcessing Center and the Economic Statis-tical Methods and Programming Divisionwith assistance from Daniel Banach,Janis Byrd, Deborah Chew, DavidDortch, Ron Farrar, John Guest,Jennifer Juzwiak, Debbie Kaline,Earnestine Kornegay, ElisabethMurawski, William Russo, and EvelynShaw.
Ruth Detlefsen, Assistant Division Chieffor Service Sector Statistics Division’sResearch and Methodology, gave generaldirection to the statistical methodology.Jock Black, Chief, Program Research andDevelopment Branch, supervised thedesign and development of the sampling,estimation, and variance estimationmethods with assistance fromM. Cristina Cruz, William C. Davie Jr.,Jacklyn R. Jonas, Brett C. Moore, andKelly Shaffrey.
Carol King Chief, Statistical MethodsBranch, supervised the sample control,imputation, and quality control procedureswith assistance from James Burton,
James W. Hunt, David L. Kinyon andMichael McElhatten and AnthonyMyers. Michael Shimberg assisted inthe seasonal adjustment and benchmark-ing of the estimates in this publication.
Howard Hogan, Chief of Economic Statis-tical Methods and Programming Divisionand Deborah Lee Tasky, Assistant Divi-sion Chief, for Annual Surveys and RelatedPrograms and Acting Assistant DivisionChief for Current Indicators Programsdirected the development of the computerprograms. Ronald M. Catzva, Chief, Serv-ice Sector Statistics Division’s IndicatorsBranch, directed the implementation ofmonthly programs with assistance fromPhillip Atwater, Phuong Diep, JamesFlaherty, Christine Ford, Denise Gillis,Robert Janshego, Michael Lavarn,Steven Pirrone, and Patricia Young.Barry F. Sessamen, Assistant DivisionChief, for Post Collection, directed theimplementation of annual programs withassistance from Kimberly Bankard,Tatiana A. Gallagher, CatherineKowalewski, Mark Wang, and Yung Yi.
Kim D. Ottenstein, Bernadette J.Gayle, Helen M. Curtis, Crystal M.Pate, and Laurene V. Qualls of theAdministrative and Customer ServicesDivision, Walter C. Odom, Chief, pro-vided publications and printing manage-ment, graphics design, and compositionand editorial review for print and elec-tronic media. General direction andproduction management were provided byMichael G. Garland, Assistant DivisionChief, and Gary J. Lauffer, Chief,Publications Services Branch.
Special acknowledgment is due for thecontributions made by Beth McCubbins,Larry Impett, Anthony Harley, MichaelLutz, Chris Berbert, and SandraHairston of the Economic Planning andCoordination Division, and CarleneBottorff, Chief, Economic Projects Branchand all employees for the coordination,collection, and processing of data inJeffersonville, Indiana’s National ProcessingCenter.
Special thanks are also given to the manybusinesses who provided data to thesurvey. The survey would not have beenpossible without their cooperation.
Direct all inquiries concerning this reportto Nancy Piesto, Service Sector StatisticsDivision, U.S. Census Bureau, Washington,DC 20233, telephone 301-457-2706.
ACKNOWLEDGMENTS

U.S. Department of CommerceDonald L. Evans,
Secretary
Samuel W. Bodman,Deputy Secretary
Economics and Statistics AdministrationKathleen B. Cooper,
Under Secretary for Economic Affairs
U.S. CENSUS BUREAUCharles Louis Kincannon,
Director
BR/01-A
Current Business Reports
Annual Benchmark Report forRetail Trade and Food Services:
January 1992 Through March 2002A Detailed Summary of Retail Sales, Purchases, Accounts
Receivable, and Inventories, and Food Services Sales
Issued May 2002
John H. Thompson,Principal Associate Directorfor Programs
Frederick T. Knickerbocker,Associate Directorfor Economic Programs
Thomas L. Mesenbourg,Assistant Directorfor Economic Programs
Mark E. Wallace,Chief, Service SectorStatistics Division
SUGGESTED CITATION
U.S. Census Bureau,Current Business Reports,
Series BR/01-A,Annual Benchmark Report
for Retail Trade andFood Services:
January 1992 Through March 2002,Washington, DC 20233
ECONOMICS
AND STATISTICS
ADMINISTRATION
Economicsand StatisticsAdministration
Kathleen B. Cooper,Under Secretaryfor Economic Affairs
U.S. CENSUS BUREAU
Charles Louis Kincannon,Director
William G. Barron, Jr.,Deputy Director

Text
Introduction . . . . . . . . . . . . . . . . . . . . . . . . . . . . . . . . . . . vCoverage . . . . . . . . . . . . . . . . . . . . . . . . . . . . . . . . . . . . vSummary of Changes . . . . . . . . . . . . . . . . . . . . . . . . . . . . . . vRevisions to Previously Published Estimates . . . . . . . . . . . . . . . . . . viRevisions of Sales and Inventories . . . . . . . . . . . . . . . . . . . . . . . viiDefinition of Terms . . . . . . . . . . . . . . . . . . . . . . . . . . . . . . . viii
Tables
1a. Unadjusted and Adjusted Estimates of Monthly Retail and FoodServices Sales by Kinds of Business: January 2002 ThroughMarch 2002 . . . . . . . . . . . . . . . . . . . . . . . . . . . . . . 2
1b. Unadjusted and Adjusted Estimates of End-of-Month RetailInventories and Inventories/Sales Ratios by Kinds ofBusiness: January 2002 Through February 2002 . . . . . . . . . . 3
2. Estimated Annual Retail and Food Services Sales by Kinds ofBusiness: 1992 Through 2001 . . . . . . . . . . . . . . . . . . . . 4
3. Unadjusted and Adjusted Estimates of Monthly Retail and FoodServices Sales by Kinds of Business: January 1992 ThroughDecember 2001 . . . . . . . . . . . . . . . . . . . . . . . . . . . . 5
4. Unadjusted and Adjusted Estimates of End-of-Month RetailInventories and Inventories/Sales Ratios by Kinds ofBusiness: January 1992 Through December 2001 . . . . . . . . . 25
5. Estimated Annual Purchases of Retail Stores by Kinds ofBusiness: 1992 Through 2000 . . . . . . . . . . . . . . . . . . . . 35
6. Estimated Annual Gross Margin of Retail Stores by Kinds ofBusiness: 1993 Through 2000 . . . . . . . . . . . . . . . . . . . . 36
7. Estimated Annual Gross Margin as a Percentage of Sales by Kinds ofBusiness: 1993 Through 2000 . . . . . . . . . . . . . . . . . . . . 37
8. Estimated End-of-Year Accounts Receivable of Retail Stores by Typeof Account and Kinds of Business: 2000 and 1999 . . . . . . . . . 38
9. Estimated Per Capita Retail Sales by Selected Kinds of Business:1992 Through 2001 . . . . . . . . . . . . . . . . . . . . . . . . . 39
Appendixes
A. Explanatory Material. . . . . . . . . . . . . . . . . . . . . . . . . . . A-1B. NAICS Codes, Titles, and Descriptions . . . . . . . . . . . . . . . . . B-1
CONTENTS
iii

Annual Benchmark Report for Retail Trade andFood Services: January 1992 Through March 2002
INTRODUCTION
The U.S. Census Bureau produces the Annual BenchmarkReport for Retail Trade and Food Services to providenational estimates by kind of business of annual andmonthly sales for establishments classified in the retailtrade and food services industries. Estimates of end-of-month inventories, inventory-to-sales ratios, annual pur-chases, gross margin, gross margin as a percent of sales,end-of-year accounts receivable, and per capita sales arealso provided, but only for retail establishments.
We develop the estimates in this report using data fromthe Monthly Retail Trade Survey (MRTS), Annual RetailTrade Survey (ARTS), and administrative records. For eachsurvey, questionnaires are mailed to a probability sampleof firms located in the United States and having paidemployees. The samples are updated regularly and peri-odically reselected. These samples include firms of allsizes. Administrative records data are used to account forfirms without paid employees.
Additional information on MRTS and ARTS can be found onthe Census Bureau Web site at:www.census.gov/econ/www/retmenu.html
COVERAGE
The estimates in this publication are summarized by kind-of-business classification based on the 1997 North Ameri-can Industry Classification System (NAICS). NAICS groupsestablishments into industries based on the activities inwhich they are primarily engaged. This system was devel-oped by the joint efforts of statistical agencies in Canada,Mexico, and the United States. The common industry defi-nitions allow for statistics to be compared by businessactivity across North America.
Retail trade, as defined by NAICS sector 44-45, includesestablishments engaged in selling merchandise in smallquantities to the general public, without transformation,and rendering services incidental to the sale of merchan-dise. Two principal types of establishments classified inretail trade can be distinguished:
1. Store retailers operate fixed point-of-sale locations,located and designed to attract a high volume ofwalk-in customers. They have extensive displays ofmerchandise, use mass-media advertising to attractcustomers and typically sell merchandise to the gen-eral public for personal or household use. Some store
retailers also provide after-sales services, such asrepair and installation. For example, new automobiledealers.
2. Nonstore retailers also serve the general public, buttheir retailing methods differ. Such methods include‘‘infomercials,’’ paper and electronic catalogs, door-to-door solicitation, in-home demonstration, selling fromportable stalls or through vending machines
Food services, as defined by NAICS subsector 722,includes establishments that prepare meals, snacks, andbeverages to customer order for immediate on-premisesand off-premises consumption.
New samples were introduced with the 1999 Annual RetailTrade Survey and with the March 2001 Monthly RetailTrade Survey. The new samples were designed to produceNAICS-based estimates and replace the samples designedto produce SIC-based estimates
Detailed information about NAICS and a comparisonof the SIC and NAICS systems can be found on the CensusBureau Web site at:www.census.gov/epcd/www/naics.html
A summary of changes from the prior benchmark reportand the procedures for producing NAICS-based estimatesare described below.
SUMMARY OF CHANGES
Unadjusted estimates of monthly sales were revised forJanuary 19981 through February 2002 or March 20022 (ifan advance sales estimate was computed). The revised,unadjusted sales estimates reflect results from the 1999and 2000 annual surveys. Unadjusted estimates of end-of-month inventories were also revised for January 1992through February 2002. The revised, unadjusted end-of-month inventory estimates reflect revised end-of-yearinventory estimates for the years 1992 through 1999, aswell as new 2000 end-of-year inventories. We derived
1For discount department stores (excluding and includingleased departments 4521102) and warehouse clubs and super-stores (45291) as well as aggregates that include estimates forthese NAICS codes, we revised estimates for January 1992through March 2002 due to historical annual and monthlycorrections.
2Advance sales estimates are computed for selected kinds ofbusiness and are based on a small subsample from the full retailsales and food services sample.
v
U.S. Census Bureau

revised purchases and gross margin estimates for theyears 1992 through 1999 and new purchases, gross mar-gin, and accounts receivables estimates for 2000.
New seasonal, trading-day, and holiday adjustment factorswere computed and used to adjust sales for January 19951
through February 2002 or March 20022 (if an advancesales estimate was computed). Adjusted estimates werederived beginning January 1995 instead of January 1998because the revised 1998 unadjusted estimates can affectsignificantly the computation of seasonal factors as farback as 1995. New seasonal adjustment factors were com-puted and used to adjust inventories for January 1992through February 2002. Factors for both sales and inven-tories were developed by using unadjusted estimates asinput to the seasonal adjustment program.
The revision procedures were applied to specific detailedsales and inventory series. All other sales and inventoryseries were obtained by summing appropriate detail levelestimates, thereby assuring additivity.
REVISIONS TO PREVIOUSLY PUBLISHED ESTIMATES
Annual Estimates
Sales, end-of-year inventories, and purchases for 2000were estimated from the 2000 Annual Retail Trade Survey(ARTS). For 1999, revisions were applied to the previouslypublished sales, end-of-year inventories, and purchases.There were no revisions to the previously published19983 4 annual sales estimates. However, the 1998 inven-tory estimates were revised by using the inventory-to-sales ratios estimated from the 1998 data from the ARTSNAICS-based sample. The revised 1998 inventory esti-mates were derived by multiplying the revised 1998inventory/sales ratio by the previously published 1998annual sales estimate. Revised 1992 through 1997 end-of-year inventory estimates were derived by multiplying thepreviously published inventory estimates by the ratio ofthe revised-to-previously published 1998 inventory esti-mates. A similar adjustment was made for purchases.
Estimates of Monthly Sales
For December 1997 through February 20025, monthlyretail and food services sales estimates were input to thebenchmarking program. The December 1997 through Feb-ruary 2002 estimates were developed by restating the SIC-based estimates to NAICS basis. Estimates from March2001 through February 2002 were derived from the NAICSsample. Also, for selected kinds of business correctionswere applied to the estimates. The estimates were revisedin a manner that —
• constrained the sum of the 12 monthly sales estimatesequal to the annual estimates (benchmarks) derived forthe years 1998 through 2000.
• minimized the differences between the month-to-monthchanges of the input and revised estimates.
• used the previously published December 1997 estimateto link the revised estimates to the previously publishedestimates.
A mathematical result of the benchmarking methodologyis that all input estimates following the end of the lastbenchmark year (2000) are derived by multiplying theseestimates by the ratio of benchmarked-to-input estimatefor the last month of the last benchmark year. Therefore,for a specified sales series, a ratio of the December 2000benchmarked estimate to the December 2000 input esti-mate was computed. Estimates for periods followingDecember 2000 were multiplied by these constant ratios(called carry-forward factors) to derive published salesestimates. The carry-forward factors remain constant untilthe next benchmarking operation.
Estimates of End-of-Month Inventories
For January 1992 through February 2002, monthly retailend-of-month inventory estimates were input to thebenchmarking program. The January 1992 through Febru-ary 2001 estimates were developed by restating the SIC-based estimates on a NAICS basis. Estimates from March2001 through February 2002 were derived from the NAICSsample. Also, for selected kinds of business, correctionswere applied to the estimates. The estimates were revisedin a manner that —
• equated the December or end-of-year inventory esti-mates for 1992 through 2000 to the end-of-year inven-tory estimates derived from the annual survey.
• minimized the differences between the month-to-monthchanges of the input and revised estimates.
Estimates subsequent to December 2000 were derived bymultiplying the input estimates by the ratio of the Decem-ber 2000 published estimate to the input estimate forDecember 2000. This ratio is the carry-forward factor forinventory and remains constant for all series until the nextbenchmarking operation.3For 1998 and prior years, we revised annual estimates for dis-
count department stores (excluding and including leased depart-ments 4521102) and warehouse clubs and superstores (45291),as well as aggregates that include estimates for these NAICScodes.
4The annual sales estimates for 1998 and prior years weredeveloped by restating the SIC-based estimates to a NAICS basis.
5For discount department stores excluding and includingleased departments 4521102) and warehouse clubs and super-stores (45291), we derived revised estimates for the period Janu-ary 1992 through February 2002. For these NAICS codes, we con-strained the sum of the 12 monthly sales estimates to equal theannual estimates for the years 1992 through 2000.
vi
U.S. Census Bureau

REVISIONS OF SALES AND INVENTORIES
The following table shows a comparison of the revisedsales and inventories to the previously published esti-mates for 2001:
2001 Retail and Food Services Sales andRetail Inventories Comparison of the RevisedEstimates to the Previously PublishedEstimates(Millions of dollars)
NAICScode
Kind of business RevisedPreviouslypublished
Per-cent
differ-ence
SALES
Retail and food servicessales, total . . . . . . . . . . . . 3,488,552 3,504,189 -0.4
Retail, total . . . . . . . . . . . . 3,167,842 3,183,182 -0.5
441 Motor vehicle andparts dealers. . . . . . . . . . . . . 857,550 877,989 -2.3
442 Furniture and homefurnishings stores. . . . . . . . . 91,515 92,010 -0.5
443 Electronics andappliances stores. . . . . . . . . 87,726 88,214 -0.6
444 Building mat., gardenequip., & suppliesdealers . . . . . . . . . . . . . . . . . . 297,725 292,475 +1.8
445 Food and beveragestores . . . . . . . . . . . . . . . . . . . 472,573 481,085 -1.8
446 Health and personalcare stores . . . . . . . . . . . . . . 170,291 171,761 -0.9
447 Gasoline stations . . . . . . . . . . 237,654 238,016 -0.2448 Clothing and clothing
access. stores . . . . . . . . . . . 169,127 169,661 -0.3451 Sporting goods, hobby,
book, & music stores . . . . . 84,797 87,344 -2.9452 General merchandise
stores . . . . . . . . . . . . . . . . . . . 430,458 418,242 +2.9453 Miscellaneous
store retailers . . . . . . . . . . . . 112,017 111,863 +0.1454 Nonstore retailers. . . . . . . . . . 156,409 154,522 +1.2722 Food services and
drinking places . . . . . . . . . . . 320,710 321,007 -0.1
INVENTORIES1
Retail, total. . . . . . . . . . . . . 390,173 393,603 -0.9
441 Motor vehicleand parts dealers. . . . . . . . . 119,157 121,134 -1.6
442, 443 Furniture, homefurnishings, electronics,and appliance stores. . . . . . 24,635 24,139 +2.1
444 Building mat., gardenequip., & suppliesdealers . . . . . . . . . . . . . . . . . . 38,448 38,890 -1.1
445 Food and beveragestores . . . . . . . . . . . . . . . . . . . 34,556 35,096 -1.5
448 Clothing and clothingaccess. stores . . . . . . . . . . . 30,501 30,016 +1.6
452 General merchandisestores . . . . . . . . . . . . . . . . . . . 60,391 60,838 -0.7
1End of December, not adjusted for seasonal variations.
Reasons for Monthly Revisions
There are several reasons for revisions. The main contribu-tors to the revision from the previously published esti-mates are:
• Timing. The respondents have more time to preparetheir annual reports than they do for their monthlyreports. The annual responses are requested at a timewhen many firms have already compiled audited bookfigures for their own use. The timing of the annual sur-vey is such that we are also able to obtain independentverification of the reported data from such sources as acompany’s annual report. On the other hand, respon-dents to the monthly survey have just a few weeks toprovide reports of their sales and end-of-month invento-ries. Sometimes these reports are based on incompleteor unaudited records. These include estimates by therespondents to represent their understanding of theirbusiness.
• Sampling. The annual sample is larger than thesamples used to develop the estimates for any givenmonth. As described in more detail in Appendix A ofthis report, the samples used to produce the sales esti-mates each month consist of certainty companies andnoncertainty Employer Identification Numbers (EINs).
• The companies selected as certainty companies arethose companies that had large sales in relation toother companies in their kind-of-business group.
• The initial selection of the noncertainty EINs wasbased on stratified random sampling, using annualsales as the measure of size, for those EINs notbelonging to a certainty company. The selected non-certainty EINs were assigned to one of two groups.The monthly sample canvasses one group of noncer-tainty EINs, while both groups of noncertainty EINsare canvassed in the annual sample.
• The sample used for the end-of-month inventory esti-mates is a subsample of the monthly sales sample.The monthly inventories sample is about one-thirdthe size of the monthly sales sample. This, combinedwith the differences between the annual and monthlysurveys mentioned above, often results in greaterrevision for the inventories estimates than for thesales estimates.
• Response. The annual estimates are based on morereported data than are the monthly estimates. Theresponse to the Annual Retail Trade Survey is requiredby law. This requirement results in a dollar volumeresponse rate above 90 percent. The response to ourmonthly survey is not mandatory. The response ratesfor the monthly surveys are usually around 80 percentfor sales and 72 percent for inventories. The sales andinventories for the nonreported retailers are accountedfor by an imputation process. This process assumes thatthe firms not responding have trends similar to theresponding firms in their respective kinds of business.
vii
U.S. Census Bureau

DEFINITION OF TERMS
Dollar Values
All dollar values presented are expressed in current dol-lars; that is, the estimates are not adjusted to a constantdollar series. Consequently, when comparing estimates toprior years, users also should consider price levelchanges.
Confidentiality
Title 13 of the United States Code authorizes the CensusBureau to conduct censuses and surveys. Section 9 of thesame Title requires that any information collected from thepublic under the authority of Title 13 be maintained asconfidential. Section 214 of Title 13 and Sections 3559and 3571 of Title 18 of the United States Code provide forthe imposition of penalties of up to 5 years in prison andup to $250,000 in fines for wrongful disclosure of confi-dential census information. In accordance with Title 13, noestimates are published that would disclose the opera-tions of an individual firm.
The Census Bureau’s Internal Disclosure Review board setsthe confidentiality rules for all data releases. A checklistapproach is used to ensure that all potential risks to theconfidentiality of the data are considered and addressed.
Disclosure Limitation
A disclosure of data occurs when an individual can usepublished statistical information to identify either an indi-vidual or firm that has provided information under apledge of confidentiality. Disclosure limitation is the pro-cess used to protect the confidentiality of the survey dataprovided by an individual or firm. Using disclosure limita-tion procedures, the Census Bureau modifies or removesthe characteristics that put confidential information at riskfor disclosure. Although it may appear that a table showsinformation about a specific individual or business, theCensus Bureau has taken steps to disguise or suppress theoriginal data while making sure the results are still useful.The techniques used by the Census Bureau to protect con-fidentiality in tabulations vary, depending on the type ofdata.
Unpublished Estimates
Additional statistics, such as dollar volume estimates forsome kinds of business not separately shown in thisreport, are produced as a byproduct of the regularly pub-lished statistics. These additional estimates have not beenincluded in this publication because high sampling vari-ability, poor response, or other factors that may makethem potentially misleading. Upon written request, for anominal fee, the Census Bureau will release these esti-mates for individual use, though not for publication. Itshould be noted that some unpublished estimates can bederived directly from this report by subtracting published
estimates from their respective totals. However, the esti-mates obtained by such subtraction would be subject tothe poor response rates or high sampling variabilitydescribed previously for unpublished kinds of business.
Individuals who use estimates in this report to create newestimates should cite the Census Bureau as the source ofonly the original estimates.
Adjustment Factors
The X-12 ARIMA program was used to derive the factorsfor adjusting data for seasonal variations and, in the caseof sales, for trading-day and holiday differences. Unad-justed sales and inventory estimates were input to thisprogram for the period January 1992 through February orMarch (if an advance sales estimate was computed) 2002.
Seasonal adjustment of estimates is an approximationbased on current and past experiences. Therefore, theadjustment could become less precise because of changesin economic conditions and other elements that introducesignificant changes in seasonal, trading-day, and holidaypatterns.
Sales
Sales include merchandise sold (for cash or credit at retailor wholesale) by establishments primarily engaged inretail trade. Services that are incidental to the sale of mer-chandise, and excise taxes that are paid by the manufac-turer or wholesaler and passed along to the retailer arealso included. Sales are net after deductions for refundsand allowances for merchandise returned by customers.Sales exclude sales taxes collected directly from custom-ers and paid directly to a local, state, or federal taxagency.
The estimates of sales measure the operations receiptsrendered by stores that primarily sell at retail. The salesestimates represent total sales and receipts of all estab-lishments primarily engaged in retail trade. They do notinclude sales at retail by manufacturers, wholesalers, serv-ice establishments, and others whose primary activity isother than retail trade. Because the retail establishment isthe basic unit of measure, the published estimates of salesby type of retail store are not intended to measure thetotal sales for a given commodity or merchandise line.
Inventories
Merchandise inventories are the value of stocks of goodsheld for sale through retail stores. The inventories esti-mates represent the value, at cost, of the merchandiseavailable for sale as of the last day of the report period.Methods of valuation may vary according to the account-ing practices of each firm. The estimates provided in thisreport are valued on a non-LIFO (last in, first out) basis.Note—LIFO is a method of valuing inventory where thelatest items of merchandise added to the inventory are the
viii
U.S. Census Bureau

first ones taken out. Non-LIFO would mean that anothermethod, such as FIFO (first in, first out), was used toestablish the value of the inventory available for sale. Mer-chandise inventories are shown for stores and warehousesservicing retail establishments. Included are only thosewarehouses that maintained supplies of merchandise pri-marily intended for distribution to retail stores within theorganization.
Most firms reported the value of their inventories as of theclose of the calendar year. Some firms, using a fiscal yearrather than a calendar year for accounting purposes, val-ued their inventory as of some date other than the lastday of the calendar year. About 26 percent of the retailinventory estimate from the Annual Retail Trade Surveywas based on data reported on an end-of-fiscal year otherthan December 31. In the annual survey, inventoriesreported for a date in a month other than December wereadjusted to a December 31 equivalent, based on ratiosdeveloped from the monthly inventory sample.
Inventories/Sales Ratios
The inventories/sales ratios show the relationship of theend-of-month values of inventory to the monthly sales.These ratios can be looked at as indications of the numberof months of inventory that are on hand in relation to thesales for a month. For example, a ratio of 2.5 would indi-cate that the retail stores have enough merchandise onhand to cover two and a half months of sales.
Purchases
Purchases represent the total cost of merchandise thatwas purchased for resale during the year, whether or notpayment for the merchandise was made during the year.
Purchases data include cash and credit purchases made atcentral offices and company warehouses. The purchases,however, exclude deliveries from central offices or ware-houses to retail stores owned by other companies. Thosecompanies engaged in both manufacturing and retailingare asked to include purchases at the cost value of inter-company transfers from their plant or warehouses to theirretail stores and to include the cost of outside purchases.
Cost of Goods Available for Sale andCost of Goods Sold
To calculate the cost of goods available for sale, the pur-chases made during the year were added to the precedingyear’s end-of-year inventories. To calculate the cost ofgoods sold, the end of the current year’s value of invento-ries were deducted from the cost of goods available forsale.
Gross Margin
The measure of gross margin represents total sales lesscost of goods sold.
Accounts Receivable Balances
Retail accounts receivable are amounts owed to retailstores by their customers for purchases made on credit.The estimate in this publication refer to receivables out-standing as of December 31, including receivables againstwhich the firm has borrowed. However, credit paper dis-counted or sold to others and amounts actually chargedoff as bad debts are excluded. Also excluded are amountscharged on credit cards issued by oil companies, banks,and other organizations that issue credit cards.
Charge accounts are credit accounts for which full pay-ment is scheduled to be made at the end of the customarybilling period. Installment accounts are classified as open-end or closed-end.
• Open-end installment accounts are primarily revolvingor optional accounts. A deferred payment privilege isextended through a line of credit, and the customer hasthe option of paying the balance in full or paying in twoor more installments. The payments are subject to aminimum required payment with a finance charge usu-ally assessed.
• Closed-end installment accounts are those generallyrequiring a new contract to cover each extension ofcredit. A precomputed finance charge is assessed at thetime credit is extended. Specified fixed schedules ofinstallment payments are established with the number,the amount of payments, and the due dates specified inthe contract.
Leased Department
Leased departments are broadly defined as operations ofone company conducted within the establishment ofanother company. Typical examples may include jewelrycounters or optical centers within department stores.
GAFO
GAFO represents sales at stores that sell merchandise nor-mally sold in department stores. GAFO includes the follow-ing kinds of retail businesses:
• General merchandise stores (NAICS 452),
• Clothing and clothing accessories stores (NAICS 448),
• Furniture and home furnishings stores (NAICS 442),
• Electronics and appliance stores (NAICS 443),
• Sporting goods, hobby, book, and music stores (NAICS451),
• Office supplies, stationery, and gift stores (NAICS 4532).
ix
U.S. Census Bureau

Detailed Tables
1
U.S. Census Bureau

Table 1a. Unadjusted and Adjusted Estimates of Monthly Retail and Food Services Sales by Kindsof Business: January 2002 Through March 2002
[Estimates are shown in millions of dollars. Estimates are based on data from the Monthly Retail Trade Survey and administrative records and havebeen adjusted using results of the most recent economic census]
NAICScode Kind of business
Unadjusted Adjusted1
Jan. Feb.p Mar.a Jan. Feb.p Mar.a
Retail and food services sales, total . . . . . . . . . . . 264,922 262,515 296,056 294,852 296,120 296,371
Total (excl. motor vehicle and parts dealers) . . . . . . 200,789 195,890 221,746 223,808 224,443 225,138
Retail sales, total . . . . . . . . . . . . . . . . . . . . . . . 239,523 237,066 267,604 267,002 268,092 268,504
Retail sales, total (excl. motor vehicle and partsdealers) . . . . . . . . . . . . . . . . . . . . . . . . . . . . 175,390 170,441 NA 195,958 196,415 NA
GAFO2 . . . . . . . . . . . . . . . . . . . . . . . . . . . . . . . . . 65,976 66,739 NA 78,798 79,397 NA
441 Motor vehicle and parts dealers . . . . . . . . . . . . . . . . . 64,133 66,625 74,310 71,044 71,677 71,233
4411, 4412 Automobile and other motor vehicle dealers . . . . . . . . . 58,504 61,176 68,251 64,932 65,499 65,1254411 Automobile dealers . . . . . . . . . . . . . . . . . . . . . . . . 55,438 57,435 NA NA NA NA44111 New car dealers . . . . . . . . . . . . . . . . . . . . . . . . . 50,120 51,645 NA NA NA NA44112 Used car dealers . . . . . . . . . . . . . . . . . . . . . . . . 5,318 5,790 NA NA NA NA4413 Auto parts, access., and tire stores . . . . . . . . . . . . . 5,629 5,449 NA 6,112 6,178 NA
442, 443 Furniture, home furnishings, electronics, and appliancestores . . . . . . . . . . . . . . . . . . . . . . . . . . . . . . . . . . 14,520 14,108 NA 15,516 15,638 NA
442 Furniture and home furnishings stores . . . . . . . . . . . . 7,170 7,138 7,802 7,862 7,940 7,9294421 Furniture stores . . . . . . . . . . . . . . . . . . . . . . . . . . . . 4,130 4,165 NA NA NA NA4422 Home furnishings stores . . . . . . . . . . . . . . . . . . . . . . 3,040 2,973 NA NA NA NA
443 Electronics and appliance stores . . . . . . . . . . . . . . . . 7,350 6,970 7,361 7,654 7,698 7,70144311 Appl., TV, and other elect. stores . . . . . . . . . . . . . . . 4,858 4,702 NA NA NA NA443111 Household appliance stores . . . . . . . . . . . . . . . . . . 962 914 NA NA NA NA443112 Radio, TV, and other elect. stores . . . . . . . . . . . . . . 3,896 3,788 NA NA NA NA44312 Computer and software stores . . . . . . . . . . . . . . . . . 2,260 2,045 NA 2,233 2,201 NA
444 Building mat. and garden equip. and supplies dealers . 20,787 20,109 23,788 25,106 24,994 25,3404441 Building mat. and supplies dealers . . . . . . . . . . . . . . . 18,701 18,065 NA 22,184 22,111 NA44413 Hardware stores . . . . . . . . . . . . . . . . . . . . . . . . . . 1,158 1,095 NA NA NA NA
445 Food and beverage stores . . . . . . . . . . . . . . . . . . . . . 38,651 36,220 40,687 40,190 40,264 40,2114451 Grocery stores . . . . . . . . . . . . . . . . . . . . . . . . . . . . 35,270 32,760 36,822 36,174 36,199 36,2064453 Beer, wine, and liquor stores . . . . . . . . . . . . . . . . . . . 2,216 2,216 NA 2,604 2,632 NA
446 Health and personal care stores . . . . . . . . . . . . . . . . . 14,843 14,289 15,389 14,963 15,025 14,97044611 Pharmacies and drug stores . . . . . . . . . . . . . . . . . . 12,651 12,050 NA 12,689 12,724 NA
447 Gasoline stations . . . . . . . . . . . . . . . . . . . . . . . . . . . 16,358 15,534 18,237 18,055 18,000 18,552
448 Clothing and clothing access. stores . . . . . . . . . . . . . . 10,494 11,911 14,212 14,619 14,727 14,6894481 Clothing stores . . . . . . . . . . . . . . . . . . . . . . . . . . . . 7,661 8,179 NA 10,529 10,556 NA44811 Men’s clothing stores . . . . . . . . . . . . . . . . . . . . . . . 683 675 NA 855 869 NA44812 Women’s clothing stores . . . . . . . . . . . . . . . . . . . . . 2,123 2,332 NA 2,912 2,926 NA44814 Family clothing stores . . . . . . . . . . . . . . . . . . . . . . . 3,382 3,612 NA NA NA NA4482 Shoe stores . . . . . . . . . . . . . . . . . . . . . . . . . . . . . . 1,361 1,530 NA 1,834 1,864 NA44831 Jewelry stores . . . . . . . . . . . . . . . . . . . . . . . . . . . . 1,358 2,083 NA 2,119 2,170 NA
451 Sporting goods, hobby, book, and music stores . . . . . . 6,856 5,772 6,788 7,526 7,325 7,41045111 Sporting goods stores . . . . . . . . . . . . . . . . . . . . . . . 1,936 1,970 NA NA NA NA451211 Book stores . . . . . . . . . . . . . . . . . . . . . . . . . . . . . 2,188 1,066 NA NA NA NA
452 General merchandise stores . . . . . . . . . . . . . . . . . . . . 30,550 31,454 36,419 37,482 37,964 38,0294521 Department stores (excl. L.D.) . . . . . . . . . . . . . . . . . . 14,789 15,408 18,306 19,286 19,373 19,2924521102 Discount dept. stores . . . . . . . . . . . . . . . . . . . . . . 9,355 9,556 NA NA NA NA4521101,4521103 Conventional and national chain dept. stores . . . . . . . 5,434 5,852 NA NA NA NA
4521 Department stores (incl. L.D.)3 . . . . . . . . . . . . . . . . . . 15,074 15,695 NA NA NA NA4521102 Discount dept. stores . . . . . . . . . . . . . . . . . . . . . . 9,493 9,697 NA NA NA NA4521101,4521103 Conventional and national chain dept. stores . . . . . . . 5,581 5,998 NA NA NA NA
4529 Other general merchandise stores . . . . . . . . . . . . . . . 15,761 16,046 NA 18,196 18,591 NA45291 Warehouse clubs and superstores . . . . . . . . . . . . . . . 13,197 13,443 NA 15,065 15,470 NA45299 All other general merchandise stores . . . . . . . . . . . . . 2,564 2,603 NA 3,131 3,121 NA
453 Miscellaneous store retailers . . . . . . . . . . . . . . . . . . . 8,580 8,751 8,944 9,367 9,381 9,294
454 Nonstore retailers . . . . . . . . . . . . . . . . . . . . . . . . . . . 13,751 12,293 13,667 13,134 13,097 13,1464541 Electronic shopping and mail-order houses . . . . . . . . . . 9,087 8,189 NA 9,339 9,306 NA45431 Fuel dealers . . . . . . . . . . . . . . . . . . . . . . . . . . . . . 2,788 2,244 NA 1,778 1,778 NA
722 Food services and drinking places . . . . . . . . . . . . . . . 25,399 25,449 28,452 27,850 28,028 27,8677221 Full-service restaurants . . . . . . . . . . . . . . . . . . . . . . . 11,210 11,171 NA NA NA NA7222 Limited-service eating places . . . . . . . . . . . . . . . . . . . 10,718 10,736 NA NA NA NA7224 Drinking places . . . . . . . . . . . . . . . . . . . . . . . . . . . . 1,442 1,439 NA NA NA NA
aAdvance estimates. pPreliminary estimates. NA Data not available.1Estimates are adjusted for seasonal variation, holiday, and trading-day differences, but not for price changes.2GAFO represents stores classified in the following NAICS codes: 442, 443, 448, 451, 452, and 4532. NAICS code 4532 includes office supplies, stationery, and gift stores.3Includes data for leased departments operated within department stores. Data for this line not included in aggregate kind-of-business totals.Note: Retail and food services total and other subsector totals may include data for kinds of business not shown. Table A-1 provides estimated measures of sampling variability. The introduction
and appendixes give information on confidentiality protection, sampling error, nonsampling error, sample design, and definitions. Links to this information on the Internet may be found atwww.census.gov/mrts/www/nrely.html.
2
U.S. Census Bureau

Table 1b. Unadjusted and Adjusted Estimates of End-of-Month Retail Inventories andInventories/Sales Ratios by Kinds of Business: January 2002 and February 2002
[Estimates are shown in millions of dollars. Estimates are based on data from the Monthly Retail Trade Survey and administrative records and havebeen adjusted using results of the most recent economic census]
NAICScode Kind of business
Unadjusted Adjusted1
Jan. Feb.p Jan. Feb.p
Retail inventories, total . . . . . . . . . . . . . . . . . . . . . . . . . . . . . . . . . 390,760 396,661 399,269 401,862
Total (excl. motor vehicle and parts dealers) . . . . . . . . . . . . . . . . . . 269,363 271,272 280,732 280,514
441 Motor vehicle and parts dealers . . . . . . . . . . . . . . . . . . . . . . . . . . . . . . . . 121,397 125,389 118,537 121,348
442, 443 Furniture, home furnishings, electronics, and appliance stores . . . . . . . . . . . . 24,672 24,459 25,409 25,505
444 Building mat. and garden equip. and supplies dealers . . . . . . . . . . . . . . . . . 39,233 40,554 40,034 40,232
445 Food and beverage stores . . . . . . . . . . . . . . . . . . . . . . . . . . . . . . . . . . . 33,663 33,121 33,580 33,527
448 Clothing and clothing access. stores . . . . . . . . . . . . . . . . . . . . . . . . . . . . . 30,840 31,462 33,890 33,223
452 General merchandise stores . . . . . . . . . . . . . . . . . . . . . . . . . . . . . . . . . . 59,058 60,665 64,392 64,6294521 Department stores . . . . . . . . . . . . . . . . . . . . . . . . . . . . . . . . . . . . . . . 36,843 37,936 40,531 40,704
Inventories/sales ratios
Retail trade, total . . . . . . . . . . . . . . . . . . . . . . . . . . . . . . . . . . . . . 1.63 1.67 1.50 1.50Total (excl. motor vehicle and parts dealers) . . . . . . . . . . . . . . . . . 1.54 1.59 1.43 1.43
441 Motor vehicle and parts dealers . . . . . . . . . . . . . . . . . . . . . . . . . . . . . . . . 1.89 1.88 1.67 1.69
442, 443 Furniture, home furnishings, electronics, and appliance stores . . . . . . . . . . . . 1.70 1.73 1.64 1.63
444 Building mat. and garden equip. and supplies dealers . . . . . . . . . . . . . . . . . 1.89 2.02 1.59 1.61
445 Food and beverage stores . . . . . . . . . . . . . . . . . . . . . . . . . . . . . . . . . . . 0.87 0.91 0.84 0.83
448 Clothing and clothing access. stores . . . . . . . . . . . . . . . . . . . . . . . . . . . . . 2.94 2.64 2.32 2.26
452 General merchandise stores . . . . . . . . . . . . . . . . . . . . . . . . . . . . . . . . . . 1.93 1.93 1.72 1.704521 Department stores . . . . . . . . . . . . . . . . . . . . . . . . . . . . . . . . . . . . . . . 2.49 2.46 2.10 2.10
pPreliminary estimates.1Inventory estimates are adjusted for seasonal variation and, in the case of sales, for holiday and trading-day differences. Estimates are not adjusted for price changes.
Note: Estimates exclude food services. Inventory estimates include data for auxiliary establishments; for example warehouses servicing retail stores. Other subsector totals may include data forkinds of business not shown. Table A-1 provides estimated measures of sampling variability. The introduction and appendixes give information on confidentiality protection, sampling error, nonsamplingerror, sample design, and definitions. Links to this information on the Internet may be found at www.census.gov/mrts/www/nrely.html.
3
U.S. Census Bureau

Table 2. Estimated Annual Retail and Food Services Sales by Kinds of Business: 1992 Through2001
[Estimates are shown in millions of dollars. Estimates are based on data from the Monthly Retail Trade Survey, Annual Retail Trade Survey, andadministrative records and have been adjusted using results of the most recent economic census]
NAICScode Kind of business 1992 1993 1994 1995 1996 1997 1998 1999 2000 2001
Retail and food services sales,total . . . . . . . . . . . . . . . . . . . 2,054,628 2,194,091 2,372,814 2,492,449 2,645,173 2,767,387 2,906,731 3,153,631 3,365,128 3,488,552Total (excl. motor vehicle and
parts dealers) . . . . . . . . . . . . 1,627,019 1,712,142 1,822,719 1,904,436 2,009,922 2,106,705 2,207,274 2,373,664 2,548,477 2,631,002
Retail sales, total . . . . . . . . . 1,851,213 1,978,040 2,147,185 2,258,824 2,402,277 2,509,347 2,634,085 2,868,155 3,059,138 3,167,842
Retail sales, total (excl. motorvehicle and parts dealers) . . 1,423,604 1,496,091 1,597,090 1,670,811 1,767,026 1,848,665 1,934,628 2,088,188 2,242,487 2,310,292
GAFO1 . . . . . . . . . . . . . . . . . . . 536,894 574,126 619,580 653,010 685,254 715,682 762,570 822,849 873,074 907,527
441 Motor vehicle and parts dealers . . . . 427,609 481,949 550,095 588,013 635,251 660,682 699,457 779,967 816,651 857,5504411, 4412 Automobile and other motor vehicle
dealers . . . . . . . . . . . . . . . . . . . 377,230 428,933 492,780 528,722 572,902 596,250 631,890 708,237 743,023 784,8724411 Automobile dealers . . . . . . . . . . . 359,110 407,832 468,869 502,482 544,789 565,509 597,470 669,835 700,342 735,03244111 New car dealers . . . . . . . . . . . . 333,801 379,522 435,661 464,642 502,340 518,972 545,128 611,915 637,979 669,60544112 Used car dealers . . . . . . . . . . . 25,309 28,310 33,208 37,840 42,449 46,537 52,342 57,920 62,363 65,4274413 Auto parts, access., and tire stores 50,379 53,016 57,315 59,291 62,349 64,432 67,567 71,730 73,628 72,678442, 443 Furniture, home furnishings,
electronics and appliance stores . . . 97,757 106,695 120,179 130,447 137,930 144,303 154,555 167,151 178,834 179,241
442 Furniture and home furnishingsstores . . . . . . . . . . . . . . . . . . . . . . 54,994 57,935 62,766 65,528 69,415 74,092 78,574 85,129 91,352 91,515
4421 Furniture stores . . . . . . . . . . . . . . . 31,608 33,356 35,562 37,034 39,231 41,945 44,139 46,968 50,502 50,3524422 Home furnishings stores . . . . . . . . . 23,386 24,579 27,204 28,494 30,184 32,147 34,435 38,161 40,850 41,163
443 Electronics and appliance stores . . . 42,763 48,760 57,413 64,919 68,515 70,211 75,981 82,022 87,482 87,72644311 Appl., TV, and other elect. stores . . 29,002 32,610 37,942 42,142 43,310 43,060 46,265 51,492 57,251 59,056443111 Household appliance stores . . . . . 8,443 9,143 9,051 9,986 10,221 10,380 10,814 11,492 11,792 12,349443112 Radio, TV, and other elect. stores . 20,559 23,467 28,891 32,156 33,089 32,680 35,451 40,000 45,459 46,70744312 Computer and software stores . . . . 11,453 13,851 17,187 20,502 22,905 24,803 27,182 27,754 27,245 25,394
444 Building mat. and garden equip. andsupplies dealers . . . . . . . . . . . . . . 160,171 171,733 190,817 199,068 212,759 229,489 243,490 264,039 278,109 297,725
4441 Building mat. and supplies dealers . . 135,522 147,655 165,246 172,274 183,297 197,375 210,049 229,551 241,706 256,42644413 Hardware stores . . . . . . . . . . . . . 12,720 13,051 13,831 13,764 13,955 13,998 14,751 15,084 15,354 16,494
445 Food and beverage stores . . . . . . . . 371,451 375,440 385,265 391,312 402,020 410,288 421,579 442,622 459,185 472,5734451 Grocery stores . . . . . . . . . . . . . . . 337,925 341,855 351,056 356,932 366,075 373,072 382,426 401,809 415,318 425,3894453 Beer, wine, and liquor stores . . . . . . 21,825 21,675 22,240 22,145 23,300 24,222 25,697 26,987 29,025 30,626
446 Health and personal care stores . . . . 90,794 93,623 97,299 102,469 110,199 119,055 130,228 145,419 157,468 170,29144611 Pharmacies and drug stores . . . . . . 77,806 79,720 82,006 85,851 91,821 98,833 108,344 122,742 131,308 143,048
447 Gasoline stations . . . . . . . . . . . . . . 156,556 162,587 171,416 181,294 194,601 199,856 191,749 209,409 244,450 237,654
448 Clothing and clothing access. stores . 120,346 124,989 129,327 131,605 136,860 140,565 149,442 159,888 167,541 169,1274481 Clothing stores . . . . . . . . . . . . . . . 85,941 88,724 90,806 91,416 94,473 98,506 104,894 112,360 118,556 121,04044811 Men’s clothing stores . . . . . . . . . . 10,185 9,968 10,039 9,322 9,554 10,077 10,621 10,541 10,822 10,64844812 Women’s clothing stores . . . . . . . . 31,840 32,377 30,611 28,723 28,266 27,851 28,690 30,219 32,526 32,83544814 Family clothing stores . . . . . . . . . . 33,159 35,311 38,118 40,014 42,275 45,259 49,472 53,800 56,468 57,3084482 Shoe stores . . . . . . . . . . . . . . . . . 18,148 18,528 19,361 19,759 20,604 20,788 21,539 21,835 21,891 21,65244831 Jewelry stores . . . . . . . . . . . . . . . 15,184 16,571 17,996 19,152 20,317 19,778 21,527 24,069 25,317 24,773
451 Sporting goods, hobby, book, andmusic stores . . . . . . . . . . . . . . . . . 49,296 52,368 57,538 60,922 64,055 65,573 69,456 74,045 78,120 84,797
45111 Sporting goods stores . . . . . . . . . . . 15,702 16,913 18,951 19,986 20,931 21,286 22,579 24,188 26,092 27,877451211 Book stores . . . . . . . . . . . . . . . . . 8,338 9,119 10,119 11,208 11,918 12,755 13,390 14,541 15,420 16,747
452 General merchandise stores . . . . . . . 247,968 266,088 285,278 300,589 315,398 331,454 351,796 381,428 405,936 430,4584521 Department stores (excl. L.D.) . . . . . 177,089 187,685 198,945 205,920 212,203 220,108 223,653 231,042 233,627 230,1014521102 Discount dept. stores . . . . . . . . . . 91,936 101,360 109,543 116,620 120,031 126,123 129,007 133,703 136,277 137,7894521101,4521103
Conventional and national chaindept. stores . . . . . . . . . . . . . . . . 85,153 86,325 89,402 89,300 92,172 93,985 94,646 97,339 97,350 92,312
4521 Department stores (incl. L.D.)2 . . . . . 181,255 192,125 203,808 210,919 217,001 225,062 228,547 236,063 238,747 234,6754521102 Discount dept. stores . . . . . . . . . . 93,871 103,405 111,793 118,661 121,936 128,049 131,004 135,713 138,360 139,8954521101,4521103
Conventional and national chaindept. stores . . . . . . . . . . . . . . . . 87,384 88,720 92,015 92,258 95,065 97,013 97,543 100,350 100,387 94,780
4529 Other general merchandise stores . . 70,879 78,403 86,333 94,669 103,195 111,346 128,143 150,386 172,309 200,35745291 Warehouse clubs and superstores . . 40,025 46,628 57,756 65,101 73,079 81,919 98,718 119,183 140,001 164,54145299 All other general merchandise stores 30,854 31,775 28,577 29,568 30,116 29,427 29,425 31,203 32,308 35,816
453 Miscellaneous store retailers . . . . . . 55,833 62,601 70,585 77,177 84,109 91,669 99,803 105,742 109,000 112,017
454 Nonstore retailers . . . . . . . . . . . . . . 73,432 79,967 89,386 95,928 109,095 116,413 122,530 138,445 163,844 156,4094541 Electronic shopping and mail-order
houses . . . . . . . . . . . . . . . . . . . . 35,252 40,725 47,093 52,741 61,174 70,136 79,489 92,921 109,933 106,53245431 Fuel dealers . . . . . . . . . . . . . . . . 19,311 19,912 20,762 21,554 24,116 22,934 19,740 20,788 27,931 25,958
722 Food services and drinking places . . 203,415 216,051 225,629 233,625 242,896 258,040 272,646 285,476 305,990 320,7107221 Full-service restaurants . . . . . . . . . . 86,493 91,476 97,117 99,430 104,514 114,591 119,663 124,609 132,927 137,6207222 Limited-service eating places . . . . . . 87,433 94,736 98,446 103,143 106,192 109,298 116,836 122,186 131,413 138,2377224 Drinking places . . . . . . . . . . . . . . . 12,352 12,209 11,826 12,515 13,015 13,445 14,110 14,713 15,677 16,766
1GAFO represents stores classified in the following NAICS codes: 442, 443, 448, 451, 452, and 4532. NAICS code 4532 includes office supplies, stationery, and gift stores.2Includes data for leased departments operated within department stores. Data for this line not included in any aggregate kind-of-business totals.Note: Retail and food services total and other subsector totals may include data for kinds of business not shown. Estimates are not adjusted for price changes. Table A-2 provides estimated mea-
sures of sampling variability. The introduction and appendixes give information on confidentiality protection, sampling error, nonsampling error, sample design, and definitions. Links to this informationon the Internet may be found at www.census.gov/mrts/www/nrely.html.
4
U.S. Census Bureau
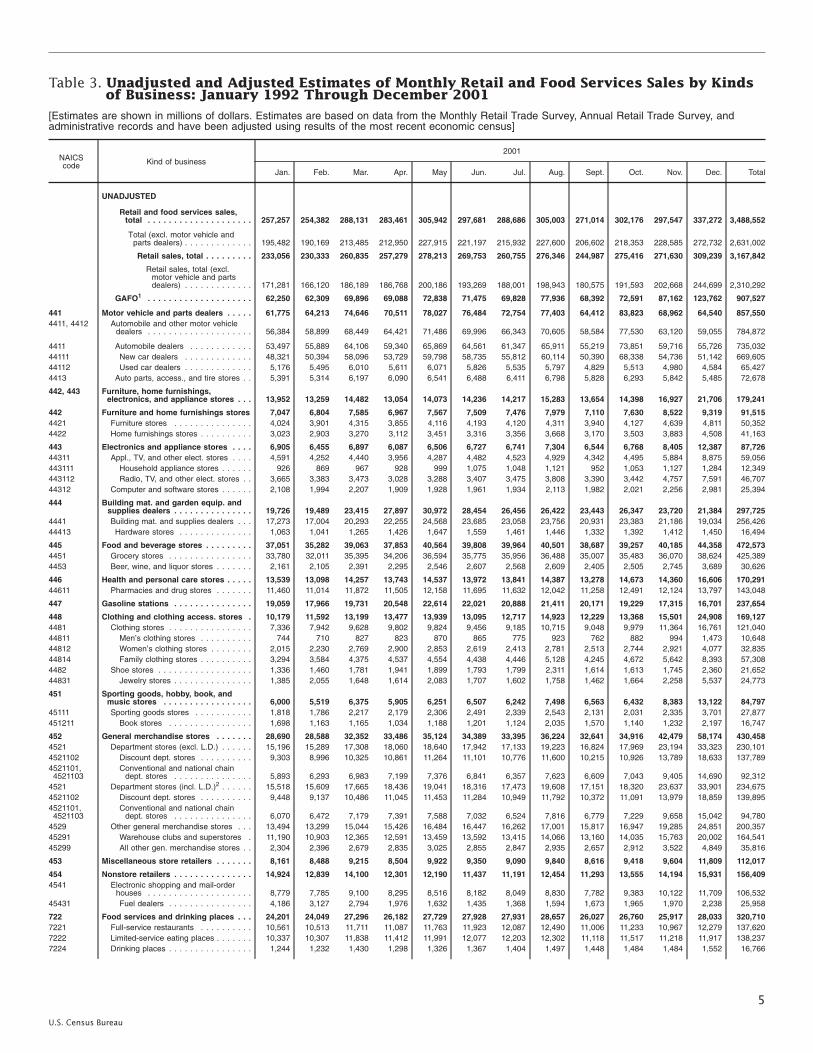
Table 3. Unadjusted and Adjusted Estimates of Monthly Retail and Food Services Sales by Kindsof Business: January 1992 Through December 2001
[Estimates are shown in millions of dollars. Estimates are based on data from the Monthly Retail Trade Survey, Annual Retail Trade Survey, andadministrative records and have been adjusted using results of the most recent economic census]
NAICScode Kind of business
2001
Jan. Feb. Mar. Apr. May Jun. Jul. Aug. Sept. Oct. Nov. Dec. Total
UNADJUSTED
Retail and food services sales,total . . . . . . . . . . . . . . . . . . . . 257,257 254,382 288,131 283,461 305,942 297,681 288,686 305,003 271,014 302,176 297,547 337,272 3,488,552
Total (excl. motor vehicle andparts dealers) . . . . . . . . . . . . . 195,482 190,169 213,485 212,950 227,915 221,197 215,932 227,600 206,602 218,353 228,585 272,732 2,631,002
Retail sales, total . . . . . . . . . 233,056 230,333 260,835 257,279 278,213 269,753 260,755 276,346 244,987 275,416 271,630 309,239 3,167,842
Retail sales, total (excl.motor vehicle and partsdealers) . . . . . . . . . . . . . 171,281 166,120 186,189 186,768 200,186 193,269 188,001 198,943 180,575 191,593 202,668 244,699 2,310,292
GAFO1 . . . . . . . . . . . . . . . . . . . . 62,250 62,309 69,896 69,088 72,838 71,475 69,828 77,936 68,392 72,591 87,162 123,762 907,527
441 Motor vehicle and parts dealers . . . . . 61,775 64,213 74,646 70,511 78,027 76,484 72,754 77,403 64,412 83,823 68,962 64,540 857,5504411, 4412 Automobile and other motor vehicle
dealers . . . . . . . . . . . . . . . . . . . . 56,384 58,899 68,449 64,421 71,486 69,996 66,343 70,605 58,584 77,530 63,120 59,055 784,872
4411 Automobile dealers . . . . . . . . . . . . 53,497 55,889 64,106 59,340 65,869 64,561 61,347 65,911 55,219 73,851 59,716 55,726 735,03244111 New car dealers . . . . . . . . . . . . . 48,321 50,394 58,096 53,729 59,798 58,735 55,812 60,114 50,390 68,338 54,736 51,142 669,60544112 Used car dealers . . . . . . . . . . . . . 5,176 5,495 6,010 5,611 6,071 5,826 5,535 5,797 4,829 5,513 4,980 4,584 65,4274413 Auto parts, access., and tire stores . . 5,391 5,314 6,197 6,090 6,541 6,488 6,411 6,798 5,828 6,293 5,842 5,485 72,678
442, 443 Furniture, home furnishings,electronics, and appliance stores . . . 13,952 13,259 14,482 13,054 14,073 14,236 14,217 15,283 13,654 14,398 16,927 21,706 179,241
442 Furniture and home furnishings stores 7,047 6,804 7,585 6,967 7,567 7,509 7,476 7,979 7,110 7,630 8,522 9,319 91,5154421 Furniture stores . . . . . . . . . . . . . . . 4,024 3,901 4,315 3,855 4,116 4,193 4,120 4,311 3,940 4,127 4,639 4,811 50,3524422 Home furnishings stores . . . . . . . . . . 3,023 2,903 3,270 3,112 3,451 3,316 3,356 3,668 3,170 3,503 3,883 4,508 41,163
443 Electronics and appliance stores . . . . 6,905 6,455 6,897 6,087 6,506 6,727 6,741 7,304 6,544 6,768 8,405 12,387 87,72644311 Appl., TV, and other elect. stores . . . . 4,591 4,252 4,440 3,956 4,287 4,482 4,523 4,929 4,342 4,495 5,884 8,875 59,056443111 Household appliance stores . . . . . . 926 869 967 928 999 1,075 1,048 1,121 952 1,053 1,127 1,284 12,349443112 Radio, TV, and other elect. stores . . 3,665 3,383 3,473 3,028 3,288 3,407 3,475 3,808 3,390 3,442 4,757 7,591 46,70744312 Computer and software stores . . . . . . 2,108 1,994 2,207 1,909 1,928 1,961 1,934 2,113 1,982 2,021 2,256 2,981 25,394
444 Building mat. and garden equip. andsupplies dealers . . . . . . . . . . . . . . . 19,726 19,489 23,415 27,897 30,972 28,454 26,456 26,422 23,443 26,347 23,720 21,384 297,725
4441 Building mat. and supplies dealers . . . 17,273 17,004 20,293 22,255 24,568 23,685 23,058 23,756 20,931 23,383 21,186 19,034 256,42644413 Hardware stores . . . . . . . . . . . . . . 1,063 1,041 1,265 1,426 1,647 1,559 1,461 1,446 1,332 1,392 1,412 1,450 16,494
445 Food and beverage stores . . . . . . . . . 37,051 35,282 39,063 37,853 40,564 39,808 39,964 40,501 38,687 39,257 40,185 44,358 472,5734451 Grocery stores . . . . . . . . . . . . . . . . 33,780 32,011 35,395 34,206 36,594 35,775 35,956 36,488 35,007 35,483 36,070 38,624 425,3894453 Beer, wine, and liquor stores . . . . . . . 2,161 2,105 2,391 2,295 2,546 2,607 2,568 2,609 2,405 2,505 2,745 3,689 30,626
446 Health and personal care stores . . . . . 13,539 13,098 14,257 13,743 14,537 13,972 13,841 14,387 13,278 14,673 14,360 16,606 170,29144611 Pharmacies and drug stores . . . . . . . 11,460 11,014 11,872 11,505 12,158 11,695 11,632 12,042 11,258 12,491 12,124 13,797 143,048
447 Gasoline stations . . . . . . . . . . . . . . . 19,059 17,966 19,731 20,548 22,614 22,021 20,888 21,411 20,171 19,229 17,315 16,701 237,654
448 Clothing and clothing access. stores . 10,179 11,592 13,199 13,477 13,939 13,095 12,717 14,923 12,229 13,368 15,501 24,908 169,1274481 Clothing stores . . . . . . . . . . . . . . . . 7,336 7,942 9,628 9,802 9,824 9,456 9,185 10,715 9,048 9,979 11,364 16,761 121,04044811 Men’s clothing stores . . . . . . . . . . 744 710 827 823 870 865 775 923 762 882 994 1,473 10,64844812 Women’s clothing stores . . . . . . . . 2,015 2,230 2,769 2,900 2,853 2,619 2,413 2,781 2,513 2,744 2,921 4,077 32,83544814 Family clothing stores . . . . . . . . . . 3,294 3,584 4,375 4,537 4,554 4,438 4,446 5,128 4,245 4,672 5,642 8,393 57,3084482 Shoe stores . . . . . . . . . . . . . . . . . . 1,336 1,460 1,781 1,941 1,899 1,793 1,799 2,311 1,614 1,613 1,745 2,360 21,65244831 Jewelry stores . . . . . . . . . . . . . . . 1,385 2,055 1,648 1,614 2,083 1,707 1,602 1,758 1,462 1,664 2,258 5,537 24,773
451 Sporting goods, hobby, book, andmusic stores . . . . . . . . . . . . . . . . . 6,000 5,519 6,375 5,905 6,251 6,507 6,242 7,498 6,563 6,432 8,383 13,122 84,797
45111 Sporting goods stores . . . . . . . . . . . 1,818 1,786 2,217 2,179 2,306 2,491 2,339 2,543 2,131 2,031 2,335 3,701 27,877451211 Book stores . . . . . . . . . . . . . . . . 1,698 1,163 1,165 1,034 1,188 1,201 1,124 2,035 1,570 1,140 1,232 2,197 16,747
452 General merchandise stores . . . . . . . 28,690 28,588 32,352 33,486 35,124 34,389 33,395 36,224 32,641 34,916 42,479 58,174 430,4584521 Department stores (excl. L.D.) . . . . . . 15,196 15,289 17,308 18,060 18,640 17,942 17,133 19,223 16,824 17,969 23,194 33,323 230,1014521102 Discount dept. stores . . . . . . . . . . 9,303 8,996 10,325 10,861 11,264 11,101 10,776 11,600 10,215 10,926 13,789 18,633 137,7894521101,4521103
Conventional and national chaindept. stores . . . . . . . . . . . . . . . 5,893 6,293 6,983 7,199 7,376 6,841 6,357 7,623 6,609 7,043 9,405 14,690 92,312
4521 Department stores (incl. L.D.)2 . . . . . . 15,518 15,609 17,665 18,436 19,041 18,316 17,473 19,608 17,151 18,320 23,637 33,901 234,6754521102 Discount dept. stores . . . . . . . . . . 9,448 9,137 10,486 11,045 11,453 11,284 10,949 11,792 10,372 11,091 13,979 18,859 139,8954521101,4521103
Conventional and national chaindept. stores . . . . . . . . . . . . . . . 6,070 6,472 7,179 7,391 7,588 7,032 6,524 7,816 6,779 7,229 9,658 15,042 94,780
4529 Other general merchandise stores . . . 13,494 13,299 15,044 15,426 16,484 16,447 16,262 17,001 15,817 16,947 19,285 24,851 200,35745291 Warehouse clubs and superstores . 11,190 10,903 12,365 12,591 13,459 13,592 13,415 14,066 13,160 14,035 15,763 20,002 164,54145299 All other gen. merchandise stores . . 2,304 2,396 2,679 2,835 3,025 2,855 2,847 2,935 2,657 2,912 3,522 4,849 35,816
453 Miscellaneous store retailers . . . . . . . 8,161 8,488 9,215 8,504 9,922 9,350 9,090 9,840 8,616 9,418 9,604 11,809 112,017
454 Nonstore retailers . . . . . . . . . . . . . . . 14,924 12,839 14,100 12,301 12,190 11,437 11,191 12,454 11,293 13,555 14,194 15,931 156,4094541 Electronic shopping and mail-order
houses . . . . . . . . . . . . . . . . . . . . 8,779 7,785 9,100 8,295 8,516 8,182 8,049 8,830 7,782 9,383 10,122 11,709 106,53245431 Fuel dealers . . . . . . . . . . . . . . . . 4,186 3,127 2,794 1,976 1,632 1,435 1,368 1,594 1,673 1,965 1,970 2,238 25,958
722 Food services and drinking places . . . 24,201 24,049 27,296 26,182 27,729 27,928 27,931 28,657 26,027 26,760 25,917 28,033 320,7107221 Full-service restaurants . . . . . . . . . . 10,561 10,513 11,711 11,087 11,763 11,923 12,087 12,490 11,006 11,233 10,967 12,279 137,6207222 Limited-service eating places . . . . . . . 10,337 10,307 11,838 11,412 11,991 12,077 12,203 12,302 11,118 11,517 11,218 11,917 138,2377224 Drinking places . . . . . . . . . . . . . . . . 1,244 1,232 1,430 1,298 1,326 1,367 1,404 1,497 1,448 1,484 1,484 1,552 16,766
5
U.S. Census Bureau
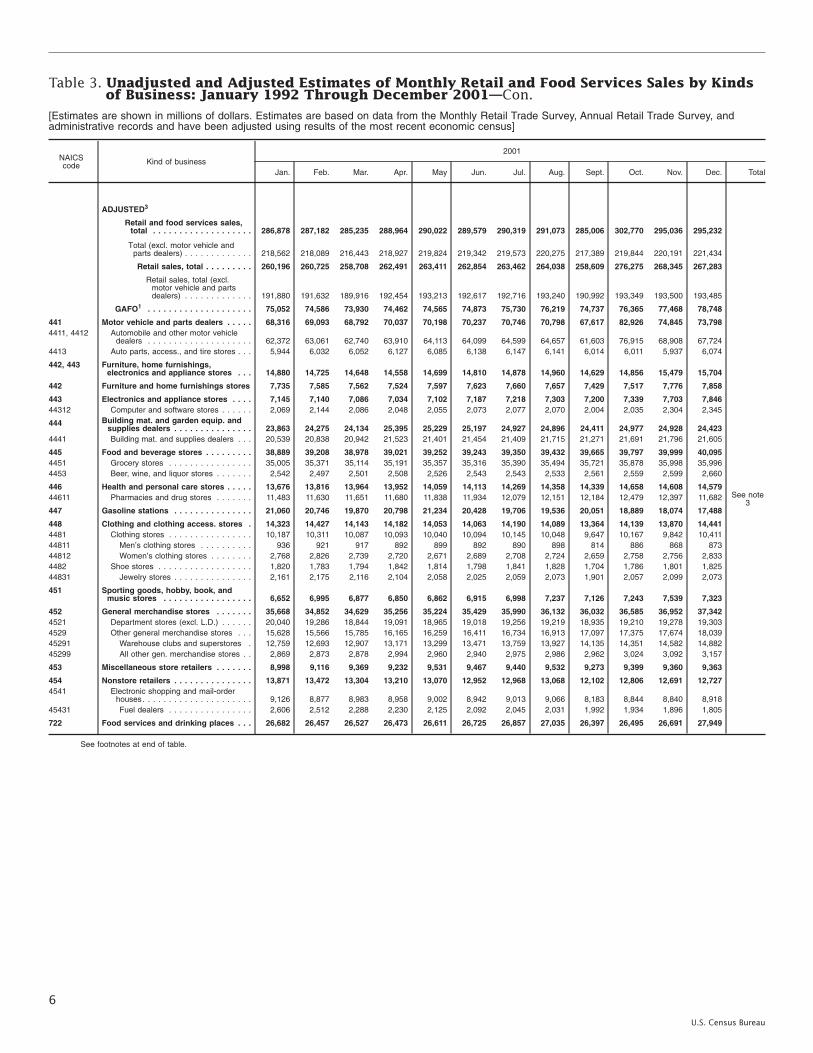
Table 3. Unadjusted and Adjusted Estimates of Monthly Retail and Food Services Sales by Kindsof Business: January 1992 Through December 2001—Con.
[Estimates are shown in millions of dollars. Estimates are based on data from the Monthly Retail Trade Survey, Annual Retail Trade Survey, andadministrative records and have been adjusted using results of the most recent economic census]
NAICScode Kind of business
2001
Jan. Feb. Mar. Apr. May Jun. Jul. Aug. Sept. Oct. Nov. Dec. Total
ADJUSTED3
Retail and food services sales,total . . . . . . . . . . . . . . . . . . . 286,878 287,182 285,235 288,964 290,022 289,579 290,319 291,073 285,006 302,770 295,036 295,232
Total (excl. motor vehicle andparts dealers) . . . . . . . . . . . . . 218,562 218,089 216,443 218,927 219,824 219,342 219,573 220,275 217,389 219,844 220,191 221,434
Retail sales, total . . . . . . . . . 260,196 260,725 258,708 262,491 263,411 262,854 263,462 264,038 258,609 276,275 268,345 267,283
Retail sales, total (excl.motor vehicle and partsdealers) . . . . . . . . . . . . . 191,880 191,632 189,916 192,454 193,213 192,617 192,716 193,240 190,992 193,349 193,500 193,485
GAFO1 . . . . . . . . . . . . . . . . . . . . 75,052 74,586 73,930 74,462 74,565 74,873 75,730 76,219 74,737 76,365 77,468 78,748
441 Motor vehicle and parts dealers . . . . . 68,316 69,093 68,792 70,037 70,198 70,237 70,746 70,798 67,617 82,926 74,845 73,7984411, 4412 Automobile and other motor vehicle
dealers . . . . . . . . . . . . . . . . . . . . 62,372 63,061 62,740 63,910 64,113 64,099 64,599 64,657 61,603 76,915 68,908 67,7244413 Auto parts, access., and tire stores . . . 5,944 6,032 6,052 6,127 6,085 6,138 6,147 6,141 6,014 6,011 5,937 6,074
442, 443 Furniture, home furnishings,electronics and appliance stores . . . 14,880 14,725 14,648 14,558 14,699 14,810 14,878 14,960 14,629 14,856 15,479 15,704
442 Furniture and home furnishings stores 7,735 7,585 7,562 7,524 7,597 7,623 7,660 7,657 7,429 7,517 7,776 7,858
443 Electronics and appliance stores . . . . 7,145 7,140 7,086 7,034 7,102 7,187 7,218 7,303 7,200 7,339 7,703 7,84644312 Computer and software stores . . . . . . 2,069 2,144 2,086 2,048 2,055 2,073 2,077 2,070 2,004 2,035 2,304 2,345
444 Building mat. and garden equip. andsupplies dealers . . . . . . . . . . . . . . . 23,863 24,275 24,134 25,395 25,229 25,197 24,927 24,896 24,411 24,977 24,928 24,423
4441 Building mat. and supplies dealers . . . 20,539 20,838 20,942 21,523 21,401 21,454 21,409 21,715 21,271 21,691 21,796 21,605
445 Food and beverage stores . . . . . . . . . 38,889 39,208 38,978 39,021 39,252 39,243 39,350 39,432 39,665 39,797 39,999 40,0954451 Grocery stores . . . . . . . . . . . . . . . . 35,005 35,371 35,114 35,191 35,357 35,316 35,390 35,494 35,721 35,878 35,998 35,9964453 Beer, wine, and liquor stores . . . . . . . 2,542 2,497 2,501 2,508 2,526 2,543 2,543 2,533 2,561 2,559 2,599 2,660
See note3
446 Health and personal care stores . . . . . 13,676 13,816 13,964 13,952 14,059 14,113 14,269 14,358 14,339 14,658 14,608 14,57944611 Pharmacies and drug stores . . . . . . . 11,483 11,630 11,651 11,680 11,838 11,934 12,079 12,151 12,184 12,479 12,397 11,682
447 Gasoline stations . . . . . . . . . . . . . . . 21,060 20,746 19,870 20,798 21,234 20,428 19,706 19,536 20,051 18,889 18,074 17,488
448 Clothing and clothing access. stores . 14,323 14,427 14,143 14,182 14,053 14,063 14,190 14,089 13,364 14,139 13,870 14,4414481 Clothing stores . . . . . . . . . . . . . . . . 10,187 10,311 10,087 10,093 10,040 10,094 10,145 10,048 9,647 10,167 9,842 10,41144811 Men’s clothing stores . . . . . . . . . . 936 921 917 892 899 892 890 898 814 886 868 87344812 Women’s clothing stores . . . . . . . . 2,768 2,826 2,739 2,720 2,671 2,689 2,708 2,724 2,659 2,758 2,756 2,8334482 Shoe stores . . . . . . . . . . . . . . . . . . 1,820 1,783 1,794 1,842 1,814 1,798 1,841 1,828 1,704 1,786 1,801 1,82544831 Jewelry stores . . . . . . . . . . . . . . . 2,161 2,175 2,116 2,104 2,058 2,025 2,059 2,073 1,901 2,057 2,099 2,073
451 Sporting goods, hobby, book, andmusic stores . . . . . . . . . . . . . . . . . 6,652 6,995 6,877 6,850 6,862 6,915 6,998 7,237 7,126 7,243 7,539 7,323
452 General merchandise stores . . . . . . . 35,668 34,852 34,629 35,256 35,224 35,429 35,990 36,132 36,032 36,585 36,952 37,3424521 Department stores (excl. L.D.) . . . . . . 20,040 19,286 18,844 19,091 18,965 19,018 19,256 19,219 18,935 19,210 19,278 19,3034529 Other general merchandise stores . . . 15,628 15,566 15,785 16,165 16,259 16,411 16,734 16,913 17,097 17,375 17,674 18,03945291 Warehouse clubs and superstores . 12,759 12,693 12,907 13,171 13,299 13,471 13,759 13,927 14,135 14,351 14,582 14,88245299 All other gen. merchandise stores . . 2,869 2,873 2,878 2,994 2,960 2,940 2,975 2,986 2,962 3,024 3,092 3,157
453 Miscellaneous store retailers . . . . . . . 8,998 9,116 9,369 9,232 9,531 9,467 9,440 9,532 9,273 9,399 9,360 9,363
454 Nonstore retailers . . . . . . . . . . . . . . . 13,871 13,472 13,304 13,210 13,070 12,952 12,968 13,068 12,102 12,806 12,691 12,7274541 Electronic shopping and mail-order
houses. . . . . . . . . . . . . . . . . . . . . 9,126 8,877 8,983 8,958 9,002 8,942 9,013 9,066 8,183 8,844 8,840 8,91845431 Fuel dealers . . . . . . . . . . . . . . . . 2,606 2,512 2,288 2,230 2,125 2,092 2,045 2,031 1,992 1,934 1,896 1,805
722 Food services and drinking places . . . 26,682 26,457 26,527 26,473 26,611 26,725 26,857 27,035 26,397 26,495 26,691 27,949
See footnotes at end of table.
6
U.S. Census Bureau

Table 3. Unadjusted and Adjusted Estimates of Monthly Retail and Food Services Sales by Kindsof Business: January 1992 Through December 2001—Con.
[Estimates are shown in millions of dollars. Estimates are based on data from the Monthly Retail Trade Survey, Annual Retail Trade Survey, andadministrative records and have been adjusted using results of the most recent economic census]
NAICScode Kind of business
2000
Jan. Feb. Mar. Apr. May Jun. Jul. Aug. Sept. Oct. Nov. Dec. Total
UNADJUSTED
Retail and food services sales,total . . . . . . . . . . . . . . . . . . . . 241,815 256,181 285,915 270,825 290,711 288,227 277,861 290,968 275,843 277,581 282,665 326,536 3,365,128
Total (excl. motor vehicle andparts dealers) . . . . . . . . . . . . . 181,815 187,948 209,408 203,524 216,200 213,637 208,949 217,209 208,021 211,676 222,068 268,022 2,548,477
Retail sales, total . . . . . . . . . 219,002 232,591 260,007 245,341 264,474 261,876 251,013 264,359 250,164 251,674 258,100 300,537 3,059,138
Retail sales, total (excl.motor vehicle and partsdealers) . . . . . . . . . . . . . 159,002 164,358 183,500 178,040 189,963 187,286 182,101 190,600 182,342 185,769 197,503 242,023 2,242,487
GAFO1 . . . . . . . . . . . . . . . . . . . . 57,888 61,029 68,309 66,897 70,485 69,095 67,372 73,594 68,919 69,789 82,405 117,292 873,074
441 Motor vehicle and parts dealers . . . . . 60,000 68,233 76,507 67,301 74,511 74,590 68,912 73,759 67,822 65,905 60,597 58,514 816,6514411, 4412 Automobile and other motor vehicle
dealers . . . . . . . . . . . . . . . . . . . . 54,619 62,637 70,065 61,376 68,059 68,000 62,718 66,986 61,451 59,698 54,652 52,762 743,023
4411 Automobile dealers . . . . . . . . . . . . 52,120 59,664 65,736 57,378 63,432 63,430 58,993 63,200 58,170 56,572 51,797 49,850 700,34244111 New car dealers . . . . . . . . . . . . . 47,477 54,005 59,942 52,194 58,071 57,862 53,586 57,663 52,858 51,548 47,282 45,491 637,97944112 Used car dealers . . . . . . . . . . . . . 4,643 5,659 5,794 5,184 5,361 5,568 5,407 5,537 5,312 5,024 4,515 4,359 62,3634413 Auto parts, access., and tire stores . . 5,381 5,596 6,442 5,925 6,452 6,590 6,194 6,773 6,371 6,207 5,945 5,752 73,628
442, 443 Furniture, home furnishings,electronics, and appliance stores . . . 13,654 13,913 14,823 13,632 14,427 14,265 14,220 15,242 14,472 14,329 16,089 19,768 178,834
442 Furniture and home furnishings stores 6,674 7,024 7,668 7,167 7,668 7,521 7,523 7,995 7,550 7,684 8,328 8,550 91,3524421 Furniture stores . . . . . . . . . . . . . . . 3,894 4,070 4,361 4,029 4,251 4,169 4,197 4,329 4,188 4,141 4,464 4,409 50,5024422 Home furnishings stores . . . . . . . . . . 2,780 2,954 3,307 3,138 3,417 3,352 3,326 3,666 3,362 3,543 3,864 4,141 40,850
443 Electronics and appliance stores . . . . 6,980 6,889 7,155 6,465 6,759 6,744 6,697 7,247 6,922 6,645 7,761 11,218 87,48244311 Appl., TV, and other elect. stores . . . . 4,404 4,398 4,426 4,072 4,333 4,362 4,430 4,738 4,400 4,272 5,381 8,035 57,251443111 Household appliance stores . . . . . . 872 873 950 900 1,035 1,045 967 1,013 960 972 1,045 1,160 11,792443112 Radio, TV, and other elect. stores . . 3,532 3,525 3,476 3,172 3,298 3,317 3,463 3,725 3,440 3,300 4,336 6,875 45,45944312 Computer and software stores . . . . . . 2,410 2,316 2,534 2,193 2,198 2,140 2,038 2,277 2,303 2,145 2,071 2,620 27,245
444 Building mat. and garden equip. andsupplies dealers . . . . . . . . . . . . . . . 18,528 19,497 24,020 24,057 27,630 26,166 23,814 24,568 22,935 23,952 22,006 20,936 278,109
4441 Building mat. and supplies dealers . . . 16,174 17,081 20,723 20,208 23,006 22,494 21,048 21,929 20,331 21,269 19,401 18,042 241,70644413 Hardware stores . . . . . . . . . . . . . . 1,015 976 1,238 1,344 1,503 1,459 1,361 1,353 1,259 1,263 1,251 1,332 15,354
445 Food and beverage stores . . . . . . . . . 35,269 34,631 37,726 37,620 38,988 38,818 39,503 39,050 37,945 37,707 38,643 43,285 459,1854451 Grocery stores . . . . . . . . . . . . . . . . 32,321 31,541 34,374 34,187 35,317 35,095 35,721 35,369 34,361 34,133 34,827 38,072 415,3184453 Beer, wine, and liquor stores . . . . . . . 1,953 2,010 2,227 2,168 2,396 2,454 2,506 2,465 2,401 2,397 2,600 3,448 29,025
446 Health and personal care stores . . . . . 12,162 12,349 13,157 12,601 13,418 12,988 12,692 13,195 12,773 13,245 13,237 15,651 157,46844611 Pharmacies and drug stores . . . . . . . 10,152 10,199 10,875 10,500 11,146 10,706 10,541 10,964 10,605 11,107 11,131 13,382 131,308
447 Gasoline stations . . . . . . . . . . . . . . . 17,474 18,082 20,579 19,527 20,931 21,904 21,861 21,657 21,099 21,033 20,117 20,186 244,450
448 Clothing and clothing access. stores . 9,444 11,167 12,818 13,101 13,725 12,935 12,476 14,568 13,366 13,363 15,653 24,925 167,5414481 Clothing stores . . . . . . . . . . . . . . . . 6,720 7,505 9,321 9,462 9,541 9,195 8,904 10,373 9,729 9,866 11,516 16,424 118,55644811 Men’s clothing stores . . . . . . . . . . 707 683 792 852 868 849 817 900 861 907 1,040 1,546 10,82244812 Women’s clothing stores . . . . . . . . 1,734 2,054 2,756 2,795 2,904 2,653 2,466 2,734 2,752 2,742 2,925 4,011 32,52644814 Family clothing stores . . . . . . . . . . 3,149 3,488 4,284 4,345 4,391 4,340 4,250 4,964 4,473 4,649 5,819 8,316 56,4684482 Shoe stores . . . . . . . . . . . . . . . . . . 1,340 1,524 1,824 1,922 1,880 1,798 1,770 2,261 1,772 1,658 1,771 2,371 21,89144831 Jewelry stores . . . . . . . . . . . . . . . 1,267 2,012 1,526 1,587 2,163 1,804 1,664 1,793 1,729 1,706 2,206 5,860 25,317
451 Sporting goods, hobby, book, andmusic stores . . . . . . . . . . . . . . . . . 5,424 5,272 5,907 5,706 5,998 6,110 5,949 6,706 6,334 5,741 7,099 11,874 78,120
45111 Sporting goods stores . . . . . . . . . . . 1,631 1,723 2,118 2,045 2,248 2,387 2,304 2,329 2,075 1,787 2,011 3,434 26,092451211 Book stores . . . . . . . . . . . . . . . . 1,541 1,116 1,055 999 1,133 1,153 1,082 1,647 1,463 1,066 1,161 2,004 15,420
452 General merchandise stores . . . . . . . 26,055 27,283 31,304 31,304 33,112 32,652 31,660 33,422 31,261 32,799 39,777 55,307 405,9364521 Department stores (excl. L.D.) . . . . . . 14,785 15,490 17,955 18,271 19,070 18,242 17,430 18,832 17,362 18,102 23,564 34,524 233,6274521102 Discount dept. stores . . . . . . . . . . 9,001 9,088 10,542 10,847 11,309 10,987 10,564 11,098 10,023 10,539 13,571 18,708 136,2774521101,4521103
Conventional and national chaindept. stores . . . . . . . . . . . . . . . 5,784 6,402 7,413 7,424 7,761 7,255 6,866 7,734 7,339 7,563 9,993 15,816 97,350
4521 Department stores (incl. L.D.)2 . . . . . . 15,110 15,847 18,356 18,682 19,488 18,639 17,803 19,230 17,736 18,496 24,083 35,277 238,7474521102 Discount dept. stores . . . . . . . . . . 9,136 9,226 10,702 11,012 11,482 11,156 10,726 11,268 10,176 10,701 13,779 18,996 138,3604521101,4521103
Conventional and national chaindept. stores . . . . . . . . . . . . . . . 5,974 6,621 7,654 7,670 8,006 7,483 7,077 7,962 7,560 7,795 10,304 16,281 100,387
4529 Other general merchandise stores . . . 11,270 11,793 13,349 13,033 14,042 14,410 14,230 14,590 13,899 14,697 16,213 20,783 172,30945291 Warehouse clubs and superstores . 9,213 9,506 10,780 10,546 11,379 11,760 11,623 11,907 11,371 12,020 13,165 16,731 140,00145299 All other gen. merchandise stores . . 2,057 2,287 2,569 2,487 2,663 2,650 2,607 2,683 2,528 2,677 3,048 4,052 32,308
453 Miscellaneous store retailers . . . . . . . 8,126 9,002 9,136 8,453 9,174 8,956 8,463 9,186 8,902 9,030 9,175 11,397 109,000
454 Nonstore retailers . . . . . . . . . . . . . . . 12,866 13,162 14,030 12,039 12,560 12,492 11,463 13,006 13,255 14,570 15,707 18,694 163,8444541 Electronic shopping and mail-order
houses . . . . . . . . . . . . . . . . . . . . 7,936 7,912 9,224 8,209 8,464 8,608 7,957 8,963 9,065 9,874 10,850 12,871 109,93345431 Fuel dealers . . . . . . . . . . . . . . . . 3,079 3,161 2,425 1,842 1,798 1,677 1,543 1,802 2,045 2,335 2,532 3,692 27,931
722 Food services and drinking places . . . 22,813 23,590 25,908 25,484 26,237 26,351 26,848 26,609 25,679 25,907 24,565 25,999 305,9907221 Full-service restaurants . . . . . . . . . . 10,010 10,448 11,375 11,153 11,303 11,238 11,648 11,471 11,141 11,318 10,606 11,216 132,9277222 Limited-service eating places . . . . . . . 9,720 9,924 10,951 10,938 11,333 11,556 11,630 11,550 10,936 11,027 10,651 11,197 131,4137224 Drinking places . . . . . . . . . . . . . . . . 1,213 1,270 1,437 1,313 1,317 1,315 1,349 1,345 1,299 1,270 1,226 1,323 15,677
7
U.S. Census Bureau

Table 3. Unadjusted and Adjusted Estimates of Monthly Retail and Food Services Sales by Kindsof Business: January 1992 Through December 2001—Con.
[Estimates are shown in millions of dollars. Estimates are based on data from the Monthly Retail Trade Survey, Annual Retail Trade Survey, andadministrative records and have been adjusted using results of the most recent economic census]
NAICScode Kind of business
2000
Jan. Feb. Mar. Apr. May Jun. Jul. Aug. Sept. Oct. Nov. Dec. Total
ADJUSTED3
Retail and food services sales,total . . . . . . . . . . . . . . . . . . . 274,853 279,165 281,762 277,862 277,533 278,919 280,178 279,891 283,665 282,524 281,316 283,086
Total (excl. motor vehicle andparts dealers) . . . . . . . . . . . . . 205,743 208,574 212,143 210,125 210,608 211,434 212,332 212,175 214,925 215,296 214,910 216,258
Retail sales, total . . . . . . . . . 249,866 254,096 256,287 252,429 252,257 253,533 254,560 254,549 257,986 256,823 255,701 257,446
Retail sales, total (excl.motor vehicle and partsdealers) . . . . . . . . . . . . . 180,756 183,505 186,668 184,692 185,332 186,048 186,714 186,833 189,246 189,595 189,295 190,618
GAFO1 . . . . . . . . . . . . . . . . . . . . 70,032 71,204 72,192 72,105 72,528 72,190 72,584 72,979 73,940 73,957 73,504 73,388
441 Motor vehicle and parts dealers . . . . . 69,110 70,591 69,619 67,737 66,925 67,485 67,846 67,716 68,740 67,228 66,406 66,8284411, 4412 Automobile and other motor vehicle
dealers . . . . . . . . . . . . . . . . . . . . 62,925 64,508 63,407 61,746 60,821 61,372 61,791 61,625 62,324 61,166 60,389 60,5074413 Auto parts, access., and tire stores . . . 6,185 6,083 6,212 5,991 6,104 6,113 6,055 6,091 6,416 6,062 6,017 6,321
442, 443 Furniture, home furnishings,electronics and appliance stores . . . 14,760 14,931 14,977 15,099 15,009 14,864 14,803 14,987 15,080 14,984 14,785 14,350
442 Furniture and home furnishings stores 7,482 7,577 7,645 7,698 7,707 7,651 7,700 7,702 7,688 7,699 7,605 7,191
443 Electronics and appliance stores . . . . 7,278 7,354 7,332 7,401 7,302 7,213 7,103 7,285 7,392 7,285 7,180 7,15944312 Computer and software stores . . . . . . 2,396 2,400 2,384 2,363 2,328 2,246 2,194 2,250 2,294 2,195 2,122 2,083
444 Building mat. and garden equip. andsupplies dealers . . . . . . . . . . . . . . . 23,411 23,059 24,408 22,845 22,961 22,848 22,957 23,096 23,155 23,145 23,238 23,799
4441 Building mat. and supplies dealers . . . 20,243 19,954 21,124 19,988 20,128 19,995 20,027 19,954 19,972 20,141 20,084 20,410
445 Food and beverage stores . . . . . . . . . 36,838 37,333 37,823 38,280 38,099 38,433 38,367 38,373 38,396 38,624 38,554 38,8764451 Grocery stores . . . . . . . . . . . . . . . . 33,355 33,806 34,271 34,708 34,489 34,782 34,681 34,675 34,673 34,865 34,792 35,1874453 Beer, wine, and liquor stores . . . . . . . 2,287 2,324 2,354 2,344 2,379 2,411 2,433 2,460 2,460 2,492 2,510 2,459
See note3
446 Health and personal care stores . . . . . 12,590 12,601 12,824 12,858 12,989 13,014 13,139 13,248 13,459 13,502 13,535 13,61044611 Pharmacies and drug stores . . . . . . . 10,391 10,397 10,630 10,703 10,842 10,880 10,969 11,131 11,234 11,334 11,393 11,293
447 Gasoline stations . . . . . . . . . . . . . . . 19,308 20,136 20,724 19,784 19,877 20,357 20,604 19,960 20,685 20,887 20,955 20,810
448 Clothing and clothing access. stores . 13,305 13,661 13,818 13,808 13,918 13,786 13,758 14,037 14,306 14,259 14,151 14,1834481 Clothing stores . . . . . . . . . . . . . . . . 9,303 9,604 9,823 9,766 9,815 9,713 9,695 9,930 10,167 10,107 10,091 10,07144811 Men’s clothing stores . . . . . . . . . . 863 872 891 908 909 873 920 899 919 912 911 90044812 Women’s clothing stores . . . . . . . . 2,422 2,580 2,731 2,659 2,709 2,699 2,731 2,756 2,817 2,812 2,775 2,7454482 Shoe stores . . . . . . . . . . . . . . . . . . 1,821 1,823 1,856 1,817 1,811 1,794 1,781 1,828 1,832 1,848 1,841 1,81844831 Jewelry stores . . . . . . . . . . . . . . . 2,037 2,085 1,984 2,072 2,137 2,135 2,136 2,137 2,159 2,151 2,073 2,148
451 Sporting goods, hobby, book, andmusic stores . . . . . . . . . . . . . . . . . 6,122 6,414 6,456 6,559 6,613 6,521 6,662 6,517 6,710 6,539 6,477 6,492
452 General merchandise stores . . . . . . . 32,335 32,727 33,419 32,989 33,505 33,515 33,836 33,917 34,253 34,482 34,507 34,7944521 Department stores (excl. L.D.) . . . . . . 19,378 19,191 19,410 19,276 19,505 19,266 19,292 19,258 19,367 19,428 19,632 19,7514529 Other general merchandise stores . . . 12,957 13,536 14,009 13,713 14,000 14,249 14,544 14,659 14,886 15,054 14,875 15,04345291 Warehouse clubs and superstores . 10,363 10,889 11,276 11,078 11,345 11,575 11,800 11,907 12,123 12,303 12,156 12,43045299 All other gen. merchandise stores . . 2,594 2,647 2,733 2,635 2,655 2,674 2,744 2,752 2,763 2,751 2,719 2,613
453 Miscellaneous store retailers . . . . . . . 9,300 9,295 9,178 9,261 8,906 8,898 8,956 8,886 9,227 9,215 9,047 8,943
454 Nonstore retailers . . . . . . . . . . . . . . . 12,787 13,348 13,041 13,209 13,455 13,812 13,632 13,812 13,975 13,958 14,046 14,7614541 Electronic shopping and mail-order
houses. . . . . . . . . . . . . . . . . . . . . 8,664 8,675 8,938 9,051 8,995 9,216 9,178 9,278 9,336 9,377 9,443 9,69245431 Fuel dealers . . . . . . . . . . . . . . . . 2,015 2,513 1,931 2,096 2,242 2,413 2,283 2,343 2,423 2,417 2,414 2,914
722 Food services and drinking places . . . 24,987 25,069 25,475 25,433 25,276 25,386 25,618 25,342 25,679 25,701 25,615 25,640
See footnotes at end of table.
8
U.S. Census Bureau

Table 3. Unadjusted and Adjusted Estimates of Monthly Retail and Food Services Sales by Kindsof Business: January 1992 Through December 2001—Con.
[Estimates are shown in millions of dollars. Estimates are based on data from the Monthly Retail Trade Survey, Annual Retail Trade Survey, andadministrative records and have been adjusted using results of the most recent economic census]
NAICScode Kind of business
1999
Jan. Feb. Mar. Apr. May Jun. Jul. Aug. Sept. Oct. Nov. Dec. Total
UNADJUSTED
Retail and food services sales,total . . . . . . . . . . . . . . . . . . . . 222,413 225,070 258,811 256,345 267,950 266,954 267,990 271,034 259,680 263,883 269,749 323,752 3,153,631
Total (excl. motor vehicle andparts dealers) . . . . . . . . . . . . . 168,815 166,907 189,774 190,184 198,819 196,182 198,249 200,137 193,706 200,128 208,536 262,227 2,373,664
Retail sales, total . . . . . . . . . 200,970 203,747 235,355 232,536 243,150 242,722 242,792 246,287 236,318 238,907 246,384 298,987 2,868,155
Retail sales, total (excl.motor vehicle and partsdealers) . . . . . . . . . . . . . 147,372 145,584 166,318 166,375 174,019 171,950 173,051 175,390 170,344 175,152 185,171 237,462 2,088,188
GAFO1 . . . . . . . . . . . . . . . . . . . . 54,640 55,209 63,497 62,209 65,838 64,858 64,557 68,382 64,695 67,163 76,993 114,808 822,849
441 Motor vehicle and parts dealers . . . . . 53,598 58,163 69,037 66,161 69,131 70,772 69,741 70,897 65,974 63,755 61,213 61,525 779,9674411, 4412 Automobile and other motor vehicle
dealers . . . . . . . . . . . . . . . . . . . . 48,482 52,996 63,051 60,054 63,126 64,423 63,412 64,580 59,737 57,564 55,148 55,664 708,237
4411 Automobile dealers . . . . . . . . . . . . 46,625 50,359 59,397 56,138 58,913 60,335 59,652 61,211 56,803 54,610 52,685 53,107 669,83544111 New car dealers . . . . . . . . . . . . . 42,381 45,614 54,314 51,147 53,784 55,097 54,560 56,110 52,087 49,873 48,167 48,781 611,91544112 Used car dealers . . . . . . . . . . . . . 4,244 4,745 5,083 4,991 5,129 5,238 5,092 5,101 4,716 4,737 4,518 4,326 57,9204413 Auto parts, access., and tire stores . . 5,116 5,167 5,986 6,107 6,005 6,349 6,329 6,317 6,237 6,191 6,065 5,861 71,730
442, 443 Furniture, home furnishings,electronics, and appliance stores . . . 12,241 11,939 13,345 12,525 12,960 13,367 13,683 14,092 13,785 13,834 15,431 19,949 167,151
442 Furniture and home furnishings stores 5,989 6,072 6,881 6,576 6,758 6,937 7,042 7,320 7,215 7,409 8,050 8,880 85,1294421 Furniture stores . . . . . . . . . . . . . . . 3,587 3,548 3,937 3,602 3,791 3,812 3,887 3,958 3,971 4,031 4,298 4,546 46,9684422 Home furnishings stores . . . . . . . . . . 2,402 2,524 2,944 2,974 2,967 3,125 3,155 3,362 3,244 3,378 3,752 4,334 38,161
443 Electronics and appliance stores . . . . 6,252 5,867 6,464 5,949 6,202 6,430 6,641 6,772 6,570 6,425 7,381 11,069 82,02244311 Appl., TV, and other elect. stores . . . . 3,738 3,560 3,820 3,528 3,820 3,970 4,254 4,276 4,029 4,039 4,905 7,553 51,492443111 Household appliance stores . . . . . . 809 781 903 884 907 1,053 1,142 966 937 943 992 1,175 11,492443112 Radio, TV, and other elect. stores . . 2,929 2,779 2,917 2,644 2,913 2,917 3,112 3,310 3,092 3,096 3,913 6,378 40,00044312 Computer and software stores . . . . . . 2,348 2,139 2,452 2,226 2,169 2,241 2,171 2,279 2,346 2,180 2,204 2,999 27,754
444 Building mat. and garden equip. andsupplies dealers . . . . . . . . . . . . . . . 16,848 17,572 21,449 23,593 24,779 24,818 23,477 23,066 22,376 22,654 21,998 21,409 264,039
4441 Building mat. and supplies dealers . . . 14,678 15,314 18,560 19,855 20,424 21,285 20,759 20,647 19,912 20,102 19,538 18,477 229,55144413 Hardware stores . . . . . . . . . . . . . . 1,075 979 1,176 1,375 1,451 1,402 1,343 1,253 1,235 1,241 1,237 1,317 15,084
445 Food and beverage stores . . . . . . . . . 34,822 32,674 36,073 35,715 37,717 36,469 38,737 36,882 36,558 37,059 36,794 43,122 442,6224451 Grocery stores . . . . . . . . . . . . . . . . 31,950 29,827 32,920 32,433 34,266 33,127 35,201 33,604 33,336 33,716 33,354 38,075 401,8094453 Beer, wine, and liquor stores . . . . . . . 1,900 1,840 2,024 2,139 2,254 2,188 2,385 2,183 2,167 2,262 2,317 3,328 26,987
446 Health and personal care stores . . . . . 11,167 10,991 12,160 11,814 12,056 12,009 11,926 11,894 11,668 12,080 12,251 15,403 145,41944611 Pharmacies and drug stores . . . . . . . 9,478 9,334 10,279 10,002 10,185 10,109 10,012 9,971 9,853 10,217 10,275 13,027 122,742
447 Gasoline stations . . . . . . . . . . . . . . . 14,971 14,104 16,088 16,957 17,636 17,636 18,807 18,959 18,254 18,664 17,956 19,377 209,409
448 Clothing and clothing access. stores . 9,261 10,193 12,089 12,407 13,182 12,291 12,456 13,716 12,355 12,951 14,643 24,344 159,8884481 Clothing stores . . . . . . . . . . . . . . . . 6,618 6,927 8,731 8,973 9,236 8,686 8,866 9,762 8,966 9,477 10,571 15,547 112,36044811 Men’s clothing stores . . . . . . . . . . 734 656 763 877 871 860 789 863 783 882 989 1,474 10,54144812 Women’s clothing stores . . . . . . . . 1,778 1,920 2,555 2,670 2,743 2,457 2,355 2,464 2,410 2,502 2,631 3,734 30,21944814 Family clothing stores . . . . . . . . . . 2,994 3,179 4,004 4,051 4,264 4,072 4,354 4,789 4,260 4,581 5,357 7,895 53,8004482 Shoe stores . . . . . . . . . . . . . . . . . . 1,370 1,488 1,829 1,844 1,932 1,836 1,860 2,195 1,719 1,673 1,711 2,378 21,83544831 Jewelry stores . . . . . . . . . . . . . . . 1,173 1,675 1,414 1,481 1,892 1,649 1,610 1,631 1,544 1,668 2,199 6,133 24,069
451 Sporting goods, hobby, book, andmusic stores . . . . . . . . . . . . . . . . . 5,337 4,810 5,500 5,329 5,479 5,816 5,644 6,165 5,789 5,617 6,845 11,714 74,045
45111 Sporting goods stores . . . . . . . . . . . 1,511 1,496 1,861 1,925 2,031 2,258 2,104 2,188 1,888 1,750 1,875 3,301 24,188451211 Book stores . . . . . . . . . . . . . . . . 1,541 1,011 999 957 1,002 1,060 1,052 1,426 1,276 1,047 1,119 2,051 14,541
452 General merchandise stores . . . . . . . 24,647 25,180 29,363 28,978 31,293 30,419 29,900 31,056 29,487 31,468 36,360 53,277 381,4284521 Department stores (excl. L.D.) . . . . . . 14,509 15,279 17,901 17,753 18,990 18,006 17,597 18,568 17,446 18,576 22,287 34,130 231,0424521102 Discount dept. stores . . . . . . . . . . 8,834 9,043 10,451 10,417 11,192 10,780 10,541 10,817 10,088 10,770 12,661 18,109 133,7034521101,4521103
Conventional and national chaindept. stores . . . . . . . . . . . . . . . 5,675 6,236 7,450 7,336 7,798 7,226 7,056 7,751 7,358 7,806 9,626 16,021 97,339
4521 Department stores (incl. L.D.)2 . . . . . . 14,818 15,596 18,267 18,127 19,406 18,405 17,977 18,966 17,824 18,984 22,786 34,907 236,0634521102 Discount dept. stores . . . . . . . . . . 8,968 9,180 10,609 10,573 11,360 10,942 10,699 10,980 10,239 10,932 12,851 18,380 135,7134521101,4521103
Conventional and national chaindept. stores . . . . . . . . . . . . . . . 5,850 6,416 7,658 7,554 8,046 7,463 7,278 7,986 7,585 8,052 9,935 16,527 100,350
4529 Other general merchandise stores . . . 10,138 9,901 11,462 11,225 12,303 12,413 12,303 12,488 12,041 12,892 14,073 19,147 150,38645291 Warehouse clubs and superstores . 8,104 7,779 9,014 8,822 9,734 9,867 9,797 9,976 9,617 10,251 11,163 15,059 119,18345299 All other gen. merchandise stores . . 2,034 2,122 2,448 2,403 2,569 2,546 2,506 2,512 2,424 2,641 2,910 4,088 31,203
453 Miscellaneous store retailers . . . . . . . 7,526 8,061 8,508 8,355 8,650 8,671 8,360 8,741 8,556 8,552 9,303 12,459 105,742
454 Nonstore retailers . . . . . . . . . . . . . . . 10,552 10,060 11,743 10,702 10,267 10,454 10,061 10,819 11,516 12,273 13,590 16,408 138,4454541 Electronic shopping and mail-order
houses . . . . . . . . . . . . . . . . . . . . 6,408 6,309 7,497 7,035 6,832 7,124 6,865 7,405 7,913 8,420 9,449 11,664 92,92145431 Fuel dealers . . . . . . . . . . . . . . . . 2,347 1,869 2,090 1,550 1,353 1,273 1,237 1,333 1,486 1,763 1,913 2,574 20,788
722 Food services and drinking places . . . 21,443 21,323 23,456 23,809 24,800 24,232 25,198 24,747 23,362 24,976 23,365 24,765 285,4767221 Full-service restaurants . . . . . . . . . . 9,516 9,441 10,301 10,479 10,695 10,457 10,980 10,836 10,201 10,954 10,138 10,611 124,6097222 Limited-service eating places . . . . . . . 9,120 9,020 9,962 10,136 10,746 10,436 10,892 10,615 9,949 10,609 10,012 10,689 122,1867224 Drinking places . . . . . . . . . . . . . . . . 1,115 1,154 1,306 1,261 1,222 1,211 1,271 1,221 1,192 1,280 1,201 1,279 14,713
9
U.S. Census Bureau

Table 3. Unadjusted and Adjusted Estimates of Monthly Retail and Food Services Sales by Kindsof Business: January 1992 Through December 2001—Con.
[Estimates are shown in millions of dollars. Estimates are based on data from the Monthly Retail Trade Survey, Annual Retail Trade Survey, andadministrative records and have been adjusted using results of the most recent economic census]
NAICScode Kind of business
1999
Jan. Feb. Mar. Apr. May Jun. Jul. Aug. Sept. Oct. Nov. Dec. Total
ADJUSTED3
Retail and food services sales,total . . . . . . . . . . . . . . . . . . . 252,192 255,325 255,990 257,416 260,358 261,118 263,205 265,663 266,698 267,257 270,404 275,378
Total (excl. motor vehicle andparts dealers) . . . . . . . . . . . . . 190,439 192,584 193,101 194,412 195,769 196,206 197,031 198,697 200,225 201,505 203,339 207,991
Retail sales, total . . . . . . . . . 228,960 231,867 232,627 233,843 236,649 237,454 239,611 241,936 242,859 242,961 246,015 250,785
Retail sales, total (excl.motor vehicle and partsdealers) . . . . . . . . . . . . . 167,207 169,126 169,738 170,839 172,060 172,542 173,437 174,970 176,386 177,209 178,950 183,398
GAFO1 . . . . . . . . . . . . . . . . . . . . 66,214 66,882 67,358 67,279 67,881 68,597 68,290 68,852 69,492 69,732 69,689 70,820
441 Motor vehicle and parts dealers . . . . . 61,753 62,741 62,889 63,004 64,589 64,912 66,174 66,966 66,473 65,752 67,065 67,3874411, 4412 Automobile and other motor vehicle
dealers . . . . . . . . . . . . . . . . . . . . 55,919 56,863 57,060 57,086 58,667 58,995 60,220 61,040 60,340 59,652 60,870 61,2374413 Auto parts, access., and tire stores . . . 5,834 5,878 5,829 5,918 5,922 5,917 5,954 5,926 6,133 6,100 6,195 6,150
442, 443 Furniture, home furnishings,electronics and appliance stores . . . 13,209 13,373 13,505 13,575 13,687 13,877 13,946 14,122 14,352 14,339 14,221 14,504
442 Furniture and home furnishings stores 6,692 6,846 6,895 6,915 6,938 7,043 7,056 7,219 7,347 7,357 7,345 7,351
443 Electronics and appliance stores . . . . 6,517 6,527 6,610 6,660 6,749 6,834 6,890 6,903 7,005 6,982 6,876 7,15344312 Computer and software stores . . . . . . 2,355 2,300 2,305 2,326 2,332 2,349 2,305 2,304 2,327 2,250 2,254 2,341
444 Building mat. and garden equip. andsupplies dealers . . . . . . . . . . . . . . . 21,294 21,723 21,605 21,518 21,686 21,869 21,997 22,133 22,111 22,398 22,909 23,001
4441 Building mat. and supplies dealers . . . 18,393 18,813 18,843 18,749 18,841 18,971 19,115 19,260 19,276 19,441 19,916 19,975
445 Food and beverage stores . . . . . . . . . 36,004 36,331 36,282 36,550 36,726 36,550 36,778 36,899 37,234 37,092 37,328 38,6154451 Grocery stores . . . . . . . . . . . . . . . . 32,669 32,994 32,953 33,129 33,333 33,193 33,429 33,537 33,844 33,682 33,896 35,0604453 Beer, wine, and liquor stores . . . . . . . 2,189 2,185 2,179 2,256 2,234 2,210 2,229 2,234 2,257 2,276 2,265 2,360
See note3
446 Health and personal care stores . . . . . 11,536 11,680 11,737 11,897 11,948 12,106 12,059 12,149 12,282 12,364 12,527 13,00944611 Pharmacies and drug stores . . . . . . . 9,711 9,856 9,912 10,123 10,114 10,315 10,237 10,290 10,415 10,458 10,517 10,722
447 Gasoline stations . . . . . . . . . . . . . . . 16,273 16,156 16,433 16,974 16,941 16,622 17,414 17,835 17,967 18,316 18,802 19,533
448 Clothing and clothing access. stores . 12,972 12,955 13,002 13,203 13,378 13,434 13,313 13,391 13,292 13,453 13,417 13,4854481 Clothing stores . . . . . . . . . . . . . . . . 9,121 9,142 9,214 9,378 9,475 9,483 9,380 9,453 9,403 9,446 9,424 9,33744811 Men’s clothing stores . . . . . . . . . . 879 861 865 952 896 907 875 880 849 860 883 85444812 Women’s clothing stores . . . . . . . . 2,483 2,487 2,535 2,560 2,585 2,570 2,532 2,525 2,477 2,505 2,518 2,4614482 Shoe stores . . . . . . . . . . . . . . . . . . 1,859 1,835 1,786 1,824 1,851 1,875 1,822 1,816 1,796 1,807 1,794 1,80344831 Jewelry stores . . . . . . . . . . . . . . . 1,862 1,853 1,875 1,870 1,923 1,945 1,983 1,989 1,964 2,052 2,044 2,195
451 Sporting goods, hobby, book, andmusic stores . . . . . . . . . . . . . . . . . 5,970 6,120 6,084 6,049 6,129 6,220 6,148 6,110 6,265 6,297 6,228 6,315
452 General merchandise stores . . . . . . . 30,753 31,143 31,431 31,152 31,380 31,750 31,693 31,894 32,216 32,243 32,321 33,0044521 Department stores (excl. L.D.) . . . . . . 19,094 19,350 19,365 19,185 19,176 19,313 19,264 19,184 19,393 19,286 19,215 19,2954529 Other general merchandise stores . . . 11,659 11,793 12,066 11,967 12,204 12,437 12,429 12,710 12,823 12,957 13,106 13,70945291 Warehouse clubs and superstores . 9,126 9,239 9,478 9,405 9,619 9,828 9,856 10,118 10,188 10,303 10,482 11,07345299 All other gen. merchandise stores . . 2,533 2,554 2,588 2,562 2,585 2,609 2,573 2,592 2,635 2,654 2,624 2,636
453 Miscellaneous store retailers . . . . . . . 8,597 8,764 8,659 8,707 8,742 8,602 8,476 8,644 8,741 8,832 9,190 9,511
454 Nonstore retailers . . . . . . . . . . . . . . . 10,599 10,881 11,000 11,214 11,443 11,512 11,613 11,793 11,926 11,875 12,007 12,4214541 Electronic shopping and mail-order
houses. . . . . . . . . . . . . . . . . . . . . 7,003 7,302 7,293 7,421 7,600 7,702 7,740 7,928 8,034 8,065 8,090 8,39145431 Fuel dealers . . . . . . . . . . . . . . . . 1,538 1,560 1,667 1,722 1,744 1,751 1,793 1,794 1,788 1,833 1,831 1,931
722 Food services and drinking places . . . 23,232 23,458 23,363 23,573 23,709 23,664 23,594 23,727 23,839 24,296 24,389 24,593
See footnotes at end of table.
10
U.S. Census Bureau

Table 3. Unadjusted and Adjusted Estimates of Monthly Retail and Food Services Sales by Kindsof Business: January 1992 Through December 2001—Con.
[Estimates are shown in millions of dollars. Estimates are based on data from the Monthly Retail Trade Survey, Annual Retail Trade Survey, andadministrative records and have been adjusted using results of the most recent economic census]
NAICScode Kind of business
1998
Jan. Feb. Mar. Apr. May Jun. Jul. Aug. Sept. Oct. Nov. Dec. Total
UNADJUSTED
Retail and food services sales,total . . . . . . . . . . . . . . . . . . . . 211,292 207,287 234,395 238,999 249,811 248,945 246,301 245,212 236,047 249,146 245,442 293,854 2,906,731
Total (excl. motor vehicle andparts dealers) . . . . . . . . . . . . . 160,893 155,837 173,748 178,126 186,717 183,126 185,560 186,478 178,410 188,571 191,872 237,936 2,207,274
Retail sales, total . . . . . . . . . 190,806 187,105 211,950 216,654 225,818 225,617 222,419 221,210 213,589 225,267 223,287 270,363 2,634,085
Retail sales, total (excl.motor vehicle and partsdealers) . . . . . . . . . . . . . 140,407 135,655 151,303 155,781 162,724 159,798 161,678 162,476 155,952 164,692 169,717 214,445 1,934,628
GAFO1 . . . . . . . . . . . . . . . . . . . . 51,035 51,010 57,102 58,678 61,473 59,917 59,973 63,966 59,112 63,240 72,082 104,982 762,570
441 Motor vehicle and parts dealers . . . . . 50,399 51,450 60,647 60,873 63,094 65,819 60,741 58,734 57,637 60,575 53,570 55,918 699,4574411, 4412 Automobile and other motor vehicle
dealers . . . . . . . . . . . . . . . . . . . . 45,424 46,597 55,032 55,168 57,322 59,878 54,690 52,828 51,888 54,544 48,150 50,369 631,890
4411 Automobile dealers . . . . . . . . . . . . 43,555 44,303 52,030 51,765 53,635 56,289 51,107 49,810 49,079 51,706 46,084 48,107 597,47044111 New car dealers . . . . . . . . . . . . . 39,792 40,052 47,396 47,250 49,163 51,435 46,443 45,204 44,818 47,035 42,239 44,301 545,12844112 Used car dealers . . . . . . . . . . . . . 3,763 4,251 4,634 4,515 4,472 4,854 4,664 4,606 4,261 4,671 3,845 3,806 52,3424413 Auto parts, access., and tire stores . . 4,975 4,853 5,615 5,705 5,772 5,941 6,051 5,906 5,749 6,031 5,420 5,549 67,567
442, 443 Furniture, home furnishings,electronics, and appliance stores . . . 11,858 11,192 12,222 11,641 12,007 12,422 12,738 13,014 12,482 12,870 14,109 18,000 154,555
442 Furniture and home furnishings stores 5,911 5,672 6,264 6,145 6,324 6,417 6,569 6,604 6,431 6,798 7,273 8,166 78,5744421 Furniture stores . . . . . . . . . . . . . . . 3,575 3,380 3,662 3,473 3,626 3,609 3,663 3,674 3,603 3,734 3,974 4,166 44,1394422 Home furnishings stores . . . . . . . . . . 2,336 2,292 2,602 2,672 2,698 2,808 2,906 2,930 2,828 3,064 3,299 4,000 34,435
443 Electronics and appliance stores . . . . 5,947 5,520 5,958 5,496 5,683 6,005 6,169 6,410 6,051 6,072 6,836 9,834 75,98144311 Appl., TV, and other elect. stores . . . . 3,577 3,304 3,474 3,218 3,537 3,630 3,792 3,970 3,561 3,524 4,289 6,389 46,265443111 Household appliance stores . . . . . . 820 758 839 822 901 975 1,016 934 861 901 913 1,074 10,814443112 Radio, TV, and other elect. stores . . 2,757 2,546 2,635 2,396 2,636 2,655 2,776 3,036 2,700 2,623 3,376 5,315 35,45144312 Computer and software stores . . . . . . 2,223 2,071 2,317 2,099 1,950 2,166 2,169 2,235 2,295 2,336 2,313 3,008 27,182
444 Building mat. and garden equip. andsupplies dealers . . . . . . . . . . . . . . . 15,986 15,990 19,286 21,933 22,867 22,832 21,996 20,567 20,893 21,670 19,522 19,948 243,490
4441 Building mat. and supplies dealers . . . 13,889 13,819 16,409 18,046 18,656 19,598 19,371 18,363 18,549 19,158 17,132 17,059 210,04944413 Hardware stores . . . . . . . . . . . . . . 966 893 1,094 1,306 1,403 1,402 1,332 1,286 1,269 1,272 1,198 1,330 14,751
445 Food and beverage stores . . . . . . . . . 33,694 30,934 33,719 34,283 36,132 34,772 36,858 35,862 34,509 35,925 35,065 39,826 421,5794451 Grocery stores . . . . . . . . . . . . . . . . 30,891 28,176 30,776 31,130 32,801 31,569 33,460 32,622 31,405 32,640 31,802 35,154 382,4264453 Beer, wine, and liquor stores . . . . . . . 1,862 1,786 1,913 1,984 2,163 2,084 2,237 2,146 2,058 2,193 2,187 3,084 25,697
446 Health and personal care stores . . . . . 10,200 9,775 10,460 10,630 10,757 10,690 10,809 10,816 10,529 11,083 10,910 13,569 130,22844611 Pharmacies and drug stores . . . . . . . 8,508 8,164 8,684 8,827 8,943 8,764 8,879 8,876 8,732 9,245 9,173 11,549 108,344
447 Gasoline stations . . . . . . . . . . . . . . . 15,287 14,113 15,410 15,736 16,825 16,763 17,310 16,814 15,832 16,359 15,293 16,007 191,749
448 Clothing and clothing access. stores . 8,828 9,520 10,880 11,842 12,264 11,473 11,650 12,975 11,232 12,405 13,877 22,496 149,4424481 Clothing stores . . . . . . . . . . . . . . . . 6,282 6,419 7,795 8,477 8,500 8,044 8,272 9,189 8,099 9,056 10,092 14,669 104,89444811 Men’s clothing stores . . . . . . . . . . 732 660 756 870 864 847 790 881 792 911 1,008 1,510 10,62144812 Women’s clothing stores . . . . . . . . 1,736 1,782 2,214 2,532 2,540 2,281 2,251 2,359 2,275 2,460 2,571 3,689 28,69044814 Family clothing stores . . . . . . . . . . 2,746 2,848 3,528 3,780 3,851 3,740 4,000 4,470 3,734 4,361 5,094 7,320 49,4724482 Shoe stores . . . . . . . . . . . . . . . . . . 1,319 1,471 1,719 1,877 1,871 1,763 1,820 2,194 1,649 1,741 1,741 2,374 21,53944831 Jewelry stores . . . . . . . . . . . . . . . 1,122 1,519 1,243 1,367 1,763 1,534 1,421 1,472 1,379 1,513 1,933 5,261 21,527
451 Sporting goods, hobby, book, andmusic stores . . . . . . . . . . . . . . . . . 5,033 4,486 5,015 5,035 5,234 5,423 5,253 5,876 5,433 5,301 6,276 11,091 69,456
45111 Sporting goods stores . . . . . . . . . . . 1,395 1,421 1,775 1,842 1,962 2,146 2,002 2,065 1,727 1,632 1,711 2,901 22,579451211 Book stores . . . . . . . . . . . . . . . . 1,467 926 886 857 924 945 887 1,395 1,259 965 1,004 1,875 13,390
452 General merchandise stores . . . . . . . 22,519 23,057 26,156 27,482 29,234 27,849 27,447 29,068 26,747 29,424 34,457 48,356 351,7964521 Department stores (excl. L.D.) . . . . . . 13,902 14,659 16,640 17,569 18,609 17,260 16,934 18,393 16,497 18,242 22,203 32,745 223,6534521102 Discount dept. stores . . . . . . . . . . 8,415 8,572 9,636 10,325 10,964 10,326 10,073 10,588 9,575 10,559 12,573 17,401 129,0074521101,4521103
Conventional and national chaindept. stores . . . . . . . . . . . . . . . 5,487 6,087 7,004 7,244 7,645 6,934 6,861 7,805 6,922 7,683 9,630 15,344 94,646
4521 Department stores (incl. L.D.)2 . . . . . . 14,213 14,992 17,018 17,977 19,029 17,645 17,302 18,788 16,844 18,631 22,673 33,435 228,5474521102 Discount dept. stores . . . . . . . . . . 8,548 8,707 9,788 10,486 11,135 10,486 10,230 10,752 9,722 10,721 12,764 17,665 131,0044521101,4521103
Conventional and national chaindept. stores . . . . . . . . . . . . . . . 5,665 6,285 7,230 7,491 7,894 7,159 7,072 8,036 7,122 7,910 9,909 15,770 97,543
4529 Other general merchandise stores . . . 8,617 8,398 9,516 9,913 10,625 10,589 10,513 10,675 10,250 11,182 12,254 15,611 128,14345291 Warehouse clubs and superstores . 6,670 6,406 7,286 7,595 8,182 8,195 8,137 8,306 7,985 8,664 9,465 11,827 98,71845299 All other gen. merchandise stores . . 1,947 1,992 2,230 2,318 2,443 2,394 2,376 2,369 2,265 2,518 2,789 3,784 29,425
453 Miscellaneous store retailers . . . . . . . 7,209 7,374 7,687 7,688 8,168 8,354 8,346 8,383 8,383 8,490 8,377 11,344 99,803
454 Nonstore retailers . . . . . . . . . . . . . . . 9,793 9,214 10,468 9,511 9,236 9,220 9,271 9,101 9,912 11,165 11,831 13,808 122,5304541 Electronic shopping and mail-order
houses . . . . . . . . . . . . . . . . . . . . 5,766 5,421 6,482 6,044 6,055 5,917 6,049 5,987 6,632 7,391 8,054 9,691 79,48945431 Fuel dealers . . . . . . . . . . . . . . . . 2,427 2,083 2,069 1,582 1,340 1,263 1,228 1,188 1,324 1,547 1,651 2,038 19,740
722 Food services and drinking places . . . 20,486 20,182 22,445 22,345 23,993 23,328 23,882 24,002 22,458 23,879 22,155 23,491 272,6467221 Full-service restaurants . . . . . . . . . . 9,143 9,107 9,961 9,808 10,401 10,177 10,425 10,504 9,801 10,404 9,659 10,273 119,6637222 Limited-service eating places . . . . . . . 8,653 8,383 9,501 9,635 10,460 10,034 10,367 10,406 9,629 10,228 9,507 10,033 116,8367224 Drinking places . . . . . . . . . . . . . . . . 1,118 1,099 1,211 1,137 1,190 1,167 1,246 1,220 1,156 1,242 1,130 1,194 14,110
11
U.S. Census Bureau

Table 3. Unadjusted and Adjusted Estimates of Monthly Retail and Food Services Sales by Kindsof Business: January 1992 Through December 2001—Con.
[Estimates are shown in millions of dollars. Estimates are based on data from the Monthly Retail Trade Survey, Annual Retail Trade Survey, andadministrative records and have been adjusted using results of the most recent economic census]
NAICScode Kind of business
1998
Jan. Feb. Mar. Apr. May Jun. Jul. Aug. Sept. Oct. Nov. Dec. Total
ADJUSTED3
Retail and food services sales,total . . . . . . . . . . . . . . . . . . . 235,768 236,188 237,483 239,914 241,572 243,269 241,413 240,912 243,728 247,083 248,705 251,321
Total (excl. motor vehicle andparts dealers) . . . . . . . . . . . . . 179,524 180,442 180,788 181,548 182,689 183,389 184,292 184,755 185,380 186,795 188,195 189,569
Retail sales, total . . . . . . . . . 213,693 213,937 215,083 217,524 218,958 220,510 218,776 218,140 220,765 223,989 225,457 227,759
Retail sales, total (excl.motor vehicle and partsdealers) . . . . . . . . . . . . . 157,449 158,191 158,388 159,158 160,075 160,630 161,655 161,983 162,417 163,701 164,947 166,007
GAFO1 . . . . . . . . . . . . . . . . . . . . 61,850 62,353 62,548 62,770 62,949 63,527 63,504 63,781 64,031 64,609 65,201 65,294
441 Motor vehicle and parts dealers . . . . . 56,244 55,746 56,695 58,366 58,883 59,880 57,121 56,157 58,348 60,288 60,510 61,7524411, 4412 Automobile and other motor vehicle
dealers . . . . . . . . . . . . . . . . . . . . 50,753 50,212 51,097 52,843 53,224 54,286 51,497 50,505 52,678 54,544 54,841 55,9664413 Auto parts, access., and tire stores . . . 5,491 5,534 5,598 5,523 5,659 5,594 5,624 5,652 5,670 5,744 5,669 5,786
442, 443 Furniture, home furnishings,electronics and appliance stores . . . 12,633 12,627 12,631 12,583 12,617 12,854 12,970 13,037 12,934 13,040 13,250 13,316
442 Furniture and home furnishings stores 6,488 6,438 6,438 6,448 6,460 6,521 6,569 6,513 6,522 6,613 6,747 6,805
443 Electronics and appliance stores . . . . 6,145 6,189 6,193 6,135 6,157 6,333 6,401 6,524 6,412 6,427 6,503 6,51144312 Computer and software stores . . . . . . 2,208 2,229 2,209 2,171 2,104 2,245 2,290 2,285 2,307 2,348 2,380 2,372
444 Building mat. and garden equip. andsupplies dealers . . . . . . . . . . . . . . . 19,697 19,805 19,805 20,171 20,090 20,020 20,291 20,227 20,542 20,695 20,910 21,229
4441 Building mat. and supplies dealers . . . 16,897 17,018 17,039 17,302 17,258 17,343 17,626 17,572 17,784 17,888 18,034 18,284
445 Food and beverage stores . . . . . . . . . 34,387 34,440 34,690 34,688 34,904 35,041 35,237 35,349 35,464 35,549 35,669 36,0454451 Grocery stores . . . . . . . . . . . . . . . . 31,203 31,203 31,468 31,444 31,661 31,824 31,989 32,077 32,177 32,253 32,385 32,6714453 Beer, wine, and liquor stores . . . . . . . 2,090 2,129 2,098 2,113 2,119 2,092 2,112 2,157 2,159 2,161 2,170 2,251
See note3
446 Health and personal care stores . . . . . 10,366 10,432 10,439 10,609 10,629 10,733 10,874 11,105 11,095 11,161 11,353 11,44144611 Pharmacies and drug stores . . . . . . . 8,594 8,639 8,693 8,792 8,881 8,934 9,042 9,179 9,240 9,320 9,516 9,521
447 Gasoline stations . . . . . . . . . . . . . . . 16,297 16,129 15,919 15,863 16,070 15,950 16,058 15,832 15,722 15,883 16,014 16,152
448 Clothing and clothing access. stores . 12,204 12,245 12,303 12,369 12,339 12,498 12,489 12,478 12,254 12,584 12,678 12,7954481 Clothing stores . . . . . . . . . . . . . . . . 8,554 8,548 8,648 8,709 8,655 8,767 8,781 8,775 8,659 8,849 8,926 8,96144811 Men’s clothing stores . . . . . . . . . . 867 867 887 927 881 897 890 892 878 885 884 88144812 Women’s clothing stores . . . . . . . . 2,404 2,336 2,358 2,389 2,376 2,383 2,402 2,390 2,370 2,412 2,442 2,4734482 Shoe stores . . . . . . . . . . . . . . . . . . 1,763 1,832 1,809 1,764 1,780 1,784 1,807 1,792 1,747 1,833 1,815 1,83244831 Jewelry stores . . . . . . . . . . . . . . . 1,753 1,728 1,707 1,753 1,761 1,800 1,748 1,793 1,735 1,801 1,837 1,903
451 Sporting goods, hobby, book, andmusic stores . . . . . . . . . . . . . . . . . 5,561 5,744 5,660 5,801 5,809 5,806 5,798 5,829 5,848 5,857 5,833 5,918
452 General merchandise stores . . . . . . . 28,463 28,769 28,884 28,994 29,156 29,278 29,124 29,344 29,690 29,828 30,200 30,0354521 Department stores (excl. L.D.) . . . . . . 18,518 18,685 18,609 18,556 18,663 18,614 18,478 18,573 18,634 18,740 18,860 18,8864529 Other general merchandise stores . . . 9,945 10,084 10,275 10,438 10,493 10,664 10,646 10,771 11,056 11,088 11,340 11,14945291 Warehouse clubs and superstores . 7,520 7,672 7,851 7,995 8,069 8,211 8,219 8,331 8,586 8,595 8,821 8,66445299 All other gen. merchandise stores . . 2,425 2,412 2,424 2,443 2,424 2,453 2,427 2,440 2,470 2,493 2,519 2,485
453 Miscellaneous store retailers . . . . . . . 8,212 8,091 8,073 8,039 8,155 8,203 8,337 8,430 8,550 8,584 8,582 8,666
454 Nonstore retailers . . . . . . . . . . . . . . . 9,629 9,909 9,984 10,041 10,306 10,247 10,477 10,352 10,318 10,520 10,458 10,4104541 Electronic shopping and mail-order
houses. . . . . . . . . . . . . . . . . . . . . 6,193 6,355 6,424 6,443 6,728 6,474 6,714 6,697 6,747 6,863 6,901 6,88845431 Fuel dealers . . . . . . . . . . . . . . . . 1,605 1,723 1,734 1,721 1,709 1,779 1,720 1,632 1,599 1,610 1,574 1,519
722 Food services and drinking places . . . 22,075 22,251 22,400 22,390 22,614 22,759 22,637 22,772 22,963 23,094 23,248 23,562
See footnotes at end of table.
12
U.S. Census Bureau
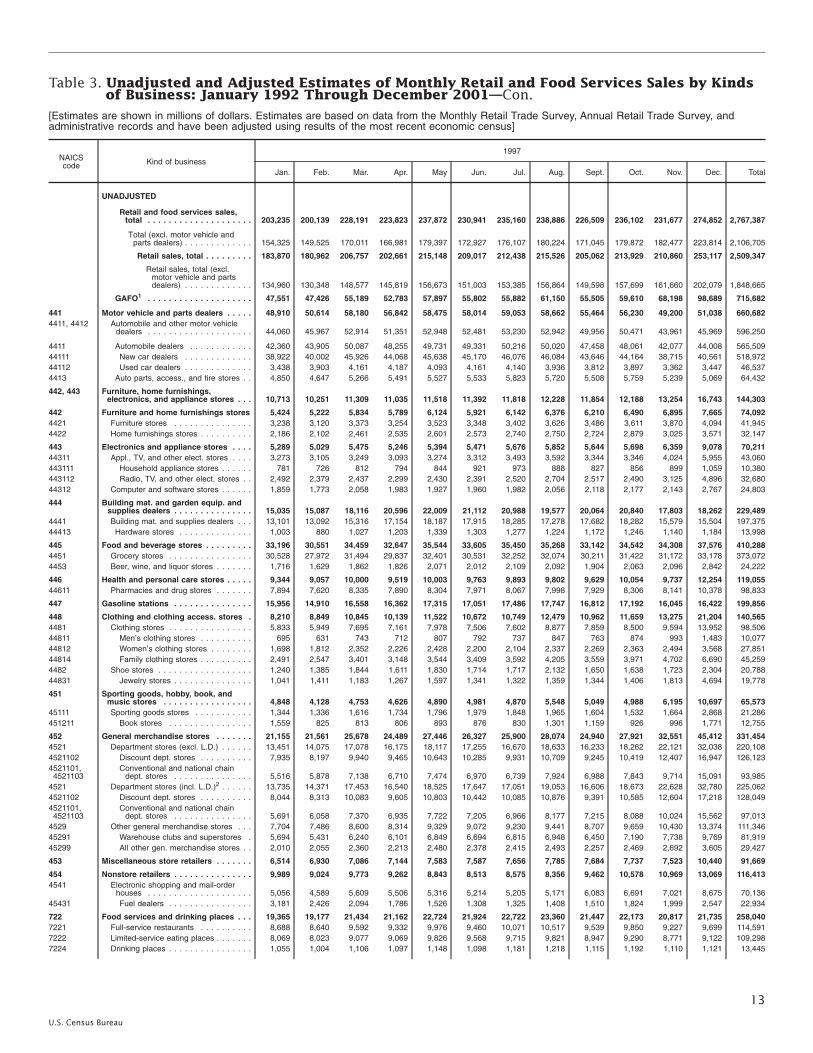
Table 3. Unadjusted and Adjusted Estimates of Monthly Retail and Food Services Sales by Kindsof Business: January 1992 Through December 2001—Con.
[Estimates are shown in millions of dollars. Estimates are based on data from the Monthly Retail Trade Survey, Annual Retail Trade Survey, andadministrative records and have been adjusted using results of the most recent economic census]
NAICScode Kind of business
1997
Jan. Feb. Mar. Apr. May Jun. Jul. Aug. Sept. Oct. Nov. Dec. Total
UNADJUSTED
Retail and food services sales,total . . . . . . . . . . . . . . . . . . . . 203,235 200,139 228,191 223,823 237,872 230,941 235,160 238,886 226,509 236,102 231,677 274,852 2,767,387
Total (excl. motor vehicle andparts dealers) . . . . . . . . . . . . . 154,325 149,525 170,011 166,981 179,397 172,927 176,107 180,224 171,045 179,872 182,477 223,814 2,106,705
Retail sales, total . . . . . . . . . 183,870 180,962 206,757 202,661 215,148 209,017 212,438 215,526 205,062 213,929 210,860 253,117 2,509,347
Retail sales, total (excl.motor vehicle and partsdealers) . . . . . . . . . . . . . 134,960 130,348 148,577 145,819 156,673 151,003 153,385 156,864 149,598 157,699 161,660 202,079 1,848,665
GAFO1 . . . . . . . . . . . . . . . . . . . . 47,551 47,426 55,189 52,783 57,897 55,802 55,882 61,150 55,505 59,610 68,198 98,689 715,682
441 Motor vehicle and parts dealers . . . . . 48,910 50,614 58,180 56,842 58,475 58,014 59,053 58,662 55,464 56,230 49,200 51,038 660,6824411, 4412 Automobile and other motor vehicle
dealers . . . . . . . . . . . . . . . . . . . . 44,060 45,967 52,914 51,351 52,948 52,481 53,230 52,942 49,956 50,471 43,961 45,969 596,250
4411 Automobile dealers . . . . . . . . . . . . 42,360 43,905 50,087 48,255 49,731 49,331 50,216 50,020 47,458 48,061 42,077 44,008 565,50944111 New car dealers . . . . . . . . . . . . . 38,922 40,002 45,926 44,068 45,638 45,170 46,076 46,084 43,646 44,164 38,715 40,561 518,97244112 Used car dealers . . . . . . . . . . . . . 3,438 3,903 4,161 4,187 4,093 4,161 4,140 3,936 3,812 3,897 3,362 3,447 46,5374413 Auto parts, access., and tire stores . . 4,850 4,647 5,266 5,491 5,527 5,533 5,823 5,720 5,508 5,759 5,239 5,069 64,432
442, 443 Furniture, home furnishings,electronics, and appliance stores . . . 10,713 10,251 11,309 11,035 11,518 11,392 11,818 12,228 11,854 12,188 13,254 16,743 144,303
442 Furniture and home furnishings stores 5,424 5,222 5,834 5,789 6,124 5,921 6,142 6,376 6,210 6,490 6,895 7,665 74,0924421 Furniture stores . . . . . . . . . . . . . . . 3,238 3,120 3,373 3,254 3,523 3,348 3,402 3,626 3,486 3,611 3,870 4,094 41,9454422 Home furnishings stores . . . . . . . . . . 2,186 2,102 2,461 2,535 2,601 2,573 2,740 2,750 2,724 2,879 3,025 3,571 32,147
443 Electronics and appliance stores . . . . 5,289 5,029 5,475 5,246 5,394 5,471 5,676 5,852 5,644 5,698 6,359 9,078 70,21144311 Appl., TV, and other elect. stores . . . . 3,273 3,105 3,249 3,093 3,274 3,312 3,493 3,592 3,344 3,346 4,024 5,955 43,060443111 Household appliance stores . . . . . . 781 726 812 794 844 921 973 888 827 856 899 1,059 10,380443112 Radio, TV, and other elect. stores . . 2,492 2,379 2,437 2,299 2,430 2,391 2,520 2,704 2,517 2,490 3,125 4,896 32,68044312 Computer and software stores . . . . . . 1,859 1,773 2,058 1,983 1,927 1,960 1,982 2,056 2,118 2,177 2,143 2,767 24,803
444 Building mat. and garden equip. andsupplies dealers . . . . . . . . . . . . . . . 15,035 15,087 18,116 20,596 22,009 21,112 20,988 19,577 20,064 20,840 17,803 18,262 229,489
4441 Building mat. and supplies dealers . . . 13,101 13,092 15,316 17,154 18,187 17,915 18,285 17,278 17,682 18,282 15,579 15,504 197,37544413 Hardware stores . . . . . . . . . . . . . . 1,003 880 1,027 1,203 1,339 1,303 1,277 1,224 1,172 1,246 1,140 1,184 13,998
445 Food and beverage stores . . . . . . . . . 33,196 30,551 34,459 32,647 35,544 33,605 35,450 35,268 33,142 34,542 34,308 37,576 410,2884451 Grocery stores . . . . . . . . . . . . . . . . 30,528 27,972 31,494 29,837 32,401 30,531 32,252 32,074 30,211 31,422 31,172 33,178 373,0724453 Beer, wine, and liquor stores . . . . . . . 1,716 1,629 1,862 1,826 2,071 2,012 2,109 2,092 1,904 2,063 2,096 2,842 24,222
446 Health and personal care stores . . . . . 9,344 9,057 10,000 9,519 10,003 9,763 9,893 9,802 9,629 10,054 9,737 12,254 119,05544611 Pharmacies and drug stores . . . . . . . 7,894 7,620 8,335 7,890 8,304 7,971 8,067 7,998 7,929 8,306 8,141 10,378 98,833
447 Gasoline stations . . . . . . . . . . . . . . . 15,956 14,910 16,558 16,362 17,315 17,051 17,486 17,747 16,812 17,192 16,045 16,422 199,856
448 Clothing and clothing access. stores . 8,210 8,849 10,845 10,139 11,522 10,672 10,749 12,479 10,962 11,659 13,275 21,204 140,5654481 Clothing stores . . . . . . . . . . . . . . . . 5,833 5,949 7,695 7,161 7,978 7,506 7,602 8,877 7,859 8,500 9,594 13,952 98,50644811 Men’s clothing stores . . . . . . . . . . 695 631 743 712 807 792 737 847 763 874 993 1,483 10,07744812 Women’s clothing stores . . . . . . . . 1,698 1,812 2,352 2,226 2,428 2,200 2,104 2,337 2,269 2,363 2,494 3,568 27,85144814 Family clothing stores . . . . . . . . . . 2,491 2,547 3,401 3,148 3,544 3,409 3,592 4,205 3,559 3,971 4,702 6,690 45,2594482 Shoe stores . . . . . . . . . . . . . . . . . . 1,240 1,385 1,844 1,611 1,830 1,714 1,717 2,132 1,650 1,638 1,723 2,304 20,78844831 Jewelry stores . . . . . . . . . . . . . . . 1,041 1,411 1,183 1,267 1,597 1,341 1,322 1,359 1,344 1,406 1,813 4,694 19,778
451 Sporting goods, hobby, book, andmusic stores . . . . . . . . . . . . . . . . . 4,848 4,128 4,753 4,626 4,890 4,981 4,870 5,548 5,049 4,988 6,195 10,697 65,573
45111 Sporting goods stores . . . . . . . . . . . 1,344 1,336 1,616 1,734 1,796 1,979 1,848 1,965 1,604 1,532 1,664 2,868 21,286451211 Book stores . . . . . . . . . . . . . . . . 1,559 825 813 806 893 876 830 1,301 1,159 926 996 1,771 12,755
452 General merchandise stores . . . . . . . 21,155 21,561 25,678 24,489 27,446 26,327 25,900 28,074 24,940 27,921 32,551 45,412 331,4544521 Department stores (excl. L.D.) . . . . . . 13,451 14,075 17,078 16,175 18,117 17,255 16,670 18,633 16,233 18,262 22,121 32,038 220,1084521102 Discount dept. stores . . . . . . . . . . 7,935 8,197 9,940 9,465 10,643 10,285 9,931 10,709 9,245 10,419 12,407 16,947 126,1234521101,4521103
Conventional and national chaindept. stores . . . . . . . . . . . . . . . 5,516 5,878 7,138 6,710 7,474 6,970 6,739 7,924 6,988 7,843 9,714 15,091 93,985
4521 Department stores (incl. L.D.)2 . . . . . . 13,735 14,371 17,453 16,540 18,525 17,647 17,051 19,053 16,606 18,673 22,628 32,780 225,0624521102 Discount dept. stores . . . . . . . . . . 8,044 8,313 10,083 9,605 10,803 10,442 10,085 10,876 9,391 10,585 12,604 17,218 128,0494521101,4521103
Conventional and national chaindept. stores . . . . . . . . . . . . . . . 5,691 6,058 7,370 6,935 7,722 7,205 6,966 8,177 7,215 8,088 10,024 15,562 97,013
4529 Other general merchandise stores . . . 7,704 7,486 8,600 8,314 9,329 9,072 9,230 9,441 8,707 9,659 10,430 13,374 111,34645291 Warehouse clubs and superstores . 5,694 5,431 6,240 6,101 6,849 6,694 6,815 6,948 6,450 7,190 7,738 9,769 81,91945299 All other gen. merchandise stores . . 2,010 2,055 2,360 2,213 2,480 2,378 2,415 2,493 2,257 2,469 2,692 3,605 29,427
453 Miscellaneous store retailers . . . . . . . 6,514 6,930 7,086 7,144 7,583 7,587 7,656 7,785 7,684 7,737 7,523 10,440 91,669
454 Nonstore retailers . . . . . . . . . . . . . . . 9,989 9,024 9,773 9,262 8,843 8,513 8,575 8,356 9,462 10,578 10,969 13,069 116,4134541 Electronic shopping and mail-order
houses . . . . . . . . . . . . . . . . . . . . 5,056 4,589 5,609 5,506 5,316 5,214 5,205 5,171 6,083 6,691 7,021 8,675 70,13645431 Fuel dealers . . . . . . . . . . . . . . . . 3,181 2,426 2,094 1,786 1,526 1,308 1,325 1,408 1,510 1,824 1,999 2,547 22,934
722 Food services and drinking places . . . 19,365 19,177 21,434 21,162 22,724 21,924 22,722 23,360 21,447 22,173 20,817 21,735 258,0407221 Full-service restaurants . . . . . . . . . . 8,688 8,640 9,592 9,332 9,976 9,460 10,071 10,517 9,539 9,850 9,227 9,699 114,5917222 Limited-service eating places . . . . . . . 8,069 8,023 9,077 9,069 9,826 9,568 9,715 9,821 8,947 9,290 8,771 9,122 109,2987224 Drinking places . . . . . . . . . . . . . . . . 1,055 1,004 1,106 1,097 1,148 1,098 1,181 1,218 1,115 1,192 1,110 1,121 13,445
13
U.S. Census Bureau

Table 3. Unadjusted and Adjusted Estimates of Monthly Retail and Food Services Sales by Kindsof Business: January 1992 Through December 2001—Con.
[Estimates are shown in millions of dollars. Estimates are based on data from the Monthly Retail Trade Survey, Annual Retail Trade Survey, andadministrative records and have been adjusted using results of the most recent economic census]
NAICScode Kind of business
1997
Jan. Feb. Mar. Apr. May Jun. Jul. Aug. Sept. Oct. Nov. Dec. Total
ADJUSTED3
Retail and food services sales,total . . . . . . . . . . . . . . . . . . . 226,588 228,850 229,194 228,374 226,121 229,053 232,143 233,098 233,718 233,074 234,522 234,797
Total (excl. motor vehicle andparts dealers) . . . . . . . . . . . . . 172,192 173,581 174,246 173,861 173,380 174,725 176,263 176,902 177,974 177,755 178,320 178,306
Retail sales, total . . . . . . . . . 205,401 207,660 207,993 207,148 204,864 207,580 210,420 211,266 211,811 211,336 212,928 212,865
Retail sales, total (excl.motor vehicle and partsdealers) . . . . . . . . . . . . . 151,005 152,391 153,045 152,635 152,123 153,252 154,540 155,070 156,067 156,017 156,726 156,374
GAFO1 . . . . . . . . . . . . . . . . . . . . 58,330 58,585 58,620 58,710 58,767 59,281 60,010 60,365 60,293 60,644 61,170 61,024
441 Motor vehicle and parts dealers . . . . . 54,396 55,269 54,948 54,513 52,741 54,328 55,880 56,196 55,744 55,319 56,202 56,4914411, 4412 Automobile and other motor vehicle
dealers . . . . . . . . . . . . . . . . . . . . 49,119 49,964 49,591 49,187 47,487 48,956 50,503 50,759 50,258 49,922 50,705 51,1334413 Auto parts, access., and tire stores . . . 5,277 5,305 5,357 5,326 5,254 5,372 5,377 5,437 5,486 5,397 5,497 5,358
442, 443 Furniture, home furnishings,electronics and appliance stores . . . 11,494 11,678 11,690 11,887 11,879 11,954 12,073 12,217 12,238 12,257 12,393 12,460
442 Furniture and home furnishings stores 5,980 5,968 5,996 6,055 6,124 6,123 6,154 6,263 6,285 6,289 6,367 6,414
443 Electronics and appliance stores . . . . 5,514 5,710 5,694 5,832 5,755 5,831 5,919 5,954 5,953 5,968 6,026 6,04644312 Computer and software stores . . . . . . 1,857 1,911 1,960 2,038 2,043 2,044 2,095 2,124 2,133 2,162 2,207 2,200
444 Building mat. and garden equip. andsupplies dealers . . . . . . . . . . . . . . . 18,301 18,744 19,070 18,973 19,017 19,102 19,250 19,214 19,536 19,542 19,414 19,437
4441 Building mat. and supplies dealers . . . 15,746 16,163 16,346 16,431 16,399 16,466 16,563 16,487 16,760 16,803 16,662 16,582
445 Food and beverage stores . . . . . . . . . 34,035 34,008 34,185 34,086 33,968 33,917 34,191 34,358 34,330 34,419 34,501 34,3734451 Grocery stores . . . . . . . . . . . . . . . . 30,993 30,977 31,121 31,048 30,947 30,808 31,071 31,231 31,178 31,266 31,360 31,1824453 Beer, wine, and liquor stores . . . . . . . 1,943 1,949 1,983 1,978 1,988 2,036 2,032 2,017 2,041 2,061 2,073 2,087
See note3
446 Health and personal care stores . . . . . 9,477 9,697 9,804 9,763 9,702 9,962 10,003 10,012 10,125 10,094 10,228 10,24644611 Pharmacies and drug stores . . . . . . . 7,950 8,081 8,124 8,117 8,125 8,252 8,274 8,262 8,390 8,339 8,480 8,472
447 Gasoline stations . . . . . . . . . . . . . . . 16,885 16,982 17,035 16,645 16,335 16,379 16,388 16,617 16,846 16,675 16,661 16,554
448 Clothing and clothing access. stores . 11,448 11,505 11,489 11,417 11,443 11,621 11,790 11,859 11,907 11,801 12,030 12,1094481 Clothing stores . . . . . . . . . . . . . . . . 7,998 7,985 7,992 7,977 8,044 8,150 8,286 8,395 8,376 8,291 8,441 8,48944811 Men’s clothing stores . . . . . . . . . . 828 830 818 809 823 828 856 861 852 858 860 85944812 Women’s clothing stores . . . . . . . . 2,352 2,391 2,347 2,297 2,244 2,306 2,322 2,344 2,356 2,288 2,366 2,3384482 Shoe stores . . . . . . . . . . . . . . . . . . 1,687 1,744 1,722 1,708 1,709 1,737 1,740 1,738 1,730 1,733 1,764 1,79244831 Jewelry stores . . . . . . . . . . . . . . . 1,637 1,646 1,639 1,604 1,564 1,612 1,638 1,616 1,684 1,652 1,701 1,696
451 Sporting goods, hobby, book, andmusic stores . . . . . . . . . . . . . . . . . 5,417 5,326 5,389 5,305 5,374 5,474 5,405 5,434 5,458 5,567 5,678 5,654
452 General merchandise stores . . . . . . . 27,186 27,222 27,126 27,294 27,344 27,456 27,982 28,040 27,863 28,148 28,252 27,9484521 Department stores (excl. L.D.) . . . . . . 18,117 18,138 18,087 18,184 18,203 18,294 18,543 18,580 18,423 18,575 18,688 18,4734529 Other general merchandise stores . . . 9,069 9,084 9,039 9,110 9,141 9,162 9,439 9,460 9,440 9,573 9,564 9,47545291 Warehouse clubs and superstores . 6,560 6,575 6,555 6,646 6,695 6,721 6,947 6,962 6,973 7,140 7,132 7,08445299 All other gen. merchandise stores . . 2,509 2,509 2,484 2,464 2,446 2,441 2,492 2,498 2,467 2,433 2,432 2,391
453 Miscellaneous store retailers . . . . . . . 7,416 7,690 7,671 7,489 7,291 7,605 7,574 7,681 7,800 7,789 7,836 7,918
454 Nonstore retailers . . . . . . . . . . . . . . . 9,346 9,539 9,586 9,776 9,770 9,782 9,884 9,638 9,964 9,725 9,733 9,6754541 Electronic shopping and mail-order
houses. . . . . . . . . . . . . . . . . . . . . 5,305 5,463 5,747 5,882 5,829 5,925 5,848 5,823 6,213 6,044 5,975 6,07545431 Fuel dealers . . . . . . . . . . . . . . . . 2,055 1,932 1,787 1,912 1,944 1,890 1,906 1,937 1,897 1,846 1,900 1,824
722 Food services and drinking places . . . 21,187 21,190 21,201 21,226 21,257 21,473 21,723 21,832 21,907 21,738 21,594 21,932
See footnotes at end of table.
14
U.S. Census Bureau

Table 3. Unadjusted and Adjusted Estimates of Monthly Retail and Food Services Sales by Kindsof Business: January 1992 Through December 2001—Con.
[Estimates are shown in millions of dollars. Estimates are based on data from the Monthly Retail Trade Survey, Annual Retail Trade Survey, andadministrative records and have been adjusted using results of the most recent economic census]
NAICScode Kind of business
1996
Jan. Feb. Mar. Apr. May Jun. Jul. Aug. Sept. Oct. Nov. Dec. Total
UNADJUSTED
Retail and food services sales,total . . . . . . . . . . . . . . . . . . . . 188,124 195,390 215,378 215,352 230,879 221,297 222,021 229,874 212,635 226,252 227,028 260,943 2,645,173
Total (excl. motor vehicle andparts dealers) . . . . . . . . . . . . . 142,647 145,169 159,061 160,562 172,031 165,701 166,258 173,710 160,924 171,350 178,323 214,186 2,009,922
Retail sales, total . . . . . . . . . 170,431 176,899 195,062 195,464 209,679 200,573 200,996 208,026 192,756 205,460 206,643 240,288 2,402,277
Retail sales, total (excl.motor vehicle and partsdealers) . . . . . . . . . . . . . 124,954 126,678 138,745 140,674 150,831 144,977 145,233 151,862 141,045 150,558 157,938 193,531 1,767,026
GAFO1 . . . . . . . . . . . . . . . . . . . . 43,722 46,210 51,745 51,704 55,787 53,796 52,734 58,933 53,266 56,769 65,713 94,875 685,254
441 Motor vehicle and parts dealers . . . . . 45,477 50,221 56,317 54,790 58,848 55,596 55,763 56,164 51,711 54,902 48,705 46,757 635,2514411, 4412 Automobile and other motor vehicle
dealers . . . . . . . . . . . . . . . . . . . . 40,848 45,488 51,253 49,495 53,348 50,286 50,191 50,596 46,689 49,249 43,597 41,862 572,902
4411 Automobile dealers . . . . . . . . . . . . 39,330 43,619 48,939 46,714 50,339 47,264 47,479 47,600 44,531 47,039 41,793 40,142 544,78944111 New car dealers . . . . . . . . . . . . . 36,398 40,095 44,809 42,754 46,534 43,654 43,837 44,019 41,247 43,444 38,469 37,080 502,34044112 Used car dealers . . . . . . . . . . . . . 2,932 3,524 4,130 3,960 3,805 3,610 3,642 3,581 3,284 3,595 3,324 3,062 42,4494413 Auto parts, access., and tire stores . . 4,629 4,733 5,064 5,295 5,500 5,310 5,572 5,568 5,022 5,653 5,108 4,895 62,349
442, 443 Furniture, home furnishings,electronics, and appliance stores . . . 10,244 10,004 11,022 10,639 11,158 11,004 11,174 11,761 11,238 11,768 12,687 15,231 137,930
442 Furniture and home furnishings stores 4,927 4,964 5,555 5,462 5,754 5,623 5,825 6,042 5,723 6,116 6,559 6,865 69,4154421 Furniture stores . . . . . . . . . . . . . . . 2,889 2,965 3,275 3,132 3,283 3,210 3,247 3,363 3,237 3,350 3,624 3,656 39,2314422 Home furnishings stores . . . . . . . . . . 2,038 1,999 2,280 2,330 2,471 2,413 2,578 2,679 2,486 2,766 2,935 3,209 30,184
443 Electronics and appliance stores . . . . 5,317 5,040 5,467 5,177 5,404 5,381 5,349 5,719 5,515 5,652 6,128 8,366 68,51544311 Appl., TV, and other elect. stores . . . . 3,350 3,115 3,339 3,121 3,393 3,317 3,391 3,595 3,335 3,424 4,138 5,792 43,310443111 Household appliance stores . . . . . . 749 699 785 802 857 853 855 900 818 857 945 1,101 10,221443112 Radio, TV, and other elect. stores . . 2,601 2,416 2,554 2,319 2,536 2,464 2,536 2,695 2,517 2,567 3,193 4,691 33,08944312 Computer and software stores . . . . . . 1,816 1,774 1,962 1,883 1,821 1,866 1,750 1,926 2,004 2,046 1,809 2,248 22,905
444 Building mat. and garden equip. andsupplies dealers . . . . . . . . . . . . . . . 13,990 14,283 16,167 18,816 20,364 19,448 19,554 19,060 17,980 19,524 17,368 16,205 212,759
4441 Building mat. and supplies dealers . . . 12,253 12,385 13,855 15,529 16,948 16,470 16,911 16,784 15,819 17,142 15,270 13,931 183,29744413 Hardware stores . . . . . . . . . . . . . . 977 920 1,028 1,251 1,369 1,306 1,242 1,186 1,083 1,187 1,177 1,229 13,955
445 Food and beverage stores . . . . . . . . . 31,822 30,863 33,154 32,249 34,478 33,545 34,514 34,921 32,279 33,583 34,095 36,517 402,0204451 Grocery stores . . . . . . . . . . . . . . . . 29,228 28,246 30,304 29,401 31,424 30,525 31,429 31,792 29,529 30,702 31,032 32,463 366,0754453 Beer, wine, and liquor stores . . . . . . . 1,690 1,662 1,849 1,810 1,970 1,971 2,047 2,075 1,791 1,870 2,003 2,562 23,300
446 Health and personal care stores . . . . . 8,458 8,565 9,021 8,965 9,431 8,876 9,137 9,231 8,653 9,333 9,177 11,352 110,19944611 Pharmacies and drug stores . . . . . . . 7,134 7,189 7,509 7,426 7,755 7,264 7,485 7,630 7,208 7,813 7,702 9,706 91,821
447 Gasoline stations . . . . . . . . . . . . . . . 14,492 14,176 15,634 16,043 17,448 16,975 17,055 17,286 15,987 16,682 16,243 16,580 194,601
448 Clothing and clothing access. stores . 7,704 9,016 10,365 10,586 11,426 10,573 10,218 12,148 10,640 11,274 12,900 20,010 136,8604481 Clothing stores . . . . . . . . . . . . . . . . 5,375 6,105 7,246 7,335 7,712 7,337 7,059 8,374 7,554 8,087 9,180 13,109 94,47344811 Men’s clothing stores . . . . . . . . . . 639 651 708 719 776 759 660 762 745 794 920 1,421 9,55444812 Women’s clothing stores . . . . . . . . 1,568 1,837 2,196 2,349 2,555 2,378 2,074 2,355 2,278 2,415 2,594 3,667 28,26644814 Family clothing stores . . . . . . . . . . 2,262 2,629 3,194 3,175 3,277 3,157 3,193 3,853 3,334 3,661 4,341 6,199 42,2754482 Shoe stores . . . . . . . . . . . . . . . . . . 1,209 1,373 1,705 1,803 1,833 1,712 1,686 2,161 1,625 1,607 1,724 2,166 20,60444831 Jewelry stores . . . . . . . . . . . . . . . 1,043 1,439 1,316 1,359 1,768 1,408 1,375 1,477 1,332 1,462 1,843 4,495 20,317
451 Sporting goods, hobby, book, andmusic stores . . . . . . . . . . . . . . . . . 4,687 4,112 4,683 4,574 4,588 4,838 4,742 5,567 4,789 4,786 6,042 10,647 64,055
45111 Sporting goods stores . . . . . . . . . . . 1,336 1,316 1,659 1,712 1,784 1,906 1,844 2,003 1,604 1,461 1,618 2,688 20,931451211 Book stores . . . . . . . . . . . . . . . . 1,375 758 743 751 855 839 787 1,361 1,042 899 908 1,600 11,918
452 General merchandise stores . . . . . . . 18,953 20,797 23,583 23,762 26,166 25,152 24,072 26,718 24,174 26,375 31,155 44,491 315,3984521 Department stores (excl. L.D.) . . . . . . 12,279 13,774 15,813 15,958 17,457 16,651 15,759 17,930 16,095 17,462 21,392 31,633 212,2034521102 Discount dept. stores . . . . . . . . . . 7,317 7,958 9,026 9,203 10,166 9,858 9,299 10,126 9,000 9,847 11,797 16,434 120,0314521101,4521103
Conventional and national chaindept. stores . . . . . . . . . . . . . . . 4,962 5,816 6,787 6,755 7,291 6,793 6,460 7,804 7,095 7,615 9,595 15,199 92,172
4521 Department stores (incl. L.D.)2 . . . . . . 12,575 14,128 16,212 16,352 17,856 17,009 16,099 18,321 16,449 17,849 21,883 32,268 217,0014521102 Discount dept. stores . . . . . . . . . . 7,430 8,082 9,170 9,352 10,330 10,010 9,441 10,284 9,145 10,006 11,992 16,694 121,9364521101,4521103
Conventional and national chaindept. stores . . . . . . . . . . . . . . . 5,145 6,046 7,042 7,000 7,526 6,999 6,658 8,037 7,304 7,843 9,891 15,574 95,065
4529 Other general merchandise stores . . . 6,674 7,023 7,770 7,804 8,709 8,501 8,313 8,788 8,079 8,913 9,763 12,858 103,19545291 Warehouse clubs and superstores . 4,758 4,914 5,431 5,474 6,124 6,027 5,914 6,244 5,808 6,373 6,994 9,018 73,07945299 All other gen. merchandise stores . . 1,916 2,109 2,339 2,330 2,585 2,474 2,399 2,544 2,271 2,540 2,769 3,840 30,116
453 Miscellaneous store retailers . . . . . . . 5,452 6,038 6,047 6,616 7,644 7,153 7,196 7,349 6,834 7,128 7,144 9,508 84,109
454 Nonstore retailers . . . . . . . . . . . . . . . 9,152 8,824 9,069 8,424 8,128 7,413 7,571 7,821 8,471 10,105 11,127 12,990 109,0954541 Electronic shopping and mail-order
houses . . . . . . . . . . . . . . . . . . . . 4,553 4,230 4,706 4,568 4,565 4,253 4,446 4,591 4,881 5,825 6,687 7,869 61,17445431 Fuel dealers . . . . . . . . . . . . . . . . 3,091 2,769 2,394 1,861 1,563 1,273 1,320 1,369 1,537 1,967 2,175 2,797 24,116
722 Food services and drinking places . . . 17,693 18,491 20,316 19,888 21,200 20,724 21,025 21,848 19,879 20,792 20,385 20,655 242,8967221 Full-service restaurants . . . . . . . . . . 7,532 7,943 8,685 8,502 8,977 8,716 8,978 9,548 8,675 9,032 9,005 8,921 104,5147222 Limited-service eating places . . . . . . . 7,847 8,080 8,928 8,745 9,418 9,317 9,349 9,466 8,532 8,954 8,622 8,934 106,1927224 Drinking places . . . . . . . . . . . . . . . . 998 1,031 1,120 1,056 1,100 1,075 1,101 1,144 1,058 1,106 1,106 1,120 13,015
15
U.S. Census Bureau
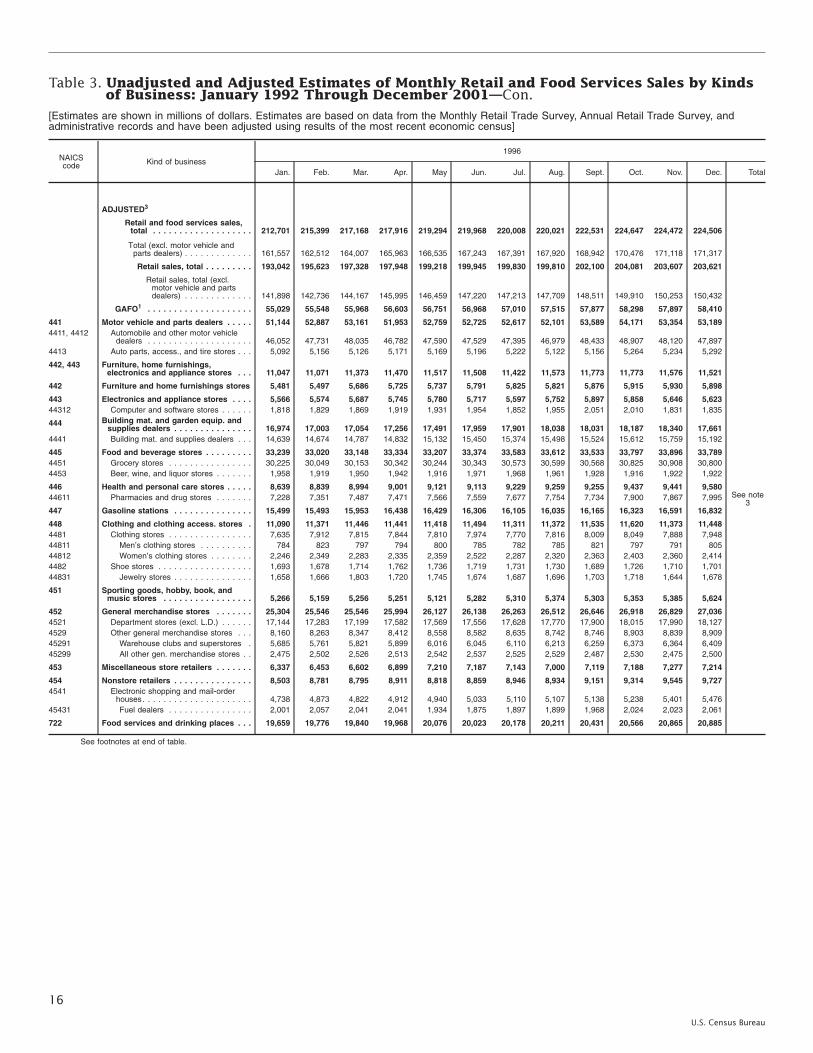
Table 3. Unadjusted and Adjusted Estimates of Monthly Retail and Food Services Sales by Kindsof Business: January 1992 Through December 2001—Con.
[Estimates are shown in millions of dollars. Estimates are based on data from the Monthly Retail Trade Survey, Annual Retail Trade Survey, andadministrative records and have been adjusted using results of the most recent economic census]
NAICScode Kind of business
1996
Jan. Feb. Mar. Apr. May Jun. Jul. Aug. Sept. Oct. Nov. Dec. Total
ADJUSTED3
Retail and food services sales,total . . . . . . . . . . . . . . . . . . . 212,701 215,399 217,168 217,916 219,294 219,968 220,008 220,021 222,531 224,647 224,472 224,506
Total (excl. motor vehicle andparts dealers) . . . . . . . . . . . . . 161,557 162,512 164,007 165,963 166,535 167,243 167,391 167,920 168,942 170,476 171,118 171,317
Retail sales, total . . . . . . . . . 193,042 195,623 197,328 197,948 199,218 199,945 199,830 199,810 202,100 204,081 203,607 203,621
Retail sales, total (excl.motor vehicle and partsdealers) . . . . . . . . . . . . . 141,898 142,736 144,167 145,995 146,459 147,220 147,213 147,709 148,511 149,910 150,253 150,432
GAFO1 . . . . . . . . . . . . . . . . . . . . 55,029 55,548 55,968 56,603 56,751 56,968 57,010 57,515 57,877 58,298 57,897 58,410
441 Motor vehicle and parts dealers . . . . . 51,144 52,887 53,161 51,953 52,759 52,725 52,617 52,101 53,589 54,171 53,354 53,1894411, 4412 Automobile and other motor vehicle
dealers . . . . . . . . . . . . . . . . . . . . 46,052 47,731 48,035 46,782 47,590 47,529 47,395 46,979 48,433 48,907 48,120 47,8974413 Auto parts, access., and tire stores . . . 5,092 5,156 5,126 5,171 5,169 5,196 5,222 5,122 5,156 5,264 5,234 5,292
442, 443 Furniture, home furnishings,electronics and appliance stores . . . 11,047 11,071 11,373 11,470 11,517 11,508 11,422 11,573 11,773 11,773 11,576 11,521
442 Furniture and home furnishings stores 5,481 5,497 5,686 5,725 5,737 5,791 5,825 5,821 5,876 5,915 5,930 5,898
443 Electronics and appliance stores . . . . 5,566 5,574 5,687 5,745 5,780 5,717 5,597 5,752 5,897 5,858 5,646 5,62344312 Computer and software stores . . . . . . 1,818 1,829 1,869 1,919 1,931 1,954 1,852 1,955 2,051 2,010 1,831 1,835
444 Building mat. and garden equip. andsupplies dealers . . . . . . . . . . . . . . . 16,974 17,003 17,054 17,256 17,491 17,959 17,901 18,038 18,031 18,187 18,340 17,661
4441 Building mat. and supplies dealers . . . 14,639 14,674 14,787 14,832 15,132 15,450 15,374 15,498 15,524 15,612 15,759 15,192
445 Food and beverage stores . . . . . . . . . 33,239 33,020 33,148 33,334 33,207 33,374 33,583 33,612 33,533 33,797 33,896 33,7894451 Grocery stores . . . . . . . . . . . . . . . . 30,225 30,049 30,153 30,342 30,244 30,343 30,573 30,599 30,568 30,825 30,908 30,8004453 Beer, wine, and liquor stores . . . . . . . 1,958 1,919 1,950 1,942 1,916 1,971 1,968 1,961 1,928 1,916 1,922 1,922
See note3
446 Health and personal care stores . . . . . 8,639 8,839 8,994 9,001 9,121 9,113 9,229 9,259 9,255 9,437 9,441 9,58044611 Pharmacies and drug stores . . . . . . . 7,228 7,351 7,487 7,471 7,566 7,559 7,677 7,754 7,734 7,900 7,867 7,995
447 Gasoline stations . . . . . . . . . . . . . . . 15,499 15,493 15,953 16,438 16,429 16,306 16,105 16,035 16,165 16,323 16,591 16,832
448 Clothing and clothing access. stores . 11,090 11,371 11,446 11,441 11,418 11,494 11,311 11,372 11,535 11,620 11,373 11,4484481 Clothing stores . . . . . . . . . . . . . . . . 7,635 7,912 7,815 7,844 7,810 7,974 7,770 7,816 8,009 8,049 7,888 7,94844811 Men’s clothing stores . . . . . . . . . . 784 823 797 794 800 785 782 785 821 797 791 80544812 Women’s clothing stores . . . . . . . . 2,246 2,349 2,283 2,335 2,359 2,522 2,287 2,320 2,363 2,403 2,360 2,4144482 Shoe stores . . . . . . . . . . . . . . . . . . 1,693 1,678 1,714 1,762 1,736 1,719 1,731 1,730 1,689 1,726 1,710 1,70144831 Jewelry stores . . . . . . . . . . . . . . . 1,658 1,666 1,803 1,720 1,745 1,674 1,687 1,696 1,703 1,718 1,644 1,678
451 Sporting goods, hobby, book, andmusic stores . . . . . . . . . . . . . . . . . 5,266 5,159 5,256 5,251 5,121 5,282 5,310 5,374 5,303 5,353 5,385 5,624
452 General merchandise stores . . . . . . . 25,304 25,546 25,546 25,994 26,127 26,138 26,263 26,512 26,646 26,918 26,829 27,0364521 Department stores (excl. L.D.) . . . . . . 17,144 17,283 17,199 17,582 17,569 17,556 17,628 17,770 17,900 18,015 17,990 18,1274529 Other general merchandise stores . . . 8,160 8,263 8,347 8,412 8,558 8,582 8,635 8,742 8,746 8,903 8,839 8,90945291 Warehouse clubs and superstores . 5,685 5,761 5,821 5,899 6,016 6,045 6,110 6,213 6,259 6,373 6,364 6,40945299 All other gen. merchandise stores . . 2,475 2,502 2,526 2,513 2,542 2,537 2,525 2,529 2,487 2,530 2,475 2,500
453 Miscellaneous store retailers . . . . . . . 6,337 6,453 6,602 6,899 7,210 7,187 7,143 7,000 7,119 7,188 7,277 7,214
454 Nonstore retailers . . . . . . . . . . . . . . . 8,503 8,781 8,795 8,911 8,818 8,859 8,946 8,934 9,151 9,314 9,545 9,7274541 Electronic shopping and mail-order
houses. . . . . . . . . . . . . . . . . . . . . 4,738 4,873 4,822 4,912 4,940 5,033 5,110 5,107 5,138 5,238 5,401 5,47645431 Fuel dealers . . . . . . . . . . . . . . . . 2,001 2,057 2,041 2,041 1,934 1,875 1,897 1,899 1,968 2,024 2,023 2,061
722 Food services and drinking places . . . 19,659 19,776 19,840 19,968 20,076 20,023 20,178 20,211 20,431 20,566 20,865 20,885
See footnotes at end of table.
16
U.S. Census Bureau

Table 3. Unadjusted and Adjusted Estimates of Monthly Retail and Food Services Sales by Kindsof Business: January 1992 Through December 2001—Con.
[Estimates are shown in millions of dollars. Estimates are based on data from the Monthly Retail Trade Survey, Annual Retail Trade Survey, andadministrative records and have been adjusted using results of the most recent economic census]
NAICScode Kind of business
1995
Jan. Feb. Mar. Apr. May Jun. Jul. Aug. Sept. Oct. Nov. Dec. Total
UNADJUSTED
Retail and food services sales,total . . . . . . . . . . . . . . . . . . . . 178,379 175,035 204,711 199,515 214,409 215,720 207,068 218,033 205,685 207,635 215,481 250,778 2,492,449
Total (excl. motor vehicle andparts dealers) . . . . . . . . . . . . . 137,192 132,975 152,471 150,967 160,910 160,064 156,386 163,779 156,136 158,425 168,763 206,368 1,904,436
Retail sales, total . . . . . . . . . 160,993 158,011 185,293 180,060 194,147 195,431 186,512 197,100 186,031 187,813 196,645 230,788 2,258,824
Retail sales, total (excl.motor vehicle and partsdealers) . . . . . . . . . . . . . 119,806 115,951 133,053 131,512 140,648 139,775 135,830 142,846 136,482 138,603 149,927 186,378 1,670,811
GAFO1 . . . . . . . . . . . . . . . . . . . . 42,278 41,581 49,148 49,083 51,914 52,016 50,390 55,156 52,307 52,833 63,790 92,514 653,010
441 Motor vehicle and parts dealers . . . . . 41,187 42,060 52,240 48,548 53,499 55,656 50,682 54,254 49,549 49,210 46,718 44,410 588,0134411, 4412 Automobile and other motor vehicle
dealers . . . . . . . . . . . . . . . . . . . . 36,862 37,883 47,264 43,698 48,335 50,368 45,633 48,708 44,588 44,021 41,601 39,761 528,722
4411 Automobile dealers . . . . . . . . . . . . 35,546 36,306 44,741 41,194 45,557 47,331 43,105 46,110 42,270 41,973 40,197 38,152 502,48244111 New car dealers . . . . . . . . . . . . . 32,777 33,410 41,372 38,130 42,307 43,956 39,539 42,592 38,980 38,835 37,205 35,539 464,64244112 Used car dealers . . . . . . . . . . . . . 2,769 2,896 3,369 3,064 3,250 3,375 3,566 3,518 3,290 3,138 2,992 2,613 37,8404413 Auto parts, access., and tire stores . . 4,325 4,177 4,976 4,850 5,164 5,288 5,049 5,546 4,961 5,189 5,117 4,649 59,291
442, 443 Furniture, home furnishings,electronics, and appliance stores . . . 9,757 9,111 10,386 9,558 10,373 10,588 10,340 11,108 10,841 11,044 12,303 15,038 130,447
442 Furniture and home furnishings stores 4,811 4,569 5,266 4,990 5,375 5,374 5,358 5,686 5,589 5,678 6,260 6,572 65,5284421 Furniture stores . . . . . . . . . . . . . . . 2,861 2,667 3,057 2,817 3,029 3,050 3,026 3,183 3,195 3,180 3,422 3,547 37,0344422 Home furnishings stores . . . . . . . . . . 1,950 1,902 2,209 2,173 2,346 2,324 2,332 2,503 2,394 2,498 2,838 3,025 28,494
443 Electronics and appliance stores . . . . 4,946 4,542 5,120 4,568 4,998 5,214 4,982 5,422 5,252 5,366 6,043 8,466 64,91944311 Appl., TV, and other elect. stores . . . . 3,221 2,885 3,188 2,882 3,216 3,300 3,330 3,489 3,327 3,375 4,076 5,853 42,142443111 Household appliance stores . . . . . . 745 667 794 724 825 891 922 898 800 800 894 1,026 9,986443112 Radio, TV, and other elect. stores . . 2,476 2,218 2,394 2,158 2,391 2,409 2,408 2,591 2,527 2,575 3,182 4,827 32,15644312 Computer and software stores . . . . . . 1,570 1,513 1,764 1,521 1,586 1,712 1,464 1,737 1,743 1,810 1,783 2,299 20,502
444 Building mat. and garden equip. andsupplies dealers . . . . . . . . . . . . . . . 13,470 13,312 16,295 16,787 18,949 18,618 17,133 17,913 16,897 17,706 16,433 15,555 199,068
4441 Building mat. and supplies dealers . . . 11,922 11,630 14,007 13,943 15,846 15,862 14,801 15,766 14,949 15,609 14,467 13,472 172,27444413 Hardware stores . . . . . . . . . . . . . . 875 848 1,061 1,157 1,343 1,340 1,230 1,182 1,153 1,141 1,193 1,241 13,764
445 Food and beverage stores . . . . . . . . . 31,109 29,196 32,435 31,864 33,251 33,133 33,597 33,355 32,254 31,908 32,595 36,615 391,3124451 Grocery stores . . . . . . . . . . . . . . . . 28,669 26,798 29,748 29,126 30,429 30,271 30,697 30,479 29,423 29,114 29,668 32,510 356,9324453 Beer, wine, and liquor stores . . . . . . . 1,565 1,510 1,736 1,709 1,818 1,873 1,898 1,872 1,856 1,800 1,892 2,616 22,145
446 Health and personal care stores . . . . . 8,066 7,804 8,533 8,300 8,745 8,562 8,243 8,544 8,227 8,450 8,491 10,504 102,46944611 Pharmacies and drug stores . . . . . . . 6,830 6,616 7,136 6,955 7,275 7,035 6,793 7,036 6,859 7,083 7,210 9,023 85,851
447 Gasoline stations . . . . . . . . . . . . . . . 13,884 13,224 14,771 14,645 15,960 16,223 16,073 16,233 15,210 15,173 14,696 15,202 181,294
448 Clothing and clothing access. stores . 7,536 7,982 9,829 10,178 10,640 10,316 9,804 11,280 10,730 10,464 12,779 20,067 131,6054481 Clothing stores . . . . . . . . . . . . . . . . 5,377 5,516 6,995 7,131 7,246 7,140 6,863 7,790 7,618 7,484 9,055 13,201 91,41644811 Men’s clothing stores . . . . . . . . . . 662 607 675 727 721 741 643 697 723 756 904 1,466 9,32244812 Women’s clothing stores . . . . . . . . 1,724 1,812 2,395 2,439 2,538 2,359 2,174 2,328 2,372 2,315 2,570 3,697 28,72344814 Family clothing stores . . . . . . . . . . 2,197 2,267 2,902 2,961 2,959 3,061 3,007 3,489 3,321 3,291 4,292 6,267 40,0144482 Shoe stores . . . . . . . . . . . . . . . . . . 1,145 1,154 1,608 1,758 1,707 1,700 1,607 1,987 1,685 1,516 1,719 2,173 19,75944831 Jewelry stores . . . . . . . . . . . . . . . 914 1,223 1,138 1,204 1,603 1,388 1,259 1,393 1,325 1,371 1,867 4,467 19,152
451 Sporting goods, hobby, book, andmusic stores . . . . . . . . . . . . . . . . . 4,469 3,762 4,394 4,327 4,421 4,635 4,504 5,252 4,817 4,457 5,741 10,143 60,922
45111 Sporting goods stores . . . . . . . . . . . 1,230 1,256 1,609 1,616 1,655 1,759 1,715 1,857 1,579 1,406 1,557 2,747 19,986451211 Book stores . . . . . . . . . . . . . . . . 1,309 720 696 689 786 808 783 1,248 1,103 747 851 1,468 11,208
452 General merchandise stores . . . . . . . 18,519 18,606 22,523 23,034 24,152 24,246 23,498 24,916 23,515 24,453 30,226 42,901 300,5894521 Department stores (excl. L.D.) . . . . . . 12,236 12,605 15,449 15,734 16,348 16,397 15,896 17,042 15,988 16,572 21,139 30,514 205,9204521102 Discount dept. stores . . . . . . . . . . 7,147 7,241 8,781 9,161 9,511 9,665 9,259 9,614 9,003 9,446 11,647 16,145 116,6204521101,4521103
Conventional and national chaindept. stores . . . . . . . . . . . . . . . 5,089 5,364 6,668 6,573 6,837 6,732 6,637 7,428 6,985 7,126 9,492 14,369 89,300
4521 Department stores (incl. L.D.)2 . . . . . . 12,544 12,927 15,836 16,129 16,748 16,788 16,265 17,462 16,384 16,966 21,661 31,209 210,9194521102 Discount dept. stores . . . . . . . . . . 7,277 7,360 8,938 9,331 9,686 9,847 9,418 9,781 9,159 9,599 11,849 16,416 118,6614521101,4521103
Conventional and national chaindept. stores . . . . . . . . . . . . . . . 5,267 5,567 6,898 6,798 7,062 6,941 6,847 7,681 7,225 7,367 9,812 14,793 92,258
4529 Other general merchandise stores . . . 6,283 6,001 7,074 7,300 7,804 7,849 7,602 7,874 7,527 7,881 9,087 12,387 94,66945291 Warehouse clubs and superstores . 4,317 4,118 4,855 4,999 5,343 5,392 5,274 5,435 5,217 5,460 6,288 8,403 65,10145299 All other gen. merchandise stores . . 1,966 1,883 2,219 2,301 2,461 2,457 2,328 2,439 2,310 2,421 2,799 3,984 29,568
453 Miscellaneous store retailers . . . . . . . 5,101 5,498 5,783 5,868 6,898 6,670 6,335 6,998 6,406 6,301 6,461 8,858 77,177
454 Nonstore retailers . . . . . . . . . . . . . . . 7,895 7,456 8,104 6,951 7,259 6,784 6,303 7,247 7,585 8,647 10,202 11,495 95,9284541 Electronic shopping and mail-order
houses . . . . . . . . . . . . . . . . . . . . 3,944 3,344 4,125 3,653 3,948 3,714 3,572 4,085 4,362 5,028 6,121 6,845 52,74145431 Fuel dealers . . . . . . . . . . . . . . . . 2,359 2,393 2,052 1,571 1,523 1,316 1,219 1,363 1,423 1,596 2,034 2,705 21,554
722 Food services and drinking places . . . 17,386 17,024 19,418 19,455 20,262 20,289 20,556 20,933 19,654 19,822 18,836 19,990 233,6257221 Full-service restaurants . . . . . . . . . . 7,507 7,341 8,243 8,269 8,615 8,549 8,902 9,035 8,271 8,328 7,987 8,383 99,4307222 Limited-service eating places . . . . . . . 7,666 7,491 8,650 8,584 8,942 8,974 9,004 9,161 8,703 8,751 8,295 8,922 103,1437224 Drinking places . . . . . . . . . . . . . . . . 915 916 1,030 1,023 1,050 1,036 1,066 1,083 1,104 1,092 1,075 1,125 12,515
17
U.S. Census Bureau

Table 3. Unadjusted and Adjusted Estimates of Monthly Retail and Food Services Sales by Kindsof Business: January 1992 Through December 2001—Con.
[Estimates are shown in millions of dollars. Estimates are based on data from the Monthly Retail Trade Survey, Annual Retail Trade Survey, andadministrative records and have been adjusted using results of the most recent economic census]
NAICScode Kind of business
1995
Jan. Feb. Mar. Apr. May Jun. Jul. Aug. Sept. Oct. Nov. Dec. Total
ADJUSTED3
Retail and food services sales,total . . . . . . . . . . . . . . . . . . . 205,489 201,809 203,142 204,602 206,390 208,563 208,708 210,057 210,839 209,692 212,038 213,894
Total (excl. motor vehicle andparts dealers) . . . . . . . . . . . . . 157,700 155,217 155,860 156,576 157,941 158,555 159,088 159,535 160,739 159,987 161,450 162,959
Retail sales, total . . . . . . . . . 186,128 182,851 184,067 185,186 186,963 189,110 189,112 190,327 191,185 189,949 192,356 194,102
Retail sales, total (excl.motor vehicle and partsdealers) . . . . . . . . . . . . . 138,339 136,259 136,785 137,160 138,514 139,102 139,492 139,805 141,085 140,244 141,768 143,167
GAFO1 . . . . . . . . . . . . . . . . . . . . 54,090 52,382 53,068 53,247 53,908 54,300 54,668 54,629 55,649 54,883 55,759 55,939
441 Motor vehicle and parts dealers . . . . . 47,789 46,592 47,282 48,026 48,449 50,008 49,620 50,522 50,100 49,705 50,588 50,9354411, 4412 Automobile and other motor vehicle
dealers . . . . . . . . . . . . . . . . . . . . 42,913 41,813 42,465 43,137 43,545 45,052 44,694 45,521 45,084 44,691 45,466 45,8604413 Auto parts, access., and tire stores . . . 4,876 4,779 4,817 4,889 4,904 4,956 4,926 5,001 5,016 5,014 5,122 5,075
442, 443 Furniture, home furnishings,electronics and appliance stores . . . 10,753 10,496 10,547 10,474 10,728 10,868 10,750 10,990 11,075 11,178 11,303 11,311
442 Furniture and home furnishings stores 5,498 5,258 5,282 5,314 5,359 5,417 5,462 5,483 5,572 5,589 5,706 5,632
443 Electronics and appliance stores . . . . 5,255 5,238 5,265 5,160 5,369 5,451 5,288 5,507 5,503 5,589 5,597 5,67944312 Computer and software stores . . . . . . 1,589 1,610 1,633 1,588 1,696 1,749 1,581 1,758 1,770 1,790 1,797 1,909
444 Building mat. and garden equip. andsupplies dealers . . . . . . . . . . . . . . . 16,672 16,590 16,524 16,249 16,244 16,380 16,473 16,627 16,733 16,819 17,089 17,340
4441 Building mat. and supplies dealers . . . 14,557 14,394 14,351 14,127 14,098 14,163 14,164 14,281 14,457 14,520 14,732 14,986
445 Food and beverage stores . . . . . . . . . 32,769 32,438 32,432 32,418 32,638 32,636 32,538 32,624 32,680 32,725 32,670 33,1354451 Grocery stores . . . . . . . . . . . . . . . . 29,895 29,611 29,600 29,570 29,832 29,824 29,716 29,765 29,750 29,799 29,757 30,1864453 Beer, wine, and liquor stores . . . . . . . 1,846 1,813 1,818 1,834 1,816 1,824 1,816 1,844 1,896 1,881 1,866 1,905
See note3
446 Health and personal care stores . . . . . 8,402 8,382 8,382 8,478 8,507 8,536 8,507 8,570 8,651 8,676 8,763 8,80544611 Pharmacies and drug stores . . . . . . . 7,049 7,031 7,024 7,082 7,132 7,157 7,113 7,150 7,258 7,272 7,357 7,378
447 Gasoline stations . . . . . . . . . . . . . . . 15,010 14,959 14,875 15,082 15,229 15,363 15,322 15,185 15,149 15,083 14,981 15,232
448 Clothing and clothing access. stores . 10,967 10,599 10,842 10,828 10,974 10,912 10,856 10,836 11,286 10,907 11,227 11,2154481 Clothing stores . . . . . . . . . . . . . . . . 7,726 7,501 7,557 7,493 7,595 7,558 7,535 7,492 7,899 7,528 7,712 7,79544811 Men’s clothing stores . . . . . . . . . . 812 801 770 773 766 762 752 753 782 768 789 78844812 Women’s clothing stores . . . . . . . . 2,528 2,416 2,469 2,429 2,419 2,419 2,432 2,347 2,401 2,334 2,326 2,3534482 Shoe stores . . . . . . . . . . . . . . . . . . 1,617 1,495 1,646 1,665 1,667 1,673 1,650 1,641 1,677 1,648 1,710 1,65944831 Jewelry stores . . . . . . . . . . . . . . . 1,491 1,491 1,536 1,566 1,611 1,581 1,578 1,597 1,602 1,628 1,694 1,653
451 Sporting goods, hobby, book, andmusic stores . . . . . . . . . . . . . . . . . 5,090 4,905 4,926 5,002 4,984 5,016 5,118 5,149 5,141 5,071 5,229 5,218
452 General merchandise stores . . . . . . . 25,019 24,052 24,524 24,595 24,795 25,082 25,469 25,141 25,613 25,179 25,430 25,5754521 Department stores (excl. L.D.) . . . . . . 17,224 16,623 16,884 16,844 16,964 17,204 17,558 17,203 17,535 17,193 17,301 17,3434529 Other general merchandise stores . . . 7,795 7,429 7,640 7,751 7,831 7,878 7,911 7,938 8,078 7,986 8,129 8,23245291 Warehouse clubs and superstores . 5,252 5,078 5,220 5,301 5,348 5,414 5,437 5,484 5,586 5,538 5,634 5,72045299 All other gen. merchandise stores . . 2,543 2,351 2,420 2,450 2,483 2,464 2,474 2,454 2,492 2,448 2,495 2,512
453 Miscellaneous store retailers . . . . . . . 6,087 6,214 6,193 6,381 6,476 6,401 6,520 6,554 6,535 6,519 6,567 6,657
454 Nonstore retailers . . . . . . . . . . . . . . . 7,570 7,624 7,540 7,653 7,939 7,908 7,939 8,129 8,222 8,087 8,509 8,6794541 Electronic shopping and mail-order
houses. . . . . . . . . . . . . . . . . . . . . 4,100 4,014 4,064 4,123 4,301 4,294 4,399 4,484 4,592 4,583 4,760 4,77745431 Fuel dealers . . . . . . . . . . . . . . . . 1,610 1,762 1,682 1,773 1,880 1,896 1,847 1,844 1,801 1,698 1,897 1,999
722 Food services and drinking places . . . 19,361 18,958 19,075 19,416 19,427 19,453 19,596 19,730 19,654 19,743 19,682 19,792
See footnotes at end of table.
18
U.S. Census Bureau

Table 3. Unadjusted and Adjusted Estimates of Monthly Retail and Food Services Sales by Kindsof Business: January 1992 Through December 2001—Con.
[Estimates are shown in millions of dollars. Estimates are based on data from the Monthly Retail Trade Survey, Annual Retail Trade Survey, andadministrative records and have been adjusted using results of the most recent economic census]
NAICScode Kind of business
1994
Jan. Feb. Mar. Apr. May Jun. Jul. Aug. Sept. Oct. Nov. Dec. Total
UNADJUSTED
Retail and food services sales,total . . . . . . . . . . . . . . . . . . . . 164,290 165,749 195,851 193,183 198,847 201,835 197,077 206,268 197,604 201,570 205,942 244,598 2,372,814
Total (excl. motor vehicle andparts dealers) . . . . . . . . . . . . . 127,147 125,900 146,273 144,858 151,019 151,744 150,562 157,113 150,520 154,595 161,571 201,417 1,822,719
Retail sales, total . . . . . . . . . 148,174 149,192 177,040 174,353 179,389 182,342 176,863 186,271 178,728 182,202 187,647 224,984 2,147,185
Retail sales, total (excl.motor vehicle and partsdealers) . . . . . . . . . . . . . 111,031 109,343 127,462 126,028 131,561 132,251 130,348 137,116 131,644 135,227 143,276 181,803 1,597,090
GAFO1 . . . . . . . . . . . . . . . . . . . . 38,350 39,215 47,139 46,279 47,976 48,721 47,657 52,315 49,233 51,880 60,394 90,421 619,580
441 Motor vehicle and parts dealers . . . . . 37,143 39,849 49,578 48,325 47,828 50,091 46,515 49,155 47,084 46,975 44,371 43,181 550,0954411, 4412 Automobile and other motor vehicle
dealers . . . . . . . . . . . . . . . . . . . . 33,073 35,721 44,670 43,461 42,998 45,039 41,555 43,850 42,253 42,036 39,552 38,572 492,780
4411 Automobile dealers . . . . . . . . . . . . 32,113 34,450 42,476 41,042 40,570 42,348 39,230 41,726 40,338 39,860 37,792 36,924 468,86944111 New car dealers . . . . . . . . . . . . . 29,861 31,958 39,743 38,191 37,869 39,513 36,389 38,533 37,383 36,653 35,170 34,398 435,66144112 Used car dealers . . . . . . . . . . . . . 2,252 2,492 2,733 2,851 2,701 2,835 2,841 3,193 2,955 3,207 2,622 2,526 33,2084413 Auto parts, access., and tire stores . . 4,070 4,128 4,908 4,864 4,830 5,052 4,960 5,305 4,831 4,939 4,819 4,609 57,315
442, 443 Furniture, home furnishings,electronics, and appliance stores . . . 8,261 8,141 9,403 8,965 9,272 9,720 9,635 10,312 10,091 10,419 11,503 14,457 120,179
442 Furniture and home furnishings stores 4,174 4,305 5,024 4,893 5,070 5,166 5,179 5,574 5,404 5,539 5,937 6,501 62,7664421 Furniture stores . . . . . . . . . . . . . . . 2,540 2,562 2,921 2,829 2,865 2,896 2,930 3,083 3,069 3,043 3,277 3,547 35,5624422 Home furnishings stores . . . . . . . . . . 1,634 1,743 2,103 2,064 2,205 2,270 2,249 2,491 2,335 2,496 2,660 2,954 27,204
443 Electronics and appliance stores . . . . 4,087 3,836 4,379 4,072 4,202 4,554 4,456 4,738 4,687 4,880 5,566 7,956 57,41344311 Appl., TV, and other elect. stores . . . . 2,650 2,438 2,736 2,611 2,753 2,996 2,951 3,090 3,009 3,147 3,843 5,718 37,942443111 Household appliance stores . . . . . . 641 593 693 676 704 830 789 771 715 746 885 1,008 9,051443112 Radio, TV, and other elect. stores . . 2,009 1,845 2,043 1,935 2,049 2,166 2,162 2,319 2,294 2,401 2,958 4,710 28,89144312 Computer and software stores . . . . . . 1,292 1,256 1,470 1,294 1,261 1,353 1,317 1,447 1,494 1,551 1,534 1,918 17,187
444 Building mat. and garden equip. andsupplies dealers . . . . . . . . . . . . . . . 11,803 11,986 15,379 16,870 18,192 17,861 16,514 17,424 16,784 16,878 15,776 15,350 190,817
4441 Building mat. and supplies dealers . . . 10,255 10,391 13,088 13,828 14,960 15,225 14,494 15,579 14,868 15,005 14,130 13,423 165,24644413 Hardware stores . . . . . . . . . . . . . . 959 866 1,053 1,232 1,296 1,271 1,217 1,193 1,138 1,198 1,165 1,243 13,831
445 Food and beverage stores . . . . . . . . . 30,322 28,585 32,000 31,282 32,293 32,616 33,367 32,690 31,935 31,920 31,991 36,264 385,2654451 Grocery stores . . . . . . . . . . . . . . . . 27,932 26,216 29,307 28,573 29,448 29,767 30,391 29,837 29,145 29,122 29,119 32,199 351,0564453 Beer, wine, and liquor stores . . . . . . . 1,557 1,514 1,724 1,769 1,842 1,869 1,994 1,870 1,834 1,817 1,857 2,593 22,240
446 Health and personal care stores . . . . . 7,580 7,276 8,143 7,835 8,121 8,070 7,936 8,206 7,903 8,041 7,996 10,192 97,29944611 Pharmacies and drug stores . . . . . . . 6,504 6,205 6,927 6,624 6,789 6,671 6,575 6,830 6,571 6,778 6,801 8,731 82,006
447 Gasoline stations . . . . . . . . . . . . . . . 12,729 12,308 13,663 13,660 14,367 14,737 15,155 15,616 14,738 14,872 14,551 15,020 171,416
448 Clothing and clothing access. stores . 7,293 7,918 9,929 9,882 10,021 9,906 9,753 11,172 10,232 10,751 12,382 20,088 129,3274481 Clothing stores . . . . . . . . . . . . . . . . 5,166 5,464 7,145 7,062 6,993 6,995 6,886 7,824 7,229 7,772 8,873 13,397 90,80644811 Men’s clothing stores . . . . . . . . . . 688 633 762 775 790 819 719 754 755 836 936 1,572 10,03944812 Women’s clothing stores . . . . . . . . 1,787 1,971 2,562 2,560 2,554 2,449 2,250 2,540 2,420 2,574 2,801 4,143 30,61144814 Family clothing stores . . . . . . . . . . 1,997 2,126 2,875 2,807 2,783 2,877 2,969 3,354 3,030 3,315 3,977 6,008 38,1184482 Shoe stores . . . . . . . . . . . . . . . . . . 1,159 1,205 1,659 1,583 1,592 1,578 1,576 1,931 1,662 1,554 1,651 2,211 19,36144831 Jewelry stores . . . . . . . . . . . . . . . 904 1,191 1,058 1,171 1,367 1,257 1,224 1,320 1,246 1,323 1,731 4,204 17,996
451 Sporting goods, hobby, book, andmusic stores . . . . . . . . . . . . . . . . . 3,950 3,564 4,181 4,123 4,124 4,325 4,263 4,924 4,576 4,377 5,376 9,755 57,538
45111 Sporting goods stores . . . . . . . . . . . 1,175 1,202 1,498 1,562 1,561 1,689 1,595 1,749 1,479 1,333 1,481 2,627 18,951451211 Book stores . . . . . . . . . . . . . . . . 1,055 636 635 610 684 726 679 1,156 1,023 733 772 1,410 10,119
452 General merchandise stores . . . . . . . 17,059 17,669 21,685 21,422 22,431 22,643 21,846 23,506 22,099 24,104 28,642 42,172 285,2784521 Department stores (excl. L.D.) . . . . . . 11,636 12,159 15,193 14,896 15,507 15,618 15,024 16,422 15,257 16,679 20,235 30,319 198,9454521102 Discount dept. stores . . . . . . . . . . 6,676 6,811 8,250 8,341 8,817 8,919 8,638 8,969 8,354 9,212 10,846 15,710 109,5434521101,4521103
Conventional and national chaindept. stores . . . . . . . . . . . . . . . 4,960 5,348 6,943 6,555 6,690 6,699 6,386 7,453 6,903 7,467 9,389 14,609 89,402
4521 Department stores (incl. L.D.)2 . . . . . . 11,930 12,476 15,572 15,285 15,888 15,992 15,381 16,816 15,649 17,082 20,726 31,011 203,8084521102 Discount dept. stores . . . . . . . . . . 6,807 6,937 8,413 8,521 9,002 9,109 8,813 9,157 8,539 9,401 11,074 16,020 111,7934521101,4521103
Conventional and national chaindept. stores . . . . . . . . . . . . . . . 5,123 5,539 7,159 6,764 6,886 6,883 6,568 7,659 7,110 7,681 9,652 14,991 92,015
4529 Other general merchandise stores . . . 5,423 5,510 6,492 6,526 6,924 7,025 6,822 7,084 6,842 7,425 8,407 11,853 86,33345291 Warehouse clubs and superstores . 3,560 3,575 4,220 4,282 4,594 4,691 4,629 4,795 4,632 5,067 5,746 7,965 57,75645299 All other gen. merchandise stores . . 1,863 1,935 2,272 2,244 2,330 2,334 2,193 2,289 2,210 2,358 2,661 3,888 28,577
453 Miscellaneous store retailers . . . . . . . 4,417 4,768 5,232 5,189 6,173 6,000 5,929 6,439 6,167 5,860 6,037 8,374 70,585
454 Nonstore retailers . . . . . . . . . . . . . . . 7,617 7,128 7,847 6,800 6,567 6,373 5,950 6,827 7,119 8,005 9,022 10,131 89,3864541 Electronic shopping and mail-order
houses . . . . . . . . . . . . . . . . . . . . 3,536 3,145 3,902 3,623 3,469 3,300 3,100 3,602 3,816 4,314 5,260 6,026 47,09345431 Fuel dealers . . . . . . . . . . . . . . . . 2,716 2,448 2,117 1,396 1,293 1,221 1,167 1,331 1,418 1,621 1,795 2,239 20,762
722 Food services and drinking places . . . 16,116 16,557 18,811 18,830 19,458 19,493 20,214 19,997 18,876 19,368 18,295 19,614 225,6297221 Full-service restaurants . . . . . . . . . . 6,998 7,275 8,177 8,143 8,364 8,292 8,689 8,661 8,080 8,264 7,822 8,352 97,1177222 Limited-service eating places . . . . . . . 6,954 7,055 8,116 8,138 8,450 8,561 8,873 8,690 8,309 8,562 8,073 8,665 98,4467224 Drinking places . . . . . . . . . . . . . . . . 911 915 1,032 1,032 1,020 982 996 994 964 986 967 1,027 11,826
19
U.S. Census Bureau
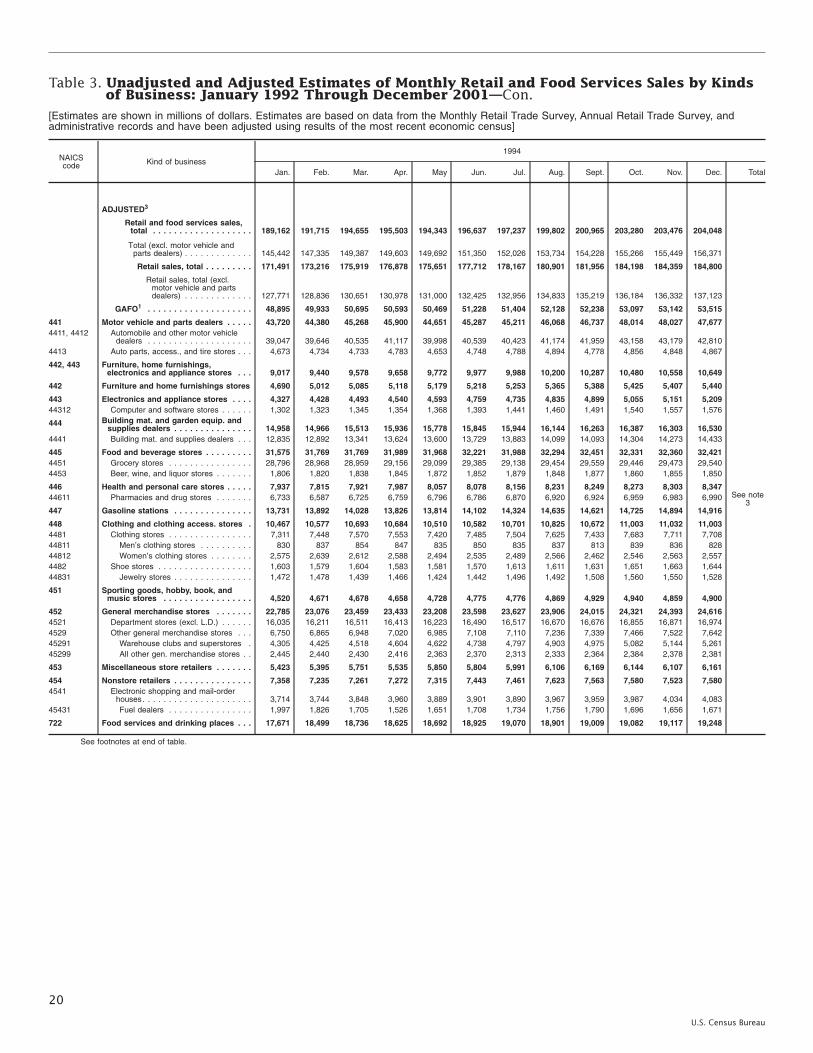
Table 3. Unadjusted and Adjusted Estimates of Monthly Retail and Food Services Sales by Kindsof Business: January 1992 Through December 2001—Con.
[Estimates are shown in millions of dollars. Estimates are based on data from the Monthly Retail Trade Survey, Annual Retail Trade Survey, andadministrative records and have been adjusted using results of the most recent economic census]
NAICScode Kind of business
1994
Jan. Feb. Mar. Apr. May Jun. Jul. Aug. Sept. Oct. Nov. Dec. Total
ADJUSTED3
Retail and food services sales,total . . . . . . . . . . . . . . . . . . . 189,162 191,715 194,655 195,503 194,343 196,637 197,237 199,802 200,965 203,280 203,476 204,048
Total (excl. motor vehicle andparts dealers) . . . . . . . . . . . . . 145,442 147,335 149,387 149,603 149,692 151,350 152,026 153,734 154,228 155,266 155,449 156,371
Retail sales, total . . . . . . . . . 171,491 173,216 175,919 176,878 175,651 177,712 178,167 180,901 181,956 184,198 184,359 184,800
Retail sales, total (excl.motor vehicle and partsdealers) . . . . . . . . . . . . . 127,771 128,836 130,651 130,978 131,000 132,425 132,956 134,833 135,219 136,184 136,332 137,123
GAFO1 . . . . . . . . . . . . . . . . . . . . 48,895 49,933 50,695 50,593 50,469 51,228 51,404 52,128 52,238 53,097 53,142 53,515
441 Motor vehicle and parts dealers . . . . . 43,720 44,380 45,268 45,900 44,651 45,287 45,211 46,068 46,737 48,014 48,027 47,6774411, 4412 Automobile and other motor vehicle
dealers . . . . . . . . . . . . . . . . . . . . 39,047 39,646 40,535 41,117 39,998 40,539 40,423 41,174 41,959 43,158 43,179 42,8104413 Auto parts, access., and tire stores . . . 4,673 4,734 4,733 4,783 4,653 4,748 4,788 4,894 4,778 4,856 4,848 4,867
442, 443 Furniture, home furnishings,electronics and appliance stores . . . 9,017 9,440 9,578 9,658 9,772 9,977 9,988 10,200 10,287 10,480 10,558 10,649
442 Furniture and home furnishings stores 4,690 5,012 5,085 5,118 5,179 5,218 5,253 5,365 5,388 5,425 5,407 5,440
443 Electronics and appliance stores . . . . 4,327 4,428 4,493 4,540 4,593 4,759 4,735 4,835 4,899 5,055 5,151 5,20944312 Computer and software stores . . . . . . 1,302 1,323 1,345 1,354 1,368 1,393 1,441 1,460 1,491 1,540 1,557 1,576
444 Building mat. and garden equip. andsupplies dealers . . . . . . . . . . . . . . . 14,958 14,966 15,513 15,936 15,778 15,845 15,944 16,144 16,263 16,387 16,303 16,530
4441 Building mat. and supplies dealers . . . 12,835 12,892 13,341 13,624 13,600 13,729 13,883 14,099 14,093 14,304 14,273 14,433
445 Food and beverage stores . . . . . . . . . 31,575 31,769 31,769 31,989 31,968 32,221 31,988 32,294 32,451 32,331 32,360 32,4214451 Grocery stores . . . . . . . . . . . . . . . . 28,796 28,968 28,959 29,156 29,099 29,385 29,138 29,454 29,559 29,446 29,473 29,5404453 Beer, wine, and liquor stores . . . . . . . 1,806 1,820 1,838 1,845 1,872 1,852 1,879 1,848 1,877 1,860 1,855 1,850
See note3
446 Health and personal care stores . . . . . 7,937 7,815 7,921 7,987 8,057 8,078 8,156 8,231 8,249 8,273 8,303 8,34744611 Pharmacies and drug stores . . . . . . . 6,733 6,587 6,725 6,759 6,796 6,786 6,870 6,920 6,924 6,959 6,983 6,990
447 Gasoline stations . . . . . . . . . . . . . . . 13,731 13,892 14,028 13,826 13,814 14,102 14,324 14,635 14,621 14,725 14,894 14,916
448 Clothing and clothing access. stores . 10,467 10,577 10,693 10,684 10,510 10,582 10,701 10,825 10,672 11,003 11,032 11,0034481 Clothing stores . . . . . . . . . . . . . . . . 7,311 7,448 7,570 7,553 7,420 7,485 7,504 7,625 7,433 7,683 7,711 7,70844811 Men’s clothing stores . . . . . . . . . . 830 837 854 847 835 850 835 837 813 839 836 82844812 Women’s clothing stores . . . . . . . . 2,575 2,639 2,612 2,588 2,494 2,535 2,489 2,566 2,462 2,546 2,563 2,5574482 Shoe stores . . . . . . . . . . . . . . . . . . 1,603 1,579 1,604 1,583 1,581 1,570 1,613 1,611 1,631 1,651 1,663 1,64444831 Jewelry stores . . . . . . . . . . . . . . . 1,472 1,478 1,439 1,466 1,424 1,442 1,496 1,492 1,508 1,560 1,550 1,528
451 Sporting goods, hobby, book, andmusic stores . . . . . . . . . . . . . . . . . 4,520 4,671 4,678 4,658 4,728 4,775 4,776 4,869 4,929 4,940 4,859 4,900
452 General merchandise stores . . . . . . . 22,785 23,076 23,459 23,433 23,208 23,598 23,627 23,906 24,015 24,321 24,393 24,6164521 Department stores (excl. L.D.) . . . . . . 16,035 16,211 16,511 16,413 16,223 16,490 16,517 16,670 16,676 16,855 16,871 16,9744529 Other general merchandise stores . . . 6,750 6,865 6,948 7,020 6,985 7,108 7,110 7,236 7,339 7,466 7,522 7,64245291 Warehouse clubs and superstores . 4,305 4,425 4,518 4,604 4,622 4,738 4,797 4,903 4,975 5,082 5,144 5,26145299 All other gen. merchandise stores . . 2,445 2,440 2,430 2,416 2,363 2,370 2,313 2,333 2,364 2,384 2,378 2,381
453 Miscellaneous store retailers . . . . . . . 5,423 5,395 5,751 5,535 5,850 5,804 5,991 6,106 6,169 6,144 6,107 6,161
454 Nonstore retailers . . . . . . . . . . . . . . . 7,358 7,235 7,261 7,272 7,315 7,443 7,461 7,623 7,563 7,580 7,523 7,5804541 Electronic shopping and mail-order
houses. . . . . . . . . . . . . . . . . . . . . 3,714 3,744 3,848 3,960 3,889 3,901 3,890 3,967 3,959 3,987 4,034 4,08345431 Fuel dealers . . . . . . . . . . . . . . . . 1,997 1,826 1,705 1,526 1,651 1,708 1,734 1,756 1,790 1,696 1,656 1,671
722 Food services and drinking places . . . 17,671 18,499 18,736 18,625 18,692 18,925 19,070 18,901 19,009 19,082 19,117 19,248
See footnotes at end of table.
20
U.S. Census Bureau
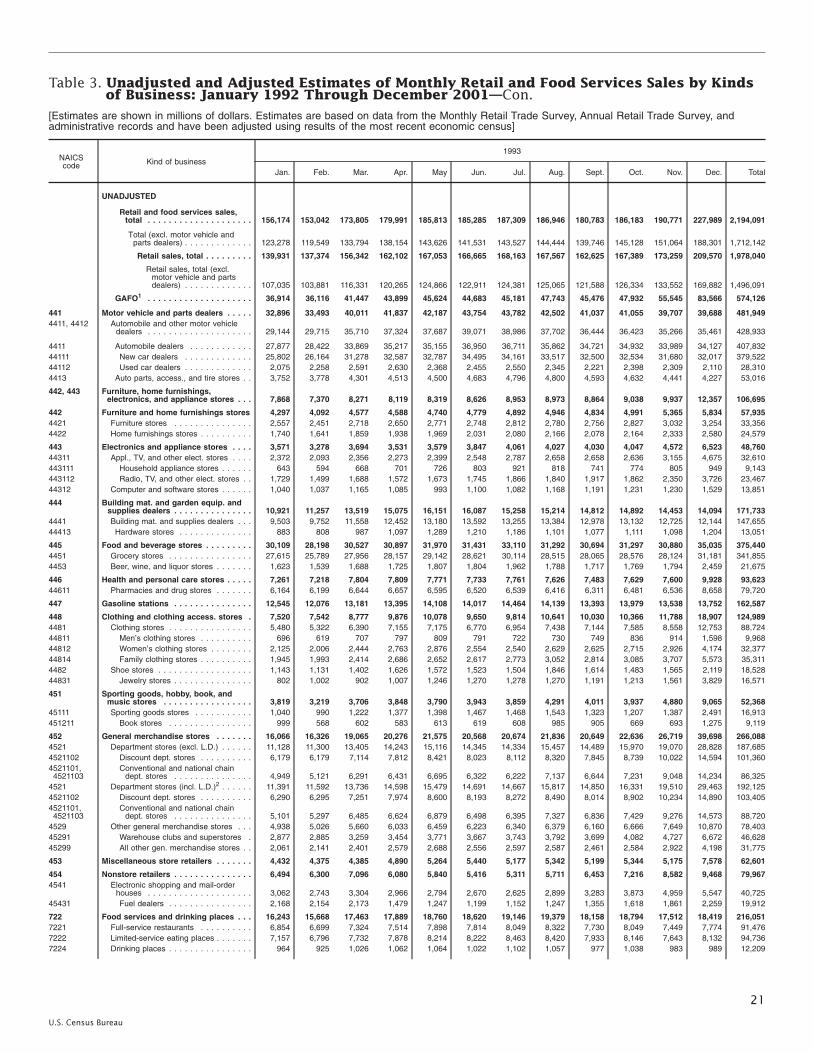
Table 3. Unadjusted and Adjusted Estimates of Monthly Retail and Food Services Sales by Kindsof Business: January 1992 Through December 2001—Con.
[Estimates are shown in millions of dollars. Estimates are based on data from the Monthly Retail Trade Survey, Annual Retail Trade Survey, andadministrative records and have been adjusted using results of the most recent economic census]
NAICScode Kind of business
1993
Jan. Feb. Mar. Apr. May Jun. Jul. Aug. Sept. Oct. Nov. Dec. Total
UNADJUSTED
Retail and food services sales,total . . . . . . . . . . . . . . . . . . . . 156,174 153,042 173,805 179,991 185,813 185,285 187,309 186,946 180,783 186,183 190,771 227,989 2,194,091
Total (excl. motor vehicle andparts dealers) . . . . . . . . . . . . . 123,278 119,549 133,794 138,154 143,626 141,531 143,527 144,444 139,746 145,128 151,064 188,301 1,712,142
Retail sales, total . . . . . . . . . 139,931 137,374 156,342 162,102 167,053 166,665 168,163 167,567 162,625 167,389 173,259 209,570 1,978,040
Retail sales, total (excl.motor vehicle and partsdealers) . . . . . . . . . . . . . 107,035 103,881 116,331 120,265 124,866 122,911 124,381 125,065 121,588 126,334 133,552 169,882 1,496,091
GAFO1 . . . . . . . . . . . . . . . . . . . . 36,914 36,116 41,447 43,899 45,624 44,683 45,181 47,743 45,476 47,932 55,545 83,566 574,126
441 Motor vehicle and parts dealers . . . . . 32,896 33,493 40,011 41,837 42,187 43,754 43,782 42,502 41,037 41,055 39,707 39,688 481,9494411, 4412 Automobile and other motor vehicle
dealers . . . . . . . . . . . . . . . . . . . . 29,144 29,715 35,710 37,324 37,687 39,071 38,986 37,702 36,444 36,423 35,266 35,461 428,933
4411 Automobile dealers . . . . . . . . . . . . 27,877 28,422 33,869 35,217 35,155 36,950 36,711 35,862 34,721 34,932 33,989 34,127 407,83244111 New car dealers . . . . . . . . . . . . . 25,802 26,164 31,278 32,587 32,787 34,495 34,161 33,517 32,500 32,534 31,680 32,017 379,52244112 Used car dealers . . . . . . . . . . . . . 2,075 2,258 2,591 2,630 2,368 2,455 2,550 2,345 2,221 2,398 2,309 2,110 28,3104413 Auto parts, access., and tire stores . . 3,752 3,778 4,301 4,513 4,500 4,683 4,796 4,800 4,593 4,632 4,441 4,227 53,016
442, 443 Furniture, home furnishings,electronics, and appliance stores . . . 7,868 7,370 8,271 8,119 8,319 8,626 8,953 8,973 8,864 9,038 9,937 12,357 106,695
442 Furniture and home furnishings stores 4,297 4,092 4,577 4,588 4,740 4,779 4,892 4,946 4,834 4,991 5,365 5,834 57,9354421 Furniture stores . . . . . . . . . . . . . . . 2,557 2,451 2,718 2,650 2,771 2,748 2,812 2,780 2,756 2,827 3,032 3,254 33,3564422 Home furnishings stores . . . . . . . . . . 1,740 1,641 1,859 1,938 1,969 2,031 2,080 2,166 2,078 2,164 2,333 2,580 24,579
443 Electronics and appliance stores . . . . 3,571 3,278 3,694 3,531 3,579 3,847 4,061 4,027 4,030 4,047 4,572 6,523 48,76044311 Appl., TV, and other elect. stores . . . . 2,372 2,093 2,356 2,273 2,399 2,548 2,787 2,658 2,658 2,636 3,155 4,675 32,610443111 Household appliance stores . . . . . . 643 594 668 701 726 803 921 818 741 774 805 949 9,143443112 Radio, TV, and other elect. stores . . 1,729 1,499 1,688 1,572 1,673 1,745 1,866 1,840 1,917 1,862 2,350 3,726 23,46744312 Computer and software stores . . . . . . 1,040 1,037 1,165 1,085 993 1,100 1,082 1,168 1,191 1,231 1,230 1,529 13,851
444 Building mat. and garden equip. andsupplies dealers . . . . . . . . . . . . . . . 10,921 11,257 13,519 15,075 16,151 16,087 15,258 15,214 14,812 14,892 14,453 14,094 171,733
4441 Building mat. and supplies dealers . . . 9,503 9,752 11,558 12,452 13,180 13,592 13,255 13,384 12,978 13,132 12,725 12,144 147,65544413 Hardware stores . . . . . . . . . . . . . . 883 808 987 1,097 1,289 1,210 1,186 1,101 1,077 1,111 1,098 1,204 13,051
445 Food and beverage stores . . . . . . . . . 30,109 28,198 30,527 30,897 31,970 31,431 33,110 31,292 30,694 31,297 30,880 35,035 375,4404451 Grocery stores . . . . . . . . . . . . . . . . 27,615 25,789 27,956 28,157 29,142 28,621 30,114 28,515 28,065 28,576 28,124 31,181 341,8554453 Beer, wine, and liquor stores . . . . . . . 1,623 1,539 1,688 1,725 1,807 1,804 1,962 1,788 1,717 1,769 1,794 2,459 21,675
446 Health and personal care stores . . . . . 7,261 7,218 7,804 7,809 7,771 7,733 7,761 7,626 7,483 7,629 7,600 9,928 93,62344611 Pharmacies and drug stores . . . . . . . 6,164 6,199 6,644 6,657 6,595 6,520 6,539 6,416 6,311 6,481 6,536 8,658 79,720
447 Gasoline stations . . . . . . . . . . . . . . . 12,545 12,076 13,181 13,395 14,108 14,017 14,464 14,139 13,393 13,979 13,538 13,752 162,587
448 Clothing and clothing access. stores . 7,520 7,542 8,777 9,876 10,078 9,650 9,814 10,641 10,030 10,366 11,788 18,907 124,9894481 Clothing stores . . . . . . . . . . . . . . . . 5,480 5,322 6,390 7,155 7,175 6,770 6,954 7,438 7,144 7,585 8,558 12,753 88,72444811 Men’s clothing stores . . . . . . . . . . 696 619 707 797 809 791 722 730 749 836 914 1,598 9,96844812 Women’s clothing stores . . . . . . . . 2,125 2,006 2,444 2,763 2,876 2,554 2,540 2,629 2,625 2,715 2,926 4,174 32,37744814 Family clothing stores . . . . . . . . . . 1,945 1,993 2,414 2,686 2,652 2,617 2,773 3,052 2,814 3,085 3,707 5,573 35,3114482 Shoe stores . . . . . . . . . . . . . . . . . . 1,143 1,131 1,402 1,626 1,572 1,523 1,504 1,846 1,614 1,483 1,565 2,119 18,52844831 Jewelry stores . . . . . . . . . . . . . . . 802 1,002 902 1,007 1,246 1,270 1,278 1,270 1,191 1,213 1,561 3,829 16,571
451 Sporting goods, hobby, book, andmusic stores . . . . . . . . . . . . . . . . . 3,819 3,219 3,706 3,848 3,790 3,943 3,859 4,291 4,011 3,937 4,880 9,065 52,368
45111 Sporting goods stores . . . . . . . . . . . 1,040 990 1,222 1,377 1,398 1,467 1,468 1,543 1,323 1,207 1,387 2,491 16,913451211 Book stores . . . . . . . . . . . . . . . . 999 568 602 583 613 619 608 985 905 669 693 1,275 9,119
452 General merchandise stores . . . . . . . 16,066 16,326 19,065 20,276 21,575 20,568 20,674 21,836 20,649 22,636 26,719 39,698 266,0884521 Department stores (excl. L.D.) . . . . . . 11,128 11,300 13,405 14,243 15,116 14,345 14,334 15,457 14,489 15,970 19,070 28,828 187,6854521102 Discount dept. stores . . . . . . . . . . 6,179 6,179 7,114 7,812 8,421 8,023 8,112 8,320 7,845 8,739 10,022 14,594 101,3604521101,4521103
Conventional and national chaindept. stores . . . . . . . . . . . . . . . 4,949 5,121 6,291 6,431 6,695 6,322 6,222 7,137 6,644 7,231 9,048 14,234 86,325
4521 Department stores (incl. L.D.)2 . . . . . . 11,391 11,592 13,736 14,598 15,479 14,691 14,667 15,817 14,850 16,331 19,510 29,463 192,1254521102 Discount dept. stores . . . . . . . . . . 6,290 6,295 7,251 7,974 8,600 8,193 8,272 8,490 8,014 8,902 10,234 14,890 103,4054521101,4521103
Conventional and national chaindept. stores . . . . . . . . . . . . . . . 5,101 5,297 6,485 6,624 6,879 6,498 6,395 7,327 6,836 7,429 9,276 14,573 88,720
4529 Other general merchandise stores . . . 4,938 5,026 5,660 6,033 6,459 6,223 6,340 6,379 6,160 6,666 7,649 10,870 78,40345291 Warehouse clubs and superstores . 2,877 2,885 3,259 3,454 3,771 3,667 3,743 3,792 3,699 4,082 4,727 6,672 46,62845299 All other gen. merchandise stores . . 2,061 2,141 2,401 2,579 2,688 2,556 2,597 2,587 2,461 2,584 2,922 4,198 31,775
453 Miscellaneous store retailers . . . . . . . 4,432 4,375 4,385 4,890 5,264 5,440 5,177 5,342 5,199 5,344 5,175 7,578 62,601
454 Nonstore retailers . . . . . . . . . . . . . . . 6,494 6,300 7,096 6,080 5,840 5,416 5,311 5,711 6,453 7,216 8,582 9,468 79,9674541 Electronic shopping and mail-order
houses . . . . . . . . . . . . . . . . . . . . 3,062 2,743 3,304 2,966 2,794 2,670 2,625 2,899 3,283 3,873 4,959 5,547 40,72545431 Fuel dealers . . . . . . . . . . . . . . . . 2,168 2,154 2,173 1,479 1,247 1,199 1,152 1,247 1,355 1,618 1,861 2,259 19,912
722 Food services and drinking places . . . 16,243 15,668 17,463 17,889 18,760 18,620 19,146 19,379 18,158 18,794 17,512 18,419 216,0517221 Full-service restaurants . . . . . . . . . . 6,854 6,699 7,324 7,514 7,898 7,814 8,049 8,322 7,730 8,049 7,449 7,774 91,4767222 Limited-service eating places . . . . . . . 7,157 6,796 7,732 7,878 8,214 8,222 8,463 8,420 7,933 8,146 7,643 8,132 94,7367224 Drinking places . . . . . . . . . . . . . . . . 964 925 1,026 1,062 1,064 1,022 1,102 1,057 977 1,038 983 989 12,209
21
U.S. Census Bureau

Table 3. Unadjusted and Adjusted Estimates of Monthly Retail and Food Services Sales by Kindsof Business: January 1992 Through December 2001—Con.
[Estimates are shown in millions of dollars. Estimates are based on data from the Monthly Retail Trade Survey, Annual Retail Trade Survey, andadministrative records and have been adjusted using results of the most recent economic census]
NAICScode Kind of business
1993
Jan. Feb. Mar. Apr. May Jun. Jul. Aug. Sept. Oct. Nov. Dec. Total
ADJUSTED3
Retail and food services sales,total . . . . . . . . . . . . . . . . . . . 178,819 177,294 175,763 179,679 181,725 181,794 183,878 184,003 185,072 186,209 188,368 189,466
Total (excl. motor vehicle andparts dealers) . . . . . . . . . . . . . 140,299 139,871 138,888 140,700 141,826 142,095 142,888 142,900 144,062 144,612 145,633 146,049
Retail sales, total . . . . . . . . . 161,221 159,768 158,265 161,879 163,841 163,699 165,884 165,738 166,543 167,927 170,088 171,211
Retail sales, total (excl.motor vehicle and partsdealers) . . . . . . . . . . . . . 122,701 122,345 121,390 122,900 123,942 124,000 124,894 124,635 125,533 126,330 127,353 127,794
GAFO1 . . . . . . . . . . . . . . . . . . . . 46,913 46,159 45,872 47,005 47,437 47,611 48,164 48,098 48,418 48,613 49,005 49,208
441 Motor vehicle and parts dealers . . . . . 38,520 37,423 36,875 38,979 39,899 39,699 40,990 41,103 41,010 41,597 42,735 43,4174411, 4412 Automobile and other motor vehicle
dealers . . . . . . . . . . . . . . . . . . . . 34,247 33,090 32,642 34,623 35,487 35,294 36,504 36,604 36,444 37,091 38,249 38,9684413 Auto parts, access., and tire stores . . . 4,273 4,333 4,233 4,356 4,412 4,405 4,486 4,499 4,566 4,506 4,486 4,449
442, 443 Furniture, home furnishings,electronics and appliance stores . . . 8,576 8,538 8,494 8,711 8,771 8,838 9,043 9,011 9,064 9,066 9,147 9,191
442 Furniture and home furnishings stores 4,812 4,747 4,651 4,804 4,832 4,813 4,853 4,844 4,839 4,879 4,904 4,903
443 Electronics and appliance stores . . . . 3,764 3,791 3,843 3,907 3,939 4,025 4,190 4,167 4,225 4,187 4,243 4,28844312 Computer and software stores . . . . . . 1,034 1,088 1,091 1,099 1,107 1,146 1,150 1,183 1,198 1,229 1,256 1,245
444 Building mat. and garden equip. andsupplies dealers . . . . . . . . . . . . . . . 13,862 14,056 13,696 13,981 14,266 14,257 14,306 14,416 14,429 14,522 14,886 15,011
4441 Building mat. and supplies dealers . . . 11,879 12,099 11,818 12,019 12,283 12,212 12,319 12,358 12,384 12,531 12,763 12,878
445 Food and beverage stores . . . . . . . . . 31,100 31,310 31,135 31,173 31,269 31,245 31,344 31,206 31,302 31,367 31,441 31,5704451 Grocery stores . . . . . . . . . . . . . . . . 28,236 28,465 28,353 28,384 28,459 28,422 28,517 28,401 28,550 28,605 28,669 28,8184453 Beer, wine, and liquor stores . . . . . . . 1,859 1,845 1,823 1,804 1,798 1,811 1,810 1,799 1,776 1,783 1,790 1,781
See note3
446 Health and personal care stores . . . . . 7,603 7,745 7,734 7,732 7,725 7,795 7,831 7,782 7,836 7,833 7,884 8,04544611 Pharmacies and drug stores . . . . . . . 6,381 6,581 6,585 6,598 6,602 6,673 6,714 6,628 6,664 6,647 6,710 6,861
447 Gasoline stations . . . . . . . . . . . . . . . 13,417 13,599 13,491 13,517 13,578 13,491 13,543 13,377 13,460 13,705 13,786 13,562
448 Clothing and clothing access. stores . 10,662 10,131 9,927 10,240 10,383 10,456 10,573 10,462 10,535 10,471 10,522 10,4544481 Clothing stores . . . . . . . . . . . . . . . . 7,700 7,274 7,108 7,344 7,435 7,373 7,447 7,352 7,419 7,424 7,462 7,36344811 Men’s clothing stores . . . . . . . . . . 830 822 833 835 839 834 835 814 817 828 822 84244812 Women’s clothing stores . . . . . . . . 3,044 2,696 2,594 2,701 2,752 2,708 2,758 2,694 2,687 2,672 2,672 2,5704482 Shoe stores . . . . . . . . . . . . . . . . . . 1,561 1,492 1,484 1,511 1,535 1,545 1,512 1,564 1,579 1,556 1,574 1,59444831 Jewelry stores . . . . . . . . . . . . . . . 1,283 1,256 1,231 1,278 1,310 1,433 1,512 1,460 1,452 1,402 1,396 1,408
451 Sporting goods, hobby, book, andmusic stores . . . . . . . . . . . . . . . . . 4,321 4,183 4,174 4,380 4,345 4,351 4,264 4,309 4,340 4,392 4,437 4,571
452 General merchandise stores . . . . . . . 21,389 21,397 21,343 21,651 21,940 21,949 22,294 22,323 22,443 22,662 22,841 22,9304521 Department stores (excl. L.D.) . . . . . . 15,260 15,129 15,066 15,321 15,499 15,508 15,738 15,744 15,815 15,982 16,018 16,0204529 Other general merchandise stores . . . 6,129 6,268 6,277 6,330 6,441 6,441 6,556 6,579 6,628 6,680 6,823 6,91045291 Warehouse clubs and superstores . 3,466 3,575 3,585 3,655 3,737 3,784 3,859 3,909 3,990 4,086 4,198 4,36945299 All other gen. merchandise stores . . 2,663 2,693 2,692 2,675 2,704 2,657 2,697 2,670 2,638 2,594 2,625 2,541
453 Miscellaneous store retailers . . . . . . . 5,440 5,002 4,930 5,113 5,061 5,228 5,164 5,185 5,274 5,482 5,268 5,482
454 Nonstore retailers . . . . . . . . . . . . . . . 6,331 6,384 6,466 6,402 6,604 6,390 6,532 6,564 6,850 6,830 7,141 6,9784541 Electronic shopping and mail-order
houses. . . . . . . . . . . . . . . . . . . . . 3,186 3,231 3,223 3,200 3,204 3,171 3,245 3,298 3,431 3,556 3,771 3,70345431 Fuel dealers . . . . . . . . . . . . . . . . 1,620 1,631 1,692 1,625 1,601 1,647 1,697 1,701 1,679 1,675 1,728 1,654
722 Food services and drinking places . . . 17,598 17,526 17,498 17,800 17,884 18,095 17,994 18,265 18,529 18,282 18,280 18,255
See footnotes at end of table.
22
U.S. Census Bureau

Table 3. Unadjusted and Adjusted Estimates of Monthly Retail and Food Services Sales by Kindsof Business: January 1992 Through December 2001—Con.
[Estimates are shown in millions of dollars. Estimates are based on data from the Monthly Retail Trade Survey, Annual Retail Trade Survey, andadministrative records and have been adjusted using results of the most recent economic census]
NAICScode Kind of business
1992
Jan. Feb. Mar. Apr. May Jun. Jul. Aug. Sept. Oct. Nov. Dec. Total
UNADJUSTED
Retail and food services sales,total . . . . . . . . . . . . . . . . . . . . 149,252 149,964 162,665 167,208 173,724 172,350 173,438 173,797 168,059 177,228 174,673 212,270 2,054,628
Total (excl. motor vehicle andparts dealers) . . . . . . . . . . . . . 118,747 118,070 126,743 130,326 136,467 133,160 134,821 137,580 131,400 139,658 141,598 178,449 1,627,019
Retail sales, total . . . . . . . . . 133,519 134,085 145,771 150,669 156,030 155,487 156,085 155,864 151,554 159,511 157,907 194,731 1,851,213
Retail sales, total (excl.motor vehicle and partsdealers) . . . . . . . . . . . . . 103,014 102,191 109,849 113,787 118,773 116,297 117,468 119,647 114,895 121,941 124,832 160,910 1,423,604
GAFO1 . . . . . . . . . . . . . . . . . . . . 34,126 35,465 38,994 40,826 42,496 41,283 41,249 44,928 41,770 45,213 51,528 79,016 536,894
441 Motor vehicle and parts dealers . . . . . 30,505 31,894 35,922 36,882 37,257 39,190 38,617 36,217 36,659 37,570 33,075 33,821 427,6094411, 4412 Automobile and other motor vehicle
dealers . . . . . . . . . . . . . . . . . . . . 26,862 28,261 31,761 32,624 32,950 34,711 34,124 31,860 32,404 33,027 28,944 29,702 377,230
4411 Automobile dealers . . . . . . . . . . . . 25,850 27,086 30,255 30,651 31,153 32,857 32,246 30,197 31,019 31,637 27,882 28,277 359,11044111 New car dealers . . . . . . . . . . . . . 24,057 25,040 28,018 27,981 28,924 30,591 29,933 28,052 28,950 29,431 26,171 26,653 333,80144112 Used car dealers . . . . . . . . . . . . . 1,793 2,046 2,237 2,670 2,229 2,266 2,313 2,145 2,069 2,206 1,711 1,624 25,3094413 Auto parts, access., and tire stores . . 3,643 3,633 4,161 4,258 4,307 4,479 4,493 4,357 4,255 4,543 4,131 4,119 50,379
442, 443 Furniture, home furnishings,electronics, and appliance stores . . . 7,289 7,138 7,623 7,534 7,701 8,022 8,165 8,104 7,974 8,331 8,768 11,108 97,757
442 Furniture and home furnishings stores 4,036 4,096 4,377 4,370 4,491 4,596 4,638 4,676 4,553 4,736 4,915 5,510 54,9944421 Furniture stores . . . . . . . . . . . . . . . 2,397 2,465 2,612 2,530 2,609 2,608 2,632 2,644 2,616 2,669 2,773 3,053 31,6084422 Home furnishings stores . . . . . . . . . . 1,639 1,631 1,765 1,840 1,882 1,988 2,006 2,032 1,937 2,067 2,142 2,457 23,386
443 Electronics and appliance stores . . . . 3,253 3,042 3,246 3,164 3,210 3,426 3,527 3,428 3,421 3,595 3,853 5,598 42,76344311 Appl., TV, and other elect. stores . . . . 2,147 2,048 2,146 2,068 2,185 2,318 2,391 2,294 2,278 2,422 2,719 3,986 29,002443111 Household appliance stores . . . . . . 602 577 631 643 663 745 765 728 684 733 754 918 8,443443112 Radio, TV, and other elect. stores . . 1,545 1,471 1,515 1,425 1,522 1,573 1,626 1,566 1,594 1,689 1,965 3,068 20,55944312 Computer and software stores . . . . . . 939 844 936 932 842 901 939 939 952 984 950 1,295 11,453
444 Building mat. and garden equip. andsupplies dealers . . . . . . . . . . . . . . . 10,986 11,057 12,987 14,216 15,031 14,945 14,265 13,736 13,848 14,198 12,405 12,497 160,171
4441 Building mat. and supplies dealers . . . 9,398 9,315 10,727 11,467 11,929 12,508 12,265 11,978 12,069 12,313 10,839 10,714 135,52244413 Hardware stores . . . . . . . . . . . . . . 846 822 962 1,077 1,235 1,170 1,147 1,086 1,056 1,110 1,041 1,168 12,720
445 Food and beverage stores . . . . . . . . . 29,660 28,642 29,756 30,306 31,756 30,845 32,486 31,548 30,233 31,486 30,465 34,268 371,4514451 Grocery stores . . . . . . . . . . . . . . . . 27,352 26,268 27,281 27,635 28,931 28,086 29,527 28,691 27,519 28,628 27,665 30,342 337,9254453 Beer, wine, and liquor stores . . . . . . . 1,519 1,551 1,606 1,686 1,834 1,786 1,924 1,874 1,781 1,894 1,843 2,527 21,825
446 Health and personal care stores . . . . . 7,340 7,228 7,499 7,616 7,583 7,483 7,370 7,406 7,162 7,562 7,200 9,345 90,79444611 Pharmacies and drug stores . . . . . . . 6,359 6,285 6,421 6,574 6,492 6,343 6,237 6,281 6,075 6,441 6,176 8,122 77,806
447 Gasoline stations . . . . . . . . . . . . . . . 12,117 11,597 12,291 12,461 13,469 13,448 13,896 13,846 13,159 13,682 13,083 13,507 156,556
448 Clothing and clothing access. stores . 6,952 7,538 8,485 9,405 9,573 9,199 9,123 10,528 9,588 10,277 11,216 18,462 120,3464481 Clothing stores . . . . . . . . . . . . . . . . 4,889 5,197 6,061 6,720 6,811 6,579 6,598 7,536 6,923 7,566 8,257 12,804 85,94144811 Men’s clothing stores . . . . . . . . . . 702 659 731 816 857 854 714 777 762 842 915 1,556 10,18544812 Women’s clothing stores . . . . . . . . 1,874 1,993 2,405 2,667 2,755 2,425 2,375 2,660 2,562 2,757 2,948 4,419 31,84044814 Family clothing stores . . . . . . . . . . 1,650 1,865 2,152 2,438 2,412 2,518 2,655 3,046 2,688 2,994 3,400 5,341 33,1594482 Shoe stores . . . . . . . . . . . . . . . . . . 1,176 1,232 1,426 1,633 1,521 1,460 1,413 1,792 1,539 1,490 1,477 1,989 18,14844831 Jewelry stores . . . . . . . . . . . . . . . 803 1,030 922 977 1,182 1,104 1,046 1,100 1,043 1,132 1,376 3,469 15,184
451 Sporting goods, hobby, book, andmusic stores . . . . . . . . . . . . . . . . . 3,456 3,282 3,493 3,544 3,564 3,627 3,658 4,007 3,817 3,781 4,455 8,612 49,296
45111 Sporting goods stores . . . . . . . . . . . 979 1,108 1,224 1,276 1,302 1,343 1,350 1,389 1,216 1,129 1,216 2,170 15,702451211 Book stores . . . . . . . . . . . . . . . . 790 540 536 524 553 589 593 895 863 647 642 1,166 8,338
452 General merchandise stores . . . . . . . 14,976 16,022 17,980 18,878 20,052 18,815 18,578 20,519 18,715 20,984 25,024 37,425 247,9684521 Department stores (excl. L.D.) . . . . . . 10,278 11,250 12,905 13,457 14,292 13,350 13,097 14,776 13,332 14,969 18,123 27,260 177,0894521102 Discount dept. stores . . . . . . . . . . 5,488 5,904 6,654 7,043 7,650 7,192 7,077 7,638 6,862 7,879 9,132 13,417 91,9364521101,4521103
Conventional and national chaindept. stores . . . . . . . . . . . . . . . 4,790 5,346 6,251 6,414 6,642 6,158 6,020 7,138 6,470 7,090 8,991 13,843 85,153
4521 Department stores (incl. L.D.)2 . . . . . . 10,530 11,547 13,236 13,803 14,626 13,662 13,394 15,101 13,665 15,327 18,528 27,836 181,2554521102 Discount dept. stores . . . . . . . . . . 5,601 6,025 6,800 7,205 7,810 7,347 7,224 7,805 7,021 8,044 9,326 13,663 93,8714521101,4521103
Conventional and national chaindept. stores . . . . . . . . . . . . . . . 4,929 5,522 6,436 6,598 6,816 6,315 6,170 7,296 6,644 7,283 9,202 14,173 87,384
4529 Other general merchandise stores . . . 4,698 4,772 5,075 5,421 5,760 5,465 5,481 5,743 5,383 6,015 6,901 10,165 70,87945291 Warehouse clubs and superstores . 2,580 2,616 2,838 2,985 3,258 3,107 3,097 3,288 3,077 3,429 4,011 5,739 40,02545299 All other gen. merchandise stores . . 2,118 2,156 2,237 2,436 2,502 2,358 2,384 2,455 2,306 2,586 2,890 4,426 30,854
453 Miscellaneous store retailers . . . . . . . 3,715 3,976 3,826 4,223 4,685 4,605 4,571 4,586 4,535 4,851 4,930 7,330 55,833
454 Nonstore retailers . . . . . . . . . . . . . . . 6,523 5,711 5,909 5,604 5,359 5,308 5,356 5,367 5,864 6,789 7,286 8,356 73,4324541 Electronic shopping and mail-order
houses . . . . . . . . . . . . . . . . . . . . 2,693 2,287 2,486 2,509 2,486 2,605 2,668 2,677 2,936 3,441 3,928 4,536 35,25245431 Fuel dealers . . . . . . . . . . . . . . . . 2,233 1,899 1,796 1,562 1,349 1,179 1,123 1,162 1,327 1,653 1,762 2,266 19,311
722 Food services and drinking places . . . 15,733 15,879 16,894 16,539 17,694 16,863 17,353 17,933 16,505 17,717 16,766 17,539 203,4157221 Full-service restaurants . . . . . . . . . . 6,910 6,959 7,268 7,023 7,555 7,021 7,297 7,558 6,945 7,464 7,138 7,355 86,4937222 Limited-service eating places . . . . . . . 6,451 6,551 7,116 7,080 7,560 7,403 7,619 7,859 7,179 7,714 7,222 7,679 87,4337224 Drinking places . . . . . . . . . . . . . . . . 1,054 1,032 1,078 1,037 1,053 992 1,021 1,028 964 1,048 1,005 1,040 12,352
23
U.S. Census Bureau
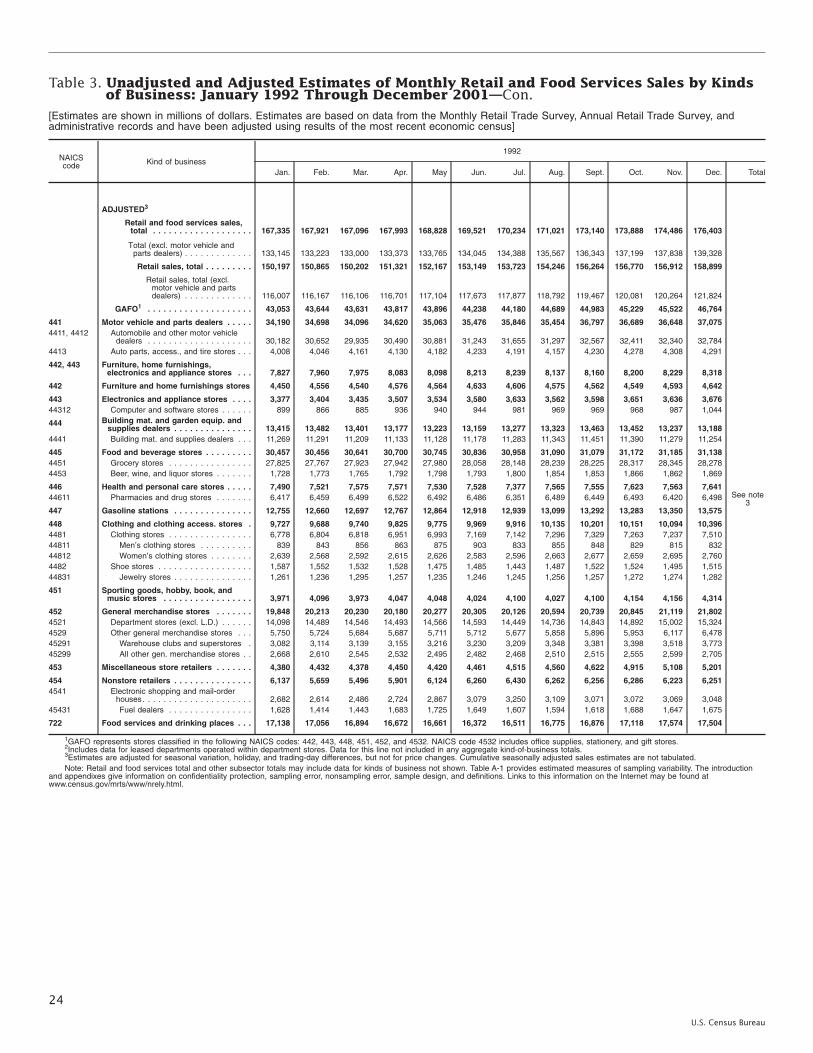
Table 3. Unadjusted and Adjusted Estimates of Monthly Retail and Food Services Sales by Kindsof Business: January 1992 Through December 2001—Con.
[Estimates are shown in millions of dollars. Estimates are based on data from the Monthly Retail Trade Survey, Annual Retail Trade Survey, andadministrative records and have been adjusted using results of the most recent economic census]
NAICScode Kind of business
1992
Jan. Feb. Mar. Apr. May Jun. Jul. Aug. Sept. Oct. Nov. Dec. Total
ADJUSTED3
Retail and food services sales,total . . . . . . . . . . . . . . . . . . . 167,335 167,921 167,096 167,993 168,828 169,521 170,234 171,021 173,140 173,888 174,486 176,403
Total (excl. motor vehicle andparts dealers) . . . . . . . . . . . . . 133,145 133,223 133,000 133,373 133,765 134,045 134,388 135,567 136,343 137,199 137,838 139,328
Retail sales, total . . . . . . . . . 150,197 150,865 150,202 151,321 152,167 153,149 153,723 154,246 156,264 156,770 156,912 158,899
Retail sales, total (excl.motor vehicle and partsdealers) . . . . . . . . . . . . . 116,007 116,167 116,106 116,701 117,104 117,673 117,877 118,792 119,467 120,081 120,264 121,824
GAFO1 . . . . . . . . . . . . . . . . . . . . 43,053 43,644 43,631 43,817 43,896 44,238 44,180 44,689 44,983 45,229 45,522 46,764
441 Motor vehicle and parts dealers . . . . . 34,190 34,698 34,096 34,620 35,063 35,476 35,846 35,454 36,797 36,689 36,648 37,0754411, 4412 Automobile and other motor vehicle
dealers . . . . . . . . . . . . . . . . . . . . 30,182 30,652 29,935 30,490 30,881 31,243 31,655 31,297 32,567 32,411 32,340 32,7844413 Auto parts, access., and tire stores . . . 4,008 4,046 4,161 4,130 4,182 4,233 4,191 4,157 4,230 4,278 4,308 4,291
442, 443 Furniture, home furnishings,electronics and appliance stores . . . 7,827 7,960 7,975 8,083 8,098 8,213 8,239 8,137 8,160 8,200 8,229 8,318
442 Furniture and home furnishings stores 4,450 4,556 4,540 4,576 4,564 4,633 4,606 4,575 4,562 4,549 4,593 4,642
443 Electronics and appliance stores . . . . 3,377 3,404 3,435 3,507 3,534 3,580 3,633 3,562 3,598 3,651 3,636 3,67644312 Computer and software stores . . . . . . 899 866 885 936 940 944 981 969 969 968 987 1,044
444 Building mat. and garden equip. andsupplies dealers . . . . . . . . . . . . . . . 13,415 13,482 13,401 13,177 13,223 13,159 13,277 13,323 13,463 13,452 13,237 13,188
4441 Building mat. and supplies dealers . . . 11,269 11,291 11,209 11,133 11,128 11,178 11,283 11,343 11,451 11,390 11,279 11,254
445 Food and beverage stores . . . . . . . . . 30,457 30,456 30,641 30,700 30,745 30,836 30,958 31,090 31,079 31,172 31,185 31,1384451 Grocery stores . . . . . . . . . . . . . . . . 27,825 27,767 27,923 27,942 27,980 28,058 28,148 28,239 28,225 28,317 28,345 28,2784453 Beer, wine, and liquor stores . . . . . . . 1,728 1,773 1,765 1,792 1,798 1,793 1,800 1,854 1,853 1,866 1,862 1,869
See note3
446 Health and personal care stores . . . . . 7,490 7,521 7,575 7,571 7,530 7,528 7,377 7,565 7,555 7,623 7,563 7,64144611 Pharmacies and drug stores . . . . . . . 6,417 6,459 6,499 6,522 6,492 6,486 6,351 6,489 6,449 6,493 6,420 6,498
447 Gasoline stations . . . . . . . . . . . . . . . 12,755 12,660 12,697 12,767 12,864 12,918 12,939 13,099 13,292 13,283 13,350 13,575
448 Clothing and clothing access. stores . 9,727 9,688 9,740 9,825 9,775 9,969 9,916 10,135 10,201 10,151 10,094 10,3964481 Clothing stores . . . . . . . . . . . . . . . . 6,778 6,804 6,818 6,951 6,993 7,169 7,142 7,296 7,329 7,263 7,237 7,51044811 Men’s clothing stores . . . . . . . . . . 839 843 856 863 875 903 833 855 848 829 815 83244812 Women’s clothing stores . . . . . . . . 2,639 2,568 2,592 2,615 2,626 2,583 2,596 2,663 2,677 2,659 2,695 2,7604482 Shoe stores . . . . . . . . . . . . . . . . . . 1,587 1,552 1,532 1,528 1,475 1,485 1,443 1,487 1,522 1,524 1,495 1,51544831 Jewelry stores . . . . . . . . . . . . . . . 1,261 1,236 1,295 1,257 1,235 1,246 1,245 1,256 1,257 1,272 1,274 1,282
451 Sporting goods, hobby, book, andmusic stores . . . . . . . . . . . . . . . . . 3,971 4,096 3,973 4,047 4,048 4,024 4,100 4,027 4,100 4,154 4,156 4,314
452 General merchandise stores . . . . . . . 19,848 20,213 20,230 20,180 20,277 20,305 20,126 20,594 20,739 20,845 21,119 21,8024521 Department stores (excl. L.D.) . . . . . . 14,098 14,489 14,546 14,493 14,566 14,593 14,449 14,736 14,843 14,892 15,002 15,3244529 Other general merchandise stores . . . 5,750 5,724 5,684 5,687 5,711 5,712 5,677 5,858 5,896 5,953 6,117 6,47845291 Warehouse clubs and superstores . 3,082 3,114 3,139 3,155 3,216 3,230 3,209 3,348 3,381 3,398 3,518 3,77345299 All other gen. merchandise stores . . 2,668 2,610 2,545 2,532 2,495 2,482 2,468 2,510 2,515 2,555 2,599 2,705
453 Miscellaneous store retailers . . . . . . . 4,380 4,432 4,378 4,450 4,420 4,461 4,515 4,560 4,622 4,915 5,108 5,201
454 Nonstore retailers . . . . . . . . . . . . . . . 6,137 5,659 5,496 5,901 6,124 6,260 6,430 6,262 6,256 6,286 6,223 6,2514541 Electronic shopping and mail-order
houses. . . . . . . . . . . . . . . . . . . . . 2,682 2,614 2,486 2,724 2,867 3,079 3,250 3,109 3,071 3,072 3,069 3,04845431 Fuel dealers . . . . . . . . . . . . . . . . 1,628 1,414 1,443 1,683 1,725 1,649 1,607 1,594 1,618 1,688 1,647 1,675
722 Food services and drinking places . . . 17,138 17,056 16,894 16,672 16,661 16,372 16,511 16,775 16,876 17,118 17,574 17,504
1GAFO represents stores classified in the following NAICS codes: 442, 443, 448, 451, 452, and 4532. NAICS code 4532 includes office supplies, stationery, and gift stores.2Includes data for leased departments operated within department stores. Data for this line not included in any aggregate kind-of-business totals.3Estimates are adjusted for seasonal variation, holiday, and trading-day differences, but not for price changes. Cumulative seasonally adjusted sales estimates are not tabulated.Note: Retail and food services total and other subsector totals may include data for kinds of business not shown. Table A-1 provides estimated measures of sampling variability. The introduction
and appendixes give information on confidentiality protection, sampling error, nonsampling error, sample design, and definitions. Links to this information on the Internet may be found atwww.census.gov/mrts/www/nrely.html.
24
U.S. Census Bureau
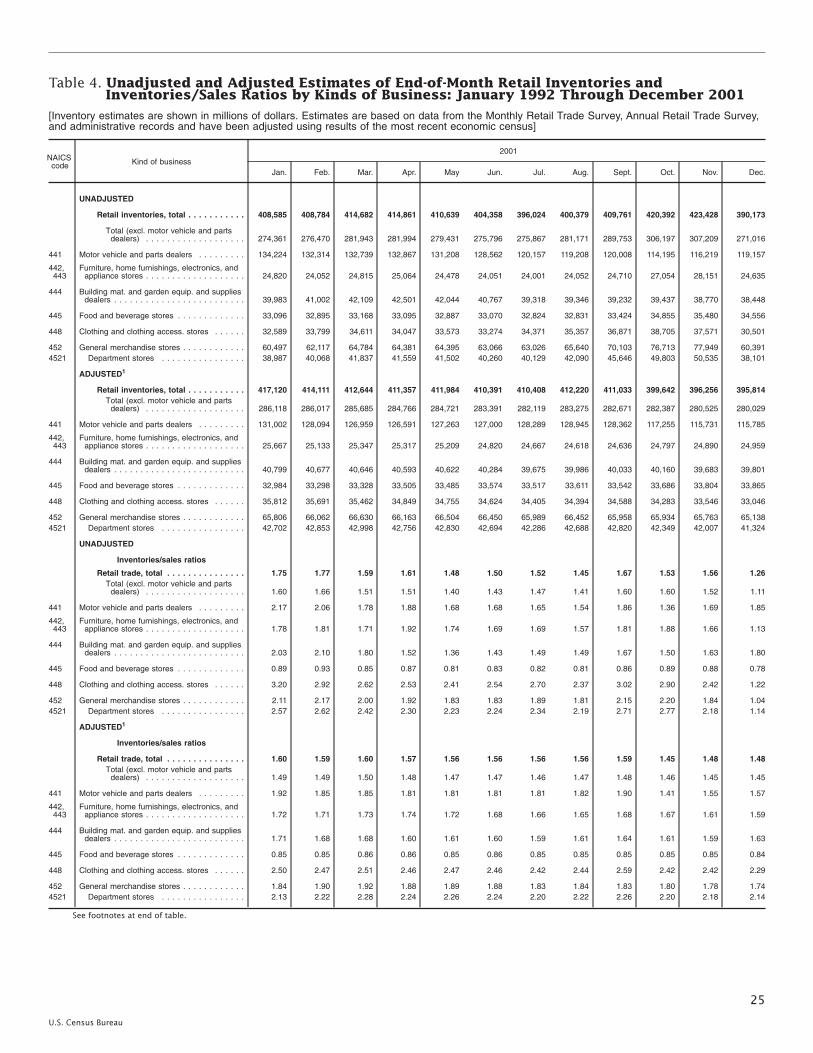
Table 4. Unadjusted and Adjusted Estimates of End-of-Month Retail Inventories andInventories/Sales Ratios by Kinds of Business: January 1992 Through December 2001
[Inventory estimates are shown in millions of dollars. Estimates are based on data from the Monthly Retail Trade Survey, Annual Retail Trade Survey,and administrative records and have been adjusted using results of the most recent economic census]
NAICScode Kind of business
2001
Jan. Feb. Mar. Apr. May Jun. Jul. Aug. Sept. Oct. Nov. Dec.
UNADJUSTED
Retail inventories, total . . . . . . . . . . . 408,585 408,784 414,682 414,861 410,639 404,358 396,024 400,379 409,761 420,392 423,428 390,173
Total (excl. motor vehicle and partsdealers) . . . . . . . . . . . . . . . . . . . 274,361 276,470 281,943 281,994 279,431 275,796 275,867 281,171 289,753 306,197 307,209 271,016
441 Motor vehicle and parts dealers . . . . . . . . . 134,224 132,314 132,739 132,867 131,208 128,562 120,157 119,208 120,008 114,195 116,219 119,157
442,443
Furniture, home furnishings, electronics, andappliance stores . . . . . . . . . . . . . . . . . . . 24,820 24,052 24,815 25,064 24,478 24,051 24,001 24,052 24,710 27,054 28,151 24,635
444 Building mat. and garden equip. and suppliesdealers . . . . . . . . . . . . . . . . . . . . . . . . . 39,983 41,002 42,109 42,501 42,044 40,767 39,318 39,346 39,232 39,437 38,770 38,448
445 Food and beverage stores . . . . . . . . . . . . . 33,096 32,895 33,168 33,095 32,887 33,070 32,824 32,831 33,424 34,855 35,480 34,556
448 Clothing and clothing access. stores . . . . . . 32,589 33,799 34,611 34,047 33,573 33,274 34,371 35,357 36,871 38,705 37,571 30,501
452 General merchandise stores . . . . . . . . . . . . 60,497 62,117 64,784 64,381 64,395 63,066 63,026 65,640 70,103 76,713 77,949 60,3914521 Department stores . . . . . . . . . . . . . . . . 38,987 40,068 41,837 41,559 41,502 40,260 40,129 42,090 45,646 49,803 50,535 38,101
ADJUSTED1
Retail inventories, total . . . . . . . . . . . 417,120 414,111 412,644 411,357 411,984 410,391 410,408 412,220 411,033 399,642 396,256 395,814Total (excl. motor vehicle and parts
dealers) . . . . . . . . . . . . . . . . . . . 286,118 286,017 285,685 284,766 284,721 283,391 282,119 283,275 282,671 282,387 280,525 280,029
441 Motor vehicle and parts dealers . . . . . . . . . 131,002 128,094 126,959 126,591 127,263 127,000 128,289 128,945 128,362 117,255 115,731 115,785
442,443
Furniture, home furnishings, electronics, andappliance stores . . . . . . . . . . . . . . . . . . . 25,667 25,133 25,347 25,317 25,209 24,820 24,667 24,618 24,636 24,797 24,890 24,959
444 Building mat. and garden equip. and suppliesdealers . . . . . . . . . . . . . . . . . . . . . . . . . 40,799 40,677 40,646 40,593 40,622 40,284 39,675 39,986 40,033 40,160 39,683 39,801
445 Food and beverage stores . . . . . . . . . . . . . 32,984 33,298 33,328 33,505 33,485 33,574 33,517 33,611 33,542 33,686 33,804 33,865
448 Clothing and clothing access. stores . . . . . . 35,812 35,691 35,462 34,849 34,755 34,624 34,405 34,394 34,588 34,283 33,546 33,046
452 General merchandise stores . . . . . . . . . . . . 65,806 66,062 66,630 66,163 66,504 66,450 65,989 66,452 65,958 65,934 65,763 65,1384521 Department stores . . . . . . . . . . . . . . . . 42,702 42,853 42,998 42,756 42,830 42,694 42,286 42,688 42,820 42,349 42,007 41,324
UNADJUSTED
Inventories/sales ratios
Retail trade, total . . . . . . . . . . . . . . . 1.75 1.77 1.59 1.61 1.48 1.50 1.52 1.45 1.67 1.53 1.56 1.26Total (excl. motor vehicle and parts
dealers) . . . . . . . . . . . . . . . . . . . 1.60 1.66 1.51 1.51 1.40 1.43 1.47 1.41 1.60 1.60 1.52 1.11
441 Motor vehicle and parts dealers . . . . . . . . . 2.17 2.06 1.78 1.88 1.68 1.68 1.65 1.54 1.86 1.36 1.69 1.85
442,443
Furniture, home furnishings, electronics, andappliance stores . . . . . . . . . . . . . . . . . . . 1.78 1.81 1.71 1.92 1.74 1.69 1.69 1.57 1.81 1.88 1.66 1.13
444 Building mat. and garden equip. and suppliesdealers . . . . . . . . . . . . . . . . . . . . . . . . . 2.03 2.10 1.80 1.52 1.36 1.43 1.49 1.49 1.67 1.50 1.63 1.80
445 Food and beverage stores . . . . . . . . . . . . . 0.89 0.93 0.85 0.87 0.81 0.83 0.82 0.81 0.86 0.89 0.88 0.78
448 Clothing and clothing access. stores . . . . . . 3.20 2.92 2.62 2.53 2.41 2.54 2.70 2.37 3.02 2.90 2.42 1.22
452 General merchandise stores . . . . . . . . . . . . 2.11 2.17 2.00 1.92 1.83 1.83 1.89 1.81 2.15 2.20 1.84 1.044521 Department stores . . . . . . . . . . . . . . . . 2.57 2.62 2.42 2.30 2.23 2.24 2.34 2.19 2.71 2.77 2.18 1.14
ADJUSTED1
Inventories/sales ratios
Retail trade, total . . . . . . . . . . . . . . . 1.60 1.59 1.60 1.57 1.56 1.56 1.56 1.56 1.59 1.45 1.48 1.48Total (excl. motor vehicle and parts
dealers) . . . . . . . . . . . . . . . . . . . 1.49 1.49 1.50 1.48 1.47 1.47 1.46 1.47 1.48 1.46 1.45 1.45
441 Motor vehicle and parts dealers . . . . . . . . . 1.92 1.85 1.85 1.81 1.81 1.81 1.81 1.82 1.90 1.41 1.55 1.57
442,443
Furniture, home furnishings, electronics, andappliance stores . . . . . . . . . . . . . . . . . . . 1.72 1.71 1.73 1.74 1.72 1.68 1.66 1.65 1.68 1.67 1.61 1.59
444 Building mat. and garden equip. and suppliesdealers . . . . . . . . . . . . . . . . . . . . . . . . . 1.71 1.68 1.68 1.60 1.61 1.60 1.59 1.61 1.64 1.61 1.59 1.63
445 Food and beverage stores . . . . . . . . . . . . . 0.85 0.85 0.86 0.86 0.85 0.86 0.85 0.85 0.85 0.85 0.85 0.84
448 Clothing and clothing access. stores . . . . . . 2.50 2.47 2.51 2.46 2.47 2.46 2.42 2.44 2.59 2.42 2.42 2.29
452 General merchandise stores . . . . . . . . . . . . 1.84 1.90 1.92 1.88 1.89 1.88 1.83 1.84 1.83 1.80 1.78 1.744521 Department stores . . . . . . . . . . . . . . . . 2.13 2.22 2.28 2.24 2.26 2.24 2.20 2.22 2.26 2.20 2.18 2.14
See footnotes at end of table.
25
U.S. Census Bureau

Table 4. Unadjusted and Adjusted Estimates of End-of-Month Retail Inventories andInventories/Sales Ratios by Kinds of Business: January 1992 Through December2001—Con.
[Inventory estimates are shown in millions of dollars. Estimates are based on data from the Monthly Retail Trade Survey, Annual Retail Trade Survey,and administrative records and have been adjusted using results of the most recent economic census]
NAICScode Kind of business
2000
Jan. Feb. Mar. Apr. May Jun. Jul. Aug. Sept. Oct. Nov. Dec.
UNADJUSTED
Retail inventories, total . . . . . . . . . . . 384,634 389,321 397,806 400,710 400,635 400,969 391,538 398,269 409,120 434,072 444,137 411,273
Total (excl. motor vehicle and partsdealers) . . . . . . . . . . . . . . . . . . . 262,268 266,003 272,271 273,199 273,306 272,136 273,781 279,381 288,570 307,115 311,951 276,378
441 Motor vehicle and parts dealers . . . . . . . . . 122,366 123,318 125,535 127,511 127,329 128,833 117,757 118,888 120,550 126,957 132,186 134,895
442,443
Furniture, home furnishings, electronics, andappliance stores . . . . . . . . . . . . . . . . . . . 23,138 23,101 24,002 24,284 24,085 24,510 24,647 25,014 25,374 27,925 29,570 25,458
444 Building mat. and garden equip. and suppliesdealers . . . . . . . . . . . . . . . . . . . . . . . . . 38,108 39,521 40,754 41,721 41,440 40,791 40,162 40,170 40,121 40,134 40,087 39,404
445 Food and beverage stores . . . . . . . . . . . . . 33,114 32,622 32,865 32,632 32,587 32,127 31,850 31,818 32,572 33,850 34,189 33,521
448 Clothing and clothing access. stores . . . . . . 29,839 31,333 32,675 32,816 32,931 32,837 34,476 35,716 37,197 39,676 39,677 33,097
452 General merchandise stores . . . . . . . . . . . . 59,573 61,220 62,386 62,410 62,242 61,279 61,523 63,515 68,304 75,415 77,011 60,6564521 Department stores . . . . . . . . . . . . . . . . 39,819 41,037 41,741 41,601 41,424 40,324 40,303 41,601 44,685 49,837 51,083 39,325
ADJUSTED1
Retail inventories, total . . . . . . . . . . . 392,994 394,509 395,847 397,055 401,989 406,969 405,681 410,574 410,551 413,698 416,422 416,475Total (excl. motor vehicle and parts
dealers) . . . . . . . . . . . . . . . . . . . 273,538 275,135 275,968 275,763 278,368 279,582 279,704 281,585 281,578 283,370 284,934 285,682
441 Motor vehicle and parts dealers . . . . . . . . . 119,456 119,374 119,879 121,292 123,621 127,387 125,977 128,989 128,973 130,328 131,488 130,793
442,443
Furniture, home furnishings, electronics, andappliance stores . . . . . . . . . . . . . . . . . . . 24,002 24,164 24,643 24,579 24,804 25,320 25,305 25,551 25,198 25,526 26,145 25,793
444 Building mat. and garden equip. and suppliesdealers . . . . . . . . . . . . . . . . . . . . . . . . . 38,886 39,207 39,338 39,886 40,039 40,307 40,486 40,823 40,940 40,870 41,031 40,707
445 Food and beverage stores . . . . . . . . . . . . . 32,974 33,020 33,012 33,027 33,171 32,609 32,513 32,548 32,691 32,733 32,563 32,840
448 Clothing and clothing access. stores . . . . . . 32,826 33,087 33,444 33,589 34,090 34,134 34,476 34,811 34,894 35,174 35,458 35,858
452 General merchandise stores . . . . . . . . . . . . 64,664 65,017 64,183 64,054 64,300 64,612 64,325 64,370 64,340 64,921 65,088 65,3714521 Department stores . . . . . . . . . . . . . . . . 43,423 43,749 42,899 42,711 42,749 42,761 42,335 42,235 42,037 42,523 42,640 42,606
UNADJUSTED
Inventories/sales ratios
Retail trade, total . . . . . . . . . . . . . . . 1.76 1.67 1.53 1.63 1.51 1.53 1.56 1.51 1.64 1.72 1.72 1.37Total (excl. motor vehicle and parts
dealers) . . . . . . . . . . . . . . . . . . . 1.65 1.62 1.48 1.53 1.44 1.45 1.50 1.47 1.58 1.65 1.58 1.14
441 Motor vehicle and parts dealers . . . . . . . . . 2.04 1.81 1.64 1.89 1.71 1.73 1.71 1.61 1.78 1.93 2.18 2.31
442,443
Furniture, home furnishings, electronics, andappliance stores . . . . . . . . . . . . . . . . . . . 1.69 1.66 1.62 1.78 1.67 1.72 1.73 1.64 1.75 1.95 1.84 1.29
444 Building mat. and garden equip. and suppliesdealers . . . . . . . . . . . . . . . . . . . . . . . . . 2.06 2.03 1.70 1.73 1.50 1.56 1.69 1.64 1.75 1.68 1.82 1.88
445 Food and beverage stores . . . . . . . . . . . . . 0.94 0.94 0.87 0.87 0.84 0.83 0.81 0.81 0.86 0.90 0.88 0.77
448 Clothing and clothing access. stores . . . . . . 3.16 2.81 2.55 2.50 2.40 2.54 2.76 2.45 2.78 2.97 2.53 1.33
452 General merchandise stores . . . . . . . . . . . . 2.29 2.24 1.99 1.99 1.88 1.88 1.94 1.90 2.18 2.30 1.94 1.104521 Department stores . . . . . . . . . . . . . . . . 2.69 2.65 2.32 2.28 2.17 2.21 2.31 2.21 2.57 2.75 2.17 1.14
ADJUSTED1
Inventories/sales ratios
Retail trade, total . . . . . . . . . . . . . . . 1.57 1.55 1.54 1.57 1.59 1.61 1.59 1.61 1.59 1.61 1.63 1.62Total (excl. motor vehicle and parts
dealers) . . . . . . . . . . . . . . . . . . . 1.51 1.50 1.48 1.49 1.50 1.50 1.50 1.51 1.49 1.49 1.51 1.50
441 Motor vehicle and parts dealers . . . . . . . . . 1.73 1.69 1.72 1.79 1.85 1.89 1.86 1.90 1.88 1.94 1.98 1.96
442,443
Furniture, home furnishings, electronics, andappliance stores . . . . . . . . . . . . . . . . . . . 1.63 1.62 1.65 1.63 1.65 1.70 1.71 1.70 1.67 1.70 1.77 1.80
444 Building mat. and garden equip. and suppliesdealers . . . . . . . . . . . . . . . . . . . . . . . . . 1.66 1.70 1.61 1.75 1.74 1.76 1.76 1.77 1.77 1.77 1.77 1.71
445 Food and beverage stores . . . . . . . . . . . . . 0.90 0.88 0.87 0.86 0.87 0.85 0.85 0.85 0.85 0.85 0.84 0.84
448 Clothing and clothing access. stores . . . . . . 2.47 2.42 2.42 2.43 2.45 2.48 2.51 2.48 2.44 2.47 2.51 2.53
452 General merchandise stores . . . . . . . . . . . . 2.00 1.99 1.92 1.94 1.92 1.93 1.90 1.90 1.88 1.88 1.89 1.884521 Department stores . . . . . . . . . . . . . . . . 2.24 2.28 2.21 2.22 2.19 2.22 2.19 2.19 2.17 2.19 2.17 2.16
See footnotes at end of table.
26
U.S. Census Bureau
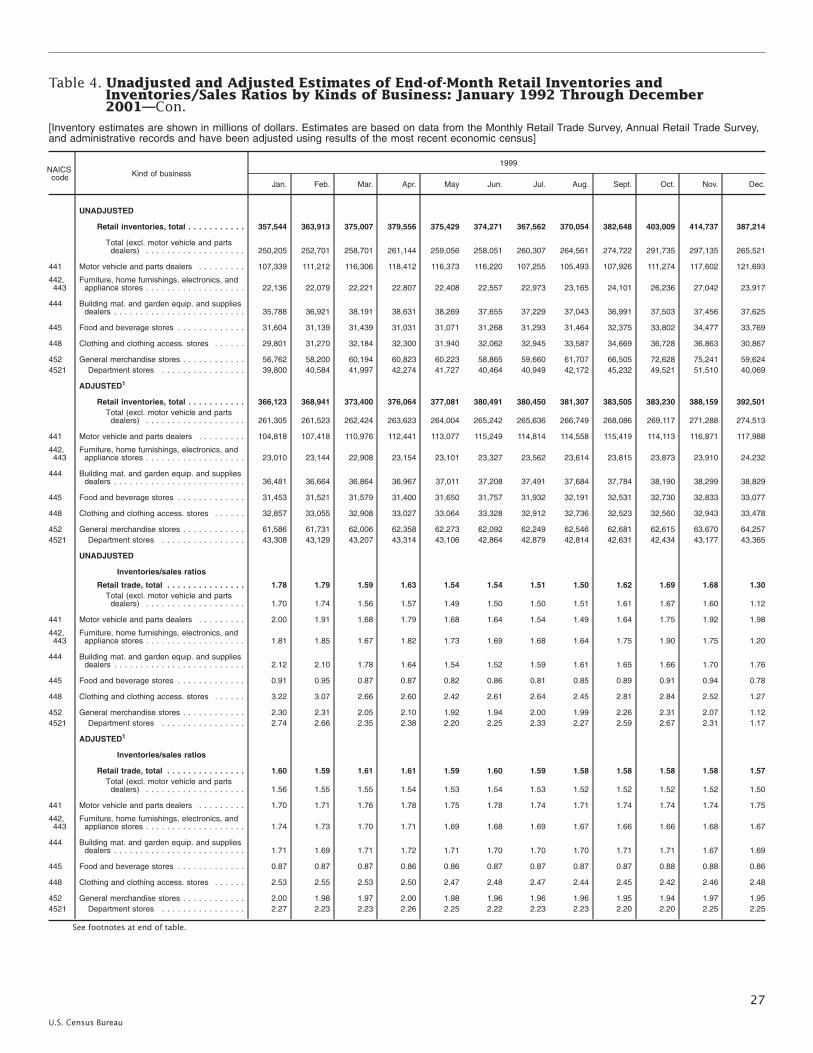
Table 4. Unadjusted and Adjusted Estimates of End-of-Month Retail Inventories andInventories/Sales Ratios by Kinds of Business: January 1992 Through December2001—Con.
[Inventory estimates are shown in millions of dollars. Estimates are based on data from the Monthly Retail Trade Survey, Annual Retail Trade Survey,and administrative records and have been adjusted using results of the most recent economic census]
NAICScode Kind of business
1999
Jan. Feb. Mar. Apr. May Jun. Jul. Aug. Sept. Oct. Nov. Dec.
UNADJUSTED
Retail inventories, total . . . . . . . . . . . 357,544 363,913 375,007 379,556 375,429 374,271 367,562 370,054 382,648 403,009 414,737 387,214
Total (excl. motor vehicle and partsdealers) . . . . . . . . . . . . . . . . . . . 250,205 252,701 258,701 261,144 259,056 258,051 260,307 264,561 274,722 291,735 297,135 265,521
441 Motor vehicle and parts dealers . . . . . . . . . 107,339 111,212 116,306 118,412 116,373 116,220 107,255 105,493 107,926 111,274 117,602 121,693
442,443
Furniture, home furnishings, electronics, andappliance stores . . . . . . . . . . . . . . . . . . . 22,136 22,079 22,221 22,807 22,408 22,557 22,973 23,165 24,101 26,236 27,042 23,917
444 Building mat. and garden equip. and suppliesdealers . . . . . . . . . . . . . . . . . . . . . . . . . 35,788 36,921 38,191 38,631 38,269 37,655 37,229 37,043 36,991 37,503 37,456 37,625
445 Food and beverage stores . . . . . . . . . . . . . 31,604 31,139 31,439 31,031 31,071 31,268 31,293 31,464 32,375 33,802 34,477 33,769
448 Clothing and clothing access. stores . . . . . . 29,801 31,270 32,184 32,300 31,940 32,062 32,945 33,587 34,669 36,728 36,863 30,867
452 General merchandise stores . . . . . . . . . . . . 56,762 58,200 60,194 60,823 60,223 58,865 59,660 61,707 66,505 72,628 75,241 59,6244521 Department stores . . . . . . . . . . . . . . . . 39,800 40,584 41,997 42,274 41,727 40,464 40,949 42,172 45,232 49,521 51,510 40,069
ADJUSTED1
Retail inventories, total . . . . . . . . . . . 366,123 368,941 373,400 376,064 377,081 380,491 380,450 381,307 383,505 383,230 388,159 392,501Total (excl. motor vehicle and parts
dealers) . . . . . . . . . . . . . . . . . . . 261,305 261,523 262,424 263,623 264,004 265,242 265,636 266,749 268,086 269,117 271,288 274,513
441 Motor vehicle and parts dealers . . . . . . . . . 104,818 107,418 110,976 112,441 113,077 115,249 114,814 114,558 115,419 114,113 116,871 117,988
442,443
Furniture, home furnishings, electronics, andappliance stores . . . . . . . . . . . . . . . . . . . 23,010 23,144 22,908 23,154 23,101 23,327 23,562 23,614 23,815 23,873 23,910 24,232
444 Building mat. and garden equip. and suppliesdealers . . . . . . . . . . . . . . . . . . . . . . . . . 36,481 36,664 36,864 36,967 37,011 37,208 37,491 37,684 37,784 38,190 38,299 38,829
445 Food and beverage stores . . . . . . . . . . . . . 31,453 31,521 31,579 31,400 31,650 31,757 31,932 32,191 32,531 32,730 32,833 33,077
448 Clothing and clothing access. stores . . . . . . 32,857 33,055 32,908 33,027 33,064 33,328 32,912 32,736 32,523 32,560 32,943 33,478
452 General merchandise stores . . . . . . . . . . . . 61,586 61,731 62,006 62,358 62,273 62,092 62,249 62,546 62,681 62,615 63,670 64,2574521 Department stores . . . . . . . . . . . . . . . . 43,308 43,129 43,207 43,314 43,106 42,864 42,879 42,814 42,631 42,434 43,177 43,365
UNADJUSTED
Inventories/sales ratios
Retail trade, total . . . . . . . . . . . . . . . 1.78 1.79 1.59 1.63 1.54 1.54 1.51 1.50 1.62 1.69 1.68 1.30Total (excl. motor vehicle and parts
dealers) . . . . . . . . . . . . . . . . . . . 1.70 1.74 1.56 1.57 1.49 1.50 1.50 1.51 1.61 1.67 1.60 1.12
441 Motor vehicle and parts dealers . . . . . . . . . 2.00 1.91 1.68 1.79 1.68 1.64 1.54 1.49 1.64 1.75 1.92 1.98
442,443
Furniture, home furnishings, electronics, andappliance stores . . . . . . . . . . . . . . . . . . . 1.81 1.85 1.67 1.82 1.73 1.69 1.68 1.64 1.75 1.90 1.75 1.20
444 Building mat. and garden equip. and suppliesdealers . . . . . . . . . . . . . . . . . . . . . . . . . 2.12 2.10 1.78 1.64 1.54 1.52 1.59 1.61 1.65 1.66 1.70 1.76
445 Food and beverage stores . . . . . . . . . . . . . 0.91 0.95 0.87 0.87 0.82 0.86 0.81 0.85 0.89 0.91 0.94 0.78
448 Clothing and clothing access. stores . . . . . . 3.22 3.07 2.66 2.60 2.42 2.61 2.64 2.45 2.81 2.84 2.52 1.27
452 General merchandise stores . . . . . . . . . . . . 2.30 2.31 2.05 2.10 1.92 1.94 2.00 1.99 2.26 2.31 2.07 1.124521 Department stores . . . . . . . . . . . . . . . . 2.74 2.66 2.35 2.38 2.20 2.25 2.33 2.27 2.59 2.67 2.31 1.17
ADJUSTED1
Inventories/sales ratios
Retail trade, total . . . . . . . . . . . . . . . 1.60 1.59 1.61 1.61 1.59 1.60 1.59 1.58 1.58 1.58 1.58 1.57Total (excl. motor vehicle and parts
dealers) . . . . . . . . . . . . . . . . . . . 1.56 1.55 1.55 1.54 1.53 1.54 1.53 1.52 1.52 1.52 1.52 1.50
441 Motor vehicle and parts dealers . . . . . . . . . 1.70 1.71 1.76 1.78 1.75 1.78 1.74 1.71 1.74 1.74 1.74 1.75
442,443
Furniture, home furnishings, electronics, andappliance stores . . . . . . . . . . . . . . . . . . . 1.74 1.73 1.70 1.71 1.69 1.68 1.69 1.67 1.66 1.66 1.68 1.67
444 Building mat. and garden equip. and suppliesdealers . . . . . . . . . . . . . . . . . . . . . . . . . 1.71 1.69 1.71 1.72 1.71 1.70 1.70 1.70 1.71 1.71 1.67 1.69
445 Food and beverage stores . . . . . . . . . . . . . 0.87 0.87 0.87 0.86 0.86 0.87 0.87 0.87 0.87 0.88 0.88 0.86
448 Clothing and clothing access. stores . . . . . . 2.53 2.55 2.53 2.50 2.47 2.48 2.47 2.44 2.45 2.42 2.46 2.48
452 General merchandise stores . . . . . . . . . . . . 2.00 1.98 1.97 2.00 1.98 1.96 1.96 1.96 1.95 1.94 1.97 1.954521 Department stores . . . . . . . . . . . . . . . . 2.27 2.23 2.23 2.26 2.25 2.22 2.23 2.23 2.20 2.20 2.25 2.25
See footnotes at end of table.
27
U.S. Census Bureau
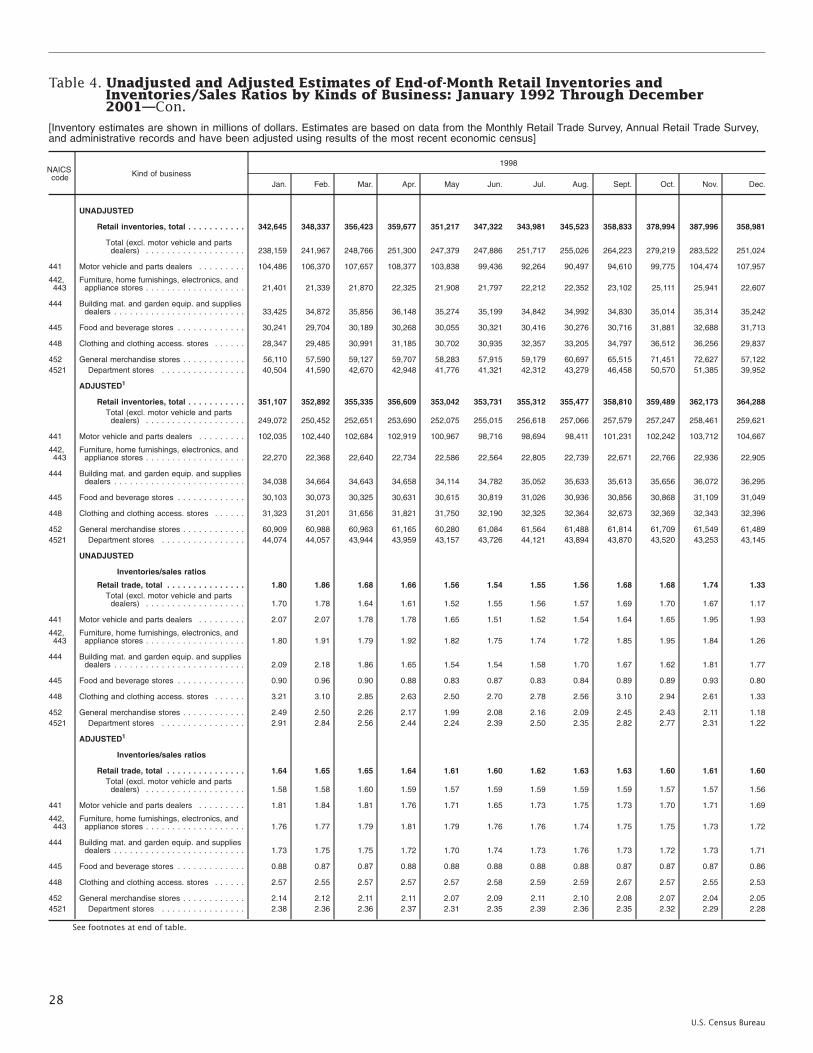
Table 4. Unadjusted and Adjusted Estimates of End-of-Month Retail Inventories andInventories/Sales Ratios by Kinds of Business: January 1992 Through December2001—Con.
[Inventory estimates are shown in millions of dollars. Estimates are based on data from the Monthly Retail Trade Survey, Annual Retail Trade Survey,and administrative records and have been adjusted using results of the most recent economic census]
NAICScode Kind of business
1998
Jan. Feb. Mar. Apr. May Jun. Jul. Aug. Sept. Oct. Nov. Dec.
UNADJUSTED
Retail inventories, total . . . . . . . . . . . 342,645 348,337 356,423 359,677 351,217 347,322 343,981 345,523 358,833 378,994 387,996 358,981
Total (excl. motor vehicle and partsdealers) . . . . . . . . . . . . . . . . . . . 238,159 241,967 248,766 251,300 247,379 247,886 251,717 255,026 264,223 279,219 283,522 251,024
441 Motor vehicle and parts dealers . . . . . . . . . 104,486 106,370 107,657 108,377 103,838 99,436 92,264 90,497 94,610 99,775 104,474 107,957
442,443
Furniture, home furnishings, electronics, andappliance stores . . . . . . . . . . . . . . . . . . . 21,401 21,339 21,870 22,325 21,908 21,797 22,212 22,352 23,102 25,111 25,941 22,607
444 Building mat. and garden equip. and suppliesdealers . . . . . . . . . . . . . . . . . . . . . . . . . 33,425 34,872 35,856 36,148 35,274 35,199 34,842 34,992 34,830 35,014 35,314 35,242
445 Food and beverage stores . . . . . . . . . . . . . 30,241 29,704 30,189 30,268 30,055 30,321 30,416 30,276 30,716 31,881 32,688 31,713
448 Clothing and clothing access. stores . . . . . . 28,347 29,485 30,991 31,185 30,702 30,935 32,357 33,205 34,797 36,512 36,256 29,837
452 General merchandise stores . . . . . . . . . . . . 56,110 57,590 59,127 59,707 58,283 57,915 59,179 60,697 65,515 71,451 72,627 57,1224521 Department stores . . . . . . . . . . . . . . . . 40,504 41,590 42,670 42,948 41,776 41,321 42,312 43,279 46,458 50,570 51,385 39,952
ADJUSTED1
Retail inventories, total . . . . . . . . . . . 351,107 352,892 355,335 356,609 353,042 353,731 355,312 355,477 358,810 359,489 362,173 364,288Total (excl. motor vehicle and parts
dealers) . . . . . . . . . . . . . . . . . . . 249,072 250,452 252,651 253,690 252,075 255,015 256,618 257,066 257,579 257,247 258,461 259,621
441 Motor vehicle and parts dealers . . . . . . . . . 102,035 102,440 102,684 102,919 100,967 98,716 98,694 98,411 101,231 102,242 103,712 104,667
442,443
Furniture, home furnishings, electronics, andappliance stores . . . . . . . . . . . . . . . . . . . 22,270 22,368 22,640 22,734 22,586 22,564 22,805 22,739 22,671 22,766 22,936 22,905
444 Building mat. and garden equip. and suppliesdealers . . . . . . . . . . . . . . . . . . . . . . . . . 34,038 34,664 34,643 34,658 34,114 34,782 35,052 35,633 35,613 35,656 36,072 36,295
445 Food and beverage stores . . . . . . . . . . . . . 30,103 30,073 30,325 30,631 30,615 30,819 31,026 30,936 30,856 30,868 31,109 31,049
448 Clothing and clothing access. stores . . . . . . 31,323 31,201 31,656 31,821 31,750 32,190 32,325 32,364 32,673 32,369 32,343 32,396
452 General merchandise stores . . . . . . . . . . . . 60,909 60,988 60,963 61,165 60,280 61,084 61,564 61,488 61,814 61,709 61,549 61,4894521 Department stores . . . . . . . . . . . . . . . . 44,074 44,057 43,944 43,959 43,157 43,726 44,121 43,894 43,870 43,520 43,253 43,145
UNADJUSTED
Inventories/sales ratios
Retail trade, total . . . . . . . . . . . . . . . 1.80 1.86 1.68 1.66 1.56 1.54 1.55 1.56 1.68 1.68 1.74 1.33Total (excl. motor vehicle and parts
dealers) . . . . . . . . . . . . . . . . . . . 1.70 1.78 1.64 1.61 1.52 1.55 1.56 1.57 1.69 1.70 1.67 1.17
441 Motor vehicle and parts dealers . . . . . . . . . 2.07 2.07 1.78 1.78 1.65 1.51 1.52 1.54 1.64 1.65 1.95 1.93
442,443
Furniture, home furnishings, electronics, andappliance stores . . . . . . . . . . . . . . . . . . . 1.80 1.91 1.79 1.92 1.82 1.75 1.74 1.72 1.85 1.95 1.84 1.26
444 Building mat. and garden equip. and suppliesdealers . . . . . . . . . . . . . . . . . . . . . . . . . 2.09 2.18 1.86 1.65 1.54 1.54 1.58 1.70 1.67 1.62 1.81 1.77
445 Food and beverage stores . . . . . . . . . . . . . 0.90 0.96 0.90 0.88 0.83 0.87 0.83 0.84 0.89 0.89 0.93 0.80
448 Clothing and clothing access. stores . . . . . . 3.21 3.10 2.85 2.63 2.50 2.70 2.78 2.56 3.10 2.94 2.61 1.33
452 General merchandise stores . . . . . . . . . . . . 2.49 2.50 2.26 2.17 1.99 2.08 2.16 2.09 2.45 2.43 2.11 1.184521 Department stores . . . . . . . . . . . . . . . . 2.91 2.84 2.56 2.44 2.24 2.39 2.50 2.35 2.82 2.77 2.31 1.22
ADJUSTED1
Inventories/sales ratios
Retail trade, total . . . . . . . . . . . . . . . 1.64 1.65 1.65 1.64 1.61 1.60 1.62 1.63 1.63 1.60 1.61 1.60Total (excl. motor vehicle and parts
dealers) . . . . . . . . . . . . . . . . . . . 1.58 1.58 1.60 1.59 1.57 1.59 1.59 1.59 1.59 1.57 1.57 1.56
441 Motor vehicle and parts dealers . . . . . . . . . 1.81 1.84 1.81 1.76 1.71 1.65 1.73 1.75 1.73 1.70 1.71 1.69
442,443
Furniture, home furnishings, electronics, andappliance stores . . . . . . . . . . . . . . . . . . . 1.76 1.77 1.79 1.81 1.79 1.76 1.76 1.74 1.75 1.75 1.73 1.72
444 Building mat. and garden equip. and suppliesdealers . . . . . . . . . . . . . . . . . . . . . . . . . 1.73 1.75 1.75 1.72 1.70 1.74 1.73 1.76 1.73 1.72 1.73 1.71
445 Food and beverage stores . . . . . . . . . . . . . 0.88 0.87 0.87 0.88 0.88 0.88 0.88 0.88 0.87 0.87 0.87 0.86
448 Clothing and clothing access. stores . . . . . . 2.57 2.55 2.57 2.57 2.57 2.58 2.59 2.59 2.67 2.57 2.55 2.53
452 General merchandise stores . . . . . . . . . . . . 2.14 2.12 2.11 2.11 2.07 2.09 2.11 2.10 2.08 2.07 2.04 2.054521 Department stores . . . . . . . . . . . . . . . . 2.38 2.36 2.36 2.37 2.31 2.35 2.39 2.36 2.35 2.32 2.29 2.28
See footnotes at end of table.
28
U.S. Census Bureau

Table 4. Unadjusted and Adjusted Estimates of End-of-Month Retail Inventories andInventories/Sales Ratios by Kinds of Business: January 1992 Through December2001—Con.
[Inventory estimates are shown in millions of dollars. Estimates are based on data from the Monthly Retail Trade Survey, Annual Retail Trade Survey,and administrative records and have been adjusted using results of the most recent economic census]
NAICScode Kind of business
1997
Jan. Feb. Mar. Apr. May Jun. Jul. Aug. Sept. Oct. Nov. Dec.
UNADJUSTED
Retail inventories, total . . . . . . . . . . . 331,547 337,977 341,245 345,044 341,782 338,660 335,875 335,389 348,228 367,967 374,047 345,500
Total (excl. motor vehicle and partsdealers) . . . . . . . . . . . . . . . . . . . 230,401 234,070 236,854 240,078 239,342 237,215 240,675 242,090 252,999 267,718 270,842 239,422
441 Motor vehicle and parts dealers . . . . . . . . . 101,146 103,907 104,391 104,966 102,440 101,445 95,200 93,299 95,229 100,249 103,205 106,078
442,443
Furniture, home furnishings, electronics, andappliance stores . . . . . . . . . . . . . . . . . . . 21,927 21,690 21,670 21,729 21,927 21,723 22,078 21,964 22,896 24,917 25,388 22,055
444 Building mat. and garden equip. and suppliesdealers . . . . . . . . . . . . . . . . . . . . . . . . . 31,757 32,545 33,615 33,956 33,931 33,452 32,855 32,611 32,927 32,918 32,826 32,926
445 Food and beverage stores . . . . . . . . . . . . . 29,670 29,152 29,433 29,173 29,075 29,106 29,057 29,259 29,860 30,833 31,491 30,474
448 Clothing and clothing access. stores . . . . . . 26,907 28,343 28,813 29,646 29,346 29,103 30,507 31,116 32,791 34,819 34,619 28,674
452 General merchandise stores . . . . . . . . . . . . 55,063 56,734 57,745 58,905 58,348 57,339 58,162 59,169 63,746 69,132 70,519 56,2074521 Department stores . . . . . . . . . . . . . . . . 39,812 41,151 42,019 42,806 42,327 41,502 41,979 42,747 46,013 50,155 51,291 40,697
ADJUSTED1
Retail inventories, total . . . . . . . . . . . 339,854 342,191 340,305 342,188 343,365 345,006 347,129 345,615 348,805 349,212 348,940 350,763Total (excl. motor vehicle and parts
dealers) . . . . . . . . . . . . . . . . . . . 240,985 242,327 240,775 242,503 243,805 244,295 245,265 244,015 246,641 246,484 246,603 247,861
441 Motor vehicle and parts dealers . . . . . . . . . 98,869 99,864 99,530 99,685 99,560 100,711 101,864 101,600 102,164 102,728 102,337 102,902
442,443
Furniture, home furnishings, electronics, andappliance stores . . . . . . . . . . . . . . . . . . . 22,769 22,736 22,479 22,218 22,628 22,534 22,761 22,298 22,359 22,509 22,428 22,345
444 Building mat. and garden equip. and suppliesdealers . . . . . . . . . . . . . . . . . . . . . . . . . 32,306 32,351 32,478 32,619 32,784 33,055 33,020 33,243 33,702 33,521 33,496 33,874
445 Food and beverage stores . . . . . . . . . . . . . 29,509 29,518 29,603 29,527 29,611 29,603 29,600 29,897 30,031 29,880 29,983 29,840
448 Clothing and clothing access. stores . . . . . . 29,797 30,024 29,431 30,220 30,379 30,347 30,446 30,327 30,790 30,841 30,827 31,167
452 General merchandise stores . . . . . . . . . . . . 59,744 60,042 59,582 60,315 60,300 60,472 60,401 59,898 60,189 59,799 59,825 60,5374521 Department stores . . . . . . . . . . . . . . . . 43,274 43,500 43,319 43,769 43,681 43,871 43,683 43,310 43,491 43,312 43,320 43,949
UNADJUSTED
Inventories/sales ratios
Retail trade, total . . . . . . . . . . . . . . . 1.80 1.87 1.65 1.70 1.59 1.62 1.58 1.56 1.70 1.72 1.77 1.36Total (excl. motor vehicle and parts
dealers) . . . . . . . . . . . . . . . . . . . 1.71 1.80 1.59 1.65 1.53 1.57 1.57 1.54 1.69 1.70 1.68 1.18
441 Motor vehicle and parts dealers . . . . . . . . . 2.07 2.05 1.79 1.85 1.75 1.75 1.61 1.59 1.72 1.78 2.10 2.08
442,443
Furniture, home furnishings, electronics, andappliance stores . . . . . . . . . . . . . . . . . . . 2.05 2.12 1.92 1.97 1.90 1.91 1.87 1.80 1.93 2.04 1.92 1.32
444 Building mat. and garden equip. and suppliesdealers . . . . . . . . . . . . . . . . . . . . . . . . . 2.11 2.16 1.86 1.65 1.54 1.58 1.57 1.67 1.64 1.58 1.84 1.80
445 Food and beverage stores . . . . . . . . . . . . . 0.89 0.95 0.85 0.89 0.82 0.87 0.82 0.83 0.90 0.89 0.92 0.81
448 Clothing and clothing access. stores . . . . . . 3.28 3.20 2.66 2.92 2.55 2.73 2.84 2.49 2.99 2.99 2.61 1.35
452 General merchandise stores . . . . . . . . . . . . 2.60 2.63 2.25 2.41 2.13 2.18 2.25 2.11 2.56 2.48 2.17 1.244521 Department stores . . . . . . . . . . . . . . . . 2.96 2.92 2.46 2.65 2.34 2.41 2.52 2.29 2.83 2.75 2.32 1.27
ADJUSTED1
Inventories/sales ratios
Retail trade, total . . . . . . . . . . . . . . . 1.65 1.65 1.64 1.65 1.68 1.66 1.65 1.64 1.65 1.65 1.64 1.65Total (excl. motor vehicle and parts
dealers) . . . . . . . . . . . . . . . . . . . 1.60 1.59 1.57 1.59 1.60 1.59 1.59 1.57 1.58 1.58 1.57 1.59
441 Motor vehicle and parts dealers . . . . . . . . . 1.82 1.81 1.81 1.83 1.89 1.85 1.82 1.81 1.83 1.86 1.82 1.82
442,443
Furniture, home furnishings, electronics, andappliance stores . . . . . . . . . . . . . . . . . . . 1.98 1.95 1.92 1.87 1.90 1.89 1.89 1.83 1.83 1.84 1.81 1.79
444 Building mat. and garden equip. and suppliesdealers . . . . . . . . . . . . . . . . . . . . . . . . . 1.77 1.73 1.70 1.72 1.72 1.73 1.72 1.73 1.73 1.72 1.73 1.74
445 Food and beverage stores . . . . . . . . . . . . . 0.87 0.87 0.87 0.87 0.87 0.87 0.87 0.87 0.87 0.87 0.87 0.87
448 Clothing and clothing access. stores . . . . . . 2.60 2.61 2.56 2.65 2.65 2.61 2.58 2.56 2.59 2.61 2.56 2.57
452 General merchandise stores . . . . . . . . . . . . 2.20 2.21 2.20 2.21 2.21 2.20 2.16 2.14 2.16 2.12 2.12 2.174521 Department stores . . . . . . . . . . . . . . . . 2.39 2.40 2.40 2.41 2.40 2.40 2.36 2.33 2.36 2.33 2.32 2.38
See footnotes at end of table.
29
U.S. Census Bureau

Table 4. Unadjusted and Adjusted Estimates of End-of-Month Retail Inventories andInventories/Sales Ratios by Kinds of Business: January 1992 Through December2001—Con.
[Inventory estimates are shown in millions of dollars. Estimates are based on data from the Monthly Retail Trade Survey, Annual Retail Trade Survey,and administrative records and have been adjusted using results of the most recent economic census]
NAICScode Kind of business
1996
Jan. Feb. Mar. Apr. May Jun. Jul. Aug. Sept. Oct. Nov. Dec.
UNADJUSTED
Retail inventories, total . . . . . . . . . . . 322,053 326,929 329,003 331,173 330,262 325,997 325,445 328,082 338,085 359,690 364,953 335,110
Total (excl. motor vehicle and partsdealers) . . . . . . . . . . . . . . . . . . . 223,634 226,835 231,176 233,699 232,514 229,445 233,961 237,321 245,434 262,431 265,599 233,084
441 Motor vehicle and parts dealers . . . . . . . . . 98,419 100,094 97,827 97,474 97,748 96,552 91,484 90,761 92,651 97,259 99,354 102,026
442,443
Furniture, home furnishings, electronics, andappliance stores . . . . . . . . . . . . . . . . . . . 21,185 21,323 21,561 22,096 22,115 21,765 22,004 22,590 23,620 25,586 25,599 22,270
444 Building mat. and garden equip. and suppliesdealers . . . . . . . . . . . . . . . . . . . . . . . . . 30,736 31,379 32,428 32,763 32,901 32,356 31,920 31,187 31,198 31,511 31,649 31,468
445 Food and beverage stores . . . . . . . . . . . . . 28,707 28,327 28,441 28,537 28,398 28,246 28,494 28,367 28,959 30,316 30,928 30,254
448 Clothing and clothing access. stores . . . . . . 26,480 27,707 28,748 28,420 27,869 27,617 29,126 30,081 30,983 33,446 33,975 27,447
452 General merchandise stores . . . . . . . . . . . . 54,807 56,054 57,555 58,023 57,636 56,781 58,269 60,276 64,301 70,116 71,514 56,1114521 Department stores . . . . . . . . . . . . . . . . 39,646 40,791 41,861 42,179 41,813 41,098 42,101 43,669 46,474 50,714 51,912 40,533
ADJUSTED1
Retail inventories, total . . . . . . . . . . . 330,307 330,879 328,399 328,884 331,471 332,024 336,080 337,890 338,873 341,134 340,113 340,335Total (excl. motor vehicle and parts
dealers) . . . . . . . . . . . . . . . . . . . 234,043 234,793 235,176 236,151 236,664 236,255 238,385 239,077 239,147 241,282 241,595 241,389
441 Motor vehicle and parts dealers . . . . . . . . . 96,264 96,086 93,223 92,733 94,807 95,769 97,695 98,813 99,726 99,852 98,518 98,946
442,443
Furniture, home furnishings, electronics, andappliance stores . . . . . . . . . . . . . . . . . . . 21,885 22,328 22,389 22,686 22,846 22,578 22,755 22,934 22,999 23,092 22,594 22,495
444 Building mat. and garden equip. and suppliesdealers . . . . . . . . . . . . . . . . . . . . . . . . . 31,236 31,192 31,331 31,503 31,727 31,941 32,080 31,791 31,965 32,056 32,262 32,374
445 Food and beverage stores . . . . . . . . . . . . . 28,582 28,683 28,622 28,863 28,897 28,698 28,989 28,978 29,119 29,389 29,477 29,582
448 Clothing and clothing access. stores . . . . . . 29,357 29,351 29,425 28,941 28,820 28,858 29,068 29,262 29,092 29,572 30,227 29,866
452 General merchandise stores . . . . . . . . . . . . 59,548 59,329 59,369 59,368 59,486 59,791 60,421 60,913 60,728 60,735 60,799 60,4514521 Department stores . . . . . . . . . . . . . . . . 43,140 43,074 43,156 43,084 43,106 43,352 43,719 44,155 43,926 43,908 44,031 43,772
UNADJUSTED
Inventories/sales ratios
Retail trade, total . . . . . . . . . . . . . . . 1.89 1.85 1.69 1.69 1.58 1.63 1.62 1.58 1.75 1.75 1.77 1.39Total (excl. motor vehicle and parts
dealers) . . . . . . . . . . . . . . . . . . . 1.79 1.79 1.67 1.66 1.54 1.58 1.61 1.56 1.74 1.74 1.68 1.20
441 Motor vehicle and parts dealers . . . . . . . . . 2.16 1.99 1.74 1.78 1.66 1.74 1.64 1.62 1.79 1.77 2.04 2.18
442,443
Furniture, home furnishings, electronics, andappliance stores . . . . . . . . . . . . . . . . . . . 2.07 2.13 1.96 2.08 1.98 1.98 1.97 1.92 2.10 2.17 2.02 1.46
444 Building mat. and garden equip. and suppliesdealers . . . . . . . . . . . . . . . . . . . . . . . . . 2.20 2.20 2.01 1.74 1.62 1.66 1.63 1.64 1.74 1.61 1.82 1.94
445 Food and beverage stores . . . . . . . . . . . . . 0.90 0.92 0.86 0.88 0.82 0.84 0.83 0.81 0.90 0.90 0.91 0.83
448 Clothing and clothing access. stores . . . . . . 3.44 3.07 2.77 2.68 2.44 2.61 2.85 2.48 2.91 2.97 2.63 1.37
452 General merchandise stores . . . . . . . . . . . . 2.89 2.70 2.44 2.44 2.20 2.26 2.42 2.26 2.66 2.66 2.30 1.264521 Department stores . . . . . . . . . . . . . . . . 3.23 2.96 2.65 2.64 2.40 2.47 2.67 2.44 2.89 2.90 2.43 1.28
ADJUSTED1
Inventories/sales ratios
Retail trade, total . . . . . . . . . . . . . . . 1.71 1.69 1.66 1.66 1.66 1.66 1.68 1.69 1.68 1.67 1.67 1.67Total (excl. motor vehicle and parts
dealers) . . . . . . . . . . . . . . . . . . . 1.65 1.64 1.63 1.62 1.62 1.60 1.62 1.62 1.61 1.61 1.61 1.60
441 Motor vehicle and parts dealers . . . . . . . . . 1.88 1.82 1.75 1.78 1.80 1.82 1.86 1.90 1.86 1.84 1.85 1.86
442,443
Furniture, home furnishings, electronics, andappliance stores . . . . . . . . . . . . . . . . . . . 1.98 2.02 1.97 1.98 1.98 1.96 1.99 1.98 1.95 1.96 1.95 1.95
444 Building mat. and garden equip. and suppliesdealers . . . . . . . . . . . . . . . . . . . . . . . . . 1.84 1.83 1.84 1.83 1.81 1.78 1.79 1.76 1.77 1.76 1.76 1.83
445 Food and beverage stores . . . . . . . . . . . . . 0.86 0.87 0.86 0.87 0.87 0.86 0.86 0.86 0.87 0.87 0.87 0.88
448 Clothing and clothing access. stores . . . . . . 2.65 2.58 2.57 2.53 2.52 2.51 2.57 2.57 2.52 2.54 2.66 2.61
452 General merchandise stores . . . . . . . . . . . . 2.35 2.32 2.32 2.28 2.28 2.29 2.30 2.30 2.28 2.26 2.27 2.244521 Department stores . . . . . . . . . . . . . . . . 2.52 2.49 2.51 2.45 2.45 2.47 2.48 2.48 2.45 2.44 2.45 2.41
See footnotes at end of table.
30
U.S. Census Bureau
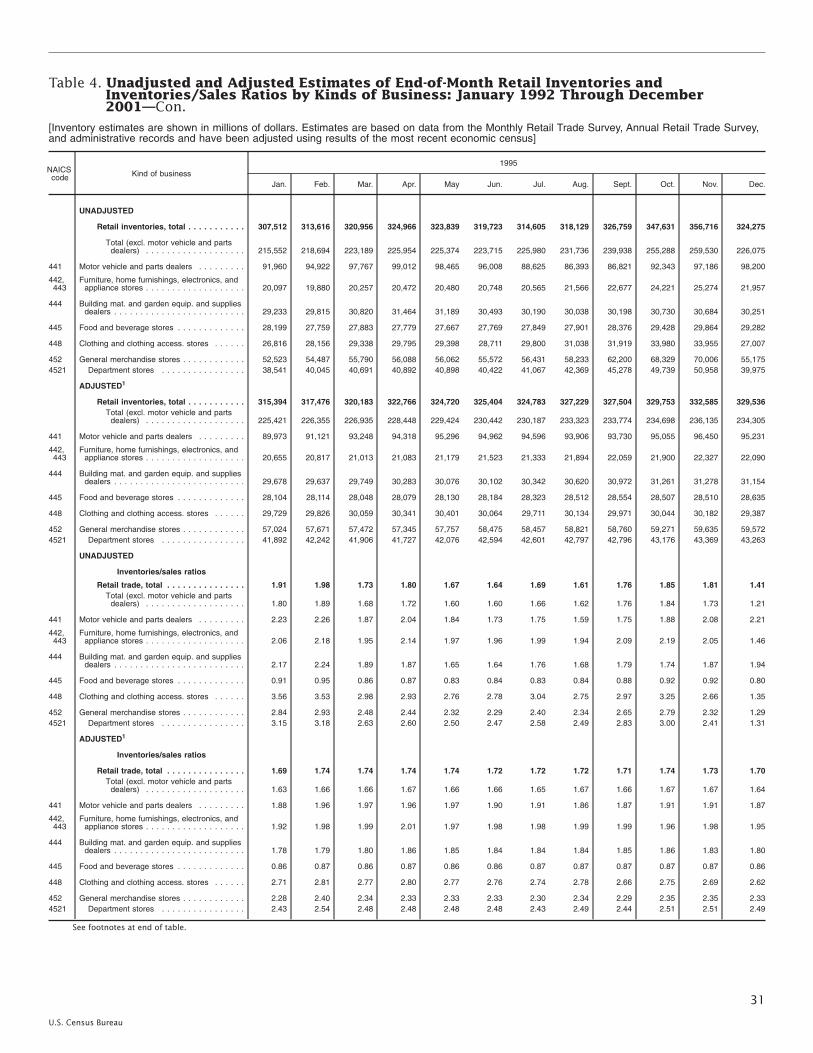
Table 4. Unadjusted and Adjusted Estimates of End-of-Month Retail Inventories andInventories/Sales Ratios by Kinds of Business: January 1992 Through December2001—Con.
[Inventory estimates are shown in millions of dollars. Estimates are based on data from the Monthly Retail Trade Survey, Annual Retail Trade Survey,and administrative records and have been adjusted using results of the most recent economic census]
NAICScode Kind of business
1995
Jan. Feb. Mar. Apr. May Jun. Jul. Aug. Sept. Oct. Nov. Dec.
UNADJUSTED
Retail inventories, total . . . . . . . . . . . 307,512 313,616 320,956 324,966 323,839 319,723 314,605 318,129 326,759 347,631 356,716 324,275
Total (excl. motor vehicle and partsdealers) . . . . . . . . . . . . . . . . . . . 215,552 218,694 223,189 225,954 225,374 223,715 225,980 231,736 239,938 255,288 259,530 226,075
441 Motor vehicle and parts dealers . . . . . . . . . 91,960 94,922 97,767 99,012 98,465 96,008 88,625 86,393 86,821 92,343 97,186 98,200
442,443
Furniture, home furnishings, electronics, andappliance stores . . . . . . . . . . . . . . . . . . . 20,097 19,880 20,257 20,472 20,480 20,748 20,565 21,566 22,677 24,221 25,274 21,957
444 Building mat. and garden equip. and suppliesdealers . . . . . . . . . . . . . . . . . . . . . . . . . 29,233 29,815 30,820 31,464 31,189 30,493 30,190 30,038 30,198 30,730 30,684 30,251
445 Food and beverage stores . . . . . . . . . . . . . 28,199 27,759 27,883 27,779 27,667 27,769 27,849 27,901 28,376 29,428 29,864 29,282
448 Clothing and clothing access. stores . . . . . . 26,816 28,156 29,338 29,795 29,398 28,711 29,800 31,038 31,919 33,980 33,955 27,007
452 General merchandise stores . . . . . . . . . . . . 52,523 54,487 55,790 56,088 56,062 55,572 56,431 58,233 62,200 68,329 70,006 55,1754521 Department stores . . . . . . . . . . . . . . . . 38,541 40,045 40,691 40,892 40,898 40,422 41,067 42,369 45,278 49,739 50,958 39,975
ADJUSTED1
Retail inventories, total . . . . . . . . . . . 315,394 317,476 320,183 322,766 324,720 325,404 324,783 327,229 327,504 329,753 332,585 329,536Total (excl. motor vehicle and parts
dealers) . . . . . . . . . . . . . . . . . . . 225,421 226,355 226,935 228,448 229,424 230,442 230,187 233,323 233,774 234,698 236,135 234,305
441 Motor vehicle and parts dealers . . . . . . . . . 89,973 91,121 93,248 94,318 95,296 94,962 94,596 93,906 93,730 95,055 96,450 95,231
442,443
Furniture, home furnishings, electronics, andappliance stores . . . . . . . . . . . . . . . . . . . 20,655 20,817 21,013 21,083 21,179 21,523 21,333 21,894 22,059 21,900 22,327 22,090
444 Building mat. and garden equip. and suppliesdealers . . . . . . . . . . . . . . . . . . . . . . . . . 29,678 29,637 29,749 30,283 30,076 30,102 30,342 30,620 30,972 31,261 31,278 31,154
445 Food and beverage stores . . . . . . . . . . . . . 28,104 28,114 28,048 28,079 28,130 28,184 28,323 28,512 28,554 28,507 28,510 28,635
448 Clothing and clothing access. stores . . . . . . 29,729 29,826 30,059 30,341 30,401 30,064 29,711 30,134 29,971 30,044 30,182 29,387
452 General merchandise stores . . . . . . . . . . . . 57,024 57,671 57,472 57,345 57,757 58,475 58,457 58,821 58,760 59,271 59,635 59,5724521 Department stores . . . . . . . . . . . . . . . . 41,892 42,242 41,906 41,727 42,076 42,594 42,601 42,797 42,796 43,176 43,369 43,263
UNADJUSTED
Inventories/sales ratios
Retail trade, total . . . . . . . . . . . . . . . 1.91 1.98 1.73 1.80 1.67 1.64 1.69 1.61 1.76 1.85 1.81 1.41Total (excl. motor vehicle and parts
dealers) . . . . . . . . . . . . . . . . . . . 1.80 1.89 1.68 1.72 1.60 1.60 1.66 1.62 1.76 1.84 1.73 1.21
441 Motor vehicle and parts dealers . . . . . . . . . 2.23 2.26 1.87 2.04 1.84 1.73 1.75 1.59 1.75 1.88 2.08 2.21
442,443
Furniture, home furnishings, electronics, andappliance stores . . . . . . . . . . . . . . . . . . . 2.06 2.18 1.95 2.14 1.97 1.96 1.99 1.94 2.09 2.19 2.05 1.46
444 Building mat. and garden equip. and suppliesdealers . . . . . . . . . . . . . . . . . . . . . . . . . 2.17 2.24 1.89 1.87 1.65 1.64 1.76 1.68 1.79 1.74 1.87 1.94
445 Food and beverage stores . . . . . . . . . . . . . 0.91 0.95 0.86 0.87 0.83 0.84 0.83 0.84 0.88 0.92 0.92 0.80
448 Clothing and clothing access. stores . . . . . . 3.56 3.53 2.98 2.93 2.76 2.78 3.04 2.75 2.97 3.25 2.66 1.35
452 General merchandise stores . . . . . . . . . . . . 2.84 2.93 2.48 2.44 2.32 2.29 2.40 2.34 2.65 2.79 2.32 1.294521 Department stores . . . . . . . . . . . . . . . . 3.15 3.18 2.63 2.60 2.50 2.47 2.58 2.49 2.83 3.00 2.41 1.31
ADJUSTED1
Inventories/sales ratios
Retail trade, total . . . . . . . . . . . . . . . 1.69 1.74 1.74 1.74 1.74 1.72 1.72 1.72 1.71 1.74 1.73 1.70Total (excl. motor vehicle and parts
dealers) . . . . . . . . . . . . . . . . . . . 1.63 1.66 1.66 1.67 1.66 1.66 1.65 1.67 1.66 1.67 1.67 1.64
441 Motor vehicle and parts dealers . . . . . . . . . 1.88 1.96 1.97 1.96 1.97 1.90 1.91 1.86 1.87 1.91 1.91 1.87
442,443
Furniture, home furnishings, electronics, andappliance stores . . . . . . . . . . . . . . . . . . . 1.92 1.98 1.99 2.01 1.97 1.98 1.98 1.99 1.99 1.96 1.98 1.95
444 Building mat. and garden equip. and suppliesdealers . . . . . . . . . . . . . . . . . . . . . . . . . 1.78 1.79 1.80 1.86 1.85 1.84 1.84 1.84 1.85 1.86 1.83 1.80
445 Food and beverage stores . . . . . . . . . . . . . 0.86 0.87 0.86 0.87 0.86 0.86 0.87 0.87 0.87 0.87 0.87 0.86
448 Clothing and clothing access. stores . . . . . . 2.71 2.81 2.77 2.80 2.77 2.76 2.74 2.78 2.66 2.75 2.69 2.62
452 General merchandise stores . . . . . . . . . . . . 2.28 2.40 2.34 2.33 2.33 2.33 2.30 2.34 2.29 2.35 2.35 2.334521 Department stores . . . . . . . . . . . . . . . . 2.43 2.54 2.48 2.48 2.48 2.48 2.43 2.49 2.44 2.51 2.51 2.49
See footnotes at end of table.
31
U.S. Census Bureau

Table 4. Unadjusted and Adjusted Estimates of End-of-Month Retail Inventories andInventories/Sales Ratios by Kinds of Business: January 1992 Through December2001—Con.
[Inventory estimates are shown in millions of dollars. Estimates are based on data from the Monthly Retail Trade Survey, Annual Retail Trade Survey,and administrative records and have been adjusted using results of the most recent economic census]
NAICScode Kind of business
1994
Jan. Feb. Mar. Apr. May Jun. Jul. Aug. Sept. Oct. Nov. Dec.
UNADJUSTED
Retail inventories, total . . . . . . . . . . . 277,177 282,371 287,937 290,407 293,122 293,437 289,765 295,444 306,565 324,318 332,189 306,881
Total (excl. motor vehicle and partsdealers) . . . . . . . . . . . . . . . . . . . 198,912 202,529 207,046 209,265 210,584 211,026 213,022 217,500 226,032 240,991 244,696 216,294
441 Motor vehicle and parts dealers . . . . . . . . . 78,265 79,842 80,891 81,142 82,538 82,411 76,743 77,944 80,533 83,327 87,493 90,587
442,443
Furniture, home furnishings, electronics, andappliance stores . . . . . . . . . . . . . . . . . . . 18,135 17,842 17,764 18,315 18,572 18,717 18,629 19,356 20,602 22,630 23,307 20,696
444 Building mat. and garden equip. and suppliesdealers . . . . . . . . . . . . . . . . . . . . . . . . . 26,786 27,942 28,708 28,951 29,359 28,773 28,402 28,453 28,031 28,464 28,742 28,641
445 Food and beverage stores . . . . . . . . . . . . . 27,621 27,155 27,569 27,279 27,224 27,503 27,453 27,300 27,912 28,920 29,370 28,694
448 Clothing and clothing access. stores . . . . . . 25,282 26,472 27,388 27,825 27,559 27,536 28,832 29,905 31,127 33,204 33,280 27,237
452 General merchandise stores . . . . . . . . . . . . 47,610 49,367 51,193 52,111 52,772 52,727 52,758 54,514 58,847 64,219 65,603 52,3514521 Department stores . . . . . . . . . . . . . . . . 35,879 37,232 38,418 39,128 39,517 39,341 39,385 40,607 43,779 47,586 48,487 38,502
ADJUSTED1
Retail inventories, total . . . . . . . . . . . 284,468 286,300 287,394 288,953 294,085 298,570 298,647 303,569 307,516 307,770 309,657 312,019Total (excl. motor vehicle and parts
dealers) . . . . . . . . . . . . . . . . . . . 207,723 209,567 210,228 211,535 214,332 217,318 216,955 218,978 220,289 221,726 222,824 224,204
441 Motor vehicle and parts dealers . . . . . . . . . 76,745 76,733 77,166 77,418 79,753 81,252 81,692 84,591 87,227 86,044 86,833 87,815
442,443
Furniture, home furnishings, electronics, andappliance stores . . . . . . . . . . . . . . . . . . . 18,543 18,683 18,370 18,901 19,226 19,416 19,365 19,671 20,041 20,554 20,626 20,717
444 Building mat. and garden equip. and suppliesdealers . . . . . . . . . . . . . . . . . . . . . . . . . 27,194 27,748 27,684 27,864 28,284 28,404 28,545 29,004 28,779 28,956 29,299 29,527
445 Food and beverage stores . . . . . . . . . . . . . 27,533 27,504 27,723 27,564 27,687 27,886 27,885 27,941 28,085 28,022 28,061 28,068
448 Clothing and clothing access. stores . . . . . . 28,029 28,042 28,119 28,306 28,499 28,864 28,746 28,978 29,255 29,384 29,556 29,605
452 General merchandise stores . . . . . . . . . . . . 51,624 52,295 52,627 53,188 54,307 55,443 54,614 55,023 55,608 55,767 55,975 56,6344521 Department stores . . . . . . . . . . . . . . . . 38,914 39,316 39,484 39,845 40,614 41,412 40,813 40,976 41,379 41,379 41,371 41,759
UNADJUSTED
Inventories/sales ratios
Retail trade, total . . . . . . . . . . . . . . . 1.87 1.89 1.63 1.67 1.63 1.61 1.64 1.59 1.72 1.78 1.77 1.36Total (excl. motor vehicle and parts
dealers) . . . . . . . . . . . . . . . . . . . 1.79 1.85 1.62 1.66 1.60 1.60 1.63 1.59 1.72 1.78 1.71 1.19
441 Motor vehicle and parts dealers . . . . . . . . . 2.11 2.00 1.63 1.68 1.73 1.65 1.65 1.59 1.71 1.77 1.97 2.10
442,443
Furniture, home furnishings, electronics, andappliance stores . . . . . . . . . . . . . . . . . . . 2.20 2.19 1.89 2.04 2.00 1.93 1.93 1.88 2.04 2.17 2.03 1.43
444 Building mat. and garden equip. and suppliesdealers . . . . . . . . . . . . . . . . . . . . . . . . . 2.27 2.33 1.87 1.72 1.61 1.61 1.72 1.63 1.67 1.69 1.82 1.87
445 Food and beverage stores . . . . . . . . . . . . . 0.91 0.95 0.86 0.87 0.84 0.84 0.82 0.84 0.87 0.91 0.92 0.79
448 Clothing and clothing access. stores . . . . . . 3.47 3.34 2.76 2.82 2.75 2.78 2.96 2.68 3.04 3.09 2.69 1.36
452 General merchandise stores . . . . . . . . . . . . 2.79 2.79 2.36 2.43 2.35 2.33 2.41 2.32 2.66 2.66 2.29 1.244521 Department stores . . . . . . . . . . . . . . . . 3.08 3.06 2.53 2.63 2.55 2.52 2.62 2.47 2.87 2.85 2.40 1.27
ADJUSTED1
Inventories/sales ratios
Retail trade, total . . . . . . . . . . . . . . . 1.66 1.65 1.63 1.63 1.67 1.68 1.68 1.68 1.69 1.67 1.68 1.69Total (excl. motor vehicle and parts
dealers) . . . . . . . . . . . . . . . . . . . 1.63 1.63 1.61 1.62 1.64 1.64 1.63 1.62 1.63 1.63 1.63 1.64
441 Motor vehicle and parts dealers . . . . . . . . . 1.76 1.73 1.70 1.69 1.79 1.79 1.81 1.84 1.87 1.79 1.81 1.84
442,443
Furniture, home furnishings, electronics, andappliance stores . . . . . . . . . . . . . . . . . . . 2.06 1.98 1.92 1.96 1.97 1.95 1.94 1.93 1.95 1.96 1.95 1.95
444 Building mat. and garden equip. and suppliesdealers . . . . . . . . . . . . . . . . . . . . . . . . . 1.82 1.85 1.78 1.75 1.79 1.79 1.79 1.80 1.77 1.77 1.80 1.79
445 Food and beverage stores . . . . . . . . . . . . . 0.87 0.87 0.87 0.86 0.87 0.87 0.87 0.87 0.87 0.87 0.87 0.87
448 Clothing and clothing access. stores . . . . . . 2.68 2.65 2.63 2.65 2.71 2.73 2.69 2.68 2.74 2.67 2.68 2.69
452 General merchandise stores . . . . . . . . . . . . 2.27 2.27 2.24 2.27 2.34 2.35 2.31 2.30 2.32 2.29 2.29 2.304521 Department stores . . . . . . . . . . . . . . . . 2.43 2.43 2.39 2.43 2.50 2.51 2.47 2.46 2.48 2.45 2.45 2.46
See footnotes at end of table.
32
U.S. Census Bureau

Table 4. Unadjusted and Adjusted Estimates of End-of-Month Retail Inventories andInventories/Sales Ratios by Kinds of Business: January 1992 Through December2001—Con.
[Inventory estimates are shown in millions of dollars. Estimates are based on data from the Monthly Retail Trade Survey, Annual Retail Trade Survey,and administrative records and have been adjusted using results of the most recent economic census]
NAICScode Kind of business
1993
Jan. Feb. Mar. Apr. May Jun. Jul. Aug. Sept. Oct. Nov. Dec.
UNADJUSTED
Retail inventories, total . . . . . . . . . . . 261,978 267,666 275,998 277,250 275,362 272,495 270,280 270,374 279,000 295,901 303,929 281,039
Total (excl. motor vehicle and partsdealers) . . . . . . . . . . . . . . . . . . . 189,346 192,291 198,420 200,031 198,907 197,040 200,065 202,557 210,435 223,258 226,932 201,333
441 Motor vehicle and parts dealers . . . . . . . . . 72,632 75,375 77,578 77,219 76,455 75,455 70,215 67,817 68,565 72,643 76,997 79,706
442,443
Furniture, home furnishings, electronics, andappliance stores . . . . . . . . . . . . . . . . . . . 16,059 15,650 16,134 16,243 16,319 16,600 16,834 17,158 18,052 19,233 20,077 18,490
444 Building mat. and garden equip. and suppliesdealers . . . . . . . . . . . . . . . . . . . . . . . . . 25,280 26,056 26,942 27,020 27,006 26,504 26,016 25,846 25,684 26,077 26,212 26,131
445 Food and beverage stores . . . . . . . . . . . . . 27,445 27,096 27,387 27,438 27,171 27,188 26,966 26,752 27,238 28,279 28,648 28,048
448 Clothing and clothing access. stores . . . . . . 25,092 26,287 27,145 27,416 27,053 26,766 28,329 29,049 30,131 31,652 31,750 25,941
452 General merchandise stores . . . . . . . . . . . . 46,560 48,087 50,978 51,657 50,982 49,665 50,747 52,276 55,917 61,037 62,457 49,3344521 Department stores . . . . . . . . . . . . . . . . 35,653 36,876 39,010 39,342 38,957 37,824 38,600 39,747 42,409 46,100 47,153 37,232
ADJUSTED1
Retail inventories, total . . . . . . . . . . . 268,951 271,591 275,274 275,872 276,149 277,045 278,405 277,403 279,417 280,751 283,315 285,906Total (excl. motor vehicle and parts
dealers) . . . . . . . . . . . . . . . . . . . 197,646 199,025 201,314 202,184 202,465 202,835 203,745 203,942 205,094 205,571 206,897 208,676
441 Motor vehicle and parts dealers . . . . . . . . . 71,305 72,566 73,960 73,688 73,684 74,210 74,660 73,461 74,323 75,180 76,418 77,230
442,443
Furniture, home furnishings, electronics, andappliance stores . . . . . . . . . . . . . . . . . . . 16,353 16,405 16,667 16,780 16,911 17,202 17,499 17,455 17,577 17,532 17,799 18,453
444 Building mat. and garden equip. and suppliesdealers . . . . . . . . . . . . . . . . . . . . . . . . . 25,639 25,849 25,981 26,006 26,017 26,164 26,147 26,347 26,397 26,555 26,747 26,967
445 Food and beverage stores . . . . . . . . . . . . . 27,384 27,449 27,548 27,706 27,611 27,542 27,384 27,402 27,410 27,388 27,396 27,437
448 Clothing and clothing access. stores . . . . . . 27,818 27,817 27,898 27,890 27,976 28,086 28,216 28,121 28,319 28,035 28,197 28,166
452 General merchandise stores . . . . . . . . . . . . 50,444 50,956 52,310 52,666 52,407 52,185 52,536 52,749 52,865 53,043 53,429 53,4834521 Department stores . . . . . . . . . . . . . . . . 38,627 38,940 40,010 40,022 39,997 39,773 40,000 40,068 40,122 40,122 40,371 40,470
UNADJUSTED
Inventories/sales ratios
Retail trade, total . . . . . . . . . . . . . . . 1.87 1.95 1.77 1.71 1.65 1.63 1.61 1.61 1.72 1.77 1.75 1.34Total (excl. motor vehicle and parts
dealers) . . . . . . . . . . . . . . . . . . . 1.77 1.85 1.71 1.66 1.59 1.60 1.61 1.62 1.73 1.77 1.70 1.19
441 Motor vehicle and parts dealers . . . . . . . . . 2.21 2.25 1.94 1.85 1.81 1.72 1.60 1.60 1.67 1.77 1.94 2.01
442,443
Furniture, home furnishings, electronics, andappliance stores . . . . . . . . . . . . . . . . . . . 2.04 2.12 1.95 2.00 1.96 1.92 1.88 1.91 2.04 2.13 2.02 1.50
444 Building mat. and garden equip. and suppliesdealers . . . . . . . . . . . . . . . . . . . . . . . . . 2.31 2.31 1.99 1.79 1.67 1.65 1.71 1.70 1.73 1.75 1.81 1.85
445 Food and beverage stores . . . . . . . . . . . . . 0.91 0.96 0.90 0.89 0.85 0.87 0.81 0.85 0.89 0.90 0.93 0.80
448 Clothing and clothing access. stores . . . . . . 3.34 3.49 3.09 2.78 2.68 2.77 2.89 2.73 3.00 3.05 2.69 1.37
452 General merchandise stores . . . . . . . . . . . . 2.90 2.95 2.67 2.55 2.36 2.41 2.45 2.39 2.71 2.70 2.34 1.244521 Department stores . . . . . . . . . . . . . . . . 3.20 3.26 2.91 2.76 2.58 2.64 2.69 2.57 2.93 2.89 2.47 1.29
ADJUSTED1
Inventories/sales ratios
Retail trade, total . . . . . . . . . . . . . . . 1.67 1.70 1.74 1.70 1.69 1.69 1.68 1.67 1.68 1.67 1.67 1.67Total (excl. motor vehicle and parts
dealers) . . . . . . . . . . . . . . . . . . . 1.61 1.63 1.66 1.65 1.63 1.64 1.63 1.64 1.63 1.63 1.62 1.63
441 Motor vehicle and parts dealers . . . . . . . . . 1.85 1.94 2.01 1.89 1.85 1.87 1.82 1.79 1.81 1.81 1.79 1.78
442,443
Furniture, home furnishings, electronics, andappliance stores . . . . . . . . . . . . . . . . . . . 1.91 1.92 1.96 1.93 1.93 1.95 1.94 1.94 1.94 1.93 1.95 2.01
444 Building mat. and garden equip. and suppliesdealers . . . . . . . . . . . . . . . . . . . . . . . . . 1.85 1.84 1.90 1.86 1.82 1.84 1.83 1.83 1.83 1.83 1.80 1.80
445 Food and beverage stores . . . . . . . . . . . . . 0.88 0.88 0.88 0.89 0.88 0.88 0.87 0.88 0.88 0.87 0.87 0.87
448 Clothing and clothing access. stores . . . . . . 2.61 2.75 2.81 2.72 2.69 2.69 2.67 2.69 2.69 2.68 2.68 2.69
452 General merchandise stores . . . . . . . . . . . . 2.36 2.38 2.45 2.43 2.39 2.38 2.36 2.36 2.36 2.34 2.34 2.334521 Department stores . . . . . . . . . . . . . . . . 2.53 2.57 2.66 2.61 2.58 2.56 2.54 2.54 2.54 2.51 2.52 2.53
See footnotes at end of table.
33
U.S. Census Bureau

Table 4. Unadjusted and Adjusted Estimates of End-of-Month Retail Inventories andInventories/Sales Ratios by Kinds of Business: January 1992 Through December2001—Con.
[Inventory estimates are shown in millions of dollars. Estimates are based on data from the Monthly Retail Trade Survey, Annual Retail Trade Survey,and administrative records and have been adjusted using results of the most recent economic census]
NAICScode Kind of business
1992
Jan. Feb. Mar. Apr. May Jun. Jul. Aug. Sept. Oct. Nov. Dec.
UNADJUSTED
Retail inventories, total . . . . . . . . . . . 242,130 246,086 251,883 256,513 254,295 253,182 255,084 254,491 261,390 276,104 282,540 263,143
Total (excl. motor vehicle and partsdealers) . . . . . . . . . . . . . . . . . . . 177,463 179,670 184,210 187,254 185,181 184,595 188,702 190,324 197,257 209,170 212,120 189,491
441 Motor vehicle and parts dealers . . . . . . . . . 64,667 66,416 67,673 69,259 69,114 68,587 66,382 64,167 64,133 66,934 70,420 73,652
442,443
Furniture, home furnishings, electronics, andappliance stores . . . . . . . . . . . . . . . . . . . 14,162 13,964 14,600 14,814 14,939 14,935 15,046 15,278 15,923 17,051 17,754 16,597
444 Building mat. and garden equip. and suppliesdealers . . . . . . . . . . . . . . . . . . . . . . . . . 23,458 24,217 25,000 25,519 25,209 24,893 24,789 24,441 24,390 24,721 24,654 24,514
445 Food and beverage stores . . . . . . . . . . . . . 26,901 26,613 26,638 26,871 26,916 26,865 26,854 26,419 26,943 28,154 28,627 27,963
448 Clothing and clothing access. stores . . . . . . 22,694 24,124 24,795 25,350 25,018 24,742 26,446 27,524 28,116 29,772 30,260 25,307
452 General merchandise stores . . . . . . . . . . . . 43,649 44,172 46,186 47,378 45,795 45,464 47,235 48,061 51,678 56,470 57,173 45,6464521 Department stores . . . . . . . . . . . . . . . . 33,529 34,001 35,629 36,465 35,261 34,885 36,239 36,912 39,492 43,162 43,726 34,873
ADJUSTED1
Retail inventories, total . . . . . . . . . . . 248,628 249,868 251,273 255,335 255,031 257,298 262,760 261,143 261,924 262,212 263,712 267,808Total (excl. motor vehicle and parts
dealers) . . . . . . . . . . . . . . . . . . . 185,070 185,853 186,725 189,215 188,456 189,884 192,173 191,708 192,378 192,841 193,761 196,419
441 Motor vehicle and parts dealers . . . . . . . . . 63,558 64,015 64,548 66,120 66,575 67,414 70,587 69,435 69,546 69,371 69,951 71,389
442,443
Furniture, home furnishings, electronics, andappliance stores . . . . . . . . . . . . . . . . . . . 14,392 14,637 15,067 15,304 15,481 15,477 15,640 15,558 15,519 15,572 15,753 16,531
444 Building mat. and garden equip. and suppliesdealers . . . . . . . . . . . . . . . . . . . . . . . . . 23,815 24,001 24,085 24,561 24,286 24,574 24,914 24,914 25,093 25,174 25,183 25,324
445 Food and beverage stores . . . . . . . . . . . . . 26,843 26,987 26,798 27,141 27,354 27,189 27,269 27,082 27,110 27,262 27,394 27,361
448 Clothing and clothing access. stores . . . . . . 25,160 25,528 25,509 25,788 25,872 25,935 26,341 26,645 26,425 26,394 26,898 27,478
452 General merchandise stores . . . . . . . . . . . . 47,302 46,843 47,344 48,251 47,036 47,771 48,901 48,531 48,858 49,100 48,975 49,5844521 Department stores . . . . . . . . . . . . . . . . 36,326 35,942 36,505 37,058 36,165 36,682 37,553 37,247 37,362 37,598 37,501 37,988
UNADJUSTED
Inventories/sales ratios
Retail trade, total . . . . . . . . . . . . . . . 1.81 1.84 1.73 1.70 1.63 1.63 1.63 1.63 1.72 1.73 1.79 1.35Total (excl. motor vehicle and parts
dealers) . . . . . . . . . . . . . . . . . . . 1.72 1.76 1.68 1.65 1.56 1.59 1.61 1.59 1.72 1.72 1.70 1.18
441 Motor vehicle and parts dealers . . . . . . . . . 2.12 2.08 1.88 1.88 1.86 1.75 1.72 1.77 1.75 1.78 2.13 2.18
442,443
Furniture, home furnishings, electronics, andappliance stores . . . . . . . . . . . . . . . . . . . 1.94 1.96 1.92 1.97 1.94 1.86 1.84 1.89 2.00 2.05 2.02 1.49
444 Building mat. and garden equip. and suppliesdealers . . . . . . . . . . . . . . . . . . . . . . . . . 2.14 2.19 1.93 1.80 1.68 1.67 1.74 1.78 1.76 1.74 1.99 1.96
445 Food and beverage stores . . . . . . . . . . . . . 0.91 0.93 0.90 0.89 0.85 0.87 0.83 0.84 0.89 0.89 0.94 0.82
448 Clothing and clothing access. stores . . . . . . 3.26 3.20 2.92 2.70 2.61 2.69 2.90 2.61 2.93 2.90 2.70 1.37
452 General merchandise stores . . . . . . . . . . . . 2.91 2.76 2.57 2.51 2.28 2.42 2.54 2.34 2.76 2.69 2.28 1.224521 Department stores . . . . . . . . . . . . . . . . 3.26 3.02 2.76 2.71 2.47 2.61 2.77 2.50 2.96 2.88 2.41 1.28
ADJUSTED1
Inventories/sales ratios
Retail trade, total . . . . . . . . . . . . . . . 1.66 1.66 1.67 1.69 1.68 1.68 1.71 1.69 1.68 1.67 1.68 1.69Total (excl. motor vehicle and parts
dealers) . . . . . . . . . . . . . . . . . . . 1.60 1.60 1.61 1.62 1.61 1.61 1.63 1.61 1.61 1.61 1.61 1.61
441 Motor vehicle and parts dealers . . . . . . . . . 1.86 1.84 1.89 1.91 1.90 1.90 1.97 1.96 1.89 1.89 1.91 1.93
442,443
Furniture, home furnishings, electronics, andappliance stores . . . . . . . . . . . . . . . . . . . 1.84 1.84 1.89 1.89 1.91 1.88 1.90 1.91 1.90 1.90 1.91 1.99
444 Building mat. and garden equip. and suppliesdealers . . . . . . . . . . . . . . . . . . . . . . . . . 1.78 1.78 1.80 1.86 1.84 1.87 1.88 1.87 1.86 1.87 1.90 1.92
445 Food and beverage stores . . . . . . . . . . . . . 0.88 0.89 0.87 0.88 0.89 0.88 0.88 0.87 0.87 0.87 0.88 0.88
448 Clothing and clothing access. stores . . . . . . 2.59 2.64 2.62 2.62 2.65 2.60 2.66 2.63 2.59 2.60 2.66 2.64
452 General merchandise stores . . . . . . . . . . . . 2.38 2.32 2.34 2.39 2.32 2.35 2.43 2.36 2.36 2.36 2.32 2.274521 Department stores . . . . . . . . . . . . . . . . 2.58 2.48 2.51 2.56 2.48 2.51 2.60 2.53 2.52 2.52 2.50 2.48
1Inventory estimates are adjusted for seasonal variation and, in the case of sales for holiday and trading-day differences. Estimates are not adjusted for price changes.Note: Estimates exclude food services. Inventory estimates include data for auxiliary establishments; for example, warehouses servicing retail stores. Table A-1 provides estimated measures of
sampling variability. The introduction and appendixes give information on confidentiality protection, sampling error, nonsampling error, sample design, and definitions. Links to this information on theInternet may be found at www.census.gov/mrts/www/nrely.html.
34
U.S. Census Bureau
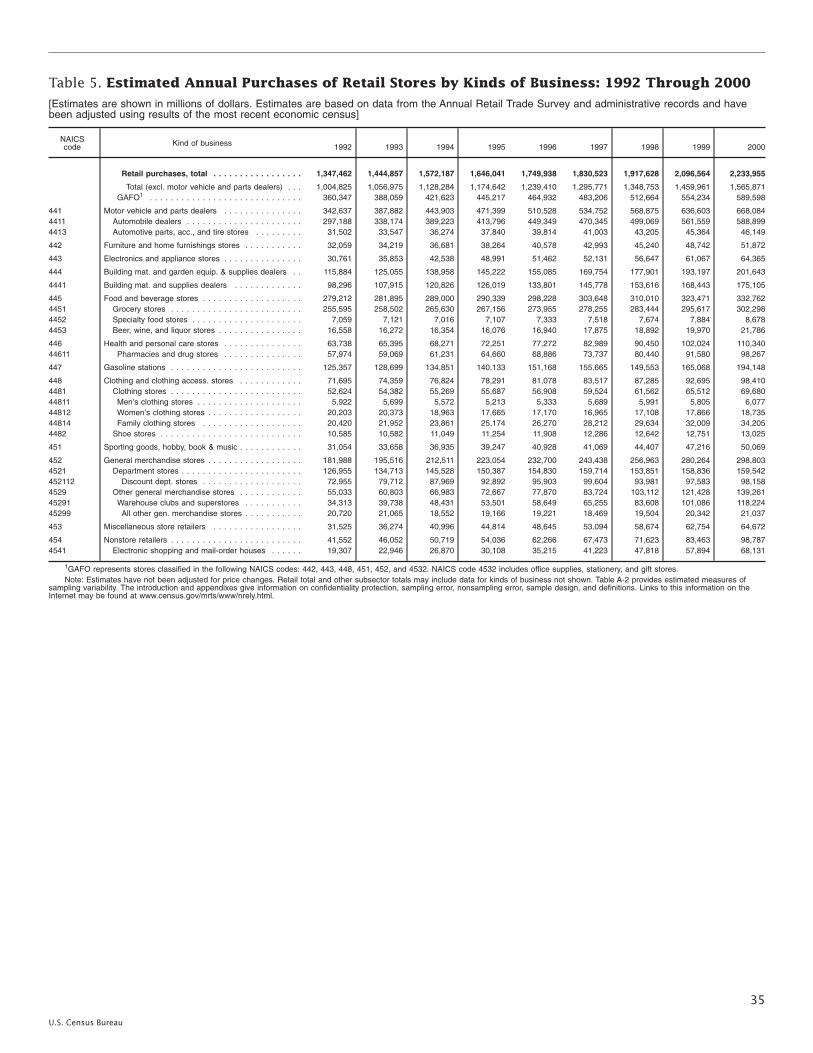
Table 5. Estimated Annual Purchases of Retail Stores by Kinds of Business: 1992 Through 2000
[Estimates are shown in millions of dollars. Estimates are based on data from the Annual Retail Trade Survey and administrative records and havebeen adjusted using results of the most recent economic census]
NAICScode Kind of business 1992 1993 1994 1995 1996 1997 1998 1999 2000
Retail purchases, total . . . . . . . . . . . . . . . . . 1,347,462 1,444,857 1,572,187 1,646,041 1,749,938 1,830,523 1,917,628 2,096,564 2,233,955
Total (excl. motor vehicle and parts dealers) . . . 1,004,825 1,056,975 1,128,284 1,174,642 1,239,410 1,295,771 1,348,753 1,459,961 1,565,871GAFO1 . . . . . . . . . . . . . . . . . . . . . . . . . . . . . 360,347 388,059 421,623 445,217 464,932 483,206 512,664 554,234 589,598
441 Motor vehicle and parts dealers . . . . . . . . . . . . . . . 342,637 387,882 443,903 471,399 510,528 534,752 568,875 636,603 668,0844411 Automobile dealers . . . . . . . . . . . . . . . . . . . . . . 297,188 338,174 389,223 413,796 449,349 470,345 499,069 561,559 588,8994413 Automotive parts, acc., and tire stores . . . . . . . . . 31,502 33,547 36,274 37,840 39,814 41,003 43,205 45,364 46,149
442 Furniture and home furnishings stores . . . . . . . . . . . 32,059 34,219 36,681 38,264 40,578 42,993 45,240 48,742 51,872
443 Electronics and appliance stores . . . . . . . . . . . . . . . 30,761 35,853 42,538 48,991 51,462 52,131 56,647 61,067 64,365
444 Building mat. and garden equip. & supplies dealers . . 115,884 125,055 138,958 145,222 155,085 169,754 177,901 193,197 201,643
4441 Building mat. and supplies dealers . . . . . . . . . . . . . 98,296 107,915 120,826 126,019 133,801 145,778 153,616 168,443 175,105
445 Food and beverage stores . . . . . . . . . . . . . . . . . . . 279,212 281,895 289,000 290,339 298,228 303,648 310,010 323,471 332,7624451 Grocery stores . . . . . . . . . . . . . . . . . . . . . . . . . 255,595 258,502 265,630 267,156 273,955 278,255 283,444 295,617 302,2984452 Specialty food stores . . . . . . . . . . . . . . . . . . . . . 7,059 7,121 7,016 7,107 7,333 7,518 7,674 7,884 8,6784453 Beer, wine, and liquor stores . . . . . . . . . . . . . . . . 16,558 16,272 16,354 16,076 16,940 17,875 18,892 19,970 21,786
446 Health and personal care stores . . . . . . . . . . . . . . . 63,738 65,395 68,271 72,251 77,272 82,989 90,450 102,024 110,34044611 Pharmacies and drug stores . . . . . . . . . . . . . . . 57,974 59,069 61,231 64,660 68,886 73,737 80,440 91,580 98,267
447 Gasoline stations . . . . . . . . . . . . . . . . . . . . . . . . . 125,357 128,699 134,851 140,133 151,168 155,665 149,553 165,068 194,148
448 Clothing and clothing access. stores . . . . . . . . . . . . 71,695 74,359 76,824 78,291 81,078 83,517 87,285 92,695 98,4104481 Clothing stores . . . . . . . . . . . . . . . . . . . . . . . . . 52,624 54,382 55,269 55,687 56,908 59,524 61,562 65,512 69,68044811 Men’s clothing stores . . . . . . . . . . . . . . . . . . . . 5,922 5,699 5,572 5,213 5,333 5,689 5,991 5,805 6,07744812 Women’s clothing stores . . . . . . . . . . . . . . . . . . 20,203 20,373 18,963 17,665 17,170 16,965 17,108 17,866 18,73544814 Family clothing stores . . . . . . . . . . . . . . . . . . . 20,420 21,952 23,861 25,174 26,270 28,212 29,634 32,009 34,2054482 Shoe stores . . . . . . . . . . . . . . . . . . . . . . . . . . . 10,585 10,582 11,049 11,254 11,908 12,286 12,642 12,751 13,025
451 Sporting goods, hobby, book & music . . . . . . . . . . . . 31,054 33,658 36,935 39,247 40,928 41,069 44,407 47,216 50,069
452 General merchandise stores . . . . . . . . . . . . . . . . . . 181,988 195,516 212,511 223,054 232,700 243,438 256,963 280,264 298,8034521 Department stores . . . . . . . . . . . . . . . . . . . . . . . 126,955 134,713 145,528 150,387 154,830 159,714 153,851 158,836 159,542452112 Discount dept. stores . . . . . . . . . . . . . . . . . . . 72,955 79,712 87,969 92,892 95,903 99,604 93,981 97,583 98,1584529 Other general merchandise stores . . . . . . . . . . . . 55,033 60,803 66,983 72,667 77,870 83,724 103,112 121,428 139,26145291 Warehouse clubs and superstores . . . . . . . . . . . 34,313 39,738 48,431 53,501 58,649 65,255 83,608 101,086 118,22445299 All other gen. merchandise stores . . . . . . . . . . . 20,720 21,065 18,552 19,166 19,221 18,469 19,504 20,342 21,037
453 Miscellaneous store retailers . . . . . . . . . . . . . . . . . 31,525 36,274 40,996 44,814 48,645 53,094 58,674 62,754 64,672
454 Nonstore retailers . . . . . . . . . . . . . . . . . . . . . . . . . 41,552 46,052 50,719 54,036 62,266 67,473 71,623 83,463 98,7874541 Electronic shopping and mail-order houses . . . . . . 19,307 22,946 26,870 30,108 35,215 41,223 47,818 57,894 68,131
1GAFO represents stores classified in the following NAICS codes: 442, 443, 448, 451, 452, and 4532. NAICS code 4532 includes office supplies, stationery, and gift stores.Note: Estimates have not been adjusted for price changes. Retail total and other subsector totals may include data for kinds of business not shown. Table A-2 provides estimated measures of
sampling variability. The introduction and appendixes give information on confidentiality protection, sampling error, nonsampling error, sample design, and definitions. Links to this information on theInternet may be found at www.census.gov/mrts/www/nrely.html.
35
U.S. Census Bureau

Table 6. Estimated Annual Gross Margin of Retail Stores by Kinds of Business: 1993 Through2000
[Estimates are shown in millions of dollars. Estimates are based on data from the Annual Retail Trade Survey and administrative records and havebeen adjusted using results of the most recent economic census]
NAICScode Kind of business 1993 1994 1995 1996 1997 1998 1999 2000
Retail gross margin, total . . . . . . . . . . . . . . . . . . 551,079 600,840 630,177 663,174 689,214 729,938 799,824 849,242
Total (excl. motor vehicle and parts dealers) . . . . . 450,958 483,767 505,950 534,625 559,232 597,477 642,724 687,473GAFO1 . . . . . . . . . . . . . . . . . . . . . . . . . . . . . . . . 194,395 206,750 213,276 221,891 234,067 254,241 274,806 289,870
441 Motor vehicle and parts dealers . . . . . . . . . . . . . . . . . . 100,121 117,073 124,227 128,549 129,982 132,461 157,100 161,7694411 Automobile dealers . . . . . . . . . . . . . . . . . . . . . . . . . 75,068 89,669 95,864 97,665 98,050 99,073 119,949 122,7344413 Automotive parts, acc., and tire stores . . . . . . . . . . . . 19,715 21,778 21,699 23,484 23,807 24,806 27,620 27,999
442 Furniture and home furnishings stores . . . . . . . . . . . . . . 24,463 26,888 27,414 29,326 31,455 33,903 37,114 40,309
443 Electronics and appliance stores . . . . . . . . . . . . . . . . . . 14,053 16,278 17,039 16,877 17,509 19,317 21,538 23,829
444 Building mat. and garden equip. & supplies dealers . . . . . 48,295 54,369 55,456 58,891 61,193 67,905 73,225 78,2454441 Building mat. and supplies dealers . . . . . . . . . . . . . . . 41,241 46,679 47,332 50,737 52,654 58,389 63,275 68,055
445 Food and beverage stores . . . . . . . . . . . . . . . . . . . . . . 93,630 96,911 101,561 104,764 106,860 112,808 121,207 126,1754451 Grocery stores . . . . . . . . . . . . . . . . . . . . . . . . . . . . 83,569 86,028 90,357 92,911 94,920 99,768 108,037 112,3994452 Specialty food stores . . . . . . . . . . . . . . . . . . . . . . . . 4,792 4,951 5,143 5,321 5,502 5,821 5,983 6,2184453 Beer, wine, and liquor stores . . . . . . . . . . . . . . . . . . . 5,269 5,932 6,061 6,532 6,438 7,219 7,187 7,558
446 Health and personal care stores . . . . . . . . . . . . . . . . . . 28,895 29,898 30,724 33,746 37,558 41,121 45,039 47,78944611 Pharmacies and drug stores . . . . . . . . . . . . . . . . . . . 21,160 21,444 21,558 23,581 26,369 28,992 32,558 33,367
447 Gasoline stations . . . . . . . . . . . . . . . . . . . . . . . . . . . . 33,794 36,791 41,297 43,761 44,262 42,468 45,114 50,890
448 Clothing and clothing access. stores . . . . . . . . . . . . . . . 51,264 53,799 53,084 56,222 58,275 63,320 68,223 71,3614481 Clothing stores . . . . . . . . . . . . . . . . . . . . . . . . . . . . 34,500 36,201 35,216 37,664 40,230 44,021 47,207 50,38644811 Men’s clothing stores . . . . . . . . . . . . . . . . . . . . . . . 4,217 4,470 3,911 4,185 4,435 4,782 4,656 4,82044812 Women’s clothing stores . . . . . . . . . . . . . . . . . . . . . 11,958 11,295 10,667 11,032 10,937 11,663 12,515 14,20544814 Family clothing stores . . . . . . . . . . . . . . . . . . . . . . 13,656 15,119 14,793 16,130 18,034 20,318 21,923 23,0624482 Shoe stores . . . . . . . . . . . . . . . . . . . . . . . . . . . . . . 7,942 8,425 8,478 8,708 8,633 9,035 9,135 8,756
451 Sporting goods, hobby, book & music stores . . . . . . . . . . 19,949 22,579 22,748 22,847 24,705 26,043 27,810 29,522
452 General merchandise stores . . . . . . . . . . . . . . . . . . . . . 74,260 75,784 80,359 83,634 88,112 95,748 103,666 108,1654521 Department stores . . . . . . . . . . . . . . . . . . . . . . . . . . 55,331 54,687 57,006 57,931 60,558 69,057 72,323 73,341452112 Discount dept. stores . . . . . . . . . . . . . . . . . . . . . . . 22,823 22,083 24,531 23,695 26,307 34,786 36,209 37,4224529 Other general merchandise stores . . . . . . . . . . . . . . . 18,929 21,097 23,353 25,703 27,554 26,691 31,343 34,82445291 Warehouse clubs and superstores . . . . . . . . . . . . . . 7,963 11,352 12,445 15,132 17,300 16,354 20,369 23,43045299 All other gen. merchandise stores . . . . . . . . . . . . . . 10,966 9,745 10,908 10,571 10,254 10,337 10,974 11,394
453 Miscellaneous store retailers . . . . . . . . . . . . . . . . . . . . 27,842 30,793 33,790 36,315 39,598 42,872 43,864 44,686
454 Nonstore retailers . . . . . . . . . . . . . . . . . . . . . . . . . . . . 34,513 39,677 42,478 48,242 49,705 51,972 55,924 66,5024541 Electronic shopping and mail-order houses . . . . . . . . . 18,226 21,043 23,076 26,939 30,013 32,386 35,929 42,864
1GAFO represents stores classified in the following NAICS codes: 442, 443, 448, 451, 452, and 4532. NAICS code 4532 includes office supplies, stationery, and gift stores.Note: Estimates have not been adjusted for price changes. Retail total and other subsector totals may include data for kinds of business not shown. Table A-2 provides estimated measures of
sampling variability. The introduction and appendixes give information on confidentiality protection, sampling error, nonsampling error, sample design, and definitions. Links to this information on theInternet may be found at www.census.gov/mrts/www/nrely.html.
36
U.S. Census Bureau

Table 7. Estimated Annual Gross Margin as a Percentage of Sales by Kinds of Business: 1993Through 2000
[Estimates are shown as percents. Estimates are based on data from the Annual Retail Trade Survey and administrative records and have beenadjusted using results of the most recent economic census]
NAICScode Kind of business 1993 1994 1995 1996 1997 1998 1999 2000
Retail gross margin, total . . . . . . . . . . . . . . . . . . 27.9 28.0 27.9 27.6 27.5 27.7 27.9 27.8
Total (excl. motor vehicle and parts dealers) . . . . . 30.1 30.3 30.3 30.3 30.3 30.9 30.8 30.7GAFO1 . . . . . . . . . . . . . . . . . . . . . . . . . . . . . . . . 33.9 33.4 32.7 32.4 32.7 33.3 33.4 33.2
441 Motor vehicle and parts dealers . . . . . . . . . . . . . . . . . . 20.8 21.3 21.1 20.2 19.7 18.9 20.1 19.84411 Automobile dealers . . . . . . . . . . . . . . . . . . . . . . . . . 18.4 19.1 19.1 17.9 17.3 16.6 17.9 17.54413 Automotive parts, acc., and tire stores . . . . . . . . . . . . 37.2 38.0 36.6 37.7 36.9 36.7 38.5 38.0
442 Furniture and home furnishings stores . . . . . . . . . . . . . . 42.2 42.8 41.8 42.2 42.5 43.1 43.6 44.1
443 Electronics and appliance stores . . . . . . . . . . . . . . . . . . 28.8 28.4 26.2 24.6 24.9 25.4 26.3 27.2
444 Building mat. and garden equip. & supplies dealers . . . . . 28.1 28.5 27.9 27.7 26.7 27.9 27.7 28.14441 Building mat. and supplies dealers . . . . . . . . . . . . . . . 27.9 28.2 27.5 27.7 26.7 27.8 27.6 28.2
445 Food and beverage stores . . . . . . . . . . . . . . . . . . . . . . 24.9 25.2 26.0 26.1 26.0 26.8 27.4 27.54451 Grocery stores . . . . . . . . . . . . . . . . . . . . . . . . . . . . 24.4 24.5 25.3 25.4 25.4 26.1 26.9 27.14452 Specialty food stores . . . . . . . . . . . . . . . . . . . . . . . . 40.2 41.4 42.0 42.1 42.3 43.3 43.3 41.94453 Beer, wine, and liquor stores . . . . . . . . . . . . . . . . . . . 24.3 26.7 27.4 28.0 26.6 28.1 26.6 26.0
446 Health and personal care stores . . . . . . . . . . . . . . . . . . 30.9 30.7 30.0 30.6 31.5 31.6 31.0 30.344611 Pharmacies and drug stores . . . . . . . . . . . . . . . . . . 26.5 26.1 25.1 25.7 26.7 26.8 26.5 25.4
447 Gasoline stations . . . . . . . . . . . . . . . . . . . . . . . . . . . . 20.8 21.5 22.8 22.5 22.1 22.1 21.5 20.8
448 Clothing and clothing access. stores . . . . . . . . . . . . . . . 41.0 41.6 40.3 41.1 41.5 42.4 42.7 42.64481 Clothing stores . . . . . . . . . . . . . . . . . . . . . . . . . . . . 38.9 39.9 38.5 39.9 40.8 42.0 42.0 42.544811 Men’s clothing stores . . . . . . . . . . . . . . . . . . . . . . . 42.3 44.5 42.0 43.8 44.0 45.0 44.2 44.544812 Women’s clothing stores . . . . . . . . . . . . . . . . . . . . . 36.9 36.9 37.1 39.0 39.3 40.7 41.4 43.744814 Family clothing stores . . . . . . . . . . . . . . . . . . . . . . 38.7 39.7 37.0 38.2 39.8 41.1 40.7 40.84482 Shoe stores . . . . . . . . . . . . . . . . . . . . . . . . . . . . . . 42.9 43.5 42.9 42.3 41.5 41.9 41.8 40.0
451 Sporting goods, hobby, book & music stores . . . . . . . . . . 38.1 39.2 37.3 35.7 37.7 37.5 37.6 37.8
452 General merchandise stores . . . . . . . . . . . . . . . . . . . . . 27.9 26.6 26.7 26.5 26.6 27.2 27.2 26.64521 Department stores . . . . . . . . . . . . . . . . . . . . . . . . . . 29.5 27.5 27.7 27.3 27.5 30.9 31.3 31.4452112 Discount dept. stores . . . . . . . . . . . . . . . . . . . . . . . 22.5 20.2 21.0 19.7 20.9 27.0 27.1 27.54529 Other general merchandise stores . . . . . . . . . . . . . . . 24.1 24.4 24.7 24.9 24.7 20.8 20.8 20.245291 Warehouse clubs and superstores . . . . . . . . . . . . . . 17.1 19.7 19.1 20.7 21.1 16.6 17.1 16.745299 All other gen. merchandise stores . . . . . . . . . . . . . . 34.5 34.1 36.9 35.1 34.8 35.1 35.2 35.3
453 Miscellaneous store retailers . . . . . . . . . . . . . . . . . . . . 44.5 43.6 43.8 43.2 43.2 43.0 41.5 41.0
454 Nonstore retailers . . . . . . . . . . . . . . . . . . . . . . . . . . . . 43.2 44.4 44.3 44.2 42.7 42.4 40.4 40.64541 Electronic shopping and mail-order houses . . . . . . . . . 44.8 44.7 43.8 44.0 42.8 40.7 38.7 39.0
1GAFO represents stores classified in the following NAICS codes: 442, 443, 448, 451, 452, and 4532. NAICS code 4532 includes office supplies, stationery, and gift stores.Note: Estimates have not been adjusted for price changes. Retail total and other subsector totals may include data for kinds of business not shown. Table A-3 provides estimated measures of
sampling variability. The introduction and appendixes give information on confidentiality protection, sampling error, nonsampling error, sample design, and definitions. Links to this information on theInternet may be found at www.census.gov/mrts/www/nrely.html.
37
U.S. Census Bureau

Table 8. Estimated End-of-Year Accounts Receivable of Retail Stores by Type of Account andKinds of Business: 2000 and 1999
[Estimates are shown in millions of dollars. Estimates are based on data from the Annual Retail Trade Survey and administrative records and havebeen adjusted using results of the most recent economic census]
NAICScode Kind of business
Total accountsreceivable
Type of account
ChargeInstallment
Total Open-end Closed-end2000 1999 2000 1999 2000 1999 2000 1999 2000 1999
Retail accounts receivables, total . . . . . . . . . 66,429 65,132 21,923 21,513 44,506 43,619 39,808 39,278 4,698 4,341
Total (excl. Motor vehicle and parts dealers) 57,022 56,144 16,691 16,451 40,331 39,693 37,221 36,873 3,110 2,820
441 Motor Vehicle and parts dealers . . . . . . . . . . . . . 9,407 8,988 5,232 5,062 4,175 3,926 2,587 2,405 1,588 1,521
442 Furniture, homes furnishings stores . . . . . . . . . . 4,009 3,899 930 925 3,079 2,974 1,902 1,833 1,177 1,141
443 Electronics and appliance stores . . . . . . . . . . . . 2,051 2,098 1,066 1,136 985 962 683 655 302 307
444 Building mat., garden equip. & supply stores . . . . 8,176 8,046 5,856 5,849 2,320 2,197 2,159 2,039 161 158
445 Food and beverage stores . . . . . . . . . . . . . . . . 1,109 1,122 598 608 511 514 438 442 73 72
446 Health and personal care stores . . . . . . . . . . . . . 2,629 2,354 1,585 1,458 S S S S S S
447 Gasoline stations . . . . . . . . . . . . . . . . . . . . . . . 1,484 1,484 928 928 556 556 530 529 26 27
448 Clothing access. stores . . . . . . . . . . . . . . . . . . 3,763 3,992 620 1,212 3,143 2,780 2,801 2,470 342 310
451 Sporting goods, hobby, book & music . . . . . . . . . 708 670 281 269 S S S S S S
452 General merchandise stores . . . . . . . . . . . . . . . 24,310 24,820 81 65 24,229 24,755 23,802 24,475 427 2804521 Department stores (ex. L.D.) . . . . . . . . . . . . . 24,118 24,653 44 37 24,074 24,616 23,690 24,380 384 236
453 Miscellaneous store retailers . . . . . . . . . . . . . . . 1,883 1,846 1,095 1,086 S 760 S 574 S 186
454 Nonstore retailers . . . . . . . . . . . . . . . . . . . . . . 6,900 5,813 3,651 2,915 3,249 2,898 2,992 2,693 257 205
S Estimate does not meet publication standards because of high sampling variability or poor response quality. Unpublished estimates derived from this table by subtraction are subject to thesesame limitations and should not be attributed to the U.S. Census Bureau.
Note: Estimates have not been adjusted for price changes. Retail total and other subsector totals may include data for kinds of business not shown. Table A-2 provides estimated measures ofsampling variability. The introduction and appendixes give information on confidentiality protection, sampling error, nonsampling error, sample design, and definitions. Links to this information on theInternet may be found at www.census.gov/mrts/www/nrely.html.
38
U.S. Census Bureau

Table 9. Estimated Per Capita Retail Sales by Selected Kinds of Business: 1992 Through 2001[Estimates are shown in dollars. Estimates are based on data from the Annual Retail Trade Survey, administrative records, and the Census Bureau’sPopulation Estimates Program1]
NAICScode Kind of business 1992 1993 1994 1995 1996 1997 1998 1999 2000 2001
Retail sales, total2 . . . . . . . . . . 7,259 7,673 8,248 8,595 9,057 9,371 9,747 10,518 10,843 11,123Total (excl. motor vehicle and
parts dealers) . . . . . . . . . . . . 5,582 5,804 6,135 6,358 6,662 6,904 7,159 7,658 7,949 8,112
441 Motor vehicle and parts dealers . . . . . . 1,677 1,870 2,113 2,237 2,395 2,467 2,588 2,860 2,895 3,011
442 Furniture and home furnishings stores . 216 225 241 249 262 277 291 312 324 321
443 Electronics and appliance stores . . . . . . 168 189 221 247 258 262 281 301 310 308
444 Building mat. and garden equip. andsupplies dealers . . . . . . . . . . . . . . . 628 666 733 757 802 857 901 968 986 1,045
445 Food and beverage stores . . . . . . . . . 1,456 1,456 1,480 1,489 1,516 1,532 1,560 1,623 1,628 1,659
446 Health and personal care stores . . . . . 356 363 374 390 415 445 482 533 558 598
447 Gasoline stations . . . . . . . . . . . . . . . 614 631 658 690 734 746 710 768 866 834
448 Clothing and clothing access. stores . . . 472 485 497 501 516 525 553 586 594 594
451 Sporting goods, hobby, book and musicstores . . . . . . . . . . . . . . . . . . . . . . 193 203 221 232 242 245 257 272 277 298
452 General merchandise stores . . . . . . . . 972 1,032 1,096 1,144 1,189 1,238 1,302 1,399 1,439 1,511
453 Miscellaneous store retailers . . . . . . . . 219 243 271 294 317 342 369 388 386 393
454 Nonstore retailers . . . . . . . . . . . . . . . 288 310 343 365 411 435 453 508 581 549
722 Food services and drinking places . . . . 798 838 867 889 916 964 1,009 1,047 1,085 1,126
1Time Series of National Population Estimates, U.S. Census Bureau, Population Division. Population estimates (in thousands) for July 1 of: 1992—255,030; 1993—257,783; 1994—260,327;1995—262,803; 1996—265,229; 1997—267,784; 1998—270,248; 1999—272,691; 2000—282,125; 2001—284,797. For additional information, see http://eire.census.gov/popest/estimates.php.
2Estimates for food services and drinking places not included in total retail.Note: Estimates have not been adjusted for price changes. Measures of sampling variability for these estimates have not been computed. The introduction and appendixes give information on con-
fidentiality protection, sampling error, nonsampling error, sample design, and definitions. Links to this information on the Internet may be found at www.census.gov/mrts/www/nrely.html.
39
U.S. Census Bureau
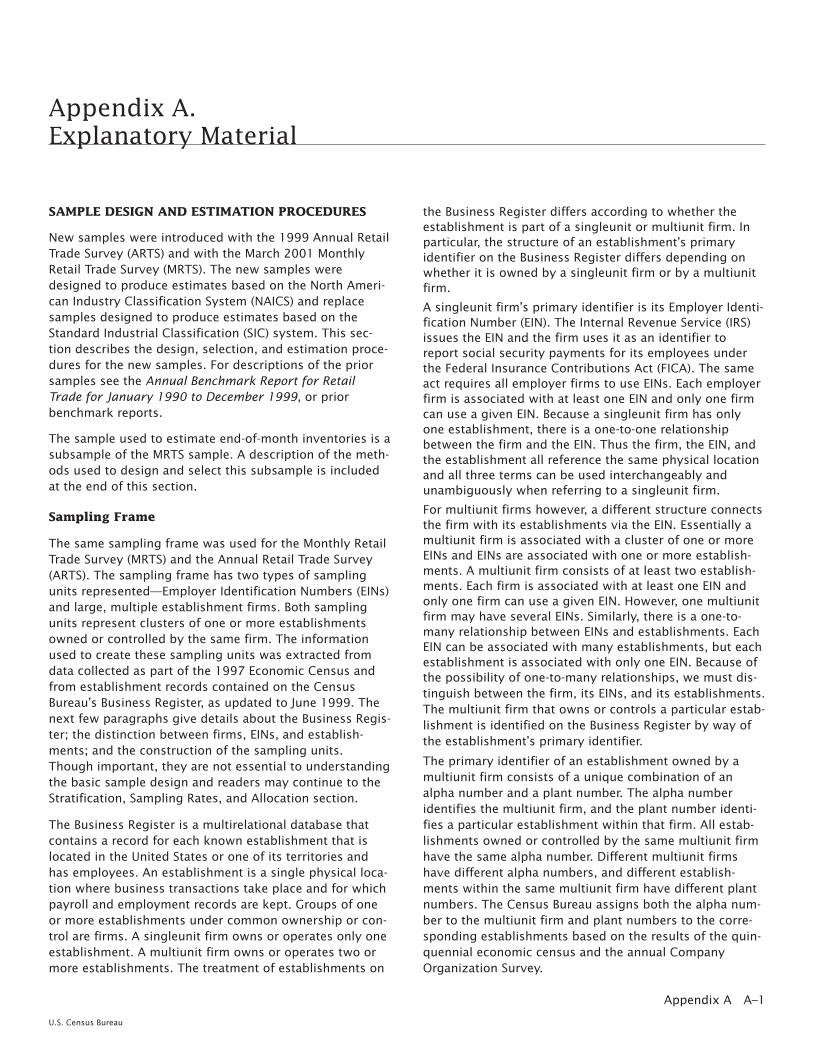
Appendix A.Explanatory Material
SAMPLE DESIGN AND ESTIMATION PROCEDURES
New samples were introduced with the 1999 Annual RetailTrade Survey (ARTS) and with the March 2001 MonthlyRetail Trade Survey (MRTS). The new samples weredesigned to produce estimates based on the North Ameri-can Industry Classification System (NAICS) and replacesamples designed to produce estimates based on theStandard Industrial Classification (SIC) system. This sec-tion describes the design, selection, and estimation proce-dures for the new samples. For descriptions of the priorsamples see the Annual Benchmark Report for RetailTrade for January 1990 to December 1999, or priorbenchmark reports.
The sample used to estimate end-of-month inventories is asubsample of the MRTS sample. A description of the meth-ods used to design and select this subsample is includedat the end of this section.
Sampling Frame
The same sampling frame was used for the Monthly RetailTrade Survey (MRTS) and the Annual Retail Trade Survey(ARTS). The sampling frame has two types of samplingunits represented—Employer Identification Numbers (EINs)and large, multiple establishment firms. Both samplingunits represent clusters of one or more establishmentsowned or controlled by the same firm. The informationused to create these sampling units was extracted fromdata collected as part of the 1997 Economic Census andfrom establishment records contained on the CensusBureau’s Business Register, as updated to June 1999. Thenext few paragraphs give details about the Business Regis-ter; the distinction between firms, EINs, and establish-ments; and the construction of the sampling units.Though important, they are not essential to understandingthe basic sample design and readers may continue to theStratification, Sampling Rates, and Allocation section.
The Business Register is a multirelational database thatcontains a record for each known establishment that islocated in the United States or one of its territories andhas employees. An establishment is a single physical loca-tion where business transactions take place and for whichpayroll and employment records are kept. Groups of oneor more establishments under common ownership or con-trol are firms. A singleunit firm owns or operates only oneestablishment. A multiunit firm owns or operates two ormore establishments. The treatment of establishments on
the Business Register differs according to whether theestablishment is part of a singleunit or multiunit firm. Inparticular, the structure of an establishment’s primaryidentifier on the Business Register differs depending onwhether it is owned by a singleunit firm or by a multiunitfirm.
A singleunit firm’s primary identifier is its Employer Identi-fication Number (EIN). The Internal Revenue Service (IRS)issues the EIN and the firm uses it as an identifier toreport social security payments for its employees underthe Federal Insurance Contributions Act (FICA). The sameact requires all employer firms to use EINs. Each employerfirm is associated with at least one EIN and only one firmcan use a given EIN. Because a singleunit firm has onlyone establishment, there is a one-to-one relationshipbetween the firm and the EIN. Thus the firm, the EIN, andthe establishment all reference the same physical locationand all three terms can be used interchangeably andunambiguously when referring to a singleunit firm.
For multiunit firms however, a different structure connectsthe firm with its establishments via the EIN. Essentially amultiunit firm is associated with a cluster of one or moreEINs and EINs are associated with one or more establish-ments. A multiunit firm consists of at least two establish-ments. Each firm is associated with at least one EIN andonly one firm can use a given EIN. However, one multiunitfirm may have several EINs. Similarly, there is a one-to-many relationship between EINs and establishments. EachEIN can be associated with many establishments, but eachestablishment is associated with only one EIN. Because ofthe possibility of one-to-many relationships, we must dis-tinguish between the firm, its EINs, and its establishments.The multiunit firm that owns or controls a particular estab-lishment is identified on the Business Register by way ofthe establishment’s primary identifier.
The primary identifier of an establishment owned by amultiunit firm consists of a unique combination of analpha number and a plant number. The alpha numberidentifies the multiunit firm, and the plant number identi-fies a particular establishment within that firm. All estab-lishments owned or controlled by the same multiunit firmhave the same alpha number. Different multiunit firmshave different alpha numbers, and different establish-ments within the same multiunit firm have different plantnumbers. The Census Bureau assigns both the alpha num-ber to the multiunit firm and plant numbers to the corre-sponding establishments based on the results of the quin-quennial economic census and the annual CompanyOrganization Survey.
Appendix A A–1
U.S. Census Bureau
To create the sampling frame, we extract the records forall establishments classified in the Retail Trade andAccommodation and Food Services sectors as defined bythe 1997 North American Industry Classification System(NAICS). For these establishments, we extract sales, pay-roll, employment, inventory, name and address informa-tion, as well as primary identifiers and, for establishmentsowned by multiunit firms, associated EINs. To create thesampling units for multiunit firms, we aggregate the eco-nomic data of the establishments owned by these firms toan EIN level by tabulating the establishment data for allextracted establishment records (i.e., establishments clas-sified in the Retail Trade and Accommodation and FoodServices sectors) associated with the same EIN. Similarlywe aggregate the data to a multiunit firm level by tabulat-ing the establishment data for all extracted establishmentrecords associated with the same alpha number. No aggre-gation is necessary to put singleunit establishment infor-mation on an EIN basis or a firm basis. Thus, the samplingunits created for singleunit firms simultaneously representestablishment, EIN, and firm information. In summary, thesampling frame is a complex amalgam of establishments,EINs, and firms.
Stratification, Sampling Rates, and Allocation
The primary stratification of the frame is by kind-of-business group based on the detail required for this publi-cation. We further stratify the sampling units within kind-of-business group (substratify) by a measure of sizerelated to their annual sales. Sampling units expected tohave a large effect on the precision of the estimates areselected ‘‘with certainty.’’ This means they are sure to beselected and will represent only themselves (i.e., have aselection probability of one and a sampling weight ofone). Within each kind-of-business stratum, we determineda substratum boundary (or cutoff) that divides the cer-tainty units from the noncertainty units. We based thesecutoffs on a statistical analysis of data from the 1997 Eco-nomic Census. Accordingly, these values are on a 1997sales basis. We also used this analysis to determine thenumber of size substrata for each kind-of-business stra-tum and to set preliminary sampling rates needed toachieve specified sampling variability objectives on salesestimates for different kind-of-business groups. The sizesubstrata and sampling rates were later updated throughan analysis of the sampling frame.
Sample Selection
The first step in the sample selection identified certaintyfirms. If a firm was selected with certainty and had morethan one establishment at the time of sampling, any newestablishments that the firm acquires, even if under newor different EINs, are included in the sample with certainty.However, if a singleunit firm was selected with certainty,only future establishments associated with that firm’s
originally-selected EIN are included in the sample with cer-tainty; any new EINs that might later be associated withthat firm are subjected to sampling through the quarterlybirth-selection procedure (see Sample Maintenance).
All firms not selected with certainty were subjected tosampling on an EIN basis. If a firm had more than one EIN,we treated each of its EINs as a separate sampling unit. Tobe eligible for the initial sampling, an EIN used by a single-unit firm had to have nonzero payroll in 1998. EINs usedby multiunit firms were required to have nonzero payrollin 1997. The EINs were stratified according to their majorkind of business and their estimated annual sales (on a1997 basis). Within each noncertainty stratum, a simplerandom sample of EINs was selected. We then assignedthe selected noncertainty EINs to one of two groups. Onegroup is canvassed for both the monthly and annual sur-veys, the other only for the annual survey. The maximumsampling weight for an EIN selected for the monthly sur-vey was 500. The maximum sampling weight for an EINselected for the annual survey was 250.
Sample Maintenance
Periodically, we update the samples to represent EINsissued since the initial sample selection. These new EINs,called births, are EINs recently assigned by the IRS on thelatest available IRS mailing list for FICA taxpayers andassigned a kind-of-business classification (if possible) bythe Social Security Administration (SSA).
EIN births are sampled on a quarterly basis using a two-phase selection procedure. To be eligible for selection, abirth must either have no kind-of-business classification orbe classified in a kind of business within the scope ofARTS, the Annual Trade Survey (ATS), or the Service AnnualSurvey (SAS), and it must meet certain criteria regardingits number of paid employees or quarterly payroll. In thefirst phase, births are stratified by kind of business and ameasure of size based on expected employment or quar-terly payroll. A relatively large sample is drawn and can-vassed to obtain a more reliable measure of size, consist-ing of sales in 2 recent months, and a new or moredetailed kind-of-business classification.
Using this more reliable information, the selected birthsfrom the first phase are subjected to probabilityproportional-to-size sampling with overall probabilitiesequivalent to those used in drawing the initial ARTS, ATS,and SAS samples from the June 1999 Business Register.Because of the time it takes for a new employer firm toacquire an EIN from the IRS, and because of the timeneeded to accomplish the two-phase birth-selection proce-dure, births are added to the samples approximately 9months after they begin operation.
The processing of the EIN births differs between themonthly (MRTS) and annual (ARTS) surveys. For the MRTS,EIN births selected in a quarter are added into the survey
A–2 Appendix A
U.S. Census Bureau

during the next quarter. Because births are not repre-sented in the monthly sample until they go through thetwo-phase selection procedure, an interim procedure isused to account for births during the period between theonset of activity and the time of birth selection. This con-sists of imputing data for all EINs selected in the monthlysample that go out of business, but are still on the IRSmailing list.
For the ARTS, EIN births that are selected in the quarterlybirth-selection procedure in November of the annual sur-vey year are included in the initial mailing of the ARTSquestionnaires in January of the following year. To betterrepresent all EIN births in the annual survey year, and spe-cifically to account for the time it takes to identify andselect new EINs, we add births to the annual sample thatare selected in February, May, and August of the year fol-lowing the annual survey year. We mail survey forms tothese births in June and August to supplement the initialannual survey mailing.
To be eligible for the sample canvass and tabulation, anEIN selected in the noncertainty sampling operations mustmeet both of the following requirements:
• It must be on the latest available IRS mailing list forFICA taxpayers from the previous quarter.
• It must have been selected from the Business Register ineither the initial sampling or during the quarterly birth-selection procedure.
EINs selected into the samples with certainty are notdropped from canvass and tabulation if they are no longeron the IRS mailing list. Rather, the firm that used the EIN iscontacted, and if a successor EIN is found, it is added tothe survey.
Estimation Procedures for Monthly Sales
The estimates of monthly sales published in this report arederived from data collected in the Monthly Retail TradeSurvey (MRTS). Each month, all firms selected with cer-tainty (sampling weight equal to 1) and one of the twogroups of noncertainty (sampling weight greater than 1)EINs are asked to report their sales data for the month justending. (As noted in the Sample Selection section, noncer-tainty EINs are assigned to one of two groups. One groupis canvassed for the monthly and annual survey, while theother group is canvassed only for the annual survey.) Esti-mates of monthly sales are computed as the sum ofweighted data (reported and imputed) for all selected sam-pling units that meet the tabulation criteria given in theSample Maintenance section. The weight for a given sam-pling unit is the reciprocal of its probability of selectioninto the MRTS sample. The monthly sales estimates arebenchmarked using the corresponding annual survey esti-mates and economic census results. See the Revisions toPreviously Published Estimates section located at thebeginning of this report for a description of the bench-marking procedures.
Estimation Procedures for Annual Totals
The annual sales, end-of-year inventories, purchases,accounts receivable, and gross margin estimates pub-lished in this report are derived from data collected in theAnnual Retail Trade Survey (ARTS). All firms selected withcertainty and both groups of noncertainty EINs are askedto report data for the previous year. (Two years of data arerequested in the year in which a new sample is intro-duced.) Estimates are computed as the sum of weighteddata (reported and imputed) for all selected sampling unitsthat meet the tabulation criteria given in the Sample Main-tenance section. The weight for a given sampling unit isthe reciprocal of its probability of selection into the ARTSsample. Because both groups of noncertainty EINs are can-vassed for the annual survey, the annual estimates haveless sampling variability than the corresponding monthlyestimates. The annual estimates presented in this reporthave been adjusted using results of the most recent eco-nomic census.
The estimates of total inventory published in this reportare on a non-LIFO basis. For those firms that reportedinventory on a LIFO (last-in, first-out) basis, the LIFOreserve amount is added to the LIFO value to get inventoryon a non-LIFO basis. In the annual survey, sampling unitsthat used a LIFO cost basis for all or part of their inventorywere asked to report LIFO reserves.
The estimates of gross margin represent sales minus thecost of goods sold (see Definition of Terms section) andare computed as a function of weighted sales, inventories,and purchased data from the ARTS.
SUBSAMPLE TO ESTIMATE END-OF-MONTHINVENTORIES
The sample used to estimate end-of-month inventories(the inventory sample) is a subset of the units used to esti-mate monthly sales (the sales sample). This section high-lights differences between the design of the inventory andsales samples.
Sampling Frame
The inventory sample is a subsample of the sales sample.Unlike the sales sample, the inventory sample is designedto produce estimates of end-of-month inventories forestablishments classified in only the Retail Trade sector. Itis not designed to produce inventory estimates for theAccommodation and Food Services sector. The samplingframe for the inventory sample is a subset of the salessample and has the same types of sampling units as thesales frame—large, multiple-establishment firms and EINs.Descriptions of these sampling units were given in theSampling Frame section.
Stratification, Sampling Rates, and Allocation
Sampling units are stratified by their major kind of busi-ness. The stratification used for the inventory sample isbased on groupings of three-digit and four-digit North
Appendix A A–3
U.S. Census Bureau

American Industry Classification System (NAICS) codes.Less detailed kind-of-business groupings are used to pro-duce estimates of end-of-month inventories than the kind-of-business groupings that are used to produce monthlysales estimates. Therefore, the stratification for the inven-tory sample is more broad than the stratification used forthe sales sample. Sampling units are assigned to substratabased on a measure of size related to their annual sales.The measure of size used for the inventory sample isslightly different from that used for the sales sample,because the inventory sample is designed to measureinventories of retail establishments only (i.e., establish-ments classified in the Accommodation and Food Servicessector are not measured). Sampling rates for the inventorysample are computed using the same methods asdescribed for the sales sample.
Sample Selection
The selection of the inventory sample is carried out inde-pendently within each size substratum contained in akind-of-business stratum. The actual selection procedurefollows a systematic, probability proportional-to-sizescheme. Because the inventory sample is a subsample thatwas designed independently of the sales sample, it is pos-sible that some units were selected in the sales sample ata lower sampling rate than desired for the inventorysample. Such a unit is included in the inventory sampleand is assigned a sampling weight equal to the unit’s salessampling weight. The maximum sampling weight for anEIN selected for the inventory sample was 1,000.
Sample Maintenance
The inventory sample is updated in the same manner andat the same time as the sales sample. The births selectedfor the inventory sample are a subsample of the birthsselected for the sales sample. These births are selectedusing sampling rates equivalent to those used in selectingthe initial inventory sample.
Estimation Procedures for End-of-MonthInventories
The procedures described in the Estimation Procedures forMonthly Sales are followed, except the sampling weightfor the inventory sample is used when computing end-of-month inventory estimates. Because the inventory sampleis a subsample of the sales sample, the sampling weightfor the inventory sample is greater than or equal to thesampling weight for the sales sample.
RELIABILITY OF THE ESTIMATES
The total error of an estimate based on a sample survey isthe difference between the estimate and the true popula-tion value that it estimates. This error may be consideredto be comprised of sampling error and nonsampling error.Sampling error is the difference between the estimate and
the result that would be obtained from a complete censusconducted under the same survey conditions. This erroroccurs because characteristics differ among samplingunits and because only a subset of the entire population ismeasured in a sample survey. Nonsampling error encom-passes all other factors that contribute to the total error ofa sample survey estimate. The accuracy of a survey resultmay be affected by these two types of errors.
Sampling and nonsampling errors are often measured bythe quantities, bias, and variance. The bias of an estimatorof an unknown population value is the difference, aver-aged over all possible samples of the same size anddesign, between the estimator and the unknown popula-tion value. Any systematic error, or inaccuracy that affectsall samples of a specified design in a similar way, may biasthe resulting estimates. The variance of an estimator is thesquared difference, averaged over all possible samples ofthe same size and design, between the estimator and itsaverage value.
Descriptions of sampling and nonsampling errors for theMonthly Retail Trade Survey (MRTS) and the Annual RetailTrade Survey (ARTS) are provided in the following sec-tions.
Sampling Error
Because the estimates are based on a sample, exact agree-ment with results that would be obtained from a completeenumeration of firms represented on the sampling frameusing the same enumeration procedures is not expected.However, because each firm represented on the samplingframe has a known probability of being selected into thesample, it is possible to estimate the sampling variabilityof the survey estimates.
The particular sample used in this survey is one of a largenumber of samples of the same size, that could have beenselected using the same design. If all possible sampleshad been surveyed under the same conditions, an esti-mate of an unknown population value could have beenobtained from each sample. These samples give rise to adistribution of estimates for the unknown populationvalue. A statistical measure of the variability among theseestimates is the standard error, which can be approxi-mated from any one sample. The standard error is definedas the square root of the variance. The coefficient of varia-tion (or relative standard error) of an estimator is thestandard error of the estimator divided by the estimator.Note that measures of sampling variability, such as thestandard error and coefficient of variation, are estimatedfrom the sample and are also subject to sampling variabil-ity. (Technically, we should refer to the estimated standarderror or the estimated coefficient of variation of an estima-tor. However, for the sake of brevity, we have omitted thisdetail.) It is important to note that the standard error andcoefficient of variation only measure sampling variability.
A–4 Appendix A
U.S. Census Bureau

They do not measure any systematic biases in the esti-mates. Table A-1 provides the minimum, maximum, andmedian measures of sampling variability for estimates ofmonthly sales, end-of-month inventories, andinventory/sales ratios for each kind of business. Theranges and medians shown in Table A-1 are based on finalMRTS estimates for January 2001 through December2001. Measures of sampling variability for estimates ofannual sales, end-of-year inventories, purchases, accountsreceivables, inventory/sales ratios, and gross margin-to-sales ratios for each kind of business are provided inTables A-2 and A-3. These measures of sampling variabil-ity are based on 2000 ARTS data, adjusted using results ofthe 1997 Economic Census. (All measures of samplingvariability are expressed as percents.) The Census Bureaurecommends that individuals using estimates contained inthis report incorporate this information into their analysis,as sampling error could affect the conclusions drawn fromthese estimates.
The estimate from a particular sample and the standarderror associated with the estimate can be used to con-struct a confidence interval. A confidence interval is arange about a given estimator that has a specified prob-ability of containing the result of a complete enumeration.Associated with each interval is a percentage of confi-dence, which is interpreted as follows. If, for each possiblesample, an estimate of an unknown population value andits approximate standard error were obtained, then:
1. For approximately 90 percent of the possible samples,the interval from 1.65 standard errors below to 1.65standard errors above the estimate would include theresult of a complete enumeration.
2. For approximately 95 percent of the possible samples,the interval from two standard errors below to twostandard errors above the estimate would include theresult of a complete enumeration.
To illustrate the computation of a confidence interval foran estimate of total sales, assume that an estimate of totalsales is $10,750 million and the coefficient of variation forthis estimate is 1.8 percent, or 0.018. First obtain thestandard error of the estimate by multiplying the totalsales estimate by its coefficient of variation. For thisexample, multiply $10,750 million by 0.018. This yields astandard error of $193.5 million. The upper and lowerbounds of the 90-percent confidence interval are com-puted as $10,750 million plus or minus 1.65 times $193.5million. Consequently, the 90-percent confidence intervalis $10,431 million to $11,069 million. If correspondingconfidence intervals were constructed for all possible
samples of the same size and design, approximately 9 outof 10 (90 percent) of these intervals would contain theresult obtained from a complete enumeration.
Nonsampling Errors
Nonsampling error encompasses all other factors that con-tribute to the total error of a sample survey estimate andmay also occur in censuses. It is often helpful to think ofnonsampling error as arising from deficiencies or mistakesin the survey process. In the MRTS and the ARTS, nonsam-pling error can be attributed to many sources: inability toobtain information about all units in the sample; responseerrors; differences in the interpretation of the questions;mistakes in coding or keying the data obtained; and othererrors of collection, response, coverage, and processing.Additional nonsampling error may have been introducedby the method used to adjust the survey estimates usingresults of the 1997 Economic Census. Although no directmeasurement of the potential biases due to nonsamplingerror has been obtained, precautionary steps were takenin all phases of the collection, processing, and tabulationof the data in an effort to minimize their influence. TheCensus Bureau recommends that individuals using esti-mates in this report incorporate this information into theiranalyses, as nonsampling error could affect the conclu-sions drawn from these estimates.
A potential source of bias in the estimates is nonresponse.Nonresponse is defined as the inability to obtain all theintended measurements or responses about all selectedunits. Two types of nonresponse are often distinguished.Unit nonresponse is used to describe the inability toobtain any of the substantive measurements about asampled unit. In most cases of unit nonresponse, thequestionnaire was never returned to the Census Bureau,after several attempts to elicit a response. Item nonre-sponse occurs either when a question is unanswered orthe response to the question fails computer or analystedits.
For both unit and item nonresponse, a missing value isreplaced by a predicted value obtained from an appropri-ate model for nonresponse. This procedure is called impu-tation and uses survey data and administrative records asinput. In any given month, imputed data amounts to about20 percent of the total monthly retail and food servicessales estimate and about 28 percent of the total retail end-of-month inventory estimate. For the annual survey,imputed data amounts to about 6 percent of the totalretail and food services sales estimate, about 15 percentof the total retail end-of-year inventory estimate, approxi-mately 15 of the total accounts receivables estimate, andnearly 23 percent of the total purchases estimate.
Appendix A A–5
U.S. Census Bureau
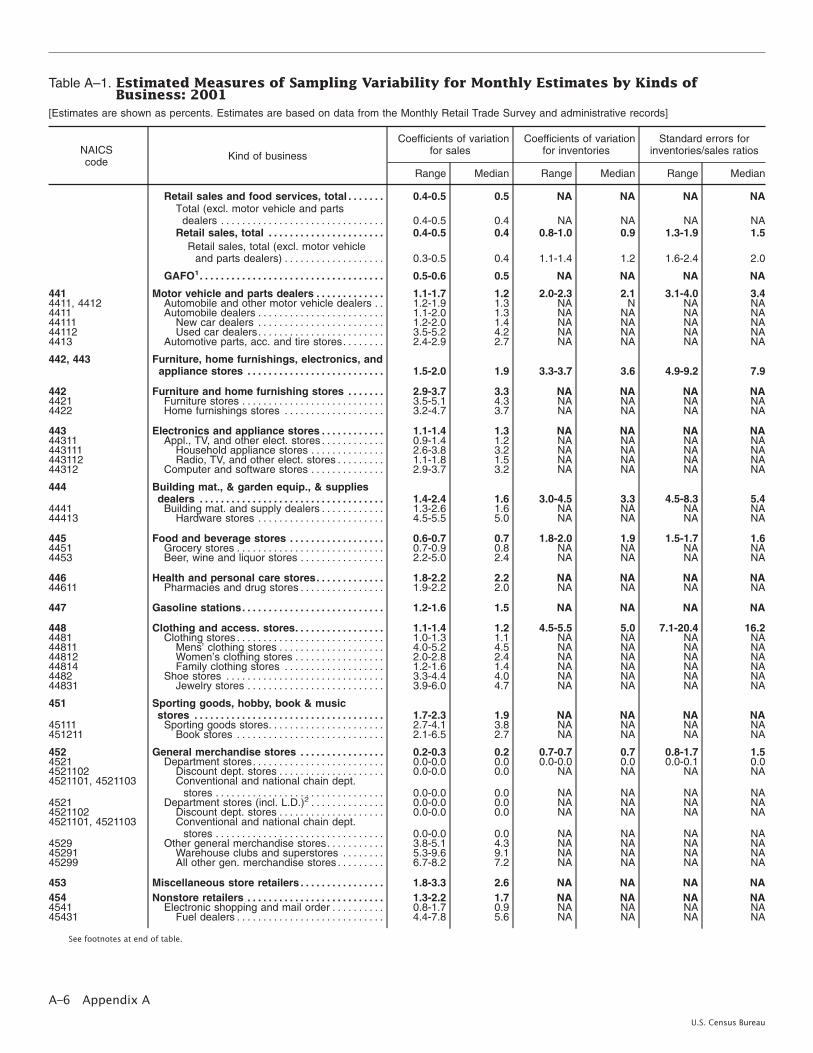
Table A–1. Estimated Measures of Sampling Variability for Monthly Estimates by Kinds ofBusiness: 2001
[Estimates are shown as percents. Estimates are based on data from the Monthly Retail Trade Survey and administrative records]
NAICScode Kind of business
Coefficients of variationfor sales
Coefficients of variationfor inventories
Standard errors forinventories/sales ratios
Range Median Range Median Range Median
Retail sales and food services, total . . . . . . . 0.4-0.5 0.5 NA NA NA NATotal (excl. motor vehicle and parts
dealers . . . . . . . . . . . . . . . . . . . . . . . . . . . . . . . 0.4-0.5 0.4 NA NA NA NARetail sales, total . . . . . . . . . . . . . . . . . . . . . . 0.4-0.5 0.4 0.8-1.0 0.9 1.3-1.9 1.5
Retail sales, total (excl. motor vehicleand parts dealers) . . . . . . . . . . . . . . . . . . . 0.3-0.5 0.4 1.1-1.4 1.2 1.6-2.4 2.0
GAFO1. . . . . . . . . . . . . . . . . . . . . . . . . . . . . . . . . . . 0.5-0.6 0.5 NA NA NA NA
441 Motor vehicle and parts dealers . . . . . . . . . . . . . 1.1-1.7 1.2 2.0-2.3 2.1 3.1-4.0 3.44411, 4412 Automobile and other motor vehicle dealers . . 1.2-1.9 1.3 NA N NA NA4411 Automobile dealers . . . . . . . . . . . . . . . . . . . . . . . . 1.1-2.0 1.3 NA NA NA NA44111 New car dealers . . . . . . . . . . . . . . . . . . . . . . . . 1.2-2.0 1.4 NA NA NA NA44112 Used car dealers. . . . . . . . . . . . . . . . . . . . . . . . 3.5-5.2 4.2 NA NA NA NA4413 Automotive parts, acc. and tire stores. . . . . . . . 2.4-2.9 2.7 NA NA NA NA
442, 443 Furniture, home furnishings, electronics, andappliance stores . . . . . . . . . . . . . . . . . . . . . . . . . . 1.5-2.0 1.9 3.3-3.7 3.6 4.9-9.2 7.9
442 Furniture and home furnishing stores . . . . . . . 2.9-3.7 3.3 NA NA NA NA4421 Furniture stores . . . . . . . . . . . . . . . . . . . . . . . . . . . 3.5-5.1 4.3 NA NA NA NA4422 Home furnishings stores . . . . . . . . . . . . . . . . . . . 3.2-4.7 3.7 NA NA NA NA
443 Electronics and appliance stores . . . . . . . . . . . . 1.1-1.4 1.3 NA NA NA NA44311 Appl., TV, and other elect. stores . . . . . . . . . . . . 0.9-1.4 1.2 NA NA NA NA443111 Household appliance stores . . . . . . . . . . . . . . 2.6-3.8 3.2 NA NA NA NA443112 Radio, TV, and other elect. stores . . . . . . . . . 1.1-1.8 1.5 NA NA NA NA44312 Computer and software stores . . . . . . . . . . . . . . 2.9-3.7 3.2 NA NA NA NA
444 Building mat., & garden equip., & suppliesdealers . . . . . . . . . . . . . . . . . . . . . . . . . . . . . . . . . . . 1.4-2.4 1.6 3.0-4.5 3.3 4.5-8.3 5.4
4441 Building mat. and supply dealers . . . . . . . . . . . . 1.3-2.6 1.6 NA NA NA NA44413 Hardware stores . . . . . . . . . . . . . . . . . . . . . . . . 4.5-5.5 5.0 NA NA NA NA
445 Food and beverage stores . . . . . . . . . . . . . . . . . . 0.6-0.7 0.7 1.8-2.0 1.9 1.5-1.7 1.64451 Grocery stores . . . . . . . . . . . . . . . . . . . . . . . . . . . . 0.7-0.9 0.8 NA NA NA NA4453 Beer, wine and liquor stores . . . . . . . . . . . . . . . . 2.2-5.0 2.4 NA NA NA NA
446 Health and personal care stores. . . . . . . . . . . . . 1.8-2.2 2.2 NA NA NA NA44611 Pharmacies and drug stores . . . . . . . . . . . . . . . . 1.9-2.2 2.0 NA NA NA NA
447 Gasoline stations. . . . . . . . . . . . . . . . . . . . . . . . . . . 1.2-1.6 1.5 NA NA NA NA
448 Clothing and access. stores. . . . . . . . . . . . . . . . . 1.1-1.4 1.2 4.5-5.5 5.0 7.1-20.4 16.24481 Clothing stores . . . . . . . . . . . . . . . . . . . . . . . . . . . . 1.0-1.3 1.1 NA NA NA NA44811 Mens’ clothing stores . . . . . . . . . . . . . . . . . . . . 4.0-5.2 4.5 NA NA NA NA44812 Women’s clothing stores . . . . . . . . . . . . . . . . . 2.0-2.8 2.4 NA NA NA NA44814 Family clothing stores . . . . . . . . . . . . . . . . . . . 1.2-1.6 1.4 NA NA NA NA4482 Shoe stores . . . . . . . . . . . . . . . . . . . . . . . . . . . . . . 3.3-4.4 4.0 NA NA NA NA44831 Jewelry stores . . . . . . . . . . . . . . . . . . . . . . . . . . 3.9-6.0 4.7 NA NA NA NA
451 Sporting goods, hobby, book & musicstores . . . . . . . . . . . . . . . . . . . . . . . . . . . . . . . . . . . . 1.7-2.3 1.9 NA NA NA NA
45111 Sporting goods stores. . . . . . . . . . . . . . . . . . . . . . 2.7-4.1 3.8 NA NA NA NA451211 Book stores . . . . . . . . . . . . . . . . . . . . . . . . . . . . 2.1-6.5 2.7 NA NA NA NA
452 General merchandise stores . . . . . . . . . . . . . . . . 0.2-0.3 0.2 0.7-0.7 0.7 0.8-1.7 1.54521 Department stores. . . . . . . . . . . . . . . . . . . . . . . . . 0.0-0.0 0.0 0.0-0.0 0.0 0.0-0.1 0.04521102 Discount dept. stores . . . . . . . . . . . . . . . . . . . . 0.0-0.0 0.0 NA NA NA NA4521101, 4521103 Conventional and national chain dept.
stores . . . . . . . . . . . . . . . . . . . . . . . . . . . . . . . . 0.0-0.0 0.0 NA NA NA NA4521 Department stores (incl. L.D.)2 . . . . . . . . . . . . . . 0.0-0.0 0.0 NA NA NA NA4521102 Discount dept. stores . . . . . . . . . . . . . . . . . . . . 0.0-0.0 0.0 NA NA NA NA4521101, 4521103 Conventional and national chain dept.
stores . . . . . . . . . . . . . . . . . . . . . . . . . . . . . . . . 0.0-0.0 0.0 NA NA NA NA4529 Other general merchandise stores. . . . . . . . . . . 3.8-5.1 4.3 NA NA NA NA45291 Warehouse clubs and superstores . . . . . . . . 5.3-9.6 9.1 NA NA NA NA45299 All other gen. merchandise stores . . . . . . . . . 6.7-8.2 7.2 NA NA NA NA
453 Miscellaneous store retailers . . . . . . . . . . . . . . . . 1.8-3.3 2.6 NA NA NA NA454 Nonstore retailers . . . . . . . . . . . . . . . . . . . . . . . . . . 1.3-2.2 1.7 NA NA NA NA4541 Electronic shopping and mail order . . . . . . . . . . 0.8-1.7 0.9 NA NA NA NA45431 Fuel dealers . . . . . . . . . . . . . . . . . . . . . . . . . . . . 4.4-7.8 5.6 NA NA NA NA
See footnotes at end of table.
A–6 Appendix A
U.S. Census Bureau

Table A–1. Estimated Measures of Sampling Variability for Monthly Estimates by Kinds ofBusiness: 2001—Con.
[Estimates are shown as percents. Estimates are based on data from the Monthly Retail Trade Survey and administrative records]
NAICScode Kind of business
Coefficients of variationfor sales
Coefficients of variationfor inventories
Standard errors forinventories/sales ratios
Range Median Range Median Range Median
722 Food services and drinking places . . . . . . . . . . 1.8-2.3 2.0 NA NA NA NA7221 Full-service restaurants . . . . . . . . . . . . . . . . . . . . 2.5-4.0 3.0 NA NA NA NA7222 Limited-service eating places . . . . . . . . . . . . . . . 2.8-3.7 3.1 NA NA NA NA7224 Drinking places . . . . . . . . . . . . . . . . . . . . . . . . . . . 2.6-4.9 4.0 NA NA NA NA
(NA) Not available.
1GAFO represents stores classified in the following NAICS codes: 442, 443, 448, 451, 452, and 4532. NAICS code 4532 includes office supplies,stationery, and gift stores.
2Includes data for leased departments operated within department stores. Data for this line are not included in any aggregate kind-of-businesstotals.
Note: Measures of sampling variability are based on estimates unadjusted for seasonal variation, holiday, or trading-day differences. The rangesand medians were computed using final monthly estimates for January 2001 to December 2001. The introduction and appendixes give information onconfidentiality protection, sampling error, nonsampling error, sample design, and definitions. Links to this information on the Internet may be found atwww.census.gov/mrts/www/nrely.html
Appendix A A–7
U.S. Census Bureau

Table A–2. Estimated Measures of Sampling Variability for Annual Sales, End-of-Year Inventories,and Purchases by Kinds of Business: 2000
[Estimates are shown as percents. Estimates are based on data from the 2000 Annual Retail Trade Survey and administrative records]
NAICScode Kind of business
Coefficients of variation for Standard errors for
Sales Inventories PurchasesInventories/sales ratio
Gross marginas a
percent ofsales
Retail trade, total . . . . . . . . . . . . . . . . . . . . . . . . . 0.4 0.6 0.5 0.1 0.1Total (excl. motor vehicle and part dealers). 0.4 0.4 0.3 0.0 0.1
GAFO1. . . . . . . . . . . . . . . . . . . . . . . . . . . . . . . . . . . 0.3 NP 0.3 NP 0.1441 Motor vehicle and parts dealers . . . . . . . . . . . . . 1.1 1.5 1.1 0.2 0.14411 Automobile dealers . . . . . . . . . . . . . . . . . . . . . . . . 1.2 NP 1.2 NP 0.14413 Automotive parts, acc., and tire stores . . . . . . . 2.4 NP 2.4 NP 0.5442 Furniture and home furnishings stores . . . . . . 1.3 2.1 1.3 0.3 0.2443 Electronics and appliance stores . . . . . . . . . . . . 1.0 1.0 1.1 0.1 0.2444 Building mat. and garden equip. & supplies
dealers . . . . . . . . . . . . . . . . . . . . . . . . . . . . . . . . . . . 1.6 1.6 1.7 0.2 0.34441 Building mat. and supplies dealers . . . . . . . . . . 1.6 NP 1.7 NP 0.3445 Food and beverage stores . . . . . . . . . . . . . . . . . . 0.6 0.7 0.6 0.0 0.14451 Grocery stores . . . . . . . . . . . . . . . . . . . . . . . . . . . . 0.6 NP 0.6 NP 0.14452 Specialty food stores . . . . . . . . . . . . . . . . . . . . . . 2.6 NP 2.6 NP 0.64453 Beer, wine, and liquor stores. . . . . . . . . . . . . . . . 1.4 NP 1.4 NP 0.5446 Health and personal care stores. . . . . . . . . . . . . 1.4 NP 1.3 NP 0.444611 Pharmacies and drug stores. . . . . . . . . . . . . . 1.2 NP 1.3 NP 0.3447 Gasoline stations. . . . . . . . . . . . . . . . . . . . . . . . . . . 2.1 NP 1.3 NP 0.9448 Clothing and clothing access. stores . . . . . . . . 0.6 0.8 0.8 0.1 0.14481 Clothing stores . . . . . . . . . . . . . . . . . . . . . . . . . . . . 0.7 NP 0.8 NP 0.244811 Men’s clothing store . . . . . . . . . . . . . . . . . . . . . 2.6 NP 3.1 NP 0.744812 Women’s clothing stores . . . . . . . . . . . . . . . . . 1.5 NP 1.4 NP 0.344814 Family clothing stores . . . . . . . . . . . . . . . . . . . 0.7 NP 0.8 NP 0.24482 Shoe stores . . . . . . . . . . . . . . . . . . . . . . . . . . . . . . 1.4 NP 1.5 NP 0.3451 Sporting goods, hobby, book & music
stores . . . . . . . . . . . . . . . . . . . . . . . . . . . . . . . . . . . . 1.0 NP 1.2 NP 0.3452 General merchandise stores . . . . . . . . . . . . . . . . 0.2 0.3 0.2 0.0 0.04521 Department stores. . . . . . . . . . . . . . . . . . . . . . . . . 0.0 0.0 0.0 0.0 0.04521102 Discount dept. stores . . . . . . . . . . . . . . . . . . . . 0.0 NP 0.0 NP 0.04529 Other general merchandise stores. . . . . . . . . . . 0.4 NP 0.4 NP 0.145291 Warehouse clubs and superstores . . . . . . . . 0.1 NP 0.1 NP 0.045299 All other gen. merchandise stores . . . . . . . . . 1.9 NP 2.1 NP 0.4453 Miscellaneous store retailers . . . . . . . . . . . . . . . . 1.5 NP 1.2 NP 0.4454 Nonstore retailers . . . . . . . . . . . . . . . . . . . . . . . . . . 2.0 NP 1.8 NP 0.34541 Electronic shopping and mail-order houses . . . 2.4 NP 2.2 NP 0.3
(NP) Not Published.1GAFO represents stores classified in the following NAICS codes: 442, 443, 448, 451, 452, and 4532. NAICS code 4532 includes office supplies,
stationery, and gift stores.
Note: The introduction and appendixes give information on confidentiality protection, sampling error, nonsampling error, sample design, and defini-tions. Links to this information on the Internet may be found at www.census.gov/mrts/www/nrely.html.
A–8 Appendix A
U.S. Census Bureau

Table A–3. Estimated Measures of Sampling Variability for End-of-Year Accounts ReceivableEstimates by Kinds of Business: 2000
[Estimates are shown as percents. Estimates are based on data from the 2000 Annual Retail Trade Survey and administrative records]
NAICScode Kind of business
Coefficients of variation for
Totalaccounts
receivable
Type of account
Charge
Installment
Total Open-end Closed-end
Retail accounts receivable . . . . . . . . . . . . . . . . 0.9 2.7 1.2 1.2 5.7Total (excl. motor vehicle and parts
dealers). . . . . . . . . . . . . . . . . . . . . . . . . . . . . . . 1.0 3.3 1.2 1.1 5.8441 Motor vehicle and parts dealers . . . . . . . . . . . . . . . 2.4 3.3 5.7 9.1 8.5442 Furniture and home furnishings stores . . . . . . . . . 5.8 11.9 7.2 5.3 14.3443 Electronics and appliance stores . . . . . . . . . . . . . . 5.2 8.0 7.2 11.2 9.7444 Building mat. and garden equip. & supplies
dealers. . . . . . . . . . . . . . . . . . . . . . . . . . . . . . . . . . . . 3.4 5.7 9.1 9.1 21.8445 Food and beverage stores . . . . . . . . . . . . . . . . . . . . 5.5 4.0 9.4 9.9 25.8446 Health and personal care stores. . . . . . . . . . . . . . . 10.7 11.6 S S S447 Gasoline stations . . . . . . . . . . . . . . . . . . . . . . . . . . . . 9.2 12.0 10.7 11.4 23.4448 Clothing and clothing access. stores . . . . . . . . . . . 2.7 12.9 3.0 3.4 10.2451 Sporting goods, hobby, book & music stores . . . . 10.2 14.7 S S S452 General merchandise stores . . . . . . . . . . . . . . . . . . 0.3 7.0 0.2 0.1 8.14521 Department stores. . . . . . . . . . . . . . . . . . . . . . . . . 0.0 0.0 0.0 0.0 0.0453 Miscellaneous store retailers . . . . . . . . . . . . . . . . . . 7.6 10.1 S S S454 Nonstore retailers. . . . . . . . . . . . . . . . . . . . . . . . . . . . 2.3 4.9 2.6 2.8 6.4
S Corresponding estimate in Table 8 does not meet publication standards because of high sampling variability or poor response quality.
Note: The introduction and appendixes give information on confidentiality protection, sampling error, nonsampling error, sample design, and defini-tions. Links to this information on the Internet may be found at www.census.gov/mrts/www/nrely.html. Measures of sampling variability for historicalestimates approximate those shown in the table.
Appendix A A–9
U.S. Census Bureau
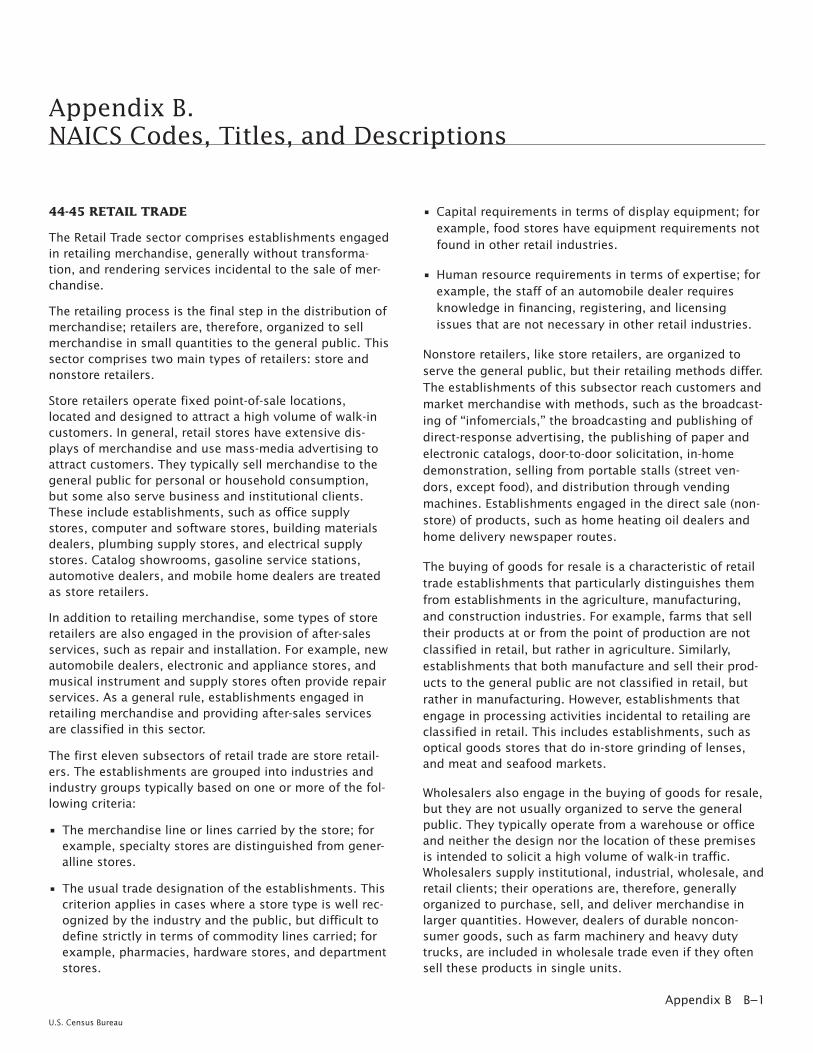
Appendix B.NAICS Codes, Titles, and Descriptions
44-45 RETAIL TRADE
The Retail Trade sector comprises establishments engagedin retailing merchandise, generally without transforma-tion, and rendering services incidental to the sale of mer-chandise.
The retailing process is the final step in the distribution ofmerchandise; retailers are, therefore, organized to sellmerchandise in small quantities to the general public. Thissector comprises two main types of retailers: store andnonstore retailers.
Store retailers operate fixed point-of-sale locations,located and designed to attract a high volume of walk-incustomers. In general, retail stores have extensive dis-plays of merchandise and use mass-media advertising toattract customers. They typically sell merchandise to thegeneral public for personal or household consumption,but some also serve business and institutional clients.These include establishments, such as office supplystores, computer and software stores, building materialsdealers, plumbing supply stores, and electrical supplystores. Catalog showrooms, gasoline service stations,automotive dealers, and mobile home dealers are treatedas store retailers.
In addition to retailing merchandise, some types of storeretailers are also engaged in the provision of after-salesservices, such as repair and installation. For example, newautomobile dealers, electronic and appliance stores, andmusical instrument and supply stores often provide repairservices. As a general rule, establishments engaged inretailing merchandise and providing after-sales servicesare classified in this sector.
The first eleven subsectors of retail trade are store retail-ers. The establishments are grouped into industries andindustry groups typically based on one or more of the fol-lowing criteria:
• The merchandise line or lines carried by the store; forexample, specialty stores are distinguished from gener-alline stores.
• The usual trade designation of the establishments. Thiscriterion applies in cases where a store type is well rec-ognized by the industry and the public, but difficult todefine strictly in terms of commodity lines carried; forexample, pharmacies, hardware stores, and departmentstores.
• Capital requirements in terms of display equipment; forexample, food stores have equipment requirements notfound in other retail industries.
• Human resource requirements in terms of expertise; forexample, the staff of an automobile dealer requiresknowledge in financing, registering, and licensingissues that are not necessary in other retail industries.
Nonstore retailers, like store retailers, are organized toserve the general public, but their retailing methods differ.The establishments of this subsector reach customers andmarket merchandise with methods, such as the broadcast-ing of ‘‘infomercials,’’ the broadcasting and publishing ofdirect-response advertising, the publishing of paper andelectronic catalogs, door-to-door solicitation, in-homedemonstration, selling from portable stalls (street ven-dors, except food), and distribution through vendingmachines. Establishments engaged in the direct sale (non-store) of products, such as home heating oil dealers andhome delivery newspaper routes.
The buying of goods for resale is a characteristic of retailtrade establishments that particularly distinguishes themfrom establishments in the agriculture, manufacturing,and construction industries. For example, farms that selltheir products at or from the point of production are notclassified in retail, but rather in agriculture. Similarly,establishments that both manufacture and sell their prod-ucts to the general public are not classified in retail, butrather in manufacturing. However, establishments thatengage in processing activities incidental to retailing areclassified in retail. This includes establishments, such asoptical goods stores that do in-store grinding of lenses,and meat and seafood markets.
Wholesalers also engage in the buying of goods for resale,but they are not usually organized to serve the generalpublic. They typically operate from a warehouse or officeand neither the design nor the location of these premisesis intended to solicit a high volume of walk-in traffic.Wholesalers supply institutional, industrial, wholesale, andretail clients; their operations are, therefore, generallyorganized to purchase, sell, and deliver merchandise inlarger quantities. However, dealers of durable noncon-sumer goods, such as farm machinery and heavy dutytrucks, are included in wholesale trade even if they oftensell these products in single units.
Appendix B B−1
U.S. Census Bureau
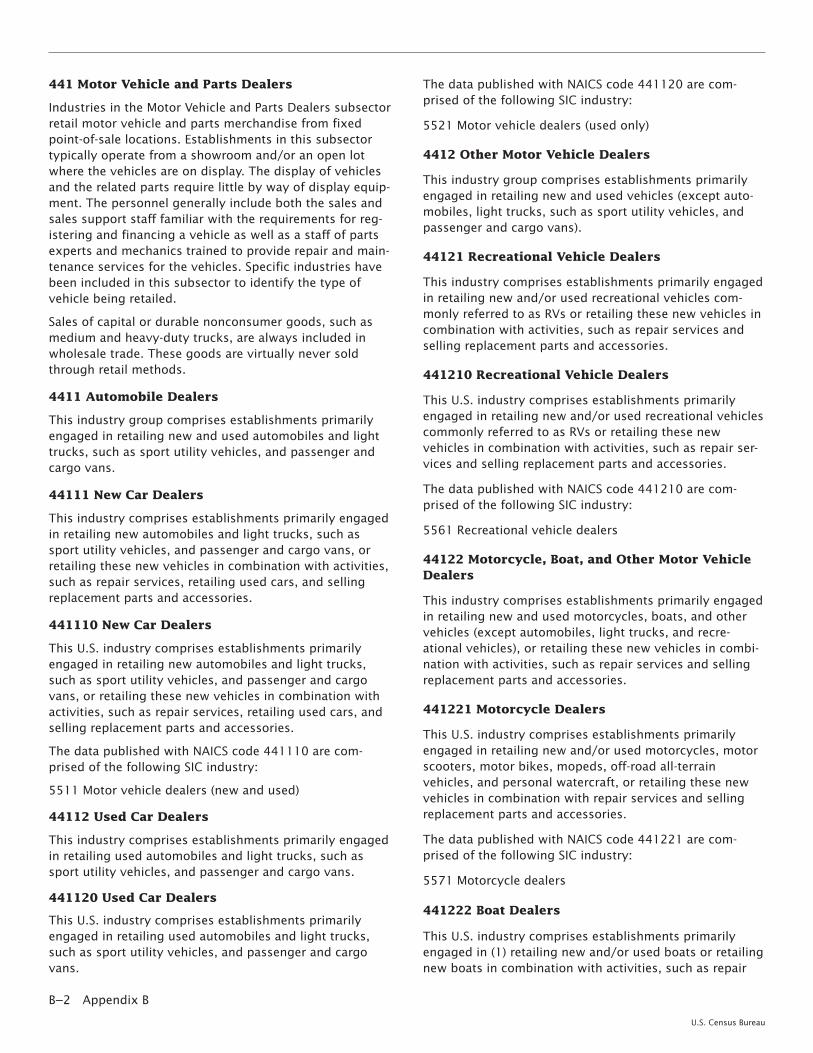
441 Motor Vehicle and Parts Dealers
Industries in the Motor Vehicle and Parts Dealers subsectorretail motor vehicle and parts merchandise from fixedpoint-of-sale locations. Establishments in this subsectortypically operate from a showroom and/or an open lotwhere the vehicles are on display. The display of vehiclesand the related parts require little by way of display equip-ment. The personnel generally include both the sales andsales support staff familiar with the requirements for reg-istering and financing a vehicle as well as a staff of partsexperts and mechanics trained to provide repair and main-tenance services for the vehicles. Specific industries havebeen included in this subsector to identify the type ofvehicle being retailed.
Sales of capital or durable nonconsumer goods, such asmedium and heavy-duty trucks, are always included inwholesale trade. These goods are virtually never soldthrough retail methods.
4411 Automobile Dealers
This industry group comprises establishments primarilyengaged in retailing new and used automobiles and lighttrucks, such as sport utility vehicles, and passenger andcargo vans.
44111 New Car Dealers
This industry comprises establishments primarily engagedin retailing new automobiles and light trucks, such assport utility vehicles, and passenger and cargo vans, orretailing these new vehicles in combination with activities,such as repair services, retailing used cars, and sellingreplacement parts and accessories.
441110 New Car Dealers
This U.S. industry comprises establishments primarilyengaged in retailing new automobiles and light trucks,such as sport utility vehicles, and passenger and cargovans, or retailing these new vehicles in combination withactivities, such as repair services, retailing used cars, andselling replacement parts and accessories.
The data published with NAICS code 441110 are com-prised of the following SIC industry:
5511 Motor vehicle dealers (new and used)
44112 Used Car Dealers
This industry comprises establishments primarily engagedin retailing used automobiles and light trucks, such assport utility vehicles, and passenger and cargo vans.
441120 Used Car Dealers
This U.S. industry comprises establishments primarilyengaged in retailing used automobiles and light trucks,such as sport utility vehicles, and passenger and cargovans.
The data published with NAICS code 441120 are com-prised of the following SIC industry:
5521 Motor vehicle dealers (used only)
4412 Other Motor Vehicle Dealers
This industry group comprises establishments primarilyengaged in retailing new and used vehicles (except auto-mobiles, light trucks, such as sport utility vehicles, andpassenger and cargo vans).
44121 Recreational Vehicle Dealers
This industry comprises establishments primarily engagedin retailing new and/or used recreational vehicles com-monly referred to as RVs or retailing these new vehicles incombination with activities, such as repair services andselling replacement parts and accessories.
441210 Recreational Vehicle Dealers
This U.S. industry comprises establishments primarilyengaged in retailing new and/or used recreational vehiclescommonly referred to as RVs or retailing these newvehicles in combination with activities, such as repair ser-vices and selling replacement parts and accessories.
The data published with NAICS code 441210 are com-prised of the following SIC industry:
5561 Recreational vehicle dealers
44122 Motorcycle, Boat, and Other Motor VehicleDealers
This industry comprises establishments primarily engagedin retailing new and used motorcycles, boats, and othervehicles (except automobiles, light trucks, and recre-ational vehicles), or retailing these new vehicles in combi-nation with activities, such as repair services and sellingreplacement parts and accessories.
441221 Motorcycle Dealers
This U.S. industry comprises establishments primarilyengaged in retailing new and/or used motorcycles, motorscooters, motor bikes, mopeds, off-road all-terrainvehicles, and personal watercraft, or retailing these newvehicles in combination with repair services and sellingreplacement parts and accessories.
The data published with NAICS code 441221 are com-prised of the following SIC industry:
5571 Motorcycle dealers
441222 Boat Dealers
This U.S. industry comprises establishments primarilyengaged in (1) retailing new and/or used boats or retailingnew boats in combination with activities, such as repair
B−2 Appendix B
U.S. Census Bureau

services and selling replacement parts and accessories,and/or (2) retailing new and/or used outboard motors,boat trailers, marine supplies, parts, and accessories.
The data published with NAICS code 441222 are com-prised of the following SIC industry:
5551 Boat dealers
441229 ALL OTHER MOTOR VEHICLE DEALERS
This U.S. industry comprises establishments primarilyengaged in retailing new and/or used utility trailers andvehicles (except automobiles, light trucks, recreationalvehicles, motorcycles, boats, motor scooters, motorbikes,off-road all-terrain vehicles, and personal watercraft) orretailing these new vehicles in combination with activities,such as repair services and selling replacement parts andaccessories.
The data published with NAICS code 441229 are com-prised of the following SIC industry:
5599 Automotive dealers, not elsewhere classified
4413 Automotive Parts, Accessories, and TireStores
This NAICS Industry Group includes establishments classi-fied in the following NAICS Industries: Automotive Partsand Accessories Stores, 44131; and 44132, Tire Dealers.
44131 Automotive Parts and Accessories Stores
This industry comprises one or more of the following: (1)establishments known as automotive supply stores pri-marily engaged in retailing new, used, and/or rebuilt auto-motive parts and accessories; (2) automotive supply storesthat are primarily engaged in both retailing automotiveparts and accessories and repairing automobiles; and (3)establishments primarily engaged in retailing and install-ing automotive accessories.
441310 Automotive Parts and Accessories Stores
This U.S. industry comprises one or more of the following:(1) establishments known as automotive supply stores pri-marily engaged in retailing new, used, and/or rebuilt auto-motive parts and accessories; (2) automotive supply storesthat are primarily engaged in both retailing automotiveparts and accessories and repairing automobiles; and (3)establishments primarily engaged in retailing and install-ing automotive accessories.
The data published with NAICS code 441310 are com-prised of these parts of the following SIC industries:
5013 (pt.) Motor vehicle supplies and new parts jobbers(retail)
5531 (pt.) Auto supplies stores
5731 (pt.) Automotive radio stores
4413101 Auto Supplies Stores
Establishments primarily engaged in retailing auto sup-plies, such as automotive batteries, parts, accessories, andsundry supplies. These establishments also may automo-tive tires. These establishments may have facilities to per-form motor vehicle service work. Establishments primarilyengaged in selling and installing custom-made seat coversare included here.
4413102 Automotive Radio Stores
Establishments primarily engaged in retailing automotiveradios and other automotive sound reproducing equip-ment. These establishments may also perform incidentalinstallation and repair work.
4413103 Motor Vehicle Supplies and New PartsJobbers (Retail)
Establishments primarily engaged in retailing motorvehicle supplies and new parts. These establishmentsmeet the wholesale trade classification criteria under the1987 Standard Industrial Classification System.
44132 Tire Dealers
This industry comprises establishments primarily engagedin retailing new and/or used tires and tubes or retailingnew tires in combination with automotive repair services.
441320 Tire Dealers
This U.S. industry comprises establishments primarilyengaged in retailing new and/or used tires and tubes orretailing new tires in combination with automotive repairservices.
The data published with NAICS code 441320 are com-prised of these parts of the following SIC industries:
5014 (pt.) Tire and tube merchants (retail)
5531 (pt.) New tire dealers
4413201 New Tire Dealers
Establishments primarily engaged in retailing new auto-motive tires and tubes. These establishments generallyhave facilities to perform installation and repair servicesrelated to the sale of tires.
4413202 Tire and Tube Merchants (Retail)
Establishments primarily engaged in retailing new tiresand tubes for passenger and commercial vehicles. Theseestablishments meet the wholesale trade classification cri-teria under the 1987 Standard Industrial ClassificationSystem.
Appendix B B−3
U.S. Census Bureau

442 Furniture and Home Furnishings Stores
Industries in the Furniture and Home Furnishings Storessubsector retail new furniture and home furnishings mer-chandise from fixed point-of-sale locations. Establish-ments in this subsector usually operate from showroomsand have substantial areas for the presentation of theirproducts. Many offer interior decorating services in addi-tion to the sale of products.
4421 Furniture Stores
This NAICS Industry Group includes establishments classi-fied in the following NAICS Industry:
44211, Furniture Stores.
44211 Furniture Stores
This industry comprises establishments primarily engagedin retailing new furniture, such as household furniture(e.g., baby furniture box springs and mattresses) and out-door furniture; office furniture (except those sold in com-bination with office supplies and equipment); and/or furni-ture sold in combination with major appliances, homeelectronics, home furnishings, and/or floor covering.
442110 Furniture Stores
This U.S. industry comprises establishments primarilyengaged in retailing new furniture, such as household fur-niture (e.g., baby furniture box springs and mattresses)and outdoor furniture; office furniture (except those soldin combination with office supplies and equipment);and/or furniture sold in combination with major appli-ances, home electronics, home furnishings, and/or floorcovering.
The data published with NAICS code 442110 are com-prised of these parts of the following SIC industries:
5021 (pt.) Office and business furniture merchants (retail)
5712 (pt.) Furniture warehouse showrooms
5712 (pt.) Sleep shop and waterbed stores
5712 (pt.) Furniture stores, except custom
5712 (pt.) Specialty furniture stores, except custom
4421101 Furniture Stores, Except Custom
Establishments primarily engaged in retailing new house-hold furniture (except custom-made furniture). Theseestablishments may also provide interior design servicesand sell floor coverings, other home furnishings, andmajor appliances, such as refrigerators, stoves, freezers,and televisions.
4421102 Furniture Warehouse Showrooms
Establishments, known as furniture warehouse show-rooms, primarily engaged in retailing the same merchan-dise as furniture stores, but operating as warehouse show-rooms where customers make their furniture selectionsfrom items on display in the showroom. The furniture isthen taken from a warehouse adjacent to the showroom(usually under the same roof) for delivery to or pick-up bythe customer.
4421103 Sleep Shop and Waterbed Stores
Establishments primarily engaged in retailing new mat-tresses, box springs, and other sleep equipment, includingwaterbeds.
4421104 Specialty Furniture Stores, Except Custom
Establishments primarily engaged in retailing specialty fur-niture, such as children’s, outdoor, office, and computer-related furniture.
44211041 Specialty Furniture Stores, ExceptCustom
Establishments primarily engaged in retailing specialty fur-niture, such as children’s, outdoor, and computer-relatedfurniture.
44211042 Office and Business FurnitureMerchants (Retail)
Establishments primarily engaged in retailing filing cabi-nets (wood or steel), desks, and other office and businessfurniture. These establishments meet the wholesale tradeclassification criteria under the 1987 Standard IndustrialClassification System.
4422 Home Furnishings Stores
This industry group comprises establishments primarilyengaged in retailing new home furnishings (except furni-ture).
44221 Floor Covering Stores
This industry comprises establishments primarily engagedin retailing new floor coverings, such as rugs and carpets,vinyl floor coverings, and floor tile (except ceramic orwood only); or retailing new floor coverings in combina-tion with installation and repair services.
442210 Floor Covering Stores
This U.S. industry comprises establishments primarilyengaged in retailing new floor coverings, such as rugs andcarpets, vinyl floor coverings, and floor tile (exceptceramic or wood only); or retailing new floor coverings incombination with installation and repair services.
B−4 Appendix B
U.S. Census Bureau
The data published with NAICS code 442210 are com-prised of these parts of the following SIC industries:
5023 (pt.) Floor covering merchants (retail)
5713 Floor covering stores
4422101 Floor Covering Stores
Establishments primarily engaged in retailing rugs, car-pets, floor tile (i.e., rubber, vinyl, asphalt), and relatedproducts. These establishments may also perform inciden-tal installation.
4422102 Floor Covering Merchants (Retail)
Establishments primarily engaged in retailing carpets,rugs, and all other types of hard and soft surface floorcoverings (excluding ceramic and clay tile). These estab-lishments meet the wholesale trade classification criteriaunder the 1987 Standard Industrial Classification System.
44229 Other Home Furnishings Stores
This industry comprises establishments primarily engagedin retailing new home furnishings (except furniture andfloor coverings).
442291 Window Treatment Stores
This U.S. industry comprises establishments primarilyengaged in retailing new window treatments, such as cur-tains, drapes, blinds, and shades.
The data published with NAICS code 442291 are com-prised of these parts of the following SIC industries:
5714 (pt.) Drapery and curtain stores, except custom
5719 (pt.) Blind and shade stores
4422911 Drapery and Curtain Stores, ExceptCustom
Establishments primarily engaged in retailing packageddraperies and curtains.
4422912 Blind and Shade Stores
Establishments primarily engaged in retailing blinds,shades, and similar window treatments. Establishmentsproducing custom-made window shades and venetianblinds for household use are included here.
442299 All Other Home Furnishings Stores
This U.S. industry comprises establishments primarilyengaged in retailing new home furnishings (except floorcoverings, furniture, and window treatments).
The data published with NAICS code 442299 are com-prised of this part of the following SIC industry:
5719 (pt.) All other home furnishings stores
443 Electronics and Appliance Stores
Industries in the Electronics and Appliance Stores subsec-tor retail new electronics and appliance merchandise frompoint-of-sale locations. Establishments in this subsectoroften operate from locations that have special provisionsfor floor displays requiring special electrical capacity toaccommodate the proper demonstration of the products.The staff includes sales personnel knowledgeable in thecharacteristics and warranties of the line of goods retailedand may also include trained repair persons to handle themaintenance and repair of the electronic equipment andappliances. The classifications within this subsector aremade principally on the type of product and knowledgerequired to operate each type of store.
4431 Electronics and Appliance Stores
This industry group comprises establishments primarilyengaged in retailing the following new products:household-type appliances, cameras, computers, andother electronic goods.
44311 Appliance, Television, and OtherElectronics Stores
This industry comprises establishments primarily engagedin retailing one of the following: (1) retailing an array ofnew household-type appliances and consumer-type elec-tronic products, such as radios, televisions, and comput-ers; (2) specializing in retailing a single line of newconsumer-type electronic products (except computers);and (3) retailing these new products in combination withrepair services.
443111 Household Appliance Stores
This U.S. industry comprises establishments known asappliance stores primarily engaged in retailing an array ofnew household appliances, such as refrigerators, dish-washers, ovens, irons, coffee makers, hair dryers, electricrazors, room air-conditioners, microwave ovens, sewingmachines, and vacuum cleaners, or retailing new appli-ances in combination with appliance repair services.
The data published with NAICS code 443111 are com-prised of the following SIC industry:
5722 Household appliance stores
443112 Radio, Television, and Other ElectronicsStores
This U.S. industry comprises: (1) establishments known asconsumer electronics stores primarily engaged in retailinga general line of new consumer-type electronic products;(2) establishments specializing in retailing a single line ofconsumer-type electronic products (except computers); or(3) establishments primarily engaged in retailing thesenew electronic products in combination with repair ser-vices.
Appendix B B−5
U.S. Census Bureau
The data published with NAICS code 443112 are com-prised of these parts of the following SIC industries:
5731 (pt.) Other radio, television, and electronics stores
5999 (pt.) Typewriter shops
5999 (pt.) Telephone stores
4431121 Typewriter Shops
Establishments primarily engaged in retailing typewriters.These establishments may also rent and/or repair type-writers.
4431122 Telephone Stores
Establishments primarily engaged in retailing telephonesand telephone parts and supplies.
4431123 Other Radio, Television, and ElectronicsStores
Establishments primarily engaged in retailing radios andstereo equipment (except automotive), television sets,record players, and other consumer audio and video elec-tronic equipment. These establishments may also selladditional lines, such as household appliances; computers,computer peripheral equipment, and software; musicalinstruments; or prerecorded records and tapes. Theseestablishments may also perform incidental installationand repair work.
44312 Computer and Software Stores
This industry comprises establishments primarily engagedin retailing new computers, computer peripherals, andprepackaged computer software without retailing otherconsumer-type electronic products or office equipment,office furniture and office supplies; or retailing these newproducts in combination with repair and support services.
443120 Computer and Software Stores
This U.S. industry comprises establishments primarilyengaged in retailing new computers, computer peripher-als, and prepackaged computer software without retailingother consumer-type electronic products or office equip-ment, office furniture and office supplies; or retailingthese new products in combination with repair and sup-port services.
The data published with NAICS code 443120 are com-prised of these parts of the following SIC industries:
5045 (pt.) Computer and peripheral equipment merchants(retail)
5045 (pt.) Computer software merchants (retail)
5734 (pt.) Computer stores
5734 (pt.) Computer stores (custom assembly)
5734 (pt.) Computer software stores
4431201 Computer Stores (Custom Assembly)
Establishments primarily engaged in custom assembly andretail sales of computers and computer peripheral equip-ment. These establishments may also sell computer soft-ware and computer furniture and perform incidental repairwork.
4431202 Other Computer Stores
Establishments primarily engaged in retailing computers,computer hardware, and computer peripheral equipmentnot assembled at the sales location. These establishmentsmay also sell computer software and computer furniture,and perform incidental installation and repair work.
44312021 Computer Stores
Establishments primarily engaged in retailing computers,computer hardware, and computer peripheral equipmentnot assembled at the sales location. These establishmentsmay also sell computer software and computer furnitureand perform incidental installation and repair work.
44312022 Computer and Peripheral EquipmentMerchants (Retail)
Establishments primarily engaged in retailing computers,computer hardware, and computer peripheral equipment.These establishments meet the wholesale trade classifica-tion criteria under the 1987 Standard Industrial Classifica-tion System.
4431203 Prepackaged Software Stores
Establishments primarily engaged in retailing prepackaged(off-the-shelf) computer software. These establishmentsmay also sell computer books, supplies, and accessories.
44312031 Computer Software Stores
Establishments primarily engaged in retailing prepackaged(off-the-shelf) computer software. These establishmentsmay also sell computer books, supplies, and accessories.
44312032 Computer Software Merchants (Retail)
Establishments primarily engaged in retailing prepackaged(off-the-shelf) computer software. These establishmentsmay also sell computer books, supplies, and accessories.These establishments meet the wholesale trade classifica-tion criteria under the 1987 Standard Industrial Classifica-tion System.
44313 Camera and Photographic Supplies Stores
This industry comprises establishments primarily engagedin either retailing new cameras, photographic equipment,and photographic supplies or retailing new cameras andphotographic equipment in combination with activities,such as repair services and film developing.
B−6 Appendix B
U.S. Census Bureau
443130 Camera and Photographic Supplies Stores
This U.S. industry comprises establishments primarilyengaged in either retailing new cameras, photographicequipment, and photographic supplies or retailing newcameras and photographic equipment in combination withactivities, such as repair services and film developing.
The data published with NAICS code 443130 are com-prised of the following SIC industry:
5946 Camera and photographic supply stores
444 Building Material and Garden Equipment andSupplies Dealers
Industries in the Building Material and Garden Equipmentand Supplies Dealers subsector retail new building mate-rial and garden equipment and supplies merchandise fromfixed point-of-sale locations. Establishments in this sub-sector have display equipment designed to handle lumberand related products and garden equipment and suppliesthat may be kept either indoors or outdoors under cov-ered areas. The staff is usually knowledgeable in the useof the specific products being retailed in the construction,repair, and maintenance of the home and associatedgrounds.
4441 Building Material and Supplies Dealers
This industry group comprises establishments primarilyengaged in retailing new building materials and supplies.
44411 Home Centers
This industry comprises establishments known as homecenters primarily engaged in retailing a general line ofnew home repair and improvement materials and supplies,such as lumber, plumbing goods, electrical goods, tools,housewares, hardware, and lawn and garden supplies,with no one merchandise line predominating. The mer-chandise lines are normally arranged in separate depart-ments.
444110 Home Centers
This U.S. industry comprises establishments known ashome centers primarily engaged in retailing a general lineof new home repair and improvement materials and sup-plies, such as lumber, plumbing goods, electrical goods,tools, housewares, hardware, and lawn and garden sup-plies, with no one merchandise line predominating. Themerchandise lines are normally arranged in separatedepartments.
The data published with NAICS code 444110 are com-prised of this part of the following SIC industry:
5211 (pt.) Home centers
44412 Paint and Wallpaper Stores
This industry comprises establishments known as paintand wallpaper stores primarily engaged in retailing paint,wallpaper, and related supplies.
444120 Paint and Wallpaper Stores
This U.S. industry comprises establishments known aspaint and wallpaper stores primarily engaged in retailingpaint, wallpaper, and related supplies.
The data published with NAICS code 444120 are com-prised of these parts of the following SIC industries:
5198 (pt.) Paint, varnish, and supplies merchants (retail)
5231 (pt.) Retail paint and wallpaper stores
4441201 Retail Paint and Wallpaper Stores
Establishments primarily engaged in retailing paint, wall-paper, or a combination of these lines.
4441202 Paint, Varnish, and Supplies Merchants(Retail)
Establishments primarily engaged in retailing paints, var-nishes, wallpaper, and supplies. These establishmentsmeet the wholesale trade classification criteria under the1987 Standard Industrial Classification System.
44413 Hardware Stores
This industry comprises establishments known as hard-ware stores primarily engaged in retailing a general line ofnew hardware items, such as tools and builders’ hardware.
444130 Hardware Stores
This U.S. industry comprises establishments known ashardware stores primarily engaged in retailing a generalline of new hardware items, such as tools and builders’hardware.
The data published with NAICS code 444130 are com-prised of the following SIC industry:
5251 Hardware stores
44419 Other Building Material Dealers
This industry comprises establishments (except thoseknown as home centers, paint and wallpaper stores, andhardware stores) primarily engaged in retailing specializedlines of new building materials, such as lumber, fencing,glass, doors, plumbing fixtures and supplies, electricalsupplies, prefabricated buildings and kits, and kitchen andbath cabinets and countertops to be installed.
Appendix B B−7
U.S. Census Bureau

444190 Other Building Material Dealers
This U.S. industry comprises establishments (except thoseknown as home centers, paint and wallpaper stores, andhardware stores) primarily engaged in retailing specializedlines of new building materials, such as lumber, fencing,glass, doors, plumbing fixtures and supplies, electricalsupplies, prefabricated buildings and kits, and kitchen andbath cabinets and countertops to be installed.
The data published with NAICS code 444190 are com-prised of these parts of the following SIC industries:
5031 (pt.) Lumber merchants with yard (retail)
5031 (pt.) Plywood, veneer, and millwork merchants(retail)
5032 (pt.) Brick, block, tile, clay/cement sewer pipe mer-chants (retail)
5032 (pt.) Sand, gravel, and stone merchants (retail)
5032 (pt.) Cement, lime, and related products merchants(retail)
5033 (pt.) Roofing, siding, and insulation merchants(retail)
5039 (pt.) Flat glass and other construction glass mer-chants (retail)
5039 (pt.) Other building material merchants (retail)
5063 (pt.) Electrical supplies stores (retail)
5074 (pt.) Plumbing and heating equipment and suppliesmerchants (retail)
5211 (pt.) Retail lumber yards
5211 (pt.) Retail building material dealers
5231 (pt.) Retail glass dealers
4441901 Retail Lumber Yards
Establishments primarily engaged in retailing lumber,often with related lines of building materials. Retail lum-ber yards may produce some of the lumber and millworkthey sell.
44419011 Retail Lumber Yards
Establishments primarily engaged in retailing lumber,often with related lines of building materials. Retail lum-ber yards may produce some of the lumber and millworkthey sell.
44419012 Lumber Merchants With Yard (Retail)
Establishments primarily engaged in retailing rough,dressed, and finished lumber. These establishments meetthe wholesale trade classification criteria under the 1987Standard Industrial Classification System.
4441902 All Other Building Material Dealers
Establishments (except those known as home centers,paint and wallpaper stores, hardware stores, and retaillumber yards) primarily engaged in retailing specializedlines of new building materials, such as fencing, glass,doors, plumbing fixtures and supplies, electrical supplies,prefabricated buildings and kits, and kitchen and bathcabinets and countertops to be installed.
44419021 Retail Glass Dealers
Establishments primarily engaged in retailing glass,including mirrored glass.
44419022 Flat Glass and Other Construction GlassMerchants (Retail)
Establishments primarily engaged in retailing flat glass,glass blocks, plate glass, window glass, and buildingglass. These establishments meet the wholesale tradeclassification criteria under the 1987 Standard IndustrialClassification System.
44419023 Retail Building Material Dealers
Establishments primarily engaged in retailing specializedlines of building materials (except lumber, paint, and hard-ware), such as brick and blocks, ceramic tile, stone,cement, sand, gravel, fencing, roofing, siding, doors andwindows, wallboard, lime, plaster, prefabricated buildings,and kitchen and bath cabinets and countertops to beinstalled.
44419024 Plywood, Veneer, and MillworkMerchants (Retail)
Establishments primarily engaged in retailing plywood(hardwood, softwood, and nonwood face), veneer, doorand window frames, and overhead doors (in wood ormetal). These establishments meet the wholesale tradeclassification criteria under the 1987 Standard IndustrialClassification System.
44419025 Brick, Block, Tile, Clay/Cement SewerPipe Merchants (Retail)
Establishments primarily engaged in retailing brick, block,tile, and clay construction materials. These establishmentsmeet the wholesale trade classification criteria under the1987 Standard Industrial Classification System.
44419026 Sand, Gravel, and Stone Merchants(Retail)
Establishments primarily engaged in retailing sand, gravel,and stone. These establishments meet the wholesale tradeclassification criteria under the 1987 Standard IndustrialClassification System.
B−8 Appendix B
U.S. Census Bureau

44419027 Cement, Lime, and Related ProductsMerchants (Retail)
Establishments primarily engaged in retailing cement,lime, asphalt, and other related products. These establish-ments meet the wholesale trade classification criteriaunder the 1987 Standard Industrial Classification System.
44419028 Roofing, Siding, and InsulationMerchants (Retail)
Establishments primarily engaged in retailing roofing, sid-ing (except wood), and insulation materials. These estab-lishments meet the wholesale trade classification criteriaunder the 1987 Standard Industrial ClassificationSystem.
44419029 Other Building Material Merchants(Retail)
Establishments primarily engaged in retailing building andconstruction paper, plastics building materials, prefabri-cated structural assemblies (including modular homes),and other building materials. These establishments meetthe wholesale trade classification criteria under the 1987Standard Industrial Classification System.
4441902a Electrical Supplies Stores (Retail)
Establishments primarily engaged in retailing electricalsupplies and electric light fixtures. These establishmentsmeet the wholesale trade classification criteria under the1987 Standard Industrial Classification System.
4441902b Plumbing and Heating Equipment andSupplies Merchants (Retail)
Establishments primarily engaged in retailing hydronicplumbing and heating equipment and supplies. Theseestablishments meet the wholesale trade classification cri-teria under the 1987 Standard Industrial Classification Sys-tem.
4442 Lawn and Garden Equipment and SuppliesStores
This industry group comprises establishments primarilyengaged in retailing new lawn and garden equipment andsupplies.
44421 Outdoor Power Equipment Stores
This industry comprises establishments primarily engagedin retailing new outdoor power equipment or retailing newoutdoor power equipment in combination with activities,such as repair services and selling replacement parts.
444210 Outdoor Power Equipment Stores
This U.S. industry comprises establishments primarilyengaged in retailing new outdoor power equipment orretailing new outdoor power equipment in combinationwith activities, such as repair services and selling replace-ment parts.
The data published with NAICS code 444210 are com-prised of these parts of the following SIC industries:
5083 (pt.) Lawn and garden machinery and equipmentdealers (retail)
5261 (pt.) Outdoor power equipment stores
4442101 Outdoor Power Equipment Stores
Establishments primarily engaged in retailing outdoorpower equipment, such as power lawnmowers, chainsaws, garden tillers, and snowblowers. These establish-ments generally also perform repair services.
4442102 Lawn and Garden Machinery andEquipment Dealers (Retail)
Establishments primarily engaged in retailing lawn andgarden machinery and equipment. These establishmentsmeet the wholesale trade classification criteria under the1987 Standard Industrial Classification System.
44422 Nursery and Garden Centers
This industry comprises establishments primarily engagedin retailing nursery and garden products, such as trees,shrubs, plants, seeds, bulbs, and sod, that are predomi-nantly grown elsewhere. These establishments may sell alimited amount of a product they grow themselves.
444220 Nursery and Garden Centers
This U.S. industry comprises establishments primarilyengaged in retailing nursery and garden products, such astrees, shrubs, plants, seeds, bulbs, and sod, that are pre-dominantly grown elsewhere. These establishments maysell a limited amount of a product they grow themselves.
The data published with NAICS code 444220 are com-prised of these parts of the following SIC industries:
5191 (pt.) Farm supplies dealers (retail)
5193 (pt.) Flower, nursery stock, and florists’ supplies mer-chants (retail)
5261 (pt.) Nursery and garden centers
4442201 Nursery and Garden Centers
Establishments primarily engaged in retailing nurserystock, bulbs, and other garden supplies and tools. Theseestablishments primarily sell products purchased fromothers, but may sell some plants which they grow them-selves.
4442202 Farm Supplies Dealers (Retail)
Establishments primarily engaged in retailing farm sup-plies. These establishments meet the wholesale trade clas-sification criteria under the 1987 Standard Industrial Clas-sification System.
Appendix B B−9
U.S. Census Bureau
4442203 Flower, Nursery Stock and Florists’Supplies Merchants (Retail)
Establishments primarily engaged in retailing flowers,nursery stock, and florists’ supplies. These establishmentsmeet the wholesale trade classification criteria under the1987 Standard Industrial Classification System.
445 Food and Beverage Stores
Industries in the Food and Beverage Stores subsector usu-ally retail food and beverage merchandise from fixedpoint-of-sale locations. Establishments in this subsectorhave special equipment (e.g., freezers, refrigerated displaycases, refrigerators) for displaying food and beveragegoods. They have staff trained in the processing of foodproducts to guarantee the proper storage and sanitaryconditions required by regulatory authority.
4451 Grocery Stores
This industry group comprises establishments primarilyengaged in retailing a general line of food products.
44511 Supermarkets and Other Grocery (exceptConvenience) Stores
This industry comprises establishments generally knownas supermarkets and grocery stores primarily engaged inretailing a general line of food, such as canned and frozenfoods; fresh fruits and vegetables; and fresh and preparedmeats, fish, and poultry. Included in this industry aredelicatessen-type establishments primarily engaged inretailing a general line of food.
445110 Supermarkets and Other Grocery (exceptConvenience) Stores
This U.S. industry comprises establishments generallyknown as supermarkets and grocery stores primarilyengaged in retailing a general line of food, such as cannedand frozen foods; fresh fruits and vegetables; and freshand prepared meats, fish, and poultry. Included in thisindustry are delicatessen-type establishments primarilyengaged in retailing a general line of food. The data pub-lished with NAICS code 445110 are comprised of theseparts of the following SIC industries:
5411 (pt.) Delicatessens, primarily selling meats and arange of grocery items
5411 (pt.) Supermarkets and grocery stores
4451101 Supermarkets and Grocery Stores
Establishments, known as supermarkets, food stores, gro-cery stores, and food warehouse stores, primarily engagedin retailing a general line of canned and frozen foods;fresh fruits and vegetables; fresh and prepared meats,fish, and poultry; eggs; bakery and dairy products; andother prepackaged grocery items.
4451102 Delicatessens, Primarily Selling Meatsand a Range of Grocery Items
Establishments, known as delicatessens, engaged in retail-ing prepared meats, such as cold cuts and oven-roastedand smoked meats and a full line of grocery items. Theseestablishments often prepare sandwiches and party plat-ters for carry-out consumption.
44512 Convenience Stores
This industry comprises establishments known as conve-nience stores or food marts (except those with fuelpumps) primarily engaged in retailing a limited line ofgoods that generally includes milk, bread, soda, andsnacks.
445120 Convenience Stores
This U.S. industry comprises establishments known asconvenience stores or food marts (except those with fuelpumps) primarily engaged in retailing a limited line ofgoods that generally includes milk, bread, soda, andsnacks.
The data published with NAICS code 445120 are com-prised of this part of the following SIC industry:
5411 (pt.) Convenience stores
4452 Specialty Food Stores
This industry group comprises establishments primarilyengaged in retailing specialized lines of food.
44521 Meat Markets
This industry comprises establishments primarily engagedin retailing fresh, frozen, or cured meats and poultry.Delicatessen-type establishments primarily engaged inretailing fresh meat are included in thisindustry.
445210 Meat Markets
This U.S. industry comprises establishments primarilyengaged in retailing fresh, frozen, or cured meats andpoultry. Delicatessen-type establishments primarilyengaged in retailing fresh meat are included in this indus-try.
The data published with NAICS code 445210 are com-prised of these parts of the following SIC industries:
5411 (pt.) Delicatessens, primarily selling fresh and pre-pared meats
5421 (pt.) Meat markets
4452101 Meat Markets
Establishments primarily engaged in retailing fresh, fro-zen, or cured meats. Meat markets may butcher animalsfor their own account, or they may buy from others. Estab-lishments selling poultry may kill or dress the poultry theysell.
B−10 Appendix B
U.S. Census Bureau

4452102 Delicatessens, Primarily Selling Freshand Prepared Meats
Establishments, known as delicatessens, engaged in retail-ing prepared meats, such as cold cuts and ovenroastedand smoked meats, and a limited line of grocery items,such as bread and condiments. These establishmentsoften prepare sandwiches and party platters for carry-outconsumption.
44522 Fish and Seafood Markets
This industry comprises establishments primarily engagedin retailing fresh, frozen, or cured fish and seafood prod-ucts.
445220 Fish and Seafood Markets
This U.S. industry comprises establishments primarilyengaged in retailing fresh, frozen, or cured fish and sea-food products.
The data published with NAICS code 445220 are com-prised of this part of the following SIC industry:
5421 (pt.) Fish and seafood markets
44523 Fruit and Vegetable Markets
This industry comprises establishments primarily engagedin retailing fresh fruits and vegetables.
445230 Fruit and Vegetable Markets
This U.S. industry comprises establishments primarilyengaged in retailing fresh fruits and vegetables.
The data published with NAICS code 445230 are com-prised of the following SIC industry:
5431 Fruit and vegetable markets
44529 Other Specialty Food Stores
This industry comprises establishments primarily engagedin retailing specialty foods (except meat, fish, seafood,and fruits and vegetables) not for immediate consumptionand not made on premises.
445291 Baked Goods Stores
This U.S. industry comprises establishments primarilyengaged in retailing baked goods not for immediate con-sumption and not made on the premises.
The data published with NAICS code 445291 are com-prised of this part of the following SIC industry:
5461 (pt.) Baked goods stores
445292 Confectionery and Nut Stores
This U.S. industry comprises establishments primarilyengaged in retailing candy and other confections, nuts,and popcorn not for immediate consumption and notmade on the premises.
The data published with NAICS code 445292 are com-prised of this part of the following SIC industry:
5441 (pt.) Confectionery and nut stores
445299 All Other Specialty Food Stores
This U.S. industry comprises establishments primarilyengaged in retailing miscellaneous specialty foods (exceptmeat, fish, seafood, fruit and vegetables, confections,nuts, popcorn, and baked goods) not for immediate con-sumption and not made on the premises.
The data published with NAICS code 445299 are com-prised of these parts of the following SIC industries:
5451 Dairy products stores
5499 (pt.) Miscellaneous food stores
4452991 Miscellaneous Food Stores
Establishments primarily engaged in retailing specializedfoods not elsewhere classified, such as eggs; packagedcoffee, tea, herbs, and spices; nationality foods; and otherspecialty foods, not for immediate consumption. Establish-ments may roast and grind the coffee they sell on the pre-mises. Included are establishments selling soft drinks foroff-premise consumption. Establishments bottling naturalor mineral water for retail sale are classified here if notengaged in pasteurization, carbonization, or other pro-cessing.
4452992 Dairy Products Stores
Establishments primarily engaged in retailing over-thecounter packaged dairy products, such as milk, cream,butter, cheese, and ice cream for off-premises consump-tion.
4453 Beer, Wine, and Liquor Stores
This NAICS Industry Group includes establishments classi-fied in the following NAICS Industry:
44531 Beer, Wine, and Liquor Stores
This industry comprises establishments primarily engagedin retailing packaged alcoholic beverages, such as ale,beer, wine, and liquor.
445310 Beer, Wine, and Liquor Stores
This U.S. industry comprises establishments primarilyengaged in retailing packaged alcoholic beverages, suchas ale, beer, wine, and liquor.
Appendix B B−11
U.S. Census Bureau

The data published with NAICS code 445310 are com-prised of the following SIC industry:
5921 Liquor stores
446 Health and Personal Care Stores
Industries in the Health and Personal Care Stores subsec-tor retail health and personal care merchandise from fixedpoint-of-sale locations. Establishments in this subsectorare characterized principally by the products they retail,and some health and personal care stores may have spe-cialized staff trained in dealing with the products. Staffmay include pharmacists, opticians, and other profession-als engaged in retailing, advising customers, and/or fittingthe product sold to the customer’s needs.
4461 Health and Personal Care Stores
This industry group comprises establishments primarilyengaged in retailing health and personal care products.
44611 Pharmacies and Drug Stores
This industry comprises establishments known as pharma-cies and drug stores engaged in retailing prescription ornonprescription drugs and medicines.
446110 Pharmacies and Drug Stores
This U.S. industry comprises establishments known aspharmacies and drug stores engaged in retailing prescrip-tion or nonprescription drugs and medicines.
The data published with NAICS code 4461 10 are com-prised of these parts of the following SIC industries:
5912 (pt.) Pharmacies and drug stores
5912 (pt.) Proprietary stores
4461101 Pharmacies and Drug Stores
Establishments primarily engaged in retailing prescriptiondrugs. Drug stores are classified here if any prescriptionsare sold or if there is an indication that a pharmacist isemployed. These establishments frequently sell otheritems, such as proprietary drugs, medicines, and healthand first-aid products; cosmetics; toiletries; greetingcards; magazines; tobacco; and candy.
4461102 Proprietary Stores
Establishments primarily engaged in retailing nonprescrip-tion drugs and medicines, health remedies, and first-aidproducts. These stores do not sell prescription drugs andfrequently sell other lines, such as beauty preparations,household supplies, and candy and prepackaged snacks.
44612 Cosmetics, Beauty Supplies, and PerfumeStores
This industry comprises establishments known as a cos-metic or perfume stores or beauty supply shops primarilyengaged in retailing cosmetics, perfumes, toiletries, andpersonal grooming products.
446120 Cosmetics, Beauty Supplies, and PerfumeStores
This U.S. industry comprises establishments known ascosmetic or perfume stores or beauty supply shops pri-marily engaged in retailing cosmetics, perfumes, toiletries,and personal grooming products.
The data published with NAICS code 446120 are com-prised of these parts of the following SIC industries:
5087 (pt.) Beauty and barber shop equipment and sup-plies stores (retail)
5999 (pt.) Cosmetics, beauty supplies, and perfume stores
4461201 Cosmetics, Beauty Supplies, and PerfumeStores
Establishments primarily engaged in selling cosmetics,beauty aids, and perfume.
4461202 Beauty and Barber Shop Equipment andSupplies Stores (Retail)
Establishments primarily engaged in retailing barber shopand beauty parlor equipment and supplies, such as furni-ture, hydraulic chairs, driers, shampoos, wave solutions,permanent waving supplies, barber soaps, and manicuringsupplies. These establishments meet the wholesale tradeclassification criteria under the 1987 Standard IndustrialClassification System.
44613 Optical Goods Stores
This industry comprises establishments primarily engagedin one or more of the following: (1) retailing and fittingprescription eyeglasses and contact lenses; (2) retailingprescription eyeglasses in combination with the grindingof lenses to order on the premises; and (3) selling nonpre-scription eyeglasses.
446130 Optical Goods Stores
This U.S. industry comprises establishments primarilyengaged in one or more of the following: (1) retailing andfitting prescription eyeglasses and contact lenses; (2)retailing prescription eyeglasses in combination with thegrinding of lenses to order on the premises; and (3) sellingnonprescription eyeglasses.
The data published with NAICS code 446130 are com-prised of the following SIC industry:
5995 Optical goods stores
B−12 Appendix B
U.S. Census Bureau

44619 Other Health and Personal Care Stores
This industry comprises establishments primarily engagedin retailing health and personal care items (except drugs,medicines, optical goods, perfumes, cosmetics, andbeauty supplies).
446191 Food (Health) Supplement Stores
This U.S. industry comprises establishments primarilyengaged in retailing food supplement products, such asvitamins, nutrition supplements, and body enhancingsupplements.
The data published with NAICS code 446191 are com-prised of this part of the following SIC industry:
5499 (pt.) Food (health) supplement stores
446199 All Other Health and Personal Care Stores
This U.S. industry comprises establishments primarilyengaged in retailing specialized lines of health and per-sonal care merchandise (except drugs, medicines, opticalgoods, cosmetics, beauty supplies, perfume, and foodsupplement products).
The data published with NAICS code 446199 are com-prised of these parts of the following SIC industries:
5047 (pt.) Surgical, medical, and hospital supplies stores(retail)
5999 (pt.) Health care stores
4461991 Health Care Stores
Establishments primarily engaged in retailing wheelchairsand other patient transport devices; gauze, bandages, andother surgical dressings; crutches, canes, and other walk-ing assistance devices; braces; surgical corsets; artificiallimbs; hearing aids; and other health care, convalescent,and sick room supplies.
4461992 Surgical, Medical, and Hospital SuppliesStores (Retail)
Establishments primarily engaged in retailing medicalinstruments, apparatus, and equipment; orthopedic appli-ances; crutches; bandages; breathing devices; wheeledchairs and beds; and other medical devices. These estab-lishments meet the wholesale trade classification criteriaunder the 1987 Standard Industrial Classification System.
447 Gasoline Stations
Industries in the Gasoline Stations subsector group estab-lishments retailing automotive fuels (e.g., gasoline, dieselfuel, gasohol) and automotive oils and retailing theseproducts in combination with convenience store items.These establishments have specialized equipment for thestorage and dispensing of automotive fuels.
4471 Gasoline Stations
This NAICS Industry Group includes establishments classi-fied in the following NAICS Industries:
44711, Gasoline Stations with Convenience Stores
44719, Other Gasoline Stations.
44711 Gasoline Stations with Convenience Stores
This industry comprises establishments engaged in retail-ing automotive fuels (e.g., diesel fuel, gasohol, gasoline)in combination with convenience store or food mart items.These establishments can either be in a convenience store(i.e., food mart) setting or a gasoline station setting. Theseestablishments may also provide automotive repair ser-vices.
447110 Gasoline Stations with Convenience Stores
This U.S. industry comprises establishments engaged inretailing automotive fuels (e.g., diesel fuel, gasohol, gaso-line) in combination with convenience store or food martitems. These establishments can either be in a conve-nience store (i.e., food mart) setting or a gasoline stationsetting. These establishments may also provide automo-tive repair services.
The data published with NAICS code 4471 10 are com-prised of these parts of the following SIC industries:
5411 (pt.) Convenience stores selling gasoline
5541 (pt.) Gasoline stations with convenience stores
4471101 Convenience Stores Selling Gasoline
Establishments primarily engaged in retailing a limited lineof groceries such as milk, bread, soda, snacks, and icecream, and also selling gasoline. These establishmentsmay also provide additional items, such as beer, house-hold cleaners, baby supplies, cigarettes, and painrelievers.
4471102 Gasoline Stations With ConvenienceStores
Establishments primarily engaged in retailing gasoline andautomotive lubricants and also selling a limited line ofgroceries, such as milk, eggs, bread, beer, cigarettes, andsnacks.
44719 Other Gasoline Stations
This industry comprises establishments known as gasolinestations (except those with convenience stores) primarilyengaged in one of the following: (1) retailing automotivefuels (e.g., diesel fuel, gasohol, gasoline) or (2) retailingthese fuels in combination with activities, such as repairservices, selling automotive oils, replacement parts, andaccessories, and/or with restaurants.
Appendix B B−13
U.S. Census Bureau
447190 Other Gasoline Stations
This U.S. industry comprises establishments known asgasoline stations (except those with convenience stores)primarily engaged in one of the following: (1) retailingautomotive fuels (e.g., diesel fuel, gasohol, gasoline) or (2)retailing these fuels in combination with activities, such asrepair services, selling automotive oils, replacement partsand accessories, and/or with restaurants.
The data published with NAICS code 447190 are com-prised of these parts of the following SIC industries:
5541 (pt.) Gasoline stations with no convenience stores
5541 (pt.) Truck stops
4471901 Gasoline Stations With No ConvenienceStores
Establishments primarily engaged in retailing gasoline andautomotive lubricants for automobiles and watercraft.These establishments may also sell tires, batteries, andaccessories, and perform related services, including minorrepair work and motor vehicle towing.
4471902 Truck Stops
Establishments primarily engaged in retailing diesel fuel totruckers. These establishments may also sell gasoline andlubricants, provide repair services, and operate a restau-rant or motel as part of the truck stop establishment.
448 Clothing and Clothing Accessories Stores
Industries in the Clothing and Clothing Accessories Storessubsector retailing new clothing and clothing accessoriesmerchandise from fixed point-of-sale locations. Establish-ments in this subsector have similar display equipmentand staff that is knowledgeable regarding fashion trendsand the proper match of styles, colors, and combinationsof clothing and accessories to the characteristics andtastes of the customer.
4481 Clothing Stores
This industry group comprises establishments primarilyengaged in retailing new clothing.
44811 Men’s Clothing Stores
This industry comprises establishments primarily engagedin retailing a general line of new men’s and boys’ clothing.These establishments may provide basic alterations, suchas hemming, taking in or letting out seams, or lengthen-ing or shortening sleeves.
448110 Men’s Clothing Stores
This U.S. industry comprises establishments primarilyengaged in retailing a general line of new men’s and boys’clothing. These establishments may provide basic alter-ations, such as hemming, taking in or letting out seams,or lengthening or shortening sleeves.
The data published with NAICS code 448110 are com-prised of the following SIC industry:
5611 Men’s and boy’s clothing and accessory stores
44812 Women’s Clothing Stores
This industry comprises establishments primarily engagedin retailing a general line of new women’s, misses’ andjuniors’ clothing, including maternity wear. These estab-lishments may provide basic alterations, such as hem-ming, taking in or letting out seams, or lengthening orshortening sleeves.
448120 Women’s Clothing Stores
This U.S. industry comprises establishments primarilyengaged in retailing a general line of new women’s,misses’ and juniors’ clothing, including maternity wear.These establishments may provide basic alterations, suchas hemming, taking in or letting out seams, or lengthen-ing or shortening sleeves.
The data published with NAICS code 448120 are com-prised of the following SIC industry:
5621 Women’s clothing stores
44813 Children’s and Infants’ Clothing Stores
This industry comprises establishments primarily engagedin retailing a general line of new children’s and infants’clothing. These establishments may provide basic alter-ations, such as hemming, taking in or letting out seams,or lengthening or shortening sleeves.
448130 Children’s and Infants’ Clothing Stores
This U.S. industry comprises establishments primarilyengaged in retailing a general line of new children’s andinfants’ clothing. These establishments may provide basicalterations, such as hemming, taking in or letting outseams, or lengthening or shortening sleeves.
The data published with NAICS code 448130 are com-prised of the following SIC industry:
5641 Children’s and infants’ wear stores
44814 Family Clothing Stores
This industry comprises establishments primarily engagedin retailing a general line of new clothing for men, women,and children, without specializing in sales for an indi-vidual gender or age group. These establishments mayprovide basic alterations, such as hemming, taking in orletting out seams, or lengthening or shortening sleeves.
448140 Family Clothing Stores
This U.S. industry comprises establishments primarilyengaged in retailing a general line of new clothing formen, women, and children, without specializing in sales
B−14 Appendix B
U.S. Census Bureau
for an individual gender or age group. These establish-ments may provide basic alterations, such as hemming,taking in or letting out seams, or lengthening or shorten-ing sleeves.
The data published with NAICS code 448140 are com-prised of the following SIC industry:
5651 Family clothing stores
44815 Clothing Accessories Stores
This industry comprises establishments primarily engagedin retailing single or combination lines of new clothingaccessories, such as hats and caps, costume jewelry,gloves, handbags, ties, wigs, toupees, and belts.
448150 Clothing Accessories Stores
This U.S. industry comprises establishments primarilyengaged in retailing single or combination lines of newclothing accessories, such as hats and caps, costume jew-elry, gloves, handbags, ties, wigs, toupees, and belts.
The data published with NAICS code 448150 are com-prised of these parts of the following SIC industries:
5632 (pt.) Women’s accessory stores
5699 (pt.) Miscellaneous accessory stores
4481501 Women’s Accessory Stores
Establishments primarily engaged in retailing women’s,juniors’, and misses’ accessories, such as hats, hosiery,costume jewelry, gloves, and handbags.
4481502 Miscellaneous Accessory Stores
Establishments primarily engaged in retailing specializedlines of accessories (except women’s), such as belts,umbrellas, wigs, and ties.
44819 Other Clothing Stores
This industry comprises establishments primarily engagedin retailing specialized lines of new clothing (except gen-eral lines of men’s, women’s, children’s, infants’, and fam-ily clothing). These establishments may provide basicalterations, such as hemming, taking in or letting outseams, or lengthening or shortening sleeves.
448190 Other Clothing Stores
This U.S. industry comprises establishments primarilyengaged in retailing specialized lines of new clothing(except general lines of men’s, women’s, children’s,infants’, and family clothing). These establishments mayprovide basic alterations, such as hemming, taking in orletting out seams, or lengthening or shortening sleeves.
The data published with NAICS code 448190 are com-prised of these parts of the following SIC industries:
5632 (pt.) Furriers and fur shops
5632 (pt.) Women’s specialty stores
5699 (pt.) Sports apparel stores
5699 (pt.) Miscellaneous apparel stores
4481901 Women’s Specialty Stores
Establishments primarily engaged in retailing a specializedline of women’s, juniors’, and misses’ clothing, such asbridal gowns, lingerie, negligees, and robes.
4481902 Furriers and Fur Shops
Establishments primarily engaged in retailing fur coatsand other fur apparel made to custom order. Establish-ments selling ready-made fur coats and other fur apparelare included here.
4481903 Sports Apparel Stores
Establishments primarily engaged in retailing sportsapparel, such as t-shirts, sweatshirts, sweatpants, caps,and shorts. These stores may also sell athletic footwear.
4481904 Miscellaneous Apparel Stores
Establishments primarily engaged in retailing miscella-neous lines of apparel, such as uniforms (except sportsuniforms), raincoats, bathing suits, and costumes.
4482 Shoe Stores
This NAICS Industry Group includes establishments classi-fied in the following NAICS Industry:
44821 Shoe Stores
This industry comprises establishments primarily engagedin retailing all types of new footwear (except hosiery andspecialty sports footwear, such as golf shoes, bowlingshoes, and spiked shoes). Establishments primarilyengaged in retailing new tennis shoes or sneakers areincluded in this industry.
448210 Shoe Stores
This U.S. industry comprises establishments primarilyengaged in retailing all types of new footwear (excepthosiery and specialty sports footwear, such as golf shoes,bowling shoes, and spiked shoes). Establishments primar-ily engaged in retailing new tennis shoes or sneakers areincluded in this industry.
The data published with NAICS code 448210 are com-prised of these parts of the following SIC industries:
5661 (pt.) Men’s shoe stores
5661 (pt.) Women’s shoe stores
5661 (pt.) Children’s and juveniles’ shoe stores
Appendix B B−15
U.S. Census Bureau
5661 (pt.) Family shoe stores
5661 (pt.) Athletic footwear stores
4482101 Men’s Shoe Stores
Establishments primarily engaged in retailing men’s shoes,boots, and other footwear. These establishments may alsosell hosiery and other accessories. Establishments special-izing in the sale of custom orthopedic shoes for men areclassified here.
4482102 Women’s Shoe Stores
Establishments primarily engaged in retailing women’sshoes, boots, and other footwear. Establishments special-izing in selling custom orthopedic shoes for women areclassified here. These establishments may also sell hosieryand other accessories.
4482103 Children’s and Juveniles’ Shoe Stores
Establishments primarily engaged in retailing children’sshoes and other footwear, including children’s athleticfootwear. Establishments specializing in selling customorthopedic shoes for children are classified here.
4482104 Family Shoe Stores
Establishments primarily engaged in retailing a combina-tion of men’s, women’s, and children’s footwear, withoutspecializing in any one line. These establishments fre-quently carry accessory lines, such as hosiery and hand-bags. Establishments specializing in selling custom ortho-pedic shoes for men, women, and children are includedhere.
4482105 Athletic Footwear Stores
Establishments primarily engaged in retailing athletic foot-wear. These establishments may also sell athletic apparel.
4483 Jewelry, Luggage, and Leather Goods Stores
This industry group comprises establishments primarilyengaged in retailing new jewelry (except costume jewelry);new silver and plated silverware; new watches and clocks;and new luggage with or without a general line of newleather goods and accessories, such as hats, gloves, hand-bags, ties, and belts.
44831 Jewelry Stores
This industry comprises establishments primarily engagedin retailing one or more of the following items: (1) newjewelry (except costume jewelry); (2) new sterling andplated silverware; and (3) new watches and clocks. Alsoincluded are establishments retailing these new productsin combination with lapidary work and/or repair services.
448310 Jewelry Stores
This U.S. industry comprises establishments primarilyengaged in retailing one or more of the following items:(1) new jewelry (except costume jewelry); (2) new sterlingand plated silverware; and (3) new watches and clocks.Also included are establishments retailing these new prod-ucts in combination with lapidary work and/or repair ser-vices.
The data published with NAICS code 448310 are com-prised of the following SIC industry:5944 jewelry stores
44832 Luggage and Leather Goods Stores
This industry comprises establishments known as luggageand leather goods stores primarily engaged in retailingnew luggage, briefcases, trunks, or these new products incombination with a general line of leather items (exceptleather apparel), such as belts, gloves, and handbags.
448320 Luggage and Leather Goods Stores
This U.S. industry comprises establishments known as lug-gage and leather goods stores primarily engaged in retail-ing new luggage, briefcases, trunks, or these new prod-ucts in combination with a general line of leather items(except leather apparel), such as belts, gloves, and hand-bags.
The data published with NAICS code 448320 are com-prised of the following SIC industry:5948 Luggage and leather goods stores
451 Sporting Goods, Hobby, Book, and MusicStores
Industries in the Sporting Goods, Hobby, Book, and MusicStores subsector are engaged in retailing and providingexpertise on use of sporting equipment or other specificleisure activities, such as needlework and musical instru-ments. Book stores are also included in this subsector.
4511 Sporting Goods, Hobby, and MusicalInstrument Stores
This industry group comprises establishments primarilyengaged in retailing new sporting goods, games and toys,and musical instruments.
45111 Sporting Goods Stores
This industry comprises establishments primarily engagedin retailing new sporting goods, such as bicycles andbicycle parts; camping equipment; exercise and fitnessequipment; athletic uniforms; specialty sports footwear;and sporting goods, equipment, and accessories.
B−16 Appendix B
U.S. Census Bureau
451110 Sporting Goods Stores
This U.S. industry comprises establishments primarilyengaged in retailing new sporting goods, such as bicyclesand bicycle parts; camping equipment; exercise and fit-ness equipment; athletic uniforms; specialty sports foot-wear; and sporting goods, equipment, and accessories.
The data published with NAICS code 451110 are com-prised of these parts of the following SIC industries:
5941 (pt.) General-line sporting goods stores
5941 (pt.) Other specialty-line sporting goods stores
5941 (pt.) Bicycle shops
5941 (pt.) Golf shops
5941 (pt.) Gun shops
5941 (pt.) Ski shops
5941 (pt.) Tackle shops
4511101 General-line Sporting Goods Stores
Establishments primarily engaged in retailing five or morelines of sporting goods and equipment, such as for camp-ing, fishing, riding, and other sports. These establish-ments may also sell clothing and shoes appropriate forsporting activities, including uniforms.
4511102 Specialty-line Sporting Goods Stores
Establishments primarily engaged in retailing a maximumof four lines of sporting goods, such as for camping, fish-ing, riding, and other sports. These establishments mayalso sell clothing and shoes appropriate for sportingactivities, including uniforms.
45111021 Bicycle Shops
Establishments primarily engaged in retailing bicycles(except motorized) and bicycle parts and accessories.These establishments may also rent and/or repairbicycles.
45111022 Golf Shops
Establishments primarily engaged in retailing golf equip-ment and accessories, including shoes. These establish-ments may also rent golf equipment and/or provide golflessons. Included are retail establishments operated bygolf professionals.
45111023 Gun Shops
Establishments primarily engaged in retailing firearms,ammunition, and hunters’ equipment and accessories.
45111024 Ski Shops
Establishments primarily engaged in retailing snow skiequipment and accessories, including ski boots and snow-boards. These establishments may also rent and/or repairski equipment.
45111025 Tackle Shops
Establishments primarily engaged in retailing tackle, bait,and fishing equipment and supplies. These establishmentsmay also rent fishing equipment.
45111026 Other Specialty-line Sporting GoodsStores
Establishments primarily engaged in retailing a maximumof four lines of sporting goods. These establishments mayalso sell clothing and shoes appropriate for the sportingactivity, including uniforms. Included are establishmentsselling gymnasium and playground equipment.
45112 Hobby, Toy, and Game Stores
This industry comprises establishments primarily engagedin retailing new toys, games, and hobby and craft supplies(except needlecraft).
451120 Hobby, Toy, and Game Stores
This U.S. industry comprises establishments primarilyengaged in retailing new toys, games, and hobby and craftsupplies (except needlecraft).
The data published with NAICS code 451120 are com-prised of these parts of the following SIC industries:
5945 (pt.) Hobby, toy, and game stores
5945 (pt.) Craft supplies stores
4511201 Hobby, Toy, and Game Stores
Establishments primarily engaged in retailing hobby sup-plies, toys, and games, including video games.
4511202 Craft Supplies Stores
Establishments primarily engaged in retailing a generalline of supplies for crafts, such as ceramics, shell craft,metal craft, felt craft, jewelry craft, dried flower and plantarrangements, wreaths, textile painting, and copper enam-eling.
45113 Sewing, Needlework, and Piece Goods Stores
This industry comprises establishments primarily engagedin retailing new sewing supplies, fabrics, patterns, yarns,and other needlework accessories or retailing these prod-ucts in combination with selling new sewing machines.
Appendix B B−17
U.S. Census Bureau

451130 Sewing, Needlework, and Piece GoodsStores
This U.S. industry comprises establishments primarilyengaged in retailing new sewing supplies, fabrics, pat-terns, yarns, and other needlework accessories or retailingthese products in combination with selling new sewingmachines.
The data published with NAICS code 451130 are com-prised of these parts of the following SIC industries:
5714 (pt.) Upholstery stores
5949 (pt.) Sewing, fabric, and piece goods stores
5949 (pt.) Needlework and knitting stores
4511301 Sewing, Fabric, and Piece Goods Stores
Establishments primarily engaged in retailing sewing sup-plies, fabrics, fabric patterns, and other piece goods sup-plies.
4511302 Needlework and Knitting Stores
Establishments primarily engaged in retailing laces, knit-ting supplies, yarn, and other needlework accessories.These establishments may also provide custom work.
4511303 Upholstery Stores
Establishments primarily engaged in retailing upholsterymaterial and slipcovers.
45114 Musical Instrument and Supplies Stores
This industry comprises establishments primarily engagedin retailing new musical instruments, sheet music, andrelated supplies; or retailing these new products in combi-nation with musical instrument repair, rental, or musicinstruction.
451140 Musical Instrument and Supplies Stores
This U.S. industry comprises establishments primarilyengaged in retailing new musical instruments, sheetmusic, and related supplies; or retailing these new prod-ucts in combination with musical instrument repair, rental,or music instruction.
The data published with NAICS code 451140 are com-prised of the following SIC industry:
5736 Musical instrument stores
4512 Book, Periodical, and Music Stores
This industry group comprises establishments primarilyengaged in retailing new books, newspapers, magazines,and prerecorded audio and video media.
45121 Book Stores and News Dealers
This industry comprises establishments primarily engagedin retailing new books, newspapers, magazines, and otherperiodicals.
451211 Book Stores
This U.S. industry comprises establishments primarilyengaged in retailing new books.
The data published with NAICS code 451211 are com-prised of these parts of the following SIC industries:
5942 (pt.) Book stores, general
5942 (pt.) Specialty book stores
5942 (pt.) College book stores
4512111 Book Stores, General
Establishments primarily engaged in retailing a generalline of new books. These establishments may also sell sta-tionery and related items, second-hand books, and maga-zines.
4512112 Specialty Book Stores
Establishments primarily engaged in retailing specialtybooks, such as general reference, religious, and profes-sional books.
4512113 College Book Stores
Establishments primarily engaged in retailing textbooks,generally on the college level. Most of these establish-ments are located on or near college campuses, and somesell more apparel than books. These establishments mayalso offer second-hand textbooks. School book stores,other than college, are included in this industry.
451212 News Dealers and Newsstands
This U.S. industry comprises establishments primarilyengaged in retailing current newspapers, magazines, andother periodicals.
The data published with NAICS code 451212 are com-prised of the following SIC industry:
5994 News dealers and newsstands
45122 Prerecorded Tape, Compact Disc, andRecord Stores
This industry comprises establishments primarily engagedin retailing new prerecorded audio and video tapes, com-pact discs (CDs), and phonograph records.
B−18 Appendix B
U.S. Census Bureau
451220 Prerecorded Tape, Compact Disc, andRecord Stores
This U.S. industry comprises establishments primarilyengaged in retailing new prerecorded audio and videotapes, compact discs (CDs), and phonograph records.
The data published with NAICS code 451220 are com-prised of these parts of the following SIC industries:
5735 (pt.) Prerecorded tape, compact disc, and recordstores
5735 (pt.) Video tape stores, retail
4512201 Prerecorded Tape, Compact Disc, andRecord Stores
Establishments primarily engaged in retailing compactdiscs, and prerecorded records and tapes.
4512202 Video Tape Stores, Retail
Establishments primarily engaged in retailing prerecordedvideo tapes and video laser discs. These establishmentsmay also sell blank video tapes.
452 General Merchandise Stores
Industries in the General Merchandise Stores subsectorretail new general merchandise from fixed point-of-salelocations. Establishments in this subsector are unique inthat they have the equipment and staff capable of retailinga large variety of goods from a single location. Thisincludes a variety of display equipment and staff trainedto provide information on many lines of products.
4521 Department Stores (Excluding LeasedDepartments)
This NAICS Industry includes establishments classified inthe following NAICS Industry:
45211, Department Stores.
4521 Department Stores (Including LeasedDepartments)
This NAICS Industry includes establishments classified inthe following NAICS Industry:
45211, Department Stores (Including Leased Depart-ments).
45211 Department Stores (Excluding LeasedDepartments)
This industry comprises establishments known as depart-ment stores primarily engaged in retailing a wide range ofthe following new products with no one merchandise linepredominating: apparel, furniture, appliances and homefurnishings; and selected additional items, such as paint,
hardware, toiletries, cosmetics, photographic equipment,jewelry, toys, and sporting goods. Merchandise lines arenormally arranged in separate departments.
452110 Department Stores (Excluding LeasedDepartments)
This U.S. industry comprises establishments known asdepartment stores primarily engaged in retailing a widerange of the following new products with no one merchan-dise line predominating: apparel, furniture, appliances andhome furnishings; and selected additional items, such aspaint, hardware, toiletries, cosmetics, photographic equip-ment, jewelry, toys, and sporting goods. Merchandiselines are normally arranged in separate departments.
The data published with NAICS code 452110 are com-prised of these parts of the following SIC industries:
5311 (pt.) Conventional department stores
5311 (pt.) Discount or mass merchandising departmentstores
5311 (pt.) National chain department stores
45211 Department Stores (Including LeasedDepartments)
This industry comprises establishments known as depart-ment stores primarily engaged in retailing a wide range ofthe following new products with no one merchandise linepredominating: apparel, furniture, appliances and homefurnishings; and selected additional items, such as paint,hardware, toiletries, cosmetics, photographic equipment,jewelry, toys, and sporting goods. Merchandise lines arenormally arranged in separate departments. Total salesinclude the sales from leased departments owned byanother company and operating within the departmentstore.
4521101 Conventional Department Stores(Excluding Leased Departments)
Establishments that satisfy the criteria of a departmentstore and: (1) usually provide check-out service and cus-tomer assistance (sales persons) within each department;(2) frequently have a catalog order desk; and (3) are notaffiliated with a company that operates similar establish-ments on a national basis. Sales of establishments thatoperate leased departments in conventional departmentstores are excluded.
4521101 Conventional Department Stores(Including Leased Departments)
Establishments that satisfy the criteria of a departmentstore and: (1) usually provide check-out service and cus-tomer assistance (sales persons) within each department;(2) frequently have a catalog order desk; and (3) are not
Appendix B B−19
U.S. Census Bureau
affiliated with a company that operates similar establish-ments on a national basis. Sales of establishments thatoperate leased departments in conventional departmentstores are included.
4521102 Discount or Mass MerchandisingDepartment Stores (Excluding LeasedDepartments)
Establishments that satisfy the criteria of a departmentstore and usually: (1) convey the image of a high-volume,fast-turnover outlet selling a variety of merchandise forless than conventional prices; (2) provide centralizedcheck-out service; and (3) provide minimal customer assis-tance within each department. Sales of establishmentsthat operate leased departments in discount or mass mer-chandising department stores are excluded.
4521103 National Chain Department Stores(Excluding Leased Departments)
Establishments that satisfy the criteria of a departmentstore and: (1) usually provide check-out service and cus-tomer assistance (sales persons) within each department;(2) frequently have a catalog order desk; and (3) are affili-ated with a company that operates similar establishmentson a national basis. Sales of establishments that operateleased departments in national chain department storesare excluded.
4529 Other General Merchandise Stores
This industry group comprises establishments primarilyengaged in retailing new goods in general merchandisestores (except. department stores).
45291 Warehouse Clubs and Superstores
This industry comprises establishments known as ware-house clubs, superstores or supercenters primarilyengaged in retailing a general line of groceries in combina-tion with general lines of new merchandise, such asapparel, furniture, and appliances.
452910 Warehouse Clubs and Superstores
This U.S. industry comprises establishments known aswarehouse clubs, superstores or supercenters primarilyengaged in retailing a general line of groceries in combina-tion with general lines of new merchandise, such asapparel, furniture, and appliances.
The data published with NAICS code 452910 are com-prised of these parts of the following SIC industries:
5311 (pt.) Supercenters
5399 (pt.) Warehouse clubs
5411 (pt.) Supermarket/general merchandise combinationstores
4529101 Warehouse Clubs
Establishments that sell general lines of merchandise,such as automotive tires, parts, and accessories; audioand video equipment; household appliances; office equip-ment and supplies; apparel; books; and groceries, throughwarehouse-based operations. These establishments aresometimes known as membership warehouse clubs.
4529102 Supermarket/General MerchandiseCombination Stores
Establishments primarily engaged in selling a full line ofperishable and nonperishable grocery items in combina-tion with hardware, clothing, and other general merchan-dise.
45291021 Supercenters
Establishments primarily engaged in selling a full line ofperishable and nonperishable grocery items in combina-tion with hardware, clothing, and other general merchan-dise. Sales of hardware, clothing, and other general mer-chandise are greater than sales of grocery items.
45291022 Supermarket/General MerchandiseCombination Stores
Establishments primarily engaged in selling a full line ofperishable and nonperishable grocery items in combina-tion with hardware, clothing, and other general merchan-dise. Sales of grocery items are greater than sales of hard-ware, clothing, and other general merchandise.
45299 All Other General Merchandise Stores
This industry comprises establishments primarily engagedin retailing new goods in general merchandise stores(except department stores, warehouse clubs, superstores,and supercenters). These establishments retail a generalline of new merchandise, such as apparel, automotiveparts, dry goods, hardware, groceries, housewares orhome furnishings, and other lines in limited amounts, withnone of the lines predominating.
452990 All Other General Merchandise Stores
This U.S. industry comprises establishments primarilyengaged in retailing new goods in general merchandisestores (except department stores, warehouse clubs, super-stores, and supercenters). These establishments retail ageneral line of new merchandise, such as apparel, automo-tive parts, dry goods, hardware, groceries, housewares orhome furnishings, and other lines in limited amounts, withnone of the lines predominating.
The data published with NAICS code 452990 are com-prised of these parts of the following SIC industries:
5331 Variety stores
B−20 Appendix B
U.S. Census Bureau

5399 (pt.) Miscellaneous general merchandise stores,except catalog showrooms and warehouse clubs
5399 (pt.) Catalog showrooms
5531 (pt.) Other auto and home supplies stores
4529901 Variety Stores
Establishments primarily engaged in selling a variety ofmerchandise, such as inexpensive apparel and accesso-ries, costume jewelry, notions and small wares, candy,toys, and other items in the low and popular price ranges.These establishments generally do not carry a completeline of merchandise, are not departmentalized, do notoffer their own charge service, and do not deliver mer-chandise.
4529902 Catalog Showrooms
Establishments primarily engaged in selling general linesof merchandise, such as jewelry, home furnishings, house-wares, electronics, and sporting goods, from catalog dis-plays of inventory at location.
4529903 Miscellaneous General MerchandiseStores
Establishments primarily engaged in selling limited linesof merchandise, such as apparel and accessories, drygoods, hardware, housewares, home furnishings, or acombination of auto and home products.
45299031 Miscellaneous General MerchandiseStores, Except Catalog Showrooms and WarehouseClubs
Establishments primarily engaged in selling limited linesof merchandise, such as apparel and accessories, drygoods, hardware, housewares, and home furnishings.Establishments known as country general stores are alsoincluded.
45299032 Other Auto and Home Supplies Stores
Establishments that sell a combination of auto and homeproducts, such as tires, batteries, and accessories; house-hold appliances; sporting goods; housewares; and hard-ware. These establishments differ from auto suppliesstores in that although the largest sales of merchandisemay be in lines of automotive supplies, parts, and acces-sories, a considerable amount of sales also are in nonauto-motive lines.
453 Miscellaneous Store Retailers
Industries in the Miscellaneous Store Retailers subsectorretail merchandise from fixed point-of-sale locations(except new or used motor vehicles and parts; new furni-ture and house furnishings; new appliances and electronicproducts; new building materials; and garden equipmentand supplies; food and beverages; health and personal
care goods; gasoline; new clothing and accessories; andnew sporting goods, hobby goods, books, and music).Establishments in this subsector include stores withunique characteristics like florists, used merchandisestores, and pet and pet supply stores as well as otherstore retailers.
4531 Florists
This NAICS Industry Group includes establishments classi-fied in the following NAICS Industry:
45311 Florists
This industry comprises establishments known as floristsprimarily engaged in retailing cut flowers, floral arrange-ments, and potted plants purchased from others. Theseestablishments usually prepare the arrangements theysell.
453110 Florists
This U.S. industry comprises establishments known as flo-rists primarily engaged in retailing cut flowers, floralarrangements, and potted plants purchased from others.These establishments usually prepare the arrangementsthey sell.
The data published with NAICS code 453110 are com-prised of the following SIC industry:
5992 Florists
4532 Office Supplies, Stationery, and Gift Stores
This NAICS Industry Group includes establishments classi-fied in the following NAICS Industries:
45321, Office Supplies and Stationary Stores; and
45322, Gift, Novelty, and Souvenir Stores.
45321 Office Supplies and Stationery Stores
This industry comprises establishments primarily engagedin one or more of the following: (1) retailing new statio-nery, school supplies, and office supplies; (2) selling acombination of new office equipment, furniture, and sup-plies; and (3) selling new office equipment, furniture, andsupplies in combination with selling new computers.
453210 Office Supplies and Stationery Stores
This U.S. industry comprises establishments primarilyengaged in one or more of the following: (1) retailing newstationery, school supplies, and office supplies; (2) sellinga combination of new office equipment, furniture, andsupplies; and (3) selling new office equipment, furniture,and supplies in combination with selling new computers.
The data published with NAICS code 453210 are com-prised of these parts of the following SIC industries:
5049 (pt.) School supplies stores (retail)
Appendix B B−21
U.S. Census Bureau

5112 (pt.) Other office supplies stores (retail)
5943 (pt.) Stationery stores
5943 (pt.) Office supplies stores
4532101 Stationery Stores
Establishments primarily engaged in retailing stationery,such as paper and paper products, postcards, paper novel-ties, and scrapbooks. These establishments may also per-form incidental printing and engraving.
4532102 Office Supplies Stores
Establishments primarily engaged in retailing a generalline of office supplies, such as accounting and legal forms,blankbooks, and office forms and supplies. School andteacher supply stores are included in this classification.
45321021 Office Supplies Stores
Establishments primarily engaged in retailing a generalline of office supplies, such as accounting and legal forms,blankbooks, and office forms and supplies. School andteacher supply stores are included in this classification.
45321022 School Supplies Stores (Retail)
Establishments primarily engaged in retailing a wide vari-ety of school supplies, such as black boards, chalk, rulers,globes, wall maps, audio/video aids, computer aids,books, and teaching displays. These establishments meetthe wholesale trade classification criteria under the 1987Standard Industrial Classification System.
45321023 Other Office Supplies Stores (Retail)
Establishments primarily engaged in retailing office sup-plies, such as computer and photocopy supplies, enve-lopes, typewriter and mimeograph paper, file cards andfolders, pens, and pencils. These establishments meet thewholesale trade classification criteria under the 1987Standard Industrial Classification System.
45322 Gift, Novelty, and Souvenir Stores
This industry comprises establishments primarily engagedin retailing new gifts, novelty merchandise, souvenirs,greeting cards, seasonal and holiday decorations, andcurios.
453220 Gift, Novelty, and Souvenir Stores
This U.S. industry comprises establishments primarilyengaged in retailing new gifts, novelty merchandise, sou-venirs, greeting cards, seasonal and holiday decorations,and curios. The data published with NAICS code 453220are comprised of the following SIC industry:
5947 Gift, novelty, and souvenir shops
4533 Used Merchandise Stores
This NAICS Industry Group includes establishments classi-fied in the following NAICS Industry:
45331, Used Merchandise Stores.
45331 Used Merchandise Stores
This industry comprises establishments primarily engagedin retailing used merchandise, antiques, and secondhandgoods (except motor vehicles, such as automobiles, RVs,motorcycles, and boats; motor vehicle parts; tires; andmobile homes).
453310 Used Merchandise Stores
This U.S. industry comprises establishments primarilyengaged in retailing used merchandise, antiques, and sec-ondhand goods (except motor vehicles, such as automo-biles, RVs, motorcycles, and boats; motor vehicle parts;tires; and mobile homes).
The data published with NAICS code 453310 are com-prised of these parts of the following SIC industries:
5932 (pt.) Antique stores
5932 (pt.) Second-hand stores, except pawn shops
4533101 Antique Stores
Establishments primarily engaged in retailing antique fur-niture and home furnishings, antique glassware, rarebooks and manuscripts, and other antique objects of art.
4533102 Second-hand Stores, Except Pawn Shops
Establishments primarily engaged in retailing used mer-chandise, such as clothing, shoes, furniture, home furnish-ings, appliances, electronics, books (except rare), musicalinstruments, compact discs, tapes, records, lumber, andbuilding materials.
4539 Other Miscellaneous Store Retailers
This industry group comprises establishments primarilyengaged in retailing new miscellaneous specialty storemerchandise (except motor vehicle and parts dealers; fur-niture and home furnishings stores; consumer-type elec-tronics and appliance stores; building material and gardenequipment and supplies dealers; food and beveragestores; health and personal care stores; gasoline stations;clothing and clothing accessories stores; sporting goods,hobby, book, and music stores; general merchandisestores; florists; office supplies, stationery, and gift stores;and used merchandise stores).
45391 Pet and Pet Supplies Stores
This industry comprises establishments primarily engagedin retailing pets, pet foods, and pet supplies.
B−22 Appendix B
U.S. Census Bureau

453910 Pet and Pet Supplies Stores
This U.S. industry comprises establishments primarilyengaged in retailing pets, pet foods, and pet supplies.
The data published with NAICS code 453910 are com-prised of this part of the following SIC industry:
5999 (pt.) Pet and pet supplies stores
45392 Art Dealers
This industry comprises establishments primarily engagedin retailing original and limited edition art works. Includedin this industry are establishments primarily engaged indisplaying works of art for retail sale in art galleries.
453920 Art Dealers
This U.S. industry comprises establishments primarilyengaged in retailing original and limited edition art works.Included in this industry are establishments primarilyengaged in displaying works of art for retail sale in art gal-leries.
The data published with NAICS code 453920 are com-prised of this part of the following SIC industry:
5999 (pt.) Art dealers
45393 Manufactured (Mobile) Home Dealers
This industry comprises establishments primarily engagedin retailing new and/or used manufactured homes (i.e.,mobile homes), parts, and equipment.
453930 Manufactured (Mobile) Home Dealers
This U.S. industry comprises establishments primarilyengaged in retailing new and/or used manufacturedhomes (i.e., mobile homes), parts, and equipment.
The data published with NAICS code 453930 are com-prised of the following SIC industry:
5271 Mobile home dealers
45399 All Other Miscellaneous Store Retailers
This industry comprises establishments primarily engagedin retailing specialized lines of merchandise (except motorvehicle and parts dealers; furniture and home furnishingsstores; electronic and appliance stores; building materialand garden equipment and supplies dealers; food andbeverage stores; health and personal care stores; gasolinestations; clothing and clothing accessories stores; sportinggoods, hobby, book, and music stores; general merchan-dise stores; florists; office supplies, stationery and giftstores; used merchandise stores; pet and pet supplies; artdealers; and manufactured home (i.e., mobile home) deal-ers). This industry also includes establishments primarilyengaged in retailing a general line of new and used mer-chandise on an auction basis.
453991 Tobacco Stores
This U.S. industry comprises establishments primarilyengaged in retailing cigarettes, cigars, tobacco, pipes, andother smokers’ supplies.
The data published with NAICS code 453991 are com-prised of the following SIC industry:
5993 Tobacco stores and stands
453998 All Other Miscellaneous Store Retailers(Except Tobacco Stores)
This U.S. industry comprises establishments primarilyengaged in retailing specialized lines of merchandise(except motor vehicle and parts dealers; furniture andhome furnishings stores; electronic and appliance stores;building material and garden equipment and suppliesdealers; food and beverage stores; health and personalcare stores; gasoline stations; clothing and clothing acces-sories stores; sporting goods, hobby, book and musicstores; general merchandise stores; florists; office sup-plies, stationery and gift stores; used merchandise stores;pet and pet supplies stores; art dealers; manufacturedhome (i.e., mobile homes) dealers; and tobacco stores).This industry also includes establishments primarilyengaged in retailing a general line of new and used mer-chandise on an auction basis.
The data published with NAICS code 453998 are com-prised of these parts of the following SIC industries:
5999 (pt.) Collectors’ items and supplies stores
5999 (pt.) Trophy shops
5999 (pt.) Other miscellaneous store retailers, n.e.c.
4539981 Collectors’ Items and Supplies Stores
Establishments primarily engaged in retailing collectors’items and supplies, such as stamps, autographs, sportscards, and coins.
4539982 Trophy Shops
Establishments primarily engaged in retailing trophies,plaques, and other award items to individuals and teams.These establishments may perform incidental engraving.
4539983 Other Miscellaneous Store Retailers,N.E.C.
Establishments primarily engaged in retailing specializedlines, such as artists’ supplies, party supplies, swimmingpools (above ground) and supplies, monuments and tomb-stones, fireworks, and religious goods (except jewelry andbooks). Included are establishments primarily engaged inselling a general line of new and used merchandise on anauction basis.
Appendix B B−23
U.S. Census Bureau

454 Nonstore Retailers
Industries in the Nonstore Retailers subsector retail mer-chandise using methods, such as the broadcasting of info-mercials, the broadcasting and publishing of direct-response advertising, the publishing of paper andelectronic catalogues, door-to-door solicitation, in-homedemonstration, selling from portable stalls and distribu-tion through vending machines. Establishments in thissubsector include mail-order houses, vending machineoperators, home delivery sales, door-to-door sales, partyplan sales, electronic shopping, and sales through por-table stalls (e.g., street vendors, except food). Establish-ments engaged in the direct sale (i.e., nonstore) of prod-ucts, such as home heating oil dealers, newspaperdelivery are included in this subsector.
4541 Electronic Shopping and Mail-Order Houses
This NAICS Industry Group includes establishments classi-fied in the following NAICS Industry:
45411 Electronic Shopping and Mail-Order Houses
This industry comprises establishments primarily engagedin retailing all types of merchandise by means of mail orby electronic media, such as interactive television or com-puter. Included in this industry are establishments primar-ily engaged in retailing from catalogue showrooms ofmail-order houses.
454110 Electronic Shopping and Mail-OrderHouses
This U.S. industry comprises establishments primarilyengaged in retailing all types of merchandise by means ofmail or by electronic media, such as interactive televisionor computer. Included in this industry are establishmentsprimarily engaged in retailing from catalogue showroomsof mail-order houses.
The data published with NAICS code 4541 10 are com-prised of these parts of the following SIC industries:
5961 (pt.) Mail-order houses, department store merchan-dise
5961 (pt.) Mail-order houses, other general merchandise
5961 (pt.) Mail-order houses, specialized merchandise
5961 (pt.) Television order, home shopping
4541101 Mail-order Houses, Department StoreMerchandise
Establishments primarily engaged as mail-order housesretailing all of the following lines of merchandise: furni-ture; home furnishings; appliances; radios and televisions;household linens and dry goods; and apparel. Theseestablishments are affiliated with department store chains.
4541102 Mail-order Houses, Other GeneralMerchandise
Establishments primarily engaged as mail-order housesselling a variety of merchandise and not affiliated withdepartment store chains.
4541103 Mail-order Houses, SpecializedMerchandise
Establishments primarily engaged as mail-order housesselling a single item or a group of related items such asfoods; apparel and accessories; computers and computersoftware; appliances, televisions, audio equipment, furni-ture, floor coverings, kitchenware, and home furnishings;books and stationery; proprietary medicines; antiques;used merchandise; sporting goods; silverware; cigars andcigarettes; cameras and photographic equipment; giftsand novelties; optical goods; leather goods; artists’ sup-plies; pet supplies; hobby equipment; and toys andgames. Book and music clubs are included in this industry.
4541104 Television Order, Home Shopping
Establishments primarily engaged in selling merchandisethrough television shop-at-home programs. These estab-lishments receive orders by phone and fill them by mail.
4542 Vending Machine Operators
This NAICS Industry Group includes establishments classi-fied in the following NAICS Industry:
45421, Vending Machine Operators.
45421 Vending Machine Operators
This industry comprises establishments primarily engagedin retailing merchandise through vending machines thatthey service.
454210 Vending Machine Operators
This U.S. industry comprises establishments primarilyengaged in retailing merchandise through vendingmachines that they service.
The data published with NAICS code 454210 are com-prised of the following SIC industry:
5962 Automatic merchandising machine operators
4543 Direct Selling Establishments
This industry group comprises establishments primarilyengaged in nonstore retailing (except electronic, mail-order, or vending machine sales). These establishmentstypically go to the customers’ location rather than the cus-tomer coming to them (e.g., door-to-door sales, home par-ties). Examples of establishments in this industry arehome delivery newspaper routes; home delivery of heat-ing oil, liquefied petroleum (LP) gas, and other fuels;
B−24 Appendix B
U.S. Census Bureau
locker meat provisioners; frozen food and freezer planproviders; coffee break services providers; and bottledwater or water softener services.
45431 Fuel Dealers
This industry comprises establishments primarily engagedin retailing heating oil, liquefied petroleum (LP) gas, andother fuels via direct selling.
454311 Heating Oil Dealers
This U.S. industry comprises establishments primarilyengaged in retailing heating oil via direct selling.
The data published with NAICS code 45431 1 are com-prised of these parts of the following SIC industries:
5171 (pt.) Heating oil dealers (selling for consumption -retail)
5983 Fuel oil dealers
4543111 Heating Oil Dealers
Establishments primarily engaged in selling fuel oil. Theseestablishments may also repair and service fuel oil heatingequipment.
4543112 Heating Oil Dealers (Selling forConsumption - Retail)
Establishments primarily engaged in selling heating oil forconsumption (end use). These establishments may alsoprovide repair and maintenance services in conjunctionwith the sale. These establishments meet the wholesaletrade classification criteria under the 1987 Standard Indus-trial Classification System.
454312 Liquefied Petroleum Gas (Bottled Gas)Dealers
This U.S. industry comprises establishments primarilyengaged in retailing liquefied petroleum (LP) gas via directselling.
The data published with NAICS code 454312 are com-prised of these parts of the following SIC industries:
5171 (pt.) Liquefied petroleum dealers (selling for con-sumption retail)
5984 Liquefied petroleum gas (bottled gas) dealers
4543121 Liquefied Petroleum Gas (Bottled Gas)Dealers
Establishments primarily engaged in selling bottled orbulk liquefied petroleum (LP) gas.
4543122 Liquefied Petroleum Dealers (Selling forConsumption - Retail)
Establishments primarily engaged in selling liquefiedpetroleum gases for consumption (end use). These estab-lishments meet the wholesale trade classification criteriaunder the 1987 Standard Industrial Classification System.
454319 Other Fuel Dealers
This U.S. industry comprises establishments primarilyengaged in retailing fuels (except liquefied petroleum gasand heating oil) via direct selling.
The data published with NAICS code 454319 are com-prised of the following SIC industry:
5989 Fuel dealers, not elsewhere classified
45439 Other Direct Selling Establishments
This industry comprises establishments primarily engagedin retailing merchandise (except food for immediate con-sumption and fuel) via direct sale to the customer bymeans, such as in-house sales (i.e., party plan merchandis-ing), truck or wagon sales, and portable stalls (i.e., streetvendors).
454390 Other Direct Selling Establishments
This U.S. industry comprises establishments primarilyengaged in retailing merchandise (except food for immedi-ate consumption and fuel) via direct sale to the customerby means, such as in-house sales (i.e., party plan mer-chandising), truck or wagon sales, and portable stalls (i.e.,street vendors).
The data published with NAICS code 454390 are com-prised of these parts of the following SIC industries:
5421 (pt.) Freezer and locker meat provisioners
5963 (pt.) Direct selling, furniture, home furnishings, elec-tronics, and appliances
5963 (pt.) Direct selling, videos, tapes, compact discs, andrecords
5963 (pt.) Direct selling, books and magazines
5963 (pt.) Direct selling, stationery
5963 (pt.) Direct selling, newspapers
5963 (pt.) Direct selling, cameras and photographic equip-ment
5963 (pt.) Direct selling, all other merchandise
4543901 Direct Selling, Furniture, HomeFurnishings, Electronics, and Appliances
Establishments primarily engaged in the direct selling ofhousehold appliances, furniture, floor coverings, draper-ies, curtains, china, glassware, kitchen utensils, cutlery,
Appendix B B−25
U.S. Census Bureau
housewares, brooms and brushes, lamps, mirrors, pic-tures, window shades and blinds, radios, televisions, con-sumer electronics, and other home furnishings.
45439011 Direct Selling, Furniture, HomeFurnishings, Electronics, and Appliances
Establishments primarily engaged in the direct selling ofhousehold appliances, furniture, floor coverings, draper-ies, curtains, china, glassware, kitchen utensils, cutlery,housewares, brooms and brushes, lamps, mirrors, pic-tures, window shades and blinds, radios, televisions, con-sumer electronics, and other home furnishings.
45439012 Direct Selling, Cameras andPhotographic Equipment
Establishments primarily engaged in the direct selling ofcameras and photographic equipment.
4543902 Direct Selling, Books, Periodicals, Videos,and Compact Discs
Establishments primarily engaged in the direct selling ofbooks, periodicals, videos, and compact discs.
45439021 Direct Selling, Videos, Tapes, CompactDiscs, and Records
Establishments primarily engaged in the direct selling ofvideos, tapes, compact discs, and records.
45439022 Direct Selling, Books and Magazines
Establishments primarily engaged in the direct selling ofbooks, magazine subscriptions, and encyclopedias.
45439023 Direct Selling, Newspapers
Establishments primarily engaged in the direct selling ofnewspapers.
4543903 Direct Selling, Other Merchandise
Establishments primarily engaged in the direct selling ofmerchandise not elsewhere classified.
45439031 Direct Selling, Stationery Establish-ments primarily engaged in the direct selling ofstationery.
45439032 Freezer and Locker Meat Provisioners
Establishments primarily engaged in the retail sale, on abulk basis, of meat for freezer storage and in providinghome freezer meat plans.
45439033 Direct Selling, All Other Merchandise
Establishments primarily engaged in the direct selling ofmerchandise such as building materials; hardware; lawnand garden supplies; grocery items (except freezer meatand foods/beverages for immediate consumption); apparel
and accessories; cosmetics; proprietary medicines; usedmerchandise; sporting goods; jewelry; tobacco products;gifts, novelties and souvenirs; optical goods; leathergoods; hobby equipment; religious articles; greetingcards; toys and games; and bottled water and coffee sup-plies.
722 Food Services and Drinking Places
Industries in the Food Services and Drinking Places sub-sector prepare meals, snacks, and beverages to customerorder for immediate on-premises and off-premises con-sumption. There is a wide range of establishments inthese industries. Some provide food and drink only; whileothers provide various combinations of seating space,waiter/waitress services and incidental amenities, such aslimited entertainment. The industries in the subsector aregrouped based on the type and level of services provided.The industry groups are full-service restaurants; limited-service eating places; special food services, such as foodservice contractors, caterers, and mobile food services,and drinking places. Food services and drink activities athotels and motels; amusement parks, theaters, casinos,country clubs, and similar recreational facilities; and civicand social organizations are included in this subsectoronly if these services are provided by a separate establish-ment primarily engaged in providing food and beverageservices.
Excluded from this subsector are establishments operatingdinner cruises. These establishments are classified in Sub-sector 487, Scenic and Sightseeing Transportation becausethose establishments utilize transportation equipment toprovide scenic recreational entertainment.
7221 Full-Service Restaurants
This industry group comprises establishments primarilyengaged in providing food services to patrons who orderand are served while seated (i.e., waiter/waitress service)and pay after eating. Establishments that provide thesetype of food services to patrons with any combination ofother services, such as carryout services are classified inthis industry.
72211 Full-Service Restaurants
This industry comprises establishments primarily engagedin providing food services to patrons who order and areserved while seated (i.e. waiter/waitress service) and payafter eating. These establishments may provide this typeof food services to patrons in combination with sellingalcoholic beverages, providing takeout services, or pre-senting live nontheatrical entertainment.
722110 Full-Service Restaurants
This U.S. industry comprises establishments primarilyengaged in providing food services to patrons who orderand are served while seated (i.e. waiter/waitress service)
B−26 Appendix B
U.S. Census Bureau

and pay after eating. These establishments may providethis type of food services to patrons in combination withselling alcoholic beverages, providing takeout services, orpresenting live nontheatrical entertainment.
The data published with NAICS code 722110 are com-prised of this part of the following SIC industry:
5812 (pt.) Full-service restaurants
7222 Limited-Service Eating Places
This industry group comprises establishments primarilyengaged in providing food services where patrons gener-ally order or select items and pay before eating. Mostestablishments do not have waiter/waitress service, butsome provide limited service, such as cooking to order(i.e., per special request), bringing food to seated custom-ers, or providing off-site delivery.
72221 Limited-Service Eating Places
This industry comprises establishments primarily engagedin (1) providing food services where patrons generallyorder or select items and pay before eating or (2) selling aspecialty snack or nonalcoholic beverage for consumptionon or near the premises. Food and drink may be con-sumed on the premises, taken out, or delivered to custom-ers’ location. Some establishments in this industry mayprovide these food services (except snack and nonalco-holic beverage bars) in combination with selling alcoholicbeverages.
722211 Limited-Service Restaurants
This U.S. industry comprises establishments primarilyengaged in providing food services (except snack andnonalcoholic beverage bars) where patrons generally orderor select items and pay before eating. Food and drink maybe consumed on premises, taken out, or delivered to cus-tomers’ location. Some establishments in this industrymay provide these food services in combination with sell-ing alcoholic beverages.
The data published with NAICS code 722211 are com-prised of this part of the following SIC industry:
5812 (pt.) Limited-service restaurants
722212 Cafeterias
This U.S. industry comprises establishments, known ascafeterias, primarily engaged in preparing and servingmeals for immediate consumption using cafeteria-styleserving equipment, such as steam tables, a refrigeratedarea, and self-service nonalcoholic beverage dispensingequipment. Patrons select from food and drink items ondisplay in a continuous cafeteria line.
The data published with NAICS code 722212 are com-prised of this part of the following SIC industry:
5812 (pt.) Cafeterias
722213 Snack and Nonalcoholic Beverage Bars
This U.S. industry comprises establishments primarilyengaged in (1) preparing and/or serving a specialty snack,such as ice cream, frozen yogurt, cookies, or popcorn or(2) serving nonalcoholic beverages, such as coffee, juices,or sodas for consumption on or near the premises. Theseestablishments may carry and sell a combination of snack,nonalcoholic beverage, and other related products (e.g.,coffee beans, mugs, coffee makers) but generally promoteand sell a unique snack or nonalcoholic beverage.
The data published with NAICS code 722213 are com-prised of these parts of the following SIC industries:
5461 (pt.) Cookie shops
5461 (pt.) Donut shops, baking on premises
5461 (pt.) Donut shops, no baking on premises
5812 (pt.) Ice cream and soft serve shops
5812 (pt.) Frozen yogurt shops
5812 (pt.) Bagel shops
5812 (pt.) Coffee shops
5812 (pt.) Other snack and nonalcoholic beverage bars
7222131 Ice Cream and Soft Serve Shops
Establishments primarily engaged in selling ice creamand/or frozen custard for immediate consumption.
7222132 Frozen Yogurt Shops
Establishments primarily engaged in selling frozen yogurtfor immediate consumption.
7222133 Donut Shops
Establishments primarily engaged in selling donuts, forconsumption on or off the premises.
72221331 Donut Shops, Baking on Premises
Establishments primarily engaged in selling donuts bakedon the premises.
72221332 Donut Shops, No Baking on Premises
Establishments primarily engaged in selling donuts notbaked on the premises.
7222134 Bagel Shops
Establishments primarily engaged in selling bagels, includ-ing bagel sandwiches, for consumption on or off the pre-mises. Establishments primarily engaged in selling bulkbagels to retail customers are also included.
Appendix B B−27
U.S. Census Bureau
7222135 Coffee Shops
Establishments primarily engaged in selling freshlybrewed coffee, for consumption on or off the premises.Establishments providing beverage teas are also included.The sale of food frequently accounts for a substantial por-tion of the sales of these establishments.
7222136 Cookie Shops
Establishments primarily engaged in selling cookies.
7222137 Other Snack and Nonalcoholic BeverageBars
Establishments primarily engaged in selling specialtysnacks and beverages such as pretzels, sodas, and juicesfrom permanent sites for immediate consumption on ornear the premises.
7223 Special Food Services
This industry group comprises establishments primarilyengaged in providing one of the following food services:(1) at the customers’ location; (2) a location designated bythe customer; or (3) from motorized vehicles or nonmotor-ized carts.
72231 Food Service Contractors
This industry comprises establishments primarily engagedin providing food services at institutional, governmental,commercial, or industrial locations of others based oncontractual arrangements with these type of organizationsfor a specified period of time. The establishments of thisindustry provide food services for the convenience of thecontracting organization or the contracting organization’scustomers. The contractual arrangement of these estab-lishments with contracting organizations may vary fromtype of facility operated (e.g., cafeteria, restaurant, fast-food eating place), revenue sharing, cost structure, to pro-viding personnel. Management staff is always provided bythe food services contractor.
722310 Food Service Contractors
This U.S. industry comprises establishments primarilyengaged in providing food services at institutional, gov-ernmental, commercial, or industrial locations of othersbased on contractual arrangements with these type oforganizations for a specified period of time. The establish-ments of this industry provide food services for the conve-nience of the contracting organization or the contractingorganization’s customers. The contractual arrangement ofthese establishments with contracting organizations mayvary from type of facility operated (e.g., cafeteria, restau-rant, fast-food eating place), revenue sharing, cost struc-ture, to providing personnel. Management staff is alwaysprovided by the food services contractor.
The data published with NAICS code 722310 are com-prised of this part of the following SIC industry:
5812 (pt.) Food service contractors
72232 Caterers
This industry comprises establishments primarily engagedin providing single event-based food services. Theseestablishments generally have equipment and vehicles totransport meals and snacks to events and/or prepare foodat an off-premise site. Banquet halls with catering staff areincluded in this industry. Examples of events catered byestablishments in this industry are graduation parties,wedding receptions, business or retirement luncheons,and trade shows.
722320 Caterers
This U.S. industry comprises establishments primarilyengaged in providing single event-based food services.These establishments generally have equipment andvehicles to transport meals and snacks to events and/orprepare food at an off-premise site. Banquet halls withcatering staff are included in this industry. Examples ofevents catered by establishments in this industry aregraduation parties, wedding receptions, business or retire-ment luncheons, and trade shows.
The data published with NAICS code 722320 are com-prised of this part of the following SIC industry:
5812 (pt.) Caterers
72233 Mobile Food Services
This industry comprises establishments primarily engagedin preparing and serving meals and snacks for immediateconsumption from motorized vehicles or nonmotorizedcarts. The establishment is the central location from whichthe caterer route is serviced, not each vehicle, or cart.Included in this industry are establishments primarilyengaged in providing food services from vehicles, such ashot dog cart, and ice cream truck.
722330 Mobile Food Services
This U.S. industry comprises establishments primarilyengaged in preparing and serving meals and snacks forimmediate consumption from motorized vehicles or non-motorized carts. The establishment is the central locationfrom which the caterer route is serviced, not each vehicle,or cart. Included in this industry are establishments pri-marily engaged in providing food services from vehicles,such as hot dog cart, and ice cream truck.
The data published with NAICS code 722330 are com-prised of this part of the following SIC industry:
5963 (pt.) Mobile food services
B−28 Appendix B
U.S. Census Bureau

7224 Drinking Places (Alcoholic Beverages)
This industry group comprises establishments primarilyengaged in preparing and serving alcoholic beverages forimmediate consumption.
72241 Drinking Places (Alcoholic Beverages)
This industry comprises establishments known as bars,taverns, nightclubs or drinking places primarily engagedin preparing and serving alcoholic beverages for immedi-ate consumption. These establishments may also providelimited food services.
722410 Drinking Places (Alcoholic Beverages)
This U.S. industry comprises establishments known asbars, taverns, nightclubs or drinking places primarilyengaged in preparing and serving alcoholic beverages forimmediate consumption. These establishments may alsoprovide limited food services.
The data published with NAICS code 722410 are com-prised of the following SIC industry:
5813 Drinking places (alcoholic beverages)
Appendix B B−29
U.S. Census Bureau
An
nu
al Bench
mark
Rep
ort fo
r Retail Trad
e and
Food
Services: Janu
ary 19
92
to M
arch 2
00
2U
S C E N
S U S B
U R
E A U
Cu
rren
t Bu
sin
ess R
ep
orts
BR/0
1-A
U.S. Department of CommerceEconomics and Statistics AdministrationU.S. CENSUS BUREAUWashington, DC 20233
OFFICIAL BUSINESSPenalty for Private Use, $300