Embed Size (px)
Citation preview

ANNUAL 2016 REPORT
TABLE OF CONTENTS
Highlights 02
Chairman’s Report 04
Managing Director and CEO’s Report 06
COO Letter (CEO-elect) 08
Corporate Governance Statement 10
Annual Financial Report 15
Directors’ Report 16
Remuneration Report 24
Independent Auditor’s Report 33
Auditor’s Independence Declaration 35
Directors’ Declaration 36
Financial Statements 37
Notes to the Financial Statements 42
Shareholder Information 75
Corporate Directory IBC
A DA IR S L IM I T ED ABN 50 147 375 45 1
Adairs is a leading specialty retailer of home furnishings
in Australia with a national footprint of stores across a number of store formats. Our strategy is to present customers with a differentiated proposition, combining on-trend fashion products, quality staples, strong value and superior in-store customer service.
A NN UA L REP ORT 2 0 16 0 1
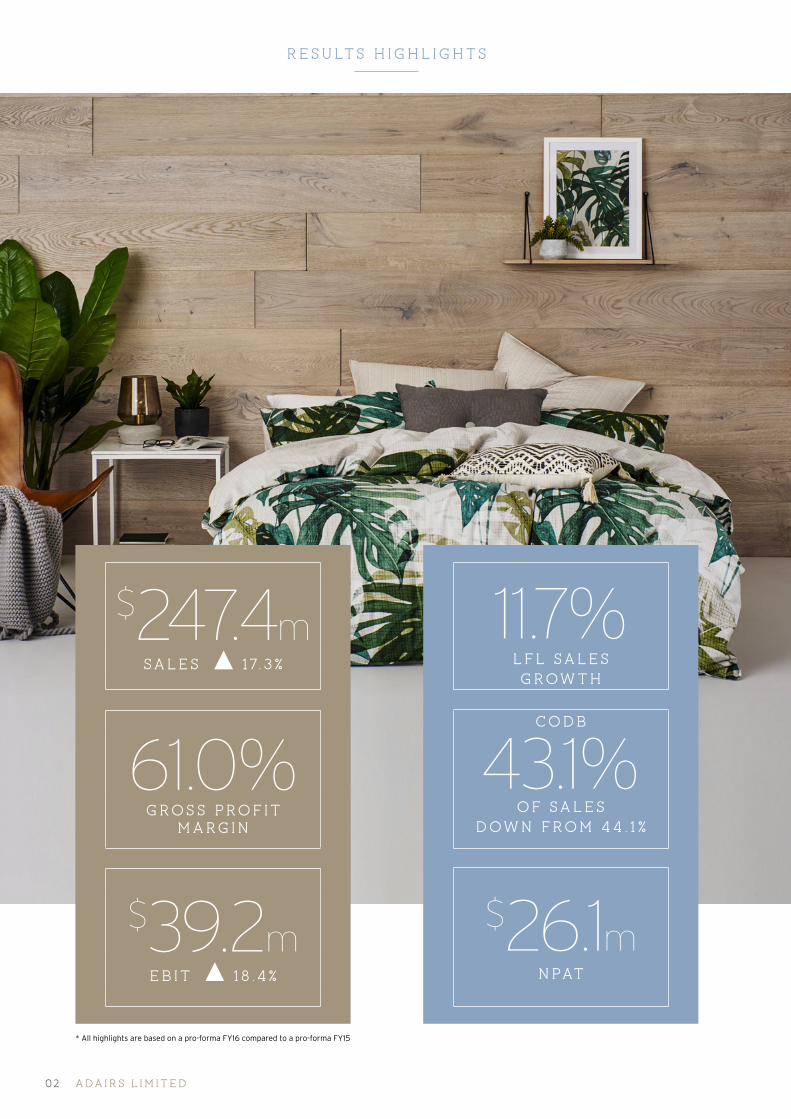
RESULTS HIGHLIGHTS
$247.4mSALES 17. 3%
61.0%GRO S S PROF IT
MARGIN
$39.2mEBIT 18 . 4%
11.7%LFL SALES GROW TH
CODB
43.1%OF SALES
DOWN FROM 44 . 1 %
$26.1mNPAT
* All highlights are based on a pro-forma FY16 compared to a pro-forma FY15
02 A DA IR S L IM I T ED

OPER ATIONAL HIGHLIGHTS
ALL STO RE
FO R M ATS
PRO F I TAB LE
AN D
GRO WI N G
13 NE W
S TORES
OPENED A ND
9 S TORES
F ULLY
REF URB I S HED
CO N T I N U I NG
TO GROW
M A RK E T S H A RE
A ND CU S TOMER
A ND S O C I A L
DATA BA S ES
INTERNATIONAL
EXPANS ION
COMMENCES
WITH THE
S IGN ING OF
STORES IN
NEW ZEALAND
3 R D
CO N S EC U T I V E
Y E A R O F D O UB LE
D I G I T LF L SA LES
GROW T H
SUCCESSFUL
TR IA L OF
3 URBA N
HOME REP UBL IC
MY ER
CONCESS IONS
SU C CE SSFULLY
E XPAN D I NG
N E W PRO D UCT
C ATE GO RIES
ONLINE
SALES
GROWTH
+63% NOW
8% OF
SALES
A NN UA L REP ORT 2 0 16 0 3

CHAIRMAN ’ S REPORT
11.5cpsDIV IDEND
0 4 A DA IR S L IM I T ED

Dear Shareholder,
I am pleased to present the 2016 Annual Report of Adairs Limited.
OUTPERFORMING PROSPECTUS FORECAST AND MARKET GU IDANCE
The 2016 financial year has been a successful year for our Company. Over the period to 3 July 2016 the company has:
• Outperformed Prospectus forecast and market guidance
• Generated 11.7% like-for-like sales growth, cycling two consecutive prior years of double-digit like-for-like sales growth.
• Delivered record results with $247.4 million revenue, $44.4 million EBITDA and $26.1 million net profit after tax
• Paid dividends totaling 11.5 cents per share fully franked.
Our continued focus on superior retail execution ensured Adairs could deliver these results in the midst of a challenging and competitive retail environment. The business aims to deliver above-market growth, underpinned by a combination of product and range differentiation, and our omni-channel strategies.
A GREAT TEAM EFFORT
The results achieved over the 2016 financial year would not have been possible without strong leadership across every function of our business. On behalf of the Company’s Board I would like to thank these leaders, along with all of our team for their daily pursuit of retail excellence and ongoing commitment to our business.
S TRONG CORPORATE GOVERNANCE
The Board is committed to maximising performance, increasing shareholder value and financial returns, and sustaining the growth and success of Adairs. In conducting business with these objectives, the Board further seeks to protect shareholder interests and operate in an environment of appropriate corporate governance and risk mitigation.
As our business grows, we are committed to evolving our corporate governance to ensure Adairs maintains the best framework and standards within its industry as well as the broader standards of the ASX.
WELL EXECUTED SUCCESS ION PLANNING
As announced on 7 September 2016, David MacLean is retiring from the position of Managing Director & CEO on 18 November 2016. David has been a key contributor to the growth of Adairs, and the results speak for themselves. Over the past 27 years of David’s involvement in the business – 14 as Managing Director & CEO – Adairs has grown from a business with 7 stores generating $10 million revenue, to a business with, as at 3 July 2016, 1,300 team members and 147 stores generating $247 million revenue. We are pleased that David has accepted the Board’s invitation to remain involved with Adairs as a non-executive Director immediately after ceasing in his current role.
Together with the Board, David developed a succession plan over the last three years. Our plan was for Mark Ronan (currently Chief Operating Officer) to follow David into the role of Managing Director & CEO, and we are delighted that this will occur.
Mark is an excellent retailer and strong leader. He commenced with the business nine years ago in finance and has been the COO since 2014, following roles as Head of Merchandise Planning and GM Retail Operations.
In addition, Michael Cherubino has been appointed as Executive Director – Property and Business Development, to enable him to focus more fully on managing and growing our store portfolio in Australia and New Zealand as we accelerate our store roll out strategy.
Taking on Michael’s previous finance responsibilities, Mandy Drake will join the Company as Chief Financial Officer and Company Secretary, having previously been CFO and a key member of the executive team at Forever New that saw the business grow from start up in 2006 to over 300 stores in 10 countries globally.
CLEAR STRATEGY FOR DEL IVER ING LONG TERM SHAREHOLDER VALUE
Adairs is in a strong financial position with an experienced leadership team and clear strategy for growth. I am confident we have the right people and processes in place to continue to deliver longterm value for our customers and shareholders.
I would like to close by thanking you, our shareholders, for your continued support. As the business enters a new era of growth, we remain well placed to maximise the opportunities that lie ahead.
Michael ButlerChairman
CHAIRMAN ’ S REPORT (CO N T I N UED)
A NN UA L REP ORT 2 0 16 0 5

MANAGING DIRECTOR & CEO’ S REPORT
FY 16 HAS BE E N AN OUT STAN D IN G YE AR FOR THE BUS IN E S S
0 6 A DA IR S L IM I T ED
Dear Shareholder,
FY16 has been an outstanding year for the business. Our continued focus on superior retail execution underpinned the delivery of record sales and profits. Our key strategies of product fashionability and differentiation, product range extensions, a superior omni channel customer experience and an accelerated rollout of stores across Australia combined to deliver an impressive result.
S TRONG F INANCIAL AND OPERAT IONAL PERFORMANCE
The strength of the Adairs’ business is reflected in our strong like-for-like (LFL) sales growth. FY16 saw the business deliver its 3rd consecutive year of LFL sales growth greater than 10%; with the compounded average growth rate over this period being 16%. Clearly, our ‘on trend’ product fashionability and successful growth in our expanded product ranges has underpinned our results.
Further this sales growth was largely driven by increased transaction volumes, which provides clear evidence more Australians are making Adairs their preferred retailer in our product categories.
Pleasingly, all our store formats contributed strongly to our sales growth. Importantly it was the ‘core’ formats of Adairs and Adairs Homemaker which drove our overall result.
Excitingly online sales again grew at exponential rates up 63% over the prior corresponding period. The compounded annual growth rate of online sales over the last 3 years has been 40% and now represents 8% of total company sales. Our strong loyalty program ‘Linen Lovers’ and growing digital databases are driving the success of our omni-channel strategies.
As forecasted the company also accelerated the rollout of stores across all of its formats, opening 13 new stores across Australia in the last 12 months. In the same period, 9 stores were fully refurbished.
This was an impressive effort and was only possible due to the dedication and hard work of the entire Adairs team.
On a cautionary note, it is difficult for any large retail business to sustain the LFL sales this business has enjoyed in recent years. We have seen second half FY16 sales moderate to 8.7% and expect further moderation into FY17.
ACTIVELY M ANAGING FOREIGN EXCHANGE EXPOSURE
With the majority of Adairs’ products manufactured overseas, the company has actively managed gross profit margin in the face of a declining Australian dollar to maximise gross profit dollars. Our strategies delivered a gross profit margin of 61%, which was at the top end of our half year guidance range.
STRONG BALANCE SHEET SUPPORTING FURTHER GROWTH
Adairs’ balance sheet remains strong. With net debt of $27.1 million, the company is well placed to capitalise on growth opportunities.
ATTRACTIVE D IV IDEND
With a strong balance sheet and positive earnings growth, the board of Adairs announced a final dividend of 6.5 cents per share bringing full year dividends to 11.5 cents per share fully franked.
REFLECT ING ON THE PAST 27 YEARS
Over the past 27 years I have been very fortunate to work with an amazing group of people that are as passionate about retail as I am. The business would not be where it is today without the commitment and resilience of both our past and current leaders. I cannot under play the importance of their unrelenting dedication to providing our customers with the best possible shopping experience.
It has been my long term plan to spend more time on family investments and personal interests. Having joined Adairs in 1989, and being Managing Director & CEO for the past 14 years, I believe it’s time for me to hand the leadership of the company to Mark Ronan. Having worked closely with Mark over the past 9 years, I have seen his passion for continuously improving our customer experience, and as such I have no doubt that he will make an outstanding CEO for Adairs.
Adairs is in a strong position, having delivered its ‘best ever’ result in the past year, and has a very capable team and clear growth strategy. I look forward to continuing to support the Company as a non-executive director and shareholder, and seeing the business continuing to thrive and grow under Mark’s leadership.
I would like to close by thanking all the people that have supported the company as it has grown – our suppliers, landlords, business partners, shareholders, and most importantly all our team and our loyal customers. Our focus on providing the very best retail experience is core to what we do and is the reason why we have been able to continue to grow. It is this focus that will underpin our continued success.
David MacLeanManaging Director & CEO
MANAGING DIRECTOR & CEO’ S REPORT (CO N T I N UED)
A NN UA L REP ORT 2 0 16 0 7

CO O LET TER (CEO -ELECT )
T H E PAS T 12 M O N THS H AVE F URTHE R
ESTABL IS HE D ADAIRS AS T H E LEAD IN G RE TAIL E R
IN ITS CATE GO RY
0 8 A DA IR S L IM I T ED

Dear Shareholder,
I am delighted to have the opportunity of writing this report to you as Adair’s Managing Director & CEO-elect.
The past 12 months have further established Adairs as the leading retailer in its category, and I look forward to continuing to deliver on our focused growth strategy following my appointment on 18 November 2016.
We are at an exciting time in the Company’s development with multiple proven growth strategies. Having been closely involved in the development and implementation of these strategies, I see my role as leading the team on the continued execution and evolution of our existing strategies. To that end, I would like to outline to you some key elements that will underpin Adairs’ growth in FY17 and beyond.
PRODUCT AND RANGE D IFFERENTIAT ION
We pride ourselves on providing a differentiated and innovative product range that offers value for money and on-trend merchandise in a high-service store environment. At the same time, we are building on category range extensions by expanding into adjacent categories to furnish our customers living, entertaining and functional spaces.
In recent years we have developed product range extensions across wall art, lighting, home fragrance, floor rugs, nursery linen, bedroom & occasional furniture as well as an expanded ranging of home décor and soft furnishings including cushions and throws.
This growth in product range extensions provides the business and its shareholders with many more years of growth and is inextricably linked to our next strategy, growing our store footprints.
GROWING STORE FOOTPRINT AND UPS IZ ING
Our store footprint strategy continues to focus on growing the footprint size of both our shopping centre and Homemaker stores.
Over the past 18 months, we successfully trialled a ‘mini-homemaker’ store in three shopping centre locations. The target size for this format is c400-500m2. As a hybrid format we are able to introduce a larger product range including the best of our new product range extensions normally only seen in our Homemaker format. We have initially identified up to 16 existing Adairs ‘regular’ shopping centre stores for potential upsizing to this new mini Homemaker format.
In addition, we have also identified up to 12 existing Adairs ‘Homemaker’ stores for potential upsizing to a larger footprint with a target size of 700-1000m2. This size footprint is now the preferred size for new Homemaker store openings.
These ‘upsizing’ opportunities provide our customers with a broader and more coordinated product range and differentiated shopping experience; and are targeted at improving store sales and contribution metrics.
The company will look to ‘upsize’ these stores over the next five years as leases expire.
In tandem with upsizing a number of our stores, we will continue to roll-out new stores to further increase our national footprint. We expect to open 8-12 new stores per annum, and have already agreed terms on 8 new stores in Australia for the first half of FY17 we are confident our store openings will be at the top end of our range.
We now have 17 stores across our ‘emerging’ formats, 11 Adairs Kids stores and 6 Urban Home Republic stores/concessions. Both these formats have been reinvigorated with new store designs as well as improved product offers. We continue to focus on optimising their performance and selectively opening stores.
A LEADING OM NI-CHANNEL STRATEGY
Our omni-channel strategy has been highly effective with the online store growing successfully and delivering strong profitability. Digital marketing initiatives have further enhanced customer engagement and continue to drive strong returns.
Having recently replatformed our website, the business is now able to commence trading online internationally starting with New Zealand. Further we will offer a ‘click and collect’ in CY17.
INTERNATIONAL EXPANS ION TO COMMENCE WITH ENTRY INTO NEW ZEALAND
New Zealand provides an exciting international growth opportunity. We plan to open our first Homemaker store in October 2016 at Sylvia Park, the largest shopping centre in Auckland. Three additional sites have been secured for opening in FY17 and we look forward to building our presence in the New Zealand market.
I’ve had the opportunity over the past 9 years to work closely with all of the Adairs team and I’m honoured to have been given the opportunity of leading such a great business.
With an unrelenting focus on superior retail execution, Adairs is well positioned financially and strategically to capitalise on our attractive growth opportunities. We look forward to providing our customers with an enhanced retail experience and delivering shareholders attractive returns.
Mark RonanChief Operating Officer
CO O LET TER (CEO -ELECT ) (CO N T I N UED)
A NN UA L REP ORT 2 0 16 0 9
CORPOR ATE GOVERNANCE STATEMENT
A DA IR S L IM I T ED1 0
The Board of Adairs Limited is responsible for the corporate governance of the group. It sets out the key features of Adairs’ governance framework and reports against the Corporate Governance Principles and Recommendations (3rd edition) published by the ASX Corporate Governance Council (ASX Principles and Recommendations).
The Board is committed to maximizing performance, generating appropriate levels of Shareholder value and financial return, and sustaining the growth and success of Adairs. In conducting business with these objectives, the Board seeks to ensure Adairs is properly managed to protect and enhance Shareholder interests, and that Adairs, its Directors, officers and personnel operate in an appropriate environment of corporate governance.
PR INC IPLE 1
Lay solid foundations for management and oversight
The Board has adopted a Charter which sets out the Board’s role and responsibilities, the relationship and interaction between the Board and management and the authority delegated by the Board to management and Board committees.
The Board is responsible for the overall governance of Adairs including monitoring the operational and financial position and performance of Adairs and overseeing its business strategy, including approving the strategic objectives, plans and budgets of the Company. The Board delegates to the CEO and senior management matters involving the implementation of corporate strategy and management of Adairs’ day-to-day activities.
The Board’s key responsibilities as set out in the Board Charter include:
• selecting, appointing, removing and evaluating from time to time the performance of, determining the remuneration of, and planning succession of, the CEO;
• contributing to and approving management’s development of corporate strategy, including setting performance objectives and approving operating budgets;
• reviewing, ratifying and monitoring systems of risk management and internal control and ethical and legal compliance;
• monitoring corporate performance and implementation of strategy and policy;
• approving major capital expenditure, acquisitions and divestitures, and monitoring capital management;
• monitoring and reviewing management processes aimed at ensuring the integrity of financial and other reporting;
• conducting performance evaluations of the Board, its Committees and individual Directors; and
• developing and reviewing corporate governance principles and policies.
Board and Committee Charters and the Company’s Constitution are available on Adairs’ website.
The Board has established a Remuneration Committee Charter which is responsible for the annual review of the remuneration arrangements of the executive directors, chairman and non-executive directors to ensure they remain equitable and assess performance processes to ensure capability of management to realise the business strategy. In the FY16 year a performance evaluation of the Board was conducted.
The Board has adopted a diversity policy which aims to, among other matters, address the representation of women in senior management positions and on the Board, and to actively facilitate a more diverse and representative management and leadership structure. As at 30 June 2016, 25% of our non-executive directors, 20% of senior executive positions, 82% of senior management and 91% of the Groups workforce are held by women.
In supporting gender diversity, at each change of senior executive or Board composition the Company will seek to increase female representation. Given the overall majority representation of women in senior executive and management positions, the board has not set specific diversity targets at this time. An annual review of gender diversity will be conducted and reported to ensure the business seeks a fair and balanced representation of men and women.
PR INC IPLE 2
Structure the Board to add value
The Board has established a Nomination Committee comprising all Directors and is chaired by Michael Butler. The Nomination Committee is responsible for identifying qualified individuals for appointment to the Board. In identifying candidates, the Nomination Committee will have regard to the selection criteria set out in the Board appointment process (refer Nomination Committee Charter), which will include:
• skills, expertise and background that add to and complement the range of skills, expertise and background of the existing Directors;
• diversity; and
• the extent to which the candidate would fill a present need on the Board.
The Nomination Committee is also responsible for ensuring an effective Director induction process is in place (and continues to be effective) and for providing appropriate professional development opportunities for Directors. The Nomination Committee will assist the Board as required in relation to the ongoing performance evaluation of the Board, its committees and individual Directors with this process having commenced in the 2016 year.
CORPOR ATE GOVERNANCE STATEMENT (CO N T I N UED)
A NN UA L REP ORT 2 0 16 1 1
In the 2016 year the Company conducted a survey of the Board to identify ongoing professional development and ensure the Board was structured to add value to the company. Based on the survey, the Remuneration and Nomination Committee is satisfied the Board currently comprises Directors with a broad range of skills, knowledge, experience and has a proper understanding of the current and emerging issues facing the Company and can effectively review and challenge management’s decisions.
The skills, experience and expertise of each Director, including current and former directorships, are set out in more detail in the biographies on pages 20-22.
The Board should comprise a majority of independent Non-executive Directors and the Board has adopted guidelines, as set out in the Board Charter, which are used to guide independence assessments based on the definition of independence listed in Box 2.3 of the ASX Principles and Recommendations.
Having regard to these criteria, the Board considers Michael Butler, Kate Spargo and David Briskin are free from any business or any other relationship that could materially interfere with the independent exercise of their judgement and are able to fulfil the role of an independent Director for the purposes of the ASX Recommendations.
The Board considers Trent Peterson, David MacLean and Michael Cherubino are not independent on the basis that:
• Trent Peterson is a director of Catalyst Investment Managers (Catalyst), a substantial shareholder in the Company.
• David MacLean is the CEO of the Company and Michael Cherubino is the CFO of the Company.
While the Board does not currently comprise a majority of independent Directors, the Company is satisfied the Board operates independently of management and is highly effective in promoting the best interests of shareholders as a whole. In particular, the Board considers Trent Peterson, David MacLean and Michael Cherubino add significant value to the Board given their considerable experience and skills and bring objective and independent judgment to the Board’s deliberations.
The Board collectively, and each Director individually, has the right to seek independent professional advice, subject to the approval of the Chairman or the Board as a whole. The Company Secretary, who is accountable to the Board through the Chairman, provides advice and support to the Board and is responsible for all matters to do with the proper functioning of the Board.
PR INC IPLE 3
Act ethically and responsibly
The Board recognises the need to observe the highest standards of ethics, integrity and behaviour. Accordingly, the Board has adopted a formal Code of Conduct which outlines how the Company expects its employees and Directors to behave during the course of their employment in dealing with internal and external clients and customers of the business.
The Code of Conduct requires (amongst other things) employees and Directors to:
• comply with all Company policies, procedures, rules and regulations;
• be honest and fair in dealings with customers, clients, co-workers, Company management and the general public;
• maintain the confidentiality of any information, records or other materials acquired during the course of employment with Adairs; and
• respect Adairs’ ownership of resources and property.
Adairs also has an ‘Issue Resolution & Complaint Procedures’ that contains procedures for employees and Directors to report any situations or behaviours that breach or potentially breach the Code of Conduct.
Adairs’ Code of Conduct is available on Adairs’ website.
PR INC IPLE 4
Safeguard integrity in corporate reporting
Under the Audit and Risk Committee Charter, the Committee should consist of:
• at least three members of the Board;
• only Non-executive Directors;
• a majority of independent Directors; and
• an independent chair who is not Chairman of the Board.
The current members of the Audit and Risk Committee are:
• Kate Spargo (chair);
• Trent Peterson; and
• Michael Butler.
The Audit and Risk Committee assists the Board in carrying out its accounting, auditing and financial reporting responsibilities including:
• overseeing the Company’s relationship with the external auditor and the external audit function generally;
• overseeing the preparation of the financial statements and reports;
• overseeing the Company’s financial controls and systems; and
• managing the process of identification and management of financial risk.
CORPOR ATE GOVERNANCE STATEMENT (CO N T I N UED)
A DA IR S L IM I T ED1 2

Non-Committee members, including members of management and the external auditor, may attend meetings of the Committee by invitation of the Committee chair. Minutes of meetings of the Committee are kept by the Company Secretary and, after approval by the Committee chair, are presented at the next Board meeting.
The Committee has rights of access to management and auditors (external and internal) without management present, and rights to seek explanations and additional information from both management and auditors.
The Audit and Risk Committee met on two occasions during the year with all three members of the Committee in attendance. Further information relating to attendance at Board and committee meetings is set out in the Directors Report on page 22.
Adairs’ external auditor is Ernst & Young who will be requested to attend the company’s Annual General Meeting to answer any questions from shareholders The Audit and Risk Committee provides a link between the external auditor, the Board and management. It also has the responsibility (subject to Corporations Act requirements) for the appointment and remuneration of the external auditor, as well as for evaluating its effectiveness and independence.
The Board has approved a policy on non-audit services provided by the external auditor which clearly sets out the type of non-audit services which are prohibited because they would create a real or perceived threat to the independence of the external auditor.
The Board requires the CEO and CFO provide written assurance the financial reports give a true and fair view, in all material respects, of the group’s financial position and of their financial performance and are in accordance with Australian Accounting Standards.
PR INC IPLE 5
Make timely and balanced disclosure
Adairs is committed to complying with its disclosure obligations under the Corporations Act and the ASX Listing Rules to keep the market reasonably informed of information which may have a material effect on the price or value of Adairs’ securities.
The Company adopted a Continuous Disclosure Policy on Listing which established procedures aimed at ensuring the Company fulfills its obligations in relation to the timely disclosure of material price-sensitive information.
Adairs’ Continuous Disclosure Policy is available on Adairs’ website.
PR INC IPLE 6
Respect the rights of security holders
Adairs aims to communicate all important information relating to the Company to its shareholders. Additionally, the Company recognises potential investors and other interested stakeholders may wish to obtain information about the Company from time to time.
To achieve this, the Company communicates information regularly to Shareholders and other stakeholders through a range of forums and publications, including:
• Adairs website: important information about Adairs can be found under the section marked ‘Corporate Governance’ in the investors section on its website. The website also contains a facility for shareholders to direct inquiries to Adairs.
• Annual general meeting: the Company will encourage full participation of shareholders at its AGM and for those shareholders who are unable to attend in person, shareholders will be able to lodge proxies. The Company’s external auditor will attend the AGM and be available to answer shareholder questions about the conduct of the audit and the preparation and content of the auditor’s report.
• Annual Report: Adairs’ Annual Report will be available on the website and contains important information about the Company’s activities and results for the previous financial year.
• ASX announcements: all ASX announcements, including annual and half year financial results, are posted on the Company’s website as soon as they have been released by ASX.
• Investor relations: to encourage two-way communication, Adairs provides a telephone helpline facility and an online email inquiry service to assist shareholders with any queries. Information is also communicated to shareholders via periodic mail outs, or by email to shareholders who have provided their email address.
Adairs’ Continuous Disclosure Policy is available on Adairs’ website.
PR INC IPLE 7
Recognise and manage risk
The Board has established an Audit and Risk Committee comprising of three members, Kate Spargo (chair), Trent Peterson and Michael Butler. The Audit and Risk Committee has the responsibility and authority for the appointment of the head of internal audit. The head of the internal audit has a direct reporting line to the Chair of the Committee and, therefore, to the Board.
The Committee has developed systems for evaluating and improving the effectiveness of the Company’s risk management and internal control processes.
CORPOR ATE GOVERNANCE STATEMENT (CO N T I N UED)
A NN UA L REP ORT 2 0 16 13
The Committee’s specific functions with respect to risk management and compliance are to review and report to the Board that:
• the Committee has, at least annually, reviewed the Company’s risk management framework to satisfy itself that it continues to be sound and effectively identifies all areas of potential risk
• adequate policies and processes have been designed and implemented to manage identified risks;
• a regular program of audits is undertaken to test the adequacy of and compliance with prescribed policies;
• proper remedial action is undertaken to redress areas of weakness.
The Committee will also review management recommendations on policies and strategies relating to employee culture and behaviour and make recommendations to the Board where appropriate. This includes policies and recommendations on bullying and harassment.
During the 2016 year the Audit and Risk Committee developed an internal audit plan to be carried out over a three year period to ensure compliance with the Groups risk management and internal control process. The management team engaged third parties to carry out the internal audit process in line with the plan.
Refer to page 19 of this report report for Adairs business Risks.
PR INC IPLE 8
Renumerate fairly and responsibly
The Board has established a Remuneration Committee comprising of four members, Trent Peterson (chair), Michael Butler, Kate Spargo and David Briskin. The responsibilities of the committee are outlined in our Remuneration Committee Charter.
The Company’s remuneration strategy for Non-executive Directors is designed to attract and retain experienced, qualified Non-executive Directors and to remunerate appropriately to reflect the demands which are made on them and the responsibilities of the position.
The level of fees are reviewed annually by the Remuneration Committee, and are based on the fees paid for comparative Non-executive Director roles in similarly sized publicly listed companies operating in the retail industry.
Non-executive Directors do not receive any variable or “at- risk” remuneration or other performance related incentives.
The principles that guide Adairs’ executive remuneration policy are:
• to provide competitive total remuneration arrangements that enable the Company to attract and retain high performing leaders and to reward them for their contribution to the success of the Company;
• to align remuneration arrangements with the delivery of the outcomes which (in the opinion of the Board) drive sustainable value creation for the Company’s shareholders;
• to maintain a pay for performance environment for executives through linking incentive pay opportunities to the achievement of specific, measurable business goals;
• to position base salaries at competitive levels, subject to individual performance;
• to provide arrangements with the flexibility to recognise individuals based on consistent performance, experience and qualifications; and
• to provide equitable pay arrangements across the Company.
These principles seek to ensure the level and composition of remuneration is appropriate, and also that there is a clear link between pay and performance.
Further information relating to the remuneration of the Non-executive Directors and senior executives is set out in the Remuneration Report on page 29. The number of meetings held and attendance by members of the Remuneration and Nomination Committee are outlined in the Directors report on page 22.
CORPOR ATE GOVERNANCE STATEMENT (CO N T I N UED)
A DA IR S L IM I T ED14

ANNUAL F INANCIAL REPORT 2 016FOR T HE 5 3 W EEK S ENDING 3 J ULY 2 016
A NN UA L REP ORT 2 0 16 15

DIRECTORS ’ REPORT
Your directors submit their report on the consolidated entity (referred to hereafter as “Adairs”, “the Group” “company”) for the 53 weeks ended 3 July 2016 (“FY2016”).
Adairs operates on a retail accounting calendar which consists of four quarters of 13 weeks, equating to an annual 52 week reporting period of 364 days in most years, with a 53 week reporting period (i.e. 371 days) every five to six years. In FY2016, there was a 53 week reporting period with an additional week of operations occurring. The implication of this in FY2016 is that Adairs has 371 financial year days versus 364 financial year days in FY2015. The directors include in our commentary below a comparison of EBIT between FY15 and FY16, including an adjustment to normalise FY16 EBIT to a comparable 52 week period.
DI RECTORS
The following persons were Directors of Adairs Limited during the period and up to the date of this report unless otherwise stated.
Michael Butler David MacLean Michael Cherubino Trent Peterson Kate Spargo David Briskin
Information on qualifications and experience of Directors is included on pages 20 to 22 of this report.
PR INC IPAL ACT IV IT IES
During the period, the principal continuing activities of the Company consisted of the retailing of homewares and home furnishings in Australia.
DI V IDENDS
In respect of the financial year ended 3 July 2016, an interim dividend of 5 cents per share was paid to the holders of fully paid ordinary shares on 6 April 2016 and the directors have declared the payment of a final dividend of 6.5 cents per share, to be paid to the holders of fully paid ordinary shares on 28 September 2016. Both dividends are franked to 100% at the 30% corporate income tax rate. The total dividend for the full year of 11.5 cents per share is 0.5 cents higher than the amount included in the disclosures in the prospectus (being 11.0 cents), and represents a payout ratio of 70% of the full year earnings.
2016 OPERAT ING AND F INANCIAL REVIEW
The profit from ordinary activities after income tax for FY2016 amounted to $27.172 million (2015: $745k, $2,942k from continuing operations).
The Directors’ Report includes references to pro-forma results to exclude the FY2016 impact of the 53rd week of trade and the FY2015 impact of Adairs corporate and capital structure following the divestment of dusk, refinancing of the Company’s debt facilities and the costs associated with the IPO results as disclosed in the Company’s prospectus dated 29th May 2015. It also includes references to non-IFRS financial measures such as Earnings Before Interest and Tax (“EBIT”), EBIT margin, EBITDA (EBIT excluding depreciation and amortisation), like-for-like sales growth (“LFL”), Pro-forma EBIT and related Pro-forma adjustments.
The EBIT of the Group for FY2016 was $40.7 million (2015: EBIT $18.4 million).
Continuing Operations2016
$’0002015
$’000
Statutory profit after income tax for continuing operations 27,172 2,942
Add back:
Finance expenses 2,006 14,267
Interest income (81) (446)
Income tax (benefit)/expense 11,651 1,675
EBIT(1) 40,748 18,438
(1) Earnings Before Interest and Tax (EBIT) is used as a measure of financial performance by excluding certain variables that affect operating profits but which may not be directly related to all financial aspects of the operations of the group. EBIT is not a measure of operating income, operating performance or liquidity under A-IFRS. Other companies may calculate EBIT in a different manner to us. The above EBIT reconciliation has not been audited.
During the prior reporting period the Group underwent significant structural changes including divestment of the dusk operating business, amended capital structure and listing on the Australian Securities Exchange.
A DA IR S L IM I T ED16
DIRECTORS ’ REPORT (CO N T I N UED)
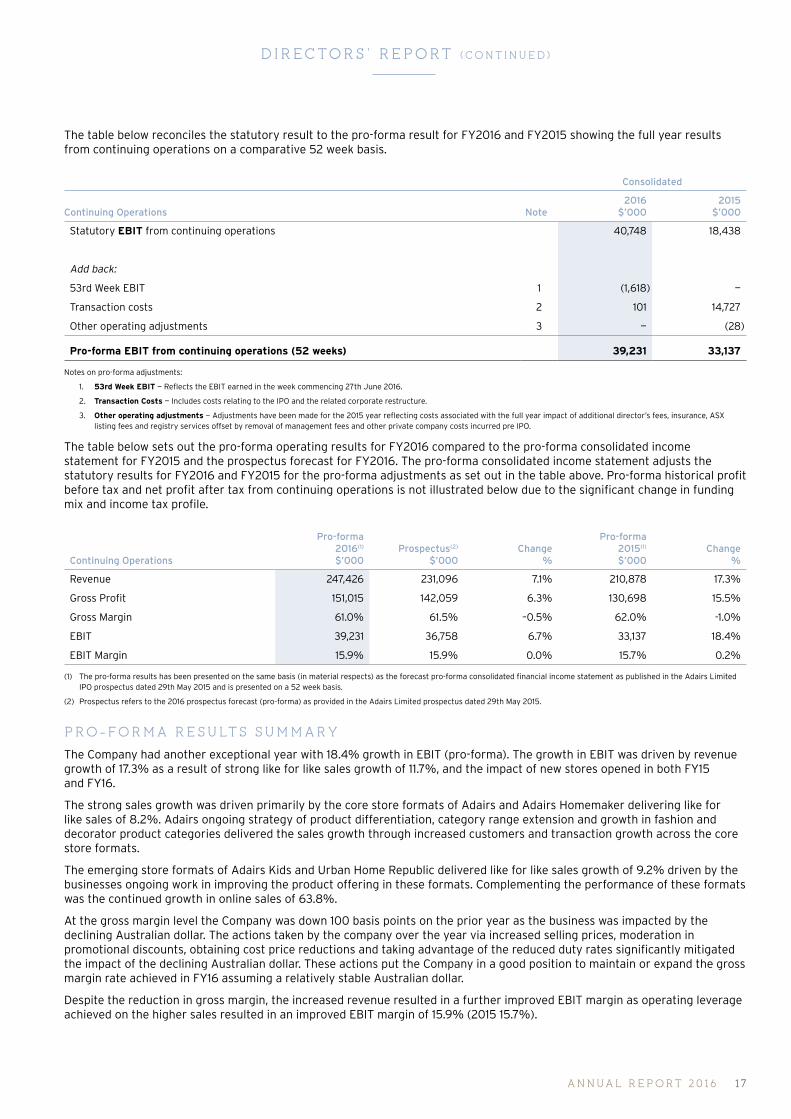
The table below reconciles the statutory result to the pro-forma result for FY2016 and FY2015 showing the full year results from continuing operations on a comparative 52 week basis.
Consolidated
Continuing Operations Note2016
$’0002015
$’000
Statutory EBIT from continuing operations 40,748 18,438
Add back:
53rd Week EBIT 1 (1,618) —
Transaction costs 2 101 14,727
Other operating adjustments 3 — (28)
Pro-forma EBIT from continuing operations (52 weeks) 39,231 33,137
Notes on pro-forma adjustments:
1. 53rd Week EBIT — Reflects the EBIT earned in the week commencing 27th June 2016.
2. Transaction Costs — Includes costs relating to the IPO and the related corporate restructure.
3. Other operating adjustments — Adjustments have been made for the 2015 year reflecting costs associated with the full year impact of additional director’s fees, insurance, ASX listing fees and registry services offset by removal of management fees and other private company costs incurred pre IPO.
The table below sets out the pro-forma operating results for FY2016 compared to the pro-forma consolidated income statement for FY2015 and the prospectus forecast for FY2016. The pro-forma consolidated income statement adjusts the statutory results for FY2016 and FY2015 for the pro-forma adjustments as set out in the table above. Pro-forma historical profit before tax and net profit after tax from continuing operations is not illustrated below due to the significant change in funding mix and income tax profile.
Continuing Operations
Pro-forma2016(1) $’000
Prospectus(2) $’000
Change %
Pro-forma2015(1) $’000
Change %
Revenue 247,426 231,096 7.1% 210,878 17.3%
Gross Profit 151,015 142,059 6.3% 130,698 15.5%
Gross Margin 61.0% 61.5% –0.5% 62.0% -1.0%
EBIT 39,231 36,758 6.7% 33,137 18.4%
EBIT Margin 15.9% 15.9% 0.0% 15.7% 0.2%
(1) The pro-forma results has been presented on the same basis (in material respects) as the forecast pro-forma consolidated financial income statement as published in the Adairs Limited IPO prospectus dated 29th May 2015 and is presented on a 52 week basis.
(2) Prospectus refers to the 2016 prospectus forecast (pro-forma) as provided in the Adairs Limited prospectus dated 29th May 2015.
PRO-FORMA RESULTS SUMMARY
The Company had another exceptional year with 18.4% growth in EBIT (pro-forma). The growth in EBIT was driven by revenue growth of 17.3% as a result of strong like for like sales growth of 11.7%, and the impact of new stores opened in both FY15 and FY16.
The strong sales growth was driven primarily by the core store formats of Adairs and Adairs Homemaker delivering like for like sales of 8.2%. Adairs ongoing strategy of product differentiation, category range extension and growth in fashion and decorator product categories delivered the sales growth through increased customers and transaction growth across the core store formats.
The emerging store formats of Adairs Kids and Urban Home Republic delivered like for like sales growth of 9.2% driven by the businesses ongoing work in improving the product offering in these formats. Complementing the performance of these formats was the continued growth in online sales of 63.8%.
At the gross margin level the Company was down 100 basis points on the prior year as the business was impacted by the declining Australian dollar. The actions taken by the company over the year via increased selling prices, moderation in promotional discounts, obtaining cost price reductions and taking advantage of the reduced duty rates significantly mitigated the impact of the declining Australian dollar. These actions put the Company in a good position to maintain or expand the gross margin rate achieved in FY16 assuming a relatively stable Australian dollar.
Despite the reduction in gross margin, the increased revenue resulted in a further improved EBIT margin as operating leverage achieved on the higher sales resulted in an improved EBIT margin of 15.9% (2015 15.7%).
A NN UA L REP ORT 2 0 16 17
DIRECTORS ’ REPORT (CO N T I N UED)
CAPI TAL MANAGEMENT
There was no significant change in the capital structure of Adairs through FY2016. The debt facility remains at $50 million in aggregate and represents a $42 million revolving cash advance term facility (fully drawn) and an $8 million multi option revolving working capital facility.
The leverage ratio as at June 2016 was 0.9x actual EBITDA (EBITDA is calculated from EBIT, as mentioned above, plus depreciation and amortisation). Net debt is $27.1 million. The company’s debt facility has three key financial covenants, the debt to capital ratio, fixed cover charge ratio and the leverage ratio. Significant headroom exists within all of the financial covenants as at June 2016.
ADAIRS STRATEGY
The strategy is aimed at delivering profitable growth with the strategies reflecting the continued evolution of the business’ existing proven strategies which have contributed materially to the earnings growth achieved by the business in recent years.
PRODUCT AND RANGE DIFFERENTIATION TO DRIVE ABOVE-MARKET LIKE FOR LIKE SALES GROWTH
Whilst Adairs has achieved significant like for like growth over the past 4 years the product and range differentiation strategy remains critical to maintaining this sales momentum. Whilst Adairs expects to continue to grow same store sales we expect the rate of growth to moderate over the coming years. The key driver of our like for like sale growth will be the two key components of the product and range differentiation strategy:
1. Product differentiation: Offer customers a range of on trend products at value-for-money prices that are exclusive to Adairs.
2. Category Range differentiation: Offer customers a broader range of co-ordinated decorator products than our competitors. Adairs will continue to expand its range to cover new product areas based on management’s assessment of customer demand. Recent examples include the adding of wall art, mirrors, home fragrances, floor rugs, bedroom chairs, bedside tables and lamps to Adairs’ product range. A critical aspect of this strategy is to ensure that any range extension is complementary to the existing product categories and range and has similar attributes such as value, quality, styling and fashionability. This helps customers develop a co-ordinated look across product categories and enables store teams to deliver superior service.
CONTINUED STORE ROLL-OUT IN AUSTRAL IA
After opening net 12 new stores in FY2016 Adairs will continue to roll out new stores in FY2017, and maintain a target of 8-12 net new store-openings in Australia each year for the next three years. Of those stores, 8—10 are expected to be Adairs core formats of Adairs and Adairs Homemaker stores. As discussed below, we also expect to open stores in New Zealand.
Given the continued work on product and range differentiation Adairs will also continue to up-size selected existing Adairs and Adairs Homemaker stores (i.e. our core store formats), with 28 stores currently identified for potential up-sizing over the next 7 years. Adairs believes there is significant opportunity in providing our customers an enhanced shopping experience and wider range of product via these larger store formats, and our current experience with this strategy indicates an attractive incremental ROCE.
Consistent with the above upsizing strategy for existing stores, Adairs also has a strategy of seeking to selectively open moderately larger stores (in square metres) in new locations in our core stores formats. Our experience to date is that these larger stores give us a better opportunity to merchandise a wider range, and deliver the customer a superior shopping experience. We note for completeness that ultimately the size of each store is determined on a site by site basis and is a function of a range of commercial and practical factors.
With the opening of 4 Adairs Kids stores in FY2016 Adairs expects to take selective opportunities to further roll out the Adairs Kids format in FY2017. Over the next two years Adairs will look to open 2—3 new Adairs Kids format stores per annum to further prove the format and determine the types of locations the format is most suited to.
Adairs believes there remains a significant opportunity to roll-out its UHR stores (including in the concession store format which are currently operating in Myer stores) in Australia. Adairs expects to open 2—3 UHR boutiques per annum over the next two years and if these openings deliver the expected financial returns the roll-out pace can be accelerated from FY2019 onward. Further, after a successful 3 store concession trial with Myer, Adairs and Myer are in discussions to roll out additional concession stores in the first half of FY2017. Going forward Adairs expects the modern contemporary UHR brand to deliver above market growth out of both its boutiques and Myer concession stores through consistent implementation of Adairs commitment to product and range differentiation.
A DA IR S L IM I T ED18
DIRECTORS ’ REPORT (CO N T I N UED)
INTERNATIONAL EXPANS ION
Adairs expects to open up to 5 stores in New Zealand in the FY2017 year supported by a New Zealand website. The stores will be supported by a third party logistics provider to limit the capital investment Adairs will make in New Zealand to the fixtures and fittings of the stores. At the date of this report, Adairs has agreed lease terms in respect of 3 of these new stores. New Zealand is Adairs’ first international market. We have selected this market due to its relative location to Australia, benign sovereign risks and relative economic stability. We also believe New Zealand consumers have a tendency to exhibit house proud consumer behaviours, including entertaining at home. Finally, New Zealand has similar shopping and climate seasonality to Australia. The approach to the New Zealand expansion will incorporate a disciplined attitude to risk and capital allocation.
Adairs currently see the New Zealand market as having the potential to support up to 18 stores across Adairs existing store formats, subject to the success of the initial stores.
Given the start-up nature of the new operations in New Zealand, Adairs expects this strategy will cost the business approximately A$1 million in FY2017 in EBIT loss, and up to A$3 million in investment in capex and incremental inventory. While Adairs expects the underlying stores to be modestly profitable in FY2017, the operating losses are expected to arise from incremental costs which relate to supporting the marketing and brand development activities, and the initial overheads required to support a small network of stores. Adairs expects its operations in this market will achieve economies of scale over the following 2—3 years.
MATERIAL BUS INESS R ISKS
There are a number of risk factors both specific to Adairs and of a general nature which may impact the future operating and financial performance of Company. The performance of the Company is influenced by a variety of general economic and business conditions, including levels of consumer spending, inflation, interest and exchange rates, access to debt and capital markets and government policies.
The specific material business risks that are likely to have an effect on the financial prospects of Adairs include:
• The retail environment and general economic conditions may worsen Consumers may consider many of Adairs’ products to be discretionary goods, and sales levels are sensitive to consumer and retail sentiment as a result. If consumer and retail sentiment were to decline, this may reduce the demand for Adairs’ products, thereby reducing product sales. This would have a flow on affect with regard to like for like sales and have a materially adverse effect on Adairs financial performance.
• Competition may increase and change The competitive environment in which Adairs operates in is relatively stable, however there is a risk that Adairs may lose market share to new or existing competitors. Adairs’ competitive position may deteriorate as a result of increased competition, and Adairs customers may choose to purchase products from its competitors rather than from Adairs and could lead to downward pressure on margins and subsequently have an adverse impact on Adairs financial performance.
• Customers buying habits or seasonal trading patterns may change Many of Adairs’ products are considered to be discretionary goods, particularly products in Adairs’ fashion item lines where consumer preferences and tastes can change quickly. Consumer demand for these products is sensitive to Adairs’ fashion and design selections and product range. A broad-based or series of significant misjudgements in interpreting product and fashion trends and over estimation of the quantum of demand for these products could adversely affect Adairs’ financial performance.
• Management may be unable to achieve its growth objectives Adairs’ management has developed a number of growth strategies for the business. The success of growth strategies is key to Adairs’ future financial performance, however there is a risk that Adairs’ growth strategies are ineffective or are not executed effectively.
• Adairs may be unable to retain and suitable store sites Adairs’ store footprint and lease portfolio is frequently assessed and revised in order to optimise financial and operational performance. Adairs’ financial performance and future growth is dependent on its ability to both retain existing store sites and secure new store sites in suitable locations and on acceptable terms. Adairs’ ability to achieve this may be impacted by a range of factors including availability of new store sites, profitability of new sites, landlord disputes, potential cannibalisation of existing stores by new store openings as examples.
• International expansion may not be successful The introduction of international business operations into the group adds complexity and requires management to consider additional factors impacting a different economy and varied regulatory requirements. Adairs have mitigated this risk by seeking advice and expertise from people who have previously operated in the market and have specific expertise related to the market. Despite this Adairs strategies in relation to international expansion may be ineffective or not executed effectively adversely impacting the future financial performance.
A NN UA L REP ORT 2 0 16 19
DIRECTORS ’ REPORT (CO N T I N UED)
OUTLOOK
Adairs expects to continue to grow its store network in Australia through the continued roll out of the Adairs and Adairs Homemaker formats. Over the coming years Adairs also expects to expand its store network through the further roll out of Adairs Kids, Urban Home Republic including concession stores and internationally. Since the FY2016 year end Adairs has opened 2 stores and has agreed lease terms on a further 4 stores.
After multiple years of double digit LFL sales we expect to see moderation in the LFL sales growth rate with total sales in FY2017 to be in the range of $275 million to $285 million.
S I GN IF ICANT CHANGES IN THE STATE OF AFFA IRS
There have been no significant changes in the state of affairs of Adairs during the financial year ended 3 July 2016.
MATTERS SUBSEQUENT TO THE END OF THE F INANCIAL YEAR
On 25 August 2016, the directors of Adairs Limited declared a final dividend on ordinary shares in respect of the 2016 financial year. The total amount of the dividend is $10.782 million which represents a fully franked final dividend of 6.5 cents per share. The dividend has not been provided for in the 3 July 2016 financial statements.
Other than the matter noted above, no matters or circumstances have arisen since the reporting date which significantly affected or may significantly affect the operations of the Group, the results of those operations, or the state of affairs of the Group.
ENVIRONMENTAL REGULAT ION
The Company’s operations are not subject to any significant environmental obligations or regulations. No environmental breaches have been notified to the Company during the 53 weeks ended 3 July 2016.
DI RECTORS AND D IRECTORS ’ INTERESTS
The Directors of Adairs Limited in office at the date of this report are listed below together with details of their relevant interest in the securities of the Company at that date.
Michael Butler Independent Chair Non-Executive.
Michael has extensive experience in finance and investments in both executive and board roles. He has over 20 years’ experience as a non-executive director of ASX listed companies across a broad range of industries including financial services, tourism, logistics, property, resources, and retailing.
Other Current Directorships
Non-executive director of Metcash LimitedNon-executive director of Total Tools Pty Ltd
Former Listed Directorships in the last 3 years
None
Special Responsibilities
Chair of the BoardChair of the Nomination CommitteeMember of the Audit and Risk CommitteeMember of the Remuneration Committee
Interest in Shares and options
62,500 ordinary shares in Adairs Limited
David MacLean Managing Director and Chief Executive Officer.
David was appointed Chief Executive Officer and Managing Director in 2002, following a long career within the Adairs business, progressing from General Manager through to Managing Director.
Other Current Directorships
Non-executive director of dusk Retail Holdings Group Pty Ltd
Former Listed Directorships in the last 3 years
None
A DA IR S L IM I T ED2 0
DIRECTORS ’ REPORT (CO N T I N UED)
Special Responsibilities
Managing Director and Chief Executive OfficerMember of the Nomination Committee
Interest in Shares and options
4,152,273 ordinary shares in Adairs LimitedEntities associated with David hold 208,334 ordinary shares in Adairs Limited.
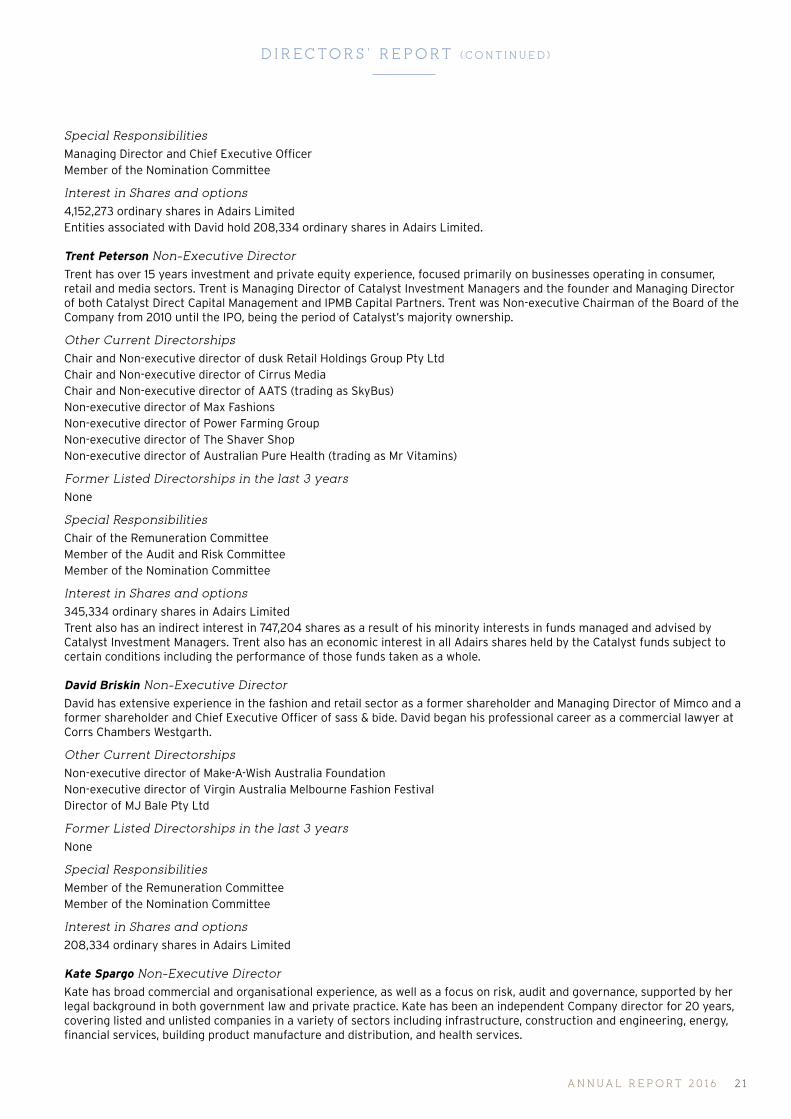
Trent Peterson Non-Executive Director
Trent has over 15 years investment and private equity experience, focused primarily on businesses operating in consumer, retail and media sectors. Trent is Managing Director of Catalyst Investment Managers and the founder and Managing Director of both Catalyst Direct Capital Management and IPMB Capital Partners. Trent was Non-executive Chairman of the Board of the Company from 2010 until the IPO, being the period of Catalyst’s majority ownership.
Other Current Directorships
Chair and Non-executive director of dusk Retail Holdings Group Pty LtdChair and Non-executive director of Cirrus MediaChair and Non-executive director of AATS (trading as SkyBus)Non-executive director of Max FashionsNon-executive director of Power Farming GroupNon-executive director of The Shaver ShopNon-executive director of Australian Pure Health (trading as Mr Vitamins)
Former Listed Directorships in the last 3 years
None
Special Responsibilities
Chair of the Remuneration CommitteeMember of the Audit and Risk CommitteeMember of the Nomination Committee
Interest in Shares and options
345,334 ordinary shares in Adairs LimitedTrent also has an indirect interest in 747,204 shares as a result of his minority interests in funds managed and advised by Catalyst Investment Managers. Trent also has an economic interest in all Adairs shares held by the Catalyst funds subject to certain conditions including the performance of those funds taken as a whole.
David Briskin Non-Executive Director
David has extensive experience in the fashion and retail sector as a former shareholder and Managing Director of Mimco and a former shareholder and Chief Executive Officer of sass & bide. David began his professional career as a commercial lawyer at Corrs Chambers Westgarth.
Other Current Directorships
Non-executive director of Make-A-Wish Australia FoundationNon-executive director of Virgin Australia Melbourne Fashion FestivalDirector of MJ Bale Pty Ltd
Former Listed Directorships in the last 3 years
None
Special Responsibilities
Member of the Remuneration CommitteeMember of the Nomination Committee
Interest in Shares and options
208,334 ordinary shares in Adairs Limited
Kate Spargo Non-Executive Director
Kate has broad commercial and organisational experience, as well as a focus on risk, audit and governance, supported by her legal background in both government law and private practice. Kate has been an independent Company director for 20 years, covering listed and unlisted companies in a variety of sectors including infrastructure, construction and engineering, energy, financial services, building product manufacture and distribution, and health services.
A NN UA L REP ORT 2 0 16 2 1
DIRECTORS ’ REPORT (CO N T I N UED)
Other Current Directorships
Chair of UGL LtdNon-executive director of Sonic Healthcare LtdNon-executive director of CoInvest LtdNon-executive director of Fletcher Building LtdNon-executive director of SMEC LtdNon-executive director of Sigma Pharmaceuticals LtdNon-executive director of Geelong Football Club
Former Listed Directorships in the last 3 years
None
Special Responsibilities
Chair of the Audit and Risk CommitteeMember of the Remuneration CommitteeMember of the Nomination Committee
Interest in Shares and options
41,667 ordinary shares in Adairs Limited
Michael Cherubino Executive Director and Chief Financial Officer
Michael was appointed Chief Financial Officer in 1996 and has over 19 years’ experience in the retail sector. Michael’s previous roles were with National Australia Bank and Bankwest.
Other Current Directorships
None
Former Listed Directorships in the last 3 years
None
Special Responsibilities
Chief Financial OfficerMember of the Nomination Committee
Interest in Shares and options
2,076,135 ordinary shares in Adairs Limited
COMPANY SECRETARY
The Company Secretary is Mark Ronan. Mark is also Chief Operating Officer. Mark commenced with Adairs as the Finance Manager in 2007 and was appointed Company Secretary in May 2015.
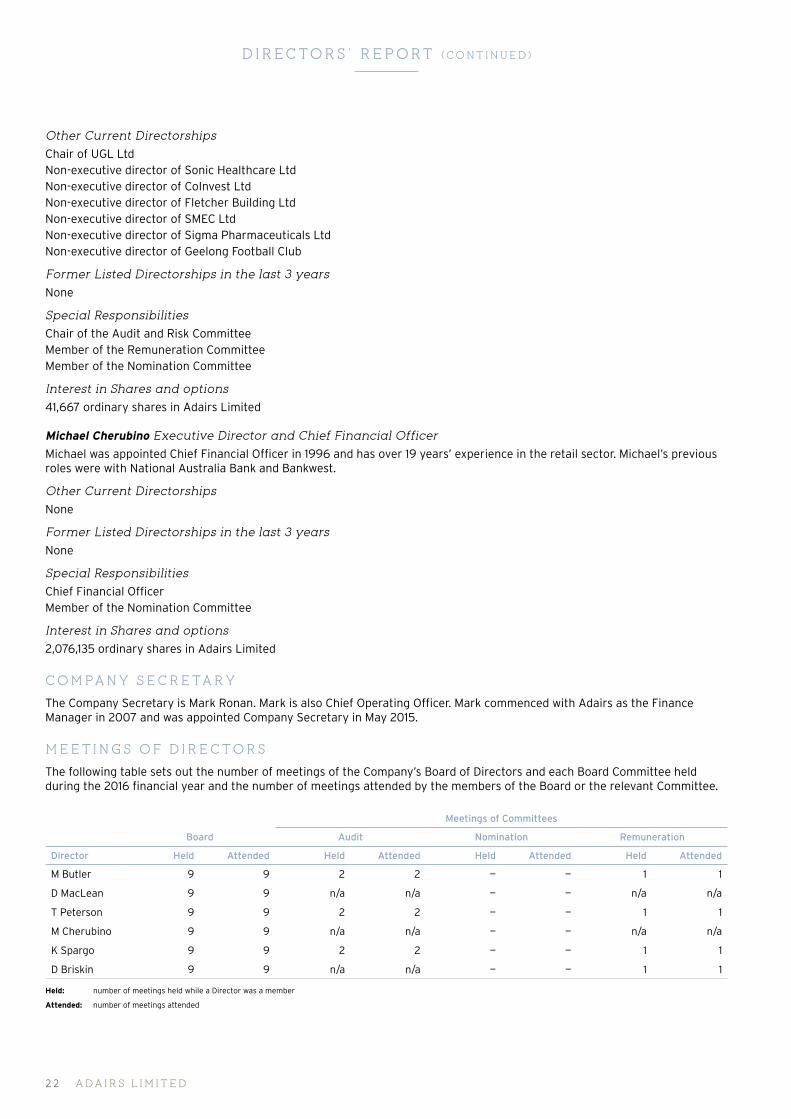
MEETINGS OF D IRECTORS
The following table sets out the number of meetings of the Company’s Board of Directors and each Board Committee held during the 2016 financial year and the number of meetings attended by the members of the Board or the relevant Committee.
Meetings of Committees
Board Audit Nomination Remuneration
Director Held Attended Held Attended Held Attended Held Attended
M Butler 9 9 2 2 — — 1 1
D MacLean 9 9 n/a n/a — — n/a n/a
T Peterson 9 9 2 2 — — 1 1
M Cherubino 9 9 n/a n/a — — n/a n/a
K Spargo 9 9 2 2 — — 1 1
D Briskin 9 9 n/a n/a — — 1 1
Held: number of meetings held while a Director was a member
Attended: number of meetings attended
A DA IR S L IM I T ED2 2
DIRECTORS ’ REPORT (CO N T I N UED)
NON-AUDIT SERVICES
The Company may decide to employ the auditor on assignments additional to their statutory audit duties where the auditors’ expertise and experience with the Company are important.
Details of the amount paid to the auditor Ernst & Young Australia for audit and non-audit services provided during the year are set out in Note 25 to the financial statements on page 74.
The directors are satisfied that the provision of non-audit services is compatible with the general standards of independence for auditors imposed by the Corporations Act 2001. The Directors are satisfied that the services provided did not compromise the external auditor independence for the following reasons:
• all non-audit services are reviewed and approved by the Audit and Risk Committee prior to commencement to ensure that they do not impact the integrity and objectivity of the auditor; and
• the nature of the services provided does not compromise the general principles relating to auditor independence as set out in APES110 — Code of Ethics for Professional Accountants.
AUDITOR ’S INDEPENDENCE DECLARAT ION
A copy of the auditor’s independence declaration as required under section 370C of the Corporations Act 2001 is set out on page 35.
MODIF ICAT ION OF AUDITOR ROTAT ION REQUIREMENTS
On 19 June 2015, at the recommendation of the Audit and Risk Committee, the directors granted an approval for the extension of the Group’s audit partner for up to a further 2 years when the initial period of 5 years as permitted under Corporations Act 2001 expired in June 2015. The Audit and Risk Committee’s recommendation was based on the following reasons:
• the Audit and Risk Committee was satisfied with the skills and personal qualities of the audit partner and the audit team and is of the view that they display a good understanding of the Group and strong technical accounting competence;
• the Audit and Risk Committee was satisfied that Ernst & Young conducts an effective audit with focus on the appropriate areas of risk;
• the Audit and Risk Committee was satisfied that the approval of up to a 2 year extension does not give rise to a conflict of interest situation; and
• given the IPO of Adairs undertaken in June 2015, and the divestment of the dusk Retail Group undertaken in February 2015, and the resulting accounting and financial reporting complexity arising from these transactions, the Audit and Risk Committee felt that continuity of audit partner would be simpler and more effective for both the Company and the auditors.
PROCEEDINGS ON BEHALF OF THE COMPANY
There are currently no proceedings on behalf of the Company.
INDEMNIF ICAT ION AND INSURANCE OF OFF ICERS
The Group has agreed to indemnify all the Directors and executive officers against loss, cost, damage, expense or other liability suffered or incurred by the Directors as officers of the Group. The indemnity does not extend to indemnify the Director:
a. in bringing or prosecuting any claim, unless the claim is a claim in the nature of a cross-claim or third-party claim for contribution or indemnity in, and results directly from, any proceedings in respect of which the Directors have made a claim under the indemnity;
b. in connection with any proceedings between the Directors and the Director’s appointee or any related body corporate of the appointer (within the meaning of section 50 of the Corporations Act 2001) or their respective insurers; or
c. to the extent that the amount of the claim under the indemnity is increased as a result of failure of the Director to comply with their obligations under the indemnity agreement.
During or since the financial year, the Company has paid premiums in respect of a contract insuring all the directors of Adairs Limited against legal costs incurred in defending proceedings for conduct other than:
a. A wilful breach of duty
b. A contravention of sections 182 or 183 of the Corporations Act 2001, as permitted by section 199B of the Corporations Act 2001.
Under the terms of the policy, the total amount of insurance contract premiums paid cannot be disclosed.
A NN UA L REP ORT 2 0 16 23

DIRECTORS ’ REPORT (CO N T I N UED)
I NDEMNIF ICAT ION OF AUDITORS
To the extent permitted by law, the Company has agreed to indemnify its auditors, Ernst & Young Australia, as part of the terms of its audit engagement agreement against claims by third parties arising from the audit (for an unspecified amount). No payment has been made to indemnify Ernst & Young during or since the financial year.
ROUNDING
The amounts contained in the Directors’ report and in the financial report have been rounded to the nearest $1,000 (where rounding is applicable) under the option available to the Company under ASIC Class Order 98/100. The Company is an entity to which the Class Order applies.
REMUNERATION REPORT
The Directors of Adairs Limited present the Remuneration Report for the Company for the 53 week period of 29 June 2015 to 3 July 2016. This Remuneration Report forms part of the Directors’ Report and has been audited in accordance with the Corporations Act 2001.
This Report sets out the remuneration arrangements for Adairs’ key management personnel (KMP) (listed in the table below) who have been KMP during the reporting period. For the remainder of this Remuneration Report, the KMP are referred to as either Non-executive Directors or Senior Executives.
All Non-executive Directors and Senior Executives have held their positions for the duration of the reporting period unless indicated otherwise.
Name Position
Non-executive Directors
Michael Butler Independent, Non-executive Chairman
David Briskin Independent, Non-executive Director
Trent Peterson Non-executive Director
Kate Spargo Independent, Non-executive Director
Senior Executives
David MacLean Chief Executive Officer (CEO) and Executive Director
Michael Cherubino Chief Financial Officer (CFO) and Executive Director
Mark Ronan Chief Operating Officer and Company Secretary
Contents
Section 1 Introduction page 24
Section 2 Remuneration Strategy and Policy page 25
Section 3 Role of the Remuneration Committee and external advisers page 25
Section 4 Senior Executive Remuneration Structure page 26
Section 5 Non-Executive Directors Remuneration Structure page 29
Section 6 KMP Disclosures page 30
Section 7 Statutory Remuneration Details and Other Statutory Disclosures page 30
SECTION 1: INTRODUCTION
Remuneration Snapshot
The Company’s performance over the reporting period has been strong, and the Board is focused on continuing to build and deliver value to shareholders, progress its growth plans and selectively pursue opportunities which we believe will add value in a manner which is appropriate having regard to the associated risks. Having a robust remuneration and reward framework that supports and encourages sustainable growth, risk management, and drives our people, is critical to the successful execution of our strategy.
The Company has a cash short term incentive (STI) in place for Senior Executives that is based on achieving pre-determined performance criteria and targets. The primary measure used by the Company for award of FY2016 STI is the EBIT of the business. During FY2016, the Company exceeded its budget, and the stretch targets set at the commencement of the financial year for the STI scheme. Therefore, the Company expects to pay the maximum STI bonuses payable for FY2016.
A DA IR S L IM I T ED24
DIRECTORS ’ REPORT (CO N T I N UED)
The Company has not yet implemented a LTI plan post-Listing. Each Senior Executive holds a significant number of shares and the Board believes that they have material exposure to movements in the Company’s share price and the Company’s performance generally. The Remuneration Committee will continue to review the remuneration arrangements for KMP to ensure that they are relevant, competitive and appropriate for a listed Company. The company will put in place a LTI plan for the Senior Executives over the course of the next 6 months.
SECTION 2: REMUNERATION STRATEGY AND POLICY
A core belief of the Adairs Board is that the attraction, development, engagement and retention of skilled and culturally aligned leaders and team members provides a competitive advantage which is fundamental to the long term success of the Company. The maintenance and development of our leaders and fostering a workplace culture that supports this belief are priorities for the Company.
Adairs is committed to creating a focused and high performance culture. A summary of our philosophy is to provide simple and competitive market based total remuneration arrangements that also are linked in material part to measures of financial performance that we believe best represent the outcomes relevant to the value creation strategy of the Company.
Remuneration can include a number of different elements such as fixed pay, superannuation, short term incentives, long term incentives and other benefits such as tools of trade, study and relocation assistance and car lease arrangements. The elements of the total remuneration package may vary according to the job role, team members experience and performance. The Remuneration Committee also has regard for the equity ownership position of the KMPs, and how that position has arisen, when setting remuneration packages.
In considering the remuneration arrangements of KMP, the Remuneration Committee makes recommendations based on 7 important concepts;
• Simplicity: We seek to ensure remuneration arrangements are simple, and can be easily understood by both the KMP and other key stakeholders.
• Alignment: We seek to ensure material components of the KMP’s remuneration arrangements (including their shareholding as appropriate) contribute to alignment of the interests of the KMP with those of the shareholders.
• Sustainability: We seek to ensure the material aspects of an employee’s remuneration arrangements are sustainable and could withstand tests of precedent and transparency within the organisation and market place.
• Competitive: We seek to ensure our KMP are remunerated such that (when taken as a whole, and having regard to their particular circumstances, including any risks and opportunities) their individual remuneration arrangements are competitive with relevant comparable positions.
• Risk Aware: In considering remuneration arrangements, the Company seeks to manage certain key risk exposures, including the risk of loss of an individual, retention of intellectual property and skills, issues associated with replacement of the individuals, risk of poaching, and the presence and quality of our succession planning.
• Company First: The Company develops systems, policies, processes and team depth to manage its reliance on any given individual within its leadership team. This extends to remuneration, where we seek to ensure the remuneration architecture and individual arrangements are orderly and considered. Finally, we seek to respond to changes in an individual’s circumstance or market conditions in a measured and sustainable manner.
• Reward for outcomes and performance: We back ourselves to identify the outcomes that drive sustainable value creation (or value protection), and seek to reward executives who influence those outcomes most significantly and directly.
SECTION 3: ROLE OF THE REMUNERATION COMMITTEE AND EXTERNAL ADVISERS
The primary objective of the Remuneration Committee is to assist the Board to fulfil its corporate governance and oversight responsibilities in relation to the Company’s people strategy including remuneration components, performance measurements and accountability frameworks, recruitment, engagement, retention, talent management and succession planning.
The Committee also works with the CEO in considering specific situations pertaining to employment terms for individuals, or groups of individuals as needed.
The Committee undertakes an annual review of the Company’s remuneration strategy and remuneration policy to facilitate understanding of the overall approach to remuneration and to confirm alignment with the Company’s business strategy, high standards of governance and compliance with regulatory standards.
The Committee reviews and recommends to the Board for approval, remuneration arrangements for the CEO and other Senior Executives. The Committee also establishes the policy for the remuneration arrangements for Non-executive Directors. The Committee reviews KMP arrangements on an annual basis against the remuneration policy, external remuneration practices, market expectations and regulatory standards. The Committee also reviews relevant individual’s remuneration arrangements in the event that significant circumstances change (e.g. a role or company restructure or change of role). The Committee obtains independent external remuneration advice where appropriate.
A NN UA L REP ORT 2 0 16 2 5
DIRECTORS ’ REPORT (CO N T I N UED)
REMUNERATION REPORT (CONTINUED)
The Remuneration Committee exercises caution in interpreting remuneration surveys. While we seek independent data from time to time, we believe benchmarking of salaries requires an intimate knowledge of the details and role and circumstances of the components of reference data set, and this is rarely possible, complex and prone to error. We therefore regard such information as only one component of the balanced consideration of base salaries and other remuneration terms and do not have a stated position regarding a target benchmark. Market information is sourced from internal and external sources.
Adairs has engaged the services of Ernst & Young and Herbert Smith Freehills to advise on selected aspects of the implementation of a LTI plan. No external advisors have provided remuneration recommendations during the year.
SECTION 4: SENIOR EXECUTIVE REMUNERATION STRUCTURE
Senior Executives are remunerated under a Total Reward structure which currently consists of two elements:
• fixed remuneration comprising base salary package (inclusive of superannuation contributions, car allowances and other benefits); and
• short term incentives (STI).
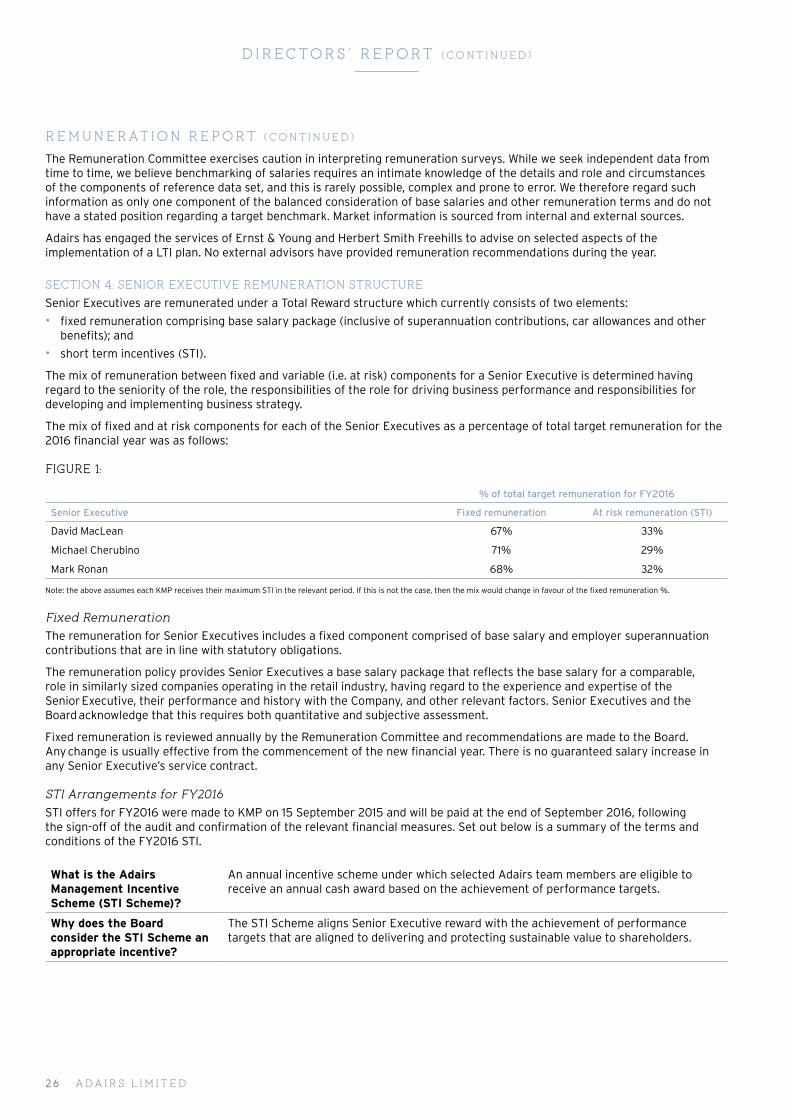
The mix of remuneration between fixed and variable (i.e. at risk) components for a Senior Executive is determined having regard to the seniority of the role, the responsibilities of the role for driving business performance and responsibilities for developing and implementing business strategy.
The mix of fixed and at risk components for each of the Senior Executives as a percentage of total target remuneration for the 2016 financial year was as follows:
FIGURE 1:
% of total target remuneration for FY2016
Senior Executive Fixed remuneration At risk remuneration (STI)
David MacLean 67% 33%
Michael Cherubino 71% 29%
Mark Ronan 68% 32%
Note: the above assumes each KMP receives their maximum STI in the relevant period. If this is not the case, then the mix would change in favour of the fixed remuneration %.
Fixed Remuneration
The remuneration for Senior Executives includes a fixed component comprised of base salary and employer superannuation contributions that are in line with statutory obligations.
The remuneration policy provides Senior Executives a base salary package that reflects the base salary for a comparable, role in similarly sized companies operating in the retail industry, having regard to the experience and expertise of the Senior Executive, their performance and history with the Company, and other relevant factors. Senior Executives and the Board acknowledge that this requires both quantitative and subjective assessment.
Fixed remuneration is reviewed annually by the Remuneration Committee and recommendations are made to the Board. Any change is usually effective from the commencement of the new financial year. There is no guaranteed salary increase in any Senior Executive’s service contract.
STI Arrangements for FY2016
STI offers for FY2016 were made to KMP on 15 September 2015 and will be paid at the end of September 2016, following the sign-off of the audit and confirmation of the relevant financial measures. Set out below is a summary of the terms and conditions of the FY2016 STI.
What is the Adairs Management Incentive Scheme (STI Scheme)?
An annual incentive scheme under which selected Adairs team members are eligible to receive an annual cash award based on the achievement of performance targets.
Why does the Board consider the STI Scheme an appropriate incentive?
The STI Scheme aligns Senior Executive reward with the achievement of performance targets that are aligned to delivering and protecting sustainable value to shareholders.
A DA IR S L IM I T ED2 6

DIRECTORS ’ REPORT (CO N T I N UED)
What are the performance conditions?
The STI Scheme has the following performance conditions:• minimum stock turn target• Company EBIT measures• Continuing service condition
Gateway condition — stock turn target: for a Senior Executive to be eligible to earn any part or all of their STI in FY2016, the Company’s stock turn cannot be less than 3.3x. If the Company’s stock turn target is not met, no STI will be awarded.Company EBIT: the STI Scheme is primarily based upon the Company’s EBIT result for the financial year. Each year the Board will determine the EBIT benchmarks with reference to the annual forecast and prior year results. On achievement of the EBIT benchmark, the Senior Executive will be entitled to an initial incentive and will share in any amount achieved in excess of the EBIT benchmark. For FY2016, the EBIT benchmarks and corresponding bonus amounts payable were:
EBIT D MacLean M Cherubino M Ronan
Below benchmark less than $34m nil nil nil
Benchmark $34m $25,000 $15,000 $15,000
Level 2 $35m $50,000 $30,000 $30,000
Level 3 $36m $75,000 $55,000 $55,000
Level 4 $37m $125,000 $85,000 $85,000
Level 5 $38m $175,000 $115,000 $115,000
Level 6 $39m $225,000 $145,000 $145,000
Level 7 $40m $275,000 $175,000 $175,000
Service condition: there is an additional requirement that on the STI payment date (anticipated to be in September each year), the Senior Executive must be employed by Adairs (and not have given notice or be suspended from employment) otherwise no STI will be paid subject to director’s discretion.
Why were the performance conditions chosen?
EBIT and stock turn levels were chosen as performance conditions to ensure that the STIs are linked to the achievement of key financial objectives and business drivers that we believe are well understood by stakeholders and balanced indicators of success of the individual’s contribution to performance.The Board believes that stock turn is an important measure to support the underlying quality and sustainability of the EBIT result, and ensure underlying cash generation and productivity of the business is also improving.The Remuneration Committee recommends to the Board annual EBIT targets in consultation with the CEO. In setting these targets, the Committee considers the EBIT projections set out in the Company’s approved business plan, and performance (growth) relative to prior year, and other factors specific to the upcoming year. The Board believes that achieving acceptable levels of growth year on year, and meeting targets set out in the Company’s annual business plan are both important.
How are the performance conditions measured and why were these methods chosen?
The Remuneration Committee has ultimate responsibility for assessing whether performance conditions are achieved and for approving STI payments.Individual stock turn target: the stock turn level is set using Adairs’ internal measure of stock turns which is calculated by dividing the total cost of goods sold (excluding distribution costs) by the average month end level of inventory held by the business through the financial year. Adairs uses this methodology as it ensures that the inventory is better managed throughout the season as opposed to using opening and closing balances.Company EBIT: for the purpose of determining the Company’s achievement of the EBIT benchmark, financial results are extracted by reference to the Company’s audited financial statements. The use of financial statements ensures the integrity of the measure and alignment with the true financial performance of the Company.One off adjustments will only be considered by the Committee in exceptional circumstances and where they occur as a result of matters that are materially outside the control of management and could not have reasonably been contemplated at the time of setting the targets. The Board expects such events to be rare.
In addition, the Board may decide to pay Senior Executives discretionary bonus amounts in addition to their maximum STI amount under the STI Scheme above.
A NN UA L REP ORT 2 0 16 27
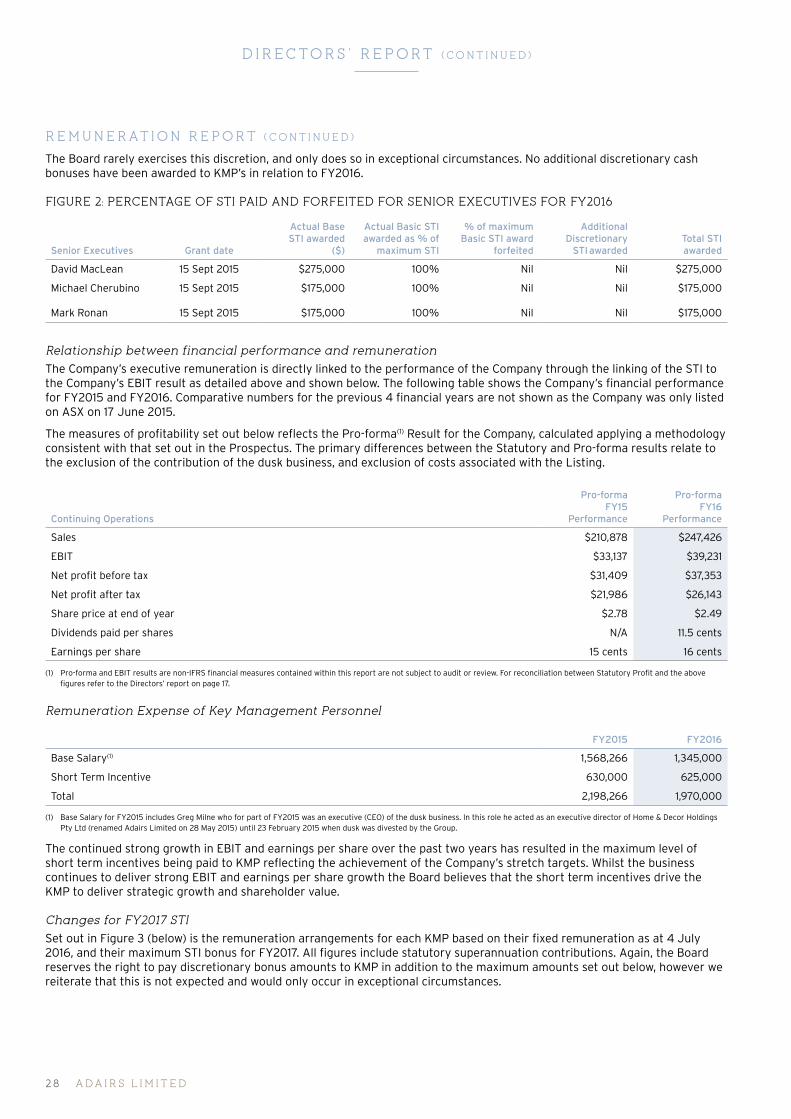
DIRECTORS ’ REPORT (CO N T I N UED)
REMUNERATION REPORT (CONTINUED)
The Board rarely exercises this discretion, and only does so in exceptional circumstances. No additional discretionary cash bonuses have been awarded to KMP’s in relation to FY2016.
FIGURE 2: PERCENTAGE OF STI PAID AND FORFEITED FOR SENIOR EXECUTIVES FOR FY2016
Senior Executives Grant date
Actual Base STI awarded
($)
Actual Basic STI awarded as % of
maximum STI
% of maximum Basic STI award
forfeited
Additional Discretionary
STI awardedTotal STI awarded
David MacLean 15 Sept 2015 $275,000 100% Nil Nil $275,000
Michael Cherubino 15 Sept 2015 $175,000 100% Nil Nil $175,000
Mark Ronan 15 Sept 2015 $175,000 100% Nil Nil $175,000
Relationship between financial performance and remuneration
The Company’s executive remuneration is directly linked to the performance of the Company through the linking of the STI to the Company’s EBIT result as detailed above and shown below. The following table shows the Company’s financial performance for FY2015 and FY2016. Comparative numbers for the previous 4 financial years are not shown as the Company was only listed on ASX on 17 June 2015.
The measures of profitability set out below reflects the Pro-forma(1) Result for the Company, calculated applying a methodology consistent with that set out in the Prospectus. The primary differences between the Statutory and Pro-forma results relate to the exclusion of the contribution of the dusk business, and exclusion of costs associated with the Listing.
Continuing Operations
Pro-formaFY15
Performance
Pro-formaFY16
Performance
Sales $210,878 $247,426
EBIT $33,137 $39,231
Net profit before tax $31,409 $37,353
Net profit after tax $21,986 $26,143
Share price at end of year $2.78 $2.49
Dividends paid per shares N/A 11.5 cents
Earnings per share 15 cents 16 cents
(1) Pro-forma and EBIT results are non-IFRS financial measures contained within this report are not subject to audit or review. For reconciliation between Statutory Profit and the above figures refer to the Directors’ report on page 17.
Remuneration Expense of Key Management Personnel
FY2015 FY2016
Base Salary(1) 1,568,266 1,345,000
Short Term Incentive 630,000 625,000
Total 2,198,266 1,970,000
(1) Base Salary for FY2015 includes Greg Milne who for part of FY2015 was an executive (CEO) of the dusk business. In this role he acted as an executive director of Home & Decor Holdings Pty Ltd (renamed Adairs Limited on 28 May 2015) until 23 February 2015 when dusk was divested by the Group.
The continued strong growth in EBIT and earnings per share over the past two years has resulted in the maximum level of short term incentives being paid to KMP reflecting the achievement of the Company’s stretch targets. Whilst the business continues to deliver strong EBIT and earnings per share growth the Board believes that the short term incentives drive the KMP to deliver strategic growth and shareholder value.
Changes for FY2017 STI
Set out in Figure 3 (below) is the remuneration arrangements for each KMP based on their fixed remuneration as at 4 July 2016, and their maximum STI bonus for FY2017. All figures include statutory superannuation contributions. Again, the Board reserves the right to pay discretionary bonus amounts to KMP in addition to the maximum amounts set out below, however we reiterate that this is not expected and would only occur in exceptional circumstances.
A DA IR S L IM I T ED2 8

DIRECTORS ’ REPORT (CO N T I N UED)
FIGURE 3: FY2017 REMUNERATION OPPORTUNITIES
KMP Executive
Fixed remuneration
(at 4 July 2016)
Maximum Potential STI for FY2017(1)
% of fixed remuneration
available under FY2017 STI
David MacLean $625,000 $312,500 50%
Michael Cherubino $433,000 $175,000 40.4%
Mark Ronan $425,000 $212,500 50.0%
(1) Assumes that a full STI is received by the relevant KMP. The actual reward is dependent on the achievement of performance targets in FY2017.
LTI Arrangements
The Senior Executives currently do not participate in a LTI plan. The Remuneration Committee is in the process of developing a LTI program and expect to implement a LTI plan in the coming 6 months.
The Board believe that equity ownership is an important component of aligning the interests of KMP with shareholders.
Service Agreements
Adairs Holding Australia Pty Ltd (ACN 128 275 838) (a wholly owned subsidiary of the Company) (Adairs Holding) has entered into service agreements with David MacLean, Michael Cherubino and Mark Ronan to formalise the remuneration and terms of their employment with Adairs. Each of these agreements provides for the provision of fixed remuneration, performance related cash bonuses and other benefits.
The service agreements with the Senior Executives are ongoing until terminated by either party. All contracts with the Senior Executives may be terminated early by either party with six months’ notice. In either event, Adairs Holding may make payment in lieu of notice. In the event of serious misconduct or other circumstances warranting summary dismissal, Adairs Holding may terminate the Senior Executive’s employment contract immediately without notice.
The Corporations Act restricts the termination benefits that can be provided to KMP on cessation of their employment, unless shareholder approval is obtained. The shareholders of the Company and Adairs Holding approved the termination arrangements of David MacLean and Michael Cherubino at a general meeting of the Company on 1 June 2015.
After cessation of employment for any reason, for a period of 6 months, the Senior Executive must not compete with the Company (including direct or indirect involvement as a principal, agent, partner, employee, shareholder, unit holder, director, trustee, beneficiary, manager, contractor, adviser or financier), without first obtaining the consent of the Company in writing, subject to certain carve outs and exemptions.
In addition, in the case of David MacLean and Michael Cherubino, where the employee has resigned from the Company, the Board may elect to extend this restraint period for further period of up to 6 months by notifying the employee and paying the employee a further amount for each month (up to a maximum of 6 months) on a monthly basis.
No contracted retirement benefits are in place with any of the Company’s Senior Executives.
SECTION 5: NON-EXECUTIVE DIRECTORS REMUNERATION STRUCTURE
Overview
The Company’s remuneration strategy is designed to attract and retain experienced, qualified Non-executive Directors and to remunerate appropriately to reflect the demands which are made on them and the responsibilities of the position.
The level of fees are reviewed annually by the Remuneration Committee, and are based on the fees paid for comparative Non-executive Director roles in similarly sized publicly listed companies operating in the retail industry.
Directors’ Fees
Non-executive Director Fees are determined within an aggregate Directors’ fee pool approved by shareholders. The current approved fee pool of up to $450,000 per annum was approved at the Board meeting of the Company on 1 June 2015.
This pool provides the capacity to appoint additional Directors to facilitate board succession and regeneration and to apply the Company’s remuneration policy. No increase in the fee pool is proposed.
Currently, annual base Non-executive Directors’ fees are $137,958 for the Chairman and $70,000 for each other Non-executive Director. All Non-executive Director fees include superannuation. No additional fees are paid to the chairs and members of the Audit and Risk Committee, and the Remuneration Committees. The Director fees for Trent Peterson are paid to Catalyst Investment Managers Pty Ltd.
Directors may also be reimbursed for travel and other expenses incurred in attending to the Company’s affairs. Directors may be paid additional or special remuneration where a Director performs services outside the ordinary duties of a Non-executive Director. There are no retirement benefit schemes for Non-executive Directors other than statutory superannuation contributions, and Non-executive Directors do not currently receive shares, performance rights or share options as part of their remuneration.
A NN UA L REP ORT 2 0 16 2 9
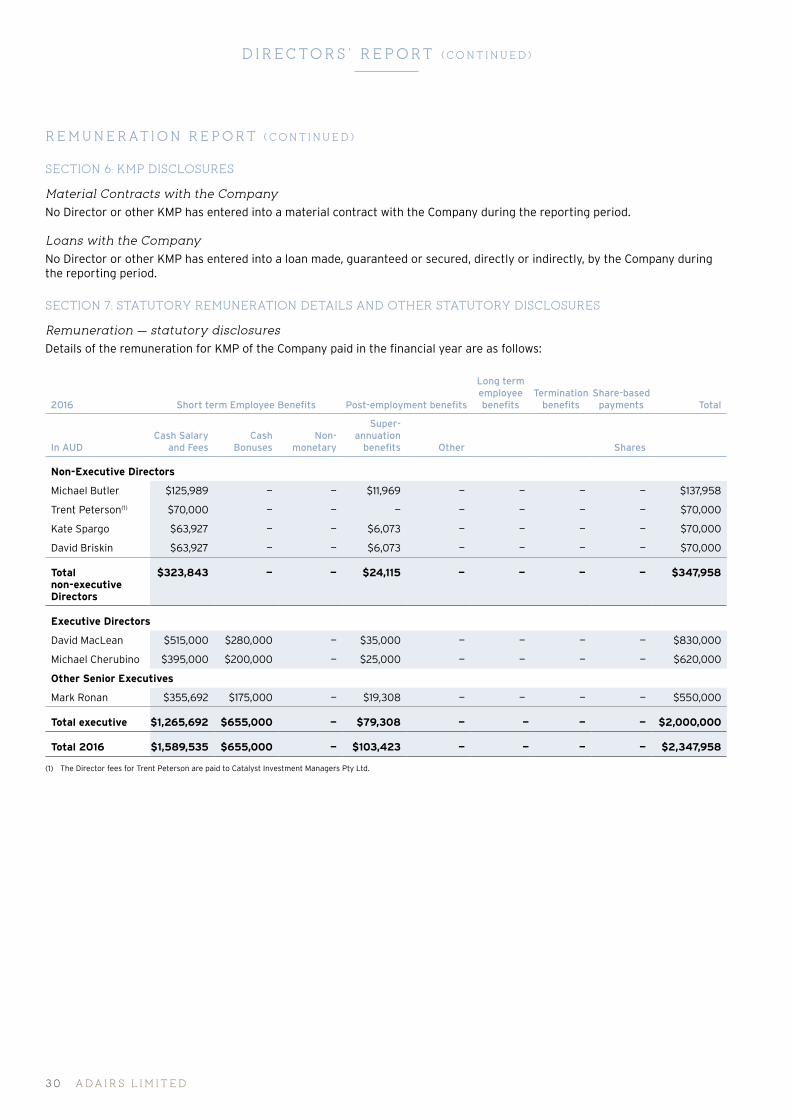
DIRECTORS ’ REPORT (CO N T I N UED)
REMUNERATION REPORT (CONTINUED)
SECTION 6: KMP DISCLOSURES
Material Contracts with the Company
No Director or other KMP has entered into a material contract with the Company during the reporting period.
Loans with the Company
No Director or other KMP has entered into a loan made, guaranteed or secured, directly or indirectly, by the Company during the reporting period.
SECTION 7: STATUTORY REMUNERATION DETAILS AND OTHER STATUTORY DISCLOSURES
Remuneration — statutory disclosures
Details of the remuneration for KMP of the Company paid in the financial year are as follows:
2016 Short term Employee Benefits Post-employment benefits
Long term employee benefits
Termination benefits
Share-based payments Total
In AUDCash Salary
and FeesCash
BonusesNon-
monetary
Super-annuation
benefits Other Shares
Non-Executive Directors
Michael Butler $125,989 — — $11,969 — — — — $137,958
Trent Peterson(1) $70,000 — — — — — — — $70,000
Kate Spargo $63,927 — — $6,073 — — — — $70,000
David Briskin $63,927 — — $6,073 — — — — $70,000
Total non-executive Directors
$323,843 — — $24,115 — — — — $347,958
Executive Directors
David MacLean $515,000 $280,000 — $35,000 — — — — $830,000
Michael Cherubino $395,000 $200,000 — $25,000 — — — — $620,000
Other Senior Executives
Mark Ronan $355,692 $175,000 — $19,308 — — — — $550,000
Total executive $1,265,692 $655,000 — $79,308 — — — — $2,000,000
Total 2016 $1,589,535 $655,000 — $103,423 — — — — $2,347,958
(1) The Director fees for Trent Peterson are paid to Catalyst Investment Managers Pty Ltd.
A DA IR S L IM I T ED3 0
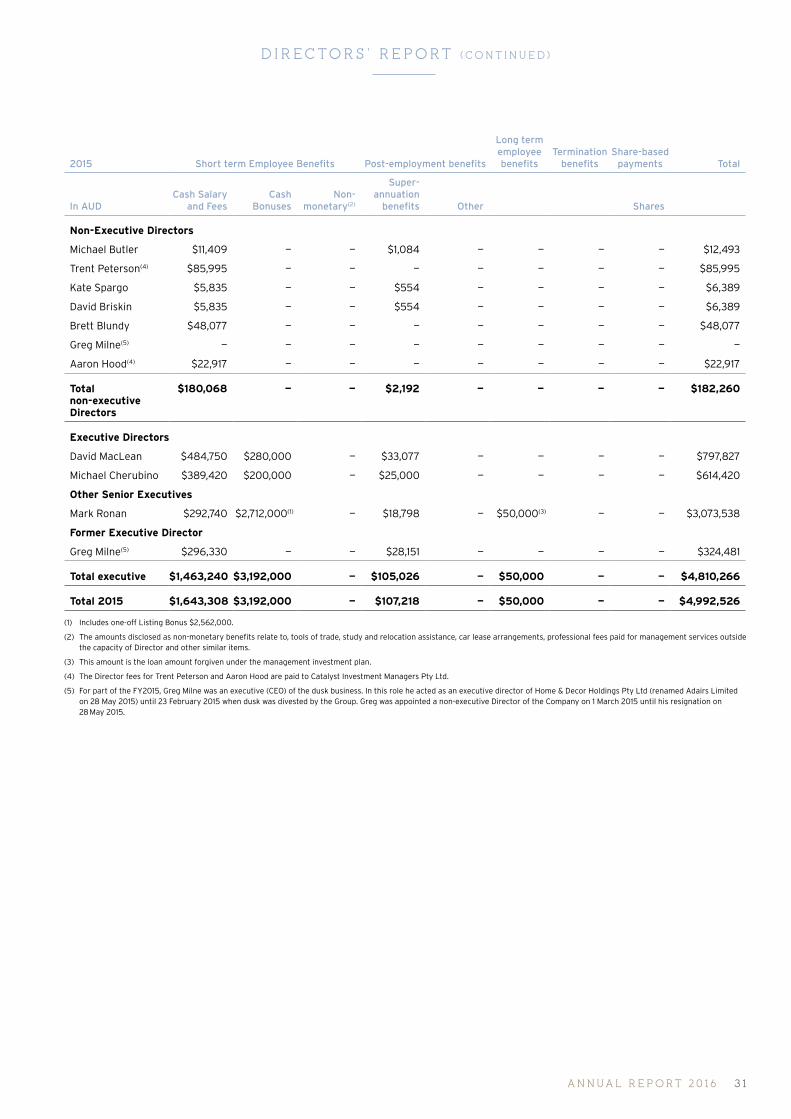
DIRECTORS ’ REPORT (CO N T I N UED)
2015 Short term Employee Benefits Post-employment benefits
Long term employee benefits
Termination benefits
Share-based payments Total
In AUDCash Salary
and FeesCash
BonusesNon-
monetary(2)
Super-annuation
benefits Other Shares
Non-Executive Directors
Michael Butler $11,409 — — $1,084 — — — — $12,493
Trent Peterson(4) $85,995 — — — — — — — $85,995
Kate Spargo $5,835 — — $554 — — — — $6,389
David Briskin $5,835 — — $554 — — — — $6,389
Brett Blundy $48,077 — — — — — — — $48,077
Greg Milne(5) — — — — — — — — —
Aaron Hood(4) $22,917 — — — — — — — $22,917
Total non-executive Directors
$180,068 — — $2,192 — — — — $182,260
Executive Directors
David MacLean $484,750 $280,000 — $33,077 — — — — $797,827
Michael Cherubino $389,420 $200,000 — $25,000 — — — — $614,420
Other Senior Executives
Mark Ronan $292,740 $2,712,000(1) — $18,798 — $50,000(3) — — $3,073,538
Former Executive Director
Greg Milne(5) $296,330 — — $28,151 — — — — $324,481
Total executive $1,463,240 $3,192,000 — $105,026 — $50,000 — — $4,810,266
Total 2015 $1,643,308 $3,192,000 — $107,218 — $50,000 — — $4,992,526
(1) Includes one-off Listing Bonus $2,562,000.
(2) The amounts disclosed as non-monetary benefits relate to, tools of trade, study and relocation assistance, car lease arrangements, professional fees paid for management services outside the capacity of Director and other similar items.
(3) This amount is the loan amount forgiven under the management investment plan.
(4) The Director fees for Trent Peterson and Aaron Hood are paid to Catalyst Investment Managers Pty Ltd.
(5) For part of the FY2015, Greg Milne was an executive (CEO) of the dusk business. In this role he acted as an executive director of Home & Decor Holdings Pty Ltd (renamed Adairs Limited on 28 May 2015) until 23 February 2015 when dusk was divested by the Group. Greg was appointed a non-executive Director of the Company on 1 March 2015 until his resignation on 28 May 2015.
A NN UA L REP ORT 2 0 16 31
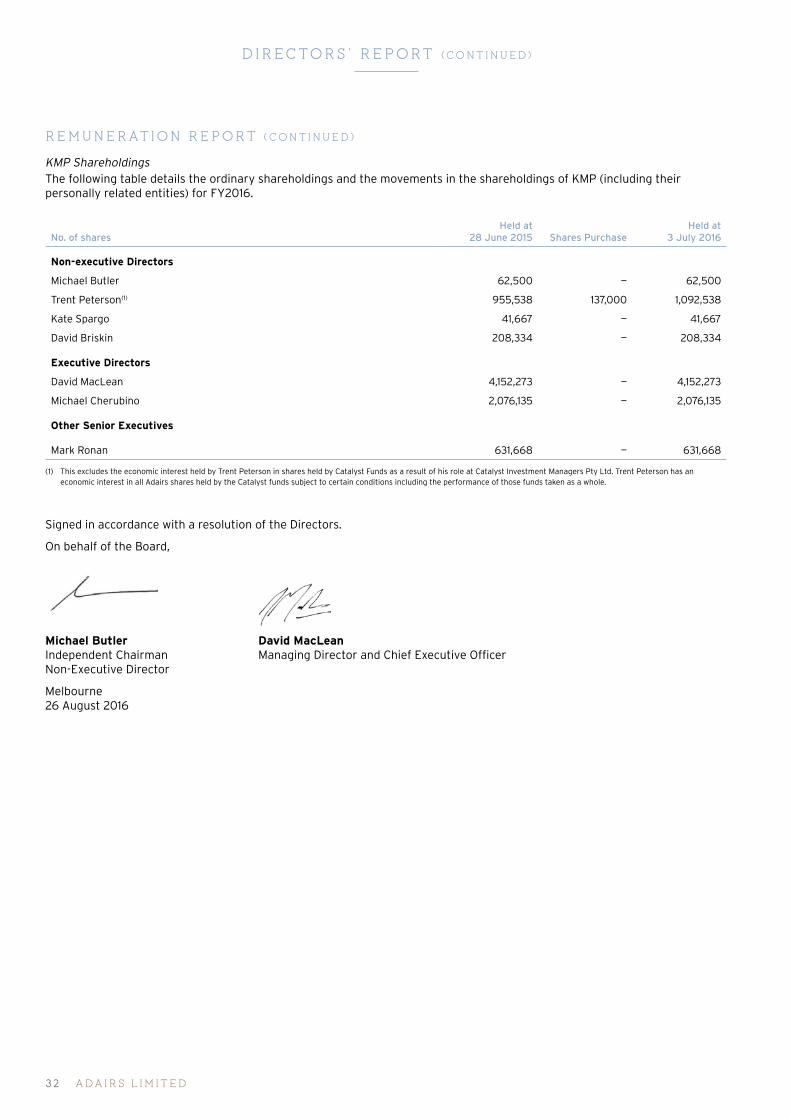
DIRECTORS ’ REPORT (CO N T I N UED)
REMUNERATION REPORT (CONTINUED)
KMP ShareholdingsThe following table details the ordinary shareholdings and the movements in the shareholdings of KMP (including their personally related entities) for FY2016.
No. of sharesHeld at
28 June 2015 Shares PurchaseHeld at
3 July 2016
Non-executive Directors
Michael Butler 62,500 — 62,500
Trent Peterson(1) 955,538 137,000 1,092,538
Kate Spargo 41,667 — 41,667
David Briskin 208,334 — 208,334
Executive Directors
David MacLean 4,152,273 — 4,152,273
Michael Cherubino 2,076,135 — 2,076,135
Other Senior Executives
Mark Ronan 631,668 — 631,668
(1) This excludes the economic interest held by Trent Peterson in shares held by Catalyst Funds as a result of his role at Catalyst Investment Managers Pty Ltd. Trent Peterson has an economic interest in all Adairs shares held by the Catalyst funds subject to certain conditions including the performance of those funds taken as a whole.
Signed in accordance with a resolution of the Directors.
On behalf of the Board,
Michael Butler Independent Chairman Non-Executive Director
Melbourne 26 August 2016
David MacLean Managing Director and Chief Executive Officer
A DA IR S L IM I T ED32

INDEPENDENT AUDITOR’ S REPORT
Ernst & Young 8 Exhibition Street Melbourne VIC 3000 Australia GPO Box 67 Melbourne VIC 3001
Tel: +61 3 9288 8000 Fax: +61 3 8650 7777 ey.com/au
A member firm of Ernst & Young Global Limited Liability limited by a scheme approved under Professional Standards Legislation
Independent auditor's report to the members of Adairs Limited
Report on the financial report
We have audited the accompanying financial report of Adairs Limited, which comprises the consolidated statement of financial position as at 3 July 2016, the consolidated statement of comprehensive income, the consolidated statement of changes in equity and the consolidated statement of cash flows for the 53 weeks then ended, notes comprising a summary of significant accounting policies and other explanatory information, and the directors' declaration of the consolidated entity comprising the company and the entities it controlled for the financial year.
Directors' responsibility for the financial report
The directors of the company are responsible for the preparation of the financial report that gives a true and fair view in accordance with Australian Accounting Standards and the Corporations Act 2001 and for such internal controls as the directors determine are necessary to enable the preparation of the financial report that is free from material misstatement, whether due to fraud or error. In Note 2, the directors also state, in accordance with Accounting Standard AASB 101 Presentation of Financial Statements, that the financial statements comply with International Financial Reporting Standards.
Auditor's responsibility
Our responsibility is to express an opinion on the financial report based on our audit. We conducted our audit in accordance with Australian Auditing Standards. Those standards require that we comply with relevant ethical requirements relating to audit engagements and plan and perform the audit to obtain reasonable assurance about whether the financial report is free from material misstatement.
An audit involves performing procedures to obtain audit evidence about the amounts and disclosures in the financial report. The procedures selected depend on the auditor's judgment, including the assessment of the risks of material misstatement of the financial report, whether due to fraud or error. In making those risk assessments, the auditor considers internal controls relevant to the entity's preparation and fair presentation of the financial report in order to design audit procedures that are appropriate in the circumstances, but not for the purpose of expressing an opinion on the effectiveness of the entity's internal controls. An audit also includes evaluating the appropriateness of accounting policies used and the reasonableness of accounting estimates made by the directors, as well as evaluating the overall presentation of the financial report.
We believe that the audit evidence we have obtained is sufficient and appropriate to provide a basis for our audit opinion.
Independence
In conducting our audit we have complied with the independence requirements of the Corporations Act 2001. We have given to the directors of the company a written Auditor’s Independence Declaration, a copy of which is included in the directors’ report.
A NN UA L REP ORT 2 0 16 3 3

INDEPENDENT AUDITOR’ S REPORT (CO N T I N UED)
A member firm of Ernst & Young Global Limited Liability limited by a scheme approved under Professional Standards Legislation
Opinion
In our opinion:
a. the financial report of Adairs Limited is in accordance with the Corporations Act 2001, including:
i giving a true and fair view of the consolidated entity's financial position as at 3 July 2016 and of its performance for the 53 weeks ended on that date; and
ii complying with Australian Accounting Standards and the Corporations Regulations 2001; and
b. the financial report also complies with International Financial Reporting Standards as disclosed in Note 2.
Report on the remuneration report
We have audited the Remuneration Report included in pages 24 to 32 of the directors' report for the 53 weeks ended 3 July 2016. The directors of the company are responsible for the preparation and presentation of the Remuneration Report in accordance with section 300A of the Corporations Act 2001. Our responsibility is to express an opinion on the Remuneration Report, based on our audit conducted in accordance with Australian Auditing Standards.
Opinion
In our opinion, the Remuneration Report of Adairs Limited for the 53 weeks ended 3 July 2016, complies with section 300A of the Corporations Act 2001.
Ernst & Young
Ashley Butler Partner 26 August 2016
A DA IR S L IM I T ED3 4
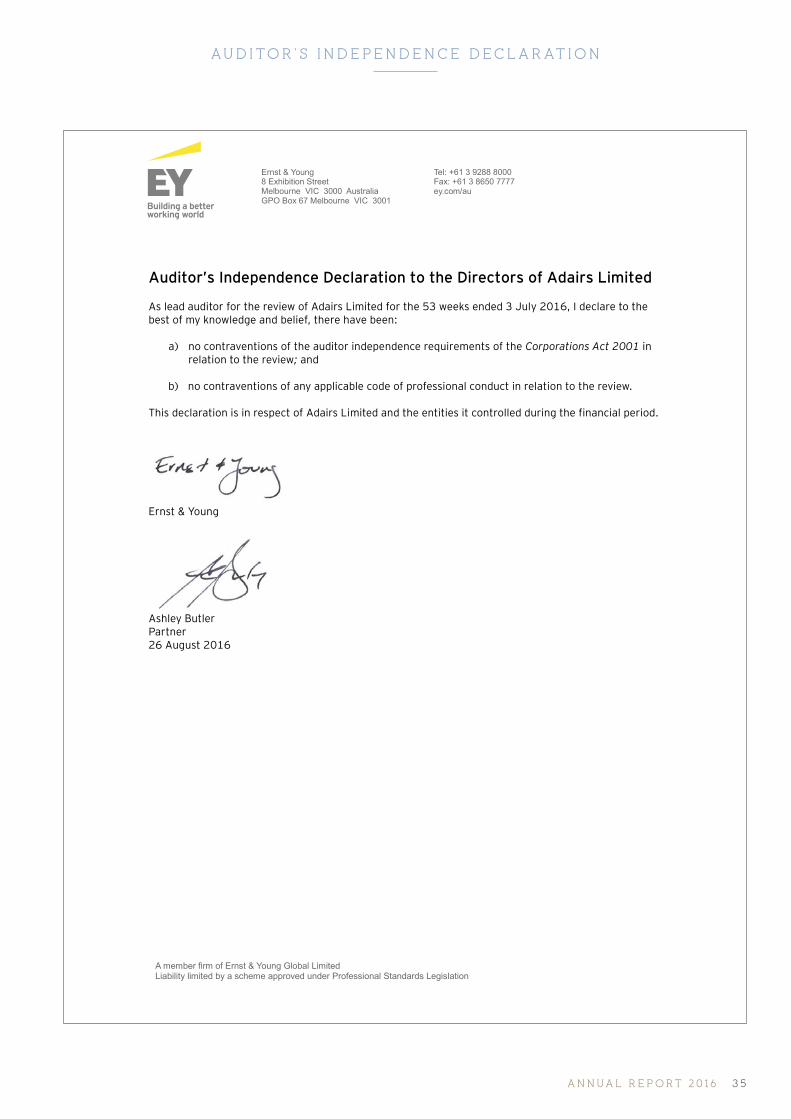
AUDITOR’ S INDEPENDENCE DECL AR ATION
ADAIRS LIMITED
Ernst & Young8 Exhibition Street Melbourne VIC 3000 AustraliaGPO Box 67 Melbourne VIC 3001
Tel: +61 3 9288 8000Fax: +61 3 8650 7777ey.com/au
A member firm of Ernst & Young Global LimitedLiability limited by a scheme approved under Professional Standards Legislation
Auditor’s Independence Declaration to the Directors of Adairs Limited
As lead auditor for the review of Adairs Limited for the 53 weeks ended 3 July 2016, I declare to the best of my knowledge and belief, there have been:
a) no contraventions of the auditor independence requirements of the Corporations Act 2001 inrelation to the review; and
b) no contraventions of any applicable code of professional conduct in relation to the review.
This declaration is in respect of Adairs Limited and the entities it controlled during the financial period.
Ernst & Young
Ashley Butler Partner 26 August 2016
A NN UA L REP ORT 2 0 16 3 5
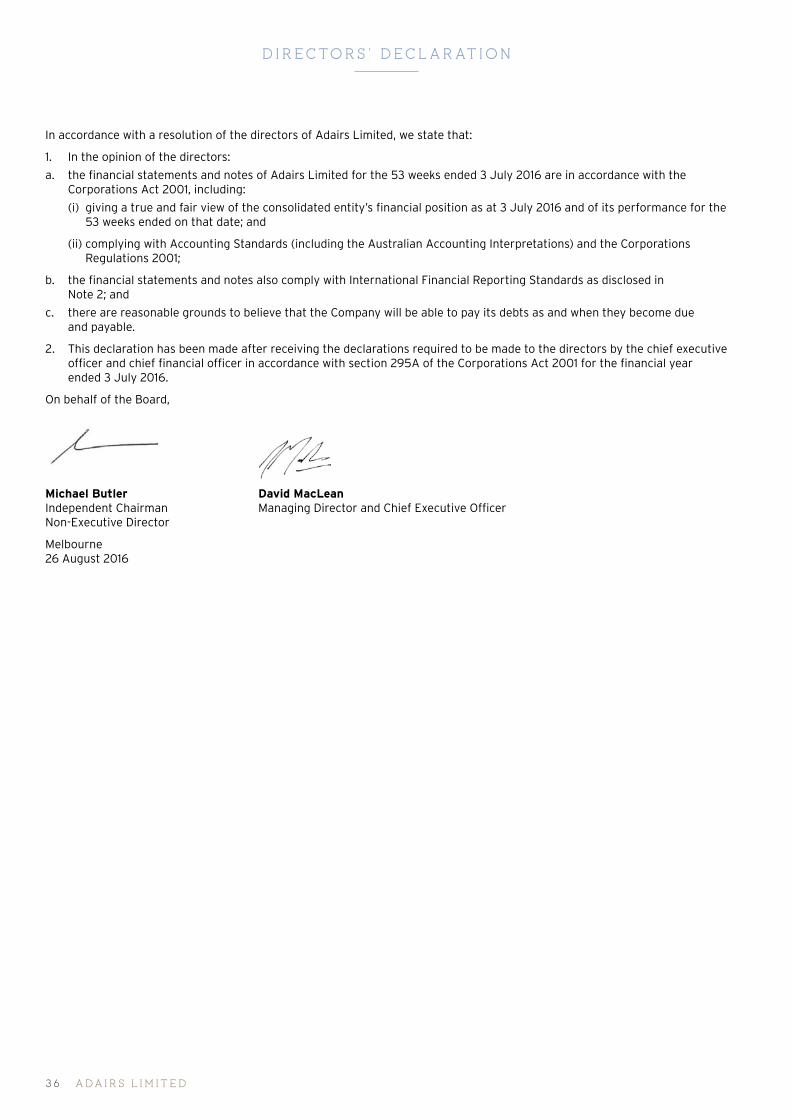
DIRECTORS ’ DECL AR ATION
In accordance with a resolution of the directors of Adairs Limited, we state that:
1. In the opinion of the directors:
a. the financial statements and notes of Adairs Limited for the 53 weeks ended 3 July 2016 are in accordance with the Corporations Act 2001, including:
(i) giving a true and fair view of the consolidated entity’s financial position as at 3 July 2016 and of its performance for the 53 weeks ended on that date; and
(ii) complying with Accounting Standards (including the Australian Accounting Interpretations) and the Corporations Regulations 2001;
b. the financial statements and notes also comply with International Financial Reporting Standards as disclosed in Note 2; and
c. there are reasonable grounds to believe that the Company will be able to pay its debts as and when they become due and payable.
2. This declaration has been made after receiving the declarations required to be made to the directors by the chief executive officer and chief financial officer in accordance with section 295A of the Corporations Act 2001 for the financial year ended 3 July 2016.
On behalf of the Board,
Michael Butler Independent Chairman Non-Executive Director
Melbourne 26 August 2016
David MacLean Managing Director and Chief Executive Officer
A DA IR S L IM I T ED3 6
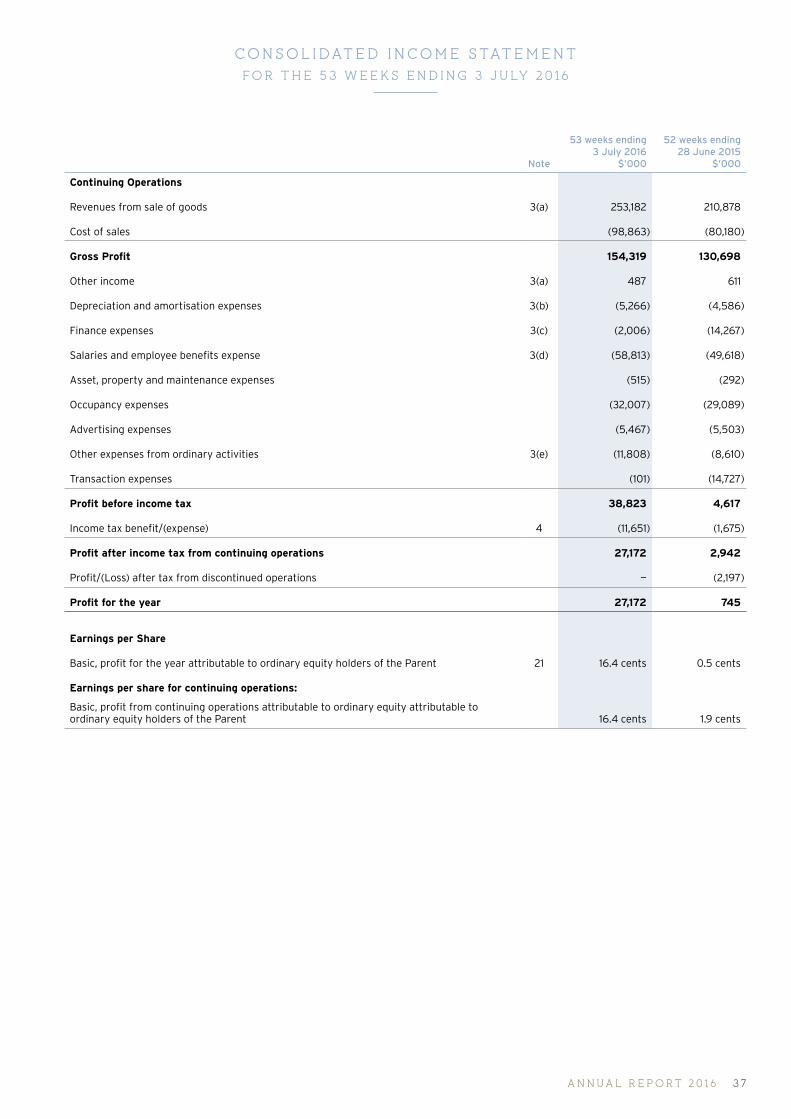
CONSOLIDATED INCOME STATEMENTFOR T HE 5 3 W EEK S ENDING 3 J ULY 2 016
Note
53 weeks ending 3 July 2016
$’000
52 weeks ending 28 June 2015
$’000
Continuing Operations
Revenues from sale of goods 3(a) 253,182 210,878
Cost of sales (98,863) (80,180)
Gross Profit 154,319 130,698
Other income 3(a) 487 611
Depreciation and amortisation expenses 3(b) (5,266) (4,586)
Finance expenses 3(c) (2,006) (14,267)
Salaries and employee benefits expense 3(d) (58,813) (49,618)
Asset, property and maintenance expenses (515) (292)
Occupancy expenses (32,007) (29,089)
Advertising expenses (5,467) (5,503)
Other expenses from ordinary activities 3(e) (11,808) (8,610)
Transaction expenses (101) (14,727)
Profit before income tax 38,823 4,617
Income tax benefit/(expense) 4 (11,651) (1,675)
Profit after income tax from continuing operations 27,172 2,942
Profit/(Loss) after tax from discontinued operations — (2,197)
Profit for the year 27,172 745
Earnings per Share
Basic, profit for the year attributable to ordinary equity holders of the Parent 21 16.4 cents 0.5 cents
Earnings per share for continuing operations:
Basic, profit from continuing operations attributable to ordinary equity attributable to ordinary equity holders of the Parent 16.4 cents 1.9 cents
A NN UA L REP ORT 2 0 16 37
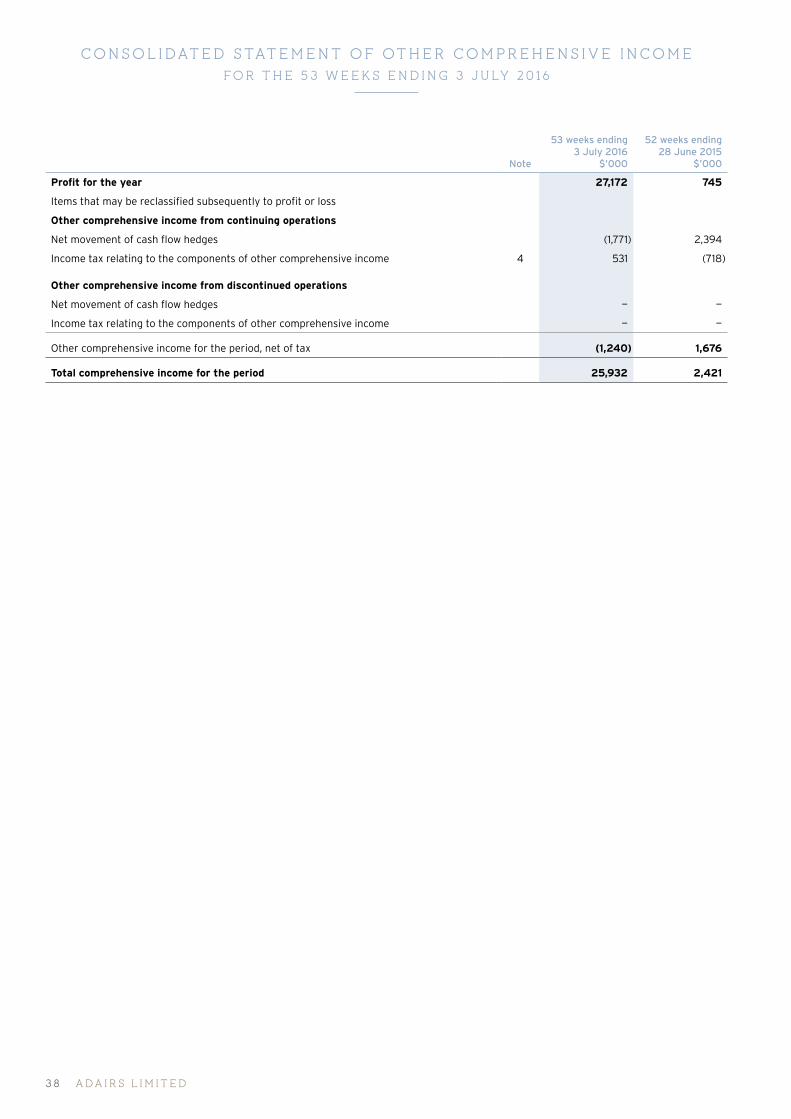
CONSOLIDATED STATEMENT OF OTHER COMPREHENSIVE INCOMEFOR T HE 5 3 W EEK S ENDING 3 J ULY 2 016
Note
53 weeks ending 3 July 2016
$’000
52 weeks ending 28 June 2015
$’000
Profit for the year 27,172 745
Items that may be reclassified subsequently to profit or loss
Other comprehensive income from continuing operations
Net movement of cash flow hedges (1,771) 2,394
Income tax relating to the components of other comprehensive income 4 531 (718)
Other comprehensive income from discontinued operations
Net movement of cash flow hedges — —
Income tax relating to the components of other comprehensive income — —
Other comprehensive income for the period, net of tax (1,240) 1,676
Total comprehensive income for the period 25,932 2,421
A DA IR S L IM I T ED3 8

CONSOLIDATED STATEMENT OF F INANCIAL PO S IT IONA S AT 3 J ULY 2 016
Note
53 weeks ending 3 July 2016
$’000
52 weeks ending 28 June 2015
$’000
ASSETS
CURRENT ASSETS
Cash and cash equivalents 5 14,676 9,437
Trade and other receivables 6 6,599 4,790
Inventories 7 26,272 23,244
Current tax receivable — —
Derivative financial instruments 15 — 753
TOTAL CURRENT ASSETS 47,547 38,224
NON-CURRENT ASSETS
Trade and other receivables 6 — —
Property, plant and equipment 8 16,007 10,944
Intangibles 9 101,004 101,041
Deferred tax assets 4 6,725 7,190
TOTAL NON-CURRENT ASSETS 123,736 119,175
TOTAL ASSETS 171,283 157,399
LIABILITIES
CURRENT LIABILITIES
Trade and other payables 10 15,391 23,718
Interest bearing liabilities 11 (121) (121)
Current tax liabilities 8,794 6,531
Provisions 12 3,496 3,523
Derivative financial instruments 15 1,015 —
TOTAL CURRENT LIABILITIES 28,575 33,651
NON-CURRENT LIABILITIES
Deferred tax liabilities 4 58 326
Trade and other payables 10 — —
Interest bearing liabilities 11 41,921 41,800
Provisions 12 5,136 3,670
Derivative financial instruments 15 3 —
TOTAL NON-CURRENT LIABILITIES 47,118 45,796
TOTAL LIABILITIES 75,693 79,447
NET ASSETS 95,590 77,952
EQUITY
Contributed equity 68,349 68,349
Reserves 13 (713) 527
Retained earnings 27,954 9,076
TOTAL EQUITY 95,590 77,952
A NN UA L REP ORT 2 0 16 3 9

CONSOLIDATED STATEMENT OF CHANGES IN EQ UIT YFOR T HE 5 3 W EEK S ENDING 3 J ULY 2 016
Note
Ordinary shares $’000
Cash flow hedge reserve
$’000
Retained earnings
$’000Total
$’000
At 28 June 2015 68,349 527 9,076 77,952
Profit for the period — — 27,172 27,172
Other comprehensive income — (1,240) — (1,240)
Total comprehensive income for the period — (1,240) 27,172 25,932
Transactions with owners in their capacity as owners:
Dividend payment 23 — — (8,294) (8,294)
At 3 July 2016 68,349 (713) 27,954 95,590
Ordinary shares $’000
Cash flow hedge reserve
$’000
Retained earnings
$’000Total
$’000
At 1 July 2014 34,718 (1,149) 8,331 41,900
Profit for the period — — 2,942 2,942
Profit from discontinued operations — — (2,197) (2,197)
Other comprehensive income — 1,676 — 1,676
Total comprehensive income for the period — 1,676 745 2,421
Transactions with owners in their capacity as owners:
Issued shares 35,645 — — 35,645
Share issue costs capitalised (2,014) — — (2,014)
At 28 June 2015 68,349 527 9,076 77,952
A DA IR S L IM I T ED4 0
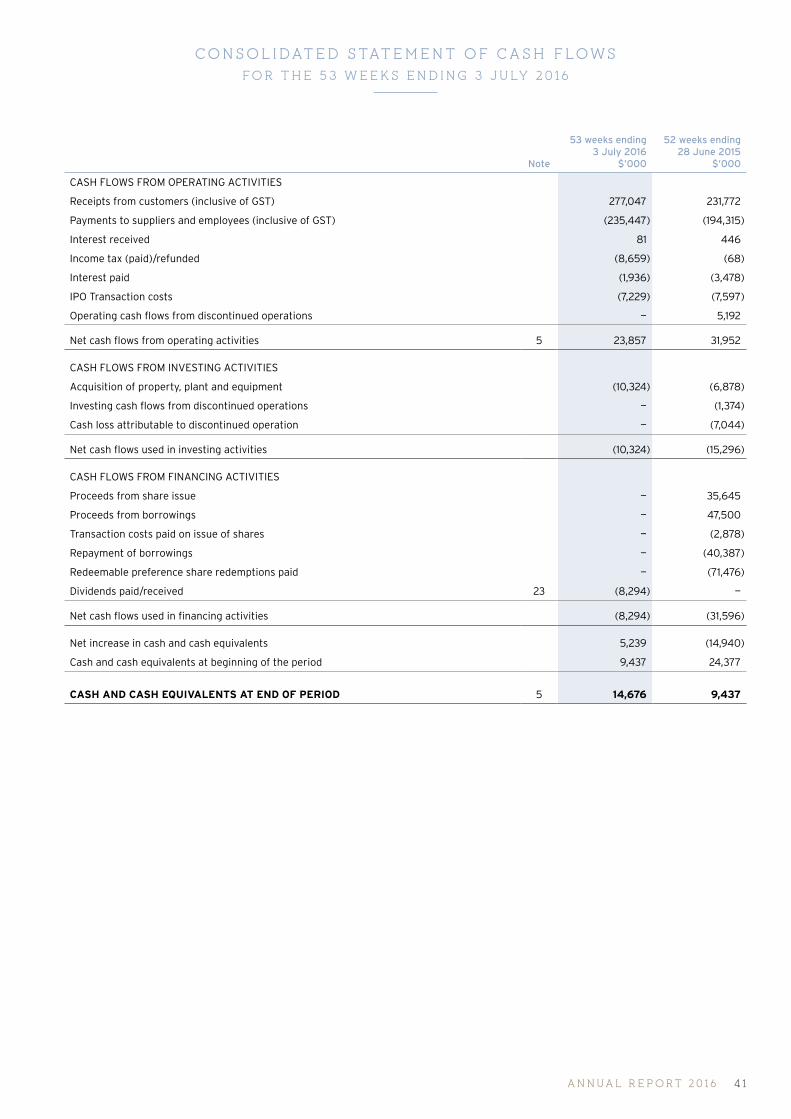
CONSOLIDATED STATEMENT OF CA SH FLOWSFOR T HE 5 3 W EEK S ENDING 3 J ULY 2 016
Note
53 weeks ending 3 July 2016
$’000
52 weeks ending 28 June 2015
$’000
CASH FLOWS FROM OPERATING ACTIVITIES
Receipts from customers (inclusive of GST) 277,047 231,772
Payments to suppliers and employees (inclusive of GST) (235,447) (194,315)
Interest received 81 446
Income tax (paid)/refunded (8,659) (68)
Interest paid (1,936) (3,478)
IPO Transaction costs (7,229) (7,597)
Operating cash flows from discontinued operations — 5,192
Net cash flows from operating activities 5 23,857 31,952
CASH FLOWS FROM INVESTING ACTIVITIES
Acquisition of property, plant and equipment (10,324) (6,878)
Investing cash flows from discontinued operations — (1,374)
Cash loss attributable to discontinued operation — (7,044)
Net cash flows used in investing activities (10,324) (15,296)
CASH FLOWS FROM FINANCING ACTIVITIES
Proceeds from share issue — 35,645
Proceeds from borrowings — 47,500
Transaction costs paid on issue of shares — (2,878)
Repayment of borrowings — (40,387)
Redeemable preference share redemptions paid — (71,476)
Dividends paid/received 23 (8,294) —
Net cash flows used in financing activities (8,294) (31,596)
Net increase in cash and cash equivalents 5,239 (14,940)
Cash and cash equivalents at beginning of the period 9,437 24,377
CASH AND CASH EQUIVALENTS AT END OF PERIOD 5 14,676 9,437
A NN UA L REP ORT 2 0 16 41

NOTES TO THE F INANCIAL STATEMENTSFOR T HE 5 3 W EEK S ENDING 3 J ULY 2 016
NOTE 1 . CORPORATE INFORMATION
The consolidated financial statements of Adairs Limited and its subsidiaries (collectively, the Group) for the 53 weeks ending 3 July 2016 were authorised for issue in accordance with a resolution of the directors on 26 August 2016.
Adairs operates on a retail accounting calendar which consists of four 13 weeks quarters based on weekly financial and operating performance, equating to an annual 52 week reporting period with a 53 week reporting period every five to six years. In FY2016, there was a 53 week reporting period with an additional week of operations occurring. The implication of this in FY2016 is that Adairs has 371 financial year days versus 364 financial year days in FY2015.
Adairs Limited (the Company or the parent) is a for profit company limited by shares incorporated in Australia whose shares are publicly traded on the Australian Securities Exchange.
The Group is principally engaged in retail operations in the Manchester, Homewares and Home Décor market segments within Australia. The Group’s principal place of business is International Court, Scoresby, Australia. Further information on the nature of the operations and principal activities of the Group is provided in the directors’ report. The Group’s structure consists of a main operational entity and information on other related party relationships is provided in Note 19.
NOTE 2 . SUMM ARY OF S IGN IF ICANT ACCOUNTING POL IC IES
(a) BASIS OF PREPARATION
The financial report is a general purpose financial report, which has been prepared in accordance with the requirements of the Corporations Act 2001, Australian Accounting Standards and other authoritative pronouncements of the Australian Accounting Standards Board. The financial report has also been prepared on a historical cost basis, except for derivative financial instruments which have been measured at fair value.
The carrying values of recognised assets and liabilities that are designated as hedged items in fair value hedges that would otherwise be carried at amortised cost are adjusted to record changes in the fair values attributable to the risks that are being hedged in effective hedge relationships.
The financial report is presented in Australian dollars and all values are rounded to the nearest thousand dollars ($000) unless otherwise stated.
The consolidated financial statements provide comparative information in respect of the previous period.
The financial report has been prepared on the basis of accounting practices applicable to a going concern. This basis presumes that funds will be available to finance future operations and the realisation of assets and settlement of liabilities will occur in the ordinary course of business.
(b) COMPLIANCE WITH INTERNATIONAL FINANCIAL REPORTING STANDARDS (IFRS)
The financial report also complies with International Financial Reporting Standards (IFRS) as issued by the International Accounting Standards Board.
(c) CHANGES IN ACCOUNTING POLICY, ACCOUNTING STANDARDS AND INTERPRETATIONS
The accounting policies adopted in the preparation of the consolidated financial statements are consistent with those followed in the preparation of the Group’s annual financial statements for the 53 weeks ended 3 July 2016, except as follows:
(i) New and amended standards and interpretations
The Group has adopted all the new and amended Australian Accounting Standards and AASB Interpretations that apply for the first time from 29 June 2015, as noted below:
(a) AASB 2013-9 — Amendments to Australian Accounting Standards — Conceptual Framework, Materiality and Financial Instruments
The Standard contains three main parts and makes amendments to a number of Standards and Interpretations.
Part A of AASB 2013-9 makes consequential amendments arising from the issuance of AASB CF 2013-1.
Part B makes amendments to particular Australian Accounting Standards to delete references to AASB 1031 and also makes minor editorial amendments to various other standards.
Part C makes amendments to a number of Australian Accounting Standards, including incorporating Chapter 6 Hedge Accounting into AASB 9 Financial Instruments.
The adoption of these amendments had no material impact on the financial position or performance of the Group.
A DA IR S L IM I T ED4 2
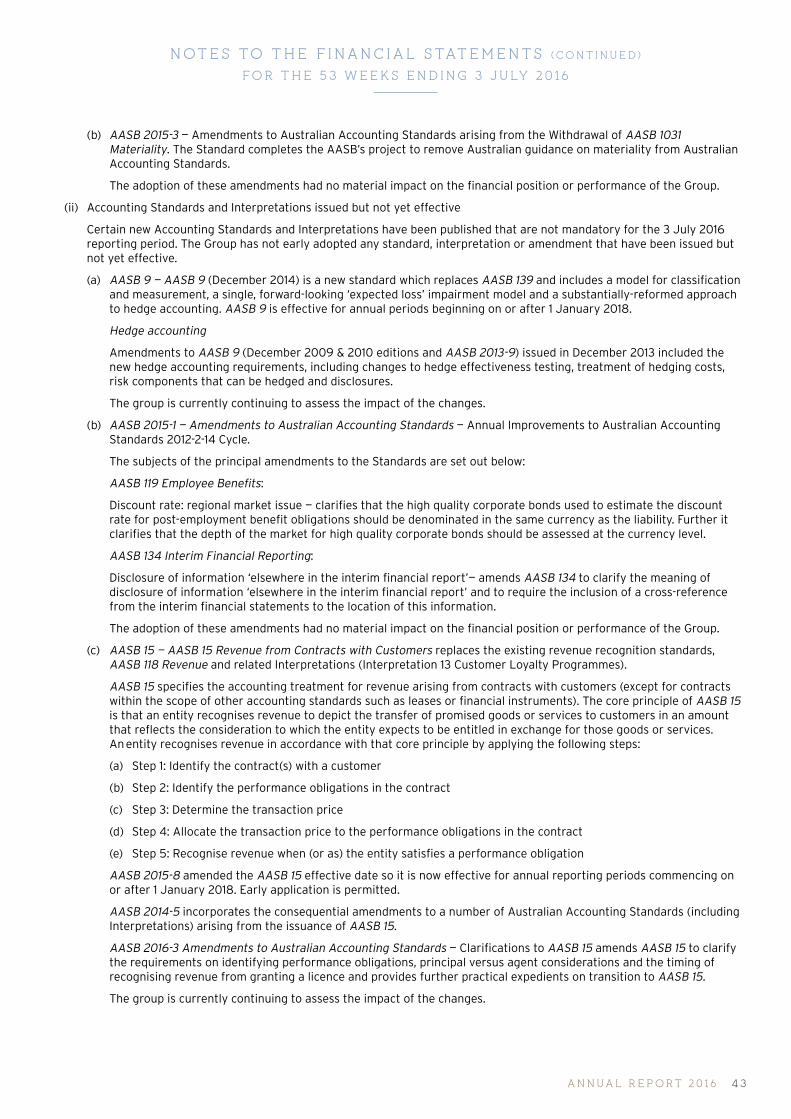
NOTES TO THE F INANCIAL STATEMENTS (CO N T I N UED)
FOR T HE 5 3 W EEK S ENDING 3 J ULY 2 016
(b) AASB 2015-3 — Amendments to Australian Accounting Standards arising from the Withdrawal of AASB 1031 Materiality. The Standard completes the AASB’s project to remove Australian guidance on materiality from Australian Accounting Standards.
The adoption of these amendments had no material impact on the financial position or performance of the Group.
(ii) Accounting Standards and Interpretations issued but not yet effective
Certain new Accounting Standards and Interpretations have been published that are not mandatory for the 3 July 2016 reporting period. The Group has not early adopted any standard, interpretation or amendment that have been issued but not yet effective.
(a) AASB 9 — AASB 9 (December 2014) is a new standard which replaces AASB 139 and includes a model for classification and measurement, a single, forward-looking ‘expected loss’ impairment model and a substantially-reformed approach to hedge accounting. AASB 9 is effective for annual periods beginning on or after 1 January 2018.
Hedge accounting
Amendments to AASB 9 (December 2009 & 2010 editions and AASB 2013-9) issued in December 2013 included the new hedge accounting requirements, including changes to hedge effectiveness testing, treatment of hedging costs, risk components that can be hedged and disclosures.
The group is currently continuing to assess the impact of the changes.
(b) AASB 2015-1 — Amendments to Australian Accounting Standards — Annual Improvements to Australian Accounting Standards 2012-2-14 Cycle.
The subjects of the principal amendments to the Standards are set out below:
AASB 119 Employee Benefits:
Discount rate: regional market issue — clarifies that the high quality corporate bonds used to estimate the discount rate for post-employment benefit obligations should be denominated in the same currency as the liability. Further it clarifies that the depth of the market for high quality corporate bonds should be assessed at the currency level.
AASB 134 Interim Financial Reporting:
Disclosure of information ‘elsewhere in the interim financial report’— amends AASB 134 to clarify the meaning of disclosure of information ‘elsewhere in the interim financial report’ and to require the inclusion of a cross-reference from the interim financial statements to the location of this information.
The adoption of these amendments had no material impact on the financial position or performance of the Group.
(c) AASB 15 — AASB 15 Revenue from Contracts with Customers replaces the existing revenue recognition standards, AASB 118 Revenue and related Interpretations (Interpretation 13 Customer Loyalty Programmes).
AASB 15 specifies the accounting treatment for revenue arising from contracts with customers (except for contracts within the scope of other accounting standards such as leases or financial instruments). The core principle of AASB 15 is that an entity recognises revenue to depict the transfer of promised goods or services to customers in an amount that reflects the consideration to which the entity expects to be entitled in exchange for those goods or services. An entity recognises revenue in accordance with that core principle by applying the following steps:
(a) Step 1: Identify the contract(s) with a customer
(b) Step 2: Identify the performance obligations in the contract
(c) Step 3: Determine the transaction price
(d) Step 4: Allocate the transaction price to the performance obligations in the contract
(e) Step 5: Recognise revenue when (or as) the entity satisfies a performance obligation
AASB 2015-8 amended the AASB 15 effective date so it is now effective for annual reporting periods commencing on or after 1 January 2018. Early application is permitted.
AASB 2014-5 incorporates the consequential amendments to a number of Australian Accounting Standards (including Interpretations) arising from the issuance of AASB 15.
AASB 2016-3 Amendments to Australian Accounting Standards — Clarifications to AASB 15 amends AASB 15 to clarify the requirements on identifying performance obligations, principal versus agent considerations and the timing of recognising revenue from granting a licence and provides further practical expedients on transition to AASB 15.
The group is currently continuing to assess the impact of the changes.
A NN UA L REP ORT 2 0 16 4 3
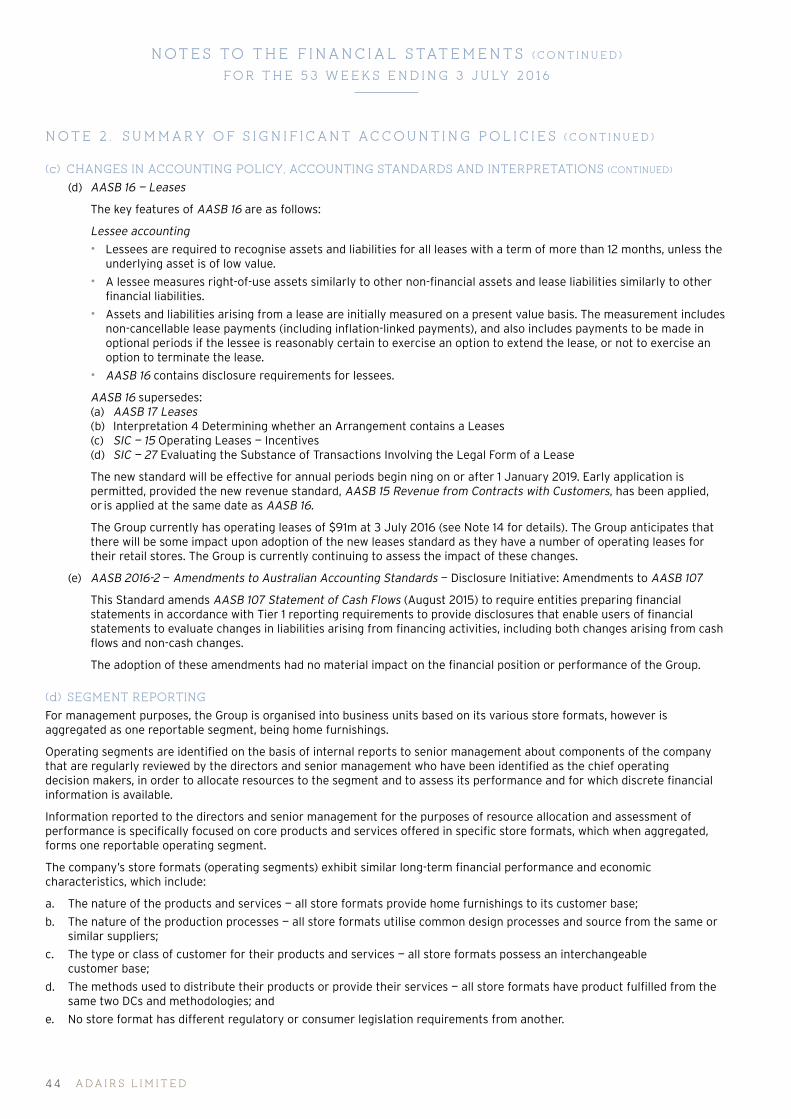
NOTES TO THE F INANCIAL STATEMENTS (CO N T I N UED)
FOR T HE 5 3 W EEK S ENDING 3 J ULY 2 016
NOTE 2 . SUMM ARY OF S IGN IF ICANT ACCOUNTING POL IC IES (CONTINUED)
(c) CHANGES IN ACCOUNTING POLICY, ACCOUNTING STANDARDS AND INTERPRETATIONS (CONTINUED)
(d) AASB 16 — Leases
The key features of AASB 16 are as follows:
Lessee accounting
• Lessees are required to recognise assets and liabilities for all leases with a term of more than 12 months, unless the underlying asset is of low value.
• A lessee measures right-of-use assets similarly to other non-financial assets and lease liabilities similarly to other financial liabilities.
• Assets and liabilities arising from a lease are initially measured on a present value basis. The measurement includes non-cancellable lease payments (including inflation-linked payments), and also includes payments to be made in optional periods if the lessee is reasonably certain to exercise an option to extend the lease, or not to exercise an option to terminate the lease.
• AASB 16 contains disclosure requirements for lessees.
AASB 16 supersedes: (a) AASB 17 Leases (b) Interpretation 4 Determining whether an Arrangement contains a Leases (c) SIC — 15 Operating Leases — Incentives (d) SIC — 27 Evaluating the Substance of Transactions Involving the Legal Form of a Lease
The new standard will be effective for annual periods begin ning on or after 1 January 2019. Early application is permitted, provided the new revenue standard, AASB 15 Revenue from Contracts with Customers, has been applied, or is applied at the same date as AASB 16.
The Group currently has operating leases of $91m at 3 July 2016 (see Note 14 for details). The Group anticipates that there will be some impact upon adoption of the new leases standard as they have a number of operating leases for their retail stores. The Group is currently continuing to assess the impact of these changes.
(e) AASB 2016-2 — Amendments to Australian Accounting Standards — Disclosure Initiative: Amendments to AASB 107
This Standard amends AASB 107 Statement of Cash Flows (August 2015) to require entities preparing financial statements in accordance with Tier 1 reporting requirements to provide disclosures that enable users of financial statements to evaluate changes in liabilities arising from financing activities, including both changes arising from cash flows and non-cash changes.
The adoption of these amendments had no material impact on the financial position or performance of the Group.
(d) SEGMENT REPORTING
For management purposes, the Group is organised into business units based on its various store formats, however is aggregated as one reportable segment, being home furnishings.
Operating segments are identified on the basis of internal reports to senior management about components of the company that are regularly reviewed by the directors and senior management who have been identified as the chief operating decision makers, in order to allocate resources to the segment and to assess its performance and for which discrete financial information is available.
Information reported to the directors and senior management for the purposes of resource allocation and assessment of performance is specifically focused on core products and services offered in specific store formats, which when aggregated, forms one reportable operating segment.
The company’s store formats (operating segments) exhibit similar long-term financial performance and economic characteristics, which include:
a. The nature of the products and services — all store formats provide home furnishings to its customer base;
b. The nature of the production processes — all store formats utilise common design processes and source from the same or similar suppliers;
c. The type or class of customer for their products and services — all store formats possess an interchangeable customer base;
d. The methods used to distribute their products or provide their services — all store formats have product fulfilled from the same two DCs and methodologies; and
e. No store format has different regulatory or consumer legislation requirements from another.
A DA IR S L IM I T ED4 4

NOTES TO THE F INANCIAL STATEMENTS (CO N T I N UED)
FOR T HE 5 3 W EEK S ENDING 3 J ULY 2 016
Group financing (including finance costs and finance income) and income taxes are managed on a Group basis and are not allocated to store formats.
The company operates in one geographical segment for the 53 weeks ended 3 July 2016: Australia.
(e) CURRENT VERSUS NON-CURRENT CLASSIFICATION
The Group presents assets and liabilities in the statement of financial position based on current/non-current classification. An asset is current when it is:
• Expected to be realised or intended to be sold or consumed in the Group’s normal operating cycle
• Held primarily for the purpose of trading
• Expected to be realised within twelve months after the reporting period; or
• Cash or a cash equivalent unless restricted from being exchanged or used to settle a liability for at least twelve months after the reporting period
The Group classifies all other assets as non-current.
A liability is current when:
• It is expected to be settled in the Group’s normal operating cycle
• It is held primarily for the purpose of trading
• It is due to be settled within twelve months after the reporting period; or
• There is no unconditional right to defer the settlement of the liability for at least twelve months after the reporting period.
The Group classifies all other liabilities as non-current.
Deferred tax assets and liabilities are classified as non-current assets and liabilities.
(f) TRADE AND OTHER RECEIVABLES
Lay-by customers make up the majority of trade receivables, which generally have 60 day terms, and are recognised and carried at original invoice amount less an allowance for any uncollectible amounts.
Collectability of trade receivables is reviewed on an ongoing basis. An allowance for lay-by cancellations is made when there is objective evidence that the Group will not be able to collect the debts, based on historical trends and ageing of debts. Bad debts are written off when identified.
(g) BASIS OF CONSOLIDATION
The consolidated financial statements comprise the financial statements of the Group and its subsidiaries as at 3 July 2016. Control is achieved when the Group is exposed, or has rights, to variable returns from its involvement with the investee and has the ability to affect those returns through its power over the investee. Specifically, the Group controls an investee if and only if the Group has:
• Power over the investee (i.e. existing rights that give it the current ability to direct the relevant activities of the investee)
• Exposure, or rights, to variable returns from its involvement with the investee; and
• The ability to use its power over the investee to affect its returns
The financial statements of subsidiaries are prepared for the same reporting period as the parent company, using consistent accounting policies. Adjustments are made to bring into line any dissimilar accounting policies that may exist.
All intercompany balances and transactions, including unrealised profits arising from intra-group transactions have been eliminated in full. Unrealised losses are eliminated unless costs cannot be recovered.
Subsidiaries are fully consolidated from the date on which control is transferred to the Group and cease to be consolidated from the date on which control is transferred out of the Group.
Investments in subsidiaries held by the Group are accounted for at cost in the separate financial statements of the parent entity.
The acquisition of subsidiaries is accounted for using the acquisition method of accounting. The acquisition method of accounting involves allocating the cost of the business combination to the fair value of the assets acquired and the liabilities and contingent liabilities assumed at the date of acquisition (see Note (h) below).
A NN UA L REP ORT 2 0 16 4 5

NOTES TO THE F INANCIAL STATEMENTS (CO N T I N UED)
FOR T HE 5 3 W EEK S ENDING 3 J ULY 2 016
NOTE 2 . SUMM ARY OF S IGN IF ICANT ACCOUNTING POL IC IES (CONTINUED)
(h) GOODWILL
Goodwill on acquisition is initially measured at cost, being the excess of the consideration for the business combination over the Group’s interest in the net fair value of the acquiree’s identifiable assets, liabilities and contingent liabilities.
Following initial recognition, goodwill is measured at cost less any accumulated impairment losses.
Goodwill is reviewed for impairment annually or more frequently if events or changes in circumstances dictate that the carrying value may be impaired.
For the purpose of impairment testing, goodwill acquired in a business combination is, from the acquisition date, allocated to each of the Group’s cash-generating units, or groups of cash-generating units, that are expected to benefit from the synergies of the combination, irrespective of whether other assets or liabilities of the Group are assigned to those units or groups of units. Each unit or group of units to which the goodwill is so allocated:
• represents the lowest level within the Group at which the goodwill is monitored for internal management
• is not larger than a segment based on the Group’s primary reporting format determined in accordance with AASB 8 Operating Segments.
Impairment is determined by assessing the recoverable amount of the cash-generating unit to which the goodwill relates. When the recoverable amount of the cash-generating unit is less than the carrying amount, an impairment loss is recognised.
When goodwill forms part of a cash-generating unit and part of the operation within that unit is disposed of, the goodwill associated with the operation disposed of is included in the carrying amount of the operation when determining the gain or loss on disposal of the operation.
Goodwill disposed of in this circumstance is measured on the basis of the relative values of the operation disposed of and the portion of the cash-generating unit retained.
Impairment losses recognised for goodwill are not subsequently reversed.
(i) INCOME TAX
Current tax assets and liabilities for the current period are measured at the amount expected to be recovered from or paid to the taxation authorities based on the current period’s taxable income. The tax rates and tax laws used to compute the amount are those that are enacted or substantively enacted by the reporting date.
Deferred income tax is provided on all temporary differences at the reporting date between the tax bases of assets and liabilities and their carrying amounts for financial reporting purposes.
Deferred income tax liabilities are recognised for all taxable temporary differences except:
• when the deferred income tax liability arises from the initial recognition of goodwill or of an asset or liability in a transaction that is not a business combination and, at the time of the transaction, affects neither the accounting profit nor taxable profit or loss; and
• when taxable temporary differences are associated with investments in subsidiaries, associates or interests in joint ventures, and the timing of the reversal of the temporary differences can be controlled and it is probable that the temporary difference will not reverse in the foreseeable future.
Deferred income tax assets are recognised for all deductible temporary differences, carry-forward of unused tax assets and unused tax losses, to the extent that it is probable that taxable profit will be available against which the deductible temporary differences and the carry-forward of unused tax credits and unused tax losses can be utilised, except:
• when the deferred income tax asset relating to the deductible temporary difference arises from the initial recognition of an asset or liability in a transaction that is not a business combination and, at the time of the transaction, affects neither the accounting profit nor taxable profit or loss; or
• when the deductible temporary difference associated with investments in subsidiaries, associates and interests in joint ventures, in which case deferred tax asset is only recognised to the extent that it is probable that the temporary difference will reverse in the foreseeable future and taxable profit will be available against which the temporary differences can be utilised.
The carrying amount of deferred income tax assets is reviewed at each reporting date and reduced to the extent that it is no longer probable that sufficient taxable profit will be available to allow all or part of the deferred income tax asset to be utilised. Unrecognised deferred income tax assets are reassessed at each reporting date and are recognised to the extent that it has become probable that future taxable profit will allow the deferred tax asset to be recovered.
A DA IR S L IM I T ED4 6
NOTES TO THE F INANCIAL STATEMENTS (CO N T I N UED)
FOR T HE 5 3 W EEK S ENDING 3 J ULY 2 016
Deferred income tax assets and liabilities are measured at the tax rates that are expected to apply to the year when the asset is realised or the liability is settled, based on tax rates (and tax laws) that have been enacted or substantively enacted at the reporting date.
Income taxes relating to items recognised directly in equity are recognised in equity and not in the Statement of Comprehensive Income.
Deferred tax assets and deferred tax liabilities are offset only if a legally enforceable right exists to offset current tax assets against current tax liabilities and the deferred tax assets and liabilities relate to the same taxable entity and the same taxation authority.
Tax consolidation legislation
Adairs Limited and its wholly-owned Australian controlled entities implemented the tax consolidation legislation as of 1 November 2010.
The head entity, Adairs Limited and the controlled entities in the tax consolidated group continue to account for their own current and deferred tax amounts. The Group has applied the Group allocation approach in determining the appropriate amount of current taxes and deferred taxes to allocate to members of the tax consolidated group.
In addition to its own current and deferred tax amounts, Adairs also recognises the current tax liabilities (or assets) and the deferred tax assets arising from unused tax losses and unused tax credits assumed from controlled entities in the tax consolidated group.
Assets or liabilities arising under tax funding agreements with the tax consolidated entities are recognised as amounts receivable from or payable to other entities in the Group.
Any difference between the amounts assumed and amounts receivable or payable under the tax funding agreement are recognised as a contribution to (or distribution from) wholly-owned tax consolidated entities.
(j) OTHER TAXES
Revenues, expenses and assets are recognised net of the amount of GST except:
• when the GST incurred on a purchase of goods and services is not recoverable from the taxation authority, in which case the GST is recognised as part of the cost of acquisition of the asset or as part of the expense item
• receivables and payables, which are stated with the amount of GST included.
The net amount of GST recoverable from, or payable to, the taxation authority is included as part of receivables or payables in the Statement of Financial Position.
Cash flows are included in the Statement of Cash Flows on a gross basis and the GST component of cash flows arising from investing and financing activities, which is recoverable from, or payable to, the taxation authority, are classified as operating cash flows.
Commitments and contingencies are disclosed net of the amount of GST recoverable from, or payable to, the taxation authority.
(k) DISCONTINUED OPERATIONS
The Group classifies non-current assets and disposal groups held for distribution to equity holders of the parent if their carrying amount will be recovered principally through distribution rather than through continuing use. Such non-current assets and disposal groups classified as held for distribution are measured at the lower of their carrying amount and fair value less cost to distribute. Cost to distribute is the incremental costs directly attributable to the distribution.
The criteria for held for distribution classification is regarded as met only when the distribution is highly probable and the asset or disposal group is available for immediate distribution in its present condition. Actions required to complete the distribution should indicate that it is unlikely that significant changes to the distribution will be made or that the decision to distribute will be withdrawn. Management must commit to the distribution expected within one year from the date of the classification.
Property, plant and equipment and intangible assets are not depreciated or amortised once classified as held for distribution.
Assets and liabilities classified as held for distribution are presented separately as current items in the statement of financial position.
• Represents a separate major line of business or geographical area of operations
• Is part of a single co-ordinated line to dispose of as separate major line of business or geographical area of operations; or
• Is a subsidiary acquired exclusively with a view to resale
A NN UA L REP ORT 2 0 16 47

NOTES TO THE F INANCIAL STATEMENTS (CO N T I N UED)
FOR T HE 5 3 W EEK S ENDING 3 J ULY 2 016
NOTE 2 . SUMM ARY OF S IGN IF ICANT ACCOUNTING POL IC IES (CONTINUED)
(k) DISCONTINUED OPERATIONS (CONTINUED)
Discontinued operations are excluded from the results of continuing operations and are presented as a single amount as profit of loss after tax from discontinued operations in the statement of profit or loss.
Additional disclosures are provided in Note 20. All other notes to the financial statements include amounts for continuing operations, unless otherwise mentioned.
(l) FOREIGN CURRENCY TRANSACTIONS AND BALANCES
(i) Functional and presentation currency
Both the functional and presentation currency of Adairs Limited and its Australian subsidiaries is Australian dollars (A$). Each entity in the Group determines its own functional currency and items included in the financial statements of each entity are measured using that functional currency.
(ii) Transactions and balances
Transactions in foreign currencies are initially recorded in the functional currency by applying a standard exchange rate determined by management. Monetary assets and liabilities denominated in foreign currencies are retranslated at the rate of exchange ruling at the reporting date, and any gains or losses on retranslation are taken to the Statement of Comprehensive Income.
Non-monetary items that are measured in terms of historical cost in a foreign currency are translated using the exchange rate as at the date of the initial transaction.
Non-monetary items measured at fair value in a foreign currency are translated using the exchange rates at the date when the fair value was determined.
(m) LEASES
The determination of whether an arrangement is or contains a lease is based on the substance of the arrangement and requires an assessment of whether the fulfilment of the arrangement is dependent on the use of a specific asset or assets and the arrangement conveys a right to use the asset.
Finance leases, which transfer to the Group substantially all the risks and benefits incidental to ownership of the leased item, are capitalised at the inception of the lease at the fair value of the leased asset or, if lower, at the present value of the minimum lease payments.
Lease payments are apportioned between the finance charges and reduction of the lease liability so as to achieve a constant rate of interest on the remaining balance of the liability. Finance charges are recognised as an expense in the profit and loss.
Capitalised leased assets are depreciated over the shorter of the estimated useful life of the asset and the lease term if there is no reasonable certainty that the Group will obtain ownership by the end of the lease term.
Operating lease payments are recognised as an expense in the profit and loss on a straight-line basis over the lease term. Operating lease incentives are recognised as a liability when received and subsequently reduced by allocating lease payments between rental expense and reduction of the liability.
Lease incentives are capitalised in the financial statements when received and credited to revenue over the term of the store lease to which they relate.
Operating lease expenses are recognised on a straight-line basis over the lease term, which includes the impact of annual fixed rate percentage increases.
(n) INVENTORIES
Inventories are valued at the lower of cost and net realisable value.
• Finished goods — purchase cost plus a proportion of the freight, handling and warehouse costs incurred to deliver the goods to the point of sale.
Net realisable value is the estimated selling price in the ordinary course of business, less the estimated direct costs necessary to make the sale.
At the 53 week period end of 3 July 2016, inventory held by the Group was in finished goods condition. In prior periods, the discontinued operation, dusk Australia Pty Ltd, held raw materials and work in progress inventories.
A DA IR S L IM I T ED4 8
NOTES TO THE F INANCIAL STATEMENTS (CO N T I N UED)
FOR T HE 5 3 W EEK S ENDING 3 J ULY 2 016
(o) CASH DIVIDEND AND NON-CASH DISTRIBUTION TO EQUITY HOLDERS OF THE PARENT
The Company recognises a liability to pay cash or make non-cash distributions to equity holders of the parent when the distribution is authorised and the distribution is no longer at the discretion of the Company. A corresponding amount is recognised directly in equity.
Non-cash distributions are measured at the fair value of the assets to be distributed with fair value remeasurement recognised directly in equity.
Upon distribution of non-cash assets, any difference between the carrying amount of the liability and the carrying amount of the assets distributed is recognised in the statement of profit or loss.
(p) PROPERTY, PLANT AND EQUIPMENT
Plant and equipment is stated at historical cost less accumulated depreciation and any accumulated impairment losses.
Depreciation is calculated on a straight-line basis over the estimated useful life of the asset as follows:
Class Method
Computer Hardware Straight Line 2—3 years
Plant & Equipment Straight Line 5 years
Leasehold Improvements Straight Line 5 years
Shop Fixtures & Fittings Straight Line Over initial lease term
The assets’ residual values, useful lives and depreciation methods are reviewed, and adjusted if appropriate, at each reporting date.
(i) Derecognition and disposal
An item of property, plant and equipment is derecognised upon disposal or when no future economic benefits are expected to arise from its use or disposal.
Any gain or loss arising on derecognition of the asset (calculated as the difference between the net disposal proceeds and the carrying amount of the asset) is included in the statement of comprehensive income in the year the asset is derecognised.
(q) INTANGIBLE ASSETS
Intangible assets acquired separately are measured on initial recognition at cost. The cost of intangible assets acquired in a business combination is their fair value at the date of acquisition. Following initial recognition, intangible assets are carried at cost less any accumulated amortisation and accumulated impairment losses. Internally generated intangibles, excluding capitalised development costs, are not capitalised and the related expenditure is reflected in profit or loss in the period in which the expenditure is incurred.
The useful lives of intangible assets are assessed as either finite or indefinite.
Intangible assets with finite lives are amortised over the useful economic life and assessed for impairment whenever there is an indication that the intangible asset may be impaired. The amortisation period and the amortisation method for an intangible asset with a finite useful life are reviewed at least at the end of each reporting period. Changes in the expected useful life or the expected pattern of consumption of future economic benefits embodied in the asset are considered to modify the amortisation period or method, as appropriate, and are treated as changes in accounting estimates. The amortisation expense on intangible assets with finite lives is recognised in the statement of profit or loss as the expense category that is consistent with the function of the intangible assets.
Intangible assets with indefinite useful lives are not amortised, but are tested for impairment annually, either individually or at the cash-generating unit level. The assessment of indefinite life is reviewed annually to determine whether the indefinite life continues to be supportable. If not, the change in useful life from indefinite to finite is made on a prospective basis.
Gains or losses arising from derecognition of an intangible asset are measured as the difference between the net disposal proceeds and the carrying amount of the asset and are recognised in the statement of profit or loss when the asset is derecognised.
(i) Computer Software
The Group record direct costs associated with the development of computer software for external direct costs of materials and services consumed. Computer software has been determined to have a finite life, and is amortised on a straight line basis over its useful life.
A NN UA L REP ORT 2 0 16 49
NOTES TO THE F INANCIAL STATEMENTS (CO N T I N UED)
FOR T HE 5 3 W EEK S ENDING 3 J ULY 2 016
NOTE 2 . SUMM ARY OF S IGN IF ICANT ACCOUNTING POL IC IES (CONTINUED)
(q) INTANGIBLE ASSETS (CONTINUED)
(ii) Brand Names
Brand Names have been determined to have an indefinite life, are not amortised, are acquired and are subject to impairment testing annually or where an indicator of impairment exists. The indefinite-useful life reflects management’s intention to continue to operate these brands to generate net cash inflows into the foreseeable future.
At each reporting date or where an indicator of impairment exists, the Group makes a formal estimate of the recoverable amount. Where the carrying amount of an asset exceeds its recoverable amount, the asset is considered impaired and is written down to its recoverable amounts.
Recoverable amount is the greater of fair value less costs of disposal and value in use. It is determined for an individual asset, unless the asset’s value in use cannot be estimated to be close to its fair value less costs of disposal and it does not generate cash inflows that are largely independent of those from other assets or groups of assets, in which case, the recoverable amount is determined for the cash-generating unit to which the asset belongs. In assessing value in use, the estimated future cash flows are discounted to their present value using a post-tax discount rate that reflects current market assessments of the time value of money and the risks specific to the asset.
(r) IMPAIRMENT
The Group assesses, at each reporting date, whether there is an indication that an asset may be impaired. If any indication exists, or when annual impairment testing for an asset is required, the Group estimates the asset’s recoverable amount. An asset’s recoverable amount is the higher of an asset’s or cash-generating unit’s (CGU’s) fair value less costs of disposal and its value in use. Recoverable amount is determined for an individual asset, unless the asset does not generate cash inflows that are largely independent of those from other assets or groups of assets. When the carrying amount of an asset or CGU exceeds its recoverable amount, the asset is considered impaired and is written down to its recoverable amount.
In assessing value in use, the estimated future cash flows are discounted to their present value using a pre-tax discount rate that reflects current market assessments of the time value of money and the risks specific to the asset. In determining fair value less costs of disposal, recent market transactions are taken into account. If no such transactions can be identified, an appropriate valuation model is used. These calculations are corroborated by valuation multiples, quoted share prices for publicly traded companies or other available fair value indicators.
The Group bases its impairment calculation on detailed budgets and forecast calculations, which are prepared separately for each of the Group’s CGUs to which the individual assets are allocated. These budgets and forecast calculations generally cover a period of five years. For longer periods, a long-term growth rate is calculated and applied to project future cash flows after the fifth year.
Impairment losses of continuing operations, including impairment on inventories, are recognised in the statement of profit or loss in expense categories consistent with the function of the impaired asset.
For assets excluding goodwill, an assessment is made at each reporting date to determine whether there is an indication that previously recognised impairment losses no longer exist or have decreased. If such indication exists, the Group estimates the asset’s or CGU’s recoverable amount. A previously recognised impairment loss is reversed only if there has been a change in the assumptions used to determine the asset’s recoverable amount since the last impairment loss was recognised. The reversal is limited so that the carrying amount of the asset does not exceed its recoverable amount, nor exceed the carrying amount that would have been determined, net of depreciation, had no impairment loss been recognised for the asset in prior years. Such reversal is recognised in the statement of profit or loss unless the asset is carried at a revalued amount, in which case, the reversal is treated as a revaluation increase.
Goodwill is tested for impairment annually as at balance sheet date and when circumstances indicate that the carrying value may be impaired.
Impairment is determined for goodwill by assessing the recoverable amount of each CGU (or group of CGUs) to which the goodwill relates. When the recoverable amount of the CGU is less than its carrying amount, an impairment loss is recognised in the statement of profit or loss. Impairment losses relating to goodwill cannot be reversed in future periods.
Intangible assets with indefinite useful lives are tested for impairment annually at the CGU level, as appropriate, and when circumstances indicate that the carrying value may be impaired.
(s) BORROWING COSTS
Borrowing costs are recognised as an expense when incurred.
A DA IR S L IM I T ED5 0
NOTES TO THE F INANCIAL STATEMENTS (CO N T I N UED)
FOR T HE 5 3 W EEK S ENDING 3 J ULY 2 016
(t) CASH AND CASH EQUIVALENTS
Cash and cash equivalents in the Statement of Financial Position comprise cash at bank and in hand and short-term deposits with an original maturity of three months or less that are readily convertible to known amounts of cash and which are subject to an insignificant risk of changes in value.
For the purposes of the Statement of Cash Flows, cash and cash equivalents consist of cash and cash equivalents as defined above, net of outstanding bank overdrafts. Bank overdrafts are included within interest-bearing loans and borrowings in current liabilities on the Statement of Financial Position.
(u) EMPLOYEE LEAVE BENEFITS
(i) Wages, salaries and annual leave
Liabilities for wages and salaries, including non-monetary benefits and annual leave expected to be settled within 12 months of the reporting date are recognised in respect of employees’ services up to the reporting date. They are measured at the amounts expected to be paid when the liabilities are settled. Liabilities for non-accumulating sick leave are recognised when the leave is taken and are measured at the rates paid or payable.
(ii) Long service leave
The liability for long service leave is recognised and measured in the provision for employee benefits and measured as the present value of expected future payments to be made in respect of services provided by employees up to the reporting date using the projected unit credit method. Consideration is given to expected future wage and salary levels, experience of employee departures, and periods of service. Expected future payments are discounted using market yields at the reporting date on high quality corporate bonds with terms to maturity and currencies that match, as closely as possible, the estimated future cash outflows.
(v) INTEREST BEARING LOANS AND BORROWINGS
All loans and borrowings are initially recognised at the fair value of the consideration received less directly attributable transaction costs.
After initial recognition, interest-bearing loans and borrowings are subsequently measured at amortised cost using the effective interest method. Fees paid on the establishment of loan facilities that are yield related are included as part of the carrying amount of the loans and borrowings.
Gains and losses are recognised in profit or loss when the liabilities are derecognised.
Borrowings are classified as current liabilities unless the Group has an unconditional right to defer settlement of the liability for at least 12 months after the reporting date.
(w) TRADE AND OTHER PAYABLES
Trade and other payables are carried at amortised cost and represent liabilities for goods and services provided to the Group prior to the end of the financial year that are unpaid and arise when the Group becomes obliged to make future payments in respect of the purchase of these goods and services. The amounts are unsecured and are usually paid within 30 days of recognition.
(x) PROVISIONS
Provisions are recognised when the Group has a present obligation (legal or constructive) as a result of a past event, it is probable that an outflow of resources embodying economic benefits will be required to settle the obligation and a reliable estimate can be made of the amount of the obligation.
Where the Group expects some or all of a provision to be reimbursed, for example under an insurance contract, the reimbursement is recognised as a separate asset but only when the reimbursement is virtually certain. The expense relating to any provision is presented in the Statement of Comprehensive Income net of any reimbursement.
Provisions are measured at the present value of management’s best estimate of the expenditure required to settle the present obligation at the reporting date.
If the effect of the time value of money is material, provisions are discounted using a pre-tax rate that reflects the risks specific to the liability.
Where discounting is used, the increase in the provision due to the passage of time is recognised as a borrowing cost.
A NN UA L REP ORT 2 0 16 51

NOTES TO THE F INANCIAL STATEMENTS (CO N T I N UED)
FOR T HE 5 3 W EEK S ENDING 3 J ULY 2 016
NOTE 2 . SUMM ARY OF S IGN IF ICANT ACCOUNTING POL IC IES (CONTINUED)
(y) REVENUE RECOGNITION
Revenue is recognised and measured at fair value of the consideration received or receivable to the extent that it is probable that the economic benefits will flow to the Group and the revenue can be reliably measured. The following specific recognition criteria must also be met before revenue is recognised:
Sale of goods
Revenue is recognised when the significant risks and rewards of ownership of the goods have passed to the buyer and the costs incurred or to be incurred in respect of the transaction can be measured reliably.
Interest income
Interest income is recognised as it accrues.
Dividends
Revenue is recognised when the Group’s right to receive the payment is established.
Linen Lovers loyalty program
Linen Lover’s membership fees are recognised upfront when the membership is paid. Refer to 2(dd) (ii) for further discussion.
(z) CONTRIBUTED EQUITY
Ordinary shares are classified as equity. Incremental costs directly attributable to the issue of new shares are shown in equity as a deduction net of tax from the proceeds.
(aa) DERIVATIVE FINANCIAL INSTRUMENTS
The Group uses derivative financial instruments such as forward currency contracts to hedge its risks associated with foreign currency fluctuations. Such derivative financial instruments are initially recognised at fair value on the date on which a derivative contract is entered into and are subsequently re-measured to fair value. Derivatives are carried as assets when their fair value is positive and as liabilities when their fair value is negative.
Any gain or losses arising from the changes in the fair value of derivatives, except for those that qualify as cash flow hedges, are taken directly to net profit or loss for the year. The fair value of forward currency contracts is calculated by reference to current forward exchange rates for contracts with similar maturity profiles.
For the purposes of hedge accounting, hedges are classified as:
• fair value hedges when they hedge the exposure to changes in the fair value of a recognised asset or liability;
• cash flow hedges when they hedge exposure to variability in cash flows that is attributable either to a particular risk associated with a recognised asset or liability or to a forecast transaction; or
• hedges of a net investment in a foreign operation.
A hedge of the foreign currency risk of a firm commitment is accounted for as a cash flow hedge.
At the inception of a hedge relationship, the Group formally designates and documents the hedge relationship to which the Group wishes to apply hedge accounting and the risk management objective and strategy for undertaking the hedge. The documentation includes identification of the hedging instrument, the hedged item or transaction, the nature of the risk being hedged and how the entity will assess the hedging instrument’s effectiveness in offsetting the exposure to changes in the hedged item’s fair value or cash flows attributable to the hedged risk. Such hedges are expected to be highly effective in achieving offsetting changes in fair value or cash flows and are assessed on an ongoing basis to determine that they actually have been highly effective throughout the financial reporting periods for which they were designated.
(i) Cash Flow Hedges
Cash flow hedges are hedges of the Group’s exposure to variability in cash flows that is attributable to a particular risk associated with a recognised asset or liability or a highly probable forecast transaction and that could affect profit or loss. The effective portion of the gain or loss on the hedging instrument is recognised directly in equity, while the ineffective portion is recognised in profit or loss.
Amounts taken to equity are transferred to the Statement of Comprehensive Income when the hedged transaction affects profit or loss, such as when hedged income or expenses are recognised or when a forecast sale or purchase occurs. When the hedged item is the cost of a non-financial asset or liability, the amounts taken to equity are transferred to the initial carrying amount of the non-financial asset or liability.
A DA IR S L IM I T ED52

NOTES TO THE F INANCIAL STATEMENTS (CO N T I N UED)
FOR T HE 5 3 W EEK S ENDING 3 J ULY 2 016
If the forecast transaction is no longer expected to occur, amounts previously recognised in equity are transferred to the statement of comprehensive income. If the hedging instrument expires or is sold, terminated or exercised without replacement or rollover, or if its designation as a hedge is revoked, amounts previously recognised in equity remain in equity until the forecast transaction occurs. If the related transaction is not expected to occur, the amount is taken to the Statement of Comprehensive Income.
(bb) INVESTMENTS AND OTHER FINANCIAL ASSETS
Financial assets in the scope of AASB 139 Financial Instruments: Recognition and Measurement are classified as either financial assets at fair value through profit or loss, loans and receivables, held-to-maturity investments, or available-for-sale financial assets. When financial assets are recognised initially, they are measured at fair value, plus, in the case of investments not at fair value through profit or loss, directly attributable transaction costs. The Group determines the classification of its financial assets after initial recognition and, when allowed and appropriate, re-evaluates this designation at each reporting date.
All regular way purchases and sales of financial assets are recognised on the trade date, i.e. the date that the Group commits to purchase the asset. Regular way purchases or sales are purchases or sales of financial assets under contracts that require delivery of the assets within the period established generally by regulation or convention in the Group.
(i) Financial assets at fair value through profit or loss
Financial assets classified as held for trading are included in the category ‘financial assets at fair value through profit or loss’. Financial assets are classified as held for trading if they are acquired for the purpose of selling in the near term with the intention of making a profit. Derivatives are also classified as held for trading unless they are designated as effective hedging instruments. Gains or losses on investments held for trading are recognised in profit or loss and the related other comprehensive income.
(ii) Loans and Receivables
Loans and receivables including loan notes and loans to key management personnel are non-derivative financial assets with fixed or determinable payments that are not quoted in an active market. Such assets are carried at amortised cost using effective interest method. Gains and losses are recognised in profit or loss when the loans and receivable are derecognised or impaired, as well as through the amortisation process.
(iii) Investments in subsidiaries
Investments in subsidiaries are carried at their cost of acquisition in the Parent’s financial statements.
(cc) FAIR VALUE MEASUREMENT
The Group measures financial instruments such as derivatives at fair value at each reporting date. Fair value related disclosures for financial instruments and non-financial assets that are measured at fair value or where fair values are disclosed are summarised in the following notes:
Fair value is the price that would be received to sell an asset or paid to transfer a liability in an orderly transaction between market participants at the measurement date. The fair value measurement is based on the presumption that the transaction to sell the asset or transfer the liability takes place either:
• In the principal market for the asset or liability; or
• In the absence of a principal market, in the most advantageous market for the asset or liability
The principal or the most advantageous market must be accessible by the Group.
The fair value of an asset or a liability is measured using the assumptions that market participants would use when pricing the asset or liability, assuming that market participants act in their economic best interest.
A fair value measurement of a non-financial asset takes into account a market participant’s ability to generate economic benefits by using the asset in its highest and best use or by selling it to another market participant that would use the asset in its highest and best use.
The Group uses valuation techniques that are appropriate in the circumstances and for which sufficient data are available to measure fair value, maximising the use of relevant observable inputs and minimising the use of unobservable inputs.
A NN UA L REP ORT 2 0 16 5 3
NOTES TO THE F INANCIAL STATEMENTS (CO N T I N UED)
FOR T HE 5 3 W EEK S ENDING 3 J ULY 2 016
NOTE 2 . SUMM ARY OF S IGN IF ICANT ACCOUNTING POL IC IES (CONTINUED)
(cc) FAIR VALUE MEASUREMENT (CONTINUED)
All assets and liabilities for which fair value is measured or disclosed in the financial statements are categorised within the fair value hierarchy, described as follows, based on the lowest level input that is significant to the fair value measurement as a whole:
• Level 1 — Quoted (unadjusted) market prices in active markets for identical assets or liabilities
• Level 2 — Valuation techniques for which the lowest level input that is significant to the fair value measurement directly or indirectly observable
• Level 3 — Valuation techniques for which the lowest level input that is significant to the fair value measurement is unobservable.
For assets and liabilities that are recognised in the financial statements at fair value on a recurring basis, the Group determines whether transfers have occurred between levels in the hierarchy by re-assessing categorisation (based on the lowest level input that is significant to the fair value measurement as a whole) at the end of each reporting period.
For the purpose of fair value disclosures, the Group has determined classes of assets and liabilities on the basis of the nature, characteristics and risks of the asset or liability and the level of the fair value hierarchy as explained above.
(dd) SIGNIFICANT ACCOUNTING JUDGMENTS, ESTIMATES AND ASSUMPTIONS
In applying the Group’s accounting policies management continually evaluates judgments, estimates and assumptions based on experience and other factors, including expectations of future events that may have an impact on the Group. All judgments, estimates and assumptions made are believed to be reasonable based on the most current set of circumstances available to management. Actual results may differ from the judgments, estimates and assumptions. Significant judgments, estimates and assumptions made by management in the preparation of these financial statements:
(i) Significant accounting judgments
Recovery of deferred tax assetsDeferred tax assets are recognised for deductible temporary differences as management considers that it is probable that future taxable profits will be available to utilise those temporary differences.
Impairment of non-financial assets other than goodwillThe Group assesses impairment of all assets at each reporting date by evaluating conditions specific to the Group and to the particular assets that may lead to impairment. These include product, manufacturing and retail performance, technology and economic environments and future product expectations. If an impairment trigger exists the recoverable amount of the assets is determined. This involves value in use calculations, which incorporate a number of key estimates and assumptions.
(ii) Significant accounting estimates and assumptions
Impairment of goodwill and intangibles with indefinite useful livesThe Group determines whether goodwill and intangibles with indefinite useful lives are impaired at least on an annual basis. This requires an estimation of the recoverable amount of the cash-generating units to which the goodwill and intangibles with indefinite useful lives are allocated. The assumptions used in this estimation of recoverable amount and the carrying amount of goodwill and intangibles with indefinite useful lives are discussed in Note 9.
Long service leave provisionAs discussed in Note 2(u), the liability for long service leave is recognised and measured at the present value of the estimated future cash flows to be made in respect of all employees at reporting date. In determining the present value of the liability, attrition rates and pay increases through promotion and inflation have been taken into account.
Make good provisionsProvision is made for the anticipated costs of future restoration of leased premises. The provision includes future cost estimates associated with dismantling and removal of shop fittings and cleaning. These future cost estimates are discounted to their present value. The calculation of this provision requires assumptions such as store closure dates, available technologies and removal cost estimates.
A DA IR S L IM I T ED5 4

NOTES TO THE F INANCIAL STATEMENTS (CO N T I N UED)
FOR T HE 5 3 W EEK S ENDING 3 J ULY 2 016
Estimation of useful lives of assetsThe estimation of the useful lives of assets has been based on historical experience as well as manufacturers’ warranties (for plant and equipment) and lease terms (for shop fittings). In addition, the condition of the assets is assessed at least once per year and considered against the remaining useful life. Adjustments to useful life are made when considered necessary. Depreciation charges are included in Note 8.
Loyalty program salesLoyalty program sales are recognised in full at the point of sale as the fee is non-refundable and as management considers that any customer benefits in the form of discounts and products benefits are accounted for as inventory markdowns at the time of sale. Additionally, specific loyalty marketing programs are variable in nature subject to general market and sales volume conditions at any given time. As Adairs’ new ERP and point of sale systems are jointly implemented in future periods, data may be collected to further refine this estimation.
Lay-by salesA lay-by sale is a contract for the sale of merchandise conditional that the goods are not to pass to the purchaser until the full purchase price is paid. The purchase price of the merchandise is to be paid at some specified future date. For lay-by arrangements entered into by individual retail stores on Adairs’ legacy ERP, revenue is recognised at the point where the lay-by contract is signed by the customer and a deposit paid. This recognition criteria is based on historical data maintained by the company in relation to the likelihood of defaults or non-collection. An allowance for cancellations expressed as a percentage of lay-by sales are calculated based on historical data and recorded at the time of recognising the related sale.
As individual retail stores have progressively implemented Adairs’ new ERP and POS systems across the latter half of FY2016, revenue on lay-by sales from the various implementation dates is recognised at the point that customers make their last instalment payment and collect the associated goods. As of 3 July 2016, approximately 30% of the Group’s store network had implemented the new ERP and point of sale systems. The remainder of the Group’s store network are expected to have implemented the new ERP and point of sale systems progressively by October 2017. The timing difference in the two methods of recognising lay-by sales is not material to the financial results of the Group for the 53 weeks ended 3 July 2016.
Lease incentivesProvisions for lease incentives are recognised as a liability when received and subsequently reduced by allocating lease payments between rental expense and reduction of the liability. The liability is unwound on a straight-line basis over the leased term.
A NN UA L REP ORT 2 0 16 5 5
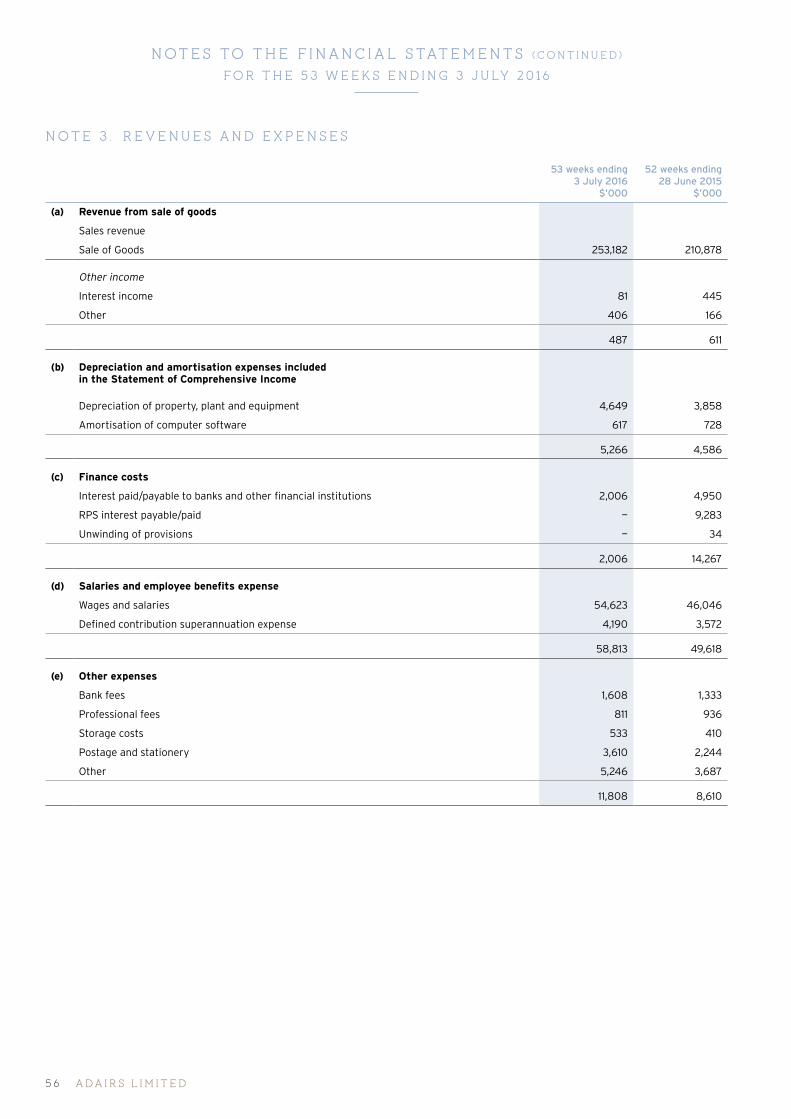
NOTES TO THE F INANCIAL STATEMENTS (CO N T I N UED)
FOR T HE 5 3 W EEK S ENDING 3 J ULY 2 016
NOTE 3 . REVENUES AND EXPENSES
53 weeks ending 3 July 2016
$’000
52 weeks ending 28 June 2015
$’000
(a) Revenue from sale of goods
Sales revenue
Sale of Goods 253,182 210,878
Other income
Interest income 81 445
Other 406 166
487 611
(b) Depreciation and amortisation expenses included in the Statement of Comprehensive Income
Depreciation of property, plant and equipment 4,649 3,858
Amortisation of computer software 617 728
5,266 4,586
(c) Finance costs
Interest paid/payable to banks and other financial institutions 2,006 4,950
RPS interest payable/paid — 9,283
Unwinding of provisions — 34
2,006 14,267
(d) Salaries and employee benefits expense
Wages and salaries 54,623 46,046
Defined contribution superannuation expense 4,190 3,572
58,813 49,618
(e) Other expenses
Bank fees 1,608 1,333
Professional fees 811 936
Storage costs 533 410
Postage and stationery 3,610 2,244
Other 5,246 3,687
11,808 8,610
A DA IR S L IM I T ED5 6
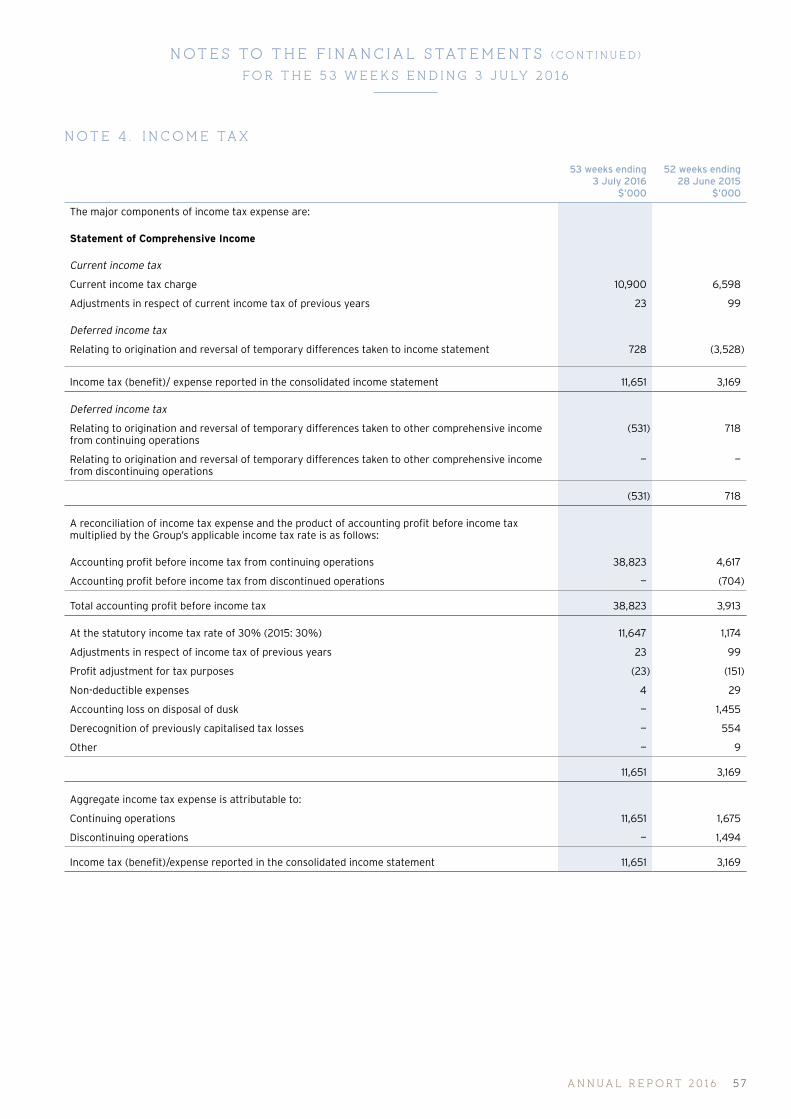
NOTES TO THE F INANCIAL STATEMENTS (CO N T I N UED)
FOR T HE 5 3 W EEK S ENDING 3 J ULY 2 016
NOTE 4 . INCOME TAX
53 weeks ending 3 July 2016
$’000
52 weeks ending 28 June 2015
$’000
The major components of income tax expense are:
Statement of Comprehensive Income
Current income tax
Current income tax charge 10,900 6,598
Adjustments in respect of current income tax of previous years 23 99
Deferred income tax
Relating to origination and reversal of temporary differences taken to income statement 728 (3,528)
Income tax (benefit)/ expense reported in the consolidated income statement 11,651 3,169
Deferred income tax
Relating to origination and reversal of temporary differences taken to other comprehensive income from continuing operations
(531) 718
Relating to origination and reversal of temporary differences taken to other comprehensive income from discontinuing operations
— —
(531) 718
A reconciliation of income tax expense and the product of accounting profit before income tax multiplied by the Group’s applicable income tax rate is as follows:
Accounting profit before income tax from continuing operations 38,823 4,617
Accounting profit before income tax from discontinued operations — (704)
Total accounting profit before income tax 38,823 3,913
At the statutory income tax rate of 30% (2015: 30%) 11,647 1,174
Adjustments in respect of income tax of previous years 23 99
Profit adjustment for tax purposes (23) (151)
Non-deductible expenses 4 29
Accounting loss on disposal of dusk — 1,455
Derecognition of previously capitalised tax losses — 554
Other — 9
11,651 3,169
Aggregate income tax expense is attributable to:
Continuing operations 11,651 1,675
Discontinuing operations — 1,494
Income tax (benefit)/expense reported in the consolidated income statement 11,651 3,169
A NN UA L REP ORT 2 0 16 57
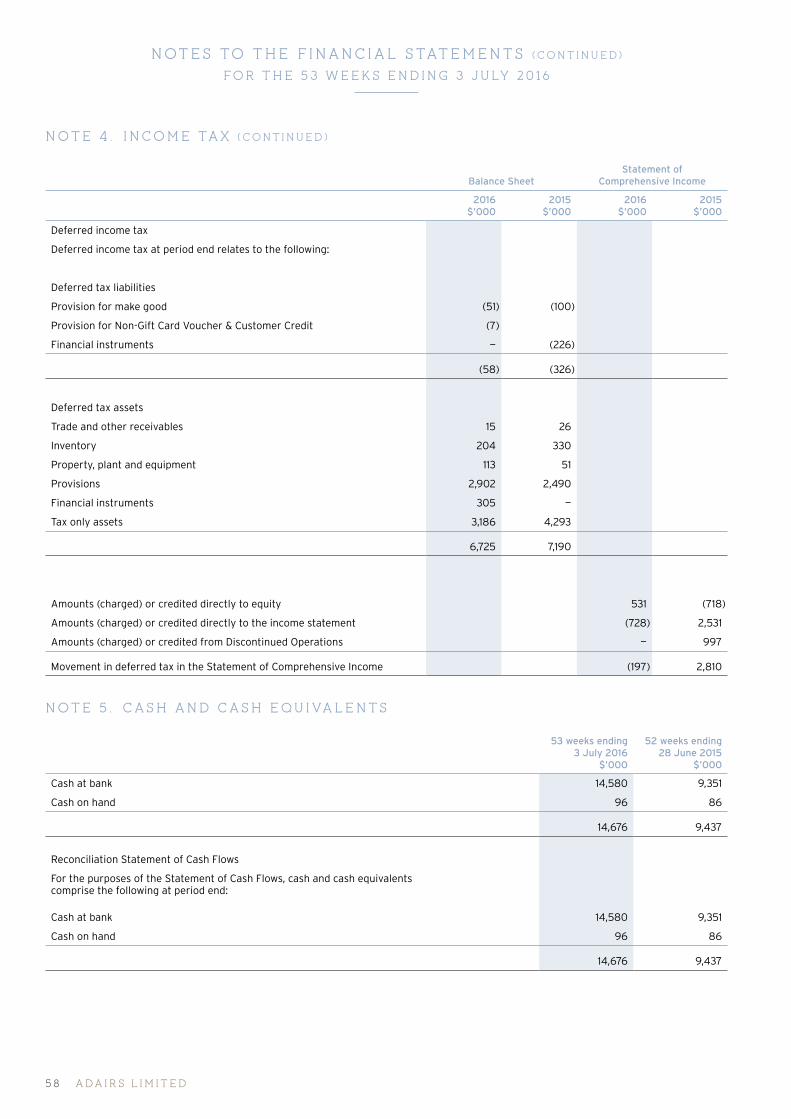
NOTES TO THE F INANCIAL STATEMENTS (CO N T I N UED)
FOR T HE 5 3 W EEK S ENDING 3 J ULY 2 016
NOTE 4 . INCOM E TAX (CONTINUED)
Balance SheetStatement of
Comprehensive Income
2016 $’000
2015 $’000
2016 $’000
2015 $’000
Deferred income tax
Deferred income tax at period end relates to the following:
Deferred tax liabilities
Provision for make good (51) (100)
Provision for Non-Gift Card Voucher & Customer Credit (7)
Financial instruments — (226)
(58) (326)
Deferred tax assets
Trade and other receivables 15 26
Inventory 204 330
Property, plant and equipment 113 51
Provisions 2,902 2,490
Financial instruments 305 —
Tax only assets 3,186 4,293
6,725 7,190
Amounts (charged) or credited directly to equity 531 (718)
Amounts (charged) or credited directly to the income statement (728) 2,531
Amounts (charged) or credited from Discontinued Operations — 997
Movement in deferred tax in the Statement of Comprehensive Income (197) 2,810
NOTE 5 . CASH AND CASH EQUIVALENTS
53 weeks ending 3 July 2016
$’000
52 weeks ending 28 June 2015
$’000
Cash at bank 14,580 9,351
Cash on hand 96 86
14,676 9,437
Reconciliation Statement of Cash Flows
For the purposes of the Statement of Cash Flows, cash and cash equivalents comprise the following at period end:
Cash at bank 14,580 9,351
Cash on hand 96 86
14,676 9,437
A DA IR S L IM I T ED5 8

NOTES TO THE F INANCIAL STATEMENTS (CO N T I N UED)
FOR T HE 5 3 W EEK S ENDING 3 J ULY 2 016
STATEMENT OF CASH FLOWS RECONCILIATION
53 weeks ending 3 July 2016
$’000
52 weeks ending 28 June 2015
$’000
(a) Reconciliation of net profit/(loss) after tax to net cash flows from operations
Net profit/(loss) after tax 27,172 745
Adjustments and non-cash items
Depreciation and amortisation from continued operations 5,266 4,586
Depreciation and amortisation from discontinued operations — 1,567
Interest income not received in cash (80) —
Capitalised borrowing costs written off — 1,306
Interest expense not paid in cash — Make good 32 —
Redeemable preference share interest expensed — 9,283
IPO transaction costs not yet paid in cash — 7,130
Unpaid IPO costs held in payables — (7,130)
Finance costs from discontinued operations — 354
Other adjustments — discontinued operations — 506
Changes in assets and liabilities
(Increase)/Decrease in trade and other receivables (1,810) (90)
(Increase)/Decrease in inventories (3,028) 3,273
Increase/(Decrease) in payables (8,247) 8,451
(Increase)/Decrease in deferred tax assets 728 (2,676)
(Increase)/Decrease in provisions 1,439 (1,983)
(Increase)/Decrease in tax receivables — 99
Increase/(Decrease) in tax provisions 2,264 6,531
Increase/(Decrease) in interest bearing liabilities 121 —
Cash flow from operations 23,857 31,952
A NN UA L REP ORT 2 0 16 59
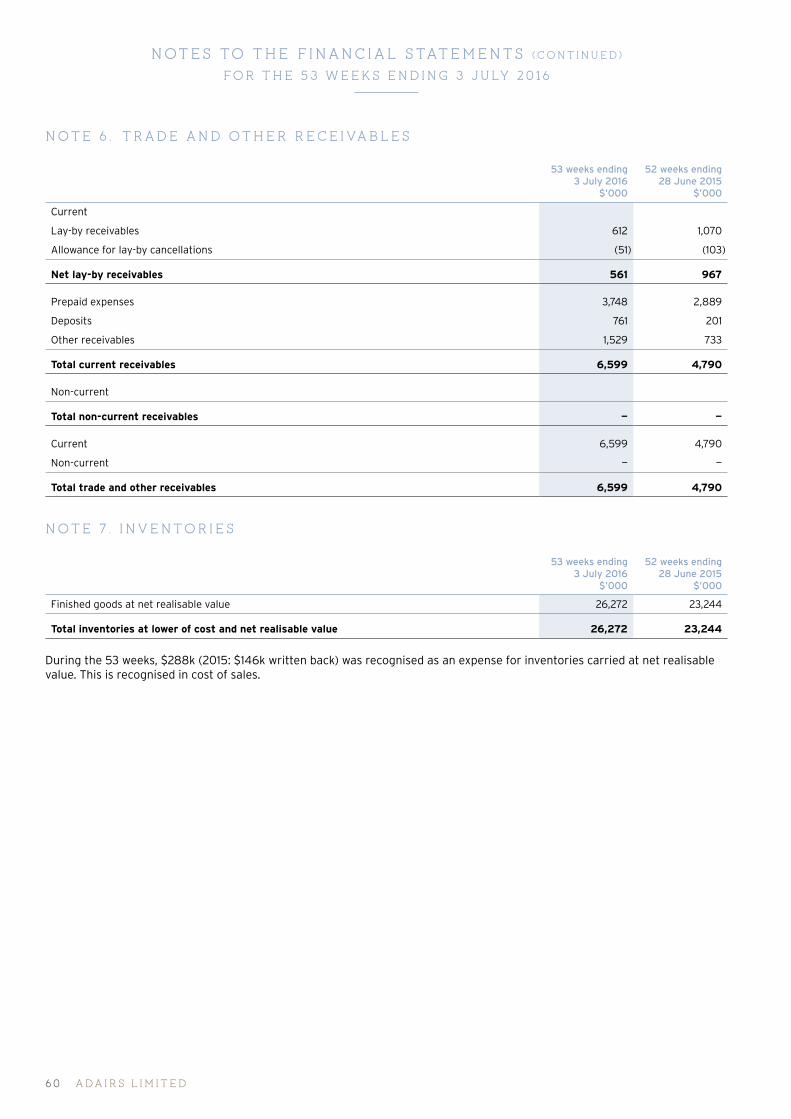
NOTES TO THE F INANCIAL STATEMENTS (CO N T I N UED)
FOR T HE 5 3 W EEK S ENDING 3 J ULY 2 016
NOTE 6 . TRADE AND OTHER RECE IVABLES
53 weeks ending 3 July 2016
$’000
52 weeks ending 28 June 2015
$’000
Current
Lay-by receivables 612 1,070
Allowance for lay-by cancellations (51) (103)
Net lay-by receivables 561 967
Prepaid expenses 3,748 2,889
Deposits 761 201
Other receivables 1,529 733
Total current receivables 6,599 4,790
Non-current
Total non-current receivables — —
Current 6,599 4,790
Non-current — —
Total trade and other receivables 6,599 4,790
NOTE 7 . INVENTORIES
53 weeks ending 3 July 2016
$’000
52 weeks ending 28 June 2015
$’000
Finished goods at net realisable value 26,272 23,244
Total inventories at lower of cost and net realisable value 26,272 23,244
During the 53 weeks, $288k (2015: $146k written back) was recognised as an expense for inventories carried at net realisable value. This is recognised in cost of sales.
A DA IR S L IM I T ED6 0
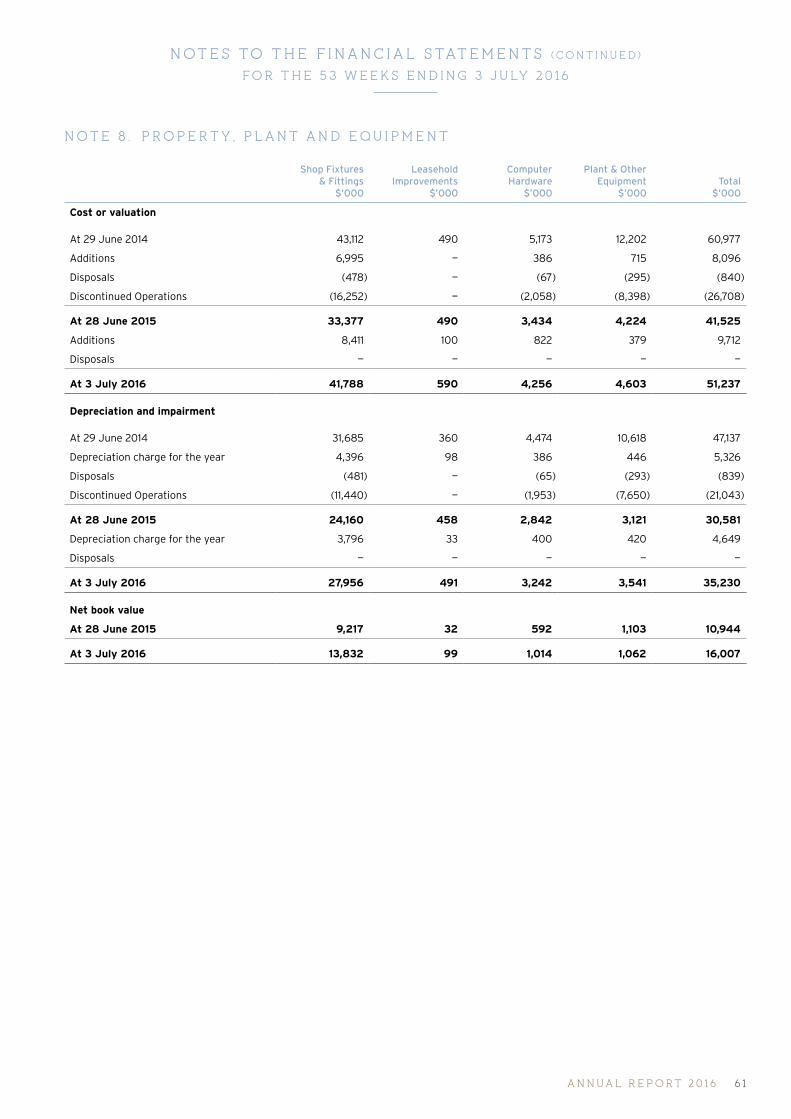
NOTES TO THE F INANCIAL STATEMENTS (CO N T I N UED)
FOR T HE 5 3 W EEK S ENDING 3 J ULY 2 016
NOTE 8 . PROPERTY , PLANT AND EQUIPMENT
Shop Fixtures & Fittings
$’000
Leasehold Improvements
$’000
Computer Hardware
$’000
Plant & Other Equipment
$’000Total
$’000
Cost or valuation
At 29 June 2014 43,112 490 5,173 12,202 60,977
Additions 6,995 — 386 715 8,096
Disposals (478) — (67) (295) (840)
Discontinued Operations (16,252) — (2,058) (8,398) (26,708)
At 28 June 2015 33,377 490 3,434 4,224 41,525
Additions 8,411 100 822 379 9,712
Disposals — — — — —
At 3 July 2016 41,788 590 4,256 4,603 51,237
Depreciation and impairment
At 29 June 2014 31,685 360 4,474 10,618 47,137
Depreciation charge for the year 4,396 98 386 446 5,326
Disposals (481) — (65) (293) (839)
Discontinued Operations (11,440) — (1,953) (7,650) (21,043)
At 28 June 2015 24,160 458 2,842 3,121 30,581
Depreciation charge for the year 3,796 33 400 420 4,649
Disposals — — — — —
At 3 July 2016 27,956 491 3,242 3,541 35,230
Net book value
At 28 June 2015 9,217 32 592 1,103 10,944
At 3 July 2016 13,832 99 1,014 1,062 16,007
A NN UA L REP ORT 2 0 16 61
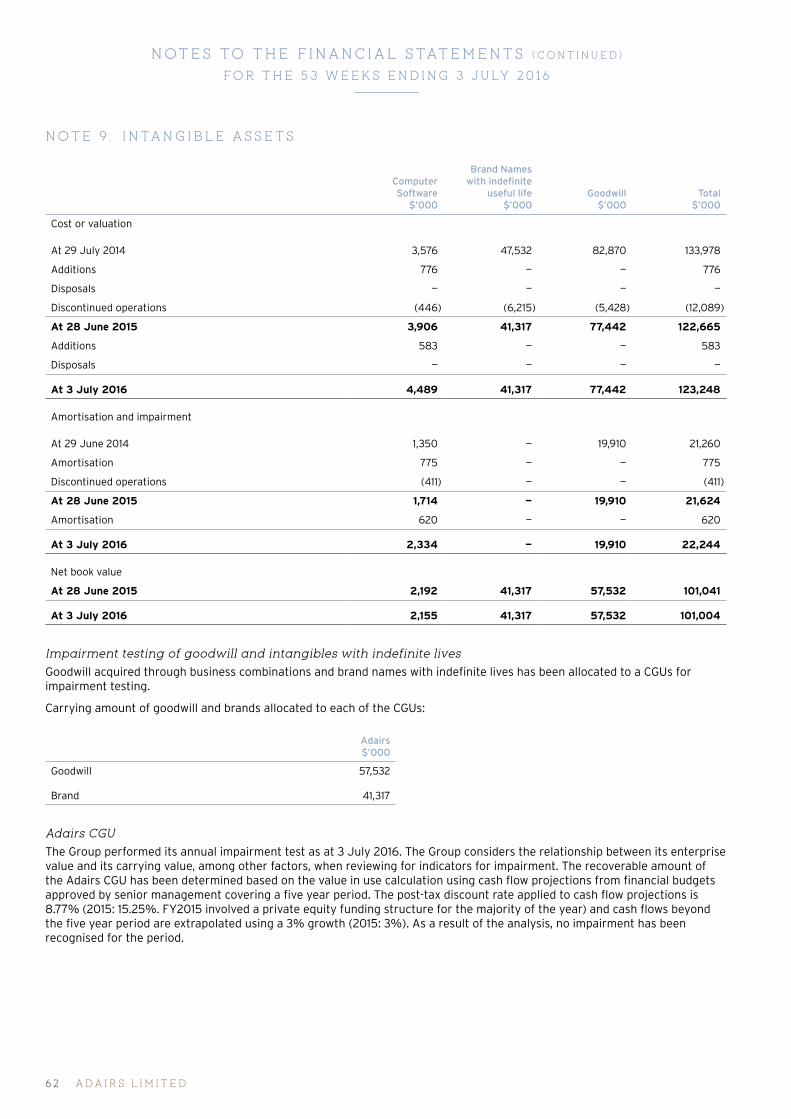
NOTES TO THE F INANCIAL STATEMENTS (CO N T I N UED)
FOR T HE 5 3 W EEK S ENDING 3 J ULY 2 016
NOTE 9 . INTANGIBLE ASSETS
Computer Software
$’000
Brand Names with indefinite
useful life$’000
Goodwill$’000
Total$’000
Cost or valuation
At 29 July 2014 3,576 47,532 82,870 133,978
Additions 776 — — 776
Disposals — — — —
Discontinued operations (446) (6,215) (5,428) (12,089)
At 28 June 2015 3,906 41,317 77,442 122,665
Additions 583 — — 583
Disposals — — — —
At 3 July 2016 4,489 41,317 77,442 123,248
Amortisation and impairment
At 29 June 2014 1,350 — 19,910 21,260
Amortisation 775 — — 775
Discontinued operations (411) — — (411)
At 28 June 2015 1,714 — 19,910 21,624
Amortisation 620 — — 620
At 3 July 2016 2,334 — 19,910 22,244
Net book value
At 28 June 2015 2,192 41,317 57,532 101,041
At 3 July 2016 2,155 41,317 57,532 101,004
Impairment testing of goodwill and intangibles with indefinite lives
Goodwill acquired through business combinations and brand names with indefinite lives has been allocated to a CGUs for impairment testing.
Carrying amount of goodwill and brands allocated to each of the CGUs:
Adairs $’000
Goodwill 57,532
Brand 41,317
Adairs CGU
The Group performed its annual impairment test as at 3 July 2016. The Group considers the relationship between its enterprise value and its carrying value, among other factors, when reviewing for indicators for impairment. The recoverable amount of the Adairs CGU has been determined based on the value in use calculation using cash flow projections from financial budgets approved by senior management covering a five year period. The post-tax discount rate applied to cash flow projections is 8.77% (2015: 15.25%. FY2015 involved a private equity funding structure for the majority of the year) and cash flows beyond the five year period are extrapolated using a 3% growth (2015: 3%). As a result of the analysis, no impairment has been recognised for the period.
A DA IR S L IM I T ED62

NOTES TO THE F INANCIAL STATEMENTS (CO N T I N UED)
FOR T HE 5 3 W EEK S ENDING 3 J ULY 2 016
Key assumptions used in value in use calculations
The calculation of value in use for Adairs is most sensitive to the following assumptions:
• Gross margin
• Discount rate
• Growth rate
Gross margins — Gross margins are based on average values achieved in the past. These are increased over the budget period for anticipated efficiency improvements.
Discount rate — Discount rate calculation is based on the specific circumstances of the Group and is derived from its weighted average cost of capital (WACC). The WACC takes into account both debt and equity. The cost of equity is derived from the expected return of investment by the Group’s investors. The cost of debt is based on the interest bearing borrowings the Group is obliged to service. Segment-specific risk is incorporated by applying individual risk factors into the WACC.
Growth rate — Rates are based on management’s best estimate of anticipated growth in the short to medium term.
Sensitivity to changes in assumptions
There are no reasonable possible changes in key assumptions that could cause the carrying value of the cash-generating units (CGUs) to exceed its recoverable amount.
NOTE 10 . TRADE AND OTHER PAYABLES
53 weeks ending 3 July 2016
$’000
52 weeks ending 28 June 2015
$’000
Current
Trade creditors 7,212 13,588
Accrued expenses 5,335 8,179
Other payables 2,844 1,951
Total current 15,391 23,718
Non-current
Total non-current — —
Current 15,391 23,718
Non-current — —
Total trade and other payables 15,391 23,718
A NN UA L REP ORT 2 0 16 6 3
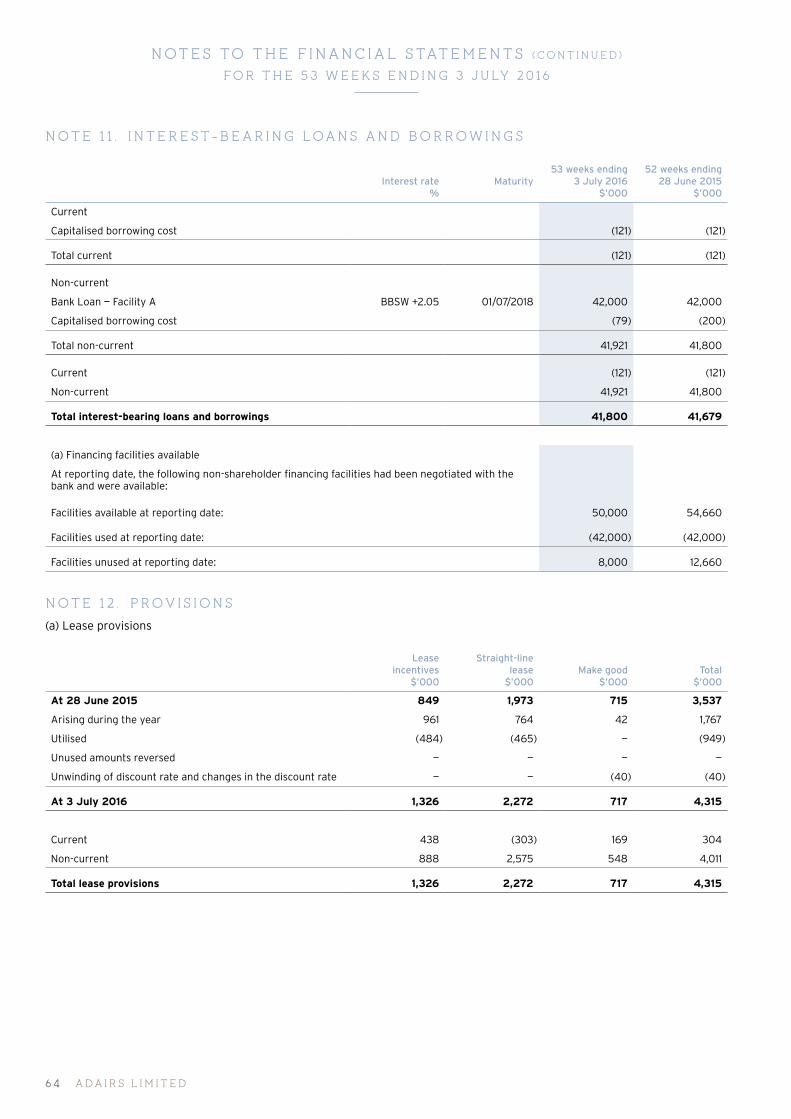
NOTES TO THE F INANCIAL STATEMENTS (CO N T I N UED)
FOR T HE 5 3 W EEK S ENDING 3 J ULY 2 016
NOTE 1 1 . INTEREST-BEARING LOANS AND BORROWINGS
Interest rate %
Maturity53 weeks ending
3 July 2016 $’000
52 weeks ending 28 June 2015
$’000
Current
Capitalised borrowing cost (121) (121)
Total current (121) (121)
Non-current
Bank Loan — Facility A BBSW +2.05 01/07/2018 42,000 42,000
Capitalised borrowing cost (79) (200)
Total non-current 41,921 41,800
Current (121) (121)
Non-current 41,921 41,800
Total interest-bearing loans and borrowings 41,800 41,679
(a) Financing facilities available
At reporting date, the following non-shareholder financing facilities had been negotiated with the bank and were available:
Facilities available at reporting date: 50,000 54,660
Facilities used at reporting date: (42,000) (42,000)
Facilities unused at reporting date: 8,000 12,660
NOTE 12 . PROVIS IONS
(a) Lease provisions
Lease incentives
$’000
Straight-line lease
$’000Make good
$’000Total
$’000
At 28 June 2015 849 1,973 715 3,537
Arising during the year 961 764 42 1,767
Utilised (484) (465) — (949)
Unused amounts reversed — — — —
Unwinding of discount rate and changes in the discount rate — — (40) (40)
At 3 July 2016 1,326 2,272 717 4,315
Current 438 (303) 169 304
Non-current 888 2,575 548 4,011
Total lease provisions 1,326 2,272 717 4,315
A DA IR S L IM I T ED6 4
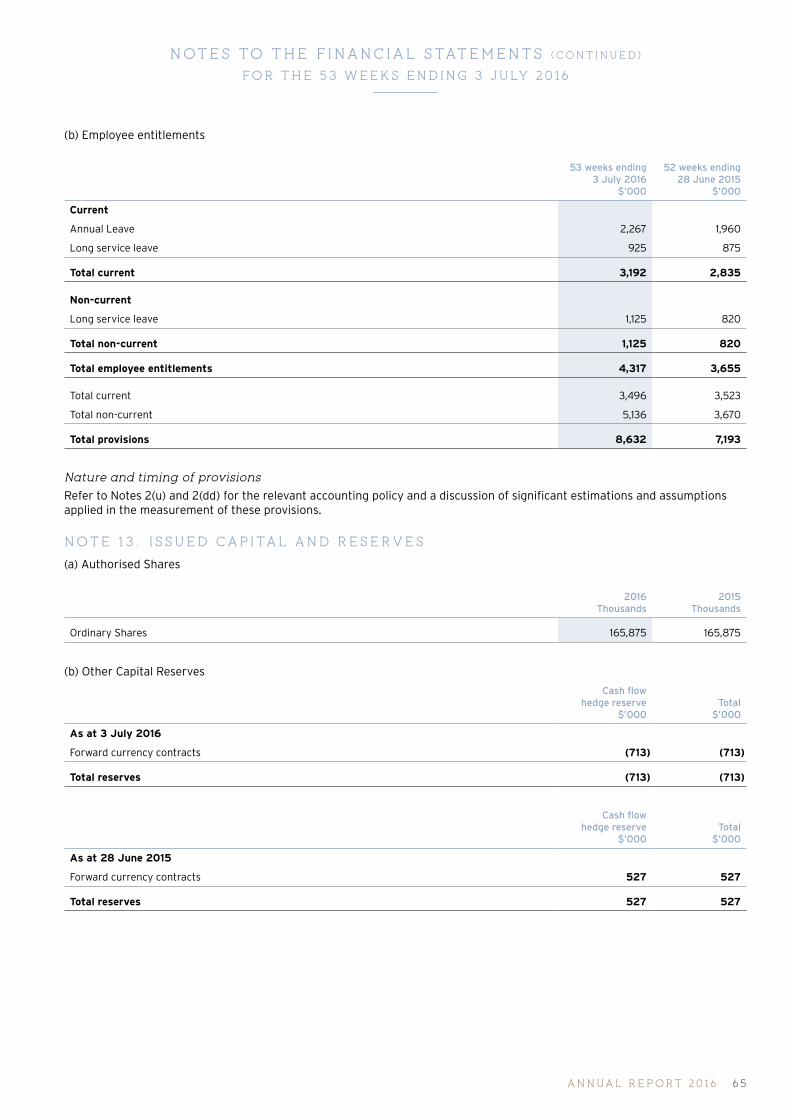
NOTES TO THE F INANCIAL STATEMENTS (CO N T I N UED)
FOR T HE 5 3 W EEK S ENDING 3 J ULY 2 016
(b) Employee entitlements
53 weeks ending 3 July 2016
$’000
52 weeks ending 28 June 2015
$’000
Current
Annual Leave 2,267 1,960
Long service leave 925 875
Total current 3,192 2,835
Non-current
Long service leave 1,125 820
Total non-current 1,125 820
Total employee entitlements 4,317 3,655
Total current 3,496 3,523
Total non-current 5,136 3,670
Total provisions 8,632 7,193
Nature and timing of provisions
Refer to Notes 2(u) and 2(dd) for the relevant accounting policy and a discussion of significant estimations and assumptions applied in the measurement of these provisions.
NOTE 13 . I SSUED CAP ITAL AND RESERVES
(a) Authorised Shares
2016 Thousands
2015 Thousands
Ordinary Shares 165,875 165,875
(b) Other Capital Reserves
Cash flowhedge reserve
$’000Total
$’000
As at 3 July 2016
Forward currency contracts (713) (713)
Total reserves (713) (713)
Cash flowhedge reserve
$’000Total
$’000
As at 28 June 2015
Forward currency contracts 527 527
Total reserves 527 527
A NN UA L REP ORT 2 0 16 6 5
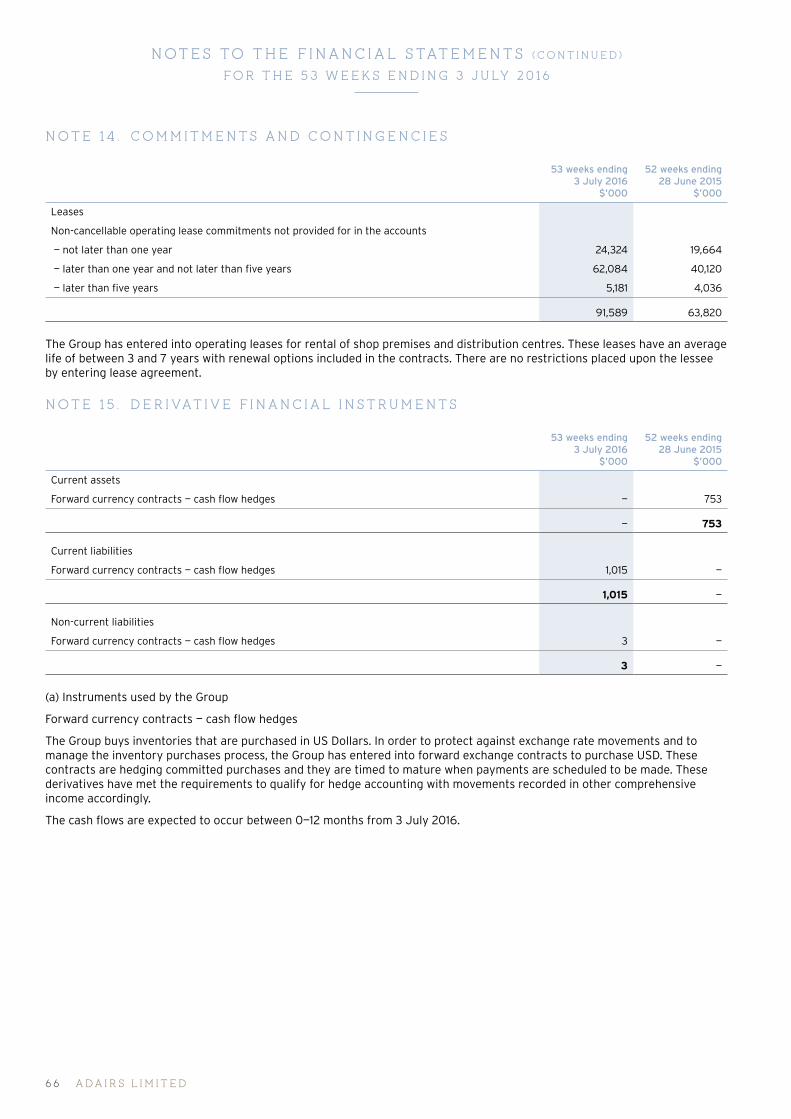
NOTES TO THE F INANCIAL STATEMENTS (CO N T I N UED)
FOR T HE 5 3 W EEK S ENDING 3 J ULY 2 016
NOTE 14 . COMM ITMENTS AND CONTINGENCIES
53 weeks ending 3 July 2016
$’000
52 weeks ending 28 June 2015
$’000
Leases
Non-cancellable operating lease commitments not provided for in the accounts
— not later than one year 24,324 19,664
— later than one year and not later than five years 62,084 40,120
— later than five years 5,181 4,036
91,589 63,820
The Group has entered into operating leases for rental of shop premises and distribution centres. These leases have an average life of between 3 and 7 years with renewal options included in the contracts. There are no restrictions placed upon the lessee by entering lease agreement.
NOTE 15 . DER IVAT IVE F INANCIAL INSTRUM ENTS
53 weeks ending 3 July 2016
$’000
52 weeks ending 28 June 2015
$’000
Current assets
Forward currency contracts — cash flow hedges — 753
— 753
Current liabilities
Forward currency contracts — cash flow hedges 1,015 —
1,015 —
Non-current liabilities
Forward currency contracts — cash flow hedges 3 —
3 —
(a) Instruments used by the Group
Forward currency contracts — cash flow hedges
The Group buys inventories that are purchased in US Dollars. In order to protect against exchange rate movements and to manage the inventory purchases process, the Group has entered into forward exchange contracts to purchase USD. These contracts are hedging committed purchases and they are timed to mature when payments are scheduled to be made. These derivatives have met the requirements to qualify for hedge accounting with movements recorded in other comprehensive income accordingly.
The cash flows are expected to occur between 0—12 months from 3 July 2016.
A DA IR S L IM I T ED6 6
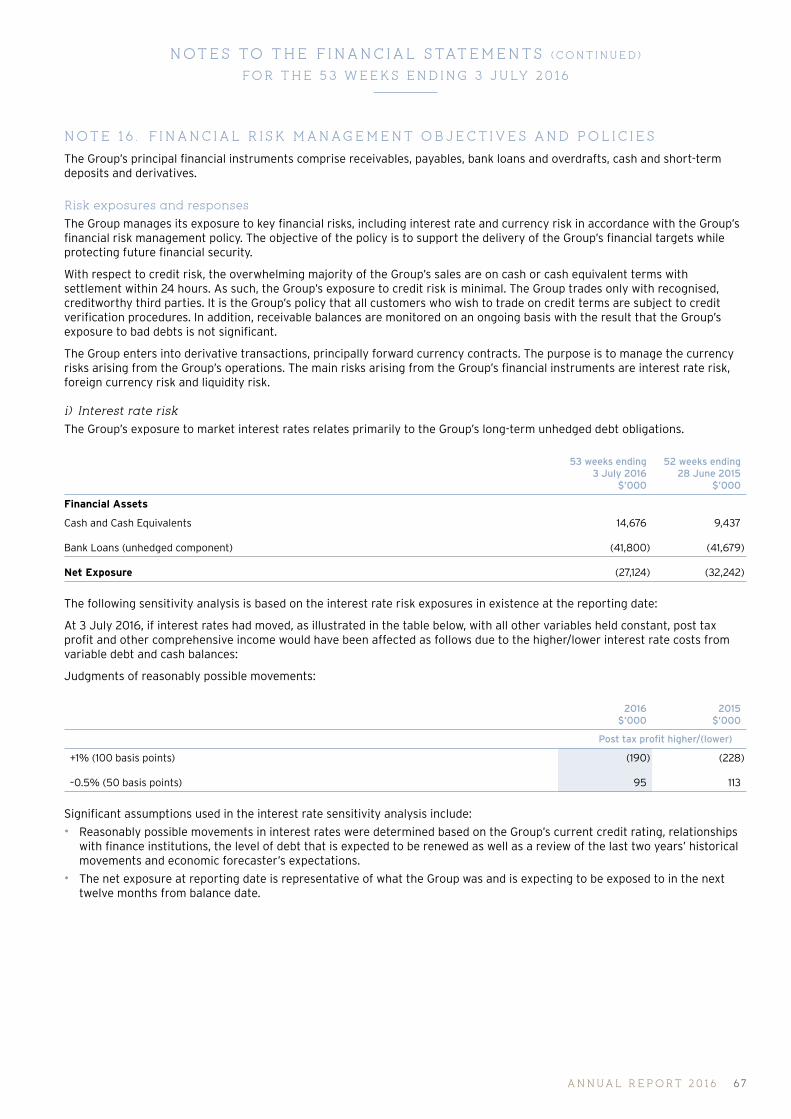
NOTES TO THE F INANCIAL STATEMENTS (CO N T I N UED)
FOR T HE 5 3 W EEK S ENDING 3 J ULY 2 016
NOTE 16 . F INANCIAL R ISK MANAGEM ENT OBJECT IVES AND POL IC IES
The Group’s principal financial instruments comprise receivables, payables, bank loans and overdrafts, cash and short-term deposits and derivatives.
Risk exposures and responses
The Group manages its exposure to key financial risks, including interest rate and currency risk in accordance with the Group’s financial risk management policy. The objective of the policy is to support the delivery of the Group’s financial targets while protecting future financial security.
With respect to credit risk, the overwhelming majority of the Group’s sales are on cash or cash equivalent terms with settlement within 24 hours. As such, the Group’s exposure to credit risk is minimal. The Group trades only with recognised, creditworthy third parties. It is the Group’s policy that all customers who wish to trade on credit terms are subject to credit verification procedures. In addition, receivable balances are monitored on an ongoing basis with the result that the Group’s exposure to bad debts is not significant.
The Group enters into derivative transactions, principally forward currency contracts. The purpose is to manage the currency risks arising from the Group’s operations. The main risks arising from the Group’s financial instruments are interest rate risk, foreign currency risk and liquidity risk.
i) Interest rate risk
The Group’s exposure to market interest rates relates primarily to the Group’s long-term unhedged debt obligations.
53 weeks ending 3 July 2016
$’000
52 weeks ending 28 June 2015
$’000
Financial Assets
Cash and Cash Equivalents 14,676 9,437
Bank Loans (unhedged component) (41,800) (41,679)
Net Exposure (27,124) (32,242)
The following sensitivity analysis is based on the interest rate risk exposures in existence at the reporting date:
At 3 July 2016, if interest rates had moved, as illustrated in the table below, with all other variables held constant, post tax profit and other comprehensive income would have been affected as follows due to the higher/lower interest rate costs from variable debt and cash balances:
Judgments of reasonably possible movements:
2016 $’000
2015 $’000
Post tax profit higher/(lower)
+1% (100 basis points) (190) (228)
–0.5% (50 basis points) 95 113
Significant assumptions used in the interest rate sensitivity analysis include:
• Reasonably possible movements in interest rates were determined based on the Group’s current credit rating, relationships with finance institutions, the level of debt that is expected to be renewed as well as a review of the last two years’ historical movements and economic forecaster’s expectations.
• The net exposure at reporting date is representative of what the Group was and is expecting to be exposed to in the next twelve months from balance date.
A NN UA L REP ORT 2 0 16 67

NOTES TO THE F INANCIAL STATEMENTS (CO N T I N UED)
FOR T HE 5 3 W EEK S ENDING 3 J ULY 2 016
NOTE 16 . F INANCIAL RISK MANAGEMENT OBJECTIVES AND POLICIES (CONTINUED)
(ii) Foreign currency risk
As a result of large purchases of inventory denominated in United States Dollars, the Group’s Statement of Financial Position can be affected significantly by movements in the US$/A$ exchange rates. The group attempts to mitigate this risk by entering into forward foreign exchange contracts, as detailed below.
At reporting date, the Group had the following exposure to US$ foreign currency that is not covered by a designated cash flow.
2016 $’000
2015 $’000
Financial Liabilities
Payables 2,650 858
The following sensitivity is based on the foreign currency risk exposures in existence at the reporting date:
At 3 July 2016, had the Australian Dollar moved, as illustrated in the table below, with all other variables held constant, post tax profit and other comprehensive income would have been affected as follows:
Judgments of reasonably possible movements:
2016 $’000
2015 $’000
Post tax profit higher/(lower)
AUD to US Dollar +15% 242 59
AUD to US Dollar —15% (327) 227
Significant assumptions used in the foreign currency exposure sensitivity analysis include:
• Reasonably possible movements in foreign exchange rates were determined based on a review of the last two years’ historical movements and economic forecaster’s expectations.
• The net exposure at balance date is representative of what the Group was and is expecting to be exposed to in the next twelve months from reporting date.
• The sensitivity does not include financial instruments that are non-monetary items as these are not considered to give rise to currency risk.
(iii) Liquidity risk
Liquidity risk arises from the financial liabilities of the Group and the Group’s subsequent ability to meet their obligations to repay their financial liabilities as and when they fall due.
The Group’s objective is to maintain a balance between continuity of funding and flexibility through the use of bank overdrafts, bank loans, preference shares and committed available credit lines.
A. Non-derivative financial assets and liabilitiesThe following liquidity risk disclosures reflect all contractually fixed pay-offs, repayments and interest resulting from recognised financial liabilities as of 3 July 2016. For the other obligations the respective undiscounted cash flows for the respective upcoming fiscal years are presented. The timing of cash flows for assets/liabilities is based on the contractual terms of the underlying contract.
A DA IR S L IM I T ED6 8
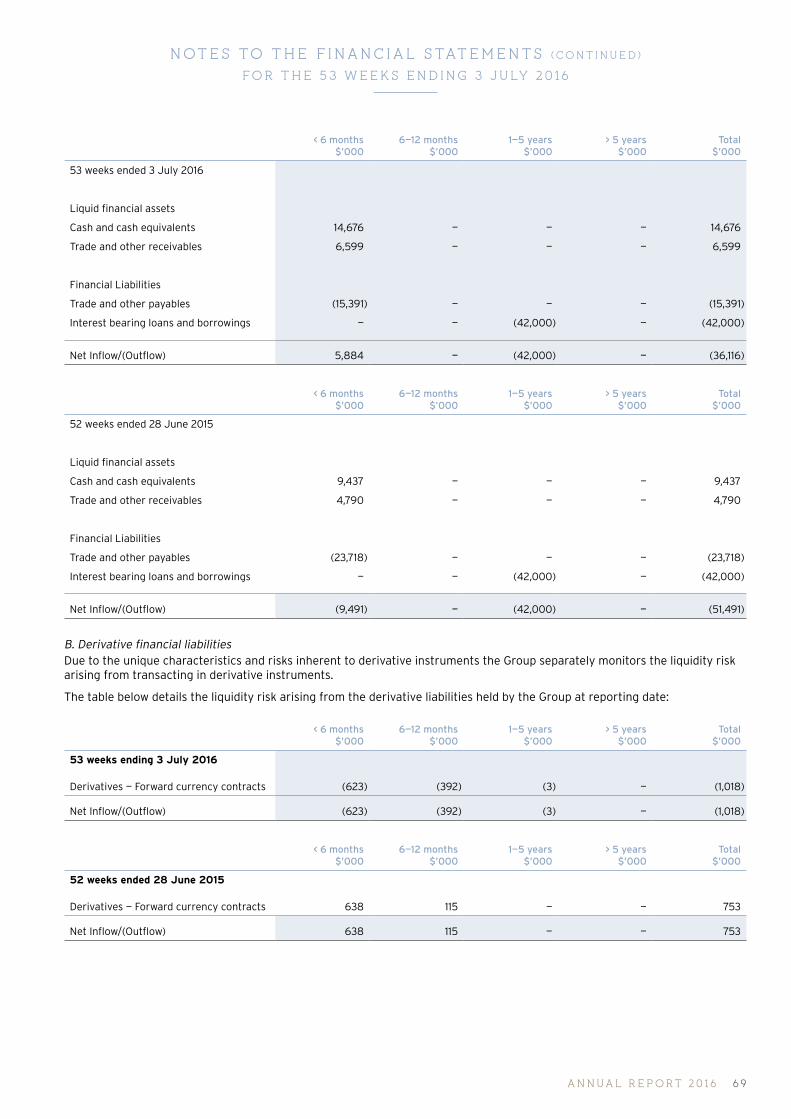
NOTES TO THE F INANCIAL STATEMENTS (CO N T I N UED)
FOR T HE 5 3 W EEK S ENDING 3 J ULY 2 016
< 6 months $’000
6—12 months $’000
1—5 years $’000
> 5 years $’000
Total $’000
53 weeks ended 3 July 2016
Liquid financial assets
Cash and cash equivalents 14,676 — — — 14,676
Trade and other receivables 6,599 — — — 6,599
Financial Liabilities
Trade and other payables (15,391) — — — (15,391)
Interest bearing loans and borrowings — — (42,000) — (42,000)
Net Inflow/(Outflow) 5,884 — (42,000) — (36,116)
< 6 months $’000
6—12 months $’000
1—5 years $’000
> 5 years $’000
Total $’000
52 weeks ended 28 June 2015
Liquid financial assets
Cash and cash equivalents 9,437 — — — 9,437
Trade and other receivables 4,790 — — — 4,790
Financial Liabilities
Trade and other payables (23,718) — — — (23,718)
Interest bearing loans and borrowings — — (42,000) — (42,000)
Net Inflow/(Outflow) (9,491) — (42,000) — (51,491)
B. Derivative financial liabilitiesDue to the unique characteristics and risks inherent to derivative instruments the Group separately monitors the liquidity risk arising from transacting in derivative instruments.
The table below details the liquidity risk arising from the derivative liabilities held by the Group at reporting date:
< 6 months $’000
6—12 months $’000
1—5 years $’000
> 5 years $’000
Total $’000
53 weeks ending 3 July 2016
Derivatives — Forward currency contracts (623) (392) (3) — (1,018)
Net Inflow/(Outflow) (623) (392) (3) — (1,018)
< 6 months $’000
6—12 months $’000
1—5 years $’000
> 5 years $’000
Total $’000
52 weeks ended 28 June 2015
Derivatives — Forward currency contracts 638 115 — — 753
Net Inflow/(Outflow) 638 115 — — 753
A NN UA L REP ORT 2 0 16 69
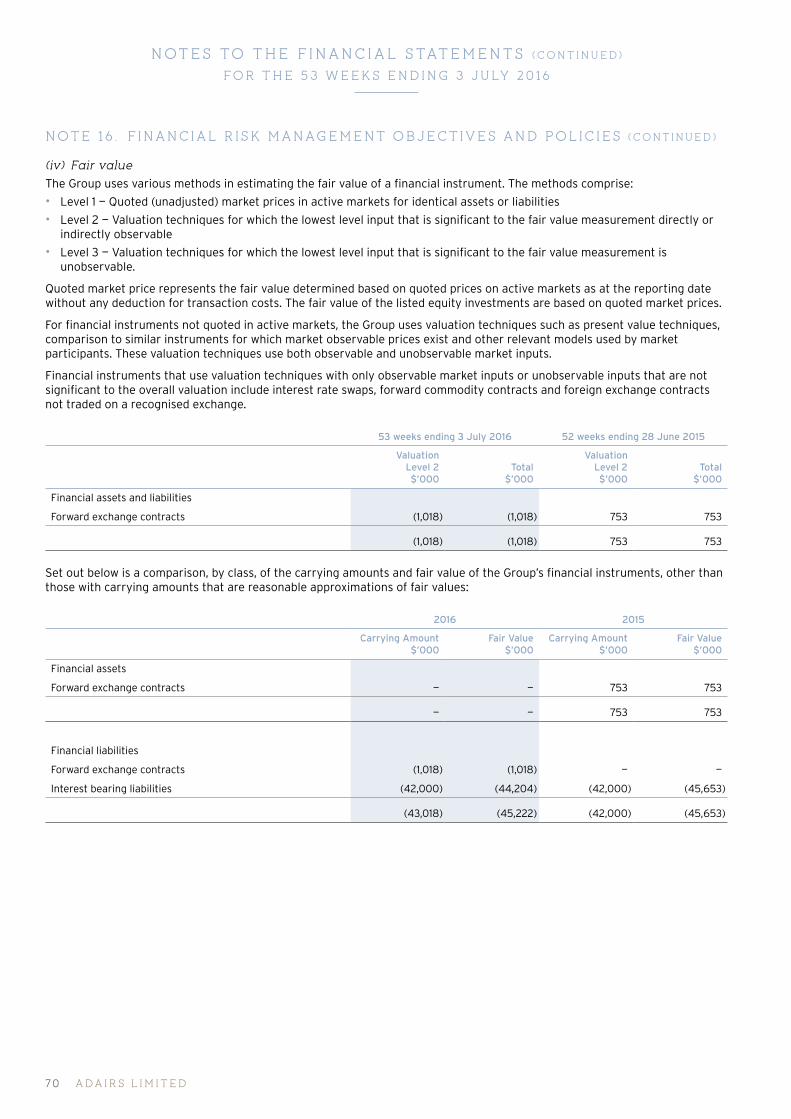
NOTES TO THE F INANCIAL STATEMENTS (CO N T I N UED)
FOR T HE 5 3 W EEK S ENDING 3 J ULY 2 016
NOTE 16 . F INANCIAL RISK MANAGEMENT OBJECTIVES AND POLICIES (CONTINUED)
(iv) Fair value
The Group uses various methods in estimating the fair value of a financial instrument. The methods comprise:
• Level 1 — Quoted (unadjusted) market prices in active markets for identical assets or liabilities
• Level 2 — Valuation techniques for which the lowest level input that is significant to the fair value measurement directly or indirectly observable
• Level 3 — Valuation techniques for which the lowest level input that is significant to the fair value measurement is unobservable.
Quoted market price represents the fair value determined based on quoted prices on active markets as at the reporting date without any deduction for transaction costs. The fair value of the listed equity investments are based on quoted market prices.
For financial instruments not quoted in active markets, the Group uses valuation techniques such as present value techniques, comparison to similar instruments for which market observable prices exist and other relevant models used by market participants. These valuation techniques use both observable and unobservable market inputs.
Financial instruments that use valuation techniques with only observable market inputs or unobservable inputs that are not significant to the overall valuation include interest rate swaps, forward commodity contracts and foreign exchange contracts not traded on a recognised exchange.
53 weeks ending 3 July 2016 52 weeks ending 28 June 2015
ValuationLevel 2$’000
Total$’000
ValuationLevel 2$’000
Total$’000
Financial assets and liabilities
Forward exchange contracts (1,018) (1,018) 753 753
(1,018) (1,018) 753 753
Set out below is a comparison, by class, of the carrying amounts and fair value of the Group’s financial instruments, other than those with carrying amounts that are reasonable approximations of fair values:
2016 2015
Carrying Amount$’000
Fair Value$’000
Carrying Amount$’000
Fair Value$’000
Financial assets
Forward exchange contracts — — 753 753
— — 753 753
Financial liabilities
Forward exchange contracts (1,018) (1,018) — —
Interest bearing liabilities (42,000) (44,204) (42,000) (45,653)
(43,018) (45,222) (42,000) (45,653)
A DA IR S L IM I T ED70
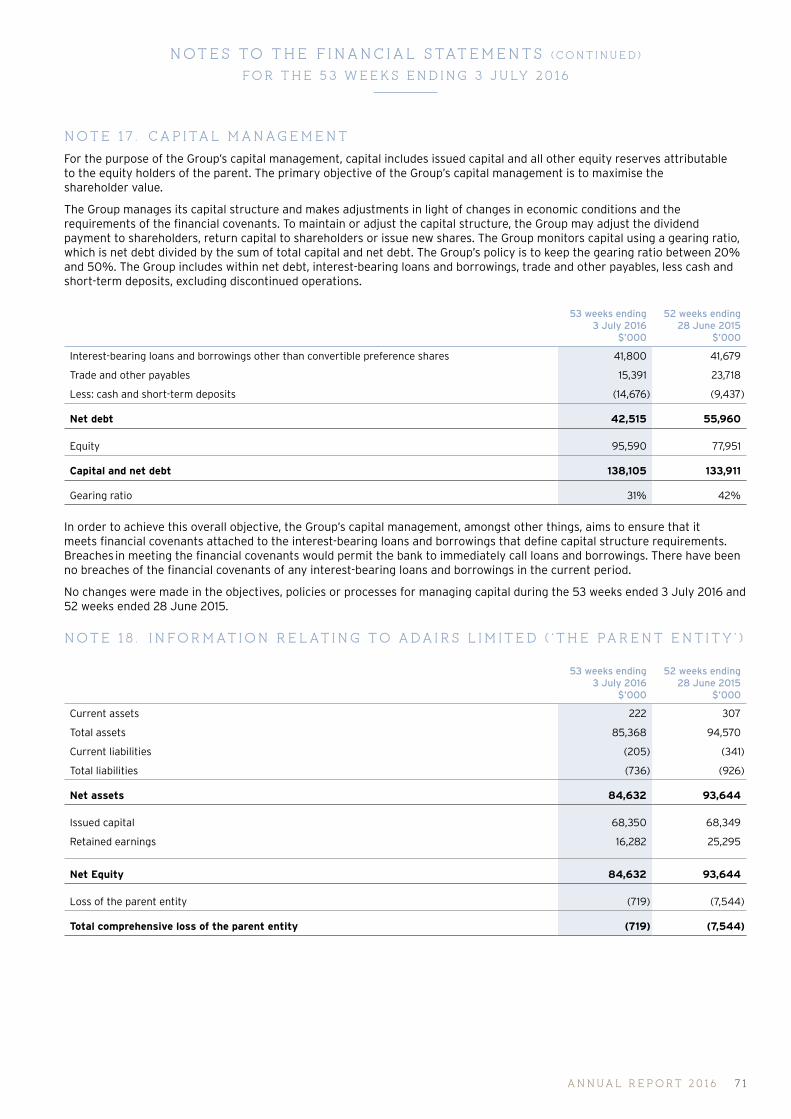
NOTES TO THE F INANCIAL STATEMENTS (CO N T I N UED)
FOR T HE 5 3 W EEK S ENDING 3 J ULY 2 016
NOTE 17 . CAP ITAL MANAGEMENT
For the purpose of the Group’s capital management, capital includes issued capital and all other equity reserves attributable to the equity holders of the parent. The primary objective of the Group’s capital management is to maximise the shareholder value.
The Group manages its capital structure and makes adjustments in light of changes in economic conditions and the requirements of the financial covenants. To maintain or adjust the capital structure, the Group may adjust the dividend payment to shareholders, return capital to shareholders or issue new shares. The Group monitors capital using a gearing ratio, which is net debt divided by the sum of total capital and net debt. The Group’s policy is to keep the gearing ratio between 20% and 50%. The Group includes within net debt, interest-bearing loans and borrowings, trade and other payables, less cash and short-term deposits, excluding discontinued operations.
53 weeks ending 3 July 2016
$’000
52 weeks ending 28 June 2015
$’000
Interest-bearing loans and borrowings other than convertible preference shares 41,800 41,679
Trade and other payables 15,391 23,718
Less: cash and short-term deposits (14,676) (9,437)
Net debt 42,515 55,960
Equity 95,590 77,951
Capital and net debt 138,105 133,911
Gearing ratio 31% 42%
In order to achieve this overall objective, the Group’s capital management, amongst other things, aims to ensure that it meets financial covenants attached to the interest-bearing loans and borrowings that define capital structure requirements. Breaches in meeting the financial covenants would permit the bank to immediately call loans and borrowings. There have been no breaches of the financial covenants of any interest-bearing loans and borrowings in the current period.
No changes were made in the objectives, policies or processes for managing capital during the 53 weeks ended 3 July 2016 and 52 weeks ended 28 June 2015.
NOTE 18 . INFORMATION RELAT ING TO ADAIRS L IM ITED ( ‘ THE PARENT ENT ITY ’ )
53 weeks ending 3 July 2016
$’000
52 weeks ending 28 June 2015
$’000
Current assets 222 307
Total assets 85,368 94,570
Current liabilities (205) (341)
Total liabilities (736) (926)
Net assets 84,632 93,644
Issued capital 68,350 68,349
Retained earnings 16,282 25,295
Net Equity 84,632 93,644
Loss of the parent entity (719) (7,544)
Total comprehensive loss of the parent entity (719) (7,544)
A NN UA L REP ORT 2 0 16 7 1
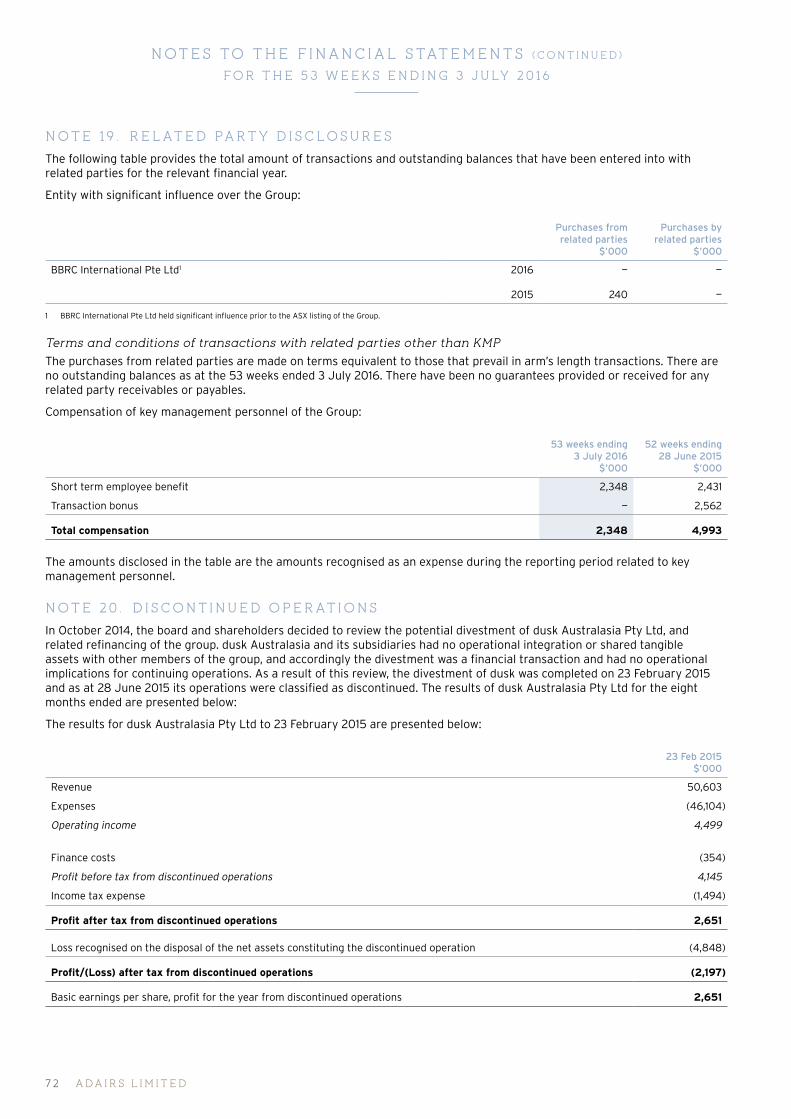
NOTES TO THE F INANCIAL STATEMENTS (CO N T I N UED)
FOR T HE 5 3 W EEK S ENDING 3 J ULY 2 016
NOTE 19 . RELATED PARTY D ISCLOSURES
The following table provides the total amount of transactions and outstanding balances that have been entered into with related parties for the relevant financial year.
Entity with significant influence over the Group:
Purchases from related parties
$’000
Purchases by related parties
$’000
BBRC International Pte Ltd1 2016 — —
2015 240 —
1 BBRC International Pte Ltd held significant influence prior to the ASX listing of the Group.
Terms and conditions of transactions with related parties other than KMP
The purchases from related parties are made on terms equivalent to those that prevail in arm’s length transactions. There are no outstanding balances as at the 53 weeks ended 3 July 2016. There have been no guarantees provided or received for any related party receivables or payables.
Compensation of key management personnel of the Group:
53 weeks ending 3 July 2016
$’000
52 weeks ending 28 June 2015
$’000
Short term employee benefit 2,348 2,431
Transaction bonus — 2,562
Total compensation 2,348 4,993
The amounts disclosed in the table are the amounts recognised as an expense during the reporting period related to key management personnel.
NOTE 20 . D ISCONTINUED OPERAT IONS
In October 2014, the board and shareholders decided to review the potential divestment of dusk Australasia Pty Ltd, and related refinancing of the group. dusk Australasia and its subsidiaries had no operational integration or shared tangible assets with other members of the group, and accordingly the divestment was a financial transaction and had no operational implications for continuing operations. As a result of this review, the divestment of dusk was completed on 23 February 2015 and as at 28 June 2015 its operations were classified as discontinued. The results of dusk Australasia Pty Ltd for the eight months ended are presented below:
The results for dusk Australasia Pty Ltd to 23 February 2015 are presented below:
23 Feb 2015 $’000
Revenue 50,603
Expenses (46,104)
Operating income 4,499
Finance costs (354)
Profit before tax from discontinued operations 4,145
Income tax expense (1,494)
Profit after tax from discontinued operations 2,651
Loss recognised on the disposal of the net assets constituting the discontinued operation (4,848)
Profit/(Loss) after tax from discontinued operations (2,197)
Basic earnings per share, profit for the year from discontinued operations 2,651
A DA IR S L IM I T ED72

NOTES TO THE F INANCIAL STATEMENTS (CO N T I N UED)
FOR T HE 5 3 W EEK S ENDING 3 J ULY 2 016
NOTE 2 1 . EARNINGS PER SHARE
Basic EPS amounts are calculated by dividing the profit for the year attributable to ordinary equity holders of the Parent by the weighted average number of ordinary shares outstanding during the year.
No dilutive equity instruments are on issue as at 3 July 2016 (2015: nil). As a result, dilutive EPS equals basic EPS.
The following reflects the income and share data used in the basic and diluted EPS computations:
53 weeks ending 3 July 2016
$’000
52 weeks ending 28 June 2015
$’000
Profit attributable to ordinary equity holders of the Parent:
Continuing operations 27,172 2,942
Discontinued operations — (2,197)
Profit attributable to ordinary equity holders of the Parent for basic earnings 27,172 745
Interest on convertible preference shares — 9,283
Profit attributable to ordinary equity holders of the Parent adjusted for the effect of dilution 27,172 10,028
53 weeks ending 3 July 2016
’000
52 weeks ending 28 June 2015
’000
Weighted average number of ordinary shares for basic EPS(1) 165,875 151,471
(1) The weighted average number of shares takes into account the weighted average effect of changes in treasury share transactions during the year.
There have been no other transactions involving ordinary shares or potential ordinary shares between the reporting date and the date of authorisation of these financial statements.
To calculate the EPS amounts for discontinued operations (Note 20), the weighted average number of ordinary shares for both basic and diluted EPS is as per the table above. The following table provides the profit/ (loss) amount used:
53 weeks ending 3 July 2016
$’000
52 weeks ending 28 June 2015
$’000
Profit/(loss) attributable to ordinary equity holders of the Parent from a discontinued operations for basic and diluted EPS calculations
— (2,197)
NOTE 22 . INFORMATION RELAT ING TO SUBS ID IAR IES
The consolidated financial statements of the Group include:
Equity Holding
Name of Entity Country of incorporation2016
%2015
%
Adairs Limited Australia 100 100
Adairs Holdings Australia Pty Limited Australia 100 100
Adairs Retail Group Pty Limited Australia 100 100
Wilder Days Pty Limited Australia 100 100
Adairs New Zealand Limited New Zealand 100 —
A NN UA L REP ORT 2 0 16 73
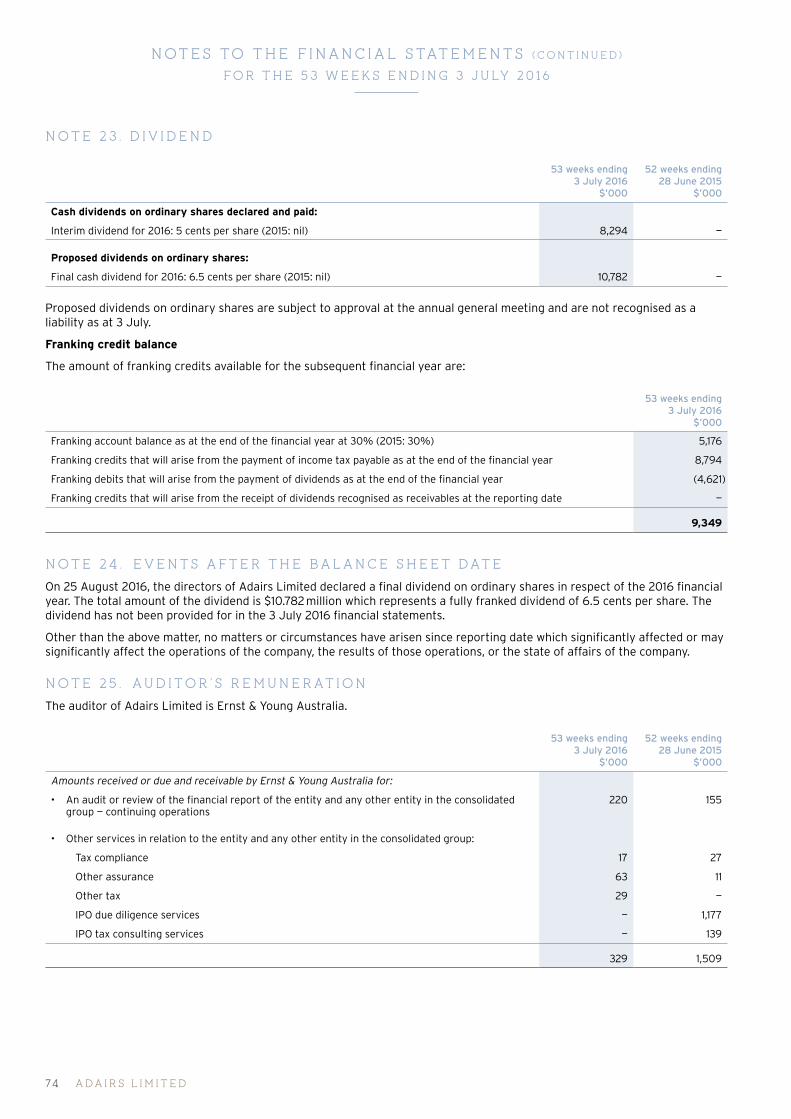
NOTES TO THE F INANCIAL STATEMENTS (CO N T I N UED)
FOR T HE 5 3 W EEK S ENDING 3 J ULY 2 016
NOTE 23 . D IV IDEND
53 weeks ending 3 July 2016
$’000
52 weeks ending 28 June 2015
$’000
Cash dividends on ordinary shares declared and paid:
Interim dividend for 2016: 5 cents per share (2015: nil) 8,294 —
Proposed dividends on ordinary shares:
Final cash dividend for 2016: 6.5 cents per share (2015: nil) 10,782 —
Proposed dividends on ordinary shares are subject to approval at the annual general meeting and are not recognised as a liability as at 3 July.
Franking credit balance
The amount of franking credits available for the subsequent financial year are:
53 weeks ending 3 July 2016
$’000
Franking account balance as at the end of the financial year at 30% (2015: 30%) 5,176
Franking credits that will arise from the payment of income tax payable as at the end of the financial year 8,794
Franking debits that will arise from the payment of dividends as at the end of the financial year (4,621)
Franking credits that will arise from the receipt of dividends recognised as receivables at the reporting date —
9,349
NOTE 24 . EVENTS AFTER THE BALANCE SHEET DATE
On 25 August 2016, the directors of Adairs Limited declared a final dividend on ordinary shares in respect of the 2016 financial year. The total amount of the dividend is $10.782 million which represents a fully franked dividend of 6.5 cents per share. The dividend has not been provided for in the 3 July 2016 financial statements.
Other than the above matter, no matters or circumstances have arisen since reporting date which significantly affected or may significantly affect the operations of the company, the results of those operations, or the state of affairs of the company.
NOTE 25 . AUDITOR ’S REMUNERATION
The auditor of Adairs Limited is Ernst & Young Australia.
53 weeks ending 3 July 2016
$’000
52 weeks ending 28 June 2015
$’000
Amounts received or due and receivable by Ernst & Young Australia for:
• An audit or review of the financial report of the entity and any other entity in the consolidated group — continuing operations
220 155
• Other services in relation to the entity and any other entity in the consolidated group:
Tax compliance 17 27
Other assurance 63 11
Other tax 29 —
IPO due diligence services — 1,177
IPO tax consulting services — 139
329 1,509
A DA IR S L IM I T ED74
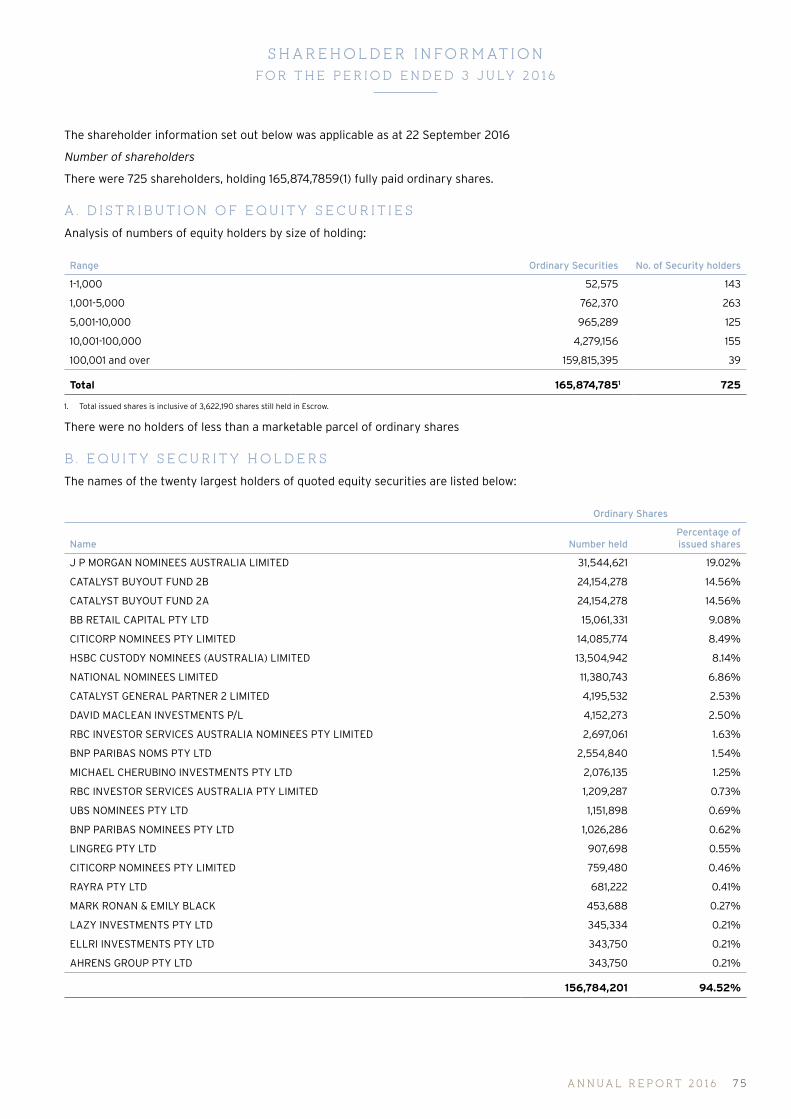
SHAREHOLDER INFORMATIONFOR T HE PERIOD ENDED 3 J ULY 2 016
The shareholder information set out below was applicable as at 22 September 2016
Number of shareholders
There were 725 shareholders, holding 165,874,7859(1) fully paid ordinary shares.
A . D ISTR IBUT ION OF EQUITY SECURIT IES
Analysis of numbers of equity holders by size of holding:
Range Ordinary Securities No. of Security holders
1-1,000 52,575 143
1,001-5,000 762,370 263
5,001-10,000 965,289 125
10,001-100,000 4,279,156 155
100,001 and over 159,815,395 39
Total 165,874,7851 725
1. Total issued shares is inclusive of 3,622,190 shares still held in Escrow.
There were no holders of less than a marketable parcel of ordinary shares
B . EQUITY SECURITY HOLDERS
The names of the twenty largest holders of quoted equity securities are listed below:
Ordinary Shares
Name Number heldPercentage of issued shares
J P MORGAN NOMINEES AUSTRALIA LIMITED 31,544,621 19.02%
CATALYST BUYOUT FUND 2B 24,154,278 14.56%
CATALYST BUYOUT FUND 2A 24,154,278 14.56%
BB RETAIL CAPITAL PTY LTD 15,061,331 9.08%
CITICORP NOMINEES PTY LIMITED 14,085,774 8.49%
HSBC CUSTODY NOMINEES (AUSTRALIA) LIMITED 13,504,942 8.14%
NATIONAL NOMINEES LIMITED 11,380,743 6.86%
CATALYST GENERAL PARTNER 2 LIMITED 4,195,532 2.53%
DAVID MACLEAN INVESTMENTS P/L 4,152,273 2.50%
RBC INVESTOR SERVICES AUSTRALIA NOMINEES PTY LIMITED 2,697,061 1.63%
BNP PARIBAS NOMS PTY LTD 2,554,840 1.54%
MICHAEL CHERUBINO INVESTMENTS PTY LTD 2,076,135 1.25%
RBC INVESTOR SERVICES AUSTRALIA PTY LIMITED 1,209,287 0.73%
UBS NOMINEES PTY LTD 1,151,898 0.69%
BNP PARIBAS NOMINEES PTY LTD 1,026,286 0.62%
LINGREG PTY LTD 907,698 0.55%
CITICORP NOMINEES PTY LIMITED 759,480 0.46%
RAYRA PTY LTD 681,222 0.41%
MARK RONAN & EMILY BLACK 453,688 0.27%
LAZY INVESTMENTS PTY LTD 345,334 0.21%
ELLRI INVESTMENTS PTY LTD 343,750 0.21%
AHRENS GROUP PTY LTD 343,750 0.21%
156,784,201 94.52%
A NN UA L REP ORT 2 0 16 75

C . SUBSTANTIAL SHAREHOLDINGS
As at 22 September 2016, there are eight substantial shareholders that the Company is aware of:
Ordinary Shares
Name Number heldPercentage of issued shares1
Date of most recent notice
Catalyst Buyout Fund 2A Pty Ltd 24,154,278 14.56% 26/08/2015
Catalyst Buyout Fund 2B Pty Ltd 24,154,278 14.56% 26/08/2015
The Goldman Sachs Group, Inc. 15,253,621 9.20% 02/05/2016
BB Retail Capital Pty Ltd 15,061,331 9.08% 17/06/2015
Commonwealth Bank of Australia 13,785,623 8.31% 22/09/2016
AustralianSuper Pty Ltd 12,644,982 7.62% 23/05/2016
FIL Limited 8,377,337 5.05% 14/06/2016
Platypus Asset Management 8,329,414 5.02% 31/08/2015
1. Total issued shares is inclusive of 3,622,190 shares still held in Escrow.
D. VOT ING R IGHTS
The voting rights relating to each class of equity securities is as follows:
a) Ordinary Shares
On a show of hands at a General Meeting of the Company, every member present in person or by proxy shall have one vote and upon poll each person present in person or by proxy shall have one vote for each ordinary share held.
E . MARKET BUY-BACK
There is currently no on market buy-back.
SHAREHOLDER INFORMATION (CO N T I N UED)
FOR T HE PERIOD ENDED 3 J ULY 2 016
A DA IR S L IM I T ED76

CORPOR ATE INFORMATION
ABN 50 147 375 451
DIRECTORS
Michael ButlerTrent PetersonKate SpargoDavid BriskinDavid MacLeanMichael Cherubino
COMPANY SECRETARY
Mark Ronan
REGISTERED OFFICE
2 International CourtScoresby Victoria 3179Australia
PRINCIPAL PLACE OF BUSINESS
2 International CourtScoresby Victoria 3179Australia
Phone: 1800 990 475
SHARE REGISTER
Link Market ServicesLocked Bag A14Sydney South NSW 1235
Phone: 1300 554 474
AUDITORS
Ernst & Young
SOLICITORS
Herbert Smith Freehills
BANKERS
Commonwealth Bank of Australia
A NN UA L REP ORT 2 0 16