Embed Size (px)
Citation preview
ANNEXURES
Studies on some aspects of nitrogen fixation by microbes from alkaline and saline soils
Ph.D. Thesis, Rajendra D. Shelar, 2014, NMU, Jalgaon 181
Annexure 1: Calibration curve for estimation of Acetylene and Ethylene using
gas chromatography
Fig. A1: Calibration curves of gas chromatographic response for (a) acetylene
(99.6%) and ethylene (99.96%) expressed in injection volume (µl) and
(b) ethylene expressed in nmoles
Explanation
All gas calculations are done at normal temperature and pressure (NTP) (pressure = 760
mm Hg or 1 atm; temperature = 273° K). Convert 1 ml of ethylene to ml of ethylene at
NTP using the gas law relationship:
Acetyleney = 2859.2xR² = 0.9965
Ethyleney = 2938.5xR² = 0.9986
0
200000
400000
600000
800000
1000000
1200000
1400000
1600000
0 100 200 300 400 500 600
Pe
ak a
rea
Acetylene and Ethylene (µl)
(a)
Acytelene (µl)
Ethylene (µl)
y = 732.8xR² = 0.9986
0
200000
400000
600000
800000
1000000
1200000
1400000
1600000
0 500 1000 1500 2000 2500
Pe
ak a
rea
Ethylene (nmoles)
(b) Ethylene nmoles
Linear (Ethylene nmoles)
ANNEXURES
Studies on some aspects of nitrogen fixation by microbes from alkaline and saline soils
Ph.D. Thesis, Rajendra D. Shelar, 2014, NMU, Jalgaon 182
P1.V1 / T1 = P2.V2 / T2
Where P1 = 760 mm Hg, V1 = unknown, T1 = 273° K
P2 = 760 mm Hg, V2 = 1 ml, T2 = (273° + 23°) K
and P2 = 760 mm Hg, V2 = 1 ml, T2 = (273° + 30°) K
1 ml of ethylene at RT and 1 atm (760 mm Hg) = 0.922 ml at NTP
1 ml of ethylene at RT (30oC) and 1 atm (760 mm Hg) = 0.900 ml at NTP
Conversion of ethylene (ml to nmoles):
1 mole of C2H4 at NTP occupies 22.4 liters.
0.922 ml of ethylene at NTP = 4.12 x 10⁻⁵ mol
= 0.0000412 moles = 41200 nmol
0.900 ml of ethylene at NTP = 4.01 x 10⁻⁵ mol
= 0.0000401 moles = 41000 nmol
1 ml of 1% ethylene injected into the GC = 412 nmol
1 ml of 1% ethylene injected into the GC = 401 nmol
1 ml of 10% ethylene injected into the GC = 4010 nmol
100 µl of 10% ethylene injected into the GC = 401.0 nmol
100 µl = 401.0 nmol = (peak area)
200 µl = 401.0 x 2 nmol = 802 nmol = (peak area)
300 µl = 401.0 x 3 nmol = 1203 nmol = (peak area)
400 µl = 401.0 x 4 nmol = 1604 nmol = (peak area)
500 µl = 401.0 x 5 nmol = 2005 nmol = (peak area)
ANNEXURES
Studies on some aspects of nitrogen fixation by microbes from alkaline and saline soils
Ph.D. Thesis, Rajendra D. Shelar, 2014, NMU, Jalgaon 183
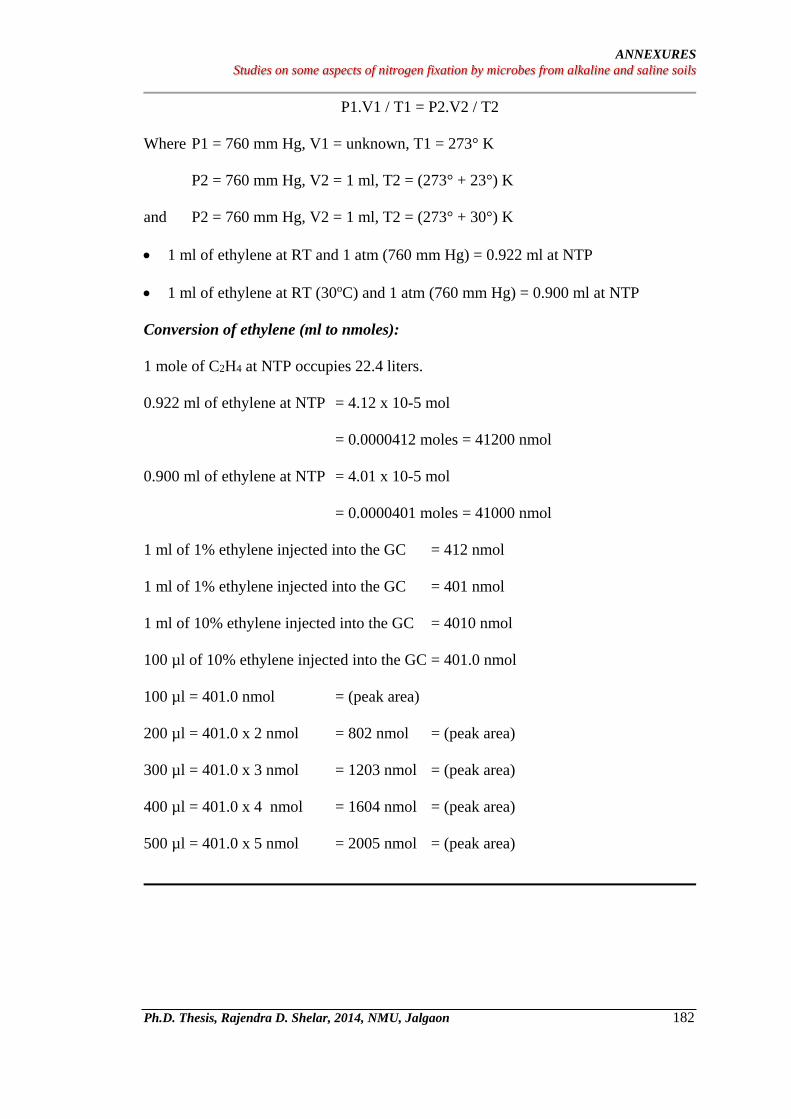
Annexure 2: Pattern of fatty acid methyl esters of Halomonas spp. and its quantum
Volume: DATA File: E123304.16A SampCtr: 10 ID Number: 7
Type: Samp Bottle: 8 Method: RTSBA6
Created: 3/30/2012 11:13:12 AM Sample ID: RAP3
RT Response Ar/Ht RFact ECL Peak Name Percent Comment1 Comment2
0.7437 1.654E+6 0.005 ---- 6.6657 ---- < min rt
0.7522 1.093E+9 0.019 ---- 6.7292 SOLVENT PEAK ---- < min rt
0.9935 360 0.008 ---- 8.5248 ---- < min rt
1.0289 440 0.011 ---- 8.7936 ---- < min rt
1.1308 891 0.018 1.372 9.5662 unknown 9.560 ---- ECL deviates 0.006
1.1888 1783 0.012 1.317 10.0019 10:0 0.23 ECL deviates 0.002 Reference 0.014
1.2698 1148 0.015 ---- 10.4770 ----
1.3597 1612 0.012 1.204 11.0024 11:0 0.19 ECL deviates 0.002 Reference 0.007
1.4550 24489 0.009 1.160 11.4548 10:0 3OH 2.77 ECL deviates 0.007
1.4863 533 0.013 1.143 11.6030 12:0 iso 0.06 ECL deviates -0.018 Reference -0.017
1.5316 2131 0.009 1.125 11.8180 unknown 11.825 ---- ECL deviates -0.007
1.5706 61795 0.008 1.110 12.0025 12:0 6.69 ECL deviates 0.002 Reference 0.001
1.5997 411 0.011 1.101 12.1205 11:0 iso 3OH 0.04 ECL deviates 0.013
1.6869 2859 0.010 1.072 12.4733 11:0 3OH 0.30 ECL deviates 0.008
1.7242 738 0.008 1.061 12.6244 13:0 iso 0.08 ECL deviates 0.001 Reference -0.003
1.7474 870 0.009 1.054 12.7183 13:0 anteiso 0.09 ECL deviates 0.004 Reference 0.000
1.7700 423 0.009 ---- 12.8096 ----
1.8004 611 0.008 ---- 12.9328 ----
1.8174 1154 0.008 1.034 13.0014 13:0 0.12 ECL deviates 0.001 Reference -0.004
1.8515 656 0.011 1.026 13.1251 12:0 iso 3OH 0.07 ECL deviates 0.005
1.8699 486 0.009 ---- 13.1916 ----
1.9094 904 0.011 1.013 13.3344 12:1 3OH 0.09 ECL deviates 0.009
1.9527 49647 0.008 1.003 13.4907 12:0 3OH 4.85 ECL deviates 0.008
1.9909 831 0.012 0.994 13.6286 14:0 iso 0.08 ECL deviates 0.001 Reference -0.007
2.0179 486 0.010 0.989 13.7263 14:0 anteiso 0.05 ECL deviates 0.008 Reference 0.000
2.0482 3888 0.009 ---- 13.8354 ----
2.0942 7656 0.009 0.974 14.0017 14:0 0.73 ECL deviates 0.002 Reference -0.007
2.1622 543 0.009 0.963 14.2313 13:0 2OH 0.05 ECL deviates 0.007
2.1941 602 0.014 ---- 14.3389 ----
2.2438 3659 0.009 0.949 14.5065 Sum In Feature 1 0.34 ECL deviates 0.004 13:0 3OH/15:1 iso
H 2.2810 2589 0.009 0.944 14.6318 15:0 iso 0.24 ECL deviates 0.000 Reference -0.010
2.3086 4031 0.009 0.940 14.7250 15:0 anteiso 0.37 ECL deviates 0.000 Reference -0.010
2.3354 5578 0.008 0.936 14.8151 15:1 w8c 0.51 ECL deviates 0.001
2.3533 1064 0.008 0.934 14.8754 15:1 w6c 0.10 ECL deviates 0.000
2.3911 9002 0.009 0.929 15.0028 15:0 ---- ECL deviates 0.003
2.4381 884 0.010 0.923 15.1551 14:0 iso 3OH 0.08 ECL deviates 0.008
2.4905 1203 0.009 ---- 15.3243 ----
2.5515 17215 0.009 0.911 15.5217 Sum In Feature 2 1.53 ECL deviates 0.006 14:0 3OH/16:1 iso
I 2.5860 4674 0.010 0.908 15.6329 16:0 iso 0.41 ECL deviates 0.000 Reference -0.011
2.6091 378 0.009 ---- 15.7077 ----
2.6508 272952 0.010 0.902 15.8423 Sum In Feature 3 23.99 ECL deviates 0.002 16:1 w7c/16:1 w6c
2.6775 1008 0.009 0.899 15.9285 16:1 w5c 0.09 ECL deviates 0.000
2.7008 235076 0.009 0.898 16.0039 16:0 20.56 ECL deviates 0.004 Reference -0.007
2.7518 569 0.010 0.894 16.1668 15:0 iso 3OH 0.05 ECL deviates 0.005
2.7811 854 0.009 0.892 16.2607 15:0 2OH 0.07 ECL deviates 0.006
2.8374 944 0.011 0.888 16.4404 Sum In Feature 9 0.08 ECL deviates -0.007 17:1 iso w9c
2.8718 848 0.010 0.886 16.5504 17:1 anteiso w9c 0.07 ECL deviates -0.002
2.8976 2790 0.010 0.884 16.6329 17:0 iso 0.24 ECL deviates -0.004 Reference -0.015
2.9285 12305 0.009 0.883 16.7314 17:0 anteiso 1.06 ECL deviates -0.002 Reference -0.012
2.9542 18771 0.009 0.881 16.8134 17:1 w8c 1.61 ECL deviates -0.002
2.9755 2777 0.009 0.880 16.8817 17:1 w6c 0.24 ECL deviates 0.001
3.0126 12801 0.009 0.879 17.0001 17:0 1.10 ECL deviates 0.000 Reference -0.010
3.0789 990 0.023 ---- 17.2116 ----
3.1278 1080 0.015 ---- 17.3674 ----
3.1667 407 0.009 0.873 17.4913 18:1 iso H 0.03 ECL deviates 0.001
3.1843 1612 0.009 0.873 17.5475 16:0 3OH 0.14 ECL deviates 0.000
3.2108 1444 0.010 0.872 17.6321 18:0 iso 0.12 ECL deviates -0.004 Reference -0.013
3.2777 346623 0.009 0.871 17.8452 Sum In Feature 8 29.43 ECL deviates -0.002 18:1 w7c
ANNEXURES
Studies on some aspects of nitrogen fixation by microbes from alkaline and saline soils
Ph.D. Thesis, Rajendra D. Shelar, 2014, NMU, Jalgaon 184
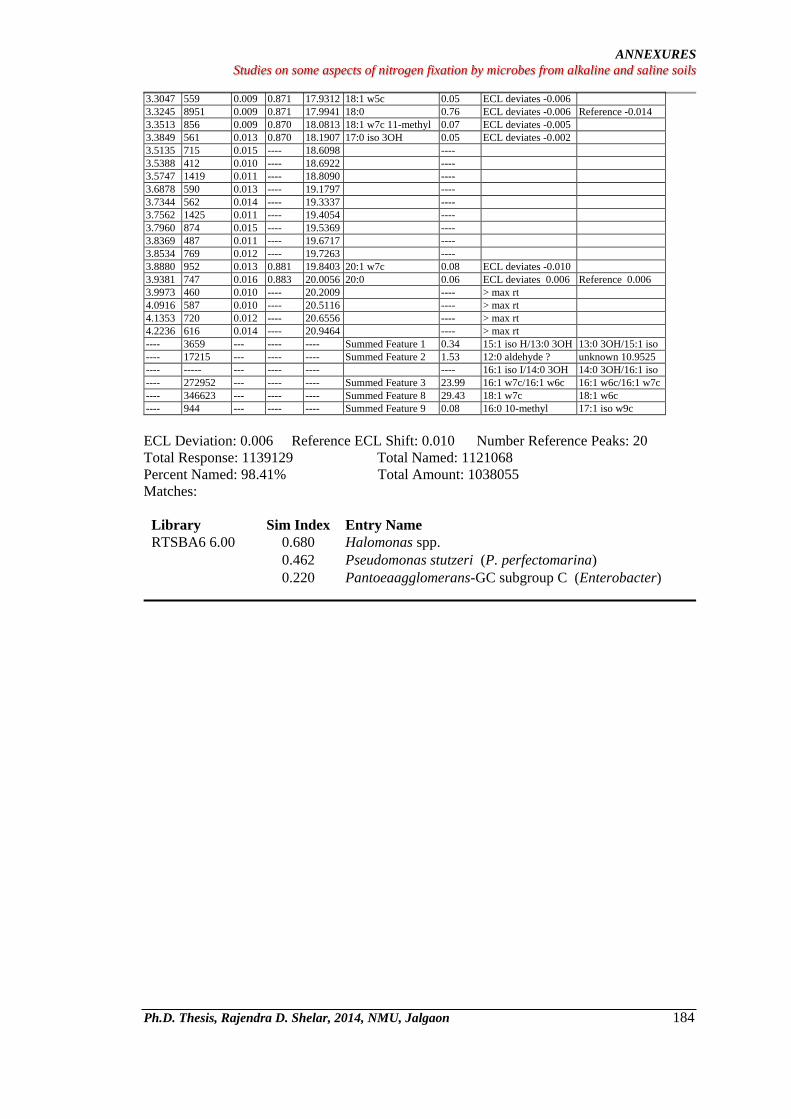
ECL Deviation: 0.006 Reference ECL Shift: 0.010 Number Reference Peaks: 20
Total Response: 1139129 Total Named: 1121068
Percent Named: 98.41% Total Amount: 1038055
Matches:
Library Sim Index Entry Name
RTSBA6 6.00 0.680 Halomonas spp.
0.462 Pseudomonas stutzeri (P. perfectomarina)
0.220 Pantoeaagglomerans-GC subgroup C (Enterobacter)
3.3047 559 0.009 0.871 17.9312 18:1 w5c 0.05 ECL deviates -0.006
3.3245 8951 0.009 0.871 17.9941 18:0 0.76 ECL deviates -0.006 Reference -0.014
3.3513 856 0.009 0.870 18.0813 18:1 w7c 11-methyl 0.07 ECL deviates -0.005
3.3849 561 0.013 0.870 18.1907 17:0 iso 3OH 0.05 ECL deviates -0.002
3.5135 715 0.015 ---- 18.6098 ----
3.5388 412 0.010 ---- 18.6922 ----
3.5747 1419 0.011 ---- 18.8090 ----
3.6878 590 0.013 ---- 19.1797 ----
3.7344 562 0.014 ---- 19.3337 ----
3.7562 1425 0.011 ---- 19.4054 ----
3.7960 874 0.015 ---- 19.5369 ----
3.8369 487 0.011 ---- 19.6717 ----
3.8534 769 0.012 ---- 19.7263 ----
3.8880 952 0.013 0.881 19.8403 20:1 w7c 0.08 ECL deviates -0.010
3.9381 747 0.016 0.883 20.0056 20:0 0.06 ECL deviates 0.006 Reference 0.006
3.9973 460 0.010 ---- 20.2009 ---- > max rt
4.0916 587 0.010 ---- 20.5116 ---- > max rt
4.1353 720 0.012 ---- 20.6556 ---- > max rt
4.2236 616 0.014 ---- 20.9464 ---- > max rt
---- 3659 --- ---- ---- Summed Feature 1 0.34 15:1 iso H/13:0 3OH 13:0 3OH/15:1 iso
H ---- 17215 --- ---- ---- Summed Feature 2 1.53 12:0 aldehyde ? unknown 10.9525
---- ----- --- ---- ---- ---- 16:1 iso I/14:0 3OH 14:0 3OH/16:1 iso
I ---- 272952 --- ---- ---- Summed Feature 3 23.99 16:1 w7c/16:1 w6c 16:1 w6c/16:1 w7c
---- 346623 --- ---- ---- Summed Feature 8 29.43 18:1 w7c 18:1 w6c
---- 944 --- ---- ---- Summed Feature 9 0.08 16:0 10-methyl 17:1 iso w9c
ANNEXURES
Studies on some aspects of nitrogen fixation by microbes from alkaline and saline soils
Ph.D. Thesis, Rajendra D. Shelar, 2014, NMU, Jalgaon 185
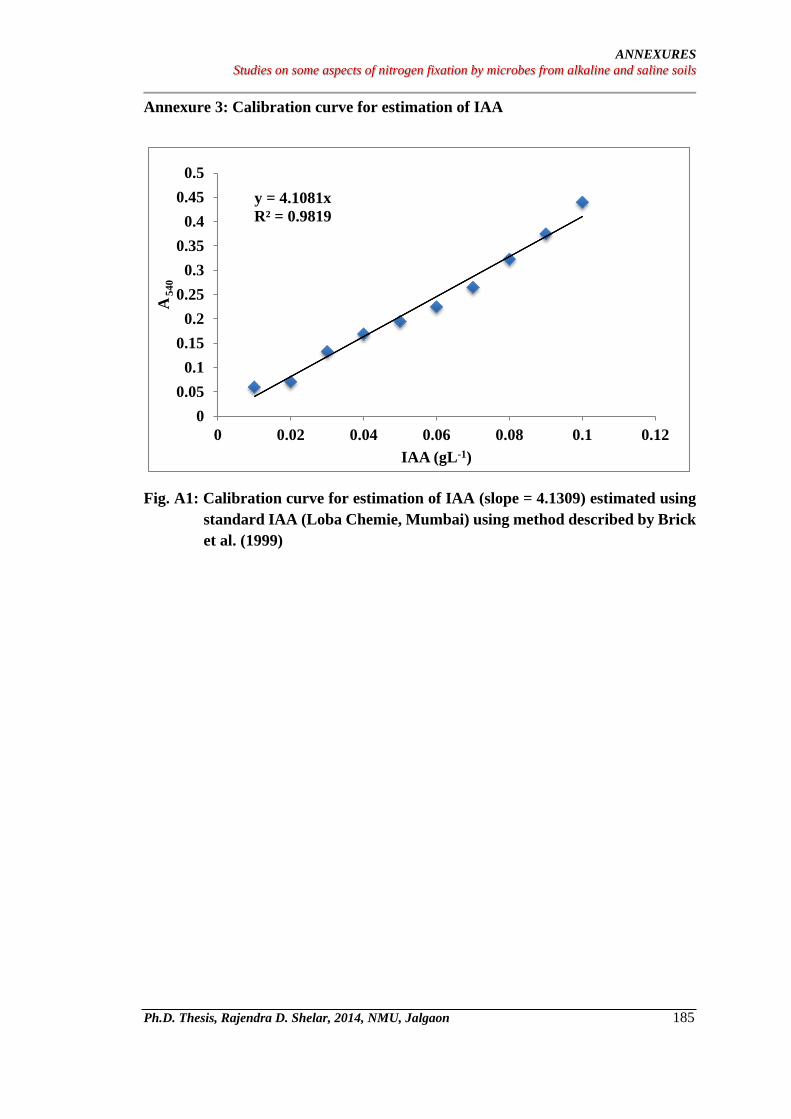
Annexure 3: Calibration curve for estimation of IAA
Fig. A1: Calibration curve for estimation of IAA (slope = 4.1309) estimated using
standard IAA (Loba Chemie, Mumbai) using method described by Brick
et al. (1999)
y = 4.1081x
R² = 0.9819
0
0.05
0.1
0.15
0.2
0.25
0.3
0.35
0.4
0.45
0.5
0 0.02 0.04 0.06 0.08 0.1 0.12
A5
40
IAA (gL-1)

ANNEXURES
Studies on some aspects of nitrogen fixation by microbes from alkaline and saline soils
Ph.D. Thesis, Rajendra D. Shelar, 2014, NMU, Jalgaon 186
Annexure 4: FAME analysis report of RAP3 strain.
Royal Life Sciences Pvt.Ltd. Affiliated to MIDI Sherlock, USA
Plot No. 41, Samrat colony, W.Marredpally, Secunderabad -500 026, (Twin city of Hyderabad), INDIA. Tele Fax: + 91-40- 65795687 / 27803738 / 27703154 Email: [email protected] Site rwww.royalgroupinfo.com
ANALYSIS REPORT
ISSUED TO: Report Number: RLS/REP/046 R. D. Shelar, Research Scholar,Issue Date: 02/04/2012 Dept. of Microbiology, Z. B. Patil College, Deopur, Dhule - 424 002
SAMPLE DETAILS
Sample Received Date: 24/03/2012 Sample Ids: 1. RAP 3 Service Requested for: FAME Analysis No. of Samples: 1 Growth Conditions: Aerobic Culture
RESULT
S.No Sample Id Analysis Method Used Result
1 RAP 3 FAME RTSBA6 Halomonas spp.
Checked by
Navya (Research Analyst)
ANNEXURES
Studies on some aspects of nitrogen fixation by microbes from alkaline and saline soils
Ph.D. Thesis, Rajendra D. Shelar, 2014, NMU, Jalgaon 187
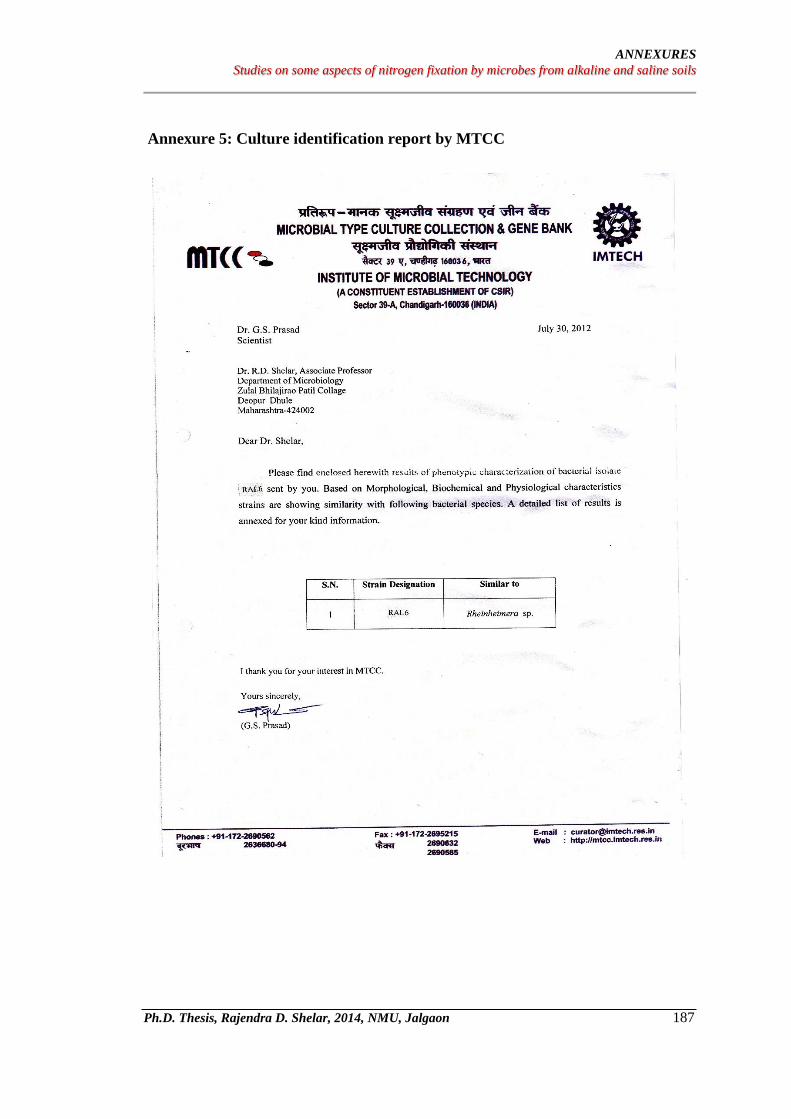
Annexure 5: Culture identification report by MTCC
ANNEXURES
Studies on some aspects of nitrogen fixation by microbes from alkaline and saline soils
Ph.D. Thesis, Rajendra D. Shelar, 2014, NMU, Jalgaon 188
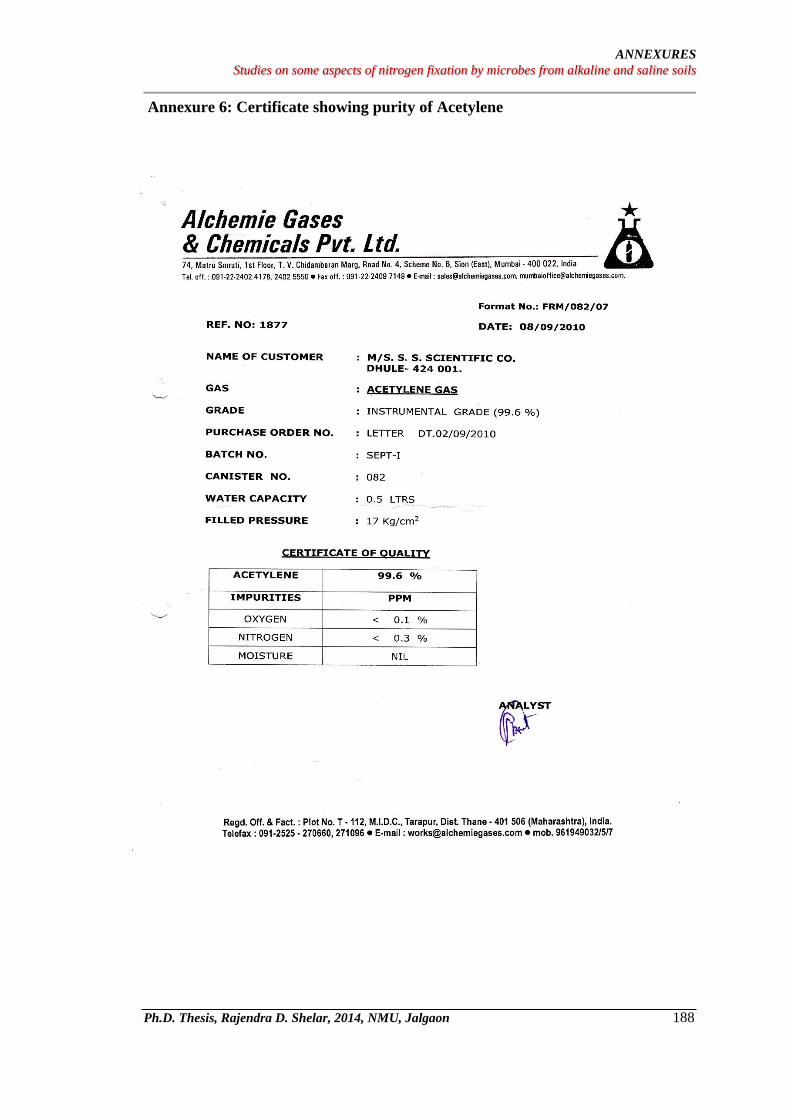
Annexure 6: Certificate showing purity of Acetylene
ANNEXURES
Studies on some aspects of nitrogen fixation by microbes from alkaline and saline soils
Ph.D. Thesis, Rajendra D. Shelar, 2014, NMU, Jalgaon 189
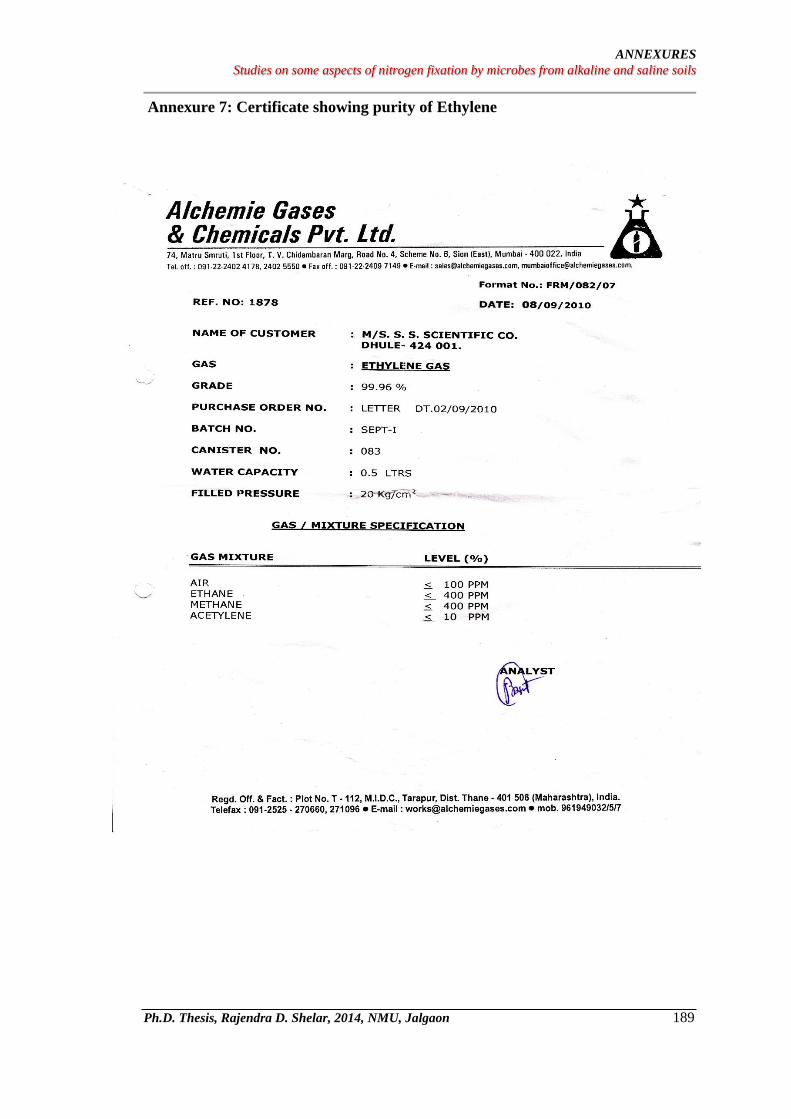
Annexure 7: Certificate showing purity of Ethylene