Embed Size (px)
Citation preview

ANNEXES
ANNEX 1; Statement of the Resources Director
I declare that in accordance with the Commission's communication on clarification of the responsibilities of the key actors in the domain of internal audit and internal control in the Commission6, I have reported my advice and recommendations to the Director-General on the overall state of internal control in the DG.
I hereby certify that the information provided in Section 2 of the present AAR and in its annexes is, to the best of my knowledge, accurate and exhaustive."
Date 14 ¡ЪЪ)
Maria Angeles Benitez Salas
6 Communication to the Commission: Clarification of the responsibilities of the key actors in the domain of internal audit and internal control in the Commission; SEC(2003)59 of 21.01.2003.
23
Ref. Ares(2016)1750387 - 13/04/2016

Annex 3 Financial Reports - DG EPSC - Financial Year 2015
Table 1 : Commitments
Table 2 : Payments
Table 3 : Commitments to be settled
Table 7 : Income
Table 9 : Ageing Balance of Recovery Orders
Table 11 : Negotiated Procedures (excluding Building Contracts)
Table 12 : Summary of Procedures (excluding Building Contracts)
Table 13 : Building Contracts
Table 4 : Balance Sheet
Table 10 : Waivers of Recovery Orders
Table 14 : Contracts declared Secret
AAR 2015 Version 1
Table 6 : Average Payment Times
Table 8 : Recovery of undue Payments
Table 5 : Statement of Financial Performance
Note : The figures are those related to the provisionalaccounts and not yet audited by the Court of Auditors
Annex 3 Financial Reports - DG EPSCReport printed on 21/01/2016
Ref. Ares(2016)1750387 - 13/04/2016

Additional comments
Note : The figures are those related to the provisionalaccounts and not yet audited by the Court of Auditors
Annex 3 Financial Reports - DG EPSCReport printed on 21/01/2016

TABLE 1: OUTTURN ON COMMITMENT APPROPRIATIONS IN 2015 (in Mio €)Commitment
appropriationsauthorised
Commitmentsmade %
1 2 3=2/1
Title 25 Commission¿s policy coordination and legal advice
25 25 01Administrative expenditure of the`Commission-s policy coordination and legaladvice- policy area
0.82 0.74 90.49 %
Total Title 25 0.82 0.74 90.49%
Total DG EPSC 0.82 0.74 90.49 %
* Commitment appropriations authorised include, in addition to the budget voted by the legislative authority,appropriations carried over from the previous exercise, budget amendments as well as miscellaneouscommitment appropriations for the period (e.g. internal and external assigned revenue).
Annex 3 Financial Reports - DG EPSCReport printed on 21/01/2016
Note : The figures are those related to the provisionalaccounts and not yet audited by the Court of Auditors

TABLE 2: OUTTURN ON PAYMENT APPROPRIATIONS IN 2015 (in Mio €)
ChapterPayment
appropriationsauthorised *
Paymentsmade %
1 2 3=2/1
Title 25 Commission¿s policy coordination and legal advice
25 25 01Administrative expenditure of the `Commission-s policycoordination and legal advice- policy area 0.95 0.47 49.13 %
Total Title 25 0.95 0.47 49.13%
Total DG EPSC 0.95 0.47 49.13 %
* Payment appropriations authorised include, in addition to the budget voted by the legislative authority,appropriations carried over from the previous exercise, budget amendments as well as miscellaneous paymentappropriations for the period (e.g. internal and external assigned revenue).
Annex 3 Financial Reports - DG EPSCReport printed on 21/01/2016
Note : The figures are those related to the provisionalaccounts and not yet audited by the Court of Auditors

TABLE 3 : BREAKDOWN OF COMMITMENTS TO BE SETTLED AT 31/12/2015 (in Mio €)
2015 Commitments to be settled Commitments tobe settled from
Total ofcommitments to be
settled at end
Total ofcommitments tobe settled at end
Chapter Commitments2015 Payments 2015 RAL 2015 % to be settled financial years
previous to 2015of financial year 2015
(incl corrections)
of financial year2014(incl.
corrections)
1 2 3=1-2 4=1-2/1 5 6=3+5 7
Title 25 : Commission¿s policy coordination and legal advice
25 25 01Administrative expenditure of the`Commission-s policy coordination andlegal advice- policy area
0.74 0.44 0.3 40.25 % 0.00 0.30 0.13
Total Title 25 0.74 0.44 0.3 40.25% 0 0.3 0.13
Total DG EPSC 0.74 0.44 0.3 40.25 % 0 0.3 0.13
Annex 3 Financial Reports - DG EPSCReport printed on 21/01/2016
Note : The figures are those related to the provisionalaccounts and not yet audited by the Court of Auditors

Annex 3 Financial Reports - DG EPSCReport printed on 21/01/2016
Note : The figures are those related to the provisionalaccounts and not yet audited by the Court of Auditors

TABLE 4 : BALANCE SHEET
BALANCE SHEET 2015 2014
P.III. CURRENT LIABILITIES -481.82 -481.82
LIABILITIESP.III. CURRENT LIABILITIESP.III.4. Accounts Payable 0.00 0.00
P.III.5. Accrued charges and deferred income -481.82 -481.82
LIABILITIESLIABILITIES -481.82 -481.82
NET ASSETS (ASSETS less LIABILITIES) -481.82 -481.82
TOTAL 0.00 0.00
Non-allocated central (surplus)/deficit* -2,067,151.27 -1,838,405.96
It should be noted that the balance sheet and statement of financial performance presented in Annex 3 to this AnnualActivity Report, represent only the assets, liabilities, expenses and revenues that are under the control of this DirectorateGeneral. Significant amounts such as own resource revenues and cash held in Commission bank accounts are notincluded in this Directorate General's accounts since they are managed centrally by DG Budget, on whose balance sheetand statement of financial performance they appear. Furthermore, since the accumulated result of the Commission is notsplit amongst the various Directorates General, it can be seen that the balance sheet presented here is not in equilibrium.
Additionally, the figures included in tables 4 and 5 are provisional since they are, at this date, still subject to audit by theCourt of Auditors. It is thus possible that amounts included in these tables may have to be adjusted following this audit.
P.I.2. Accumulated Surplus / Deficit 2,067,633.09 1,838,887.78
Annex 3 Financial Reports - DG EPSCReport printed on 21/01/2016
Note : The figures are those related to the provisionalaccounts and not yet audited by the Court of Auditors

TABLE 5 : STATEMENT OF FINANCIAL PERFORMANCE
It should be noted that the balance sheet and statement of financial performance presented in Annex 3 to this AnnualActivity Report, represent only the assets, liabilities, expenses and revenues that are under the control of this DirectorateGeneral. Significant amounts such as own resource revenues and cash held in Commission bank accounts are not includedin this Directorate General's accounts since they are managed centrally by DG Budget, on whose balance sheet andstatement of financial performance they appear. Furthermore, since the accumulated result of the Commission is not splitamongst the various Directorates General, it can be seen that the balance sheet presented here is not in equilibrium.
Additionally, the figures included in tables 4 and 5 are provisional since they are, at this date, still subject to audit by theCourt of Auditors. It is thus possible that amounts included in these tables may have to be adjusted following this audit.
STATEMENT OF FINANCIAL PERFORMANCE 2015 2014
II.1 REVENUES 15,372.1 22,519.95
II.1.2. EXCHANGE REVENUES 15,372.1 22,519.95
II.1 REVENUESII.1.2.2. OTHER EXCHANGE REVENUE 15,372.10 22,519.95
II.2. EXPENSES 232,628.85 206,225.36
II.2. EXPENSES 232,628.85 206,225.36
II.2. EXPENSESII.2.10.OTHER EXPENSES 232,628.85 206,225.36
STATEMENT OF FINANCIAL PERFORMANCE 248,000.95 228,745.31
Explanatory Notes (facultative):Please enter the text directly (no copy/paste of formatted text which would then disappear when savingthe document in pdf), use \\\"ctrl+enter\\\" to go to the next line and \\\"enter\\\" to validate your typing.
Annex 3 Financial Reports - DG EPSCReport printed on 21/01/2016
Note : The figures are those related to the provisionalaccounts and not yet audited by the Court of Auditors

TABLE 6: AVERAGE PAYMENT TIMES FOR 2015 - DG EPSC
Legal Times
MaximumPayment
Time (Days)
Total Numberof Payments
Nbr ofPayments
within TimeLimit
PercentageAveragePayment
Times (Days)
Nbr of LatePayments Percentage
AveragePayment
Times (Days)
30 76 70 92.11 % 10.36 6 7.89 % 48.17
60 8 8 100.00 % 14.5
Total Numberof Payments 84 78 92.86 % 6 7.14 %
AveragePaymentTime
13.45 10.78 48.17
Late Interest paid in 2015
DG GL Account Description Amount (Eur)
Target Times
TargetPayment
Time (Days)
Total Numberof Payments
Nbr ofPayments
withinTarget Time
PercentageAveragePayment
Times (Days)
30 1 1 100.00 % 10
Total Numberof Payments 1 1 100.00 %
AveragePaymentTime
10 10
Suspensions
Average ReportApproval
SuspensionDays
AveragePayment
SuspensionDays
Number ofSuspendedPayments
% of TotalNumber
TotalNumber ofPayments
Amount ofSuspendedPayments
% ofTotal
Amount
Total PaidAmount
0 8 5 5.95 % 84 67,264.85 27.13 % 247,941.55
Note : The figures are those related to the provisionalaccounts and not yet audited by the Court of Auditors Annex 3 Financial Reports - DG EPSC
Report printed on 21/01/2016

TABLE 7 : SITUATION ON REVENUE AND INCOME IN 2015
Revenue and income recognized Revenue and income cashed from Outstanding
Chapter Current year RO Carried over RO Total Current Year RO Carried over RO Total balance
1 2 3=1+2 4 5 6=4+5 7=3-6
Total DG
Note : The figures are those related to the provisionalaccounts and not yet audited by the Court of Auditors
Annex 3 Financial Reports - DG EPSCReport printed on 21/01/2016
EXPENSES BUDGET Error Irregularity OLAF Notified Total undue paymentsrecovered
Total transactions inrecovery context
(incl. non-qualified)% Qualified/Total RC
Nbr Amount Nbr Amount Nbr Amount Nbr Amount Nbr Amount Nbr AmountINCOME LINES ININVOICESNON ELIGIBLE INCOST CLAIMS
CREDIT NOTES 2 495.80
Sub-Total 2 495.8
GRAND TOTAL 2 495.8
TABLE 8 : RECOVERY OF PAYMENTS(Number of Recovery Contexts and corresponding Transaction Amount)
INCOME BUDGETRECOVERY
ORDERS ISSUEDIN 2015
Total undue paymentsrecovered
Total transactions inrecovery context
(incl. non-qualified)% Qualified/Total RC
Year of Origin(commitment) Nbr RO Amount Nbr RO Amount Nbr RO Amount
Sub-Total
Annex 3 Financial Reports - DG EPSCReport printed on 21/01/2016
Note : The figures are those related to the provisional accounts and not yet auditedby the Court of Auditors. The provisional closure will be based on the recoverycontext situation at 31/01/2016.

TABLE 9: AGEING BALANCE OF RECOVERY ORDERS AT 31/12/2015 FOR EPSC
Number at01/01/2015
Number at31/12/2015 Evolution
Open Amount(Eur) at
01/01/2015
Open Amount(Eur) at
31/12/2015Evolution
Note : The figures are those related to the provisionalaccounts and not yet audited by the Court of Auditors
Annex 3 Financial Reports - DG EPSCReport printed on 21/01/2016

TABLE 10 : RECOVERY ORDER WAIVERS IN 2015 >= EUR 100.000
WaiverCentral Key
Linked ROCentral Key
ROAcceptedAmount
(Eur)
LE Account Group CommissionDecision Comments
Total DG
Number of RO waivers
Justifications:Please enter the text directly (no copy/paste of formatted text which would then disappear whensaving the document in pdf), use "ctrl+enter" to go to the next line and "enter" to validate your typing.
Note : The figures are those related to the provisionalaccounts and not yet audited by the Court of Auditors
Annex 3 Financial Reports - DG EPSCReport printed on 21/01/2016
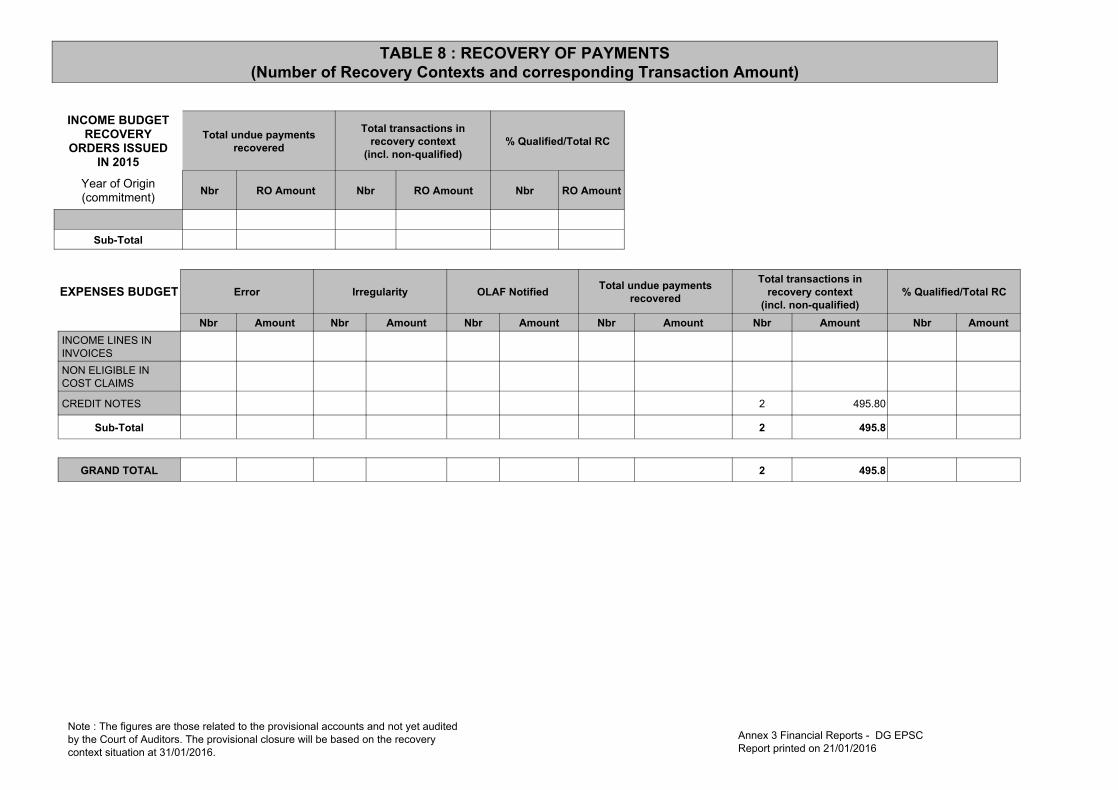
TABLE 11 : CENSUS OF NEGOTIATED PROCEDURES - DG EPSC - 2015
Negotiated ProcedureLegal base Number of Procedures Amount (€)
Total
No data to be reported
Annex 3 Financial Reports - DG EPSCReport printed on 21/01/2016

TABLE 12 : SUMMARY OF PROCEDURES OF DG EPSC EXCLUDING BUILDING CONTRACTS
Additional comments
Internal Procedures > € 60,000
Procedure Type Count Amount (€)Internal
Procedures >
€60,000
Call for expressions of interest - Pre-selection of candidates (Art.136.1(a) RAP) 1 60,668.00
TOTAL 1 60,668.00
Annex 3 Financial Reports - DG EPSCReport printed on 21/01/2016

No data to be reported
TABLE 13 : BUILDING CONTRACTS
Total number of contracts :
Total amount :
Legal base ContractNumber Contractor Name Description Amount (€)
Annex 3 Financial Reports - DG EPSCReport printed on 21/01/2016

Total amount :
Total Number of Contracts :
TABLE 14 : CONTRACTS DECLARED SECRET
Legal base ContractNumber Contractor Name Type of
contract Description Amount (€)
No data to be reported
Annex 3 Financial Reports - DG EPSCReport printed on 21/01/2016

ANNEX 5: Internal Control Template(s) for budget implementation (ICTs)
Procurement direct management
The DG EPSC is managing a small budget falling under heading 5 "Administrative expenditure": the procurement procedures are in general low value contracts (negotiated procedures under the threshold of 15.000 euro), mainly for the organisation of conferences, visitors' programme. The DG EPSC is mainly using existing framework contracts for its regular activities.
Stage 1: Procurement
A- Needs analysis and planning
Main control objectives: Effectiveness, efficiency and economy
Main risks It may happen (again) that… Mitigating controls How to determine coverage,
frequency and depth How to estimate the costs and benefits of controls Control indicators
The precise procurement needs are not always clearly defined due to the absence of work programme and the flexibility of DG EPSC reporting directly to the President and operating under his authority.
Decisions to procure are taken during management meetings with the Cabinet Hierarchical validation for all procurement procedures launched accompanied by a note to AO(s)D on justification and validation by AO(s)D
Coverage/Frequency: 100 %
Cost: FTEs linked to Management and Resource Unit Benefits : non-quantifiable qualitative benefits (reputational damage)
Total cost of controls/all expenditure executed during the year (payments made)
Ref. Ares(2016)1750387 - 13/04/2016

B- Needs assessment & definition of needs
Main control objectives: Effectiveness, efficiency and economy. Compliance (legality and regularity)
Main risks It may happen (again) that… Mitigating controls How to determine coverage,
frequency and depth How to estimate the costs and benefits of controls Control indicators
The needs are not well defined (operationally and/or economically) in the draft tender specifications documents
Standard templates developed for the preparation of tender specifications for use of framework contracts and launch of negotiated procedures. Financial circuit : AOsD approval on specifications Review by Management and Resource Unit of all procedures launched
Coverage/Frequency: 100%
Cost: FTE linked to Management and Resource Unit Benefits : non-quantifiable qualitative benefits (reputational damage)
Total cost of controls/all expenditure executed during the year (payments made)
C- Selection of the offer & evaluation
Main control objectives: Effectiveness, efficiency and economy. Compliance (legality and regularity). Fraud prevention and detection
Main risks It may happen (again) that… Mitigating controls How to determine coverage,
frequency and depth How to estimate the costs and benefits of controls Control indicators
The evaluation process of the submitted offers by the contractor is biased or inaccurate or "unfair"
Documented evaluation by Management and Resource Unit of all offers received
Coverage/Frequency: 100%
Cost: FTE linked to Management and Resource Unit Benefits : non-quantifiable qualitative benefits (reputational damage)
Total cost of controls/all expenditure executed during the year (payments made)

Stage 2: Financial transactions
Main control objectives: Ensuring that the implementation of the contract is in compliance with the signed contract
Main risks It may happen (again) that… Mitigating controls How to determine coverage,
frequency and depth How to estimate the costs and benefits of controls Control indicators
The services delivered by the contractor are not, totally or partially in compliance with the contractual terms and/or the amount to be paid is not correct with the applicable contractual provisions.
Operational and financial steps performed in accordance with the financial circuits (segregation of duties) Ex-ante verification performed centrally by Management and Resource Unit based on detailed check-lists Management of sensitive functions
Coverage/Frequency: 100% of the commitments and payments are controlled Review every 5 years
Costs: FTE linked to actors acting on financial circuit Qualitative and quantitative benefits : Detected error before payment Sound financial management and respect of contractual provisions and deterrent effect
Total cost of controls/all expenditure executed during the year (payments made) Efficiency time to payment Late interest payment

Stage 3: Supervisory measures
Main control objectives: Ensuring that any weakness in the procedures (tender and financial transactions) is detected and corrected
Main risks It may happen (again) that… Mitigating controls How to determine coverage,
frequency and depth How to estimate the costs and benefits of controls Control indicators
An error or non-compliance with regulatory and contractual provisions or a fraud is not prevented and corrected by ex-ante controls, prior to payment or prior to the awarding decision
Review of any events/problem signalled Review of exceptions and non-compliance reports
100 % of the situations signalled At least once a year: evaluation of non-compliance and exceptions reported
Costs: estimation of staff involved Benefits: amount of payments made during the year for which there is reasonable assurance that were made free of material error (quantifiable) Deterrents and systematic weaknesses corrected to improve procedures and to better address related risks (not quantifiable)
Effectiveness: amounts associated with errors detected (related to fraud, irregularities and error) in % over total checked.


 XXX draft ANNEXES 1 to 21 ANNEXES to COMMISSION](https://img.pdfslide.us/doc/110x75/5b02708e7f8b9a84338f9f10/annexes-to-commission-delegated-ec-en-european-commission-brussels-xxx-2014.jpg)


 XXX draft ANNEXES 1 to 2 ANNEXES to the Commission Regulation supplementing Regulation (EC) No 715/2007 of](https://img.pdfslide.us/doc/110x75/5e71bf55db205378d93fe0ef/en-2016-12-13-en-en-european-commission-brussels-xxx-2016-xxx-draft-annexes.jpg)