Embed Size (px)
Citation preview

Annex K
Economic Assessment
Specialist Study
Cost Benefit Analysis
Specialist Study (2015)
Updated Cost Benefit Analysis Specialist Study (2019)
Economic Assessment Specialist Study

I
Batoka Gorge Hydro-Electric Scheme
Environmental and Social Impact Assessment
ECONOMIC ASSESSMENT (Amended – V2.0)
March 2015
September 2019
Anchor Environmental Consultants Report No: AEC/1860/1

I
Batoka Gorge Hydro-Electric Scheme
Environmental and Social Impact Assessment
ECONOMIC ASSESSMENT (Amended – V2.0)
Prepared for Environmental Resources Management (ERM)
The Great Westerford, 240 Main Road, Rondebosch, Cape Town www.erm.com
by
Anchor Environmental Consultants
8 Steenberg House, Silverwood Close, Tokai 7945 www.anchorenvironmental.co.za
Authors:
Gwyneth Letley, Kevin Coldrey & Jane Turpie
Anchor Environmental Consultants
September 2019

II
PREFACE AND ACKNOWLEDGEMENTS This study was conducted as part of the Environmental and Social Impact Assessment (ESIA) for the proposed Batoka Gorge Hydro-Electric Scheme (BGHES) in Zimbabwe and Zambia. The socio-economic assessment formed part of the ESIA being conducted by Environmental Resources Management (ERM). This study was led by Dr Jane Turpie of Anchor Environmental Consultants. The tourism business survey instrument was designed by Jane Turpie. Gwyneth Letley and Kevin Coldrey were responsible for coordinating and arranging the interviews and data collection in Livingstone and Victoria Falls in 2015 and 2019, respectively, and were assisted by Megan Laird and Joshua Weiss. We are grateful to Nadia Mol, Miana Capuano and Dieter Rodewald of ERM for providing stakeholder details and for assisting with providing tourism businesses with interview details during the stakeholder process and to Andrew Thurlow of ERM for providing the relevant GIS maps of the study area. We would like to extend our thanks to the representatives of the tourism industries and the tourism businesses who willingly participated in the interviews and provided valuable information as well as to the other stakeholders who willingly met with Anchor staff and gave further input in private meetings.

III
ACRONYMS AND ABBREVIATIONS
BGHES Batoka Gorge Hydro-Electric Scheme ERM Environmental Resources Management ESIA Environmental and Social Impact Assessment FSL Full Supply Level GDP Gross Domestic Product GVA Gross Value Added JIMP Joint Integrated Management Plan LCCI Livingstone Chamber of Commerce and Industry LTA Livingstone Tourism Association KAZA Kavango-Zambezi ASL Above Sea Level SADC Southern African Development Community TFCA Transfrontier Conservation Area UNESCO United Nations Educational, Scientific and Cultural Organization UNWTO United Nations World Tourism Organisation WTTC World Travel and Tourism Council ZAWA Zambia Wildlife Authority ZIPAR Zambia Institute for Policy Analysis and Research ZNCC Zimbabwe National Chamber of Commerce ZMTA Zambia Ministry of Tourism and Arts ZTA Zimbabwe Tourism Authority

IV
TABLE OF CONTENTS
1 BASELINE ECONOMIC ASSSESSMENT......................................... 1
1.1 INTRODUCTION ..................................................................................................... 1
1.2 STUDY APPROACH ................................................................................................. 1
1.2.1 Collation of existing information ......................................................................... 2
1.2.2 Tourism business survey ....................................................................................... 3
1.2.3 Visitor numbers, activities and expenditure ....................................................... 5
1.2.4 Direct and indirect economic impacts ................................................................. 5
1.2.5 Contribution of Batoka Gorge to tourism value ................................................. 6
1.3 STUDY AREA AND ITS SOCIO-ECONOMIC CONTEXT .............................. 7
1.3.1 Zimbabwe ................................................................................................................ 7
1.3.2 Zambia ................................................................................................................... 10
1.4 TOURISM USE OF THE AFFECTED AREA ...................................................... 13
1.4.1 Activities in Batoka Gorge ................................................................................... 13
1.5 THE TOURISM INDUSTRY WITHIN THE STUDY AREA ........................... 21
1.5.1 Background ........................................................................................................... 21
1.5.2 Victoria Falls/Mosi-oa-Tunya: a UNESCO World Heritage Site ................... 26
1.5.3 Tourism facilities and activities offered in Victoria Falls, Zimbabwe ........... 27
1.5.4 Tourism facilities and activities offered in Livingstone, Zambia ................... 31
1.6 VISITOR NUMBERS, OCCUPANCY & ACTIVITY SALES IN VICTORIA FALLS 38
1.6.1 Visitor numbers .................................................................................................... 38
1.6.2 Occupancy of accommodation establishments ................................................ 39
1.6.3 Estimated demand for tourist activities ............................................................ 40
1.7 VISITOR NUMBERS, OCCUPANCY & ACTIVITY SALES IN LIVINGSTONE ..................................................................................................................... 42
1.7.1 Visitor numbers .................................................................................................... 42
1.7.2 Occupancy of accommodation establishments ................................................ 43
1.7.3 Estimated demand for tourist activities ............................................................ 44
1.8 SUMMARY OF TOTAL VISITOR NUMBERS TO THE STUDY AREA...... 47
1.9 DIRECT AND INDIRECT ECONOMIC IMPACTS ......................................... 47
1.9.1 Visitor expenditure in Victoria Falls and Livingstone..................................... 47
1.9.2 Employment .......................................................................................................... 50
1.9.3 Overall economic impacts ................................................................................... 52
1.9.4 The tourism value of the Batoka Gorge ............................................................. 53

V
1.10 NON-USE VALUE ................................................................................................... 55
2 IMPACT ASSESSMENT ..................................................................... 56
2.1 IMPACT ON WHITE WATER ACTIVITY BUSINESSES ............................... 56
2.2 IMPACT ON OTHER TOURISM ACTIVITY BUSINESSES MAKING USE OF THE GORGE ................................................................................................................... 59
2.3 IMPACT ON TOURIST ACCOMMODATION ESTABLISHMENTS IN THE GORGE .......................................................................................................................... 61
2.4 IMPACT ON LOCAL ECONOMY ....................................................................... 64
2.5 IMPACT ON BROADER SOCIETY ..................................................................... 70
3 CONCLUSIONS AND RECOMMENDATIONS ........................... 72
3.1 Caveat ......................................................................................................................... 72
3.2 Mitigation of impacts .............................................................................................. 72
3.3 Compensation ........................................................................................................... 72
3.4 Monitoring ................................................................................................................ 73
4 REFERENCES ........................................................................................ 74

1
1 BASELINE ECONOMIC ASSSESSMENT
1.1 INTRODUCTION
The Victoria Falls (or Mosi-oa-Tunya Falls) has been called the “world’s greatest sheet of falling water” and was listed as a World Heritage Site in 1989 (UNESCO 2014). The transboundary site extends over 6860 hectares in Zambia and Zimbabwe. The Falls are protected within the Mosi-oa-Tunya National Park in Zambia and the Victoria Falls National Park and Zambezi National Park in Zimbabwe. The Victoria Falls, the eight steep sided gorges below the falls and the river and islands upstream of the falls provide a diversity of habitats for a wide range of flora and fauna. The area offers a range of tourism opportunities that are largely centred on nature-based and adventure activities. Tourism forms the backbone of the economy in this area and was therefore the main focus of this assessment. The proposed Batoka Gorge Hydro-Electric Scheme (BGHES), located downstream of Victoria Falls, will change the Gorge environment significantly and have an impact on tourism in the area. The aim of this study is to estimate the value of tourism to the study area (defined below), to explore the contribution of the Batoka Gorge to this value and to estimate the potential magnitude of the socio-economic impacts of the proposed BGHES. This study begins with a description of the socio-economic context of the project area, including the areas along the Batoka Gorge below the Victoria Falls. An overview of the tourism industry in Livingstone and Victoria Falls is provided with a particular focus on the proposed inundation area and a description about the activities currently offered in this area. The numbers and sizes of tourism activity businesses and accommodation establishments in the study area are identified and detailed information relating to sales, occupancy and employment is described. Businesses most likely to be directly impacted by the proposed BGHES are identified and the possible impacts on these businesses are discussed. The direct and indirect economic contribution of tourism to the study area is then quantified and the tourism value associated with the Batoka Gorge is also estimated. The last section of the report assesses the potential magnitude of negative socio-economic impacts resulting from the proposed BGHES and provides mitigation measures and recommendations. The potential positive economic impacts are also discussed.
1.2 STUDY APPROACH
This study was based on a desktop review of available information, existing statistics collected from relevant organisations and government departments, and information collected from a tourism business survey conducted in Livingstone, Zambia and Victoria Falls, Zimbabwe in February 2015 and July/ August 2019. The survey was repeated in 2019 as the impact assessment was

2
placed on hold following the initial submission of the socio-economic impact study report in 2015. No change was made to the tourism business survey but the dam operating levels have been changed since 2015 and have therefore been updated in the final report. This study focussed on tourism, and in particular on the tourism activities most likely to be affected by the proposed BGHES. The following estimates were required for determining tourism value and potential economic impacts within the study area:
numbers and descriptions of tourism businesses in the study area; total visitor numbers to the study area and bed nights sold; visitor expenditure on accommodation and tourist activities; direct income and employment generated as a result of this expenditure; the knock-on effects of this expenditure.
1.2.1 Collation of existing information
Existing statistics for the study area were obtained as follows: Annual park entry statistics (to view the Victoria Falls) supplied by
tourism and park management authorities in both Zimbabwe and Zambia for the period 2004 – 2018.
Zambezi National Park and Mosi-oa-Tunya National Park total visitor numbers 2012 – 2013 sourced from national tourism statistical reports.
National and global tourism statistics from Zambian Ministry of Tourism and Arts, Zimbabwe Tourism Authority, the United Nations World Tourism Organisation (UNWTO) and the World Travel and Tourism Council (WTTC).
Regional tourism statistics from a survey conducted by Africa Albida Tourism in the study area in 2017.
Airport arrival statistics for Victoria Falls Airport and Harry Mwanga Nkumbula International Airport sourced from the Zimbabwe Tourism Authority and the Zambian Ministry of Tourism and Arts respectively.
Room sales for eight of the main hotels in Victoria Falls 2004 – 2014 provided by the Victoria Falls Hospitality Association.
Inventory of accommodation establishments and tourism activity businesses in the study area provided by the Zimbabwe Tourism Authority (ZTA) and Livingstone Tourism Board, and updated using the internet and interview data.
Very few studies have been carried out on tourism in the study area, and there are no recent studies that have actively estimated the value of tourism in the area. A study conducted in 2012 by Banda & Cheelo from the Zambia Institute for Policy Analysis and Research (ZIPAR) looked at the costs and pricing of tourism in Zambia with a case study on the Livingstone area. The aim of the study was to inform tourism policy and strategy by looking at the cost and price structures of tourism service operations in Livingstone and to compare them with the structures in Victoria Falls town.

3
There are a few studies from 2005/06 that focused on generating tourism data in the area. Suich et al. (2005) investigated the economic impacts of Transfrontier Conservation Areas (TFCA) by undertaking a survey of tourism in the Kavango-Zambezi TFCA. Suich et al. (2005) surveyed 19 accommodation establishments and 18 activity providers in Livingstone and 9 of the large hotel establishments in Victoria Falls, and provided some estimates of revenue, expenditure and employment. In 2006, the Ministry of Tourism, Environment and Natural Resources (Zambia) appointed DCDM Consulting to undertake a tourism survey in Livingstone as part of the Support for Economic Expansion and Diversification Project (SEED). A total of 21 activity operators and 47 accommodation establishments were surveyed. This study did not make any extrapolations on the size, revenue generated or total employment in the tourism industry in Livingstone.
1.2.2 Tourism business survey
A list of tourism businesses active in Livingstone and Victoria Falls was compiled using online resources, stakeholder lists provided by Environmental Resources Management (ERM), site visits and information provided by the Zambian Tourism Board, the Zimbabwe Tourist Authority (ZTA) and the Livingstone Tourism Association (LTA). Stakeholders were invited to book interview slots at Stakeholder Meetings held in Livingstone and Victoria Falls in January 2015, which resulted in several interview bookings. Further interviews were arranged by contacting all of the remaining known tourism businesses in the area by telephone or email. The businesses who volunteered or agreed to be interviewed were emailed the survey instrument ahead of the scheduled interview. A number of tourism businesses, especially accommodation establishments in Victoria Falls, did not respond to the initial emails or calls or would not agree to an interview. Of those that did, two did not turn up on the day for the scheduled interviews. The tourism businesses interviewed in 2015 were contacted again in 2019 and interviews were scheduled with the majority of them, as well as two businesses commencing operations since 2015. A single survey instrument was designed for accommodation establishments and tourism activity providers. Information about the type of accommodation, types of activities offered, types of clientele, seasonality, occupancy, the factors influencing tourism demand, activity sales and employment and expenditure by these businesses were all included in the questionnaire (Box 1).

4
Box 1. Structure of the tourism business questionnaire for accommodation establishments and activity providers.
Section 1: Description of business & occupancy/sales patterns
Type of establishment Services/activities offered Capacity Rates Seasonal patterns in occupancy & sales Seasonal attractions Occupancy/sales data (over time,
seasonal, current annual) Extent of business Length of stay
Section 2: Description of the Clientele
Origins Activities Proportion undertaking affected
activities Reasons for visiting
Section 3: Business Impact on the Economy
Staff numbers (by type & season)
Wages Relationship between business
turnover and employment Expenditures (by type) Location of spend
Section 4: Longer Trends
Age of business Planned changes to business Fluctuations in business and
reasons for this Impacts of proposed dam on
business
In total 15 interviews were conducted in each of Victoria Falls and Livingstone in 2015 and 80% of these were re-interviewed in 2019. The total number of each type of business interviewed is shown in Table 1. Although no independent restaurants or retail shops were interviewed directly, many of the accommodation establishments as well as the tourist activity providers owned restaurants and shops as part of their businesses, and information was provided on these in those interviews. The interviews were carried out face-to-face as far as possible but two respondents who could not make an interview submitted their responses via email. These were followed up with a telephonic interview for clarification of responses. Meetings were also held with the Zimbabwe National Chamber of Commerce (ZNCC) Victoria Falls branch, the Livingstone Chamber of Commerce and Industry (LCCI), the Zambia Tourism Board, The Rafting Association of Zimbabwe and the Zimbabwe Tourism Authority whilst in the study area.
Table 1. Numbers of different types of businesses interviewed
Type of business interviewed
Number in Livingstone
(2015)
Number in Livingstone
(2019)
Number in Victoria
Falls (2015)
Number in Victoria
Falls (2019)
Accommodation establishments
10 6 4 4
Activity providers 2 3 7 6
Accommodation & activity provider
2 2 3 2
Local online tourism media provider
1 1 1

5
It should be noted that many of the businesses in Zimbabwe in the 2015 round of interviews were reluctant to provide details or confidential information relating to their business which made the interview process relatively challenging as well as influencing the amount of data collected. However, we were able to obtain data on rates and bed occupancy for eight of the main hotels from the Victoria Falls Hospitality Association to supplement the interview data collected and in 2019 the interview data was supplemented with a tourism study in the area by Africa Albida Tourism (2017).
1.2.3 Visitor numbers, activities and expenditure
Total annual visitor numbers into the study area were estimated from numerous sources, including park gate statistics, occupancy numbers, and average recorded length of stays and compared to the available regional or provincial statistics provided by Zimbabwe Tourism Authority (ZTA) and the Zambian Ministry of Tourism and Arts (ZMTA), as well as the tourism survey in the Victoria Falls region by Africa Albida Tourism (2017). Total expenditure by visitors in the study area was estimated as the daily spend multiplied by number of visitor days in the area. The daily spend was separated into accommodation, activities and other expenses. Other expenses included food, beverage and retail (e.g. on curios). Expenditure on accommodation was calculated by using data gathered during the business interviews as well as information from previous tourism studies. The recorded accommodation prices for both the high and low season as indicated in the accommodation questionnaire and on advertised online rates were used to calculate an average room rate. Average rates were then multiplied by the total number of bed nights. Expenditure on activities was calculated by estimating the number of companies offering different activities and using information on sales to derive an estimate of overall expenditure.
1.2.4 Direct and indirect economic impacts
Tourism value in the study area was described in terms of its direct and indirect impacts on economic output. The direct impacts are the overall expenditure of tourists and number of jobs created directly by businesses supplying the goods and services that are being purchased by the tourists. The indirect impacts estimate the knock-on effects of expenditure created by businesses supplying tourism goods and services on other businesses that supply goods and services to them. For example, activity providers and tour operators requiring boat maintenance provide business to boat engineers and mechanics who maintain and repair their boats.
Direct impact is identified as the money spent by tourists in the study area on activities and attraction services (all tourist activities, park entrance fees) and accommodation.
Direct economic effects are the changes in local tourism activity (i.e. increased or decreased bed nights, increased or decreased activity sales).

6
Increased/decreased visitor spend has a direct impact on monetary gains/losses for individuals (employees and business owners within the trade, catering and accommodation sector) within the study area.
For affected businesses there may be losses in terms of tourism product quality and availability, due to changes in how and when activities are able to operate.
For affected locals, impacts may include job loss and a decrease in the availability and variety of job opportunities in the area and related decreases in disposable income. Or benefits may include job creation through new activities developed in the project area.
All of these effects can ultimately lead to growth or decline of business sales and income in the affected study area.
The indirect effects of economic activity in the tourism sector are experienced as the backward and forward linkages along the value chain (Table 2).
Table 2. Examples of backward and forward linkages in the tourism sector
Subsector Linkages
All Tourism Products Travel agents, tourism activity businesses Roads, airports, rail, immigration Human resources and skills training Banking and finance, health services, legal services, health and safety Customs
Accommodation Construction industry, plumbers, electricians in order to build extensions or maintain facilities Utilities such as water and electricity Retail – such as homeware needed to stock accommodation facility
Boat based activity providers
Boat repair and maintenance Natural resource management such as National Park permits and fees
Safari tour operators Automotive industry for safari vehicle supply and maintenance Natural resource management such as National Park permits and fees
The indirect impacts of economic activity were estimated using multipliers derived from data presented in the WTTC National Reports (2014a, 2018a, 2014b, 2018b) for Zimbabwe and Zambia. The multiplier used for Victoria Falls was 0.85 in 2014 and 0.89 in 2018, while for Livingstone it was 0.91 in 2014 and 0.85 in 2018.
1.2.5 Contribution of Batoka Gorge to tourism value
The contribution of the Batoka Gorge to the economic value of tourism in the study area was estimated on the basis of visitor activity sales reported in the surveys and the business owners’ perceptions of visitor interests as well as
7
information collected from safari lodges located along the edge of the gorge. The following activities were considered:
White water rafting Guided birding and angling, hiking and camping trips Jet Extreme boating Helicopter and microlight flights
Helicopter and microlight flights were also considered because they fly above and over the gorges and from interviews it was determined that these views contribute significantly to the overall enjoyment experienced by tourists whilst flying over the area. Many of the elderly tourists who are unable to hike into the gorge or white water raft down the gorge rely on the scenic flights for this experience.
1.3 STUDY AREA AND ITS SOCIO-ECONOMIC CONTEXT
This description is based on a desktop review of available information collated from previous studies done in the area and statistics gathered from relevant government publications. For more detailed information about the social description of the study area see Section 9 of the ESIA. The study area includes the towns of Livingstone and Victoria Falls, the areas surrounding both these towns and the areas both sides of the Batoka Gorge.
1.3.1 Zimbabwe
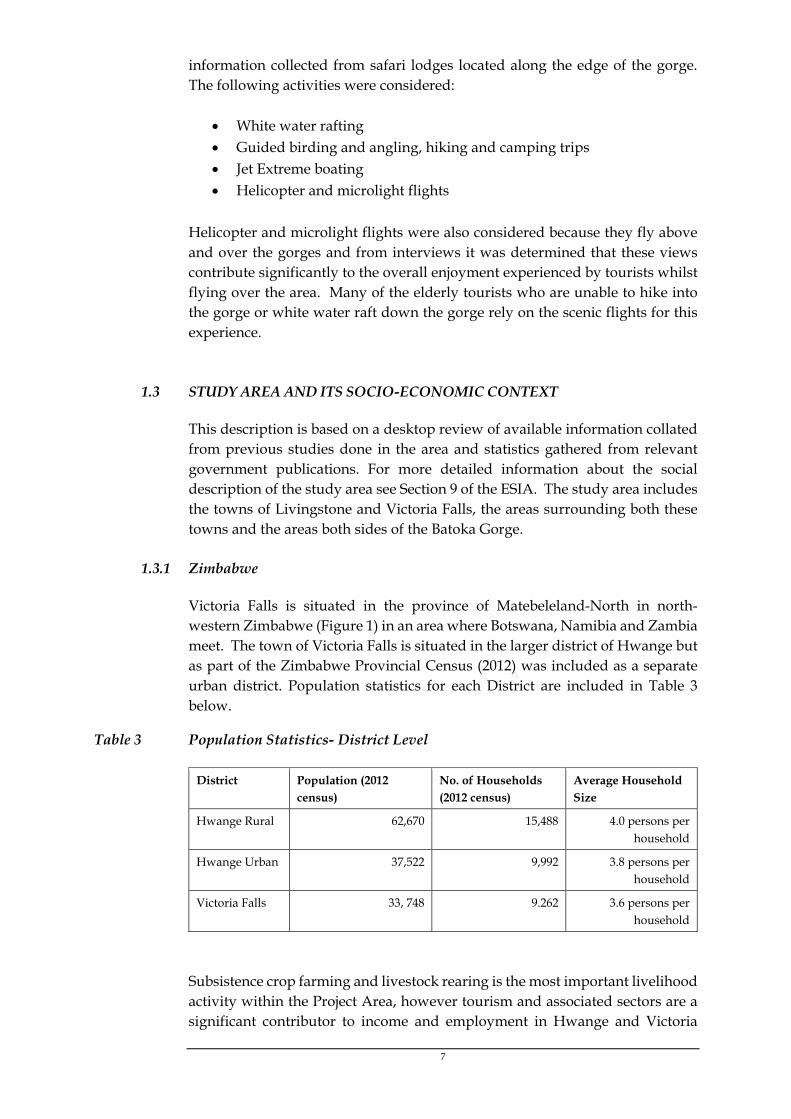
Victoria Falls is situated in the province of Matebeleland-North in north-western Zimbabwe (Figure 1) in an area where Botswana, Namibia and Zambia meet. The town of Victoria Falls is situated in the larger district of Hwange but as part of the Zimbabwe Provincial Census (2012) was included as a separate urban district. Population statistics for each District are included in Table 3 below.
Table 3 Population Statistics- District Level
District Population (2012 census)
No. of Households (2012 census)
Average Household Size
Hwange Rural 62,670 15,488 4.0 persons per household
Hwange Urban 37,522 9,992 3.8 persons per household
Victoria Falls 33, 748 9.262 3.6 persons per household
Subsistence crop farming and livestock rearing is the most important livelihood activity within the Project Area, however tourism and associated sectors are a significant contributor to income and employment in Hwange and Victoria

8
Falls. The large hotels and safari lodges employ a significant number of local people, as do the restaurants and activity providers. Associated sectors such as transport, manufacturing and mechanics also contribute towards employment in the district. The largest contributor to employment in the province is agriculture accounting for 55% but in Victoria Falls district agriculture accounts for only 1.5% of employment (Zimbabwe Census 2012). Outside of the small urban district of Victoria Falls, the entire population downstream of the Falls along the Batoka Gorge are considered rural (Zimstats 2012). Almost 50% of the district population are employed in agriculture and 8.4% are employed in services (Zimbabwe Census 2012). During periods of poor rainfall the villages situated along the Batoka Gorge rely on tourism to supplement their income, through part time or casual work with activity providers (e.g. rafting guides and porters). The local villages also benefit from tourism in the area through concession fees and royalties. Other important social characteristics in the Project Area include:
The most commonly spoken language in the Project Area are Ndebele, Shona and Tonga.
The majority of people in the Project Area are Christian. Communal land is held under the custodianship of the state and is
managed under both local and decentralised government arrangements, as well as traditional leadership of Chiefs, Headmen and Village Heads;
Crops and gardening, animal husbandry and curio trade serve as primary livelihood activities. Other activities included fishing and brick making.
The main source of water is boreholes and rivers, and most villages did not have access to National grid electricity;
Health, education and service infrastructure is average to poor and there is a shortage of secondary schools.

10
Average literacy rates are 92% and the unemployment rate is approximately 30% (Zimbabwe Census 2012). Almost 50% of the district population are employed in agriculture and 8.4% are employed in services (Zimbabwe Census 2012). Approximately 31% of the district population are communal farmers. During periods of poor rainfall the villages situated along the Batoka Gorge rely on tourism to supplement their income, through part time or casual work with activity providers (e.g. rafting guides and porters). The local villages also benefit from tourism in the area through concession fees and royalties.
1.3.2 Zambia
Livingstone is located 12 km from the Mosi-oa-Tunya Falls in the Southern Province of Zambia (Figure 2) and was, until 2011, the provincial capital. Livingstone has a population of approximately 185,003 people as per the 2019 Projections from the Central Statistical Office Zambia (2018). The annual population growth rate in Livingstone is 3.2 and the average household size is 5 people, slightly higher than the provincial average (Zambia Census 2010). Unemployment is high in Zambia (estimated at 12.5% in 2018), particularly amongst youth, defined as those aged between 15 to 25 years (22.9%). Unemployment rates in the Southern Province are slightly below the National average at 7.5% (ZamStats, 2018). The majority of employment is within the informal sector, which is characterised by low pay and poor working conditions. Economic activity has been traditionally dominated by small-scale subsistence agriculture, which provides employment to just under two thirds of the population (ZamStats, 2018). Across the Project Area, livestock rearing is the most popular livelihood activity. The majority of Livestock are largely reared for income purposes, unlike crops, which are largely generated for subsistence. The most commonly owned livestock include poultry, goats, cattle, pigs and donkeys. Cattle and donkeys were observed to be primarily used for ploughing and ox cart transport purposes. Livestock are also an important form of bartering and are used for a number of payments, ranging from dowries to traditional healer consultations. Livestock are also central to sacrifices in rituals. Similarly to Zimbabwe, the villages located along the Batoka Gorge rely on tourism during times of low rainfall and failed crops. Part time and casual work helps to supplement household income when crops fail. Although undertaken all year round, charcoal production was described as a particularly important drought time livelihood activity for 2018/19 and was undertaken to substitute normal livelihood activities hampered by drier conditions (crop farming and fishing most notably). The Zambezi and other tributaries located downstream from the proposed BGHES are used by villagers from Mulola, Madyongo, Sikatali, Simanyonge, Posani, Siampondo and the Ng’andu cluster for fishing. Fishing is done by men only and is undertaken at fishing camps along the Zambezi River and other rivers in the Project area where men stay between a few days and a week. These

11
camps are located up to 15 km from the valley village cluster and beyond depending on the time of the year. The valley and Ng’andu village clusters said that fishermen came in season from as far as the DRC to make use of fishing camps in the Project area. Fishermen reportedly catch a wide variety of species including bottle fish, tiger fish and Kariba bream. Fishing is undertaken in both the rainy and dry season however, the catch is reported to be larger in the rainy season (between December to March), Fish are caught using both traditionally woven nets and baited fishing lines. Once caught, fish is commonly processed to preserve it, either through drying, frying or smoking.

13
1.4 TOURISM USE OF THE AFFECTED AREA
The Batoka Gorge is a unique environment characterised by sheer cliffs and endemic flora and fauna. The steep cliffs and rapids of the Zambezi River below provide a rare setting for a number of activities. The proposed BGHES will inundate a large proportion of the gorge below Victoria Falls, having an impact on the tourist activities that are currently offered in the gorge. It is envisioned that the dam will operate at the full supply level of 757 m during the high-water season (Figure 3; generally from January/ February to July/ August) and at 730 m during the dry, low-water season (Figure 4; generally from July/ August to December/ January). The potential magnitude of these impacts are discussed in detail in the Impact Assessment Section (2) of this report. This section provides a description of the activities currently offered in the gorge.
1.4.1 Activities in Batoka Gorge
A number of tourist activities take place in the Batoka Gorge downstream of Victoria Falls. The scale of the gorge is an attraction in itself and the activities that take place appeal to both the adventure- and nature-based tourist. White water rafting
White-water rafting has been a popular tourist activity below the Victoria Falls for more than 35 years. It is considered to be one of the best white water rafting experiences in the world because of the number of high grade rapids in succession over such a short stretch of river. The rafting industry in Victoria Falls and Livingstone has played a vital role in establishing adventure tourism in the area (Rogerson 2004) and was one of the first activities offered to tourists. Many tourists from other rafting nations such as Canada, United States of America (USA) and New Zealand come especially to raft down this stretch of river. Rafting numbers were at their highest back in the 1990s when more than 50 000 rafting trips were sold each year. Numbers since then have decreased to approximately 20 000 trips a year (the average over the past five years). There are a number of reasons for the decrease in numbers. Firstly, the type of tourist has changed significantly due to the international economic climate. In the 1990s a significant proportion of tourists were young travellers and gap-year students keen on adventure and new experiences. Over the years as travel became more and more expensive, the type of tourist changed and became dominated by older, wealthier travellers and young professionals. This change had an impact on the number of tourists coming to the area solely to raft. Secondly, over the last decade the number of activities available to tourists in the study area has significantly increased. This created competition within the adventure tourism market and resulted in tourists choosing other activities on offer. Rafting is one of the most expensive activities in the area and for a number of tourists cheaper activities that can still offer some form of adventure are chosen above rafting. Although rafting tourist numbers have fallen since the

14
1990s, rafting still plays a major role in attracting tourists to the area. All of the rafting companies interviewed indicated that rafting attracts a large proportion of clientele.
The Zambezi River is classified as a high-volume, pool-drop river, meaning there is little exposed rock in the rapids themselves or in the pools of water that lie below the rapids. At the starting point for rafting, the gorge is approximately 400 feet (122 m) deep. Over the 25 kilometres covered during a day of rafting the river drops approximately 400 feet (122 m) so that at the end point the gorge is 750 feet (229 m) deep. The first section of rafting (rapids 1 to 8) is classified as “Grade 5” rapids characterised by steep gradients, big drops and pressure areas (Figure 5). The rapids decrease in size and difficulty as one moves further down the river. Rafting is not constant throughout the year and is dependent on annual flow conditions which are dependent on the timing and quantity of catchment rainfall. The following is a summary of how the flow conditions influence rafting on the Zambezi:
Rafting is able to run from rapid 1 when the water levels are at their
lowest from August to early January. For the first half of January and the second half of July rafting can run
from rapid 8 when flows are intermediate. From late January to the end of February and for the first half of July
rafting runs from rapid 10. During March and June rafting runs from rapid 14 when flows are high,
often called the “splash and dash” run. Usually during April and May, when flows are at their absolute highest,
no rafting takes place.
Therefore, flow conditions play a major role in the operating of rafting on the Zambezi. These conditions change annually with some years having higher than average flows compared to other years dominated by low flows. The rafting trips offered are either a half-day, full-day, full day plus overnight or a 2 - 5 day trip throughout the main low water season from August to December. Between 2007 and 2018, the average low-water season lasted 136 days (4.5 months), the closed season lasted 55 days (2 months) and the high-water season lasted 174 days (5.5 months) (pers. comm. Representatives of The Rafting Association of Zimbabwe, 2019). The half day trip during low water is offered on both the Zambian and Zimbabwean sides and involves rafting from rapid 1 – 10/11. From the Zimbabwean side the low water full day trip goes from rapid 1 to rapid 19 and during high water from rapid 11 to rapid 23. From the Zambian side the low water full day trip goes from rapid 1 to 24/25 and during high water from rapid 10 – 24/25 (Figure 5). Both sides offer overnight camping in the gorge and 2 – 5 day rafting trips which end just above the start of Lake Kariba.

15
In 2015 there were a total of 11 rafting companies that operated on the Zambezi and in 2019 there were 10. Many more licenses have however been awarded on both the Zimbabwe and Zambian sides. These range in size from small operators that only offer rafting, take fewer than 100 trips a year in hired boats, to the larger activity providers that offer a wide range of activities within the study area and sell more than 3000 rafting trips per year and own their own boats and equipment. Most of these companies started out only offering rafting but have diversified over the years in order to remain competitive in the changing tourism market within the study area.

19
The rafting industry employs approximately 250 staff as river guides, porters, drivers and assistants. A large proportion of them are either part time or casual staff. This number also includes staff employed through other companies that are directly associated with rafting, such as media sales companies that film the daily rafting trips and take photographs. After each rafting trip, the rafters can watch the footage of their trip down the river and can purchase the DVD and photographs. Almost 100% of staff are from the local communities in the study area. Many of the rafting guides have been involved in the industry since it started and have over the years developed further into managerial and operational roles within the rafting companies. The villages along the gorge are well connected to the rafting industry and rely on the industry for employment opportunities. For example, local villagers who rely on agricultural crops for food and income are able to seek employment in the rafting industry when crops fail due to poor rains. These villagers are able to find casual or part time work as porters to supplement their income during times of hardship. This was emphasised during a conversation with one of the long-standing rafting guides in Livingstone. Through this the rafting companies have formed good relationships with local communities and have worked with them through social and environmental development projects to improve community infrastructure and development. These projects include funding for schools and clinics, health-care and sanitation initiatives and scholarship programs within the community. Suich et al. (2005) reported in their study that 63% of tour operator and activity provider businesses made both financial and non-financial contributions to local communities. All of the rafting companies interviewed were of the opinion that impacts to the rafting industry would have knock-on effects throughout the tourism sector as well as impact communities within the study area. They also emphasised the significance of the Batoka Gorge as being one of the last remaining untouched wilderness sites with important environmental and natural heritage characteristics and that the loss of this site would be damaging to tourism in the region. Other Gorge activities
Other activities in the gorge include birding, angling, hiking and, up until very recently, Jet Extreme Boating. Jet Extreme Boating is no longer offered on the Zambian side as declining tourist numbers have made it unfeasible. There is however an operator on the Zimbabwean side that operates at the base of the falls. Although these activities employ fewer people than the rafting industry, they are nonetheless very popular activities amongst nature- and adventure-based tourists that are visiting the area specifically for a high-quality birding, angling or hiking experience and contribute to direct tourism expenditure. Birding in the area is popular and birders travel considerable distances in order to see a number of endemic and rare raptors found in the Batoka Gorge. These include the Taita Falcon, Peregrine Falcon, Verreaux’s (Black) Eagle and the

20
Augur Buzzard. A further 363 bird species have been recorded in or near to the Gorge over the past 12 years (D. Tiran, pers. comm.). Many birding day trips are taken from Victoria Falls to Gorges Lodge on the Zimbabwean side or from Taita Falcon Lodge on the Zambian side. Both these lodges have excellent strategic points for viewing the raptors and the dramatic gorge scenery. Approximately 30% of the guests that come to stay at these lodges are birders and it is estimated that birding tourists amount to around 800 – 1000 visitors per year. A very unique ecosystem exists within the Batoka Gorge. This interconnected food web is important for the birdlife in the gorge and any disruption along the food chain could have knock-on effects throughout the ecosystem. The well-aerated river waters flowing over the rocks are home to an abundance of aquatic insect larvae and nymphs. These transform into an abundance of aerial insects that form the main food source for insectivorous bats and birds, and making the gorge an ideal breeding habitat for African Black Swift and Rock Pratincole. In early April an annual bat migration takes place where the Egyptian Free Tailed Bat feeds entirely on the airborne insect life from the river. These swifts, pratincoles and bats are in turn important prey items for the raptors. The loss of river borne insect life would have a cascade effect along the food chain, impacting on bat and bird numbers in the gorge and ultimately birding tourism in the area. The possible magnitude of these impacts is discussed in in Section 2. Angling is a popular tourist activity both upstream and downstream of the Victoria Falls. However, the angling experience upstream of the Falls is very different to angling experience downstream in the Batoka Gorge. This activity involves hiking and sometimes camping in the Gorge in order to find the most productive fishing spots. Although most of the angling trips sold are upstream of the Falls, it is estimated that approximately 20% of the total angling trips sold are downstream of the Falls. Hiking in the Batoka Gorge is often done in combination with another activity, such as birding, angling or local village tours. Hikers are attracted to the Gorge as it offers steep climbs and extensive scenic views of the river, rapids and sheer cliffs. Hiking is the best way to experience the vastness of the Gorge. Taita Falcon Lodge on the edge of the Gorge offers a range of hiking and walking trips. The lodge also receives regular international and regional school groups who come to do 1-3 day hiking excursions into the Gorge. Hiking activities are usually a half day or full day trip but multi-day hiking trips can be organised from Victoria Falls and Livingstone. Jet Extreme Boating was an activity run from the Zambian side of the Falls up until 2018 when it became unfeasible to operate owing to declining tourist numbers. Jet Extreme Boats are powerful speed boats that can reach speeds of 100 km an hour as they fly over the water between rapids 23 and 27. The boats are custom-built 22-seaters with super twin engines. A cable car transports guests into the gorge and back out again to avoid the steep 220 metre hike,

21
allowing guests of all ages to enjoy the activity. During high water levels, when rafting is not available, Jet Extreme provided an alternative adventure activity to tourists wanting to experience the Batoka Gorge.
1.5 THE TOURISM INDUSTRY WITHIN THE STUDY AREA
1.5.1 Background
Victoria Falls, Zimbabwe
The Victoria Falls settlement was founded in 1901 and expanded further when the railway from Bulawayo extended to the town crossed into Zambia when the Victoria Falls Bridge was constructed in 1905. The town has always been the main gateway to viewing the world-renowned Victoria Falls. The tourism industry in Zimbabwe has gone through a number of significant changes over the last few decades. During the period 1980 – 2000 tourism was amongst the fastest-growing sectors in the country, contributing significantly to GDP (Karambakuwa et al. 2011) and providing high quality reliable tourism products. However, political instability starting in 2001/02 and the global recession in 2008 saw tourism in Zimbabwe decrease substantially over this period, with travel bans and negative international media coverage impacting heavily on the tourism sector (Karambakuwa et al. 2011). International arrivals started to recover in 2010 but then pre-election violence and instability in 2012 resulted in a 25% reduction in total tourist arrivals. Numbers have started recovering again, and a total of 2,579,974 international arrivals were recorded in Zimbabwe in 2018 (Figure 6). The direct contribution of travel and tourism to GDP in 2017 was USD 512.3 million, 3% of total GDP in Zimbabwe (WTTC 2018a). This was forecast to rise by a further 3.5% in 2018 (WTTC 2018a). Tourism is the main industry in Victoria Falls and contributes significantly to the local economy. The town has been the main gateway for exploring the area and a wide range of activities both above and below the Falls have been available to tourists for a number of decades. Impacts on the tourism industry are felt heavily in the town and during interviews businesses explained that the last decade had been a challenge for them. A large number of tourists wanting to view Victoria Falls and participate in activities in the area started to fly directly into Livingstone and for the most part avoided Zimbabwe altogether during the unstable periods. This impacted heavily on Victoria Falls’ local tourism market and only over the last five years have tourist numbers to Victoria Falls started to increase again to promising levels. Interviews and informal conversations with locals revealed that a number of smaller businesses were forced to close down during this time and other smaller businesses explained that they closed over the quieter periods and went and worked overseas to supplement their income. Larger businesses were able to adapt by offering specials and discounted prices to attract local and regional tourists. However, there has now been a shift in sentiment where tourists are choosing the Zimbabwean side over the Zambian side as activities are cheaper and the

22
new Kaza Uni-Visa allows tourists to visit both countries without paying double visa fees. It was noted by several interviewees that tourists are flying in to Livingstone (Harry Mwanga Nkumbula International Airport), for which flights are cheaper than in to Victoria Falls, and boarding busses at the airport which are headed straight to the Zimbabwean side.
Figure 6. Annual international arrivals to Zimbabwe from 1999 – 2018, and the year on year percentage change in growth (Source: Zimbabwe Tourism Authority).
Tourist arrival statistics from the Victoria Falls International Airport have shown increased arrivals over the period 2014 - 2018 (Figure 7).
‐30
‐20
‐10
0
10
20
30
40
50
60
0
500000
1000000
1500000
2000000
2500000
3000000
1999
2000
2001
2002
2003
2004
2005
2006
2007
2008
2009
2010
2011
2012
2013
2014
2015
2016
2017
2018
% chan
ge
International arrivals
%change Arrivals

23
Figure 7. Total tourist arrivals to Victoria Falls International Airport from 2014 - 2018 and the year on year percentage change in growth.
Many of the businesses interviewed indicated that although visitor numbers were not close to those of the 1990s, they believed that international tourist numbers had increased over the past five years in Victoria Falls, as evidenced by improved average hotel occupancy levels at 58% in 2018 (Table 4).
Table 4. Trends in national and Victoria Falls hotel occupancy data (Source: ZTA Annual Tourism Trends & Statistics Reports)
Year National Occupancy % change Victoria Falls Occupancy % change 2007 45 34 2008 41 -9 28 -18 2009 46 12 40 43 2010 52 13 46 15 2011 52 0 50 9 2012 52 0 45 -10 2013 48 -8 53 18 2014 48 0 49 -8 2015 47 -2 52 6 2016 46 -2 49 -6 2017 48 4 55 12 2018 53 10 58 5
Livingstone, Zambia
The town of Livingstone was founded in 1905 and became the capital of what was then Northern Rhodesia in 1911. In 1935 the capital was moved to Lusaka and from then and until after independence Livingstone focused on light-industrial and manufacturing trade. The timber and textile trade and the automobile industry were also relatively large and contributed to employment
0
5
10
15
20
25
30
0
20000
40000
60000
80000
100000
120000
140000
2014 2015 2016 2017 2018
% chan
ge
Total tourist arrivals
Total Tourist Arrivals % change

24
in the town. In the late 1970s, after the collapse of the national economy, most of the light-industry and manufacturing businesses closed (McGowen 2007). In the 1990s the economic reforms of the time flooded the economy with cheap imported goods such as textiles and food from the East (McGowen 2007), resulting in the eventual collapse of the local manufacturing and textile sector and the loss of thousands of jobs in Livingstone. It was after this collapse that the government started to focus on the tourism potential associated with the Mosi-oa-Tunya Falls. Through large investments in the hotel industry and in marketing, tourism in Zambia and particularly in Livingstone started to grow (McGowen 2007). In Zambia tourism is now one of the fastest-growing sectors and has been identified by government as a priority growth area for the national economy (Zambian Development Agency 2014). Many believe tourism to potentially be one of Zambia’s best prospects for economic growth and diversification (Banda & Cheelo 2012, Rogerson 2004). The tourism sector is still relatively small but has been growing steadily over the last decade and has huge potential to develop even further (Dixey 2005, Chaunga et al. 2013). The tourism sector has, and still is to an extent, faced with a number of challenges and inhibitors to development (Pope 2005, Chaunga et al. 2013). These include inadequate investment and budgetary allocations, poor management and coordination between the public and private sectors, lack of research, data and inadequate statistical collection databases, lack of infrastructure and high destination costs when compared to other countries in the region (Pope 2005, Chaunga et al. 2013). Regional political instability, the international recession and health concerns such as the 2014 Ebola outbreak in West Africa have all impacted Zambian tourism. The world-wide recession saw visitor numbers drop drastically in 2008/09 (Figure 8) but since 2009 numbers have slowly increased. In 2017 a total of 1,083,000 international arrivals were recorded in Zambia. The direct contribution of travel and tourism to GDP in 2017 was USD 777.6 million, 3.2% of total GDP in Zambia and was forecast to rise by a further 6.5% in 2018 (WTTC 2018b).

25
Figure 8. Annual international arrivals to Zambia from 1998 – 2017, and the year on year percentage change in growth (Source: Zambian Ministry of Tourism & Arts)
Livingstone is considered the tourism capital of Zambia (Rogerson 2004). The town and surrounding communities rely extensively on the tourism industry, and similarly to the town of Victoria Falls, any impacts on tourism are felt heavily. Although Livingstone has benefited from the political instability in Zimbabwe, interviews with tourism businesses indicated that numbers are now declining and that occupancy is falling as Zimbabwe becomes more attractive. Tourist arrival statistics for Harry Mwanga Nkumbula International Airport (in Livingstone) indicate that arrival numbers have been declining steadily since 2013, apart from a sharp rise in 2018 (Figure 8). Interviews with tourism businesses indicated that, because flights into Harry Mwanga Nkumbula International Airport are relatively less expensive than flights into Victoria Falls, Livingstone is still a popular in-flight destination. However, foreign tourists are seen boarding busses at the airport en-route to Zimbabwe where accommodation and activities are relatively cheaper. The UNI VISA system has made this affordable as tourists are no longer required to pay for two separate visas on arrival at either entry point.
‐15
‐10
‐5
0
5
10
15
20
25
30
35
0
200000
400000
600000
800000
1000000
1200000
1998
1999
2000
2001
2002
2003
2004
2005
2006
2007
2008
2009
2010
2011
2012
2013
2014
2015
2016
2017
% chan
ge
International arrivals
%change Arrivals

26
Figure 9. Total tourist arrivals to Harry Mwanga Nkumbula International Airport from 2007 - 2018 and the year on year percentage change in growth.
1.5.2 Victoria Falls/Mosi-oa-Tunya: a UNESCO World Heritage Site
The Victoria Falls/Mosi-oa-Tunya is one of the world’s greatest waterfalls and was listed as a World Heritage Site in 1989 (UNESCO 2014). It is the largest curtain of falling water in the world with up to 500 million litres of water per minute falling over the almost 100 m high steep wall. There are eight steep-sided gorges below the Falls that zigzag for a distance of approximately 150 km (UNESCO 2014). The Falls have a Joint Integrated Management Plan (JIMP) which was approved in 2007 and is implemented within a participatory framework (UNESCO 2014). The property is protected by the Zimbabwe Parks and Wildlife Act and the National Heritage Conservation Act and Zambia Wildlife Act. The management plan addresses transboundary coordination and management in terms of urban, tourism and funding schemes. During surveys and business interviews concerns about the delisting of Victoria Falls as a World Heritage Site were raised. A significant number of businesses believe that the delisting of the Falls would have a disastrous impact on tourism. Apart from the potential negative impact on tourism demand as a result of losing World Heritage Site status, stakeholders were concerned that, without the UNESCO World Heritage Site management and development criteria, Vic Falls could become over-commercialised and lose the ‘wildness’ that attracts many of the tourists. It is important to note here that these concerns need to be addressed and that communication with UNESCO, if not already initiated, should take place.
‐50
‐40
‐30
‐20
‐10
0
10
20
30
40
50
0
10000
20000
30000
40000
50000
60000
70000
80000
90000
100000
2007 2008 2009 2010 2011 2012 2013 2014 2015 2016 2017 2018
% chan
ge
Total p
assenger arrivals
Total Passenger Arrivals % change

27
1.5.3 Tourism facilities and activities offered in Victoria Falls, Zimbabwe
Location and arrangement of facilities
The town, Victoria Falls, is situated approximately 1.25 km away from the world-famous waterfalls and is the main gateway for exploring the area from the Zimbabwean side. The town is small and compact with most amenities and accommodation establishments within walking distance of the centre of town where cafes, restaurants and tourist activity providers are found (Figure 10). The Rainforest Park is situated to one end of town and is the main entrance for visiting the Falls and exploring the natural fauna and flora in the forest along the walkways found within the park. The Zambezi National Park runs along the edge of the Zambezi River upstream of the Falls and downstream to just below Songwe Gorge. A number of attractions and activities are available in and around town. A large proportion of these activities are river-based, such as white-water rafting, river cruises, guided angling and canoe trails. Activity providers and tour operators provide the necessary transport for accessing these and other activities offered outside of town. There is a small tourism office in the centre of town providing maps, information and advice. The Victoria Falls International Airport is located 20 km from the town and the A8 road links Victoria Falls to Bulawayo in the south. The Zambian border is situated across the Victoria Falls Bridge approximately 2.5 km from the town centre and the Kazangula Road links Victoria Falls to Botswana in the west.
29
Accommodation establishments
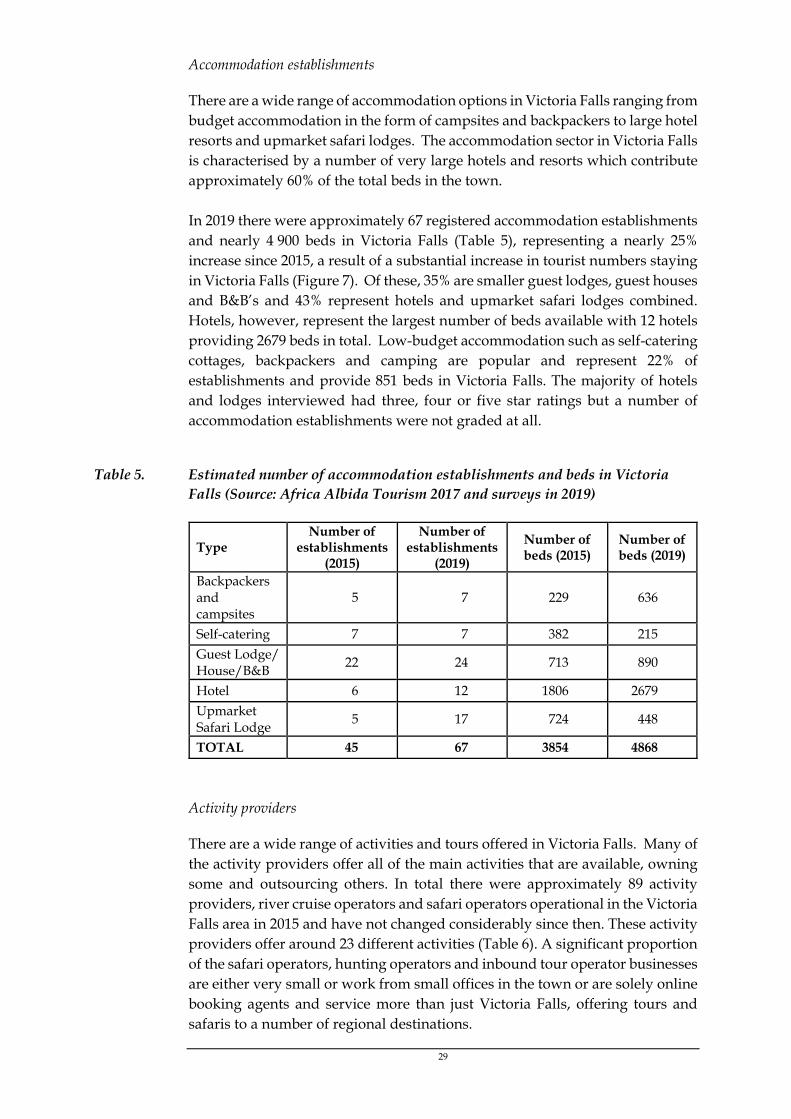
There are a wide range of accommodation options in Victoria Falls ranging from budget accommodation in the form of campsites and backpackers to large hotel resorts and upmarket safari lodges. The accommodation sector in Victoria Falls is characterised by a number of very large hotels and resorts which contribute approximately 60% of the total beds in the town. In 2019 there were approximately 67 registered accommodation establishments and nearly 4 900 beds in Victoria Falls (Table 5), representing a nearly 25% increase since 2015, a result of a substantial increase in tourist numbers staying in Victoria Falls (Figure 7). Of these, 35% are smaller guest lodges, guest houses and B&B’s and 43% represent hotels and upmarket safari lodges combined. Hotels, however, represent the largest number of beds available with 12 hotels providing 2679 beds in total. Low-budget accommodation such as self-catering cottages, backpackers and camping are popular and represent 22% of establishments and provide 851 beds in Victoria Falls. The majority of hotels and lodges interviewed had three, four or five star ratings but a number of accommodation establishments were not graded at all.
Table 5. Estimated number of accommodation establishments and beds in Victoria Falls (Source: Africa Albida Tourism 2017 and surveys in 2019)
Type Number of
establishments (2015)
Number of establishments
(2019)
Number of beds (2015)
Number of beds (2019)
Backpackers and campsites
5 7 229 636
Self-catering 7 7 382 215
Guest Lodge/ House/B&B
22 24 713 890
Hotel 6 12 1806 2679
Upmarket Safari Lodge
5 17 724 448
TOTAL 45 67 3854 4868
Activity providers
There are a wide range of activities and tours offered in Victoria Falls. Many of the activity providers offer all of the main activities that are available, owning some and outsourcing others. In total there were approximately 89 activity providers, river cruise operators and safari operators operational in the Victoria Falls area in 2015 and have not changed considerably since then. These activity providers offer around 23 different activities (Table 6). A significant proportion of the safari operators, hunting operators and inbound tour operator businesses are either very small or work from small offices in the town or are solely online booking agents and service more than just Victoria Falls, offering tours and safaris to a number of regional destinations.

30
Approximately 40% of the activities are provided by multiple-activity providers. These operators range in size and tend to offer all of the activities and tours described in Table 6. Some of these businesses do not own any of the activities and are purely operating as booking agents and tour organisers. Other businesses own some of the activities that they offer and outsource the rest, and certain businesses own all the activities that they offer to tourists. Around 18% of the businesses are single-activity providers, focusing on only one activity or tour that they own and market. Single-activity providers include, for example, helicopter operators, croc – cage diving operators, white-water rafting providers, guided angling safaris, canoe trails and private hiking and walking tours.
Table 6. Approximate number of tour operators and activity providers operating in Victoria Falls in 2015 (Source: ZTA Annual Tourism Trends & Statistics Reports).
Type Number Description River cruise operators
4 These operators solely provide river cruises on the Zambezi River
Safari operators 9 These operators focus solely on providing safari holidays and game drives
Inbound tour operators (incl. travel agencies)
20 Inbound tour operators organise travel, accommodation and activities for inbound tourists
Single activity providers
16 These businesses focus on providing a single activity or tour, such as only helicopter rides or only white water rafting
Hunting safari operators
4 These operators provide hunting safari tours
Local activity providers (multiple)
36
Local tour operators focus on providing and booking a wide range of activities for tourists. These businesses may own some of the activities but also offer and outsource other activities.
TOTAL 89
A total of nine activity providers were interviewed in 2015 and eight in 2019. Although this represents only about 10% of the activity/tour businesses in Victoria Falls, all of the larger, more prominent activity providers were captured in this sample. There are six white-water rafting companies in Victoria Falls and all of these businesses were interviewed in 2015, while four of these businesses were interviewed in 2019, as well as the Rafting Association of Zimbabwe. Two out of the six are solely involved in white-water rafting and do not offer any other activities. During the interviews the four companies that do offer other activities highlighted the importance of white-water rafting to their business. Three of the four originally only provided white-water rafting and two of these businesses pioneered the industry almost 30 years ago. Rafting therefore plays a crucial

31
role in their businesses and most of these companies indicated that white-water rafting attracts the largest number of hits on their websites, drawing tourists to their company and to the other activities that they offer.
1.5.4 Tourism facilities and activities offered in Livingstone, Zambia
Location and arrangement of facilities
Livingstone is situated in the Southern Province of Zambia approximately 11 km away from Mosi-oa-Tunya Falls. The town is larger than Victoria Falls in Zimbabwe and is more spread out (Figure 11). Most of the amenities, such as restaurants, shops and banks, are located in the town centre and are within walking distance from one another. However, the larger hotels and upmarket safari lodges are situated further out of town either closer to the Falls off the main Mosi-oa-Tunya Road or along the banks of the Zambezi River upstream of the Falls (Figure 12). In the Livingstone town centre there are a large number of smaller guesthouses and B&B’s as well as campsites and backpackers. The Avani and Royal Livingstone hotels are situated less than one kilometre from the Falls. The Mosi-oa-Tunya National Park is 66 km2 in size and stretches 12 km upstream of the Falls and extends to the end of the 5th Gorge downstream of the Falls. Just as in Victoria Falls, there are a wide variety of activities for visitors and the activities offered in Victoria Falls and listed Table 6 are also offered in Livingstone. Most of the activities are river based and activity providers offer packages and special offers for those visitors interested in doing more than one activity. Overland organised tour groups often stay in the same campsites or chalets and take part in a number of different activities. In the town centre there is the Livingstone Tourism Association office which provides maps, information and brochures for a wide range of accommodation establishments and activity providers. The Harry Mwanga Nkumbula International Airport is located north-west of the town centre approximately 5.5 km away, and the M10 Nakatindi Road links Livingstone to Botswana and Namibia in the west. Accommodation establishments
There is a wide choice of accommodation establishments in Livingstone. Unlike Victoria Falls in Zimbabwe, the hotels are on average smaller in size offering a fewer number of beds per establishment. In 2019, there were approximately 88 accommodation establishments and about 3 900 beds in Livingstone (Table 7), representing a decline of about 20% since 2015. Hotels accounted for 17% of the total number of accommodation establishments. There are numerous smaller guesthouses, guest lodges and B&B’s in the town and these accounted for 47% of the establishments and 23% of the total beds. Upmarket safari lodges accounted for 18% of the establishments and 9% of the total beds. In total there are 88 accommodation establishments and 3851 available beds in Livingstone

32
(Table 7). In Livingstone the accommodation sector is more focused to smaller, high-end establishments and the majority of high-end safari lodges are situated upstream of the Falls along the Zambezi River (Figure 12). Accommodation statistics were estimated using available data from previous tourism studies in Livingstone and updated using information collected during tourism business interviews and online accommodation booking sites.
Table 7. Estimated number of accommodation establishments and beds in Livingstone (Source: Africa Albida Tourism 2017 and surveys in 2019)
Type Number of
establishments (2015)
Number of establishments
(2019)
Number of beds (2015)
Number of beds (2019)
Backpackers and campsites
7 6 85 523
Self-catering 59 10 1312 318
Guest Lodge/ House/B&B
6 41 1332 872
Hotel 26 15 1142 1804 Upmarket Safari Lodge
12 16 967 334
TOTAL 110 88 4838 3851
Activity providers
In Livingstone there are fewer activity providers and inbound tour operators than in Victoria Falls. In total it was estimated that 42 activity providers operated in Livingstone in 2015 and there has been no considerable change since then. These activity providers offer a wide range of local and regional activities (Table 8). Half of these offer local activities in and around Livingstone. The number of activity providers in Livingstone was estimated using data collected from the tourism business surveys, previous tourism studies and from online accommodation booking and travel sites. A total of five activity providers were interviewed in both 2015 and 2019. Although this represents only about 12% of the activity tourism businesses in Livingstone, all of the larger, more prominent activity providers were captured in this sample.
Table 8. Approximate number of tour operators and activity providers operating in Livingstone in 2015 (Source: Suich et al. 2005, LTA and internet search).
Type Number Description River cruise operators
2 These operators solely provide river cruises on the Zambezi River
Safari operators 7 These operators focus solely on providing safari holidays and game drives

33
Type Number Description Inbound tour operators (incl. travel agencies)
13 Inbound tour operators organise travel, accommodation and activities for inbound tourists
Single activity providers
10 These businesses focus on providing single activities or tours, such as only helicopter rides or only white water rafting
Local activity providers (multiple)
10
Local activity providers focus on providing and booking a wide range of activities for tourists. These businesses may own some of the activities but also offer and outsource other activities.
TOTAL 42
There are four white-water rafting companies in Livingstone and all of these were interviewed. Two rafting companies are solely involved in white-water rafting and do not offer any other activities. During the interviews companies that do offer other activities emphasised the importance of rafting to their business as it attracts tourists to partake in other activities that are also on offer. Although two of the four companies do offer other activities, these do not make up the largest proportion of their sales and most of the rafting companies rely heavily on the income received from rafting.
Table 9. Tourist activities offered in Victoria Falls and Livingstone.
Tour/Activity Description
Victoria Falls guided tour
This includes entry into the Rainforest Park and a tour of the Falls with historical, environmental and geographical information about the Falls described by a knowledgeable guide.
River cruises There are a variety of cruise options, from breakfast, lunch and dinner cruises to sunset cruises. They depart from the small riverside jetties located upstream of the Falls. The cruises are two and half hours long and are usually inclusive of drinks and snacks. They take place daily throughout the year.
White water rafting and kayaking
Rafting is offered as a half-day, full-day or up to five day activity which includes camping in the Batoka Gorge for tours longer than the standard one day excursion. Half-day rafting includes rapids 1 – 10 and full-day includes rapids 1 – 18 (Zimbabwe) and 1 – 25 (Zambia). White water rafting is seasonal and dependent on the level of water. During December to May water levels are high and only certain rapids can be rafted. From August to December water levels are low and all rapids are open.
Game drives A variety of safari game drives are offered in and around the study area. A number of these operate in local National Parks and game reserves and others offer day trips and overnight trips to Chobe National Park in Botswana.
Gorge swing & Zip Line
These activities take place below the Victoria Falls from the edge of the gorge. The gorge swing is suspended across the gorge and a harness is attached to the jumper. The jumper leaps off the

34
edge of the gorge, free falling before going into a long pendulum type swing across the gorge. For the zip line activity, the individual is harnessed in and attached to a pulley system. The zip line extends across the gorge from one end to the other. The zip line canopy tour extends through a section of forest.
Horseback safari This is either a three hour morning or afternoon activity which involves horseback riding through a game reserve to experience wildlife from a different perspective.
Elephant back safari / walking with elephants
This safari experience gives guests an up close and personal insight into elephants. The elephant back safari involves riding on the back of an elephant with a trained guide and elephant handler. The activity takes place in the National Park and involves walking through the bush and the rivers with views of the Zambezi River. The elephant experience involves meeting the elephants and interacting with them as well as learning more about elephants and elephant conservation.
Lion encounter This activity lasts about three hours and involves one on one interaction with lions that are in a rehabilitation program. Visitors meet the lion handlers and are briefed about safety before being able to interact and walk with the lions.
Canoe trails The canoe trail tours take place above Victoria Falls along the upper Zambezi. These can be half day, full day or overnight canoe trips and guests paddle along the river viewing game and birds.
Guided angling Guided angling can be a half day, full day or overnight excursion which involves guided boat trips along the river to well-known fishing spots. The most sought after and well renowned fish in the river is the Tiger Fish, which most guests hope to catch.
Guided nature walking
Walking safaris can be in the National Parks or smaller game reserves or in the Batoka Gorge with a focus on game or on birding.
Scenic flights Scenic flights over Victoria Falls and surrounding areas can be done from a helicopter, a microlight or a fixed wing plane. The flights can be short (15 min), medium (22 min) or long (30 min). The flight gives a 365 degree view of the Falls, the upper river and the Batoka Gorge below.
Croc-cage diving The croc-cage diving activity involves being completely submerged in a large pool and observing crocodiles from within a cage as they swim around you. The activity focuses on crocodile interaction from the safety of a cage but provides the guest with an up close and personal view of how impressive crocodiles are.
Bungee Jumping & Bridge Swing
The bungee jump and bridge swing take place from the top of the Victoria Falls Bridge in front of the Falls and above the rapids of the gorge below. The bungee jump is approximately 111 metres high. The bridge swing is an 80m freefall and a pendulum swing in an arc below.
Victoria Falls Bridge Tour
The historic bridge tour involves an informative talk about the history of the famous Victorian engineered bridge with views from the bridge of the Victoria Falls and the rapids below as the tour takes place on the walkways below the bridge.

35
Cultural village tour
These tours involve visiting one of the local villages to learn more about the local cultures and village life. The tours are informative providing historical and cultural information. Guests get to observe and interact with the local community members to learn more about their daily activities and way of life within the village.
Livingstone Island Tour (Devils Pool)
Livingstone Island is located on the Zambian side above the Falls. This activity involves catching a small boat to the island from the banks of the Zambezi. The view from the island of the top of the Falls is impressive. From the island the guests either walk across or swim to the Devils Pool which is a large deep natural rock pool at the edge of the Falls. Guests can swim in the pool and sit on the edge overlooking the Falls.
Under the Spray Tour (Zambia)
This activity involves viewing Victoria Falls from below at the bottom of the gorge under the spray of the waterfall. Guests swim in the rock pools and sit under the spray.
Quad Biking Quad biking along an eco-trail through the bush exploring with the possibility of viewing game along the way.
Jet Extreme Below the falls, power boats with jet engines shoot over the first few rapids at speeds of 100km per hour. This activity was also offered between rapids 23 – 27 in the gorge up until 2018, after which it became unfeasible. The gorge operations involved an hour drive to the entry point and a steep hike down into the gorge. A cable car was installed to lift tourists out of the steep gorge.
Boiling Pot hikes (Zimbabwe)
This activity on the Zimbabwean side is similar to the “Under the Spray” tour offered on the Zambian side. It involves hiking down into the gorge below the Falls where guests are ferried on a raft to the rock outcrops below the Falls where they can swim in the rock pools and get showered by the spray.
Royal Livingstone Express Steam Train Tour & Dinner
The stream train tour involves boarding the historical steam train in Livingstone and enjoying a trip to the Victoria Falls Bridge. Enjoy some sparkling wine with views of the Falls from the bridge. The tour with dinner involves a 15km train journey through the Zambezi River Valley while enjoying fine dining and drinks. This tour operates on certain days of the week and is only available from Livingstone.
Raft Float/Drift Guests’ board small inflatable rafts upstream of the Falls, each raft has its own guide. The guides paddle and point out various fauna and flora while guests sit back and enjoy the scenery, drinks and snacks. The rafts slowly drift downstream towards the Falls.

38
1.6 VISITOR NUMBERS, OCCUPANCY & ACTIVITY SALES IN VICTORIA
FALLS
There are no statistics on the total numbers of visitors to Victoria Falls per se. However, there are some statistics available for the numbers of visitors entering the Rainforest Park which could be used to derive total estimates in combination with using accommodation statistics and information collected from the interviews with tourism businesses.
1.6.1 Visitor numbers
An annual average of 212 636 visitors entered the Rainforest Park gates during the period 2010 – 2017 (Table 10). Data for 2014 was not available. International visitors, on average, represented 65% and domestic visitors 35% of visitors entering the park every year. Interviews with tourism businesses and casual conversations with tourists suggested that 98.5% of tourists to Victoria Falls visit the Rainforest Park. Business and conference visitors, although in the area for work, do also take the time to visit the Rainforest Park.
Table 10. Total numbers of international and domestic visitors entering the Rainforest Park gates in Victoria Falls (Source: ZTA Annual Tourism Trends & Statistics Report 2015 and Africa Albida Tourism 2017)
Year International Domestic Total
2010 110 300 50 217 160 517
2011 72 151 48 100 120 251
2012 136 980 60 796 197 776
2013 144 680 51 361 196 041
2015 173 561 59 913 233 474
2016 192 307 70 305 262 612
2017 246 204 71 574 317 778
Average 153 740 58 895 212 636
Seasonal data were not available for the Rainforest Park, but from interviews with the tourism businesses, the visitor high season was established to be from June – October with peaks in local and regional tourist numbers in April over the Easter period and December over the Christmas and New Year period. From the interviews and tourist conversations it was established that approximately 97.5% of visitors to Victoria Falls overnight in the area. There are small numbers of day visitors that come to see Victoria Falls from Botswana but the majority of visitors stay overnight and participate in the many activities on offer. The average length of stay for visitors to Victoria Falls is 2.6 days, as indicated by the accommodation establishments, activity providers and previous tourism studies.

39
1.6.2 Occupancy of accommodation establishments
On average, accommodation establishments reported similar trends in occupancy over the year (Figure 13; based on data collected in 2015). The high season was reported to be from June to September, with all accommodation establishments recording their highest occupancy levels in August with an average of almost 80%. Businesses reported that on average they receive 70% of their turnover during the high season months. April and December see peaks over the Easter and Christmas holiday period but remain quiet over the rest of the month. The quietest months are January and February. International guests from beyond the SADC region made up approximately 60% of the occupancy each month with local and regional guests making up 20% each.
Figure 13. Seasonal patterns in bed occupancy in Victoria Falls reported by the accommodation establishments interviewed, broken down by local, regional and international guests.
Average annual bed occupancy rates reported by the accommodation establishments were in the range of 37-67%, and were similar in both years of data collection. The overall annual occupancy rate in Victoria Falls was estimated to be 50% for all types of accommodation. This was based on reported occupancy figures, figures provided for the main hotels and lodges in town and figures reported by ZTA in the annual tourism statistic reports. This translates into an estimated 872 715 bed nights sold per annum (Table 11).
0.0
10.0
20.0
30.0
40.0
50.0
60.0
70.0
80.0
90.0
Jan Feb Mar Apr May Jun Jul Aug Sep Oct Nov Dec
Avg. %
Bed
Occupan
cy
Local Regional International

40
Table 11. Average bed occupancy rates for accommodation establishments and estimated overall annual bed nights in Victoria Falls (Source: Africa Albida Tourism 2017 and surveys in 2019).
Type of accommodation Number of beds
Estimated annual bed nights
Backpackers and campsites 636 116 070
Self-catering 215 39 238
Guest Lodge/Guest House/B&B
890 162 425
Hotel 2679 488 918
Upmarket Safari Lodge 448 81 760
TOTAL 4 868 888 410
1.6.3 Estimated demand for tourist activities
On average activity providers reported similar trends in activity sales over the last year. The high season for these companies is June – October and the last two weeks in December (Figure 14). Business is at its busiest in the month of August with 66% of sales and companies indicated that on average 65% of their turnover is generated during the high season months.
Figure 14. Seasonal patterns in activity and tour sales in Victoria Falls as reported by activity providers and tour operators.
All businesses reported that February is their worst month for selling activities. The low activity sales during the low season months are a combination of not just decreased tourist numbers to the area over this time, but also due to the availability of certain activities at this time of year. From January river water levels become too high and the availability and extent of some river activities become compromised. White water rafting and kayaking is only available for a half day trip from rapid 10, Livingstone Island (Devil’s Pool) tours are not

41
available and some hiking and angling activities in the gorge are suspended due to the high water levels. In most years from March to May the water levels become dangerously high and white-water rafting is closed completely for a few weeks. Tourism businesses estimated the percentage of their clients participating in different activities whilst in Victoria Falls. Approximately 98% of clients to the area visit the Rainforest Park (Figure 15). Wildlife safaris and river cruises are also very popular with 75% of clients choosing to do these activities. Just under 50% of visitors take part in white water rafting and scenic flights over the Falls.
Figure 15. Percentage visitor participation for some of the most popular activities offered in Victoria Falls as recorded from business interviews
The estimated total number of different activities and tours provided by tourism businesses in Victoria Falls are outlined in Table 12. While it was not possible to obtain exact data on the numbers of tours offered by every activity provider or the exact number of people taking part in each activity, information obtained from tourism activity businesses and accommodation establishment interviews, the internet and previous tourism studies was used to generate our estimates which provide a baseline for the approximate activities sold. The river cruises are extremely popular and it is estimated that around 130 000 cruises are sold to visitors each year. White water rafting sees a total of approximately 11 500 customers per year, while scenic flights sees approximately 60 000 customers per year. The average price paid for an activity in Victoria Falls was $87 (estimated total revenue from activities in Victoria Falls divided by the estimated total number of users per year).

42
Table 12. Estimates of the total numbers of customers and average prices for the main activities offered by locally-based tourism businesses in Victoria Falls (Source: tourism business survey 2015 and 2019).
Tours Average duration
Estimated total annual users
Average Price (US$)
Victoria Falls guided tour (excl. Rainforest entry)
2.5 hours 40 000 20
Standard river/sunset cruise 2.5 hours 129 186 50 White water rafting and kayaking
1 day 11 500 150
Game drive (local parks) half day 2 500 100
Game drives: Chobe day trips 1 day 4 000 180
Gorge swing & Zip Line 30 minutes 3 100 90
Horseback safari 2.5 hours 620 85
Elephant back safari 3 hours 18 000 150
Lion encounter 3 hours 10 500 150
Canoe trails 1 day 4 050 144
Guided angling 3 hours 3 300 130
Guided nature walking 3 hours 800 75
Scenic flights 15 min 60 000 150
Croc-cage diving 20 min 400 70 Bungee Jumping/Bridge Swing
30 minutes 7 500 145
Cultural village tour 2 hours 5 500 50
Boiling Pot hikes 2 hours 400 48
1.7 VISITOR NUMBERS, OCCUPANCY & ACTIVITY SALES IN LIVINGSTONE
Similarly, there are no statistics on the total numbers of visitors to the Livingstone area. There are some statistics available for the numbers of visitors entering the National Park to view the Victoria Falls which can be used to derive total estimates in combination with using accommodation statistics and information collected from the interviews with tourism businesses.
1.7.1 Visitor numbers
On average just less than 154 200 visitors entered the Park in Zambia each year from 2010 - 2018 (Table 13). From 2012, visitor numbers increased to upwards of 150 000 and only dropping below that in 2015 and 2017.

43
Table 13. Total numbers of international and domestic visitors entering the Rainforest Park gates in Zambia from 2010 to 2018 (Source: Zambia Tourism Board 2019)
Year International Domestic Total
2010 51 411 86 737 138 148
2011 40 206 92 847 133 053
2012 42 090 108 915 151 005
2013 51 969 100 983 152 952
2014 45 303 108 487 153 790
2015 29 575 112 354 141 929
2016 51 450 116 260 167 710
2017 35 964 113 666 149 630
2018 68 523 130 986 199 509
Average 46 277 107 915 154 192
From the interviews and conversations with tourists it was established that approximately 98.2% of visitors to Livingstone overnight in the area. Similarly to Victoria Falls, there are a small number of day visitors that come to the study area from Botswana but the majority of visitors stay overnight and participate in the activities. The average length of stay for visitors in Livingstone is 2.9 days, as indicated by the accommodation establishments, activity providers and previous tourism studies.
1.7.2 Occupancy of accommodation establishments
Accommodation establishments in Livingstone reported similar seasonal trends in bed occupancy (Figure 16) with the high season occurring from May to September with peaks over the Easter period in April and Christmas/New Year period in December and early January. Businesses indicated that they receive on average 72% of their annual turnover during the high season months. All of the accommodation establishments interviewed recorded their highest levels of occupancy in July and August and their lowest levels in February. International guests from beyond the SADC area made up 60%, regional guests 24% and local guests 16% of the occupancy on average each month. Average annual bed occupancy rates for Livingstone reported by accommodation establishments were in the range of 30 – 66%. The overall annual bed occupancy rate for hotels and upmarket safari lodges in Livingstone was estimated to be 49.3% and for self-catering, guesthouses, B&B’s and backpackers/camping was 30%. This was based on reported occupancy figures, previous Livingstone tourism studies and figures reported by the Ministry of Tourism and Arts in the annual tourism statistic reports. This translates into an estimated total of 572 296 bed nights sold per annum in Livingstone (Table 14).
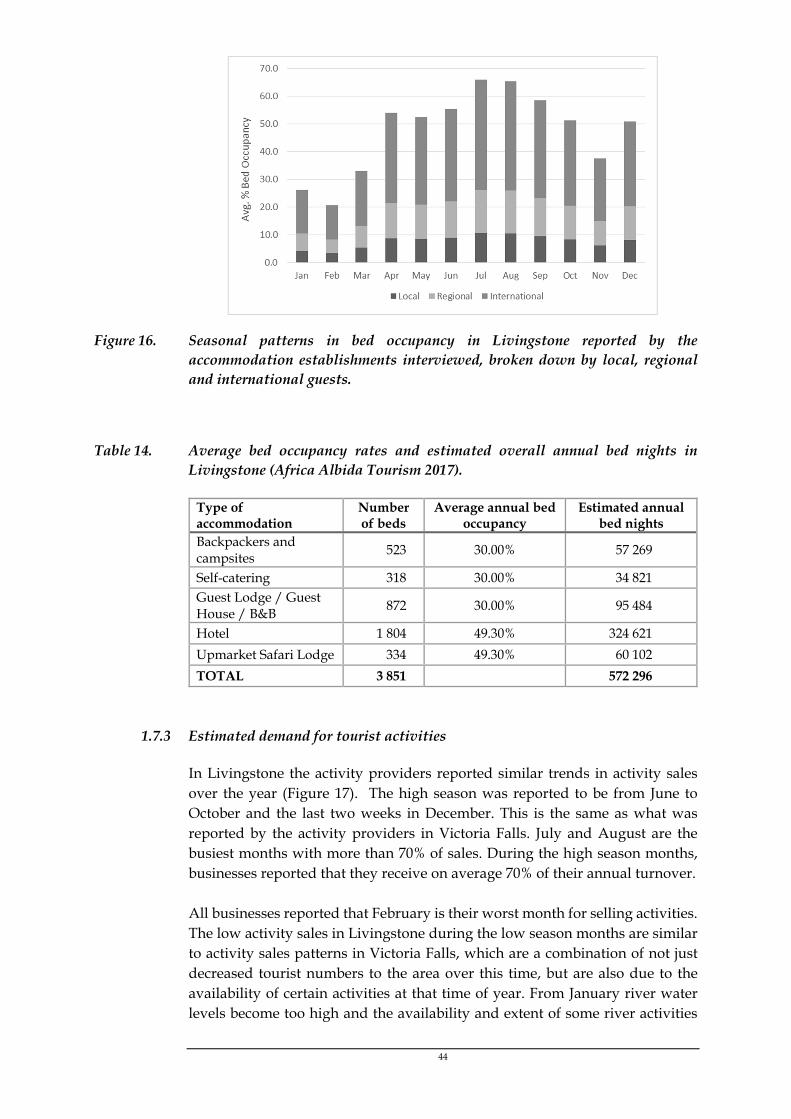
44
Figure 16. Seasonal patterns in bed occupancy in Livingstone reported by the accommodation establishments interviewed, broken down by local, regional and international guests.
Table 14. Average bed occupancy rates and estimated overall annual bed nights in Livingstone (Africa Albida Tourism 2017).
Type of accommodation
Number of beds
Average annual bed occupancy
Estimated annual bed nights
Backpackers and campsites
523 30.00% 57 269
Self-catering 318 30.00% 34 821 Guest Lodge / Guest House / B&B
872 30.00% 95 484
Hotel 1 804 49.30% 324 621
Upmarket Safari Lodge 334 49.30% 60 102
TOTAL 3 851 572 296
1.7.3 Estimated demand for tourist activities
In Livingstone the activity providers reported similar trends in activity sales over the year (Figure 17). The high season was reported to be from June to October and the last two weeks in December. This is the same as what was reported by the activity providers in Victoria Falls. July and August are the busiest months with more than 70% of sales. During the high season months, businesses reported that they receive on average 70% of their annual turnover. All businesses reported that February is their worst month for selling activities. The low activity sales in Livingstone during the low season months are similar to activity sales patterns in Victoria Falls, which are a combination of not just decreased tourist numbers to the area over this time, but are also due to the availability of certain activities at that time of year. From January river water levels become too high and the availability and extent of some river activities

45
become compromised. White water rafting and kayaking is only available for a half day from rapid 10, Livingstone Island (Devil’s Pool) tours are not available and some hiking and angling activities in the gorge are suspended due to the high water levels. In most years from March to May the water levels become dangerously high and white-water rafting is closed completely for a few weeks.
Figure 17. Seasonal patterns in activity and tour sales in Livingstone as reported by activity providers and tour operators.
Tourism businesses estimated the percentage of their clients participating in different activities whilst in Livingstone. Approximately 98% of clients visit the National Park to view the Victoria Falls (Figure 18). Wildlife safaris and river cruises are also very popular with 63% of clients choosing to do these activities. Just under 45% of visitors take part in white water rafting and 29% choose to do the scenic flights over the Falls. Percentage participation in bungee jumping, cultural tours and scenic flights was reportedly less in Livingstone than in Victoria Falls.
Figure 18. Percentage visitor participation for some of the most popular activities offered in Livingstone as recorded from business interviews

46
Table 15. Estimates of the total numbers of customers and average prices for the main activities offered by locally-based tourism businesses in Livingstone (Source: estimates from tourism business survey in 2015 and 2019).
Activities & Tours Average duration
Estimated total annual
users
Avg. Price (US$)
Victoria Falls guided tour (excl. Park entry) 2.5 hours 20 000 30
River cruises 2.5 hours 75 000 65
White water rafting and kayaking 1 day 9 500 170
Game drive: local parks half day 1 500 65
Game drive: Chobe day trips 1 day 4 000 190
Horseback safari 2.5 hours 1 500 80
Elephant back safari 3 hours 10 000 175
Lion encounter 3 hours 5 000 160
Canoe trails 1 day 2 200 145
Guided angling half day 2 500 145
Guided nature walking 3 hours 2 140 85
Scenic flights 15 min 25 000 180
Abseil/Gorge Swing/High wire half day 5 000 140
Cultural village tour 2 hours 3 000 50
Under the Spray Tour 3 hours 375 70
Livingstone Island Tour (Devils Pool) 2 hours 2 900 95
Raft Float/Drift half day 200 80
Quad Biking trails 1.5 hours 1 050 80
The estimated total number of different activities and tours provided by tourism businesses in Livingstone are outlined in Table 15. Data on the exact numbers of trips and activities being offered by all activity providers in Livingstone or the exact number of tourists taking part in each activity were not available. However, information obtained from tourism activity businesses and accommodation establishment interviews, the internet and previous tourism studies was used to generate our estimates which provide a baseline for the approximate number of activities sold. In Livingstone there are fewer river boats offering cruises than in Victoria Falls but these still form a significant amount of activity sales with approximately 75 000 cruises sold annually. There were approximately 9 500 white water rafting sales and 25 000 scenic flight sales. The average price paid for an activity in Livingstone was $101 (estimated total revenue from activities in Livingstone divided by the estimated total number of users per year). This was slightly more than the average price of an activity in Victoria Falls, owing to the fact that in Livingstone activities are taxed at 15% whereas in Victoria Falls activities are not taxed and there are two entities charging fees for activities (Parks and Wildlife Authority and the National Heritage Conservation Commission) in Livingstone.
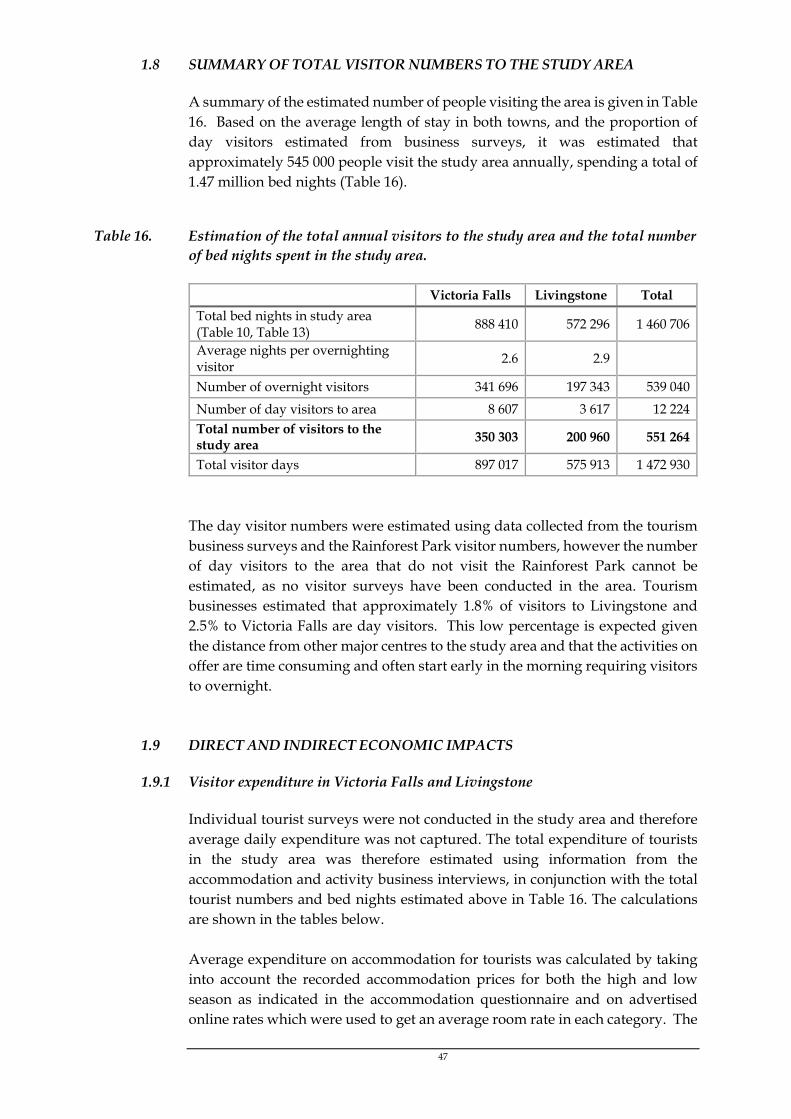
47
1.8 SUMMARY OF TOTAL VISITOR NUMBERS TO THE STUDY AREA
A summary of the estimated number of people visiting the area is given in Table 16. Based on the average length of stay in both towns, and the proportion of day visitors estimated from business surveys, it was estimated that approximately 545 000 people visit the study area annually, spending a total of 1.47 million bed nights (Table 16).
Table 16. Estimation of the total annual visitors to the study area and the total number of bed nights spent in the study area.
Victoria Falls Livingstone Total
Total bed nights in study area (Table 10, Table 13)
888 410 572 296 1 460 706
Average nights per overnighting visitor
2.6 2.9
Number of overnight visitors 341 696 197 343 539 040
Number of day visitors to area 8 607 3 617 12 224 Total number of visitors to the study area 350 303 200 960 551 264
Total visitor days 897 017 575 913 1 472 930
The day visitor numbers were estimated using data collected from the tourism business surveys and the Rainforest Park visitor numbers, however the number of day visitors to the area that do not visit the Rainforest Park cannot be estimated, as no visitor surveys have been conducted in the area. Tourism businesses estimated that approximately 1.8% of visitors to Livingstone and 2.5% to Victoria Falls are day visitors. This low percentage is expected given the distance from other major centres to the study area and that the activities on offer are time consuming and often start early in the morning requiring visitors to overnight.
1.9 DIRECT AND INDIRECT ECONOMIC IMPACTS
1.9.1 Visitor expenditure in Victoria Falls and Livingstone
Individual tourist surveys were not conducted in the study area and therefore average daily expenditure was not captured. The total expenditure of tourists in the study area was therefore estimated using information from the accommodation and activity business interviews, in conjunction with the total tourist numbers and bed nights estimated above in Table 16. The calculations are shown in the tables below. Average expenditure on accommodation for tourists was calculated by taking into account the recorded accommodation prices for both the high and low season as indicated in the accommodation questionnaire and on advertised online rates which were used to get an average room rate in each category. The
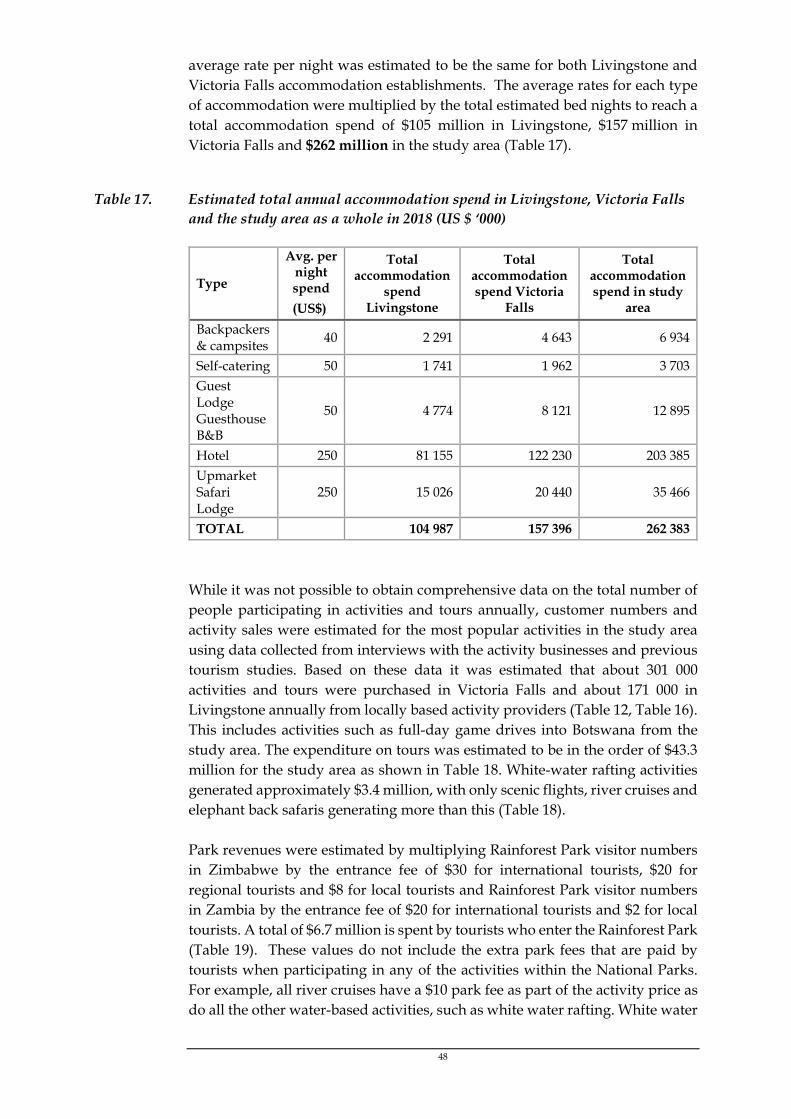
48
average rate per night was estimated to be the same for both Livingstone and Victoria Falls accommodation establishments. The average rates for each type of accommodation were multiplied by the total estimated bed nights to reach a total accommodation spend of $105 million in Livingstone, $157 million in Victoria Falls and $262 million in the study area (Table 17).
Table 17. Estimated total annual accommodation spend in Livingstone, Victoria Falls and the study area as a whole in 2018 (US $ ‘000)
Type
Avg. per night spend
Total accommodation
spend Livingstone
Total accommodation spend Victoria
Falls
Total accommodation spend in study
area (US$)
Backpackers & campsites
40 2 291 4 643 6 934
Self-catering 50 1 741 1 962 3 703 Guest Lodge Guesthouse B&B
50 4 774 8 121 12 895
Hotel 250 81 155 122 230 203 385 Upmarket Safari Lodge
250 15 026 20 440 35 466
TOTAL 104 987 157 396 262 383
While it was not possible to obtain comprehensive data on the total number of people participating in activities and tours annually, customer numbers and activity sales were estimated for the most popular activities in the study area using data collected from interviews with the activity businesses and previous tourism studies. Based on these data it was estimated that about 301 000 activities and tours were purchased in Victoria Falls and about 171 000 in Livingstone annually from locally based activity providers (Table 12, Table 16). This includes activities such as full-day game drives into Botswana from the study area. The expenditure on tours was estimated to be in the order of $43.3 million for the study area as shown in Table 18. White-water rafting activities generated approximately $3.4 million, with only scenic flights, river cruises and elephant back safaris generating more than this (Table 18). Park revenues were estimated by multiplying Rainforest Park visitor numbers in Zimbabwe by the entrance fee of $30 for international tourists, $20 for regional tourists and $8 for local tourists and Rainforest Park visitor numbers in Zambia by the entrance fee of $20 for international tourists and $2 for local tourists. A total of $6.7 million is spent by tourists who enter the Rainforest Park (Table 19). These values do not include the extra park fees that are paid by tourists when participating in any of the activities within the National Parks. For example, all river cruises have a $10 park fee as part of the activity price as do all the other water-based activities, such as white water rafting. White water

49
rafting on the Zambian side faces two fees: an entry fee which is paid to the National Heritage Conservation Commission and exit fee which is paid to Parks and Wildlife Management Authority. Including these extra fees becomes difficult because some activities have the park fee already included in the selling price whereas others do not. Therefore, these estimations are conservative as they do not, for the most part, consider the extra park fees included in activity sales.
Table 18. Estimate of total numbers of different types of activities purchased from local activity providers in Livingstone and Victoria Falls, and the overall revenues generated in the study area (US$)
Activities & Tours Total Expenditure
Livingstone
Total Expenditure Victoria Falls
Estimated Total Expenditure in study
area Victoria Falls guided tour (excl. Rainforest/Park entry)
600 000 800 000 1 400 000
River cruises 4 875 000 6 459 300 11 334 300
White water rafting and kayaking 1 615 000 1 725 000 3 340 000
Game drive: local parks 97 500 250 000 347 500
Game drive: Chobe day trips 760 000 720 000 1 480 000
Horseback safari 120 000 52 700 172 700
Elephant back safari 1 750 000 2 700 000 4 450 000
Lion encounter 800 000 1 575 000 2 375 000
Canoe trails 319 000 583 200 902 200
Guided angling 362 500 429 000 791 500
Guided nature walking 181 900 60 000 241 900
Scenic flights 4 500 000 9 000 000 13 500 000
Abseil/Gorge Swing/High wire 700 000 279 000 979 000
Cultural village tour 150 000 275 000 425 000
Under the Spray Tour /Boiling Pot hikes
26 250 19 200 45 450
Livingstone Island Tour (Devils Pool)
275 500 275 500
Raft Float/Drift 16 000 16 000
Quad Biking trails 84 000 84 000
Croc-cage diving 28 000 28 000
Bungee Jumping/Bridge Swing 1 087 500 1 087 500
TOTAL 17 232 650 26 042 900 43 275 550

50
Table 19. Total annual expenditure (US$) on park fees for the Rainforest Park and for the study area.
Type Zimbabw
e park fees (US $)
Zambia park
fees (US $)
Park fees expenditure
Victoria Falls
Park Fees expenditure Livingstone
Total Park Fees expenditure Study Area
International 30 20 3 074 800 925 540 4 000 340
Regional 20 2 049 867 2 049 867
Local 8 2 471 160 215 830 686 990
TOTAL 5 595 827 1 141 370 6 737 197
The other expenditure reflected in (Table 20) is additional spend by tourists on food, retail and beverage services as well as on local crafts and curios. The figure of $80 per person per day in Vic Falls and $75 per person per day in Livingstone was developed using the average cost and pricing structures for food and beverages (Banda & Cheelo 2012) and curios (DCDM 2006) in the study area. This figure does not include any accommodation or activity expenditure. This estimate of additional spend is considered conservative as it does not include other services such as taxi rides or fuel.
Table 20. Estimated total tourism expenditure in the study area (US$ ‘000)
Description Vic Falls Livingstone Study Area
Expenditure on accommodation (Table 16) 157 396 104 987 262 383
Total expenditure on activities (Table 17) 26 043 17 233 43 276
Total expenditure on park fees (Table 18) 5 596 1 141 6 737
Total tourist days 881 322 575 913 1 457 235
Other expenditures per tourist per day $ 80 $ 75
Total other expenditure 70 506 43 194 113 700
Estimated total expenditure in study area 259 541 166 555 426 096
Overall annual expenditure by tourists to the study area on accommodation, activities, food and beverages and local curios was estimated to be $260 million in Victoria Falls (a substantial increase on the 2015 estimate of $158 million), $167 million in Livingstone (an increase on the 2015 estimate of $145 million) and $426 million within the study area in 2018 (Table 20).
1.9.2 Employment
The direct contribution of tourism to the regional economy includes the total expenditure by tourists in the study area and the total number of jobs created. In addition, the direct contribution also considers direct employment generated by accommodation and tourism activity businesses.

51
The tourism business survey findings indicated that 77% of staff employed in Victoria Falls were full time, 15% were part time and 8% were employed casually. In Livingstone the findings were almost identical with 78% of staff full time, 14% part time and 8% employed casually. Full time staff numbers remain relatively constant over the year with businesses employing more part time staff and casual staff over the high season months. In Victoria Falls 75% of full time staff, 98% of the part time staff and 91% of the casual staff are originally from the area whereas in Livingstone it was indicated that 93% of the full time staff, 96% of the part time staff and 98% of the casual staff are originally from the area. Data collected from the tourism business surveys, previous tourism studies in the area and government statistics were used to estimate employment numbers. In Victoria Falls, larger hotels and safari lodges employed on average 189 staff and self-catering establishments, guesthouses and backpackers employed on average 10 staff per establishment. In Livingstone the larger hotels employed on average 155 staff, the upmarket safari lodges 35 staff and the smaller guesthouses, self-catering establishments and backpackers on average 10 staff per establishment. Activity provider businesses were estimated to employ on average 25 staff in Victoria Falls and 26 staff in Livingstone. Accommodation establishments in the study area therefore employed approximately 8 750 staff and the activity providers in the study area employed approximately 3 320 staff (Table 21). This equates to a little over 12 000 employees in the study area. However, approximately 1 800 of these are estimated to be part time workers and 970 casual workers. The employee to bed ratios for accommodation establishments in both Victoria Falls and Livingstone was 0.5, but when self-catering and campsites were not included the ratio increased to 0.7.
Table 21. Approximate employment in the study area
Victoria Falls Total Livingstone Total Study Area Total
Accommodation 5 300 3 450 8 750
Activity providers 2 220 1 100 3 320
Total 7 520 4 550 12 070
From the business interviews it was understood that in Victoria Falls approximately half of the 2 220 activity business jobs were provided by six local tourism activity businesses, four of which operate white water rafting tours. In Livingstone it was estimated that three activity businesses employed roughly half of total estimate, one of which operates white water rafting tours. Based on the employment data (Table 20), the national minimum wages in Zambia and Zimbabwe, and the estimated gratuity for both accommodation

52
and activity provider employees, total annual wages comes to about $42 million for the study area (Table 21). From the interviews, it was estimated that accommodation employees would receive on average 15% of their monthly wages in gratuities, while activity provider employees would receive on average 50% of their monthly wages in gratuities.
Table 22. Estimated total annual wages for accommodation and activity provider employees in the study area ($ ‘000).
Victoria Falls Total
Annual Wages Livingstone Total
Annual Wages Study Area Total
Annual Wages
Accommodation 19 945 7 629 27 573
Activity providers 10 934 3 145 14 079
Total 30 878 10 774 41 652
In Victoria Falls tourism businesses indicated that if customer levels decreased consistently by one third of current levels they would on average be forced to lose 20% of their staff. In Livingstone businesses indicated that this figure would be 26%. This equates to approximately 2 700 jobs that would be lost if tourist numbers decreased by a third of current levels.
1.9.3 Overall economic impacts
The total impact of tourism in the study area is much greater than the direct expenditure by tourists described above. The businesses providing tourism services purchase input goods and services from other businesses. This expenditure is the indirect impact of the direct tourism expenditure. The tourism sector has both forward and backward linkages with industries such as agriculture, manufacturing, and transport. Growth in tourism therefore has a direct impact on the performance of a wide range of downstream sectors that are linked to the tourism sector (Abel et al. 2013). Tourism businesses reported that the following expenses contribute most to their monthly costs:
Maintenance and repairs to buildings, vehicles, equipment and boats VAT Other taxes/rates such as water and electricity Permits such as National Park and tourism permits to be able to operate
a tourist activity Fuel Marketing and advertising Catering Royalties Insurance and accounting services

53
Businesses in Victoria Falls indicated that 67% of this is spent locally, 27% nationally and 6% internationally. In Livingstone 84% was spent locally, 7% nationally and 9% internationally. Based on ratios and multipliers from WTTC (2018a, b), the direct value added by tourism was estimated to be $148 million for Victoria Falls and $89 million for Livingstone (Table 23). When the indirect impacts are considered, the total contribution of tourism in the study area is estimated to be in the order of $281 and $164 million to the GDP of Zimbabwe and Zambia, respectively (Table 23).
Table 23. Overall direct and indirect economic impacts of tourism in the study area (US$ millions), based on multipliers derived from the WTTC (2018a, 2018b)
Business Sales Gross output
Direct value added
Indirect value added
Total contribution to GDP
Victoria Falls 260 148 133 281
Livingstone 167 89 76 164
The direct and total contribution of travel and tourism to GDP in Zimbabwe during 2017 was $512 million (3.0%) and $1 200 million (7.1%), respectively (WTTC 2018a). In Zambia the direct and total contribution was $778 million (3.2%) and $1 787 (7.3%), respectively (WTTC 2018b). The direct GVA reflects the income generated by industries such as hotels, airlines and travel agents but also includes activities associated with restaurant and leisure industries directly supported by tourists (WTTC 2018a, b). This study has estimated that tourism in the study area accounts for 23% of the value of tourism in Zimbabwe and 10% in Zambia.
1.9.4 The tourism value of the Batoka Gorge
This study set out to investigate the current value and economic contribution of tourism to the study area with a focus of trying to estimate, in particular, the contribution that the tourism activities offered in the Batoka Gorge make to this overall tourism value. This was estimated on the basis of visitor activity sales reported in the business interviews and the business owners’ perceptions of visitor interests as well as information collected from lodges located along the gorge and other local experts in the area. The Batoka Gorge is estimated to contribute just less than $6.5 million in direct tourism expenditure (excluding park fees generated by the activities undertaken in the gorge) in 2018, down from the estimated $7.5 million in 2015 (Table 24). When park fees are included, this amount is just less than $7 million, down from just less than $8 million in 2015. Accommodation establishments located along the edge of the Batoka Gorge have extensive views of the Gorge and the river below. A number of the guests staying at these lodges are birders and hikers choosing to stay at these lodges for this reason. These lodges contribute approximately $1.4 million in tourism expenditure. White water

54
rafting is the most popular activity downstream of the Falls and is the largest contributor to tourism value with almost $3.4 million in tourist expenditure annually. Angling, birding, hiking and canyoneering are estimated to contribute over $250 000 dollars annually. Business interviews with flight operators indicated that a proportion of their clients choose to do the scenic flight with a particular interest in seeing the Batoka Gorge. A number of these tourists are elderly, and this provides the only opportunity for them to experience the Gorge. Based on these interviews it was assumed that 10% of the scenic flight clientele would choose not to do the flight if views of the Batoka Gorge were significantly different to what they are today. Therefore, it is estimated that 10% of the total scenic flight expenditure is attributable to the Gorge.
Table 24. Total annual tourism expenditure attributable to the Batoka Gorge (US$)
Type Estimated Value
Accommodation 1 407 805
White water rafting 3 340 000
Birding and hiking 82 279
Angling 158 300
Scenic Flights 1 350 000
Canyoneering 16 000
Subtotal 6 354 384
Park Fees 506 600
TOTAL 6 860 984
The above figures represent only the direct tourism expenditure on these activities and do not include the full impact of these tourists in terms of their expenditure on accommodation, restaurants and retail outlets. Many of the gorge activities start early in the morning, and most visitors undertaking them are overnighting in the area. Based on data collected during the tourism business interviews a weighted average of 19.7% was used as an estimate for tourists to the study area taking part in at least one of the gorge activities (white-water rafting, scenic flight, fishing, hiking, and birding). Based on the average expenditure and length of stay in each town, it is estimated that tourists participating in gorge activities spend approximately $74 million, up from the estimated $50 million in 2015. The lodges along the Gorge employ about 60 staff and contribute a total of about $190 000 per annum to wages. The white water rafting companies are estimated to employ approximately 250 staff (full time, part time and casual). It is not possible to quantify exactly how many are part time and casual because of the lack of employment data provided by some of the businesses and also because of the dynamics of the rafting industry. Every season is different and is dependent on tourist numbers and length of rafting season. Part time and casual staff change every year and the numbers fluctuate regularly depending

55
on the tourist market and also on the numbers of local villagers looking for extra income. It is estimated that 100 staff in the rafting industry are full time employees.
1.10 NON-USE VALUE
The above analysis focuses on the tangible benefits generated as a result of the attributes of the study area, which are directly measurable in terms of contribution to the economy. It is important to recognise that individuals and communities also derive value from environmental assets in many other ways which are not as easily measured in monetary terms (Perman et al. 2011). Environmental economics considers the “total economic value” (TEV) of an environmental asset to include both “use” and “non-use” values. Use values can be consumptive use such as fishing, or non-consumptive, such as photographic tourism (Perman et al. 2011). Non-use values include the value of having the option to use the resources (e.g. genetic) within an area in the future (option value), and the value of knowing that the biodiversity associated with an area or ecosystem is protected (existence value). The latter values are theoretically reflected in society’s willingness to pay to conserve these resources, and are at least partly revealed by donations, non-government and government expenditure on the maintenance of these assets. Although the methodology is less than perfect, non-use value can be estimated through stated-preference methods, but this was beyond the scope of this study. However, it is important to highlight that in the case of a unique asset such as this, the non-use value to global society is likely to be high.

56
2 IMPACT ASSESSMENT
2.1 IMPACT ON WHITE WATER ACTIVITY BUSINESSES
Based on the flow descriptions and data provided in Section 10.2.3 of the Biophysical Environment Impact Assessment included in the ESIA, the following was concluded about the extent to which the operating of white-water rafting would be impacted with the proposed BGHES impoundment in place (FSL 757m ASL during the wet, high-water season and FSL 730m ASL during the dry, low-water season):
Based on the hydraulic analysis the proposed BGHES would prevent any rafting during the high-water season (between January to July) since the river reach from rapid 10 would be submerged by the reservoir
Rafting would be compromised throughout January and July due to flow velocities being significantly affected from rapid 7b
Rafting would only operate from rapid 1 to rapid 9 or 10 during the low-water season (between August to December)
Note that this has changed since 2015, when only FSL 757m ASL was being considered year-round. This would have resulted in rafting only taking place from rapid 1 to rapid 5 during the low-water season, a situation considered to be unviable for all rafting operators. With the proposed amendments to the operating levels, rafting would be available for approximately 136 days per year, between August and December, and would include rafting from rapid 1 to rapid 9/10. The practicality and feasibility of this for rafting companies makes rafting less viable under such conditions but, according to the diversified activity provider businesses interviewed, they would still operate under these conditions but would likely have to downsize and therefore retrench some employees. The white-water rafting companies not providing alternative activities indicated that this will likely force them to close their businesses in the study area. The low-water season is where rafting companies make the majority of their annual revenue, however, the bulk of this is made up of full-day rafting trips. Using the proportion of activity sales during the low-water season provided by businesses, Vic Falls would receive approximately 6 900 rafters a year and Livingstone would receive approximately 6 175 rafters a year, for a total of 13 075 rafters a year (62.3% of the average annual number of rafters; Table 25). Using the same average rafting rates of $150 for Vic Falls and $170 for Livingstone, the total value generated by rafting would decline by 37.5% to just over $2 million per year. The economic impact of this would be significant and losses in direct tourism expenditure would be around $2 million. Indirect expenditure lost would be much larger than this. Many of those working in the rafting industry would lose their jobs. Retrenchment costs could be substantial for rafting companies.

57
Table 25. The estimated number of rafters per year and the value generated for rafting businesses if the BGHES were to go ahead at the proposed operating levels.
Vic Falls Livingstone Total
Number of rafters 6 900 6 175 13 075
Value ($) 1 035 000 1 049 750 2 084 750
Significance of impact (pre-mitigation)
Based on the analysis provided above, it is assessed that the socio-economic impact relating to white water activities on the Zambezi River upstream of the reservoir impoundment will be a “Major Impact” pre-mitigation (refer to Table 26). This is based on the magnitude of the impact being assessed as Large, as the impacts effect all white water activity companies, their staff and other businesses associated indirectly with the rafting industry.
Table 26. Rating of Impacts Related to White Water Activities (Pre-Mitigation)
Type of Impact Direct Negative Impact
Rating of Impacts Characteristic Designation Summary of Reasoning
Extent Regional The impact affects white water businesses in Victoria Falls and Livingstone and will adversely affect local communities in the study area.
Duration Permanent The impact will be permanent. Scale Large Impact to businesses and local communities will be significant:
job losses, decreased daily income, and complete closure of some businesses. Indirect impacts include the losses experienced in other sectors associated with the rafting industry (e.g. maintenance and servicing).
Frequency Constant The impact will be permanent Likelihood Likely The impact is a direct consequence of the reservoir impoundment.
Magnitude Large
Sensitivity/Vulnerability/Importance of the Resource/Receptor High
The vulnerability and importance of this receptor is rated as high
Significance Rating Before Mitigation Major
Mitigation
The impacts described in this section are a direct consequence of the reservoir impoundment and, because lowering the operating level to below 730m ASL would not be feasible for power generation, there is no option to mitigate the impact by altering the operating level of the dam. However, to compensate rafting companies for the expected loss in revenues, rafting companies could be granted operating licences, as well as being provided with tax incentives, for

58
other tourism products and activities which could take place on the reservoir, such as houseboats or lakeside lodges and campsites. This would allow rafting companies to create a full-day trip for tourists by rafting a half day from rapid 1 to 9/10 and then moving guests to a houseboat for a fishing trip or sunset cruise on the reservoir. Therefore, the compensation that would need to be paid to white-water activity companies that will either go out of business as a result of construction of the dam or that will have to retrench employees would need to be evaluated by ERM as part of the RAP process. In theory, such compensation can fully address the direct white-water rafting business impact. However, note that it would be necessary to compensate all other losers as well. This includes all other companies and employees in associated sectors that gain from the rafting businesses, other businesses that benefit from use of the gorge and more pertinently, the rest of society that suffers a loss of welfare. It will be very difficult and costly to adequately compensate all affected parties. Residual Impact
Based on the analysis provided above, it is assessed that the impact relating to white water activity businesses upstream of the reservoir impoundment will be a “Moderate Impact” post-mitigation (refer to Table 27). This is based on the magnitude of the impact being assessed as Medium.
Table 27. Rating of Residual Impact Related to White Water Activities (Post-Mitigation)
Rating of Impacts Characteristic Designation Summary of Reasoning
Extent Regional The impact affects white water businesses in Victoria Falls and Livingstone and will adversely affect local communities in the study area.
Duration Permanent The impact will be permanent. Scale Medium Medium impact to white water rafting businesses and local
communities as there may be complete closure of some businesses with associated job losses but for others, losses from white water rafting could be compensated for by other tourism opportunities and incentives on the reservoir.
Frequency Constant The impact will be a permanent occurrence as long as the reservoir remains.
Likelihood Likely The impact is a direct consequence of the reservoir impoundment. Magnitude
Medium Significance Rating After Mitigation
Moderate
59
2.2 IMPACT ON OTHER TOURISM ACTIVITY BUSINESSES MAKING USE OF
THE GORGE
Based on the flow descriptions and data provided in Section 10.2.3 of the Biophysical Environment Impact Assessment included in the ESIA, the following was concluded about the extent to which other activities such as scenic flights, hiking and birdwatching would be impacted with the proposed BGHES impoundment in place (FSL 757m ASL during the wet, high-water season and FSL 730m ASL during the dry, low-water season):
Based on the hydraulic analysis the extent of the flooded area from the reservoir extends well into the Victoria Falls National Park and Mosi-oa-Tunya National Park
The backwater effect from the reservoir causes a rise in the natural water levels extending as far as the bottom of the third gorge (after rapid 5) during the high-water season and as far as the bottom of rapid 9/ 10 during the low-water season.
As a result of the inundation of the rapids, it is expected that the available habitat for river borne insects will be severely reduced. With fewer river borne insects to feed on, insectivorous birds and bats will move out of the gorge, further impacting on the larger raptors relying on them for prey. The increased water levels up the Gorge will remove prime habitat along the sheer cliff faces. Decreased food availability and the removal of prime nesting sites will force raptors such as the Taita Falcons and Peregrine Falcons to move out of the gorge. Without these rare raptors and other birds in the Gorge, birders will no longer be attracted to the area and guided birding trips in the gorge will no longer operate. These trips form a significant part of guided birding activities in the area. Hiking in the gorge will be affected in that hikers will only be able to hike for a few months of the year (during the low-water season) and for a short distance (to rapid 9/10) along the bottom of the Gorge due to the increased water levels from the reservoir. Overnight hiking and camping trips will also be impacted as water levels rise and remove hiking trails and camping sites along the edge of the river. Even during the low-water season when the dam is operating at FSL 730m ASL, the areas previously inundated by water will be muddy, slippery and unconducive to hiking and camping. Again, these activities form a major component of guided hikes in the area. While the Falls are the main attraction of scenic flights, the gorge also adds significant value to this visitor experience, and the inundation of the gorge could reduce the demand for these flights. Significance of impact (Pre-mitigation)
Based on the analysis provided above, the tourism activity businesses making use of the gorge for activities other than white-water activities will suffer a “Major Impact” pre-mitigation (refer to Table 28). This is based on the magnitude of the impact being assessed as Large, as the impacts of the reservoir are likely to prevent hiking and birding in the long term and could reduce the demand for scenic flights. It is understood that once the birds move off due to lack of food and nesting sites the probability of them returning is extremely low.

60
Table 28. Rating of Impacts Related to Birding and Hiking (Pre-Mitigation)
Type of Impact Direct Negative Impact
Rating of Impacts Characteristic Designation Summary of Reasoning
Extent Regional The impact affects activity businesses and other tourism businesses in Victoria Falls and Livingstone and will adversely affect local communities in the study area.
Duration Permanent The impact will be permanent. Scale Large Impact to businesses offering birding and hiking activities and loss in
birding tourists to the area. Local communities will incur job losses and decreased daily income. Indirect impacts include the losses experienced in other sectors associated with birding and hiking (e.g. accommodation sector).
Frequency Constant The impact will be a permanent occurrence as long as the reservoir remains.
Likelihood Likely The impact is a direct consequence of the reservoir impoundment.
Magnitude Large
Sensitivity/Vulnerability/Importance of the Resource/Receptor High
The vulnerability and importance of these receptors (and the National Parks themselves) is rated as high, in both ecological and socio-economic terms.
Significance Rating Before Mitigation Major
Mitigation
The impacts described in this section are a direct consequence of the reservoir impoundment and the only mitigation would be to alter the height of the dam wall and in so doing reduce the extent of the upstream impacts. However, as mentioned above, power generation becomes ineffective below a certain dam wall height and therefore there is no mitigation measure that will adequately alleviate the loss of birding and hiking habitat. In order to compensate the affected businesses, it would be necessary to establish the amount of turnover that would be lost as a result of inundation. This is likely to be more straightforward in the case of activities involving direct use of the gorge, than in activities such as scenic flights. As discussed above, this does not consider the non-use value associated with the Gorge and the potential permanent loss of an ecosystem and associated endemic flora and fauna. Residual Impact
Based on the analysis provided above, it is assessed that the tourism activity businesses making use of the gorge for activities other than white-water activities will be a “Major Impact” post-mitigation (refer to Table 29). This is based on the magnitude of the impact being assessed as Large.

61
Table 29. Rating of Impacts Related to Birding and Hiking (Post-Mitigation)
Type of Impact Direct Negative Impact
Rating of Impacts Characteristic Designation Summary of Reasoning
Extent Regional The impact affects activity businesses and other tourism businesses in Victoria Falls and Livingstone and will adversely affect local communities in the study area.
Duration Permanent The impact will be permanent. Scale Large Impact to businesses offering birding and hiking activities and loss in
birding tourists to the area. Local communities will incur job losses and decreased daily income. Indirect impacts include the losses experienced in other sectors associated with birding and hiking (e.g. accommodation sector).
Frequency Constant The impact will be a permanent occurrence as long as the reservoir remains.
Likelihood Likely The impact is a direct consequence of the reservoir impoundment.
Magnitude Large
Sensitivity/Vulnerability/Importance of the Resource/Receptor High
The vulnerability and importance of these receptors (and the National Parks themselves) is rated as high, in both ecological and socio-economic terms.
Significance Rating After Mitigation Major
2.3 IMPACT ON TOURIST ACCOMMODATION ESTABLISHMENTS IN THE
GORGE
Based on the flow descriptions and data provided in Section 10.2.3 of the Biophysical Environment Impact Assessment included in the ESIA, the following was concluded about the extent to which water levels in the Gorge would change with the proposed BGHES impoundment in place (FSL 757m ASL during the wet, high-water season and FSL 730m ASL during the dry, low-water season):
Based on the hydraulic analysis the extent of the flooded area from the reservoir extends well into the Victoria Falls National Park and Mosi-oa-Tunya National Park
The backwater effect from the reservoir causes a rise in the natural water levels extending as far as the bottom of the third gorge (after rapid 5) during the high-water season and as far as the bottom of rapid 9/ 10 during the low-water season.
Taita Falcon Lodge on the Zambian side of the river is located just downstream of Songwe Gorge above rapids 15 to 17 (Figure 19). The lodge is located on the edge of the Gorge with views upstream to rapid 15 and downstream to rapid 17. Gorges Lodge is located further downstream on the Zimbabwean side of the river above rapid 18 (Figure 20). Both lodges are built on communal land and concession fees and royalties are paid to the local village communities. The accommodation establishments along the Gorge will be impacted in the following ways:

62
The views from these lodges will be significantly altered as water levels rise and the Gorge environment is completely changed
The views offered by these lodges as well as their proximity to the Gorge for hiking and birding are their main selling points
Compromised views, altered landscape and lack of birding/hiking will influence tourist’s decision to stay at these lodges
Tourists will choose to stay at lodges either closer to the Falls or upstream of the Falls where the views are uninterrupted and natural
Acknowledging the above, it is estimated that tourist numbers to these lodges may decrease after the construction of the proposed BGHES. This will result in a loss of revenue as well as the potential loss of staff due to decreased bed occupancy. A further consideration is the potential impact of earthquakes caused by the inundation process which may put these establishments in jeopardy as they are located on the edge of the Gorge walls.
Figure 19. Location of Taita Falcon Lodge in Zambia on the edge of the Batoka Gorge
Figure 20. Location of Gorges Lodge in Zimbabwe on the edge of the Batoka Gorge

63
Significance of impact (Pre-mitigation)
Based on the analysis provided above, it is assessed that the impact relating to accommodation establishments upstream of the reservoir impoundment will be a “Moderate Impact” pre-mitigation (refer to Table 30). This is based on the magnitude of the impact being assessed as medium, as the impacts of the reservoir are likely to change the current views as well as disrupt activities offered by these establishments.
Table 30. Rating of Impacts Related to Accommodation Establishments in the Gorge (Pre-Mitigation)
Type of Impact Direct Negative Impact
Rating of Impacts Characteristic Designation Summary of Reasoning
Extent Regional The impact affects accommodation establishments located downstream of Victoria Falls and along the Batoka Gorge, as well as local communities in the study area.
Duration Permanent The impact will be permanent. Scale Medium Impact to lodges offering birding and hiking activities and loss in
birding tourists. Local communities will incur job losses and decreased daily income. Indirect impacts include the losses experienced in other sectors associated with accommodation establishments (e.g. food and beverage industry).
Frequency Constant The impact will be a permanent occurrence as long as the reservoir remains.
Likelihood Likely The impact is a direct consequence of the reservoir impoundment.
Magnitude Medium
Sensitivity/Vulnerability/Importance of the Resource/Receptor Medium
The sensitivity and importance of these resources is rated as medium as there is some ability to adapt.
Significance Rating Before Mitigation Moderate
Mitigation
Currently both of these lodges are marketed for their views and are also very popular amongst birding and hiking tourists. After construction of the proposed BGHES, the views from these lodges will be altered and the birding and hiking opportunities no longer available. The only available mitigation option would be to market the lodges differently to attract visitors coming to the area to enjoy the activities available on the dam. Compensation for altering marketing material should be assessed by ERM as part of the RAP. The lodges are situated close to the proposed reservoir and visitors to the area wanting to participate in the new activities available on the reservoir would be attracted to these accommodation options. The lodges could provide activities themselves, such as fishing trips and reservoir cruises. Predicting whether

64
tourists will be attracted to the new activities and the dam, when these activities are currently available upstream of Victoria Falls and on Lake Kariba, is difficult and therefore this mitigation measure needs to be approached with caution. The shaded nature of the gorge, and the fact that the appearance of the gorge sides will be unattractive due to fluctuations in water level leading to vegetation die-off, means that the attractiveness of the inundated gorge area is likely to be limited. If visitors are not attracted to the new activities and visitor numbers decrease over time, then these accommodation establishments could be impacted without mitigation. Residual Impact
Based on the analysis provided above, it is assessed that the impact relating to accommodation establishments upstream of the reservoir impoundment will be a “Minor-Moderate Impact” post-mitigation (refer to Table 31). This is based on the magnitude of the impact being assessed as Small-Medium.
Table 31. Rating of Residual Impact Related to Accommodation establishments in the Gorge (Post-Mitigation)
Rating of Impacts Characteristic Designation Summary of Reasoning
Extent Regional The impact affects accommodation establishments located downstream of Victoria Falls and along the Batoka Gorge, as well as local communities in the study area.
Duration Permanent The impact will be permanent. Scale Small to
Medium Small to medium impact to lodges offering birding and hiking activities. Local communities may still incur job losses and decreased daily income. Indirect impacts include the losses experienced in other sectors associated with accommodation establishments (e.g. food and beverage industry). New activities could provide opportunities for new visitors to stay at these lodges.
Frequency Constant The impact will be a permanent occurrence as long as the reservoir remains.
Likelihood Likely The impact is a direct consequence of the reservoir impoundment. Magnitude
Low to Medium Significance Rating After Mitigation
Minor to Moderate
2.4 IMPACT ON LOCAL ECONOMY
This section describes the overall economic impacts of the proposed BGHES in the study area, focusing on all the possible negative and positive impacts and any mitigation options available. The estimated magnitudes of the impacts are described qualitatively based on information obtained during the tourism business interviews and the site visit. Based on the flow descriptions and data provided in Section 10.2.3 of the Biophysical Environment Impact Assessment included in the ESIA, the

65
following was concluded about the extent to which water levels in the Gorge would change with the proposed BGHES impoundment in place (FSL 757m ASL during the wet, high-water season and FSL 730m ASL during the dry, low-water season) and the resulting economic impacts in the study area:
Based on the hydraulic analysis the extent of the flooded area from the reservoir extends well into the Victoria Falls National Park and Mosi-oa-Tunya National Park.
The backwater effect from the reservoir causes a rise in the natural water levels extending as far as the bottom of the third gorge (after rapid 5) during the high-water season and as far as the bottom of rapid 9/ 10 during the low-water season.
Rafting would only operate from rapid 1 to rapid 9 or 10 during the low-water season (between August to December)
Views of the Gorge will be severely altered downstream of the third gorge, even during the low-water season owing to vegetation die-off along inundated areas during the high-water season. Views of the Gorge from accommodation establishments such as Gorges Lodge and Taita Falcon Lodge will change.
Flight operations offering scenic views of the Victoria Falls and the Gorge will be affected as the untouched natural vistas of the Gorge are replaced with views of a reservoir.
Tourism activity businesses offering white water rafting, birding, hiking, camping, and angling will be adversely affected by the rising water levels and inundation in the Gorge.
Employment associated with these businesses and any service providers linked to these tourism businesses will most likely be negatively affected.
Knock-on effects of changes in the tourism sector will be significant. The overall tourism product offered in the study area will change.
It is estimated that the direct tourist spend on activities in the Gorge is almost $7 million. However, the Batoka Gorge activities currently attract tourists to the area and also encourage further spend as tourists stay longer in the area to participate in a number of activities on offer, spending more on accommodation, food and services. It is estimated that the total tourist spend attributable to the activities offered in the Gorge is close to $74 million, about 17% of the total direct tourist expenditure in the study area. Although not all of this will be lost if the BGHES is built, it is expected that a significant portion will be as those tourists that come to participate in gorge activities will either no longer come or will stay for a shorter period of time. Other economic impacts not estimated here include the taxes and permits paid by all activity providers to operate activities in the National Parks and in the Batoka Gorge. These fees are paid to the relative Zimbabwean and Zambian government departments and form a significant part of the expenditure paid each month by the activity businesses. Accommodation establishments and certain activity providers also pay local communities concession fees and royalties to be able to operate tourism businesses on the communal lands. These make a significant contribution to community development with the money contributing to schools, clinics and improved sanitation. Currently the tourism product offered in Victoria Falls and Livingstone takes the form of adventure and wilderness tourism with a focus on offering unique

66
adrenalin- and nature-based tourist activities, not offered elsewhere in the region. This study has estimated that tourism in Victoria Falls contributes 29% of the value added by tourism in Zimbabwe, i.e. directly and indirectly contributing approximately 0.9% of the country’s GDP. In Livingstone the corresponding figure represents 11% of the value added by tourism in Zambia contributing approximately 0.4% to total GDP. The tourism activities in the Gorge contribute approximately 17% to the total tourism GVA in the study area. Therefore, these activities alone contribute approximately 0.1% of the GDP in Zimbabwe and 0.1% of the GDP in Zambia. The natural landscapes both above and below Victoria Falls contribute significantly to tourists deciding to visit the area. The Batoka Gorge is one of the very few remaining untouched and completely wild stretches of river in the region, and in the world, and it is this exclusivity and “wow factor” that contributes hugely to the appeal of the area as a tourist destination. Changes to these landscapes and to the activities offered in the area are expected to impact tourism significantly. Construction of the proposed BGHES will potentially alter the tourism product on offer and will also possibly alter the type of tourist expected to visit. The type of tourist will potentially change from younger more adventurous tourists to older, less active tourists interested in visiting the area mainly with the intention of viewing Victoria Falls, a trend already observed but will likely be exacerbated. This will result in fewer activity sales throughout the year as well as a decrease in the average number of days tourists spend in the area. Tourists visiting a number of countries in the region, such as Botswana, Namibia and South Africa could decide to spend longer in these countries and not visit the study area if certain activities were no longer offered. Younger tourists spoken to whilst in the study area in 2015 indicated that they enjoyed the experience of the adventure and cultural activities more than they did the viewing of Victoria Falls, and indicated that they would definitely spend less time in the area if the activities changed. One of the most popular of these adventure activities is white-water rafting which has been operating in the Batoka Gorge for more than 30 years. Construction of the proposed BGHES at the proposed FSL 757m ASL during the wet, high-water season and FSL 730m ASL during the dry, low-water season will alter white-water rafting, birding and hiking, and will change the landscape downstream of Victoria Falls permanently. The white-water rafting industry as well as other activity providers and accommodation establishments operating in the Gorge provide employment to a significant number of people, most of which are from the communities situated along the Gorge. Based on data collected from tourism businesses that operate in the Gorge, it is estimated that between 400 and 450 staff are employed by the accommodation establishments and activity providers together. This represents a significant contribution to employment and daily household income in the study area. The majority of accommodation establishments and activity providers have been in operation for longer than 20 years and the relationships formed with local communities are well developed. Those employed in the tourism industry are able to contribute significantly to household income. Whilst in the study area, a local rafting guide who has been employed in the rafting industry for 15 years explained how rafting had contributed significantly to daily income and had also contributed positively to the livelihood of his extended family. Part time and casual employment also offers an alternative when agriculture is limited or when crops fail in seasons

67
of poor rainfall. Loss of employment is estimated to have far reaching negative impacts in an area already struggling with low household income and unemployment. In Livingstone the majority of tourism businesses interviewed, as well as other locals spoken to whilst on site, were against the construction of the proposed BGHES and believed that the impacts would be catastrophic for their businesses and for the tourism industry in Livingstone. For a small few, they saw the proposed dam as a way to ‘kick-start’ the recently lacklustre tourism industry in Livingstone. However, every person spoken to believed that the impacts of the proposed BGHES would be much greater and more widespread than anticipated. Many voiced their concerns over the possible delisting of the Falls as a UNESCO World Heritage Site as well as the international perception that the construction of the proposed BGHES will have on tourism. In Victoria Falls the tourism businesses interviewed were not as candid in their responses. One third of the businesses were of the opinion that the proposed BGHES could provide new opportunities and have some positive impact in terms of power generation and local development but also emphasised that the impacts of the dam on tourism should be kept to an absolute minimum where possible. Two thirds were of the opinion that the proposed BGHES should not go ahead and that the impacts on their businesses and on tourism in Victoria Falls would be significant. A number of these businesses were also concerned about the delisting of the Falls as a UNESCO World Heritage Site and the impact this would have on tourism in the area. The construction of the proposed BGHES could result in a number of negative social implications resulting in economic impacts to the area. These include increased crime rates as a result of easier access between Zambia and Zimbabwe across the Gorge and the proposed reservoir as part of the proposed BGHES. Currently the river and the Gorge are very difficult to cross and illegal crossings are rare. Monitoring this and other criminal activities, such as prostitution, which will arise if new towns either side of the dam are developed and trucks are diverted to this crossing point (see Social Impact Report). These social impacts could influence new business development in the study area and would also influence tourist perceptions of the area. Based on the above and the baseline data collected during this study, it is estimated that the local area economic impacts associated with the proposed BGHES (FSL 757m ASL during the wet, high-water season and FSL 730m ASL during the dry, low-water season) will be significant and will alter the “sense of place” and tourism product currently offered in Livingstone and Victoria Falls. Certain adventure- and nature-based activities that have been offered for more than thirty years will no longer operate and the knock-on effects of this are estimated to be large. However, tourism is adaptive and estimating the magnitude of the impact is difficult due to the uncertainty involved. Significance of impact (Pre-mitigation)
Based on the analysis provided above, it is assessed that the economic impact relating to the construction of the proposed BGHES will be a “Moderate - Major Impact” pre-mitigation (refer to Table 32). This is based on the magnitude of

68
the impact being assessed as Medium to Large. There is some uncertainty involved in trying to estimate the magnitude of the impacts due to the knock-on effects associated with tourism.
Table 32. Rating of Socio-economic Impacts (Pre-Mitigation)
Type of Impact Direct Negative Impact
Rating of Impacts Characteristic Designation Summary of Reasoning
Extent Regional The impact will be largest in Victoria Falls and Livingstone but is not completely confined to these two towns and will affect users on both sides of the river/border and the communities along the Batoka Gorge.
Duration Permanent The impact will be permanent. Scale Large Direct and indirect economic impacts such as job losses, decreased
household income, decreased business revenue and the complete loss of certain activity businesses. Possible change to tourism product and change in type of tourist visiting the area. Possible social implications as a result of the proposed BGHES could see decreased investor and business confidence in the area.
Frequency Constant The occurrence will be permanent once the dam is built Likelihood Likely The impact is a direct consequence of the reservoir impoundment.
Magnitude Medium - Large
Sensitivity/Vulnerability/Importance of the Resource/Receptor Medium
The vulnerability and importance of these resources is rated as medium, as there is some opportunity to adapt within the tourism industry.
Significance Rating Before Mitigation Moderate - Major
Mitigation
The tourism sector is relatively dynamic and constantly changes as a result of both local, regional and international influences and impacts, such as economic recessions and political instability. The tourism sectors in Zambia and Zimbabwe are sensitive to these changes, as experienced over the last decade. Significant changes to the current tourism product, as a result of the proposed BGHES, are estimated to have significant impacts on the current tourism market. The only available mitigation measures for the tourism industry in the study area include developing and promoting a new type of tourism market. Most tourists are coming to the area with the intention to view the Victoria Falls. The change in the activities that are available below the Falls will change the type of tourist interested in coming to the area and may also have an impact on the overall numbers of visitors to the area. New tourist activities could be developed and promoted in the affected area. These new business ventures would be expected to offer new employment opportunities in the area. It is anticipated that these new activities cannot

69
simply replace the activities currently offered in the Gorge as the experience and product offered will be completely different. The new activities might be similar to the activities already on offer upstream of Victoria Falls and on Lake Kariba which is approximately 50 km away from the proposed BGHES site. Potential activities offered on the reservoir could include house boats, motor boat activities, dam cruises, canoeing, birding (waterfowl) and angling. All of these are on offer in the area already and it is therefore very unlikely that they will form the primary reason for tourists to visit the area like white-water rafting currently does. It is important however to ensure that the activities developed on the reservoir do not flood the market and impact negatively on the activity businesses upstream of Victoria Falls or on Lake Kariba. In order for these activities to be successful the tourist market and visitor numbers need to be assessed to determine accurately the carrying capacity of the reservoir area and the supply and demand of the market. It is recommended that a comprehensive tourist survey be conducted during the high season months to determine accurately what activities would be the most popular amongst tourists and which activities would not. In doing so, a more focused tourism product can be developed that will attract tourists to the area and will encourage the promotion of new activities. The construction of small to medium sized safari lodges and tented camps downstream of Victoria Falls in the vicinity of the proposed reservoir could encourage tourists to overnight in the area and to participate in new activities developed on the reservoir. These accommodation facilities would be expected to benefit local communities through employment opportunities and local community development projects. The very limited mitigation options available focus on tourism marketing and the development of new tourism activities. As described above, these activities are not very promising, especially when compared to the current activities on offer. The businesses and people that lose out from the construction of the proposed BGHES therefore need to be fully compensated (as explained in Section 2.1and 2.2above). Some of these businesses will be forced to shut down completely, whereas others may lose in the form of decreased business sales. In certain cases, compensation may be relatively straightforward to calculate, but in other cases will prove to be extremely difficult. Further consultation with these stakeholders will be required in order to establish acceptable terms. Residual Impact
Based on the analysis provided above, it is assessed that the socio-economic impacts of the proposed BGHES will be a “Moderate Impact” post-mitigation (refer to Table 33). This is based on the magnitude of the impact being assessed as Medium. There will be a resultant clear difference from baseline conditions and the impacts will affect a number of people and businesses in the region but there is some ability to adapt to change brought on by the Project.

70
Table 33. Rating of Residual Socio-economic Impacts (Post-Mitigation)
Rating of Impacts Characteristic Designation Summary of Reasoning
Extent Regional The impact will be largest in Victoria Falls and Livingstone but is not completely confined to these two towns and will affect users on both sides of the river/border and the communities along the Batoka Gorge.
Duration Permanent The impact will be permanent. Scale Medium Direct and indirect socio-economic impacts such as some possible
job losses and decreased business revenue and the potential loss of certain activity businesses. Improved by the possible development of new activities and facilities surrounding the reservoir which will have positive impacts on employment.
Frequency Constant The occurrence will be permanent Likelihood Likely The impact is a direct consequence of the reservoir impoundment.
Magnitude Medium
Significance Rating After Mitigation Moderate
2.5 IMPACT ON BROADER SOCIETY
It is important to note and consider the cumulative effects of the proposed BGHES. These effects relate to both the use and non-use values associated with the Batoka Gorge and the impacts they have on broader society. A very similar project is currently underway in the upper Nile Valley near Jinja in Uganda and highlights the complexities involved and the impacts that are felt by locals and by broader society. Tourism businesses and locals are petitioning hard to prevent the complete loss of white-water rafting and associated tourism in the Jinja area. These petitions have garnered signatures from people all over the world, who have either visited the area before or who want to visit the area in the future. Construction of the proposed Isimba Hydro Power Project downstream of the Bujagali hydro-electric dam is underway and once built will remove all rapids currently used for white-water rafting. When the Bujagali Dam was constructed and eliminated some of the white-water rafting, one of the mitigation measures and agreements was to ensure that the stretch of river downstream be protected so that rafting, kayaking and other tourism activities were not impacted further. However, this agreement has not been upheld and construction of Isimba is already underway. The tourism and economic impact assessment recommended that the lowest wall height option be considered to allow white-water rafting and other activities to continue operating on the river. The economic assessment found that tourism generated by the area was a major contributor to the national economy, as is the case with this study, and that the area has important existence and option value associated with it. It is anticipated that white-water rafting on the Upper Nile will be completely lost and the associated tourism sector in Jinja will be significantly negatively affected. Similar ramifications can be expected for this

71
project. The fact that the main alternative site in Africa for high quality white-water rafting is also under threat further exacerbates the impacts of this project. Given the rarity of natural features of this kind, the existence value associated with the Batoka Gorge is likely to be significant at a global scale, and it is expected that society’s willingness to pay for its protection and continued existence would be considerable. The proposed BGHES will have an irreversible and permanent impact. The non-use value associated with the Batoka Gorge is difficult to quantify and is, to a degree, invaluable and needs to be considered when estimating and describing the overall magnitude of the economic impact associated with the construction of the proposed BGHES. Option value, the value of having the option to use the resource within an area in the future, also needs to be considered. Members of society who wish to visit the Batoka Gorge in the future, or to white-water raft the Zambezi, will no longer have the option available to them if the dam is constructed. Such losses will impose changes to an individual’s or community’s future options. Although difficult to quantify, the option value would be significant and is viewed as extremely important by individuals and society as a whole. These losses are unlikely to ever be adequately compensated, if at all.

72
3 CONCLUSIONS AND RECOMMENDATIONS
3.1 CAVEAT
This study was focused on the local economic impacts of the proposed BGHES. It does not consider the broader economic implications of electricity and associated income generation for Zambia and Zimbabwe, or the region as a whole. It is assumed that the ultimate decision as to whether construction of the proposed BGHES should go ahead will take this into account. At a local level, the impacts of the proposed BGHES will be significant and negative. Mitigation options that do not affect the viability of the project are limited. It must be noted that compensation will not be able to cover all of the residual negative impacts that remain after other forms of mitigation. This includes the loss of sense of place, loss of non-use values held by society as a whole, and the loss of livelihoods for people that have few alternatives, even after retrenchment, or for people who obtained benefits informally who may fail to be considered in the compensation process for various reasons. Thus, even with mitigation, the project can only go ahead if the overall benefits make all of these costs strongly justifiable. Should this be the case, then the following should be considered.
3.2 MITIGATION OF IMPACTS
This study has evaluated the proposed BGHES at the lowest viable dam height. In other words, mitigation in terms of lowering the dam height has already been spoken for. The only further mitigation may be to develop alternative tourism ventures in the Gorge and in the area as a whole, that focus on the new reservoir created by the dam, as well as on other attractions. While this will not reduce the loss of the sense of place of the area, it may help to reduce losses in tourism-related income and employment in the area. However, since tourism development within the gorge is unlikely to hold much potential (as discussed above), it may be better to develop and/or improve other forms of tourism in the area. This would have to be done very carefully, so as to improve the attractiveness of the area as a destination, without further impacting on its existing sense of place.
3.3 COMPENSATION
Certain activity businesses are expected to cease, and many other businesses in the area are expected to suffer losses in trade as a result of changes in tourism demand in the area. Thus impacts on businesses will range from total closure to minor losses. Such losses that are incurred as a result of the Project should be compensated. This should include the payment of retrenchment packages by those employers. Once approval for the Project has been granted all affected parties (businesses and employees) within the study area become eligible for compensation.

73
Qualified social and economic consultants should be appointed to help with the investigative compensation process and with helping those affected parties who are unsure about compensation to understand the process fully. The following procedural guidelines are recommended:
Registration: all affected parties and potential claimants must be identified and formally registered on a Project register database.
Details of claim: all potential claimants must be interviewed and the nature and details surrounding each claim should be documented with documentation as provided by the claimant (extent of loss, impact on livelihood). The information collected about the individual or the business must be as detailed as possible.
Investigation: Each claim must be investigated thoroughly and this should include cross-referencing information collected from each claimant with records obtained from local government departments, baseline survey information, and other formal structures such as community leaders where applicable.
Decision: each claim must be individually addressed and investigated. Once this process in complete a decision on whether to award or decline the claim should be made. Details about how the claim will be paid out should be decided at this point. Compensation offers should be formulated and signed by both parties.
Recording: All claims decisions should be recorded and kept for auditing and reference purposes.
3.4 MONITORING
If the Project is approved, it is recommended that the potential impacts of the BGHES on tourism in the study area be monitored over time. Monitoring should include an annual survey of tourists visiting Victoria Falls and Livingstone and the annual collection of data from tourist accommodation establishments in the study area. Monitoring should commence before the start of the Project and should continue throughout the construction process. A detailed tourist accommodation inventory for the study area needs to be developed and should include information about the type and size of every establishment found in Victoria Falls and Livingstone. This information should be monitored and updated annually. A selection of different accommodation establishments (large hotels, backpackers, lodges and guesthouses) should be monitored each year and bed occupancy data collected from each establishment selected for monitoring. All of the accommodation establishments located along the Gorge or with views of the Gorge should be included in the monitoring process. It is also recommended that these establishments record information about their guests, such as nationality, average length of stay and the activities guests participate in. This information should be collected and monitored along with bed occupancy rates. Through this approach any changes to tourism in the study area can be consistently evaluated over time.

74
4 REFERENCES
Abel, S., Nyamadzawo, J., Nyaruwata, S. & Moyo, C. 2013. Positioning the Zimbabwe tourism sector for growth: issues and challenges. Report prepared by Nathan Associates for USAID Strategic Economic Research & Analysis – Zimbabwe (SERA).
Africa Albida Tourism. 2017. A tourism survey of the Victoria Falls region. Banda, B. & Cheelo, C. 2012. The costs and pricing of tourism in Zambia. The
case of Livingstone. Zambia Institute for Policy Analysis and Research. Chaunga, C., Morel, M., Kaunda, A., Siwale, A., Mwila, B. S., Mtawali, M. 2013.
Efficient and effective marketing of Zambia as a globally recognised leading tourist destination. Tourism and Wealth Series. Policy Monitoring and Research Centre. Policy Brief Two.
DCDM Consulting. 2006. Livingstone Tourism Survey. Support for Economic Expansion and Diversification (SEED) Project. Submitted to Ministry of Tourism, Environment and Natural Resources, Zambia. SEEDPCU/SP/08-05/RFP.
Dixey, L. 2005. Inventory and analysis of community based tourism in Zambia. Report prepared for: Production, Finance and Technology (PROFIT) A USAID Private Sector Development Programme.
Karambakuwa, R. T., Shonhiwa, T., Murombo, L., Mauchi, F. N., Gopo, N. R., Denhere, W., Tafirei, F., Chingarandem, A. & Mudavanhi, V. 2011. The impact of Zimbabwe Tourism Authority initiatives on tourist arrivals in Zimbabwe 2008 – 2009. Journal of Sustainable Development in Africa 13(6): 68-77.
McGowen, G. J. 2007. Strategic planning for pro-poor tourism: a case study of Livingstone, Zambia. MSc Thesis, University of British Columbia.
Pope, A. 2005. Luangwa Safari Association Tourism Study. Whydah Consulting Ltd.
Rogerson, C. M. 2004. Adventure Tourism in Africa: The Case of Livingstone, Zambia. Geography 89(2): 183-188
Suich, H., Busch, J. & Barbancho, N. 2005. Economic Impacts of Transfrontier Conservation Areas: Baseline of Tourism in the Kavango-Zambezi TFCA. Conservation International South Africa and Swiss Agency for Development and Cooperation.
UNESCO 2014. Mosi-oa-Tunya/Victoria Falls. Advisory Body Evaluation Report. http://whc.unesco.org/en/list/509/ Accessed 23.02.15.
World Travel and Tourism Council (WTTC). 2014a. Travel and Tourism Economic Impact 2014: Zimbabwe
World Travel and Tourism Council (WTTC). 2014b. Travel and Tourism Economic Impact 2014: Zambia.
World Travel and Tourism Council (WTTC). 2018a. Travel and Tourism Economic Impact 2018: Zimbabwe
World Travel and Tourism Council (WTTC). 2018b. Travel and Tourism Economic Impact 2018: Zambia.
Zambia Central Statistical Office. 2012. 2010 Census of Population and Housing: National Analytical Report.
Zambia Ministry of Tourism and Arts. 2014. 2013 Tourism Statistical Digest.

75
Zambian Development Agency. 2014. Tourism Sector Profile Report. Zimbabwe Tourism Authority (ZTA). Annual Tourism Trends and Statistics
Reports 2000 – 2013. www.zimbabwetourism.net. Zimbabwe Tourism Authority (ZTA) Database. Provided by the local Victoria
Falls ZTA office for this study. ZimStat. 2012. Zimbabwe Population Census 2012: National Report. ZimStat. 2012. Zimbabwe Population Census 2012: Matebeleland North
Provincial Report.
Cost Benefit Analysis Specialist Study (2015)

Economic Feasibility of the Proposed Batoka Gorge Hydroelectric Scheme i
Economic Feasibility - Batoka Gorge
Hydroelectric Scheme
Prepared for ERM Southern Africa

Economic Feasibility of the Proposed Batoka Gorge Hydroelectric Scheme i
Economic Feasibility: Proposed Batoka Gorge Hydroelectric Scheme
Prepared by:
Barry Standish Antony Boting
John White
3 February 2016
Stratecon is a 2014 joint venture between Economics Information Services (EiS) and Strategic Economic Solutions (SES). EiS
was started in 1992 by Barry Standish. SES was started in 2003 by Antony Boting. The two companies collaborated for several
years before the merger.
Barry Standish is visiting Professor of Economics at the Rotterdam School of Management, Erasmus University, the
Netherlands. He was, until 2013, a senior economist at the UCT Graduate School of Business. He holds a Masters Degree in
economics and has been consulting to industry since 1992. Barry’s key specialisation is economic modelling.
Antony Boting is a Civil Engineer who changed to economics. His engineering background provides insight into the evaluation
of the large scale infrastructural projects that Stratecon often analyses. He holds a Masters Degree in Civil Engineering and a
Masters in Business Administration (MBA) from the University of Cape Town.
Revision History
This section outlines the revisions to the report that was tabled on 3 February 2016
Date Page/Section Made by:
5 Feb 2106 iii) ESIA needs Barry/Antony
Abbreviations moved to
above ES
Barry/Antony
P29 Two Peak load cases Barry/Antony
P34 footnote 12 elaborated Barry/Antony

Economic Feasibility of the Proposed Batoka Gorge Hydroelectric Scheme ii
Abbreviations
BCR Benefit Cost Ratio
CBA Cost Benefit Analysis
ESIA Environmental and Social Impact Assessment
FSL Final Supply Level
GDP Gross Domestic Product
GWh Gigawatt hour
HES Hydroelectric Scheme
IRR Internal Rate of Return
MW Megawatt
NPV Net Present Value
PV Present Value
REA Rural Electrification Agency [Zimbabwe]
REMP Rural Electrification Masterplan [Zimbabwe]
SAM Social Accounting Matrix
SAPP Southern African Power Pool
ZESCO Zambia Electricity Supply Corporation
ZRA Zambezi River Authority

Economic Feasibility of the Proposed Batoka Gorge Hydroelectric Scheme iii
Executive Summary
ERM Southern Africa is currently conducting an Environmental and Social Impact
Assessment (ESIA) of the proposed Batoka Gorge Dam and Hydroelectric Scheme for the
Zambezi River Authority (ZRA). The hydroelectric scheme is situated upstream of the
existing Kariba Dam scheme on the Zambezi River and approximately 50km downstream of
the Victoria Falls, a world heritage site. A number of specialist studies have already been
completed, including a specialist economic assessment by Anchor Environmental
Consultants that focuses on the localised microeconomic impact on the affected tourism
related firms in the gorge. The ZRA has requested an economic cost benefit analysis to
weigh the potential negative localised economic impact and the environmental impact of the
hydroelectric scheme against the positive regional impacts.
This economic report is not a full Economic Specialist report as required by an ESIA. It
focusses purely on the economic efficiency of the project and the distribution of the costs
and benefits through Zambia and Zimbabwe. An economic specialist report should be
coached within the equity, efficiency and sustainability parameters. This report not assess
alternative electricity generation plants, the fit with the legislative, regulatory and policy
framework of the two countries nor the economic equity and sustainability of the various
alternatives (and their associated risks).
Project Description and Study Approach
The key components of the proposed scheme are:
• Dam wall, impoundment and spillway: the proposed high gravity arch dam wall
would be 181m in height. The full supply level (FSL) of the reservoir would be 762m
above mean sea level;
• Power houses: Two powerhouses, each with an installed capacity of 1 200 MW,
would be constructed on each river bank;
• Transmission lines in Zambia and Zimbabwe;
• Access roads in Zambia and Zimbabwe;
• Permanent villages and other ancillary infrastructure (such as quarries, spoils area,
construction camps and batching areas).
The underlying assumption in the analysis is that both Zambia and Zimbabwe currently have
insufficient electricity. The electricity generated by the proposed Batoka Gorge Hydroelectric

Economic Feasibility of the Proposed Batoka Gorge Hydroelectric Scheme iv
Scheme would be used to service the unserved demand and future economic growth. Any
surplus would be exported to the Southern African Power Pool (SAPP).
The following cases are evaluated in the cost benefit analysis:
• Case 1 – base case. The scheme as presented in the Options Assessment Report
with an FSL of 762m, producing 10 215 GWh of annual electricity.
• Case 2. Variations in final supply levels. These are 757m, 740m and 730m in the
FSL;
• Case 3. Variations in electricity demand.
• Case 4. Lower water storage during the dry season.
• Case 5. This is the base case with peak load electricity exported to the SAPP at peak
power prices. Two cases were investigated here.
Baseline Assessment
In Zambia, a number of new generation options are either being planned or commissioned.
A number of smaller power stations (maximum installed power of 300 MW) began
generating in 2014 and 2015. Two larger power plants, Batoka Gorge (800 MW or
1 200 MW) and Kafue Gorge Lower (750 MW) are expected to begin generating electricity in
2022 (Studio Pietrangeli, 2015, p. 123). It is expected that there would be an estimated
unserved demand of 227 MW in Zambia when the proposed Batoka Gorge hydroelectric
scheme starts operating in 2022.
At the same time, it is estimated that there would be unserved demand of 444 MW in
Zimbabwe that would be supplied by Batoka Gorge. A number of power stations, the
majority of which are coal fired, are expected to be commissioned between 2016 and 2020
(Studio Pietrangeli, 2015, p. 121). The larger ones, include CASECO (600 MW) and Hwange
7 & 8 (600 MW).
The generation capacity of Batoka Gorge needs to be seen in the context of the total power
generation and demand of the two countries. Under the base case the:
• Installed Power (MW) of Batoka Gorge would cover:
o 38% of the peak demand for Zambia in 2025 and 29% in 2030.
o 37% of the total peak demand for Zimbabwe in 2025 and 32% in 2030.
• The generation in GWh would generate sufficient electricity to supply:
o 23% of the generation forecast in Zambia in 2025 and 18% in 2030.
o 29% of the generation forecast of Zimbabwe in 2025 and 25% in 2030.

Economic Feasibility of the Proposed Batoka Gorge Hydroelectric Scheme v
The motivation for the proposed Batoka Gorge Hydroelectric Scheme is that it would provide
electricity at a cost that would be considerably lower than most of the reasonable
alternatives:
• In Zambia Batoka Gorge:
• is expected to generate the fourth cheapest electricity of the seventeen planned
power plants in Zambia (Studio Pietrangeli, 2015, p. 130);
• It is only slightly more expensive than the cheaper options;
• It is the largest planned power generation plant estimated to produce electricity less
than half the price of electricity produced by Kafue Gorge Lower, the other large
planned power station.
• In Zimbabwe:
• None of the power stations in Zimbabwe are expected to generate electricity at a
lower cost than Batoka Gorge;
• The cost of electricity generation from large coal fired power stations (such as
CASECO and Hwange) would be up to four times higher than Batoka Gorge.
Costs and Benefits
There are four types of costs:
• The first are those that are the direct result of the building and running of the
proposed Batoka Gorge Hydroelectric Scheme. These are divided into construction
(capital), running (operation and maintenance) and financing costs.
• The second are those for households which, faced with being able to use newly
supplied electricity, need to spend on connection costs and electrical appliances.
• The third is firms which have three types of costs. These are connections cost, fuel
for generators and the cost of lost productivity.
• The final cost is the potential negative impact on tourism in the area around the
proposed hydroelectric scheme.
There are many benefits from new electrical connections or more reliable electricity
generation. These accrue to both households, firms and the electricity utility:
• Firms:
o Savings in generator costs;

Economic Feasibility of the Proposed Batoka Gorge Hydroelectric Scheme vi
o Savings from fewer power outages.
• Households:
o Alternative fuel savings;
o Increased income;
o Health benefits.
• Electricity Utility:
o Export revenue.
Results of the Economic Analysis
Cost Benefit Analysis
• Case 1: Base case, with an FSL of 762m:
o The NPV is R11 625m. This is economically efficient and would benefit both
Zambia and Zimbabwe.
o The BCR is 4.71. This means that for every $1.00 spent on the project
society would benefit by $4.71. This is a robust result.
o The IRR is 28%.
• Case 2: Different dam heights: There are lower costs and benefits with a lower dam
wall. Benefits reduce more proportionately than costs. The BCR and IRR for an FSL
of:
o 762m (base case) are 4.71 and 28% (as reported above);
o 757m are 4.63 and 28%;
o 740m are 4.08 and 26%;
o 730m are 3.77 and 25%.
• Case 3: Variations in electricity demand: The proposed scheme remains
economically efficient even with substantial changes to projected demand.
• Case 4: Lower water storage in the dry season:
o The NPV would drop from $11 625m to $9 296m;
o The BCR reduces from 4.71 to 3.98 and the IRR from 28% to 26%.
• Case 5: Exporting peak load power: The efficiency of the proposed scheme
increases if the peak load could be generated and exported at a premium to the
SAPP. The BCR and IRR for:
o Peak case 2 increase to 5.19 and 32%;
o Peak case 3 increase to 5.17 and 32%
The conclusion to the cost benefit analysis is that:

Economic Feasibility of the Proposed Batoka Gorge Hydroelectric Scheme vii
• Operating the dam at its highest level is economically the most efficient.
• Variations in demand for electricity would not change the economic efficiency
provided surplus electricity could be exported to the SAPP.
• Operating at less than capacity during the dry season reduces the economic
efficiency. It also would make hardly any difference to the impact on the income of
tourist operators. Mitigation would be improved by financial compensation to these
operators. This would remain efficient so long as the compensation is not relocated
to other countries.
• Exporting peak load electricity to the SAPP would improve the efficiency of the
project.
A sensitivity analysis was conducted on a number of assumptions for the base case (FSL of
762m) and case 4 (lower water storage in the dry season). The results were most sensitive
to changes in the distribution of unserved demand (between households and firms) and the
cost of lost production for firms without generators. However, the results remained
economically efficient for the tested range.
Macroeconomic Analysis
In Zambia the total contribution to GDP of the base case:
• Is largely constant over construction - between $107m and $105m.
• Increases to $706m by 2022 in the first year of operation and continues to increase
until 2030 as a result of savings from fewer power outages.
• By 2030 contribution to GDP is $1 117m.
• This drops slightly to $1 113m by 2035 because of falling tourism revenues.
In Zimbabwe the total contribution to GDP of the base case:
• Is largely constant over construction - between $139m and $135m.
• Increases to $1 920m by 2022 in the first year of operation and continues to increase
until 2030 as a result of savings from fewer power outages.
• By 2030 contribution to GDP is $2 101m.
• This drops slightly to $2 095m by 2035 because of falling tourism revenues.
In total, contribution to GDP:
• Is largely constant over construction - about $240m.
• Increases to $2 627m by 2022.

Economic Feasibility of the Proposed Batoka Gorge Hydroelectric Scheme viii
• This is $3 208m by 2035.
Figure ES1: Detailed Contribution to Gross Domestic Product
In aggregate the proposed Batoka Gorge hydroelectric scheme would have added a
cumulative $1 458m to the GDPs of the two countries at the end of construction. By 2035
this cumulative contribution is estimated at $45 670m. The detailed contribution to GDP is
shown in Figure ES1.
The contribution of the proposed Batoka Gorge Hydroelectric scheme to job creation:
• Total direct jobs in the two countries are estimated to exceed 1 500 from the third
year of construction. The number of direct jobs then increases until stabilizing at
approximately 54 000 in 2030. The bulk of these jobs would be in the economies at
large of the two countries as a result of the improved supply of electricity.
• Total indirect jobs in the two countries are set to increase from around 11 900 in
2016 to approximately 94 000 in 2022. As business productivity increases so too do
the indirect jobs, until they total almost 110 000 by 2030 and 2035.
• Total jobs, which is the sum of the direct and indirect jobs, are set to increase from
12 465 in 2016 to 14 666 by the end of the construction period. They increase to
136 791 in 2022. They increase annually after that reaching approximately 164 000
by 2030.
-500
0
500
1 000
1 500
2 000
2 500
3 000
3 500
4 000
2016 2017 2018 2019 2020 2021 2022 2023 2024 2025 2026 2027 2028 2029 2030 2031 2032 2033 2034 2035
Co
ntr
ibu
tio
n t
o G
ross
Do
me
stic
Pro
du
ct (
US
$ m
illi
on
s)
Detailed Contribution to GDP
Initial Construction Costs Operations & Maintenance Professional Fees
Reduced Tourism Revenues Savings from Fewer Outages Exported Electricity

Economic Feasibility of the Proposed Batoka Gorge Hydroelectric Scheme ix

Economic Feasibility of the Proposed Batoka Gorge Hydroelectric Scheme x
Significance Ratings
All five cases that were assessed have major positive significance ratings.
The one necessary mitigation measure is for the negative impact of incomes on tourism
operators as a result of the adverse impact on tourist attractions:
• The initial mitigation that was tested was to lower the water storage in the dam during
the dry season. This made hardly any difference to the impact on the income of
tourist operators.
• A more effective mitigation measure would be direct financial compensation to
affected operators.
• Financial compensation would be economically efficient provided the compensation
remains in the countries.

Economic Feasibility of the Proposed Batoka Gorge Hydroelectric Scheme xi
Table of Contents
Revision History ..................................................................................................................... i
Abbreviations .........................................................................................................................ii
Executive Summary .............................................................................................................. iii
Table of Contents .................................................................................................................. xi
List of Tables ...................................................................................................................... xiv
List of Figures ...................................................................................................................... xv
1 Introduction .................................................................................................................... 1
1.1 Note of Clarification ................................................................................................. 1
1.2 Declaration of Independence .................................................................................. 1
1.3 Objectives ............................................................................................................... 2
1.4 Report Structure ..................................................................................................... 2
2 Project Description and Study Approach ........................................................................ 3
2.1 Project Description .................................................................................................. 3
2.2 Study Approach ...................................................................................................... 5
3 Baseline Assessment ..................................................................................................... 6
4 Limitations .................................................................................................................... 10
5 Understanding the Economic Analysis ......................................................................... 11
5.1 Direct Benefits and Cost Benefit Analysis ............................................................. 11
5.1.1 Negative Costs and Benefits ............................................................................ 12
5.2 Secondary Benefits and Macroeconomic Analysis ................................................ 12
5.3 Cost and Benefit Differences in the Two Approaches ........................................... 14

Economic Feasibility of the Proposed Batoka Gorge Hydroelectric Scheme xii
6 Costs and Benefits ....................................................................................................... 16
6.1 Costs .................................................................................................................... 16
6.1.1 Project ............................................................................................................. 16
6.1.2 Firms ............................................................................................................... 19
6.1.3 Households ...................................................................................................... 19
6.1.4 Tourism ........................................................................................................... 20
6.2 Benefits ................................................................................................................. 22
6.2.1 Firms ............................................................................................................... 22
6.2.2 Households ...................................................................................................... 24
6.2.3 Exports ............................................................................................................ 25
7 Results ......................................................................................................................... 26
7.1 Cost Benefit Analysis Results ............................................................................... 26
7.1.1 Case 1: Base Case – Dam Height and FSL of 762m ....................................... 27
7.1.2 Case 2: Different Dam Heights ........................................................................ 28
7.1.3 Case 3: Variations in Electricity Demand ......................................................... 29
7.1.4 Case 4: Lower Water Storage in Dry Season ................................................... 29
7.1.5 Case 5: Exporting Peak Load Power .............................................................. 30
7.1.6 Base Case Sensitivity Analysis ........................................................................ 31
7.1.7 Conclusion to the Cost Benefit Analysis ........................................................... 35
7.2 Macroeconomic Results ........................................................................................ 36
7.2.1 Gross Domestic Product .................................................................................. 36
7.2.2 Direct and Indirect Jobs ................................................................................... 39
8 Overall Assessment and Significance Rating of Impacts .............................................. 43

Economic Feasibility of the Proposed Batoka Gorge Hydroelectric Scheme xiii
8.1 Economic Feasibility: Case 1: Base Case – Dam Height and FSL of 762m .......... 43
8.1.1 Description of Effect ......................................................................................... 43
8.1.2 Assessment ..................................................................................................... 43
8.2 Economic Feasibility: Case 2: Different Dam Heights ........................................... 45
8.2.1 Description of Effect ......................................................................................... 45
8.2.2 Assessment ..................................................................................................... 45
8.3 Economic Feasibility: Case 3: Variations in Electricity Demand ............................ 47
8.3.1 Description of Effect ......................................................................................... 47
8.3.2 Assessment ..................................................................................................... 47
8.4 Economic Feasibility: Case 4 -Lower Water Storage in Dry Season ..................... 49
8.4.1 Description of Effect ......................................................................................... 49
8.4.2 Assessment ..................................................................................................... 49
8.5 Economic Feasibility: Case 5: Exporting Peak Load Electricity ............................. 51
8.5.1 Description of Effect ......................................................................................... 51
8.5.2 Assessment ..................................................................................................... 51
9 Conclusion ................................................................................................................... 53
Cost Benefit Analysis Results ...................................................................................... 53
Macroeconomic Results ...................................................................................................... 54
Significance Ratings ........................................................................................................... 55
10 Bibliography ................................................................................................................. 56

Economic Feasibility of the Proposed Batoka Gorge Hydroelectric Scheme xiv
List of Tables
Table 1: Installed Power, Costs and Annual Energy Produced ............................................. 4
Table 2: Peak Electricity Demand and Generation Forecast ................................................ 8
Table 3: Capital Costs for Various Installed Power Options................................................ 17
Table 4: Installed Power, Power Generated and Change in Costs for Varying Final Supply
Levels ................................................................................................................................. 17
Table 5: Local Tourism Affected by Batoka Gorge for Varying Final Supply Levels ............ 21
Table 6: Increase in Household Income Attributed to Electricity .......................................... 25
Table 7: Cost Benefit – Base Case .................................................................................... 27
Table 8: Cost Benefit – Different Final Supply Levels ......................................................... 28
Table 9: Cost Benefit Analysis for Variation in Electricity Demand for 762m FSL ............... 29
Table 10: Results of Scheme Operated at Lower Levels During Dry Season ..................... 30
Table 11: Cost Benefit – Exporting Peak Load Electricity ................................................... 31
Table 12: Unserved Demand in Zambia ............................................................................. 32
Table 13: Sensitivity Analysis of Unserved Demand in Zimbabwe ...................................... 32
Table 14: Households and Firm Distribution of Unserved Demand .................................... 33
Table 15: Sensitivity Analysis of Cost of Lost Production ................................................... 34
Table 16: Annual Growth in Demand for Electricity in Zambia ............................................ 34
Table 17: Sensitivity Analysis of Growth in Demand for Electricity in Zimbabwe ................ 34
Table 18: Changes in Real Rate Cost of Borrowing ........................................................... 35
Table 19: Contribution to GDP ........................................................................................... 36
Table 20: Direct Jobs ......................................................................................................... 39
Table 21: Indirect Jobs ....................................................................................................... 40

Economic Feasibility of the Proposed Batoka Gorge Hydroelectric Scheme xv
Table 22: Total Direct and Indirect Jobs ............................................................................. 41
Table 23: Significance Rating of the Proposed Batoka Gorge Hydroelectric Scheme at FSL
762m ................................................................................................................................... 43
Table 24: Significance Rating of the Proposed Batoka Gorge Hydroelectric Scheme with
FSLs less than 762m .......................................................................................................... 45
Table 25: Significance Rating of the Proposed Batoka Gorge Hydroelectric Scheme at FSL
762m and Variations in Demand ......................................................................................... 47
Table 26: Significance Rating of the Proposed Batoka Gorge Hydroelectric Scheme
Operated at FSL 740m during the Dry Season.................................................................... 49
Table 27: Significance Rating of the Proposed Batoka Gorge Hydroelectric Scheme at FSL
762m and Exporting Peak Load Electricity .......................................................................... 51
List of Figures
Figure 1: Physical Location of the Proposed Batoka Gorge Hydroelectric Scheme .............. 3
Figure 2: Available Capacity, Demand and Spare Capacity for Zambia................................ 7
Figure 3: Available Capacity, Demand and Spare Capacity for Zimbabwe ........................... 8
Figure 4: Detailed Contribution to Gross Domestic Product ................................................ 38
Figure 5: Contribution to Direct and Indirect Jobs and Gross Domestic Product ................. 41
Economic Feasibility Analysis of the Proposed Batoka Gorge Hydroelectric Scheme 1
1 Introduction
ERM Southern Africa is currently conducting an Environmental and Social Impact
Assessment (ESIA) of the proposed Batoka Gorge Dam and Hydroelectric Scheme for the
Zambezi River Authority (ZRA). The hydroelectric scheme is situated upstream of the
existing Kariba Dam scheme on the Zambezi River and approximately 50km downstream of
the Victoria Falls, a world heritage site. A number of specialist studies have already been
completed, including a specialist economic assessment by Anchor Environmental
Consultants that focuses on the localised microeconomic impact on the affected tourism
related firms in the gorge. The ZRA has requested an economic cost benefit analysis to
weigh the potential negative localised economic impact and the environmental impact of the
hydroelectric scheme against the positive regional impacts. This report performs the cost
benefit analysis and the macroeconomic analysis.
This report focuses only on the economic costs and has not attempted to quantify the
environmental costs. These need to be weighed against each other by the relevant decision
making authorities.
1.1 Note of Clarification
This economic report is not a full Economic Specialist report as required by an ESIA. An
economic specialist report should be coached within the equity, efficiency and sustainability
parameters. The focus of this report is on the economic efficiency of the project and the
distribution of the costs and benefits through the economies of Zambia and Zimbabwe.
The report does not assess:
• Alternative electricity generation plants;
• Fit with legislative, regulatory and policy framework of the two countries;
• Economic equity or sustainability and the associated risks.
1.2 Declaration of Independence
This is to confirm that Barry Standish and Antony Boting of Stratecon are independent and
have no vested or financial interests in the approval or disapproval of the proposed project.

Economic Feasibility Analysis of the Proposed Batoka Gorge Hydroelectric Scheme 2
1.3 Objectives
The objectives of this study are to determine the economic efficiency of the proposed
hydroelectric scheme. This is done by investigating the efficiency of the hydroelectric
scheme for a number of different cases. These are:
• Case 1: Base case. The scheme as presented in the Options Assessment Report
with an FSL of 762m, producing 10 215 GWh of annual electricity.
• Case 2. Variations in final supply levels. These are 757m, 740m and 730m in the
FSL;
• Case 3. Variations in electricity demand.
• Case 4. Lower water storage during the dry season.
• Case 5. The base case with peak load electricity exported to the SAPP at peak
power prices.
A macroeconomic analysis was done on the base case.
1.4 Report Structure
The report has eight further sections:
• Section 2 gives a description of the project and overall study approach;
• Section 3 provides a baseline assessment of the project;
• Section 4 presents the limitations faced by the study;
• Section 5 describes the economic analysis and how to interpret the results;
• Section 6 lists costs, benefits and derivation;
• Section 7 presents the results of the cost benefit macroeconomic analyses;
• Section 8 reports the assessed significance ratings;
• Section 9 concludes the report.

Economic Feasibility Analysis of the Proposed Batoka Gorge Hydroelectric Scheme 3
2 Project Description and Study Approach
This section gives a brief description of the proposed project and approach.
2.1 Project Description
A full description of the project is given in Chapter 2 of the Environmental Impact
Assessment Report.
The proposed Batoka Hydroelectric Scheme is located in the central portion of the Zambezi
River Basin and would extend across the international boundary between Zambia and
Zimbabwe. It would be situated upstream of the existing Kariba Dam hydroelectric scheme
on the Zambezi River and approximately 50 km downstream of the Victoria Falls. The
Victoria Falls (or Mosi-oa-Tunya Falls) was listed as a World Heritage Site in 1989
(UNESCO, 2016).
In Zimbabwe the proposed Batoka Gorge is situated within the province of Matabeleland
North and in the Hwange Rural District, while in Zambia the main area of direct impact falls
under the Southern Province in the Kazungula District. Electricity generated by the scheme
would serve both countries.
Figure 1: Physical Location of the Proposed Batoka Gorge Hydroelectric Scheme

Economic Feasibility Analysis of the Proposed Batoka Gorge Hydroelectric Scheme 4
The key components of the proposed scheme are:
• Dam wall, impoundment and spillway: the proposed high gravity arch dam wall
would be 181m in height. The full supply level (FSL) of the reservoir would be 762m
above mean sea level. After impoundment to the full supply level, the reservoir
surface area would cover approximately 23.0 km². The FSL of 762m has been
selected to ensure the backwaters from the resulting impoundment do not reach the
base of the Victoria Falls or flood the outlets of the existing Victoria Falls Power
Station, located in the region of Silent Pool.
• Power houses: In a 1993 feasibility study it was planned that two powerhouses,
each with an installed capacity of 800 MW, would be constructed on each river bank.
However, a later feasibility study suggested that the optimum installed capacity of
2 400 MW (1 200 MW on each river bank). This is shown in Table 1 where the ratio
of annual energy to total costs (last row of the table) derived from table 8.9 and figure
8.10 of the options assessment report (Studio Pietrangeli, 2015, p. 165) indicates
that the scheme with 2 410 MW and generating 10 215 GWh has the highest ratio.
Table 1: Installed Power, Costs and Annual Energy Produced
• Transmission lines in Zambia and Zimbabwe: in Zimbabwe the transmission lines
would comprise 2 x 70 km 330 kV lines, running in parallel to the existing Hwange
330 kV substation. In Zambia, two 330 kV transmission line routes are proposed,
each comprising two outgoing lines. The first routing is from Batoka, terminating at a
proposed new 330 kV ZESCO substation to be constructed in Livingstone; this route
would be 21 km long. The second line would run in parallel to the existing 220 kV
line, terminating at the Muzuma substation in Choma, a distance of approximately
160 km.
• Access roads in Zambia and Zimbabwe: the upgrading of existing roads and
construction of new roads to access each bank from the main roads linking
Livingstone to Lusaka (Zambia) and Victoria Falls to Bulawayo (Zimbabwe) would be
required.
• Permanent villages and other ancillary infrastructure (such as quarries, spoils area,
construction camps and batching areas): permanent villages would be located on
each side of the river. Construction camps would house approximately 3 000 staff
Installed Power - MW 1 620 1 950 2 410 2 920 3 720
Total Costs ($ millions) 2 300 2 433 2 625 2 848 3 155
Annual Energy (ave) - GWh 8 565 9 322 10 215 11 011 11 890
Annual Energy : Total Costs 3.72 3.83 3.89 3.87 3.77

Economic Feasibility Analysis of the Proposed Batoka Gorge Hydroelectric Scheme 5
(including security and support staff). It is proposed that the construction camps
would be converted into permanent villages, once operational, for staff and support
services personnel (customs, police etc.).
The project has no underground works. Due to the small storage capacity of the proposed
reservoir, the proposed scheme would be operated as a run-of-river project with storage only
sufficient to allow daily and weekly peaking but not for monthly or seasonal flow regulation.
2.2 Study Approach
In light of the note of clarification in the introduction, this section describes the approach to
the economic analysis of the project and the cases that were analyzed.
This study comprised a desktop study. The underlying assumption is that Zambia and
Zimbabwe currently have insufficient electricity (refer to Section 3 for supporting discussion).
The electricity would be used to address current power outages and future growth. Any
surplus would be exported to the Southern African Power Pool (SAPP).

Economic Feasibility Analysis of the Proposed Batoka Gorge Hydroelectric Scheme 6
3 Baseline Assessment
The purpose of this section is to acknowledge that a baseline assessment is necessary for a
study of this nature.
In the best of all worlds the following aspects would be included in a baseline assessment.
• A description of the relevant demographic profiles of Zambia and Zimbabwe.
• Levels of employment and income.
• The current electricity supply, demand and capacity situation.
• Description of the degree to which there are power outages and the number of firms
and households that are affected by these outages.
• Potential economic growth and development trends. The impact of these trends on
the demand for electricity.
• Alternative power generation options.
The major time constraints and terms of reference under which this study was undertaken
prevented a detailed assessment. The most critical part of this assessment is, arguably, the
current electricity supply, demand and capacity situation. It is this situation that provides
some context for the need for the proposed Batoka Gorge Hydroelectric Scheme.
The data and projections on which the current and expected electricity supply, demand and
capacity is based are drawn from the options assessment report. This, in turn, is based on
the business plans of the relevant authorities in each country.
The current and expected electricity capacity, demand and surplus capacity for Zambia is
given in Figure 2. As can be seen power shortages are expected in 2012 – 2014 and 2020
to 2021.
A number of new generation options are currently being either planned or commissioned. It
was expected that a number of smaller power stations (maximum installed power of
300 MW) would begin generating electricity in 2014 and 2015, while two larger power plants,
Batoka Gorge (800MW or 1 200 MW) and Kafue Gorge Lower (750 MW) would begin
generating electricity in 2022 (Studio Pietrangeli, 2015, p. 123). It is expected that when the
proposed Batoka Gorge hydroelectric scheme starts operating in 2022 there would be an
estimated unserved demand of 227 MW in Zambia.

Economic Feasibility Analysis of the Proposed Batoka Gorge Hydroelectric Scheme 7
Figure 2: Available Capacity, Demand and Spare Capacity for Zambia
The current and expected electricity capacity, demand and surplus capacity for Zimbabwe is
given in Figure 3. At the time that Batoka Gorge commences operations in 2022 there would
be an estimated unserved demand of 444 MW in Zimbabwe.
A number of power stations, the majority of which are coal fired, are expected to be
commissioned between 2016 and 2020 (Studio Pietrangeli, 2015, p. 121). Some of the
larger ones, such as CASECO (600 MW) and Hwange 7 & 8 (600 MW) are coal fired power
stations.

Economic Feasibility Analysis of the Proposed Batoka Gorge Hydroelectric Scheme 8
Figure 3: Available Capacity, Demand and Spare Capacity for Zimbabwe
The electricity that is expected from Batoka Gorge needs to be put into the context of the
total power generation and demand of the two countries. This is done in order to show the
size of the proposed Batoka Gorge scheme in relation to the total electricity supply of the
country. Table 2 below shows the estimated demand and supply forecasts for Zambia,
Zimbabwe and the Southern Africa Power Pool.
Table 2: Peak Electricity Demand and Generation Forecast
The generation capacity of Batoka Gorge needs to be seen in the context of the total power
generation and demand of the two countries. Under the base case the:
• Installed Power (MW) of Batoka Gorge would cover:
2012 2013 2014 2015 2020 2025 2030 2035 2040 2045
Peak Demand Forecast (MW)
Zambia 1 681 1 740 1 824 1 911 2 428 3 146 4 138 5 508 7 400 10 015
Zimbabwe 2 029 2 425 2 471 2 534 2 865 3 255 3 738 4 340 5 101 6 071
Generation Forecast (GWhr)
Zambia 11 781 12 195 12 781 13 390 17 017 22 049 29 000 38 602 51 866 70 188
Zimbabwe 11 025 13 177 13 428 13 766 15 568 17 688 20 310 23 583 27 715 32 987
SAPP Total 327 791 369 675 418 733 479 123 554 207 648 541 768 335

Economic Feasibility Analysis of the Proposed Batoka Gorge Hydroelectric Scheme 9
o 38% of the peak demand for Zambia in 2025 and 29% in 2030.
o 37% of the total peak demand for Zimbabwe in 2025 and 32% in 2030.
• The generation in GWh would generate sufficient electricity to supply:
o 23% of the generation forecast in Zambia in 2025 and 18% in 2030.
o 29% of the generation forecast of Zimbabwe in 2025 and 25% in 2030.
The motivation for the proposed Batoka Gorge Hydroelectric Scheme is that it would provide
electricity at a cost that would be considerably lower than most of the reasonable
alternatives:
• In Zambia Batoka Gorge:
• is expected to generate the fourth cheapest electricity of the seventeen planned
power plants in Zambia (Studio Pietrangeli, 2015, p. 130);
• It is only slightly more expensive than the cheaper options;
• It is the largest planned power generation plant estimated to produce electricity less
than half the price of electricity produced by Kafue Gorge Lower, the other large
planned power station.
• In Zimbabwe:
• None of the power stations in Zimbabwe are expected to generate electricity at a
lower cost than Batoka Gorge;
• The cost of electricity generation from large coal fired power stations (such as
CASECO and Hwange) would be up to four times higher than Batoka Gorge.
It would be recognized that many factors could affect the electricity projections outlined. For
example, the current drought has resulted in electricity shortages when surpluses were
expected. In addition, delays in approval might affect the timing of some of the planned
power plants. Changes in commodity prices might render some plants unfeasible. The
consequence is that a number of variations to the base case demand amounts described
above are investigated. A range in the unserved demand of both countries that is supplied
by Batoka is investigated. These results are discussed and presented in section 7.1.3.

Economic Feasibility Analysis of the Proposed Batoka Gorge Hydroelectric Scheme 10
4 Limitations
• The project has been contextualised within the current and proposed electricity
generation mix. However, no precise information on electricity generation has been
provided for alternative power plants.
• Annual average electricity, taking changes in river flow, have been used.
• A number of assumptions were made because of the time constraints. These
assumptions are described in the costs and benefits section. Some are varied in a
sensitivity analysis.
• This report looks only at quantifiable impacts. Some impacts, such as the non-use
value described in the Economic Specialist Report (Anchor Environmental
Consultants, 2015, p. 48) or the value in the loss of habitat have not been included.
These effects would need to be weighed by decision makers in when evaluating the
merits of the proposed scheme.

Economic Feasibility Analysis of the Proposed Batoka Gorge Hydroelectric Scheme 11
5 Understanding the Economic Analysis
There are a variety of different types of economic analysis, some of which can be quantified
and some of which cannot. The analyses that can be quantified include cost benefit analysis,
microeconomic costs and benefits, and macroeconomic analysis. Cost benefit and
macroeconomic analysis were used to analyse the proposed Batoka Gorge Hydroelectric
Scheme. The purpose of this section is to describe these types of analysis and explain how
to interpret the results.
5.1 Direct Benefits and Cost Benefit Analysis
An economic cost benefit analysis (CBA) was used to assess the economic efficiency of the
proposed Batoka Gorge Dam and Hydroelectric Scheme. CBA treats the national economy,
or in this case the two economies of Zambia and Zimbabwe, as entities in and of
themselves. It assumes, with some important caveats, that what is demonstrably good for
the two economies as a whole is a reasonable approximation of what would be good for the
majority of the people living and working in the countries.
When interventions like new electricity generation plants are contemplated, decision makers
need to know what impact the intervention would have on the economy as a whole and
hence how much benefit can be assumed to accrue.
The outcome of the analysis is the reporting of a net present value (NPV), a benefit cost ratio
(BCR) and an internal rate of return (IRR) for those cases where the project is compared to a
business as usual alternative. A NPV shows the total value of future costs and benefits
reduced to a present day value. This is done by using a social discount rate of 10% as
specified by international best practice and as used in the options assessment report (Studio
Pietrangeli, 2015, pp. 155, 176, 210 & 286). The BCR measures the changes in benefits and
costs that would result from an investment. BCRs are typically used when there are many
competing alternatives and projects need to be funded from a limited set of resources.
Finally, the IRR is the discount rate that returns a NPV of zero and shows the likely
economic returns to society of a project in relation to other investment opportunities.
If the evaluated benefits of a project are indeed greater than the overall project costs, then
the BCR would be greater than one. A BCR greater than one indicates that the completed
project would constitute an economic asset; a BCR less than one implies that the project
would be an economic liability. The higher the BCR the less risk there is that the proposed
investment could turn out to be less than viable economically. Low BCR’s, even if greater

Economic Feasibility Analysis of the Proposed Batoka Gorge Hydroelectric Scheme 12
than one, provide a warning that a project could be risky and may turn out to be an economic
liability.
A high BCR is usually a good indicator that it would be possible to raise finance to implement
a project. In the case of a private sector investment the high BCR would be part of the
business case to funders. A high BCR should give confidence that it is worth funding the
project directly from its Treasury if it is a public infrastructure project. Alternatively, provision
can be made with suitable institutional arrangements for the involvement of the private
sector in project funding.
An economic analysis includes all costs to society. This is done by adjusting for shadow
prices and wages and removing the distortions caused by taxes and subsidies.
The cost benefit analysis focuses purely on direct costs and benefits and does not take any
indirect costs and benefits into account. Indirect costs and benefits would include those
costs and benefits obtained through multiplier effects. For example, the construction of a
building would have spin off effects for the construction industry and the building materials
supply industries. These, in turn, would have backward linkages with other commodity
suppliers and retail industries.
5.1.1 Negative Costs and Benefits
In certain cases, the analysis may use negative costs and benefits. Albeit confusing, this
does follow international best practice. According to (Snell, 2011, p. 52) there may be
instances, for example, where there is a reduction in user costs. This is then used as a
negative cost in the analysis rather than a positive benefit. This does not change the IRR or
the NPV of the project. It does impact on the BCR. However, it cannot make an efficient
project inefficient.
5.2 Secondary Benefits and Macroeconomic Analysis
Cost benefit analysis takes into account first order costs and benefits. Macroeconomic
analysis takes into account second order benefits as well.
The size of a national or regional economy is measured in terms of the total of all economic
activities taking place within the area concerned, both in the public and private sectors. For
countries like Zambia and Zimbabwe this includes measures of informal sector activity. The
name given to the measure of the size of the economy is Gross Domestic Product (GDP).

Economic Feasibility Analysis of the Proposed Batoka Gorge Hydroelectric Scheme 13
The unit of measurement is the US dollar. Zimbabwean income is reported in US dollars.
Zambian outputs are also reported in US dollars for comparative purposes.
Underlying the measurement of GDP is the understanding that all economic activity is
dependent on the physical and institutional support systems that enable an economy to
operate effectively. These include the various levels of governmental structure, the legal
system, and the administrative, financial and educational infrastructure in the country. In
terms of physical infrastructure, all economic activity depends on water supply,
telecommunication, and transport infrastructure. The economy could not operate without all
of these systems being in place.
While there are a number of different types of macroeconomic effects, the two most
important are contribution to gross domestic product (GDP) and creation of jobs. The
importance of job creation is obvious. Increases in GDP are synonymous with increases in
peoples’ economic standards of living. Increased GDP – i.e. increased production – is
experienced in the form of more jobs, higher wages and reduced economic hardship. It is
clearly an important measure.
The effects of any infrastructure project on the size of the GDP arise as a result of the
myriad ways in which firms, public service providers and ordinary people find their normal
daily activities affected, hopefully for the better, by the changes brought about by the new
project.
The actual task of calculating the macroeconomic impact of the proposed project demands a
detailed and multifaceted approach not least because of the so-called multiplier effects. It is
well recognised that the simple act of spending – constructing a dam, for example - leads to
other economic effects. Demand for steel and cement can lead to increased production in
those industries. Increased demand for steel and cement, in turn, leads to increased
demand for mining output which uses wood, water, electricity and so on. These are the so-
called multiplier effects. While this process unfolds, each industry employs people and pays
wages. Employees, in turn, spend their wages and cause further multiplier effects through
the economy. Measuring this is further complicated by the fact that different industries
demand different types of skills. This leads to different wage structures across the various
industries. People earning different wages have different spending patterns. Thus, the
change in overall spending patterns is dependent on which industries are affected.
On a technical note, industry multipliers can be calculated either for economies that are
‘open or closed’ with respect to households. Closed multipliers are smaller than ‘open’

Economic Feasibility Analysis of the Proposed Batoka Gorge Hydroelectric Scheme 14
multipliers. The World Travel & Tourism Council publications, for example, uses ‘closed’
multipliers. In contrast Stratecon is of the opinion that households should be included and
‘open’ multipliers used. This is the case because some industry expenditure goes to
households in the form of wages and dividends. People use this for expenditure on other
goods and services, further stimulating the economy. As a result, ‘open’ economy multipliers
are used in this analysis.
Five steps were required to measure the overall macroeconomic contribution of the
proposed project:
• First, to identify appropriate expense items for each category of costs.
• Second, to determine the relative proportions of profit, labour, plant and material for
each expense item.
• Third, to assign each item of material and plant to the appropriate SAM economic
sector code.
• Fourth, the potential impact on tourism was included as a ‘negative’ benefit. This
reduces macroeconomic benefits.
• Finally, all the items in the SAM coded list of costs for each country are brought
together. The total multiplier effect is calculated as the aggregate product SAM coded
spending on plant and material, as well as SAM coded spending by workers
multiplied through the national multipliers.
The results are reported separately for the two countries.
5.3 Cost and Benefit Differences in the Two Approaches
One area of confusion that needs to be addressed is that there can be differences between
costs in the cost benefit and macroeconomic analysis. This is the case, for example, with
imports:
• Imports have only a marginal impact on the cost benefit analysis when compared to
locally procured goods and services. The reason for this is that they are costs to
society irrespective of the source of the inputs.
• On the other hand, expenditure on locally procured goods and services, although a
cost to the project, are a macroeconomic benefit (because they accrue locally and
have an economic “trickle-down” effect). As a result, the greater the import
component the less the local macroeconomic benefits.
The macroeconomic effect of some costs and benefits are treated as follows:

Economic Feasibility Analysis of the Proposed Batoka Gorge Hydroelectric Scheme 15
• Saved production would have a positive macroeconomic effect. The general
multiplier is used for the savings to firms because the distribution of these savings is
not known.
• Connection costs area cost to the project. These do however have a positive
macroeconomic effect because money is spent in the local economies on
connections.
• Increased household income and any income generated from electricity exports are
allocated to the general macroeconomic multiplier for each country.

Economic Feasibility Analysis of the Proposed Batoka Gorge Hydroelectric Scheme 16
6 Costs and Benefits
This section presents the costs and benefits that are used in the economic cost benefit
analysis.
6.1 Costs
This section summarises the costs that would occur for the proposed Batoka Gorge
Hydroelectric Scheme. There are four general categories of costs which have been treated
as negative benefits. This methodological approach has been explained in Section 5.1.1:
• Those that are the direct result of the building and running of the proposed Scheme.
These are divided into construction (capital), running (operation and maintenance)
and financing costs.
• Those for households which, faced with being able to use newly supplied electricity,
need to spend on both connection costs and electrical appliances in order to benefit
from electricity.
• Firms which have three types of costs:
• Connections cost
• Generator fuel; and
• Lost productivity.
• Potential negative impact on tourism in the area around the proposed scheme.
6.1.1 Project
6.1.1.1 Construction
Initial construction (capital) costs are divided into fixed and variable1 costs. Table 3 gives
the capital costs from table 8.9 of the options assessment report (Studio Pietrangeli, 2015, p.
165) for different installed power options. It is understood that construction would start in
2016 and generation in 2022.
1 These are called ‘varying and unvarying’ cost in the Options Assessment Report

Economic Feasibility Analysis of the Proposed Batoka Gorge Hydroelectric Scheme 17
Table 3: Capital Costs for Various Installed Power Options
Construction costs vary for different levels of installed power while fixed costs are
unchanged at $1 387m. Variable costs range between $913m and $1 768m and total costs
therefore range between $2 300m and $3 155m. The most cost effective generation option is
for installed power of 2 410MW2. This has a total cost of $2 625 million.
One of the important issues, from an economic perspective, is the proportion of imports to
total costs. No information was available. It was assumed that imports would make up:
• 75% of fixed costs;
• 75% of power house civil works;
• All electrical and mechanical equipment;
• 75% of waterways and ancillary equipment;
• 90% of transmission lines.
Professional fees are assumed to be 15% of construction and annual running costs.
Table 4: Installed Power, Power Generated and Change in Costs for Varying Final Supply Levels
2 A discussion of efficient generation options is given in Section 2.1
Installed Power - MW 1 620 1 950 2 410 2 920 3 720
Costs - $ millions
Fixed Costs 1 387 1 387 1 387 1 387 1 387
Varying Costs 913 1 046 1 238 1 461 1 768
Power House Civil Works 120 146 183 224 288
Electrical & Mechanical Equipment 387 446 525 607 731
Waterways 187 219 264 315 393
Ancillary Items 106 122 145 170 211
Transmission Lines 113 113 121 145 145
Total Costs ($ millions) 2 300 2 433 2 625 2 848 3 155
Reservoir Height - m a.s.l. 730 740 742 747 752 757 762
Change in height 32 22 20 15 10 5 0
Installed Power - MW 2 073 2 175 2 200 2 250 2 300 2 350 2 400
Change in Installed Power - MW 327 225 200 150 100 50 0
Change in IP per m height 10.2 10.0 10.0 10.0 10.0
Power Generated - GWh/yr 7 380 8 266 8 923 9 253 9 565 9 890 10 215
Change in power - GWh/yr 2 835 1949 1292 962 650 325 0
Loss in power per m height 88.6 64.6 64.1 65.0 65.0
RCC and E&M Costs - $m 581.3 629 639 661 684 708 734
Reduction in costs - $m 152.7 105 95 73 50 26 0
Reduction in costs per m height 4.8 4.8 4.9 5.0 5.2
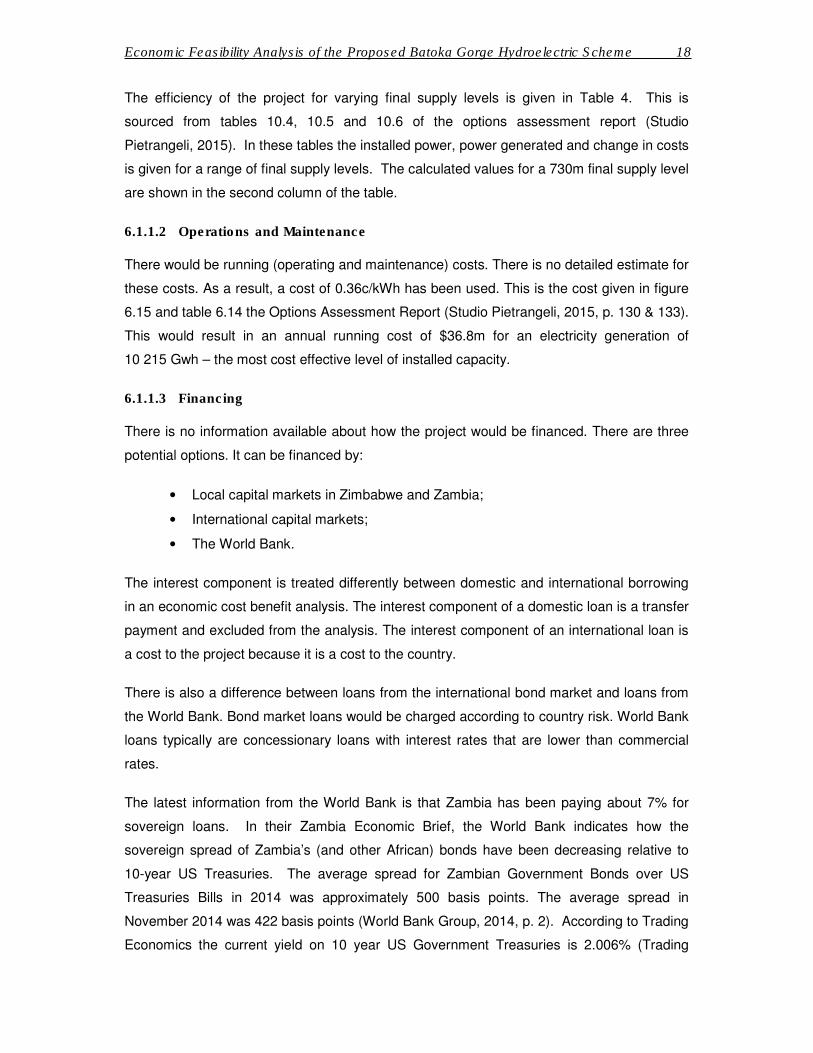
Economic Feasibility Analysis of the Proposed Batoka Gorge Hydroelectric Scheme 18
The efficiency of the project for varying final supply levels is given in Table 4. This is
sourced from tables 10.4, 10.5 and 10.6 of the options assessment report (Studio
Pietrangeli, 2015). In these tables the installed power, power generated and change in costs
is given for a range of final supply levels. The calculated values for a 730m final supply level
are shown in the second column of the table.
6.1.1.2 Operations and Maintenance
There would be running (operating and maintenance) costs. There is no detailed estimate for
these costs. As a result, a cost of 0.36c/kWh has been used. This is the cost given in figure
6.15 and table 6.14 the Options Assessment Report (Studio Pietrangeli, 2015, p. 130 & 133).
This would result in an annual running cost of $36.8m for an electricity generation of
10 215 Gwh – the most cost effective level of installed capacity.
6.1.1.3 Financing
There is no information available about how the project would be financed. There are three
potential options. It can be financed by:
• Local capital markets in Zimbabwe and Zambia;
• International capital markets;
• The World Bank.
The interest component is treated differently between domestic and international borrowing
in an economic cost benefit analysis. The interest component of a domestic loan is a transfer
payment and excluded from the analysis. The interest component of an international loan is
a cost to the project because it is a cost to the country.
There is also a difference between loans from the international bond market and loans from
the World Bank. Bond market loans would be charged according to country risk. World Bank
loans typically are concessionary loans with interest rates that are lower than commercial
rates.
The latest information from the World Bank is that Zambia has been paying about 7% for
sovereign loans. In their Zambia Economic Brief, the World Bank indicates how the
sovereign spread of Zambia’s (and other African) bonds have been decreasing relative to
10-year US Treasuries. The average spread for Zambian Government Bonds over US
Treasuries Bills in 2014 was approximately 500 basis points. The average spread in
November 2014 was 422 basis points (World Bank Group, 2014, p. 2). According to Trading
Economics the current yield on 10 year US Government Treasuries is 2.006% (Trading

Economic Feasibility Analysis of the Proposed Batoka Gorge Hydroelectric Scheme 19
Economics, 2016). This means that the yield on 10 year Zambian Government bonds would
be 7%.
In the light of the above discussion the following assumptions have been made:
• The loan would be financed by the international bond market.
• Revenues are in US dollars. This offsets foreign exchange rate risks on the capital
loans.
• It would be a ten-year loan.
• The real interest rate is 7%.
• Financing costs are only for the initial capital costs.
These assumptions are subjected to a sensitivity analysis in Section 7.1.5.
6.1.2 Firms
There is a need to make a distinction between the costs and benefits firms face as a result of
improved and/or new electricity connections. The key issue is to decide which costs to
include:
• Costs which are common to before and after new/improved electrification are
excluded. The most obvious of these is the current payment for electricity.
• Current costs that are the result of a lack of or a reliable supply of electricity. An
example of this is the savings on fuel for backup generators. Electrification would
reduce these costs. These are treated as a benefit (reduced cost) in the analysis.
• Payment for new electricity. This cost is accounted for in the running of the proposed
scheme. Including it as a cost for both firms and the proposed scheme would
constitute double counting.
• The cost to newly electrified firms for connection to the grid. This has been assumed
to be $5 000 for each new connection. This cost is a consequence of the project and
is therefore treated as a negative benefit in the analysis. This assumption is varied in
a sensitivity analysis.
6.1.3 Households
People in households are likely to face two types of costs if they wish to benefit from
electricity. These are the connection and appliance costs. Benefits from electricity come from
the use of appliances. An obvious example of this is electric lighting. These costs are a

Economic Feasibility Analysis of the Proposed Batoka Gorge Hydroelectric Scheme 20
consequence of electrification and are treated as a negative benefit, in the net household
income described in section 6.2.2.2.
6.1.3.1 Connection Costs
It has been assumed that a new connection cost would be $2 000. This is based on
discussion with industry experts and previous experience in Namibia and Zimbabwe.
It is recognized that this is both a large sum of money for poorer households and probably
unaffordable. Some mitigation is required on the part of government to ensure that
households are connected and can benefit from the new opportunities.
6.1.3.2 Costs of Appliances
The cost of appliances has been based on the lowest retail prices for each appliance. This
proportionate purchase of appliances and the cost of the relevant appliances are used to
determine the expected average appliance spending for households in each of the electricity
usage bands.
6.1.4 Tourism
There is the potential for negative impacts on white water rafting and other tourism offerings.
It is felt that this would impact on these firms that are dependent on tourism in the gorge.
The specialist report on the localised economic impact has estimated that there would be
losses in tourism revenue worth $7.94m because of the proposed scheme (Anchor
Environmental Consultants, 2015, p. 47). The estimates are made for a final supply level of
757m. The value of lost tourism revenue at this supply level is shown in the second column
of Table 5.
ERM Southern Africa have made some estimates of the degree to which this impact would
vary at different supply levels. These are also reported in the table. The annual lost tourism
business is estimated to be $6.69m for a final supply level of 730m, $7.93m for 740m and
$7.94m for 762m3.
3 These costs all exclude the non-use value of the environment, as discussed in the Economic Specialist Report
by Anchor Environmental Consultants

Economic Feasibility Analysis of the Proposed Batoka Gorge Hydroelectric Scheme 21
Table 5: Local Tourism Affected by Batoka Gorge for Varying Final Supply Levels
Two further assumptions have been made:
• The impact would start at the same time as construction.
• Tourism would have grown at the future expected average economic growth for the
two countries.
1 2 3 4 5 6
730 740 757 762
Accommodation 1 492 704 100% 100% 100% 100%
White water rafting 3 490 000 65% 100% 100% 100%
Birding and hiking 82 279 100% 100% 100% 100%
Angling 158 300 80% 90% 100% 100%
Jet Extreme 963 600 100% 100% 100% 100%
Scenic Flights 1 350 000 100% 100% 100% 100%
Park Fees 406 900 100% 100% 100% 100%
Total Lost Business ($) 7 943 783 6 690 623 7 927 953 7 943 783 7 943 783
Excludes non-use value
Source:
Data in columns 1 and 2 from Batoka HES Economic Specialist Report, table 22, pg 48
Percentage in columns 3, 4, 5 & 6 estimated by ERM Southern Africa
Variation Compared to fsl 757m
Description of Activity
Estimated
Value ($)
at fsl 757m
Final Supply Level (m)

Economic Feasibility Analysis of the Proposed Batoka Gorge Hydroelectric Scheme 22
6.2 Benefits
There are many benefits that would occur either as a result of new electrical connections or
more reliable electricity generation. These accrue to both households, firms and the
electricity utility. The latter occurs, from an economic perspective, as a result of electricity
exports. Consequently, these benefits accrue to society as a whole.
6.2.1 Firms
There are three types of firms that would benefit from an increased supply of electricity.
These are firms that:
• Currently have power outages without backup generators;
• Currently have power outages with backup generators;
• Are expected to starte as a result of economic growth.
The following assumptions have been made:
• In the absence of Batoka Gorge, total unserved demand by 2022 in:
• Zambia is estimated at 962 GWhrs and expected to increase annually. By 2028
estimated power outages in Zambia would be 5 108 GWhrs (the capacity of Batoka
Gorge to supply electricity to either country).
• Zimbabwe is estimated to be 1 882 GWhrs. By 2030 this would exceed
5 108 GWhrs. This is the total supply of electricity from Batoka Gorge to Zimbabwe.
• There would be no power outages during 2022 and 2028 in Zambia and between
2022 and 2030 in Zimbabwe because of the proposed Batoka Gorge scheme.
Further power outages can only be avoided with additional generation plants.
• In Zambia 38.2% of firms have backup generators4 and 11.2%5 in Zimbabwe.
• New firms would increase by 5.6% in Zambia and 3.4% in Zimbabwe 6. It has been
assumed that the proportion of firms with and without generators and associated
costs would be unchanged.
4 (Steinbuks & Foster, 2010, p. 512)
5 This percentage was sourced from a survey of firms in Zimbabwe
6 The rate of economic growth is not varied with and without an increase in electricity generation.

Economic Feasibility Analysis of the Proposed Batoka Gorge Hydroelectric Scheme 23
6.2.1.1 Generator Use during Outages
Some firms have invested in backup generators. There are other, limited, backup options.
Typically, the cost of own generation is higher than the cost of grid electricity (Oseni & Pollitt,
2013, p. 24). In addition, there can be other costs like the diminished capacity to finance
other types of investments, equipment damage from electrical surges and wider societal
costs like the use of dirty fuel. These latter costs have been excluded from the analysis.
Two cost estimates have been made for Zambia:
• Oseni & Pollitt (2013, p. 25) estimate the cost of own generation is $0.58/kWh
measured over an eight-hour outage. This is made up of a fixed cost of $0.18/kWh
and a variable cost of $0.40/kWh;
• Steinbuks and Foster (2010, p 509) estimate the cost is $0.45/kWh. This is made
up of a fixed cost of also $0.18/kWh and a variable cost of $0.27/kWh.
These costs have been used to estimate the 2015 generator costs from outages to firms in
Zimbabwe and Zambia:
• The power outage costs for firms with generators is $0.38/kWh in generation costs
and $0.39/kWh in lost production;
• The drop in the oil price between 2013 and 2015 price reduces the variable cost to
$0.20/kWh;
• Adjusting for taxies and levies (as has to be done in a cost benefit analysis) reduces
this cost to $0.14/kWh;
• Fixed costs have been included in the analysis7;
• In the absence of any other data the same costs have been used for Zimbabwe.
6.2.1.2 Lost Production During Power Outages
It has been assumed that the lost production cost of power outages to firms without
generators is 1.5 times that of firms with generators8.
7 This is debatable because some commentators would argue that fixed costs are sunk costs and should be omitted. In this
case Stratecon is of the opinion that they need to be included because doing this takes account of any future generator
capacity that may be added.
8 The literature indicates far higher losses. Using a lower value makes the approach more conservative because the benefits
would be lower.

Economic Feasibility Analysis of the Proposed Batoka Gorge Hydroelectric Scheme 24
6.2.2 Households
Households would have two benefits from electrification:
• Saving from other forms of fuel currently used for cooking, lighting and during
outages.
• Income benefits as a result of time savings, increases in productivity and health
benefits. Health benefits are the result of less smoke inhalation, burns and fatalities
from fires and the use of refrigeration for food and medicines.
6.2.2.1 Savings in Alternative Fuels
Many households would less time collection and less money buying alternative fuels. These
fuels include firewood (purchased or collected), candles, paraffin, LPG, etc.
The following assumptions were made:
• Households spend $12 monthly on other types of fuel. This is based on a recent
survey of rural households in Zimbabwe9.
• The number of affected households is calculated by dividing total household
unserved demand by a monthly amount of 100kWh. This is estimated based on the
income of low income households.
• The electricity shortage has been divided equally between households and firms.
6.2.2.2 Income Benefits
The positive impacts of electricity on income are well documented. Table 6 gives the results
of three recent publications which estimated the impact of electricity and electrification on
household income. Electrification increased household income in:
• Bangladesh by between 9% and 30%. (Khandker, Barnes, & Samad 2009).
• India by between 16% and 46% (Khandker, Samad, Ali, & Barnes 2012).
• Vietnam by between 25% and 36% (Khandker S. R., Barnes, Samad, & Huu Minh
2008).
The 16% was used in the analysis. This was chosen as a conservative assumption.
9 This is part of the Zimbabwe Rural Electrification Master Plan which is currently being developed.

Economic Feasibility Analysis of the Proposed Batoka Gorge Hydroelectric Scheme 25
Table 6: Increase in Household Income Attributed to Electricity
6.2.3 Exports
It is likely that any excess electricity that is not purchased in Zimbabwe or Zambia would be
exported to the SAPP. The following assumptions have been made:
• A price of $0.05/kWh for base load;
• A price of $0.15/kWh for peak load;
• The benefits also have a trickle-down effect as the export revenue is used in the
country. Hence in the macroeconomic analysis the multiplier impact is assumed to be
the average for each country.
CountryLower
Band
Mid
Band
Upper
BandSource
Bangladesh 9% 12% 30% (Khandker, Barnes, & Samad, 2009)
India 16% 39% 46% (Khandker, Samad, Ali, & Barnes, 2012)
Vietnam 25% 31% 36% (Khandker S. R., Barnes, Samad, & Huu Minh, 2008)

Economic Feasibility Analysis of the Proposed Batoka Gorge Hydroelectric Scheme 26
7 Results
This section presents the results of the economic analysis:
The cost benefit results are relatively more important as they measure the economic
efficiency of a project. They are the results on which the decision to proceed should be
taken. In contrast the macroeconomic analysis shows the distribution of the benefits across
the economy.
The cost benefit analysis has been tested for different cases. The macroeconomic analysis
is only reported for the base case.
7.1 Cost Benefit Analysis Results
This section presents the results to the cost benefit analysis. These are reported as the:
• Present value (PV) of costs and benefits;
• Net present value (NPV) of the differences between the costs and benefits;
• Benefit cost ratio (BCR) which gives the $ benefit per $ of cost; and
• Internal rate of return (IRR). This is the discount rate that returns a NPV of zero.
The following cases were analyzed:
• Case 1 - base case: a dam with a final supply level of 762m. This is the proposal in
the options analysis report.
• Case 2: different dam heights
• Case 3: variations in demand.
• Case 4: reduced water storage in dry season.
• Case 5: exports of peak load generation. Two cases are reported here:
• Peak case 2, in which release rates were peak over a three-hour period every
morning and a three-hour period every evening with reservoir volume balanced over
a 24-hour period to achieve this outcome;
• Peak case 3, in which outflows peak over a three-hour period every morning and a
three-hour period every evening during weekdays with reservoir storage balanced
over the weekly period to achieve this result.
In addition, a sensitivity analysis was done on the key assumptions of the base case.

Economic Feasibility Analysis of the Proposed Batoka Gorge Hydroelectric Scheme 27
7.1.1 Case 1: Base Case – Dam Height and FSL of 762m
The results of the analysis for the proposal in the options assessment report are presented
in Table 7.
• It was found that the costs have a present value (PV) of $3 133m. The initial capital
costs contribute the most to the overall cost, with a PV of $1 889m. Financing costs
contribute $607m, followed by professional fees ($300m) and running costs ($203m).
A reduction in tourism business adds $135m to the overall cost.
Table 7: Cost Benefit – Base Case
PV
Costs
Initial Capital Cost 1 889
Financing Costs of ICW 607
Opertions & Maintenance 203
Professional Fees 300
Tourism Impacts 135
Total Cost 3 133
Benefits - Zambia
Firms
Generator Savings 1 366
Saving from Outages (with Generators) 1 659
Saving from Outages (without Generators) 4 033
Connection Costs -131
Households with Existing Connections
Alternative Fuel Savings 187
Households with New Connections
Increased Income and Net Benefits 0
Exports 610
Total Benefits - Zambia 7 724
Benefits - Zimbabwe
Firms
Generator Savings 361
Saving from Outages (with Generators) 444
Saving from Outages (without Generators) 5 300
Connection Costs -77
Households with Existing Connections
Alternative Fuel Savings 171
Households with New Connections
Increased Income and Net Benefits 353
Exports 481
Total Benefits - Zimbabwe 7 035
Total Benefits - Zambia & Zimbabwe 14 758
NPV 11 625
BCR 4.71
IRR 28%
All Monetary Values in $ millions

Economic Feasibility Analysis of the Proposed Batoka Gorge Hydroelectric Scheme 28
• Benefits in the base case have a PV of $14 758m; $7 724m to Zambia and $7 035m
to Zimbabwe.
• For Zambia:
o Savings from reduced outages of $5 692m is the largest benefit. This is
$4 033m for firms without and $1 659m with generators.
o Savings on generators and alternative fuels are $1 366m for firms and
$187m for households.
o There are $131m grid connection costs for firms (negative benefit).
o Exports would be worth $610m.
• For Zimbabwe:
• Total savings from outages by firms of $5 744m is the largest benefit. This is made
up of $5 300m for firms without and $444m for firms with generators.
• Savings from expenditure on generators and alternative fuels are $361m for firms
and $171m for households.
• There are $77m grid connection costs for firms (expressed as a negative benefit in
the table).
• Exports would be worth $481m.
• The NPV is R11 625m. This is positive. The base case would be economically
efficient and benefits both Zambia and Zimbabwe.
• The BCR is 4.71. This means that for every $1.00 spent on the project there are
benefits of by $4.71. This is a robust result.
• The IRR is 28%.
7.1.2 Case 2: Different Dam Heights
The impact of different heights in the dam wall and, as a result, final supply levels is shown
in Table 8. The results are given for FSLs of 730m, 740m, 757m and 762m.
Table 8: Cost Benefit – Different Final Supply Levels
There are lower costs and benefits with a lower dam wall. Benefits reduce more
proportionately than costs. The BCR and IRR for an FSL of:
Final Supply Level metres 730 740 757 762
Installed Capacity MW 2 083 2 185 2 360 2 410
Power Generated GWh/yr 7 380 8 266 9 890 10 215
Total Costs $m 2 887 2 978 3 098 3 133
Total Benefits $m 10 893 12 148 14 335 14 758
NPV $m 8 007 9 170 11 236 11 625
BCR ratio 3.77 4.08 4.63 4.71
IRR % 25% 26% 28% 28%
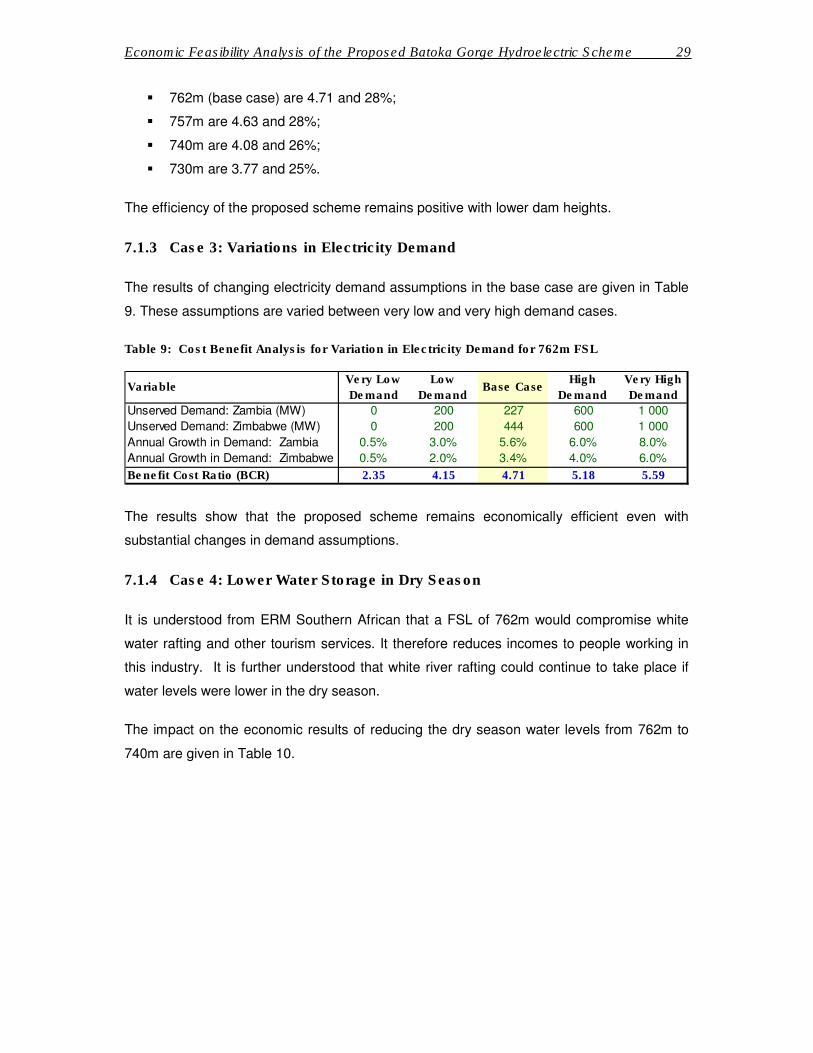
Economic Feasibility Analysis of the Proposed Batoka Gorge Hydroelectric Scheme 29
� 762m (base case) are 4.71 and 28%;
� 757m are 4.63 and 28%;
� 740m are 4.08 and 26%;
� 730m are 3.77 and 25%.
The efficiency of the proposed scheme remains positive with lower dam heights.
7.1.3 Case 3: Variations in Electricity Demand
The results of changing electricity demand assumptions in the base case are given in Table
9. These assumptions are varied between very low and very high demand cases.
Table 9: Cost Benefit Analysis for Variation in Electricity Demand for 762m FSL
The results show that the proposed scheme remains economically efficient even with
substantial changes in demand assumptions.
7.1.4 Case 4: Lower Water Storage in Dry Season
It is understood from ERM Southern African that a FSL of 762m would compromise white
water rafting and other tourism services. It therefore reduces incomes to people working in
this industry. It is further understood that white river rafting could continue to take place if
water levels were lower in the dry season.
The impact on the economic results of reducing the dry season water levels from 762m to
740m are given in Table 10.
Unserved Demand: Zambia (MW) 0 200 227 600 1 000
Unserved Demand: Zimbabwe (MW) 0 200 444 600 1 000
Annual Growth in Demand: Zambia 0.5% 3.0% 5.6% 6.0% 8.0%
Annual Growth in Demand: Zimbabwe 0.5% 2.0% 3.4% 4.0% 6.0%
Benefit Cost Ratio (BCR) 2.35 4.15 4.71 5.18 5.59
VariableVery Low
Demand
Low
DemandBase Case
High
Demand
Very High
Demand
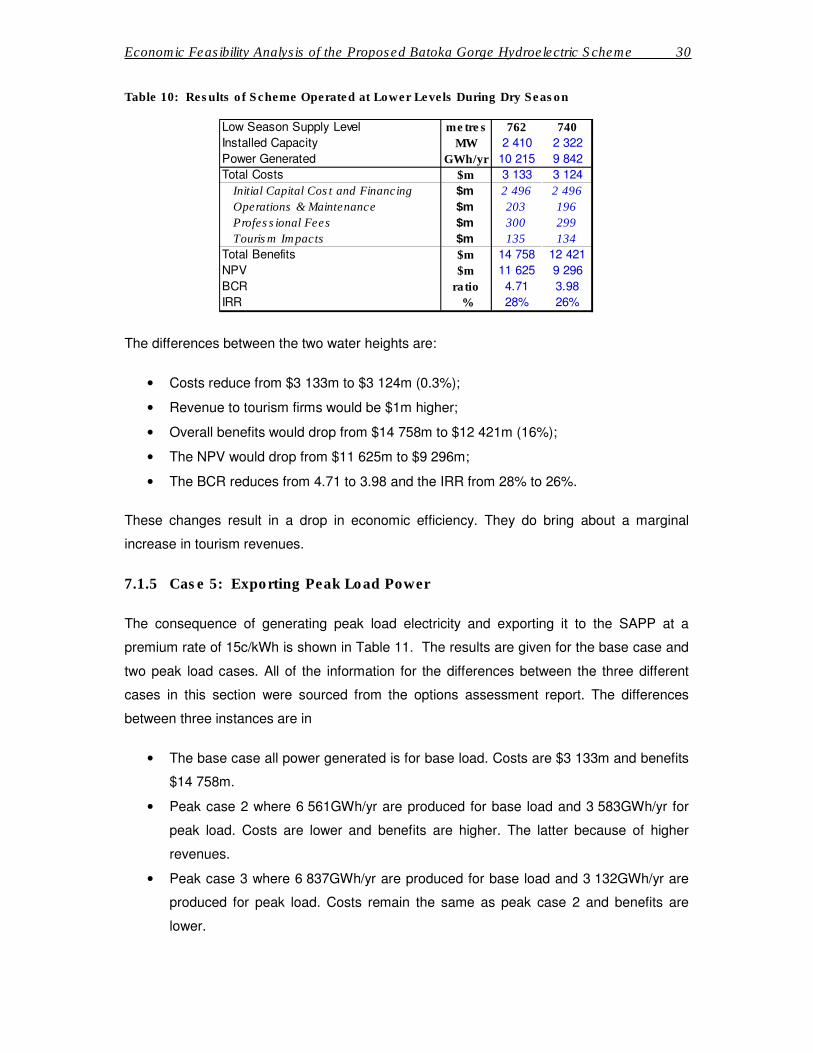
Economic Feasibility Analysis of the Proposed Batoka Gorge Hydroelectric Scheme 30
Table 10: Results of Scheme Operated at Lower Levels During Dry Season
The differences between the two water heights are:
• Costs reduce from $3 133m to $3 124m (0.3%);
• Revenue to tourism firms would be $1m higher;
• Overall benefits would drop from $14 758m to $12 421m (16%);
• The NPV would drop from $11 625m to $9 296m;
• The BCR reduces from 4.71 to 3.98 and the IRR from 28% to 26%.
These changes result in a drop in economic efficiency. They do bring about a marginal
increase in tourism revenues.
7.1.5 Case 5: Exporting Peak Load Power
The consequence of generating peak load electricity and exporting it to the SAPP at a
premium rate of 15c/kWh is shown in Table 11. The results are given for the base case and
two peak load cases. All of the information for the differences between the three different
cases in this section were sourced from the options assessment report. The differences
between three instances are in
• The base case all power generated is for base load. Costs are $3 133m and benefits
$14 758m.
• Peak case 2 where 6 561GWh/yr are produced for base load and 3 583GWh/yr for
peak load. Costs are lower and benefits are higher. The latter because of higher
revenues.
• Peak case 3 where 6 837GWh/yr are produced for base load and 3 132GWh/yr are
produced for peak load. Costs remain the same as peak case 2 and benefits are
lower.
Low Season Supply Level metres 762 740
Installed Capacity MW 2 410 2 322
Power Generated GWh/yr 10 215 9 842
Total Costs $m 3 133 3 124
Initial Capital Cost and Financing $m 2 496 2 496
Operations & Maintenance $m 203 196
Professional Fees $m 300 299
Tourism Impacts $m 135 134
Total Benefits $m 14 758 12 421
NPV $m 11 625 9 296
BCR ratio 4.71 3.98
IRR % 28% 26%

Economic Feasibility Analysis of the Proposed Batoka Gorge Hydroelectric Scheme 31
Table 11: Cost Benefit – Exporting Peak Load Electricity
There are only minor costs changes. The benefits increase because the peak load power
could be exported at a premium. The BCR and IRR for peak case:
� 2 increase to 5.19 and 32%;
� 3 increase to 5.17 and 32%.
The efficiency of the proposed scheme increases if the peak load could be generated and
exported at a premium to the SAPP.
7.1.6 Base Case Sensitivity Analysis
A sensitivity analysis was conducted on a number of assumptions. These were changes in:
• Unserved demand in Zambia and Zimbabwe in 2022;
• The distribution of unserved demand between households and firms;
• The cost of lost production to firms without generators;
• Average monthly electricity usage of new firms;
• Firm connection costs;
• Exports of base peak load;
• Running costs;
• Reduced electricity demand;
• Financing costs.
Only some of the assumptions affected the results. These are the only results that are
reported below. Combinations of some of these assumptions were also tested and the
results reported in section 7.1.3.
The results for the base case are highlighted in bold in the tables in section. The BCR is
reported twice. First for a dam with a FSL of 762m and operated at that level. Second for a
dam with a FSL of 762m operated at 740m during the dry season.
Base Power Generated GWh/yr 10,215 6,561 6,837
Peak Power Generated GWh/yr 0 3,584 3,329
Total Power Generated GWh/yr 10,215 10,145 10,166
Total Costs $m 3,133 3,132 3,132
Total Benefits $m 14,758 16,248 16,201
NPV $m 11,625 13,116 13,069
BCR ratio 4.71 5.19 5.17
IRR % 28% 32% 32%
Base
Case
Peak
Case 2
Peak
Case 3Peak Load Scenario

Economic Feasibility Analysis of the Proposed Batoka Gorge Hydroelectric Scheme 32
7.1.6.1 Unserved Demand
The base case assumed 227MW of unserved demand in Zambia and 444MW in Zimbabwe
in 2022. This sensitivity analysis varies unserved demand. The results are reported in
Table 12 for Zambia and Table 13 for Zimbabwe.
Table 12: Unserved Demand in Zambia
For Zambia:
• With no unserved demand in 2022 the BCR for a:
o FSL of 762m would reduce from 4.71 to 4.54;
o FSL of 740m would drop from 3.98 to 3.79;
o This drop is the result of more exports to the SAPP.
• The BCRs are higher with more unserved demand in 2022. Benefits are higher when
electricity is consumed locally.
Table 13: Sensitivity Analysis of Unserved Demand in Zimbabwe
For Zimbabwe:
• With no unserved demand in 2022 the BCR for a:
o FSL of 762m would reduce from 4.71 to 4.27;
o low season FSL of 740m would drop from 3.98 to 3.45;
o This drop is the result of more exports to the SAPP.
• The BCRs are higher with more unserved demand in 2022. Benefits are higher when
electricity is consumed locally.
0 MW 4.54 3.79
227 MW 4.71 3.98
900 MW 5.09 4.36
1,205 MW 5.12 4.40
Unserved Demand Zambia fsl 762mLow season
fsl 740m
0 MW 4.27 3.45
444 MW 4.71 3.98
900 MW 5.06 4.45
1,205 MW 5.13 4.49
Low season
fsl 740mUnserved Demand Zimbabwe fsl 762m

Economic Feasibility Analysis of the Proposed Batoka Gorge Hydroelectric Scheme 33
The results are mildly sensitive to changes in unserved demand in 2022. This is because
any differences in demand are exported. This generates revenues which offset the lower
local benefits.
7.1.6.2 Distribution of Unserved Demand
Unserved demand is distributed equally between households and firms in the base case.
The results of variations are shown in Table 14.
Table 14: Households and Firm Distribution of Unserved Demand
It was found that the higher the proportionate share of unserved energy for firms the greater
the economic efficiency. For example, with firms having 75% of unserved energy demands
the BCR increases to 6.72 for a FSL of 762m and 5.80 for 740m Conversely, the BCR would
be 2.70 and 2.15 respectively with a 25% share.
The results are sensitive to changes in the distribution of unserved demand.
7.1.6.3 Cost of Lost Production for Firms without Generators
It was assumed in section 6.2.1.2 that firms without generators would have losses 1.5 times
greater than firms with generators. Variations in this assumption show that:
With the FSL 762m scheme the BCR would:
• Reduce to 3.72 with losses equal to those of firms with backup generators;
• Reduce to 2.72 with losses equal to half those of firms with backup generators;
• Increase to 16.23 for losses equal to 7.3 times10 those of firms with backup
generators.
With a dry season FSL of 740m the BCR would:
• Reduce to 3.01 with losses equal to those of firms with backup generators;
• Reduce to 2.04 with losses equal to half those of firms with backup generators;
10
This is the value in the findings of (Steinbuks & Foster, 2010, p. 509).
25% Households & 75% Businesses 6.72 5.80
50% Households & 50% Businesses 4.71 3.98
75% Households & 25% Businesses 2.70 2.15
Households : Firms Unserved
Demand Splitfsl 762m
Low season
fsl 740m

Economic Feasibility Analysis of the Proposed Batoka Gorge Hydroelectric Scheme 34
• Increase to 15.21 for losses equal to 7.3 times those of firms with backup generators.
Table 15: Sensitivity Analysis of Cost of Lost Production
The results are very sensitive to relative changes in the losses of firms without generators.
7.1.6.4 Annual Growth in Demand for Electricity in Zambia and Zimbabwe
The base case estimates that annual electricity demand is expected to increase by 5.6% in
Zambia and 3.4% in Zimbabwe between 2012 and 2045.
Table 16: Annual Growth in Demand for Electricity in Zambia
In Zambia an annual change in demand for electricity of:
• 0% reduces the BCR to:
• 3.55 for a FSL of 762m;
• 2.78 for FSL of 740m.
• 3% reduces the BCR to:
• 4.52 for a FSL of 762m;
• 3.79 for FSL of 740m.
Table 17: Sensitivity Analysis of Growth in Demand for Electricity in Zimbabwe
In Zimbabwe a change in demand for electricity of:
0.5 x businesses with generators 2.72 2.04
1.0 x businesses with generators 3.72 3.01
1.5 x businesses with generators 4.71 3.98
2.0 x businesses with generators 5.70 4.94
5.0 x businesses with generators 11.66 10.75
7.3 x businesses with generators 16.23 15.21
Low season
fsl 740m
Cost of Lost Production for Firms
without Generatorsfsl 762m
0.0% 3.55 2.78 4.49
3.0% 4.52 3.79 5.14
5.6% 4.71 3.98 5.21
Annual Growth in Demand -
Zambiafsl 762m
Low season
fsl 740mPeak Power
0.0% 4.11 3.23 4.92
2.0% 4.63 3.90 5.17
3.4% 4.71 3.98 5.21
Annual Growth in Demand -
Zimbabwefsl 762m Peak Power
Low season
fsl 740m

Economic Feasibility Analysis of the Proposed Batoka Gorge Hydroelectric Scheme 35
• 0% reduces the BCR to:
• 4.11 for a FSL of 762m;
• 3.23 for a FSL of 740m.
• 2% reduces the BCR to:
• 4.63 for a FSL of 762m;
• 3.90 for a FSL of 740m.
The results are largely insensitive to changes in the growth of demand for electricity. This
rather unexpected result is because any excess electricity would be exported. The export
revenues would offset lower domestic benefits.
7.1.6.5 Financing Costs
The impact on the BCR of changed financing costs are shown in Table 18.
Table 18: Changes in Real Rate Cost of Borrowing
The results are only moderately sensitive to changes in real interest rates. The project
remains economically efficient for the range tested.
7.1.7 Conclusion to the Cost Benefit Analysis
The following conclusions are made:
• Operating the dam at its highest level is economically the most efficient.
• Variations in demand for electricity would not change the economic efficiency so long
as surplus electricity could be exported to the SAPP.
• Operating at less than capacity during the dry season reduces the economic
efficiency. It also would make hardly any difference to the impact on income of tourist
operators. Mitigation would be improved by financial compensation to these
operators. This would not affect economic efficiency provided the compensation is
not relocated to other countries.
• Exporting peak load electricity to the SAPP would improve the efficiency of the
project.
5% Real Interest Rate 5.00 4.22
7% Real Interest Rate 4.71 3.98
10% Real Interest Rate 4.32 3.64
15% Real Interest Rate 3.76 3.17
International Loans fsl 762mLow season
fsl 740m

Economic Feasibility Analysis of the Proposed Batoka Gorge Hydroelectric Scheme 36
7.2 Macroeconomic Results
The macroeconomic contribution of the base case is reported11. The results are reported
annually between 2016 and 2025 and in 5 year increments until 2035. The only variable that
changes after 2036 is lost tourism revenue.
The reported macroeconomic indicators are the contribution to Gross Domestic Product and
direct and indirect jobs in Zambia and Zimbabwe. These are disaggregated into construction,
operations and maintenance, professional fees, reduced tourism revenues, savings from
reduced outages and exports.
7.2.1 Gross Domestic Product
Gross Domestic Product is the total value of all final goods and services produced in a
country. It is clearly fundamental to the economic quality of life of people in Zambia and
Zimbabwe. It is also the most important and all-encompassing measure of the
macroeconomic effect of the proposed Batoka Gorge Hydroelectric Scheme. The
contribution to GDP is presented in Table 19 and Figure 4.
Table 19: Contribution to GDP
In Zambia the total contribution to GDP:
• Is largely constant during construction - between $107m and $105m.
11
It will be recalled that the results to the other cases are reported only for the cost benefit analysis because
those results should typically carry more weight in policy decisions. This has been outlined in Section 5. In a
nutshell the cost benefit results report the economic efficiency of a project. Ideally it is these results that
determine whether or not the project should go ahead. The macroeconomic analysis show how the benefits are
distributed through the economy.
Contribution to GDP - US$m, 2015 Prices 2016 2017 2018 2019 2020 2021 2022 2023 2024 2025 2030 2035
Zambia
Initial Construction Costs 103 103 103 103 103 103
Operations & Maintenance 29 29 29 29 29 29
Professional Fees 14 14 14 14 14 14 6 6 6 6 6 6
Reduced Tourism Revenues -10 -10 -11 -11 -12 -12 -13 -13 -14 -14 -18 -22
Savings from Outages 207 401 552 702 1 100 1 100
Exported Electricity 477 396 316 235 0 0
Total Contribution to Zambian GDP 107 106 106 105 105 105 706 819 888 958 1 117 1 113
Zimbabwe
Initial Construction Costs 128 128 128 128 128 128
Operations & Maintenance 47 47 47 47 47 47
Professional Fees 26 26 26 26 26 26 11 11 11 11 11 11
Reduced Tourism Revenues -16 -16 -17 -18 -18 -19 -20 -21 -22 -23 -28 -34
Savings from Outages 1 281 1 464 1 647 1 830 2 071 2 071
Exported Electricity 601 505 408 311 0 0
Total Contribution to Zimbabwean GDP 139 138 138 137 136 135 1 920 2 006 2 091 2 176 2 101 2 095
Total Contribution to Regional GDP 246 245 244 243 241 240 2 627 2 824 2 979 3 134 3 218 3 208
Cumulative Contribution to Regional GDP 246 491 734 977 1 218 1 458 4 085 6 909 9 889 13 023 29 609 45 670

Economic Feasibility Analysis of the Proposed Batoka Gorge Hydroelectric Scheme 37
• Increases to $706m by 2022 in the first year of operation and continues to increase
until 2030 as a result of savings from reduced outages.
• By 2030 contribution to GDP is $1 117m.
• This drops slightly to $1 113m by 2035 because of falling tourism revenues.
In Zimbabwe the total contribution to GDP:
• Is largely constant during construction - between $139m and $135m.
• Increases to $1 920m by 2022 in the first year of operation and continues to increase
until 2030 as a result of savings from reduced outages.
• By 2030 contribution to GDP is $2 101m.
• This drops slightly to $2 095m by 2035 because of falling tourism revenues.
In total, contribution to GDP:
• Is largely constant during construction - about $240m.
• Increases to $2 627m by 2022.
• This is $3 208m by 2035.
In aggregate the proposed Batoka Gorge hydroelectric scheme would have added a
cumulative $1 458m to the GDPs of the two countries at the end of construction. By 2035
this cumulative contribution is estimated to be $45 670m.
The disaggregated contribution is:
• Construction costs have been divided evenly over six years. Most of the materials
are imported and therefore do not make a macroeconomic contribution. Local
procurement increases Zambian GDP annually by $103m and by $128m in
Zimbabwe.
• Running expenses would contribute $29m to Zambian GDP and $47m to
Zimbabwean GDP.
• Professional fees would contribute a further $14m a year to Zambian GDP and $26m
to Zimbabwean GDP during construction. This operational contribution is expected
to be $6m annually in Zambia and $11m in Zimbabwe.
• Reduced tourism revenues are expected to cost Zambia $10m in 2016 increasing to
$22m by 2035. This would be $16m and $34m for Zimbabwe.

Economic Feasibility Analysis of the Proposed Batoka Gorge Hydroelectric Scheme 38
• The contribution of electricity to savings from fewer outages in Zambia is expected to
increase GDP by $207m in 2022 and increasing $1 100m from 2030. In Zimbabwe
this is expected to increase from $1 281m to $2 071m over the same period.
• Income from exports is estimated to contribute $477m to the Zambian economy in
2022. This reduces annually and no exports are expected by 2030. Exports would
contribute $601m to Zimbabwe in 2022, also dropping off by 2030.
Figure 4: Detailed Contribution to Gross Domestic Product
The detailed contribution to GDP is shown in Figure 4:
• The difference in contribution to GDP between construction and operating is clearly
apparent. Most of the construction expenses are imports.
• Exports decline and local production increases until 2027 when local demand uses
all the generation capacity of the proposed Batoka Gorge scheme.
• The slight drop between 2027 and 2028 is because there are no further electricity
connections.
• The negative impact from lower tourism revenue is also shown, as is the relative size
of this impact.
-500
0
500
1 000
1 500
2 000
2 500
3 000
3 500
4 000
2016 2017 2018 2019 2020 2021 2022 2023 2024 2025 2026 2027 2028 2029 2030 2031 2032 2033 2034 2035
Co
ntr
ibu
tio
n t
o G
ross
Do
me
stic
Pro
du
ct (
US
$ m
illi
on
s)
Detailed Contribution to GDP
Initial Construction Costs Operations & Maintenance Professional Fees
Reduced Tourism Revenues Savings from Fewer Outages Exported Electricity

Economic Feasibility Analysis of the Proposed Batoka Gorge Hydroelectric Scheme 39
7.2.2 Direct and Indirect Jobs
The proposed Batoka Gorge hydroelectric scheme would result in changes to two types of
jobs. The first are the direct jobs that would be created. These are jobs directly on building
and running the scheme. Included are the structural changes to the economy as a result of
improved productivity. The second are the so-called indirect jobs that result from the
multiplier effects of the capital and operational costs, the lost tourism business, the improved
productivity and exports.
Table 20 reports on the direct jobs, Table 21 on the indirect jobs in the two countries and
Table 22 is a sum of the direct and indirect job creation for both countries. Figure 5
illustrates the total direct and indirect job creation in the two countries as well as contribution
to their GDPs.
Table 20: Direct Jobs
During the construction period between 2016 and 2021:
• The options assessment report expects that 500 people would be employed during
the first two years of construction, increasing to around 3 000 people for the rest of
the construction period. These direct jobs, in the absence of other information, have
been divided equally between the two countries.
• It is estimated that professional fees would generate 243 jobs in Zambia and 257 in
Zimbabwe.
• There would be job losses because of lower tourism revenues. In Zambia it is
estimated that these job losses would increase from 174 in 2016 to 214 in 2021 while
in Zimbabwe it is estimated that the job losses would increase from 258 to 318 over
the same time period.
When operations commence in 2022:
Contribution to Direct Jobs 2016 2017 2018 2019 2020 2021 2022 2023 2024 2025 2030 2035
Zambia
Initial Construction Costs 250 250 1 500 1 500 1 500 1 500
Operations & Maintenance 837 837 837 837 837 837
Professional Fees 243 243 243 243 243 243 106 106 106 106 106 106
Reduced Tourism Revenues -174 -181 -189 -197 -206 -214 -223 -233 -243 -253 -312 -385
Savings from Outages 3 662 6 574 9 238 11 902 19 440 19 440
Exported Electricity 8 428 7 005 5 582 4 159 0 0
Contribution to Zambian Direct Jobs 319 312 1 554 1 546 1 538 1 529 12 809 14 288 15 519 16 750 20 070 19 998
Zimbabwe
Initial Construction Costs 250 250 1 500 1 500 1 500 1 500
Operations & Maintenance 966 966 966 966 966 966
Professional Fees 257 257 257 257 257 257 112 112 112 112 112 112
Reduced Tourism Revenues -258 -269 -280 -292 -305 -318 -331 -345 -360 -375 -463 -570
Savings from Outages 19 030 22 029 25 029 28 029 34 157 34 157
Exported Electricity 9 992 8 383 6 773 5 164 0 0
Contribution to Zimbabwean Direct Jobs 250 239 1 477 1 465 1 453 1 440 29 768 31 145 32 520 33 895 34 772 34 665
Contribution to Regional Direct Jobs 569 550 3 031 3 011 2 990 2 969 42 577 45 433 48 040 50 645 54 842 54 662

Economic Feasibility Analysis of the Proposed Batoka Gorge Hydroelectric Scheme 40
• It is estimated that 837 direct jobs would be created in Zambia and 966 in Zimbabwe
from operations and maintenance.
• Professional fees could generate 106 direct jobs in Zambia and 112 in Zimbabwe.
• There would be a loss of 223 direct jobs in tourism in Zambia and 331 in Zimbabwe
in 2022. This would increase to 385 and 570 respectively by 2035.
• Savings from fewer outages is expected to generate 19 440 direct jobs from 2030 in
Zambia and 34 157 in Zimbabwe.
• Exports contribute to job creation in the early years of operation. In Zambia as many
as 8 428 jobs could be created from export revenue in 2022 while in Zimbabwe it is
estimated that 9 992 direct jobs could be created.
Total direct jobs in the two countries are estimated to exceed 1 500 from the third year of
construction. The number of direct jobs then increases until stabilising at approximately
54 000 in 2030.
Table 21: Indirect Jobs
Indirect jobs are shown in Table 21. Total indirect jobs in the two countries are set to
increase from around 11 900 in 2016 to approximately 94 000 in 2022. As business
productivity increases so too do the indirect jobs, until they total almost 110 000 by 2030 and
2035.
Contribution to Indirect Jobs 2016 2017 2018 2019 2020 2021 2022 2023 2024 2025 2030 2035
Zambia
Initial Construction Costs 4 674 4 674 4 674 4 674 4 674 4 674
Operations & Maintenance 1 397 1 397 1 397 1 397 1 397 1 397
Professional Fees 266 266 266 266 266 266 116 116 116 116 116 116
Reduced Tourism Revenues -350 -365 -380 -396 -413 -431 -449 -468 -488 -509 -627 -773
Savings from Outages 7 363 15 232 20 588 25 944 39 083 39 083
Exported Electricity 16 944 14 083 11 222 8 361 0 0
Contribution to Zambian Indirect Jobs 4 590 4 575 4 560 4 543 4 526 4 509 25 370 30 359 32 834 35 308 39 969 39 823
Zimbabwe
Initial Construction Costs 7 429 7 429 7 429 7 429 7 429 7 429
Operations & Maintenance 2 491 2 491 2 491 2 491 2 491 2 491
Professional Fees 383 383 383 383 383 383 167 167 167 167 167 167
Reduced Tourism Revenues -506 -528 -550 -574 -598 -624 -650 -678 -707 -737 -909 -1 120
Savings from Outages 47 213 53 282 59 351 65 419 68 144 68 144
Exported Electricity 19 622 16 462 13 301 10 141 0 0
Contribution to Zimbabwean Indirect Jobs 7 306 7 285 7 262 7 239 7 214 7 189 68 843 71 723 74 603 77 481 69 894 69 683
Contribution to Regional Indirect Jobs 11 896 11 860 11 822 11 782 11 741 11 698 94 213 102 083 107 437 112 789 109 862 109 505

Economic Feasibility Analysis of the Proposed Batoka Gorge Hydroelectric Scheme 41
Table 22: Total Direct and Indirect Jobs
Total jobs, the sum of the direct and indirect jobs discussed above, are shown in Table 22.
Total jobs are set to increase from 12 465 in 2016 to 14 666 by the end of the construction
period. They increase to 136 791 in 2022. They increase annually after that reaching
approximately 164 000 by 2030.
Figure 5: Contribution to Direct and Indirect Jobs and Gross Domestic Product
Figure 5 shows the contribution to direct and indirect jobs (the blue and orange columns
respectively) and to the Zambian and Zimbabwean economies respectively (the two black
lines). A number of patterns are apparent:
Contribution to Direct and Indirect Jobs 2016 2017 2018 2019 2020 2021 2022 2023 2024 2025 2030 2035
Zambia
Initial Construction Costs 4 924 4 924 6 174 6 174 6 174 6 174
Operations & Maintenance 2 234 2 234 2 234 2 234 2 234 2 234
Professional Fees 509 509 509 509 509 509 222 222 222 222 222 222
Reduced Tourism Revenues -523 -546 -569 -593 -619 -645 -673 -701 -731 -762 -939 -1 158
Savings from Outages 11 025 21 806 29 826 37 846 58 523 58 523
Exported Electricity 25 372 21 088 16 803 12 519 0 0
Contribution to Total Zambian Jobs 4 909 4 887 6 114 6 089 6 064 6 038 38 179 44 647 48 353 52 058 60 039 59 820
Zimbabwe
Initial Construction Costs 7 679 7 679 8 929 8 929 8 929 8 929
Operations & Maintenance 3 457 3 457 3 457 3 457 3 457 3 457
Professional Fees 641 641 641 641 641 641 279 279 279 279 279 279
Reduced Tourism Revenues -764 -797 -831 -866 -903 -941 -982 -1 024 -1 067 -1 113 -1 371 -1 690
Savings from Outages 66 243 75 311 84 380 93 448 102 301 102 301
Exported Electricity 29 614 24 844 20 074 15 305 0 0
Contribution to Total Zimbabwean Jobs 7 556 7 523 8 739 8 704 8 667 8 629 98 611 102 868 107 123 111 376 104 666 104 347
Contribution to Total Regional Jobs 12 465 12 410 14 853 14 793 14 731 14 666 136 791 147 515 155 476 163 434 164 704 164 168
0
20 000
40 000
60 000
80 000
100 000
120 000
140 000
160 000
180 000
200 000
0
500
1 000
1 500
2 000
2 500
3 000
2016 2017 2018 2019 2020 2021 2022 2023 2024 2025 2026 2027 2028 2029 2030 2031 2032 2033 2034 2035
Dir
ect
an
d In
dir
ect
Jo
b N
um
be
rs
Co
ntr
ibu
tio
n t
o G
ross
Do
me
stic
Pro
du
ct (
US
$ m
illi
on
)
Contribution to GDP and Jobs
Direct Jobs Indirect Jobs Zambian GDP Zimbabwean GDP

Economic Feasibility Analysis of the Proposed Batoka Gorge Hydroelectric Scheme 42
• The contribution of the scheme to jobs and to the economies of the two counties
increases significantly during the operating period (from 2022 onwards).
• For every one direct job there are approximately two indirect jobs.
• There is a higher economic contribution to Zimbabwe than Zambia.

Economic Feasibility Analysis of the Proposed Batoka Gorge Hydroelectric Scheme 43
8 Overall Assessment and Significance Rating of Impacts
This section assesses the five cases analysed in Section 7.1.
8.1 Economic Feasibility: Case 1: Base Case – Dam Height and FSL of
762m
8.1.1 Description of Effect
Determine whether the construction and operation of the proposed Batoka Gorge
Hydroelectric Scheme, operating at an FSL of 762m, is economically efficient.
8.1.2 Assessment
The overall conclusion from the cost benefit analysis is that the base case is economically
efficient. Realistic assumption changes did not result in economic inefficiency.
Table 23: Significance Rating of the Proposed Batoka Gorge Hydroelectric Scheme at FSL 762m
Criteria Rating
Extent Regional and International
Duration Permanent
Scale Large (National and International)
Frequency Constant
Likelihood Likely
Magnitude Positive
Sensitivity / Vulnerability / Importance of Resource / Receptor High
Impact Significance Major
The project has a major positive impact significance, as shown in Table 23. Although the
project overall is beneficial from the national perspective of the two countries there is a
localised negative economic impact on the tourism facilities affected by the scheme (Anchor
Environmental Consultants, 2015).

Economic Feasibility Analysis of the Proposed Batoka Gorge Hydroelectric Scheme 44
Mitigation measures could include:
• Operating the dam at a lower level during the dry season.
• Financial payments from the ZRA to the tourist companies affected by the scheme.
This transfer would not affect the economic efficiency of the project if the transfers
remain in the countries.

Economic Feasibility Analysis of the Proposed Batoka Gorge Hydroelectric Scheme 45
8.2 Economic Feasibility: Case 2: Different Dam Heights
8.2.1 Description of Effect
Determine whether the construction and operation of the proposed Batoka Gorge
Hydroelectric Scheme, with an FSL of less than 762m, is economically efficient from a
combined national perspective for Zambia and Zimbabwe.
8.2.2 Assessment
The overall conclusion from the cost benefit analysis is that case 2 is economically efficient.
The economic efficiency is lower than the base case.
Table 24: Significance Rating of the Proposed Batoka Gorge Hydroelectric Scheme with FSLs less than 762m
Criteria Rating
Extent Regional and International
Duration Permanent
Scale Large (National and International)
Frequency Constant
Likelihood Likely
Magnitude Positive
Sensitivity / Vulnerability / Importance of Resource / Receptor High
Impact Significance Major
The project has a major positive impact significance, as shown in Table 24. Although the
project overall is beneficial from the national perspective of the two countries there is a
localised negative economic impact on the tourism facilities affected by the scheme (Anchor
Environmental Consultants, 2015).
Mitigation measures could include:
• Operating the dam at a lower level during the dry season.

Economic Feasibility Analysis of the Proposed Batoka Gorge Hydroelectric Scheme 46
• Financial payments from the ZRA to the tourist companies affected by the scheme.
This transfer would not affect the economic efficiency of the project if the transfers
remain in the two countries.

Economic Feasibility Analysis of the Proposed Batoka Gorge Hydroelectric Scheme 47
8.3 Economic Feasibility: Case 3: Variations in Electricity Demand
8.3.1 Description of Effect
Determine whether the construction and operation of the proposed Batoka Gorge
Hydroelectric Scheme, with an FSL of 762m, is economically efficient with electricity
demands different to those of the base case.
8.3.2 Assessment
The overall conclusion from the cost benefit analysis is that the base case is economically
efficient. The outcome remains economically efficient with variations in electricity demand.
The efficiency of the project reduces as demand for electricity reduces. However, the project
remains efficient under the range tested.
Table 25: Significance Rating of the Proposed Batoka Gorge Hydroelectric Scheme at FSL 762m and Variations in Demand
Criteria Rating
Extent Regional and International
Duration Permanent
Scale Large (National and International)
Frequency Constant
Likelihood Likely
Magnitude Positive
Sensitivity / Vulnerability / Importance of Resource / Receptor High
Impact Significance Major
The project has a major positive impact significance, as shown in Table 25. Although the
project overall is beneficial from the national perspective of the two countries there is a
localised negative economic impact on the tourism facilities affected by the scheme (Anchor
Environmental Consultants, 2015).
Mitigation measures could include:
• Operating the dam at a lower level during the dry season.

Economic Feasibility Analysis of the Proposed Batoka Gorge Hydroelectric Scheme 48
• Financial payments from the ZRA to the tourist companies affected by the scheme.
This transfer would not affect the economic efficiency of the project if the transfers
remain in the countries.

Economic Feasibility Analysis of the Proposed Batoka Gorge Hydroelectric Scheme 49
8.4 Economic Feasibility: Case 4 -Lower Water Storage in Dry Season
8.4.1 Description of Effect
Determine whether the construction and operation of the proposed Batoka Gorge
Hydroelectric Scheme, constructed at an FSL of 762m and operated at an FSL of 740m
during the dry season is economically efficient from a combined national perspective for
Zambia and Zimbabwe.
8.4.2 Assessment
The overall conclusion from the cost benefit analysis is that this case is still economically
efficient when operated at a lower level during the dry season. However, the economic
efficiency has reduced. Realistic changes in the assumptions did not change the efficiency
of the project.
Table 26: Significance Rating of the Proposed Batoka Gorge Hydroelectric Scheme Operated at FSL 740m during the Dry Season
Criteria Rating
Extent Regional and International
Duration Permanent
Scale Large (National and International)
Frequency Constant
Likelihood Likely
Magnitude Positive
Sensitivity / Vulnerability / Importance of Resource / Receptor High
Impact Significance Major
The project has a major positive impact significance, as shown in Table 26. Although the
efficiency has reduced from the previous case it is still an economically efficient project.
Although the project overall is beneficial from the national perspective of the two countries
there is a localised negative economic impact on the tourism facilities affected by the
scheme (Anchor Environmental Consultants, 2015).

Economic Feasibility Analysis of the Proposed Batoka Gorge Hydroelectric Scheme 50
The purpose of this particular case it to determine the impact on tourism revenues that result
from a lower FSL during the dry season. The result is insignificant. Lost tourism revenues
change from $135m with a FSL of 762m to $134m with a FSL of 740m.
As a consequence, the only mitigation measure that would have any meaningful affect would
be financial compensation by the ZRA to the tourist companies affected by the proposed
scheme.
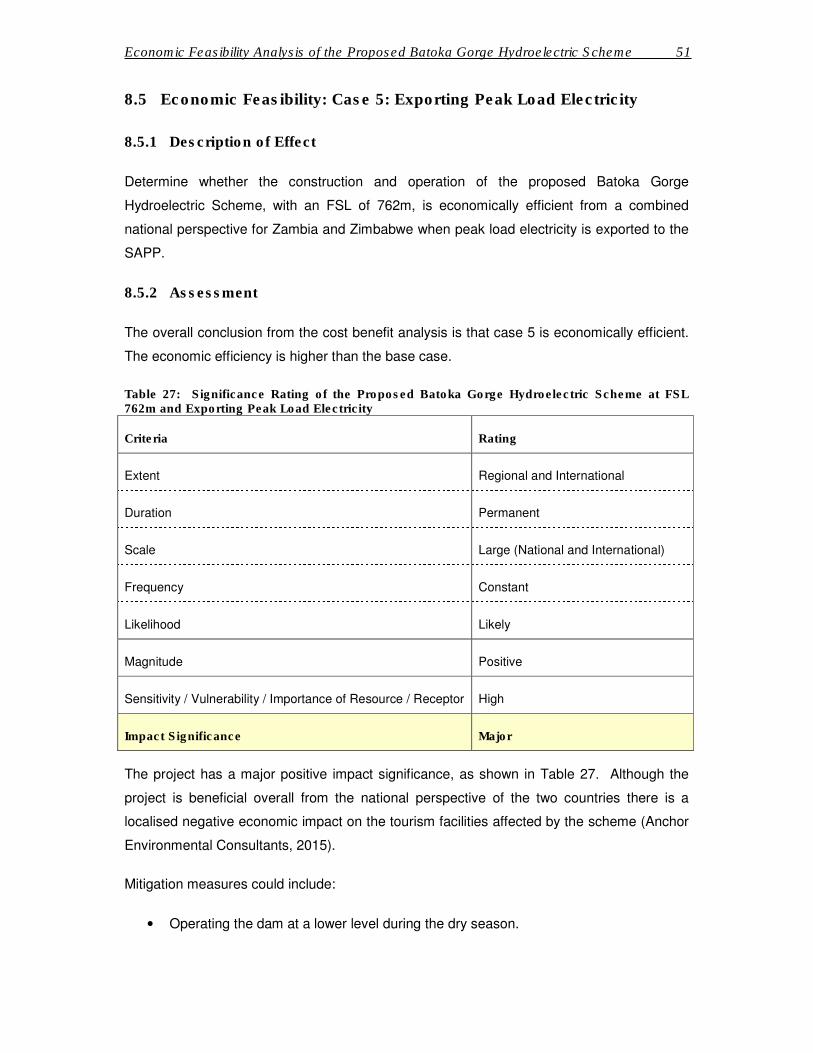
Economic Feasibility Analysis of the Proposed Batoka Gorge Hydroelectric Scheme 51
8.5 Economic Feasibility: Case 5: Exporting Peak Load Electricity
8.5.1 Description of Effect
Determine whether the construction and operation of the proposed Batoka Gorge
Hydroelectric Scheme, with an FSL of 762m, is economically efficient from a combined
national perspective for Zambia and Zimbabwe when peak load electricity is exported to the
SAPP.
8.5.2 Assessment
The overall conclusion from the cost benefit analysis is that case 5 is economically efficient.
The economic efficiency is higher than the base case.
Table 27: Significance Rating of the Proposed Batoka Gorge Hydroelectric Scheme at FSL 762m and Exporting Peak Load Electricity
Criteria Rating
Extent Regional and International
Duration Permanent
Scale Large (National and International)
Frequency Constant
Likelihood Likely
Magnitude Positive
Sensitivity / Vulnerability / Importance of Resource / Receptor High
Impact Significance Major
The project has a major positive impact significance, as shown in Table 27. Although the
project is beneficial overall from the national perspective of the two countries there is a
localised negative economic impact on the tourism facilities affected by the scheme (Anchor
Environmental Consultants, 2015).
Mitigation measures could include:
• Operating the dam at a lower level during the dry season.

Economic Feasibility Analysis of the Proposed Batoka Gorge Hydroelectric Scheme 52
• Financial payments from the ZRA to the tourist companies affected by the scheme.
This transfer would not affect the economic efficiency of the project if the transfers
remain in the two countries.
Economic Feasibility Analysis of the Proposed Batoka Gorge Hydroelectric Scheme 53
9 Conclusion
This report set out to determine the economic efficiency of the proposed Batoka Gorge
Hydroelectric Scheme and the distribution of the costs and benefits through the economies
of Zambia and Zimbabwe. It did this by performing an economic cost benefit analysils and a
macroeconomic analysis.
Cost Benefit Analysis Results
The following results are reported:
• Case 1, the base case, with an FSL of 762m:
o The NPV is R11 625m. This is economically efficient and would benefit
countries.
o The BCR is 4.71. This means that for every $1.00 spent on the project would
bring benefits of $4.71. This is a robust result.
o The IRR is 28%.
• Case 2: Different Dam Heights: There are lower costs and benefits with a lower
dam wall. Benefits reduce more proportionately than costs. The BCR and IRR for an
FSL of:
o 762m (base case) are 4.71 and 28%;
o 757m are 4.63 and 28%;
o 740m are 4.08 and 26%;
o 730m are 3.77 and 25%.
• Case 3: Variations in Electricity Demand: The proposed scheme remains
economically efficient even with substantial changes to the underlying assumptions
of electricity demand of the base case.
• Case 4: Lower Water Storage in the Dry Season:
o The NPV would drop from $11 625m to $9 296m;
o The BCR reduces from 4.71 to 3.98 and the IRR from 28% to 26%.
• Case 5: Exporting Peak Load Power: The efficiency of the proposed scheme
increases if the peak load could be generated and exported at a premium to the
SAPP. The BCR and IRR for:
o Peak case 2 increase to 5.19 and 32%;
o Peak case 3 increase to 5.17 and 32%
Economic Feasibility Analysis of the Proposed Batoka Gorge Hydroelectric Scheme 54
The following conclusions are made:
• Operating the dam at its highest level is economically the most efficient.
• Variations in demand for electricity would not change the economic efficiency
provided surplus electricity could be exported to the SAPP.
• Operating at less than capacity during the dry season reduces the economic
efficiency. It also would make hardly any difference to the impact on income of tourist
operators. Mitigation would be improved by financial compensation to these
operators. This would remain efficient so long as the compensation is not relocated
to other countries.
• Exporting peak load electricity to the SAPP would improve the efficiency of the
project.
A sensitivity analysis was conducted on a number of assumptions for the base case (FSL of
762m) and case 4 (lower water storage in the dry season). The results were only affected
by changes to some of the assumptions. The results were most sensitive to changes in the
distribution of unserved demand (between households and firms) and the cost of lost
production for firms without generators. However, the results remained economically
efficient for the entire range tested.
Macroeconomic Results
The macroeconomic contribution of the base case is reported12.
In Zambia the total contribution to GDP:
• Is largely constant over construction - between $107m and $105m.
• Increases to $706m by 2022 in the first year of operation and continues to increase
until 2030 as a result of savings from less outages.
• By 2030 contribution to GDP is $1 117m.
• This drops slightly to $1 113m by 2035 because of falling tourism revenues.
In Zimbabwe the total contribution to GDP:
• Is largely constant over construction - between $139m and $135m.
12
It will be recalled that the results to the other cases are reported only for the cost benefit analysis because
those results should typically carry more weight in policy decisions.

Economic Feasibility Analysis of the Proposed Batoka Gorge Hydroelectric Scheme 55
• Increases to $1 920m by 2022 in the first year of operation and continues to increase
until 2030 as a result of savings from less outages.
• By 2030 contribution to GDP is $2 101m.
• This drops slightly to $2 095m by 2035 because of falling tourism revenues.
In total, contribution to GDP:
• Is largely constant over construction - about $240m.
• Increases to $2 627m by 2022.
• This is $3 208m by 2035.
In aggregate the proposed Batoka Gorge hydroelectric scheme would have added a
cumulative $1 458m to the GDPs of the two countries at the end of construction. By 2035
this cumulative contribution is estimated at $45 670m.
The contribution of the proposed Batoka Gorge Hydroelectric scheme to job creation:
• Total direct jobs in the two countries are estimated to exceed 1 500 from the third
year of construction. The number of direct jobs then increases until stabilising at
approximately 54 000 in 2030.
• Total indirect jobs in the two countries are set to increase from around 11 900 in
2016 to approximately 94 000 in 2022. As business productivity increases so too do
the indirect jobs, until they total almost 110 000 by 2030 and 2035.
• Total jobs, which is the sum of the direct and indirect jobs, are set to increase from
12 465 in 2016 to 14 666 by the end of the construction period. They increase to
136 791 in 2022. They increase annually after that reaching approximately 164 000
by 2030.
Significance Ratings
All five cases assessed have major positive significance ratings.
There would be negative impacts on local firms that supply tourism services. This may
warrant mitigation:
• Operating the scheme at a lower level during the dry season makes hardly any
difference to tourism revenues.
• The alternative is a direct financial compensation from the ZRA to affected firms.

Economic Feasibility Analysis of the Proposed Batoka Gorge Hydroelectric Scheme 56
10 Bibliography
(CSIR), T. C. (2004). The estimation of unit costs of road traffic accidents in South Africa.
Anchor Environmental Consultants. (2015). Batoka Gorge Hydro-Electric Scheme
Environmental and Social Impact Assessment: Economic Assessment. Cape Town.
Barnes, D. F., Khandker, S. R., & Samad, H. A. (2010). Energy Access, Efficiency, and
Poverty: How Many Households Are Energy Poor in Bangladesh?
De Vita, G., Endresen, K., & Hunt, L. C. (2006). An empirical analysis of energy demand in
Namibia. Energy Policy, 3447-3463.
Dinkelman, T. (2008). The Effects of Rural Electrification on Employment: New Evidence
from South Africa.
Federal Motor Carrier Safety Administration (FMCSA). (2008). Current FCMSA Crash Cost
Figures.
IEG. (2008). The Welfare Impact of Rural Electrification: A Reassessment of the Costs and
Benifits. World Bank, Independent Evaluation Group. Washington: World Bank
InfoShop.
Inglesi, R. (2010). Aggregate electricity demand in South Africa: Conditional forecasts to
2030. Applied Energy, 197-204.
Inglesi-Lotz, R. (2011). The evolution of price elasticity of electricity demand in South Africa:
A Kalman filter application. Energy Policy, 3690-3696.
Inglesi-Lotz, R., & Blignaut, J. N. (2011). ESTIMATING THE PRICE ELASTICITY OF
DEMAND FOR ELECTRICITY BY SECTOR IN SOUTH AFRICA. SAJEMS NS, 449-
465.
Jacobson, A. (2007). Connective Power: Solar Electrification and Social Change in Kenya.
World Development, 35(1), 144-162.
Khandker, S. R., Barnes, D. F., & Samad, H. A. (2009). Welfare Impacts of Rural
Electrification: A Case Study from Bangladesh. World Bank.
Khandker, S. R., Barnes, D. F., Samad, H., & Huu Minh, N. (2008). Welfare Impacts of Rural
Electrification: Evidence from Vietnam. World Bank.

Economic Feasibility Analysis of the Proposed Batoka Gorge Hydroelectric Scheme 57
Khandker, S. R., Samad, H. A., Ali, R., & Barnes, D. F. (2012). Who Benefits Most from
Rural Electrification? Evidence in India. World Bank.
Kirubi, C., Jacobson, A., Kammen, D. M., & Mills, A. (2009). Community-Based Electric
Micro-Grids Can Contribute to Rural Development: Evidence from Kenya. Elsevier,
37(7), 1208-1221.
Kopp, A. (2010). How to use rural electricity in a productive way. NADEL MAS-cycle 2008 -
2010.
Lindberg, G. (2001). External Accident Cost of Heavy Goods Vehicles. Swedish National
Road and Transport Research Institute (VTI).
Lloyd, P., & Cowan, B. (2005). IMPROVING ACCESS TO ELECTRICITY: LESSONS FROM
KHAYELITSHA. Energy Research Centre, University of Cape Town, South Africa.
Mathee, A., & de Wet, T. (2001). Rural Electrification in South Africa- Implications for the
Health and Quality of Life of Women. ENERGIA News, pp. 20-22.
Namibia Statistics Agency. (2011). Namibia 2011 Population & Housing Census Main
Report. Namibia Statistics Agency.
Namibia Statistics Agency. (2012). Namibia Household Income & Expenditure Survey
(NHIES) 2009/10. Namibia Statistics Agency.
Oseni, M. O., & Pollitt, M. G. (2013). The Economic Costs of Unsupplied Electricity:
Evidence from Backup Generatoin among African Firms. University of Cambridge:
Energy Policy Research Group.
Pereira, M. G., Sena, J. A., Freitas, M. A., & da Silva, N. F. (2011). Evaluation of the impact
of access to electricity: A comparative analysis of South Africa, China, India and
Brazil. Renewable and Sustainable Energy Reviews, 1427-1441.
Prasad, G., & Dieden, S. (2007). Does Access to Electricity Enable the Uptake of Small and
Medium Enterprises in South Africa. Cape Town: Energy Research Centre,
University of Cape Town.
Prasad, G., & Ranninger, H. (2003). THE SOCIAL IMPACT OF THE BASIC ELECTRICITY
SUPPORT TARIFF (BEST). Domestic Use of Energy Conference (pp. 17-22).
Energy and Development Research Centre (EDRC).

Economic Feasibility Analysis of the Proposed Batoka Gorge Hydroelectric Scheme 58
Prasad, G., & Visagie, E. (2006). Impact of energy reforms on the poor in South Africa.
ENERGY RESEARCH CENTRE, University of Cape Town.
PRODUSE. (2013). The Impact of Electricity Access on Economic Development. Eschborn.
Snell, M. (2011). Cost-benefit analysis, a practical guide (second edition). London: Thomas
Telford.
Spalding-Fecher, R. (2005, 05). Health benefits of electrification in developing countries: a
quantitative assessment in South Africa. Energy for Sustainable Development, pp.
53-62.
Spalding-Fecher, R., & Matibe, D. K. (2003). Electricity and externalities in South Africa.
Energy Policy, 721-734.
Steinbuks, J., & Foster, V. (2010). When do firms generate? Evidence on in-house electricity
supply in Africa. Energy Economics, 505-514.
Studio Pietrangeli. (2015). Batoka Gorge Hydo-Electric Scheme Phase II Layout, Option
Assessment Report.
The Economist. (2016, January 9th - 15th). Electricity in Africa: Power Hungry. The
Economist, p. 34.
The Freight Transport Association (U.K.). (2012). HGV Accident Research: Lading Factors
and other KPI.
Trading Economics. (2016, January 26). Government Bond 10y - Countries. Retrieved from
Trading Economics: www.tradingeconomics.com/bonds
UNESCO. (2016, January 29). Mosi-oa-Tunya / Victoria Falls. Retrieved from UNESCO
World Heritage List: http://whc.unesco.org/en/list/509
Viscusi, W. K. (2005, June). The Value of Life. HARVARD, JOHN M. OLIN CENTER FOR
LAW, ECONOMICS, AND BUSINESS.
World Bank Group. (2014). Zambia Economic Brief. Washington DC: The World Bank.
ZESCO. (2016, January 15). Customer Care. Retrieved from Load Shedding Schedules:
http://www.zesco.co.zm/customerCare/loadSheddingSchedule

Economic Feasibility Analysis of the Proposed Batoka Gorge Hydroelectric Scheme 59
ZESCO. (2016, 01 18). Generation Projects. Retrieved from Projects:
www.zesco.co.zm/projects/generation

Updated Cost Benefit Analysis Specialist Study (2019)

Economic Cost Benefit Analysis of the Batoka Gorge Hydro-Electric Scheme FSL 757m i
Economic Cost Benefit Analysis
Batoka Gorge Hydro-Electric
Scheme: Dam FSL 757m
Prepared for ERM Southern Africa

Economic Cost Benefit Analysis of the Batoka Gorge Hydro-Electric Scheme FSL 757m i
Economic Cost Benefit Analysis
Proposed Batoka Gorge Hydro-Electric Scheme: Dam FSL 757m
Prepared by:
Barry Standish Antony Boting
John White
12 September 2019

Economic Cost Benefit Analysis of the Batoka Gorge Hydro-Electric Scheme FSL 757m ii
Executive Summary
This report is an update of the 2016 economic cost benefit analysis of the proposed Batoka
Gorge Hydro-Electric Scheme (BGHES or Project). It has been undertaken within the context
of the ERM Southern Africa Environmental and Social Impact Assessment (ESIA) of this
Project. This update focuses on a single option of a scheme with a final reservoir level of
757m. This economic report is not a full Economic Specialist report as required by an ESIA
and only focusses on the economic cost benefit analysis of the Project.
Four sets of analyses were done. These are:
Base Case: an evaluation of the BGHES within committed electricity generation
options and excluding emergency generators. This Base Case was extended to
assess the impact of a severe drought on the economic efficiency of the BGHES.
Alternative 1: an evaluation of the BGHES within committed and identified electricity
generation options. This alternative includes the operation of emergency generators.
Alternative 2: renewable and new coal generation options as substitutes for the
BGHES.
Sensitivity analyses on the key assumptions.
The following findings were made:
The Base Case is economically efficient. It would have a Net Present Value (NPV) of
$10 643m and benefit both countries. The Benefit Cost Ratio (BCR) is 4.44, meaning that
every $1.00 of project expenditure would return $4.44 in societal benefits to the two countries.
The economic internal rate of return (IRR) is 28%.
It was found that the Base Case would need a drought that would result in the scheme standing
idle for seventeen years (starting immediately after completion) to make the Project
economically inefficient. There is no record of such drought over the last century. Alternatively,
reduced flows resulting in generation capacity of 16% over the full lifespan of the Project are
required to make the Project economically inefficient. Once again, there is no record of such
drought over the last century.
Alternative 1 includes the operation of emergency generators which substitute for some of the
BGHES output. The excess output is sold to other countries. In this situation the BCR drops
from 4.44 to 3.75, which is still an efficient result. The NPV falls from $10 643m to $8 526m
and the IRR from 28% to 24%.

Economic Cost Benefit Analysis of the Batoka Gorge Hydro-Electric Scheme FSL 757m iii
Alternative 2 assessed whether other renewable energy and new coal generation options
would be more efficient than the BGHES. Renewable energy options would need storage
capacity to fulfil the same role as the BGHES. It was found that BGHES is the most efficient
option. The only economically efficient baseload alternative is Concentrated Solar Power
(CSP), but this is less efficient than the BGHES.
The overall conclusion is that the Project is economically efficient. It remains efficient even
with a prolonged drought. It also remains efficient even if surplus energy, because of planned
alternative generators or demand variations, is exported. The BGHES is a more efficient
baseload option than coal, CSP, wind and solar PV.
The sensitivity analyses found that the results were most sensitive to changes in the growth
in demand for electricity in both countries, the distribution of unserved demand (between
households and firms), the cost of lost production for firms without generators and the initial
construction costs. The results remained economically efficient for the entire range tested. A
combination of assumptions found that the Project remains economically efficient with the
least favourable combination.
The overall conclusion from the cost benefit analysis is that the base case is economically
efficient. Realistic assumption changes did not result in economic inefficiency. The assessed
alternative has a major positive significance rating considering that its extent is regional and
international, it is permanent, of large scale, constant frequency and likely to be implemented.
There would be negative impacts on local firms that supply tourism services in the gorge. This
may warrant mitigation of direct financial compensation to affected firms.

Economic Cost Benefit Analysis of the Batoka Gorge Hydro-Electric Scheme FSL 757m iv
Table of Contents
Executive Summary ................................................................................................................. ii
Table of Contents .................................................................................................................... iv
List of Tables .......................................................................................................................... vii
List of Figures ....................................................................................................................... viii
Abbreviations .......................................................................................................................... ix
Introduction ............................................................................................................................. 1
1 Contractual Details .......................................................................................................... 2
1.1 Declaration of Independence .................................................................................... 2
1.2 Not Full Specialist Report ......................................................................................... 2
2 Context ............................................................................................................................ 3
2.1 Project Description ................................................................................................... 3
2.2 Power Supply and Demand ...................................................................................... 5
2.2.1 Zambia ................................................................................................................ 5
2.2.2 Zimbabwe ............................................................................................................ 8
2.2.3 Southern African Power Pool ............................................................................ 11
2.2.4 Need for Batoka Gorge Hydro-Electric Scheme ................................................ 12
3 Approach and Methodology ........................................................................................... 13
3.1 Economic Cost Benefit Analysis ............................................................................. 13
3.2 Establishing Costs and Benefits: BGHES .............................................................. 14
3.2.1 Costs ................................................................................................................. 14
3.2.2 Benefits ............................................................................................................. 19

Economic Cost Benefit Analysis of the Batoka Gorge Hydro-Electric Scheme FSL 757m v
3.3 Establishing Costs and Benefits: Alternative Electricity Generation ....................... 22
3.3.1 Construction and Operating Costs .................................................................... 23
3.3.2 Construction Period ........................................................................................... 24
3.3.3 Land Area .......................................................................................................... 24
3.3.4 External Costs ................................................................................................... 24
3.3.5 Cost Summary ................................................................................................... 25
3.4 Limitations and Critical Assumptions ...................................................................... 26
4 Analytical Results .......................................................................................................... 27
4.1 Base Case .............................................................................................................. 27
4.1.1 Base Case without Water Shortages ................................................................ 27
4.1.2 Base Case with Drought and Climate Change .................................................. 29
4.2 Alternatives ............................................................................................................. 31
4.2.1 Alternative 1: BGHES within Committed and Identified Options ....................... 31
4.2.2 Alternative 2: Renewable and New Coal as BGHES substitutes ...................... 33
4.3 Sensitivity Analyses ................................................................................................ 34
4.3.1 Single Sensitivities ............................................................................................ 34
4.3.2 Simultaneous Sensitivities ................................................................................. 37
5 Assessment and Significance Rating ............................................................................ 39
5.1 Description of Effect ............................................................................................... 39
5.2 Assessment ............................................................................................................ 39
6 Conclusion ..................................................................................................................... 40
7 Bibliography ................................................................................................................... 41
Appendix: Macroeconomic Analysis ..................................................................................... 44

Economic Cost Benefit Analysis of the Batoka Gorge Hydro-Electric Scheme FSL 757m vi
Macroeconomic Analysis Methodology ................................................................................. 44
Results of Macroeconomic Analysis ..................................................................................... 46
Gross Domestic Product ................................................................................................ 47
Direct and Indirect Jobs ................................................................................................. 49

Economic Cost Benefit Analysis of the Batoka Gorge Hydro-Electric Scheme FSL 757m vii
List of Tables
Table 1: Peak Electricity Demand and Generation Forecast ................................................ 11
Table 2: Capital Costs ........................................................................................................... 15
Table 3: Local Tourism Impacts ............................................................................................ 17
Table 4: Electricity Contribution to Household Income ......................................................... 22
Table 5: South Africa Levelized Cost - Alternative Electricity Generation ............................ 23
Table 6: Electricity Generation - External Costs ................................................................... 25
Table 7: Alternative Generation Options - Total LCOE ......................................................... 25
Table 8: Results: Base Case without Water Shortages ........................................................ 28
Table 9: Cost Benefit Results – Alternative 1 Relative to Base Case ................................... 32
Table 10: Cost Benefit Results - Alternative 2: Renewables and New Coal ......................... 33
Table 11: Sensitivity: Zambia - Electricity Demand Growth .................................................. 34
Table 12: Sensitivity: Zimbabwe - Electricity Demand Growth ............................................. 35
Table 13: Sensitivity - Unserved Demand Distribution .......................................................... 36
Table 14: Sensitivity: Lost Production Cost .......................................................................... 36
Table 15: Sensitivity – Variation in Initial Construction Costs ............................................... 37
Table 16: Assessing Combined Assumptions ....................................................................... 37
Table 17: Significance Rating of the Proposed BGHES ....................................................... 39
Table 18: Contribution to GDP .............................................................................................. 47
Table 19: Direct Jobs ............................................................................................................ 50
Table 20: Indirect Jobs .......................................................................................................... 52
Table 21: Total Direct and Indirect Jobs ............................................................................... 52

Economic Cost Benefit Analysis of the Batoka Gorge Hydro-Electric Scheme FSL 757m viii
List of Figures
Figure 1: Location ................................................................................................................... 3
Figure 2: Zambia: Capacity and Demand - 2012 to 2030 ....................................................... 6
Figure 3: Zambia Installed Capacity and Demand – 2020 to 2040 ......................................... 7
Figure 4: Zimbabwe: Capacity and Demand – 2012 to 2030 .................................................. 8
Figure 5: Zimbabwe: Installed Capacity and Demand – 2020 to 2040 ................................. 10
Figure 6: Contribution to Gross Domestic Product ............................................................... 49
Figure 7: Jobs and Gross Domestic Product ........................................................................ 53

Economic Cost Benefit Analysis of the Batoka Gorge Hydro-Electric Scheme FSL 757m ix
Abbreviations
BCR Benefit Cost Ratio
BGHES Batoka Gorge Hydro-Electric Scheme
CBA Cost Benefit Analysis
CSP Concentrated Solar Power
ESIA Environmental and Social Impact Assessment
FSL Final Supply Level
GDP Gross Domestic Product
GWh Gigawatt hour
HES Hydroelectric Scheme
IRR Internal Rate of Return
LCOE Levelized Cost of Electricity
MW Megawatt
NPV Net Present Value
PEH Peak Equivalent Hours
PV Present Value
REA Rural Electrification Agency [Zimbabwe]
REMP Rural Electrification Masterplan [Zimbabwe]
SADC Southern African Development Community
SAM Social Accounting Matrix
SAPP Southern African Power Pool
Solar PV Solar Photovoltaic
ZESA Zimbabwe Electricity Supply Authority
ZESCO Zambia Electricity Supply Corporation
ZRA Zambezi River Authority
Economic Cost Benefit Analysis of the Batoka Gorge Hydro-Electric Scheme FSL 757m 1
Introduction
ERM Southern Africa is conducting an Environmental and Social Impact Assessment (ESIA)
of the proposed Batoka Gorge Hydro-Electric Scheme (BGHES or Project) for the Zambezi
River Authority (ZRA). The BGHES is situated upstream of the existing Kariba Dam on the
Zambezi River and approximately 50km downstream of the Victoria Falls, a world heritage
site. Several specialist studies were completed, including a specialist economic assessment
by Anchor Environmental Consultants (2015) that focused on the localised microeconomic
impact on the affected tourism related firms in the gorge. The ZRA subsequently requested
an economic cost benefit analysis to assess the potential negative localised economic and
environmental impact of the BGHES relative to the positive regional impacts. This was done
by StratEcon in 2016. The ZRA has now requested an update to that economic cost benefit
analysis focussing on one single option, which is the scheme with a final reservoir level of
757m.
The report has seven sections:
Section 1 is a short contractual clarification;
Section 2 describes the proposed project;
Section 3 outlines the approach and methodology;
Section 4 presents the results of the cost benefit analysis;
Section 5 reports the assessed significance ratings;
Section 6 concludes the report;
An appendix is included that gives the expected macroeconomic contribution of the
proposed project.

Economic Cost Benefit Analysis of the Batoka Gorge Hydro-Electric Scheme FSL 757m 2
1 Contractual Details
This was a desktop study. It used information supplied by the project engineers (Studio
Pietrangeli, 2018) (Studio Pietrangeli, 2019d) and no field work was done.
1.1 Declaration of Independence
This is to confirm that Barry Standish, Antony Boting and John White of StratEcon are
independent and have no vested or financial interests in the approval or otherwise of the
Project.
1.2 Not Full Specialist Report
This economic report is not a full Economic Specialist report that would be needed for an
Environmental and Social Impact Assessment (ESIA). The focus of this report is on the
economic efficiency of the Project. The distribution of the costs and benefits through the
economies of Zambia and Zimbabwe are described in an appendix. An ESIA economic
specialist report should be done within the framework of equity, efficiency and sustainability
parameters.
The report does not assess:
Fit with legislative, regulatory and policy framework of the two countries;
Economic equity or sustainability and the associated risks. This would include the
ability of the countries to pay off the loans required to service the costs;
Environmental costs.

Economic Cost Benefit Analysis of the Batoka Gorge Hydro-Electric Scheme FSL 757m 3
2 Context
This chapter gives the Project context by describing the BGHES, the current power generation
situation in Zambia and Zimbabwe, future supply and demand and the proposed role of the
Batoka Gorge Hydroelectric Scheme.
2.1 Project Description1
The BGHES is in the central portion of the Zambezi River Basin and would extend across the
international boundary between Zambia and Zimbabwe. It would be situated upstream of the
existing Kariba Dam hydroelectric scheme on the Zambezi River and approximately 50 km
downstream of the Victoria Falls. The Victoria Falls (or Mosi-oa-Tunya Falls) was listed as a
World Heritage Site in 1989 (UNESCO, 2016).
In Zimbabwe the Batoka Gorge is in the province of Matabeleland North and in the Hwange
Rural District, while in Zambia the main area of direct impact falls under the Southern Province
in the Kazungula District. Electricity generated by the scheme would serve both countries.
Figure 1: Location
1 This is a project summary of the full description in Chapter 2 of the Environmental Impact Assessment Report.

Economic Cost Benefit Analysis of the Batoka Gorge Hydro-Electric Scheme FSL 757m 4
The key components of the proposed scheme are:
Dam wall, impoundment and spillway: the proposed high gravity arch dam wall would
be 175m in height. The full supply level (FSL) of the reservoir would be 757m above
mean sea level. After impoundment to the full supply level, the reservoir surface area
would cover approximately 23.0 km². The FSL of 757m has been selected to ensure
the backwaters from the resulting impoundment do not reach the base of the Victoria
Falls or flood the outlets of the existing Victoria Falls Power Station, located in the
region of Silent Pool.
Power houses: In a 1993 feasibility study it was planned that two powerhouses, each
with an installed capacity of 800 MW, would be constructed on each riverbank.
However, a later feasibility study suggested an optimum installed capacity of
2 400 MW (1 200 MW on each riverbank).
Transmission lines connecting the Project to the grid in Zambia and Zimbabwe:
o In Zimbabwe the transmission lines would comprise 2 x 67 km 400 kV lines,
running in parallel to the existing Hwange substation.
o In Zambia, two 330 kV transmission line routes are proposed. The first
routing, consisting of two lines, is 22km long from Batoka and terminating at
a proposed new ZESCO substation to be constructed in Livingstone. The
second line is a single line running in parallel to the existing 220 kV line,
terminating at the Muzuma substation in Choma, approximately 152 km long.
o The Batoka North and Batoka South Interconnector consists of two 330kV
lines 10km in length.
Access roads in Zambia and Zimbabwe: the upgrading of existing roads and
construction of new roads to access each bank from the main roads linking
Livingstone to Lusaka (Zambia) and Victoria Falls to Bulawayo (Zimbabwe) would be
required.
Permanent townships and other ancillary infrastructure (such as quarries, spoils area,
construction camps and batching areas): permanent townships would be located on
each side of the river. Construction camps would house approximately 1 500 staff
each (including security and support staff) (Studio Pietrangeli, 2018, p. 251). It is
proposed that the construction camps would be converted into permanent townships,
once operational, for staff and support services personnel (customs, police etc.).
The BGHES would be operated as a run-of-river project with storage only enough to
allow daily and weekly peaking but not for monthly or seasonal flow regulation. This
is because of the low storage capacity of the proposed reservoir.

Economic Cost Benefit Analysis of the Batoka Gorge Hydro-Electric Scheme FSL 757m 5
2.2 Power Supply and Demand
This section describes the current and future power generation and demand in the region and
discusses the need for the BGHES. This description includes:
The current electricity supply, demand and capacity situation in each country.
The impact of potential economic growth trends on the demand for electricity.
An assessment of alternative power generation options.
Information on current and expected electricity supply, demand and capacity is from the
options assessment report and chapter 3 of the Environmental Impact Assessment Report.
Updated official reports cited in the Options Assessment and the Environmental Impact
Assessment reports have been accessed where possible.
It would be recognized that many factors could affect the electricity projections. For example,
the current drought has resulted in electricity shortages when surpluses were expected. In
addition, delays in approval might affect the timing of some of the planned power plants.
Changes in commodity prices might render some plants unfeasible. Expensive generation
costs might lead to some plants only being operated in periods of high demand. The
consequence is that variations to the base case demand and supply amounts described above
are investigated. These results are discussed and presented in section 4.
2.2.1 Zambia
The expected electricity demand and surplus capacity for Zambia is given in Figure 2 (Studio
Pietrangeli, 2018, p. 126). The Energy Regulation Board of Zambia has stated that their
national installed capacity in 2017 was 2 897MW (Energy Sector Report 2017, 2018, p. 30).
This corresponds with the amount illustrated for 2017 in Figure 2.
While there was a deficit of 526 MW as a result of the 2016 drought, the deficit had been
eliminated by 2017 (2018, p. 44). This was due to the improved hydro power generation from
better rains and the expansion in generation capacity by IPPs (most notably the 300 MW
Maamba coal-fired thermal power plant and the 120 MW Ithezi tezhi hydro power plant)
(Environmental Resources Management Southern Africa (Pty) Ltd, 2019, pp. 3-2). This
corroborates Figure 2, which shows that power shortages are only expected after 2020 without
the BGHES. It is worth noting, that Zambia was again a net importer of 353 GWh of electricity
in 2017/18 (Southern African Power Pool, 2019, p. 39).

Economic Cost Benefit Analysis of the Batoka Gorge Hydro-Electric Scheme FSL 757m 6
Figure 2: Zambia: Capacity and Demand - 2012 to 2030
Source: (Studio Pietrangeli, 2018, p. 126)
The available capacity shown in Figure 2 is based on the planned BGHES commencing
operations in 2022. This planned opening is now delayed to 2028. The demand curves (yellow
and orange curves in the figure) are based on annual demand growth in excess of 5%. The
ESIA estimates updated annual growth rates in electricity demand of closer to 3% (2019, pp.
3-3). The Energy Regulation Board (2018, p. 44) expects supply and demand to have been
balanced in 2017. This means that by 2028 Zambia would require a further 1 113 MW of
generating capacity at 3.0% growth in electricity demand and 2 127 MW at the growth rate of
5.1% used in Figure 2. These updated growth paths for demand are shown in Figure 3.
Several new hydropower generation options are planned. There are three large hydroelectric
power plants. These are Kafue Gorge Lower with 750 MW installed capacity and currently
under construction; BGHES with 1 200 MW of installed capacity for Zambia; and Luapula River
Hydro with 1 200 MW of installed capacity (of which 600MW would be supplied to Zambia and
600MW exported to the Democratic Republic of the Congo). Three small hydropower plants
(maximum capacity of 88 MW and combined capacity of 118 MW) are in implementation
phase or under procurement (Energy Regulation Board, 2017: Energy Sector Report for 2016,
as cited in the ESIA (2019, pp. 3-9)).

Economic Cost Benefit Analysis of the Batoka Gorge Hydro-Electric Scheme FSL 757m 7
Figure 3: Zambia Installed Capacity and Demand – 2020 to 2040
Source: Consultant Own Calculations
The Kafue Gorge Lower and BGHES are in either feasibility or implementation phases. It is
reported in the media that a main contractor has been appointed for the build, operate and
transfer of the BGHES2 and that construction is nearing completion on the Kafue Gorge Lower
project3. The feasibility studies for the Luapula River scheme are about to be commissioned.
This would mean that the BGHES and Kafue Gorge Lower schemes would be implemented
and completed before Luapula. With a combined capacity of 1 950 MW, the BGHES and Kafue
Gorge Lower schemes would have enough capacity to meet demand in 2028 for a 3%
economic growth but not for 5.1%. At 3.0% the two schemes would have enough capacity to
meet demand until 2035 (assuming all existing plants operate at current capacity or are not
decommissioned). The Luapula River scheme would then be needed to begin operating by
2028 with a 5.1% growth.
The Final Options Assessment Report (Studio Pietrangeli, 2018, p. 130) indicates that BGHES
has the fourth lowest unit generation cost at 3.71US$c/kWh. This is only marginally more
expensive than the cheapest options. Ithezi tezhi, which has already been developed, is the
cheapest at 3.08c/kWh. The second and third cheapest options have estimated generation
costs of 3.58c/kWh and would each produce less than half the capacity of BGHES. The Kafue
2 www.businesslive.co.za/bd/world/africa/2019-06-21-ge-to-build-hydro-power-plant-between-zimbabwe-and-
zambia/,
www.moneyweb.co.za/news-fast-news/ge-powerchina-set-to-build-4bn-zambia-zimbabwe-hydropower-plant/ 3 constructionreviewonline.com/2019/01/us-2bn-kafue-gorge-lower-hydropower-station-nears-completion/
0
1 000
2 000
3 000
4 000
5 000
6 000
7 000
8 000
9 000
10 000
2020
2021
2022
2023
2024
2025
2026
2027
2028
2029
2030
2031
2032
2033
2034
2035
2036
2037
2038
2039
2040
Installed
Capacity (M
W)
2017 Capacity Small Scale Hydro Kafue GorgeBatoka Gorge Luapula Demand 3% GrowthDemand 5.1% Growth

Economic Cost Benefit Analysis of the Batoka Gorge Hydro-Electric Scheme FSL 757m 8
Gorge Lower scheme is estimated to produce electricity at 8.06c/kWh, more than double that
of BGHES.
The conclusion for Zambia is that there will be electricity shortages without the BGHES. Even
with the planned Kafue Gorge Lower scheme (which would produce electricity at more than
double the cost of the BGHES) and the Luapula River Hydro project the country still requires
the generation capacity of BGHES.
2.2.2 Zimbabwe
The expected electricity demand and surplus capacity for Zimbabwe is presented in Figure 4
(Studio Pietrangeli, 2018, p. 129). The 2017 installed capacity was 2 270 MW but available
capacity, because of aging power stations, was only 1 850 MW (ZPC cited in the ESIA
(Environmental Resources Management Southern Africa (Pty) Ltd, 2019, pp. 3-11)). In Figure
3 the 2017 installed capacity would be above and available capacity below the blue line.
Figure 4: Zimbabwe: Capacity and Demand – 2012 to 2030

Economic Cost Benefit Analysis of the Batoka Gorge Hydro-Electric Scheme FSL 757m 9
There is currently insufficient supply to meet demand in Zimbabwe. The Zimbabwe Electricity
Supply Authority (ZESA) reports severe rolling blackouts4. According to the ESIA, demand for
electricity in 2012 was 2 200 MW (2019, pp. 3-9), while available capacity was less than
1 850 MW.
The available capacity shown in Figure 4 is based on the planned BGHES commencing
operations in 2022. This planned opening is now delayed to 2028. The demand curves (yellow
and orange curves in the figure) are based on annual demand growth of approximately 5%.
The SAPP Generation forecast suggests a slightly lower 3.4% (Studio Pietrangeli, 2018, p.
120). The lower SAPP forecast of 3.4% will be adopted for this analysis, as advised by the
ZRA5.
Several power stations, a mixture of coal fired, hydroelectric and solar, are expected to be
commissioned between 2018 and 2022 (ZPC cited in the ESIA (pp. 3-13)).
Repowering of existing coal plants, the Kariba south extension and the Gwanda solar
PV project are expected to add 580MW by 2020.
The completion of an emergency generation plant to produce 120 MW by 2019. This
emergency plant and the projects listed above to be completed by 2020 are all required
to meet the demand for electricity by the country.
The Hwange coal generation plant expansion is expected to add 600 MW by 2021 and
small-scale solar PV and hydroelectric plants are expected to add a further 230 MW
by 2022.
This would bring the additional capacity by 2022 to 1 530MW. These new generation options,
as well as Batoka Gorge and the demand for electricity are shown in Figure 5. Many of these
options and particularly the coal fired plants are expected to generate electricity at three to
four times the price of the Batoka Gorge Hydroelectric Plant (Studio Pietrangeli, 2018, p. 133)
and are not yet committed.
4www.zesa.co.za, accessed on 22 July 2019 5 Pers. Comm, e-mail dated 10 September 2019

Economic Cost Benefit Analysis of the Batoka Gorge Hydro-Electric Scheme FSL 757m 10
Figure 5: Zimbabwe: Installed Capacity and Demand – 2020 to 2040
Source: Consultant Own Calculations
The following can be concluded from Figure 5:
Zimbabwe would have electricity shortages by 2028 with a 3% annual increase in
electricity demand. This is when the BGHES is expected to start.
All the electricity generated by BGHES would be absorbed by 2039 at a 3.0% annual
growth rate and by 2036 at 3.4%.
BGHES would obviate the need to run the expensive generators at Hwange Expansion
and the Emergency Power between 2028 and 2036/38.
The electricity generated by the more expensive plants could be sold as peak power
to the SAPP.
Demand for electricity could also be higher than estimated because of the extensive
rolling blackouts experienced by the country. Firms and households have adapted to
these blackouts and many have generators (refer to the discussion in section 3.2.2.1).
Firms and households may revert to using cheaper forms of energy once there is a
more reliable supply.
The conclusion for Zimbabwe is that the BGHES is needed to meet growing energy demands.
Even with the planned thermal and emergency electricity plants (which would produce
electricity at three to four times the cost of the BGHES) the country still requires the generation
capacity of BGHES in later years.
0
1 000
2 000
3 000
4 000
5 000
6 000
2020
2021
2022
2023
2024
2025
2026
2027
2028
2029
2030
2031
2032
2033
2034
2035
2036
2037
2038
2039
2040
Installed
Capacity (M
W)
2017 Capacity Projects by 2020 Emergency Power
Small Scale Hwange Expansion Batoka Gorge
Coal Bed Methane Demand 3.0% Growth Demand 3.4% Growth
Estimated Generation Start Date for Batoka
Gorge

Economic Cost Benefit Analysis of the Batoka Gorge Hydro-Electric Scheme FSL 757m 11
2.2.3 Southern African Power Pool
The Southern African Power Pool (SAPP) operates an electricity power pool in the Southern
African Development Community (SADC). The SAPP provides a forum for regional solutions
to electric energy problems (Southern African Power Pool, 2019, p. 3). In 2004 it started the
development of a competitive electricity market for the SADC region. In 2018 a total of
2 124 GWh of electrical energy was traded on the SAPP competitive market (2019, p. 6).
The electricity that is expected from BGHES needs to be put into the context of the total power
generation and demand of the two countries. This is done in order to show the size of the
BGHES in relation to the total electricity supply of the country. Table 1 below shows the
estimated demand and supply forecasts for Zambia, Zimbabwe and the Southern Africa Power
Pool (Studio Pietrangeli, 2018, pp. 119, 120). The peak demand forecast for 2020 is estimated
at 57.3 GW. The actual demand for 2018 was 57.7 GW (Southern African Power Pool, 2019,
pp. 6, 11), which at two years earlier already exceeds the forecast. The peak demand
forecasts shown in Table 1 relate to a growth in demand for electricity of 5.6% in Zambia and
3.4% for Zimbabwe.
Table 1: Peak Electricity Demand and Generation Forecast
Source: (Studio Pietrangeli, 2018, pp. 119, 120)
The generation capacity of BGHES needs to be seen in the context of the total power
generation and demand of the two countries. The:
Installed Power (MW) of BGHES would cover:
o 29% of the peak demand for Zambia in 2030.
o 32% of the total peak demand for Zimbabwe in 2030.
Generation in GWh would generate enough electricity to supply:
o 18% of the generation forecast in Zambia in 2030.
o 25% of the generation forecast of Zimbabwe in 2030.
2012 2013 2014 2015 2020 2025 2030 2035 2040 2045Peak Demand Forecast (MW)
Zambia 1 681 1 740 1 824 1 911 2 428 3 146 4 138 5 508 7 400 10 015Zimbabwe 2 029 2 425 2 471 2 534 2 865 3 255 3 738 4 340 5 101 6 071
SAPP Total 45 124 48 502 49 427 50 672 57 302 65 108 74 756 86 806 102 015 121 421
Generation Forecast (GWhr)Zambia 11 781 12 195 12 781 13 390 17 017 22 049 29 000 38 602 51 866 70 188
Zimbabwe 11 025 13 177 13 428 13 766 15 568 17 688 20 310 23 583 27 715 32 987SAPP Total 327 791 369 675 418 733 479 123 554 207 648 541 768 335

Economic Cost Benefit Analysis of the Batoka Gorge Hydro-Electric Scheme FSL 757m 12
2.2.4 Need for Batoka Gorge Hydro-Electric Scheme
The motivation for the BGHES is that it would provide electricity at a cost considerably lower
than most alternatives:
In Zambia, BGHES:
o is expected to generate the fourth cheapest electricity of the seventeen planned
power plants in Zambia (Studio Pietrangeli, 2018, p. 130);
o it is only slightly more expensive than the lower cost options;
o it is the largest planned power generation plant estimated to produce electricity
at less than half the price of electricity produced by Kafue Gorge Lower, the
other large planned power station.
In Zimbabwe:
o All the planned power stations are expected to generate electricity at a cost
higher than BGHES;
o The cost of electricity generation from large coal fired power stations (such as
the Hwange expansion) would be up to four times higher than BGHES.

Economic Cost Benefit Analysis of the Batoka Gorge Hydro-Electric Scheme FSL 757m 13
3 Approach and Methodology
The objective of this analysis was to assess the economic efficiency of the BGHES using
economic cost benefit analysis. The analysis takes its starting point from Section 2.2 which
demonstrated that both Zambia and Zimbabwe would have insufficient electricity generation
capacity within the near future.
Four sets of analyses were completed:
Base Case: an evaluation of BGHES within committed electricity generation options
and excluding emergency generators. This Base Case was extended to assess the
impact of a severe drought on the economic efficiency of BGHES.
Alternative 1: an evaluation of BGHES within committed and identified electricity
generation options. This alternative includes the operation of emergency generators.
Alternative 2: renewable and new coal generation options as substitutes for BGHES.
Sensitivity analyses on the key assumptions.
This section starts by introducing the concept of economic cost benefit analysis and how to
interpret the results. It continues by listing the relevant project costs and benefits. This is
followed by a description of how alternative forms of electricity generation were valued.
Finally, two limitations are listed.
3.1 Economic Cost Benefit Analysis
An economic cost benefit analysis (CBA) was used to assess the economic efficiency of the
BGHES. CBA treats the national economy, or in this case the two economies of Zambia and
Zimbabwe, as entities in and of themselves. It assumes, with some important caveats, that
what is demonstrably good for the two economies combined is a reasonable approximation of
what would be good for most of the people living and working in the countries.
When interventions like new electricity generation plants are contemplated, decision makers
need to know what impact the intervention would have on the economy as a whole and hence
how much benefit can be assumed to accrue.
The outcome of the analysis is the reporting of a net present value (NPV), a benefit cost ratio
(BCR) and an internal rate of return (IRR) for those cases where the project is compared to a
business as usual alternative. An NPV shows the total value of future costs and benefits
reduced to a present-day value. This is done by using a social discount rate of 10% as
specified by international best practice and as used in the options assessment report (Studio

Economic Cost Benefit Analysis of the Batoka Gorge Hydro-Electric Scheme FSL 757m 14
Pietrangeli, 2018, pp. 155, 176, 210 & 285). The BCR measures the changes in benefits and
costs that would result from an investment. BCRs are typically used when there are many
competing alternatives and projects need to be funded from a limited set of resources. Finally,
the IRR is the discount rate that returns an NPV of zero and shows the likely economic returns
to society of a project in relation to other investment opportunities.
If the evaluated benefits of a Project are indeed greater than the overall project costs, then the
BCR would be greater than one and the NPV positive. A BCR greater than one (or a positive
NPV) indicates that the completed project would constitute an economic asset; a BCR less
than one implies that the project would be an economic liability. The higher the BCR the less
risk there is that the proposed investment could turn out to be less than viable economically.
Low BCR’s, even if greater than one, provide a warning that a project could be risky and may
turn out to be an economic liability.
A high BCR is usually a good indicator that it would be possible to raise finance to implement
a project. In the case of a private sector investment the high BCR would be part of the business
case to funders. A high BCR should give confidence that it is worth funding the project directly
from its Treasury if it is a public infrastructure project. Alternatively, provision can be made
with suitable institutional arrangements for the involvement of the private sector in project
funding.
An economic analysis includes all costs to society. This is done by adjusting for shadow prices
and wages and removing the distortions caused by taxes and subsidies.
The cost benefit analysis focuses purely on direct costs and benefits and does not take any
indirect costs and benefits into account. Indirect costs and benefits would include those costs
and benefits obtained through multiplier effects. For example, the construction of a building
would have spin off effects for the construction industry and the building materials supply
industries. These, in turn, would have backward linkages with other commodity suppliers and
retail industries.
3.2 Establishing Costs and Benefits: BGHES
The process used to establish individual costs and benefits is described here.
3.2.1 Costs
There are four general categories of costs:

Economic Cost Benefit Analysis of the Batoka Gorge Hydro-Electric Scheme FSL 757m 15
Those that are the direct result of the building and running of the BGHES. These are
divided into construction (capital), running (operation and maintenance) and financing
costs. This also includes the opportunity cost of land.
Those for households which, faced with being able to use newly supplied electricity,
need to spend on both connection costs and electrical appliances in order to benefit
from electricity.
Firms which have connection costs.
Potential negative impacts on tourism in the area around the BGHES.
The analysis only included quantifiable costs. Some costs, such as the non-use value
described in the Economic Specialist Report (Anchor Environmental Consultants, 2019, p. 53)
or loss of habitat costs have not been included. These effects would need to be weighed by
decision makers when evaluating the merits of the BGHES.
3.2.1.1 Project Costs
3.2.1.1.1 Construction
Initial construction (capital) costs were provided by the design engineers. Table 2 lists the
capital costs (Studio Pietrangeli, 2019d, pp. 245, 247). It is understood that construction would
start in 2021 and last for seven years, with generation commencing in 2028. The largest
components are the construction costs of the dam itself ($644m) and the electro-mechanical
equipment ($329m and $265m).
Table 2: Capital Costs
Cost Item US$m Start EndRoads $42.6 0 36Camps and Facilities $91.0 0 36Stationary Plant $69.2 0 36River Diversion $182.0 22 84Dam $644.1 22 84Spillway $133.4 22 84Plunge Pool $17.0 22 84Power Waterways $194.7 24 66Power Houses $188.3 24 84Hydraulic Steel Structures $226.8 25 82Mechanical Turbines $329.3 25 84Electrical Supply $264.7 25 84Transmission Lines & Substations $265.1 6 54Environmental Monitoring $30.6 0 84Total Construction Cost $2 678.8
Month
Economic Cost Benefit Analysis of the Batoka Gorge Hydro-Electric Scheme FSL 757m 16
One of the important issues, from an economic perspective, is the proportion of imports to
total costs. No information was available. It was assumed that imports would make up:
75% of civil works;
90% of electrical and mechanical equipment;
75% of waterways and ancillary equipment;
90% of transmission lines;
Half of the environmental monitoring costs.
Professional fees are assumed to be 15% of construction and annual running costs.
3.2.1.1.2 Operations and Maintenance
There would be running (operating and maintenance) costs. There is no detailed estimate for
these costs. However, an overall operating cost of 0.50c/kWh was provided by the Project
engineers6. This would result in an annual running cost of $51.1m for electricity generation of
10 215 GWh.
3.2.1.1.3 Financing
The cost and source of financing is important because economic cost benefit analysis deals
differently with interest on domestic compared to international borrowing. Interest on a
domestic loan is a transfer payment within a country or region and excluded from the analysis.
Interest on an international loan is a cost to the country and included.
There are three potential financing options. These are from local capital markets in Zimbabwe
and Zambia; international capital markets; or concessional financing from the World Bank. A
report by the World Bank on investment options for the project states that 54% of the funding
would be concessional funding and lists the following terms for the various loans (World Bank,
2018, p. 23):
Concessional financing: 2.5% interest rate, 10 years’ grace and a 40-year repayment
period;
Market-based lending: 8% interest rate, 0 years’ grace and a 20-year repayment
period;
Domestic lending: 6% interest rate and a 10-year repayment period.
6 Pers. Comm. – email from Studio Pietrangeli, dated 8 July 2019

Economic Cost Benefit Analysis of the Batoka Gorge Hydro-Electric Scheme FSL 757m 17
It has been assumed that the balance of 46% is funded through international market-based
lending (8% interest and 20-year repayment period).
3.2.1.2 Firms
The costs to firms are the grid connection costs which are assumed to be $4 000 per
connection. This assumption is varied in a sensitivity analysis.
Payment for new electricity is a cost but has already been included in the cost of the Project.
It is not included here because it would be double counting.
3.2.1.3 Households
Households will have two costs - connection and appliance costs. Benefits from electricity
come from the use of appliances. An obvious example of this is electric lighting. Based on
discussion with industry experts in Namibia and Zimbabwe, it has been assumed that a new
connection cost would be $2 000. The lowest retail price has been used for appliance costs.
3.2.1.4 Tourism
There is the potential for negative impacts on tourism firms using the gorge. The specialist
report on the localised economic impact has estimated that there would be losses in tourism
revenue worth $6.86m because of the BGHES (Anchor Environmental Consultants, 2019, p.
52)7. The value of lost tourism revenue at the supply level of 757m is shown in Table 3.
Table 3: Local Tourism Impacts
It has been assumed that the impact on tourism would start during construction and the
tourism growth would be dependent on international economic growth rates. According to the
7 The 2015 Anchor Environmental Consultants report has the loss in tourism revenue slightly higher, at $7.94m.
The updated value of $6.86m provided in the 2019 report has been used in this analysis.
Description of Activity TotalAccommodation 1 407 805White water rafting 3 340 000Birding and hiking 82 279Angling 158 300Scenic Flights 1 350 000Canyoneering 16 000Park Fees 506 600Total Lost Business ($) 6 860 984Excludes non-use value

Economic Cost Benefit Analysis of the Batoka Gorge Hydro-Electric Scheme FSL 757m 18
World Bank Global Markets Outlook, global growth is set to gradually rise from 2.6% in 2019
to 2.8% in 20218. An annual long-term growth rate of 3.0% is assumed in the analysis.
3.2.1.5 Land Opportunity Cost
The land for the generation plant and associated facilities has alternative uses which means
that an economic analysis must include the opportunity cost.
The different land parcels are:
The lake reservoir has an expected surface area of 23 km². This is 2 300ha9. The
opportunity cost of the lake reservoir is included in the displaced tourism business
discussed in the preceding section. No further opportunity cost is considered for the
lake reservoir.
The townships would initially house the construction teams and then be converted into
accommodation for operating personnel. The areas required are 491ha in Zambia
(ERM, 2019a) and 706ha in Zimbabwe (ERM, 2019b). The total area is 1 197ha in a
rural setting. The opportunity cost of this land is that it could be used for farming
purposes.
New access roads to the site. Although the majority of the access roads would be
situated on existing roads, approximately 1.2km of new road of 10m width would be
built in Zambia (Studio Pietrangeli, 2019d, p. 45). A further 5m is allowed for the road
reserve on either side, bringing the area required for new roads to 2.4ha. The
opportunity cost of this land is that it could be used for farming purposes.
Corridors for transmission lines. According to the feasibility report on the transmission
system design, it is forbidden to live inside the corridor of the transmission line (Studio
Pietrangeli, 2019c, p. 25). This is to allow access for maintenance on the system. The
way leave width is given as 110m for two parallel 400 kV lines (68km long), 50m for
single 330 kV lines (10km and 152km lengths) and 85m for two parallel 330 kV lines
(22km length). The total area for the transmission corridor is 1 745ha, which would
predominantly be in rural land. Although living within the transmission corridors is
forbidden, farming activity would be allowed in both countries. It is assumed for the
purposes of this analysis that because farming activity is allowed there is no
opportunity cost for the transmission corridor land.
8 https://www.worldbank.org/en/publication/global-economic-prospects 9 Pers. Comm. – email from ERM Southern Africa, dated 2019 08 27

Economic Cost Benefit Analysis of the Batoka Gorge Hydro-Electric Scheme FSL 757m 19
Total land to be acquired for the Project, excluding the surface area of the reservoir in the
gorge and the transmission corridors, is 1 199.4ha. The opportunity cost of this land needs to
be calculated. The market value of productive rural land is used as an indicator of the
productive use of this land:
Sales of rural land in the affected areas of Zimbabwe and Zambia were investigated.
The average value of rural land in Zimbabwe10 is $35 500/ha, with a minimum value of
$480/ha and a maximum value of $83 000/ha. When outliers are removed the average
value of land increases to $58 000/ha.
The average value of land in Zambia is $47 000/ha, with a minimum value of $2 400/ha
and a maximum value of $274 000/ha.
The analysis uses $50 000/ha. The area of land required for the facilities (but excluding
the surface area of the reservoir) has an opportunity cost of $60.0m based on this rate.
This is approximately 2% of the initial capital costs of the Project.
3.2.2 Benefits
There are many benefits for households and firms from new electrical connections and/or
more reliable electricity generation. Any electricity exports are revenue to the country even
though they are initially paid to the electricity utility company. These are all societal benefits.
3.2.2.1 Firms
There are benefits to three types of firms. There are those firms that currently experience
power outages without backup generators; those that currently experience power outages with
backup generators; and those that would be established as a result of economic growth.
The following assumptions have been made to determine the number of firms:
Total unserved demand by 2028 in Zambia is estimated at 1 043 GWh and in
Zimbabwe at 435 GWh (refer to description in sections 2.2.1 and 2.2.2).
When BGHES becomes operational in 2028 there would be enough supply to meet
demand (5 108 GWh for each country) until 2036 for Zambia and 2038 for Zimbabwe.
Thereafter additional generation plants would be needed to meet growing demand.
10 www.property.co.zw/agricultural-land-farms-for-sale/matabeleland-north, www.pamgolding.co.za/property-
search/vacant-land-properties-for-sale-multiple-locations/dd191c78-4dfa-447c-8a2e-243402f12b47, ,
www.pamgolding.co.za/property-details/41-hectares-vacant-land-for-sale-glen-forest-zimbabwe/3zb1423045

Economic Cost Benefit Analysis of the Batoka Gorge Hydro-Electric Scheme FSL 757m 20
Half the demand for BGHES electricity in each country is due to firms and the other
half from households (this assumption is tested in a sensitivity analysis).
All the new demand by firms in 2028 would be from existing firms, whereas the annual
increase in demand thereafter would be from new firms. This assumption
distinguishes the GWh demand by existing and new firms.
In their article on in-house electricity generation in Africa, Steinbuks & Foster estimate
that 38.2% of firms have backup generators Zambia (2010, p. 512). A later survey
by the World Bank on in-house electricity generation put this percentage at 27.2% for
Zambia and at 64.1% for Zimbabwe. This distinguishes the GWh demand by existing
firms with and without generators. In section 3.2.2.1.1 and 3.2.2.1.2 the value of lost
production per kWh of unserved demand will be allocated to existing firms with and
without generators.
New firms would increase by 3.0% in both Zambia and Zimbabwe11. It has been
assumed that the proportion of firms with and without generators and associated
costs would be unchanged.
3.2.2.1.1 Standby Generator Use during Outages
Some firms have invested in standby generators. There are other, limited, backup options.
Typically, the cost of own generation is higher than the cost of grid electricity (Oseni & Pollitt,
2013, p. 24). In addition, there can be other costs like the diminished capacity to finance other
types of investments, equipment damage from electrical surges and wider societal costs like
the use of dirty fuel. These latter costs have been excluded from the analysis.
Two cost estimates have been made for Zambia:
Oseni & Pollitt (2013, p. 25) estimate the cost of own generation is $0.58/kWh
measured over an eight-hour outage. This is made up of a fixed cost of $0.18/kWh
and a variable cost of $0.40/kWh;
Steinbuks and Foster (2010, p 509) estimate the cost is $0.45/kWh. This is made up
of a fixed cost of also $0.18/kWh and a variable cost of $0.27/kWh.
11 The rate of annual increase in electricity demand is similar to the economic growth forecast for both countries by Trading
Economics (www.tradingeconomics.com). This rate is not varied with and without an increase in electricity generation.

Economic Cost Benefit Analysis of the Batoka Gorge Hydro-Electric Scheme FSL 757m 21
These costs have been used to estimate the 2019 generator costs from outages to firms in
Zimbabwe and Zambia:
The power outage costs for firms with standby generators is $0.58/kWh in generation
costs and $0.39/kWh in lost production;
The drop in the oil price between 2013 and 2019 price reduces the variable cost to
$0.24/kWh;
Adjusting for taxes and levies (as must be done in an economic cost benefit analysis)
reduces this cost to $0.16/kWh for Zambia and $0.15/kWh for Zimbabwe;
Fixed costs have been included in the analysis12.
3.2.2.1.2 Lost Production during Power Outages
It has been assumed that the lost production cost of power outages to firms without generators
is 1.5 times that of firms with generators13.
3.2.2.2 Households
Households would have two benefits from electrification:
Savings from other forms of fuel currently used for cooking, lighting and during
outages.
Income benefits as a result of time savings, increases in productivity and health
benefits. Health benefits are the result of less smoke inhalation, burns and fatalities
from fires and the use of refrigeration for food and medicines.
3.2.2.2.1 Savings on Alternative Fuels
Many households would spend time collecting and money buying alternative fuels. These fuels
include firewood (purchased or collected), candles, paraffin, LPG, etc.
The following assumptions were made:
Households spend $12 monthly on other types of fuel. This is based on a recent
survey of rural households in Zimbabwe14.
12 This is debatable because some commentators would argue that fixed costs are sunk costs and should be omitted. In this
case StratEcon is of the opinion that they need to be included because doing this takes account of any future generator
capacity that may be added. 13 The literature indicates far higher losses. Using a lower value makes the approach more conservative because the benefits
would be lower.
14 This is part of the Zimbabwe Rural Electrification Master Plan

Economic Cost Benefit Analysis of the Batoka Gorge Hydro-Electric Scheme FSL 757m 22
The number of affected households is calculated by dividing total household
unserved demand by a monthly amount of 100kWh. This is estimated based on the
income of low-income households.
3.2.2.2.2 Income Benefits
The positive impacts of reliable electricity on income are well documented. Table 4 gives the
results of three publications which estimated the impact of electricity and electrification on
household income. Electrification increased household income in:
Bangladesh by between 9% and 30%. (Khandker, Barnes, & Samad 2009).
India by between 16% and 46% (Khandker, Samad, Ali, & Barnes 2012).
Vietnam by between 25% and 36% (Khandker S. R., Barnes, Samad, & Huu Minh
2008).
Table 4: Electricity Contribution to Household Income
16% was used in the analysis and it has been assumed that this would take place over nine
years (Khandker, Barnes, & Samad, 2009). This percentage is applied to the Zambian and
Zimbabwean economic contexts.
3.2.2.3 Exports
It was assumed that any excess electricity that is not purchased in Zimbabwe or Zambia would
be exported to the SAPP at $0.05/kWh for base load (Energy Regulation Board, 2018, p. 52).
3.3 Establishing Costs and Benefits: Alternative Electricity Generation
It is appropriate to compare BGHES to other generation options, even though these are not in
the current planning mix. This inclusion makes the BGHES analysis more even-handed. The
included alternatives are coal, concentrated solar power (CSP), solar photovoltaic (solar PV)
and wind. The analysis relied on existing information to compare BGHES and these
alternatives. The workability of these options was not investigated, for example, whether there
are appropriate sites for wind farms.
CountryLower
Band
Mid
Band
Upper
BandSource
Bangladesh 9% 12% 30% (Khandker, Barnes, & Samad, 2009)
India 16% 39% 46% (Khandker, Samad, Ali, & Barnes, 2012)
Vietnam 25% 31% 36% (Khandker S. R., Barnes, Samad, & Huu Minh, 2008)

Economic Cost Benefit Analysis of the Batoka Gorge Hydro-Electric Scheme FSL 757m 23
The approach was to use a levelized cost of electricity (LCOE) which includes all important
costs for an identical electricity output. This calculation includes construction and operating
costs; construction duration; necessary land area; and external costs.
3.3.1 Construction and Operating Costs
It is necessary to compare plants with a similar output as BGHES when developing
comparable LCOEs. The LCOEs have therefore been used as a function of the annual BGHES
electricity production which gives the difference in capacity factor for each technology.
These costs are construction, operation, maintenance and fuel costs amortized over the plant
lifetime. South African LCOEs were used and the results presented in Table 5.
Table 5: South Africa Levelized Cost - Alternative Electricity Generation
Sources: Kusile (Meridian Economics, 2017), SA IPP Wind, CSP & PV (GreenCape, 2019)
Wind and solar PV are intermittent sources of electricity. They are low cost with the cost of
energy storage excluded. BGHES is a base load generator so a true comparison means that
energy storage costs must be included. This would increase the costs of these technologies
substantially. Accounting for storage requirements:
Renewable energy providing less than 20 to 30% of a country’s energy demand could
be accommodated in networks without the need for storage (Sharpley, 2015);
An equivalent solar or wind power plan would need to have storage to be comparable
to BGHES, which would be supplying in the region of 30% of the electricity in both
Zambia and Zimbabwe,
Storage equivalent to 75% of the daily generating capacity of solar PV would be
required to produce baseload power.
Calculating the storage requirements for wind is far more complex, because wind is
stochastic and the pattern varies from day to day (Rycroft, 2016). Consequently, it is
assumed that 100% storage requirement for daily wind power is required.
Plant $c/kWh O&M LCOE Capex LCOE Capex and O&M
LCOE(Excl Storage) Storage Cost
Capex and O&M LCOE
(Inc Storage) Batoka Gorge 3.69 3.69Kusile (units 5&6) 3.58 10.06 13.64 13.64SA IPP Wind 1.43 3.93 5.36 17.05 22.41SA IPP CSP 1.64 11.22 12.86 12.86SA IPP Solar PV 2.01 4.49 6.50 12.79 19.29

Economic Cost Benefit Analysis of the Batoka Gorge Hydro-Electric Scheme FSL 757m 24
Table 5 concludes that the BGHES produces the lowest cost electricity. Coal is 370% and
CSP 350% more expensive. Wind and Solar PV must be assessed with storage costs to make
them comparable to BGHES as a base load generator. This makes them six and five times
more expensive when assessed on construction and operating LCOEs.
3.3.2 Construction Period
Construction time determines how long it takes before electricity is generated. This influences
when the benefits start and, therefore, the BCR. BGHES construction is expected to be seven
years. Typical construction times for the other options are eight years for coal (Kusile Power
Station, 2019); two years for a wind plant of 140 MW (Stats and Facts SAWEA, 2018); two
and a half years for 100 MW CSP (Kathu Solar Park, 2019); and one and a half years for a 50
to 75 MW solar PV plant (Engineering News, 2013).
Wind, CSP and solar PV would consist of several plants to generate the same electricity as
BGHES. According to the South African Independent Power Producers, 1 362 MW of wind
plants and 838 MW of solar PV plants were rolled out in two years. It has been assumed that
numerous wind, solar PV and CSP plants could be rolled out at multiple locations around the
countries at the same time, so that wind and solar PV would commence generating full
electricity after two years and CSP after three years.
3.3.3 Land Area
Land is important because of its opportunity cost. The land cost is based on the following rates
per GWh:
0.92 for coal (US Department of Energy, 2019);
0.13 for wind (Denholm, Hand, Jackson, & Ong, 2009);
1.41 for CSP (Ong, Campbell, Denholm, Margolis, & Heath, 2013);
1.37 for solar PV (Ong, Campbell, Denholm, Margolis, & Heath, 2013).
The total opportunity cost of land is determined by multiplying the rates per GWh above with
the annual production of 10 215 GWh and the value of rural land at $50 000 per hectare, as
discussed in section 3.2.1.5.
3.3.4 External Costs
External costs are sourced from ExternE (Externalities of Energy. A Research Project of the
European Commission, 2006). These include human health – mortality and morbidity; building

Economic Cost Benefit Analysis of the Batoka Gorge Hydro-Electric Scheme FSL 757m 25
material degradation; crops; global warming; amenity loss; ecosystems; and land use
changes. External costs for electricity production using different technologies are shown in
Table 6.
Table 6: Electricity Generation - External Costs
A comparison of the ‘central’ values in the table shows that wind has the lowest external cost
(0.2c/kWh), followed by hydro (0.7c/kWh) and solar (0.8c/kWh). Coal has the highest external
costs at 11.3c/kWh, followed by oil and diesel (9.3c/kWh). Coal has external costs that are
sixteen time higher than hydro, while oil and diesel are thirteen times higher. Wind has
between a quarter and a third of the external costs of hydro.
3.3.5 Cost Summary
Table 7 summarises the final LCOE costs. It is found that BGHES generates the lowest cost
electricity. This is followed by CSP. The inclusion of storage costs needed for a base load
makes coal the third lowest cost. Wind and solar PV with storage costs are the most
expensive.
Table 7: Alternative Generation Options - Total LCOE
Generation Type Low Central High
Coal 0.027 0.113 0.199
Oil 0.040 0.093 0.146
Diesel 0.040 0.093 0.146
Gas 0.013 0.033 0.053
Hydro 0.001 0.007 0.013
Wind 0.001 0.002 0.003
Solar 0.008 0.008 0.008
Biomass 0.003 0.021 0.040
External Costs (US$ per kWh)
Plant $c/kWhCapex and O&M LCOE
(Excl Storage) Storage Cost
Capex and O&M LCOE
(Inc Storage) Land Cost External Cost Total LCOE
Batoka Gorge 3.69 3.69 0.06 0.0001 3.75Coal 13.64 13.64 0.46 0.0011 14.11Wind 5.36 17.05 22.41 0.07 0.0000 22.47CSP 12.86 12.86 0.71 0.0001 13.57Solar PV 6.50 12.79 19.29 0.69 0.0001 19.98

Economic Cost Benefit Analysis of the Batoka Gorge Hydro-Electric Scheme FSL 757m 26
3.4 Limitations and Critical Assumptions
This analysis faced the following limitations and made some critical assumptions:
The Project has been contextualised within the current and proposed electricity
generation mix. No precise information on electricity generation has been provided for
specific alternative power plants in the two countries. Generalised costs were based
on international sources.
It is not known how BGHES fits into sequencing of the planned generation options. It
has therefore been assumed that sequencing will be in line with the LCOE of the
various options.
It is expected that the BGHES will be operated in conjunction with the Kariba Complex.
The planning would ensure the absence of countervailing negative impacts. It is
expected that the filling of the Batoka Gorge reservoir would be done in such a manner
as not to impact on the operation of the Lake Kariba hydroelectric plant. It is also
expected that the water flow from the BGHES would be properly controlled to minimise
any downstream impacts on economic activities.

Economic Cost Benefit Analysis of the Batoka Gorge Hydro-Electric Scheme FSL 757m 27
4 Analytical Results
This section presents the results of the cost benefit analysis. Four sets of analyses were
completed:
Base Case: an evaluation of BGHES within committed electricity generation options
and excluding emergency generators. This Base Case was extended to assess the
impact of a severe drought on the economic efficiency of BGHES.
Alternative 1: an evaluation of BGHES within committed and identified electricity
generation options. This alternative includes the operation of emergency generators.
Alternative 2: renewable and new coal generation options as substitutes for BGHES.
Sensitivity analyses on the key assumptions.
4.1 Base Case
This base case is BGHES within committed electricity generation options and excluding
emergency generators. This analysis is extended to consider the impact of a severe drought
and possible climate change impacts.
4.1.1 Base Case without Water Shortages
The results of the Base Case without a water shortage are presented in Table 8.
It was found that the costs have a present value (PV) of $3 095m. The initial capital
costs contribute the most to the overall cost, with a PV of $1 749m. Financing costs
contribute $688m, followed by professional fees ($262m) and running costs ($247m).
A reduction in tourism income adds a further $94m to costs and land opportunity cost
$55m.

Economic Cost Benefit Analysis of the Batoka Gorge Hydro-Electric Scheme FSL 757m 28
Table 8: Results: Base Case without Water Shortages
Benefits in the base case have a PV of $13 738m; $6 656m to Zambia and $7 082m
to Zimbabwe.
For Zambia:
o Savings from reduced outages of $4 327m is the largest benefit. This is
$3 464m for firms without and $863m with generators.
o Savings on generators and alternative fuels are $771m for firms and $1 017m
for households.
o There are $91m grid connection costs for firms.
o Exports would be worth $558m.
CostsInitial Capital Cost 1 749Financing Costs of ICW 688Opportunity Cost of Land 55Operations & Maintenance 247Professional Fees 262Tourism Impacts 94Total Costs 3 095Benefits - ZambiaFirmsGenerator Savings 771Saving from Outages (with Generators) 863Saving from Outages (without Generators) 3 464Connection Costs -91Households with Existing ConnectionsAlternative Fuel Savings 1 017Households with New ConnectionsIncreased Income and Net Benefits 74Exports 558Total Benefits - Zambia 6 656Benefits - ZimbabweFirmsGenerator Savings 1 797Saving from Outages (with Generators) 2 025Saving from Outages (without Generators) 1 701Connection Costs -90Households with Existing ConnectionsAlternative Fuel Savings 1 012Households with New ConnectionsIncreased Income and Net Benefits 85Exports 551Total Benefits - Zimbabwe 7 082Total Benefits - Zambia & Zimbabwe 13 738NPV 10 643BCR 4.44IRR 28%
All Monetary Values in $ millions PV

Economic Cost Benefit Analysis of the Batoka Gorge Hydro-Electric Scheme FSL 757m 29
For Zimbabwe:
o Total savings from outages by firms of $3 726m is the largest benefit. This is
made up of $1 701m for firms without and $2 025m for firms with generators.
o Savings from expenditure on generators and alternative fuels are $1 797m for
firms and $1 012m for households.
o There are $90m grid connection costs for firms.
o Exports would be worth $551m.
The Project NPV is $10 643m. This is positive. The base case would be economically
efficient and benefits both Zambia and Zimbabwe.
The BCR is 4.44. This means that for every $1.00 spent on the Project there are
benefits of $4.44. This is a robust result.
The IRR is 28%.
4.1.2 Base Case with Drought and Climate Change
This section assesses the impact of droughts and climate change on the economic efficiency
of the Project. The worst drought since 1978 occurred in 1996 and lasted nearly five years
(Studio Pietrangeli, 2019a, p. 69). The relevance of climate change, in this instance, would
mean a lower water flow. This means that the effects of climate change and a drought can be
investigated simultaneously.
The effect of a drought was assessed in two ways. These are by having no flow or a reduced
flow.
4.1.2.1 Drought – No Flow
This approach assessed the time needed for a drought with no water flow to make the Project
inefficient. It was modelled with the drought starting immediately after construction and
preventing any electricity generation. It was done by determining the time needed to make
the PVs of benefits and costs equal.
It was found that it would need a drought of seventeen years to make the Project economically
inefficient. There has been no drought of this length in living memory.
4.1.2.2 Drought – Reduced Flow
This approach assessed how much lower the water flow would need to be, over the entire
Project life, to make the Project economically inefficient. It was modelled by assessing the
reduction in electricity generated, as a result of reduced flows, to make the PVs of benefits

Economic Cost Benefit Analysis of the Batoka Gorge Hydro-Electric Scheme FSL 757m 30
and costs equal. These reduced flows were then compared to the dry year modelled by the
project engineers.
The Project engineers modelled a dry year with a generation capacity between approximately
80 MW and 600 MW for each country (Studio Pietrangeli, 2019a, pp. 71, 82). This would give
an average energy generation of 500MW for both countries, which is approximately 21% of
the design capacity. This in turn is a 79% output reduction. It was found that generation
capacity would need to reduce by 84% (to 400 MW) for the Project to become economically
inefficient. The project would therefore remain economically efficient, although marginally so,
at the reduced flow rate.
There is no record of any prolonged period of reduced flow. An analysis of monthly inflow rates
into Lake Kariba shows that there were only two periods of low flows over consecutive years
between 1962 and 2014 (Studio Pietrangeli, 2019b, p. Annex C) (Studio Pietrangeli, 2019d,
p. 13). The first was between 1982 and 1984 when three years of very low flows were
recorded. The second was between 1992 and 1996 when four out of five years recorded very
low flows.
4.1.2.3 Climate Change
This approach assessed the possible reduction in electricity generation as a result of climate
change on the Project efficiency.
The effect of climate change on energy production of the Project was investigated by the
Project engineers (Studio Pietrangeli, 2019d, pp. 18, 19). Several different situations relating
to different types of global emissions were modelled, using a Global Circulation Model. The
results showed that the most extreme global emissions could reduce energy production at
BGHES by 25% but that under the likely path of global emissions, energy production would
reduce by between 1% and 20%.
At a 20% reduction in output the BCR would reduce to 3.79 and at a 25% reduction to 3.63.
The Project therefore remains economically efficient under either climate change reduction
amount.

Economic Cost Benefit Analysis of the Batoka Gorge Hydro-Electric Scheme FSL 757m 31
4.1.2.4 Conclusion to Droughts and Climate Change
The conclusion to the investigation into droughts and climate change shows that they are
unlikely to render the Project economically inefficient.
A complete drought of seventeen years with no flow through the gorge would need to
occur from the day of first operations.
Alternatively, all future years would need to be as bad as the worst inflows in the gorge
in recorded history. Records show that this is unlikely to happen.
As another alternative, energy production would need to reduce by about 84% from
the first day of operations to render the Project inefficient, when studies have shown
that climate change would reduce production by at most 25% by 2044 (sixteen years
after production starts).
The efficiency of the BGHES remains positive even with conservative estimates of drought
and climate change.
4.2 Alternatives
As stated above two alternatives to the base case were analysed. Alternative 1 is BGHES
within committed and identified options. Emergency generation is in operation in this
alternative. Alternative 2 considers renewable energy and new coal as BGHES substitutes.
4.2.1 Alternative 1: BGHES within Committed and Identified Options
This alternative considers the case where BGHES is built and run within committed and
identified options. The difference to the base case is that all future identified options and, most
importantly, emergency generators are operated even though the latter are more expensive
to run than BGHES. The consequence is that there would be a period where some of the
electricity from BGHES would be surplus to national requirements and would be sold into the
Southern African Power Pool.
The results are shown in Table 9 and compared to the Base Case.

Economic Cost Benefit Analysis of the Batoka Gorge Hydro-Electric Scheme FSL 757m 32
Table 9: Cost Benefit Results – Alternative 1 Relative to Base Case
BGHES costs remain the same, with a PV of $3 095m.
The total benefits reduce from $13 738m to $11 621m because the exported excess
electricity has a lower benefit.
The Project NPV reduces from $10 643m to $8 526m, which is positive, and the Project
remains economically efficient.
The BCR reduces from 4.44 to 3.75. This means that for every $1.00 cost of the
Project, both countries benefit by $3.75.
The IRR reduces from 28% to 24%.
CostsTotal Costs 3 095 3 095Benefits - ZambiaFirmsGenerator Savings 771 506Saving from Outages (with Generators) 863 558Saving from Outages (without Generators) 3 464 2 241Connection Costs -91 -82Households with Existing ConnectionsAlternative Fuel Savings 1 017 658Households with New ConnectionsIncreased Income and Net Benefits 74 101Exports 558 1 114Total Benefits - Zambia 6 656 5 096Benefits - ZimbabweFirmsGenerator Savings 1 797 1 598Saving from Outages (with Generators) 2 025 1 791Saving from Outages (without Generators) 1 701 1 505Connection Costs -90 -93Households with Existing ConnectionsAlternative Fuel Savings 1 012 895Households with New ConnectionsIncreased Income and Net Benefits 85 109Exports 551 720Total Benefits - Zimbabwe 7 082 6 526Total Benefits - Zambia & Zimbabwe 13 738 11 621NPV 10 643 8 526BCR 4.44 3.75IRR 28% 24%
All Monetary Values in $ millions Base Case Alternative 1

Economic Cost Benefit Analysis of the Batoka Gorge Hydro-Electric Scheme FSL 757m 33
4.2.2 Alternative 2: Renewable and New Coal as BGHES substitutes
A comparison was done between the electricity generated by the BGHES and the equivalent
alternative renewable energy technologies of wind, CSP and solar PV and the option of new
coal.
In the interest of a balanced analysis the construction of BGHES and these alternatives was
started at the same time. Most of the alternatives would be completed before the BGHES and
therefore start producing electricity earlier. BGHES would start producing eight years after the
start of construction. It was assumed that this would be two years for wind with storage; three
years for CSP, two years for solar PV with storage and nine years for coal.
Table 10: Cost Benefit Results - Alternative 2: Renewables and New Coal
The results are shown in Table 10 with wind and solar PV with and without storage costs.
BGHES has the lowest costs. Wind and solar PV, including storage, are the most
expensive options. CSP and coal have lower costs than wind and solar PV with
storage.
Wind and solar PV have the highest benefits because of their modular approach and
shorter lead time.
Coal has lower benefits than BGHES for three reasons. First, coal has a longer lead
time than BGHES. Second, coal needs more land (1.1ha compared to 0.25ha per
GWh) with higher opportunity costs. Third, coal power externality costs are
substantially higher than hydropower.
The economic efficiency and ranking where wind and solar PV are analysed with storage
costs:
BGHES has the highest BCR and NPV.
Wind with storage is economically inefficient with a BCR of 0.99. It has the second
lowest BCR and NPV of all options.
Solar PV with storage costs is marginally efficient with a BCR of 1.11.
BGHES Coal CSPWind
Without Storage
Solar PV Without Storage
Wind With Storage
Solar PV With
StorageCosts PV ($m) 3 095 14 044 13 507 5 398 7 158 22 370 19 888
Benefits PV ($m) 13 738 12 489 20 114 22 125 22 125 22 125 22 125NPV ($m) 10 643 -1 555 6 607 16 727 14 967 -245 2 238
BCR 4.44 0.89 1.49 4.10 3.09 0.99 1.11

Economic Cost Benefit Analysis of the Batoka Gorge Hydro-Electric Scheme FSL 757m 34
Coal and CSP have lower BCRs and NPVs than BGHES. Coal is inefficient with a BCR
of less than one and a negative NPV and is the most inefficient of all alternatives. CSP
is economically efficient, with a BCR of more than one and a positive NPV.
The conclusion is that BGHES as baseload hydro power is the most efficient option. The only
other viable baseload option within the current context is CSP.
4.3 Sensitivity Analyses
Two categories of sensitivity tests were run. First were single tests on the main assumptions.
Second were simultaneous tests on several assumptions.
4.3.1 Single Sensitivities
Sensitivity tests were run individually on seven of the main assumptions. These were for:
Electricity demand growth in both countries;
The distribution of unserved demand between households and firms;
The cost of lost production to firms without generators;
Variations in the initial construction costs;
Average monthly electricity usage of new firms;
Firm connection costs;
Exports of base load.
Only the first four of these tests had any major effects on the results and these are reported
below.
4.3.1.1 Electricity Demand Growth - Zambia and Zimbabwe
The base case estimates that annual electricity demand is expected to increase by 3.0% in
both countries. This sensitivity analysis varies unserved demand. The results are reported in
Table 11 for Zambia and Table 12 for Zimbabwe.
Table 11: Sensitivity: Zambia - Electricity Demand Growth
1.0% 3.123.0% 4.445.6% 5.00
Annual Growth in Demand - Zambia
BCR

Economic Cost Benefit Analysis of the Batoka Gorge Hydro-Electric Scheme FSL 757m 35
In the sensitivity analysis the assumed annual growth rate in Zambia is varied between a low
of 1.0% and a high of 5.6%. The high value of 5.6% is the increase in demand presented in
the Options Assessment Report (Studio Pietrangeli, 2018, pp. 120, 126). The results are
sensitive to varying the growth in demand for electricity in Zambia. The BCR reduces to 3.12
if demand were to only increase by 1% a year, whereas it would increase to 5.00 if demand
were to increase by 5.6%. The results are more sensitive to a reduction in demand than an
increase. This is due to the capacity of the scheme being exceeded earlier with the higher
demand and no further benefit that can be generated.
Table 12: Sensitivity: Zimbabwe - Electricity Demand Growth
In the sensitivity analysis for Zimbabwe the annual growth rate is varied between a low of 1.0%
and a high of 5.0%. The high value of 5.0% is the increase in demand presented in the Options
Assessment Report (Studio Pietrangeli, 2018, pp. 120, 129). The results are sensitive to
varying the growth in demand for electricity in Zimbabwe, but the project remains economically
efficient for the full range tested.
The above sensitivities are done individually for each country because of the characteristics
of supply and demand in each one. When they are combined and no growth in demand for
electricity in both countries is assumed then the BCR reduces to 1.41. This is still an
economically efficient result and indicates that the Project is economically desirable based on
current demand and with most future planned generation plants still being implemented.
The conclusion to this sensitivity analysis is that the results are sensitive to changes in the
growth of demand for electricity. The Project, however, remains economically efficient even
for low increases in demand.
4.3.1.2 Distribution of Unserved Demand
Unserved demand is distributed equally between households and firms in the base case. The
results of variations are shown in Table 13.
1.0% 2.933.4% 4.445.0% 4.96
Annual Growth in Demand - Zimbabwe
BCR

Economic Cost Benefit Analysis of the Batoka Gorge Hydro-Electric Scheme FSL 757m 36
Table 13: Sensitivity - Unserved Demand Distribution
It was found that the higher the proportionate share of unserved energy for firms the greater
the economic efficiency. For example, with firms having 75% of unserved energy demands
the BCR increases to almost 6. Conversely, the BCR would be 3.08 with a 25% share.
The results are sensitive to changes in the distribution of unserved demand, but the Project
remains economically efficient for the range tested.
4.3.1.3 Cost of Lost Production for Firms without Standby Generators
It was assumed in section 3.2.2.1.2 that firms without standby generators would have losses
1.5 times greater than firms with generators. Variations in this assumption show that:
The BCR would:
Reduce to 3.88 with losses equal to those of firms with standby generators;
Reduce to 3.33 with losses equal to half those of firms with standby generators;
Increase to over 10 for losses equal to 7.3 times15 those of firms with standby
generators.
Table 14: Sensitivity: Lost Production Cost
The results are very sensitive to relative changes in the losses of firms without generators, but
the Project remains economically efficient for the full range tested.
15 This is the value in the findings of (Steinbuks & Foster, 2010, p. 509).
25% Households & 75% Businesses 5.8050% Households & 50% Businesses 4.4475% Households & 25% Businesses 3.08
Households : Firms Unserved Demand Split
BCR
0.5 x businesses with generators 3.331.0 x businesses with generators 3.881.5 x businesses with generators 4.442.0 x businesses with generators 4.995.0 x businesses with generators 8.337.3 x businesses with generators 10.89
Cost of Lost Production for Firms without Generators
BCR

Economic Cost Benefit Analysis of the Batoka Gorge Hydro-Electric Scheme FSL 757m 37
4.3.1.4 Initial Construction Costs
The largest cost of the Project is the initial construction cost. This sensitivity analysis
investigates variation in these costs and presents the results in Table 15.
Table 15: Sensitivity – Variation in Initial Construction Costs
The Project becomes less efficient with an increase in the initial construction costs and more
efficient with a decrease, as would be expected. The Project, however, remains economically
efficient for the full range tested. The initial capital costs would need to increase to five times
their value for the Project to no longer be efficient.
4.3.2 Simultaneous Sensitivities
The results of the previous analysis were combined to assess the consequence of changes in
multiple assumptions. These combinations and results are shown in Table 16.
Table 16: Assessing Combined Assumptions
The Project remains economically efficient under the least favourable combination of
assumptions, although only marginally so. This combination represents very little
increase in demand for electricity in both countries, very little uptake by firms (most of
the new demand would therefore be from households, which do not generate as much
economic value), a 20% increase in the initial construction costs and prices of exports
to the SAPP are lower than historically.
The efficiency of the Project increases substantially with a combination of favourable
assumptions. This combination is more representative of an increase in demand for
20% Less ($2 143m) 5.36As Provided ($2 679m) 4.4420% More ($3 215m) 3.79
Initial Construction Costs BCR
Annual Growth in Demand: Zambia 1.0% 3.0% 5.6%Annual Growth in Demand: Zimbabwe 1.0% 3.4% 5.0%Households : Firms Split 75% 50% 25%Lost Production without Generators 1.0 times 1.5 times 5.0 timesConstruction Costs 20% Higher As Provided 20% LowerSAPP Base Load Exports ($c/kWh) 4.0 c/kWh 5.0 c/kWh 6.0 c/kWhBenefit Cost Ratio (BCR) 1.06 4.44 18.52
VariableLeast
FavourablePrimary
AssumptionsMost
Favourable

Economic Cost Benefit Analysis of the Batoka Gorge Hydro-Electric Scheme FSL 757m 38
electricity as shown in the Options Assessment Report (Studio Pietrangeli, 2018, pp.
119, 126, 129), has a bigger uptake by firms rather than households, a value of lost
production by firms closer to that indicated in the literature (Steinbuks & Foster, 2010,
p. 509), a 20% reduction in the estimated construction costs and a slight premium on
exports to the SAPP.
Although the Project is just above breakeven for the least favourable combination of
assumptions, it is still efficient. The efficiency improves substantially when looking at the most
favourable combination and on the balance of probability this project would generate
substantial benefits for both countries.

Economic Cost Benefit Analysis of the Batoka Gorge Hydro-Electric Scheme FSL 757m 39
5 Assessment and Significance Rating
This section assesses the economic efficiency of the Project.
5.1 Description of Effect
Determine whether the construction and operation of the BGHES, operating at an FSL of
757m, is economically efficient.
5.2 Assessment
The overall conclusion from the cost benefit analysis is that the base case is economically
efficient. Realistic assumption changes did not result in economic inefficiency.
Table 17: Significance Rating of the Proposed BGHES
Criteria Rating
Extent Regional and International
Duration Permanent
Scale Large (National and International)
Frequency Constant
Likelihood Likely
Magnitude Positive
Sensitivity / Vulnerability / Importance of Resource / Receptor High
Impact Significance Major
The Project has a major positive impact significance, as shown in Table 17. Although the
Project overall is beneficial from the national perspective of the two countries there is a
localised negative economic impact on the tourism facilities affected by the scheme (Anchor
Environmental Consultants, 2019).
Mitigation measures could include financial payments from the ZRA to the tourist companies
affected by the scheme. This transfer would not affect the economic efficiency of the Project
if the transfers are not remitted abroad.

Economic Cost Benefit Analysis of the Batoka Gorge Hydro-Electric Scheme FSL 757m 40
6 Conclusion
This report set out to determine the economic efficiency of the BGHES using an economic
cost benefit analysis.
The conclusion is that the Project is robust from an economic efficiency point of view. The
Project would remain efficient even with a prolonged drought or reduced flow because of
climate change. The Project remains efficient even if surplus energy, because of planned
alternative generators or demand variations, is exported. BGHES is a more efficient baseload
option than coal, CSP, wind and solar PV.
Sensitivity analyses found the results most sensitive to changes in the growth in demand for
electricity in both countries, the distribution of unserved demand (between households and
firms), the cost of lost production for firms without generators and the initial construction costs.
The results remained economically efficient for the entire range tested. A combination of
assumptions found that the Project remains economically efficient with the least favourable
combination.
The overall conclusion from the cost benefit analysis is that the base case is economically
efficient. Realistic assumption changes did not result in economic inefficiency. The Project is
assessed to have a major positive significance rating considering that its extent is regional
and international, it is permanent, of large scale, constant frequency and likely to be
implemented. There would be negative impacts on local firms that supply tourism services in
the gorge. This may warrant mitigation of direct financial compensation to affected firms.

Economic Cost Benefit Analysis of the Batoka Gorge Hydro-Electric Scheme FSL 757m 41
7 Bibliography
(2017, 11 15). Retrieved from Meridian Economics: http://meridianeconomics.co.za/wp-
content/uploads/2017/11/CoalGen-Report_FinalDoc_ForUpload-1.pdf
(2019). Retrieved from GreenCape: https://www.green-
cape.co.za/assets/Uploads/RENEWABLE-ENERGY-MARKET-INTELLIGENCE-
REPORT-FINAL-WEB.pdf
Anchor Environmental Consultants. (2015). Batoka Gorge Hydro-Electric Scheme
Environmental and Social Impact Assessment: Economic Assessment.
Anchor Environmental Consultants. (2019). Batoka Gorge Hydro-Electric Scheme
Environmental and Social Impact Assessment: Economic Assessment (Amended).
Cape Town.
Central Statistics Office. (2018). 2017 Labour Force Survey Report. Lusaka: Ministry of Labour
and Social Security.
Denholm, P., Hand, M., Jackson, M., & Ong, S. (2009). Land-Use Requirements of Modern
Wind Power Plants in the United States. National Renewable Energy Laboratory.
Retrieved from https://www.nrel.gov/docs/fy09osti/45834.pdf
Energy Regulation Board. (2018). Energy Sector Report 2017.
Engineering News. (2013, 06 04). Retrieved from
https://www.engineeringnews.co.za/article/50-mw-de-aar-solar-project-at-peak-
construction-stage-2013-06-04
Environmental Resources Management Southern Africa (Pty) Ltd. (2019). Proposed Batoka
Gorge Hydro-Electric Scheme (Zambia and Zimbabwe) on the Zambezi River:
Environmental and Social Impact Assessment (ESIA) for the Project Area of
Inundation, Staff Villages and Quarries (V3.0).
ERM. (2019a). Resettlement Policy Framework (RPF) – Zambia: Proposed Batoka Gorge
Hydro-Electric Scheme (Zambia and Zimbabwe) on the Zambezi River.
ERM. (2019b). Resettlement Policy Framework (RPF) – Zimbabwe: Proposed Batoka Gorge
Hydro-Electric Scheme (Zambia and Zimbabwe) on the Zambezi River.

Economic Cost Benefit Analysis of the Batoka Gorge Hydro-Electric Scheme FSL 757m 42
ExternE. (2006). Externalities of Energy. A Research Project of the European Commission.
Retrieved from ExternE: http://www.externe.info/externe_2006/
Kathu Solar Park. (2019, 07 16). Retrieved from Kathu Solar Park:
https://www.kathusolarpark.co.za/
Khandker, S. R., Barnes, D. F., & Samad, H. A. (2009). Welfare Impacts of Rural
Electrification: A Case Study from Bangladesh. World Bank.
Kusile Power Station. (2019, 07 16). Retrieved from Wikipedia:
https://en.wikipedia.org/wiki/Kusile_Power_Station
Ong, S., Campbell, C., Denholm, P., Margolis, R., & Heath, G. (2013). Land-Use
Requirements for Solar Power Plants in the United States. National Renewable Energy
Laboratory. Retrieved from https://www.nrel.gov/docs/fy13osti/56290.pdf
Oseni, M. O., & Pollitt, M. G. (2013). The Economic Costs of Unsupplied Electricity: Evidence
from Backup Generatoin among African Firms. University of Cambridge: Energy Policy
Research Group.
Rycroft, M. (2016, 04 25). Energy storage and baseload generation. Retrieved from
eePublishers: https://www.ee.co.za/article/energy-storage-baseload-generation.html
Sharpley, N. (2015, 10 23). Unlocking the potential of wind power with energy storage.
Retrieved from Windpower Engineering and Development:
https://www.windpowerengineering.com/design/unlocking-potential-wind-power-
energy-storage/
Southern African Power Pool. (2019). Annual Report.
Stats and Facts SAWEA. (2018, 11 13). Retrieved from The South African Wind Energy
Association: https://sawea.org.za/stats-and-facts-sawea-2/
Steinbuks, J., & Foster, V. (2010). When do firms generate? Evidence on in-house electricity
supply in Africa. Energy Economics, 505-514.
Studio Pietrangeli. (2018). Batoka Gorge Hydo-Electric Scheme Phase II Layout, Option
Assessment Report.

Economic Cost Benefit Analysis of the Batoka Gorge Hydro-Electric Scheme FSL 757m 43
Studio Pietrangeli. (2019a). Batoka Gorge Hydro-Electric Scheme Phase III - Feasibility, Vol.
10 - 375 Gen R SP 001 - Reservoir Operation and Energy Production Studies. Rome:
Zambezi River Authority.
Studio Pietrangeli. (2019b). Batoka Gorge Hydro-Electric Scheme Phase III - Feasibility, Vol.
10 - Reservoir Operatoin and Energy Production Report, Annexes. Rome: Zambezi
River Authority.
Studio Pietrangeli. (2019c). Batoka Gorge Hydro-Electric Scheme, Phase III - Feasbility
Design, Transmission System Design Vol. XII. Rome: Zambezi River Authority.
Studio Pietrangeli. (2019d). Batoka Gorge Hydro-Electric Scheme, Phase III - Feasibility, Vol.1
- Main Report - Draft. Zambezi River Authority.
UNESCO. (2016, January 29). Mosi-oa-Tunya / Victoria Falls. Retrieved from UNESCO World
Heritage List: http://whc.unesco.org/en/list/509
US Department of Energy. (2019, 07 16). Retrieved from
https://www.energy.gov/eere/geothermal/geothermal-power-plants-minimizing-land-
use-and-impact
World Bank. (2018). Batoka Gorge Hydroelectric Scheme: A Macroeconomic Assessment of
Public Investment Options (MAPIO). Washington: World Bank.
Zimbabwe National Statistics Agency. (2019). Quarterly Digest of Statistics Fourth Quarter
2018. Harare: ZimStat.

Economic Cost Benefit Analysis of the Batoka Gorge Hydro-Electric Scheme FSL 757m 44
Appendix: Macroeconomic Analysis
This appendix describes the results of a macroeconomic analysis. It is included in the
appendix because it was not part of the terms of reference. This section commences with a
description of the methodological approach before presenting the results.
Macroeconomic Analysis Methodology
While a cost benefit analysis considers first order costs and benefits a macroeconomic
analysis considers second order benefits as well.
The size of a national or regional economy is measured in terms of the total of all economic
activities taking place within the area concerned, both in the public and private sectors. For
countries like Zambia and Zimbabwe this includes measures of informal sector activity. The
name given to the measure of the size of the economy is Gross Domestic Product (GDP). The
unit of measurement is the US dollar. Zimbabwean income is reported in US dollars. Zambian
outputs are also reported in US dollars for comparative purposes.
Underlying the measurement of GDP is the understanding that all economic activity is
dependent on the physical and institutional support systems that enable an economy to
operate effectively. These include the various levels of governmental structure, the legal
system, and the administrative, financial and educational infrastructure in the country. In terms
of physical infrastructure, all economic activity depends on water supply, telecommunication,
and transport infrastructure. The economy could not operate without all these systems being
in place.
While there are many different types of macroeconomic effects, the two most important are
contribution to gross domestic product (GDP) and creation of jobs. The importance of job
creation is obvious. Increases in GDP are synonymous with increases in peoples’ economic
standards of living. Increased GDP – i.e. increased production – is experienced in the form of
more jobs, higher wages and reduced economic hardship. It is clearly an important measure.
The effects of any infrastructure project on the size of the GDP arise as a result of the myriad
ways in which firms, public service providers and ordinary people find their normal daily
activities affected, hopefully for the better, by the changes brought about by the new project.
The actual task of calculating the macroeconomic impact of the BGHES demands a detailed
and multifaceted approach not least because of the so-called multiplier effects. It is well
recognised that the simple act of spending – constructing a dam, for example - leads to other

Economic Cost Benefit Analysis of the Batoka Gorge Hydro-Electric Scheme FSL 757m 45
economic effects. Demand for locally produced steel and cement can lead to increased
production in those industries. Increased demand for steel and cement, in turn, leads to
increased demand for mining output which uses wood, water, electricity and so on. These are
the so-called multiplier effects. While this process unfolds, each industry employs people and
pays wages. Employees, in turn, spend their wages and cause further multiplier effects
through the economy. Measuring this is further complicated by the fact that different industries
demand different types of skills. This leads to different wage structures across the various
industries. People earning different wages have different spending patterns. Thus, the change
in overall spending patterns is dependent on which industries are affected.
Five steps were required to measure the overall macroeconomic contribution of the proposed
project:
First, to identify appropriate expense items for each category of costs.
Second, to determine the relative proportions of local profit, labour, plant and material
for each expense item. Imports are excluded from the macroeconomic analysis.
Third, to assign each item of material and plant to the appropriate SAM economic
sector code.
Fourth, the potential negative impact on tourism, which would reduce the
macroeconomic benefits.
Finally, all the items in the SAM coded list of costs for each country are brought
together. The total multiplier effect is calculated as the aggregate product SAM coded
spending on plant and material, as well as SAM coded spending by workers multiplied
through the national multipliers.
In any macroeconomic assessment, there is a need to report the potential contribution to
direct, indirect and induced jobs. The difference between the different job types is as follows:
Direct jobs are created on site with the construction of the hydroelectric scheme as
well as with the on-going operations once completed.
Indirect jobs are created in the supply chain. They occur because of the backward and
forward linkages of firms within the economy. If, for example, a construction company
procures specialist materials for the dam then the indirect jobs would be those based
at the specialist product factory.
Induced jobs are those jobs that arise because of the expenditure of salaries and
wages by direct and indirect employees. For example, the retail industry would benefit
from induced jobs when construction workers spend their salaries.

Economic Cost Benefit Analysis of the Batoka Gorge Hydro-Electric Scheme FSL 757m 46
Direct jobs are calculated as follows:
The increased expenditure due to the various components of the project (such as the
construction of the BGHES and its operation) needs to be determined. These costs
are provided as inputs into the economic analysis by the technical experts.
Each activity needs to be aligned with the sectors in the Social Accounting Matrices
(SAMs) for Zambia and Zimbabwe. A SAM is a mathematical representation of the
economies of each country. It is a matrix that indicates the revenue and expenditure
of each of the economic sectors. The proportion of turnover of each sector that is spent
directly on salaries and wages is provided by the SAM. This proportion varies for
different economic sectors. Therefore, if the total change in turnover, or demand, of a
sector is known then the value of salaries and wages can be calculated. For example,
if it is estimated that $1m is spent on building the dam wall and the proportion of
salaries and wages for the construction industry is 30% then the $1m dam wall
expenditure would have increased salaries and wages in construction by $300 000.
Once again, this example is only true for the locally constructed portion and excludes
imports.
Direct jobs are calculated by dividing the increase in salaries and wages calculated
above by the average monthly earnings (converted to annual earnings) for the
appropriate sector. For Zimbabwe the average earnings are sourced from the June
2018 Quarterly Digest of Statistics (Zimbabwe National Statistics Agency, 2019) and
for Zambia from the 2017 Labour Force Survey (Central Statistics Office, 2018).
Where actual information on direct employment is known, these numbers are used
rather than the calculation described above. To illustrate, the ESIA Report estimates
2 000 people involved in the construction in the first two years of the Project, increasing
to 8 000 for the remaining five (Environmental Resources Management Southern
Africa (Pty) Ltd, 2019). This number is split equally between both countries and
reported, rather than that calculated as described above.
The results are reported separately for the two countries.
Results of Macroeconomic Analysis
The macroeconomic contribution of the Project is reported annually between 2021 and 2030
and in 5-year increments until 2040. The only variable that changes after 2040 is lost tourism
revenue.
The reported macroeconomic indicators are the contribution to Gross Domestic Product and
direct and indirect jobs in Zambia and Zimbabwe. These are disaggregated into construction,
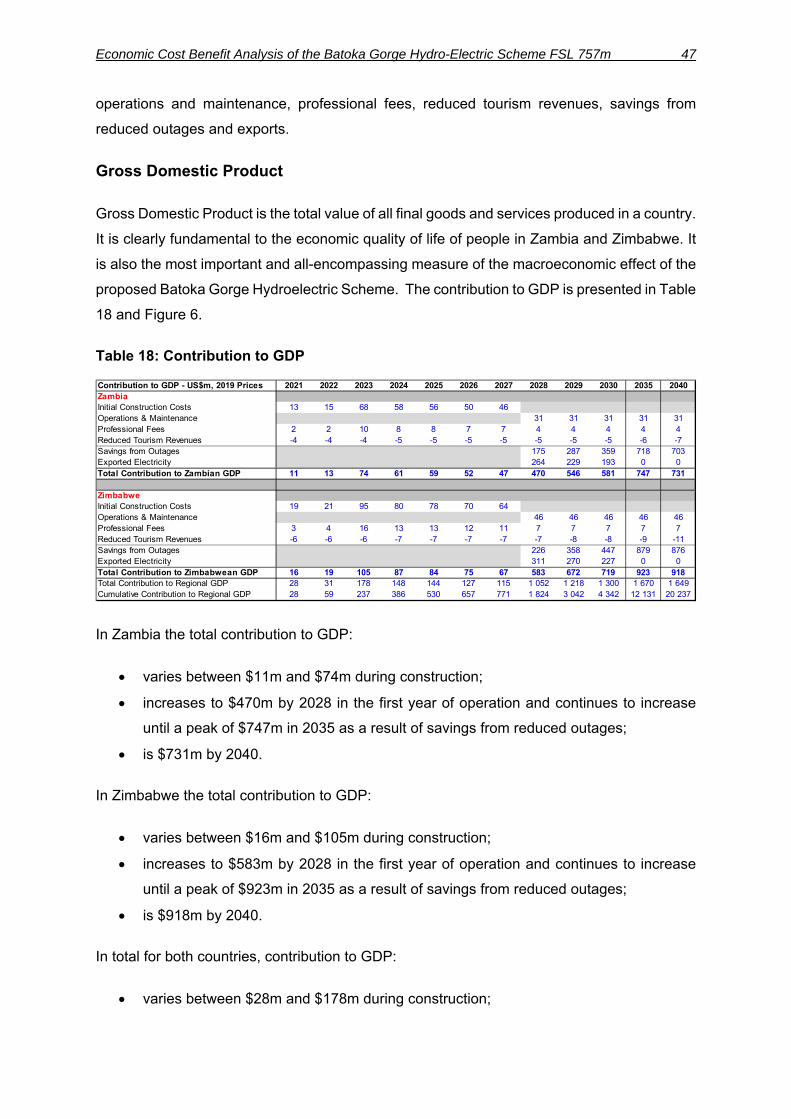
Economic Cost Benefit Analysis of the Batoka Gorge Hydro-Electric Scheme FSL 757m 47
operations and maintenance, professional fees, reduced tourism revenues, savings from
reduced outages and exports.
Gross Domestic Product
Gross Domestic Product is the total value of all final goods and services produced in a country.
It is clearly fundamental to the economic quality of life of people in Zambia and Zimbabwe. It
is also the most important and all-encompassing measure of the macroeconomic effect of the
proposed Batoka Gorge Hydroelectric Scheme. The contribution to GDP is presented in Table
18 and Figure 6.
Table 18: Contribution to GDP
In Zambia the total contribution to GDP:
varies between $11m and $74m during construction;
increases to $470m by 2028 in the first year of operation and continues to increase
until a peak of $747m in 2035 as a result of savings from reduced outages;
is $731m by 2040.
In Zimbabwe the total contribution to GDP:
varies between $16m and $105m during construction;
increases to $583m by 2028 in the first year of operation and continues to increase
until a peak of $923m in 2035 as a result of savings from reduced outages;
is $918m by 2040.
In total for both countries, contribution to GDP:
varies between $28m and $178m during construction;
Contribution to GDP - US$m, 2019 Prices 2021 2022 2023 2024 2025 2026 2027 2028 2029 2030 2035 2040ZambiaInitial Construction Costs 13 15 68 58 56 50 46Operations & Maintenance 31 31 31 31 31Professional Fees 2 2 10 8 8 7 7 4 4 4 4 4Reduced Tourism Revenues -4 -4 -4 -5 -5 -5 -5 -5 -5 -5 -6 -7Savings from Outages 175 287 359 718 703Exported Electricity 264 229 193 0 0Total Contribution to Zambian GDP 11 13 74 61 59 52 47 470 546 581 747 731
ZimbabweInitial Construction Costs 19 21 95 80 78 70 64Operations & Maintenance 46 46 46 46 46Professional Fees 3 4 16 13 13 12 11 7 7 7 7 7Reduced Tourism Revenues -6 -6 -6 -7 -7 -7 -7 -7 -8 -8 -9 -11Savings from Outages 226 358 447 879 876Exported Electricity 311 270 227 0 0Total Contribution to Zimbabwean GDP 16 19 105 87 84 75 67 583 672 719 923 918Total Contribution to Regional GDP 28 31 178 148 144 127 115 1 052 1 218 1 300 1 670 1 649Cumulative Contribution to Regional GDP 28 59 237 386 530 657 771 1 824 3 042 4 342 12 131 20 237

Economic Cost Benefit Analysis of the Batoka Gorge Hydro-Electric Scheme FSL 757m 48
increases to $1 052m by 2028;
peaks at $1 670m in 2035
is $1 649m by 2040.
In aggregate the BGHES would have added a cumulative $771m to the GDPs of the two
countries at the end of construction. By 2040 this cumulative contribution is estimated to be
$20 237m.
The disaggregated contribution:
Construction costs have been spread over seven years. Most of the materials are
imported and therefore do not make a macroeconomic contribution. Local procurement
increases Zambian GDP by a maximum of $68m and by $95m in Zimbabwe.
Running expenses would contribute $31m to Zambian GDP and $46m to Zimbabwean
GDP.
Professional fees would contribute up to $10m to Zambian GDP and $16m to
Zimbabwean GDP during construction. This operational contribution is expected to be
$4m annually in Zambia and $7m in Zimbabwe.
Reduced tourism revenues are expected to cost Zambia $4m in 2021 increasing to
$7m by 2040. This would be $6m and $11m for Zimbabwe.
The contribution of electricity to savings from fewer outages in Zambia is expected to
increase GDP by $175m in 2028 and increasing to $703m in 2040, with a peak of
$718m in 2035. In Zimbabwe this is expected to increase from $226m to $876m over
the same period, with a peak of $879m in 2035.
Income from exports is estimated to contribute $264m to the Zambian economy in
2028. This reduces annually and no exports are expected by 2035 because all the
electricity would be consumed locally. Exports would contribute $311m to Zimbabwe
in 2028, dropping off to zero by 2035.

Economic Cost Benefit Analysis of the Batoka Gorge Hydro-Electric Scheme FSL 757m 49
Figure 6: Contribution to Gross Domestic Product
The details of the contribution to GDP are presented in Figure 6:
The difference in contribution to GDP between construction and operating is clearly
apparent. Most of the construction expenses are imports.
Electricity exports decline and local production increases until 2035 when local
demand uses all the generation capacity of the BGHES.
The drop between 2035 and 2036 is because there are no further electricity
connections in either country (all the electricity produced is used by that year and no
further households or business can connect).
The negative impact from lower tourism revenue is also shown, as is the relative size
of this impact.
Direct and Indirect Jobs
The BGHES would result in changes to two types of jobs. The first are the direct jobs that
would be created. These are jobs directly on building and running the BGHES. Included are
the structural changes to the economy as a result of improved productivity. The second are
‐200
0
200
400
600
800
1 000
1 200
1 400
1 600
1 800
2021 2022 2023 2024 2025 2026 2027 2028 2029 2030 2031 2032 2033 2034 2035 2036 2037 2038 2039 2040
Contribution to Gross Domestic Produ
ct (U
S$ m
illions)
Detailed Contribution to GDP
Initial Construction Costs Operations & Maintenance Professional Fees
Reduced Tourism Revenues Savings from Fewer Outages Exported Electricity

Economic Cost Benefit Analysis of the Batoka Gorge Hydro-Electric Scheme FSL 757m 50
the so-called indirect jobs that result from the multiplier effects of the capital and operational
costs, the lost tourism business, the improved productivity and exports.
Table 19 reports on the direct jobs, Table 20 on the indirect jobs in the two countries and Table
21 is a sum of the direct and indirect job creation for both countries. Figure 7 illustrates the
total direct and indirect job creation in the two countries as well as contribution to their
respective GDPs.
Table 19: Direct Jobs
During the construction period between 2021 and 2027:
The ESIA report expects that 2 000 people would be employed during the first two
years of construction, increasing to around 8 000 people for the rest of the construction
period (Environmental Resources Management Southern Africa (Pty) Ltd, 2019).
These direct jobs, in the absence of other information, have been divided equally
between the two countries.
It is estimated that professional fees would generate up to 327 jobs in Zambia and 133
in Zimbabwe.
There would be job losses because of lower tourism revenues. In Zambia it is
estimated that these job losses would increase from 140 in 2021 to 167 in 2027 while
in Zimbabwe it is estimated that the job losses would increase from 63 to 75 over the
same time period.
When operations commence in 2028:
It is estimated that 750 direct jobs would be created in each of Zambia and Zimbabwe
from operations and maintenance.
Professional fees could generate 146 direct jobs in Zambia and 59 in Zimbabwe.
Contribution to Direct Jobs 2021 2022 2023 2024 2025 2026 2027 2028 2029 2030 2035 2040ZambiaInitial Construction Costs 1 000 1 000 4 000 4 000 4 000 4 000 4 000Operations & Maintenance 750 750 750 750 750Professional Fees 64 74 327 279 269 240 220 146 146 146 146 146Reduced Tourism Revenues -140 -144 -149 -153 -158 -162 -167 -172 -177 -183 -212 -245Savings from Outages 5 969 9 781 12 200 24 270 23 712Exported Electricity 8 894 7 714 6 500 0 0Contribution to Zambian Direct Jobs 924 929 4 178 4 126 4 112 4 077 4 053 15 587 18 213 19 414 24 955 24 363
ZimbabweInitial Construction Costs 1 000 1 000 4 000 4 000 4 000 4 000 4 000Operations & Maintenance 750 750 750 750 750Professional Fees 26 30 133 113 110 98 89 59 59 59 59 59Reduced Tourism Revenues -63 -65 -67 -69 -71 -73 -75 -78 -80 -82 -96 -111Savings from Outages 2 057 3 165 4 089 8 915 9 154Exported Electricity 3 268 2 831 2 380 0 0Contribution to Zimbabwean Direct Jobs 963 965 4 066 4 044 4 038 4 024 4 014 6 057 6 726 7 196 9 629 9 853Contribution to Regional Direct Jobs 1 887 1 894 8 244 8 170 8 150 8 102 8 067 21 644 24 939 26 610 34 584 34 216

Economic Cost Benefit Analysis of the Batoka Gorge Hydro-Electric Scheme FSL 757m 51
There would be a loss of 172 direct jobs in tourism in Zambia and 78 in Zimbabwe in
2028. This would increase to losses of 245 and 111 respectively by 2040.
Savings from fewer outages is expected to generate 24 000 direct jobs in Zambia and
9 000 in Zimbabwe from 2035 onwards.
o It is noted that there is a large disparity between the job numbers in Zambia
and Zimbabwe, when it would be expected that they would be similar. This has
to do with differences in the average compensation of employees in both
countries.
o According to the Quarterly Digest of Statistics for Zimbabwe the total
compensation of 843 000 non-agricultural employees in June 2018 was
US$1 456.3m (Zimbabwe National Statistics Agency, 2019, p. 13). This implies
an average monthly salary of $1 728 (an annual $20 727).
o The Zambian Labour Force Survey indicates that average monthly earnings in
the non-agriculture sectors in 2017 was K3 493 (Central Statistics Office, 2018,
p. 86). In mid-2017 the Zambian Kwacha was trading at approximately K9.00
to the US Dollar, implying that the average non-agriculture sector salary was
$388 (an annual $4 657). It is also noted that formal sector salaries are 28%
higher than the average in Zambia (2018, p. 85).
o Average salaries in Zimbabwe are thus about three and a half times those in
Zambia.
o Job numbers are calculated by dividing increases in salaries (which in turn are
derived from increases in turnover – refer to the description in the previous
section on how direct jobs are calculated) by the average salaries in a sector.
Based on the relative sizes of the average salaries and allowing for variation
amongst the different sectors, Zambia would generate about three times as
many jobs for the same increase in salaries.
o This is the phenomenon that is being seen when comparing job numbers
between the two countries.
Exports contribute to job creation in the early years of operation. In Zambia as many
as 8 894 jobs could be created from export revenue in 2028 while in Zimbabwe it is
estimated that 3 268 direct jobs could be created.
Total direct jobs in the two countries are estimated to exceed 8 000 from the third year of
construction. The number of direct jobs then increases until stabilising at approximately
34 000 in 2035.

Economic Cost Benefit Analysis of the Batoka Gorge Hydro-Electric Scheme FSL 757m 52
Table 20: Indirect Jobs
Indirect jobs are shown in Table 20. Total indirect jobs in the two countries are set to increase
from around 700 in 2021 to approximately 3 000 in 2027, with a peak of 4 900 in 2023. As
business productivity increases so too do the indirect jobs, until they exceed 50 000 by 2035.
Table 21: Total Direct and Indirect Jobs
Total jobs, the sum of the direct and indirect jobs discussed above, are shown in Table 21.
Total jobs are set to increase from around 2 600 in 2021 to 11 200 by the end of the
construction period, with a peak of 13 100 in 2023. Operations increase jobs to over 55 000
in 2028. They increase annually after that, exceeding 86 000 by 2040.
Contribution to Indirect Jobs 2021 2022 2023 2024 2025 2026 2027 2028 2029 2030 2035 2040ZambiaInitial Construction Costs 679 756 3 440 2 907 2 829 2 533 2 313Operations & Maintenance 2 166 2 166 2 166 2 166 2 166Professional Fees 105 120 535 456 440 392 360 239 239 239 239 239Reduced Tourism Revenues -229 -236 -243 -251 -258 -266 -274 -282 -291 -299 -347 -402Savings from Outages 9 636 15 727 19 685 39 577 38 836Exported Electricity 14 573 12 640 10 651 0 0Contribution to Zambian Indirect Jobs 554 640 3 731 3 112 3 012 2 659 2 399 26 332 30 481 32 441 41 635 40 839
ZimbabweInitial Construction Costs 210 231 1 036 871 850 761 693Operations & Maintenance 509 509 509 509 509Professional Fees 42 48 212 181 175 156 143 95 95 95 95 95Reduced Tourism Revenues -76 -78 -80 -83 -85 -88 -90 -93 -96 -99 -115 -133Savings from Outages 2 691 4 212 5 330 10 904 10 996Exported Electricity 3 916 3 392 2 851 0 0Contribution to Zimbabwean Indirect Jobs 176 201 1 168 969 939 829 745 7 117 8 111 8 685 11 393 11 467Contribution to Regional Indirect Jobs 730 841 4 900 4 081 3 951 3 488 3 145 33 450 38 593 41 127 53 028 52 306
Contribution to Direct and Indirect Jobs 2021 2022 2023 2024 2025 2026 2027 2028 2029 2030 2035 2040ZambiaInitial Construction Costs 1 679 1 756 7 440 6 907 6 829 6 533 6 313Operations & Maintenance 2 916 2 916 2 916 2 916 2 916Professional Fees 169 194 862 735 710 632 580 385 385 385 385 385Reduced Tourism Revenues -369 -380 -392 -404 -416 -428 -441 -454 -468 -482 -559 -648Savings from Outages 15 605 25 508 31 885 63 847 62 548Exported Electricity 23 467 20 354 17 151 0 0Contribution to Total Zambian Jobs 1 478 1 570 7 910 7 238 7 123 6 737 6 452 41 919 48 695 51 855 66 590 65 202
ZimbabweInitial Construction Costs 1 210 1 231 5 036 4 871 4 850 4 761 4 693Operations & Maintenance 1 259 1 259 1 259 1 259 1 259Professional Fees 68 78 345 294 284 253 232 154 154 154 154 154Reduced Tourism Revenues -139 -143 -147 -152 -156 -161 -166 -171 -176 -181 -210 -244Savings from Outages 4 748 7 377 9 419 19 819 20 151Exported Electricity 7 184 6 223 5 231 0 0Contribution to Total Zimbabwean Jobs 1 139 1 166 5 234 5 013 4 978 4 853 4 759 13 174 14 837 15 881 21 022 21 320Contribution to Total Regional Jobs 2 617 2 735 13 144 12 251 12 101 11 590 11 211 55 093 63 532 67 737 87 612 86 522

Economic Cost Benefit Analysis of the Batoka Gorge Hydro-Electric Scheme FSL 757m 53
Figure 7: Jobs and Gross Domestic Product
Figure 7 shows the contribution to direct and indirect jobs (the blue and orange columns
respectively) and to the Zambian and Zimbabwean economies (the two black lines). Three
patterns are apparent:
The contribution of the BGHES to jobs and to the economies of the two counties
increases significantly during the operating period (from 2028 onwards).
For every two direct jobs there are approximately three indirect jobs.
There is a higher economic contribution to Zimbabwe than Zambia.
0
10 000
20 000
30 000
40 000
50 000
60 000
70 000
80 000
90 000
100 000
0
100
200
300
400
500
600
700
800
900
1 000
2021 2022 2023 2024 2025 2026 2027 2028 2029 2030 2031 2032 2033 2034 2035 2036 2037 2038 2039 2040
Direct and In
direct Job Numbers
Contribution to Gross Domestic Produ
ct (U
S$ m
illion)
Contribution to GDP and Jobs
Direct Jobs Indirect Jobs Zambian GDP Zimbabwean GDP