Embed Size (px)
Citation preview
Appendix D
H:\WP\1346\Appendices\FEIS\D - Drawdown\CamRdy\App_D.doc
Annex H
Railroad and Roadway Damage Repair Plan
Table H1 Measurements of Distress from Observations of 1992 Drawdown Table H2 Potential Failure Areas Resulting from a Permanent Drawdown Table H3 Factors of Safety for Slope Stability Figure H1 Railroad and Roadway Repair Small Slope Failures Figure H2 Large Slope Failures

Appendix D
H:\WP\1346\Appendices\FEIS\D - Drawdown\CamRdy\Annexes\ANNEXH-R.DOC
D-H-1
Annex H: Railroad and Roadway Damage Repair Plan H.1 Introduction This portion of the study addresses of the potential effects of drawdown on railroad and roadway embankments from the Snake River’s confluence with the Columbia River to the Idaho state line. Those effects are settlement and slope stability directly impacted by the drawdown of the reservoir. Problems and anticipated modifications required to resist the erosive forces of the river on the embankments are described in Annex F.
There is no doubt that many of the railroad and highway embankments will be damaged as a result of rapid reservoir drawdown. As drawdown occurs, areas of the embankments along the river are anticipated to fail due to steep slopes, saturated soils, and pore pressure increase. This annex describes the critical elements that contribute to embankment failures from rapid drawdown. It summarizes the observations from the 1992 test drawdown and, from those observations, projects damages resulting from a full reservoir drawdown. It discusses the necessity and impacts of the selected drawdown rate.
H.2 Review of 1992 Drawdown A test of the reservoir drawdown concept was performed in March 1992, using Lower Granite and Little Goose Dams. The purpose of the test was to gather information regarding the effects of substantially lowering existing reservoirs. The drawdown test was scheduled to be completed within the month of March in order to minimize potential negative impacts to Snake River migrating fish. On March 1 the Lower Granite reservoir was drafted from its starting point of normal minimum operating pool (elevation 223.4 meters [733 feet]) at a rate of 0.6 meters per day for 14 days. Elevation 214.9 meters (705 feet) was achieved on March 15. During subsequent phases. Little Goose reservoir was lowered a total of 3.8 meters and Lower Granite Reservoir was further lowered to elevation 212.4 meters (697 feet) for a total drawdown of 11.0 meters.
During the drawdown the Corps monitored road and railroad embankments along the two reservoirs for potential problems. The following damage on the Lower Granite reservoir was reported:
�� Camas Prairie Railroad (CPRR) embankment experienced cracking, movement, and track misalignment;
�� Whitman County Road 9000 embankment experienced extensive movement and cracking in 33 areas (cracks varied in width from a few millimeters to 0.4 meters, and some over 60 meters in length) and damage to roadway and guardrail;
�� State Highway 193 between Steptoe Canyon and Red Wolf bridge experienced cracking and movement;
�� U.S. Highway 12 had two small slides (generally minor) near Red Wolf Marina and soil piping was noted; and
�� Cracking and movement of the road and railroad embankments disturbed many survey monuments.

Appendix D
H:\WP\1346\Appendices\FEIS\D - Drawdown\CamRdy\Annexes\ANNEXH-R.DOC
D-H-2
It was noted that most of the sliding activity associated with the drawdown occurred within slopes consisting of natural deposits of silts, sands, and gravels. For the purposes of this study, stability of natural slopes was not addressed, and efforts focused on man-made embankments. Drawdown of each reservoir of up to 30 meters cannot be assumed to occur without embankment failures.
H.3 Embankment Geometry and Material Considerations The key to understanding how embankments will behave under drawdown conditions is to understand the embankment materials. Embankments constructed from materials that are so “free-draining” that the soil saturation level falls quickly will have increased stability under drawdown conditions. Stability is decreased if the soil saturation level lags behind the reservoir drawdown level. Therefore, the rate of drawdown associated with a minimal lag is related to the “free draining” ability of embankment materials. Greater permeability and porosity of soils results in a greater ability of the material to be “free draining.” Although a material may be free draining, the rate of reservoir drawdown may be too fast, resulting in a greater saturation level lag and reduced embankment stability.
The man-made embankments along the lower Snake River are, in general, constructed from locally borrowed materials, and were not subject to the same quality control efforts (grain size and compaction control) which were used in construction of major embankment dams. Also, internal drainage features such as pipes or clean stone drains were not incorporated into the designs. According to railroad and roadway relocation reports and drawings, many embankments were constructed from “random fill” or “granular fill” materials. Compaction was probably used in placing these materials, but it is not clear how much compactive effort was used and what methods were employed. The nature of “random fill” available for borrow in the vicinity of the lower Snake River varies, although the material is predominately sand and gravel with varying amounts of fines (silts and clays passing the No. 200 sieve) and cobbles. The CPRR relocation report (Lower Granite DM 9.2) states that embankment foundations along the relocated alignments consists of bedrock or materials described as relatively clean talus rock, silty talus rock, alluvial material, and wind-deposited sand and silts. Similar materials were used for construction of the relocated road and railroad embankments.
The amount of fines controls the ability of an embankment material to be “free draining,” and the amounts of fines in silty talus rock and wind-deposited sands and silts could be significant enough to preclude free draining conditions. Alluvial materials obtained from local terrace gravel deposits and clean talus rock materials likely consist of a predominantly granular mixture of sand, gravel, and cobbles, with a lower percentage of fines than the silty materials. Although aeolian silt often exists on the ground surface of the terrace gravel deposits, it is not likely that significant amounts of fines are present in the alluvial random fill mixtures. The ability of the embankments to be free draining, and therefore more stable during drawdown, depends on the borrow source used to construct the embankments.
Man-made embankments were generally constructed with slopes of 2h:1v, with riprap or rockfill slope protection within the normal reservoir surface operating range. Some embankments, particularly on the Ice Harbor reservoir, have buttress fills against the toe of embankments with slopes of 2.5h:1v to 3h:1v. The embankments along the reservoirs have various top and toe elevations, and the drawdown range will vary from approximately 30 meters just upstream of each dam to nearly no drawdown, or possibly a slight increase in water level, just downstream of each dam. There are many embankment and drawdown rate configurations, and when the variations in embankment geometry, material types and compaction criteria are considered, there are an infinite number of material parameter and geometric combinations.
Appendix D
H:\WP\1346\Appendices\FEIS\D - Drawdown\CamRdy\Annexes\ANNEXH-R.DOC
D-H-3
H.4 Rate of Reservoir Drawdown The man-made embankments along the four lower Snake River reservoirs were constructed by various entities (including the federal government, state transportation department, and railroad companies) over an extended period of time. Embankment characteristics which vary include the method of embankment construction, embankment geometry, materials used in the embankments, surrounding land topography, embankment foundation materials, and vertical distance of drawdown from the normal reservoir surface elevation. All of these characteristics result in embankments which will behave differently under a drawdown scenario. Behavior may vary from no visible movement or damage to few tension cracks and minor movement or sloughing, to the extreme case of slope failure with extensive movement.
The rate of reservoir drawdown is an important parameter in establishing the schedule for overall embankment dam removal and reservoir drawdown. There are several biological and weather factors which influence the beginning, end, and duration of drawdown. The primary constraint in determining the rate of drawdown is the time period during which the reservoir must be lowered and the embankment removed. Reservoir evacuation cannot begin in any year prior to 1 August. This is because the spring runoff flows extend into June and July and downstream fish migration continues until this time. By January of any year the probability of high flows in the river increases dramatically. These beginning and end point constraints require that the drawdown to be done during this 5-month period. This time is further reduced to allow sufficient time to excavate the embankment and remove cofferdams.
The drawdown rate will be controlled at each dam by the spillway and powerhouse gates. Consequently, a nominal drawdown rate of 0.6 meter (2 feet) per day has been assumed for feasibility level construction planning. While some latitude may be possible as designs and schedules are further developed, the drawdown rate of 0.6 meter per day may only be slightly reduced.
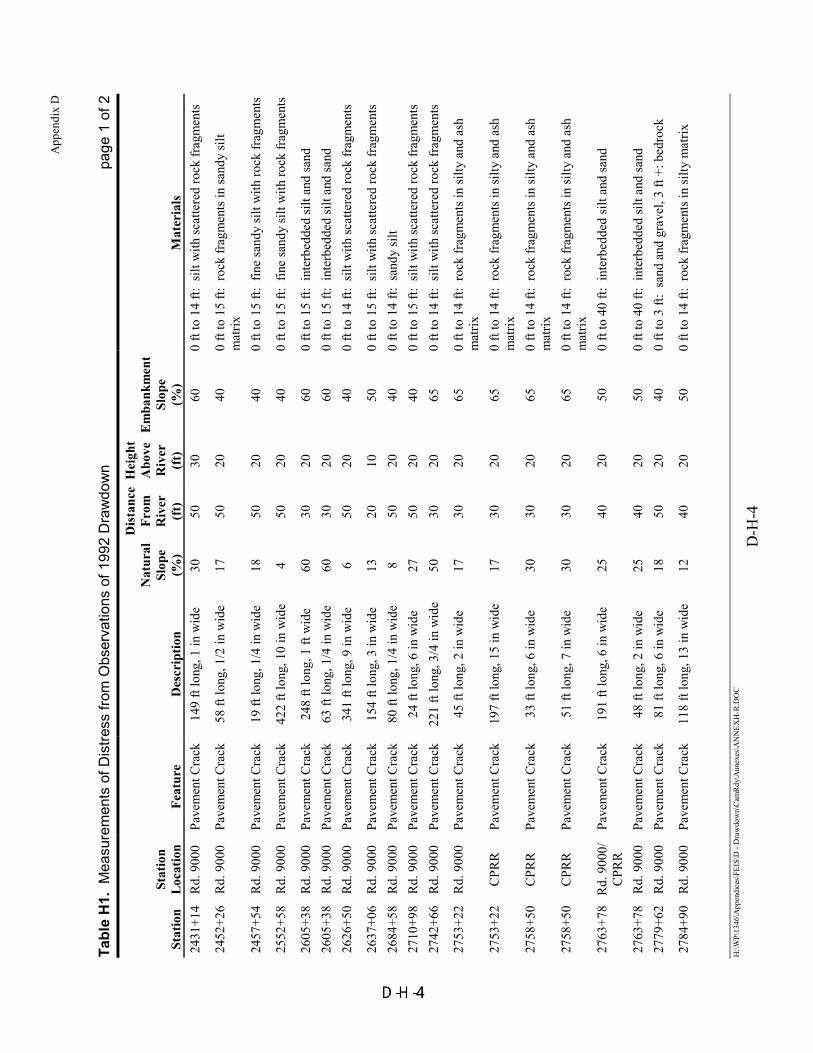
H.5 Methods The location and extent of embankment failures is extremely difficult to predict based on the uncertainty and variability of materials and methods used in constructing the embankments. However, embankment damage data from the 1992 drawdown of Lower Granite was useful in making such predictions. Table H1 summarizes the specific areas where damage was observed after the 1992 test drawdown. A rational methodology was desired to determine potential damages and subsequent repairs. To estimate the potential for road and railroad embankment failures from observed embankment distress, the study team made the following assumptions:
1. Drawdown would remove hydrostatic support from saturated materials.
2. The sections anticipated to undergo settlement are those that are in similar physical positions (height and distance) as the sections that exhibited settlement along the Lower Granite Reservoir during the 1992 drawdown.
3. The anticipated failure type and characteristics are theoretical and are based on an infinite-slope analysis. Some parameters are based on field observation, and some are based on information resources such as topographic maps and aerial photographs.
App
endi
x D
H:\W
P\13
46\A
ppen
dice
s\FE
IS\D
- D
raw
dow
n\C
amR
dy\A
nnex
es\A
NN
EXH
-R.D
OC
D-H
-4
Tabl
e H
1. M
easu
rem
ents
of D
istre
ss fr
om O
bser
vatio
ns o
f 199
2 D
raw
dow
n pa
ge 1
of 2
Stat
ion
Stat
ion
Loc
atio
n Fe
atur
e D
escr
iptio
n
Nat
ural
Sl
ope
(%)
Dis
tanc
e Fr
om
Riv
er
(ft)
Hei
ght
Abo
ve
Riv
er
(ft)
Em
bank
men
t Sl
ope
(%)
Mat
eria
ls
2431
+14
Rd.
900
0 Pa
vem
ent C
rack
14
9 ft
long
, 1 in
wid
e 30
50
30
60
0
ft to
14
ft: s
ilt w
ith sc
atte
red
rock
frag
men
ts
2452
+26
Rd.
900
0 Pa
vem
ent C
rack
58
ft lo
ng, 1
/2 in
wid
e 17
50
20
40
0
ft to
15
ft: r
ock
frag
men
ts in
sand
y si
lt m
atrix
24
57+5
4 R
d. 9
000
Pave
men
t Cra
ck
19 ft
long
, 1/4
in w
ide
18
50
20
40
0 ft
to 1
5 ft:
fin
e sa
ndy
silt
with
rock
frag
men
ts
2552
+58
Rd.
900
0 Pa
vem
ent C
rack
42
2 ft
long
, 10
in w
ide
4 50
20
40
0
ft to
15
ft: f
ine
sand
y si
lt w
ith ro
ck fr
agm
ents
2605
+38
Rd.
900
0 Pa
vem
ent C
rack
24
8 ft
long
, 1 ft
wid
e 60
30
20
60
0
ft to
15
ft: i
nter
bedd
ed si
lt an
d sa
nd
2605
+38
Rd.
900
0 Pa
vem
ent C
rack
63
ft lo
ng, 1
/4 in
wid
e 60
30
20
60
0
ft to
15
ft: i
nter
bedd
ed si
lt an
d sa
nd
2626
+50
Rd.
900
0 Pa
vem
ent C
rack
34
1 ft
long
, 9 in
wid
e 6
50
20
40
0 ft
to 1
4 ft:
silt
with
scat
tere
d ro
ck fr
agm
ents
2637
+06
Rd.
900
0 Pa
vem
ent C
rack
15
4 ft
long
, 3 in
wid
e 13
20
10
50
0
ft to
15
ft: s
ilt w
ith sc
atte
red
rock
frag
men
ts
2684
+58
Rd.
900
0 Pa
vem
ent C
rack
80
ft lo
ng, 1
/4 in
wid
e 8
50
20
40
0 ft
to 1
4 ft:
san
dy si
lt 27
10+9
8 R
d. 9
000
Pave
men
t Cra
ck
24 ft
long
, 6 in
wid
e 27
50
20
40
0
ft to
15
ft: s
ilt w
ith sc
atte
red
rock
frag
men
ts
2742
+66
Rd.
900
0 Pa
vem
ent C
rack
22
1 ft
long
, 3/4
in w
ide
50
30
20
65
0 ft
to 1
4 ft:
silt
with
scat
tere
d ro
ck fr
agm
ents
2753
+22
Rd.
900
0 Pa
vem
ent C
rack
45
ft lo
ng, 2
in w
ide
17
30
20
65
0 ft
to 1
4 ft:
roc
k fr
agm
ents
in si
lty a
nd a
sh
mat
rix
2753
+22
CPR
R
Pave
men
t Cra
ck
197
ft lo
ng, 1
5 in
wid
e 17
30
20
65
0
ft to
14
ft: r
ock
frag
men
ts in
silty
and
ash
m
atrix
27
58+5
0 C
PRR
Pa
vem
ent C
rack
33
ft lo
ng, 6
in w
ide
30
30
20
65
0 ft
to 1
4 ft:
roc
k fr
agm
ents
in si
lty a
nd a
sh
mat
rix
2758
+50
CPR
R
Pave
men
t Cra
ck
51 ft
long
, 7 in
wid
e 30
30
20
65
0
ft to
14
ft: r
ock
frag
men
ts in
silty
and
ash
m
atrix
27
63+7
8 R
d. 9
000/
C
PRR
Pa
vem
ent C
rack
19
1 ft
long
, 6 in
wid
e 25
40
20
50
0
ft to
40
ft: i
nter
bedd
ed si
lt an
d sa
nd
2763
+78
Rd.
900
0 Pa
vem
ent C
rack
48
ft lo
ng, 2
in w
ide
25
40
20
50
0 ft
to 4
0 ft:
int
erbe
dded
silt
and
sand
27
79+6
2 R
d. 9
000
Pave
men
t Cra
ck
81 ft
long
, 6 in
wid
e 18
50
20
40
0
ft to
3 ft
: sa
nd a
nd g
rave
l, 3
ft +:
bed
rock
2784
+90
Rd.
900
0 Pa
vem
ent C
rack
11
8 ft
long
, 13
in w
ide
12
40
20
50
0 ft
to 1
4 ft:
roc
k fr
agm
ents
in si
lty m
atrix

App
endi
x D
H:\W
P\13
46\A
ppen
dice
s\FE
IS\D
- D
raw
dow
n\C
amR
dy\A
nnex
es\A
NN
EXH
-R.D
OC
D-H
-5
Tabl
e H
-1, c
ontin
ued.
Mea
sure
men
ts o
f Dis
tress
from
Obs
erva
tions
of 1
992
Dra
wdo
wn
pa
ge 2
of 2
Stat
ion
Stat
ion
Loc
atio
n Fe
atur
e D
escr
iptio
n
Nat
ural
Sl
ope
(%)
Dis
tanc
e Fr
om
Riv
er
(ft)
Hei
ght
Abo
ve
Riv
er
(ft)
Em
bank
men
t Sl
ope
(%)
Mat
eria
ls
2784
+90
Rd.
900
0 Pa
vem
ent C
rack
10
2 ft
long
, 4 in
wid
e 12
40
20
50
0
ft to
14
ft: r
ock
frag
men
ts in
silty
mat
rix
2784
+90
Rd.
900
0 Pa
vem
ent C
rack
22
8 ft
long
, 13
in w
ide
12
40
20
50
0 ft
to 1
4 ft:
roc
k fr
agm
ents
in si
lty m
atrix
2790
+18
Rd.
900
0 Pa
vem
ent C
rack
28
9 ft
long
, 7 in
wid
e 40
50
20
40
0
ft to
14
ft: r
ock
frag
men
ts in
silty
mat
rix
2800
+74
Rd.
900
0 Pa
vem
ent C
rack
31
3 ft
long
, 11
in w
ide
17
50
20
40
0 ft
to 1
4 ft:
roc
k fr
agm
ents
in si
lty m
atrix
2806
+02
Rd.
900
0 Pa
vem
ent C
rack
11
6 ft
long
, 9 in
wid
e 40
30
20
65
0
ft to
14
ft: r
ock
frag
men
ts in
silty
mat
rix
2806
+02
Rd.
900
0 Pa
vem
ent C
rack
25
4 ft
long
, 10
in w
ide
40
30
20
65
0 ft
to 1
4 ft:
roc
k fr
agm
ents
in si
lty m
atrix
2811
+30
Rd.
900
0 Pa
vem
ent C
rack
24
1 ft
long
, 1 in
wid
e 10
50
20
40
0
ft to
14
ft: r
ock
frag
men
ts in
silty
mat
rix
2816
+58
Rd.
900
0 Pa
vem
ent C
rack
56
in lo
ng, 1
/8 in
wid
e 20
60
30
50
0
ft to
14
ft: r
ock
frag
men
ts in
silty
mat
rix
2849
+94
Rd.
900
0 Pa
vem
ent C
rack
50
ft lo
ng, 1
/4 in
wid
e 30
50
20
40
0
ft to
14
ft: r
ock
frag
men
ts in
silty
mat
rix
2890
+50
Rd.
900
0 Pa
vem
ent C
rack
20
4 ft
long
, 1/4
in w
ide
26
30
10
30
0 ft
to 1
4 ft:
roc
k fr
agm
ents
29
01+0
6 R
d. 9
000
Pave
men
t Cra
ck
253
ft lo
ng, 5
in w
ide
19
40
15
40
0 ft
to 1
4 ft:
roc
k fr
agm
ents
in si
lty m
atrix
29
48+5
8 R
d. 9
000
Pave
men
t Cra
ck
15 ft
long
, 1/4
in w
ide
15
40
15
40
3 ft
to 6
ft:
grav
el 6
ft to
12
ft: s
ilt
2953
+86
CPR
R
Pave
men
t Cra
ck
123
ft lo
ng, 6
in w
ide
4 15
0 20
13
vo
lcan
ic a
sh, s
ilt, a
nd sa
nd
2959
+14
CPR
R
Pave
men
t Cra
ck
30 ft
long
, 4 in
wid
e 7
50
20
40
0 ft
to 4
ft:
talu
s and
col
luvi
um 4
ft+:
bed
rock
2959
+14
Rd.
900
0 Pa
vem
ent C
rack
16
2 ft
long
, 14
in w
ide
7 50
20
40
0
ft to
4 ft
: ta
lus a
nd c
ollu
vium
4 ft
+: b
edro
ck
2959
+14
Rd.
900
0 Pa
vem
ent C
rack
75
8 ft
long
, 14
in w
ide
5 50
20
40
0
ft to
35
ft: i
nter
bedd
ed si
lt an
d sa
nd
2964
+42
Rd.
900
0 Pa
vem
ent C
rack
27
8 ft
long
, 2 in
wid
e 18
60
20
30
0
ft to
35
ft: i
nter
bedd
ed si
lt an
d sa
nd

Appendix D
H:\WP\1346\Appendices\FEIS\D - Drawdown\CamRdy\Annexes\ANNEXH-R.DOC
D-H-6
The team developed materials estimates for making repairs to the road and railroad embankments using the following assumptions:
1. The dimensions for road and railroad cross sections were assumed to be the same as the typical sections used for the road and railroad relocations prior to reservoir establishment. The team also assumed that road and railroad embankments would be constructed with materials meeting current standards.
2. Material sources were selected from existing sources identified on maps and aerial photographs. All sources were assumed to be available for use and no ownership issues were considered. Haul distances were based on sources shown on maps and aerial photographs.
3. The embankment repair quantities were assumed to be cumulative for each project.
4. Since the water level would be far below the structures, the team assumed that riprap would only be needed for shoreline protection in the active water surface zone.
5. Quantities were based on the following thicknesses:
�� Asphalt surfacing - 75 millimeters
�� Surface course - 150 millimeters
�� Base course - 300 millimeters
�� Ballast - 900 millimeters
�� Sub-ballast - 300 millimeters.
Combinations of theoretical and practical methods were used to evaluate potential railroad and roadway damage during drawdown. Practical methods were based on observations made during the 1992 Lower Granite Reservoir drawdown. The drawdown test section consisted of Whitman Co. Road No. 9000 and the Camas Prairie Railroad along the Lower Granite Reservoir (Steptoe Canyon to Wawawai Canyon). It appeared that many failures occurred along the contact between the structure fill and the natural foundation material. At other locations, it was evident that the failure extended into the foundation material. Therefore, both modes of failure had to be taken into account. The measurements taken at the time of the observations are summarized in Table H1.
Also, from the observations along the test section, it was evident that nearly all failures occurred at locations that were within 15 meters horizontal distance and 6-meter vertical distance of the reservoir perimeter, and on slopes less than 50 percent (greater than 50 percent would indicate shallow bedrock and greater stability). Therefore, the study team concluded that sections along the river in similar positions with similar physical characteristics would display a similar response. The team also assumed that sections at a horizontal distance of 15 meters to 30 meters and vertical distance greater than 6 meters from the reservoir would display only about 10 percent of the failures of the more closely adjacent sections. The areas of settlement within the test section along the Lower Granite Reservoir are marked on 1 inch = 1,000 feet maps, contract drawing maps, and copies of aerial photographs in the 1992 Reservoir Drawdown Test, Lower Granite and Little Goose Dam (Corps, 1993). Using U.S. Geological Survey, 7.5 minute, 1:24,000 scale quadrangle maps, the study team delineated the sections in both modes of failure types and measured the approximate distance in feet of each.

Appendix D
H:\WP\1346\Appendices\FEIS\D - Drawdown\CamRdy\Annexes\ANNEXH-R.DOC
D-H-7
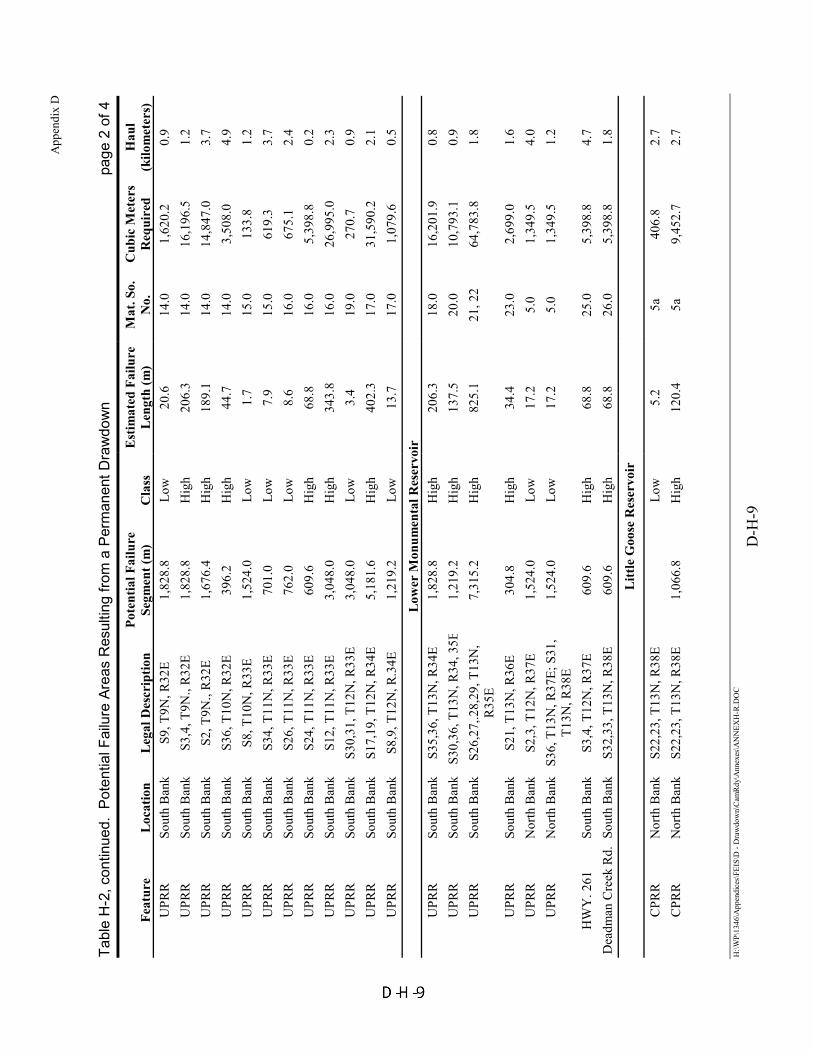
The study team estimated that a total of 68 potential failure areas could result. These anticipated failure areas are shown in Table H2.
The study team also used a theoretical approach to determine the possibility of failure of natural slopes. Using the infinite slope equations for slope stability, the team calculated the factors of safety according to the following parameters:
�� Slopes: 10 to 50 percent
�� Soil: silt (classified as ML) with scattered cobbles and boulders
�� Angle of internal friction: 30 degrees
�� Height of phreatic surface above bedrock: 0.0 meter to 4.5 meters
�� Saturated density: 1,954 kg/m3
�� Moist density (10 percent moisture content): 1,666 kg/m3
�� Depth to bedrock: 4.5 meters
While holding other parameters constant, the slope and height of the phreatic surface was varied according to the limits expressed above. Slopes range from 10 percent to 50 percent and are shown in radians. The phreatic surface ranges from 0.0 meter to 4.5 meters (anticipated ground surface) above the bedrock surface. The resulting factors of safety are shown in Table H3. The data shown indicate that, at slopes greater than about 30 percent, the factor of safety drops below one when the phreatic surface remains at the ground surface. Typical rates of permeability for silts and sandy silt mixtures (3.5 by 10-5
m3/s or less) show that the phreatic surface would remain at the ground surface for a reservoir lowering rate of 2 feet per day, creating conditions of slope instability for slopes greater than 30 percent. For slopes of 40 percent and 50 percent, the instability would be much greater.
The study team devised a typical anticipated small failure from the observed data of the 1992 drawdown and a theoretical model based on natural slope instability. The following parameters were used:
�� Length: 25.9 meters
�� Width: 3.7 meters
�� Depth: 1.5 meters
A cross section of the anticipated typical failure is shown in Figure H1. The quantities of construction materials for repair were calculated for the model using typical cross sections developed for the relocation of the County Road 9000 and the Camas Prairie Railroad. The quantities of the repair materials were then calculated for all projected small failures along the Snake River by multiplying the unit quantities (cubic meters per meter) by the number of feet of projected failure (also shown in Figure H1).
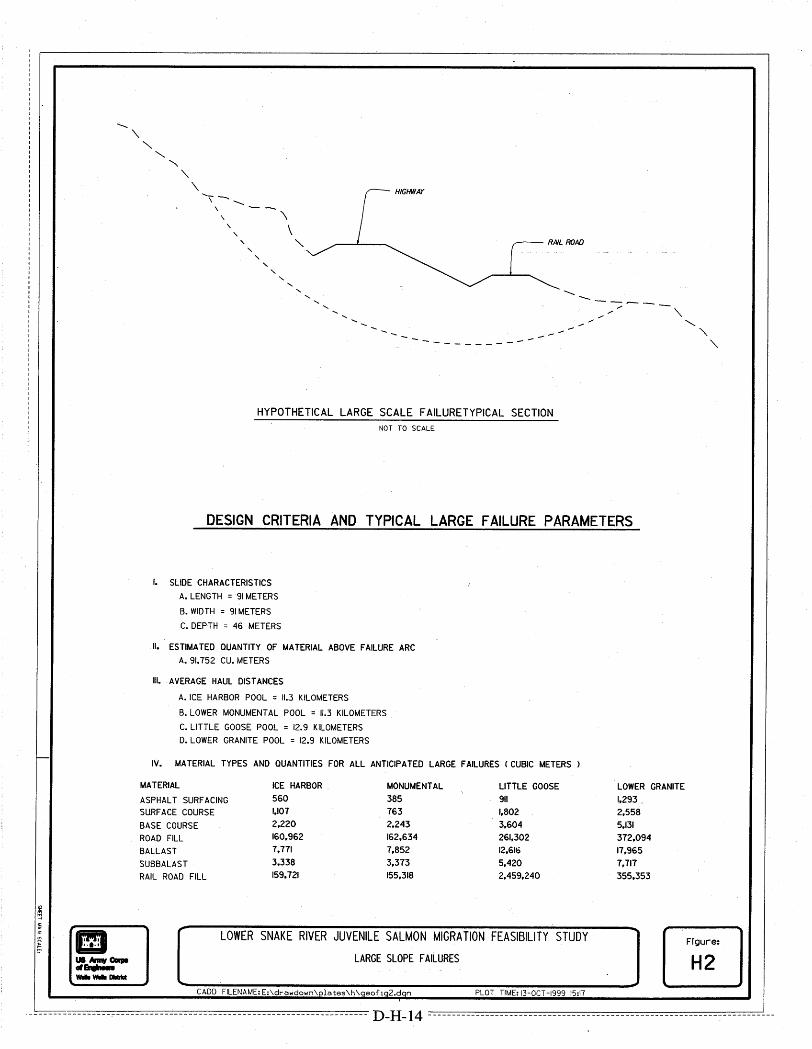
Figure H2 shows the cross section of a hypothetical large failure. The failure criteria, dimensions, and associated construction material quantities are also shown in Figure H2. It is anticipated that there would be at least two large failures on both the Little Goose and Lower Granite reservoirs, and one large failure on both the Ice Harbor and Lower Monumental reservoirs.

App
endi
x D
H:\W
P\13
46\A
ppen
dice
s\FE
IS\D
- D
raw
dow
n\C
amR
dy\A
nnex
es\A
NN
EXH
-R.D
OC
D-H
-8
Tabl
e H
2. P
oten
tial F
ailu
re A
reas
Res
ultin
g fro
m a
Per
man
ent D
raw
dow
n pa
ge 1
of 4
Feat
ure
Loc
atio
n L
egal
Des
crip
tion
Pote
ntia
l Fai
lure
Se
gmen
t (m
) C
lass
E
stim
ated
Fai
lure
L
engt
h (m
) M
at. S
o.
No.
C
ubic
Met
ers
Req
uire
d H
aul
(kilo
met
ers)
Ic
e H
arbo
r R
eser
voir
B
NR
R
Nor
th B
ank
S18,
T9N
, R32
E 12
1.9
Low
1.
4 1.
0 10
7.8
4.6
BN
RR
N
orth
Ban
k S1
8, T
9N, R
32E
182.
9 H
igh
20.6
1.
0 1,
617.
1 3.
8 B
NR
R
Nor
th B
ank
S18,
T9N
, R32
E 91
.4
Low
1.
0 1.
0 81
.0
3.0
BN
RR
N
orth
Ban
k S1
8, T
9N, R
32E
152.
4 H
igh
17.2
1.
0 1,
349.
5 2.
4 B
NR
R
Nor
th B
ank
S7, T
9N, R
32E
304.
8 Lo
w
3.4
1.0
269.
9 2.
3 B
NR
R
Nor
th B
ank
S8, T
9N, R
32E
487.
7 H
igh
55.0
1.
0 4,
320.
0 1.
2 B
NR
R
Nor
th B
ank
S4,5
, T9N
, R32
E 1,
066.
8 Lo
w
12.0
1.
0 94
5.0
1.2
BN
RR
N
orth
Ban
k S4
, T9N
, R32
E 18
2.9
Hig
h 20
.6
1.0
1,62
0.2
2.3
BN
RR
N
orth
Ban
k S3
,T9N
, R32
E 33
5.3
Low
3.
4 1.
0 26
9.9
2.4
BN
RR
N
orth
Ban
k S3
4,T1
0N, R
32E
152.
4 Lo
w
1.7
1.0
134.
6 3.
3 B
NR
R
Nor
th B
ank
S26,
T10N
, R32
E 15
2.4
Hig
h 17
.2
2.0
1,34
9.5
1.7
BN
RR
N
orth
Ban
k S2
6,T1
0N, R
32E
1,06
6.8
Low
12
.0
2.0
945.
0 2.
4 B
NR
R
Nor
th B
ank
S23,
S26,
T10N
, R32
E 1,
371.
6 Lo
w
15.5
2.
0 1,
215.
7 0.
9 B
NR
R
Nor
th B
ank
S24,
T10N
, R32
E 27
4.3
Low
3.
1 2.
0 24
3.9
0.6
BN
RR
N
orth
Ban
k S1
3,T1
0N, R
32E
274.
3 H
igh
30.9
3.
0 2,
429.
1 0.
3 B
NR
R
Nor
th B
ank
S12,
T10N
, R32
E 79
2.5
Low
8.
9 3.
0 70
1.1
2.1
BN
RR
N
orth
Ban
k S4
,T10
N, R
33E
701.
0 Lo
w
6.2
3.0
488.
6 6.
7 B
NR
R
Nor
th B
ank
S27,
34, T
11N
, R33
E 1,
371.
6 Lo
w
15.5
3.
0 1,
215.
7 14
.6
BN
RR
N
orth
Ban
k S1
4,23
, T11
N, R
33E
670.
6 Lo
w
7.6
4.0
593.
3 11
.0
Bur
r Cyn
. Rd.
N
orth
Ban
k S1
9, T
12N
, R34
E 12
1.9
Low
1.
4 4.
0 10
7.8
4.6
Bur
r Cyn
. Rd.
N
orth
Ban
k S1
8, T
12N
, R34
E 42
6.7
Hig
h 24
.1
4.0
1,89
0.1
3.7
Bur
r Cyn
. Rd.
N
orth
Ban
k S
8,17
, T12
N, R
34E
548.
6 H
igh
61.9
4.
0 4,
858.
3 2.
4 W
ilson
Cyn
. Rd.
N
orth
Ban
k S4
,9, T
12N
, R34
E 2,
438.
4 H
igh
275.
1 4.
0 21
,596
.1
1.2
Gra
vel R
oad
Sout
h B
ank
S19,
T9N
, R32
E 60
9.6
Hig
h 68
.8
13.0
5,
398.
8 0.
6
App
endi
x D
H:\W
P\13
46\A
ppen
dice
s\FE
IS\D
- D
raw
dow
n\C
amR
dy\A
nnex
es\A
NN
EXH
-R.D
OC
D-H
-9
Tabl
e H
-2, c
ontin
ued.
Pot
entia
l Fai
lure
Are
as R
esul
ting
from
a P
erm
anen
t Dra
wdo
wn
pa
ge 2
of 4
Feat
ure
Loc
atio
n L
egal
Des
crip
tion
Pote
ntia
l Fai
lure
Se
gmen
t (m
) C
lass
E
stim
ated
Fai
lure
L
engt
h (m
) M
at. S
o.
No.
C
ubic
Met
ers
Req
uire
d H
aul
(kilo
met
ers)
U
PRR
So
uth
Ban
k S9
, T9N
, R32
E
1,82
8.8
Low
20
.6
14.0
1,
620.
2 0.
9 U
PRR
So
uth
Ban
k S3
,4, T
9N.,
R32
E 1,
828.
8 H
igh
206.
3 14
.0
16,1
96.5
1.
2 U
PRR
So
uth
Ban
k S2
, T9N
., R
32E
1,67
6.4
Hig
h 18
9.1
14.0
14
,847
.0
3.7
UPR
R
Sout
h B
ank
S36,
T10
N, R
32E
396.
2 H
igh
44.7
14
.0
3,50
8.0
4.9
UPR
R
Sout
h B
ank
S8, T
10N
, R33
E 1,
524.
0 Lo
w
1.7
15.0
13
3.8
1.2
UPR
R
Sout
h B
ank
S34,
T11
N, R
33E
701.
0 Lo
w
7.9
15.0
61
9.3
3.7
UPR
R
Sout
h B
ank
S26,
T11
N, R
33E
762.
0 Lo
w
8.6
16.0
67
5.1
2.4
UPR
R
Sout
h B
ank
S24,
T11
N, R
33E
609.
6 H
igh
68.8
16
.0
5,39
8.8
0.2
UPR
R
Sout
h B
ank
S12,
T11
N, R
33E
3,04
8.0
Hig
h 34
3.8
16.0
26
,995
.0
2.3
UPR
R
Sout
h B
ank
S30,
31, T
12N
, R33
E 3,
048.
0 Lo
w
3.4
19.0
27
0.7
0.9
UPR
R
Sout
h B
ank
S17,
19, T
12N
, R34
E 5,
181.
6 H
igh
402.
3 17
.0
31,5
90.2
2.
1 U
PRR
So
uth
Ban
k S8
,9, T
12N
, R.3
4E
1,21
9.2
Low
13
.7
17.0
1,
079.
6 0.
5
Low
er M
onum
enta
l Res
ervo
ir
UPR
R
Sout
h B
ank
S35,
36, T
13N
, R34
E 1,
828.
8 H
igh
206.
3 18
.0
16,2
01.9
0.
8 U
PRR
So
uth
Ban
k S3
0,36
, T13
N, R
34, 3
5E1,
219.
2 H
igh
137.
5 20
.0
10,7
93.1
0.
9 U
PRR
So
uth
Ban
k S2
6,27
,.28,
29, T
13N
, R
35E
7,31
5.2
Hig
h 82
5.1
21, 2
2 64
,783
.8
1.8
UPR
R
Sout
h B
ank
S2
1, T
13N
, R36
E 30
4.8
Hig
h 34
.4
23.0
2,
699.
0 1.
6 U
PRR
N
orth
Ban
k S2
,3, T
12N
, R37
E 1,
524.
0 Lo
w
17.2
5.
0 1,
349.
5 4.
0 U
PRR
N
orth
Ban
k S3
6, T
13N
, R37
E; S
31,
T13N
, R38
E 1,
524.
0 Lo
w
17.2
5.
0 1,
349.
5 1.
2
HW
Y. 2
61
Sout
h B
ank
S3,4
, T12
N, R
37E
609.
6 H
igh
68.8
25
.0
5,39
8.8
4.7
Dea
dman
Cre
ek R
d. S
outh
Ban
k S3
2,33
, T13
N, R
38E
609.
6 H
igh
68.8
26
.0
5,39
8.8
1.8
Litt
le G
oose
Res
ervo
ir
CPR
R
Nor
th B
ank
S22,
23, T
13N
, R38
E
Low
5.
2 5a
40
6.8
2.7
CPR
R
Nor
th B
ank
S22,
23, T
13N
, R38
E 1,
066.
8 H
igh
120.
4 5a
9,
452.
7 2.
7

App
endi
x D
H:\W
P\13
46\A
ppen
dice
s\FE
IS\D
- D
raw
dow
n\C
amR
dy\A
nnex
es\A
NN
EXH
-R.D
OC
D-H
-10
Tabl
e H
2, c
ontin
ued.
Pot
entia
l Fai
lure
Are
as R
esul
ting
from
a P
erm
anen
t Dra
wdo
wn
pa
ge 3
of 4
Feat
ure
Loc
atio
n L
egal
Des
crip
tion
Pote
ntia
l Fai
lure
Se
gmen
t (m
) C
lass
E
stim
ated
Fai
lure
L
engt
h (m
) M
at. S
o.
No.
C
ubic
Met
ers
Req
uire
d H
aul
(kilo
met
ers)
C
PRR
N
orth
Ban
k S2
4, T
13N
, R38
E 24
3.8
Low
2.
7 5b
21
5.6
2.4
CPR
R
Nor
th B
ank
S19,
24, T
13N
, R38
E 1,
066.
8 H
igh
120.
4 5b
9,
453.
5 0.
9 C
PRR
N
orth
Ban
k S2
0,21
, T13
N, R
38E
1,52
4.0
Hig
h 17
1.9
5b
13,4
97.5
2.
4 C
PRR
N
orth
Ban
k S2
2, T
13N
, R38
E 45
7.2
Hig
h 51
.8
5b
59,3
98.7
4.
6 C
PRR
N
orth
Ban
k S7
,11,
14,2
3, T
13N
, R
39,4
0E
2,59
0.8
Hig
h 75
6.5
5b
59,3
99.5
8.
5
CPR
R
Nor
th B
ank
S7,1
2,14
,23,
T13
N,
R39
,40E
1,
219.
2 Lo
w
1.0
5b
81.0
10
.4
CPR
R
Nor
th B
ank
S13,
14,2
2,23
,27,
T14
N,
R40
E 4,
876.
8 H
igh
550.
2 6.
0 43
,198
.4
3.1
CPR
R
Nor
th B
ank
S13,
17,1
8, T
14N
, R
40,4
1E
1,52
4.0
Hig
h 17
1.9
7.0
13,4
97.5
3.
1
CPR
R
Nor
th B
ank
S15,
16,1
7, T
14N
, R41
E3,
962.
4 H
igh
446.
8 9.
0 35
,083
.7
1.8
CPR
R
Nor
th B
ank
S20,
T14
N, R
42E
1,21
9.2
Hig
h 13
7.5
9.0
10,7
98.4
8.
5 C
PRR
N
orth
Ban
k S2
0,21
, T14
N, R
42E
914.
4 Lo
w
10.3
9.
0 80
8.9
8.5
CPR
R
Nor
th B
ank
S13,
14,2
3, T
14N
, R42
E3,
048.
0 Lo
w
343.
8 9.
0 26
,995
.0
15.3
C
PRR
N
orth
Ban
k S1
3,18
,19,
T14
N,
R42
E,43
E 1,
828.
8 H
igh
206.
3 10
.0
16,1
97.3
14
.6
Hw
y 12
7 So
uth
Ban
k S9
, T13
N, R
40E
1,21
9.2
Hig
h 13
7.5
27.0
10
,797
.7
1.2
Dea
dman
Cre
ek R
d. S
outh
Ban
k S1
8,19
,30,
T14
N, R
43E
1,21
9.2
Low
13
.7
28.0
1,
079.
6 1.
5
Low
er G
rani
te R
eser
voir
C
PRR
N
orth
Ban
k S3
3,34
, T14
N, R
43E
S2,
T13N
, R43
E 4,
267.
2 H
igh
481.
3 10
.0
37,7
88.1
9.
1
Test
Sec
tion
Nor
th B
ank
Waw
awai
Cre
ek to
St
epto
e C
reek
16
,254
.4
Hig
h 18
33.4
10
and
11
143,
951.
2 5.
7
BN
RR
N
orth
Ban
k St
epto
e C
reek
to
RM
138
.4
16,4
59.2
Lo
w
185.
9 11
.0
14,5
98.5
4.
0

App
endi
x D
H:\W
P\13
46\A
ppen
dice
s\FE
IS\D
- D
raw
dow
n\C
amR
dy\A
nnex
es\A
NN
EXH
-R.D
OC
D-H
-11
Tabl
e H
2, c
ontin
ued.
Pot
entia
l Fai
lure
Are
as R
esul
ting
from
a P
erm
anen
t Dra
wdo
wn
pa
ge 4
of 4
Feat
ure
Loc
atio
n L
egal
Des
crip
tion
Pote
ntia
l Fai
lure
Se
gmen
t (m
) C
lass
E
stim
ated
Fai
lure
L
engt
h (m
) M
at. S
o.
No.
C
ubic
Met
ers
Req
uire
d H
aul
(kilo
met
ers)
W
hitm
an C
o. R
d.
9000
N
orth
Ban
k St
epto
e C
reek
to
RM
138
.4
11,5
82.4
H
igh
1306
.4
11.0
10
2,57
1.9
6.4
Hw
y 12
So
uth
Ban
k A
lpow
a C
reek
to R
ed
Wol
f Brid
ge
10,9
72.8
Lo
w
123.
7 29
and
30
9,71
6.5
5.2
Hw
y 12
9 W
est B
ank
RM
140
.5 to
143
5,
486.
4 H
igh
618.
7 32
.0
48,5
81.9
5.
2 N
ez P
erce
Co.
Rd.
Ea
st B
ank
Hw
y 12
to R
M 1
43
5,48
6.4
Low
62
.2
31.0
4,
882.
0 3.
3
Tabl
e H
3. F
acto
rs o
f Saf
ety
for S
lope
Sta
bilit
y
Deg
ree
Slop
e
Satu
rate
d M
ater
ial
Thi
ckne
ss
(m)
Fact
or
of S
afet
y D
egre
e Sl
ope
Satu
rate
d M
ater
ial
Thi
ckne
ss
(m)
Fact
or
of S
afet
yD
egre
e Sl
ope
Satu
rate
d M
ater
ial
Thi
ckne
ss
(m)
Fact
or
of S
afet
y D
egre
e Sl
ope
Satu
rate
d M
ater
ial
Thi
ckne
ss
(m)
Fact
or
of S
afet
yD
egre
e Sl
ope
Satu
rate
d M
ater
ial
Thi
ckne
ss
(m)
Fact
or
of S
afet
y5.
7 0.
0 6.
11
11.3
0.
0 3.
06
16.7
0.
0 2.
04
21.8
0.
0 1.
54
26.6
0.
0 1.
23
5.7
0.3
5.88
11
.3
0.3
2.94
16
.7
0.3
1.96
21
.8
0.3
1.48
26
.6
0.3
1.19
5.
7 0.
6 5.
65
11.3
0.
6 2.
83
16.7
0.
6 1.
89
21.8
0.
6 1.
42
26.6
0.
6 1.
14
5.7
0.9
5.43
11
.3
0.9
2.72
16
.7
0.9
1.81
21
.8
0.9
1.37
26
.6
0.9
1.10
5.
7 1.
2 5.
21
11.3
1.
2 2.
61
16.7
1.
2 1.
74
21.8
1.
2 1.
31
26.6
1.
2 1.
05
5.7
1.5
5.00
11
.3
1.5
2.50
16
.7
1.5
1.67
21
.8
1.5
1.26
26
.6
1.5
1.01
5.
7 1.
8 4.
79
11.3
1.
8 2.
40
16.7
1.
8 1.
60
21.8
1.
8 1.
21
26.6
1.
8 0.
97
5.7
2.1
4.59
11
.3
2.1
2.30
16
.7
2.1
1.53
21
.8
2.1
1.16
26
.6
2.1
0.93
5.
7 2.
4 4.
39
11.3
2.
4 2.
20
16.7
2.
4 1.
47
21.8
2.
4 1.
11
26.6
2.
4 0.
89
5.7
2.7
4.19
11
.3
2.7
2.10
16
.7
2.7
1.40
21
.8
2.7
1.06
26
.6
2.7
0.85
5.
7 3.
0 4.
00
11.3
3.
0 2.
00
16.7
3.
0 1.
34
21.8
3.
0 1.
01
26.6
3.
0 0.
81
5.7
3.4
3.81
11
.3
3.4
1.91
16
.7
3.4
1.28
21
.8
3.4
0.96
26
.6
3.4
0.77
5.
7 3.
7 3.
63
11.3
3.
7 1.
82
16.7
3.
7 1.
22
21.8
3.
7 0.
92
26.6
3.
7 0.
74
5.7
4.0
3.45
11
.3
4.0
1.73
16
.7
4.0
1.16
21
.8
4.0
0.87
26
.6
4.0
0.70
5.
7 4.
3 3.
28
11.3
4.
3 1.
64
16.7
4.
3 1.
10
21.8
4.
3 0.
83
26.6
4.
3 0.
67
5.7
4.6
3.10
11
.3
4.6
1.55
16
.7
4.6
1.04
21
.8
4.6
0.78
26
.6
4.6
0.63

Appendix D
H:\WP\1346\Appendices\FEIS\D - Drawdown\CamRdy\Annexes\ANNEXH-R.DOC
D-H-12
H.6 Conclusions Drawdown would cause significant damage to road and railroad embankments. Most embankment failures are expected to occur after the reservoirs are significantly drawn down, when the excess weight of the water in the embankment materials would cause a failure. Temporary road detours may be required during and after drawdown to allow vehicle traffic to use roadways. However, railroad embankment failures may result in a shut down of rail traffic until repairs can be made. Rapid response approach to railroad repairs will be critical to minimizing the impacts of interruption of rail service.
H.7 Construction Schedule Embankment repairs cannot be performed until after drawdown is accomplished. Also, in some areas, it may be necessary to wait several weeks after drawdown to allow the materials to drain and stabilize before repairs can be initiated. The exact number and extent of failures cannot be predicted prior to drawdown. Therefore, multiple equipment rental contracts would be awarded prior to drawdown, allowing repairs to be performed as failures occur. It is anticipated that most damage and consequent repairs would be completed within a few months and up to 1 year after drawdown is complete.