Embed Size (px)
Citation preview

PHI–BushbuckridgeAgriculturalDevelopmentPlan 2016
1
Annex3–OrchardEstablishment
TableofContents
1 OrchardSelection–AreaandSuitability.........................................................................22 GrossMarginComparisons...................................................................................................4
3 CumulativeCashEffect...........................................................................................................5
4 EstablishmentFinanceCosts–CostofCapital...............................................................65 BudgetSummaries..................................................................................................................75.1 Macadamias.....................................................................................................................................75.2 Mangos...............................................................................................................................................85.3 Avocado.............................................................................................................................................95.4 Bananas..........................................................................................................................................105.5 Citrus(Oranges)..........................................................................................................................11
TableofFiguresFigure1-ComparativeCostsandMargins............................................................................................3
TableofTablesTable1-OrchardSelection(FruitBasket).............................................................................................2Table2-AverageSot/MarginDeterminationperhectare..............................................................3

PHI–BushbuckridgeAgriculturalDevelopmentPlan 2016
2
1 OrchardSelection–AreaandSuitabilityAccordingtotheInstituteofNaturalResources(2015),“BushbuckridgeislocatedinthesubtropicalareasofSouthAfricawhichmakesitsuitableforcultivationofsubtropicalfruits(avocados,mango,litchi,andbanana)andcitrus.”For thepurposesof this study, a basket of fruit typeshasbeen examined inorder toobtain an average cost-returnmodel for the re-establishmentof orchards in termsoftheBushbuckridgeAgriculturalDevelopmentPlan.Again,theobjectiveofthemodellingis not for enterprise development purposes but rather for determining reliable andcredible budget and impact indicators on which to base the findings andrecommendationsofthestudy.To this end, the following orchard types have been included following consultationswith the CEOs of the CGA (Citrus Growers’ Association) and Subtrop (SA SubtropicalGrowers’ Association) as well as established commercial farmers and agriculturaleconomists familiar with the area and context. Consultations were conducted withspecificreferencetothecontentandproposalsofthedraftBushbuckridgeAgriculturalDevelopmentPlan.
Table1-OrchardSelection(FruitBasket)
FORBUSHBUCKRIDGE NATIONALAND/OREXPORTType InvestorDemand
(Highesttolowest)MarketOutlook(mediumtermpotential)
Industryinfo
1. Citrus Good http://cga.co.za2. Macadamia Good http://www.samac.org.za3. Avocado High http://www.avocado.co.za4. Banana Fair 5. Mango Limited http://www.mango.co.za
It is noteworthy that a number of other orchard types may be feasible (given thesuitable climate, affordable land and available water) but the specific conditions forimplementing this plan – namely based on Community Public Private Partnerships –suggeststhattheriskprofile(albeitperceivedrisk)willresultinimplementationbeingcharacterised by 1) the most obvious fruit types and 2) the most capable andestablishedcommercialoperatorswithintheimmediatevicinity(eHlanzeniandMopanidistricts).Basedontheorchardtypeslistedabove,anaverageestablishmentcostofR114koverthe1st4yearsisapplicabletothebasket.AnaverageGrossMarginof110kwillapplyfor the same basket from year 11 onwards (as this is the period beyond which allorchardtypestendtobeyieldingoptimallyandwherecostsarerelativelyconstant).It is noteworthy – in terms of the calculation of averages – thatMacadamias have atendency to push the GrossMargin average up as they yield double the value of theotherorchards.Similarly,Avocadospushtheaveragedownastheyyieldonlyabout2thirdsoftherevenueperhectarecomparedwithCitrus,MangosandBananas(whichallyieldrelativelysimilarrevenues).

PHI–BushbuckridgeAgriculturalDevelopmentPlan 2016
3
Table2-AverageSot/MarginDeterminationperhectare
EstablishmentCosts-1st4years AnnualGrossMarginfromY11Macs R112884 R222016Mango R124216 R94817Avos R106768 R59524Banana R104947 R89629Citrus R119894 R85136Average R113742 R110224
Allthedataandcalculationsusedhavebeendevelopedfora1-hectareunitandexcludeany indirect costs. I.e. there has been no provisionmade forManagement,Moveableassets(tractorsandequipment), land(purchaseorrental)orbuildingsandfacilities–norfordepreciation.(Alldataispresentedatconstant-current-prices).
Figure1-ComparativeCostsandMargins
Giventherelativelysimilarestablishmentcostsassociatedwiththedifferenceorchardtypes,itfollowsthatthechoiceororchardwilldependontheparticularcircumstancesandpreferencesofthecommercialoperator(inrelationtoaparticularprojectsite).What follows isasetofcomparative illustrationsof theGrossMarginperformanceaswellastheCumulativeCashresultsofthe5orchardtypesunderconsideration.Beyondthat,asetofsourcebudgetsummariesareprovidedtosubstantiatethenumbersforkeylineitems–ineachcasebeingpresentedasa1hectareunitovera15yearperiod(Withyearzeroincludedasthestart-uplag.Lineitemsinclude:• GrossRevenue• ProductionCosts• HarvestingandMarketingCosts• EstablishmentCost• CostofCapital
R-
R50000
R100000
R150000
R200000
R250000
Macs Mango Avos Banana Citrus Average
EstablishmentCosts-1st4years AnnualGrossMarginfromY11

PHI–BushbuckridgeAgriculturalDevelopmentPlan 2016
4
2 GrossMarginComparisons
R(50000)
R-
R50000
R100000
R150000
R200000
R250000
0 1 2 3 4 5 6 7 8 9 10 11 12 13 14 15
Macs Mango Avos Banana Citrus

PHI–BushbuckridgeAgriculturalDevelopmentPlan 2016
5
3 CumulativeCashEffect
R(400000)
R(200000)
R-
R200000
R400000
R600000
R800000
R1000000
R1200000
R1400000
R1600000
0 1 2 3 4 5 6 7 8 9 10 11 12 13 14 15
Macs Mango Avos Banana Citrus

PHI–BushbuckridgeAgriculturalDevelopmentPlan 2016
6
4 EstablishmentFinanceCosts–CostofCapitalThe cost of capitalwas calculated based on the assumption that repaymentmay notexceed a period of 10 years (and in the case of bananas, 5 years given their quickmaturityandalsogiventheirrelativelyshortlifespan).Thevalueoftheprincipledebtwasbasedonthedirectestablishmentcostplusthesumoftheinitialnegativegrossmargins(whichinmostcasespersistforthe1st4yearsafterplanting).Interestratesweresetat10,5%andpaymentsareannual(attheendoftheyear).Again, these costs pertain to1-hectareunits and exclude all indirect andmixed costs(likemanagement,tractorsandequipment,buildingsandsheds). DevCost R72300 (R18767,79) Calculation negGM R40584 R18767,79 AnnualPaymentMacs Total R112884 Years 10 Interest 10,50%
DevCost R74920 (R20651,82) Calculation negGM R49296 R20651,82 AnnualPaymentMango Total R124216 Years 10 Interest 10,50%
DevCost R67780 (R17750,96) Calculation negGM R38988 R17750,96 AnnualPaymentAvos Total R106768 Years 10 Interest 10,50%
DevCost R69700 (R28039,13) Calculation negGM R35247 R28039,13 AnnualPaymentBanana Total R104947 Years 5 Interest 10,50%
DevCost R67780 (R19933,22) Calculation negGM R52114 R19933,22 AnnualPaymentCitrus Total R119894 Years 10 Interest 10,50%

PHI–BushbuckridgeAgriculturalDevelopmentPlan 2016
7
5 BudgetSummaries
5.1 Macadamias

PHI–BushbuckridgeAgriculturalDevelopmentPlan 2016
8
5.2 Mangos
R(150000)
R(100000)
R(50000)
R-
R50000
R100000
R150000
R200000
0 1 2 3 4 5 6 7 8 9 10 11 12 13 14 15
GrossIncome TotalCosts Surplus/Dehicit
PHI–BushbuckridgeAgriculturalDevelopmentPlan 2016
9
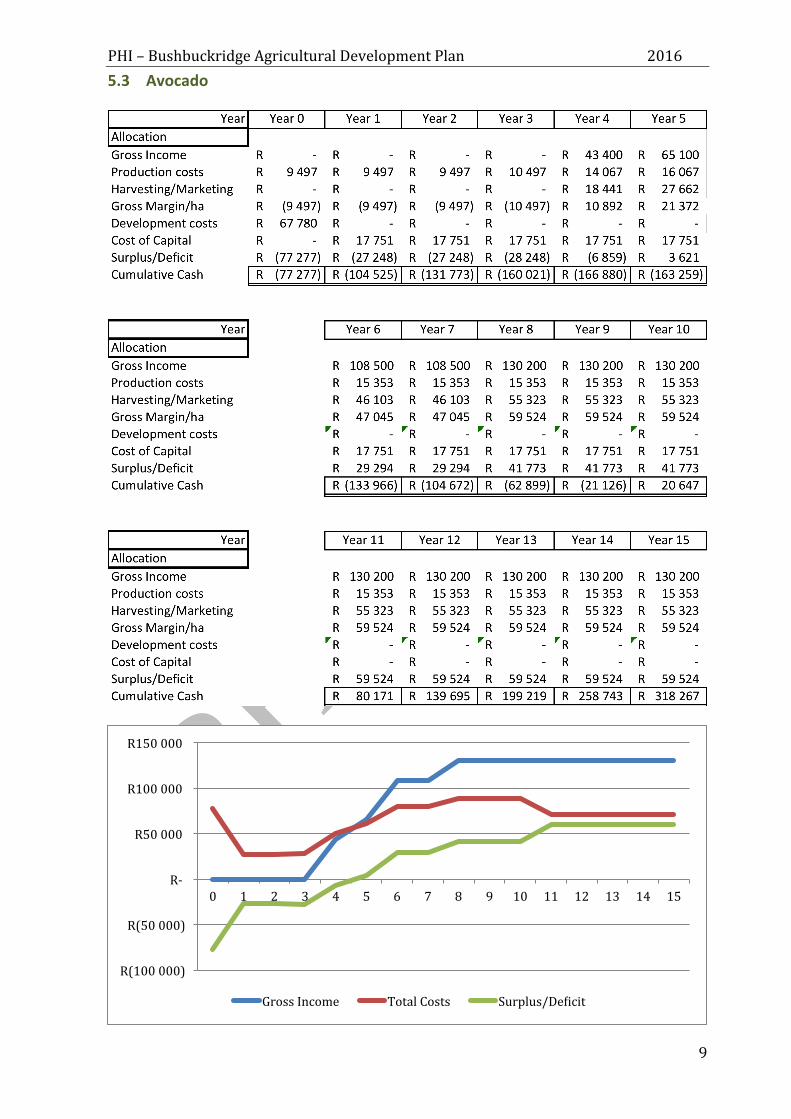
5.3 Avocado
R(100000)
R(50000)
R-
R50000
R100000
R150000
0 1 2 3 4 5 6 7 8 9 10 11 12 13 14 15
GrossIncome TotalCosts Surplus/Dehicit

PHI–BushbuckridgeAgriculturalDevelopmentPlan 2016
10
5.4 Bananas
R(150000)
R(100000)
R(50000)
R-
R50000
R100000
R150000
R200000
0 1 2 3 4 5 6 7 8 9 10 11 12 13 14 15
GrossIncome TotalCosts Surplus/Dehicit

PHI–BushbuckridgeAgriculturalDevelopmentPlan 2016
11
5.5 Citrus(Oranges)
R(100000)
R(50000)
R-
R50000
R100000
R150000
R200000
R250000
0 1 2 3 4 5 6 7 8 9 10 11 12 13 14 15
GrossIncome TotalCosts Surplus/Dehicit