Embed Size (px)
Citation preview
Annex 2
Best Energy Mix for Road Transportation in Indonesia Adhika Widyaparaga, Bertha M. Sopha, Joewono Soemardjito, Deendarlianto, Arief Budiman, Imam Muthohar Gadjah Mada University
Kazutaka Oka, Atsushi Fuwa Mizuho Information & Research Institute
Indra Chandra Setiawan Toyota Motor Manufacturing Indonesia
Hitoshi Hayashi Toyota Motor Corporation
Alia Lindasista, Syahrial Mukhtar, Fuadi A. Nasution Pertamina June 2013 This chapter should be cited as Widyaparaga, A., B. M. Sopha, J. Soemardjito, Deendarlianto, A. Budiman, I. Muthohar, K. Ota, A. Fuwa, I. C. Setiawan, H. Hayashi, A. Lindasista, S. Mukhtar, F.A. Nasution (2013), ‘Best Energy Mix for Road Transportation in Indonesia’ in Kimura, S. (ed.), Analysis on Energy Saving Potential in East Asia, ERIA Research Project Report 2012-19, pp.333-347.ERIA [online]. Available at: http:/www.eria.org/RPR_FY2012_No.19_ Annex_2.pdf
333
ANNEX 2
Best Energy Mix for Road Transportation in Indonesia
ADHIKA WIDYAPARAGA, BERTHA M. SOPHA, JOEWONO SOEMARDJITO,
DEENDARLIANTO, ARIEF BUDIMAN, IMAM MUTHOHAR
Gadjah Mada University
KAZUTAKA OKA, ATSUSHI FUWA
Mizuho Information & Research Institute
INDRA CHANDRA SETIAWAN
Toyota Motor Manufacturing Indonesia
HITOSHI HAYASHI
Toyota Motor Corporation
ALIA LINDASISTA, SYAHRIAL MUKHTAR, FUADI A. NASUTION
Pertamina
A2-1: Introduction
Historically, indigenous oil, gas and coal reserves have played an important role
in Indonesia’s economy. Indonesia’s vast reserves and resources of these three
commodities have allowed extensive utilization as sources of energy, industrial raw
material and national income. The extensive use of energy has contributed to the
increase of economic growth which is represented by GDP. Between 2002 and 2030,
it is projected that the Indonesian population will grow at 1 percent annually whereas
GDP grows at 4.6 percent. 1
The increase of population growth has in turn resulted in higher energy demand.
The total energy consumption in Indonesia in the year 2000 was 778 million barrels
1 Fuerte Jr. (ed.), (2006).

334
of oil equivalent (BOE). Within 11 years, this increased to 1,114 million BOE. The
energy consumption by the transportation sector experienced the largest increase
within this period. From the year 2000 to 2011, the energy consumption by the
transportation sector grew at a rate of 6.5 percent annually from 139 million BOE to
277 million BOE. Meanwhile, oil production decreased 4 percent annually from
2000-2011 due to depletion of reserves and lack of investment for exploration and
development. 2
The transportation sector consumes over 60 percent of Indonesian oil, 70 percent
of which attributed to road transportation. Summarizing, road transportation, the
main contributor of energy consumption in transportation sector, will account for 87
percent of the total transport energy demand by 2030. The Asia Pacific Energy
Research Centre predicts that the number of passenger vehicles will increase from
3.4 million units in 2002 to 13.9 million units by 2030 thus drastically increasing oil
demand. 3
An issue that arises is the continued financial burden to the Indonesian
government due to the policy of subsidizing gasoline and diesel fuels for road
transport. The increasing demand of these fuels will be accompanied by increasing
subsidy, further made worse if domestic oil production continues to decline. It is
thus necessary to explore alternative energy resources or fuel types for road
transportation.
This study therefore aims to examine the effect of the implementation of
alternative fuels, such as compressed natural gas (CNG) and biofuels, on fuel
consumption, CO2 emissions and fuel subsidies for the road transportation sector. In
addition, new energy efficient technologies such as electric vehicles and hybrid
vehicles are also examined. It is expected that the results of this study can provide
insight to what fuel mix can best be applied to the Indonesian road transport sector in
such a way that features a favourable balance of reduced gasoline/diesel consumption
and subsidies, more efficient energy usage, and low CO2 emissions.
2 Syahrial, et al. (2012).
3 Fuerte Jr. (ed.), (2006).
335
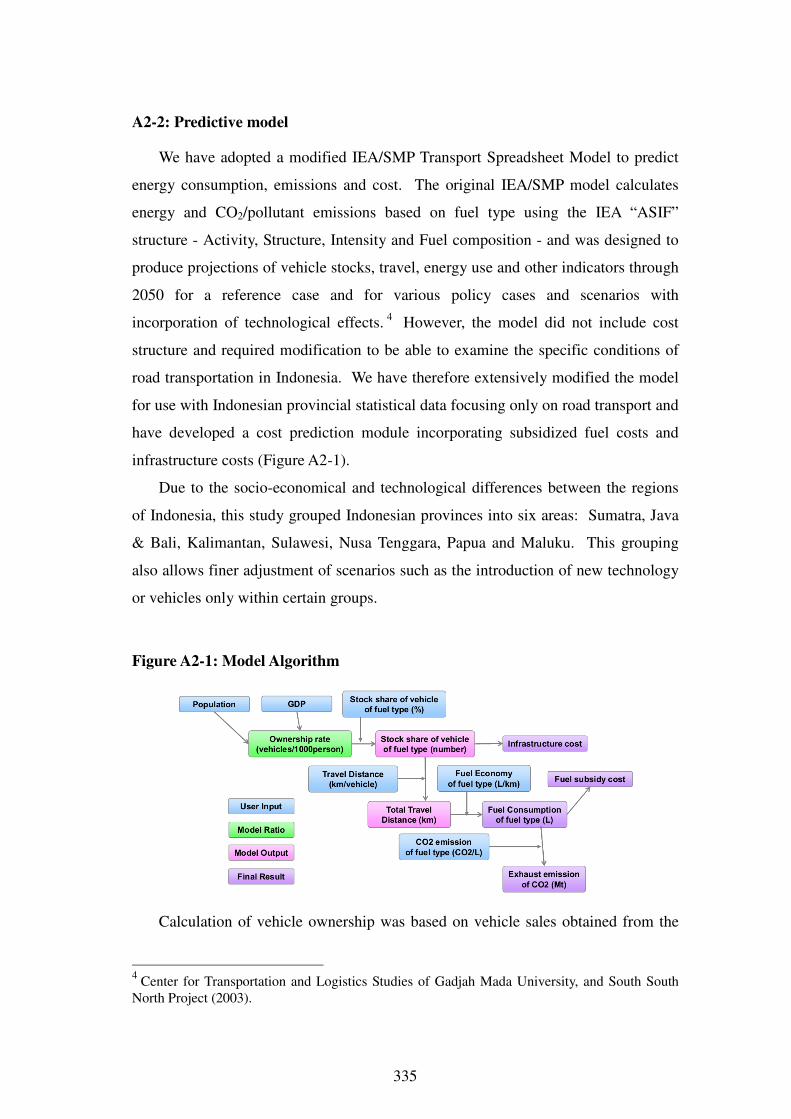
A2-2: Predictive model
We have adopted a modified IEA/SMP Transport Spreadsheet Model to predict
energy consumption, emissions and cost. The original IEA/SMP model calculates
energy and CO2/pollutant emissions based on fuel type using the IEA “ASIF”
structure - Activity, Structure, Intensity and Fuel composition - and was designed to
produce projections of vehicle stocks, travel, energy use and other indicators through
2050 for a reference case and for various policy cases and scenarios with
incorporation of technological effects. 4
However, the model did not include cost
structure and required modification to be able to examine the specific conditions of
road transportation in Indonesia. We have therefore extensively modified the model
for use with Indonesian provincial statistical data focusing only on road transport and
have developed a cost prediction module incorporating subsidized fuel costs and
infrastructure costs (Figure A2-1).
Due to the socio-economical and technological differences between the regions
of Indonesia, this study grouped Indonesian provinces into six areas: Sumatra, Java
& Bali, Kalimantan, Sulawesi, Nusa Tenggara, Papua and Maluku. This grouping
also allows finer adjustment of scenarios such as the introduction of new technology
or vehicles only within certain groups.
Figure A2-1: Model Algorithm
Calculation of vehicle ownership was based on vehicle sales obtained from the
4 Center for Transportation and Logistics Studies of Gadjah Mada University, and South South
North Project (2003).
336
Association of Indonesian Automotive Industries (GAIKINDO)5 and the Indonesian
Motorcycle Industries Association (AISI). 6
By correlating historical vehicle
ownership to historical GDP per capita7 for each study area, projections of ownership
are predicted to 2030.
Annual travel distance was obtained from a study conducted by South South
North and the Center for Transportation and Logistics Studies of Gadjah Mada
University. 8
Average annual travel distance was calculated by estimating the number
of the active days of the vehicle type within one year.
The majority of fuel economy data was adopted from an empirical research
which investigated the fuel consumption of motorcycles, passenger cars (gasoline
and diesel), buses and trucks in Indonesia, specifically the cities of Yogyakarta,
Semarang and Surakarta. 9
The data was collected through field study which was
then cross-validated with data from government institutions. Nevertheless, some
data such as fuel-efficiency for CNG-vehicles (bus and truck) and electric-vehicles
are not yet available in Indonesia so that those data are either obtained from
manufacturers or assumed. 10
Data on CO2 emission collected through a literature survey on life-cycle
assessment studies in Indonesia was utilized when available. 11
For cases where
Indonesian data was not available, best estimates using other data was used. 12
A2-3: Scenarios
We have developed five scenario types to examine the effect of the adoption of
alternative fuels and fuel efficient technology on fuel and energy consumption, CO2
emissions and fuel subsidies.
5
Association of Indonesian Automotive Industries (GAIKINDO), (2013a), GAIKINDO,
(2013b); GAIKINDO (2012). 6 Indonesian Motorcycle Industries Association (AISI), (2013).
7 Badan Pusat Statistik (BPS), (2013).
8 Center for Transportation and Logistics Studies of Gadjah Mada University, and South South
North Project (2003) 9 Sandra (2012).
10 Sinaga, et al., (2010).
11 Restianti and Gheewala (2012a).
12 Sevenster and Croezen (2006).
337
Scenario 0: Reference Scenario
In 2008, the Indonesian Ministry of Energy and Mineral Resources mandated
that biofuel content within a biofuel blend reach 5 percent by 2015. Afterwards,
biodiesel is expected to reach 20 percent content by 2025 while ethanol is expected
to reach 5 percent. 13
Due to limited stocks, production of a gasoline-ethanol blend was eventually
suspended in 2009. However, biodiesel production met a good degree of success. In
2012, the biodiesel content was ahead of schedule and able to reach 5 percent with an
increase to 7.5 percent beginning 2013. Therefore as a reference scenario, a constant
biodiesel blend of 7.5 percent and ethanol blend of 0 percent was assumed until 2030.
Scenario 1: Biofuel Scenario
Two biofuel scenarios were added to simulate the effect of increased biofuel
content towards energy consumption, carbon emissions and cost:
Scenario 1A: The current bioethanol blend of zero or E0 is increased gradually to
an ethanol content of 10 percent or E10 by 2020. Likewise the biodiesel content is
increased from the current 7.5 percent or B7.5 to 10 percent or B10 by 2020.
Scenario 1B: Similar to Scenario 1A up to 2020. Afterwards, from 2010, the
bioethanol blend content is increased gradually to 20 percent or E20 by 2030.
Scenario 2: Natural Gas Scenario
In 2010, the Indonesian Ministry of Energy and Mineral Resources issued
Regulation No. 19 Year 2010 concerning the Utilization of Natural Gas for
Transportation Fuel which mandated the increase of natural gas resource allocation
for the transportation sector from 10 percent to 25 percent by 202514
. Two gas
scenarios were created to simulate the effect of CNG adoption:
Scenario 2A: CNG cars, buses and trucks are sold and old gasoline and diesel
cars, buses and trucks are converted in islands which are adjacent or contain gas
producing areas, namely Sumatera, Kalimantan, Sulawesi, Papua and Maluku. New
CNG cars are produced and sold in the Indonesian market beginning 2016 beginning
13
Indonesian Ministry of Energy and Mineral Resources (2008). 14
Indonesian Ministry of Energy and Mineral Resources (2010).
338
at 10 percent of vehicles sold and reaching 100 percent by 2030. CNG conversion of
older gasoline and diesel cars begins in 2015 at 0.2 percent of vehicles present and
reaching 100 percent by 2030. Both are assumed to follow an exponential curve.
This resulted in a final population of CNG passenger cars comprising 31 percent of
the total car population.
Scenario 2B: Similar to Scenario 2A but with the addition of new cars, buses and
trucks sold and old cars, buses and trucks converted to CNG operation in Java and
Bali. In Java and Bali, it is assumed that CNG conversion begins in 2015 at 0.5
percent of old gasoline and diesel vehicles and CNG vehicle sales begins in 2016 at
10 percent of all vehicle sales. Both vehicles sales and conversion are assumed to
reach 100 percent at 2030. The population of CNG passengers was found to reach
99.6 percent of the total car population by 2030.
Scenario 3: Electric vehicles
Scenario 3 introduces the sales of electrical passenger cars. Scenario 3 assumes
sales of electric vehicles into the Indonesian market begin in 2016 with 0.5 percent of
cars sold. In 2030, the ratio of sales of EVs to total passenger cars sales is 100
percent. A fuel economy of 45 km per litre gasoline equivalent was assumed in 2016.
The final population of EV passenger cars by 2030 was 16 percent of the total
passenger car population.
Scenario 4: Hybrid cars
Scenario 4 introduces the sales of hybrid cars. Similar to Scenario 3, sales of
hybrid vehicles into the Indonesian market begin in 2016 with 0.5 percent of cars
sold and reach 100 percent in 2030. Hybrid vehicles were modelled to be able to
adopt to bioethanol and were assumed to have a fuel economy of 14 km per litre
gasoline equivalent in 2016. Similar to Scenario 3, the final population of hybrid
passenger cars by 2030 was 16 percent of the total passenger car population.
Scenario 5: Hybrid, CNG and biofuel Energy mix
A fuel mix was proposed in Scenario 5. This scenario combines the use of
339
hybrid vehicles and CNG vehicles. New hybrid passenger cars begin sale nationwide
at 0.5 percent in 2016 and reaches 45 percent of total passenger cars sales by 2030.
As in Scenario 2B, CNG cars are only sold and converted in Sumatra, Java, Bali,
Kalimantan, Sulawesi, Papua and Maluku due to the presence or close proximity of
natural gas production facilities and distribution infrastructure. New CNG cars begin
sale at 10 percent in 2016 and reach 55 percent by 2030. Conversion of older cars to
CNG operation begins at 0.5 percent of gasoline and diesel vehicle population for
Java and Bali in 2015 and at 0.2 percent for other areas. Conversion reaches 100
percent of non-hybrid vehicle population in 2030. The final result of fuel type
composition for passenger cars was 8 percent hybrid passenger cars and 91.3 percent
CNG cars by 2030.
A2-4. Results and discussion
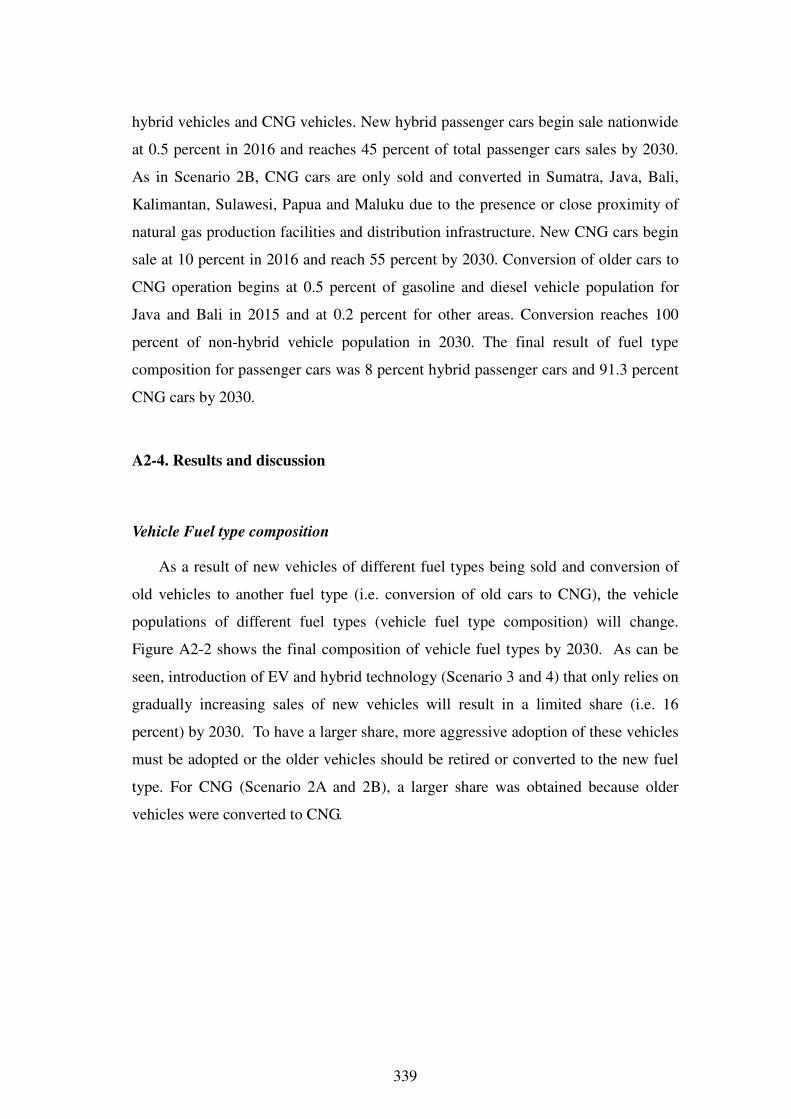
Vehicle Fuel type composition
As a result of new vehicles of different fuel types being sold and conversion of
old vehicles to another fuel type (i.e. conversion of old cars to CNG), the vehicle
populations of different fuel types (vehicle fuel type composition) will change.
Figure A2-2 shows the final composition of vehicle fuel types by 2030. As can be
seen, introduction of EV and hybrid technology (Scenario 3 and 4) that only relies on
gradually increasing sales of new vehicles will result in a limited share (i.e. 16
percent) by 2030. To have a larger share, more aggressive adoption of these vehicles
must be adopted or the older vehicles should be retired or converted to the new fuel
type. For CNG (Scenario 2A and 2B), a larger share was obtained because older
vehicles were converted to CNG.
340
Figure A2-2: Vehicle Composition by Fuel Type in 2030
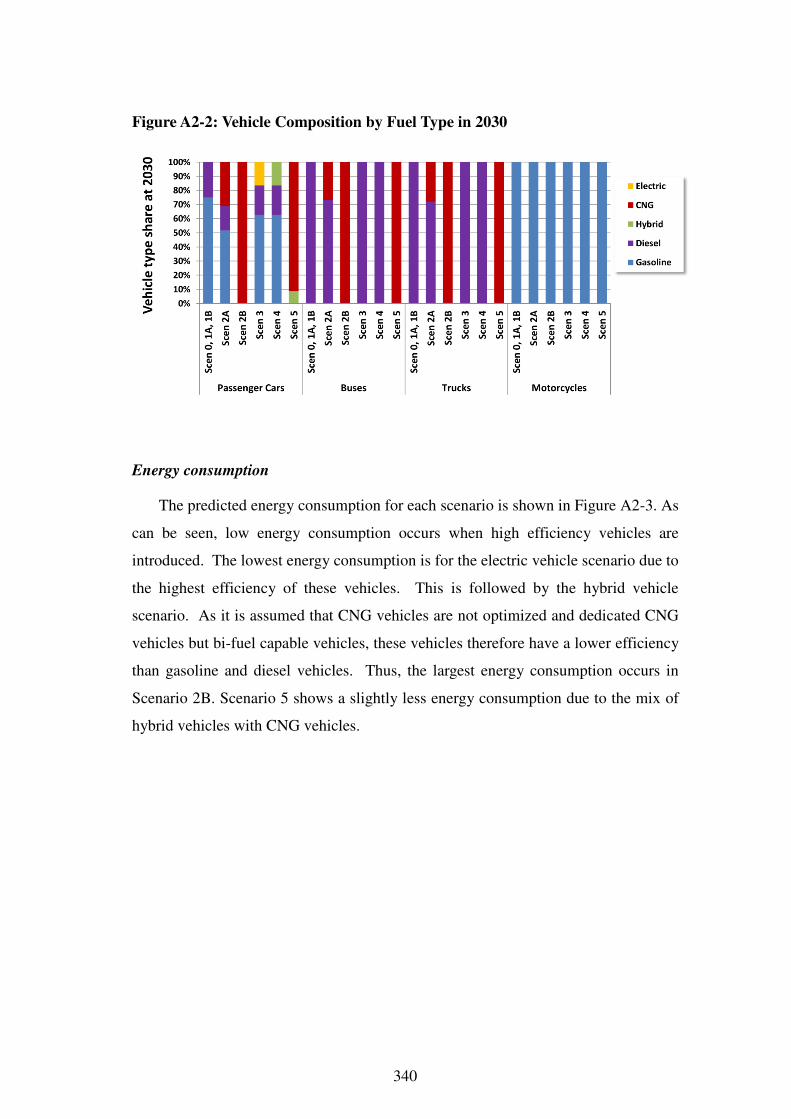
Energy consumption
The predicted energy consumption for each scenario is shown in Figure A2-3. As
can be seen, low energy consumption occurs when high efficiency vehicles are
introduced. The lowest energy consumption is for the electric vehicle scenario due to
the highest efficiency of these vehicles. This is followed by the hybrid vehicle
scenario. As it is assumed that CNG vehicles are not optimized and dedicated CNG
vehicles but bi-fuel capable vehicles, these vehicles therefore have a lower efficiency
than gasoline and diesel vehicles. Thus, the largest energy consumption occurs in
Scenario 2B. Scenario 5 shows a slightly less energy consumption due to the mix of
hybrid vehicles with CNG vehicles.
341
Figure A2-3: Energy Consumption
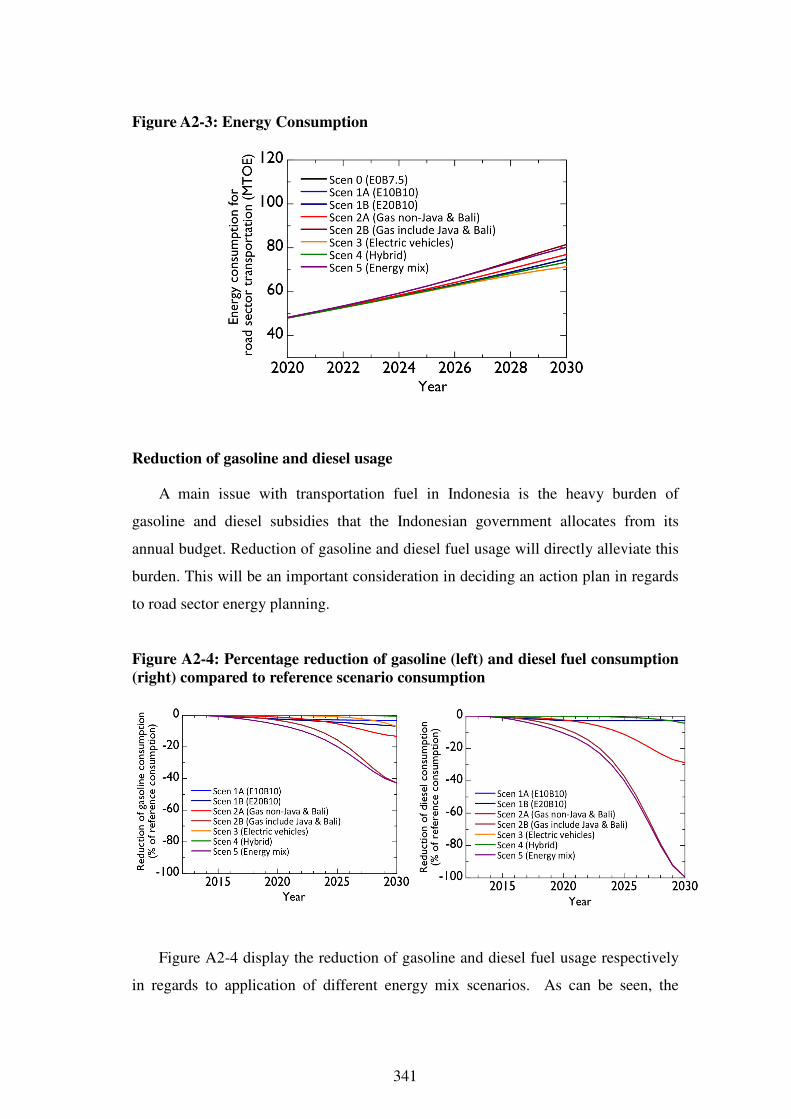
Reduction of gasoline and diesel usage
A main issue with transportation fuel in Indonesia is the heavy burden of
gasoline and diesel subsidies that the Indonesian government allocates from its
annual budget. Reduction of gasoline and diesel fuel usage will directly alleviate this
burden. This will be an important consideration in deciding an action plan in regards
to road sector energy planning.
Figure A2-4: Percentage reduction of gasoline (left) and diesel fuel consumption
(right) compared to reference scenario consumption
Figure A2-4 display the reduction of gasoline and diesel fuel usage respectively
in regards to application of different energy mix scenarios. As can be seen, the
342
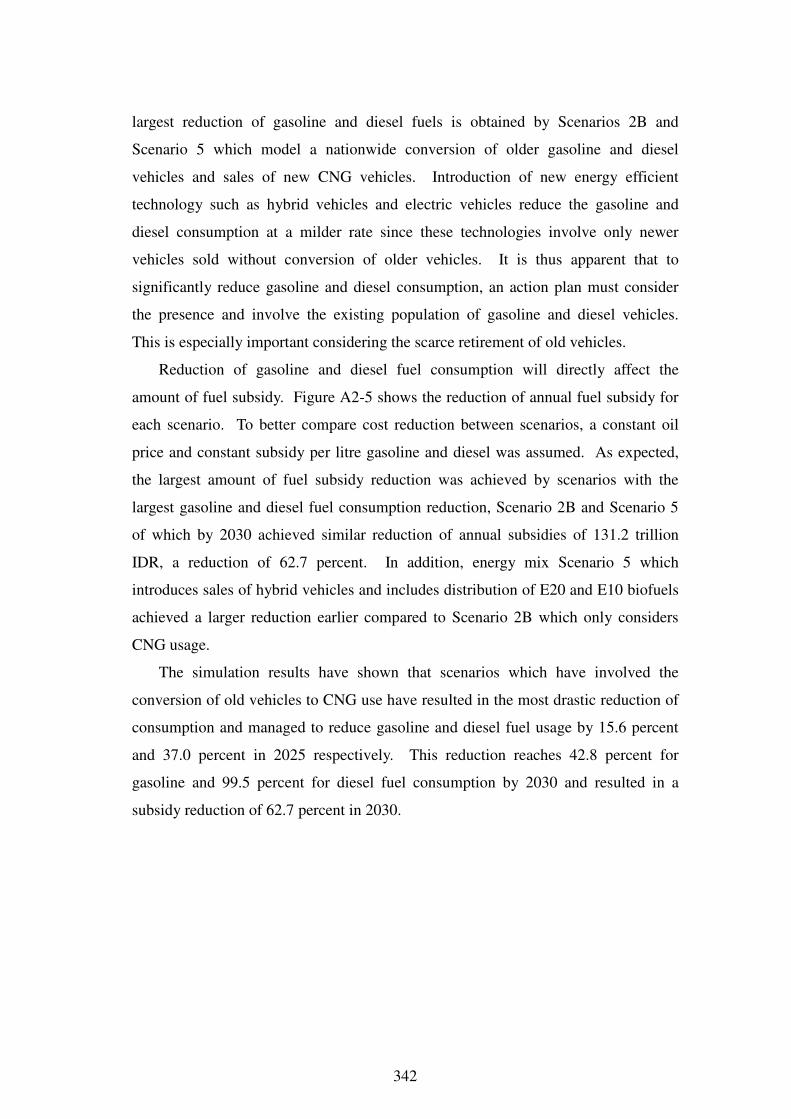
largest reduction of gasoline and diesel fuels is obtained by Scenarios 2B and
Scenario 5 which model a nationwide conversion of older gasoline and diesel
vehicles and sales of new CNG vehicles. Introduction of new energy efficient
technology such as hybrid vehicles and electric vehicles reduce the gasoline and
diesel consumption at a milder rate since these technologies involve only newer
vehicles sold without conversion of older vehicles. It is thus apparent that to
significantly reduce gasoline and diesel consumption, an action plan must consider
the presence and involve the existing population of gasoline and diesel vehicles.
This is especially important considering the scarce retirement of old vehicles.
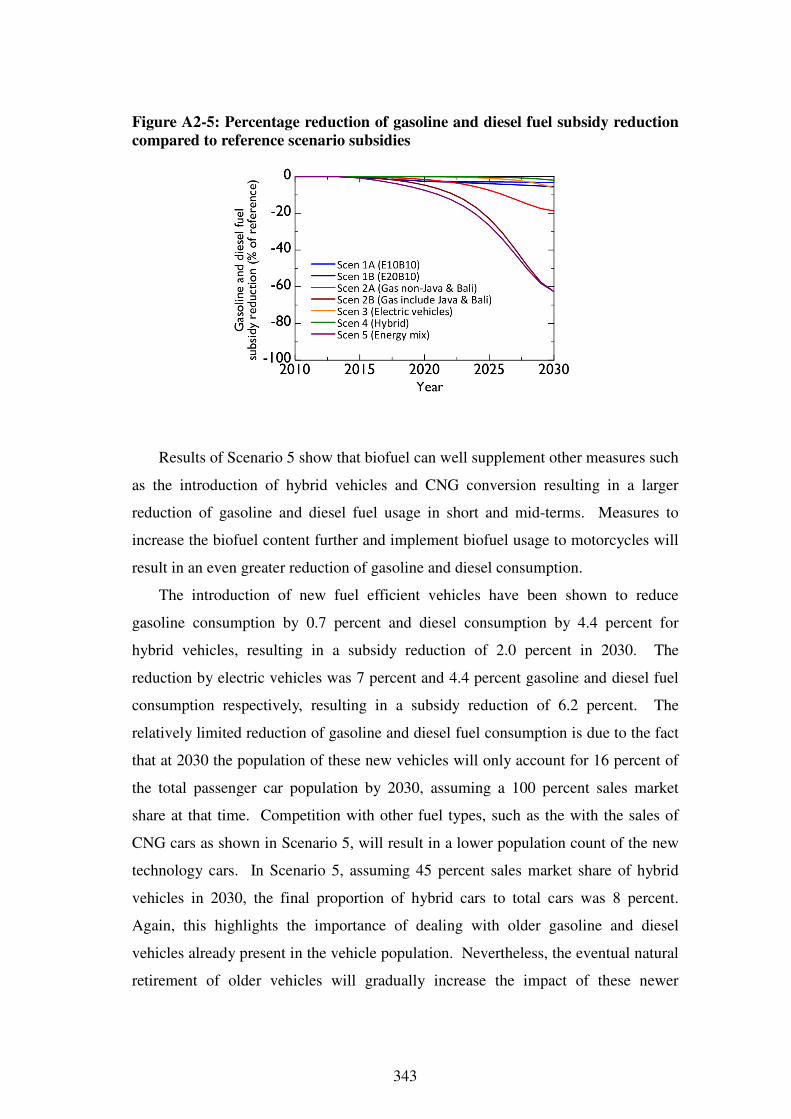
Reduction of gasoline and diesel fuel consumption will directly affect the
amount of fuel subsidy. Figure A2-5 shows the reduction of annual fuel subsidy for
each scenario. To better compare cost reduction between scenarios, a constant oil
price and constant subsidy per litre gasoline and diesel was assumed. As expected,
the largest amount of fuel subsidy reduction was achieved by scenarios with the
largest gasoline and diesel fuel consumption reduction, Scenario 2B and Scenario 5
of which by 2030 achieved similar reduction of annual subsidies of 131.2 trillion
IDR, a reduction of 62.7 percent. In addition, energy mix Scenario 5 which
introduces sales of hybrid vehicles and includes distribution of E20 and E10 biofuels
achieved a larger reduction earlier compared to Scenario 2B which only considers
CNG usage.
The simulation results have shown that scenarios which have involved the
conversion of old vehicles to CNG use have resulted in the most drastic reduction of
consumption and managed to reduce gasoline and diesel fuel usage by 15.6 percent
and 37.0 percent in 2025 respectively. This reduction reaches 42.8 percent for
gasoline and 99.5 percent for diesel fuel consumption by 2030 and resulted in a
subsidy reduction of 62.7 percent in 2030.
343
Figure A2-5: Percentage reduction of gasoline and diesel fuel subsidy reduction
compared to reference scenario subsidies
Results of Scenario 5 show that biofuel can well supplement other measures such
as the introduction of hybrid vehicles and CNG conversion resulting in a larger
reduction of gasoline and diesel fuel usage in short and mid-terms. Measures to
increase the biofuel content further and implement biofuel usage to motorcycles will
result in an even greater reduction of gasoline and diesel consumption.
The introduction of new fuel efficient vehicles have been shown to reduce
gasoline consumption by 0.7 percent and diesel consumption by 4.4 percent for
hybrid vehicles, resulting in a subsidy reduction of 2.0 percent in 2030. The
reduction by electric vehicles was 7 percent and 4.4 percent gasoline and diesel fuel
consumption respectively, resulting in a subsidy reduction of 6.2 percent. The
relatively limited reduction of gasoline and diesel fuel consumption is due to the fact
that at 2030 the population of these new vehicles will only account for 16 percent of
the total passenger car population by 2030, assuming a 100 percent sales market
share at that time. Competition with other fuel types, such as the with the sales of
CNG cars as shown in Scenario 5, will result in a lower population count of the new
technology cars. In Scenario 5, assuming 45 percent sales market share of hybrid
vehicles in 2030, the final proportion of hybrid cars to total cars was 8 percent.
Again, this highlights the importance of dealing with older gasoline and diesel
vehicles already present in the vehicle population. Nevertheless, the eventual natural
retirement of older vehicles will gradually increase the impact of these newer
344
technology hybrid and electric vehicles in the long term and thus should not be
ignored.
Carbon emissions
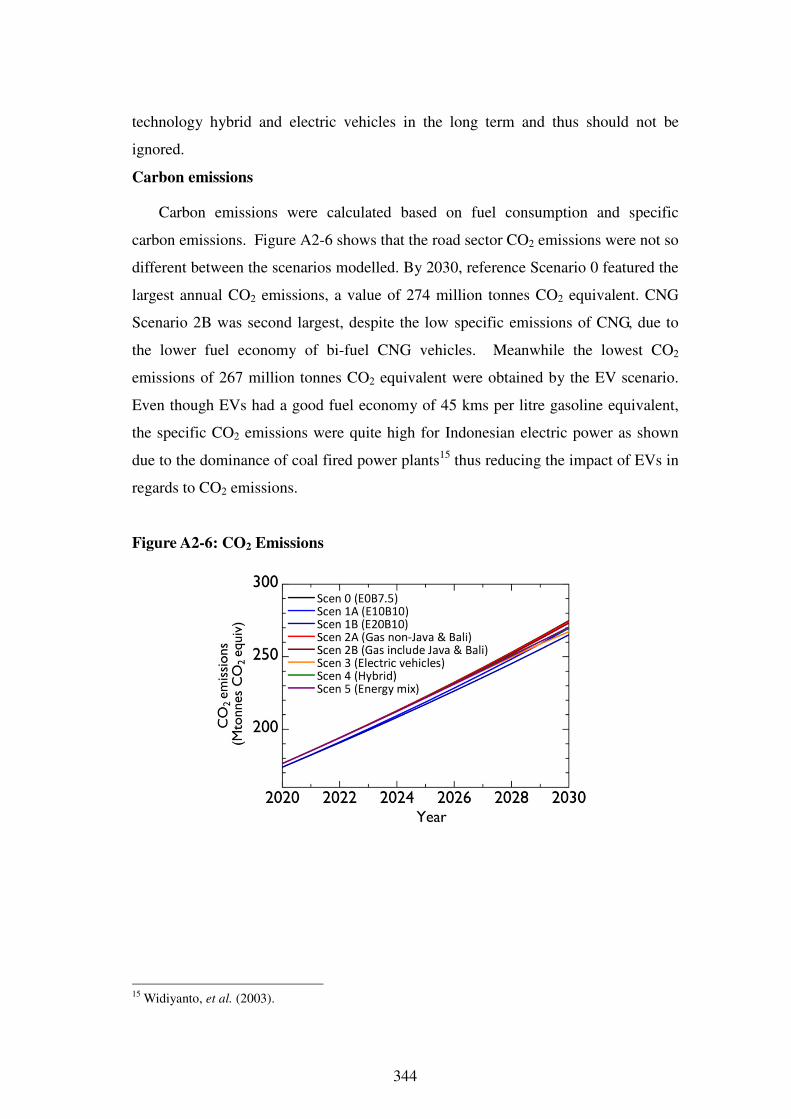
Carbon emissions were calculated based on fuel consumption and specific
carbon emissions. Figure A2-6 shows that the road sector CO2 emissions were not so
different between the scenarios modelled. By 2030, reference Scenario 0 featured the
largest annual CO2 emissions, a value of 274 million tonnes CO2 equivalent. CNG
Scenario 2B was second largest, despite the low specific emissions of CNG, due to
the lower fuel economy of bi-fuel CNG vehicles. Meanwhile the lowest CO2
emissions of 267 million tonnes CO2 equivalent were obtained by the EV scenario.
Even though EVs had a good fuel economy of 45 kms per litre gasoline equivalent,
the specific CO2 emissions were quite high for Indonesian electric power as shown
due to the dominance of coal fired power plants15
thus reducing the impact of EVs in
regards to CO2 emissions.
Figure A2-6: CO2 Emissions
15
Widiyanto, et al. (2003).
345
A2-5: Conclusion
The results have shown that to significantly reduce gasoline and diesel fuel usage
and ultimately reduce fuel subsidies, the population of old gasoline and diesel
vehicles must be put into consideration. The scarce retirement of older vehicles in
Indonesia results in these vehicles still consuming a sizable amount of gasoline and
diesel fuel despite introduction of newer, more efficient and alternative fuel capable
vehicles. This resulted in a somewhat limited impact of introduction of high fuel
economy vehicle like hybrid vehicles and electric vehicles due to the low population
of these vehicles by 2030. If the portion of these high fuel economy vehicles is
increased, either by the reduction of old vehicles or by accelerating the adoption of
high fuel economy vehicles, the impact will be more pronounced.
The largest CO2 emissions was obtained by the reference scenario at 274.8
million tonnes CO2 by 2030, while the least was obtained by Scenario 3 (electric
vehicles) with a value of 267.3 million tonnes CO2 a difference of less than 3 percent
due to the lower population size or due to increase of CO2 by power generation for
the electric vehicles. As such, CO2 emissions were relatively similar between each
scenario.
This conclusion is a result of the calculation under specific conditions. Based on
the results, implementation of a fuel mix policy intended on reducing reliance on
gasoline and diesel fuel consumption should consider the following:
• A plan to reduce the population of old gasoline and diesel vehicles must
be considered, either by adopting a vehicle retirement scheme or by
converting these vehicles to non-gasoline/diesel fuels.
• A recommended course of action is the implementation of a CNG
conversion plan for older gasoline and diesel vehicles. While bi-fuel CNG
vehicles are slightly less efficient, the end result is still only less than 6
percent rise in energy consumption, with the potential benefit of 60
percent reduction in fuel subsidies.
• Further development, production and adoption of biofuel blends with
increasing biofuel content should be conducted in conjunction with other
initiatives such as CNG conversion. In addition to being compatible with
346
a good portion of older vehicles, biofuel adoption will help reduce fuel
subsidies earlier in the short term compared to adoption of CNG, EVs or
hybrid technologies. A policy to mandate biofuel compatibility of
motorcycles will further increase the impact of biofuel adoption.
• For the introduction of new fuel efficient technologies such as hybrid
vehicles and electric vehicles to make a significant impact, the increase of
the population portion of such vehicles must be accelerated, either by a
more aggressive adoption plan or by retirement of older less efficient
vehicles. A more aggressive adoption of new technologies may be
promoted by the government by introducing policies such as subsidies or
reduced taxes for high fuel efficiency vehicles.
References
AISI (2013), Motorcycle Production Wholesales Domestic and Exports. Available at:
http://www.aisi.or.id/statistic/
Badan Pusat Statistik (BPS) (2013), Produk Domestik Regional Bruto Atas Dasar
Harga Konstan 2000 Menurut Provinsi, 2004 – 2011. Available at:
http://www.bps.go.id/
Center for Transportation and Logistics Studies of Gadjah Mada University, and
South South North Project (2003), The Green House Gases Emission
Reduction Program for Urban Buses in Yogyakarta, Yogyakarta, Indonesia.
Fuerte Jr., D. A. (ed.) (2006), APEC Energy Demand and Supply Outlook 2006:
Projections to 2030 Economy Review. Tokyo: Asia Pacific Energy Research
Centre.
GAIKINDO (2012), Domestic Auto Market (Retail) by Provinces 2005-2011. Jakarta,
Indonesia.
GAIKINDO (2013a), Indonesian Motor Vehicle Population (4 W) by Category 2000-
2011. Jakarta, Indonesia.
GAIKINDO (2013b), Indonesia Motor Vehicle Population (4-W) by Category 1972-
1999. Jakarta, Indonesia.
IEEJ (2011) 不透明さを増す国際エネルギー情勢とアジアの将来- 付表.
Available at: http://eneken.ieej.or.jp/data/4131.pdf
Indonesian Ministry of Energy and Mineral Resources (2008), Regulation No. 32
Year 2008 Concerning the Provision, Utilization and Commerce of Biofuel as
347
an alternative fuel.
Indonesian Ministry of Energy and Mineral Resources (2010), Regulation No. 19
Year 2010 Concerning the Utilization of Natural Gas for Transportation Fuel.
Nazir, N., and Setyaningsih, D. (n.d.) ‘Life cycle assessment of biodiesel production
from palm oil and Jatropha oil in Indonesia’, Proc. Biomass-Asia 7th
workshop, Jakarta, pp. 29-30.
PT PLN (2012), Rencana Usaha Penyediaan Tenaga Listrik 2012-2021, PT PLN,
Jakarta, Indonesia.
Restianti, Y. Y., and S. H. Gheewala (2012b), ‘Life cycle assessment of gasoline in
Indonesia’, The International Journal of Life Cycle Assessment, 17(4), pp.
402-408.
Restianti, Y., and S. H. Gheewala (2012a), ‘Environmental and Life Cycle Cost
Assessment of Cassava Ethanol in Indonesia’, Journal of Sustainable Energy
& Environment 3, pp. 1-6.
Sandra, P. A. (2012), Pola konsumsi BBM angkutan jalan raya (Studi kasus: Kota
Yogyakarta, Semarang dan Surakarta, Master's Thesis, Gadjah Mada
University, Yogyakarta, Indonesia.
Sevenster, M. N., and H. J. Croezen (2006), The natural gas chain: Toward a global
life cycle assessment, International Gas Union Delft, CE, Delft.
Sinaga, E., K. Manik, R. Abisena, T. Hutabarat, H. H. Putu, F. Mauludi, A. P. Jaya,
and W. R. Wahyu (2010), Business as usual scenario for the road transport
sector in Indonesia. Sustainable Urban Transport Implementation Project
(SUTIP), GTZ.
Syahrial, E., R. Adam, Suharyati, N. Ajiwihanto, R. R. F Indarwati, F. Kurniawan, A.
Kurniawan, and V. M. Suzanti (2012), 2012 Handbook of Energy and
Economic Statistics of Indonesia, Jakarta: Indonesian Ministry of Energy and
Mineral Resources.
Widiyanto, A., S. Kato, and N. Maruyama (2003), ‘Environmental Impact Analysis
of Indonesian Electric Generation Systems (Development of a Life Cycle
Inventory of Indonesian Electricity)’, JSME International Journal Series B,
46(4), pp. 650-659.
Wirawan, S. S. (2009), The Effect Of Biodiesel Utilization In Transportation Sector
To Pollutant Emission And External Cost: Case Study Jakarta, Doctoral
Dissertation, Institut Pertanian Bogor, Bogor, Indonesia.