Embed Size (px)
Citation preview

1
Annex 1: Methodical Approach to Globalization Literature Review Approach Review of scientific literature and available studies on the main global trends and individual factors affecting forestry in the EU, discussion of major findings in general and in relation to EU forestry. The resulting “Globalization Factors and Trends” should be those most relevant for the forest sector in the EU and its development. As the results of this task set the stage and built an input for a number of follow-up tasks, including a more in-depth discussion of regional effects of globalization, the draft was sent to the Globalization Expert Panel for review and comments. Methodology Review and discuss relevant literature and results of studies of national and international organizations, research institutes, and universities. The work was implemented in three steps: . Interpretation/scoping of “globalization” and database, literature ,and study review based on a literature review, focusing on the economic dimension of “globalization” rather than the wider socio-cultural dimension. The literature review on economic globalization factors (see list of reviewed studies, Part A and B) showed consistently, that the following four factors are considered as the key factors of economic globalization. 1. Foreign direct investment, 2. Economic activity, including employment 3. Trade 4. Technology/know-how A “factor” is understood as an “aspect that contributes to a certain issue in question,” in this case “globalization.” On the basis of this literature review, the initial set of globalization factors originally included “institutional arrangement” was deleted as a globalization factor from the further analysis. The Task 0 output (methodological framework) was adjusted accordingly to allow subsequent consistency in implementation throughout subsequent tasks. For each of these globalization factors, the most frequently discussed and/or measured dimensions were used as further sub-structuring elements. These were called “indicators.”. These indicators, wherever possible measurable and quantifiable, were used as consistent reference within each of the factors in three different sub-sections per factor: 1. Globalization in general 2. Forest-based-industry-specific 3. Forestry-specific Again, on the basis of the literature review, the initial set of globalization factor indicators in the initial output on indicators was adjusted accordingly to allow subsequent consistency in implementation throughout subsequent tasks. The initial output on indicators originally included a range of indicators and excluded other dimensions not originally considered as

2
indicators. In particular, a considerable number of indicators was adjusted to the most appropriate phrasing of the respective indicator content. The secondary data and literature review on “Globalization Factors and Trends” covers scientific literature, particularly journal special issues on globalization (see list of literature), databases and reports on individual globalization indicators, including outlook studies. Literature and studies selected addressed the “Globalization Indicator—Forestry State and Development Indicator Impact Matrix.” This covers the majority of the studies. It has the globalization indicators at its hard, quantitative core, but also extends to more qualitative aspects that are to be covered in descriptive form. Other relevant globalization indicators and dimensions that are not covered by the indicators, particularly international institutional arrangements (e.g., global/multilateral agreements on trade [WTO], forestry certification schemes, and phytosanitary regulations), were not taken into further consideration, as “institutional arrangements” was excluded from the set of globalization factors, following the literature review results (see above). This was subsequently confirmed, as none of the literature on the other economic globalization factors in general or on the forest sector in particular puts explicit emphasis on these. However, some members of the Globalization Expert Panel (see below) and the European Commission felt that these should be covered, even though they do not fall into the direct scope of the study, which is economic globalization. Institutional factors were therefore included in the revision of the first draft report on the globalization literature review. To be consistent, “institutional arrangements” are not discussed as an economic globalization factor (which they are not usually considered to be), but as changes in the context of dimensions (or forces) possibly or actually driving globalization as a whole or one of its main factors. These dimensions (or forces) are methodically mirrored through the PESTE framework: 1. Policy (understood to include institutional arrangement), 2. Economic (covered under economic globalization factors) 3. Social (including socio-demographic) 4. Technology (covered under economic globalization factors) 5. Environment The PESTE framework was also used to cover other “Forestry State and Development Indicators” that characterize status and trends in forestry and their importance to the national economies; but they are not covered by the set of globalization factor indicators as described above. These include energy and environmental issues in particular, as well as policy/institutional change in the context of societal change. 2. The results of the literature review is described according to the structure outlined in step 1 above (i.e., for each globalization factor, the literature review results are presented consistently—as far as possible and where literature is available—according to a set of indicators for each of the three areas: general globalization, forest-based industry, forestry. The description of “Globalization Factors and Trends” covers, as far as the literature is available, presently observed effects, where and how in general are likely to impact on EU forestry overall, trends, and through case studies, where useful or where little hard quantitative data is available on specific important developments. The resulting “Globalization Factors and Trends affecting Forestry in the EU” draft document describes the available literature findings on those factors and trends that are most relevant for

3
the forest sector in the EU and their development. They comprise factors characterized and described by quantitative state and trends as well as qualitative description of common sets of issues and developments. The resulting “Globalization Factors and Trends affecting Forestry in the EU” draft of approximately 15 pages was reviewed by the Globalization Expert Panel, consisting of a total of 14 experts. Of these, seven persons responded. All well-recognized experts worldwide, commended the good quality and well-structured nature of the draft report, particularly given the limited time available. All made excellent suggestions for minor modifications. These mainly were: 1. To discuss the following additional aspects:
• impacts of vertical integration, • global diffusion of common values and standards (see discussion on “institutional
arrangements” above), • environmental issues as drivers of globalization (see discussion on “institutional
arrangements” above) • the increasing role of R&D globalization
2. Comment on assertions made on specific aspects, including • trends in forest-based industry investments (also domestic, in new fields such as bio-
refineries) and innovation competition • drivers for FDI, particularly downward prices for commodity products, but also
increasing consumption in, for example, China • wood-revenue-based financing of European forestry and emerging alternative funding • the simultaneous competitiveness and complementarity of wood use for products and
energy • the issues of carbon- and energy-related developments • expected future trends for mergers and acquisition in forest-based industry • request to add key references to substantiate key findings (experts were provided only
with the 15-page document, not the Annex with references) In addition, a number of specific further literature sources were provided by several experts.

4
Annex 2: Indicators Note: This is a draft set of indicators outlining areas of relevance and interest regarding globalization issues. It is not a set of indicators where data or even information were necessarily expected (often, in fact, it is not). The set is adapted to tasks, as appropriate. A2.1. Forest ownership and management
• Status and trends in forest ownership and management • Status and trends in resource use
(a) forest area available for wood supply (b) balance increment and removals
A2.2. Investment • Status and change in investments in forestry • Status and change in foreign direct investment
A2.3. Economic Activity (value added, growth, employment, profitability) • Status and trends in value added and economic growth
(a) status and change in value added. • Status and change in productivity
(a) status and change in productivity (b) labor productivity per hour worked
• Status and change in employment • Status and change of cost structures
(a) status and change of raw material cost (b) status and change in unit labor cost (c) status and change in energy costs (d) status and change of transport costs
• Status and trends in profitability and price structures (a) status and change in product and service price structures. (b) profitability and return on investment.
A2.4. Technology and Know-How • Status and trends in technology use, by forest ownership size classes
(a) role of ICT in the production process (b) technology vintage
• Human capital investment, by forest ownership size classes (a) categories of labor skills (high, high-intermediate, low labor skill) (b) sector-specific education
• Innovation and research investment , by forest ownership size classes (a) expenditure on innovation and R&D
A2.5. Trade • Import • Export • Trade balance

5
Annex 3: Detailed Results Tables A3.1 Foreign Direct Investment and globalization
A3.1.1. Investment and factors affecting FDI Status and trends Outward FDI
- Over the period 1990–2000, foreign investment grew at a significantly more rapid pace than either international trade or world economic production generally. In 1982 the global total of FDI flows was US$57 billion. By 2000 that number had grown to US$1.271 billion—nearly 20 times the level of two decades earlier (Globalization101). - After World War II and until the early 1990s, the main source of external financing for developing countries was ODA provided by the governments of high-income countries. However, the fast growth of private capital flows to developing countries has overtaken ODA. Today, net private capital flows are a multiple of ODA. The structure of private flows also changed notably, shifting from a predominance of bank loans to FDI and portfolio investment, driven by rapid growth of transnational corporations and encouraged by liberalization of markets and better prospects for economic growth in a number of developing countries. The distribution of FDI among developing countries remains extremely unequal, with over one-third going to just two big countries—China and Brazil (World Bank, 2004). - After a peak recorded in 2000 (€437 billion), EU FDI outflows decreased continuously reaching €115 billion in 2004, 74% lower than in 2000. The FDI intensity of the EU15 followed the boom and bust of the stock market in the period 1995–2005: the direct FDI flow of the EU25 was €430billion in 2005, increasing from €330 billion in 2001, 70% of which went into services. The shares of EU FDI in 2003 were 41% to North America, non-EU Europe 23%, Asia 14%. (EUROSTAT). - China and India have become significant sources of FDI for both developing and developed countries. India’s outward FDI stock grew from $US0.6 billion in 1996 to $US5.1 billion in 2003. China and India now occupy positions 54 and 72, respectively, (out of 132 economies) in terms of outward FDI performance (World Bank, 2007). - Cross-border M&As, especially those involving companies in developed countries, have spurred the recent increases in FDI (UNCTAD, 2006). - FDI is accelerated by technological innovations in communications and data processing
Inward FDI
- Inflows of FDI were substantial in 2005. They rose by 29%—to reach US$916 billion—having already increased by 27% in 2004. South, East, and Southeast Asia are still the main magnets for inflows into developing countries. Inflows to developed countries in 2005 amounted to $US542 billion, an increase of 37% over 2004 while to developing countries they rose to the highest level ever recorded—$US334 billion. In percentage terms, the share of developed countries increased somewhat, to 59% of global inward FDI. There was spectacular increase in investment to Asia (South, East, and Southeast Asia), as well as to Central and Eastern Europe, modest increases to Japan and the EU, and relatively smaller gains to all other areas of the world (UNCTAD 2006) - Services gained the most from the surge of FDI, particularly finance, telecommunications, and real estate (UNCTAD 2006) - The major destination of EU FDI flows among the Candidate Countries in 2004 was Romania with €2.6 billion and Turkey in 2003 with €1.1 billion (31% of Candidate Countries’ total). Regarding the new member states, the first place was held by Hungary with €6.7 billion (63% of new member states’ total), followed by Poland with €4.4 billion (42% of new member states’ total).
General investment
- The global financial system is likely to change dramatically over the course of the next 25 years, as technological innovations and even greater integration of markets expand the reach of global financial intermediaries, with private equity and related investing having a time horizon of 5 to 10 years. New financial instruments with broad market access and fewer transaction costs are likely (UNCTAD 2005).

6
Factors Additional drivers and issues Policy - The practice of granting certain kinds of tax and other regulatory exemptions to international
investors through Export Processing Zones (EPZs) as well as regulatory exemptions to international investors in financial markets. - Continuing liberalization of exchange controls and market access and the attempt to draft a Multilateral Agreement on Investment (MAI), and its failure. - Further restructuring of public enterprises (via total or partial privatization) and foreign investment. - Liberalization continues, but some protectionist tendencies are also emerging (UNCTAD 2006).
Social - Demographic shifts and consumption/investment power shifts, including investment and spending patterns according to age.
Environ-ment
- Risk, investment, and climate change as increasingly visible issues.
A3.1.2. Investment, globalization and forest-based industry Indicator Status and trends FDI (outward and inward)
- The forest sector worldwide went through a strong restructuring process during the 1990s, influenced basically by globalization. The restructuring process was based mainly on the consolidation process through M&A operations. Despite the relative importance of DI in the forest sector, the data available on such investments are limited. An IMF article has made reference to the role of private investments in the forest sector in comparison with other sources. The article pointed out that the total amount invested in 1993 in the forest sector worldwide (US$21.5 billion) was concentrated in private (46.5%) and domestic public investments (46.5%) and that ODA was responsible for only 7% of the total (Tomaselli, 2006). - According to UNCTAD data, the worldwide FDI in agriculture, forestry, hunting, and fishing activities combined reached US$1.8 billion in 2001–2003, representing around 3.5% of the total FDI worldwide in the primary sector. The worldwide entry of FDI into the forest industry (wood and wood products manufacturing) reached US$2.3 billion in 2001–2003, which represented 4.5% of the FDI in the secondary sector and only 1.4% (2001–2003) of the total global FDI (primary, secondary, and tertiary sectors). Over the years DIs have generally contributed more than 90% of the total value invested, amounting to around US$60 billion per year (Tomaselli, 2006). - Total direct private investment (in the forest sector) rose from US$30,000 million in 1992 to US$118,000 million in 1998 and then went down to an estimated US$98,000 million in 1999. More significant is the fact that in 1992 private direct investment accounted for only 19% of total net resource flows from OECD/DAC countries and multilaterals, while it had reached more than 50% by 1999. Crossley et al. (1996), as cited by Greig-Gran, suggest that overall capital flows to the forest-based sector in developing countries is in the billions of dollars. (Gregersen and Contreras, 2001). - Private FDI in the forest sector considerably exceeds public official development assistance (ODA). In recent years, forest financing has been characterized by an increase in FDI in developing countries to approximately US$8–10 billion a year, and a decline in ODA to about US$1.75 billion a year (PROFOR 2003). - Most of the future investments in the forest industry will continue to be concentrated in the pulp and paper segment. To a lesser extent, but also importantly, investments will continue to flow to the reconstituted wood panel segment, mainly for MDF and OSB production. (Tomaselli, 2006). - DI in the pulp and paper segment in the short and medium run will be driven to maintain the growth in production observed in the past few years. DI will be concentrated in countries with a low cost of wooden raw material and high market potential, for instance, Brazil, China, Russia, and some Eastern European countries. The perspective is that FDI flows predominantly from the USA toward Latin America and from Western Europe toward Eastern Europe and Russia. The expectation is that the international trade may grow strongly in the coming years for forest product exports from Eastern European countries, Russia, and Brazil (Tomaselli, 2006). - M&A in the forest industry will likely continue in the future, but at a slower pace than observed in the past, given the changes in the world economy and competition regulations. The

7
latter will in the short term be a strong barrier for the M&A. As for newsprint, for instance, the top five world producers already account for 85% of the production capacity in Western Europe. In the case of magazine (couche) paper, the top two world producers control 50% of the European market. Within this context, it is important to consider that regulation of competition will certainly call the attention of European companies to investing outside the region, primarily in Asia and in South America (IADB, 2004). - In the United States, the industry has been divesting itself of its ownership of forestlands. In the past 25 years, industry lands have been reduced by 50%, with nearly half of that decline in the past decade. Simultaneously, the industry has increased its ownership of offshore forestlands (Bael and Sedjo, 2006). - In Russia, current investments are largely focused on the development of basic production capacity, such as production of logs and timber for export. Longer-term development is likely to turn to production of value-added products. A current effort to establish large-scale wood processing facilities along the Russian–Chinese border provides an indication of what the future may hold (Taylor, 2004). - Other countries that are currently building capacity in the forestry and wood products sector include several countries in the Asia and the Pacific region, a number of countries in Eastern Europe, and several countries in Latin America, most notably Brazil and Chile. The key producing countries in the southern hemisphere (Argentina, Australia, Brazil, Chile, Indonesia, Malaysia, New Zealand, and South Africa) have slowly but steadily raised their contribution to global wood products exports over the past four decades, from under 6% to more than 16% (Whiteman, 2003). In tropical countries there is a clear trend toward development of capacity for production of primary processed and secondary processed products, with most of the output intended for export markets (Johnson, Adams and Miyake, 2003; Bowyer 2004). - In the EU net flow in FDI was negative in 2003–2004, with about €1 billion inward investment per year in wood, publishing, and printing (EUROSTAT). - FDI in pulp and paper products tends to be around 10 times higher than FDI in other woodworking industries (e.g., US FDI [year 2000] in wood products is US$1.5 billion compared to US$15 billion in paper products). - In 2004, 68.2% of the investment in Stora Enso was of a transnational nature (US$15,467 million in foreign assets). The company is number 85 in the world’s top 100 non-financial TNCs, ranked by foreign assets (UNCTAD, 2006). - Globalization has also taken many companies in the forest cluster overseas. They have internationalized at least as rapidly as companies in the paper field. Outward (outside EU) investments are expected to be in the billions of euros. For example, Finnish forest companies had already invested nearly €2 billion in China by 2005 (FFI, 2005). - Inward investment particularly in United Kingdom publishing and printing in 2003–2004 (EUROSTAT). Metso, a Finnish supplier of paper machines, says that over one-third of its present order backlog is from China (FFI, 2005). - European forest-based-industry investments have been made and the capacity is expected to increase by some 10% for the pulp and paper industry, by some 13% for the panels industry, and by nearly 15% for energy plants within the next five years, representing an additional need for 30 million m3 of wood in that period. One reason for this growing capacity is the expected increase in the consumption of paper and board and other wood-based products, mainly because of opportunities offered by the accession of Central and Eastern European countries to the EU. Apart from this result an extra amount of some 80 millions m3/year is estimated to be needed to meet EU commitments in the field of renewable energy sources by 2030. (CEPI study, Galembert, Brasov 2003).
Domestic investment
- Numbers on domestic direct private investment in forestry and related forest-based activities are unavailable on an aggregate basis. Grieg-Gran et al. (1998) indicate the same point related to portfolio investment in forest-based activities (Gregersen and Contreras, 2001). - According to estimates the amount of DI (direct investment) in the forest sector on a global scale exceeds US$60 billion a year, which represents about 1% of total DI in the world. In the forest sector, following the general trend, DDI (domestic direct investment) has a predominant share (Tomaselli, 2006).
Factors Drivers and issues Policy - EU integration is driving investment in new accession states.
- FDI into Russia is being held back because of ambiguous legal systems; difficulties in negotiating with local authorities; unfair tax enforcement; and general political instability as the main impediments to FDI in the sector. The main limitation so far is represented by limited

8
investment. Total investment in Russian FDI is less than half that in Finland, and only a negligible part of this is represented by foreign investment, as foreign investors remain wary of the overall business climate of the country and its geopolitical risk. This could change. - Effects of energy strategy and bio-energy directive on investment.
Social - Effects of demographic shifts on consumption. Environ-ment
- The Global Forest Vision 2050 (PROFOR, 2004) study predicts that by the middle of the 21st century, 40% of global forests will be managed primarily for the protection of biodiversity and other forest environmental services. - Effects on restrictions to resource access (Natura), EFSOS etc. - Effects of climate risk assessments in investment decisions.
A3.1.3. Investment and forestry A3.1.3.1. Direct and indirect through the forest-based industry
Indicator Status and trends Outward and inward FDI
- The emergence of regions with large forest plantations with the availability of fast-growing, low-cost raw materials has attracted capital investments and promoted the development and expansion of a forest industry. New important players in wood products manufacturing and consumption include China, other Asian countries, Russian Federation, Eastern European countries, and some Latin American countries (Tomaselli, 2006). - Considering economic profit and lack of proper incentives, under the given circumstances, the response to investing in SFM has been worse than investing in other land uses. Some trends in development financing suggest that SFM faces a change in the financial environment but, unfortunately, nothing indicates that official flows would reach the required levels in the short or medium term (Tomaselli, 2006). - Under current conditions, “mainstream” international financial forest investors are not even close to considering investments in natural forests in poor countries. There were only three significant new international investments in sustainable management of natural tropical forests: the Precious Woods investment in the Amazon, the GMO investment in Gethal Plywood in the Amazon, and the Candlewood Timber Group investment in Northwest Argentina. There has also been a major initiative for a fund and a major investment in the temperate Notofagus forests of Southern Chile and Argentina. The largest and most important initiative to date is the Precious Woods Company, whose biological assets in Costa Rica are valued at US$29 million while those of Brazil are valued at US$12.5 million (2002 data) (Schmidt, 2003). - DI concentrates mostly in developed countries and on forest plantations and related downstream industrial processing and trade projects. This has resulted from the nature of the investment projects with their focus on economic returns. Of the total invested, around 30% is driven toward SFM (forestry) and the remaining 70% to forest-based industries and trade (Tomaselli, 2006). - FDIs concentrate on the improvement of the economic return of transnational corporations, mostly from the pulp and paper segments, and in M&A. Trends in the latter have been on investments in the southern hemisphere (e.g., Brazil, Uruguay, Chile, New Zealand). Information on the percentage of FDI actually applied in SFM is scarce (Tomaselli, 2006). - In the past few years, forestlands and especially forest plantations have been the main target for FDI. Within such a context, it is important to consider the role of TIMO (Timberland Investment Management Organisations), which have been outstanding in terms of DI, both as DDI, or FDI (Tomaselli, 2006). - There has been very rapid and continuous growth in investment in timberland from financial sources in the USA, growing from almost nothing to timberland assets valued at US$11 billion by 2002 over the last 15 years. Investments occur in both plantations and natural forests in the USA. The ultimate sources of most of this capital are large pension funds and endowments. The motivation is financial: to improve the risk/return profile of a portfolio. There are two major forestry-related shifts associated with this investment. First, large tracts of forest land in North America are being transferred from timber products companies to financial investors. Second, fast-growing plantations in six countries in the southern hemisphere are expanding rapidly and providing supply for the growth in global pulp consumption. It is reasonable to assume that this kind of financial investment could spread

9
globally. From 1960 to 2000 timberland investments produced an annual return of 13.8%. The S&P 500 Index for equities (US and multi-national) for the same period was 11.6%. During the 20th century southern and northwestern United States softwood stumpage prices increased at about the same rate as the S&P 500 (Schmid, 2003). - Forest assets usually have value added lower than in the forest industry. As previously mentioned, FDI in forest assets have been mainly directed toward developing countries. In this case, some Asian and Latin American countries have been a target of FDI. In Indonesia, for instance, the Swedish-Finn Stora Enso Oy invested around US$100 million in fast-growing acacia plantations. In Brazil and Uruguay, heavy investments in eucalyptus and pine plantations have been under way or announced, in several cases by some global private companies such as International Paper and Stora Enso (in Brazil) and Botnia and Weyerhäuser (in Uruguay). Moreover, it is important to single out the FDIs being made in large-scale fast-growing forest plantations through TIMOs in North and South America, some European countries, and Oceania particularly: in the USA, Canada, New Zealand, Argentina, Brazil, Chile, and Uruguay, (IADB, 2004). - The total investments in the forest sector are expected to continue at the same level observed in the recent past. DI (private sector, DDI, and FDI) will continue to be responsible for the largest share (about 90%), and ODA will probably have its importance gradually reduced. Innovative financing approaches may become a focus of investments and contribute to filling in the gap left by the reduction on ODA SFM funding (Tomaselli, 2006). - DI in the forest sector will likely maintain its current level of investment but will probably be redirected toward southern hemisphere countries, given their comparative advantages (e.g., high forest productivity, low labor costs, available resources, others). The new class of forest assets (timberlands) will continue to gain importance, and TIMOs will increase their role in developed and developing countries. TIMOs will be mainly concentrated in forest plantations and will be the predominant form of FDI from the USA (and a few other developed countries) toward Latin America (Argentina, Brazil, and Chile) and Asia/Oceania (New Zealand, Australia, and China). Investments by TIMOs in most cases do not represent, in principle, investments in forest base expansions, but rather the control of already existing forest resources. In view of the reduction in investment options, TIMOs may anyway be driven to greenfield forest projects, therefore contributing to expanding forested areas (primarily fast-growing plantations) (Tomaselli, 2006).
Effects of domestic investment on forestry in the EU
- There will be further pressure on restructuring of public enterprises (via total or partial privatization) and access to foreign investment. - Decreased demand is expected for raw material for respective industries as pulp and paper investments in production facilities and tree plantations. - There will be pressure on prices of raw material from globalized industries, as business development will be guided by cheap or fast-growing wood resources and rapidly growing paper markets.
A3.2. Economy – A globalizing economy
A3.2.1. General economic activity A3.2.1.1. Value added, productivity, profitability
Indicator Status and trends Value added
- The size of the global economy is set to double between 2005 and 2030, in real terms, while developing countries’ aggregate output would triple, raising their share in the total from 23 to 33% (at constant market prices) (World Bank, 2007). - Industry value added is around 28% of GDP (World Bank Development Indicators).
Industry structure
- According to estimates, transnational companies (TNCs) now comprise some 77,000 parent companies with over 770,000 foreign affiliates. In 2005 these foreign affiliates generated an estimated US$4.5 trillion in value added, employed some 62 million workers, and exported goods and services valued at more than US$4 trillion. The TNC universe continues to be dominated by firms from the Triad—the EU, Japan, and the United States—home to 85 of the world’s top 100 TNCs in 2004 (UNCTAD, 2006).
Production - Increasingly global sourcing of resources (material, energy, skills, and services). Increasingly global sourcing of low to high services due to falling telecommunication costs and greater

10
openness to FDI enable different parts of the services value chain to be performed in different locations around the globe, increasing service competition. While absolute numbers to date are not large, growth rates have been high and global sourcing of services is expected to grow by 30% per year over 2003–2008 (World Bank, 2007). - Increasingly, interdependency and global competition resulting in business model changes and changes in system of production: core-competency specialization in differentiated products with an increasingly large technological content, cooperation agreements, and networks/clusters to generate synergy. - Increasing innovation competition, as a key source of variations in productivity and economic growth between countries—innovation competition drives the market even more than price competition but innovation moves around the world and its pace is quickening. Fear of failure even more than hope of profit drives the constant striving for innovation. This is an inherent feature of competitive market systems (a “hard-wired” feature of competitive capitalism). - Realization that it is not about entire “sectors” of an economy prospering or being out-competed and whole classes of workers being affected (blue collar workers), but rather individual tasks. International competition plays out not just at the industry or even the firm level, but right down to the level of individual tasks—assembly, packaging, data entry—that cut across whole sectors of the economy.
Productivity - Over the past decade, labor productivity in the world increased by almost 11%. This was mainly driven by the impressive growth in labor productivity in East Asia (75% between 1993 and 2003), but also in South Asia and Southeast Asia, which have experienced considerable increases in their labor productivity levels (37.9% and 21.6%, respectively). Labor productivity growth in the industrialized economies also surpassed world productivity growth with an increase of 14.9%. The transition economies have experienced impressive labor productivity growth rates since 1999 and have thereby contributed to the world’s recent growth in productivity. Over the past ten-year period labor productivity grew by 25.4% in that region. (ILO, 2005) - Higher incomes are produced in the long run primarily through productivity growth rather than factor accumulation. With declining labor forces in some countries and declining labor force growth in all, productivity will play a more prominent role in maintaining economic growth over the next 25 years (World Bank, 2007). - Increasing productivity pressure spurred by open markets and trade,. very rapid total factor productivity (TFP) growth in the 1960s, followed by a decade of stagnation coinciding with the energy crisis of the 1970s, recovery to an estimated rate of 0.8% per year in the 1980s and 1990s, and an acceleration in the 2000s. There have been large variations across regions and time (World Bank, 2007). - The struggle regarding labor cost competition will prevail in the coming years. The strategies most widely used are mainly reactive (i.e., cost reduction through automation and enhanced labor productivity). The new member states will, in the very near future, exploit their existing cost advantage but will lose it faster than competitors outside Europe. Without their own innovation capacities for absorption and enhancement, this foreign direct investment will just pass through these member states in a decade. In any case, outside and within Europe labor-cost competition is characterized by job losses in manufacturing (FHI, 2005).
Factors Additional drivers and issues Policy - Expected continuing removal of obstacles to market access.
- Regulations creating a demand pull for eco-sustainable manufacturing based on new products, new materials, competition with energy, and, last but not least, advanced product service systems (FHI, 2005).
Social - Effects of demographic shifts on consumption. Environ-ment
- Energy scarcity and energy risk as issues. - Climate risk as production/location risk.

11
A3.2.1.2. Economic activity, globalization, and forest-based industry
Indicator Status and trends Value-added and economic growth
- Total gross value added in the (formal) forest sector has not changed much during the 1990s, with an average value of US$342 billion per year (in real terms) and annual figures within +/- 5% of this average. In 2000 total gross value added in the forest sector amounted to US$354 billion. Among the three subsectors, the pulp and paper industry makes the largest contribution to GDP, accounting for about half of the total gross value added in the forestry sector. The wood industry is the next largest contributor, with a 30% share of the total, while forestry activities account for the remaining 20%. This distribution of the value added across subsectors remained stable in the 1990s (FAO, 2004). - The forest-based industries account for about 8% of the total value added in the manufacturing industries in the EU. The pulp and paper industry together with the paper converting industry has a value added of about €50 billion per year, while the value added in the printing industry is about €45 billion and about €30 billion in the woodworking industry (EU comm. consult., 2006). - Value added per unit of output has generally increased or remained about the same in the forestry and wood industry subsectors, but has declined in the pulp and paper industry (because of falling real prices). The major exceptions to this are Western Europe and the developed Asia–Pacific regions, where value added per unit of output has declined in the forestry and wood industry subsectors, because of increased competition from neighboring regions (FAO, 2004). - During the last decade, the contribution of the forestry sector to GDP has declined from just under 1.6% in 1990 to just over 1.2% in 2000. This decline has occurred because the global economy has expanded (i.e., global GDP has increased by 30% over the last decade) while value added in the forestry sector has not increased at all. At the regional level, most regions display the same downward trend, except Eastern Europe and the Latin America and the Caribbean region (FAO, 2004). - The wood products industry is currently moving increasingly toward niche markets and value-oriented growth instead of relying on volume-oriented growth and low-cost strategies (EU comm., 2006).
Production economic growth
- With some exceptions, the trend in consumption over 1961–2000 is upwards for all regions and wood product categories. The main exceptions are for roundwood and sawnwood because of reduced consumption in both Japan and the former USSR (FAO, 2004). - World production of processed wood products has been increasing since the 1960s for each of the four main product categories: sawnwood, pulp, paper and panels, with paper and panels showing the highest rates of growth. Sawnwood production has been more cyclical, such that current production levels are only slightly higher than at the beginning of the 1980s (FAO, 2004a). - Increasing population, greater urbanization, and rising incomes will result in continued strong growth in global consumption of most products. It is anticipated that consumption will grow most rapidly in developing countries where many countries may move from being net exporters to net importers in some forest product categories (FAO, 2004). - Softwood sawnwood production in Europe is expected to continue to increase reaching nearly 105 million m3 in 2010. However, overall annual growth is estimated to be slower than that seen during the last decade because of restricted consumption growth in Western Europe and key overseas markets. Overall consumption is expected to increase by approximately 7 million m3 by 2010. Hardwood sawnwood production is expected to increase moderately until 2010 reaching close to 15 million m3. The softwood sawnwood industry is characterized by an increasingly consolidating industry, where the top ten producers increased their share of production from nearly 15% in 1995 to over 20% in 2002 (JPC, 2004). - Plywood production in Europe is expected to experience only a slight decline. Overall consumption is predicted to decline slightly as OSB continues to take market shares. MDF production in Europe is expected to grow significantly to 2005 and 2010 (JPC, 2004). - The production of wooden furniture is expected to increase to around €60 billion by 2010 from the current €54 billion. The growth in Western Europe is predicted to be moderate whereas Eastern Europe is expected to face strong development (JPC, 2004). - The demand for wood fiber is increasing, with industry alone expected to need 1.9 billion m3 per year by 2015. Demand for paper-making fiber is projected to increase by 126 million tons,

12
with recovered paper expected to meet approximately 70% of that demand. Recovered paper supply is tight, raising the demand for hardwood (PROFOR, 2004). - The main market for the forest industry is still Europe, and is likely to remain so (high “self-sufficiency,” high share of value-added production in Europe. - Structure of industry, particularly the share of micro enterprises and SMEs will likely follow the trend of larger companies, internationalization being an increasingly attractive option for all size classes. -Increasing costs for wood raw material and energy in the EU would enhance the advantage of locating additional production to third countries rather than in the EU itself. In particular, pulp production can achieve substantial relative cost advantages with production localized in tropical and subtropical areas. The EU industry would also have to consider the possibility of increasing competition from Russia which has vast forest resources. For the printing industry, there are also signs that globally integrated printing and publishing markets are being created, underpinned by technological change (EU comm., 2006). - There is a very interesting situation in Eastern Europe that has arisen because of the profound social, political, and economic changes that have taken place there during the last decade. Forestry sector employment has fallen but is still relatively high given the overall size of the forestry sector in this region. Exports are significant and have increased dramatically over the last decade. The main problem in this region is that the level of value added in the sector is comparatively low and has fallen significantly over the last decade (although it has started to rise again in recent years). A comparison of the figures for employment, value added, and trade suggest that there is substantial potential for development of the forestry sector in this region. However, there is also a significant need for investment in new technology, improved marketing, and an upgrading of human resources. The challenge for policymakers and the forest industry in this region will be to assess whether to follow the development model of the developed regions (i.e., substituting capital for labor) or to pursue expansion of the sector on all fronts (FAO, 2004).
Productivity - In particular, labor productivity in the pulp and paper industry has increased significantly over the last decade, perhaps because of increases in the scale of operations. The one exception to these general trends is Eastern Europe, where labor productivity has fallen in the forestry and wood industry subsectors. This follows from the significant fall in production in this region over the last decade, which has not been matched by the fall in employment numbers (FAO, 2004). - Productivity increases in the wood industries are -3 to 6 and 3 %/worker/year. In the pulp and paper industry they are 1 to 6 and 4%/worker/year. High rates of increase have been sustained over rather long periods of time in some countries. This is expected to continue (UNECE/ILO, 2003).
Industry structure change
- Wood products manufacturing activity is beginning to shift from developed to developing regions. At the same time, industrial wood products consumption is growing in the developing regions. In view of the many factors underlying these changes, future wood products production and consumption patterns are likely to be driven much more significantly by developments in China, elsewhere in the Asia and the Pacific region, Latin America, South Africa, the Russian Federation, and Eastern Europe than by industrial growth in countries long recognized as the most economically developed. Several of the largest emerging global economies, most notably China, appear to have targeted this sector as a focus of employment and industrial growth. Other regions have moved aggressively to create plantations of fast-growing trees and to position themselves for future forest-sector development (Bowyer, 2004). - The developed countries will continue to maintain market share through attention to technology and product design, but it is expected that the burgeoning technical capacity in developing nations, coupled with low wages, ample natural resources, and policies directed toward value-adding processing will continue to drive the shift toward exports in processed and SPWPs from developing nations. Developing countries such as Argentina, Brazil, Chile, China, Indonesia, and South Africa can be expected to become increasingly important world producers (FAO, 2004a). - The reemergence of the Russian forest sector will add substantial volumes of wood to the global supply. With more than 50% of world softwood resources and hardwood forests that cover a slightly larger area than the hardwood forests of the United States, the Russian Federation has the potential to provide very large new supplies of wood and wood products to world markets. The Russian government has recently estimated that its potential for annual production of timber is 559 million m3 (Benin, 2004). Given the Russian harvest levels of

13
recent years (172 million m3in 2002 [Ekström, 2003]), over two-thirds of the potential Russian harvest represents new supplies for future export and wood products manufacturing (Bowyer, 2004). - The influence of the rich softwood log supplies from Russia is likely to be felt in several ways: (i) The Russian sawmilling and plywood industry keeps expanding. (ii) The new Russian sawmills and plywood mills are built to international standards, and have the additional benefit of inexpensive wood and labor costs (and possibly low energy costs, too). (iii) There will be plenty of FDI in this sector in Russia, as Western industry takes advantage of the favorable conditions. (iv) An oversupply of logs will remain, which can to some extent be exported to European markets (Indufor Oy, 2004). - China: One of the industries singled out for attention by Chinese planners is the wood products industry and the hardwood products segment, in particular (furniture, moldings, flooring, kitchen cabinet components, and paper and fiber products). As China has relatively little forest cover and much of it is off limits to harvesting, the country has turned to massive importation of both hardwood and softwood logs and timber, as well as waste paper to supply the growing wood products industry. Chinese waste-paper imports have increased by an estimated 19 to 34% over the past three years (Fales, 2003). The upward trend of imports is expected to continue. Other countries are losing market share to Chinese manufactured wood products and are likely to continue to do so. For instance, partly as a result of a 2,366% increase in the value of Chinese furniture exports to the United States from 1993 to 2003, hardwood timber consumption by the United States furniture industry has been reduced by over 60% in just the past five years (Meyer, 2004) (Bowyer 2004). - China: From a total output value of US$157 million in 1978, Chinese furniture production expanded to US$16.9 billion in 2001 involving 50,000 enterprises and nearly 5 million employees (FAO, 2004). - Overall, the woodworking industries present a more fragmented industry structure and smaller corporate entities than is found in key competing materials industries, such as steel and cement. There are significant variations in the level of secondary wood product industry fragmentation and consolidation among different European countries. Although the majority of the secondary processing industries in Europe consist of a large number of SMEs, there are a growing number of large companies in the joinery, building, and construction components, as well as parquet industries that are increasingly dominating national market but are also gaining ground at the pan-European level (JPC, 2004). - The Scandinavian sawmill industry will face increasing difficulties in domestic log procurement, resulting in stagnating output, whereas producers in the British Isles (low capacity utilization) as well as in Eastern and southern Europe (greenfield investments) are expected to have an increasingly significant role in European supply. Further capacity increases are expected in Eastern Europe partly resulting from wood raw-material sourcing by large integrated forest companies in the Nordic countries and also from domestic industries exploiting the production cost advantages. However, tightening raw material supply in some regions (e.g., in the Baltic countries), will drive the expansion to Central and Southeastern Europe. The increasing share of capacity under Western ownership drives the shift toward further processing and consequently enhances the (price and) export outlook/opportunities. The leading supply countries, Sweden, Finland, and Austria, are expected to retain their roles as the major net exporters in Western Europe. Hardwood sawnwood production is expected to shift from west to east following the gradual move of the secondary processing industry which is the main driver for the hardwood sawnwood business. Consequently, production of traditional hardwood sawnwood, mainly oak and beech, in both France and Germany, is expected to decrease. The consolidation, internationalization, and forward integration of the softwood sawnwood-producing industry is expected to continue over the coming years, but the majority of production capacity will still reside within small and medium-sized businesses with one or only a few production units and processing operations tied to a specific country or region (JPC, 2004). - Plywood production decreases in Western Europe are expected to be balanced by increases in Eastern Europe. Further rationalization in France and Italy, plus the contraction of German industry (both structural and nonstructural plywood), is offset to some extent by the strong production of Scandinavia (mainly structural). The lower cost of beech in Romania erodes German cost-competitiveness (mainly non-structural). Latvia is now the largest producer of (mainly structural) plywood in Eastern Europe (JPC, 2004). - The Nordic and central European businesses are increasingly expanding processing into

14
Eastern Europe, utilizing the benefits of low-cost production resources and growing markets (JPC, 2004). - A significant contraction and consolidation of the distribution and retail sectors of the wood products trade have taken place over the last decade in Europe. This development has been particularly apparent in the major markets for wood products, such as the UK and France, where the top ten companies in the builders merchant and DIY sectors hold between 55% and 75% market share and the number one company holds around 20% market share (JPC, 2004).
Cost structure
- As markets become more globalized, companies tend to rely more on plantation forests than on natural ones, particularly in the southern temperate and Asian countries, where labor and materials tend to cost less (MEA, 2005). - Falling transportation costs, spurred in part by increased trade in manufactured commodities, help lower shipping costs for relatively low-value material, such as wood chips or other unprocessed fibers. Increasingly, chip exports are being based on plantation forests in subtropical and tropical regions instead of primary forests or low-value secondary forests in temperate regions (MEA, 2005). - To the extent that the cost of energy rises in response to fossil supply changes, forest product technologies that are energy-intensive will become less competitive, and raw material costs will rise, reflecting the relative increase in scarcity. Recycling mills have less opportunity to use biomass fuels (MEA, 2005). - According to a recent estimate, energy amounts on average to about 13% of total costs in EU paper and paper board mills (Jaakko Pöyry, 2006). Paper manufacturing based on virgin fibers requires 550–1000 kWh per ton, chemical pulp 400–750, mechanical pulp 1400–2900 and paper making based on recycled paper 20–300 kWh per ton (Chemical Pulping, Gullichsen, J. and Fogelhol, J; Jyväskylä, 2000). - As is well known, wood raw material is the largest cost element in most of the forest-based industries. In paper making more than 30% of total costs relate to wood (fiber) costs and in the sawmill industry, this is 65–70% (EU Comm., 2006). - Rising costs of raw material push the establishment of cost-efficient collection systems for used paper and wood products. - The increase in demand for wood for paper production has been limited because the share of paper production based on recovered paper products has increased substantially, currently amounting to almost 50% of total fiber input. - Forest industry companies have growing incentives to relocate their production to rapidly growing markets (e.g., Asia, Latin America, Russia) and to areas where raw material and labor are comparatively cheap. - In some segments EU manufacturers in the woodworking industry (including furniture) might be facing imports that are priced below production costs (EU Comm., 2006).
Profitability and price structures
- For nearly all (forest) products and countries (in the context of the EFSOS study), nominal prices in US$ per unit of forest product were rather stable from 1964–1973, increased until 1974 when they declined, then increased again until 1979. In 1982 there was a relatively steep decline, followed by an increase until 1989, then a strong decrease until about 1993, followed by an increase until about 1996, and then a decrease. Clear high-price years follow closely the consumption and production patterns observed in Figures 1–5 and the economic growth shown (Solberg, 2005). - Market competition encourages firms to relocate production facilities or to buy production inputs in regions where there are lower labor costs, easier access to resources, higher timber yields, good governance, political stability, functioning logistics and service, availability of recycled fiber, or any combination of these factors, which can bring costs down and increase profits (MEA, 2005). - Increasing prices for fossil fuels are likely to encourage more rapid development of biomass-based fuels, and their emergence could provide outlets for low-grade timber products that currently lack markets. - Long term availability of raw materials (including recycled raw material flows). - Within the pulp and paper industry in particular, and also in parts of the wood panels industry, the number of producers selling on the global market is increasing (EU comm., 2006). - Consolidation as a consequence of low market performance caused by chronic excess supply: As the pulp and paper industry is characterized by pronounced economics of scale, production is dominated by large plants and large enterprises. Vertical integration is very common between pulp and paper production. Some of the larger EU pulp and paper corporations operate on a global basis with production units in Asia and North and South America, in addition to the

15
European ones. In a global comparison, the largest European pulp and paper corporations were among the top five worldwide. However, the concentration level in many of the EU pulp and paper product markets is not very high. The other sectors of the forest-based industries are fragmented and dominated by small and medium-sized enterprises, the average-sized enterprise having less than 10 employees. Currently, the EU forest-based industries are competitive with, for example, labor productivity in the pulp and paper industry being about 20% higher than the corresponding industry in USA and the printing and publishing industry showing even higher advantage (over 30%), while the woodworking industry is on a par with the US industry. The North American pulp and paper industry is currently focusing on cost reduction and is divesting itself of non-strategic assets. A revival in capacity is not expected (EU Com, 2006).
Factors Additional drivers and issues Policy - Developments in Russia, including forest rights and stumpage prices or export restrictions,
have major effects on the present competitiveness of the EU FBI. Softwood pulp production in Russia is highly competitive and can be sold at half the price of French or Finnish pulp.
Social - There are no major factors known to date that radically support a significant growth in the demand for wood products in Europe, despite the ongoing and increasingly positive development in Eastern Europe. Instead, demand drivers provide a moderate to weak outlook, and competition from substituting materials and products will increase. It is thus clear that active measures will be required to increase wood products and combat competition, to allow healthy development of the wood working industries (JPC, 2004). - Effects of demographic shifts on consumption.
Environ-ment
- Global wood demand by 2045/50 will be about 2 billion m3 a year and supply should be about the same, with Asia contributing about 700 million m3 and North America about 1 billion m3 (FAO, 1998). The availability of logs from Russia is often acknowledged as one of the key strategic variables of the EU FBI. - Energy-intensive industries will face increasingly high pressure in the context of the climate regime. - As non-renewable fossil energy supplies decline and new sources of renewable energy are sought, the implications for the supply and consumption of forest products are significant. - Climate-change-related carbon accounting and harvested wood products. - Emissions from the global forest products industry value chain are expected to remain constant or decline slowly as the effects of increasing production are offset by improvements in the emissions intensity of manufacturing and reduced emissions from products in landfills. Carbon sequestration in products will become an even larger part of the industry’s profile as the demand for forest products increases in response to population growth and increasing standards of living (Miner, 2006).
A3.2.1.3. Economic activity, globalization, and forestry
Indicator Status and trends Resource base and resource supply
Forest resources/resource availability: - The total world productive forest plantation area was more than 109 million hectares in 2005, which represented more than a 44% increase over the 76 million hectares of global productive forest plantations in 1990 (FAO FRA, 2006). - The emerging southern hemisphere plantations now supply about 500 million m3/yr, and this is projected to grow to 1 billion m3/yr. over the next 100 years when it will equal the supply from temperate forests (Sohngen et al., 2003). - The (World Bank/WWF Alliance) Vision of Global Forests for the Year 2050 predicts that by the middle of this century, 40% of global forests will be managed primarily for the protection of biodiversity and other forest environmental services. Community and privately owned woodland, which has more than doubled in area in the last decade, might be expected to double again. In 2050, 50% of industrial roundwood demand will be for pulp and paper. While much of the softwood needed for pulp and timber will come from Canada and Russia, increasing volumes of hardwood fiber will come from private-sector-financed plantations in countries of the southern hemisphere and in China. This would create increasing opportunities for smallholders and local communities to play a significant role in world pulpwood supply. There is growing recognition that there are real possibilities for the production of industrial wood to be combined with the protection of biodiversity, forest carbon, and water resources—a belief that is underscored in the Bank’s 2002 Forests Strategy. This vision of global forests suggests

16
that, notwithstanding the inevitability of the further transfer of forest land to agriculture, by 2050 the global forest area will be approximately the same as it is today (PROFOR, 2004). - Europe has experienced a quite steady general increase in forest area over the last 50 years (1950–2000). During the last 50 years the forest area in Western Europe has increased by almost 30%. The growth was significantly lower in Central and Eastern as well as in southern Europe, with about 20% and 16%, respectively. In the CIS and northern Europe, the overall increase in forest area was rather low at roughly 5% over the period analyzed. The increase in forest area in Russia amounts to more than 40 million hectares over the period analyzed. The growth in forest area has slowed down notably since the beginning of 1970s in all sub-regions, with the exception of Western Europe (Gold, 2003). - Over the period 1950–2000, the growing stock expanded much more than the forest area. Growing stock (per hectare) almost doubled in Western Europe. It has increased significantly in Central, Eastern and northern Europe and has even risen in southern Europe by more than 20%, while in the CIS the growing stock is generally still at the starting level (Gold, 2003). - Western Europe has an increased increment of roughly 80% over the period under analysis, whereas the increment in the other analyzed sub-regions show only a 20–30% increase (except the CIS with almost no increase) (Gold, 2003). Roundwood supply: - Overall, world industrial roundwood production fluctuated somewhat between 1980 and 2004, with a net increase of 14% from 1980 to 2004. The data show that most regions have increased their industrial roundwood production over this time frame. The one glaring exception is the former Soviet nations. At the time of the break-up of the Soviet Union in 1991 and in the ensuing transition years, production in these nations diminished significantly from a high of over 300 million m3 in 1988–1990 to less than 100 million m3 by 1994 (FAOSTAT database). - FAO estimates that the plantation share of roundwood production will grow from the current one-third to almost half of total global production by 2040. Roundwood production from plantation forests is likely to provide 906 million m3 by 2045 compared with 331 million m3 in 1995 (FAO 2000c, 2001a). In the near future, production from plantations will significantly increase because of the age structure of the current plantations. In 1995 it was estimated that some 55 million hectares of plantations were younger than 15 years, and some 22 million hectares were in the 0–5 year age class (Brown, 2000). Many of those plantations will be coming into harvest age between 2005 and 2010, and to the extent that they reflect the enhanced yields being pursued through improved varieties, fertilization, and other management improvements, their impact on markets will be significant. - Except for smaller reductions in 1966, 1968, and 1972, EU/EFTA had a rather stable increase in industrial roundwood harvest from 1964–1990 and from 1991/92–2000 (Solberg, 2005). - Assessing the future availability of roundwood with the EFISCEN model, Nabuurs et al. (2005) indicate an expected shortfall in Europe of 50 million m³/year by 2020, and growth thereafter.
Value added, industry structure, and economic growth
Value added: - The forest-based industries account for about 8% of the total value added in the manufacturing industries in the EU. The pulp and paper industry, together with the paper converting industry, has a value added of about € 50 billion per year, while the value added in the printing industry is about €45 billion and about €30 billion in the woodworking industry (EU cons 2006). Industry structure: - Fragmentation of private forest ownership may be seen as a negative factor leading to higher cost in forest management and in the mobilization of wood (EU, 2006). -Hardwood production, primarily of fast-growing varieties, is tending to move to the southern hemisphere, but northern hemisphere natural coniferous forests, particularly in Russia, continue to be competitive suppliers of softwood (PROFOR, 2004) - Products requiring large volume of virgin fiber and those whose value can match high transportation cost continue to be produced in high-price countries. - Achieving a significant decrease in capital intensity and increased production flexibility through process innovations are a key challenge (FTP, 2006a). - Wood energy received a boost from record high oil prices and new government policies to promote renewable energy sources and mitigate climate change (UNECE, 2006). - The supply of direct wood energy (not including the expected contribution from industry residues or recovered wood) can be expected by policymakers to increase from about 160 million m3 in 2003 to about 260 million m3 in 2010, an increase of 100 million m3 (60%) in seven years (Becker et al., 2007).

17
Productivity - Productivity increases in forestry have ranged from negative to 10% per year with many countries at around 3–4%/worker/year (UNECE/ILO, 2003). - The European Technology Platforms observed that the European primary wood processing industry would have to work with considerably increased material efficiency and lower energy consumption to meet global competition, (UNECE, 2006). - High and increasing demand for raw material (maximum biological potential removals at about 780 million m3 in 2020, ETTS V). - Newton (2003) suggests that volumes in planted northern conifers can be improved by 7–26% at rotation age through genetic improvement. - Labor productivity pressure to reduce cost; labor productivity will rise, but less than in forest-based industry. For example, from 1955 to the mid-1990s, labor productivity in logging in the USA increased by an average of 1.45% annually (Perry, 1999).
Employment - Paper consumption is expected to increase at the fastest pace in Asia and especially China, over 4% a year. In Eastern Europe and Latin America, growth in demand will be nearly as fast. According to a study conducted by Jaakko Pöyry Consulting, between now and 2015, global demand for paper and board will increase by 120 million tons, with China’s share estimated at 35 million tons. If the growth in demand is to be satisfied by paper machines located in China, during the next ten years, China will have to introduce eight 450,000-ton paper machines a year (FFI-2005). - Global wood demand by 2045/50 will be about 2 billion m3 a year, and supply should be about the same, with Asia contributing about 700 million m3 and North America about one billion (FAO, 1998).
Cost structure
- Pressure to mobilize resources, including practical cooperative measures, should be encouraged, as should the development of forest property markets. - EU forest owners are facing increasing difficulty in competing because their production costs are higher than those of low-cost competitors outside the EU. - To obtain an economic and environmental balance, key challenges would be to use forest biomass for products and energy, substantially improve the industry’s energy efficiency, and develop and design products that can be recycled, reused, and finally converted to bio-energy (FTP, 2006a).
Profitability and price structures
- Economic incentives for the establishment of agriculture or forest plantations devoted to woody crops grown specifically for energy production and promotion of wood mobilization - Gradual further opening of the EU CAP regime, releasing large areas of land for competitive use. - In addition to the industry’s need for raw material, there are other increasing demands on EU forest resources, resulting from policies concerning, for example, climate change, biodiversity, habitat conservation, the use of renewable energy, and recreational and other social activities. The value of environmental and social functions is not reflected in wood revenues.
A3.2.2. Employment A3.2.2.1. Employment and labor
Indicator Status and trends Share of employ-ment
- The last decade has witnessed a decline in the share of the world’s working-age population (15 years and older) in employment (known as the employment-to-population ratio). It stood at 61.4% in 2006, 1.2%age points lower than 10 years earlier (ILO, 2007). - In 2006 the share of employment in the service sector in the total global employment progressed from 39.5% to 40% and, for the first time, overtook the share of agriculture, which decreased from 39.7% to 38.7%. The industry sector represented 21.3% of total employment (ILO, 2007). - Below-replacement fertility prevails in the more developed regions and is expected to continue to 2050. Fertility is still high in most least-developed countries and, although it is expected to decline, it will remain higher than in the rest of the world. In the rest of the developing countries, fertility has declined markedly since the late 1960s and is expected to reach below-replacement levels by 2050 in most (UN WPP, 2005). - By 2030 China and India together will account for about 40% of the world’s workforce, which will remain predominantly unskilled. By 2030 the world’s labor force will number some 4.1 billion workers, 90% of whom will live in the developing world. The global labor force is predicted to grow by about 1% per year over 2001–2030 (World Bank, 2007).

18
- Global competition is tight for the standard tasks for which global markets exist, both in manufacturing and services. As individual tasks can be offshored, globalization may help some workers in a given firm while harming others. - Close to 20% of total employment could potentially be affected by information and communications technology-enabled offshoring of services (OECD, 2005).
Wages - The share of working-age population (20–65) without formal education will decline from roughly 30% to some 20% in 2020 (Lutz et al., 2004). - The pace of labor force and employment growth in the EU25 will be weakly positive over the next 15 years and will turn negative over the period 2018 to 2050. This is mainly the outcome of projected declining trends for the working-age population and a shift in the age structure of the population toward older, less economically active groups; a consequence of the baby-boom generation approaching retirement and the succeeding lower-birth-rate cohorts reaching working age (EU, 2005). Globalization has generally been associated with rising average wages, but it imposes adjustment costs on certain groups within countries, primarily through labor markets—by influencing wages and job security, by requiring retraining, and through the upheaval of moving between jobs. The unskilled have seen their wages worsen relative to skilled workers and their jobs become less secure. This is the case even in developing countries (World Bank, 2007). - All empirical studies, including those done by some of today’s top trade economists (such as Paul Krugman of Princeton and Robert Feenstra of the University of California, Davis), show that the adverse effect of trade on wages is not substantial. Our own empirical investigation concludes that the effect of trade with poor countries may even have been to moderate the downward pressure on wages that rapid unskilled labor-saving technical change would have caused. Second, the same goes for the econometric studies by the best labor economists regarding the effects of the influx of unskilled illegal immigrants into the USA. The latest study by George Borjas and Larry Katz of Harvard also shows a virtually negligible impact on workers’ wages, once necessary adjustments are made (Bhabgwati, 2007).
Skilled versus unskilled worker
- Globalization tends to place a premium on people with a high level of skill, high education level, and high entrepreneurship. There is competition for skills and talent within both industry sectors but, more importantly, among sectors. Most often the attractive industries are dynamic ones with high rates of innovation (higher competitiveness, higher wages). - While average wages rise more rapidly in open economies than in closed ones, increasing relative demand for skilled labor is widening the wage gap between skilled and unskilled workers in both developed and developing countries (World Bank, 2007). - There is a rotation in value added toward skilled workers, with their total share increasing from 11% to 17%; this is largely taken from the share of capital which declines to 47% from 59% in 2005. Some 30% of the increase is determined by the increase in unskilled wages and 15% by the increase in skilled wages (World Bank, 2007). - Agricultural workers will constitute a shrinking share of the world’s labor force, declining from about 43% in 2001 to about 30% in 2030. While the share of agricultural workers will fall by about half in developed countries, the stark decline is from an already low base (from 4 to 2.6%) (World Bank, 2007). - The skill premium tends to increase in most regions. This reflects the assumption that skilled labor is a complement to capital, thus demand for it increases more rapidly than supply. The skill premium increases most rapidly in those countries with a high investment rate. A second factor is the relative glut of unskilled workers as the rural exodus—largely an unskilled phenomenon—continues (World Bank, 2007). - Pressures on unskilled workers will intensify in both developed and developing countries. Greater global competition, along with more rapid technological change and diffusion, can increase wage and employment volatility. Global sourcing of services exerts pressures in the same direction. Unlike displacement in low-skilled manufactures trade, the offshoring of services has the potential to destroy the previous investments of white-collar workers in firm-specific knowledge (World Bank, 2007). - It is not globalization but labor-saving technical change that puts pressure on the wages of the unskilled. Technical change prompts continual economies in the use of unskilled labor. Such technical change is quickly spreading through the system. This naturally creates, in the short run, pressure on the jobs and wages of the workers being displaced. But we know from past experience that we usually get a J-curve where, as increased productivity takes hold, it will lead to higher wages. The intensity of displacement of unskilled labor by information-technology-based change is continuous now. The pressure on wages is becoming relentless, lasting over

19
longer periods than was the case in earlier experience of unskilled labor-saving technical change (Bhagwati, 2007). - Flexibility is the key to allowing Europe to seize the opportunities of globalization while minimizing the adjustment costs. Globalization’s correlation between skill groups and winners and losers breaks down. Certain highly skilled tasks may turn out to be offshorable, while other highly skilled tasks are not. Increased offshoring will therefore not systematically help or hurt skilled workers (Baldwin, 2006).
Factors Additional drivers and issues Policy Government measures for employment protection tend to have the effect of protecting only
some workers (insiders, usually prime-age males) at the expense of others (outsiders, usually youth, women, and low-skilled workers). In the OECD countries, partial reforms have tended to reinforce labor-market inequality, with temporary contracts for new entrants (youth or women) but only limited access to more permanent jobs. (OECD 2005d, 2004). Policies shift the emphasis from measures designed to protect those in employment—which, as discussed earlier, can discourage job creation—to mechanisms aimed at ameliorating the potentially negative effects of greater labor movement (World Bank, 2007).
A3.2.2.2. Employment, globalization, and the forest-based industry
Status and trends Status and change in employ-ment
- Total employment in the (formal) forestry sector increased by about 4% over the last decade, from 12.4 million in 1990 to 12.9 million in 2000. At the global level, employment is divided roughly equally between forestry activities, the wood industry, and the pulp and paper industry. However, at the regional level, forestry activities are relatively more important than processing activities in developing regions (FAO, 2005). - In recent decades there has been a decline in the labor inputs required by the forest products industry, where employment has experienced similar declines to many other extractive and manufacturing industries1 (MEA, 2005). - The current labor force in the forest industry cluster in Europe is about 3.9 million full-time equivalents. Pulp and paper is the smallest subsector in employment terms with just 27% of the total. Forestry and the wood industries share the balance about equally between them (UNECE/ILO, 2003). - Employment has been declining substantially. In the 1980s and 1990s this decline has mostly affected the countries of northern and western Europe. In the future, assuming continued increases in labor productivity, reductions in employment levels are expected to be largest in Central and Eastern Europe as well as in the CIS. The total workforce is expected to shrink by 6.9% between 2000 and 2010. It should be noted that values for individual countries and subsectors vary widely around this average (UNECE/ILO, 2003). - At the global level, the forest sector currently employs about 0.4% of the total labor force and this figure has fallen very slightly during the period 1990 to 2000. The contribution of the forestry sector to total employment is generally higher in the developed regions and Eastern Europe than in developing regions (FAO, 2004).
Level of education, wage, etc.
- Regarding employment quality, wage levels in the pulp and paper industry compare favorably with those in the other two subsectors and with manufacturing wages in general. Remuneration is typically significantly lower in wood industries and forestry. Female wages continue to be significantly lower than male ones (in the pulp and paper industry, 30–39% lower), a situation that needs to be remedied if the sector is to attract more female workers in the future (UNECE/ILO, 2003).
1 Over the period 1997–2003 employment in the paper and paperboard production fell by one-third (US Bureau of Labor Statistics, 2004).

20
A3.2.2.3. Employment, globalization, and forestry
Indicator Status and trends Status and change in employ-ment
- Globally, reported employment in forestry declined slightly from 1990 to 2000, by about one million (or 10%) (FAO FRA, 2006). - Forest utilization continues to be intense, but much fewer local people benefit from it. - The scenario suggests that the rural exodus could be a significant factor in the years ahead, with the share of agricultural workers dropping from about 51% currently to less than 35% in 2030. This should raise average wages for rural workers (decreased urban wage premium) (World Bank, 2007). MEA-Timber: Mechanization of timber harvesting has reduced employment in the forestry sector, particularly in the tasks of felling trees and transporting logs. However, mechanization has been key to improving forest management and has led to reduced injury and mortality in the sector. - The continued decline in employment will further reduce the visibility of the sector and partly reduce its direct benefits to society. Rural livelihoods will be most affected as the losses are concentrated in forestry and in small firms in the other subsectors. If the forest industry is to make a contribution to rural development in Europe, growth patterns need to be reviewed and altered. Small enterprise development, including forestry contractors pursuing a strategy of quality and higher value added in addition to providing and marketing nontraditional goods and services, will be important elements of any strategy to address the withdrawal of the forest sector from rural areas and the continued shift toward capital intensive modes of production. Key players in the forest sector (in particular, those from Nordic countries) are acting more and more globally, shifting capacities toward Eastern Europe because of lower production costs and expected increases in the demand for forest products. This process depends on further stabilization in the policy framework as well as on the economic growth in these countries. This will have an additional impact on employment in the traditional producer countries. In spite of the decline in employment volumes, the sector is likely to be faced with difficulties in finding adequate employees with related timber qualifications in the future, not least because of demographic trends in Europe. These shortages may only affect the inability to attract new entrants with good qualifications and potential, or it may translate into absolute shortages. In some major producer countries, shortages are expected to limit the potential for growth in output. This issue would appear to merit closer scrutiny at the national and local level. Improvements in employment quality, such as wages, training, and career prospects, as well as working environment and safety, will be critical to maintaining adequate levels of new workers, in particular, women. (UNECE/ILO. 2003).
A3.3. Trade and Globalization
A3.3.1. Trade status and trends Indicator Status and trends Share of total exports in GDP
- The tremendous growth of international trade over the past several decades has been both a primary cause and an effect of globalization. The volume of world trade since 1950 has increased by 20-fold from US$320 billion to US$6.8 trillion (globalization 101). - World trade has exploded since the early 1960s. World exports have grown from just under US$1 trillion a year (in dollars, year 2000 value) to nearly US$10 trillion a year, that is, annualized growth of some 5.5% per year. Exports are clearly outpacing global output, which increased at some 3.1% per year over the same period. Between 1970 and 2004, the share of exports relative to global output has more than doubled and is now over 25%. A large part of the opening of domestic economies can be attributed to unilateral decisions, as in China and India (World Bank, 2007). - Trade in services has been growing at a pace similar to trade in goods at the global level. Rising from US$358 billion in 1984 to US$2,000 billion in 2004, the share of services exports in total exports of goods and services has advanced modestly from 16% to 17.5% (World Bank, 2007). - Many countries that report to the IMF do not report service exports and imports, but those that do reported exports of $US1,885 billion and imports of $US1,887 billion in 2003 (IMF 2006). Of these countries, the 145 that reported both goods and services exports and imports reported

21
exports of services that were 25.7% of exports of goods, and imports of services that were 25.4% of imports of goods (IMF, 2006), close to one-quarter (Lipsey, 2006). - Between 1970 and 2004, exports as a proportion of world output doubled to more than 25%; new technologies have diffused rapidly across the globe, and the total private financing of developing countries reached nearly US$1,000 billion in 2004. Globalization is likely to remain a driving force, with exports as a proportion of world output likely rising to 34% by 2030 (World Bank, 2007). - World merchandise exports rose 13% in 2005), for the first time exceeding the US$10 trillion mark. Commercial services exports rose by 11% to US$2.4 trillion in 2005 (WTO, 2006). - Trade integration will accelerate. The trade dimension of globalization has perhaps been the most prominent, especially with the emergence of Asia and the transition economies over the last two decades. Growth in trade has outpaced growth in output by a factor of two or more, and the causes behind this phenomenon are in place to sustain it over the next two decades. While the standard theory of trade has focused on comparative advantage, new trade theory places much more emphasis on the role of specialization through consumers’ desire for greater varieties and through production networks that allow for the breaking up of the production process across multiple firms and/or countries (World Bank, 2007). - Product markets are rapidly integrating, with a geographical redistribution of manufacturing taking place. Two challenges are particularly demanding: one is the rise of China, India, and other emerging economies as manufacturing powerhouses, and the other is the emergence of global sourcing of services. India and China’s sheer size raises the specter of surging new export competition. Many developing countries fear that exports from these large new players could swamp their domestic markets, squeeze them out of the global market, foreclose avenues of diversification in manufactures as a road to higher growth, and gobble up all the investment flows. And high-income countries worry that if the large emerging economies can readily acquire and master the newest technologies, their exports may soon take over high-tech markets. China as an emerging market offers enormous offsetting opportunities for other developing and developed countries. Accompanying the rising value of exports and domestic living standards in emerging economies will be rising wages (World Bank, 2007). - Production is further divided into separate fragments that can be spread around the globe, with an increasing “trade in tasks.” As globalization has advanced, it has become easier to move some of these tasks offshore. The ease of trading a particular task is a matter of degree, not kind; and it is a variable, not a constant. Hence tasks that seem safe from foreign competition today may not be so tomorrow. Finally, the tradability of a task might bear no relation to the amount of skill it requires. There is an expanding feasibility of offshoring formerly non-tradable services (World Bank, 2007).
A3.3.2. Trade, globalization, and the forest-based industry Indicator Status and trends Status and change in geographic timber trade flow patterns, volumes, relative trade balances
- Despite global expansions in international trade, the vast majority of all wood-based production is destined for consumption in the domestic markets of producing countries (FAO, 2004a). - Intraregional trade flows account for the bulk of world trade. In 1997, 78% of Europe’s forest product imports in value terms came from within the region, up from 70% in 1962. Similarly, there was increasing emphasis on intra-regional trade in Asia and the Pacific, where in 1997, 81% of exports in value terms stayed within the region, compared with 55% in 1962 (Wardle and Michie, 2001). - The trends in industrial roundwood emphasize the rapidly expanding dimension of international trade. Export volume has almost trebled since 1961, with global exports of industrial roundwood exceeding 114 million m3 in 2000 (FAO, 2004a). - The real value of forest products exports rose by nearly 50% over the last decade to reach a level of US$144 billion in 2000. Furthermore, international trade in forest products has generally expanded at similar rates in both developed and developing countries. At the regional level, exports of forest products are dominated by the three developed regions. For example, in 2000, Western Europe and North America together accounted for about three-quarters of global forest products exports, followed by the developing Asia-Pacific region (with a 10% share). Furthermore, most international trade in forest products is either trade among these three regions or among countries within each of these regions (FAO 2004a). - International trade in forest products has increased at a rate that is much faster than the increase in production. The global value of timber harvested in 2000 was around US$400

22
billion, and around one-quarter of that entered world trade, representing some 3% of total merchandise traded. In constant dollar terms, global exports increased almost 25-fold between 1961 and 2000 (MEA, 2005). - The value of world trade in the main categories of wood products is estimated at approximately US$140 billion in 1997, with paper accounting for nearly half of this. An alternative estimate comes to US$155 billion (FAO, 2004a). -Trade is becoming more important— paper and sawnwood have both gone from less than 20% of production going to export at the beginning of the 1960s to around 30% in the late 1990s. Panels have become more of an export commodity since the mid-1980s, with over 30% of production now being traded internationally (FAO, 2004a). - Despite the rapid growth in international trade, the growth in forest products trade has been less than the growth of trade in other merchandise goods. The share of forest products in total merchandise exports declined from 2.9% in 1990 to 2.2% in 2000. This downward trend also appears in all regions except Eastern Europe, where recovery in the forestry sector has generally been more rapid and successful than in many other parts of the economy (FAO 2004). - Five countries—the United States, Germany, Japan, the United Kingdom, and Italy—imported more than 50% of world imports in 2000, while Canada, the United States, Sweden, Finland, and Germany accounted for more than half of exports. During the past decade, China has increased its imports of logs and wood products by more than 50% and, if unabated, this rate of increase will put significant pressure on wood supplies in many regions, particularly Russia and Southeast Asia (MEA, 2005). - China has become the world’s largest log importer, producing primary and secondary processed products for domestic and export markets; Chinese exports compete with UNECE region producers (UNECE, 2006). - Central and Eastern European countries and Russia continue to accelerate out of the socio-economic transition period with increased exports, including value-added wood products (UNECE, 2006). - Global interregional wood raw material trade findings: (i) Wood raw material trade is becoming increasingly global; (ii) Chips and particles trade is on the increase, as is roundwood; (iii) Plantation wood is increasing faster than other sources of wood raw material; (iv) Europe has very many links with the external world and internally; (v) The EU15 has a very significant internal trade in wood raw materials; (vi) Russia is the largest single source for Western Europe’s imports; (vii) The AC10 is a net exporter now, but local processing will soon be growing; (viii) Internal trade within the EU25 will be mostly from the East to the West; (Indufor Oy, 2004).
Factors Additional drivers and issues Policy Although the EU itself has no import tariffs on pulp or paper products and generally low
tariffs on wood products, EU industry is faced with significantly higher tariffs in some third countries (EU Com, 2006).
A3.3.3. Trade, globalization, and forestry
Indicator Status and trends Status and change
- Securing the availability of renewable raw materials, while supporting the varied uses of forests and safeguarding biodiversity through sustainable forest management is a key strategic challenge (FTP, 2006a).
Trade flows
- Seen from the context of resource peripheries, certification is part of an emerging regime of production–consumption relationships, where political barriers to trade, production, and investment are complemented by technical practices purportedly designed to codify wood and fiber quality. We would argue here that forest certification and ensuring standards represent a
new basis of value creation and competition (Stringer, 2006). - Trade based on unsustainable practices in forest operations has been seen as a major factor contributing to deforestation and forest degradation, particularly in developing countries. In a number of tropical countries in Africa, Southeast Asia, and the Guyana Shield, export-oriented production has apparently accounted for a significant share of forest loss and degradation. In addition to direct impacts, indirect effects, such as opening up forest areas for encroachment,

23
can become or can trigger underlying causes of deforestation (FAO, 2004a). - Between 1961 and 2000 production of wood forest products measured in roundwood equivalents grew by 1.12% per year while the volume traded increased by 3.88% per year (FAO, 2004a).
A3.4. Technology and know-how, and globalization
A3.4.1. ICT, logistics, knowledge production and R&D Indicator Status and trends ICT use - In the 1960s, transatlantic telephone lines could accommodate only 80 simultaneous calls
between Europe and the United States. Today, satellites and other telecommunications infrastructure can handle one million calls at any one time (globalization101). - Technology has been advancing rapidly—particularly technologies that shrink the world, easing the flows of goods, capital, and technology. The improvements in telecommunications are the most striking example. The expansion of computer networking has vastly changed the way large companies organize production and has permitted the introduction of production networks that span the globe. These same networks also open up market opportunities for small firms that are no longer limited to regional markets. Improvements in transportation technology have also been impressive. The introduction of the container in the 1950s reduced the cost of loading a ship from US$5.83 per ton to 15.8 US cents, and even more savings came from the vast reduction of time ships spend in port for loading and unloading (see Levinson, 2006). - The evolution of communication through information technology is one of the key elements of globalization. The invention of new devices of communication like the fax machine, mobile phones, computer, and Internet have made the communication network much cheaper and more accessible to ordinary people. The efficient communication network played a vital role in the growth, productivity, and new employment opportunities. The micro processor and cheap memory revolutionized the communications industry in the 1980s. The rapid decline in the real price of telecommunications provides impetus to the global networking of computing through the Internet. - Innovations in several key areas in ICT development, namely, the Internet, mobile telephony, geographic information systems (GIS), and multimedia, have sparked a new “digital revolution.” However, the full promise of the new ICT and the Internet has not been realized. ICT poses a “digital challenge” to governments in terms of its proper use in policy and administrative practice and the proper regulation and governance of ICT at the national and international level. Contentious issues range from intellectual property rights to security and taxation. Another challenge is the mastery of opportunities that ICT provides in the field of e-governance at the international level. A third area is the concern about the widening digital divide between developed and developing countries and regions (WSIS, 2003). - While the dissemination of information and communication technologies has been one of the most decisive factors in accelerating the process of globalization, the diffusion of technology at the global level may not have advanced at as swift a pace as international trade or direct investment (OECD, 2005).
Logistics - Revolutions in transport and communications technologies have led to enormous reductions in cost, allowing tasks to be separated in time and space and weakening the link between specialization and geographic concentration. Instructions and information can be effectively conveyed over long distances and intermediate inputs can be transported quickly and much more cheaply than before. Thus, increasingly it is tasks, in addition to final goods and services, that are exchanged across national boundaries, resulting in global production networks of activity in a wide range of sectors (World Bank, 2007).
Innovation -Global firms derive knowledge to develop their technology and innovate from a variety of information centers located in different countries. This is a phase dominated by the setting up of numerous research and innovation laboratories outside the countries of origin or the acquisition of existing laboratories. The greater the extent to which these laboratories produce new technologies for world markets, the more it advances the globalization of the firms and industries concerned (OECD, 2005). - Speeding up the transition of the sector from being largely resource-driven to being market- and knowledge-driven is integral to success. As a result, the sector needs to extend its

24
knowledge base from being mainly technological to also include human sciences (FTP, 2006).
Share of international R&D expenditure
- In the early stages of development, economies compete price-wise. At these stages, what matters is to get the “basics” right. By “basics” we mean the institutional environment that guarantees basic property rights, physical infrastructures, and maintaining a minimum degree of macroeconomic stability and a good level of basic education and health. At intermediate levels of development, economies need to become more sophisticated. Thus, at that level we believe economies should make a greater effort to improve advanced levels of education and training, the efficiency of their labor, goods and financial markets, and adopt the most up-to-date technologies (even if these technologies have been invented elsewhere). Finally, in the most advanced stage of development, firms need to innovate in the sense of creating both new products and a more sophisticated business environment (with innovation in business practices) (WEF, 2007).
A3.4.2. Technology, know-how, globalization, and the forest-based industry Indicator Status and trends Status and trends in technology use, by forest-based industry classes and size classes
- Despite many firms having high Internet access and a large proportion of employees using computers, the extent of firms using e-commerce is still very low, although it is increasing substantially. The proportion is smaller in the manufacturing sector (e.g., in the forest industry) than in the service sectors. E-commerce use is currently most significant in tourism, media and printing, banking, insurance, and ICT services and retail. Some of these sectors are important for the forest sector, which may therefore need to move faster in the direction of e-commerce (Hetemäki and Nilsson, 2005). - Summarizing ICT impacts on the forest sector to date, the following observations can be made. First, ICT implementation in the forest industry and wood production sector has been along “installation period” lines rather than making the kind of ground-breaking advances expected in the “deployment period.” Perhaps the important exception is the globalization of the forest industry, which has been greatly enhanced by ICT development, with fundamental changes being made as a result to the industry’s operating environment. Second, many ICT impacts on the forest sector are indirect. That is, ICT changes society in general which, in turn, changes the forest sector. There are also indirect ICT impacts within the forest sector itself, with many of the fundamental impacts relating to forest industries and their markets rather than to forests themselves. However, the changes in forest industries and markets have, in turn, important implications for how we use forests. The present study reflects that situation. It emphasizes the importance of having a good grasp of how ICT impacts on the forest industry and markets, before drawing conclusions about its impacts on forests (Hetemäki and Nilsson, 2005). - There has been a structural change in communication paper markets in a number of the countries of the OECD, and ICT has probably played a central role in these. The traditional market analysis and long-term consumption projections are also less useful here—and may even provide qualitatively false projections. In the OECD, the future trend is likely to favor electronic media at the expense of printed newspapers. Newsprint consumption in a number of OECD countries has already declined and is likely to do so even more in the future. In summary, the structural changes in communication paper markets due to ICT will probably be substantial both in terms of volumes and prices. We are at the beginning of the process of paper substitution due to ICT developments (Hetemäki and Nilsson, 2005).
Human capital employed
- There can be fundamental bottlenecks impeding technology adoption, the most important of which are insufficient knowledge and capacity within the recipient country (Indufor, 2003).
Innovation and research investment
- Engineered wood products are becoming increasingly common as a result of reductions in the availability of high-quality structural wood, competition from steel products, and cyclical wood prices. These products, derived from new technologies, essentially turn low-quality wood and wood residues into products valuable for construction and furniture (Enters, 2001). The use of engineered wood products in the North American market, for example, has grown at a rate of 20% per year since 1992, reaching more than 29 million m3 in 1997 and is projected to rise to over 45 million m3 by 2005 (Taylor, 2000). If the use of these technologies continues to spread, the pressure on some ecosystems and high-quality species will be eased (MEA, 2005).
25
- The impact of ICT on consumption patterns for forest products has been an issue of great interest for a long time, especially on the future use and consumption of paper products. The possible impacts of ICT have been most clearly identified and are perhaps most significant for these products. The future prospect of a “paperless office” has already been predicted for decades, but has to date not materialized as foreseen (Hetemäki and Nilsson, 2005). - Engineered wood products, which are environmentally friendly and efficiently produced and used, have continued to make inroads into traditional wood products markets and to fend off competition for non-wood substitutes (UNECE, 2006). - A large number of innovation and R&D aspects are addressed in the Forest Technology Platform Vision 2030 document and Strategic Research Agenda, including advances in genetic materials, sorting and grading systems for roundwood, logistics, processed materials, and final products, all with potential for optimizing materials efficiency and making production more reliable. Technologies for producing new panel-type products and three-dimensional materials also have promise. These new wood-based products are for traditional applications and also for many uses outside the wood sector, including vehicles, textiles, medical, electronics, and food (FTP 2006a and b). - The EU is today the overall technological leader in the forest-based sector, although this does not mean that it has leadership in all technological areas. - The biomass refinery is poised to move quickly beyond the concept stage, with a major research effort now under way involving both the wood products and agricultural sectors in both the USA and Europe.
Factors Additional drivers and issues Policy - In Europe, the European Commission has co-funded the establishment of the forest-based
sector technology platform with a view to increasing R&D and a long-term strategic development of the sector (FTP 2006a, b) - In the United States, the federal government and the pulp and paper industry have cooperatively designed and funded research programs to develop new approaches. One result in North America is radical new thinking about the future nature of paper manufacturing. A transformation of the entire industry to a biochemicals, biofeedstock, bio-energy, pulp and paper industry is envisioned, with individual mills operating as integrated biomass refineries. Under this scenario, manufacturing centers will have the capacity to produce electricity, liquid fuels (such as ethanol), and a wide variety of biomass-derived chemicals and chemical feedstocks, in addition to pulp and paper (Bowyer, 2004). - In Europe, wood is expected to become more important as a source of energy, and policies to facilitate and guide the development of wood energy are being drafted.
Environ-ment
- Climate change will push technology development for reduced emissions and reduced energy intensity.
A3.4.3 Technology, know-how, globalization, and forestry Indicator Status and trends Innovation and research investment
Research and technological development, diversification, innovation, and investment in job quality and human capital are needed to develop a strong and dynamic sector capable of meeting the challenges of global change (EU Com, 2005).

26
A3.5 List of Reviewed Studies
A. Globalization in general: introduction and definitions − Manning, S. 1999. Introduction to Special Issue on Globalization. Journal of World-Systems Research. 5(2):137–41. − Bata, M., Bergesen, A.J. 2002. Global Inequality: An Introduction to Special Issue on Global Economy: Part I. Journal of World–System Research. 8(1):2–6. − Andersen, T.M., Herbertsson, T.T. 2003. Measuring Globalization. IZA Discussion Paper. 2003:817. Bonn: IZA B. Overall globalization factors and trends General − World Bank 2007. Global Economic Prospects—Managing the Next Wave of
Globalization, World Bank, − Stiglitz J. 2006. Making globalization work; Norton, NY − Wolf, M. 2004. Why Globalization Works; Yale Press, New Haven − OECD 2005. Economic Globalization Handbook; Organization for Economic Cooperation and Development; Paris.
FB-I - Bael and Sedjo 2006. Toward Globalization of the Forest Products Industry: Some Trends; Resource for the Future. Washington D.C. - Nilsson S. 2006. Globalization and Economic Growth: Energy and Environmental Constraints; Paper to the Seminar on the Globalization Challenges for Europe, 17 August 2006 Helsinki, Finland - Nilsson, S. 2004. Signposts for Tomorrow’s Pulp and Paper Industry. Paper presented at the Confederation of European Paper Industries (CEPI) Annual Meeting, 2 December, Brussels, Belgium. International Institute for Applied Systems Analysis, Laxenburg, Austria.
Forestry C. Globalization indicators 1) Investment General - UNCTAD World Investment Report 2006
- UNCTAD Handbook of Statistics 2005 - OECD Investment report 2005 - OECD Direct Foreign Investment Statistics data base - World Bank IMF Financial Sector Assessment Program report - World Bank 2004. Globalization and Foreign Direct Investment and Foreign Aid. - Globalization101. no year. Investment and Globalization; www.globalization101.org: Carnegie Endowment Project - EUROSTAT 2006. European Union foreign direct investment yearbook 2006;
FB-I - Gregersen H. and Contreras A. 2001. Investing in the Future: The Private Sector and Sustainable Forestry Management. International workshop of experts on financing sustainable forest management. Oslo, Norway, 22–25 January 2001 - Schmidt R. 2003. Financial investment in sustainable forest management - status and trends. A Background paper for the Global Project: Impact Assessment of Forest Products Trade in Promotion of Sustainable Forest Management GCP/INT/775/JPN. FAO, Rome - IADB 2004. IADB. Inter-American Development Bank. Estudio sobre inversión directa en negocios forestales sostenibles: Documento Conceptual. Project ATN/NP-8323-RS; STCP: Curitiba, 2004. Tomaselli I. 2006. Brief Study on Funding and Finance for Forestry and Forest-Based Sector. Final Report for the UNFF Secretariat, United Nations Forum on Forests,New York
Forestry 2) General economic activity—general General - World Bank World Development Report 2006
- World Bank Development Indicators 2006 report and database - UNIDO Industrial Development Report 2006 - World Bank IMF World Economic Outlook 2006 - ILO 2005. World Employment Report 2004-2005. Employment, Productivity and Poverty Reduction. International Labor Organization, Geneva. - WEF 2007. World Economic Forum Global Competitiveness Report 2006–2007.

27
- Economic reforms and competitiveness: key messages from the European Competitiveness Report 2006 COM(2006) 697 final. - FHI 2005. ManVis–Manufacturing Visions: Policy summary and recommendations; Fraunhofer Institute for System and Innovation Research, Germany - EC 2005. European Energy and Transport–Trends to 2030. Update 2005
FB-I - FAO 2004. Trends and current status of the contribution of the forestry sector to national economies; Working Paper FSFM/ACC/07, FAO, Rome - FAOSTAT database - The Conference Board of Canada. 2006. CFIC Forest Science Policy Forum on Transformative Technologies Regional Workshops Summary Report. May 2006. The Canadian Forest Innovation Council. - TEEC. 2004. Evaluation of the ‘Communication on the State of Competitiveness of the EU Forest- Based and Related Industries’. Final Report. Volume I (Main Report). 27th October 2004. The European Evaluation Consortium, European Commission Directorate-General for Enterprise (DG ENTR). - JPC 2004. Key Findings and Conclusions Market, Industry and Forest Resource Analysis as part of the Roadmap to 2010 Process; Jaako Poyry Consulting. - Finnish Forest Cluster Research Programme Wood Wisdom (1998–2001). 2002. Final Report 2002. National Technology Agency Tekes. Academy of Finland. Ministry of Agriculture and Forestry, and Ministry of Trade and Industry of Finland. - Niskanen, A. (ed.) 2006. Issues Affecting Enterprise Development in the Forest Sector in Europe. University of Joensuu. Faculty of Forestry, Research Notes 169: 253–279. - EU Com 2000. European Commission. 2000. Competitiveness of the European Union Woodworking Industries. Summary Report. European Commission DG Enterprise. - EU Com 2006. Consultation Document concerning Innovative and Sustainable Forest-based Industries in the EU. Directorate General Enterprise and Industry, October 2006. - Indufor Oy 2004. Final Summary Report Indufor Work Packages Environmental Catalogue, Wood Supply, Perception Analyses; Cei-Bois Roadmap 2010 for the European Woodworking Industries; Brussels, Belgium - UNECE/FAO in press. Schulmeyer EFSOS update; draft discussion paper. - UNECE/FAO 2006. Forest Products Annual Market Review 2005–2006. ECE/TIM/SP/21; UNECE Geneva - UNECE/FAO 2005. European Forest Sector Outlook Study Main Report. UNECE, Geneva - UNECE/FAO. 2005a. Forest Products Annual Market Review, 2004–2005. Timber Bulletin Vol. LVIII. - Hetemäki L., Harstela P., Hynynen J., Ilvesniemi H. and Uusivuori J. (eds.) 2006. The Contribution of Finland’s Forests to National Prosperity and Wellbeing in 2015—A Report on Finnish Forest Sector Development and Future Scenarios. METLA, Finland. - Bowyer, Jim L. 2004. Changing Realities in Forest Sector Markets. Unasylva 55(219): 59–64. - Taylor, R. 2004. Policy issues and initiatives related to the four “wild card” supplying regions. Presentation as part of UNECE Timber Committee and FAO European Forestry Commission Market Discussions. Geneva, Switzerland, 5 October.
Forestry - FAO 2004. Trends and current status of the contribution of the forestry sector to national economies; Working Paper FSFM/ACC/07, FAO, Rome - FAO 2006. Forest Resources Assessment 2005 Main Report, FAO Rome. - EU Com. 2006a. Communication from the Commission to the Council and the European Parliament on an EU Forest Action Plan COM(2006) 302 final - EU Com 2005. Council Conclusions on an EU Forest Action Plan, 2662nd meeting of the Agriculture and Fisheries Council, 30–31 May 2005. - Becker G. 2006. Can Europe's Forests Satisfy the Increasing Demand for Raw Material and Energy under Sustainable Forest Management? Draft Background Paper for the UNECE/FAO MCPFE Workshop on Mobilizing Wood Resources, January 2007. - Rametsteiner E., Weiss G., Kubeczko K. 2005. Innovation and Entrepreneurship in forestry in Central Europe; EFI Research Report 19, EFI Joensuu - Niskanen A. (ed.) 2006.: Entrepreneurship in the forest sector. Final Report of COST 30;

28
University of Joensuu, Finland. - United Nations Economic Commission for Europe 2006: The Condition of Forests in Europe. 2006 Executive Report. http://www.icp-forests.org/pdf/ER2006.pdf
2) General economic activity – employment General - UN WPP 2005. World Population Prospects—Revised World Population Analytical
Report and Database 2004 - ILO 2005. World Employment Report 2004–2005. Employment, Productivity and Poverty Reduction. International Labor Organization, Geneva. - ILO 2007 Global Employment Trends 2007. International Labor Organization, Geneva. - Bhagwati 2007. Globalisation, not technology, is driving wages down. Financial Times, Jan 03, 2007 - Baldwin 2006. The great un-bundling(s); paper to the Globalisation Challenges for Europe and Finland; Graduate Institute of International Studies, Geneva. - EU: Long-term labor force projections for the 25 EU Member States; Carone, Labor and Demography 0512006; European Commission. - EP 2004: Population trends in Europe and their sensitivity to policy measures; European Parliament Report: Doc. 10182 Committee on Migration, Refugees and Population
FB-I - UNECE/ILO 2003. Employment Trends and Prospects in the European Forest Sector
Forestry - UNECE/ILO 2003. Employment Trends and Prospects in the European Forest Sector 3) Trade General - WTO 2006 World Trade Report
- UNCTAD Trade and Development Report 2006 - Blinder A. 2006. Offshoring: The Next Industrial Revolution? Foreign Affairs. March/April 2006 Vol. 85. No. 2, pp. 113–126
FB-I - Katila M. and Simula M. 2005. Sustainability Impact Assessment of Proposed WTO Negotiations: Final Report for the Forest Sector Study. Savcor Indufor for the European Commission. - IIED (forthcoming) How can trade promote sustainable forest management?, International Institute for Environment and Development, UK. - J. Perez-Garcia, 2001. The Effect of a Tariff Elimination Policy on the Forest Sector: A Global Perspective, CINTRAFOR, US. - Brooks DJ. et al., 2001. Economic and Environmental Effects of Accelerated Tariff Liberalization in the Forest Products Sector, USDA, PNW GTR-517. - Wardle – trade - Hashiramoto, O. Castano J. and Johnson S. 2004. Changing global picture of trade in wood products; Unasylva 55(219):
Forestry - FAO 2004a. Trade and Sustainable Forest Management—Impacts and Interactions. - White et al., 2006. China and the Global Market for Forest Products: Transforming Trade to Benefit Forests and Livelihoods, Forest Trends, US. - Stringer C. 2006. Forest certification and changing global commodity chains. Journal of Economic Geography 2006 6(5):701–722; - Wardle P. and B. Michie. (2001) World forest products trade and the changing role of roundwood. World Forests, Society and Environment Volume III. Kluwer Academic Publishing. Amsterdam and New York
4) Technology and know-how General - Battelle. 2002. Technology Forecasts. Strategic Technologies for 2020.
- EC-JRC 2003. The Future of Manufacturing in Europe 2015-2020. The Challenge for Sustainability. Institute for Prospective Studies. Joint Research Center, European Commission - IEA 2004. World Energy Outlook 2004 International Energy Agency - UNDP 2004. World Energy Assessment update, 2004 (with WEC), - WSIS 2003, World Summit on the Information Society Geneva Declaration of Principles, ITU, Geneva.
FB-I - FTP 2006a. Vision 2030 – A Document of the Forest Technology Platform

29
- FTP 2006b. Strategic Research Agenda and Annex. A Document of the Forest Technology Platform - Forest Products Industry Technology Roadmap. Prepared by Agenda 2020 Technology Alliance (A special project of the American Forest and Paper Association) and Energetics Incorporated. - Hetemäki L. and Nilsson S. (eds.) 2005. Information Technology and the Forest Sector. IUFRO World Series Vol. 18. Vienna, Austria
Forestry - Indufor, 2003, Transfer of Environmentally Sound Technologies from Developed Countries to Developing Countries; Background document for the Ad Hoc Expert Group on Finance and Environmentally Sound Technologies to the Secretariat of the United Nations Forum on Forests, Indufor, Helsinki, Finland.
D. Globalization factors – PESTE aspects not covered in globalization indicators 1) Policy and Institutions General - WEF 2007. World Economic Forum Global Competitiveness Report 2006–2007. FB-I - UNECE/FAO 2007. International Forest Sector Institutions and Policy Instruments
For Europe: A Source Book; GENEVA TIMBER AND FOREST DISCUSSION PAPER 43: UNECE/FAO, Geneva, CH
Forestry - UNECE/FAO 2007. International Forest Sector Institutions and Policy Instruments For Europe: A Source Book; GENEVA TIMBER AND FOREST DISCUSSION PAPER 43: UNECE/FAO, Geneva, CH - Bauer, J. and Kniivila, M. and Schmithüsen, F. 2004. Forest legislation in Europe: How 23 countries approach the obligation to reforest, public access and use of non-wood forest products. A study implemented in the framework of the European Forest Sector Outlook study (EFSOS). UNECE Geneva timber and forest discussion paper 37. Geneva 2004. 39 p.
2) Environment General - MEA. 2005. Millennium Ecosystem Assessment 2005
- IPCC 2007. Fourth Assessment Report. - IEA, 2004. Energy Security and Climate Change Policy Interactions. An Assessment Framework, International Energy Agency - EEA 2005. European Environment Outlook. European Environment Agency. 2005. Report No 4/2005. - The Copenhagen Institute for Futures Studies. Scenarios for Society and the Environment in 2020 - World Business Council for Sustainable Development (WBCSD). 1998. Global Environmental Scenarios 2000–2050. - UK 2006. Stern Review for UK Treasury. Economics of Climate Change
FB-I Forestry - MCPFE 2003. The State of Europe’s Forests. Liaison Unit Vienna.
- EEA. 2005: PRELUDE – Land Use Scenarios for Europe. European Environmental Agency - FAO 2006. Forest Resources Assessment Main Report. FAO Rome. - Gold S. 2003. The Development Of European Forest Resources, 1950 to 2000: A Better Information Base. ECE/TIM/DP/31; UNECE/FAO, Geneva - EEA 2007. Environmentally compatible bio-energy potential from European forests; European Environmental Agency, Copenhagen, DK
3) Social General - Eurobarometer 2003: FLASH EB N°151b «Globalization» Public Opinion Report FB-I - European Commission. 2002. Qualitative Study of the Image of Wood-based Industries
among the Public in the Member States of the European Union. Perception of the Wood-based Industries. Final Report. OPTEM. Directorate-General for Enterprise.
Forestry - MCPFE 2003. Europeans and their Forests. Liaison Unit Vienna.

30
Annex 4: Supporting Data: Baseline State of EU Forestry and Development Patterns A4.1. Forest Ownership and Management
Table A4.1. Forest ownership shares public–private. Source: FAO (2006).
Public % Private %
Portugal 7.3 92.7 Austria 19.6 80.4 Sweden 19.7 80.3 France 26 74 Slovenia 27.7 72.3 Denmark 28.4 71.6 Spain 30 67.9 Finland 32.1 67.8 Italy 35 65 United Kingdom 36.2 63.8 Belgium 43.5 56.5 Luxembourg 45.7 54.3 Netherlands 49.7 50.3 Germany 52.8 47.2 Latvia 54 45.1 Slovakia 52.4 43.2 Hungary 60.5 39.5 Ireland 64 36 Cyprus 61.2 38.8 Czech Republic 76.7 23.3 Lithuania 77.3 22.7 Greece 77.5 22.5 Estonia 37.5 22.4 Poland 83.2 16.8 Bulgaria 91,6 8.4 Romania 94.3 5.7 Malta 100 0

31
0 20 40 60 80 100 120
Portugal
Austria
Sw eden
France
Slovenia
Denmark
Spain
Finland
Italy
United Kingdom
Belgium
Luxembourg
Netherlands
Germany
Latvia
Slovakia
Hungary
Ireland
Cyprus
Czech Republic
Lithuania
Greece
Estonia
Poland
Bulgaria
Romania
Malta
Public %Private %
Figure A4.1. Forest ownership shares public–private. Source: FAO (2006).

32
Table A4.2. Average size of forest holdings (ha/holding). Source: MCPFE (2003).
Public Private Lithuania 28,547 3.7 Bulgaria 22,051 0.0 Poland 16,308 8.9 Estonia 10,989 10.8 Latvia 2,918 11.2 Ireland 2,612 12.5 Greece 2,434 934.4 Slovakia 1,811 24.0 Italy 1,636 8.8 UK 1,594 16.4 Slovenia 1,394 2.8 Hungary 1,224 14.1 Spain 643 30.8 Czech Rep 484 3.0 Denmark 461 14.9 Sweden 455 93.6 Germany 442 14.2 Cyprus 390 Belgium 343 2.5 France 265 3.7 Portugal 226 7.5 Luxembourg 139 3.4 Netherlands 68 5.7 Finland 36.7 Austria 18.8 Malta 17 Romania

33
Average forest holding size - private (ha/holding)0 20 40 60 80 100
Greece
Sweden
Finland
Spain
Slovakia
Aus tria
UK
Denm ark
Germ any
Hungary
Ireland
Latvia
Es tonia
Poland
Italy
Portugal
Netherlands
France
Lithuania
Luxem bourg
Czech Rep
Slovenia
Belg ium
Bulgaria
Cyprus
Malta
Figure A4.2. Average forest holding size (ha/holding). Note: Private forest holding size in
Greece is out of scale with 934 ha/holding. Source: MCPFE (2003).

34
A4.2. Growing stock and balance of increment and fellings Table A4.3. Total growing stock 2005. Source: FAO (2006)
million m3 Cyprus 8 Luxembourg 26 Ireland 65 Netherlands 65 Denmark 76 Belgium 172 Greece 177 Hungary 337 United Kingdom 340 Portugal 350 Slovenia 357 Lithuania 400 Estonia 447 Slovakia 494 Bulgaria 568 Latvia 599 Czech Republic 736 Spain 888 Austria 1,159 Romania 1,347 Italy 1,447 Poland 1,864 Finland 2,158 France 2,465 Sweden 3,155 Total 19,700

35
Gross annual increment and annual fellings 2000 (1000 m3 overbark)
0 20.000 40.000 60.000 80.000 100.000 120.000
Cyprus
Netherlands
Ireland
Greece
Denmark
Belgium
Slovenia
Estonia
Lithuania
Hungary
Bulgaria
Slovakia
Latvia
Portugal
UK
Czech Rep
Austria
Spain
Italy
Romania
Finland
Poland
Germany
Sw eden
France
Annual fellings (1000 m³ overbark)
Gross annual increment (1000 m³ overbark)
Figure A4.3. Gross annual increment and annual fellings. Source: MCPFE (2003).

36
T o ta l G ro w in g sto ck 2005
0 500 1000 1500 2000 2500 3000 3500
C y prus
Lux em bourg
Ire land
N etherlands
Denm ark
B elgium
G reec e
Hungary
Un ited K ingdom
P ortugal
S lovenia
Lithuania
E s tonia
S lovak ia
B ulgaria
Latvia
C z ec h Republic
S pain
A us tria
Rom ania
Ita ly
P o land
F in land
F ranc e
S w eden
M m ³To ta l 1 9 7 0 0 M m ³
Figure A4.4. Total growing stock 2005. Note: Germany is missing. Source: FAO (2006).

37
Table A4.4. Growing stock by area 2005. Source: FAO (2006).
m3/ha Cyprus 46 Greece 47 Spain 50 Portugal 93 Finland 96 Ireland 98 Sweden 115 United Kingdom 120 Italy 145 Denmark 153 Bulgaria 157 France 158 Hungary 171 Netherlands 178 Lithuania 190 Estonia 196 Poland 203 Latvia 204 Romania 212 Malta 231 Slovakia 256 Belgium 258 Czech Republic 278 Slovenia 283 Luxembourg 299 Austria 300

38
Table A4.5. Growing stock of which is commercial. Source: FAO (2006).
% Cyprus 39 Bulgaria 61.1 Portugal 66.3 Italy 70.1 Denmark 76.1 Sweden 76.8 Spain 77.6 Netherlands 80 Finland 84.1 Slovakia 84.7 Latvia 85.3 Lithuania 86 Greece 88.1 United Kingdom 88.2 Slovenia 91.3 France 93.5 Estonia 93.7 Poland 94.4 Czech Republic 96.7 Hungary 97.6 Austria 97.7 Romania 98 Belgium 100 Luxembourg 100

39
Figure A4.5. Development of forest area, growing stock (per ha) and net annual increment
(per ha) in Europe 1950–1995 (1950 = 100%). Source: Gold (2003).

40
Growing stock by area 2005
0 50 100 150 200 250 300 350
Germany
Cyprus
Greece
Spain
Portugal
Finland
Ireland
Sweden
United Kingdom
Italy
Denmark
Bulgaria
France
Hungary
Netherlands
Lithuania
Estonia
Poland
Latvia
Romania
Malta
Slovakia
Belgium
Czech Republic
Slovenia
Luxembourg
Austria
m³ / ha
Figure A4.6. Growing stock (m3) per ha forest 2005. Source: FAO (2006).

41
Table A4.6 Gross annual increment and annual fellings. Source: MCPFE (2003).
Gross annual increment
(1,000 m3 overbark) Annual fellings
(1,000 m3 overbark) Luxembourg 0 0 Malta 0 0 Cyprus 109 35 Netherlands 2,538 1,561 Ireland 3,500 3,089 Greece 4,118 Denmark 4,946 1,715 Belgium 5,289 3,701 Slovenia 6,925 2,614 Estonia 9,830 4,028 Lithuania 11,904 5,972 Hungary 11,973 7,287 Bulgaria 12,310 4,852 Slovakia 13,601 8,525 Latvia 16,500 8,010 Portugal 19,054 12,733 United Kingdom 21,300 9,500 Czech Republic 22,915 16,345 Austria 29,433 19,821 Spain 30,120 12,639 Italy 30,822 8,746 Romania 34,650 8,525 Finland 79,129 67,500 Poland 80,439 36,810 Germany 100,722 48,584 Sweden 101,598 72,345 France 102,096 65,006 European Total 755,821 429,943

42
A4.4. Investment
A.2.1 Domestic investment and gross fixed capital formation
Figure A4.7. Public funding and number of programs (1990–99, million € in 1999 prices)
(excluding tax concessions). Source: EFI (2005).
Figure A4.8. Public financing per hectare of forest (1990–99, €/ha in 1999 prices). Source:
EFI (2005)

43
Figure A4.9. Public financing per hectare of forest for private and public ownership and the
category of joint forestry programs directed to both private and public ownership (1990–1999, €/ha in 1999 prices). Source: EFI (2005).
Figure A4.10.The sources of public funding (1990–99, million € in 1999 prices, %). Source:
EFI (2005).

44
Figure A4.11. The aggregate distribution of public funding (1990–1999) by types of
activities supported in 12 countries (Czech Republic, Estonia, Slovenia, Poland, France, Belgium, Germany, Switzerland, Netherlands, Finland, Norway, Catalonia). Source: EFI (2005).

45
Table A4.7. Investment of the forest industries in Finland 1975–2004 (woodworking and pulp and paper industries), million €. Source: METLA (2006a).
Forest industries investment, million €
1975 343 1976 324 1977 413 1978 226 1979 311 1980 461 1981 565 1982 571 1983 456 1984 563 1985 701 1986 679 1987 883 1988 1,052 1989 1,460 1990 1,355 1991 1,054 1992 846 1993 795 1994 750 1995 984 1996 1,514 1997 1,041 1998 1,125 1999 851 2000 900 2001 1,498 2002 742 2003 751 2004 710

46
A4.4 Economic Activity
A4.4.1. Status and change in value added Table A4.8. Gross value added at basic prices in million €. Source: MCPFE (2003).
were available millions of euros, except millions of national currency for Sweden1990 1991 1992 1993 1994 1995 1996 1997 1998 1999 2000
Belgium 140,3 134,7 157,6 151,8 157,9 120Finland 2204,1 1679,4 1596,8 1569,9 1921,7 2186,1 2057,5 2340,3 2528 2539,3 2656,2France 2547,3 2520,9 2467,1 2253,5 2959,5 3142 2766,8 2935,7 3061,3 3011,2 2318Greece 107,1 103,5 112,6 115,5Italy 296,5 338,4 370,1 377,3 419,1 393,4 464,2 467,6 470,9 448,9 416,7Luxembourg 13,1
1990 1991 1992 1993 1994 1995 1996 1997 1998 1999 2000Sweden 14774,30 14293,58 13976,90 12925,10 16195,00 20890,20 16995,20 18400,20 18122,80 17333,90
Economic accounts for forestry. Gross value added at basic prices in countries where data
0
500
1000
1500
2000
2500
3000
3500
1990
1991
1992
1993
1994
1995
1996
1997
1998
1999
2000
BelgiumFinlandFranceGreeceItaly
Figure A4.12 Gross value added of forestry at basic prices in million €. Source: MCPFE
(2003).

47
A4. 2. Production statistics (roundwood, wood fuel, non-wood goods, services) A4.2.1 Roundwood Table A4.9. Production of roundwood 2000–2004. Source: FAO (2006).
Country 2000 2002 2004 change 2000–2004 (%)
Austria 13,276,000 14,846,000 16,483,000 24.2 Belgium 4,510,000 4,500,000 4,850,000 7.5 Bulgaria 4,783,890 4,832,890 4,832,890 1.0 Cyprus 20,580 15,430 10,058 -51.1 Czech Republic 14,441,000 14,541,000 15,601,000 8.0 Denmark 2,952,000 1,446,223 1,626,940 -44.9 Estonia 8,910,000 10,500,000 6,800,000 -23.7 Finland 54,261,855 53,011,000 53,799,662 -0.9 France 45,828,000 35,449,000 33,647,000 -26.6 Germany 53,710,000 42,380,000 54,504,000 1.5 Greece 2,244,935 1,591,297 1,525,588 -32.0 Hungary 5,902,000 5,836,400 5,660,300 -4.1 Ireland 2,673,100 2,646,100 2,562,035 -4.2 Italy 9,329,000 7,511,000 8,697,393 -6.8 Latvia 14,304,000 13,465,900 12,754,000 -10.8 Lithuania 5,500,000 6,115,000 6,120,000 11.3 Luxembourg 259,700 257,044 276,610 6.5 Malta 0 0 0 Netherlands 1,039,000 839,000 1,025,724 -1.3 Poland 26,025,000 27,137,000 32,733,000 25.8 Portugal 10,831,000 8,742,000 11,553,000 6.7 Romania 13,148,200 15,154,000 15,809,000 20.2 Slovakia 6,163,000 5,782,000 7,240,000 17.5 Slovenia 2,253,000 2,283,000 2,551,000 13.2 Spain 14,321,000 15,839,000 16,290,000 13.7 Sweden 63,300,000 66,600,000 67,300,000 6.3 United Kingdom 7,811,000 7,802,000 8,273,000 5.9 Total 387,797,260 369,122,284 392,525,200

48
Table A4.10. Roundwood removals 1990–2003 in 1000 m3. Source: UNECE Timber Database (2004).
Roundwood removals 1000 m3 1990 1991 1992 1993 1994 1995 1996 1997 1998 1999 2000 2001 2002 2003
Austria 16773 15572 12849 12856 14960 14405 15609 15325 14033 14083 13276 13467 14846 17055 Belgium 4800 4510 4215 4500 4765 Bulgaria 4089 3650 3545 3547 2685 2838 3205 3041 3231 4351.66 4783.88 3991.88 4832.88 4832.88 Cyprus 62.8 53.8 44.8 52.9 47 48 45.1 41 35.34 36.45 20.58 18.31 15.42 11.99 Czech Republic 9800 10406 11950 12365 12600 13491 13991 14203 14441 14374 14541 15140 Denmark 2255 2309 2228 2281 2282 2282 2282 2207 1558 1560 2952 1613 1446 1446 Estonia 2146 2439 3550 3709 3901 5505 6061 6704 8910 10200 10500 10200 Finland 43230 34863 38482 42244 48745 50219 46272 51798 53660 53637 54261.9 52210 53011 53779 France 44713 43554 42396 39363 42242 36061 33143 34932 35526.7 36007.6 45828 39831 35449 36850 Germany 33618 32954 33152 39813 39343 37014 38207 39052 37634 53710 39483 42380 42380 Greece 2492 2546 2193 2096 2091 1961 2012 1885 1692 2214 2244.93 1915.52 1591 1673 Hungary 5973 5490 5006 4496 4527 4331 3652 4251 4167 5230.8 5902 5811 5836.4 5785 Ireland 1625 1670 1960 1821 2018 2204 2291 2180 2266 2584 2673.1 2455 2647 2684 Italy 7972 8327 8357 8818 9465 9736 9121 9146 9550 11138 9329 8099 7511 8219 Latvia 2471 4931 5700 6890 8080 8922 10030 14008 14304 12841 13465.9 12915.8 Lithuania 2329 3992 5960 5540 5149 4879 4924 5500 5700 6115 6275 Luxembourg 259 259.7 142.15 140 136 Malta 0 0 0 0 0 0 0 0 0 0 0 0 0 0 Netherlands 1420 1123 1253 1075 1043 1104 952 1109 1023 1044 1039 865 839 914 Poland 17617 17026 18778 18590 18776 20651 20287 21635 23107 24268 26025 25016 27137 28835 Portugal 11205 10809 10278 10207 9819 9350 8978 8978 8548 8978 10831 8946 8742 8742 Romania 12608 12961 12440 8840 11925 12178 12250 13529 11649 12703.5 13148.2 12424 15154 13961 Slovakia 4755 5249 5316 5323 5461 5943 5519 5795 6163 5787.9 5782 6355 Slovenia 1671 1065 1944 1866 1991 2208 2133 2068 2253 2257 2283 2591 Spain 15590 15188 13822 13757 15307 16075 15631 15631 14874 14810 14321 15131 15839 16105 Sweden 52871 51400 53520 54000 55900 63600 56300 60200 60600 58700 63300 63200 66600 67300 United Kingdom 6350 6372 6544 6764 7308 7555 7093 7482 7260 7482 7481 7559 7360 7566

49
Roundwood removals 1964-2003 (1000 m³)
0
10000
20000
30000
40000
50000
60000
70000
80000
1964
1966
1968
1970
1972
1974
1976
1978
1980
1982
1984
1986
1988
1990
1992
1994
1996
1998
2000
2002
AustriaBelgiumBulgariaCyprusCzech RepublicDenmarkEstoniaFinlandFranceGermanyGreeceHungaryIrelandItalyLatviaLithuaniaLuxembourgMaltaNetherlandsPolandPortugalRomaniaSlovakiaSloveniaSpainSwedenUnited Kingdom
Figure A4.13. Roundwood removals 1964–2003 in 1000 m3. Source: UNECE Timber Database (2004).

50
A4.2.2 Wood fuel and solid biomass for energy Table A4.11. Wood fuel 1990–2003, including wood for charcoal removals in 1000 m3. Source: UNECE Timber Database (2004).
Wood fuel, including wood for charcoal removals 1000m³ 1990 1991 1992 1993 1994 1995 1996 1997 1998 1999 2000 2001 2002 2003 Austria 2613 2437 2994 3149 3259 3059 3797 3423 3175 3095 2860 2905 3036 3336 Belgium 550 550 550 550 550 Belgium & Luxembourg 550 550 550 550 550 500 500 550 550 Bulgaria 1503 1450 1870 1710 887 868 1185 1179 1388.33 1101 2107 1635 2187 2187 Cyprus 14.8 12.1 11.2 13.9 11.1 10.9 9.9 9.69 8.31 8.03 5.43 6.55 5.21 4.27 Czech Republic 980 700 778 649 718 610 820 840 940 1010 1007 1180 Denmark 449 450 485 463 485 485 485 563 492 324 460 617 657 657 Estonia 807 1048 544 573 604 1370 693 804 1640 1880 1900 1900 Finland 2984 2922 2878 4161 4101 4095 4094 4041 4119.11 4044 4114.78 4483 4482 4533 France 9800 9800 9800 9800 9800 2500 2500 2770 2809.03 2770.8 2388 2360 2713 2900 Germany 3795 3795 3795 3795 2429 2476 2719 2611 2571 2622 2981 4625 4625 Greece 1346 1350 1509 1397 1354 1330 1338 1236 1197 1403 1601.4 1400.59 1093 1074 Hungary 2455 2291 2175 2230 2066 1948 1852 1909 1871 2575.8 2596.9 2319 2398.2 2781 Ireland 50 50 50 57 60 64 66 63 73 73 73 32 34 30 Italy 3637 4239 4832 4698 5481 5263 4958 5222 5183 6925 5680 5150 4883 5580 Latvia 700 1100 1110 1200 2530 2865 2845 2490 1680 1580 1198 990.81 Lithuania 1780 1736 1090 1230 1149 1170 1124 1450 1480 1295 1320 Luxembourg 18 18 6.72 4 7 Malta 0 0 0 0 0 0 0 0 0 0 0 0 0 0 Netherlands 145 127 161 175 180 163 123 123 150 162 160 136 136 160 Poland 2068 2692 3058 2650 2065 1411 1463 1538 1314 1426 1536 1641 2142 2350 Portugal 500 500 500 500 500 500 550 550 600 600 600 600 600 600 Romania 1883 2000 2000 1100 2285 2163 2809 3692 3020 3220 3032.2 2618 3062 2399 Slovakia 552 490 628 436 505 339 249 261 277 268 259 304 Slovenia 520 107 235 227 362 546 539 505 532 295 280 359 Spain 1800 2200 2198 2338 2317 3078 3198 3198 1710 1650 1600 1855 1989 2030 Sweden 3800 3800 3800 3800 3800 3800 3800 3800 5900 5900 5900 5900 5900 5900 United Kingdom 225 250 230 232 232 232 232 232 233 234 234 234 233 233

51
Wood fuel removal 1964-2003 in 1000m³
0
2000
4000
6000
8000
10000
12000
14000
16000
1964
1966
1968
1970
1972
1974
1976
1978
1980
1982
1984
1986
1988
1990
1992
1994
1996
1998
2000
2002
Austria
Belgium
Belgium &LuxembourgBulgaria
Cyprus
Czech Rep
Denmark
Estonia
Finland
France
Germany
Greece
Hungary
Ireland
Italy
Latvia
Lithuania
Luxembourg
Malta
Netherlands
Poland
Portugal
Romania
Slovakia
Slovenia
Spain
Sweden
UK
Figure A4.14. Wood fuel removal 1964–2003 in 1000 m3. Source: UNECE Timber
Database (2004).

52
Table A4.12. Primary energy production of solid biomass in the EU in MToe. Source: EurObserver (2007).
Country 2004 2005 Growth France 9.68 9.67 0.00 Sweden 7.47 7.94 0.00 Germany 6.13 7.86 0.28 Finland 7.36 6.61 0.00 Poland 4.1 4.3 0.1 Spain 4.137 4.176 0.90% Austria 3.25 3.507 7.90% Portugal 2.683 2.715 1.20% Czech Republic 1.418 1.46 3.00% Latvia 1.394 1.394 0.00% Denmark 1.2 1.264 5.30% Netherlands 0.724 1.142 57.70% Hungary 0.821 1.112 35.50% Italy 0.942 1.005 6.70% Greece 0.917 0.957 4.40% Lithuania 0.705 0.736 4.40% United Kingdom 0.704 0.719 2.10% Estonia 0.597 0.597 0.00% Belgium 0.368 0.528 36.60% Slovenia 0.463 0.467 0.90% Slovakia 0.345 0.398 15.40% Ireland 0.186 0.217 16.40% Luxembourg 0.015 0.015 0.00% Total 55.587 58.783 5.7%

53
Primary energy production from solid biomass in the EU25 (MTOE)
0 2 4 6 8 10
France
Sweden
Germany
Finland
Poland
Spain
Austria
Portugal
CZ Rep.
Latvia
Denmark
Netherlands
Hungary
Italy
Greece
Lithuania
UK
Estonia
Belgium
Slovenia
Slovakia
Ireland
Luxembourg
20042005
Figure A4.15. Primary energy production of solid biomass in the EU in MToe. Source: EurObserver (2007).

54
A4.2.3. Non-wood forest products Table A4.13. Removals of non-wood forest products as percentage of industrial
roundwood value.
Removals: NWFP value as % of Industrial RW
value Denmark 401.5 Spain 57.8 Netherlands 51.5 Slovenia 44.6 United Kingdom 29.7 Czech Republic 17 Sweden 7.2 Finland 5.9 Slovakia 3.8 Poland 2.6 Estonia 1.8 Lithuania 1.1
Removals: NWFP value in % of Industrial RW value
0 50 100 150 200 250 300 350 400
Denmark
Spain
Netherlands
Slovenia
United Kingdom
Czech Republic
Sweden
Finland
Slovakia
Poland
Estonia
Lithuania
Figure A4.16. Non-wood forest products removals in % of industrial round wood
value Source: FAO (2006).

55
A4.3. Productivity Table A4.14. Labor productivity in m3 wood/person/year, calculated from FAO (2006).
m3/person/year Sweden 4151 Finland 2525 Austria 2104 France 1667 Estonia 1240 Portugal 955 Belgium 882 Slovenia 849 United Kingdom 706 Germany 697 Ireland 695 Spain 619 Latvia 609 Denmark 525 Netherlands 574 Czech Republic 512 Poland 498 Hungary 492 Lithuania 441 Romania 304 Italy 279 Slovakia 228 Bulgaria 55 Cyprus 28
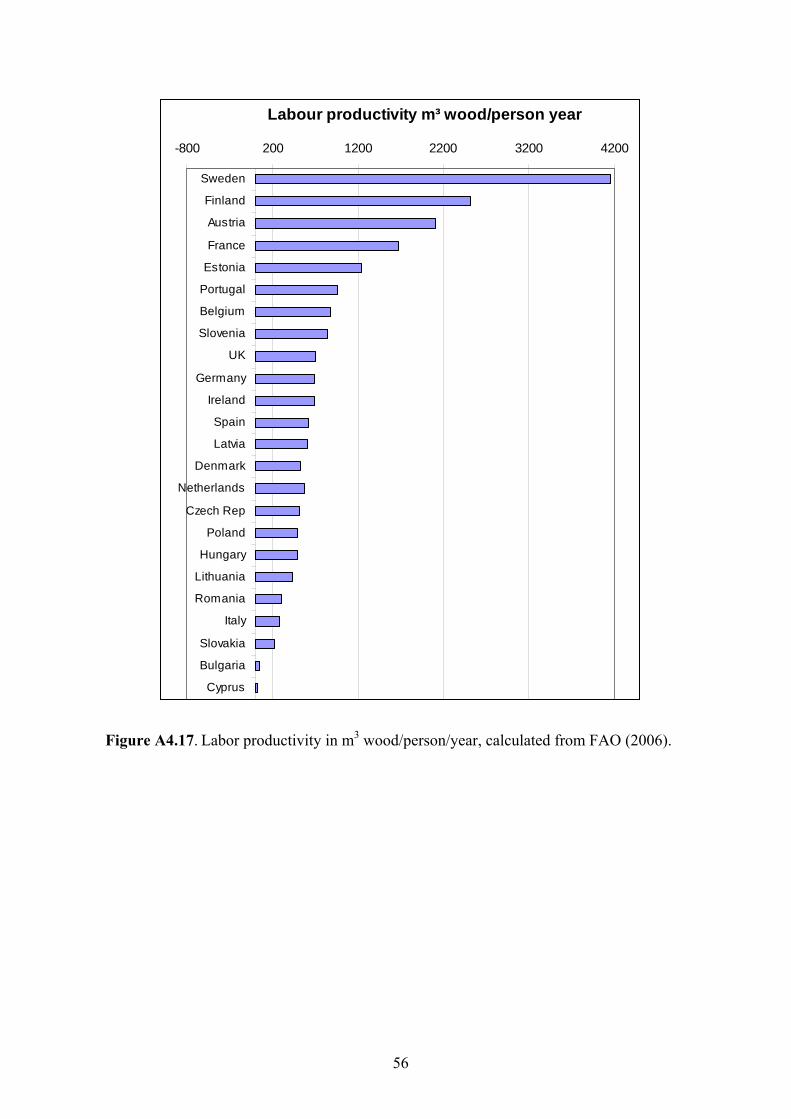
56
Labour productivity m³ wood/person year
-800 200 1200 2200 3200 4200
Sweden
Finland
Austria
France
Estonia
Portugal
Belgium
Slovenia
UK
Germany
Ireland
Spain
Latvia
Denmark
Netherlands
Czech Rep
Poland
Hungary
Lithuania
Romania
Italy
Slovakia
Bulgaria
Cyprus
Figure A4.17. Labor productivity in m3 wood/person/year, calculated from FAO (2006).

57
A4.4. Employment Table A4.15. Employment in forestry 1990 and 2000 in 1,000 person-years. Source: FAO
(2006).
1990 2000
Germany 70 Bulgaria 69 Poland 134 60 Romania 89 47 Italy 56 36 France 33 35 Czech Republic 52 31 Spain 36 29 Slovakia 36 27 Finland 39 24 Latvia 15 19 Sweden 34 17 Lithuania 15 14 Hungary 46 12 United Kingdom 19 12 Portugal 16 11 Estonia 11 9 Austria 10 8 Belgium 4 4 Denmark 4 4 Ireland 3 4 Slovenia 6 3 Netherlands 2 2 Cyprus 1 1 Greece Luxembourg Malta

58
Employment in forestry 1990 and 20000 20 40 60 80 100 120 140
Germany
Bulgaria
Poland
Romania
Italy
France
Czech Rep.
Spain
Slovakia
Finland
Latvia
Sweden
Lithuania
Hungary
UK
Portugal
Estonia
Austria
Belgium
Denmark
Ireland
Slovenia
Netherlands
Cyprus
Greece
Luxembourg
Malta
19902000
Figure A4.18. Employment in forestry in EU27 in 1990 and 2000 in 1,000 person-years. Source: FAO (2006).

59
Table A4.16. Employment in forestry as proportion of total labor force. Source: FAO (2004).
Country 1995 1998 2000
Austria 1.4 1.7 1.6 Belgium & Luxembourg 0.8 0.8 0.7 Bulgaria 1.3 1.4 1.2 Czech Republic 1.6 1.6 1.3 Denmark 1.0 1.0 1.0 Estonia 3.3 3.9 4.1 Finland 3.6 3.5 3.5 France 0.8 0.6 0.6 Germany 0.9 0.8 0.9 Greece 0.5 0.4 0.5 Hungary 1.1 0.9 0.9 Ireland 0.8 0.8 0.8 Italy 0.9 0.9 0.9 Latvia 2.3 3.2 3.7 Lithuania 2.0 1.7 1.6 Malta 0.3 0.3 0.0 Netherlands 0.5 0.5 0.5 Poland 0.9 0.8 0.8 Portugal 1.6 1.6 1.5 Romania 1.8 1.5 1.3 Slovakia 1.9 1.7 1.6 Slovenia 2.1 2.0 2.0 Spain 0.9 0.9 1.0 Sweden 2.1 2.1 2.1 United Kingdom 0.8 0.7 0.6 European average 1.4 1.4 1.4
Note: Expressed as percentage of the total labor force, as defined in ISIC Division 02.

60
Table A4.17. Employment in forestry 1990 and 2000. Source: MCPFE (2003).
1000 person-years Total Total
1990 2000 Austria 10 8 Belgium 4 4 Bulgaria - 69 Cyprus 1 1 Czech Republic 52 31 Denmark 4 4 Estonia 11 9 Finland 39 24 France 33 35 Germany - 70 Greece - - Hungary 46 12 Ireland 3 4 Italy 56 36 Latvia 15 19 Lithuania 15 14 Luxembourg - - Malta - - Netherlands 2 2 Poland 134 60 Portugal 16 11 Romania 89 47 Slovakia 36 27 Slovenia 6 3 Spain 36 29 Sweden 34 17 United Kingdom 19 12
A4.5. Cost and price development Table A4.18. UK Forestry Commission Funding public forests―Net expenditure 2001–
2006. Source: Forestry Commission (2006).
2001–02 2002–03 2003–04 2004–05 2005–06Forest management and development 57.8 77.6 61.8 53.4 56.1
Recreation, conservation, and heritage 18.5 21.5 25 30.6 32.4
Harvesting and haulage 42.7 43.4 41.9 42.4 39 Total 119.0 142.5 128.7 126.4 127.5

61
A4.5.1 Case: Profitability of forestry in UK Table A4.19. UK Three-year rolling annualized returns from forestry 1992–2005, % per
annum total return. Source: Forestry Commission (2006).
Total return %/year 1992–95 4.4 1993–96 9.9 1994–97 7.9 1995–98 4.5 1996–99 -3 1997–00 -5.2 1998–01 -5.4 1999–02 -3.2 2000–03 -1.7 2001–04 1.9 2002–05 8.2
Roundwood log price Spruce €/m³ 1990-2006
0102030405060708090
Dec
199
0
Dec
199
1
Dec
199
2
Dec
199
3
Dec
199
4
Dec
199
5
Dec
199
6
Dec
199
7
Dec
199
8
Dec
199
9
Dec
200
0
Dec
200
1
Dec
200
2
Dec
200
3
Dec
200
4
Feb.
05
Jun.
05
Mar
200
6
Jun.
06
AustriaFinlandLithuania
Figure A4.19. Roundwood nominal log price for spruce 1990–2006 in €/m3. Source:
UNECE/FAO Price Database (2004).

62
Figure A4.20. UK Coniferous standing sales and sawlog price indices in real terms 1982–2006. Source: Forestry Commission (2006).
UK net expenditure public forests 2001-2006 (mil. pound)
0
10
20
30
40
50
60
70
80
90
2001-02 2002-03 2003-04 2004-05 2005-06
Forest management& development
Recreation,conservation &heritage Harvesting & haulage
Figure A4.21. UK Forestry Commission Funding public forests―Net expenditure 2001–2006. Source: Forestry Commission (2006).

63
Figure A4.22 Finland: Overall real return on timber production, 1995–2007 at 2005 prices.
Source: METLA (2006b).
UK: Total return from forestry 1992-2005 (%/yr)
-8
-6
-4
-2
0
2
4
6
8
10
12
1992-95
1993-96
1994-97
1995-98
1996-99
1997-00
1998-01
1999-02
2000-03
2001-04
2002-05
Figure A4.23. UK Three-year rolling annualized returns from forestry 1992–2005, % per
annum total return. Source: Forestry Commission (2006).

64
Figure A4.24. Austria: Production, gross value added an net entrepreneurial income at current prices 1988–2004, in million €. Source: Sekot (2005).

65
A.4.6 Trade
A.4.6.1 Import Table A4.20. Roundwood Import 1990–2003 in 1000 m3. Source: UNECE Timber Database (2004). Roundwood import (1000 m3) 1990 1991 1992 1993 1994 1995 1996 1997 1998 1999 2000 2001 2002 2003Austria 4076.9 5662.9 4902 4786 5081 4618 4747 5433 5237 7210 8590 7666 7659 7929Belgium 3410 4024 4545.4 2684 2779Bulgaria 68.19 68.89 63.99 0.21 2 2 2 2 0 51 105 124.06 71 71Cyprus 2.9 3.2 2.02 2.21 4.3 3.5 3.7 13.8 0 0 2.1 3.1 2.28 2.28Czech Republic 120 358.05 275 335 218 505 784 817 954 976 994 597Denmark 308 310.6 350.46 222 484.4 680.5 653 866 804 753 637 533 596 877Estonia 0 3 18.89 13.8 34.9 110 298.1 380.24 346.48 582.88 639.06 941.1Finland 5714.3 5071.5 5950 5502 6787 9389 6613 6775 9347.1 10301 10005 11993 12688 13043France 1453 2106 1971.3 1465.3 2000 2350.5 1605.1 1815.5 1996.2 2175.7 2043.2 2008.8 2020 2254Germany 2190.4 2322.9 1156.7 2782 1776 1304 1815 2304 2756 3596 3566 2703 2530Greece 300.6 322.8 366.23 72.55 23.41 24.9 24.6 93.2 500.1 515 445.37 631.89 459.76 493Hungary 958 1191 1147.1 349.6 141.69 239 228.7 294.39 320.7 361.2 353.7 317 332 530Ireland 6 6 5.11 48.24 63 50 3 78 112 322 107 100.02 143 273Italy 6134 6003 6137 4873.8 6223 5058 5156 4742 5456 5320 6295 5721 5308 4994Latvia 1.37 0.03 0.5 50.5 7.3 38.5 81 145 136.03 213.59 387.31 464.98Lithuania 0.95 0 7.3 16.2 18.89 102.7 90.1 77.86 60.57 96.29 103.7 78Luxembourg 458 763.8 706.58 943.42 1527Malta 0.3 0.3 0.47 1.2 4.3 2.2 1.5 0.8 0.57 1.19 4.33 4.38 4.36 4.36Netherlands 661.59 668.9 735.14 542 499 465 413.9 463 590 491 388 440.8 539 402Poland 54.2 74.3 72.02 1.31 27.03 379.6 393.5 288 371.5 591.2 732.4 882.2 726.6 668.6Portugal 741.4 519.1 561.8 420.86 1108 1638 1067 1680 2123.9 1433 1342.1 1152 1080 1080Romania 70 67 50.56 30.25 17.5 79.8 65.3 25.7 1.6 2 20.39 25 88 21Slovakia 0 1.05 21.9 8.69 3.4 287.29 138.4 127 129 1828 134 160Slovenia 0 0 216.45 131.22 289 324 258 333 293.89 490.83 495.91 439.72 423.76 485.51Spain 2542.8 2229 2126 1432 1522.6 2265.4 1973.8 2136.5 4150 3243 3789.3 4201 3380 3319Sweden 3645.7 4002 4585.4 4310 6677 7667 5066 7745 9300.7 10428 11898 9660.8 10171 9697United Kingdom 144.6 139.2 210.8 254 321 673 848 587 468 317 309 363.4 496 712

66
Roundwood import 1964-2003 (1000 m3)
0
2000
4000
6000
8000
10000
12000
14000
1964
1967
1970
1973
1976
1979
1982
1985
1988
1991
1994
1997
2000
2003
AustriaBelgiumBulgariaCyprusCzech RepublicDenmarkEstoniaFinlandFranceGermanyGreeceHungaryIrelandItalyLatviaLithuaniaLuxembourgMaltaNetherlandsPolandPortugalRomaniaSlovakiaSloveniaSpainSwedenUnited Kingdom
Figure A4.25. Roundwood import 1964–2003 in 1000 m3. Source: UNECE Timber
Database (2004).

67
Table A4.21. Wood fuel imports 1990–2003, including wood for charcoal in 1000 m3. Source: UNECE Timber Database (2004). Wood fuel imports, including wood for charcoal (1000 m3) 1990 1991 1992 1993 1994 1995 1996 1997 1998 1999 2000 2001 2002 2003Austria 215 245 283.11 303 253 164 296 156 124 117 139 173 224 299Belgium 17 32 40.93 31 25Bulgaria 0 0 0.69 0 0 0 0 0 0 0 0 0 0Cyprus 0 0 0.02 0.02 0 0 0 0 0 0.03 0.03 0.03Czech Republic 0 0.05 8 5 5 1 3 2 4 4 3 0Denmark 17 26.6 40.46 40 36 26 104 104 75 89 107 85 139 290Estonia 3 1.9 0.6 0.6 1.2 1.1 0.12 0 0.03 0.09 0.04Finland 29 58 21 34 26 36 38 41 112.5 141 129.39 123.84 102 175France 6 17 16.3 19.3 11 5.5 4.09 9.5 16.6 21.66 30.96 15.22 27 31Germany 26.4 23.5 30.7 40 33 41 45 49 34 47 73 80 86Greece 0.1 0.1 43.53 0.88 0.52 1.9 1.6 0.2 217 223 206.05 267.08 146.67 145Hungary 0 0 0.1 2.6 0.5 0.4 10 36.2 2.6 3.3 9.3 8 12 41Ireland 0 0 0.11 0.24 0 0 0 1 0 2 1 1.01 1 1Italy 418 559 322 204 155 122 220 238 368 490 510 605 636Latvia 0 0 0 0 0.5 0 0.15 0.03 0.03 5.78Lithuania 0 0.1 1 0.4 2.9 3.8 2.43 0.56 0.14 0.1 1Luxembourg 0 10.4 27.34 41.42 51Malta 0 0 0.17 0.1 1.9 0.1 0 0.1 0.1 0.07 0.11 0.1 0.1Netherlands 1.5 4 6.74 1 2 2 4.9 61 64 63 5 5.7 8 9Poland 0 0 0.02 0.03 0.03 3.7 0.4 0 0.5 1.1 0.1 0.2 0.2 5.9Portugal 0 0 2.4 1 3 6 2 1 2.1 1 1.71 43 13 13Romania 0 0 0.56 0.07 0 0 0 0 0 0 0 0 0 0Slovakia 0 0.02 0 0 0 4.4 0 0 0 278 0 0Slovenia 2.45 1.22 9 9 10 4 9.69 17.76 1.5 0.89 0.63 1.09Spain 4.8 2 145 151 96.6 73.4 71.8 20.5 14 15 18.31 73 6 24Sweden 0.5 3 2.42 37 11 14 48 90 128.69 148 177 155.84 466 676United Kingdom 1.9 2.8 2 8 10 11 12 11 8.8 3 20 10.1 3 3


69
Wood fuel imports 1964-2003 (1000 m3)
0
100
200
300
400
500
600
700
800
900
1964
1967
1970
1973
1976
1979
1982
1985
1988
1991
1994
1997
2000
2003
AustriaBelgiumBulgariaCyprusCzech RepublicDenmarkEstoniaFinlandFranceGermanyGreeceHungaryIrelandItalyLatviaLithuaniaLuxembourgMaltaNetherlandsPolandPortugalRomaniaSlovakiaSloveniaSpainSwedenUnited Kingdom
Figure A4.26. Wood fuel imports 1964–2003 in 1000 m3. Source: UNECE Timber Database
(2004).

70
A.4.6.2. Export Table A4.22. Roundwood export 1990–2003 in 1000 m3. Source: UNECE Timber Database (2004). Roundwood export (1000 m3) 1990 1991 1992 1993 1994 1995 1996 1997 1998 1999 2000 2001 2002 2003Austria 1070.9 766.9 745.16 553 637 498 638 828 803 1050 942 957 1069 1098Belgium 1268 1181 1041.1 1086 1117Bulgaria 106.5 82.69 142.9 202 23 92.19 243.9 256.1 256.1 227 360 308.04 224.27 224.27Cyprus 0 0 0.17 0 0 0 0 0 0 0 0 0.06 0 0Czech Republic 270 1263 725 2335 2817 2827 2661 2798 2030 2485 2514 3174Denmark 407.4 506.1 449.02 197.35 292 324.8 222 236 288 290 877 726 574 615Estonia 0 531.31 1108.6 1745.6 2657.3 1927 3041 3874.8 4016.2 4432 3682.9 3359.5 3365Finland 283.59 147.8 331.6 912.6 1445 866 582 644 716.8 768.36 533.27 404.09 408 442France 5189 5031.1 4302.6 2286.1 2824.9 2935.9 2573.4 2654.6 3257.5 3441.8 5859.1 5429.2 4619 4338Germany 8461 6578 4417 4740 4983 3046 4063 4902 4598 5604 4954 4932 4125Greece 43.2 47.6 42.66 28.58 63 59.6 59.6 57 223.4 232 9.84 3.7 16.09 28Hungary 1307 1164 1334.8 802.4 609.4 694.7 804.8 858.9 1418.9 1331.9 1593.4 1515 1575 1753Ireland 271 274 415.13 188.85 124.2 304 250 262 91 176 42 51.5 129 92Italy 27.69 38.4 46.44 21.85 9.5 5 7 10 16 15 24.38 23 16 11Latvia 0 478.08 1219.5 2665 2820 1946 3139 4251 3751 4353.2 4095.5 4468.6 4461.1Lithuania 0 285.29 285.44 889.4 1769.5 955.59 767.2 793.2 939.74 1202.9 1324.7 1436.5 1407Luxembourg 291 228.35 267.77 210 283Malta 0 0 0 0 0 0 0 0 0 0 0 0 0 0Netherlands 555.6 485.29 528.37 444 395 391 290.6 321 333.5 291 242 430.5 386 414Poland 595.5 862.9 1047.2 593.46 759 239.2 237.39 288.7 362.6 390.8 347.2 310 723.3 1008.5Portugal 402 429 563.56 401.24 643 798 471.5 646 585.4 557 570.1 812 807 807Romania 2 2 0.05 1.15 0 0 0 13 161 603.4 535.1 112 94.6 211Slovakia 0 322.17 1110 919 567 1081 735 1232 1612 1828 1286 1189Slovenia 354.95 206 212 173.7 182 301 324.89 325.47 303.97 321.19 361.5 384.5Spain 31.5 21.5 28.09 69 332.2 536.7 250.9 532.29 584 387 369 508 256 255Sweden 802.3 748 649.91 843 1068 1738 1631 1404 1454.5 1335 1461.8 1340.4 1785 1533United Kingdom 123.9 150.19 143.7 38 50.3 62.4 54.4 70 356.3 289 362 266.96 233 481

71
Roundwood export 1964-2003 (1000 m3)
0
1000
2000
3000
4000
5000
6000
7000
8000
9000
1964
1967
1970
1973
1976
1979
1982
1985
1988
1991
1994
1997
2000
2003
Austria
Belgium
Bulgaria
Cyprus
Czech Republic
Denmark
Estonia
Finland
France
Germany
Greece
Hungary
Ireland
Italy
Latvia
Lithuania
Luxembourg
Malta
Netherlands
Poland
Portugal
Romania
Slovakia
Slovenia
Spain
Sw eden
United Kingdom
Figure A4.27. Roundwood export 1964–2003 in 1000 m3. Source: UNECE Timber Database (2004).

72
Table A4.23. Wood fuel export 1990–2003, including wood for charcoal in 1000 m3. Source: UNECE Timber Database (2004). Wood fuel export, including wood for charcoal (1000 m3) 1990 1991 1992 1993 1994 1995 1996 1997 1998 1999 2000 2001 2002 2003Austria 3.6 3.6 5.86 2 6 16 13 9 11 11 18 25 58 137Belgium 22 12 40.21 83 66Bulgaria 0 0 64.2 100.3 5 24.6 58.9 56 1 73 27.04 29.27 29.27Cyprus 0 0 0.17 0 0 0 0 0 0 0 0 0Czech Republic 0 77 120 174 130 170 164 172 173 209 212 219Denmark 4.4 2.1 3.02 2.48 4 6.8 4 25 9 1 1 0 1 1Estonia 1 12 27 20.39 29.3 126 83 113.45 175.35 200.67 227.48 335.58Finland 1 0.1 0.6 0.6 1 1 3 4 5.6 10 13.79 4.67 4 10France 44 98.1 123.56 120.1 391.9 460.9 346.4 373 400.3 348.81 336.67 313.05 375 379Germany 4.3 5.76 14 42 64 54 31 31 46 46 48 25 10Greece 0 0 0.06 0 0 0 0 0 220.5 229 9.39 2.95 16.05 15Hungary 148 148 338.77 290 158.19 132.4 250 158 214.9 252.9 311 288 365 387Ireland 0 0 17.13 5.85 2.2 0 0 0 0 0 0 0.7 3 2Italy 0.7 1.4 9.44 3.07 1 1 3 4 0 0.38 0 0 0Latvia 3.08 19.54 236 391 479 1015 1491 798 163.45 105.4 244.03 539.32Lithuania 0.02 0.44 1.4 0.7 3.8 2.2 0.8 1.52 3.15 10.75 16.5 54Luxembourg 0 9.64 64.8 82 65Malta 0 0 0 0 0 0 0 0 0 0 0 0Netherlands 22.2 22.5 22.07 22 21 11 16 19 43.9 29 22 14.8 20 33Poland 0 0 9.84 9.95 7 12.1 18.5 15.4 17.2 23.8 25.2 35.6 46.9 66.7Portugal 0 0 14.46 40.24 14 20 19.5 19 13.4 14 13.18 3 2 2Romania 2 2 0.05 0 0 0 0 0 0 1 4.3 3 7.6 89Slovakia 0 38.33 200 160 38 231 21.2 39 62 278 99 155Slovenia 74.54 71 102 74 110 111 89.1 75.35 61.79 54.61 60.42 77.76Spain 8.5 8.5 12.09 17 44.2 66.7 83.9 83.3 76 65 84 125 71 87Sweden 7.7 5 13.92 10 14 13 10 11 34.1 20 30.75 37.58 30 13United Kingdom 0.8 2.9 1.8 1 0.3 1.4 1.4 30 142.5 137 233 162.77 112 345

73
Wood fuel exports 1964-2003 (1000 m3)
0
200
400
600
800
1000
1200
1400
160019
64
1967
1970
1973
1976
1979
1982
1985
1988
1991
1994
1997
2000
2003
AustriaBelgiumBulgariaCyprusCzech RepublicDenmarkEstoniaFinlandFranceGermanyGreeceHungaryIrelandItalyLatviaLithuaniaLuxembourgMaltaNetherlandsPolandPortugalRomaniaSlovakiaSloveniaSpainSwedenUnited Kingdom
Figure A4.28. Wood fuel exports 1964–2003 in 1000 m3. Source: UNECE Timber Database
(2004).

74
A.4.6.3. Trade balance Table A4.24. Net Trade of Roundwood 1999–2005. Source: FAOSTAT (2007).
Import minus Export 1999
Import minus Export 2001
Import minus Export 2003
Import minus Export 2005
Austria 6,160,000 6,709,000 6,853,000 8,000,000Belgium 2,142,000 3,504,340 1,550,383 2,092,843Bulgaria -176,000 -183,977 -153,273 -508,304Cyprus 0 -20,915 781,000 493,000Czech Republic -1,981,000 -1,508,999 -2,577,000 -2,054,000Denmark 463,000 -193,000 620,841 471,459Estonia -3,635,999 -3,100,010 -2,423,869 -39,840Finland 9,532,411 11,588,823 12,601,196 15,458,265France -1,266,154 -3,420,376 -2,238,120 -1,858,490Germany -1,842,000 -1,388,000 -1,999,000 -3,033,000Greece 283,000 -3,070,106 474,294 148,044Hungary -970,700 -1,198,000 -1,223,000 -767,000Ireland 146,000 48,520 -178,060 -105,006Italy 5,305,000 5,698,000 4,948,091 5,604,924Latvia -3,606,000 -3,881,880 -3,996,386 -3,178,949Lithuania -861,887 -1,228,400 -1,375,000 -884,838Luxembourg 167,000 438,810 1,242,475 55,862Malta 1,191 14,336 184,000 20,000Netherlands 200,000 10,300 -129,300 -171,500Poland 128,400 572,200 -339,900 1,441,600Portugal 876,000 340,000 -550,000 -917,000Romania -601,400 -87,000 -190,000 177,000Slovakia -1,105,000 0 -933,000 -1,755,000Slovenia 165,356 118,520 100,974 -5,396Spain 2,856,000 3,693,000 2,934,000 3,238,463Sweden 9,093,000 8,320,390 8,164,007 5,723,081United Kingdom 28,000 96,436 263,820 -250,042

75
Net Trade of Roundwood
-10 -5 0 5 10 15 20
United Kingdom
Sweden
Spain
Slovenia
Slovakia
Romania
Portugal
Poland
Netherlands
Malta
Luxembourg
Lithuania
Latvia
Italy
Ireland
Hungary
Greece
Germany
France
Finland
Estonia
Denmark
Czech Republic
Cyprus
Bulgaria
Belgium
Austria
Cubic meters [Millions]
Import minus Export 2005Import minus Export 2003Import minus Export 2001Import minus Export 1999
Figure A4.29. Net trade of roundwood 1999–2005. Source: FAOSTAT (2007).

76
Table A4.25. Net trade of wood fuel 1999–2005. Source: FAOSTAT (2007).
Import minus
export 1999 Import minus
export 2001Import minus
export 2003 Import minus
export 2005Austria 106,000 148,000 124,000 207,000Belgium -5,000 720 -39,296 -15,541Bulgaria -1,000 -227,045 -29,273 -123,000Cyprus 0 30 110 325Czech Republic -170,000 -205,000 -219,000 -259,000Denmark 88,000 85,000 287,384 268,048Estonia -113,330 -200,650 -335,532 -117,175Finland 131,000 119,164 164,550 175,411France -327,154 -297,833 -377,121 -407,541Germany -12,000 25,000 74,000 217,000Greece -6,000 264,133 129,600 29,988Hungary -249,600 -280,000 -346,000 -133,000Ireland 2,000 310 -994 298Italy 368,000 510,000 635,583 864,079Latvia -798,000 -105,360 -533,533 -342,243Lithuania 895 -10,610 -74,000 -13,748Luxembourg 0 -37,460 -14,241 -23,500Malta 101 120 184 20Netherlands 34,000 -9,100 -26,400 -26,600Poland -22,700 -35,400 -60,800 -9,000Portugal -13,000 40,000 0 -5,000Romania -1,000 -3,000 -89,000 -68,000Slovakia -39,000 0 -59,000 -119,000Slovenia -57,595 -53,720 -76,662 -135,798Spain -50,000 -52,000 -63,000 -76,608Sweden 128,000 118,260 662,559 132,000United Kingdom -134,000 -152,670 -333,023 -191,003

77
Net Trade of Wood Fuel
-1.000.000 -500.000 0 500.000 1.000.000
United Kingdom
Sweden
Spain
Slovenia
Slovakia
Romania
Portugal
Poland
Netherlands
Malta
Luxembourg
Lithuania
Latvia
Italy
Ireland
Hungary
Greece
Germany
France
Finland
Estonia
Denmark
Czech Republic
Cyprus
Bulgaria
Belgium
Austria
Cubic meters
Import minus Export 2005Import minus Export 2003Import minus Export 2001Import minus Export 1999
Figure A4.30. Net trade of wood fuel 1999–2005. Source: FAOSTAT (2007).

78
A4.7. Technology and Know-How
A4.7.1. Technology use in forestry, including ICT
Table A4.26. Employment per 1000 ha forest (person-years/1000ha), calculated from FAO (2006).
employment/ha forest Bulgaria 20.44 Slovakia 14.06 Czech Rep. 11.76 Denmark 8.23 Romania 7.38 Lithuania 6.93 Poland 6.62 Latvia 6.59 Ireland 6.57 Germany 6.32 Hungary 6.29 Belgium 6.00 Cyprus 5.78 Netherlands 5.56 UK 4.30 Estonia 4.01 Italy 3.81 Portugal 3.07 Slovenia 2.42 France 2.28 Austria 2.08 Spain 1.76 Finland 1.07 Sweden 0.62

79
Employment/ha forest (person year/1000 ha)
0 2 4 6 8 10 12 14 16 18 20
Bulgaria
Slovakia
Czech Rep.
Denmark
Romania
Lithuania
Poland
Latvia
Ireland
Germany
Hungary
Belgium
Cyprus
Netherlands
UK
Estonia
Italy
Portugal
Slovenia
France
Austria
Spain
Finland
Sweden
Figure A4.31. Employment per 1,000 ha forest (person-years/1000 ha), calculated from FAO
(2006).

80
Annex 5: Model Descriptions 4DSM The 4DSM (Forestry Demand Supply Model) is a static economic equilibrium model for the global forest sector where demand and supply are equilibrated under a global trade regime. The market equilibrium refers to the condition where regional market prices are established through competition such that the amount of forest products sought by buyers is equal to the amount of forest products produced by sellers in a number of global and European regions. Essentially, 4DSM is a global trade model. When the price of a forest product is above the equilibrium point there is a surplus of supply; when the price is below the equilibrium point there is a shortage in supply. Different Constant Elasticity of Substitution (CES) supply curves and different demand curves were calibrated to mimic the 2005 global forest market. The functional form is EFQQPP /1)( == , where E is positive for supply schedules and negative for demand, respectively. The static global multi-market balance is established for two final products categories, sawnwood and paper and paperboard products. These final product markets are linked to regional roundwood markets of sawlogs and pulpwood logs. All forest products are traded, and the market balance is established simultaneously for all product categories. The model is regionally differentiated in five European regions and nine global regions. It starts from the FAO data and other secondary sources for quantities and prices of sawnwood logs and pulp logs and of sawnwood and pulpwood. For production cost estimates of these products, for example, mill costs, an internal IIASA database and purchased data were used. Trade costs and quantities were approximated from various literature sources. Each of the 14 regions has its own elasticity according to expert estimations and known data about the regions. Based on the production and trade costs, the model calculates the amount and price of the primary and final forest products and the trade among the regions. Depending on all these data (supply and demand quantities and elasticities, supply costs, demand prices, production costs, and trade costs) the model calculates the optimal supply and trade quantities plus prices on these curves assuming “perfect market conditions.” In order to mirror the actual trade in the base year (2005) the model is calibrated to these trade matrices (for logs and final forest products).The model can be calibrated by the use of Positive Mathematical Programming (PMP) techniques to match 2005 market conditions according to FAO statistics. However, it was found that the input parameters of the supply and demand functions were so well calibrated that the model could be run unconstrained, which allows for a much better assessment of the plausible future development trajectories of the global forest sector under globalization and given a number of development options, such as technological change scenarios (see scenario description). The scenarios are assessed by providing exogenous shift variables to supply and demand parameters. The model is a non-linear optimization model and was written in GAMS (General Algebraic Modeling System).
BFSM Background and Purpose of BFSM modeling The Bilateral Forest Sector Model (BFSM) served a number of purposes in this study. First, the model was used to carry out detailed sensitivity analyses of the dynamic interactions of various elements of the entire supply chain and their interactions with changes on the supply

81
side. Sensitivity analysis helped to distill the most important driving and impact factors of the dynamic system at hand. Using the knowledge from sensitivity runs, the more detailed models were constructed. Second, first estimates of orders of magnitudes of impact factors were assessed. Third, BFSM focused on the dynamic behavior of the possible futures of the global forestry sector, while the other assessment tools are essentially static. Fourth, the model is easily tractable for non-modelers but might be tested and further improved and augmented during the course of the full project. The model was implemented on a VENSIM modeling platform and would be ideally suited for online modeling for targeted stakeholder workshops aiming to contextualize and quantify expert knowledge. Basic Description of the Model The BFSM is a system dynamics model of the global forest sector modeling trade between Europe and the Rest of the World. This aggregated representation of the global forest sector allows the model to track in a sufficiently simple way the dynamic interactions of a number of elements within the forest sector which, for reasons of complexity reduction, have to be omitted in more geographically resolved models (like YDSM). BFSM focuses on the dynamic interaction of changes in the final demand pattern of paper products and sawnwood, with all major elements influencing the forest products supply chain involved, including technological change and innovation in the conversion industry, all the way to issues of competition over wood resources further down the supply chain. Changes in demand patterns are driven by population dynamics consistent with the revised IPCC marker scenarios (A2, B2, B1, and their respective climate policy constraint worlds: see Detailed Analysis Framework Specification), changes in economic affluence measured in gross domestic product (GDP), and changes in consumption patterns due to lifestyle changes. The latter include modeling of dematerialization or resource sparing by consumer behavior due to changes in consumption patterns such as substitution of online newspaper reading for newsprint. Technological change in the woodworking industry is modeled by two factor learning curves involving increasing/diminishing returns on R&D investment and accumulated experience stocks of respective technology vintages. The model also traces physical flows, including trade of wood chips from sawmills to pulp and paper industries, as well as the impacts of increased paper recycling or alternatives used in the energy sector. International competitiveness is measured by a “cost vector” whose elements are pure costs, but also proxy indicators of product and service quality. The “cost–competitiveness ratio” between Europe and RoW determine domestic and RoW investment rates and thus dynamically reveal the comparative advantages of new technological vintages in the forest sector. Total investments in the respective regions are distinguished between investment in new capacity for export grades or for local production. The evolution of this vintage structure is monitored throughout the simulation period. Competitiveness is assessed for the entire wood chain and not only at the conversion stage. Information on shortages in wood supply is transmitted via increased wood prices to final product markets. Modeling competitiveness also includes assessments of strategic investments mimicking market imperfection phenomena, such as the formation of oligopolistic market structures and barriers to technology transfer. In the model, three separate but linked product markets for wood are distinguished:
1. Pulpwood market 2. Sawlog market 3. Wood for energy market

82
To satisfy demand for final products, wood is delivered from a renewable forest resource stock that can roughly be divided into an existing forest resource stock and an afforestation stock that is to be newly built. Policies that aim at wood mobilization, tree improvement programs, or other silvicultural measures enhancing wood supply of any of the three grades can be captured by the model. The model was implemented with the software VENSIM (www.vensim.com).
BEWHERE BeWhere is geographically explicit static spatial partial equilibrium model driven by exogenous price and demand schedules. BeWhere is a linear mixed integer programming model whose aim is to determine the optimal geographic locations and sizes of sawmills, pulp and paper mills, and bio-energy plants. Optimal locations and sizes are found by the minimization of costs with respect to biomass and final forest product production and transport, investments for the production plants, and sales outlets. Hence, the model covers competition at all levels of the production chain, including supply of biomass, wood conversion, and demand for final products. BeWhere was used because cost-competitiveness crucially depends on the detailed costing of the entire supply chain field-wheel involving optimal location, scaling, and logistics. In this study BeWhere was dual-purpose: 1) informing the parameterization of current and future CES supply schedules for the aggregate regions of the 4DSM model; and 2) downscaling of 4DSM results to real geographic space. The latter turned out to be a powerful tool for presenting results and a valuable tool for validating model results through visual interpretation. The model is a mixed linear optimization model and is also written in GAMS.

83
Annex 6: Classifying Innovation and Innovation Support Measures A product innovation is the introduction of a good or service that is new or significantly improved with respect to its characteristics or intended uses. This includes significant improvements in technical specifications, components and materials, incorporated software, user-friendliness, or other functional characteristics. A process innovation is the implementation of a new or significantly improved production or delivery method. This includes significant changes in techniques, equipment, and/or software. A marketing innovation is the implementation of a new marketing method involving significant changes in product design or packaging, product placement, product promotion, or pricing. An organizational innovation is the implementation of a new organizational method in the firm’s business practices, workplace organization, or external relations. An organizational innovation is the result of strategic decisions taken by management. Organizational innovations in business practices involve the implementation of new methods for organizing routines and procedures for the conduct of work. Innovations in workplace organization involve the implementation of new methods for distributing responsibilities and decision making among employees for the division of work within and among firm activities (and organizational units), as well as new concepts for the structuring of activities, such as the integration of different business activities. New organizational methods in a firm’s external relations involve the implementation of new ways of organizing relations with other firms or public institutions, such as the establishment of new types of collaborations with research organizations or customers, new methods of integration with suppliers, and the outsourcing or subcontracting for the first time of business activities. As “business model innovation” is not an explicit category in the OECD definition and classification, it should be included under this category. Besides the above classified types of innovation that refer to innovations at the firm level, the concept of institutional innovations is of increasing relevance when analyzing policies and institutions. Institutions are understood here to denote “the rules of the game.” Institutional innovations refer to innovations in the public/policy sphere. Institutional innovations may include new or adaptation of existing organizations, new or significantly modified rules as laid down in laws, decrees, or policies, as well as new or significantly modified procedures in developing and implementing policies. Innovation support can take many forms from direct funding of research and development activities to the support of the diffusion of innovations, improving the knowledge base and interaction of actors, and adapting framework conditions. Some of these support measures are targeted directly at fostering concrete innovation activities; others are of structural character. These measures may be introduced without the explicit aim of fostering innovation. Research and Development: This includes innovation support in a narrower sense, that is, financing of basic and applied research, development of new products or processes, pilot projects, demonstration projects, and support for the commercialization of innovations.

84
Support for research and development generally aims at innovations that are new to the sector (forest sector), namely, products, processes, and marketing and organizational methods that have not been introduced to a particular sector in a particular country before. Diffusion of innovations: This includes support for the early and broad adoption of named, already known goods, services, and processes by enterprises in a sector in a specific country. It excludes support to standard managerial processes or late adoption (e.g., species diversity support or road building in forestry or standard IT in SMEs). Strengthening the knowledge base of forest owners/managers: The innovation capabilities of a firm, sector, or economy strongly depend, among other things, on the availability and quality of human capital, namely, individual know-how, skills, and motivation of entrepreneur and employers, and level of qualification and competencies of employers. Further, access by firm and forest managers to research, education, and training institutions and exchange of information and knowledge with them, influences the propensity to innovation. Promoting interaction/managing interfaces: Firms do not innovate in isolation. Rather a range of other actors/organizations contribute in different ways to innovations, for example, other firms/competitors, research organizations, extension services, interest groups, etc. Policy may foster innovation by strengthening the interaction among different key actors in the forest sector, among other things, through promoting cooperation among forest holdings, cooperation along the forestry wood chain and across other sectors, promoting public–private partnerships, research institutions–enterprise cooperation, and promoting interaction with users (customers and consumers). Public demand creation for innovation: The demand side is crucially important for the promotion of innovations. Policy may not only promote innovations by supporting the input side but also by inducing demand for innovation. This is often applied in the case of environmental/sustainable innovations. The following activities may be implemented to strengthen the demand for innovation: reorientation of public procurement policy (creating consumer demand), support for lead users, or public agencies acting as lead user, clear demand expression through communication. Improving frame conditions: General framework conditions including institutions such as laws, regulations, standards, taxes, or access to financing have a crucial influence on firms’ decisions to innovate. Changing framework conditions is often not in the responsibility of sectoral policies. The following list comprises a selection of policy activities to improve framework conditions for innovation:
• Institutional reforms (e.g., change of forest law, property rights reform, support for the establishment of new organizations);
• Adaptation of tax laws (e.g., corporate taxes); • Improving access to financing (e.g., by providing guarantees); and • Adaptation of standards and norms (e.g., in the construction sector).

85
Annex 7: Perceived Importance of Innovative Actions among Forest Policymakers and Forestry Associations Two recent surveys jointly undertaken by the EFI PC INNOFORCE, the UNECE, and the CEPF explored how innovation is seen and addressed by forestry administrations and forest owners’ associations across Europe (Rametsteiner and Bauer 2007). In cooperation with UNECE a first survey was conducted among representatives of ministries responsible for forestry (forest administration) in Europe. The standardized questionnaire was sent out by e-mail to 32 countries in August 2005. The questionnaire was returned by representatives of the forestry administrations of 18 countries (i.e., around 56% of the target group). A second survey targeting forest owners’ associations was undertaken in cooperation with the CEPF from January to March 2006. The questionnaire was sent to forest owners’ associations in 26 countries, of which 14 or around 54% returned the questionnaire. The figures below (Figures A7.1 and A7.2) show the combined rating of the importance of areas of innovation by forestry administrations and forest owners’ associations. The most important areas for innovations in goods and services are considered to be wood for bio-energy and environmental services. When looking at the areas for process innovations, organizational innovations dominate the picture. Both the cooperation between forest owners and the cooperation along the forestry wood chain are given equally high importance by the respondents. The most important technological innovation is the use of information technology in forestry.
Importance of areas of innovation - Goods and services
0% 10% 20% 30% 40% 50% 60% 70% 80% 90% 100%
w ood for bio-energy
environmental services
recreational services
new w ood products development
new markets for w ood products
protection services
new non-w ood forest products
other product/service innovation
very important rather important not very important no response
Figure A7.1. Importance of areas of innovation—Goods and services

86
Importance of areas of innovation - Process innovations
0% 10%
20%
30%
40%
50%
60%
70%
80%
90%
100%
co-operation along the forestry-w ood chain
use of information technologies
forest ow ners' co-operation
marketing of w ood
w ood processing technologies
improvements in transport and logistics
harvesting techniques and facilities
inf rastructure development
other process innovation
very important rather important not very important no response
Figure A7.2. Importance of areas of innovation—Process innovations The order of the areas of innovation does not differ much between forestry administrations and forest owners’ associations. While for forestry administrations, environmental services are the most important product innovation, forest owners’ associations assess wood for bio-energy highest. For forestry administrations, the cooperation among forest owners and the cooperation along the forestry-wood chain are the most important process innovations; for forest owners’ associations it is the marketing of wood.
Differences become visible when differentiating between countries with a longer market tradition and countries with economies in transition. While in countries with a longer market tradition, environmental services are clearly ranked highest by forestry administrations,(over 70% stated that it is very important), forest owners’ associations in this country group assess this area less important compared to other areas. For them wood for bio-energy clearly ranks highest. Within process innovations, forest owners’ associations in countries with a longer market tradition regard marketing of wood as highly important, while forestry administrations put this area at the end of the list. In countries with economies in transition, in contrast, forest owners’ associations rank environmental services much higher than forestry administrations do.
While environmental services are regarded as a highly important area for innovations in forestry by many respondents, institutional support for developing markets for environmental services is largely missing. Forestry interest groups and other actors are focused on averting demands for services that are free of charge rather than on actively supporting new developments. Further, skepticism regarding the market opportunities for environmental services prevails among forestry actors. Finally, there is a lack of trust among the relevant actors in forestry regarding environmental services. These factors result in only few activities being undertaken to develop the environmental services, even though this is stated to be very important.

87
Annex 8: Case Studies The following provides a range of more in-depth cases in addition to the examples given in the main body of the text. To better show the broad range and diversity of innovations in the different innovation categories, it was decided to expand the number of in-depth cases, originally planned to cover five examples, while shortening the individual descriptions. The sequence of cases follows the sequence of the regional types. Case Study 1: Finnish Thermowood Association To produce thermowood, the wood material is heated to a temperature of at least 180°C while being protected by steam. Besides providing protection, the steam also affects the chemical changes taking place in the wood. As a result of the treatment, environmentally friendly Thermowood is created. Its color darkens, it is more stable than normal wood in conditions of changing humidity, and its thermal insulation properties are improved. If carried out at a sufficiently high temperature, treatment also makes the wood resistant to decay but decreases the bending strength. For thermowood, an association of producers was formed in Finland in 2000 to cooperate in standardization, quality control, and research, in order to enhance the use of the products. It developed two standards for treatment classes for the ThermoWood® trademark, Thermo-S, and Thermo-D. 'Thermo-S' stands for 'stability', 'Thermo-D' for 'durability'. Source: Finnish Thermowood Association, others Case Study 2: Finnish Networked Center of Expertise for Wood Products
Currently, the Finnish government is renewing its national Centers of Expertise program to better address the innovation challenge of different industrial clusters. Among the 19 selected, the Forest Industry Future initiative will bring together the best research and development centers in the wood-processing industries. Another center will focus upon the use of wood in living and construction, and thereby promote more customer-oriented innovation and increase the value to wood products.
The Networked Center of Expertise for Wood Products, as it exists today, is a service structure that covers various areas of expertise in the forestry and wood products business chain and offers customized expertise and promotion for research and development projects. The Center also functions as a contact point for actors from different parts of Finland via which companies can increase their knowledge in the field and abilities to act as a developer of the regional economy.
The Center of Expertise for Wood Products is a network of 55 actors. Its core consists of universities and research centers that coordinate seven specific areas of expertise and perform research and development in the wood product industry. These actors are evenly distributed geographically and also serve as engines of regional development.
Networked Operational Model Strengthening Development Culture
The areas of expertise of the Center of Expertise for Wood Products cover the entire spectrum of the needs of the business chain. The Center of Expertise combines both national and regional experts into a comprehensive network. The most significant achievement of the Center of Expertise for Wood Products during its first years of operations has been building of well functioning network among

88
experts in the area of wood production as well as with the users of newest knowledge and expertise. Cooperation within the Wood Finland Program enables active transfer of expertise and also allows solutions to be found to the problems of small and medium- sized companies in the future.
The networked operational model has strengthened the development culture in the field and has made research and development into factors of success. The level of expertise has improved and the knowledge base has extended, as experts have been able to concentrate on their own areas of competence and those transferring technology have been able to focus on increasing their intellectual capital.
Over 100 research centers, over 200 companies, and approximately 40 other bodies have participated in the projects. The most important permanent structure is the cooperation network that incorporates all Finnish wood production research centers. The network has enabled regional actors to create regional clusters of expertise, at, for example, Oulu, Tampere, Seinäjoki, Kuopio, Joensuu, Kotka, and Mikkeli.
The most significant achievements have taken place in the product development projects where further processing developments have resulted in new wood products. The most significant achievements include:
• Modern wooden town; • Structure systems for multi-purpose buildings and large wooden structures; • Open timber construction system for wooden buildings; • Products for the construction of external areas and landscapes; • Wooden interior decoration products; and • Products made from processed birch wood.
Entire Business Chain Covered
The Center of Expertise for Wood Products intensifies expertise transfer, development of new expertise, and the creation of showpieces of wood construction in its strategic focus areas that cover the entire chain from market to forests.
Modern wooden town and wood engineering expertise areas promote the use of wood in construction. Expertise in living with wood and design includes interior structures and environmental design of both public and private premises. The field of expertise in diversification of wood utilization focuses on techno-economic issues of hardwood processing and use of wood from thinnings. These four areas of expertise follow current industry demands.
The following three areas of expertise offer the resources required for the creation of new expertise and businesses. Business-based technology development acts as the developing and transferring agent for the wood industry. The area of new concepts aims to develop the management, business concepts, and cooperation of companies. The developer forum strengthens the knowledge base and promotes information transfer between companies and the Center of Expertise.
Future Focus on Combining Different Areas of Expertise and on International Networks
In the future, the Center of Expertise for Wood Products will focus on combining different areas of expertise. This enables the creation of new products, manufacturing processes, services, and relevant business models. Breakthroughs will originate from concentration on new business concepts, design and architecture, development of knowledge transfers and the internationalization of expertise and business networks both in the area of construction and consumer goods.

89
National networking provides a good foundation for international networking. The focus of the Center of Expertise for Wood Products in 2003–2006 will be on internationalization, which means close cooperation with other research and development programs for the wood industry such as the Wood Europe campaign and the Wood Wisdom research program.
Source: http://www.oske.net/, MTI
Case Study 3: Sports and adventure services by an outdoor recreation company (Norway) Troll Mountain AS is an innovative firm organizing adventure packages in the local forest area. Various key actors, a part from the entrepreneur, are playing an important role in providing the recreational services: • The local neighbors; • The “European outdoor life” network; • Local communities; • Agder Energy, which controls the flow of water.
Troll Mountain AS has organized its activities in two different municipalities. With one of the municipalities there is a problematic relationship, but the other municipality is helpful and knows the value of the activities for them. Neither of the municipalities nor local business activity in the local community has triggered an innovation process within the firm. A lack of cooperation among businesses and with public actors is seen as a restraining factor when it comes to the creation of a common strategy of tourism activity within the area. The entrepreneur knows of many landowners who offer their own products without any willingness to cooperate within the same geographical area. The most important area of cooperation would come from tourist accommodation, adventures, and culture. (Source : B. Vennesland, Norway) Case Study 4: Biomass District Heating Micro-nets with Wood Energy Contracting, Austria In the small Styrian village of Ottendorf a group of four farmers run a biomass district heating (BDH) system which provides a couple of public and private buildings in the village center with heat. The plant of 340 kW was established in 1998/99 and is situated on one of the partners’ properties. As the farmers were able to do much of the construction work by themselves (e.g., the digging works) the costs for the construction were relatively low. The group received the know-how from the consulting organization Regionalenergie Steiermark (“Regional Energy, Styria”) and applies their “wood energy contracting ” model. Subsidies were granted for 50% of the investment. Since 2000 the group has been running a second installation of 60 kW and since 2002 another of 90kW in newly constructed residential buildings in the same village. In these cases, the boilers and storage rooms are situated within the apartment buildings. In 1992 a private initiative founded the association Regionalenergie Steiermark with the purpose of promoting wood heating systems. In the beginning the focus was on single households, and later on micro-nets, as was described in the above examples. The association offers information and advice and is mainly financed by funds from the provincial government. Today, the association is affiliated with the Forest Association of Styria and receives additional support from the chamber of agriculture. The association development, which is the model for “wood energy contracting” (“Holzenergie

90
Contracting”—a registered trademark), provides a legal–commercial framework, especially for micro-nets, for carriers of small BDH systems. It regulates the relations among the partners in the business and between the business and their clients. The farmers have become energy traders. Fostering factors • Know-how of Regionalenergie Steiermark. • Financial support for the Regionalenergie by the provincial government and the chamber of
agriculture and subsidies for erecting BDH systems. • Farmers in search of additional sources of income because their farms are too small. • Local farmers that run the business (farmers from neighboring villages would not be so easily
accepted by the local people). • Good public image of regional resources. Impeding factors Relatively low prices for gasoline since the 1990s. Some potential customers prefer to have their own heating system and do not want to be dependent on an external supplier. For housing companies the modern biomass technology and the wood energy contracting model are still unknown. Conclusions: A powerful diffusion system BDH systems are successfully promoted in Styria because all the functions of an IS are covered by a number of institutions: information (Regionalenergie), conflict management and coordination (Regionalenergie; municipalities), incentives (subsidies for BDH; provincial support for Regionalenergie). In all cases it is important to convince farmers in the first place and then the communes about the idea. The lobbying of Regionalenergie was also successful with regard to housing regulations at the provincial level and other regulations. (Source: G. Weiss, AT) Case Study 5: Forest Enterprise Topoľčianky, Slovakia—Packaging and Marketing of Venison The company and the innovation The State Forest Enterprise Topoľčianky with an area of 32,429 ha of forest stands was established in 1920 for forest and game management. Breeding and hunting of game is the secondary economic activity of many state forest enterprises. The venison is the product of a relatively high market value. The innovation idea was to modernize and expand the capacity for venison processing in compliance with the relevant EU standards. The company constructed a new building for processing; the central installation is a vacuum-packing machine with an annual processing capacity of 80,000 kg. Actors involved in the innovation process • The management of the Regional State Forest Enterprise Topoľčianky, which designed and
implemented the project, and the General Directorate, which co-financed the investment; • Production designer, construction company, and technology supplier; • External suppliers of venison; • Customers, consumers (Czech Republic and Austria); • Bank, by providing an interim credit (no long-term structural loan); • State Veterinary and Food Inspection, which assists in achieving compliance with Slovakian and
EU hygiene standards; and • Consultations concerning EU requirements with the European Commission.

91
Fostering factors • Interest of the management of the Forest Enterprise in tackling related risks, information
problems, and technological aspects of a non-typical forestry activity; • Assistance provided by the State Veterinary and Food Inspection with fulfillment of the EU
requirements and acquisition of the certificate of compliance; and • Tradition in the processing of venison, but a new investment was needed for compliance with
the EU requirements. Impeding factors • Limited information availability on EU hygiene standards; • High Outcome and future prospects The business offers five seasonal work positions. The currently processed volume of 30,000 kg of venison remains at the margin of return; however, a better market price has been achieved. The company intends to certify the venison as an ecologically produced food and to develop leather processing. Conclusions: Information is precious The innovation process described reflects a relatively stable internal environment in the state forest, although insufficient market analysis was identified as a weak point. The entrepreneurs have reported having insufficient institutional support in the implementation of the EU food production standards in Slovakia. The two major weak points concern information: market information and information about EU regulations. (Source: J. Salka, R. Vinca, M. Pálková, SK) Case Study 6: “Bergwald” Cooperation of Large Forest Holdings The cooperation The forest owners’ cooperation (FOC) “Bergwald” was founded in the year 2000 by seven larger Styrian forest holdings as an association. The initiative came from the forest managers, who used the looser cooperation that existed beforehand to build it up. Support by institutional actors was not needed. The total forest area of all the members is some 70,000 ha, and the yearly harvest accounted for 400,000 m3. As the aim of the closer cooperation is to make use of synergies in the input and output fields of forest management, the cooperation comprises production as well as marketing. The members provide mutual support in all commercial and official issues. According to the president, the aims of the FOC Bergwald are: Cooperation in forestry production (timber harvest and transport): Members may specialize in certain harvest technologies and machinery. Cooperation in timber and game marketing: Forest products are marketed in common. An IT- supported logistic system is in development. Internal benchmarking: Internal business data are open to the members for comparison. Common “foreign affairs” and common lobbying: The companies’ policies and communications are coordinated, for example, with regard to political and legal questions of nature conservation, hunting, forest law, logistics, etc. Foundation of the Forest Service Ltd. A recent project of the FOC was the foundation in 2003 of the Forest Service Ltd. together with the Styrian Forest Association, an association of farm forest owners. Through the company the members of the FOC “Bergwald” expect to gain access to small forest holdings. It offers all kinds of services as

92
contractors. The offers range from forest planning and harvesting to marketing, as well as a total forest management package for “absentee forest owners.” The Forest Service Ltd. itself is a horizontal cooperation (two partners who are in forest owners’ cooperations themselves). For the development of logistic system the Forest Service Ltd. cooperates with research institutions, the Styrian Wood Cluster Ltd., and sawmills (vertical cooperation). Fostering factors High level of professionalism and know-how among staff. Market pressure for rationalization. Buyers demand better logistics. Impeding factors Unwillingness of forest owners to give up independence. Outcome and future prospects According to the president and the manager of “Bergwald” the cooperation, overall and in the important marketing segment is fruitful. There are better marketing opportunities not necessarily because larger quantities of timber are offered, but because service is better (e.g. logistics). The Forest Service Ltd. is too new to be evaluated. Conclusions: large forest owners have their own robust capacities for networking The member managers see an urgent need for closer cooperation, even among larger forest companies. Better cooperation is necessary within and across the forest and wood sectors as well as with research institutions. In this case the IS was especially helpful in the support of networking along the wood chain through the Wood Cluster Ltd. (Source: G. Weiss, AT) Case Study 7: Scottish Forest Industries Cluster The Scottish Forest Industries Cluster encompasses all those companies, organizations, and industries involved with the planting, management, and harvesting of forests, through sawmilling, pulp, paper and board production, to the production of higher value manufactured goods. It incorporates input from the chemicals and machinery sectors, as well as from business support and education institutions. The Cluster was established initially as a partnership between the Forest Industries Development Council (FIDC) and Scottish Enterprise (SE), the UK government’s economic development agency for lowland Scotland. In October 2004 FIDC’s business activities were taken over by the new representative body for the forest industries, the Confederation of Forest Industries Ltd (ConFor), with which SE is now in partnership. The forest products industry is very much influenced by globalization and industry restructuring. Scotland has the potential to develop global companies; at present it plays host to a number of these, for example, UPM Kymmene plc, Norbord Ltd, and Egger (UK) Ltd. The industry is subject to global price, supply, and quality fluctuations and this makes its business very cyclical. The capital-intensive nature of investment in the industry makes the industry cautious; however, this also means that the investments that are made do tend to last. The Scottish Forest Industries Cluster is well-established with a strong supply chain and forward linkages from growers through processors to the construction, paper, printing and publishing, furniture, timber, and board products industries. There are weaker backward linkages to the chemicals and equipment sectors. Scotland’s forests form a significant part of the landscape, as well as contributing more directly to tourism through amenity provision and accommodation. Increasingly, linkages are developing with the power generation industry and with agriculture through biomass

93
projects. There are strong links with the training and education sectors through accreditation and certification schemes. (Source: Scottish Forest Industry Cluster) Case Study 8: IEFC—Research into plantation forestry development in Northern Iberia and Southwest France The creation of the European Institute of the Cultivated Forests within the framework of action 5 (forests of the south of Europe and sustainable development) is still working. Indeed, the multi-thematic network of IEFC on the sustainable management of the forests is starting to be recognized by EU actions and the IEFC is now developing a project, Interreg III B. The members of the IEFC have now acquired the reflexes of the work in partnership around several research orientations and developments (testing of the Indicators of Sustainable Forest Management in Pilot Areas, guides to forest pests and diseases, growth models) follow-up for which is available on the site of the Institute: www.iefc.net. The contributions in the medium term of the Eurosilvasur project should result in the pooling and modernization of the tools for professional use, consolidation of the relations among the companies of the sector, acquisition of a greater transparency in the wood trade, and the opening up of the market. These activities shows that the USSE understood how to make the sector more dynamic and communicate to each company the need for more dynamic development. IEFC organizes programs of cooperation among the laboratories, and with the USSE and professional organizations, for instance, the program, FORSEE (Sustainable FOReSt management: a nEtwork of pilot zonEs for operational implementation). (Source: C. Pinaudeau, FR) Case Study 9: Tourism—Germany: The “Adventure Forest” The company and the innovation Within a privately owned forest enterprise of 400 ha the concept of an "adventure forest" was developed to market recreational services. The property is owned by a corporate group without business ties to the forestry industry. The forest enterprise is managed as an independent unit. In the "adventure forest" the company offers two different types of services:
1. Daily events for tourists such as guided walking tours, guided tours through the forest enterprise, illustration of scenic features and endangered species, and rock climbing in an old quarry.
2. Events of several days duration for corporate clients: the seminars aim to further team formation and to illustrate the relationship between ecology and economy. The schedule of events is arranged in advance with the enterprise.
The innovation process When the forester retired, the profitability of hiring a full-time forester was questioned. The owners decided to search for a candidate with strong ideas for new businesses for the site. The concept of the "adventure forest" was introduced by the new forester.
Roles of actors • The sole responsibility for the forest enterprise and the "adventure forest" lies in the hands of the
forester. The owners give him plenty of room to make decisions.

94
• Local tourist information offices arrange daytime visits to the "adventure forest" for tourists. The local community supports the project because it offers another major attraction for the region and encourages tourism.
• Some very attractive conference locations (e.g., castles) lie in the surrounding region. Most of the corporate clients that visit the "adventure forest" combine this visit with a conference (or vice versa)
• Local suppliers (firms or farmers) are responsible for the food supply, installing bathrooms and the plumbing, etc.
• Local nature conservation groups are supported (e.g., through the construction of wooden footbridges through a nature reserve (swamp) etc.)
Fostering factors The innovation considerably benefits from an exceptional location in a scenic region and with good infrastructure due to the conference locations. Outcome and future prospects The investments for the innovation thus far have only been promotional flyers, a homepage, and certain pieces of equipment. Yet the main objectives, additional revenue and reduced dependence on the timber market, have been fully achieved. The "adventure forest" contributes to business volume by 30%. The upward trend has already allowed for an additional part-time position.
Conclusions: Adventure pays Besides the attractive natural and commercial regional environment the main success factors for the innovation lie within the company and through cooperation with partners.
(Source: L. Pickenpack, GER)
Case Study 10: Mountain bike routes offered by the UK Forestry Commission (FC) The case study explores the development of mountain biking trails at a state-owned forest at Coed Y Brenin in mid-Wales. The development involved the construction of specialist mountain bike routes in the forest and associated services both on and off site, for example, food and drink, bike hire, bike cleaning facilities, and accommodation. The product was new to the UK, but an innovative approach to trail building was also taken which resulted in an internationally renowned building technique that is also environmentally sustainable. In 1999 the site, which is regarded as one of the best in the world, injected around £1 million into the local economy, which has supported already established businesses and new enterprise. The initiation of the trails came from mountain bike riders, (one of whom was the local forest ranger for the FC) and a local mountain biking organization (North Wales Mountain Bike Association). The adoption of the innovation depended on the support of the FC, the forest manager at Coed Y Brenin, who provided the rugged and robust terrain necessary for the trails. Funding for the trails was provided through European Objective 1 finances, FC funds, as well as sponsorship from high profile companies like Red Bull and Karrimor. Information from mountain bikers and mountain bike organizations was central in determining the design of trails. The project was coordinated by the FC in close partnership with other public organizations. Later, a broader range of stakeholders, for example, local tourism service providers, local communities, and tourists boards, were brought in to provide complementary services such as accommodation, food, and drink, to reduce conflict between uses and users and to market the enterprise. The Welsh Mountain Bike Initiative was central to the Welsh Tourist Board Cycle Tourism Strategy and the tourist board played a central role in the marketing of the sites by funding the Mountain Bike Wales Web site (www.mbwales.com). As the mountain biking community is relatively close-knit, the passage of information through users and their representative organizations has been critical in raising awareness and use of the trails. Local tourism businesses also market the trails as a way of attracting clients.
(Source: S.Martin, Forest Research, UK)

95
Case Study 11: Harvester Services in Slovenia The carrier of the innovation The innovator owns a 40 ha farm, of which 30 ha are forests. He holds a license for forestry services of cutting, skidding, and road transportation of wood as an independent entrepreneur. The employees are his son and himself. Although a certified mechanic, he always had an affinity for forest work. He gave up stockbreeding and after purchasing equipment for timber transportation he became professionally involved in the forestry service.
Development and implementation of the innovation The innovation is to carry out timber production with a harvester in Slovenia. Until 2001, the innovator offered a wood transportation service. He was considering the idea of harvesting for about a year. When his son graduated and joined the transport business he made the decision to purchase a harvester. He acquired information from leaflets and through the Internet. The decisive factor was his private connection with a Swedish friend. In Sweden he observed harvester work, selected the machine, and took a course in operating the machine. He bought a 6-year-old Valmet 911 harvester. In the first year he cut only about 6,000 m3, which is approximately 10% of the maximum capacity of the machine. The majority of works were clearings of forests for land-use change. As a result he decided to purchase a new tractor in 2002, with an attachment for crushing tree stumps. That way he will be able to offer a complete clearing service.
The actors Before his purchase, the entrepreneur consulted local foresters, but the most decisive factor was his association with a friend in Sweden. He was trying to find partners who would purchase a forwarder and equipment for crushing tree stumps. So far he has failed to make such arrangements. Purchasing a harvester carried a considerable legislative risk.
Fostering factors • Forest administration advice • Professional friend abroad Impeding factors • Restrictions by legislation for forest work • Lack of demand from forestry Outcome and future prospects The purchase of a harvester carried a considerable risk because legislative directives for forest work limit the range of possible operations. The prevailing forest policy in Slovenia is oriented at a low density of fellings on the forest area. Furthermore, the average size of forest properties is very small. Therefore, a major problem is to acquire work and clients for harvester operations. The forestry profession failed to make progress in the technology area during the last 10 years. Use of a harvester is an unfamiliar technology in privately owned forests, and that is why there is no demand for such services. In public forests, work efficiency and the reduction of costs are not encouraged. The entrepreneur says that he would probably not now buy a harvester, considering the difficulties in obtaining clients throughout the last year. However, he is going to continue for another year.
Conclusions: the difficulties of a frontrunner While in many European countries harvester technology is already standard, in Slovenia the entrepreneur who purchased the harvester is a frontrunner. He faces a situation where potential demand has not yet developed. The institutional forestry system does not yet know about the technology and therefore does not promote It.
(Source: B. Papac , M. Sinko, SL)

96
Case Study 12: Nature-based tourism development, Romania Until recently, Romanian forests were to 90% public. Now, after three phases of restitution a balanced ownership structure has been reached with roughly half public forests, half other forest owners (private individuals, private entities, forest communities) and proprietors (the communes). The use of forests for recreational purposes is free of charges, irrespective of ownership and irrespective of whether the recreational activities are private or organized (commercial). An agreement with the land’ owner is required only in the case of commercial-based harvesting of forest products, such as berries or mushrooms. All the forests inside the National Park where the innovation is located are in public ownership. The innovation here regards the development of commercial private recreation services on public land. In 1998 the owner of a local business started to cooperate with the Carpathian Large Carnivore Project, leading at that time the ecotourism program "Wolves, Bears, and Lynx in Transylvania." One year later the owner launched his own tour operation (Carpathian Tours). The innovative aspect in the development of nature-based tourism is not just to offer accommodation, as there are many other tourism structures, in the near area, as well as wildlife observation services and organized forest-based recreational activities. The tour operator receives around 500 tourists yearly. The key actors are from outside forestry, except the national park administration. The idea for the innovation came from the ecotourism program developed by the Carpathian Large Carnivore Project which was very active in providing knowledge and coordination. The national park administration (a public forest management structure) provided its services for wildlife discovery and of the pursuit of nature-based activities. The local branch of ANTREC (National Association for Rural, Ecological and Cultural Tourism) also played an important coordination role. Members are owners of small accommodation structures mainly in rural areas (guesthouses). The innovator also is a non-forester. He brought to the area the experience he had previously gained in business management abroad. The financial resources involved were exclusively private (the innovator’s own investment). The innovation did not need special infrastructure, except the buildings for tourist accommodation. The natural capital played an essential role. Without the beautiful landscape and the presence in the area of the large carnivores, the innovation would have been impossible. (Source: L. Bouriaud, ROM) Case Study 13: Building private forest owner associations and services in Lithuania The process of building cooperation among private forest owners in Lithuania is rather slow and is having to overcome many obstacles. However, considerable efforts and progress was made in Lithuania, mainly based on private initiatives. A typical forest owner’s cooperative in Lithuania is small, with up to 10 members and about 20 clients who are service recipients. The main objectives of cooperatives are to develop a membership base, and the provision of services to their members in particular on timber harvesting and marketing. To convince private forest owners to join cooperatives, these cooperatives are forced to develop business models that meet the needs of private forest owners, which usually requires services that show a concrete contribution to higher profit for the members. (Source: A. Gaizutis, LT, other)

97
Case Study 14: LEADER+ and forestry: “Wood Competence Center,” Germany Declining timber sales in a specific region reflected a “need for action”. The deputy chief district forester had the idea of building a wooden house made of regional pine (pinus sylvestris). His consultations with the regional LEADER manager led to an “integrated forest-related idea.” Provided that regional timber and labor could be used, a wooden house, trend-setting in design and energy-balance was constructed. The LEADER manager convinced an architect specialized in timber construction and building biology to design the house. The architect turned out to be a “strong promoter” of the project. He achieved sustained success in monetary terms as well as for nature conservation. In 2005 this prototype house was constructed and has been used as an educational showroom promoting wood as a renewable resource.
“Strong allies” were won for the project. The co-financer and builder is a small city in the LEADER region, represented by its mayor. There is a “win–win situation” for both the region and the forestry actors. Forestry actors benefit from timber valorization, tending of woods, as well as benefiting from public relations for forestry and wood processing. The new house is located on the property of the local youth hostel which uses this attraction for educational purposes. The house is fundamental for increasing tourist trade and improving the quality of life in the region. Furthermore, it increases the awareness of wood for the next generations of home buyers. Serial production for national sales is intended.
The positive project development was greatly influenced by “strong interceders.” Early in the process the local agency for rural development realized the potential of the project for the region. It supported the LEADER management in applying for EU project funds. The president of the state forest service, members of the EU parliament, and members of the state parliament (officials living this electoral district) used the house’s opening ceremony to become associated with this project. In return for this public marketing exercise, all the officials gave good feedback about the project in their own constituencies.
A regional company sponsored the fitted kitchen for the house. To date there have been two follow-up projects (non-LEADER projects). The kitchen company plans a new kitchen made of regional pine. Another company producing urban furnishing products plans to build benches and other furniture. . (Source: M. Böcher, GER)

98
Annex 9 (i). Globalization in Chile Tybout, de Melo and Corbo (1991) analyze a large set of Chilean microdata in an effort to measure the effects of trade liberalization on productivity. They take advantage of the fortuitous fact that Chile’s trade liberalization of 1974–1979 was preceded and followed by industrial census, the first in 1967 and the second in 1979. Their sample is the universe of manufacturing plants with five or more workers, numbering 7,060 in 1967, 6,771 in 1979, and classified, in each year, into 21 three-digit ISIC (International Standard Industrial Classification) industries. They calculated total factor productivity (TFP) of each plant by fitting a Cobb-Douglas production function to data for each industry and year. Unexpectedly, they found no evidence of an improvement in overall industrial efficiency between the two census years. But the researchers did find that plants in industries subjected to the greatest reductions in protection became more productive relative to plants in other industries: “industries undergoing relatively large reductions in protection experienced relatively large improvements in average efficiency levels, and relatively large reductions in cross-plant efficiency dispersion.” Chilean manufacturing between these two census years suffered many shocks other than trade liberalization, including hyperinflation in 1973, a major recession in 1974–1976, and large increases in real interest rates. Individual plants are not identified in the data base, so it is not known how many of those operating in 1967 were still operating in 1979, nor how many new plants entered each industry. Pavcnik (2002) also uses plant-level data, but assembles an unbalanced panel from annual industrial surveys from 1979 through 1986. Though not a census, each survey includes, in principle, all manufacturing plants with 10 or more employees. The author’s main contribution is to correct for the selection bias induced by plant exit and for simultaneity bias resulting from the fact that productive plants with high TFP have every incentive to expand, hiring more workers and contracting more capital. To correct for simultaneity, she uses the Olley-Pakes (1996) technique with investment as an indicator of the unobserved plant level productivity. Pavcnik estimates a production function on a two digit ISIC (International Standard Industrial Classification) level for each of eight industries: food, textiles, wood, paper, chemicals, glass, basic metals, and machinery. These are very broad “industries.” Wood (ISIC 33), one of the more narrowly defined industries, includes sawmills and varied wood products such as furniture. Paper (ISIC 34) comprises pulp, paper, paper products, and printing and publishing. The heroic assumption is that “plants producing various four digit ISIC goods within a … two digit ISIC classification use the same factor proportions.” Output, in common with all studies of this type, is necessarily not physical output, but rather the monetary value of production deflated by a price index of the output of the four-digit industry to which a plant is assigned. Trade orientation is also measured at the four-digit level (38 industries). Plant exit was very important in Chile over the sample period, especially during the severe recession of 1982–1983. More than 35% of plants active in 1979 had ceased to produce by 1986. These exiting plants had employed 25% of the 1979 labor force and accounted for 13% of 1979 investment and 16% of the output. Pavcnik estimates that aggregative total factor productivity increased by 19% between 1979 and 1986. Most (12.7%) of the increase is due to reallocation of resources from less to more efficient producers and only 6.6% due to increased productivity within plants. She divides her sample into three parts, separating the plants into those classified in non-tradable, exportable

99
and import-competing industries, and finds that aggregate productivity grew least (6%) in the non-tradable group and most (32%) in the import-competing group of plants. This is evidence that trade liberalization enhances productivity in Chilean manufacturing. Pavcnik also regresses plant-level productivity on time, trade orientation, interaction between time and trade orientation, industry dummies, and a plant exit indicator. There is a negative coefficient on the exit variable, the size of which suggests that exiting plants are 8.1% less productive than surviving plants. She finds that plants in the import-competing group become more and more productive relative to plants in the non-traded goods group over the 1980–1986 period, but plants located in industries producing exportable goods fail to experience productivity improvements. Though she does not say so, this may be due to the fact that only a minority of plants export, even in industries producing exportable goods, and she has no information on exports at the plant level. Bergoeing et al. (2006) analyze the same source of data as Pavcnik (the annual industrial survey), but they use a much longer series—1980–2001—and estimate production functions at the three digit rather than the two digit level of the ISIC. They analyze a total of 26 industries, as two (tobacco and petroleum refining) are organized as monopolies, with too few plants for estimation of production functions. Bergoeing et al., like Pavcnik, use the Olley-Pakes (1996) estimation procedure to correct for simultaneity, but they use electricity rather than investment as a proxy for unobserved plant level productivity. Once again, total factor productivity (TFP) is estimated at the plant level as a residual. Bergoeing et al. (2006, p. 3) pay particular attention to plant entry and exit. Entry rates average 5.6% and exit rates 6.3% and both rates rise significantly over the sample period. They find that:
although newly created firms display lower productivity than incumbents at the time of entry, entering survivors quickly improve their productivity. After one period only, the productivity of a new plant is statistically equal to that of an incumbent. Moreover, exiting plants experience a downward trajectory of productivity prior to exit. Thus, on average, inefficient plants are replaced by firms that are more efficient and that experience rapid improvements in productivity.
It should be emphasized, however, that a plant can exit from the sample and remain in operation, albeit with fewer than ten employees. It is not known how many of the “exiting” plants in reality have downsized rather than closed operations. In contrast to Pavcnik’s 2002 study, Bergoeing et al. find that for the entire 1980–2001 period, TFP gains of 42.8% are driven almost entirely by entry of new plants. TFP accelerates around 1988. For the 1988–2001 period, within-plant efficiency gains become very important, accounting for 46.4% points of the total TFP gain of 80.1%. Schumpeterian creative destruction (entry and exit of plants and, to a limited extent, reallocation of inputs across incumbent plants) accounts for the remaining TFP gain. Bergoeing et al. divide their 26 industries into four types of trade orientation: export-oriented (export/sales >10%), import competing (imports/apparent consumption>20%), other traded (both conditions satisfied) and non-traded (all other industries). In the evolution of TFP over time, firms in traded sectors steadily increase their advantage over firms in the non-traded sector, although the dynamics are not strictly monotonic (there are several downturns,

100
followed by recovery). This is generally true for each of the three traded categories. The researchers conclude (p. 11) that their findings:
suggest that plants did respond to an intensified foreign competition. Possibly the enhancement of within-plant productivity is a result of a reduced cost of foreign capital and intermediate materials, self-selection into international markets, and learning from international buyers, sellers and competitors.

101
Annex 9 (ii). Globalization in Brazil Moreira and Correa (1998) examined the impact of trade liberalization over the 1989–1996 period in 39 manufacturing industries, but did not look at individual firms or plants. Moreira (2002) extended the analysis to 1998, increasing the number of industries to 49. A key finding is that the economy responded with intra-industry trade and specialization: there was a generalized increase in import penetration and export ratios in all industries. For manufacturing as a whole, the import penetration ratio (imports as a share of apparent consumption) increased from 4.5% in 1989 to 19.3% in 1998, with particularly high increases in electronics, machinery and equipment, motors and vehicle components, chemicals, tractors, automobiles and trucks, wheat milling, and non-ferrous metals. The share of exports in production rose more modestly from 8.8% to 14.8% with notable gains in “other vehicles,” lumber, sugar, footwear, motors and vehicle components, tobacco, tractors, machinery and equipment, and electronics. A shift/share analysis reveals that output gains and losses over the period owed more to changes in domestic demand than to the impact of trade liberalization. Ferreira and Rossi (2003) also look at broadly-defined manufacturing industries rather than firms or plants, but their work is more analytical and less descriptive than that of Moreira and Correa. In particular, Ferreira and Rossi estimate total factor productivity of each industry as the residual of a single, cross-industry production function. There was no information on value added by industry, so the researchers used gross output (in constant prices) as a proxy. They constructed an annual series for output, labor and physical capital from survey data for 16 of 21 Brazilian manufacturing industries from 1985 to 1997. The coefficients of the production function are assumed constant across time and across industries, but the residual, interpreted as a measure of total factor productivity, is allowed to vary by year and by industry. The researchers correct for simultaneity bias (the residual is correlated with capital and labor), using the rental rate of capital and real wages as instruments for instrumental variable (IV) estimation. Even though the dependent variable in the production function is gross output, input variables are limited to labor and capital; implicitly, material input/output ratios are assumed constant so that changes in the value of final output proxies changes in an industry’s contribution to GDP. The Ferreira/Rossis estimates of TFP follow the same trend as labor productivity and the two measures are highly correlated: productivity declined in all 16 industries between 1985 and 1990, while 1991–1997 trends were positive in all industries but one (pharmaceuticals). The average growth rate of TFP jumped from -3.83% in 1985–1990 to +2.65% in 1991–1997. When TFP growth rates are regressed on nominal or effective tariffs, the coefficients are significantly negative, consistent with the hypothesis that trade reform resulted in increased efficiency in Brazilian manufacturing. Hay (2001) was the first study to look at the productivity of firms rather then industries. Specifically, he seeks to “analyse the degree to which changes in sales productivity (that is, sales per worker) can be explained by changes in the level of protection across different sectors after 1990.” He assembles data for a balanced panel of 318 large manufacturing firms operating in the period 1986–1994. Data for 1991 are missing because the annual survey of manufacturers was suppressed that year for budgetary reasons. He estimates a single Cobb-Douglas production function, with sales per worker as the dependent variable. Independent variables are the value per worker of the capital stock of each firm (balance sheet data), the effective rate protection for the industry, year dummies, and industry dummies. “Workers” refer to end-of-year workforce; no information is available for average number of workers

102
employed by each firm, nor their quality (educational levels). Each firm’s total factor productivity is calculated as a residual (actual minus the sales per worker predicted by the production function). In a second stage, Hay regresses total factor productivity on import protection, the real exchange rate, year dummies, and a full set of firm dummies. It is not clear why he included effective protection as an independent variable in the production function, for this presumably affects his estimates of total factor productivity, obscuring any relationship between that variable and effective protection. In any case, coefficients on the protection variables are significant with the expected negative sign, but the impact is reduced very much when year dummies are included in the regression. Hay concludes that even though it is difficult to distinguish between the effects of trade liberalization and the effects of other policy changes in the post-1990 years, “the greater part of the gains should be attributed to trade liberalisation.” The real exchange rate variable is totally without significance in the regressions. In additional analysis, Hay shows that the “very large total factor productivity gains … were accompanied by large falls in market shares and profits.” Schor (2004) analyzes survey data for 4,484 manufacturing firms, selected from a total of 9,130 firms with at least one year of positive sales in the period 1986–1990 or 1992–1998. (The annual survey of all large firms and a random sample of medium-sized firms was not carried out for 1991.) The 50% reduction in sample size resulted from elimination of outliers, firms with fewer than two consecutive observations, and those with “clearly misreported values.” Schor classified the unbalanced panel of firms according to the 27 industries of nivel 100 in the Brazilian classification system, roughly equivalent to the three-digit ISIC classification. She estimates a Cobb-Douglas production function for each industry and calculates productivity (efficiency level) of the firm as the difference between observed output and output estimated by the production function. Output is measured gross, as the value of all production, and inputs are administrative workers, production workers, physical capital, and other inputs (raw materials and intermediate goods). She corrects for simultaneity bias by using the Olley-Pakes (1996) technique with inputs of labor, capital and other inputs to indicate the unobserved plant level productivity. It was not possible to use investment for this purpose because of a large number of zero values for investment. She does not explicitly correct for selection bias because there is no way of knowing if a firm has ceased production or if it is a case of missing data. The results of this exercise show a surprising amount of heterogeneity among manufacturing enterprises, and productivity fluctuates a great deal from year to year in most industries. Nonetheless, comparing 1998 with 1990, 20 of the 27 industries register an increase in productivity levels, which is consistent with the hypothesis that globalization has increased the efficiency of Brazilian manufacturing. To test more directly the effect of trade liberalization, Schor regresses total factor productivity of a firm on the nominal tariff of an industry, using year dummies to control for changes in macroeconomic policy and industry dummies to control for time-invariant characteristics of the political economy of trade liberalization (given that the rank order of protection by industry changed very little). The period examined begins in 1990 (the effective beginning of trade reform) and ends in 1998, so there are a total of 23,589 observations—an average of fewer than 3,000 firms each year—in the full regression equation. Without the industry

103
dummies, the coefficient on the nominal tariff is positive and highly significant. With industry dummies added, the coefficient becomes negative (the expected sign), but is not statistically significance. The regression produces a statistically significant, negative sign only when 4,484 “firms’ fixed-effects were included to correct a bias that may arise because the production function is estimated for each industry and not for each firm.” Adding a variable for tariffs on inputs to the equation lowers the magnitude, but not the sign nor statistical significance, of the coefficient on nominal tariffs. The coefficient for tariffs on inputs is negative and statistically significant, indicating that, along with increased competition, greater access to imported inputs also contributes to enhance productivity following trade liberalization. In further analysis, Schor runs quantile regressions—one for each decile of the productivity distribution—and finds a significantly negative coefficient on input tariff for each decile, but after three deciles the negative coefficient on nominal tariff loses significance, and by the sixth decile becomes positive and significant. This could well reflect selection bias: Firms at the lower end of the productivity distribution have to increase productivity a great deal in order to compete with imports; those who fail to increase productivity exit from the market and are not sampled. In contrast, firms with high productivity, as some inputs are fixed, face a reduction in productivity as they lose market share to imports, but are able to survive without exiting given their still high levels of productivity. The fact that selection bias is ignored is a major shortcoming of the study in question. The sample of firms is not random, as it necessarily excludes those that cease production, and the characteristics of these exiting firms are not known. A key finding is that the response of firms to globalization is very heterogeneous, even within industries. But, as Schor (p. 392) herself admits, “the results are in general not very robust to different specifications.” Muendler (2004), examines the same set of annual industrial survey data as Schor, but does not delete observations, so his unbalanced panel contains 9,500 medium and large manufacturing firms operating in the 1986–1998 period. Muendler estimates firm-level productivity, inferred from Cobb-Douglas production functions for 27 industries estimated with three alternative procedures: ordinary least squares (OLS), firm-fixed effects, and an extension of the Olley-Pakes (1996) procedure. All three procedures produce similar estimates of total factor productivity at the level of the firm. The production function that Muendler estimates is similar to that of Schor, except that Muendler divides physical capital into two parts (equipment and structures) and adds variables for share of imported equipment in total equipment and share of imported intermediates in total intermediates. He retains the blue collar/white collar distinction used by Schor. Like Hay (and unlike Schor), he includes measures of trade liberalization in the production functions, namely import penetration and nominal tariff protection. Uniquely, he adds an aggregate demand variable to each production function. There is no discussion in the text of this variable, but presumably it measures aggregate consumption of the products of an industry demand (i.e. industry output plus imports). Production function estimates are reported for five of the 27 industries—those with the largest number of observations—and the coefficients of the trade liberalization variables are erratic, significantly positive, or significantly negative, depending on the industry. Muendler (2004, p. 13) concludes that “the effect of competition variables on productivity should be revisited.” Interestingly, the coefficient on the shares of imported capital equipment and imported intermediate goods, for the most part, do not differ significantly from zero. When significant,

104
imported inputs exhibit a negative effect on output, suggesting “that the mean firm may not succeed in putting more expensive foreign equipment [and intermediate goods] to sufficiently effective use during the sampling period” (p. 13). Estimated TFP for the aggregate of the 27 industries shows a large drop in the 1980s, reaching a trough in 1990, and increasing steadily by roughly 5% over the next five years. Results by industry are not reported.
Muendler next regresses firm-level productivity on a wide variety of variables in order to assess the relative importance of three separate channels by which trade liberalization might increase productivity, which he calls 1) competitive push, 2) foreign input push, and 3) competitive elimination. He finds the first channel—competitive push—to be by far the most important. Even though his sample is not representative (small firms are excluded and large firms are over-represented), once a firm is in the sample, it remains there until it ceases production, regardless of its size. This allows Muendler to explicitly control for the selection bias of exiting firms, which have 8.2% lower productivity than survivors, on average.
To determine the importance of the competitive channel, Muendler regresses firm-level productivity on nominal tariffs and import penetration, using instrumental variables to correct for endogeneity and simultaneity. He also controls for firm-level variables such as imported inputs and relative firm size. Interestingly, he finds that “firms that start to use more foreign inputs suffer a slowdown in productivity in the subsequent year” because “they face implementation costs, may need to retrain workers and carry out adjustments to the production process” (p. 20). Lower tariffs and import penetration induce firms to improve efficiency. These effects are significant even without addressing endogeneity and simultaneity issues, but the effects are much larger with estimates that take this bias into account. This is consistent with the existence of a positive bias in the coefficient on tariffs (inefficient industries are targeted with low tariffs) and a negative bias in the coefficient on import penetration (inefficient industries are attractive markets for foreign suppliers). “Had there not been an increase in competitive pressure due to foreign imports, Brazilian manufacturers would have continued their ‘quiet lives’ and productivity would have improved more slowly” (p. 16).
Regarding the foreign input channel, a careful analysis of the behavior of the two import share variables in the production functions leads to an unambiguous conclusion that there is little or no evidence that technology embodied in imported equipment or imported intermediate goods are sources of immediate productivity change. Possibly for this reason, 80.4% of all manufacturing firms surveyed in 1986–1995 used no imported equipment and 56.9% in 1996–1998 used no imported intermediate inputs.
The competitive elimination channel is a significant, though small, source of productivity gains. The unconditional exit probability of a non-exporter increases after 1991 from 2.8% to 5%. The lower a firm’s total factor productivity (TFP), the more likely a firm will exit, unless the firm is an exporter, for TFP does not affect the exit likelihood of exporters, whose TFP is already high. Exiting firms are 8.2% less productive than survivors on average, but the probability of exit is rather low, so the effect on aggregate TFP is small. One must keep in mind, however, that small manufacturers are excluded from this sample. The probability of exit of small firms is likely much higher, so the importance of the competitive elimination channel would no doubt be greater in a full or representative sample of manufacturing firms in Brazil.

105
Annex 9 (iii). Literature Cited Globalization and the State Cameron, D., 1978. “The Expansion of the Public Economy: A Comparative Analysis,”
American Political Science Review 72:4 (December), 1243–1261. Coe, D.T., Subramanian, A. and Tamirisa, N.T., 2007. “The Missing Globalization Puzzle,”
IMF Staff Papers 54:1 (June), 34-58. Hays J. C., Ehrlich, S.D. and Peinhardt, C., 2005. “Government Spending and Public Support
for Trade in the OECD: An Empirical Test of the Embedded Liberalism Thesis,” International Organization 59:2 (April), 473–494.
Mayda, A.M., O’Rourke, K.H. and Sinnott, R., 2007. “Risk, Government and Globalization:
International Survey Evidence,” NBER Working Paper 13037 (April). Rodrik, D., 1998. “Why Do More Open Economies Have Bigger Governments?” Journal of
Political Economy 106:5, 997–1032. United Nations, 2001. “Globalization and the State,” World Public Sector Report; United
Nations Sales No. E.01.II.H.2, New York. Wolf, M., 2004. Why Globalization Works. Yale University Press. New Haven, CT, USA.
Intra-industry trade and specialization Balassa, B., 1966. “Tariff Reductions and Trade in Manufactures among the Industrial
Countries,” American Economic Review, 56:3 (June), 466–472. Bartelsman, E.J. and Doms, M.D., 2000. “Understanding Productivity: Lessons from
Longitudinal Microdata,” Journal of Economic Literature 38:3 (September), 569–594. Bartelsman, E., Haltiwanger, J. and Scarpetta, S., 2004. “Microeconomic Evidence of
Creative Destruction in Industrial and Developing Countries,” IZA Discussion Paper 1374 (October).
Bernard et al., 2003. “Plants and Productivity in International Trade,” American Economic
Review 93:4 (November), 1268–1290. Bernard et al., 2007. “Comparative Advantage and Heterogeneous Firms,” Review of
Economic Studies 74, 31–66. Del Gatto et al., 2007. “Openness to Trade and Industry Cost Dispersion: Evidence from a
Panel of Italian Firms,” CEPR Discussion Paper 6336 (June). Giersch, H. (ed.), 1979. On the Economics of Intra-Industry Trade, J.C.B. Mohr, Tübingen,
Germany.

106
Greenaway, D. and Kneller, K., 2007. “Firm Heterogeneity, Exporting and Foreign Direct Investment,” Economic Journal, 117 (February), F134–F161.
Grubel, H.G., 1967. “Intra-industry Specialization and the Pattern of Trade,” Canadian Journal
of Economics and Political Science 33 (August), 374–388. Helpman, E. and Krugman, P., 1985. Market Structure and Foreign Trade. Cambridge,
Mass.: MIT Press. Hu, X. and Ma, Y., 1999. “International Intra-Industry Trade of China,” Weltwirtschaftliches
Archiv (Review of World Economics), 135:1 (January), 82–101. Krugman, P., 1995. “Increasing Returns, Imperfect Competition and the Positive Theory of
International Trade,” in G.M. Grossman and K. Rogoff (eds.), Handbook of International Economics, 3: 1243–1277. Elsevier, 1995, Amsterdam.
Levinsohn, J. and Petrin, A., 2003. “Estimating Production Functions Using Inputs to Control
for Unobservables,” Review of Economic Studies 70:2 (April), 317–341. Lloyd, P.J. and Lee, H., (eds.), 2002. Frontiers of Research in Intra-Industry Trade. Palgrave,
New York, USA. López, R.A., 2005. “Trade and Growth: Reconciling the Macroeconomic and Microeconomic
Evidence,” Journal of Economic Surveys 19:4 (September), 623–648. McMillan, C.H., 1973. “Soviet Specialization and Trade in Manufactures,” Soviet Studies
24:4 (April), 522–532. Melitz, M.J., 2003. “The Impact of Trade on Intra-Industry Reallocations and Aggregate
Industry Productivity,” Econometrica 71:6 (November), 1695–1725. Ohlin, B., 1993. Interregional and International Trade. Harvard University Press, Cambridge,
MA, USA. Olley, G.S. and Pakes, A., 1996. “The Dynamics of Productivity in the Telecommunications
Equipment Industry,” Econometrica 64:6 (November), 1263–1297. Petersson, L., 2002. “Integration and Intra-industry Trade Adjustment in South Africa,”
Development Southern Africa 19:2, 239–259. Verdoorn, P.J., 1960. “The Intra-Block Trade of Benelux,” in R.A.G. Robinson (ed.),
Economic Consequences of the Size of Nations, Macmillan, London, UK, 291–329. Willmore, L., 1972. “Free Trade in Manufactures among Developing Countries: The Central
American Experience,” Economic Development and Cultural Change 20:4 (July), 659–670. Willmore, L., 1992. “Transnationals and Foreign Trade: Evidence from Brazil,” Journal of
Development Studies 28:2 (January), 314–335.

107
Chile Alvarez, R. and Fuentes R., 2003. “Trade Reforms and Manufacturing Industry in Chile,”
Central Bank of Chile Working Paper 210. Bergoeing et al., 2006. “Market Reforms and Efficiency Gains in Chile,” Central Bank of
Chile Working Paper 372 (August). Edwards, S., and Lederman, D., 1998. “The Political Economy of Unilateral Trade
Liberalization: The Case of Chile,” NBER Working Paper 6510 (April). Pavcnik, N., 2002. “Trade Liberalization, Exit, and Productivity Improvements: Evidence
from Chilean Plants,” The Review of Economic Studies 69:1 (January), 245–276. Tybout, J., de Melo, J. and Corbo, V., 1991. “The Effects of Trade Reforms on Scale and
Technical Efficiency: New Evidence from Chile,” Journal of International Economics 31:3-4 (November), 231–250.
Brazil Ferreira, P.C. and Rossi, J.L., 2003. “New Evidence from Brazil on Trade Liberalization and
Productivity Growth,” International Economic Review 44:4 (November), 1383–1405. Hay, D.A., 2001. “The Post-1990 Brazilian Trade Liberalization and the Performance of
Large Manufacturing Firms: Productivity, Market Share and Profits,” Economic Journal 111:473 (July), 620–641.
Moreira, M.M., 2002. Brazilian Industry in the 1990s: What Can Already Be Said? BNDES,
Brasilia, Brazil. See http://www.bndes.gov.br/english/studies/indust.pdf Accessed 19 July 2007.
Moreira, M.M. and Correa, P.G., 1998. “A First Look at the Impacts of Trade Liberalization
on Brazilian Manufacturing Industry,” World Development 26:10 (October), 1859–1874. Muendler, M.-A., 2004. “Trade, Technology, and Productivity: A Study of Brazilian
Manufacturers, 1986–1998,” CESifo Working Paper 1148 (March). Schor, A., 2004. “Heterogeneous Productivity Response to Tariff Reduction: Evidence from
Brazilian Manufacturing Firms,” Journal of Development Economics 75:2 (December), 373–396.

108
References
Alcamo et al. (1995) “An Evaluation of the IPCC IS92 Emission Scenarios,” in Houghton et al. (eds) Climate Change 1994, Radiative Forcing of Climate Change and An Evaluation of the IPCC IS92 Emission Scenarios, Cambridge University Press, Cambridge, UK, 233–304.
Bauer, J., Kniivila, M., and Schmithüsen, F. (2004) “Forest Legislation in Europe: How 23 Countries Approach the obligation to Reforest, Public Access and Use of Non-Wood Forest Products.” A study implemented in the framework of the European Forest Sector Outlook study (EFSOS). UNECE Geneva timber and forest discussion paper 37. Geneva, Switzerland.
Becker et al. (2006) “Can Europe’s Forestry Satisfy the Increasing Demand for Raw Material and Energy under Sustainable Management?” Background Paper for the Workshop Mobilizing Wood Resources, United Nations Economic Commission for Europe/Food and Agriculture Organization, Geneva, Switzerland. 11–12 January.
Botnia (2006) “Botnia’s project approved by the boards of IFC and MIGA,” Press Release, Botnia, Finland, 21 November,
Bouriaud et al. (2005) “Romania Country Report to COST E30,” Phase 1, Acta Silva Ligna, Special Issue, University of West Hungary, Sopron, Hungary.
Bystriakova, N., and Schuck, A. (2001) “Forest Research Capacities in 18 European Countries,” in Palo, M., Uusivuori, J. and Mery, G. (eds), World Forests, Markets and Policies, World Forests book series, V.3, Kluwer Academic Publishers, Dordrecht, Netherlands.
Cesaro, L., Florian, D. and Pandureanu, L. (2006) “Delocalization of Wood Working Industries to Balkan Countries. Analysis of Statistical Data and Case Studies,” in A. Niskanen (ed), Issues Affecting Enterprise Development in the Forest Sector in Europe (Final Report of COST Action E30); University of Joensuu, Finland.
Chanda, N. (2007) Bound Together. How Traders, Preachers, Adventurers and Warriors Shaped Globalization, Yale University Press, New Haven, CT, USA.
COST E51, 2006–2010, “Integrating Innovation and Development Policies for the Forest Sector, European Science Foundation COST Action E51.
ECA (2004) Special Report No 9/2004, “Forestry Measures within Rural Development Policy,” Report of the European Court of Auditors. See: www.eca.europa.eu/audit_reports/special_reports/docs/2004/rs09_04en.pdf
Edquist, C. and Johnson, B. (1997) “Institutions and Organizations in Systems of Innovation,” in Edquist, C. (ed), Systems of Innovation: Technologies, Institutions, and Organizations, Pinter, London, UK 41–63.
EFI (2005) “Evaluating Financing of Forestry in Europe,” EFFE Final Report. QLK5-CT-2000-01228, European Forest Institute, Joensuu, Finland.
EU (2003) The Forestry Wood Chain: The Impact of EU Research (1998–2004), Directorate-General for Research, European Commission, Brussels.
EurObserver (2007) Sixième bilan état des énergies renouvelables en Europe, EurObserver, Paris [in French].

109
EUROSTAT (2005) Statistics in Focus: Science and Technology, February.
FAO (2004) “Trends and Current Status of the Contribution of the Forest Sector to National Economies,” FAO Working Paper FSFM/ACC/07, prepared by A. Lebedys, Forest Products and Economics Division, FAO, Rome, Italy, December.
FAO (2006) “Global Forest Resources Assessment,” Main Report, United Nations Food and Agriculture Organization (FAO), Rome, Italy.
FAOSTAT (2007) FAO Statistics Division, Homepage. United Nations Food and Agriculture Organization, Rome, Italy, February.
Fischer et al. (2006) “Climate Change Impacts on Irrigation Water Requirements: Effects of Mitigation 1990 to 2080,” Technological Forecasting and Social Change, doi:10.1016/j.techfore.2006.05.021
Forestry Commission (2006) Forestry Statistics 2006―Finance and Prices, The Forestry Commission of Great Britain, Edinburgh, Scotland.
FTP (2006) “Forest Technology Platform Vision 2030: Innovative and Sustainable Use of Forest Resources.” See www.forestplatform.org
Grübler et al. (2006) “Regional, National, and Spatially Explicit Scenarios of Demographic and Economic Change Based on SRES, Technological Forecasting and Social Change, doi:10.1016/j.techfore.2006.05.023.
Hänninen, R., Toppinen, A. and Toivonen, R. (2007) “Transmission of Price Changes in Sawnwood and Sawlog Markets of the New and Old EU Member Countries,” European Journal of Forest Research, 126(1): 111–120, January.
Hirsch-Kreinsen H., Jacobson D. and Robertson P. (2006) “Low-Tech Industries: Innovativeness and Development Perspectives. A Summary of a European Research Project,” Pilot Project Consortium.
Houllier et al. (2005) “Future Forest Research Strategy for a Knowledge-based Forest Cluster: An Asset for a Sustainable Europe,” Discussion Paper 11, European Forest Institute (EFI), Joensuu, Finland.
Lamberg, J.-A., Näsi, J., Ojala, J. and Sajasalo, P. (2006) (eds) The Evolution of Competitive Strategies in Global Forest Industries. Springer, Dordrecht, The Netherlands.
Lutz, W., and Sanderson, W. (2001) “The End of World Population Growth,” Nature 412(6846): 543–545.
Mantau et al., (2005) “Germany Country Report to COST E30,” Phase 1, Acta Silva Ligna Special Issue, University of West Hungary, Sopron, Hungary.
Mantau U., Merlo, M. Sekot W. and Welcker, B. (2001) Recreational and Environmental Markets for Forest Enterprises: A New Approach toward Marketability of Public Goods Oxford University Press, Oxford UK.
McGahan, A.M. (2004) How Industries Change. Harvard Business Review, October 2004.
Merlo, M. and L. Croitru (eds) (2005) Valuing Mediterranean Forests. Toward Total Economic Value, CABI, Wallingford, UK.
METLA (2004) Finnish Forest Sector Economic Outlook 2003–2004, METLA (Finnish Forest Research Institute), Finland.
110
METLA (2005) “Challenges in Roundwood Trade between Finland and Russia―A Cultural Approach,” in Working Papers of the Finnish Forest Research Institute 7, prepared by Vinokurova et al., METLA, Finland.
METLA (2006a) Finnish Statistical Yearbook of Forestry 2005, METLA, (Finnish Forest Research Institute), Finland.
METLA (2006b) Finnish Forest Sector Economic Outlook 2006–2007, METLA, (Finnish Forest Research Institute), Finland.
Mizaras S. (2005) (eds) Small-scale Forestry in a Changing Environment; IUFRO 3.08.00 International Symposium 2005 Report, Lithuanian Forest Research Institute, Vilnius, Lithuania.
Nakicenovic, N. and Swarts, R. (2000) Special Report on Emissions Scenarios. International Panel on Climate Change, Cambridge University Press, Cambridge, UK.
Nakicenovic et al. (2006) “Assessment of Emissions Scenarios Revisited,” Environmental Economics and Policy Studies 7(3):137–173.
Niskanen, A. (2006) (ed) “Issues Affecting Enterprise Development in the Forest Sector in Europe,” Final Report of COST Action E30, University of Joensuu, Finland.
OECD (2005) Oslo Manual: Guidelines for Collecting and Interpreting Innovation Data, 3rd edition.
ÖIR (2003) Ex-post evaluation of the Community Initiative Leader II. Final Report. ÖIR - Managementdienste GmbH Vienna.
O’Neill, B.C. (2005) “Population Scenarios Based on Probabilistic Projections: An Application for the Millennium Ecosystem Assessment,” Population and Environment 26(3): 229–254.
Ollonqvist et al. (2006) “Delocalization of Woodworking Industry from Finland to the Baltic Countries,” in A. Niskanen (ed), Issues Affecting Enterprise Development in the Forest Sector in Europe, (Final Report of COST Action E30), University of Joensuu, Finland.
ONF (2005) Gestion Forêts 2005. Efficacité économique, Office National de Forets, France.
Pettenella et al. (2006) “NWFP&S Marketing in Europe: Lessons from Case Studies,” in A. Niskanen (ed), Issues Affecting Enterprise Development in the Forest Sector in Europe (Final Report of COST Action E30), University of Joensuu, Finland.
Rametsteiner, E. and Bauer, A. (2006) “Forest-Related Innovation and Investment Policies and Rural Development Strategies – Key Issues,” in: MCPFE Proceedings of the International Seminar on Policies Fostering Investments and Innovations in Support of Rural Development, held 27–29 March in Zvolen-Sielnica, Slovakia, Liaison Unit Warsaw.
Rametsteiner, E., Weiss, G. and Kubezko, K. (2006) Innovation and Entrepreneurship in Forestry in Central Europe (Research Report 19), European Forest Institute (EFI), Joensuu, Finland.
Šálka, J., Longauer, R. and Lacko, M. (2006) “The Effects of Property Transformation on Forestry Entrepreneurship and Innovation in the Context of Slovakia. Forest Policy and Economics, 8(7): 716–724. Rokityanskiy et al. (2006) “Geographically Explicit Global

111
Modeling of Land-Use Change, Carbon Sequestration, and Biomass Supply,” Technological Forecasting and Social Change, doi: 10.1016/j.techfore.2006.05.022, p.25.
Sekot, W. (2002) “Wirtschaftliche Entwicklung des Großwaldes von 1977–2001,” Österreichische Forstzeitung, 12:5–7 [in German].
Sekot, W. (2005) “Ergebnisse der Forstwirtschaftlichen Gesamtrechnung für 2003 und 2004,” Statische Nachrichten 11:1022–1028 [in German].
Sveaskog (2006) Annual Report 2005, Sveaskog, Sweden.
Tubiello, F. N. and Fischer, G. (2006) “Reducing Climate Change Impacts on Agriculture: Global and Regional Effects of Mitigation 1990 to 2080, “Technological Forecasting and Social Change, doi:10.1016/j.techfore.2006.05.027.
UNECE/FAO (2003) “The Development of European Forest Resources, 1950 to 2000: A Better Information Base, Geneva Timber and Forest Discussion Paper 31, prepared by S. Gold, United Nations Economic Commission for Europe, Geneva, Switzerland.
United Nations (2005) World Population Prospects: The 2004 Revision. CD-Rom edition—extended dataset, United Nations Department of Economic and Social Affairs Population Division, New York, USA.
UPM (2006) Annual Report 2005, UPM-Kymmene, Finland.