Embed Size (px)
Citation preview

Anna Long and Judith HogarthCellular Pathology
Newcastle upon Tyne Hospitals NHS Foundation Trust
North of England Cancer Network
HER2 testing Audit

We will cover…HER2 testing – an introductionAudit parametersAimsResults Summary Limitations

HER2HER2 is a trans-membrane tyrosine kinase
that mediates cell growth and survivalHER2 signalling induces cell proliferationHerceptin® binds to HER2 receptors and
inhibits proliferation by disrupting HER2 mediated downstream signalling
Only those patients that exhibit elevated expression of the HER2 antigen will benefit from treatment
Getting the test right is critical!

HER2 testingHER2 status is routinely used in breast
cancer testing and is recognised as a prognostic and predictive marker.
Eligibility for treatment assessed by immunocytochemistry and/or in situ hybridisation
IHCIHC
ISHISH
If ≥ 2.0 = AmplifiedIf ≥ 2.0 = Amplified
If < 2.0 = Non-
amplified
If < 2.0 = Non-
amplified
Negative
Positive
Equivocal
1+1+00 2+2+ 3+3+

NECN HER2 testingAt time of audit, undertaken by three
centres in the NECNGateshead Health NHS Foundation Trust
(QEH) Newcastle upon Tyne Hospitals NHS
Foundation Trust (RVI)North Tees and Hartlepool NHS Foundation
Trust (UHNT)
Centre
Tests referred from
IHC method
ISH performed?
ISH method
QEH QEHSRHUHND
Dako HercepTest
No, referred to RVI
N/A
RVI RVICRINTGH
Ventana 4B5
Yes Ventana SISH
UHNT UHNTJCUH
Ventana 4B5
No, referred to Source BioScience
N/A(Vysis FISH at Source BioScience)

UKNEQASAll centres performing HER2 testing must participate in the relevant NEQAS HER2 IHC and ISH modules
UKNEQAS cite two recommended HER2 testing guidelines:ASCO/CAP (Wolff et al. 2006)UK updated guidelines (Walker et al.
2008)

Walker et al. (J Clin Path)Laboratories undertaking tests should be
defined by each Cancer Network.UK minimum laboratory workload:
250 IHC cases per annum100 ISH cases per annum
Total HER2 positive cases: 15-17%Total IHC 2+ HER2 cases: average range
18-19%Number of IHC 2+ cases that exhibit HER2
gene amplification: 17-24%

Data collected from January 2011-December 2012 inclusive
Aims of the auditAre centres within the cancer network meeting these standards? Therefore we have established within the NECN:
(1) How many tests are performed by each centre
(2) The HER2 positivity rate(3) The number of 2+ cases generated
by IHC(4) The number of 2+ cases that exhibit
HER2 gene amplification
(1) How many tests are performed by each centre

All centres meet minimum benchmark for IHC tests performed
Number of IHC tests performed annually
0
200
400
600
800
1000
1200
1400
QE RVI UHNT
Centre
Num
ber
of t
ests
2011 2012 standard

Number of ISH tests performed annually
*Equivocal QE cases stained using SISH at RVI, UHNT cases performed by Source BioScience
All centres meet minimum benchmark for ISH tests performed

In summary (1) – Minimum number of tests performedAll centres satisfy the minimum
requirement for number of IHC and ISH tests performed.

(2) HER2 positivity rate
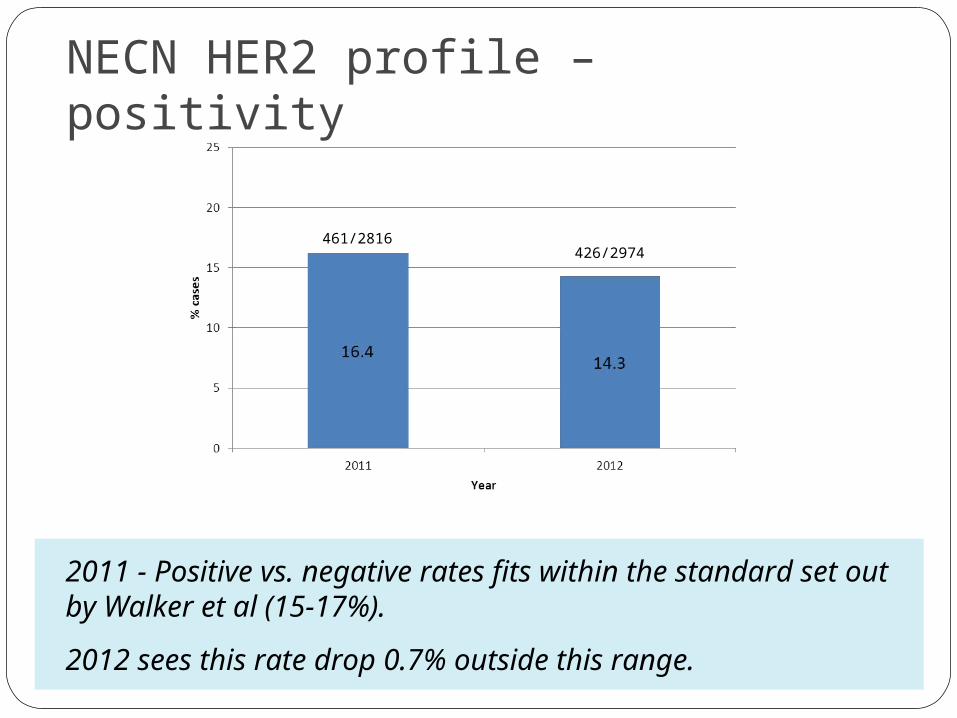
NECN HER2 profile – positivity
2011 - Positive vs. negative rates fits within the standard set out by Walker et al (15-17%).
2012 sees this rate drop 0.7% outside this range.
461/2816426/2974

Positivity profile for each centre
Quoted range 2006-2007 = 15-17%
RVI and UHNT fell within the expected positivity range in 2011.
QEH rate slightly above expected range in 2011 = 17.7%
Both QE and RVI have seen a drop in the positivity rate in 2012 (below 15%)
UHNT has shown an increase in positivity rate in 2012 (above 17%).
UKNEQAS data 2009-2012= 14.5%
135/764
135/976181/1185
148/1212
145/867145/794

Positivity rates - QEH and RVI
Positivity rate of cases has dropped across all hospitals (range = 2.4 - 5.0%)
Positivity rate of cases has dropped across all hospitals (range = 0.5 - 10.1%)
NTGH positivity rate has more than halved (19.9 – 9.8%)
56/362
60/508
19/105
27/199
60/297
48/269
53/40652/412
77/52366/495
51/256
30/305
15.5 18.111.8 17.820.213.1

Positivity rates in referring hospitals UHNT
Positivity rate of cases has increased across all hospitals (range = 0.5 - 3.1%)
82/49182/47763/376
63/317

In summary (2) – Positivity ratesThe NECN as a whole falls below the expected
frequency of positive HER2 cases. The audit period spans 2011-2012, however the
published literature details HER2 cases from 2006-2007.
UKNEQAS data spanning 2009-2012, quotes a positive rate of 14.5%, which means the NECN in fact meets the expected frequency of positive cases.
2/3 referral centres in 2012 fell below 14.5% (QEH and RVI) QEH – all referring hospitals showed a similar decline in
positivity rate This would suggest some common factor ?the test itself.
RVI - one referral hospital (NTGH) showed a marked decline in positivity rate (19.9-9.8%)
This would suggest an upstream factor is responsible for the observed shift.

(3) 2+ cases generated by IHC

2+ rate for NECN
Av. Quoted range 2006-2007 = 18-19%
UKNEQAS data 2009-2012 = 21.7%
The NECN falls below the quoted range for the whole audit period, and significantly below the UKNEQAS data.

2+ rate for centres
Av. Quoted range 2006-2007 = 18-19%
UKNEQAS data 2009-2012 = 21.7%
RVI and UHNT have shown <2% variation in 2+ rate.
QEH sees a 7.2% decrease
112/764
87/986
152/889
123/810180/1193
209/1230
16.0 15.1 17.0 15.217.18.8

% 2+ rates for referring hospitals QEH
Fall in 2+ rate observed in all hospitals (range = 4.9 – 8.8%)
Most significant decrease seen in SRH cases – more than halved.
58/363
52/518
18/107
16/199
36/300
19/269
16.0 10.0 16.8 8.0 12.0 7.1

% 2+ rates for referring hospitals - RVI and UHNT
Small increase seen in CRI and RVI cases (1.2% and 0.2 % respectively).Significant increase seen in NTGH cases (5.4%)
Small decrease seen in JCUH and UHNT cases (1.4% and 2.3% respectively).
57/40963/417
43/257
69/312
80/527 77/50164/386
49/322
88/503
74/488

In summary (3) – 2+ rate2+ rate within NECN falls below the
frequency cited in published and UKNEQAS data.
RVI and UHNT saw slight (<2%) fluctuations in 2+ rate between 2011 and 2012.
QEH showed a 7.2% decrease in 2+ reportingAll referring hospitals showed a decrease in
2+ rate (4.9-8.8% fall – SRH rate more than halved).

(4) 2+ cases that exhibit HER2 gene amplification

Number of 2+ cases that exhibit HER2 gene amplification - NECN
There has been a decline in the number of 2+ cases that exhibit HER2 gene amplification (3.8%).
Av. Quoted range 2006-2007 = 17-24%
UKNEQAS data 2009-2012 = 14.7%
70/441
49/406
15.9 12.1

2+ cases that exhibit HER2 gene amplification by centre
UHNT HER2 gene amplified cases increased 2.2%.
RVI saw a decrease of 6.7% in 2+ cases that demonstrated gene amplification….Why is this?
53/292
33/288 17/149
16/118
18.2 13.611.411.5

Amplified ISH performed at RVI
Quoted range 2006-2007 = 17-24%
UKNEQAS data 2009-2012 = 14.7%
There is significant variation in the reporting of HER2 gene amplified cases (range 0-36.8%).Most significant outliers = QEH (decrease of 10.3% to 0% amplified), UHND (increase of 22.1%), NTGH (decrease of 18.6%)
6/58
0/52
3/183/16
5/36
7/19
9/57
6/63
17/80
11/77
13/43
8/69
10.3 0.0 16.7 13.918.8 36.8 9.515.8 11.630.214.321.3

Amplified ISH UHNT cases (Source BioScience)
There is variation in the reporting of HER2 gene amplified cases (range 0.7-5.3%).
9/85
11/69
7/645/49

In summary (4) – 2+ amplified cases
There is marked variation in the positivity rate by HER2 gene amplification.
Significant outliers QEH (0% amplified 2012)UHND (increase of 22.1% from 2011 to 2012) NTGH (decrease of 18.6% from 2011 to
2012)This may be a symptom of variable 2+ rate
by IHC

In summary

Change in rates 2011 – 2012 by hospital
Hospital Change in positivity rate (%)
Change in 2+ rate (%)
Change in amplified 2+ rate (%)
QEH 2.2 6.0 10.3
SRH 5.0 8.8 2.1
UHND 2.4 4.9 22.9
NTGH 10.1 5.4 18.6
RVI 1.4 0.2 7.0
CRI 0.5 1.2 6.3
UHNT 0.5 2.3 5.3
JCUH 3.1 1.4 0.7

Limitations

Limiting factors
LimitationsPre-
analyticalAnalytical Post-
analyticalCold ischaemia
timeSubjective
interpretationSubjective
interpretation
Core vs excision Chosen HER2 test
Staffing
Fixation Methodology of test
Reporting confidence
Processing Staining platforms
Decalcification
Drying time
We need standardisation!

Future considerationsLook at 2013 data?

Thank youTrudy Johnson - QEHSharron Williams, Jim France – UHNTMerdol Ibrahim - UKNEQASImmunocytochemistry colleagues, RVI

Thank you for listening…
Questions?
References:Walker et al. HER2 testing in the UK: further update to recommendations. J Clin Path. 2008:61; 818-824.Wolff et al. American Society of Clinical Oncology/college of American Pathologists guideline recommendations for HER2 testing in breast cancer. J Clin Oncol. 2007: 25; 1-28.Ibrahim M. UKNEQAS HER2 audit data. UKNEQAS. 2009-2012. Personal communication.