Embed Size (px)
Citation preview

ANGIOGRAPHY AND PERFUSION MEASUREMENTSBY NMR
ROBERT TURNER*'* and PAUL KELLERt
*In Vivo NMR Research Center, BEIP, National Institutes of Health, Bethesda, Maryland 210892, U .S .A.t Barrow Neurological Institute, 350 W . Thomas Road, Phoenix, Arizona 85013, U.S.A .
(Received 15 January 1991)
1 Correspondence regarding this manuscript should be seat to : Dr R. Turner, Building 10, Room BIDI25,National Institutes of Health, Bethesda, Maryland 20892, U.S.A .
93
CONTENTS
1. Introduction 941 .1 . Flow imaging in vim 941.2 . The concept of 'perfusion' 951 .3 . Classification of methods 96
2. MR Angiography 962.1 . Current technology 96
2 .1.1 . Classification of MR angiographic methods 962.1 .2. Display post-processing 96
2.2 Phase effects 97221 . Basic theory 97
2.2.1.1. Flow encoding bipolar gradient pulses 972 .2.1 .2 . Flow compensation by gradient moment nulling 97
2.22. Flow zeugmatography 982.2.3 . Phase contrast angiography 98
2.2.3 .1 . 3D phase contrast angiography 10022.3 .2 . Artifacts, advantages and disadvantages 1(10
2 .2.4. Velocity measurement (flow mapping) by phase imaging 1022.3 . Time-of-flight 102
2 .3.1 . Bolus tracking 1022 .3.2. Time-of-flight angiographie methods 104
23.2.1 . Tagging 1042 .3.22 . Suppression of stationary spins 1042.3.2.3 . Sources of artifacts 10523.24. Artifact reduction 10523.2.5 . Specific timeof--flight angidgraphic techniques 105
24. Echo-planar methods
`- 1103. Perfusion Measurements 11l
3.1 . Pseudo-diffusion methods 1113 .1 .1 . Theory ill3 .1.2. Multipulse spin-echo diffusion imaging 1123 .1 .3. Echo-planar single-shot diffusion imaging 115
3 .2 . Slow flow methods its3 .3 . Dynamic contrast agent studies of perfusion 12034 . NMR tracer methods 123
3 .4.1 . Auto-tracer methods 1233 .4.2 Tracers using other nadei 125
3 .4.2.1 . Fluorinated tracers 12534.2.2 . Deuterated tracers 1263 .4.2.3 . Oxygen-17 as a tracer 127
4. Summary and Conclusions 128Acknowledgements 128References 128
Proerne In NMR Spt,c!woroyri Val. 23, pp. 93-133, 1991 . 0079-6565,91 SOa0+ .50Primed in Gnat B,imln. Paasmuu P v plc

94
R. TURNER and P. KELLER
1. INTRODUCTION
1 .1 . Flow Imaging In Vivo
The sensitivity of the NMR signal to flow was noticed at a very early stage in the development ofNMR,t 1 and measurements of blood flow velocity in vivo12 preceded the invention of magneticresonance imaging by many years. Earlier reviewst 3- "cover the early history of this area, and it is onlytouched upon briefly here. Hahn"s'recognized the impact of motion along a gradient on the phase oftransverse magnetization . As early as 1959, pioneering experiments by Singer(') demonstratedphysiologic flow. Almost concurrently, with the advent of human NMR imaging, researchers began tofind MR] alternatives to conventional angiography .t9-11 ' Conventional angiography is performedinvasively which incurs risk;ts 2 i a catheter is introduced into a blood vessel and radio-opaque dye isinjected, followed by X-ray visualization .
Early workers in flow imaging by MR include Wedeen" 3-11) and others1 t 6''t' who demonstratedthe apparently straightforward method of subtraction of images created in systole and diastole . Theactual flow contrast mechanism is more subtle than might be anticipated; the fast flow of systole resultsin depbasing which leads to signal loss, while the slow flow of diastole results in less signal loss . This isan example of a phase difference method (see below) . Experimental difficulties lay in the instrumentalinstabilities of early systems. Moranl9 ' described the phase effects on transverse magnetization for flowalong a magnetic field gradient . Initially, these were exploited by examination of phase sensitiveimagesu s' rather than the conventional magnitude MR images (see Fig. 1). For stationary spins a slowphase roll across the image is observed . However, at the intersection of a blood vessel the phase is seento change, rapidly moving across the vessel . The phase change is directly proportional to the velocity ofthe blood. Other proposed methods to examine blood flow included labeling blood by adiabatic fastpassage,t 19' use of sinusoidal gradient waveforms ;zo , att and employment of B I rather than B ogradients. ("'
The flow of blood in the capillaries (microcirculation) is of great interest to the physician andphysiologist. The classic, `gold standard' technique, using a freely diffusible inert tracer123) does not
FIG. 1 . (Left) conventional sagittat image of human abdomen, (right) phase sensitive magnitude image. Note thatthe phase displays a fairly constant roll across the image except in the region of the aorta . Here the phase changes
rapidly due to blood flow . (Reproduced from Ref. 33 with permission .)

Angiography and perfusion measurements by NMR
95
provide information on regional variations of blood supply within an organ, and methods usingionizing radiation, such as positron emission tomography (PET),f341 single-photon emission-com-puted tomography (SPEGT% 135 ) and contrast radiograph computed tomographyla6> have been usedfor more than a decade to observe regional perfusion . These suffer from some problems of absolutequantification, and the resolution is limited by dosage and signal/noise considerations. However, agreat deal of useful research has been accomplished by these methods . The primary organs of interestare the heart and brain . Since there is an exquisite coupling between function, metabolism and localblood supply1271 in the brain, the major efforts using these techniques have focussed on that organ .
NMR methods for providing a qualitative or quantitative map of perfusion are of far more recentorigin than MR angiography. There are two reasons for this . The volume fraction occupied by blood isalways quite small, on the order of 5% in brain tissue, and thus unusually precise image quantificationis needed to see the contribution from spins in the microvasculature. Furthermore, MRI has been usedprimarily for delineation of anatomy : the long time generally needed to acquire images, and theinsensitivity of the normal imaging parameters of T„ T i and proton density to physiological changes,have deterred many researchers from investigating the possibilities of MRI as a tool to study biologicalprocesses. Thus the kinds of tests, involving active changes in, perfusion, which could unequivocallydemonstrate that perfusion is observed, have been difficult to perform . Only in the field of in vivoNMRspectroscopy has the time course study, on a time scale of hours rather than minutes, becomecommonplace.
In this article the main focus will be on methods devised using magnetic resonance imaging toevaluate blood flow and perfusion . We will review recent progress in NMR angiography, andsummarize the efforts being made to provide qualitative and quantitative maps of perfusive blood flow.The basic distinction between these regimes lies in the relative sizes of the vessels and the pixels ; inangiography generally the vessels of interest are several pixels wide, while the reverse is true forperfusion imaging . W e will briefly outline the medical and neurological implications of these studies,and indicate their difficulties, limitations and possible scope.
1 .2. The Concept of `Perfusion'
Since this term has attracted controversy, it deserves some elucidation . `Perfusion' strictly describesthe rate of delivery of nutrients to cells . It is defined as an intensive quantity, a normalized volumetricflow rate, typically with units of ml/100 emin. Within a homogeneous organ it is scale independent,and it is classically measured, as previously mentioned, by observing the input and washout of an inert,freely diffusible tracer, such as N .O . Simply stated, the rate of change of concentration of the tracer inthe organn is equal to the perfusion multiplied by the difference in arterial and venous concentrations . ifthe tissue: blood partition coefficient A in the organ is known, a simple experiment in which the arterialand venous concentrations are monitored until equilibrium is reached 133 > gives an accurate measure ofthe mean perfusion P of the entire volume of tissue supplied by the vessels monitored:
P=dc,/ J'(ca-e,)di .
(1)F,
Here ca and c, are the arterial and venous concentrations, respectively, and t is the time at whichequilibrium is achieved between blood and tissue {about 10 min) .
If the tissue concentration itselff can be monitored, for instance by the use of radioactive tracers, theperfusion may be measured directly . This forms the basis for quantitation of the SPECT method.
Non-diffusible tracers have also been used to provide estimates of perfusion, as will be discussed inmore detail below . Since by definition such tracers do not enter the cells, it is hard to make precisecomparisons with the Kety-Schmidt method . 1231 Depending on the capillary bed involved, varyingquantities of blood may simply be shunted through anaslomoses from the arterial to the venouscirculation, without passing through capillaries at all. Measurements of the passage of a non-diffusiblecontrast agent would erroneously confuse this flow with perfusion, though it should be pointed outthat in many tissues this component is very small ; water in blood is nearly 100% extracted as it passesthrough a capillary bed.

96
R TuRNga and P . Ker .LER
In a looser sense of the term, perfusion is often used by pathologists simply to denote the adequacy ofblood supply . Thus it can refer to the density of active capillaries or even the velocity of flow. Clearlythese parameters are closely related, through the equation of continuity, but it is presently a matter ofsome controversy whether the term should be restricted to the classical sense described above .
1 .3 . Classification of Methods
The NMR flow measurement methods in current use can be classified as (a) manipulation of signalfrom water protons, (b) use of contrast agents and (c) use of other NMR sensitive nuclei as t racers. MRangiography has used primarily the first of these, while perfusion measurements have employed allthree, with varying success .
2. MR ANGIOGRAPHY
The bulk of this section of the review will focus upon those NMR methods for examining bulk bloodflow and visualization of vessels which are currently under active clinical evaluation. There recentlyappeared an overview, albeit somewhat vendor specific, of principles and clinical applications of MRangiographic methods which would appeal to clinicians and technologists .t 251
2 .1. Current Technology
2 .1 .1 . Classification of MR Angiographic Methods. Methods either now in clinical use or under activeinvestigation all fall into two broad categories : (a) those utilizing phase effects, and (b) those whichmake use of time-of-flight phenomena . Each of these can be used simply to visualize vessels, or toquantitate blood flow within them. The categories can be further subdivided by acquisition modeswhich include : (a) 3D volumetric, (b) sequential 2D slice, (c) projected slab, and (d) a recentlyintroduced hybrid, sequential multiple 3D volumetric .
2 .1 .2. Display Post-Processing . MR angiographic techniques which yield image data of a volume raisethe question of methods for display. The most popular methodt29 3°) involves post-processing toproduce a set of back projections of the data (Fig . 2) . Once a set of these projections has beenproduced it can be displayed in a clue loop, giving the viewer the impression of vessels rotating inspace. Clearly, for each pixel in a projection image there is a corresponding line of pixels through thevolume image data . Thus one must choose a mathematical algorithm for assigning projection pixelintensity on the basis of the line of pixel intensities found in the original data. Although otheralgorithms have been mentioned,t 32'the method most frequently employed is to assign the projectionpixel the intensity of the maximum pixel intensity found along the line of original pixels. This is known
U
Fie. 2. The concept of projective ray tracing . Given image data of a volume, display problems become an issue. Forvisualisation of blood vessels, projection of the volume data onto a back plane is useful. Clearly, for each pixel of theprojection image there is a mathematical correspondence with a line of pixels through the original volume image
data . See text .

Angiography and perfusion measurements by NMR
97
as the maximum intensity projection (MIP) method . It is favored over summation methods whenflowing/stationary contrast is not great ; in this way the background signal is diminished . It is possiblehowever, for the MIP method to mask pathology or introduce artifactacast Numerous research groupsare currently investigating improvements or alternatives to the MIP atgoritbm .?as -4n
2.2 . Phase Effects
2.2,1 . Basic Theory. If the Bo field experienced by transverse magnetization changes during itsexistence (a function of T,), this will cause the precessional frequency to increase or decrease in accordto the Larmor relationship . Such change will occur when the spins giving rise to the transversemagnetization move along an axis defined by a magnetic field gradient!a •'' The change in phase (¢) isgiven by :
O= y J x(t) • G(t) dt
(2)
where x(t)is the position along the gradient axis as a function of time, and G(t) is the magnetic fieldgradient over time. Here the gyromagnetic ratio (y) is most easily expressed in units of Hz gauss- L orradian s - ' gauss - ' . The x(t) term may be expanded into a power series
x(t)- x 0 + or +21 at e + } jt 3. . . ,
(3)
where xo is initial position, v is velocity, a is acceleration, and j is the derivative of acceleration calledjerk or pulsatility .
It is useful to examine the result of eqn . (2) for some common gradient pulse shapes, at least for thestationary and constant velocity terms . The simplest case is a rectangular gradient pulse where
O=yG(xa T+2vTx);
(4)
T is the duration of the gradient pulse . An interesting and generally more applicable case is that of anirregular trapezoid.t42 The analysis is most easily accomplished breaking up the waveform into therising, constant and falling parts. The total phase advantage is simply the sum of the components .
rb a =yG(zx0 T.+2vT,Ts +1vTa)
(5)
O c =yG(xo Tc + vT, Tc + } vTc')
(6)
`rF -yG(2xOTF+JvT,TF+6D TF)_
(7)
Here Ts is the duration of the rising portion of the trapezoid; T, is the total elapsed time since thebeginning of gradient play on this axis ; Tc is the duration of the constant portion ofthe gradient, andT„ is the duration of the falling portion of the waveform . It is interesting to note that for the velocityterms the rising portion is not equivalent to the falling portion of the waveform .
2.2 .1 .1 . Flow encoding: bipolar gradient pulses. Let us consider the gradient play shown in Fig . 3(a).From eqn. (4) it is clear that the stationary terms will cancel but the velocity terms will not . The residualvelocity component will be
¢ = 7Gv {(T12)' - T=} .
(8)
Thus the resulting phase shift will be independent of initial position and directly proportional to thevelocity component along the gradient axis e9, 437 For the half sine bipolar pair shown in Fig . 3(b) thephase advance is given byc 44)
41= yvTL G 2/n.
(9)
2.2 .1 .2 . Flow compensation by gradient moment nuffing . Gradient moment nullingc' , 29, 45 ds' is agradient play which causes both stationary and flowing spins to have the same phase at echo time .Moment refers to the order of motion : i .e. the zero-th moment is stationary; the first moment isvelocity; and the second moment is acceleration, etc . Flowcompensation up to the maximumconsidered moment M, requires M+2 gradient lobes . If the gradient play shown in Fig . 4(a) is taken to

98
+O
-G
ti t M
14 T-4-1
!a
T
Pi
(a)
(b)Fto.3.(a) Two gradient pulses of equal duration and equal hut opposite amplitude are shown . There Isno net effton the phase of transverse magnetisation arising from stationary spins . However a phase advance is imparted forspins moving along the gradient axis This phase advance is a function of each non-zero moment during thegradient play . (b) A half sine (0 n, or a 2a) is a convenient gradient wave form often used for flow encoding (see
Section 2.2.1 .1).
TE
R . TURNER and P. KELLER
TE
><
(a)
(b)Fto.4. (a) This play of the read axis or m gradient echo imaging pulse sequence yields zero phase for both stationaryand constant velocity spins at time TE . (h) This play of the read axis of a gradient echo imaging pulse sequence yieldszero phase at time TE for stationary, uniformly moving, and constant acceleration components of flow along this
axis.
be the frequency encoding gradient for a gradient-echo pulse sequence, it would be compensated forthe zero-th and first moments .
The gradient play in Fig . 4(b) is compensated through the second moment . An intellectually pleasingbut not necessarily pragmatic solution t 47 t is the use of the required number of gradient lobes, all ofequal spacing and duration . Then the relative gradient amplitudes are given by the binomial expansioncoefficients of (x -y) " . The general solution is found by holding all but M+1 of the variables(gradient timing and amplitudes) constant, and then solving M + I simultaneous equations for theunknown variables!"'
2.2.2. Flow Zeugmatography . The theory of flow zeugmatography, also known as Fourier flowmeasurement, was first developed by Morant 9l as a six-dimensional Fourier transform experimentcomprised of three spatial axes and three velocity axes . The addition of a time axis, as cardiac phasewould then give seven-dimensional data. Feinberg and co-workerstso' using a modified spin-echosequence demonstrated a 2D version of the concept with one velocity axis and one spatial axis.Velocity rather than position was phase encodedd through the use of bipolar flow encoding gradientswhich were stepped in amplitude (Fig . 5). Others later utilized gradient echoes with"' -'' ) andwithout"" nulling of moments greater than zero . These were implemented using a 3D acquisitionyielding a set of 2D images corresponding to different velocities . Alternatively, an ECG gated 2D (onespatial and one velocity) acquisition was performed in a time-resolved mode . With all phase-basedmethods, including the angiographic and flow mapping techniques described below, a limitationrepresents the need for some degree of foreknowledge concerning the velocities that will beencountered . Without this awareness aliasing may occur .
2 .2.3 . Phase Contrast Angiography. Much of the development in this area was conducted byDumoulin and coworkers .'I The basic pulse sequence is shown in Fig . 6 . It is a standard 2Dspin-warp gradient-echo imaging sequence with the addition of two flow-encoding lobes which may beapplied on any one of the three orthogonal gradient axes . A minimum of two excitations per phase-

rr
Slice
fselectgradient
Velocityencodegradient (stepped)
Readgradient
Signal
Z2
Angiography and perfusion measurements by NMR
99
time
4\Arv-Spinecho
Fla. S. Velocity density imaging sequence . The slice selection performed by the 180' pulse is orthogonal to that ofthe 90° pulse, thus defining a column of tissue in which the velocity density can be mapped as a 2D plot, where thehorizontal axis gives spatial location, the vertical axis corresponds to velocity, and the intensity corresponds tovelocity density. The hatched velocity-encoding gradients are incremented by a constant amount for each shot, andthe resulting data are Fourier transformed with respect to the gradient to give the velocity density profile. (Diagram
courtesy of Dr D. A Feinberg, Brigham and Womens Hospital, Boston)
RF
G Blab J
1G phase
G read
G flow
Receiver
Fla . 6. A pulse sequence timing diagram for basic Dumoulin style phase contrast angiography. Gs,,,. isincorporated into the gradient play along one of the three principal axes at a time.
encoding step are employed; the polarity of the flow encoding lobes are reversed from one excitation tothe next, and the resulting signals are subtracted from one another . Since the flow encoding gradientshave no net effect on the phase of transverse magnetization arising from stationary spins, their signalscancel from one excitation to the next. For flowing spins however, the flow encoding gradients impart a

100
R. TuxrrnR and P. KELLER
phase advance 40 # zero on the first excitation and -4, on the second excitation . Clearly the largestsignal will remain after subtraction of the two excitations when . 4i=ar/2 radian. If 4.=n, then thesubtraction results in no signal . The signal intensity is then proportional to sin ¢ . From eqn. (10) it isseen that signal intensity willl also vary sinusoidally with increasing velocity .
In its original implementation (" ) the pulse sequence was cardiac gated, exciting the entire imagingvolume (or a thick slab) producing projection images. Two scans were done encoding the twodimensions of flow orthogonal to the projection axis; the modulus of the resulting two images gavethe final projection angiogram, Subtraction errors, largely due to instrumental instabilities, yieldedsignificant residual signal from stationary spins . Further suppression was achieved by a projectiondephasing gradient pulse. This weak gradient along the projection axis yielded a slow phasetwistacross the projection leading to partial phase cancellation of stationary spins . This gradient pulse isweak enough that the phase dispersion across a vessel is minimal, thus retaining the signal fromflowing spins. However, there is the risk of artifactual signal loss due to phase cancellation where twovessels cross in the projection .
Later versions include the use, of pseudo-gating,' 44 flow quantitation,° 6I time-resolved studies17and the use of multiple echoes .°s,i,Pseudo-gating is a method which yields average velocityinformation . The basic approach involves using a short TR (approx . 50 ms) and the number ofexcitations per phase encoding step that fitt into one R-R interval of the patient's heartbeat Thisimproves SNR and avoids the difficulties associated with obtaining a good ECG signal . Obviously,this approach is suboptimal in arrhythmic patients . Time-resolved or cite, studies are performed byagain using a short TR and incrementing the phase-encoding gradient upon detection of an ECGR-wave . The data are sorted into their respective cardiac phases, producing a set of angiographicimages in which each image corresponds to a different cardiac phase. The set of images may bedisplayed in rapid succession in a tine loop to give the viewer ant impression of blood flow over thecardiac cycle .
Numerous workerss have explored a different type of phase contrast method best described as "flowcompensation on minus flow compensation off" . Axel and Morton°9~ subtracted nongated spin-echoimages with and without first moment compensation . A similar approach was recently demonstratedby Xaing and Nalciogluj60 ' Gradient-echo sequences have been employed using both first- andsecond-moment compensation in both 211- and 3D-acquisition modes ." ) Improvements on the basicmethod include phase correction algorithms applied to complex data before subtraction,'"' and fast(8 9/slice) acquisition techniques .!" Time shifting of a gradient lobe to unbalance the first moment hasalso been employed."'
2.2 .3 .1 . 3D phase contrast angiography . Many of the pitfalls of the phase-contrast angiographicmethods (see below) are avoided through the use of a 3D (volumetric) acquisition,' 301 but the scantimes and data handling requirements are high, Here three 3D acquisitions at two excitations (for flowencoding) per phase encoding step are required . The three acquisitions are for flow encoding on thethree orthogonal spatial axes. The three-way modulus of the data sets gives a fourth data set whichshows the total flow. This new data set is then submitted for projection ray tracing . Figure 7 shows anexample of this method . Reports of clinical experience with this angiographic method have begun toappear in the literature) 6 s -s , t
Very recently two groups independently reported'bs, 691 a method to decrease the scan time for 3D-phase contrast angiography by 33% . If one considers that there are essentially six excitations orexperiments per phase encoding step, flow encoding on the three axes, it becomes evident that it ispossible to combine some of these excitations . The most straightforward" ) is a four-excitation (step)method, in which one reference measurement is made followed by one measurement on each of thethree orthogonal axes. Consider that there are two experiments for each axis : (A) up, down, and(B) down, up . Higher SNR is obtainable'") by using linear combinations of the four excitations shownin Table 1 which then give the flow along each of the orthogonal axes .
2.2 .3.2 . Artifacts, advantages and disadvantages . Phase contrast angiography is quite sensitive toinstrumental imperfections such as poor eddy current compensation. However, if these difficulties are

Angiography and perfusion measurements by NMR
101
Fto. 7 . An example of an intracranial 3D phase contrast angiogam ; icasinternal carotid artery, mca-middlecerebral artery, aca=anterior cerebral artery, pca-posterior cemhral artery .
Flow X=(#I+#3)-(#2+#4)Flow Y=(# l + #4)-(#2+ #3)Flow Z=(#I+ 102)-(#3+#4)
overcome this technique possesses appealing properties . The contrast is dependent only upon flow,unlike many time-of-flight methods discussed below, and sensitivity to slow flow may be increasedeasily by the use of larger flow-sensitising gradients . Another advantage over time-of-flight is that thefield of view can be set to cover a very large vascular territory .
Tan 1.
Gradient X Y 7
Experiment
#I A A A#2 a B A#3 A B B#4 B A B

102 R. TURNER and P. KELLER
The principal disadvantage, beyond scan time considerations which may be severe, is therequirement for foreknowledge of the velocities that will be encountered, so that the optimalamplitude/duration, ofthe flow encoding gradients can beset.
For the projective acquisitions there is the aforementioned phase cancellation problem where vesselscross, but this is not a . problem with 3D-phase contrast angiography . Additional mechanisms forartifactual signal'l loss atee the same as time-of-flight methods discussed below .
2.2.4 . Velocity Measurement (Flow Mapping) by Phase Imaging. Employing the same phase contrastprinciples as above but retaining the phase information after reconstruction can yield images fromwhich velocities may be measured directly . Morant 70' and Bryantf 71t subtracted phase images fromECG gated spin-echo images obtained with and without flow encoding : Naylor'- "' incorporatedflow encoding into a gradient-ecbo scheme and produced sets of phase images depicting velocityvariation as a function of cardiac phase . More recently, otherst7q • "„ have employed a view-to-viewinterleaved subtraction of data acquired with and without first-moment compensation . This may beaccomplished in an ungated mode to obtain average flow velocities,l `i or with, ECG monitoring andsorting of data with respect to cardiac phase .
An example of the hut method is shown in Fig . 8 . The data are then Fourier transformed in the usualmanner and a phase map is-constructed, i .e . pixel intensities in the image vary as a function of phaserather than magnitude . Zero phase is mapped to zero pixel intensity; increasingly positive phases areassigned increasingly positive pixel intensities, and negative phases (or greater than n positive phases)are given negative pixel intensities. Positive or negative pixel intensities correspond to the direction ofthe component of Prow. along the How encoding axis . The pixel intensities are a direct measure ofvelocity, permitting one to read velocities directly from the image. It is alsoo possible to acquire thesedata using a short TR and sorting it as a function of phase of the cardiac cycle . The technique has beendubbed "VIGRE" (velocity-encoded gradient echoes) .
As in phase based methods, it is necessary to have foreknowledge of the velocities to be encounteredin order to properly set the amplitude of the flow encoding gradients. If higher velocities than expectedare present, then a phase advance of magnitude greater than p is imparted to the transversemagnetization . Thus a positive phase advance 'appears as a negative one and vice versa, causing awarp-around or aliasing artifact manifested as apparent flow in the opposite direction.
2.3. Time-of-Flight
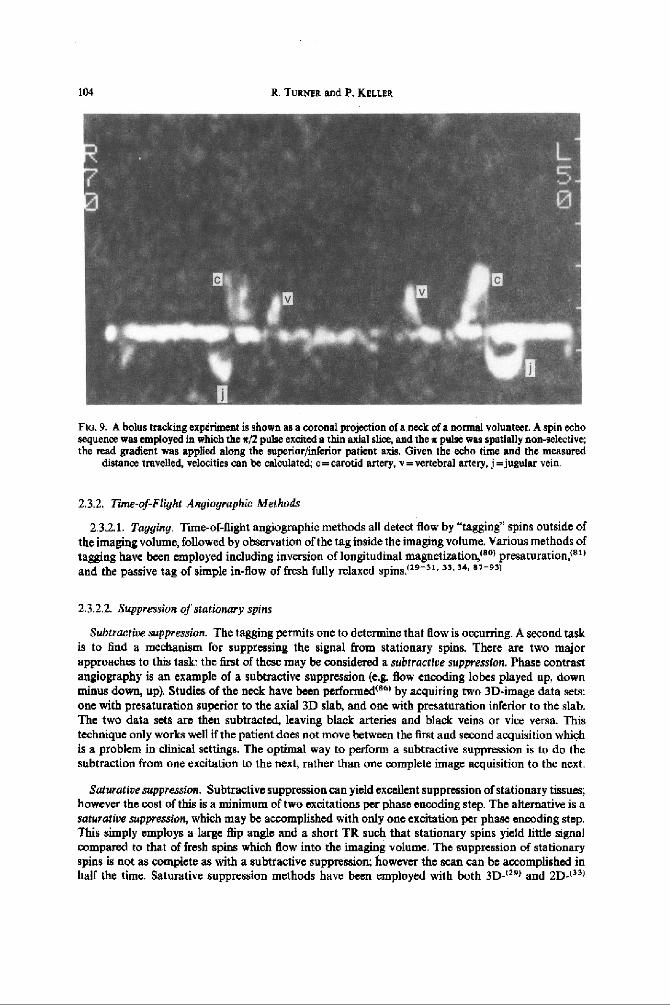
2.3.1 . Bolus Tracking . Bolus tracking refers to the generation of transverse magnetization or inversionof longitudinal magnetization at one position followed by observation of the position of this non-equilibrium magnetization at a later time . Methods have employed spin echnes,t76 ~ gradientechoes, ("-79/ and stimulated echoes.180- s" Many methods rely upon excitation of a slice perpendicu-lar to the flow direction and then imaging in aplane perpendicular to the excitation slice . An example isshown in Fig. 9 . 132)
Japanese workers", 78) utilized gradient-echo sequences in which the slice audd read gradient axeswere coincident. High signal is noted, which is displaced from the position of the slice . With thismethod motion is monitored only over the period TE, during which rapid Tz decay is occurring Ifhigher sensitivity to low velocities is required, TE must be increased, thus exacerbating the decayproblem. This is overcome to a degree through the use of analogous sequences involving spinechoesPO
Another way to circumvent this problem is to utilize T, information, since T, T, in biologicalsystems. A clever way to accomplish this is through the use of stimulated echoes!"- 80) Briefly, astimulated echo is generated from a sequence of three z/2 pulses with a delay of T r between the first andsecond pulse and a delay r2 between the second and third pulses . The first pulse generates transversemagnetization which is "stored" longitudinally by the action of the second pulse . During this time (T2 )the stored magnetization is insensitive to the action of magnetic field gradients and decays as a functionof T, . The third pulse returns the stored magnetization to the transvers plane yielding an echo at a timeequal to r, after the third pulse .

Angiography and perfusiop measurements by NMR
103
tao
a iprdlaoPWaa
(b)Fto.8.(a) One of ant ofl6axialVIGREphaseimages,eachofwhichcorrespondstodiferentpointsinthecardiaccycle. Flow inferior to superior is increasingly black with increasing velocity; ec=common carotid artery,v=vertebral artery. (b) Velocities may be measured directly from the pixel intensities in the VIGRE images . These
velocities are graphed here against the phase of the cardiac cycle .
Merboldt and co-workers (so( utilized a nonselective second pulse and spatially selective first andthird pulses. Different slices could be excited by the two selective pulses to detect flow . Morerecently"( schemes with a spatially selective first pulse followed by two nonselective pulses have beenemployed in conjunction with imaging perpendicular to the slice plane .
Another way to take advantage of T, is through the use of inversion pulses . Wehrli('a" used thedifference images from acquisitions with spatially selective or nonselective inversion pulses . Thisproduced flow images in a plane perpendicular to theflow.Others ( ' s t utilized multiple inversion boll toobtain velocity information . Hennigj 09( demonstrated the straightforward method of presaturationand dephasing of a slice and by allowing a delay for inflow before routine gradient .eeho imaging of the
slice.
(a)
104 R. TURNER and P. KELLER
a
Flu . 9 . A bolus tracking experiment is shown as a coronal projection of a neck of a normal volunteer. A spin echosequence was employed in which the x/2 pulse excited a thin axial slice, and the x pulse was spatially non-selective;the read gradient was applied along the superior/inferior patient axis. Given the echo time and the measured
distance travelled, velocities can be calculated ; c = carotid artery, v=vertebral artery, j=jugular vein .
2.3 .2 . Tune-of-Flight Angiographic Methods
2.3 .2 .1 . Tagging . Time-or-flight angiographic methods all detect flow by "tagging" spins outside ofthe imaging volume, followed by observation of the tag inside the imaging volume . Various methods oftagging have been employed including inversion of longitudinal magnetixation,tsol presaturation,ls`tand the passive tag of simple in-flow of fresh fully relaxed spins . 29-3t . 33 .34. a7-s3t
2.3.2 .2. Suppression of stationary spins
Subtractive suppression . The tagging permits one to determine that flow is occurring . A second taskis to find a mechanism for suppressing the signal from stationary spins . There are two majorapproaches to this task: the first of these may be considered a subtractive suppression. Phase contrastangiography is an example of a subtractive suppression (e,g. flow encoding lobes played up, downminus down, up). Studies of the neck have been performedtB 6) by acquiring two 3D-image data sets :one with presaturation superior to the axial 3D slab, and one with presaturation inferior to the slab .The two data sets are then subtracted, leaving black arteries and black veins or vice versa. Thistechnique only works well if the patient does not move between the first and second acquisition whichis a problem in clinical settings . The optimal way to perform a subtractive suppression is to do thesubtraction from one excitation to the next, rather than one complete image acquisition to the next .
Saturative suppression. Subtractive suppression can yield excellent suppression of stationary tissues ;however the cost of this is a minimum oftwo excitations per phase encoding step. The alternative is asaturative suppression, which may be accomplished with only one excitation per phase encoding step .This simply employs a large flip angle and a short TR such that stationary spins yield little signalcompared to that of fresh spins which flow into the imaging volume . The suppression of stationaryspins is not as complete as with a subtractive suppression ; however the scan can be accomplished inhalf the time . Saturative suppression methods have been employed with both 3D - 1"I and 2D-j 33 j

Aagoography and perfusion measurements by NMR
105
acquisition modes . The choice of TR is a compromise with Saturative suppression . The stationary spinsignal is better suppressed using a short TR, while in-flow is greater using a longer TR. Saturativesuppression is most effective at shorter TR values when the steady state is spoiled either by the action ofstepped gradients(", "1 or by RF-phase manipulation l 1 s>
Saturative suppression is synonymous with heavy T I weighting. Thus there is the potential for shortTI structures such as thrombus to appear bright in angiograms, mimicking flow.
2 .3 .23 . Sources ofarr facts. Signal loss forfiowing spins is often observed when the residence time ofthese spins in the imaging region is long enough that they experience multiple RF pulses and becomeprogressively saturated . This is especially a problem for low velocities such as those encountered inveins and certain types of pathologies .
Signal drop out is also observed due to intra-voxel phase cancellation, from two major sources :uncompensated orders of motion, and natural gradients found at magnetic susceptibility interfaces .The degree of phase dispersion across a voxel due to differences in motion across a voxel can best beseen from the solution to eqn . (1) with the substitution given in eqn . (2) for a constant gradient G ofduration T:
i=yG(x„T+ iv Te +}a T 3 + 131 T4 . . .) .
(10)
From eqn . (10) it can be seen that the undesired phase effects of a rapid movement scale linearly withgradient amplitude, but exponentially with the duration of the gradient .
2.32 .4. Artifact reduction . The conclusions ofegn. (10) imply that echo times should be kept as shortas possible by employing maximum gradient amplitudes . Schmalbrock and coworkers have pub-lishedcasl strategies for minimizing the echo times for 3D-time-of-flight MR angiography. Thesetechniques include the use of truncated sin RF pulses, acquisition of asymmetric echoes in conjunctionwith a "homodyne" reconstruction,90' 9't and combining flow compensation and slice phase encodinggradients . Another way to decrease the dispersion across a voxel is to make the voxels smaller, this ishelpful regardless of the source of the phase dispersion . However, the goals of short TE values and highspatial resolution in some respects are mutually exclusive : the higher the resolution, the greaterintegrated gradient amplitudes need to be . Other methods for artifact reduction are discussed below inconjunction with specific pulse sequences .
2.3 .2.5. Specific time-of-flight angiographic techniques
3D (valurnetric) acquisition. This is the manner in which MR angiogruphy was first introducedclinicallyls, 30, 31 . 9z-96) Its major advantage over other techniques is access to short TE times andthin slices leading to small voxel sizes. This makes it ideally suited to situations where fast, pulsatileflow will be encountered. This method has been suens .tully applied for intracerebral arteriography,and for examination of carotid arteries . An example is shown in Fig . 10. The principal limitation of 3Dacquisition is the limited coverage of the territory of the vasculature . Generally an axial excitation slabis chosen for intracranial work, and it is found that by the time the flowing spins reach the distal edge ofan approximately 4 cm thick slab that they have already become saturated enough to lose significantflowing/stationary contrast . For these reasons intracerebral veins, with the exception of large duralsinuses, are not visualized, unless chelated gadolinium IV contrast media is administered to shorten theTI of blood f9s, 9n1
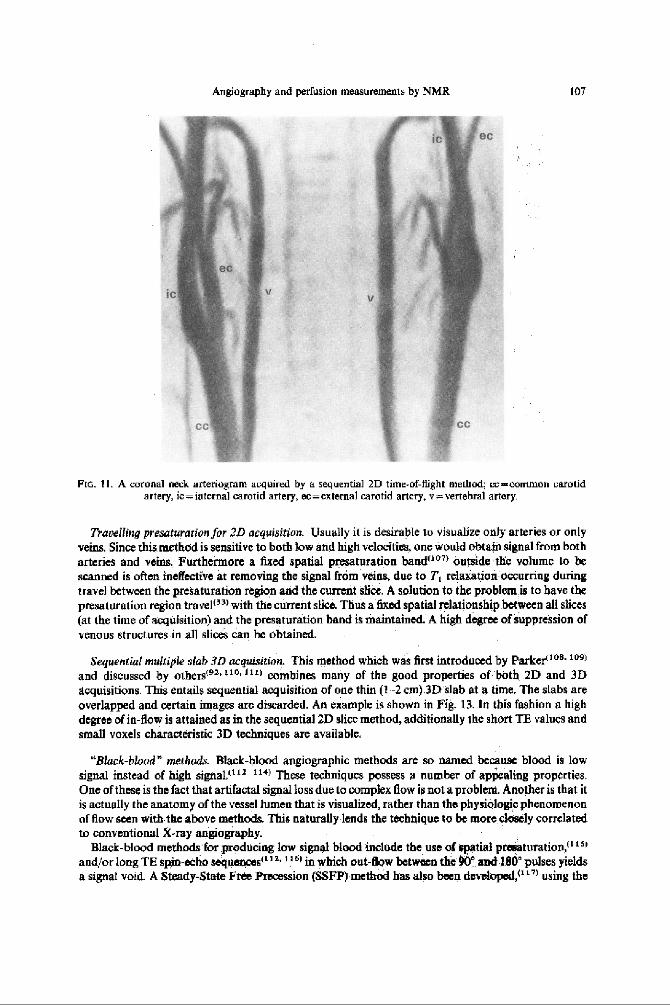
2D (sequential slice) acquisition . This approachj33 . 97-'"Ft is especially robust under conditions ofslow flow such as is found in veins or proximal to arterial stenoses. Here a volume of image data isacquired by sequentially gathering image data from one thin (1.5 3 mm) slice at a time. The acquisitionplane is chosen such as to maximize through plane flow . Clearly, significant in-plane flow will lead tosaturation and loss of contrast . However, the thinner the slices are, the less the probability it is for asignificant territory of the vessel to lie in a slice . This method has been successfully applied forarteriography and venography in the brain, neck and peripherally . An example is given in Fig. I I . The
JPNMai 23 :1-a

106
R. TURNER and F. KELLER
Fic.10. A superior,/inferior maximum pixel projection through an axial 3D time-of-flight angiogram of the brain .
principal limitations are scan time considerations for covering large peripheral territories, andartifactual signal lass due to uncompensated orders of motion . The sequential slice method is moreprone to these signal losses than the 3D methods because stronger and/or longer gradient pulses arerequired for 2D, which necessitates increasing TE. Furthermore, the minimum voxel size is largerfor 2D.
It is elucidative to compare 2D- versus 3D-time-of-flight MR angiographic examinations of thebrain of the same patient {Fig. 12) . The patient is a 70-year-old male who suffered an acute bleed of anarteriovenous malformation (AVM) . The 3D examination highlights the arterial supply of the AVM,which is useful clinical information. However, the high signal from the thrombus obscures the nidus(central portion) of the AVM ; this and slow flow also lead to nonvisualization of the venous drainage ofthe AVM. In the ZD examination the contrast between the stationary thrombus and flow is muchhigher because each slice is an entry slice. The nidus, arterial supply and draining veins are seen . Theproblem here is that so many vessels are seen that without rigorous disection of sub-volumes of thedata set, feeding arteries are difficult or impossible to identify .
A fast line scan version of the general 2D concept was discussed by Frahm .t 101 ' Other workers havesuggested modifications : Turbo flash acquisitions, 7021 fat presaturation and use of Tz effects fordecreased background signal ."" 10at
Recently, a two-slice interleave version of this technique was introduced . 1051 One point was thechoice of which slices would form the interleaved pair such that in-flow is not compromised .Additionally, the positioning of the travelling presentation (vtda infra) to obtain effective venouspresaturation in both slices was essential .
Angiography and perfusion measurements by NMR
107
FIG . 11 . A coronal neck arteriogram acquired by a sequential 2D time-of-flight method ;u:-common carotidartery, ic=internal carotid artery, ec=external carotid artery . v=vertebral artery.
Travelling presaturation for 2D acquisition . Usually it is desirable to visualize only arteries or onlyveins . Since this method is sensitive to both low and high velocities, one would obtain signal from botharteries and veins. Furthermore a fixed spatial presaturation bandf 1" outside the volume to bescanned is often ineffective at removing the signal from veins, due to T, relaxation occurring duringtravel between the presaturation region and the current slice . A solution to the problem is to have thepresaturation region travel(3a) with the current slice . Thus a fixed spatial relationship between all slices(at the time of acquisition) and the presaturation band is maintained . A high degree
of,uppression of
venous structures in all slices can be obtained.
Sequential multiple slab 3D acquisition . This method which was first introduced by Parkertland discussed by otbersts 2, uo , url combines many of the good properties of both 2D and 3Dacquisitions . This entails sequential acquisition of one thin (1--2 cm).3D"slab at a time. The slabs areoverlapped and certain images are discarded . An example is shown in Fig . 13. In this fashion a highdegree of in-flow is attained as in the sequential 2D slice method, additionally the short TE values andsmall voxels characteristic 3D techniques are available .
"Black-blood" methods. Black-blood angiographic methods are so named because blood is lowsignal instead of high signal, '2 114) These techniques possess a number of appealing properties.One of these is the fact that artifactal signal loss due to complex flow is not a problem. Another is that itis actually the anatomy of the vessel lumen that is visualized, rather than the physiologic phenomenonof flow seen withh the above methods . This naturally lends the technique to be more closely correlatedto conventional X-ray angiegiaphy.
Black-blood methods for producing low signal blood include the use of spatial presaturation, t 15,
andlor long TE spin-echo sequences(. t in which out-flow between the 90° and 1.80' pulses yieldsa signal void. A Steady-State Free Precession (SSFP) method has also been developed,(. ) using the

109 R. TURNER and P

(c)
.(d)
Fta.
12. (a)
and
(b)
Conv
enti
onal
axi
al T
, we
ight
ed MR images of the hrain of a 70 year old male patient showing an arteriovenous malformation (AVM) (solid
arrows) and
haem
orrh
age
(hol
low
arro
ws).
(c)
3D
time
-of-
figh
t an
giog
ram
of t
he A
VM p
atie
nt. Solid arrows show the feeding arteries, while hollow arrows point to haemorrhage
. (d
) A
sequential 2D time-of-flight angiogr
am o
f th
e AV
M pa
tien
t.
Soli
d ar
rows
sho
w th
e ni
dus
of t
he A
VM; hollow arrows show the haemorrhage
.
2

I to
R . TURNER and P. KEL M
Do. 13. A multi thin slab angiogram of a normal brain . Four overlapping 2 cm thick slabs were sequentiallyacquired. The voxei size is 0.2 mm 3.
unique sensitivity of this sequence to flow dephasing. The greatest hindrancee to more widespreadimplementation of these techniques is that flowing blood is not the only substance that is black on theMR images, renderingg projection ray tracing methods unusable . Additionally, a vessel such as acarotid artery will disappearr when itt passes along the cavernous sinus. For distinguishing betweenblack vessel and black non-vessel it has been proposedt4 lt to place a "seed" within the . image of thevessel, followed by edge detectio&metbods to trace the length of the vessel and its branches .
2.4 . Echo-Planar Methods
Echo planar imaging methodst"for imaging macroscopic bloodd flow have just begun to appear.Echo planar imaging is a gradient-echo technique for sampling all of k-space using a single excitation .Spin-echo hybrids have also been described ." "t Firmin and coworkers reportedt"o> a hybrid echo-planar flow velocity mapping method based on the technique of Naylor.t" 1 Koset"' 1 presentedvelocity mapping using a two-echo, spin-echo-echo planar hybrid . Due to even echo rephasing ofconstant velocity flow the phase difference between image data from the first and second echo is ameasure of velocity .
We now turn to the second major area in which NMR techniques appear to be making significantcontributions in evaluating blood flow : perfusion.

Angiography and perfusion measurements by NMR
ill
3. PERFUSION MEASUREMENTS
3.1, Pseudo-Diffusion Methods
3 .1 .1 . Theory. It was pointed out by Le Bihan'" 2 ' and later by Turner1X23 ' that the slow, random,isotropic movement of blood, as it behaves in many capillary beds such as brain grey matter, could beviewed as a pseudo-diffusive process . Just as with classical diffusion, 141 when a magnetic fieldgradient is applied, defocussing the spins, and then the spins are refocussed using a second gradientpulse, this Intra-Voxel Incoherent Motion (IVIM) results in a net loss of phase coherence of the spinsflowing along a capillary within a voxel . During the refocussing lobe of the gradient, the spins arefound at a different position in space, and so the phase evolution of each spin is not exactly reversed .Given the large number of capillaries within a typical voxel, of perhaps 2 mm x 2mm x 5mmproportions, there is thus a destructive interference within the voxel, and a resultant signal attenuation .
The total proton signal obtained from a voxel is the sum of those from protons in several tissuecompartments . The major compartments are the cytoplasm, the extracellular fluid, and the blood incapillaries (assuming that a major vessel does not cross the voxel) . In the brain, owing to the tightendothelial cells, exchange between tissue and blood is comparatively slow, 1s' while exchangebetween the intra- and extra-cellular compartments is quite fast, on the time-scale of the diffusionimaging experiment. As a result it is reasonable to consider a model with only two compartments ;the tissue, which can be characterized by a single diffusion coefficient (possibly an anisotropictensor)(L'6' 127) and the moving blood, occupying a volume fraction f In general each compartmentwill have a different transverse relaxation time T3, so that we may write the relative signal attenuationSIS. i n the form""'
S/S,=(1-f) exp(-hD,) exp (TE/T2r) + f exp(-hD p) exp (TE/T=p)
(11)
where the subscripts s and p apply to the non-flowing and flowing water molecules respectively, andTE is the echo time, around which the NMR signal is acquired . The factor b characterizes the strengthand duration of the diffusion gradients which are applied, and is defined as
b = frs
I k(t) 1 2 dt,
(12)0
with
k (t) = y G(t) de,
(13)
where G (t) describes the time course of all the . gradients which are applied whilee the nuclearmagnetization lies in the transverse plane. The sign of G (t) is reversed for t> TE/2 in a spin echosequence .
The pseudo-diffusion coefficient denoted D, deserves some discussion . By analogy with truediffusion, it may be considered to arise from molecular motion, in which the molecules travel with themean capillary blood velocity u, and are `scattered' after travelling a mean distance I (Fig. 14) whenthey reach a corner in the capillary. We may then write
DP = c 1/6.
(14)
This implies that if the structure of the capillary bed is sufficiently well known that an estimate of I mayhe made, the coefficient D P provides a measure of the mean blood flow velocity .
A simple model of the capillary bed in which the capillaries are regarded as functioning in parallelgives an elegant relationship between the perfusion, the pseudo-diffusion coefficient, the capillaryvolume fraction, and two length parameters characterizing capillary geometry . If the mean capillarycross-sectional area is a, the mean capillary length between arteriole and venule is I, and the number ofcapillaries is N, then the total capillary volume V V is given by
VV =NaI, .
(15)

112 R. TURNER and P. KELt ER
Fro. 14. Sketch of a portion of a capillary bed, showing characteristic length 1 .
If the total tissue volume is V, the capillary volume fraction fis given by
f=V,/V
(16)
The perfusion, P, being a normalized volumetric flow rate, can be written, for N capillaries in parallel
P=Nav/(p V),
(17)
where p is the tissue density . Combining eqns (15, 16 and 17), we have
P-fvl(p Id .
(18)
Substituting for the capillary blood velocity v from eqn . (14), we have our desired relation betweenthe IVIM parameters f and Do , and the classical perfusion P :
P=6JD 0 /(p 1, 1).
(19)
Thus the mean length of a capillary, and the mean distance between bends, are the only tissue-specific terms which enter this relationship . Typically" 29) in cat brain grey matter I^'100um, andI,a2 mm, giving, when D p is estimated from eqn . (14), P 50 ml/ IOOg/min, of the correct order ofmagnitude .
For a typical valuet 1261 of v (1 mm s -1 ), the pseudo-diffusion coefficient D„ comes to 15X 10-1 mm2 s-1 , about five times larger than that expected for pure water at body temperature, andabout fifteen times larger than that of brain tissue . Thus eqn. (11) represents a bi-exponential decay,with exponents different enough to be distinguishable . If sufficient accuracy is available, and enoughdifferent values of I,, giving separate points on the curve, are taken, a non-linear least squares fitalgorithm may he used to extract the four parameters D,, D p, (1-J') exp (TE/T2i ), and fexp (TE/T2rj . Ifthe not wildly unrealistic assumption is made"' that in tissue the relaxation times T 2s and TIp areequal, we are left with three parameters: D„ Dp , and f.
A careful Monte Carlo study of model data has recently been madet 130 j of the signal/noise requiredto give acceptable accuracy for these parameters . If the perfusion fraction is 5%, the S/N required togive an accuracy of 20% for fis close to 400. Thus, in practice, for successful quantitation of theperfusion fraction f, given typical image signal/noise ratios, several images must be averaged, andregions of interest larger than one pixel must be analyzed. The pseudo-diffusion coefficient Dv requiresa still higher S/N for accurate evaluation . However, to provide an accuracy of 20% for D,, S/N may beas low as 40 . When the perfusion fraction f is larger, these SIN requirements become less stringent .
3 .1 .2. MultipuiseSpin-Echo Dfusion Imaging . Atypical pulse sequence for diffusion imaging is shownin Fig . 15 . This shows the customary pair of Stejskal-Tanners' 23) gradient pulses, which sensitize the

Signal
Angiography and perfusion measurements by NMR
113
Spin echo
Fte . 15. Spin-echo diffusion imaging sequence, with Ste3akal-Tanner diffusion gradients (shown hatched),
sequence to the motion of molecules participating in diffusion and perfusion . When gradients are usedwhich are large and long enough to give an easily-measured signal attenuation as a result of diffusion,the signal is unfortunately also very sensitive to motion of any kind . All imaging sequences usingmultiple rf pulses arc affected by this problem . A widely distributed diffuse artifact in the phase-encodedirection is frequently encountered . Involuntary motion of the head gives the worst artifact, but evenCSF pulsation give a distributed artifact which can invalidate measurements of the diffusioncoefficient, and completely prevent evaluation of the perfusion factor fl'a't
Apart from gating data acquisition in phase with the cardiac cycle, which at least nullifies the effectof cardiac-related pulsations, there have been three serious attempts at solving this problem . The first isto use an effective method for immobilizing the subject's head ~ 192 j which has been found to be usefulwhen abnormal tissue with an altered diffusion coefficient is located far from the ventricles containingCSF. The second is to use a one-dimensional image, a slice-selected strip across the brain, withdiffusion gradient pulses applied as in Fig . 15, but using the data from only a single shot, with a readgradient applied to obtain a profile of the selected slice! 13 j This has given reproducible results for theparameters D,, D, and f, and the magnitudes are reasonable .
However, the ideal technique for avoiding motion artifacts in magnetic resonance imaging isundoubtedly echo-planar imaging" a"' This has been successfully used for cardiac imaging (1551 since1983, and has now been implemented on commercial imaging equipmen0127) for brain studies . Sincethe total acquisition time is 25-100 ms, no motion artifacts can be seen on the images obtained, evenwith diffusion gradients as largess 3.8 mT m -' . A further advantage is that many images with differentdiffusion weighting may be acquired in a short time (e .g. 16 within a minute), in contrast withconventional imaging methods, and thus the entire dependence of image intensity on the gradientfactor b may be easily explored .
Now we shall discuss the results of the techniques just described In early work" 32, 160 Le Bihanet al. used a simple spin-echo 2DFT imaging sequence, with Stejskal-Tanner diffusion gradients . Theyperformed trial experiments using a phantom consisting of a Sephadex gel-filled syringe, throughwhich water could be perfused at very slow flow rates compatible with those found in tissue . When theflow was switched on, their data could be fitted with a biexponential variation, and a reasonable value
114
ae
M
0.2
R. TuarsnR and P . KILLER
(b - b,) (s/mm')
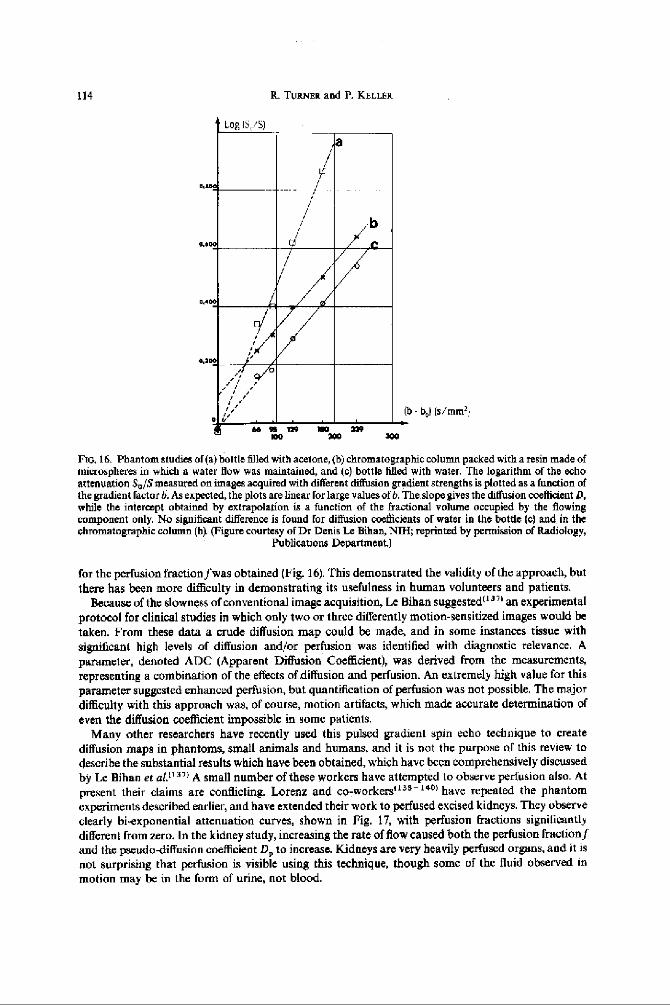
D0,16- Phantom studies of(a)bottle filled with acetone, (b) chromatographic column packed with a resin made ofmicrospheres in which a water flow was maintained, and to) bottle filled with water . The logarithm of the echoattenuation S a /S measured on images acquired with different diffusion gradient strengths is plotted as a function ofthe gradient factor b. As expected, the plots are linear for large values of b . The slope gives the diffusion coefficient D,while the intercept obtained by extrapolation is a function of the fractional volume occupied by the flowingcomponent only. No significant difference is found for diffusion coefficients of water in the bottle (c) and in thechromatographic column (h) . (Figure courtesy of Dr Denis Le Bihan, NIH ; reprinted by permission of Radiology,
Publications Department.)
for the perfusion fraction fwas obtained (Fig . 16). This demonstrated the validity of the approach, butthere has been more difficulty in demonstrating its usefulness in human volunteers and patients .
Because of the slowness of conventional image acquisition, Le Biban suggested"" an experimentalprotocol for clinical studies in which only two or three differently motion-sensitized images would betaken. From these data a crude diffusion map could be made, and in some instances tissue withsignificant high levels of diffusion and/or perfusion was identified with diagnostic relevance . Aparameter, denoted ADC (Apparent Diffusion Coefficient), was derived from the measurements,representing a combination of thee effects of diffusion and perfusion . An extremely high value for thisparameter suggested enhanced perfusion, but quantification of perfusion was not possible . The majordifficulty with this approach was, of course, motion artifacts, which made accurate determination ofeven the diffusion coefficient impossible in some patients .
Many other researchers have recently used this pulsed gradient spin echo technique to creatediffusion maps in phantoms, small animals and humans, and it is not the purpose of this review todescribe the substantial results which have been obtained, which have been comprehensively discussedby Le Bihan et alf a" A small number of these workers have attempted to observe perfusion also . Atpresent their claims are conflicting . Lorenz and co-workers'rss - root have repeated the phantomexperiments described earlier, and have extended their work to perfused excised kidneys . They observeclearly bi-exponential attenuation curves, shown in Fig . 17, with perfusion fractions significantlydifferent from zero. In the kidney study, increasing the rate of flow caused both the perfusion fraction fand the pseudo-diffusion coefficient D p to increase. Kidneys are very heavily perfuscd organs, and it isnot surprising that perfusion is visible using this technique, though some of the fluid observed inmotion may be in the form of urine, not blood .
Log IS, SI
I
U-
m w rmv
uoM
lea
x

-0 .2
-0.4
-0 .0
-0 .8
ln(a/s0)
Angiography and perfusion measurements by NMR
115
Isolated Dog Kidney
-l
-- L
~100 . zoo
300
409
500
Goo
700
800gradient factor b (eeclmal2)
-- . 80 ml/min - - 40 ml/min -X 0 MI/rain
Fir,. 17. Plats of the logarithm of signal attenuation versus b-factorr for isolated perfused dog kidney, for varyingflow rates (figure courtesy of Dr Christine Lmenx, VanderbiltUniversity) . Note the marked curvature, if diffusion
alone were pnsent the graph would be linear .
Using the line-scan technique described earlier, Chenevert and co-workersl733 ' were able to obtainreproducible values for the perfusion fraction in human brain, which show correlation with anatomicalfeatures. Typical results are shown in Fig . 18.Lt Bihan et aL 11d" showed results for cat brain in which a flowing volume of 84/a in grey matter was
claimed. In these animal studies the animals were -paralyzed and held immobile in order to avoidmotion artifacts . The diffusion coefficientsobserved are in, good agreement with those obtained usingthe snapshotecho-planar technique, which will now be discussed .
3 .1 .3. Echo-Planar Single-Shot Di tsion imaging. The most straightforward method ; of obtainingsingle-shot images in 25-100 ms was introduced by Mansfteld.t14) Here the read and phase-encodegradients are rapidly switched while data is acquired, to provide a complete raster scan of k-spa cduring the decay et a single FID (Figs 19 and 20). Sensitivity to diffusion and slow flow is provided by apair of gradient pulses preceding acquisition, as before .
Tumerl'r 31 first suggested using this technique, which was demonstrated independently by Avramand Crooks1 1431 Good quantitative measurements in vitro were made by Turner, laa7 and Le Bihan'sresults' 11 .) for perfusion in a gel phantom were reproduced' 137 • 1411 With the aid of a small high-efficiency gradient coil, just large enough to fit over a head, snapshot diffusion imaging of the humanbrain was performed. Initially the matrix size was 64 x 64, giving a spatial resolution of 2.5 mmx 2.5 mm in-plane. No motion artifacts were observable, even in images obtained with the largestdiffusion gradients, and these results must be considered to be reliable .
A small but significant hi-exponentiality has been consistently found in the attenuation versush-factor data in the grey matter of the brains of three volunteers, and 20 patients suffering from gliomasof varying grade . Typically the perfusion fraction seen is 8-10%, with a standard error of 2-4% . Thehighly vascular periphery of high grade gliomas often shows an even larger perfusion fraction . Thesevalues are larger than the volume fraction of brain grey matter capillaries reported by Pawlikll . . 1 andmany other authors, which range around 4% . If the measured perfusion fraction indeed arises fromperfusing blood, it must be concluded that the relaxation time T2 of protons in this blood isconsiderably longer than that in surrounding cellular tissue, and hence the contribution to the totalsignal from this blood is correspondingly greater, for the long echo times used

1 16
R. TURNER and P. KELLER
10
6
a1
-100 -75
60
-25
a
25
50
75
100PosteriorAnterior Location (mm)
(a)
(b)
Fie . 18 . (a) Calculated `perfusion fraction' along an anterior/posterior oriented column (10 mm x 10 mm) throughcystic (anterior) and solid (posterior) portionsof residual glioblastoma multifumne tissue. (b) Corresponding MRimage (TR= Is, TE=123 ms) showing location of column . (Figures courtesy of Dr Thomas Chenevert, Univeristy
of Michigan Medical School.)
What has not yet been adequately demonstrated, however, is whether the perfusion fractionmeasured actually comes from flowing blood, or from partial volume effects associated with thepresence in most brain tissue voxels of interstitial fluid, with a high diffusion coefficient close to that ofpure water . Frequently the pseudo-diffusion coefficient D, measured from the curve is much higherthan that of pure water at body temperature, which would suggest that the second exponentialcomponent could not come from CSF, but as mentioned earlier, the statistics fur quantitation of thiscomponent are not favorable, and so this possibility cannot be ruled out .

r
G l
61
9a'
Angiography and perfusion measurements by NMR
117
TFJ2
TF12
u
uGk
.AAAJ`1AAnA .Signal
64 echoes
Acquire--
∎ slice selection
® diffusion
echo-planar imaginggradients
gradients
gradients
Fio. 19. Echo-planar diffusion imaging sequence, showing the gradientecho version of this sequence . Note thebipolar diffusion gradients .
kr
II
III
A'
i
I ,--F
xJF
J J
IIAAiIIAIII
1
III
I
k
Fro 20. Trajectory in k-space for data acquisition using the sequence shown in Fig . 19 .
II
I
I
It should finally be noted that other fast imaging technique, such as Turbo-FLASH"" , ' 46) andTurbo-STEAM, ( 147 • t4su have recently been explored for diffusion imaging, but no results for perfusionhave yet been reported . These techniques, acquiring an image in 200-100 ms, are still somewhatvulnerable to motion artifacts and will require validation by comparison with echo-planar diffusionimaging before assessment can be made of any forthcoming results for perfusion .
1 18
it TURNER and P. KELLER
3.2. Slow Flow Methods
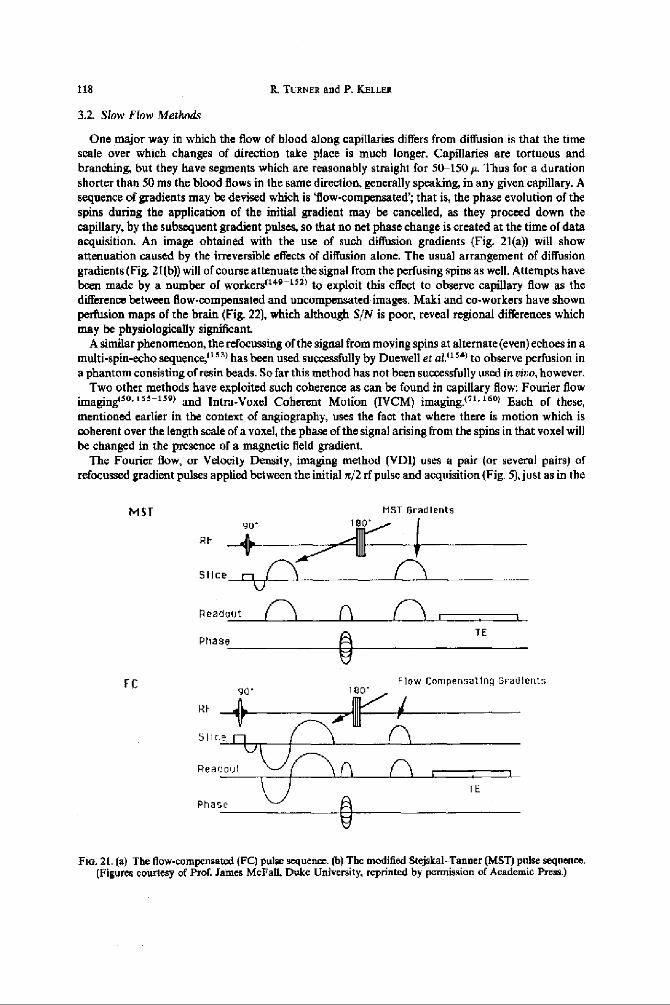
One major way in which the flow of blood along capillaries differs from diffusion is that the timescale over which changes of direction take place is much longer. Capillaries are tortuous andbranching, but they have segments which are reasonably straight for W150 p Thus for a durationshorter than 50 ms the blood flows in the same direction, generally speaking, in any given capillary . Asequence of gradients may be devised which is `flow-compensated ; that is, the phase evolution of thespins during the application of the initial gradient may be cancelled, as they proceed down thecapillary, by the subsequent gradient pulses, so that no net phase change is created at the time of dataacquisition. An image obtained with the use of such diffusion gradients (Fig . 21(a)) will showattenuation caused by the irreversible effects of diffusion alone. The usual arrangement of diffusiongradients (Fig. 21(b)) will of course attenuate the signal from the perfusing spins as well. Attempts havebeen made by a number of workerstua -"'l to exploit this effect to observe capillary flow as thedifference between flow-compensated and uncompensated images . Maki and co-workers have shownperfusion maps of the brain (Fig . 22), which although S/N is poor, reveal regional differences whichmay be physiologically significant
A similar phenomenon, the refocussing of the signal from moving spins at alternate (even) echoes in amulti-spin-echo sequence,"" ) has been used successfully by Duewell et al1 15`I to observe perfusion ina phantom consisting of resin beads. So far this method has not been successfully used in rieo, however .
Two other methods have exploited such coherence as can be found in capillary flow: Fourier flowimagugisa . ' 55- t59 t and Intra-Voxel Coherent Motion (IVCM) imaging .t. l . lsol Each of these,mentioned earlier in the context of angiography, uses the fact that where there is motion which iscoherent over the length scale of a voxel, the phase of the signal arising from the spins in that voxel willbe changed in the presence of a magnetic field gradient .
The Fourier flow, or Velocity Density, imaging method (VDI) uses a pair (or several pairs) ofrefocussed gradient pulses applied between the initial n/2 rf pulse and acquisition (Fig . 5), just as in the
MST
MST Gradients
RF
Slice I1
fC
Readout nI I(~ ,
TEPhase
Flow Compensating Gradients
TE
Phase
FIG. 21 . (a) The flow-compensated (FC) pulse sequence. (b) The modified Stejskal-Tanner (MST) pulse sequence .(Figures courtesy of ProL James McFall, Duke University, reprinted by permission of Academic Press .)

Angiography and perfusion-measurements by NMR 119
no. 22. In rbo coronal rat head images . H-H,O, M-mineral oil ; (a) Flow compensated, (b) normaliseddifference between FC image and MST image, normal level of CO, supplied in respiratory gases, (c) as (b), exceptthat 10% CO, was supplied (d) as (b), after animal sacrificed . (Figures courtesy of Prof. James McFall, Duke
University, reprinted by permission of Academic Press)
IVIM technique. However, a series of images is obtained in which the gradient amplitude is steppedthrough a large number of equally spaced values . Since the phase shift is linearly proportional to thegradient amplitude and to the velocity of the spins, a simple Fourier transform with respect to thegradient strength gives a velocity spectrum for each voxel . In practice, only one-dimensional imageshave normally been obtained using this technique, using a slice-selective n/2 rf pulse, because of theextreme length of time required to perform a full 3D encoding (2 -4 h) .
Generally speaking, as we have seen, the best VDT results been obtained for blood flow within largervessels, but perfusive flow has been detected in the thyroid gland ."") Incoherent flow and diffusionmanifest themselves as a broadening of the `line' in the velocity spectrumm for a particular voxel . Therelative magnitudes of these phenomena imply that the broadening due to perfusion is much greaterthan that due to diffusion (Fig. 23k in fact the linewidth is proponional to the effective diffusioncoefficient. In principle the method provides much more information than the simple IVIM technique.Use of this method for full 2D spatial, 1D velocity imaging with echo-planar acquisition is awaitedwith anticipation.
The IVCM technique of Bryantl 91 ) and Young et al.ti 60t entails the use of the same sequence as thespin-echo [VIM sequence described earlier, but using only one or at most two gradient increments. Atraditional spin-echo 2I)FT-image is acquired, with a very long echo timet's'l to minimise thecontribution to the signal of static spins with shorter T, than blood. The phase of the image data,which is then proportional to the velocity component of the spins parallel to the sensitizing gradient, isdisplayed as an image, after a software correction has been made to remove phase variations caused bystatic field inhomogeneities . The image, in which different phase angles appear as different shades ofgrey, represents a map of velocities, and Young and co-workers have claimed"" that what is seen isthe non-random flow ofblood in capillary beds where the source artery and sink vein are presumably

120
R. Tuasaa and P. X}LL8a
FIG . 23 . Sketch of velocity density spectrum for a tissue voxel containing a larger vessel and also numerous opencapillaries .
well separated . All the information in such an IVCM image, as well as that in an IVIM image, iscontained in a Velocity Density Image .
There are major difficulties with the interpretation of the results of IVCM imaging . The first arisesfrom the use of a multipulse imaging method, as we have seen earlier ; the image, especially the phaseimage; iss sensitive to motion of any kind, which in the brain includes involuntary motion„ (hard toprevent entirely), CSF flow, effectss of respiration and pulsation of brain tissue related to the cardiacCycle, 16 31 (which cannot be eradicated altogether even with cardiac gating since the cardiac' cycle isnever completely regular). Thus motion artifact is normally present on IVCM images,"' ) and is oftenthe dominant feature .
The second problem is the distinction of the various kinds of motion . In most IVCM images theeffect of brain pulsation can clearly be seen around the cerebral ventricles . The mean coherent velocityof blood in the capillaries is undoubtedly extremely slow, below 0.2 mm s- ' if it exists at all (which isnot likely in some brain tissue beds, where the anatomical evidence~ 1291 suggests that capillaries have arandom distribution of orientations) . This slow motion is superimposed on the cerebral pulsationswhich have a similar, or larger, velocity and are fairly complicated in their spatial distribution ;(' arkthere is no obvious means by which these physiologically distinct motions may he separated .
A final problem relates to blood visibility, and this also concerns IVIM imaging . The Tz of blood isstrongly dependent on blood oxygenation level, varying by as much as a factor of three at 1 .5 Tbetween the oxygenated and fully deoxygenated state."'. that Thus venous blood will be more poorlyseen at long echo times than arterial blood, and quantification of perfusion by IVCM or [VIM will bemade even more difficult . However, in practice it may be adequate to assume that in a capillary bed amean value for the T, of blood can be applied, since each cell is roughly equally well perfused withoxygen.
3 .3. Dynamic Contrast Agent Studies of Perfusion
If a non-diffusible NMR contrast agent is rapidly injected into the bloodstream in the form of abolus, the movement of blood through an organ can be studied by observing the changes of imagecontrast as a function of time . The origins of this change in contrast, i .e . changes in relaxivity and thedevelopment of steep localized magnetic field gradients caused by the high susceptibility of contrastagent-containing blood, will now be discussed, and recent results will be reviewed.
The presence of a paramagnetic contrast agent in the bloodstream produces a decrease in the blood'srelaxation times Tl and Tz, and an increase in its magnetic susceptibility . This latter change causeslocalized field inhomogeneity around blood vessels, which in turn results in a shortened T= in theirvicinity . In what follows we will be concerned only with brain tissue, where the contrast agent remainsintra-vascular. For voxels within a capillary bed, because of the large density of small vessels, there is afairly uniform decrease in T i, which is manifested as a loss of signal on long TE gradient echo images .It might be thought that for long TE spin echo images, since the effects of field inhomogeneity arerefocussed, the only loss of signal would be from the small fraction (2-4%) of spins actually in the

Angiography and perfusion measurements by NMR
121
blood, and thus directly affected by the dissolved paramagnetic agent, but Majumdar and Gore" 'I
showed that because tissue protons diffuse rapidly through the magnetic field gradients surroundingthe blood vessels, there is an additional loss of signal analogous to that found with the IVIM techniquedescribed earlier. This attenuation can be quite marked for long echo times, though always of smallermagnitude than with gradient echo images at the same echo time .
To observe the passage of a contrast agent through an organ, taking typically 5-20 s, it is clearlyessential to use a fast imaging technique . The two such techniques available are FLASH"" ) (orGRASS, or one of its variants), which currently has a best time resolution of about 200 ins, and Echo-Planar Imaging (EPI),"" 4' which can be run at 20 frames per second" 6 " with a time resolution of50 ms. Normally at these highest repetition rates the image SIN is poor, so a TR of 1 s is considered tohe a good compromise.
The fundamental theorem° 681 relating perfusion to observations of the effects of a tracer or contrastagent is
P= V/(MT)
(20)
where V is the volume of distribution of the contrast agent within the tissue (the total blood volume ifthe agent is non-diffusible), M is the total mass of tissue perfused, and T is the mean transit timethrough the tissue in question, for any given particle of contrast agent . If the agent tissue concentrationcan be inferred from the change in contrast as the agent passes through the tissue, the blood volume Vmay be deduced by integrating this change over time .However, to measure T is somewhat more demanding . It can strictly be deduced from the
dependence of tissue concentration upon time (the `tissue residue function') for an idealised 'delta-function' bolus of contrast agent injected proximally to the organ in question . But even intra-arterialinjections cannot approach this ideal, and for health reasons infra-venous injections are muchpreferred. Thus the tissue concentration which we hope to observe will be the convolution of theresidue function with some actual arterial concentration of agent delivered to the organ . A method ofmeasuring this arterial input function must be used in order to extract, by deconvolution, the residuefunction and hence the mean transit time . It has been suggested that this arterial function may beobtained, for the brain, by acquiring images of the carotid and vertebral arteries in the neck,interleaved with those of a selected slice in the brain . Results using this method are not yet available.
Two key assumptions are that the observed changes in contrast can be related to tissueconcentration, and that the same relationship applies for all types of tissue . The first is plainly not truefor tissue concentrations above a certain threshold ; the signal from a given voxel is reduced to the noiselevel, and larger amounts of contrast agent have no observable effect . It has been well established,however,° 69, that the change in the appropriate relaxation rate (D (17,) or D (1,/Ti), depending onwhether spin-echo or gradient echo imaging is used) is linearly proportional to the contrast agentconcentration in blood . Using this as a starting point, there have been a number of attempts to modelthe effects in living tissue . It appears to be necessary" 7 °I to use Monte Carlo techniques""' to followslowly diffusing spins through the heterogeneous magnetic fields surrounding each vessel. Simplermodels( t which rely on spatial averaging of field nonuniformity effects to provide analyticexpressions for signal attenuation are not appropriate in the regime we are forced to consider . Resultsfrom this simulation show that if the concentration of the contrast agent is not too high, the changes inthe relaxation rates l/(T2 ) and 1/(T!) are indeed roughly linearly proportional to the volume fractionof capillaries, i .e . to the blood volume, for a given intra-vascular concentration of contrast agent . Thesecond assumption, of the independence on tissue type of the contrast obtained, is more debatable .Realistic computer models of different types of capillary bed within brain tissue have yet to begenerated, and only empirical studies are available (vale infa).
Attempts to measure perfusion using contrast agents can be classified by which relaxationparameter is observed . Early work by MoseleyU I and Kentf174t Used T,-weighted images, andemployed long-persistence contrast agents such as Gd-DTPA-albumen which remain in the blood-stream for many hours. The change in T, caused by the agent reflects its equilibrium concentration indifferent tissue types, and if the calibration curve of enhancement versus concentration for the specific
JPMIX9 23 :1-I

122
R. TURNER and P . KELLER
agent is known, the absolute blood volume may be inferred . Results show good agreement withliterature values.
The first publications on echo-planar contrast-enhanced perfusion imaging technique were made bythe group of Rosen and Brady,tr,s-l''-,) though as early as 1985 a dynamic study was made of thepassage of Gd-DTPA (gadolinium-diethylene-triaminepentaacetic acid) through a pig heart in vivo byMansfield and his group . Rosen has given an excellent review of this work°'°) and only a summary willbe presented here .
More recently, Mansfield and co-workersj7e) have used an inversion recovery variant of echo-planar imaging (IR-EPI) to observe the time course of T,-related signal enhancement with a timeresolution of 3 s . The inversion time is chosen to minimise the signal from most of the brain beforethe contrast agent is administered, and the pattern intensity clearly reveals regional variations inperfusion. In particular, a • patient with a highly vascular meningioma was studied; the increasedperfusion in the lesion was well demonstrated . Quantitation of perfusion using this approach has notyet been attempted, however, although it may be more straightforward than for T, or T,* weightedimages, to which we shall now turn.
Early workt168 from Rosen's laboratory used a fast one-dimensional imaging technique as a meansof obtaining good time resolution as a bolus of Gd-DTPA was observed in its passage through ratbrains . The by-noww classic `signature' of the time variation of contrast was observed ; examples will beshown below. Later work used echo-planar imaging to obtain real-time contrast enhanced movies ofthe passage of contrast agent through the brain"", 1+71 and heart, "97
What has been demonstrated so far is as follows . The difference in perfusion between grey and whitematter can be observed, in dog brain"'6) and human brain,"- rat. lea) appearing as a difference inmaximum contrast change of about a factor of two . This is rather smaller than the ratio of perfusion,which is closer to four," 80t but corresponds well to the ratio of blood volume between these tissues .Cerebral blood flow is changed dramatically by hypercapnia (the addition of CD= to the respiratorygases). to dynamic Dy-DTPA contrast agent studies on dogs,'" , "'I Belliveau and co-workersshowed that this effect is easily observed . To obtain maps of blood volume, the logarithm of thenormalized signal from each voxel was computer fitted to a gamma-variate function .' 74I The resultingparametrized curve, which excludes thecffect of tracer recirculation, could then be integrated to give amap of blood volume, given the assumption discussed earlier that changes in relaxation rate areproportional to capillary volume for a particular capillary concentration of contrast agent . Acomputed map of cerebral blood volume is shown in Fig . 24. From such images, obtained with andwithout hypercapnia. the changes in blood volume can be determined, and these correspond well toresults previously obtained using older methods for measuring perfusion .('811 The deficit in bloodvolume in the ischemic region of the brain of a patient suffering from chronic stroke has also been welldemonstrated! tsal
Active research using these techniques is in progress in many laboratories . Excellent results havebeen obtained on laboratory animals by Moseley and his group, using a 2 T medium-bore imagingsystem and echo-planar software developed by Turner ."'j In particular, these workers haveinvestigated an animal model of stroke, in which the middle cerebral artery has been reversibly orirreversibly occluded . Dynamic Gd-DTPA studiesf1B61 have demonstrated the absence of blood flowto the parts of the brain normally only supplied by the occluded artery, and show clear evidence ofdelayed collateral blood flow into regions of shared watershed . The linear relationship between bloodflow and attenuation caused by Gd-DTPA in spin-echo images has been confirmed empirically bywork of Rudin and Sauter .""' They compared MR imaging results with determinations of localcerebral blood flow made immediately afterwards using the classical "C-iodoantipyrine method."loo)For different regions of interest within the brain, with differing tissue types, they found that the linearrelationship held well, supporting the second assumption referred to earlier .
Where researchers have no access to echo-planar compatible equipment, the gradient-recalled echoFLASH'"' 1 or GRASS technique is often used, to obtain the fairly satisfactory time resolution ofabout 2s. The contrast observed, though a complicated mixture of longitudinal and transverserelaxation effects, is dominated by Tz changes (Variants of the echo-planar method can cleanlyseparate the effects of the different relaxation parameters :) . An early study suggests"" that the effects

Angiography and perfusion measurements by NMR
55wz 090
z0.80
Z
U5 0 .70
0 .60
(a)
0 10
[5
20
25SECQNOS
(b)
1 23
lo. 24 . (a) A blood volume map of a transaxial section of a human brain, calculated usinga pixel-by-pixel fit of thelogarithm of the image intensity decrease to the gamma variate function, as a bolus of Gd-13TPA passed throughthe brain . Image resolution, 128 x 128. The map was created from 15 EPf images acquired at 1 s intervals .(b) Graph of the change in image intensity for grey and white brain tissue during the passage of contrast agent .
(Figures courtesy of Prof. Bruce Rosen, Massachusetts General Hospital)
on cerebral blood flow of visual, stimulation are observable in monkeys, but there were difficulties inproviding suitable controls, the monkeys required extensive and complicated surgical preparation, andthee measured effect was small . Further work using simpler models is under way at several laboratories,including that of the first author. Giventhat changes olcerebral perfusion of 20%n or more caused byvisual stimulation have been observed using radio-tracermethods,"" ) it is likely that definitive reeultswill soon be available :

124
R. TURNER and P. KELLER
3 .4. NMR Tracer Methods
3 .4 .1 . Auto-Tracer Methods. Within the last year two new and intriguing methods of visualizingcerebral blood flow have been demonstrated. These use blood itself as a contrast agent . The first,described by Ogawa and co-workersi 19ej and employed by Turner et al," 9t1 utilizes the dramaticchange in the magnetic susceptibility of blood when it becomes deoxygenated . This effect is stronglydependent on static field, tsal the transverse relaxation time T2 decreasing by a factor of three at65 MHz, but by a factor ofxsix or more at 270 MHz . At the field strength of 7 T used by tDgawa .et .al.,the image of a deoxygenased rat brain showed numerous dark lines caused by the phase incoherence ofspins in the vicinity of blood vessels, even for an echo time as short as 6 ms .Turner et aft191 ' observed a similar affect using gradient echo (TE=70ms) EPf of cat brain,
observing a rapid drop off signal in grey matter within seconds of death, . In a further experiment, theyobserved a reduction of grey matter signal starting about 30 s after the onset of global'hypoxia causedby the administration of pun inhaled N2 (Fig. 25), returning to normal signal amplitude almostimmediately after normal respiratory gases were restored . This results undoubtedly from the changesin blood oxygen level. Further experiments which may show local changes in blood oxygenationresulting from local ischaemia, or even brain functional activity, are clearly desirable .
The second method for turning blood into a contrast agent, in this case the blood water, which mustbe regarded asthe perfect endogenous diffusible tracer, was introduced by Detre and co-workers1rs21very recently . Here the idea, was to prepare the proton spins in the blood at the neck, using rapidlyrepeated slice-selective saturation or inversion pulses, and to observe thee steady-state effect on thesignal from a slice through the brain, as the prepared spins perfused into the brain tissue . The ratioM/M, by which the tisrite signal intensity is reduced, and also the longitudinal relaxation time T1 ,,,,must be measured in order for the perfusion to be calculated :
P=(1-M/Mo)lTrwo •
(2l)
The perfusion appears in the correct units, and quantitative experiments on rat brain gave excellentagreement with previously reported values. Perfusion images with the normal proton MRI resolutionare obtainable, and the procedure is completely noninvasive .
Feline brain signal Intensity during anoxic episode
5500
a5000
s
4500
a 4000
33500
-Q]
r4f7
CD0
I I
0f f
Time in seta50 I
100
150
200Anoxia an
Anoxia off
Fie .25 . The variation of image intensity with time for selected regions of interest in cat brain. Images were acquiredusing a gradient-echo EPI sequence, with a field of view of 40 mm, 64 x 64 image matrix, slice thickness 2 mm, echotime a0ms. The cat was respirated with 75% N,O, 25% O x except during the period of anoxia, when 100% Nr was
administered. ROr measurements were made using TDL software on a Sun 3-160 computer .

Angiography and perfusion measurements by NMR
125
The major problem in applying this extremely promising technique to human studies is that thedrop in signal is very small, no more than 1-2%, even at the high field strength of 4 .7r used by Detreet al., where T1 is about three times longer than at the maximum field at which humans are normallyimaged. At this field of 1 .5 T, S/N must be very large, image quantitation must be extremely precise,and instrumental hardware must be very stable, for perfusion to be measurable this way .
3 .4.2 . Tracers. Using Other Nuclei. If an NMR sensitive nucleus which is not usually found in vivo canbe introduced into the body in sufficient concentration to be easily observable, without appreciabletoxicity, flow measurement techniques akin to radiographic indicator dilution methods can be applied .There are a number of such nuclei which offer varying degrees of promise . The most thoroughlyexplored is 19F, in various chemical forms, to be discussed in the next section. Following this is 211, anda relative newcomer, "O .
3 .4.2 .1 . Fluorinated tracers. The earliest work using '9F as an NMR tracer to measure cerebralblood flow was that of Bolas et of t19 r1 They showed that the commercial refrigerant FC 22 (CHCIF 2),which has low toxicity, could be added to respiratory gases in experiments on rats, and its brainclearance curve was measured by NMR. Apart from its rather short T 2, the spin-1/2 19F nucleus isquite easy to observe with NMR, since its sensitivity and Larmor frequency is close to that of theproton. Quantitating the cerebral blood flow (CBF) independently using radioactive microspheres,they found that the clearance rate increased as expectedo 96' under conditions of hypercapnia. FC 22 inuseful concentrations causes noticeable changes in brain physiology. Further work by Eleff et al. ; ' 951
who observed these effects by electroencephalogram, demonstrated that the less toxic FC 23 could alsobe used as an NMR tracer. Brain biopsy was used to estimate the blood-brain partition coefficient ofthese gases.
To quantitate perfusion, using an analysis very similar to that developed by Obrist andco-workerst' 9 s ) for evaluation of CBF from clearance of the g emitting gas 133Xe, it is necessary toobserve the arterial input function, as described earlier (eqn. 1). Ewing and co-workers"' - ' 99)succeeded in obtaining such measurements, by the simultaneous NMR observation of FC 22concentration in the femoral artery 1 1971 Thus they were able to make fully quantitative estimates ofcerebral perfusion in cat brain, and even to distinguish the two compartments of grey and whitematte,119 s) which are manifested in the bi-exponential washout curve . To avoid the perturbing effectsof FC 22 on blood flow, these workers also switched to the use of FC 23, 11" ) which appears to be inertand non-toxic even at the very high respiratory concentration of 60% .
In a comprehensive study, Barranco et al.t2O01 employed FC 23 at concentrations up to 56% toobserve CBF in normal and hypercapnic cat brain, making careful comparative measurements withradioactive microspheres.t 2O 11 A surface coil was used to obtain the NMR signal, mounted directly onthe skull, to avoid contamination of the signal by FC 23 in overlying muscle . Biopsy samples wereobtained to measure the brain-blood partition coefficient, and the arterial input function was obtainedby taking blood samples at 5 s intervals, which were separately analyzed using NMR spectroscopy . Abi-exponential fit was made to the arterial washout curves obtained, and the cerebral washout wascalculated by deconvolution. The results, when the FC 23 determinations ofCBF were compared withthose from the radioactive microspheres for varying CO 2 concentrations, showed good qualitativeagreement, but the NMR measurements were about 30% lower throughout the entire PaCO 2 range. Avariety of possible explanations for this discrepancy were put forward, including differences in thebrain regions sampled by the two techniques.
Regional blood flow is of much greater interest than global flow . Several attempts have been made atinvestigating local perfusion, by spectroscopic localizationt 202 ' and by 19F imaging.t2 os) The towconcentration (30 mm) of fluorine achievable has severely limited the resolution attainable in areasonable time span, to a volume of perhaps 1 ml, when images are acquired every 3 min . This gives arelatively poorly defined washout curve. To achieve better time resolution, of 600 ms, a voxet volumeof 8 ml was required,"'*) Figures 26 and 27 show data from the experiments of Ewing and co-workers,using cat brain. Here FC 23 was administered in a series of bursts, to give better signal : noise ratios forthe calculated CBF maps, thus allowing a voxel volume of 2 ml to be achieved .

1 26
IL TURNER and P. KELLER
1-II imp, la X 128, >M 111"
rr"tSf1 W i 2 mM•Im"Im0
s-c IM~r, IL'M u. am all"a IMIIMX IM"
IrmnmI CIF IS 11"MraeuI
IMM
FIG. 26 . Upper left : high resolution (128 x 12816 cm FOV, 3 mm slice thickness( proton image taken in the medianplane of the accompanying images . Upper right low resolution (16 x 16 cm. FOV, 2 cm slim thickness) fluorineimage taken over 1 min at the peak concentration of fluorine in the brain . LowEr left component fractional flow (inm1/tOO gmin) estimated from two-compartment model fit in normo-capnic (PCO,=41) Iran Hg) cat brain . Lowerright: fast component fractional flow (in ml/100 g min) a4imated from two-compartment model fit in hypercapnia(PCO2=64 mm Hg) in the same animal. (Figure courtesy of Prof. James Ewing, Henry Ford Hospital, Detroit .)
Given that perfusion differs between brain grey and white matter, and the typical thickness of thecortex is only 2-5 mm, the resolution achievable with fluorine perfusion studies is unlikely ever to beadequate for examining the highly localized changes in CBF which accompany specialized brainfunction . However, the technique may be useful in assessing the perfusion deficit in cases of extensivestroke .
3 .4.2 .2. Deuterated tracers. Deuterium is used as a tracer in the form of deuterated water, D 2O,which quickly exchanges protons with surrounding water to become HOD . This compound wouldseem to be close to ideal; it is freely diffusible and very similar in its properties to normal water .However, it is somewhat toxic, and relatively expensive, which places limits on the concentrationsavailable. Since it is not quickly expelled through the lungs, bolus methods are complicated byrecirculation effects. Furthermore, the low sensitivity and short T 2 associated with the spin-1/2character of the nucleus presents special experimental difficulties .
Early results for deuterium washout were obtainedt20 ' 1 at the very high magnetic field of 8 .5 T,giving a Larmor frequency of 55 .2 MHz, for tumours< 3061 and organs" 07,07,1011 in small laboratoryanimals. The perfusion in these whole organs was quantified, though there was some controversycZ 097regarding the validity of injecting the D 2 0 directly into the tissue, rather than into a supplying vessel .Deuterium imaging of ratj 1101 and cat (211) brain has also been achieved, so that it was inevitable thatthe techniques would be combined to provide regional blood flow maps, in a study of cat brain byDetre and co-workers.('('I 1) In these experiments, conducted at a field of 2 .7 T, the level of CO2 in therespiratory gases was varied, and the perfusion images, with a resolution of 3 mm in-plane, showed
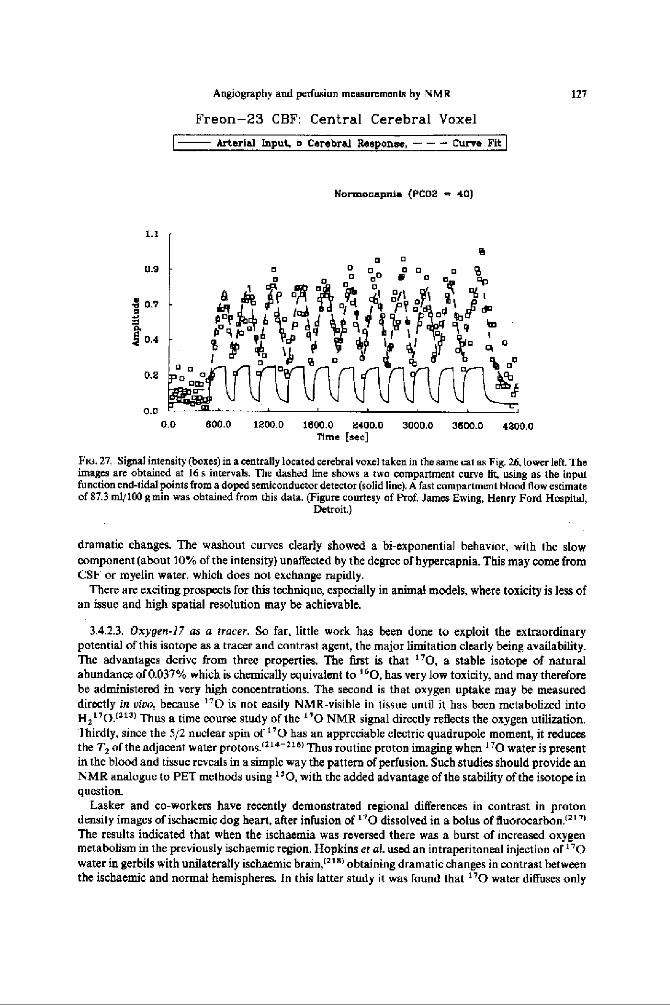
1 .1
0 .9
e 079.Q
Z 0.4
0 .2
0 .00 .0
Angiography and perfusion measurements by NMR
Freon-23 CBF: Central Cerebral Voxel
Arterial Input, o Cerebral Response, -t
Curve Fit
9
•
0 °
° o
o
lq ~' d P °~•
° °11 c PQ °fl ~~ l eao
° ~ 4bB9p°b
~~~~
9
l
° 1~ 9 o
a
°
800 .0 1200 .0
Normocapnia (PC02 - 40)
1800 .0
2400.0Time [sec]
3000 .0
3600.0
4200.0
127
Fwi . 27. Signal intensity (boxes) in a centrally located cerebral voxel taken in the same cat as Fig 26, lower left. Theimages are obtained at 16 s intervals. The dashed line shows a two compartment curve fit, using as the inputfunction end-tidal points from a doped semiconductor detector (solid line) . A fast compartment blood flow estimateof 87.3 ml/100 groin was obtained from this data. (Figure courtesy of Prof, Jams Ewing, Henry Ford Hospital,
Detroit.)
dramatic changes. The washout curves clearly showed a bi-exponential behavior, with the slowcomponent (about 10% of the intensity) unaffected by the degree of hypereapnia . This may come fromCSF or myelin water, which does not exchange rapidly .
There are exciting prospects for this technique, especially in animal models, where toxicity is less ofan issue and high spatial resolution may be achievable .
3 .4.2 .3 . Oxygen-17 as a tracer . So far, little work has been done to exploit the extraordinarypotential of this isotope as a tracer and contrast agent, the major limitation clearly being availability.The advantages derive from three properties. The first is that 170, a stable isotope of naturalabundance of 0.037% which is chemically equivalent to "0, has very low toxicity, and may thereforebe administered in very high concentrations. The second is that oxygen uptake may be measureddirectly in vim . because ' 70 is not easily NMR-visible in tissue until it has been metabolized intoH,"0.( 213 ) Thus a time course study of the "0 NMR signal directly reflects the oxygen utilization.Thirdly, since the 5/2 nuclear spin of 170 has an appreciable electric quadrupole moment, it reducesthe T2 ofthe adjacent water protons .1"'-116) Thus routine proton imaging when 170 water is presentin the blood and tissue reveals in a simple way the pattern of perfusion . Such studies should provide anNMR analogue to PET methods using 16 0, with the added advantage of the stability of the isotope inquestion.
Lasker and co-workers have recently demonstrated regional differences in contrast in protondensity images of ischaemic dog heart, after infusion of 170 dissolved in a bolus of fluorocarbon!'")The results indicated that when the ischaemia was reversed there was a burst of increased oxygenmetabolism in the previously ischaemic region . Hopkins et al . used an intraperitoneal injection of 170water in gerbils with unilaterally ischaemic brain,'" 8 ) obtaining dramatic changes in contrast betweenthe ischaemic and normal hemispheres . In this latter study it was found that 170 water diffuses only

128
R. TURNER and P. KELLER
very slowly through brain tissue (less than 3mm in 1 h), allowing measurements of differential r'Outilization to be made at leisure. This rate is consistent with the values of the diffusion coefficient ofwater found in brain tissue by other workers (e.g . Ref. 127) .
In evaluating oxygen utilization and perfusion in a specific organ, such as the brain, a minorproblem arises. This results from the production of r'0 water in other organs, and the reflow of "Clwater in the blood circulation . Precise modelling, and accurate time course studies with good timeresolution, will be needed to enable good quantitation of perfusion and oxygen utilization by thesemethods.t 2191
4. SUMMARY AND CONCLUSIONS
We have reviewed a wide variety of NMR techniques for observing the vasculature in eivo,measuring blood velocities, and providing qualitative and quantitative maps ofperfusion. Tremendousprogress has been made in all of these areas within the last three years, and it is likely that the uniquelynon-invasive character of MRI will result in major clinical use of at least some of these techniques inthe next decade. At present it is fair to say that the `traditional' methods, of X-ray angiography andDoppler ultrasonography for the major vessels, and PET and SPECT for perfusion, are still morereliable as diagnostic tools, but their advantage is rapidly disappearing .
Acknnwiedgemenie-Paul J. Kelier is grateful for helpful advice and encouragement from Dr Burton P . Drayer andDr Evan K . Farm of the Barrow Neurological Institute . Robert Turner wishes to thank his colleagues in the NIH InVivo NMR Research Center far their assistance, especially Dr Denis Le BBtan, Dr Chris T . W. Moonen, Dr JamesPekar, Dr David L Hoult, Mr Daryl Despres, Dr Geoffrey Sobering and Mr A . Scott Chesnick. Thanks too to DrDenis Le Bihan, Dr Bruce Rosen, Dr Tom Chenevert, Dr Christine Lorenz Dr Jim Ewing, Dr James McFall andDr David Feinberg for their contribution of figures.
REFERENCES
1. G . SuRYAN, Proc. Indian Acad. Sri., Sect . A 33,107 (1951).2 . J . R . SINGER, Science 130, 1652 (1959).3 . L SHEFIsNIK, Progr. NMR Speetrosc. 17, 187 (1985).4 . L. Axra, Am_J. Rnenrgenol. 141, 1 157 (1984).5 . D . G . NISxrMURA, A . MACOVSICT and L M. PAULY, IEEE Trans. Med. Imaging MI-5, 140 (1986) .6 . R . J . ALFm , T. J . MASARYK, L M. HAAKE, G. W . LENZ, J. S . Ross, M . T. Momc, A. D. NELSON, l. D. LIPUMA
and A . M . COHEN, Am. J. Radiul. 149, 1097 (1987) .7 . C . L. DusouuN, Perspectives in RadioL 2, 1 (1989).8 . K L. HAHN, Phys. Rev . 80, 580 (1950)9 . P. MORAN, Magn. Reson. Imaging 1, 197 (1983) .
10. L. AXEL, Proc. SPIE 347,336 1(983) .11 . J. R . SINCFR and L. E . CROOKS, Science 221, 654 (1983112. G. EARNEST. G . Foams, B. A. SANnox, D. G . PIEPORAS, R. J. FAUST, D. M. ILLSraur and L J. ARNDT, Am. J .
Radio-142, 247 (19841.13 . V . J . WEDEEN, R. A. MnuLw, R. R. EDELMAN et al, Science 230, 946 (1985).I4 V. I. WEDEEN, Y. S. CHAO, Comput . Assist . Tomogr. 11, 24 (1987) .15 . R. A MeuL7, V . J. WEDEEN, S C . GELLER, R. R EDELMAN, L R . FRANK, T . J . BRADY and B. R. ROSES,
Radiology 159,411 (1986)16. J . B. De CASrao, T. A. TASCLAYAN, J. N . Lee, F . FAa/ANEH, S . J . RIFDERER and R . J . HERFKENS, J. Compur.
Assist . Tomogr. 12, 255 (1988).17 . T . A. TASCIYAN, J N . LEE, S . J. RlEuERER, J. B . HE CAsTRo, L. W. HEDLUND, R . J . HERFKINS and C . E.
SrRITZea, Magn. Reson . Med. 8, 261 (1988).IS- V . I. WEnEEN, B . R . Rows., D . CITINLER and T . J. BRADY, J . Compur. Assist. Tomogr. 9,530 (1985).19. W . T. DIXON, L. N. Do, D . D . FAUL, M . GADO and S . Ross,ICK, Magn Reson . Med . 3, 454 (1986).20. J . H. WALTON and M. S. CONRADI, Magn. Re.wm. Med . 4, 274 (1987) .21 . H . VAN As, J . M . KIFuN, P. A . nF JADES and T. J . SCHAAESMA, J. Magn . Reson. 62 511 (1985)22. G. S. KARCZMAR, D. B . TwgG, T . J . LAWRY, G . B. MATSON and M. W . WEINER, Magn. Reson. Med. 7, Ill
(1988).23 . S . S . Ken and C. F. SCHMIDT, Am. J . Physiol- 143, 53 (1945).24. S . ARONOW, Positron brain scanning, Progress in Medical Radionuclide Scanning, Eds R . KNISELEY,
G . ANDREWS and C. HARRIS, Oak Ridge Institute of Nuclear Studies, Oak Ridge, Tennessee (1962) .

Angiography and perfusion measurements by NMR
129
25 . B . L . MALLET and N . VEALL, Clin . Set. 29,179 (1965),26 . B . P. DRAYER, S. K. WOLFSON, O. M. REINMUTIL M. DwoVNY, M. BoraNKE and E. E. COOK, Stroke 9,123
(1978).27 . C . S. ROY and C. S . SHERRINGTON, J. Physiol . 11, 85 (1890) .28 . P. TupSKI, Applications guide, Vascular Magnetic Resonance Imaging, Vol . 3, General Electric Medical
Systems, Milwaukee, WI (1990).29 . G . A. LAUB and W. A . KAISER, J . Comput. Assist. Tomogr . 11377 (198g-30. P. M . RUGGleRI, G. A. LAUB, T. J. MASARYK and M. T. Montc, Radiology 171, 785 (1989) .31 . T . J . MASARYAK, M. T. Moots, J . S. Ross, P. M. RUOoiaRi, G. A. LAUB, G, W . LENz, E. M . HAAKE, W. R.
SELMAN, M. WIZNITZER and S. L HARIK, Radiology 171, 793 (1989),32 . C. L . Dumoui N, S. P. SuuzA, M. F. WALKER and W. WAULE, Magn. Resort Med . 9,139 (1989).33 . P. J. KELLER, R P. DaAYER. E. K . FRAM, K . D. WILLIAMS, C. L. DuMOULIN and S. P. Soww ,,, Radiology 173,
527 (1989) .34 . C. M . ANDERSON, D. SALONER, J . S . TSURUDA, L. G . SBAPEERO and R E . LEE, Am. J. Radiol . 154, 623 (1990).35 . S, P. SOUZA, W. J . ADAMS and C. L. DuMOCLIN, Back ofAbstracts: Soc . ofMagn . Reson. in Med. 1990 p . 487.
Berkeley, CA (1990).36 . D. SLUANER, W. HANSON, J . S . TSLRUDA, C . M. ANDERsoN and R . F. LEE, Book of Abstracts: Soc. ofMagn.
Reson. in Med. 1990 p . 488, Berkeley, CA (1990).37 . S . Du NNE, S . NAPEL and B. K . RLcrr,Book ofAbsrracts : Soc. ofMagn. Reson. . in Med. 1990 p . 490, Berkeley, CA
(1990).38 . N. M . HvLroN, Book of Abstracts: Soc . of Magn. Resnn . in Med. 1990 p . 492, Berkeley, CA (1990).39. W . F . KRASKE and P.M. COLLETII, BookofAbstracts: Soc . ofMagn. Reson . In Med. 1990 p . 59, Berkeley, CA
(1990).40. J. E. SIEBERT and T. L. ROSENBAUM,BookofAbstracts : Soc. ofMagn .Reson. in Med. 1990 p 60, Berkeley, CA
(1990).41 . H. E . CLINE, C. L . DUMUUUN,W. E. LORENSON, S . P . Souzt and W. J. ADAMS, Book of Abstracts : Soc. Magn.
Resnn. in Med. 1990 p. 61, Berkeley, CA (199(l).42 P. J . KELLER, unpublished work,43. M . O'DON7sT:LL, Med . Phys. 12, 59 (1985}.44. C . L. DUMUUNN, S. P . SouzA and H . R . HART, Magn . Reson. Med. 5,239 (1987).45. E. M . HAAKE and G . M. LENZ, Am. J . Radial. 148, 1251 (1987) .46. P. M . PAriANY, 1 . J . PHILLIPS, L. C. Cwu, J . D. LIPCAMON, J . L. DOFRK, J . M. McN+t .LY and S . N .
MOHAPATRA, J . Cumpal . Tomogr. 11, 369 (1987).47 . P. 1. KELLER and F. W. WFHRU, .1 . Magn. Reson. 78,145 (1988).48 . C . YUAN, G. T. GULBERG and D. L . PARKER, Magn. Reson . Med . 9,161 (1989).49 . A . CONRTANTINFRCO, J . J . MALLET, A . RONMARTIN, C. LAI.LOT and A. BRtourr, Magn. Reson. imaging 2, 335
(1984).50 . D . A. FFINRFRG, L. F . CROOKS, P. SHELDON, J. HOVNNIGER, J . WATTS and M. ARAKAWA, Magn. Reson. Med.2,
555 (1985).51 . D . G . NORRIS, R . A . JONES and J. M. S. HUTCHISON, Magn . Resort-.Med. 7, 1 (1988) .52 . L L. DUREK and P. M . PATTANY, Magn. Reson. Imaging 6, 321 (1988).53 . R . E. WFNDT, W. NITZ, P. H . MURPHY and R. N . BRYAN, Magn. Reson . Med.7,7,71 (1989).54 . L HENNIG, M. MURI, P. BRUNNER and H . FRIEDBERG, Radiology 166,237 (1988).55 . C . L. DUMOULIN and H. R. HART, Radiology 161, 717 (1986).56 . M . F . WALKER, S. P . SouzA and C. L . DUMOULIN, J. Comput . Assist . Tomogr. 17,304 (1988) .57 . C . L DUMOIILIN, S. P. SOUZA, M. F. WALKER and E. YOSHITOME, Mayn. Resor . Med. 6, 275 (1988).58 . C . I- DuMOULIN, S. P. SOUZA and H . FBNG, Magn . Reson. Med. 5, 47 (1987).59 . L. AxEL and D . 1. MORTON, Comput . Assisi . Tomogr. 11, 31 (1987) .60. Q . S. XIANG and O . NALCIOGtU, Magn. Reson . Med. 12, 14 (1989) .61 . G. W. LENZ, E. M . HAAKE, T. J . MASARYK and G . LAUB, Radiology 166, 875 (1988).62 . T . L. CHENEVERT, K. P. FRCHNFR and D. Y . GRLRLUM, Magn. Reson. Med. 10, 38 (1989).63 . J . N. LEE, S. J. RIEDERER and N. J . PELC, Magn. Resor, Med. 12,1 (1989).64. E . BENITF2-READ, R MAZURCHuK, A . CAPRIHAN and N. MATWIYOFF, Book ofAbstracts: Sot. ofMagn. Reson .
in Med. 1990 p . 1291, Berkeley, CA (1990) .65. W. A. WAGL& C. L . DumouLIN, S . P . SouzA and FL F . CLINE, Am. J. Neuroradiol. 10, 911 (1989) .66 . J . R PERNIODNE, J . E. SIEBERT, E. J. PoTcHEN, C. G DuMOULIN and S . P. SOUZA, An J. Neuroradiol.11,457
(1990).67. F . L. STEINBERG, E. K, YUCEL, C. L. DUMOULIN and S. P . Souzn, Magn. Reson . Med. 14,315 (1990).68 . N. L PELC and M. A. BERNSTEIN, Book of Abstracts: Soc. of Magn. Reson . in Med. 1990 p 475, Berkeley, CA
(1990).69. R. HAUSMANN, J . S. LEYIN and G. LAUB, Book ofAbstracts : Soc . ofMagn. Reson . in Mod. 1990 p. 402, Berkeley,
CA (1990).70. P . R. MORAN, R. A. MORAN and N . KARSfARDT, Radiology 154, 433 (1985) .71 . D. J . BRYANT, 3. A. PAYNE, D . N. FIRMIN and D. B. LONGMORE, J. Comput . Assist . Tomugr. 8, 588 (1984) .72. G. L . NAYLOR, D. N. FIRMIN and D. B . LONGMORR, J. Comput . Assist . Tomngr. (0, 711 (1986) .
130
R. TURNER and P. KELLER
73. D. N . FIRMIN, G . L, NAYLOR, R H . KLIPSTEIN, S, R . UNDERWOOD, R. S . 0 . REES and D. B. LONGMORE,J. Comput. Assist. Tomogr. 11, 751 (1987) .
74. C . E. SPRITZER, N. M. PELC, J . N. LEE, A. l . EVANS, H. D. SosIMAN and S . J. RIEDERER, Radiology 176,255(1990).
75. A. EVANS,T . GRIST, L HEDLUND, D, SOSTMAN, C. SPRITZER, N. PELCand I NEGRO-VILAR, Book ofAbstracts :Soc. of Magn . Reson . in Med. 1990 p, 480, Berkeley, CA (1990).
76. G. BIELKE, S. MEINnL, W . V. SEELEN and P. PFANNESTWL. Book ofAbstracts Soc . of Magn. Reson . in .Med .1986 p. 76, Berkeley, CA (1986) .
77. K . SHIMIZU, T. MATSUDA, T. SAKURAI, A. FUJITA, H. OHARA, S. OKAMURA, S . HASHIMOTO, H, MAW,C. KAWAJ and M . KERI, Radiology 159,195 (1986) .
78, T . MATSUDA, K. SHIMIZU, T . SAKURAI, A . FUJIIA, H . OHARA, S . OKAMURA, S . HASHIMOTO, S . TAMAKI andC. KAWAZ Radiology 162, 857 (1987) .
79. J . HENNIO, M. MLERU, H . FRIEDBURG and P . J . BRINNFR, Comput . Assist. Tomogr. 11, 872 (1987) .80. K . MERBOLDT, W. HXNICKE and J. J. FRAHM, Magn, Reson. 67, 336 (1986).81. T . K. F. Foe, W . H . PERMAN, C . S . O . POON, J. T. CUSMA and J. C. SANDSTROM, Magn, Resan. Med . 9, 203
(1989).82 . P . 1. KELLER, unpublished results .83. F . W . WERRLI, A . SuIMAKAWA, J . R. MACFALL, L . AxEL and W. J . PEaMAN, Comput. Assisi. Tomogr. 9, 537
(1985}84, D . SLOANER, W. H. HINSON, P. R . MORAN and B. M . W . Tsui, J. Compur. Assist . Tomogr. 12,122 (1988).85 . D . G. NISHIMURA, A . MArovSKI, 1. M. PAULV and S . M. CONOLLY, Magn. Reson . Med. 4,193 (1987).86 . C. L DUMOULIN, H, B. CLINE, S. P. SOUZA, W. A. WAGLE and M . F. WALKER, Magn, Reson . Med. 11, 35
(1989}87. M. L. WOOD,M. SaYER and V. M . RLNGE, Magn . Imaging 5,455 (1987) .88 . A. P. CRAWLEY and M. L, WOOD, Magn. Resrm . Med . 8, 248 (1988).89 . P, SCHMALBROCK, C. YUAN, D. W. CHAKEaEs, J. KDEur and N. J. PEtc, Radiology 175, 861 (1990) .90 . A. MACOVSKT and D. NOLL, &xlk rf Ahslraats Soc . ofMagn. Reson, in Med. 1988p. 815, Berkeley, CA (1988).91 . E. M. HAAKE, Magn . Reson. Med . 4,407 (1987).92. G. MARCHAL, H. BOSMANS, L. V. FRAEYENHOVEN, G. WILMS, P . V. HECKE, C. PLETS and A . L, BAERT,
Radiology 175,433 (1990).93 . T. J. MASARYK, M . T. MoDIc, P. M . RuOGIEEI, J . S . Ross, (J . LAUB, G. W . LENZ, J . A. TKACH, E M, HAAKF,
W. R. SELMAN and S . 1. HARM, Radiology 171, 801 (1989) .94. J. S. Ross, T. J. MASARYK, M . T. Mooic, P. M. RUGGIERI, E. M. HAAKE and W. R, SELMAN, Am. J.
Neuroradiol . I t, 449 (1990).95 . T. J. MASARYK, J. S . Ross, M. T. MODIC, G. W, LENZ and E. M. HAAKE, Radiology 166, 461 (1988) .96. J . L . CREASY, R. R, PRICE, T. PRFRRREY, D. COINS, C. L. PARTAIN and R M. KESSLER, Radiology 175, 280
(1990).97. G. T. GULLBERG, F. W. WERRLI, A. SHIMAKAWA and M . A . SnaoNS, Radiology 165,241 (1987) .98. P. J . KELLER, B . P. DRAYER E, K. FRAM, C. L . DUMOULIN and S. P. SOUZA, Magn . Reson. Imaging 7 (SuppL 1),
186 (1989).99. J . P. GROEN, R G. DE GRAAv and P, VAN DIM, Book ofAbstracts : Soc. ofMagn . Reson. in Med. 1988 p. 906,
Berkeley, CA (1988) .100. R . R. EDELMAN, K . U, W ENTZ, H. P. MATTLE, C . V. OREILLY. G. C .ANDIA, C. Liu, B . ZHAO, R . N. KJELRERG
and K. R. DAVIS, Radiology 173, 831 (1989).101 . J, FRAHM, K. D_ MERBOLDT. W. HAENICKE, M. L . GYNOELL and H. BRUHN, Magn. Reson . Med . 7,79 (1988).102. J. LEWIN and G . LAuE, Book ofAbstracts: Soc. of Magn. Reson. in Med. 1990 p. 217, Berkeley, CA (1990).103. M, DOYLE, T. MATSUDA and C. M. POHOST . Book of Abstracts : Soc . of Magn. Reson, in Med. 1990 p. 495,
Berkeley, CA (1990).104. G. LAUB, J . S . LEWIN and J. A . TKACH, Book of Abstracts, Soc. ofMagn. Reson . in Med. 1990 p 219, Berkeley,
CA (1990) .105. P. J. KELLER, E. K. FRAM, K. D . WILLIAMS and B. P. DRAYER, Magn. Reson. Imaging 8 (Suppl . I), 114 (1990).106. K . DUCKSOO, R. R. EDELMAN, K. C. KENT, D. H. PORTER and J. J . SKILLMAN, Radiology 174,727 (1990).107. J . P. FELMLEE and R . L. ERMAN, Radiology 164,559 (1987)108. D . L . PARKER, C. YUAN . M. A, SIMONS and G . T. GULLBERG, Back of Abstracts: Soc. of Magn. Reson. in Med.
1989 p. 1132, Berkeley, CA (1989) .109. D . L . PARKER, D. D. BLATTFR, R . ROnFSON, P . Heir, C. YTIAN and G. T. GULLBERG, Book ofAbstrae s Soc. of
Magn. Reson . in Med . 1990 p . 494, Berkeley, CA (1990)I tO. 1 . S. LEWIN and G. LADE, Radiology 173, 384 (1989) .111 . J . S. LEWIN and G . LAIrii, Book of Abstracts : Soc. ofMagn . Reson . in Med . 1990 p. 332, Berkeley, CA (1990).1.12 . F . M, WERRLI. E HOFFMAN, S. P . RAYA, P. W. CHAO and H. I . GOLDBERO, Radiology 173(p), 118 (1989) .113 . R. R. EDELMAN, K. U. WENTz, H. MATTLE and B . ZHAO, Radiology 172, 351 (1989) .114. R. R. EDELMAN, H. P. MAFFLE, B. WALLNER, R . BAJAKIAN, J, KLEEFTELD, C . KENT, J . J . SKILLMAN, J . B.
MENDAL, D. J . ATKINSON, Radiology 177, 45 (1990) .115. W. SATTIN and C. WOOD, Book of Abstracts: Soc. ofMagn. Reson, in Med. 1990 p. 502, Berkeley, CA (1990)116 . W . LAN and R M. HAAKE, Book of Abstracts: Soc . of Magn . Reson . in Med . /99) p . 169, Berkeley, CA (1990).

Angiography and perfusion measurements by NMR
131
117. D. LE BIHAN, D. SCHELLINGER, S . RjAN, J . DEVEIKIS, M . CARYLIN and N. PATRoNAs, Book ofAbstracts Soc .of Malta. Resort. in Med. 1990 p. 8, Berkeley, CA (1990) .
118. P. MANSFIELD and P. G. MORRIS, NMR Imaging in Blomrdictne Ch. 4, Academic Press, London (1982).119. R . R RzEDZIAN, Book of Abstracts: Soc. . ofMagn. Resort. in Med. 1987 p. 229, Berkeley, CA (1987) .120. D. N. FIRMIN, R . H . KLIPSTEIN, G. L. HOUNSFIELD,M. P. PALEY and 1) . B. LoNCMOan, Magn. Resort, Med. 12,
316 (1989).121. K Kosm, Book of Abstracts: Soc . of Magn. Rexon. In Med. 1990 p. 1290, Berkeley, CA (1990).122. D. LE BRIAN, E . BRETON, D . LALLEMAND, P . GRENIER, E. A. CAeANIS and M. LAVAL-JEANTET, Radiology 161,
401(19x6).123. R. TURNER, Perfusion studies and fast imaging, Cerebral Blood Flow Eds A. REscIGNO and A . BolcELLl p. 245,
Plenum Publishing, New York (1988),124. E . 0. STEISKAL and J . E. TANNER, J. Chem. Phys. 42, 288 (1965).125. S . MIDDLEMAN, Transport Phenomena in the Cardinvasrufar System, p. 166, Wiley-Inlerscience, New York
(1972).126. M. E. MOSELEY, Y. COHFN, 1. MINTOROVncN, L. CHILEUITT, H. SHIMImI, 1 . TsIRunA, D . NORMAN and
P. WEINSTEIN, Boak of Abstracts: Soc . of Magn. Reson. in Med. 1989 p. 136, Berkeley, CA (1989).127. R. TURNER, D . LE BRIAN, J. MAIER, R . VAYaEK, L. K . HEDGES and J. PEKAR, Radiology 177, 4117 (1990).128 . D. LE BIHAN, E. BRETON, D. LALLEMAND, M.-L. AuBIN, J . VICNAUD and M. LAVAL-JEANTET, Radiology 168,
497 (1988).129. 0 . PAwr.iK, A. RACK!L and R . J . BING, Brain Res . 208,35 (1981) .130. C. T. W. MOONEN, J. PEKAR and P. C. M. VAN Zin, Book rfAbsiracts: .Soc. ofMagn. Resort in Med . 1990
p 384, Berkeley, CA (1990) .131. K. D. MERBOLDT, H . BRUHN,1. FRAHM, M. L . GYNGELL, W. HANtcKE andM. DEIMLtNG, Maim . Rexon . Med.
9,423 (1989) .132 . 1. S . TsunuDA, W. M . CREW, M. E. MOSELEY and D. NORMAN, Amer. J. Nearoradial. 11, 925 (1990) .133. T. L. CHENEVERT, J, A . BIwNBFRC and J . G . PIPE, Radiology, in press (1990),134 . P . MANSFIELD, J. Phys. C: Sol. State Phys. 10 . L55 (1977).135. R. R. RzEDZIAN, M . DOYLQ P. MANSFIELD et al. Lower, (B), 1281 (1983),136. D. LE BIHAN and E . BRETON, C.R. Acad. Sci . [11] 15, 1109 (1985).137 . 13 . LE BRIAN . R. TURNER and J. PEKAR, J. Magn . Reson. Imaging 1, (1991) .138. C. H . LORENZ, D . R . PICKENS, D . B . PUrFER et al., Radiology 173(P), 190 (1989).139 . D. L . JOLGREN, C. H. LORENZ, J . L . CREASY et al ., Radiology 173(P), 190 (1989).140 . D. R. PICKENS, lL R. PRICE, D. B. PUFFER et al ., Magn. Resort Imaging 8(1), 29 (1990).141. D. LE BIHAN, C. T . W . MOONEN, P. C. M. VAN 2uL, J. PEXAR and D. DESPRES, Bank ofAbstracts,. Soc. of
Magn. Resort. in Med. 1989 p. 1051, Berkeley, CA (1989):142 . H. E . AVRAM and L. E. CROOKS, Book of Abstracts: Soc . of Magn. Reson. in Med. 1988 p. 980, Berkeley, CA
(1988).143 . R. Tuna and D. LE BIHAN, J . Magn . Rexon . 86, 445 (1990) .144. R. TURNER, D. LE BIHAN, J. DELANNOY and J . PEKAR, Book ofAbstracts: Soc . ofMagn. Resort. in Med. 1989
p. 139, Berkeley, CA (1989).145. M. DEIMUSO,H MOLLER and G . LACn, Book ofAbsrracrz Soc. of Magn . Rexon. in Med . 1990 p .387, Berkeley,
CA (1990)_146. W. H. PERMAN, M. GAUO and J, C . SANDSTROM, Book ofAbstracts : Soc. ofMagn . Resort in Med. 1990 p . 309,
Berkeley, CA (1990).147 . R. R. EDELMAN and D . J. ALMNSON, Book ofAbstracts : Soc. of Magn . Resort . in Med. 1990 p. 1285, Berkeley,
CA (1990).148 . K. D . MERBOLOT, W. HANICKE, H . BRUHN, M. L . GYNGELI. and J. FRAHM, Book of Abstracts: Sac . ofMagn,
Rexon. In Med. 1990 p. 1286, Berkeley, CA (1990).149. N. FIDrTA, K . HARAI]A, K . SAKIIRAI, T. MURAKAMr, S. W . Kim, Y . AKAI and T. KoZCKA, Book ofAbstracts:
Soc . of Magn. Reson in Med . 1989 p. 907, Berkeley, CA (1989) .150. N. FunTA, K . HARADA, K. SAKURAT, Y . AKAI, K . NAKANISIII, S. W . KIM and T. KOZUKA, Book of Abstracts:
Soc. ofMagn. Rexon . in Med. 199(1 p. 315, Berkeley, CA (1990) .151 . J. H. MALI, G. P. Corms and G . A. JOHNSON, Radiology 169(P), 155 (1988).152 . J. H. MART, J. R. MACFALL and G. A . JOHNSON, Magn. Resort Med . 17,95 (1991).153 . C. B, AHN, S. Y . LEE, 0. NALCIOGLU and Z. H . (:No, Med. Phys . 14, 43 (19871.154. S. DUEWELL, R. WCMRrcH, A. Bu", C . VON WEYMARN Rod G . VON SC,HULTHESS, Magn. Resort . Med . 14,14,347
(1990).155 . A. N . GARROWAY, J. Phys. U : Appl. Phys. 7, 159 (1974).156. T. GROVER and J. R. SINGER, J. Appl. Phys. 42, 938 (1971) .157. T. W. REDPATH, D. G. Noiuus, R. A. JONES and J. M. S . HuTCHISON, Phys . Med. Biol. 29,891 (1984).158. D . A. FEtNBERG, Book of Abstracts. Sac . of Magn. Resort . in Med. 1985 p . 112, Berkeley, CA (1986) .159 . D. A. FEINBERG and A. S . MARK. Radiology 161(P), 152 (1986).160. L R. YOUNG, A. S . HALL, D. J . BRYANT, D . G. T. THOMAS . S . S . GILL . M . S . DuBowrrz, F. COWAN and J . M .
PENNOCK, J. Camput . Assr . Tomogr. 12, 721 (1988).161 . 1. R. YOUNG, G. A . CoUTTS, D . J. BRYANT and G. M . BYDDER, Magn . Resort Med . 10, 349 (1989) .
132
R . TURNER and P . KELLER
162. D. A. FFINBERG and A, S . MARK, Radiology 163, 793 (1987).163 . K. R . THULDORN, J . C. WATERTON, P. M. MATTHEWS and G. K. R.ADDA, Bircheni. Biophys. Ada 714,265
(1982) .164 . R. A . BROOKS and G. DI CHIRO, Med. Phys. (4, 903 (1987).165 . S. M.AJUMDAR and J. C. CORE, J. Magn. Reson . 78.41 (1988).166 . A . HAASE, A. J . FRAHM, J. D, MATTHAEI D, W. HANICKE W and K-D. MERBOLDT, J . Magn. Reson . 67,258
(1986).167 . M. DOYLE, R TURNER, M. CAWLEY, P . GLOVER, G. K. MORRIS, B . CHAPMAN, R. J. ORDIDGE, R. CoxoN,
R. E . COUPLAND, B. S. WORTHINGTON and P. MANSFIELD, Lancet .i), 682 (1986) .168 . G. N. STEWART, J. Physiol. 15,1 (1894) .169 . A . VILLRINOER, B . R . ROSEN, J. W. BELLLVEAU, J . L . ACKERMAN, R. B. LAUFFER, R. B. BUXTON, Y-S . CHAO,
V. J . WEDELN and T. J . BRADY, Magn, Reson. Med. 6,164 (1988).170 . B. R ROSEN,1. W. BELLLVEAU and D. CHIEN, Magn . Reson. Quart. 5, 263 (1989).171 . C. R . FISEL, 3. L. ACKERMAN, R . B. BUXTON, L. GARRIDO, J. W. BELLIVEAU, B. R . ROSEN and T. 1. BRADY,
Magn. Reson. Med., in press .172 . P. GILLIS and S. H. KOENIG, Magn . Reson . Med. 5, 323 (1987).173 . M . E . MOSELEY, D. L. WHITE, M. WANG, K . ROTH, J. DUPON and R. C . BRASCH, Proc. 27th Anna. Meet. Amer.
Soc . Neuroradiol. Orlando . FL, 1989. Boston : American Society of Neuroradiology (1989).174. T. A. KENT,M. J. QUASr, B, J. KAPLAN, A. NAJAFI, E. G. AMPARO, R . M. GEREDON, F. SALINAS. A. D. SurrLE,
D. J. DIPETTE and M . M. EISENBERG, AJNR 10, 335 (1989) .175. A. VILLRINGER, B . R. ROSEN, R. B. LAUFFER, J. L . ACKERMAN, V. J . WEDEEN, R. B. BUXTON and T. J . BRADY,
Book of Abstracts: Soc. of Magn. Resort. in Med. 1986 p . 21, Berkeley, CA (1986).176. 1. W. BEWVEAU, H. L. KANTOR,1. L. PNKErr, R. P. RZEDZIAN, E. BERLINER, P. BEAULIEU, F. S. BUONANNO.
T. J. BRADY and B. R . RosEN, Book of Abstracts : Soc . ofMagn. Reson. in Mod. 1988 p. 222. Berkeley, CA (1988) .177. 1. W. BELLLVEAU, R. M. MCKINnY, D. N. KENNEDY, J. M. VEVEA, G. SORENSEN, C. R. FISEL, B. JENKINS,
H. L. KANTOR, L. L. PYKETT, R. R. RzEDZIAN, T. J. BRADY and B. R. RosEN, Book ofAbstracts Soc . ofMagn .Reson. in Med. 1989 p . 63, Berkeley, CA (1989) .
178. M. K. STEHLING, P. BULLOCK, J . L FIRTH, A. M. BIAMiKE, R. J . ORDIDGE, R CoxoN, P. GIBBS andP. MANSFIELD, Book of Abstracts : Soc . ofMaya Reson . in Med. 1989 p 358, Berkeley, CA (1989).
179. H . L. KANTGR . R. R. RZEDZIAN, 1 . L. PYKErr, E, BERLINER, T. J . BRADY and R . B. BUXTON, Book of Abstracts :Soc. of Magn. Reson. in Med. 1988 p. 246, Berkeley, CA (1988).
180, O. SAKURADA, C . KENNEDY, J. JEHLE, J. D . BROWN, C, CARBIN and L . SOKOLOFF, Am. J . Physiol.234, H59(1978).
181. 1. W . BELLLVEAU, B. R. ROSEN, D . BETTERIDGE, D. N . KENNEDY, J. M . VEVEA, K. A. JOHNSON and T. J. BRADY,Book ofAbstracts: Soc. of Mayn. Resort. in Med. 1990 p. 181, Berkeley, CA (1990).
182. D. LE BIHAN,R TURNER, N. PATRONAS and P . DouEK, Book ofAbstracts : Soc . ofMagn. Reson, in Med. 1990p. 317, Berkeley, CA (1990).
183 . J. H. GREENBERG, A . ALAVL M . REIVICH, D. KUHL and B . UZZELL, Cite. Res. 41324 (1978).184. B. R. ROSEN, J. W . BELLLVEAU, J . M . VEvnA and T. J . BRADY, Magn. Resort Med. 14, 249 (1990).185 . R TuaNEK, Relaxation 7Brles . Bimonthly Newsletter, 6.4 GE NMR Instruments, Applications Dept, 255
Fourier Avenue, Fremont, CA 94539 (1989).186 . D. L . WHITE, M. F. WENULAND, K . P . AICaft, A . A . Tz1KA and M . E . MOSELEY, Book ofAbstracts Soc, of
Magn. Reson . in Med. 1990 p. 57, Berkeley, CA (1990).187. M. RUDIN and A . SAU rEK, Book of Abstracts : Soc. ofMagn . Reson. In Med. 1990 p . 1288, Berkeley, CA (1990).188 . J, A, FRANK, D . DOUDET, R. SAUNDERS, T . ALGNER, S. W. INSCOE, J . L . BLACK, S. ROCKLAGE and S . QUAY,
Book of Abstracts: Soc . of Magn . Reson. in Med . 1990 p . 188, Berkeley, CA (1990) .189. N. A. LASSEN, D, H. INOVAR and F. SKINHa, Set. Am. 239, 50 (1978) .190 . S. OGAwA, T-M. LEE, A. S. NAYAK and P. GLYNN, Magn . Reson. Med. 14,68 (1990).191 . R TURNER, D. LE BIHAN, C. T . W . MOONEN and L. K . HEDGES, Book of Abstracrs Soc. ofMagn . Reson . in
Med. 1990 p . 316, Berkeley, CA (1990).192 . J. A . DETRE, J . S . LEIGH, D. S . WILLIAMS and A . P. KoRETSKV, Book of Abstracts: Soc. ofMagn. Reson. in Med,
1990 p. 1289, Berkeley, CA (1990).193. N- M. BOLAS, A . J . PETROS, D. BEaun and G . K . RADDA,Book ofAbstracts : Soc. ofMagn . Reson . in Med. 1985
p. 315, Berkeley, CA j1985).194 . R. L. GRUBa, M. E. RAICHLF, 1 . . O . EICHLING and M . M. TER-POGOSSIAN, Stroke 5,630 (1974).195 . S. . ELEFF, M. SCHNALL . L . LIGETI, M . OSBAKKEN, H. SUBRAMANIAN, B . CHANCE andJ. S. LEIGH, Malta. Reson.
Med . 7 1 412 (1988).196. W . D. OBRIST, H, K, DiOMPSON, H . S. WANG and W . E. WILKINSON, Stroke 6, 245 (1975) .197 . J. R. EWING, C . A. BRANCH, M . B. SMITH, J. HELPERN and K . M. A. WELCH, Book ofAbstracts: Soc. ofMagn.
Reson, in Med. 1987 p. 649, Berkeley, CA (1987).198 . J. R EWING, C. A . BRANCH, L A. HELPERN, M, B, SMITH, S. M. BUTT and K. M. A. WELCH. Stroke 20, 259
(1989) .199 . J. R. EwiNu, C. A . BRANCH, S. C. FAGAN, J . A . HELPERN, R T. SIMIUNB, S . M. Burr and K. M . A . WELCH,
Stroke 21, 100 0990) .
Angiography and perfusion measurements by NMR
133
200. D . BARRANCO, L. N. SUTTON, S. FLORIN, J. GREENBERG, T. SINNWELL, L . LiGEri and A. C . MCLAUGHLIN,J . Cerebral Blood Flow Metab. 9, 886 (1989).
201 . D. S. WARNER, N. F. KASSELL and D. I . BGARINI, Cerebral Blood Flaw. Physiologic and Clinical AspectsEd. L H. WOOD pp. 288-298, McGraw Hill Inc ., U.S.A. (1987)t
202 . L. LIGETI, P. C. M. VAN ZIIL, T. SINNWELL, J. ALDER, A . S CHESNICYC C. T. W. MaoNEN and A. C .MCLAUGHLIN, Book of Abstracts: . Nor . ofMagn . Resort. in Med . 1990 p . 572, Berkeley, CA (1990)
203 . J. R . EwiNG, C. A . BRANCH, I. A. HELPERN and K M. A . WELCH, Book ofAbstracts : Soc. ofMagn. Resortmin Mad. 1989 p. 106, Berkeley, CA (1989).
204. C . A. BRANCH, J . A. HELPERN, L R EWING, R . J . ORDIDGE and K. M. A. WELCH, Book of Abstracts : Soc. ofMagn. Resortm in Med. 1990 p. 240, Berkeley, CA (1990) .
205 . J . J. H . ACKERMAN, C. S EWY, N . N . BECKER and R. A SHAL Wrrz, Proc. Narn . Acad. Sci. U .S.A. 84,409R (1987) .206. S-G . KIM and J. J . H . ACKERMAN, Maya Resom. Med. 8, 410 (1988).207 . T. R, WALSH, J . A . DETnE, L SIMPuCEANU, C. Ho and A. P. KORETSKY, Book of Abstracts: Soc . of Magn .
Resortm in Med. 1989 p. 566, Berkeley, CA (1989).208. M . D. MITCHELL, M . DSBAKKHN, C . DUSKA, 1 . PONOMARENKO, A. ZHANG, A . MAYEVSKY and B . CHANCE,
Book ofAbstracts : Soc. of Maga Resort, in Med . 1989 p. 40, Berkeley, CA (1989).209. J . B . L. McDouALL and I. L EvELHOCH, Cancer Res. 50, 363 (1990).210. S . MULLER and J. SEELIG, J. Magn. Resort. 72,456 (1987}.211 . C . S . Ewy, I. J. H. ACKERMAN and R. S. BALABAN, Magn . Resort. Med. 8,35 (1988) .212. J . A . DBTRE, V. H . SuBRAMANIAN, M. D. MITCHELL, D. S. SMITH, A. KoaAYAsin, A. ZAMAN and I. S . LEIGH,
Magn. Resort . Med . 14, 389 (1990) .213 . T. ARAI, S. NAKAO, K. Mo n K. ESHIMORI,1 . MORISHIMA, T. MIYAZAWA and B. FRITZ-ZIEROTIr, Biochem .
Biophys. Res. Commun. 169,153 (1990).214. A . L . HOPKms and R G . BARR, Magn. Room Med . 4,399 (1987}215. H. N. YEtNG and A. H . LENT, Maya Resort. Med. 5, 87 (1987).216. A. L. HOPKINS, E. M. HAACKE, J. TKACII, R. G. BARR and C . B. BRATTON, Magn . Resort. Med. 7,7,222 (1988).217. S . E . LASKER, P . GuPTE and T . ARAI, Book of Abstracts: Soc . ofMaga Resortm in Med. 1990 p. 1202, Berkeley,
CA (1990).218. A . L. HOPKINS, E. M . HAACKE, W. D. LLST. P. A. WIEBOLSKI, R. C . BARR and C B. BRATrON, Book of
Abstracts: Soc. ofMagn. Resort . in Med. 1990 p. 236, Berkeley, CA (1990) .219. A . C . MCLAUGHLm, personal communication.