Embed Size (px)
Citation preview

Saïd Business School
Research Papers
Saïd Business School RP 2015-2
The Saïd Business School’s working paper series aims to provide early access to high-quality and rigorous academic research. The Shool’s working papers reflect a commitment to excellence, and an interdisciplinary scope that is appropriate to a business school embedded in one of the world’s major research universities. This paper is authorised or co-authored by Saïd Business School faculty. It is circulated for comment and discussion only. Contents should be considered preliminary, and are not to be quoted or reproduced without the author’s permission.
Angels and Venture Capitalists: Substitutes or
Complements?
Thomas Hellman Saïd Business School, University of Oxford; Sauder School of Business, University of British Columbia
Paul Schure University of Victoria
Dan Vo Sauder School of Business, University of British Columbia
February 2015

Electronic copy available at: http://ssrn.com/abstract=2602739
1
Angels and Venture Capitalists:
Substitutes or Complements?
Thomas F. Hellmann *
Said School of Business, Oxford University and NBER
Paul H. Schure
University of Victoria, Department of Economics
Dan H. Vo
Sauder School of Business, University of British Columbia
February 2015
We would like to thank the Investment Capital Branch of the Government of the Province of British
Columbia, and in particular Todd Tessier and Clint Megaffin, for allowing us to analyze the BCICP
data. We are grateful for the comments we received from Ajay Agrawal, Pascal Courty, Jean de
Bettignies, Josh Lerner, Antoinette Schoar, Veikko Thiele, Rick Townsend, seminar participants at
Oxford University, Queens University and the University of Victoria, and conference participants at
the 2012 and 2013 NBER Conferences on Changing Financing Market for Innovation and
Entrepreneurship (Boston, MA and Half Moon Bay, CA) and the 2013 Conference of the Canadian
Council for Small Business and Entrepreneurship, and the First European Workshop on
Entrepreneurship Economics (2013, CEPR, Amsterdam). A special thank you goes to Dylan Callow,
Aydin Culhaci, Arif Khimani, Karen Robinson-Rafuse for their immense energy in helping us with
the data and managing teams of students at the University of British Columbia and the University of
Victoria. Hellmann and Schure are grateful for the financial support of the Social Sciences and
Humanities Research Council (SSHRC). Schure thanks the Netherlands Institute of Advanced Studies
in the Humanities and Social Sciences (NIAS) for their generous support and facilities during his
fellowship in fall 2014. All errors are ours. Updated versions are available at
http://www.sbs.ox.ac.uk/community/people/thomas-hellmann.
* Corresponding author.

Electronic copy available at: http://ssrn.com/abstract=2602739
2
1. INTRODUCTION
Equity financing of entrepreneurial start-ups has traditionally been equated with venture
capital (VC henceforth), but the importance of angel investors is increasingly recognized. An
OECD report from 2011 notes that “While VC tends to attract the bulk of the attention from
policy makers, the primary source of external seed and early-stage equity financing in many
countries is angel financing not VC” (OECD 2011, p.10). This same report estimates that the
total angel market is approximately the same size as the VC market, an estimate in line with
earlier studies (e.g. Mason and Harrison, 2002; Sohl, 2003).
How does angel financing interact with VC financing? Two opposing points of view
seem to have emerged among practitioners. The first view sees angels and VCs as synergistic
members of a common financing ecosystem. They have different skills and networks, not to
mention different levels of amounts to invest. Companies benefit from the combination of
these attributes. Marc Andreessen, venture capitalist and founder of Netscape, for example
notes that “[…] to get the best introductions to the A stage venture firms is to work through
the seed investors […]” (Sanghvi, 2014). A common view is that angel financing is a
“stepping stone” to obtaining venture capital. Benjamin and Margulis (2000) note: “Angel
investment runs the critical first leg of the relay race, passing the baton to VC only after a
company has begun to find its stride.” The examples of Google and Facebook powerfully
illustrate this stepping stone logic.
The second view sees angels and VCs as alternative financing modes that do not mix
well. They are competing approaches for financing companies, where companies that obtain
funding from one type of investor are more likely to stick to that investor type. This could be
because certain company attributes lend themselves to one type of financing, and/or because
investors guide their companies towards staying within their investor type. Michael
Arrington, founder of Tech Crunch, notes in a blog entitled “VCs and Super Angels: The War
3
For The Entrepreneur”: “Pick the wrong investor and you’ve closed the door on others.
You’ll never even know why it happened, but it will.” (Arrington, 2010)
In this paper we empirically examine the relationship between angel investors and
venture capitalists (VCs). Our research question concerns the dynamic investment pattern of
start-ups, and we ask whether companies that obtained angel financing are subsequently more
or less likely to obtain VC funding, and vice versa. We specifically test the “complements
hypothesis”, which suggests positive dynamic interactions between angel and VC financing,
against the “substitutes hypothesis”, which suggests a negative dynamic relationship.
The biggest obstacle to researching angel investments has been access to credible and
systematic data. We collect data related to a government program in British Columbia,
Canada (BC), where tax credits are available not only to VC firms but also to angel investors
(Government of British Columbia, 2014; Hellmann and Schure, 2010). The regulatory filings
under BC’s Investment Capital Program offer a unique opportunity to obtain systematic and
detailed data on both angel and VC investments. A useful feature of this dataset is the
availability of documents that list all the companies’ shareholders over time, which allows us
to construct detailed and comprehensive financing histories of start-ups. Our data includes
469 starts-up that were funded over the period 1995-2009.
Our analysis utilizes the dynamics in the data, asking specifically how prior
investments relate to subsequent investment choices. Our regressions contain a rich set of
controls, including company characteristics and a variety of time clocks. First, we find strong
evidence for dynamic persistence within investor types. A company that already obtained
funding from one particular type of investor is likely to raise more funding from investors of
the same type. This effect is not driven by repeat investments of existing investors, which are
deliberately removed from the analysis. Second, we find significant negative dynamic effects
between angel and VC financing. Companies that obtained more angel financing in the past

4
are less likely to subsequently obtain VC funding; and vice versa. These main findings are
robust to multiple model specifications.
The observed pattern of dynamic substitutes could be due to selection or treatment
effects, both of which have interesting economic interpretations. We think of selection effects
as a manifestation of a “company-led logic”, where companies have unobservable
characteristics that make them better suited for one type of investor over the other. We think
of treatment effects as a manifestation of an “investor-led logic”, where investors influence
companies raising more funding from their own type. To empirically separate selection and
treatment explanations we exploit exogenous variation in the tax credit program that affects
the relative availability of angel and VC financing. Our IV estimations suggest that both
company-led and investor-led effects contribute to the dynamic substitutes pattern.
Specifically, we find that exogenous increases in the availability of angel financing lead to
less subsequent VC financing. However, exogenous increases in the availability of VC
financing do not lead to less subsequent angel financing.
A potential concern about the substitutes pattern we find is that it is generated by poorly
performing companies that initially raise angel financing, and then continue to rely on further
angel financing, because they are not good enough to ‘graduate’ to the VC stage. Under this
view the stepping stone logic only applies to the best companies (the ‘Googles and
Facebooks’), and not the potentially much larger set of struggling companies. To empirically
test this more refined version of the stepping stone hypothesis we examine how the dynamic
substitutes pattern varies with company performance. Measuring performance in private
companies is always challenging. We follow the prior literature by focusing on exit
outcomes, that is, whether companies eventually had a successful exit (IPO or acquisition),
stayed alive, or failed (e.g. Phalippou and Gottschalg, 2009). We find that VC funding is
associated with better exit outcomes. However, the negative effect between angels and VC

5
funding does not change across the three performance categories, which is inconsistent with
the stepping stone hypothesis and its refined version.
A unique strength of our data is that it allows us to distinguish between different types
of angels. We classify angels into three types, ‘casual angels’ who only invest in a single
company; ‘serial angels’ who invest in multiple companies and are likely to be more
committed to angel investing; and ‘angel funds’ that combine the funding of multiple angels
into an investment vehicle. We find that the negative interaction pattern between angels and
VCs applies to casual angels and angel funds, but not to serial angels. This suggests, first of
all, that heterogeneity within the angel community matters, and, secondly, that serial angels
are less disconnected from the VC community than other types of angels.
The academic literature on angel financing remains underdeveloped. The paper closest
to our is Goldfarb et al. (2012), who make use of a unique dataset from a bankrupt law firm
that contained term sheets from client firms, some of which obtained angel and/or VC
financing. They show that VCs obtain more aggressive control rights than angel investors.1
They find a negative performance effect of mixing angel and VC funding, and argue that this
is driven by split control rights, where neither angels nor VCs have firm control over the
companies’ board of directors. Our analysis complements the work of Goldfarb et al. (2012)
in several important ways. For each company they only have a single snapshot of one
financing round and therefore mainly consider syndicated investment where angels and VCs
invest in the same round.2 We examine the full dynamic relationship between angel and VC
funding. We also exploit exogenous variation in tax credits to address identification issues,
and we are able to make finer distinctions amongst different types of angel investors.
1 This finding is consistent with what we know about VCs (e.g. Kaplan and Strömberg, 2003) and other research
on angel investors (Van Osnabrugge and Robinson (2000) and Wong (2010)).
2 Interestingly, our data also suggests that syndicated angel-VC investments are somewhat rare. In our sample
only 7% of all financing rounds involve syndication between angels and VCs.

6
Kerr et al. (2014) examine data from two angel funds that keep track of which
companies presented in front of the group, and which companies actually received funding.
Using a regression discontinuity approach, they find evidence that obtaining angel funding
affects the companies’ growth and survival rates. While they have more detailed evidence on
the investment decisions of angel investors, they can only look at a specific part of the angel
community, namely those associated with angel networks. They also do not consider the
interrelationships between angels and VCs. In a related vein, Bernstein, Korteweg and Law
(2014) perform some randomized online experiments on Angellist, an electronic investment
platform, showing that inexperienced angel investors react differently to information than
more experienced angel investors.
Hellmann and Thiele (2014) provide a theory that explicitly models the interaction
between angels and VCs. In their model companies want to proceed from angel to VC
funding. VCs may use their market power to squeeze out angel investors, which in turn
encourages angels to seek out alternative exit routes. A key insight from the theory is that the
bargaining dynamics between angels and VCs may determine whether the relationship is one
of complements or substitutes.
Two more papers provide further useful theoretical foundations for comparing angels
and VCs. Chemmanur and Chen (2006) assume that VCs add value but angels do not. Their
model explains why entrepreneurs might want to first obtain angel financing before switching
to VC. Schwienbacher (2009) assume that both angels and VCs can add value, but that only
VCs have enough money to refinance a deal. Under his set-up, angels endogenously provide
more value-adding effort, because of the need to attract outside capital at the later stage.
The VC literature is much larger than that on angel investors. Da Rin, Hellmann and
Puri (2012) provide a comprehensive survey of that literature. Closest to this paper are the
literatures on staged financing (Gompers, 1995; Tian, 2011) and independent versus

7
corporate venture capital (Chemmanur, Loutskina and Tian, 2014; Fulghieri and Sevilir,
2009; Hellmann, Lindsey and Puri, 2008). Furthermore, our work is related to Ozmel,
Robinson and Stuart (2013), who examine the dynamic interactions between VC financing
and strategic alliances.
The remainder of this paper is structured as follows. Section 2 discusses data sources
and variable definitions. Section 3 examines the main model of the dynamic financing
patterns across different investor types. Section 4 examines several empirical extensions. It is
followed by a brief conclusion.
2. DATA AND VARIABLES
2.1. Data sources
Our primary data source is the Government of British Columbia, who administers the British
Columbia Investment Capital Program (henceforth BCICP). The core of the program is a
30% tax credit for direct or indirect investments in eligible BC entrepreneurial companies
(details in the next subsection). Our analysis hinges on a unique feature of the BCICP that
this 30% tax credit applies to investments by both angel investors and venture capitalists.
Sandler (2004) shows that most North-American public policy initiatives target formal
venture capital, rather than the angel segment of the market.
Our BCICP dataset contains detailed company and investment activity information. Of
particular importance for our analysis are the companies’ share registries, which contain the
entire history of the individual share purchases in the company. The share registry data
contains both investments supported by the BCICP and those that are not.
We augmented the BCICP data using several additional data sources. First, these
sources helped us classify investors into types. Investors do not only include angels and
venture capitalists, but also other financial parties, corporations, and smaller groups such as
universities, charitable organizations, etc. Details will be given later on. Secondly, as we are

8
interested in how companies evolve and perform after their initial registration with the
program, we collected company exit and survival data from several additional data sources:
the BC company registry; the federal company registry (“Corporations Canada”); Capital IQ;
ThomsonOne (VentureXpert, SDC Global New Issues and SDC Mergers and Acquisitions);
Bureau Van Dijk (a data provider that collects private company data – for Canada, the main
source of the Bureau Van Dijk data comes from Dunn and Bradstreet); SEDAR, which
contains the record of filings with the Canadian Securities Administrators of public
companies and investment funds; EDGAR (filings with the SEC); and the Internet (using
mostly Google searches and an internet archive called the Wayback Machine
(http://archive.org/web).
2.2. The British Columbia Investment Capital Program (BCICP)3
The core of the BCICP was established in 1985 under the Small Business Venture Capital
Act of British Columbia. By the end of our sample period in 2009, the BCICP has four
segments that all offer a 30% tax credit for BC investors that invest in eligible entrepreneurial
companies. Eligible companies are BC-based companies that, at the moment of registration
and together with affiliate companies, if any, no more than 100 employees; pay at least 75%
of the wages and salaries to BC employees; and operate in an eligible industry.
Two segments of the BCICP primarily target angel investors. The first consists of tax
credits for investments in funds called VCCs, for Venture Capital Corporations, as the
program requires the investment vehicles to be structured as corporations.4 VCCs can only
invest in eligible small businesses and can only raise money from BC-based “eligible
3 Section contains a selective summary of the program. Further detail can be found in Hellmann and Schure
(2010), Lerner et al. (2012), and Government of British Columbia (2014).
4 The name ‘Venture Capital Corporation’ is slightly misleading, as these funds are not open to institutional
investors, but instead are only meant for private individuals. Consequently they should be thought of as angel funds. Note, however, that there are also different types of VCCs that are explicitly structured as venture capital funds for retail investors. As discussed below, we classified those as (government) venture capital funds.

9
investors”. For individual investors this means they need to satisfy some qualified investor
criterion (based on wealth, earnings, or “sophistication”), or else demonstrate to have a prior
acquaintance with the VCC fund managers (either based on a family relationship or
professional contacts.)
The second segment of the program is called the EBC program which was introduced
in 2003. It consists of tax credits for direct investments of BC-based eligible investors into
entrepreneurial companies called Eligible Business Corporations. This program is
administratively much simpler for angels than the VCC program since there is no need to set
up an investment vehicle. Indeed, the EBC program was intended to reach out to a wider set
of angels. Eligible investors, including angels, can simply claim the 30% tax credit on the
basis of an investment in an EBC.
The other two segments of the BCICP promote venture capital investments made by
what we call retail funds. The two retail fund programs are very similar. Retail funds have the
permission to approach investors from the general public. Individual investors receive again a
30% tax credit for investments into retail funds. The retail funds have an obligation to invest
the funds they attract within a specific time frame. The two retail fund programs differ in how
they are funded. In the so-called Labour-sponsored venture capital program, the BC and
federal governments equally share the costs, while in the so-called provincial retail venture
capital program the BC Government fully funds the tax credits.
2.3. Companies and investment rounds
Our analysis focuses on the time period of Jan 1995 to March 2009 and we have information
on all companies that registered under the BCICP in this period. Given our interest in
dynamic investment patterns we use financing rounds as our fundamental unit of analysis.
Below we first describe how we obtained our investment transactions and how we define
10
what constitutes a financing round. We will then present some descriptive statistics on the
company sample.
There are three sources for our transactions data. Our most important source is the
collection of share registries that give the histories of all share purchases in the company.
These transactions include investments supported by the BCICP, but also many non-BCICP
supported ones. We often have complete transaction data for the share-registry data (date,
type of share, investor, quantity, price), although at times we miss share prices. The other
sources for our transactions are the BCICP database and Venture Xpert, which we use to
augment the share-registry data in case they cover additional time periods not covered by the
share registries. For the BCICP database we have full transaction data if investments are
made by individual investors, and we have invested amounts in case investments are made by
vehicles (VCCs).5 Transactions found in Venture Xpert can cover both BCICP and non-
BCICP supported investments by mainly venture capitalists. For the Venture Xpert data we
only observe the identity of the investor and the invested amount.
As part of compensation, founders and other company insiders sometimes receive the
opportunity to purchase shares in their companies at deeply discounted values (“sweat
equity”). Investors can also buy shares at discounted prices, possibly because they may have
acquired warrants. Our analysis aims to detect the dynamic logic behind investments in
companies, rather than compensation issues. We therefore remove all sweat equity
transactions. Specifically, we remove all transactions in which shares were acquired for $0.01
or less, as well as those for which we observed the shares were acquired for 10% or less of
the share price paid by other investors in the same round.
5 For investments that are only covered by the BCICP database we miss out on investments made by out-of
province investors as well as BC investors that do not take advantage of the tax credits, either because they don’t want them, or because they already received tax credit up the maximum allowance under the program.
11
We assume that all investments made in the same quarter are part of the same financing
round. When companies raise funds during a time span that crosses two or more quarter
boundaries, we adopted the following rule regarding the definition and timing of the
financing round. The time-stamp on a round is the quarter in which the first of a series of
investments takes place. Subsequent investments are considered to be part of the same round
if they take place within ninety days of a prior one.
Our empirical analysis focuses on investment dynamics, so we require a company to
receive a minimum of two financing rounds. The procedure described above yielded 18,925
investments made by 9424 unique investors in 469 companies. The investments comprise
2168 financing rounds. All 469 companies attracted at least some funds supported by the
BCICP in one of their financing rounds.
2.4. Investors
There is no universally accepted definition for what exactly an angel investor is, and how it is
different from VC.6 Conceptually we adopt the following approach: an angel investor invests
his/her own (family’s) wealth, whereas a VC invests on behalf of other fund providers. This
definition is based on a fundamental economic distinction between direct versus
intermediated financing. From a theoretical point of view, one would expect that investors
investing their own money face different incentives and constraints than investors who are
intermediaries that act on behalf of others.7 In the data we have one interesting borderline
case, namely “angel funds”. They are normally thought of as a form of angel investing,
because they aggregate the monies of private individuals. However, they also involve some
financial intermediation, in the sense they delegate the investment functions of screening
projects and negotiating terms to a small management team of lead angels. In our data the
6 This is further discussed also OECD (2011) and Goldfarb, Hoberg, Kirsch, and Triantis (2012)
7 See also Diamond (1984) and Axelson, Strömberg and Weisbach (2009).

12
funding and management structures of these angel funds are clearly distinct from those of
venture capital funds, making the empirical distinction easy. We also adhere to the received
wisdom of classifying angel funds under the angel category. Beyond angel investors and
VCs, we also identify a variety of other investors in our data set, most notably corporations
(including institutions), as well as company founders and their families.
Too classify our 9,424 investors into investor types we adopted a two-step approach. In
step 1 we separated investors into two groups, namely humans (7,823 investors) and vehicles
(1,601). Human investors are identified by having only a first and last name (i.e. there are no
additions like “Inc.”, “Company”, “Trust”, etc); vehicle investors are the remaining ones. In
Step 2 we performed several name-based matches with other data sources to classify the
investors into several investor type categories. Our principal categorization distinguishes
Angels, VCs, and Other Investors. In the tables of the paper we abbreviate these investors
types as AN, VC, and OI, respectively. For some of the analysis in this paper we use a more
granular categorization. Specifically, we subdivide the angel investor category into three
types, namely casual angels who in our dataset invest in just a single company, albeit
possibly in multiple rounds (“AN - CASU” in our tables); ‘serial’ angels who in our dataset
invest in more than one company (“AN – SERI”); and ‘angel funds’, representing investment
vehicles that are owned by more than one angel (“AN – FUND”). We subcategorize VCs into
Private VCs (“VC – PRIV”) and Government VCs (“VC – GOVT”). Finally, the Other
Investors are a diverse group, consisting on the one hand of founders, key company
employees and their family members (“OI – FOFA”), and on the other hand a wide variety of
corporate entities (“OI – CORP”). Appendix A describes the details of Step 2, in which we
mapped human and vehicle investors into the investor categories.
2.5. Descriptive statistics
13
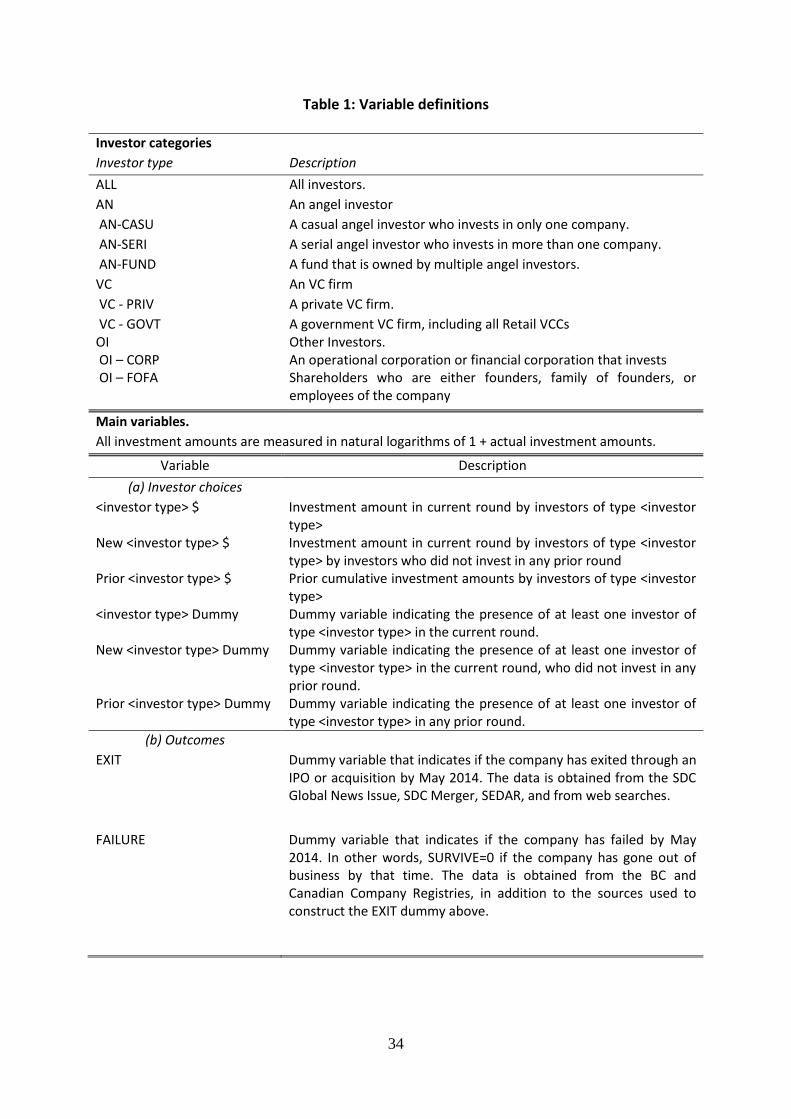
The variable description for all tables is provided in Table 1. Table 2 reports descriptive
statistics at the financing round level (Panels A-C) and the company level (Panel D). Panel A
shows that of the 2,184 financing rounds 1,491 involved one or more angels, 690 one or more
VCs, and 798 one or more Other Investors. Panel A further provides information of the sector
and region of the companies that received the funding in the rounds. We obtained this table
after manually classifying our 469 companies into industries. Our industry classification
focuses on innovative companies and is loosely based on NAICS codes. We obtained the
information on the companies’ activities from their business plans, their BCICP registration
applications, as well as internet searches. We observe that most of the BCICP companies are
active in the software industry (30%), Hi-tech manufacturing (18%) or biotech (14%). Taken
together, high-tech companies account for 80% of the companies in our data, while the other
20% of companies focus on Art, Recreation and Tourism (“Tourism”) or Agriculture,
Forestry, Fishery, Mining, Construction, or Non-high-tech manufacturing (designated for
export) (“Other”). These last two categories are eligible under the BCICP because they are
also deemed to further its main objective, namely to “enhance and diversify the BC
economy” (Government of British Columbia, 2014).
Company location is usually available through the BCICP data (from business plans,
the registration application, and/or annual filings) and we used internet searches for the
occasional company for which these documents failed us (e.g. because they reported the
accountant’s address). Our companies are concentrated in and around Vancouver – 73% of
them are located in the Greater Vancouver Regional District.8 The two smaller hubs for
innovative activities are BC’s Capital Region District (“Greater Victoria”, so to speak), and,
in the East of BC, the adjacent areas of the Okanagan and the Thompson River Valley.
8 For simplicity we also include in our GVRD definition nine companies that were located in the “Lower
Mainland”, which is the valley extending inland from Vancouver.
14
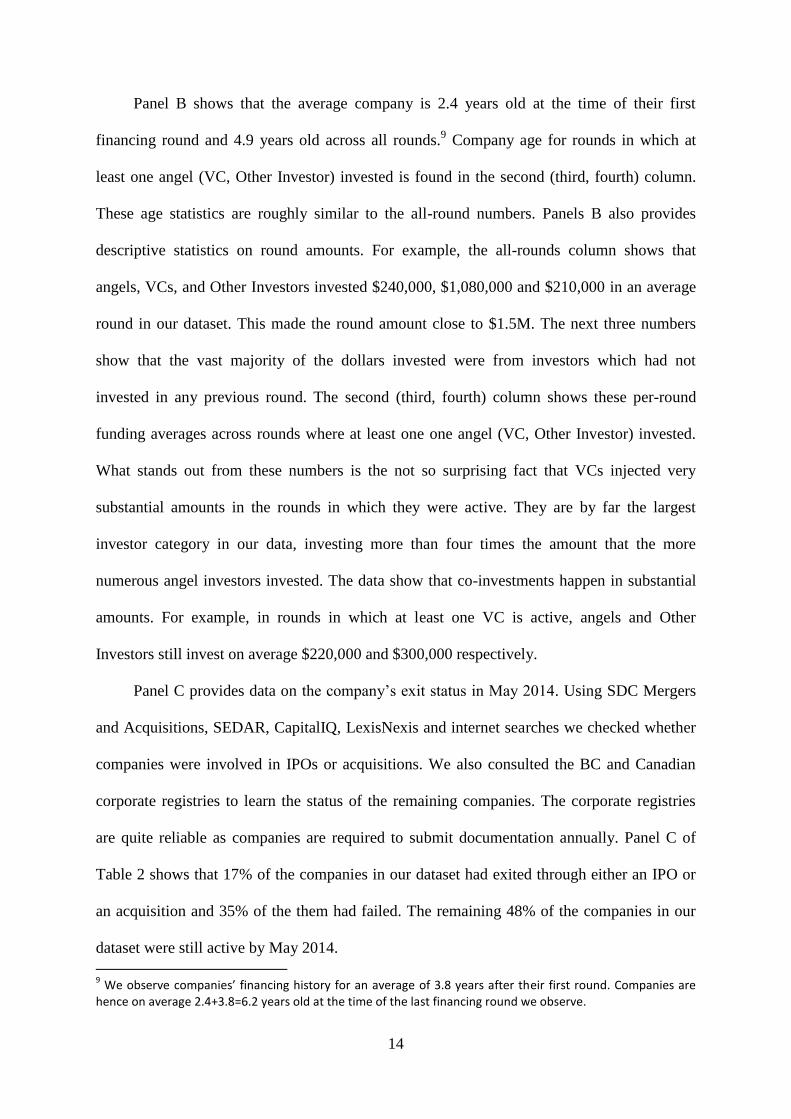
Panel B shows that the average company is 2.4 years old at the time of their first
financing round and 4.9 years old across all rounds.9 Company age for rounds in which at
least one angel (VC, Other Investor) invested is found in the second (third, fourth) column.
These age statistics are roughly similar to the all-round numbers. Panels B also provides
descriptive statistics on round amounts. For example, the all-rounds column shows that
angels, VCs, and Other Investors invested $240,000, $1,080,000 and $210,000 in an average
round in our dataset. This made the round amount close to $1.5M. The next three numbers
show that the vast majority of the dollars invested were from investors which had not
invested in any previous round. The second (third, fourth) column shows these per-round
funding averages across rounds where at least one one angel (VC, Other Investor) invested.
What stands out from these numbers is the not so surprising fact that VCs injected very
substantial amounts in the rounds in which they were active. They are by far the largest
investor category in our data, investing more than four times the amount that the more
numerous angel investors invested. The data show that co-investments happen in substantial
amounts. For example, in rounds in which at least one VC is active, angels and Other
Investors still invest on average $220,000 and $300,000 respectively.
Panel C provides data on the company’s exit status in May 2014. Using SDC Mergers
and Acquisitions, SEDAR, CapitalIQ, LexisNexis and internet searches we checked whether
companies were involved in IPOs or acquisitions. We also consulted the BC and Canadian
corporate registries to learn the status of the remaining companies. The corporate registries
are quite reliable as companies are required to submit documentation annually. Panel C of
Table 2 shows that 17% of the companies in our dataset had exited through either an IPO or
an acquisition and 35% of the them had failed. The remaining 48% of the companies in our
dataset were still active by May 2014.
9 We observe companies’ financing history for an average of 3.8 years after their first round. Companies are
hence on average 2.4+3.8=6.2 years old at the time of the last financing round we observe.

15
Panel D shows data about the investor type categorization in the three non-numbered
columns, and draws the link between investor types and funding at the company level in
Columns 1-5. The investor type categorization shows that our 9,424 unique investors consist
of 7215 Angels, 454 VCs and 1755 Other Investors. It also shows the numbers for the
subcategories, where it stands out that the bulk of the angels in our dataset are casual angels
that invest in just a single company. The third non-numbered column shows the percentage of
rounds in which at least one investor of the investor type is involved. We see that 68% of the
investment rounds involve at least one Angel Investor, 32% of the rounds one or more VCs,
and 37% of the round at least one Other Investor.
Columns 1 and 2 of Panel D reflect the first financing round of our 469 companies. We
note that 70% of the first rounds involved one or more angels, compared to 25% and 46% for
VCs and Other Investors. However, in Column 2 it becomes clear that if VCs were involved
in the first round, then they bring in an amount of $2.3M per company, much more than
Angels ($440,000) and Other Investors ($590,000). Our sub-categorization numbers show,
perhaps somewhat surprisingly, that despite their vast number, casual angels are involved in
the first rounds of merely 17% of the 469 companies, a substantially lower percentage than
for the serial angels (49%) and the angel funds (30%).
Columns 3 and 4 show the number of companies and amounts when aggregating over
all the investment rounds. Per-company average investment amounts were $7.13M. The data
confirms what we saw at the first-round level. The per-company average funding from VCs
($13.43M) is much higher than the corresponding amounts from Angels ($1.32M) and Other
Investors ($1.73M).
3. DYNAMIC FUNDING PATTERNS
3.1. Empirical specification

16
Our study of the dynamics of funding focuses on the relationship between the amount
companies receive in the current round, and the funding amount received in all rounds prior
to the current round. Thus, our unit of observation is the financing round (denoted by the
subscript r), and we follow our sample companies from their first to their last investment.
Clearly in the first financing round of a company (r=1) the prior amount received is not
meaningfully defined, so that our sample effectively begins with the second round.
Our main regression model is as follows:
Jikr = α+ βk Iik,r-1 + γ Xi + δ Xir + ηt + εikr
The dependent variable, Jikr, is the amount of funding that a company i obtains from
new investors of type k, in round r. We deliberately exclude from Jikr any funding received
from investors who already invested in a prior round. This is because we believe that our
results on the dynamic investment pattern of companies are most convincing when focusing
only on amounts invested by new investors. Existing investors who may decide to make
follow-on investments face a different decision problem than new investors. Observe also
that our regression specification does not reflect a single equation, but rather of a collection
of k equations. At the highest level of aggregation we consider the case of k=3, for Angel
investors, VCs and other investors. For example, in our main table, Table 3, Columns 1-3
reflect dollar amounts from new angel investors (AN), VCs (VC) and other investors (OI),
respectively. Column 4 considers the total funding amounts by new investors in the current
round. In section 4.3 we also consider specifications with higher values of k, disaggregating
the investor categories.
The most important independent variables are Iik,r-1, which measure the cumulative
amount of funding that company i received from investors of type k, up to round r-1. For this
we use the total amount of funding received from both new and existing investors.

17
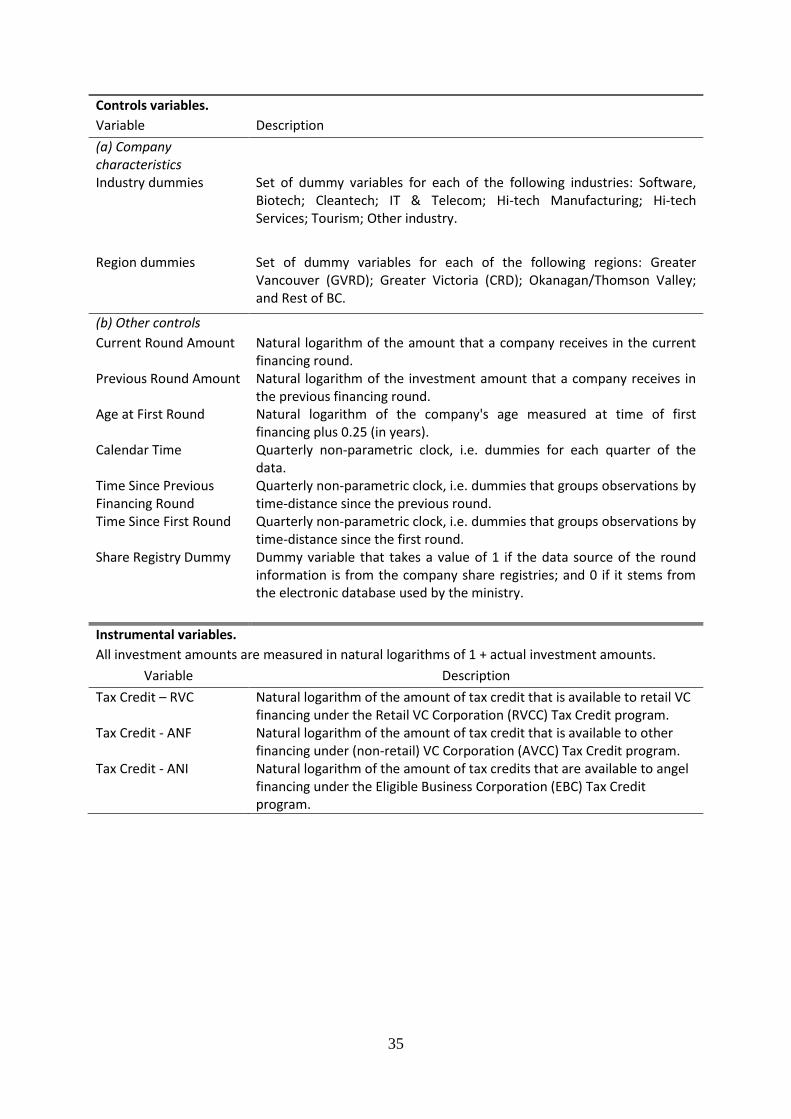
In terms of controls, Xi is the set of variables that measure all time-invariant company
characteristics, namely: company age at the time of the first round, industry and location. We
report those controls in Table 3, but omit them in all subsequent tables to save space.
Moreover, Xir is a set of variables that measure all time-variant company characteristics.
These include (i) the amount raised in the previous round, (ii) the time since the first round
(measured non-parametrically with a complete set of dummies for each quarter, starting with
the quarter when the first round occurs), (iii) the time since the last round (measured non-
parametrically with a complete set of dummies for each quarter, restarting the counter every
time a new round occurs), and (iv) a dummy control for whether the round data was obtained
from the company’s share registry (dummy = 1) or from the BCICP database and Venture
Xpert (dummy = 0). Our non-parametric time-controls are included to capture possible
independent time-varying factors, allowing us to isolate the relationship between prior and
current funding choices.10
Finally ηt are a complete set of calendar-time fixed effects. These
control for any seasonal effects, any business cycles effects, or indeed any other calendar
time effects. All our regression models use these controls, but for the sake of brevity they
remain unreported in the results tables.
Throughout the paper we use OLS regressions with robust standard errors, clustered at
the company level, and we denote these by εikr. Of course we recognize the possibility that
unobserved heterogeneity creates a possible correlation between the error term and the
dependent variable, which is commonly referred to as an endogeneity problem. In section 3.2
we first report the results without any endogeneity correction. Section 3.3 then explicitly
focuses on issue of unobserved heterogeneity.
10
Note that our specification implicitly takes care of company age, since we control for both the age at the time of first round, and a clock for time since the first round. Using a clock for company age, instead of a clock for the time since the first round, yields very similar results.

18
Panel E of table 2 reports pairwise correlation coefficients between some of the main
variables of interest at the company level. Foreshadowing the regression analysis we find
negative correlations between the various measures of angel and venture capital funding.
3.2. Results from the base model
Table 3 shows the estimation results of our base model. Columns 1-3 report the main results
concerning the relationships between investor types. We first note that the coefficients on the
main diagonal (i.e., the effect of prior financing by type k on current financing by type k) are
always positive and strongly significant at the 1% level. This suggests that companies that
have already received funding from one type of investor are likely to receive further funding
from that same investor type. Importantly, this result is not driven by repeat investors, since
our dependent variable only measures investments from new investors.
Probably the most important finding concerns the negative relationship between angel
and VC funding. If a company received more prior VC funding, it will raise less angel
funding. Conversely, if company received more prior angel funding, it will raise less VC
funding. Both these off-diagonal coefficients are statistically significant at the 1% level. This
finding suggests the existence of a separate angel and VC “tracks” in the financial ecosystem.
It is consistent with a dynamic financing pattern of ‘substitutes’ not ‘complements’.
Column 4 examines the relationship between prior funding and all new current funding.
It shows that more prior VC funding is associated with more total new funding, but that more
prior angel funding (as well as prior funding from other investors) is associated with less total
new funding. Table 3 also shows that more prior OI funding is associated with less current
VC funding, and more prior AN funding is associated with less current OI funding. Finally,
Table 3 shows some interesting and intuitive patterns for the control variables. For example,
there is less VC funding outside of the main urban centres of BC, and in certain industries

19
such as high tech services or tourism. We also find that larger prior round amounts predict
less new angel, but more new VC funding, which is in tune with the results from column 4.
We considered many permutations of the base model, and report two of the most
important ones in Table 4. First, in Table 3 the focus is on funding amounts, but we may also
be interested in the mere presence or absence of certain investor types. Such estimates are
similar in spirit to estimating transition probabilities. Panel A of Table 4 therefore estimates
the same model as Table 3, but replaces investment amounts with dummy variables
indicating presence of investor types, both for the dependent and independent variables. The
pattern of results is very similar to that of Table 3, thus indicating that the main results about
investment amounts also carry over to the presence or absence of investor types.
Second, our basic unit of analysis of investment rounds implicitly requires a company
to be raising some funding. We may also ask whether the prior presence of investors
influences the likelihood of raising new money in the first place. We therefore consider a
time-based unit of observation that also allows us to observe the absence of financing rounds.
Specifically, in Panel B of Table 4 we re-estimate the base model using company-quarters as
our unit of analysis. Note this gives us many more observations, namely the quarters in which
companies did not raise funding. Nevertheless, while some of the results for other investors
now become insignificant, our core results about the substitutes patterns between angel and
VC financing remain significant at the 1% level.11
3.3. Unobserved heterogeneity
We may ask to what extent the results so far are driven by unobserved heterogeneity. In the
introduction we mentioned two alternative explanations for a substitution pattern. One is a
company-based ‘selection logic’ where there are unobserved company characteristics that
11
As a robustness check we also reran the regression models from Table 3 and 4 using as a dependent variable the total investment amount, instead of just using the investment amounts of new investors. The results were very similar, suggesting that the inclusion of old investor amounts does not affect our main insights.

20
affect matches between companies and investors. The other is an investor-based ‘treatment
logic’ where existing investors influence the subsequent choice of investor types. We believe
that both selection and treatment constitute interesting and economically meaningful findings,
and point out that the two effects may also coexist.
The empirical challenge is to find some exogenous variation in the data that separates
these two effects. We first note that it would not be enough to consider shocks to the overall
funding availability in the market, because our research question pertains to choices across
different investors within the market. Instead we need to look for exogenous shifts in the
relative availability of alternative financing types. In an ideal scenario the government would
have differentially changed the rates at which tax credits are made available to angels and VC
investments. Unfortunately for us the rate remained fixed at 30% over time for all investors.
However, the provincial government did shift substantial amounts of tax credits across the
different program segments over the years. A noteworthy example is the introduction of the
EBC program in 2003 (see Section 2.2). We thus take an instrumental variable specification
that exploits the historic variation in the amounts of tax credit across different program
segments.
As described in Section 2.2, the BC tax credit program consists of the EBC, VCC and
Retail fund segments. The EBC segment focuses on individual angel investors, which we
abbreviate by ANI. The VCC segment focuses on angel funds, and we use the abbreviation
ANF. The Retail fund segment targets venture capital. For each of these program categories,
RVC, ANF and ANI, we observe the annual amount of tax credits disbursed.
The variable that we want to instrument for is the prior cumulative amount of funding
obtained from a particular investor type. The idea for the instrument is that the prior amount
in companies is influenced by the past availability of tax credits. Since this effect occurs over
time, we use a weighted average of our tax credits measure. Because the relevant time

21
periods are those when the company was actually fundraising, we use the company’s relative
investment amounts as weights.
Conceptually our instrument has strengths and weaknesses. It has clear theoretical
foundations, since differential access to tax credits should clearly have a direct effect on the
amount of funding provided by the alternative investor types. Empirically we benefit from the
fact that the BC tax credit involves considerable variation in the relative availability of angel
versus VC financing.
One possible concern is that the variation in the program budgets is not entirely
random. Indeed, budget changes are likely to be driven by local political considerations.
However, what matters for econometric identification is only that the variation in budget
changes is independent of companies’ expectations of future financing sources. Our
identification strategy would only be problematic if government would allocate tax credits
with an explicit intent on influencing not the current funding environment, but the future
funding possibilities that result from today’s funding choices. We submit that such foresight
would seem highly improbable, and that policies only react to current and past funding
conditions, which is consistent with our instrumentation strategy.
One potential weakness of our approach is that we can only measure the amount of tax
credit actually used by market participants. This measure is jointly determined by the amount
of tax credit offered under program, as well as the amount of tax credits that investors ask for
based on their investment decisions. Our measure may therefore incorporate not only the
supply shock that can be directly traced back to the tax credit policy, but also a broader
supply shock for the market availability of each type of financing. Following the seminal
work of Berger et al. (2005), measures of market availability are commonly used as
instruments in the corporate finance literature. This means that, even though our measure

22
combines two types of supply shocks, both of them are suitable for identifying exogenous
changes in the availability of investments across different investor types.
Panel A of Table 5 reports a typical first-stage regression, which gives an idea of the
strength of our instrument.12
It shows that an increase in the tax credits in the RVC program
is associated with significantly more VC funding, and significantly less Angel and Other
Investor funding. More tax credits in the ANF or ANI budgets, by contrast, are associated
with significantly higher Angel investments. More ANF funding is also associated with lower
VC investment amounts. To assess to overall strength of our instruments in Panel A, we
perform an F-test for the joint significance of the instruments. The instruments are jointly
significant at the 1% level for Column 1 (Angels) and Column 2 (VCs). Interestingly, they
are insignificant for Column 3 (Other Investors), which is consistent with the fact that many
of these Other Investors are not eligible for tax credits.
Panel B shows the results of the second stage regressions. The evidence suggests the
presence of both selection and treatment effects. First note that the coefficients on the main
diagonal are all smaller, and all insignificant. This suggests that there are unobserved
company characteristics that make different companies more suitable to match with different
investor types. It explains why companies repeatedly return to the same type of investor, even
when raising money from new investors. Secondly note that the coefficient for the effect of
prior VC funding on angel financing is now negative but insignificant. The economic
interpretation is that randomly adding more venture capital funding does not affect the
(already low) probability of companies returning to the angel market. Third, we find that the
effect of prior angel funding on VC remains significant and negative. This suggests that in
addition to the company-led (selection) effects, there also are some investor-led (treatment)
effects. Specifically, if a company was exposed to a positive supply shock of angel funding in
12
We report the first-stage regression for the estimation of the current angel amounts, but the results are very similar for the regressions for the VC and Other Investor amounts.
23
the past, then the company becomes less likely to raise VC financing. This finding is
consistent with the notion that angels can guide companies away from VC funding.
4. EXTENSIONS
4.1. Does the stepping stone hypothesis still apply to the best companies?
In this section we consider several extensions of the main empirical analysis. We begin by
examining whether the substitutes patterns observed in section 3 can be explained by
company performance. One might argue that the reason why many companies fail to progress
from angel financing to VC is that their underlying performance doesn’t warrant it. Put
differently, the stepping stone logic would argue that only the best companies ‘graduate’ from
angel funding to VC funding, and that the remaining ones are stuck with angels. To
empirically evaluate this possibility we ask whether the negative relationship between angel
and VC funding holds true across the performance spectrum.
An empirical challenge is that performance is hard to observe in privately-held
companies. Within our data constraints the most credible proxy for performance is the
realization of final outcomes. While this proxy does not reflect the evolution of performance
over time, it classifies companies into three distinct categories: those that ultimately
experienced a successful exit event, as measured by an acquisition or IPO; those that are still
alive by the end of the sample period; and those companies that failed.
A necessary requirement for the stepping stone hypothesis is that VCs invest in
companies that are more likely to exit. But this is not enough: under the stepping stone
hypothesis the observed negative relationship between prior angel and current VC funding
has to also turn positive for those companies that are more likely to have a successful exit.
We test both of these conditions.
To test the necessary condition that VCs invest in better companies, we regress final
outcomes on prior funding types. As before, our unit of analysis is the investment round, but

24
we augment the sample with one round that captures the final outcome. Panel A of Table 6
reports the results from linear probability models for Exit and Failure, where the independent
variables are the same as in our main model (Table 3).13
In Column 1, the dependent variable
measures whether or not the company experienced a successful exit, in Column 2 the
dependent variable measures whether the company failed or not. The central findings are that
VC financing is associated with more exits, and fewer failures. Neither the amount of funding
from angel investors, nor from other investors, is significantly correlated with exits or
failures. These findings are consistent with prior research on VC (see Da Rin, Hellmann and
Puri 2012). In columns 3 and 4 we add an interaction term between the amounts of VC and
angel financing. We find that this does not affect the main coefficients of interest. As for the
interaction term, we note that it is negative and significant at 1% for exits, and insignificant
for failures. This result is broadly consistent with the analysis of Goldfarb et al. (2012), who
find that VCs tend to do best when investing on their own.
Panel B of Table 6 uses a similar structure as Panel A, but instead of using the
continuous amount variables for the three investor types, we now use the categorical
variables which measure the presence or absence of an investor type (previously used in
Table 4A). We find very similar results for columns (1) – (3). In column (4) we also find that
companies funded only by angels have a higher failure rate, but this does not apply to those
that also attract VC.14
15
13
We refrain from using non-linear Probit or Logit models, because the large number of fixed effects in our specifications creates an incidental parameter problem (see Angrist and Pischke, 2009).
14 Specifically, we find a positive and significant coefficient for the presence of angels, a negative and
insignificant coefficient for the presence of VC, and a negative and significant coefficient for the presence of both angels and VCs. We note that the positive coefficient for the interaction effect is of a very similar magnitude as the negative coefficient for the angel dummy.
15 In addition to running a round-to-exit panel model, we also considered a simple cross-section, where the
dependent variable is simply the final company outcome (exit, alive or failed), and where the independent variable of interest is either the cumulative investment amount of the different investor types at the end of the sample (cf. Table 6A); or the presence or absence of the different investor types at the end of the sample (Table 6B). The results were in line with those of Table 6.

25
Let us collect the insights from both panels of Table 6. First, the results from columns
(1) and (2) suggest that VC backed companies do achieve better outcomes, which is
necessary for the stepping stone hypothesis. Second, the results from both columns (3) shed
some doubt on the stepping stone hypothesis, as they show that the most successful
companies do not mix angel and VC funding. Finally, the results from both columns (4) are
mixed. While there is some evidence in Panel B (but not in Panel A) that mixing of angel and
VC funding might be associated with better outcomes, this only occurs for poorly performing
companies, and not for the best companies, as conjectured by the stepping stone hypothesis.
The results from Table 6 only measure correlation, and make no claims about the
direction of causality. A large prior literature tries to disentangle selection and treatment
effect for the effect of investors on performance (see Da Rin et al. 2012 for a detailed
discussion). While not central to the analysis of the stepping stone hypothesis, we nonetheless
reran the regressions of Table 6 using an instrumentation strategy based on the analysis of
Table 5. In unreported regressions we found that none of the investor type coefficients are
statistically significant. This suggests that selection effects explain most for the relationship
between investor types and performance.
Next we consider the second condition of the stepping stone hypothesis, namely that
the observed negative relationship between prior angel and current VC funding applies to
poorly performing, but not to high-performing companies. Table 7 examines how the
dynamic relationship between angels and VCs differs across the performance range. We
interact our investor type variables with two sets of dummy variables that measure eventual
company outcomes. The first four columns of Table 7 report the same regressions as in Table
3, yet augmented by controls for Exit and Failure. They show that the main coefficients are
very similar to before. The last four columns of Table 7 then report the interaction effects of
financing type with eventual company outcomes. We find that almost all interaction

26
coefficients are statistically insignificant.16
Most importantly, we do not find that the negative
relationship between prior angel funding and current VC funding is weaker for companies
that eventually have a successful exit. This finding is inconsistent with the central argument
of the stepping stone hypothesis.
4.2. Do funding needs affect transitions across investor types?
The analysis of section 4.1 suggests that the negative dynamic relationship between angel and
VC funding applies across the performance range. In this section we ask how it might vary
across the range of funding needs. This question is motivated by Table 2 which shows that
VC rounds tend to be considerably larger than angel rounds. Our simple conjectures are that
(i) the negative relationship of going from angel to VC funding should weaken for larger
deals, and that (ii) the negative relationship of going from VC to angel funding should
weaken for small deals. These conjectures are driven by the basic observation that angels
tend to invest smaller amounts than VCs. In fact, the most relevant empirical question is
maybe not whether these conjectures are true, but whether the substitutes pattern survives
after controlling for these portfolio size effects.
Table 8 reports results from a regression that is similar to Table 7, but in which we
interact the investor type variables with the amount of funding raised in the current round.
The main finding is that the conjectures above are strongly confirmed in the data. In Column
2 we find that the negative effect of prior angel financing on VC is attenuated in larger
rounds. The interaction effect is positive and significant at the 1% level. Moreover, in
Column 1 we find that the negative effect of prior VC financing on angels is stronger in
larger rounds. The interaction effect is negative and significant at the 1% level. We also find
16
The only significant interaction effects occur for exited companies on the main diagonal. Specifically, angel backed companies that eventually exit, are more likely to continue raising more angel investing. The same is true for other investors, but not for VCs.
27
that the persistence of investor types for VCs and Other Investors is stronger in larger deals,
as reflected by the positive and significant interaction effects on the main diagonal.
The finding that larger round size attenuates the negative effect of angel funding on
VC, but accentuates the negative effect of VC on angel funding, is reassuring. It confirms that
the dynamic funding relationship is affected by important economic variables, such as the
financing needs of the company at the time of financing. Yet, probably the most important
finding is that the basic substitutes patterns between angel and VC financing is unaffected
after controlling for these portfolio size effects. Indeed, both the size and the statistical
significance of the main coefficients are hardly affected by the additional controls.
4.3. Does the dynamic financing pattern vary across investor subtypes?
Our analysis so far uses aggregate categories for angels, VC and other investor. In this
section we disaggregate those categories to obtain a deeper understanding of the
interrelationship between different investor types. The more granular categorization allows us
to (i) gauge the dynamic financing patterns within investor types, and to (ii) examine how
cross-investor effects vary by subcategories. Indeed, the biggest question is whether the
negative relationship between angels and VCs applies uniformly across angel types.
In section 2 we discussed our decomposition of angel investors into three types: casual
angels, serial angels, and angel funds. A natural interpretation is that serial angels are likely
to be more experienced and committed to angel investing in the long term than casual angels.
For example, it is likely that our casual angel category includes ‘friends’ who invest in a
single company on the basis of personal relationships, but have no intention to systematically
engage in angel investing. Angel funds may behave differently from both casual and serial
angels. Prowse (1998) distinguishes between “active” and “passive” angels within angel
funds. He argues that active angels are delegated monitors for the passive angels, and may
develop relevant skills and networks in this position. In addition we note that angel funds are

28
likely to have deeper pockets than individual angels, and may therefore become a viable
alternative to VC funding for companies that require large investment amounts.
The theoretical predictions as to the substitutes pattern between VCs and any of these
angel subcategories are often ambiguous. For example, on the one hand one may conjecture
that serial angels are a stronger substitute to VCs than casual angels because the former are
more willing to fund companies on their own. However, on the other hand, VCs may find it
easier to develop long-term relationships with the serial angels, which would suggest a
stronger substitutes pattern for the casual angels than for the angel funds. Similarly angel
funds may exhibit a relatively weak substitutes pattern with VCs as they appear to be the
most akin to VCs and should hence select into similar firms and/or be able to work together
productively. But angel funds may also exhibit strong substitutes patterns with VCs as they
may offer a viable alternative funding system due to their expertise and size.
Table 9 shows the results for decomposing investor types. Concerning relationships
within investor types we again note positive (and mostly significant) relationships on the
main diagonal. Consider next the interactions amongst different types of angel investors,
shown in columns 1-3. We find a two-way negative relationship between casual angels and
angel funds. We also find a positive and significant relationship between prior casual angel
funding and current serial angel funding. However, this effect goes only one way, i.e., there is
no effect between prior serial angel funding and current casual angel funding. Within the
venture capital subcategories we also find an interesting asymmetry, namely that prior
funding from private VCs is associated with greater current government VC funding
amounts, but not vice versa.
Turning next to the breakout across investor types, we find a negative effect of prior
angel financing on (both types of) VC for two out of three angel subcategories, namely casual
angels and angel funds. However, the coefficients for serial angels are insignificant (and even

29
have a positive sign). This suggests that serial angels stand less apart from the VC community
than casual angels or angel funds. Looking at the reverse relationship of prior VC on angel
investing we notice a somewhat similar pattern for government VCs: more prior government
VC funding predicts less current funding from casual angels and angel funds, but it has no
significant effect on current funding from serial angels. For private VCs, however, more prior
funding always predicts less angel funding, irrespective of the specific angel subcategory.
Finally, there are some interesting patterns between angels and Other Investors. Prior
funding from angel funds is negatively related to current funding from Other Investors. This
is not the case for prior funding from casual or serial angels. As for the breakout within Other
Investors, the most interesting result is that prior funding from corporations is associated with
greater private VC funding. Prior funding from founders and family is not associated with
greater private VC funding.
Overall we note that the analysis of subcategories reveals several interesting insights,
the most interesting one being that there are significant differences in the dynamic investment
patterns of casual angels, serial angels, and angel funds.
5. CONCLUSION
This paper examines the dynamic interactions between different types of investors, focusing
in particular on the interactions between angels and VCs. Using detailed data from British
Columbia, Canada, we find considerable support for the hypothesis that angel investors and
VCs are dynamic substitutes. Companies that obtain VC funding are less likely to obtain
subsequent angel funding, and vice versa. The results are robust across a wide range of
econometric specifications. The substitutes effect is stronger for casual angels and angel
funds than for serial angels.
Our analysis suggests several avenues for future research. First, a natural next step
would be to obtain a deeper understanding of the reasons behind the observed substitutes
30
pattern. Do angels and VCs have different networks? Do they have incompatible governance
systems? Or do disagreements about valuations drive the substitutes result? Second, while we
obtain unique data on angels and VCs in British Columbia, Canada, it would be interesting to
see to what extent the results continue to hold in other environments. For example, does the
substitutes result also hold in large start-up ecosystems such as Silicon Valley? And how
about in significantly less developed start-up ecosystems than British Columbia? Third, an
interesting line of research is to examine whether the substitutes pattern continues to apply
after recent developments in angel markets, most notably the rise of electronic investment
platforms, such as Angellist and equity crowdfunding platforms. Finally, there is an
important research agenda in understanding public policy implications. Government policies
traditionally focused on (formal) venture capital as the main path to improving the financing
environment of start-ups. Yet our central finding challenges that approach, suggesting that
government policies towards angel investors would reach a different set of entrepreneurial
companies that develop outside of the reach of venture capitalists.
31
REFERENCES.
Angrist, J. and J. Pischke. 2009. Mostly harmless econometrics. Princeton, NJ: Princeton
University Press.
Arrington, Michael. 2010. VCs and super angels: The war for the entrepreneur. Retrieved
from http://techcrunch.com/2010/08/15/venture-capital-super-angel-war-
entrepreneur/
Axelson, Ulf, Per Strömberg and Michael Weisbach. 2009. Why are buyouts leveraged? The
financial structure of private equity funds. Journal of Finance 64-4: 1549-1582.
Benjamin, G. A., & J. Margulis. 2001. The angel investor’s handbooks. How to profit from
early-stage investing. Princeton, NJ: Bloomberg Press.
Berger, A., N. Miller, M. Petersen, R. Rajan, and J. Stein. 2005. Does function follow
organizational form? Evidence from the lending practices of large and small banks.
Journal of Financial Economics 76: 237–269.
Bernstein, Shai, Arthur Korteweg, and Kevin Law. 2014. Attracting early stage investors:
Evidence from a randomized field experiment. Mimeo Stanford University.
Brander, James, Qianqian Du and Thomas Hellmann. 2013. The effects of government-
sponsored VC: international evidence. Working Paper, University of British
Columbia.
Chemmanur, T. and Z. Chen. 2006. VCs versus angels: the dynamics of private firm
financing contracts. Unpublished working paper.
Chemmanur, Thomas, Elena Loutskina and Xuan Tian. 2014. Corporate venture capital,
value creation, and innovation. Review of Financial Studies 27 (8): 2434-2473.
Da Rin, Marco, Thomas Hellmann and Manju Puri. 2012. A survey of VC research. In
Handbook of the Economics of Finance, Vol. 2, ed. George Constantinides, Milton
Harris, and René Stulz. Amsterdam, North Holland.
Diamond, Douglas. 1984. Financial intermediation and delegated monitoring. The Review of
Economic Studies 51: 393–414.
Fulghieri, Paolo and Merih Sevilir. 2009. Organization and financing of innovation, and the
choice between corporate and independent venture capital. Journal of Financial and
Quantitative Analysis 44 (n.6): 1291-1321.
Goldfarb, B., G. Hoberg, D. Kirsch and A. Triantis. 2012. Does angel participation matter?
An analysis of early venture financing. Unpublished working paper.
Gompers, Paul. 1995. Optimal investment, monitoring, and the staging of venture capital.
Journal of Finance 50: 1461-1489.

32
Government of British Columbia. 2014. Investment capital. Government of British Columbia,
Ministry of International Trade and Responsible for Asia Pacific Strategy and
Multiculturalism. Retrieved from http://www.mit.gov.bc.ca/icp/
Hellmann, T., L., Lindsey, and M. Puri. 2008. Building relationships early: banks in venture
capital. Review of Financial Studies 21, 513-541.
Hellmann, Thomas and Paul Schure. 2010. An evaluation of the VC program in British
Columbia. Report prepared for the BC Ministry of Small Business, Technology and
Economic Development.
Hellmann, Thomas and Veikko Thiele. 2014. Friends or foes? The interrelationship between
angel and venture capital markets". Journal of Financial Economics, forthcoming.
Kaplan, Steven and Per Strömberg. 2003. Financial contracting theory meets the real world:
Evidence from VC contracts. Review of Economic Studies 70, 281–315.
Kerr, W., J. Lerner, and A. Schoar. 2014. The consequences of entrepreneurial finance: a
regression discontinuity analysis. Review of Financial Studies, 27:1, 20-55.
Lerner, Josh, Thomas Hellmann and Ilkin Ilyaszade. 2012. Angels in British Columbia.
Harvard Business School Case Study 9 – 811 – 100.
Mason, Colin, and Richard Harrison. 2002. Barriers to investment in the informal VC sector.
Entrepreneurship and Regional Development 14 , 271-287.
OECD. 2011. Financing high-growth firms: The role of angel investors. OECD Publishing,
http://dx.doi.org/10.1787/9789264118782-en.
Ozmel, Umut, David T. Robinson and Toby Stuart. 2013. Strategic alliances, venture capital,
and the going public decision. Journal of Financial Economics 107(3): 655-670.
Phalippou, L. and O. Gottschalg. 2009. The performance of private equity funds. Review of
Financial Studies 22: 1747-1776.
Prowse, Stephen. 1998. Angel investors and the market for angel investments. Journal of
Banking & Finance 22: 785–792.
Sandler, Daniel. 2004. VC and tax incentives: A comparative study of Canada and the United
States. Toronto, ON: Canadian Tax Foundation.
Sanghvi, Rajen. 2014. 17 quotes from Marc Andreessen & Ron Conway on how to raise
money. From how to start a start-up – Lecture 9. Retrieved from
https://medium.com/how-to-start-a-startup/17-quotes-from-marc-andreessen-ron-
conway-on-how-to-raise-money-d0b710f115f1.
Schwienbacher, A. 2009. Financing commitments and investors incentives in entrepreneurial
firms. Unpublished working paper.

33
Sohl, Jeffrey E. 2003. The U.S. angel and VC Market: Recent trends and developments. The
Journal of Private Equity 6-2: 7-18.
Tian, Xuan. 2011. The causes and consequences of venture capital stage financing. Journal of
Financial Economics 101 (1): 132-159.
Van Osnabrugge, Mark and Robert J. Robinson. 2000. Angel investing: Matching start-up
funds with start-up companies. San Francisco, CA: Jossey-Bass.
Wong, Andrew. 2010. Angel finance: The other VC. In VC: Investment Strategies,
Structures, and Policies, ed. Douglas Cumming. Hoboken, NJ: John Wiley & Sons.
34
Table 1: Variable definitions
Investor categories
Investor type Description
ALL All investors.
AN An angel investor
AN-CASU A casual angel investor who invests in only one company.
AN-SERI A serial angel investor who invests in more than one company.
AN-FUND A fund that is owned by multiple angel investors.
VC An VC firm
VC - PRIV A private VC firm.
VC - GOVT A government VC firm, including all Retail VCCs OI OI – CORP
Other Investors. An operational corporation or financial corporation that invests
OI – FOFA Shareholders who are either founders, family of founders, or employees of the company
Main variables.
All investment amounts are measured in natural logarithms of 1 + actual investment amounts.
Variable Description
(a) Investor choices
<investor type> $ Investment amount in current round by investors of type <investor type>
New <investor type> $ Investment amount in current round by investors of type <investor type> by investors who did not invest in any prior round
Prior <investor type> $ Prior cumulative investment amounts by investors of type <investor type>
<investor type> Dummy Dummy variable indicating the presence of at least one investor of type <investor type> in the current round.
New <investor type> Dummy Dummy variable indicating the presence of at least one investor of type <investor type> in the current round, who did not invest in any prior round.
Prior <investor type> Dummy Dummy variable indicating the presence of at least one investor of type <investor type> in any prior round.
(b) Outcomes
EXIT Dummy variable that indicates if the company has exited through an IPO or acquisition by May 2014. The data is obtained from the SDC Global News Issue, SDC Merger, SEDAR, and from web searches.
FAILURE Dummy variable that indicates if the company has failed by May 2014. In other words, SURVIVE=0 if the company has gone out of business by that time. The data is obtained from the BC and Canadian Company Registries, in addition to the sources used to construct the EXIT dummy above.
35
Controls variables.
Variable Description
(a) Company characteristics
Industry dummies Set of dummy variables for each of the following industries: Software, Biotech; Cleantech; IT & Telecom; Hi-tech Manufacturing; Hi-tech Services; Tourism; Other industry.
Region dummies Set of dummy variables for each of the following regions: Greater Vancouver (GVRD); Greater Victoria (CRD); Okanagan/Thomson Valley; and Rest of BC.
(b) Other controls
Current Round Amount Natural logarithm of the amount that a company receives in the current financing round.
Previous Round Amount Natural logarithm of the investment amount that a company receives in the previous financing round.
Age at First Round Natural logarithm of the company's age measured at time of first financing plus 0.25 (in years).
Calendar Time Quarterly non-parametric clock, i.e. dummies for each quarter of the data.
Time Since Previous Financing Round
Quarterly non-parametric clock, i.e. dummies that groups observations by time-distance since the previous round.
Time Since First Round Quarterly non-parametric clock, i.e. dummies that groups observations by time-distance since the first round.
Share Registry Dummy Dummy variable that takes a value of 1 if the data source of the round information is from the company share registries; and 0 if it stems from the electronic database used by the ministry.
Instrumental variables.
All investment amounts are measured in natural logarithms of 1 + actual investment amounts.
Variable Description
Tax Credit – RVC Natural logarithm of the amount of tax credit that is available to retail VC financing under the Retail VC Corporation (RVCC) Tax Credit program.
Tax Credit - ANF Natural logarithm of the amount of tax credit that is available to other financing under (non-retail) VC Corporation (AVCC) Tax Credit program.
Tax Credit - ANI Natural logarithm of the amount of tax credits that are available to angel financing under the Eligible Business Corporation (EBC) Tax Credit program.

36
Table 2: Descriptive Statistics
Panel A: Company sectors and regions GVRD = Greater Vancouver Region District. CRD = Capital Region District (Greater Victoria).
Variable All rounds (n=2,184 )
AN Rounds (n=1,491)
VC Rounds (n=690)
OI Rounds (n=798)
Industry (% of all rounds)
Software 30 28 34 35
Biotech 14 11 23 16
Cleantech 4 5 3 5
IT & Communication 7 5 9 6
Hi-tech Manufacturing 18 19 19 20
Hi-tech Service 6 7 3 5
Tourism 6 7 1 6
Other 14 17 7 8
Location (% of all rounds)
GVRD (Vancouver) 73 70 81 75
CRD (Victoria) 9 8 11 8
Okanagan & Thompson River 5 6 4 6
Rest of BC 12 16 4 12
Panel B: Company age and investment amounts
Variable All rounds (n=2,184 )
AN Rounds (n=1,491)
VC Rounds (n=690)
OI Rounds (n=798)
Company Age at 1st Round (yrs) 2.4 2.3 2.7 2.2
Company Age at Round (yrs) 4.9 4.5 5.9 4.3
Amounts in round ($Th.)
AN $ 240 350 220 390
VC $ 1,080 280 3,430 1,040
OI $ 210 200 350 570
Amount new investors current round ($ M)
New AN $ 200 290 180 320
New VC $ 990 230 3,140 930
New OI $ 180 160 300 480
Panel C: Company outcomes (as observed in May 2014).
Variable # Companies (%)
Exit 79 (17%)
Death 163 (35%)
Active 227 (48%)
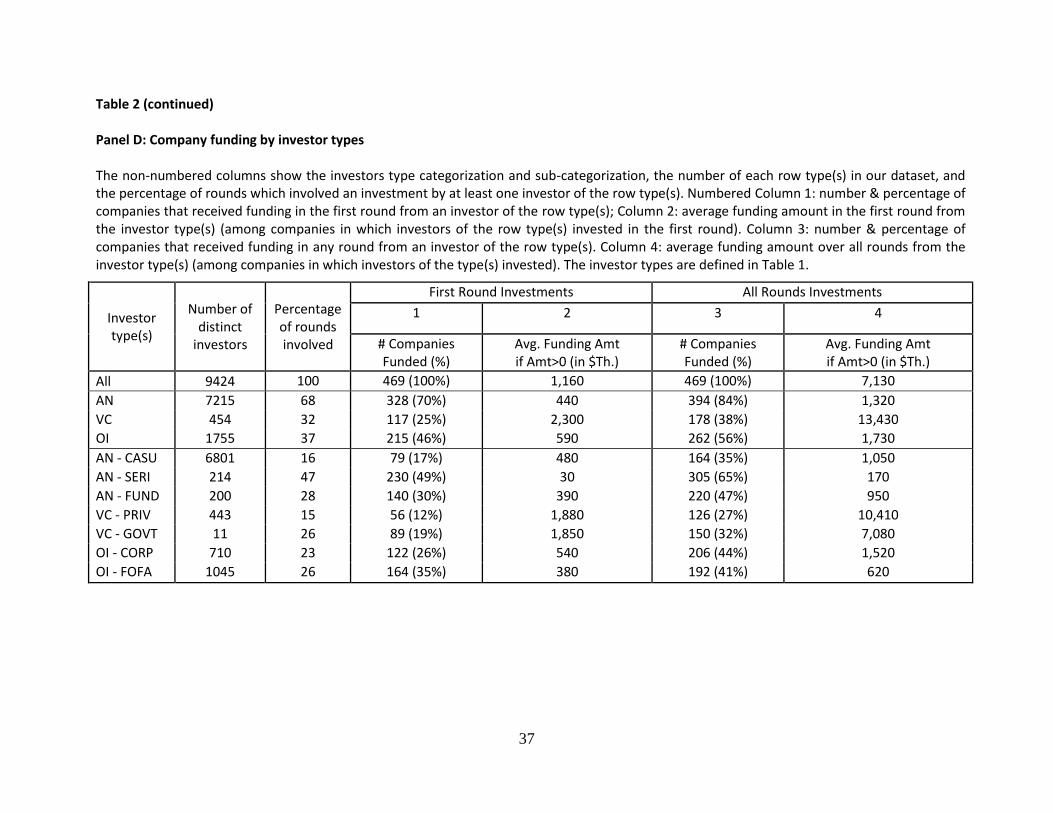
37
Table 2 (continued) Panel D: Company funding by investor types The non-numbered columns show the investors type categorization and sub-categorization, the number of each row type(s) in our dataset, and the percentage of rounds which involved an investment by at least one investor of the row type(s). Numbered Column 1: number & percentage of companies that received funding in the first round from an investor of the row type(s); Column 2: average funding amount in the first round from the investor type(s) (among companies in which investors of the row type(s) invested in the first round). Column 3: number & percentage of companies that received funding in any round from an investor of the row type(s). Column 4: average funding amount over all rounds from the investor type(s) (among companies in which investors of the type(s) invested). The investor types are defined in Table 1.
Investor type(s)
Number of distinct
investors
Percentage of rounds involved
First Round Investments All Rounds Investments
1 2 3 4
# Companies Funded (%)
Avg. Funding Amt if Amt>0 (in $Th.)
# Companies Funded (%)
Avg. Funding Amt if Amt>0 (in $Th.)
All 9424 100 469 (100%) 1,160 469 (100%) 7,130
AN 7215 68 328 (70%) 440 394 (84%) 1,320
VC 454 32 117 (25%) 2,300 178 (38%) 13,430
OI 1755 37 215 (46%) 590 262 (56%) 1,730
AN - CASU 6801 16 79 (17%) 480 164 (35%) 1,050
AN - SERI 214 47 230 (49%) 30 305 (65%) 170
AN - FUND 200 28 140 (30%) 390 220 (47%) 950
VC - PRIV 443 15 56 (12%) 1,880 126 (27%) 10,410
VC - GOVT 11 26 89 (19%) 1,850 150 (32%) 7,080
OI - CORP 710 23 122 (26%) 540 206 (44%) 1,520
OI - FOFA 1045 26 164 (35%) 380 192 (41%) 620
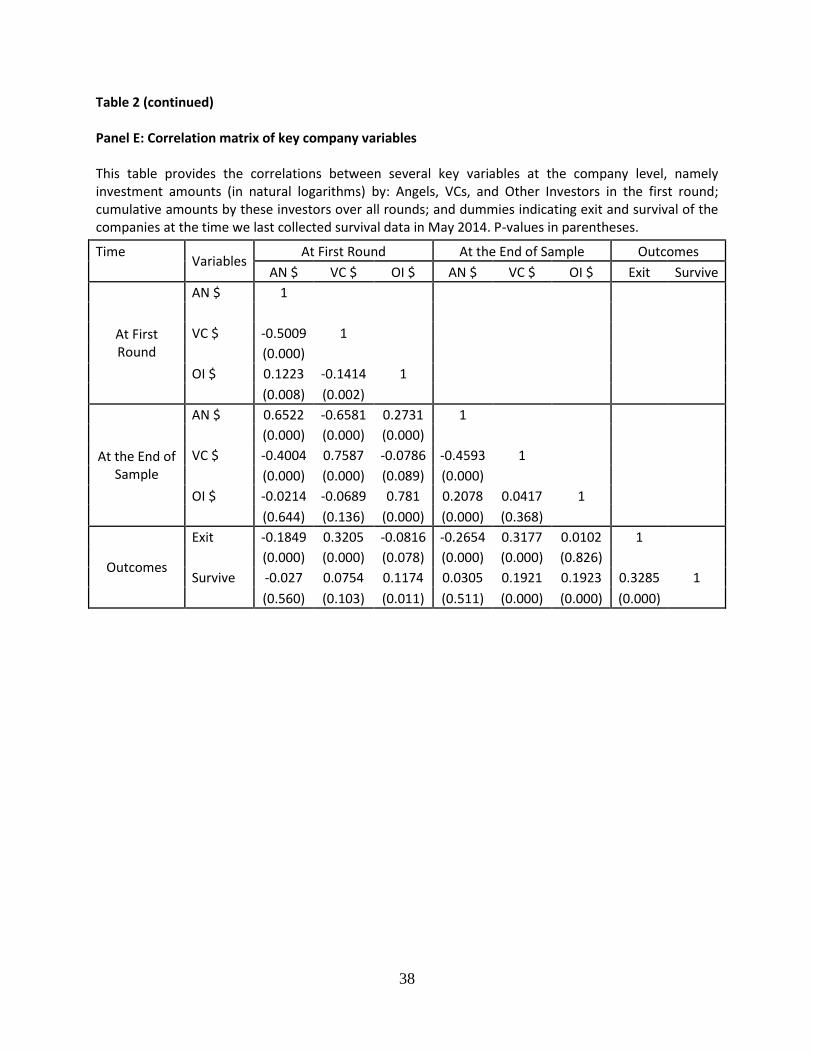
38
Table 2 (continued) Panel E: Correlation matrix of key company variables This table provides the correlations between several key variables at the company level, namely investment amounts (in natural logarithms) by: Angels, VCs, and Other Investors in the first round; cumulative amounts by these investors over all rounds; and dummies indicating exit and survival of the companies at the time we last collected survival data in May 2014. P-values in parentheses.
Time Variables
At First Round At the End of Sample Outcomes
AN $ VC $ OI $ AN $ VC $ OI $ Exit Survive
At First Round
AN $ 1
VC $ -0.5009 1
(0.000)
OI $ 0.1223 -0.1414 1
(0.008) (0.002)
At the End of Sample
AN $ 0.6522 -0.6581 0.2731 1
(0.000) (0.000) (0.000)
VC $ -0.4004 0.7587 -0.0786 -0.4593 1
(0.000) (0.000) (0.089) (0.000)
OI $ -0.0214 -0.0689 0.781 0.2078 0.0417 1
(0.644) (0.136) (0.000) (0.000) (0.368)
Outcomes
Exit -0.1849 0.3205 -0.0816 -0.2654 0.3177 0.0102 1
(0.000) (0.000) (0.078) (0.000) (0.000) (0.826)
Survive -0.027 0.0754 0.1174 0.0305 0.1921 0.1923 0.3285 1
(0.560) (0.103) (0.011) (0.511) (0.000) (0.000) (0.000)

39
Table 3: The Relationship between Prior Funding and Current Funding by New Investors Results of panel OLS regressions at the financing round level. The dependent variables are the current investment amounts of new investors of each type (e.g. "New AN $" is the total amount invested by angel investors, who did not invest in any prior round in the company). The main independent variables are the prior cumulative investments amounts of Angels, VCs, and Other Investors. All investment amounts are in natural logarithms. The other reported independent variables are company age at the first investment round, previous round amount, region dummies, and industry dummies. The omitted categories for region dummies and industry dummies are Greater Vancouver and Software respectively. The unreported control variables are three (quarterly) non-parametric clocks for calendar time, time passed since the previous financing round, and time passed since the first round. A constant was also included but not shown. All variables are defined in Table 1. Robust standard errors, clustered at the company level, are reported in the parentheses. ***, **, and * indicate significance at the 1%, 5%, and 10% levels, respectively.
1 2 3 4
New AN $ New VC $ New OI $ All New $
Prior AN $ 0.259*** -0.351*** -0.0847*** -0.154***
(0.0358) (0.0362) (0.0321) (0.0329)
Prior VC $ -0.237*** 0.334*** 0.00854 0.0585*
(0.0390) (0.0372) (0.0276) (0.0315)
Prior OI $ -0.0391 -0.0835*** 0.166*** -0.0939***
(0.0359) (0.0237) (0.0289) (0.0355)
Age at First Round -0.00840 0.0619 -0.0338 0.0713
(0.0520) (0.0378) (0.0500) (0.0483)
Previous Round Amount -0.236*** 0.377*** -0.0423 0.116
(0.0881) (0.0768) (0.0834) (0.0799)
Capital Region District 0.554 0.692* -0.379 0.821
(0.723) (0.414) (0.458) (0.551)
Okanagan Thomson -0.792 -0.0989 -0.0103 -1.035
(0.926) (0.494) (0.825) (0.881)
Rest of BC 0.820 -0.800** -0.193 0.453
(0.590) (0.357) (0.515) (0.494)
Biotech 0.787 0.335 0.835 0.759
(0.577) (0.478) (0.531) (0.518)
Cleantech 2.341*** 0.159 -0.0289 1.858***
(0.720) (0.608) (0.695) (0.637)
IT&Telecom 0.434 1.364** 0.232 1.176
(0.957) (0.659) (0.688) (0.785)
High-tech Manufacturing 0.557 0.0464 0.198 0.350
(0.637) (0.461) (0.503) (0.563)
High-tech Services -0.942 -1.523*** -0.528 -1.884*
(0.925) (0.534) (0.911) (1.012)
Tourism -0.428 -1.796*** -1.344 -1.688*
(0.948) (0.475) (0.837) (0.944)
Other industry 0.856 -0.831** -0.535 0.159
(0.668) (0.419) (0.512) (0.585)
Controls YES YES YES YES
Observations 1,715 1,715 1,715 1,715
Number of companies 469 469 469 469
R-square 0.378 0.661 0.275 0.214
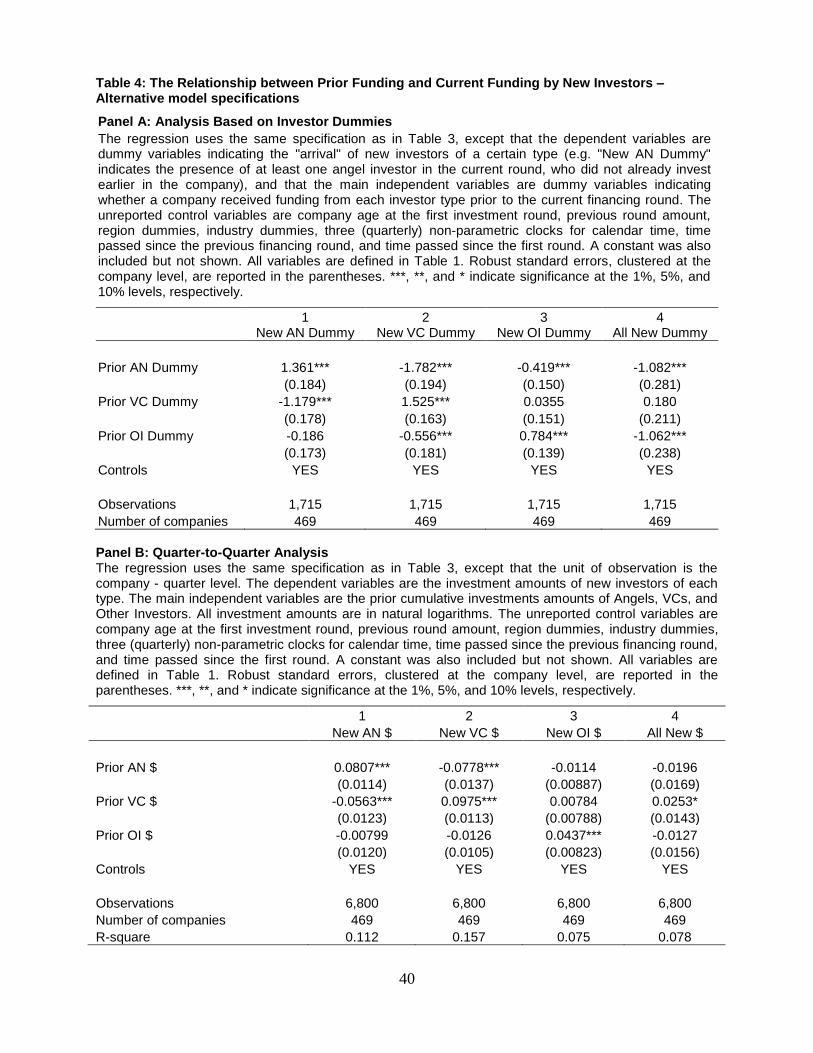
40
Table 4: The Relationship between Prior Funding and Current Funding by New Investors – Alternative model specifications
Panel A: Analysis Based on Investor Dummies
The regression uses the same specification as in Table 3, except that the dependent variables are dummy variables indicating the "arrival" of new investors of a certain type (e.g. "New AN Dummy" indicates the presence of at least one angel investor in the current round, who did not already invest earlier in the company), and that the main independent variables are dummy variables indicating whether a company received funding from each investor type prior to the current financing round. The unreported control variables are company age at the first investment round, previous round amount, region dummies, industry dummies, three (quarterly) non-parametric clocks for calendar time, time passed since the previous financing round, and time passed since the first round. A constant was also included but not shown. All variables are defined in Table 1. Robust standard errors, clustered at the company level, are reported in the parentheses. ***, **, and * indicate significance at the 1%, 5%, and 10% levels, respectively.
1 2 3 4
New AN Dummy New VC Dummy New OI Dummy All New Dummy
Prior AN Dummy 1.361*** -1.782*** -0.419*** -1.082***
(0.184) (0.194) (0.150) (0.281)
Prior VC Dummy -1.179*** 1.525*** 0.0355 0.180
(0.178) (0.163) (0.151) (0.211)
Prior OI Dummy -0.186 -0.556*** 0.784*** -1.062***
(0.173) (0.181) (0.139) (0.238)
Controls YES YES YES YES
Observations 1,715 1,715 1,715 1,715
Number of companies 469 469 469 469
Panel B: Quarter-to-Quarter Analysis The regression uses the same specification as in Table 3, except that the unit of observation is the company - quarter level. The dependent variables are the investment amounts of new investors of each type. The main independent variables are the prior cumulative investments amounts of Angels, VCs, and Other Investors. All investment amounts are in natural logarithms. The unreported control variables are company age at the first investment round, previous round amount, region dummies, industry dummies, three (quarterly) non-parametric clocks for calendar time, time passed since the previous financing round, and time passed since the first round. A constant was also included but not shown. All variables are defined in Table 1. Robust standard errors, clustered at the company level, are reported in the parentheses. ***, **, and * indicate significance at the 1%, 5%, and 10% levels, respectively.
1 2 3 4
New AN $ New VC $ New OI $ All New $
Prior AN $ 0.0807*** -0.0778*** -0.0114 -0.0196
(0.0114) (0.0137) (0.00887) (0.0169)
Prior VC $ -0.0563*** 0.0975*** 0.00784 0.0253*
(0.0123) (0.0113) (0.00788) (0.0143)
Prior OI $ -0.00799 -0.0126 0.0437*** -0.0127
(0.0120) (0.0105) (0.00823) (0.0156)
Controls YES YES YES YES
Observations 6,800 6,800 6,800 6,800
Number of companies 469 469 469 469
R-square 0.112 0.157 0.075 0.078

41
Table 5. The Relationship between Prior Funding and Current Funding by New Investors – Instrumental Variable Estimation Panel A: First-stage regressions Results from the first stage of an instrumental variable regression at the financing round level. The main dependent variables in the first stage are the prior cumulative investments amounts of our investor types. Our instruments are the amounts of tax credits issued to companies under the RVC, ANF and ANI programs. All amounts are in natural logarithms. The unreported control variables are company age at the first investment round, previous round amount, region dummies, industry dummies, the share registry dummy, and three (quarterly) non-parametric clocks for calendar time, time passed since the previous financing round, and time passed since the first round. A constant was included but not shown. All variables are defined in Table 1. Robust standard errors, clustered at the company level, are reported in the parentheses. ***, **, and * indicate significance at the 1%, 5%, and 10% levels, respectively.
1 2 3
Prior AN $ Prior VC $ Prior OI $
Tax credits – RVC -0.049** 0.06*** -0.032*
(0.0196) (0.021) (0.019)
Tax credits – ANF 0.143*** -0.031 0.023
(0.031) (0.033) (0.030)
Tax credits – ANI 0.052*** -0.044** -0.003
(0.018) (0.019) (0.0175)
Controls YES YES YES
Observations 1,715 1,715 1,715 Number of companies 469 469 469
Panel B: Second-stage regressions Results from the second-stage instrumental variable regressions at the financing round level. The dependent variables are the current investment amounts of new investors of each type (e.g. "New AN $" is the total amount invested by angel investors, who did not invest in any prior quarter in the company). The main independent variables are the first-stage predictions of the prior cumulative investments amounts of Angel, VC, and Other investors. All amounts are in natural logarithms. The unreported control variables are identical to those in the first-stage regression. Robust standard errors, clustered at the company level, are reported in the parentheses. ***, **, and * indicate significance at the 1%, 5%, and 10% levels, respectively.
1 2 3 4
New AN $ New VC $ New OI $ All New $
Prior AN $ - IV 0.197 -0.497* -0.319 -0.333
(0.331) (0.297) (0.268) (0.261)
Prior VC $ - IV -0.434 -0.100 -0.315 -0.499
(0.555) (0.498) (0.450) (0.439)
Prior OI $ - IV 0.864 -0.875 0.610 0.0111
(1.026) (0.920) (0.832) (0.810)
Controls YES YES YES YES
Observations 1,715 1,715 1,715 1,715
Number of companies 469 469 469 469
R-square 0.185 0.374 0.183 0.073
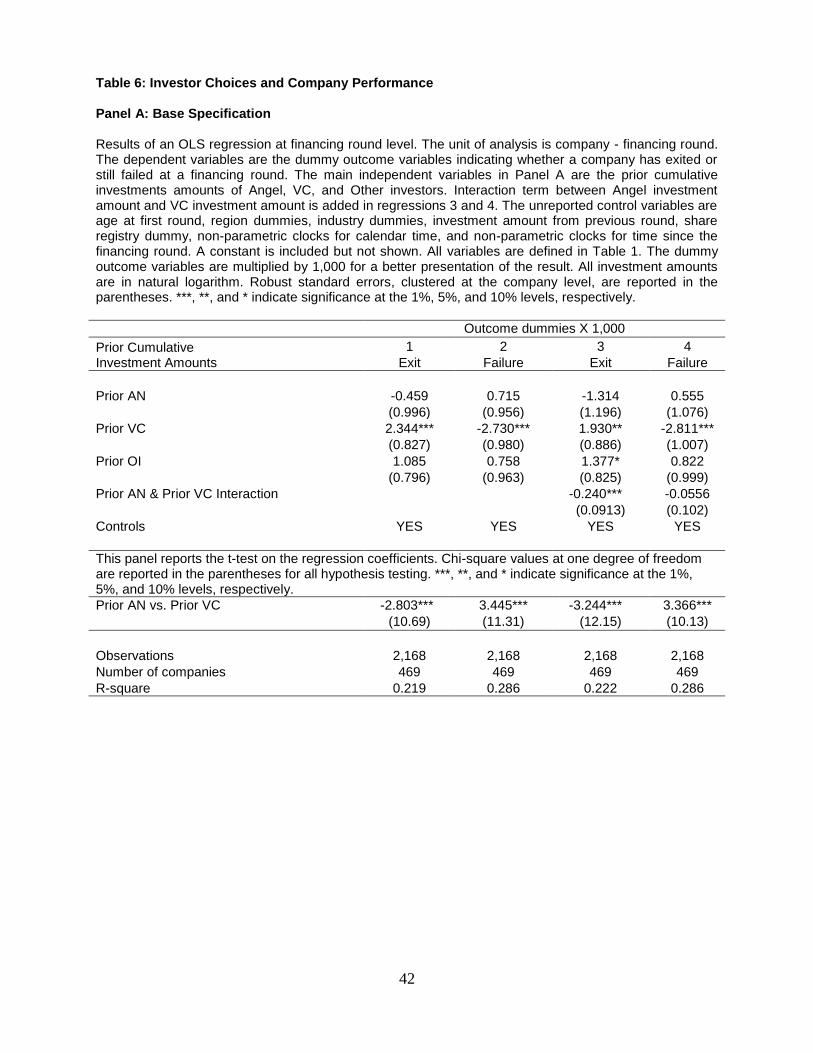
42
Table 6: Investor Choices and Company Performance Panel A: Base Specification Results of an OLS regression at financing round level. The unit of analysis is company - financing round. The dependent variables are the dummy outcome variables indicating whether a company has exited or still failed at a financing round. The main independent variables in Panel A are the prior cumulative investments amounts of Angel, VC, and Other investors. Interaction term between Angel investment amount and VC investment amount is added in regressions 3 and 4. The unreported control variables are age at first round, region dummies, industry dummies, investment amount from previous round, share registry dummy, non-parametric clocks for calendar time, and non-parametric clocks for time since the financing round. A constant is included but not shown. All variables are defined in Table 1. The dummy outcome variables are multiplied by 1,000 for a better presentation of the result. All investment amounts are in natural logarithm. Robust standard errors, clustered at the company level, are reported in the parentheses. ***, **, and * indicate significance at the 1%, 5%, and 10% levels, respectively.
Outcome dummies X 1,000
Prior Cumulative Investment Amounts
1 2 3 4
Exit Failure Exit Failure
Prior AN -0.459 0.715 -1.314 0.555
(0.996) (0.956) (1.196) (1.076)
Prior VC 2.344*** -2.730*** 1.930** -2.811***
(0.827) (0.980) (0.886) (1.007)
Prior OI 1.085 0.758 1.377* 0.822
(0.796) (0.963) (0.825) (0.999)
Prior AN & Prior VC Interaction
-0.240*** -0.0556
(0.0913) (0.102)
Controls YES YES YES YES
This panel reports the t-test on the regression coefficients. Chi-square values at one degree of freedom are reported in the parentheses for all hypothesis testing. ***, **, and * indicate significance at the 1%, 5%, and 10% levels, respectively.
Prior AN vs. Prior VC -2.803*** 3.445*** -3.244*** 3.366***
(10.69) (11.31) (12.15) (10.13)
Observations 2,168 2,168 2,168 2,168
Number of companies 469 469 469 469
R-square 0.219 0.286 0.222 0.286
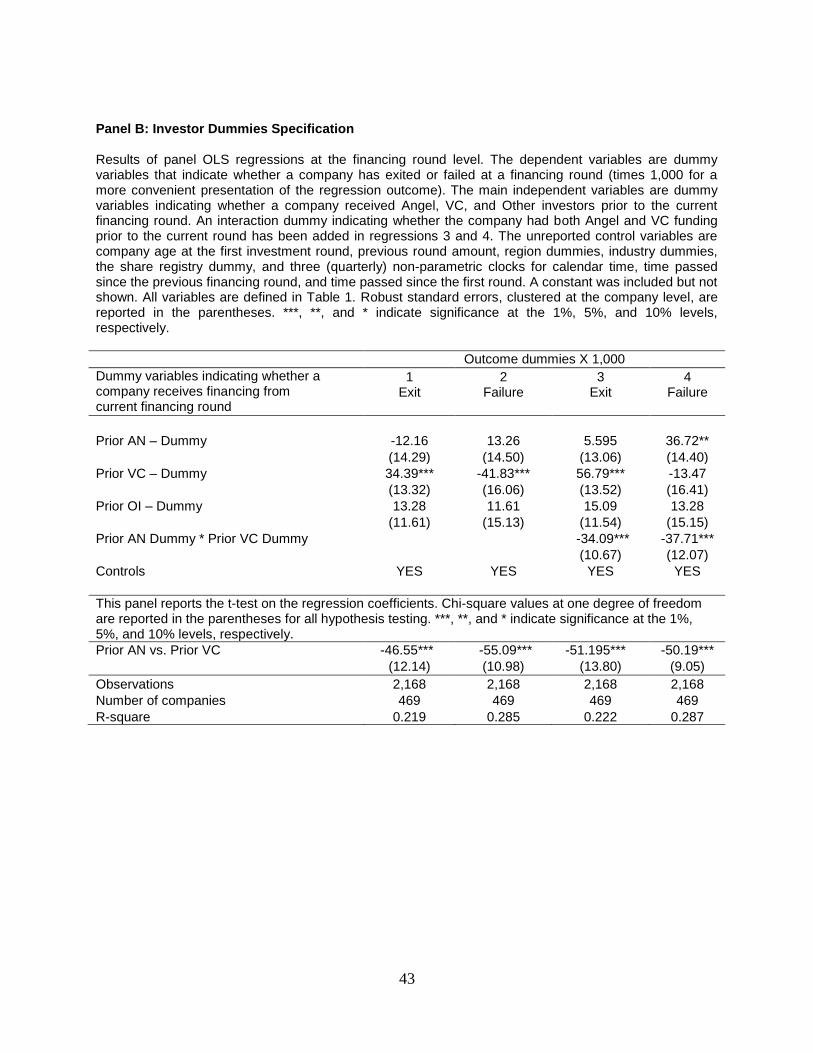
43
Panel B: Investor Dummies Specification Results of panel OLS regressions at the financing round level. The dependent variables are dummy variables that indicate whether a company has exited or failed at a financing round (times 1,000 for a more convenient presentation of the regression outcome). The main independent variables are dummy variables indicating whether a company received Angel, VC, and Other investors prior to the current financing round. An interaction dummy indicating whether the company had both Angel and VC funding prior to the current round has been added in regressions 3 and 4. The unreported control variables are company age at the first investment round, previous round amount, region dummies, industry dummies, the share registry dummy, and three (quarterly) non-parametric clocks for calendar time, time passed since the previous financing round, and time passed since the first round. A constant was included but not shown. All variables are defined in Table 1. Robust standard errors, clustered at the company level, are reported in the parentheses. ***, **, and * indicate significance at the 1%, 5%, and 10% levels, respectively.
Outcome dummies X 1,000
Dummy variables indicating whether a company receives financing from current financing round
1 2 3 4 Exit
Failure
Exit
Failure
Prior AN – Dummy -12.16 13.26 5.595 36.72**
(14.29) (14.50) (13.06) (14.40)
Prior VC – Dummy 34.39*** -41.83*** 56.79*** -13.47
(13.32) (16.06) (13.52) (16.41)
Prior OI – Dummy 13.28 11.61 15.09 13.28
(11.61) (15.13) (11.54) (15.15)
Prior AN Dummy * Prior VC Dummy
-34.09*** -37.71***
(10.67) (12.07)
Controls YES YES YES YES
This panel reports the t-test on the regression coefficients. Chi-square values at one degree of freedom are reported in the parentheses for all hypothesis testing. ***, **, and * indicate significance at the 1%, 5%, and 10% levels, respectively.
Prior AN vs. Prior VC -46.55*** -55.09*** -51.195*** -50.19***
(12.14) (10.98) (13.80) (9.05)
Observations 2,168 2,168 2,168 2,168
Number of companies 469 469 469 469
R-square 0.219 0.285 0.222 0.287

44
Table 7: The Relationship between Prior Funding and Current Funding by New Investors - Controlling for Outcome . Results from panel OLS regressions at the financing round level. The dependent variables are the current investment amounts of new investors of each type (e.g. "New AN" is the total amount invested by angel investors, who did not invest in any prior round in the company). The main independent variables are the prior cumulative investments amounts of Angels, VCs, and Other Investors. All investment amounts are in natural logarithms. Dummy variables to reflect Exit and Failure are added to control for outcome ("success"). Interaction terms are additionally included in regressions 5 to 8. The unreported control variables are company age at the first investment round, previous round amount, region dummies, industry dummies, the share registry dummy, and three (quarterly) non-parametric clocks for calendar time, time passed since the previous financing round, and time passed since the first round. A constant was included but not shown. All variables are defined in Table 1. Robust standard errors, clustered at the company level, are reported in the parentheses. ***, **, and * indicate significance at the 1%, 5%, and 10% levels, respectively.
Investment Amounts by New Investors in Current Round
Prior Cumulative 1 2 3 4 5 6 7 8
Investment Amounts New AN New VC New OI All New New AN New VC New OI All New
Prior AN 0.259*** -0.344*** -0.0778** -0.148*** 0.223*** -0.314*** -0.0458 -0.123**
(0.0359) (0.0357) (0.0314) (0.0325) (0.0518) (0.0497) (0.0432) (0.0487)
Prior VC -0.241*** 0.318*** -0.0102 0.0405 -0.233*** 0.291*** -0.00233 0.0330
(0.0392) (0.0374) (0.0273) (0.0308) (0.0485) (0.0451) (0.0341) (0.0385)
Prior OI -0.0420 -0.0885*** 0.167*** -0.0992*** -0.0573 -0.0814** 0.130*** -0.112***
(0.0355) (0.0239) (0.0280) (0.0345) (0.0465) (0.0339) (0.0311) (0.0422)
Exit -0.315 1.575*** 1.582*** 1.053** 0.863 1.296 1.825* 1.395
(0.569) (0.471) (0.451) (0.453) (1.124) (1.176) (0.937) (1.097)
Failure -1.087** -0.368 -0.731* -1.302*** -0.997 0.519 -0.346 -1.221
(0.509) (0.298) (0.380) (0.469) (1.286) (1.213) (0.909) (1.231)
Prior AN * Exit
0.143* -0.0368 -0.0824 -0.0159
(0.0759) (0.0916) (0.0734) (0.0720)
Prior VC * Exit
-0.0499 0.0606 -0.0572 -0.00816
(0.0679) (0.0778) (0.0590) (0.0593)
Prior OI * Exit
0.0722 -0.0721 0.126** 0.0407
(0.0578) (0.0530) (0.0583) (0.0467)
Prior AN * Failure
-0.00340 -0.0588 -0.0322 -0.0759
(0.0769) (0.0685) (0.0646) (0.0762)
Prior VC * Failure
0.00132 0.0713 0.0232 0.0298
(0.0661) (0.0699) (0.0544) (0.0638)
Prior OI * Failure
0.0181 0.0226 0.0279 0.00311
(0.0664) (0.0425) (0.0489) (0.0609)
Controls YES YES YES YES YES YES YES YES
Observations 1,715 1,715 1,715 1,715 1,715 1,715 1,715 1,715
Number of companies 469 469 469 469 469 469 469 469
R-square 0.382 0.666 0.288 0.231 0.39 0.668 0.292 0.234
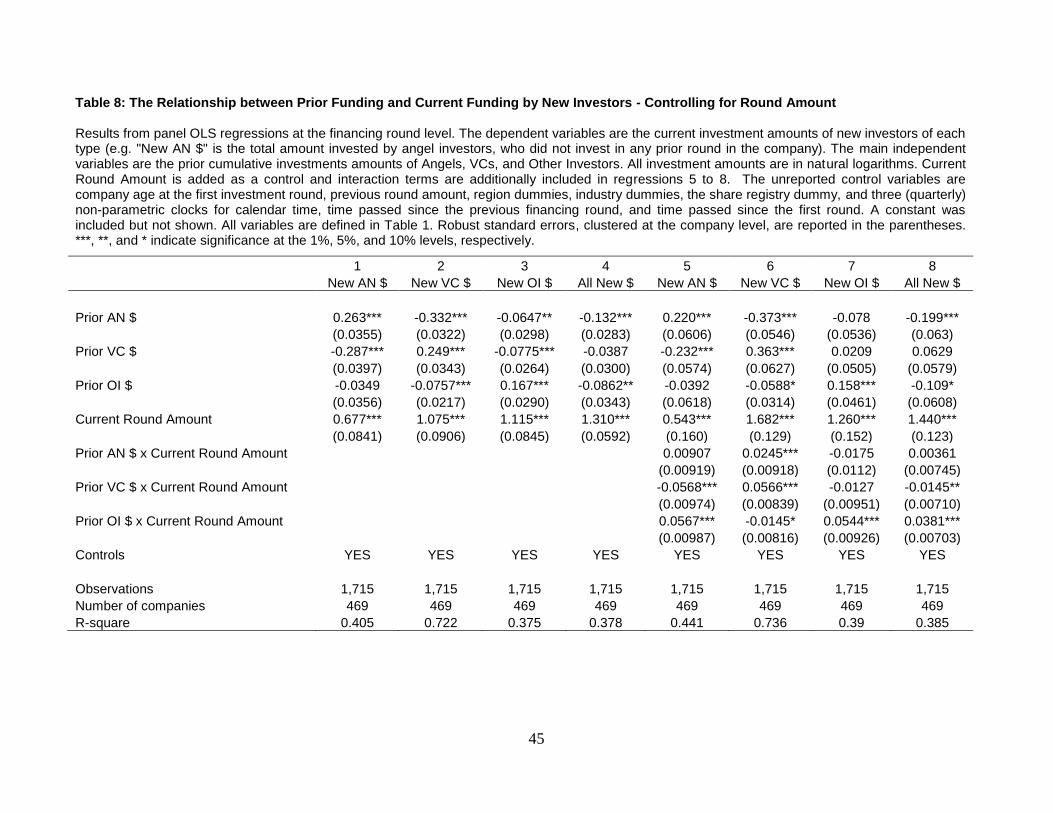
45
Table 8: The Relationship between Prior Funding and Current Funding by New Investors - Controlling for Round Amount Results from panel OLS regressions at the financing round level. The dependent variables are the current investment amounts of new investors of each type (e.g. "New AN $" is the total amount invested by angel investors, who did not invest in any prior round in the company). The main independent variables are the prior cumulative investments amounts of Angels, VCs, and Other Investors. All investment amounts are in natural logarithms. Current Round Amount is added as a control and interaction terms are additionally included in regressions 5 to 8. The unreported control variables are company age at the first investment round, previous round amount, region dummies, industry dummies, the share registry dummy, and three (quarterly) non-parametric clocks for calendar time, time passed since the previous financing round, and time passed since the first round. A constant was included but not shown. All variables are defined in Table 1. Robust standard errors, clustered at the company level, are reported in the parentheses. ***, **, and * indicate significance at the 1%, 5%, and 10% levels, respectively.
1 2 3 4 5 6 7 8
New AN $ New VC $ New OI $ All New $ New AN $ New VC $ New OI $ All New $
Prior AN $ 0.263*** -0.332*** -0.0647** -0.132*** 0.220*** -0.373*** -0.078 -0.199***
(0.0355) (0.0322) (0.0298) (0.0283) (0.0606) (0.0546) (0.0536) (0.063)
Prior VC $ -0.287*** 0.249*** -0.0775*** -0.0387 -0.232*** 0.363*** 0.0209 0.0629
(0.0397) (0.0343) (0.0264) (0.0300) (0.0574) (0.0627) (0.0505) (0.0579)
Prior OI $ -0.0349 -0.0757*** 0.167*** -0.0862** -0.0392 -0.0588* 0.158*** -0.109*
(0.0356) (0.0217) (0.0290) (0.0343) (0.0618) (0.0314) (0.0461) (0.0608)
Current Round Amount 0.677*** 1.075*** 1.115*** 1.310*** 0.543*** 1.682*** 1.260*** 1.440***
(0.0841) (0.0906) (0.0845) (0.0592) (0.160) (0.129) (0.152) (0.123)
Prior AN $ x Current Round Amount
0.00907 0.0245*** -0.0175 0.00361
(0.00919) (0.00918) (0.0112) (0.00745)
Prior VC $ x Current Round Amount
-0.0568*** 0.0566*** -0.0127 -0.0145**
(0.00974) (0.00839) (0.00951) (0.00710)
Prior OI $ x Current Round Amount
0.0567*** -0.0145* 0.0544*** 0.0381***
(0.00987) (0.00816) (0.00926) (0.00703)
Controls YES YES YES YES YES YES YES YES
Observations 1,715 1,715 1,715 1,715 1,715 1,715 1,715 1,715
Number of companies 469 469 469 469 469 469 469 469
R-square 0.405 0.722 0.375 0.378 0.441 0.736 0.39 0.385
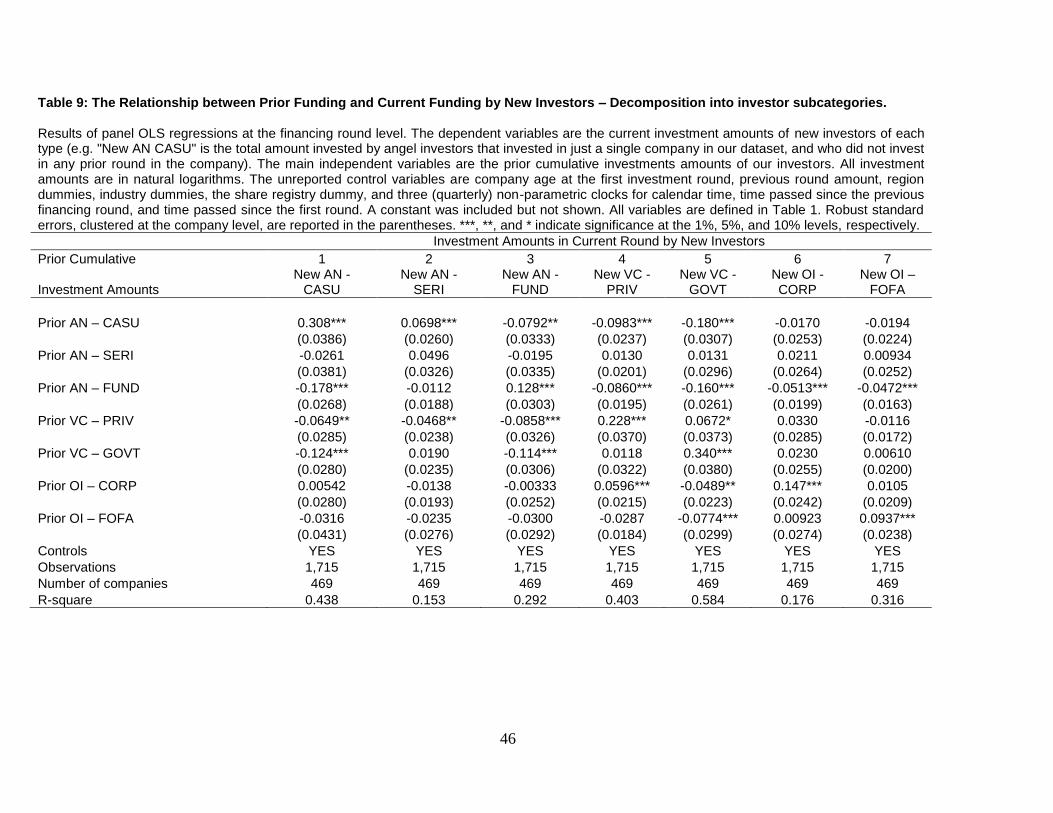
46
Table 9: The Relationship between Prior Funding and Current Funding by New Investors – Decomposition into investor subcategories. Results of panel OLS regressions at the financing round level. The dependent variables are the current investment amounts of new investors of each type (e.g. "New AN CASU" is the total amount invested by angel investors that invested in just a single company in our dataset, and who did not invest in any prior round in the company). The main independent variables are the prior cumulative investments amounts of our investors. All investment amounts are in natural logarithms. The unreported control variables are company age at the first investment round, previous round amount, region dummies, industry dummies, the share registry dummy, and three (quarterly) non-parametric clocks for calendar time, time passed since the previous financing round, and time passed since the first round. A constant was included but not shown. All variables are defined in Table 1. Robust standard errors, clustered at the company level, are reported in the parentheses. ***, **, and * indicate significance at the 1%, 5%, and 10% levels, respectively.
Investment Amounts in Current Round by New Investors
Prior Cumulative 1 2 3 4 5 6 7
Investment Amounts New AN -
CASU New AN -
SERI New AN -
FUND New VC -
PRIV New VC -
GOVT New OI - CORP
New OI – FOFA
Prior AN – CASU 0.308*** 0.0698*** -0.0792** -0.0983*** -0.180*** -0.0170 -0.0194
(0.0386) (0.0260) (0.0333) (0.0237) (0.0307) (0.0253) (0.0224)
Prior AN – SERI -0.0261 0.0496 -0.0195 0.0130 0.0131 0.0211 0.00934
(0.0381) (0.0326) (0.0335) (0.0201) (0.0296) (0.0264) (0.0252)
Prior AN – FUND -0.178*** -0.0112 0.128*** -0.0860*** -0.160*** -0.0513*** -0.0472***
(0.0268) (0.0188) (0.0303) (0.0195) (0.0261) (0.0199) (0.0163)
Prior VC – PRIV -0.0649** -0.0468** -0.0858*** 0.228*** 0.0672* 0.0330 -0.0116
(0.0285) (0.0238) (0.0326) (0.0370) (0.0373) (0.0285) (0.0172)
Prior VC – GOVT -0.124*** 0.0190 -0.114*** 0.0118 0.340*** 0.0230 0.00610
(0.0280) (0.0235) (0.0306) (0.0322) (0.0380) (0.0255) (0.0200)
Prior OI – CORP 0.00542 -0.0138 -0.00333 0.0596*** -0.0489** 0.147*** 0.0105
(0.0280) (0.0193) (0.0252) (0.0215) (0.0223) (0.0242) (0.0209)
Prior OI – FOFA -0.0316 -0.0235 -0.0300 -0.0287 -0.0774*** 0.00923 0.0937***
(0.0431) (0.0276) (0.0292) (0.0184) (0.0299) (0.0274) (0.0238)
Controls YES YES YES YES YES YES YES
Observations 1,715 1,715 1,715 1,715 1,715 1,715 1,715
Number of companies 469 469 469 469 469 469 469
R-square 0.438 0.153 0.292 0.403 0.584 0.176 0.316
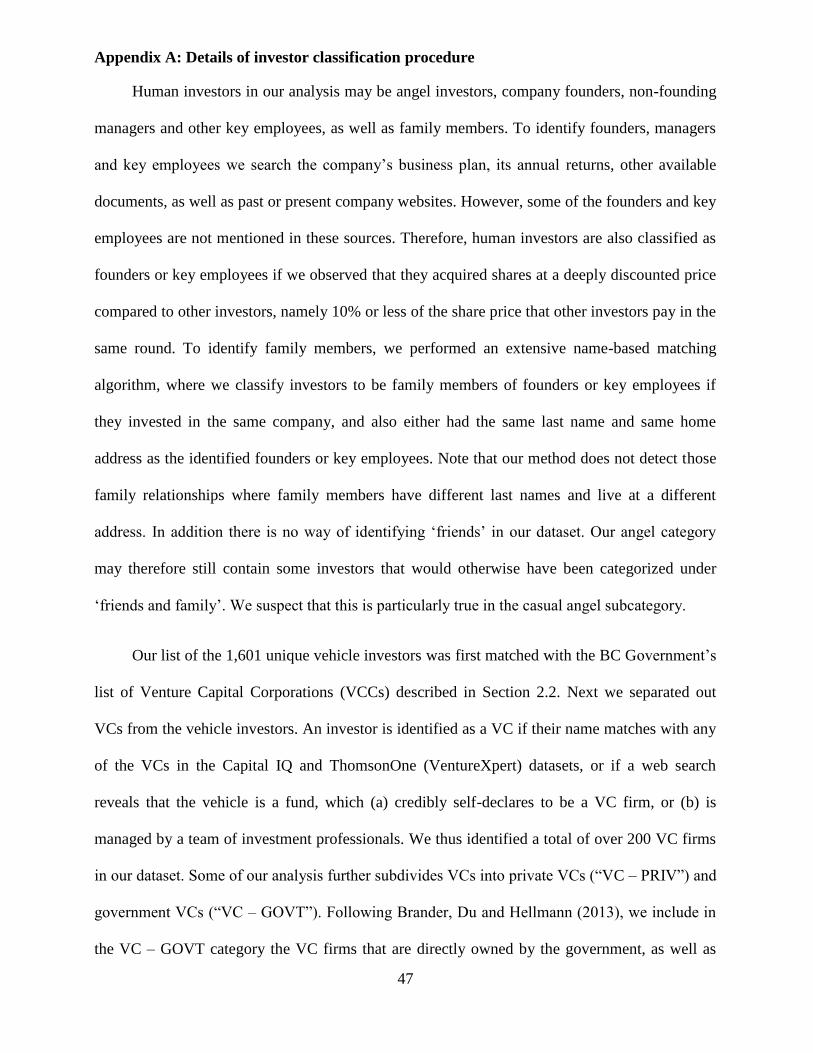
47
Appendix A: Details of investor classification procedure
Human investors in our analysis may be angel investors, company founders, non-founding
managers and other key employees, as well as family members. To identify founders, managers
and key employees we search the company’s business plan, its annual returns, other available
documents, as well as past or present company websites. However, some of the founders and key
employees are not mentioned in these sources. Therefore, human investors are also classified as
founders or key employees if we observed that they acquired shares at a deeply discounted price
compared to other investors, namely 10% or less of the share price that other investors pay in the
same round. To identify family members, we performed an extensive name-based matching
algorithm, where we classify investors to be family members of founders or key employees if
they invested in the same company, and also either had the same last name and same home
address as the identified founders or key employees. Note that our method does not detect those
family relationships where family members have different last names and live at a different
address. In addition there is no way of identifying ‘friends’ in our dataset. Our angel category
may therefore still contain some investors that would otherwise have been categorized under
‘friends and family’. We suspect that this is particularly true in the casual angel subcategory.
Our list of the 1,601 unique vehicle investors was first matched with the BC Government’s
list of Venture Capital Corporations (VCCs) described in Section 2.2. Next we separated out
VCs from the vehicle investors. An investor is identified as a VC if their name matches with any
of the VCs in the Capital IQ and ThomsonOne (VentureXpert) datasets, or if a web search
reveals that the vehicle is a fund, which (a) credibly self-declares to be a VC firm, or (b) is
managed by a team of investment professionals. We thus identified a total of over 200 VC firms
in our dataset. Some of our analysis further subdivides VCs into private VCs (“VC – PRIV”) and
government VCs (“VC – GOVT”). Following Brander, Du and Hellmann (2013), we include in
the VC – GOVT category the VC firms that are directly owned by the government, as well as

48
those that benefit substantially from government support, in our context most notably the Retail
VCCs (see Section 2.2).
The vehicle investors that remain after separating out the VCCs and VCs include: angel
investors that invested through vehicles, companies, and financial parties that are not VCs. We
adopted the following rules to classify these remaining vehicles. Trusts that carry the name of
individuals or families are classified as angel investors. We tried company registry and web
searches for all other vehicles – searches which included attempts with postal code, place name,
or other available information. These searches almost always led to one or more “hits”. Many
hits clearly demonstrate that the vehicles are firms which sell a real or financial product. If so
(and/or if the vehicle name suggests, it represents a firm which sells a real or financial product),
these vehicles were classified as OI – CORP. The vehicles with no, sparse or ambiguous search
returns were classified as angel investors if the vehicle name consists of the name of individuals
or families (possibly with add-ons such as “investments” or “fund”). If not, they are classified as
OI – CORP. This approach puts an emphasis on correctly identifying angel investors. That is, we
are unlikely to classify entities as angel investors if they are not; yet it is quite possible that some
angel investor vehicles were erroneously classified as OI – CORP. More generally speaking, OI
– CORP contains a heterogeneous group of vehicle investors that include a large variety of
manufacturing and professional service firms, financial institutions that are not VCs (e.g.,
banks), as well as a host of investment vehicles (e.g., real estate funds).