Embed Size (px)
Citation preview
2016 INVESTOR CONFERENCE12-14 October 2016 Park Hyatt Saigon, Ho Chi Minh
VinaCapital Vietnam Opportunity Fund
Andy HoChief Investment OfficerManaging Director
Click to edit Master title styleClick to edit Master title style
2
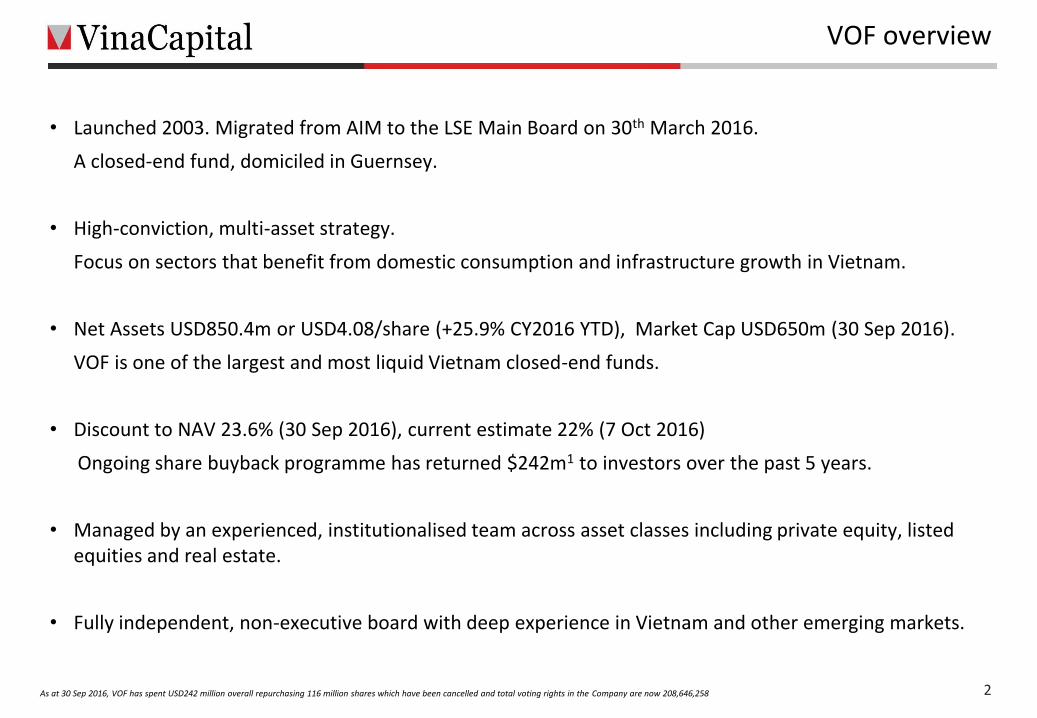
VOF overview
• Launched 2003. Migrated from AIM to the LSE Main Board on 30th March 2016.
A closed-end fund, domiciled in Guernsey.
• High-conviction, multi-asset strategy.
Focus on sectors that benefit from domestic consumption and infrastructure growth in Vietnam.
• Net Assets USD850.4m or USD4.08/share (+25.9% CY2016 YTD), Market Cap USD650m (30 Sep 2016).
VOF is one of the largest and most liquid Vietnam closed-end funds.
• Discount to NAV 23.6% (30 Sep 2016), current estimate 22% (7 Oct 2016)
Ongoing share buyback programme has returned $242m1 to investors over the past 5 years.
• Managed by an experienced, institutionalised team across asset classes including private equity, listed equities and real estate.
• Fully independent, non-executive board with deep experience in Vietnam and other emerging markets.
As at 30 Sep 2016, VOF has spent USD242 million overall repurchasing 116 million shares which have been cancelled and total voting rights in the Company are now 208,646,258
Click to edit Master title styleClick to edit Master title style
Why VOF
Click to edit Master title styleClick to edit Master title style
4
VOF strategy
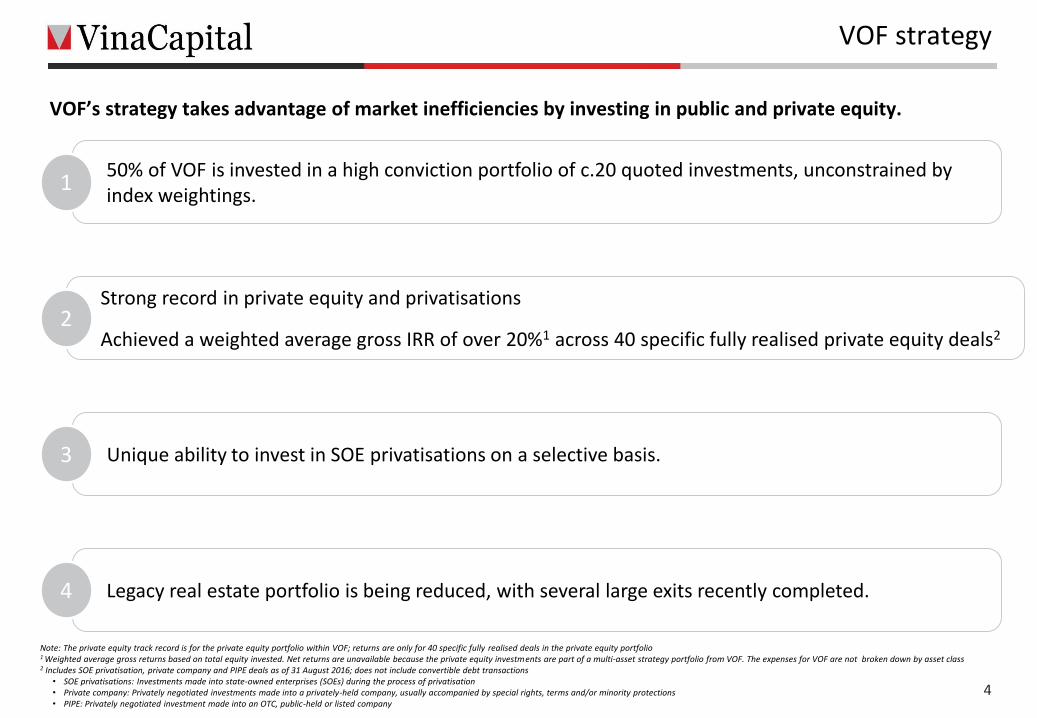
VOF’s strategy takes advantage of market inefficiencies by investing in public and private equity.
50% of VOF is invested in a high conviction portfolio of c.20 quoted investments, unconstrained by index weightings.
1
Strong record in private equity and privatisations
Achieved a weighted average gross IRR of over 20%1 across 40 specific fully realised private equity deals22
Unique ability to invest in SOE privatisations on a selective basis.3
Legacy real estate portfolio is being reduced, with several large exits recently completed.4
Note: The private equity track record is for the private equity portfolio within VOF; returns are only for 40 specific fully realised deals in the private equity portfolio1 Weighted average gross returns based on total equity invested. Net returns are unavailable because the private equity investments are part of a multi-asset strategy portfolio from VOF. The expenses for VOF are not broken down by asset class2 Includes SOE privatisation, private company and PIPE deals as of 31 August 2016; does not include convertible debt transactions
• SOE privatisations: Investments made into state-owned enterprises (SOEs) during the process of privatisation• Private company: Privately negotiated investments made into a privately-held company, usually accompanied by special rights, terms and/or minority protections• PIPE: Privately negotiated investment made into an OTC, public-held or listed company
Click to edit Master title styleClick to edit Master title style
Annualised returns
Asset class1 FY2016 Last 3 years1 Last 5 years1
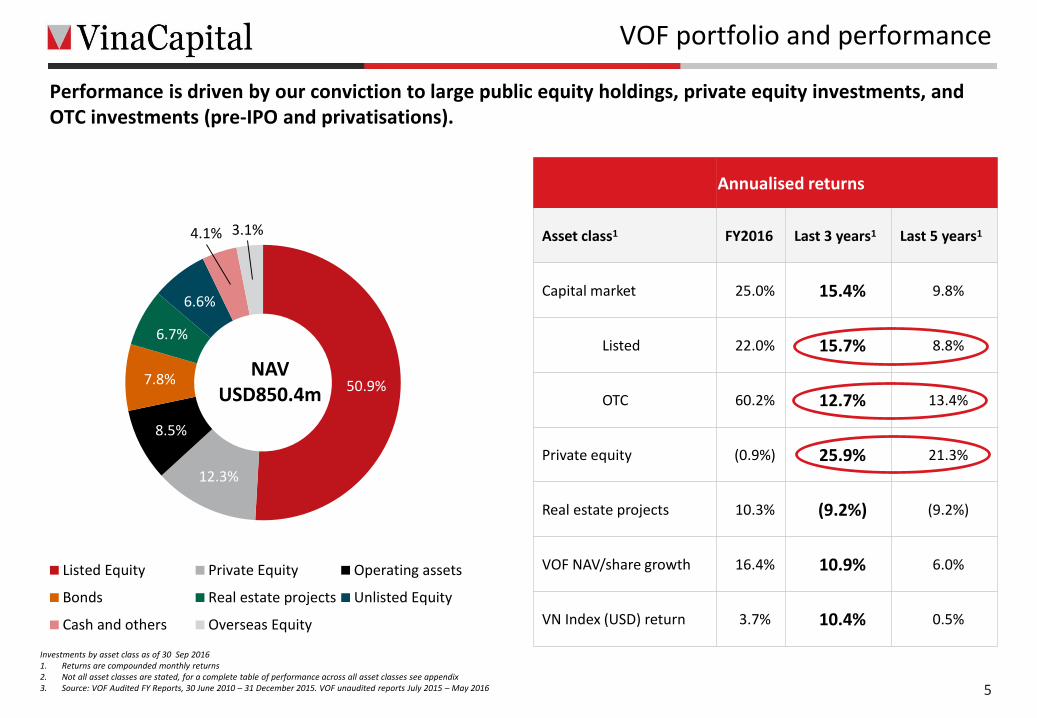
Capital market 25.0% 15.4% 9.8%
Listed 22.0% 15.7% 8.8%
OTC 60.2% 12.7% 13.4%
Private equity (0.9%) 25.9% 21.3%
Real estate projects 10.3% (9.2%) (9.2%)
VOF NAV/share growth 16.4% 10.9% 6.0%
VN Index (USD) return 3.7% 10.4% 0.5%
5
VOF portfolio and performance
Investments by asset class as of 30 Sep 20161. Returns are compounded monthly returns2. Not all asset classes are stated, for a complete table of performance across all asset classes see appendix3. Source: VOF Audited FY Reports, 30 June 2010 – 31 December 2015. VOF unaudited reports July 2015 – May 2016
Performance is driven by our conviction to large public equity holdings, private equity investments, and OTC investments (pre-IPO and privatisations).
NAVUSD850.4m 50.9%
12.3%
8.5%
7.8%
6.7%
6.6%
4.1% 3.1%
Listed Equity Private Equity Operating assets
Bonds Real estate projects Unlisted Equity
Cash and others Overseas Equity
Click to edit Master title styleClick to edit Master title style
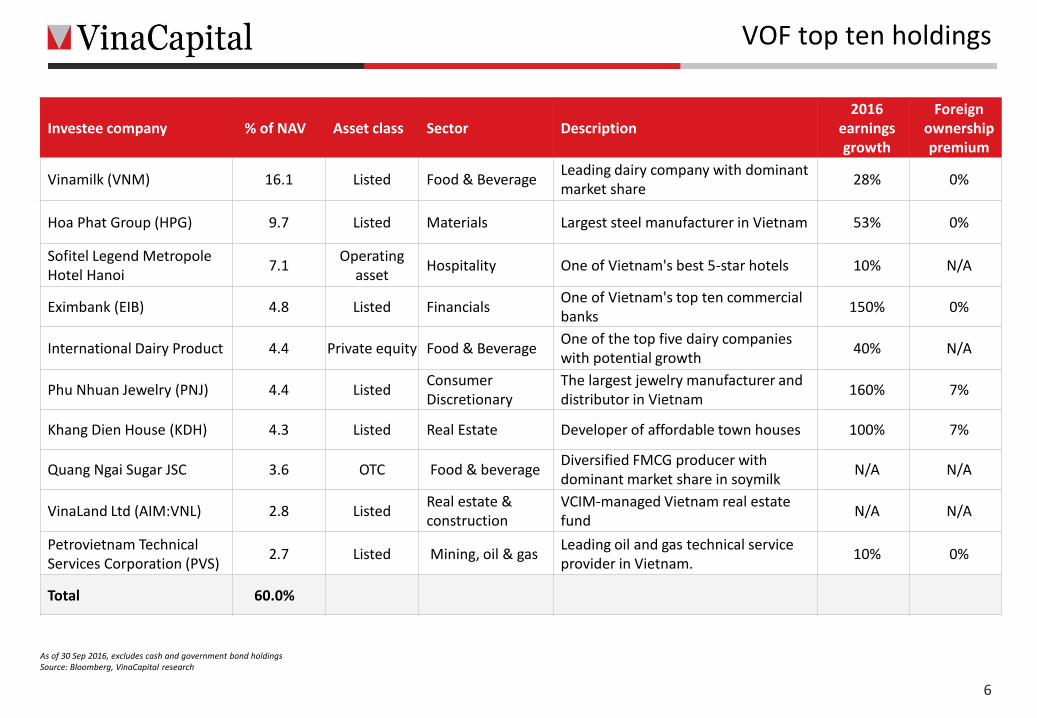
As of 30 Sep 2016, excludes cash and government bond holdingsSource: Bloomberg, VinaCapital research
6
VOF top ten holdings
Investee company % of NAV Asset class Sector Description2016
earnings growth
Foreignownership premium
Vinamilk (VNM) 16.1 Listed Food & BeverageLeading dairy company with dominant market share
28% 0%
Hoa Phat Group (HPG) 9.7 Listed Materials Largest steel manufacturer in Vietnam 53% 0%
Sofitel Legend MetropoleHotel Hanoi
7.1Operating
assetHospitality One of Vietnam's best 5-star hotels 10% N/A
Eximbank (EIB) 4.8 Listed FinancialsOne of Vietnam's top ten commercial banks
150% 0%
International Dairy Product 4.4 Private equity Food & BeverageOne of the top five dairy companies with potential growth
40% N/A
Phu Nhuan Jewelry (PNJ) 4.4 ListedConsumer Discretionary
The largest jewelry manufacturer and distributor in Vietnam
160% 7%
Khang Dien House (KDH) 4.3 Listed Real Estate Developer of affordable town houses 100% 7%
Quang Ngai Sugar JSC 3.6 OTC Food & beverage Diversified FMCG producer with dominant market share in soymilk
N/A N/A
VinaLand Ltd (AIM:VNL) 2.8 ListedReal estate & construction
VCIM-managed Vietnam real estate fund
N/A N/A
Petrovietnam Technical Services Corporation (PVS)
2.7 Listed Mining, oil & gas Leading oil and gas technical service provider in Vietnam.
10% 0%
Total 60.0%
Click to edit Master title styleClick to edit Master title style
7
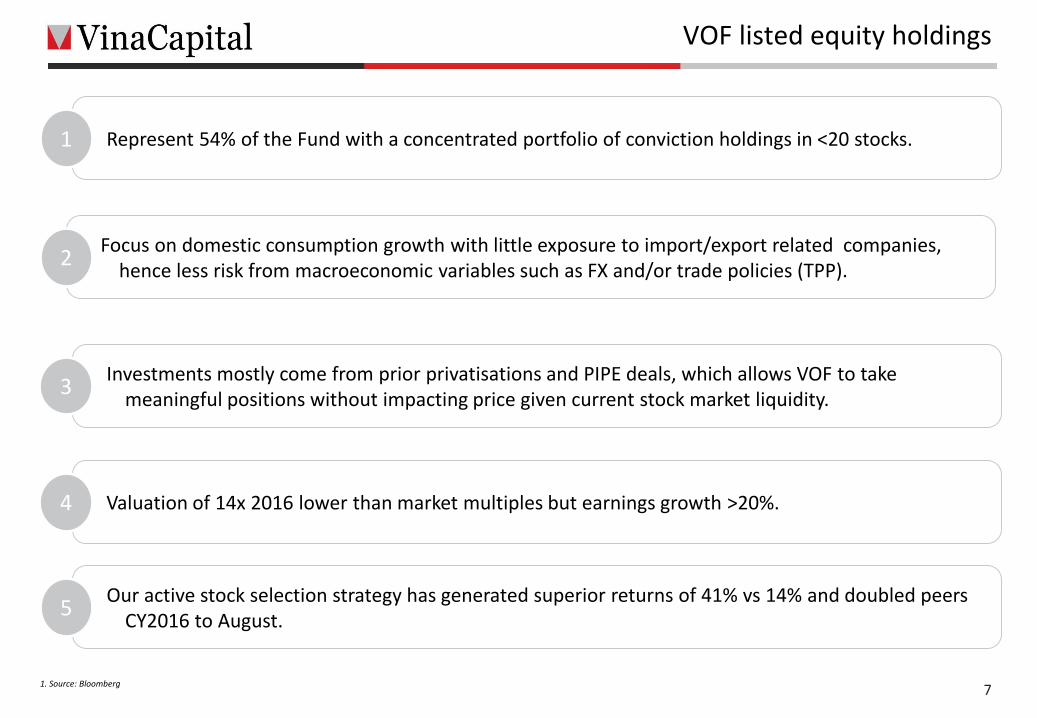
VOF listed equity holdings
1. Source: Bloomberg
Represent 54% of the Fund with a concentrated portfolio of conviction holdings in <20 stocks.1
Focus on domestic consumption growth with little exposure to import/export related companies, hence less risk from macroeconomic variables such as FX and/or trade policies (TPP).
2
Investments mostly come from prior privatisations and PIPE deals, which allows VOF to take meaningful positions without impacting price given current stock market liquidity.
3
Valuation of 14x 2016 lower than market multiples but earnings growth >20%.4
Our active stock selection strategy has generated superior returns of 41% vs 14% and doubled peers CY2016 to August.
5
Click to edit Master title styleClick to edit Master title style
Vietnam Stock Market
Click to edit Master title styleClick to edit Master title style
9
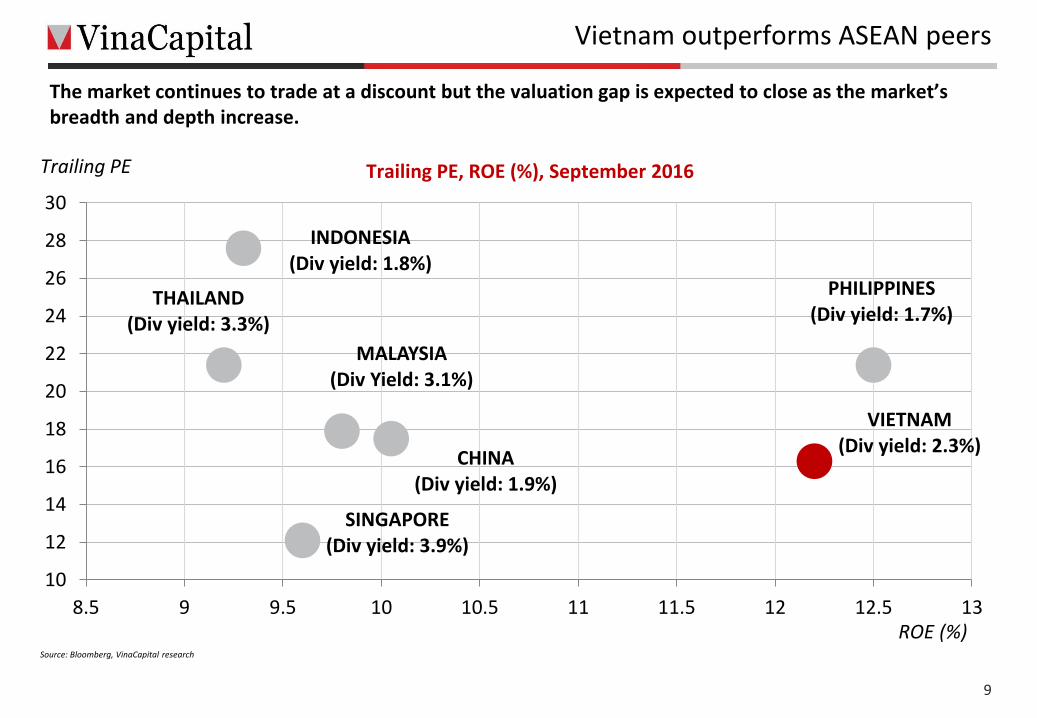
Vietnam outperforms ASEAN peers
Source: Bloomberg, VinaCapital research
The market continues to trade at a discount but the valuation gap is expected to close as the market’s breadth and depth increase.
Trailing PE, ROE (%), September 2016
ROE (%)
Trailing PE
VIETNAM(Div yield: 2.3%)
SINGAPORE(Div yield: 3.9%)
THAILAND(Div yield: 3.3%)
MALAYSIA(Div Yield: 3.1%)
INDONESIA(Div yield: 1.8%)
CHINA(Div yield: 1.9%)
PHILIPPINES(Div yield: 1.7%)
10
12
14
16
18
20
22
24
26
28
30
8.5 9 9.5 10 10.5 11 11.5 12 12.5 13
Click to edit Master title styleClick to edit Master title style
10
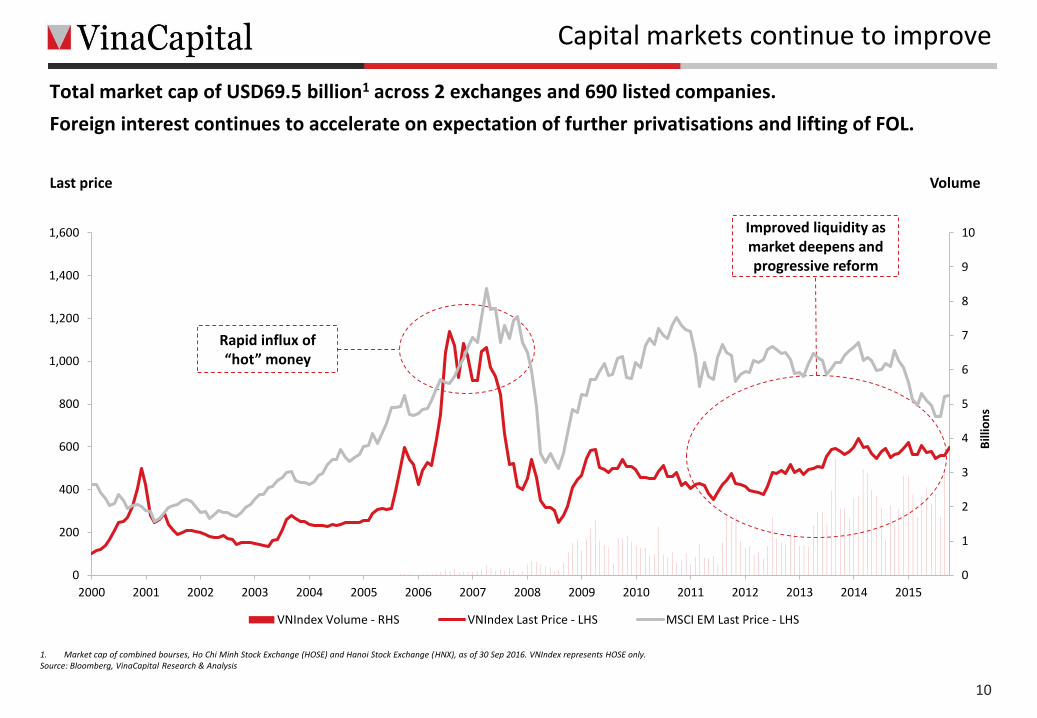
Capital markets continue to improve
Total market cap of USD69.5 billion1 across 2 exchanges and 690 listed companies.
Foreign interest continues to accelerate on expectation of further privatisations and lifting of FOL.
1. Market cap of combined bourses, Ho Chi Minh Stock Exchange (HOSE) and Hanoi Stock Exchange (HNX), as of 30 Sep 2016. VNIndex represents HOSE only.Source: Bloomberg, VinaCapital Research & Analysis
Last price Volume
Improved liquidity as market deepens and progressive reform
Rapid influx of “hot” money
0
1
2
3
4
5
6
7
8
9
10
0
200
400
600
800
1,000
1,200
1,400
1,600
2000 2001 2002 2003 2004 2005 2006 2007 2008 2009 2010 2011 2012 2013 2014 2015
Bill
ion
s
VNIndex Volume - RHS VNIndex Last Price - LHS MSCI EM Last Price - LHS
Click to edit Master title styleClick to edit Master title style
11
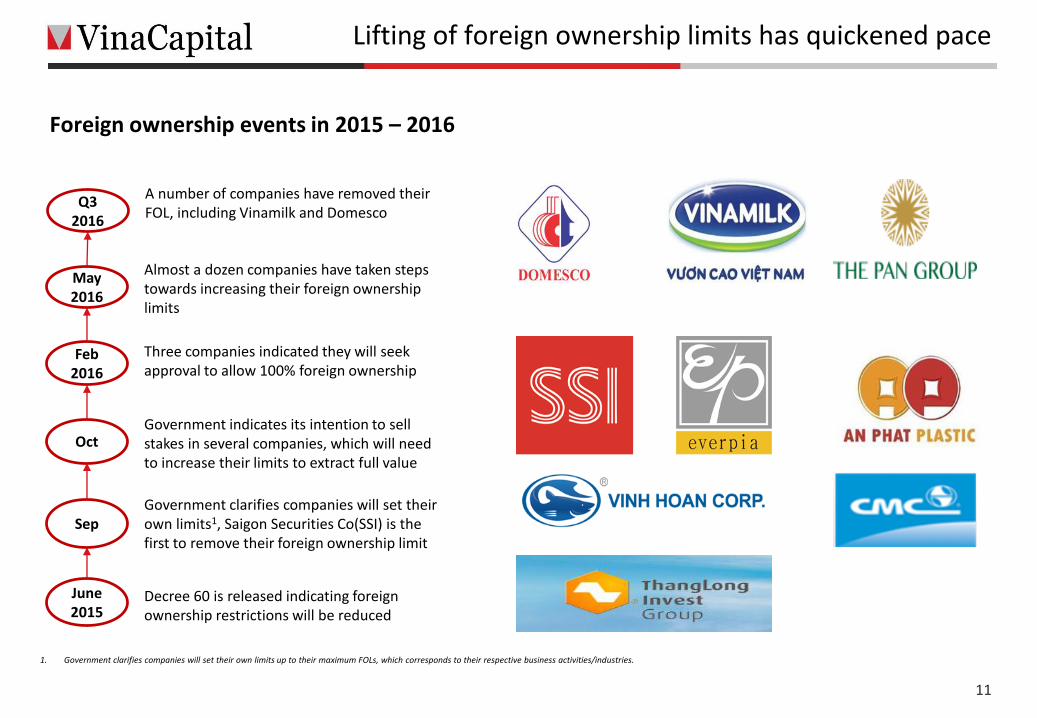
1. Government clarifies companies will set their own limits up to their maximum FOLs, which corresponds to their respective business activities/industries.
May 2016
Almost a dozen companies have taken steps towards increasing their foreign ownership limits
Feb 2016
Three companies indicated they will seek approval to allow 100% foreign ownership
Government indicates its intention to sell stakes in several companies, which will need to increase their limits to extract full value
Oct
SepGovernment clarifies companies will set their own limits1, Saigon Securities Co(SSI) is the first to remove their foreign ownership limit
June2015
Decree 60 is released indicating foreign ownership restrictions will be reduced
Lifting of foreign ownership limits has quickened pace
Foreign ownership events in 2015 – 2016
Q3 2016
A number of companies have removed their FOL, including Vinamilk and Domesco
Click to edit Master title styleClick to edit Master title style
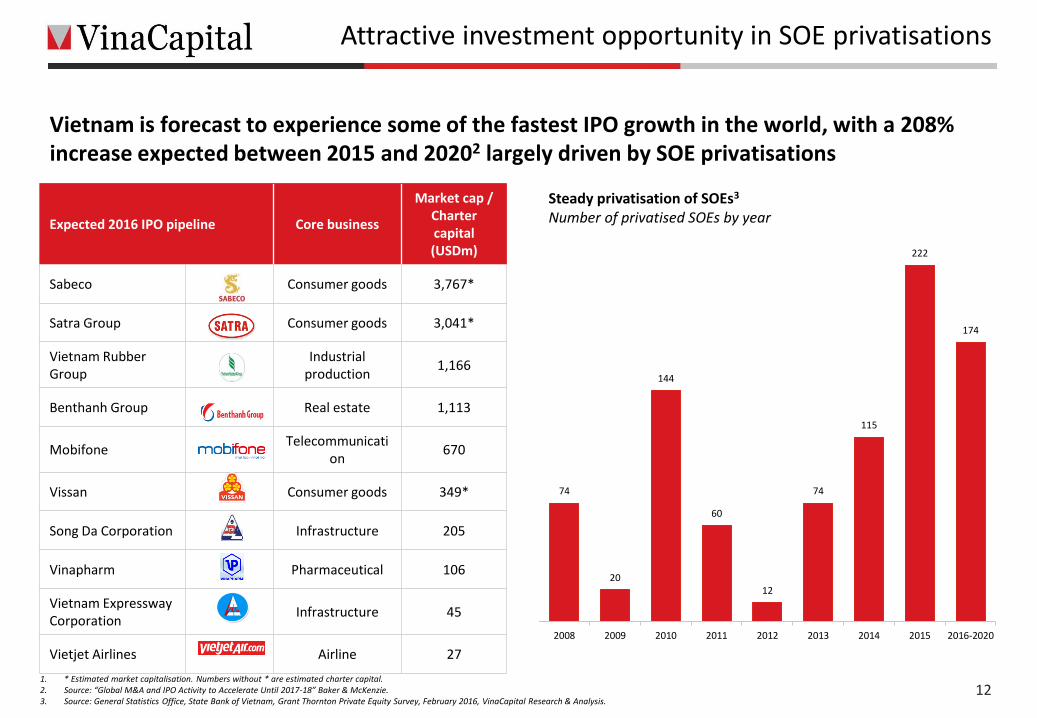
74
20
144
60
12
74
115
222
174
2008 2009 2010 2011 2012 2013 2014 2015 2016-2020
Steady privatisation of SOEs3
Number of privatised SOEs by year
Attractive investment opportunity in SOE privatisations
Expected 2016 IPO pipeline Core business
Market cap / Charter capital(USDm)
Sabeco Consumer goods 3,767*
Satra Group Consumer goods 3,041*
Vietnam Rubber Group
Industrial production
1,166
Benthanh Group Real estate 1,113
MobifoneTelecommunicati
on670
Vissan Consumer goods 349*
Song Da Corporation Infrastructure 205
Vinapharm Pharmaceutical 106
Vietnam Expressway Corporation
Infrastructure 45
Vietjet Airlines Airline 27
Vietnam is forecast to experience some of the fastest IPO growth in the world, with a 208% increase expected between 2015 and 20202 largely driven by SOE privatisations
1. * Estimated market capitalisation. Numbers without * are estimated charter capital.2. Source: “Global M&A and IPO Activity to Accelerate Until 2017-18” Baker & McKenzie.3. Source: General Statistics Office, State Bank of Vietnam, Grant Thornton Private Equity Survey, February 2016, VinaCapital Research & Analysis.
12
Click to edit Master title styleClick to edit Master title style
13
Private equity overview
The fund continues to review both government and private opportunities
PE is focusing on private companies particularly in the consumer and infrastructure sectors to gain exposure to Vietnam’s growing middle class and the government’s plan to spend USD2.5b per year over the next five years.
2
Currently 12%, the PE portion of the fund will increase to 20% in the next 1-2 years, and we are reviewing a dozen transactions worth >USD100m.
3
VOF’s PE team has generated superior returns of over 20% over 40 fully realised investments.1
Note: The private equity track record is for the private equity portfolio within VOF; returns are only for 40 specific fully realised deals in the private equity portfolio
Click to edit Master title styleClick to edit Master title style
14
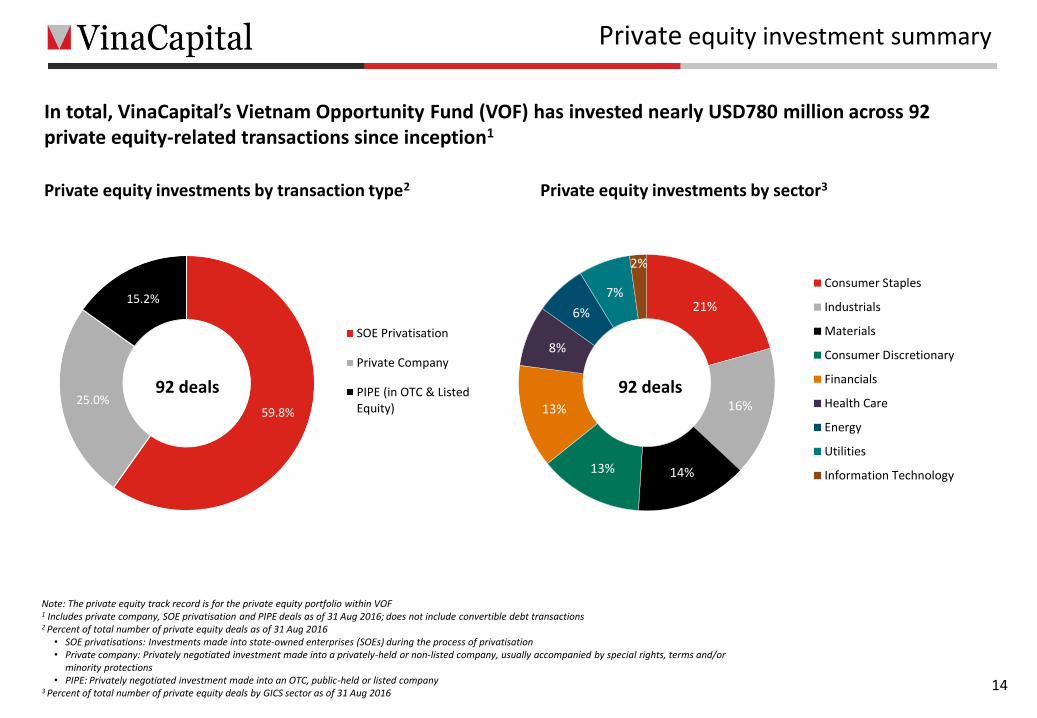
In total, VinaCapital’s Vietnam Opportunity Fund (VOF) has invested nearly USD780 million across 92 private equity-related transactions since inception1
Investments by Type of Deal2 Investments by Sector3
Private equity investments by transaction type2 Private equity investments by sector33
Private equity investment summary
Note: The private equity track record is for the private equity portfolio within VOF1 Includes private company, SOE privatisation and PIPE deals as of 31 Aug 2016; does not include convertible debt transactions2 Percent of total number of private equity deals as of 31 Aug 2016
• SOE privatisations: Investments made into state-owned enterprises (SOEs) during the process of privatisation • Private company: Privately negotiated investment made into a privately-held or non-listed company, usually accompanied by special rights, terms and/or
minority protections• PIPE: Privately negotiated investment made into an OTC, public-held or listed company
3 Percent of total number of private equity deals by GICS sector as of 31 Aug 2016
59.8%25.0%
15.2%
SOE Privatisation
Private Company
PIPE (in OTC & ListedEquity)
92 deals
21%
16%
14%13%
13%
8%
6%
7%
2%
Consumer Staples
Industrials
Materials
Consumer Discretionary
Financials
Health Care
Energy
Utilities
Information Technology
92 deals
Click to edit Master title styleClick to edit Master title styleActively participate in private equity investments
Transaction summary Investment returns Bo
ard
m
emb
ersh
ip
Stra
tegi
c ad
viso
ry &
mar
ket
rese
arch
Lead
ersh
ip
Rec
ruit
men
t&
HR
Bu
sin
ess
dev
elo
pm
ent
Co
rpo
rate
go
vern
ance
Op
erat
ion
alsu
pp
ort
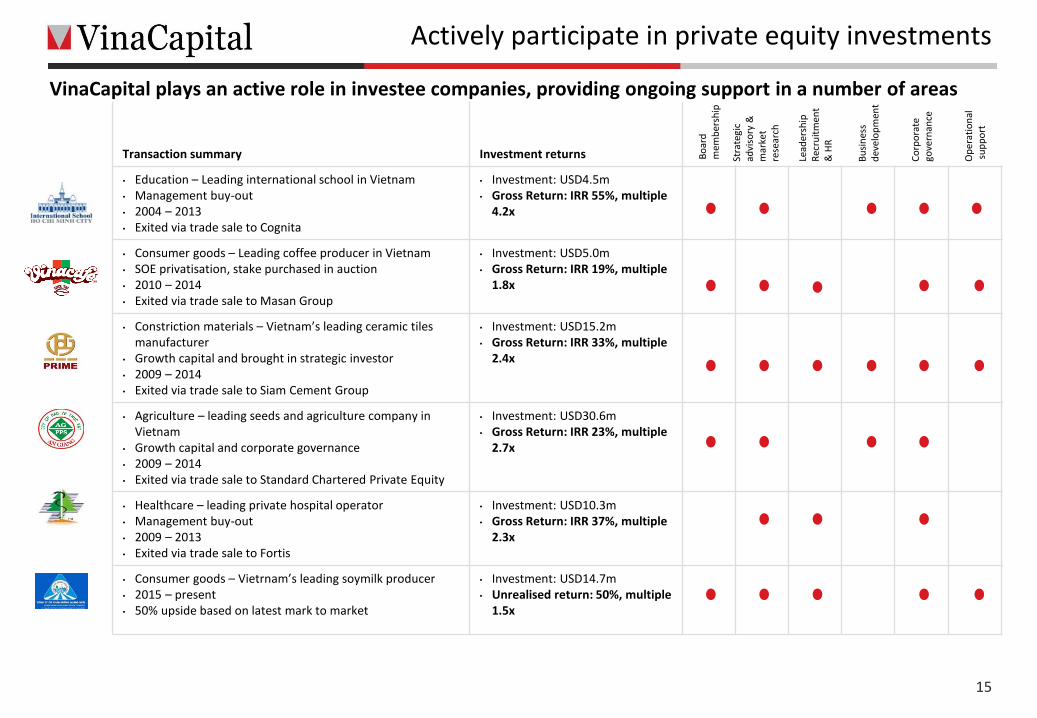
• Education – Leading international school in Vietnam• Management buy-out• 2004 – 2013 • Exited via trade sale to Cognita
• Investment: USD4.5m• Gross Return: IRR 55%, multiple
4.2x
• Consumer goods – Leading coffee producer in Vietnam• SOE privatisation, stake purchased in auction• 2010 – 2014 • Exited via trade sale to Masan Group
• Investment: USD5.0m • Gross Return: IRR 19%, multiple
1.8x
• Constriction materials – Vietnam’s leading ceramic tiles manufacturer
• Growth capital and brought in strategic investor• 2009 – 2014 • Exited via trade sale to Siam Cement Group
• Investment: USD15.2m • Gross Return: IRR 33%, multiple
2.4x
• Agriculture – leading seeds and agriculture company in Vietnam
• Growth capital and corporate governance• 2009 – 2014 • Exited via trade sale to Standard Chartered Private Equity
• Investment: USD30.6m • Gross Return: IRR 23%, multiple
2.7x
• Healthcare – leading private hospital operator• Management buy-out• 2009 – 2013• Exited via trade sale to Fortis
• Investment: USD10.3m• Gross Return: IRR 37%, multiple
2.3x
• Consumer goods – Vietrnam’s leading soymilk producer• 2015 – present • 50% upside based on latest mark to market
• Investment: USD14.7m• Unrealised return: 50%, multiple
1.5x
VinaCapital plays an active role in investee companies, providing ongoing support in a number of areas
15
Click to edit Master title styleClick to edit Master title style
16
Case study of private company (current investment): An Cuong Woodworking
1. Source: 2015 GSO Statistical Yearbook.2. Source: BMI, PwC Estimates.
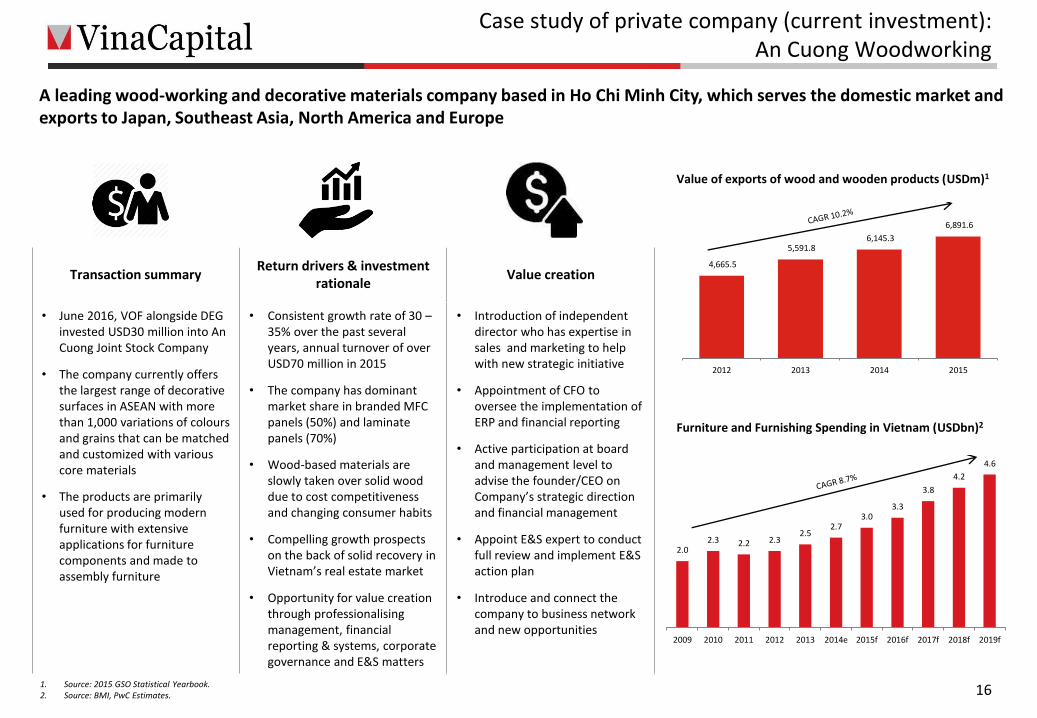
A leading wood-working and decorative materials company based in Ho Chi Minh City, which serves the domestic market and exports to Japan, Southeast Asia, North America and Europe
Transaction summaryReturn drivers & investment
rationaleValue creation
• June 2016, VOF alongside DEG invested USD30 million into An Cuong Joint Stock Company
• The company currently offers the largest range of decorative surfaces in ASEAN with more than 1,000 variations of coloursand grains that can be matchedand customized with various core materials
• The products are primarily used for producing modern furniture with extensive applications for furniture components and made to assembly furniture
• Consistent growth rate of 30 –35% over the past several years, annual turnover of over USD70 million in 2015
• The company has dominant market share in branded MFC panels (50%) and laminate panels (70%)
• Wood-based materials are slowly taken over solid wood due to cost competitiveness and changing consumer habits
• Compelling growth prospects on the back of solid recovery in Vietnam’s real estate market
• Opportunity for value creation through professionalisingmanagement, financial reporting & systems, corporate governance and E&S matters
• Introduction of independent director who has expertise in sales and marketing to help with new strategic initiative
• Appointment of CFO to oversee the implementation of ERP and financial reporting
• Active participation at board and management level to advise the founder/CEO on Company’s strategic direction and financial management
• Appoint E&S expert to conduct full review and implement E&S action plan
• Introduce and connect the company to business network and new opportunities
2.02.3 2.2 2.3
2.52.7
3.03.3
3.8
4.2
4.6
2009 2010 2011 2012 2013 2014e 2015f 2016f 2017f 2018f 2019f
Furniture and Furnishing Spending in Vietnam (USDbn)2
Value of exports of wood and wooden products (USDm)1
4,665.5
5,591.8 6,145.3
6,891.6
2012 2013 2014 2015
Click to edit Master title styleClick to edit Master title style
17
Case study of SOE privatisation (current investment): Vinatex – Vietnam National Textile & Garment Group
Transaction summaryReturn drivers & investment
rationaleValue creation
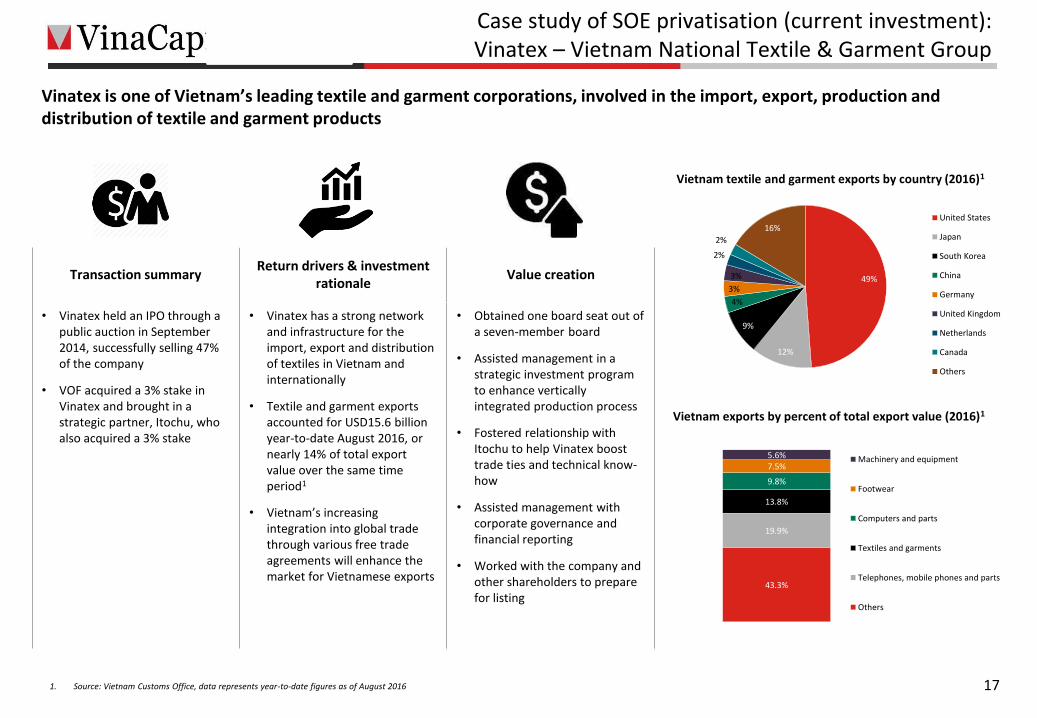
• Vinatex held an IPO through a public auction in September 2014, successfully selling 47% of the company
• VOF acquired a 3% stake in Vinatex and brought in a strategic partner, Itochu, who also acquired a 3% stake
• Vinatex has a strong network and infrastructure for the import, export and distribution of textiles in Vietnam and internationally
• Textile and garment exports accounted for USD15.6 billion year-to-date August 2016, or nearly 14% of total export value over the same time period1
• Vietnam’s increasing integration into global trade through various free trade agreements will enhance the market for Vietnamese exports
• Obtained one board seat out of a seven-member board
• Assisted management in a strategic investment program to enhance vertically integrated production process
• Fostered relationship with Itochu to help Vinatex boost trade ties and technical know-how
• Assisted management with corporate governance and financial reporting
• Worked with the company and other shareholders to prepare for listing
Vinatex is one of Vietnam’s leading textile and garment corporations, involved in the import, export, production and distribution of textile and garment products
Vietnam exports by percent of total export value (2016)1
Vietnam textile and garment exports by country (2016)1
49%
12%
9%
4%
3%
3%
2%
2%
16%United States
Japan
South Korea
China
Germany
United Kingdom
Netherlands
Canada
Others
43.3%
19.9%
13.8%
9.8%
7.5%5.6% Machinery and equipment
Footwear
Computers and parts
Textiles and garments
Telephones, mobile phones and parts
Others
1. Source: Vietnam Customs Office, data represents year-to-date figures as of August 2016
Click to edit Master title styleClick to edit Master title style
18
Case study of SOE privatisation (exited investment): DHG Pharmaceutical JSC
1. Source: Drugs Administration of Vietnam
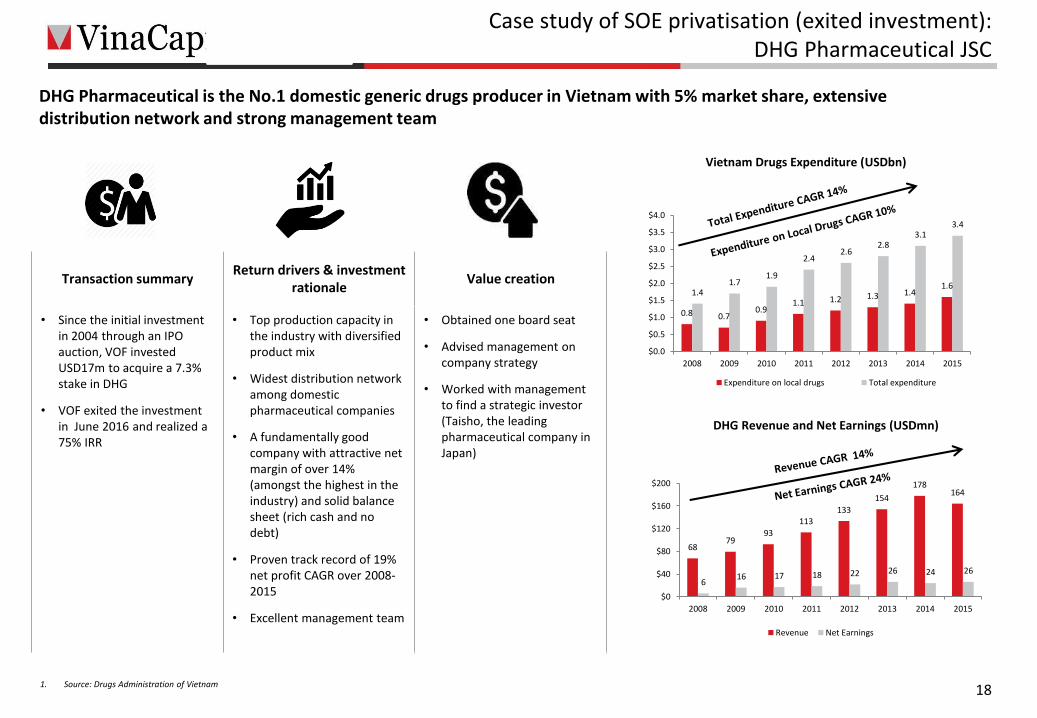
DHG Pharmaceutical is the No.1 domestic generic drugs producer in Vietnam with 5% market share, extensive distribution network and strong management team
6879
93
113133
154
178164
616 17 18 22 26 24 26
$0
$40
$80
$120
$160
$200
2008 2009 2010 2011 2012 2013 2014 2015
DHG Revenue and Net Earnings (USDmn)
Revenue Net Earnings
0.8 0.70.9
1.1 1.2 1.3 1.41.6
1.41.7
1.9
2.42.6
2.83.1
3.4
$0.0
$0.5
$1.0
$1.5
$2.0
$2.5
$3.0
$3.5
$4.0
2008 2009 2010 2011 2012 2013 2014 2015
Vietnam Drugs Expenditure (USDbn)
Expenditure on local drugs Total expenditure
Transaction summaryReturn drivers & investment
rationaleValue creation
• Since the initial investment in 2004 through an IPO auction, VOF invested USD17m to acquire a 7.3% stake in DHG
• VOF exited the investment in June 2016 and realized a 75% IRR
• Top production capacity in the industry with diversified product mix
• Widest distribution network among domestic pharmaceutical companies
• A fundamentally good company with attractive net margin of over 14% (amongst the highest in the industry) and solid balance sheet (rich cash and no debt)
• Proven track record of 19% net profit CAGR over 2008-2015
• Excellent management team
• Obtained one board seat
• Advised management on company strategy
• Worked with management to find a strategic investor(Taisho, the leading pharmaceutical company in Japan)
Click to edit Master title styleClick to edit Master title style
191. Source: VinaCapital Research & Analysis, CBRE Vietnam
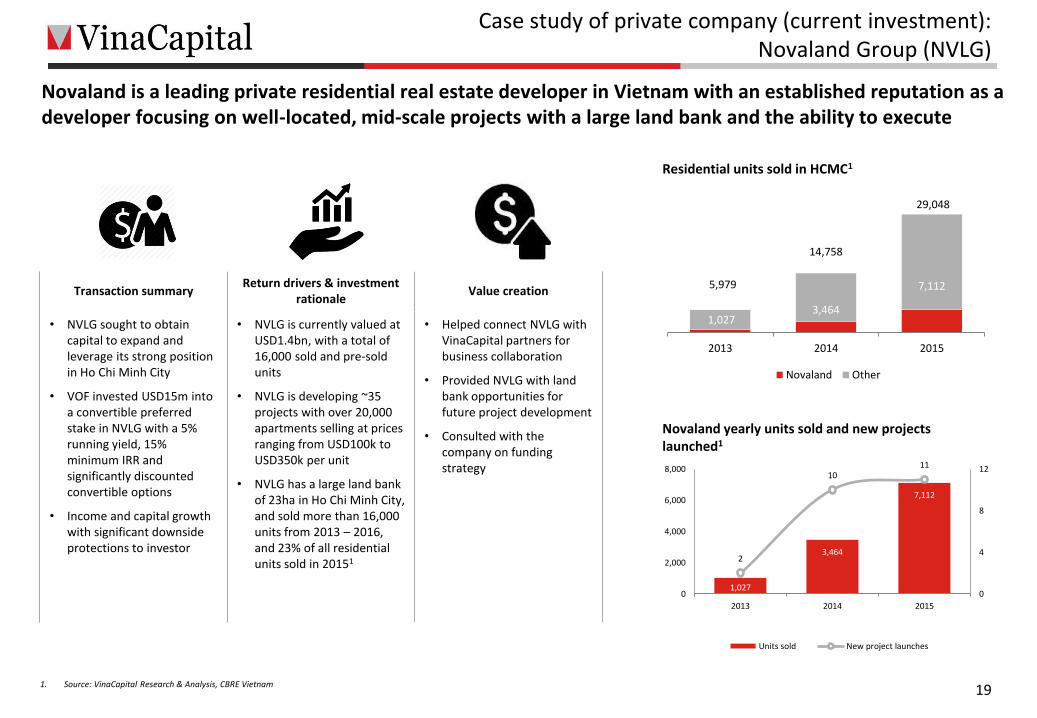
Case study of private company (current investment):Novaland Group (NVLG)
Transaction summaryReturn drivers & investment
rationaleValue creation
• NVLG sought to obtain capital to expand and leverage its strong position in Ho Chi Minh City
• VOF invested USD15m into a convertible preferred stake in NVLG with a 5% running yield, 15% minimum IRR and significantly discounted convertible options
• Income and capital growth with significant downside protections to investor
• NVLG is currently valued at USD1.4bn, with a total of 16,000 sold and pre-sold units
• NVLG is developing ~35 projects with over 20,000 apartments selling at prices ranging from USD100k to USD350k per unit
• NVLG has a large land bank of 23ha in Ho Chi Minh City, and sold more than 16,000 units from 2013 – 2016, and 23% of all residential units sold in 20151
• Helped connect NVLG with VinaCapital partners for business collaboration
• Provided NVLG with land bank opportunities for future project development
• Consulted with the company on funding strategy
Novaland is a leading private residential real estate developer in Vietnam with an established reputation as a developer focusing on well-located, mid-scale projects with a large land bank and the ability to execute
1,027
3,464
7,112
2
1011
0
4
8
12
0
2,000
4,000
6,000
8,000
2013 2014 2015
Units sold New project launches
Novaland yearly units sold and new projectslaunched1
Residential units sold in HCMC1
1,0273,464
7,1125,979
14,758
29,048
2013 2014 2015
Novaland Other
Click to edit Master title styleClick to edit Master title style
20
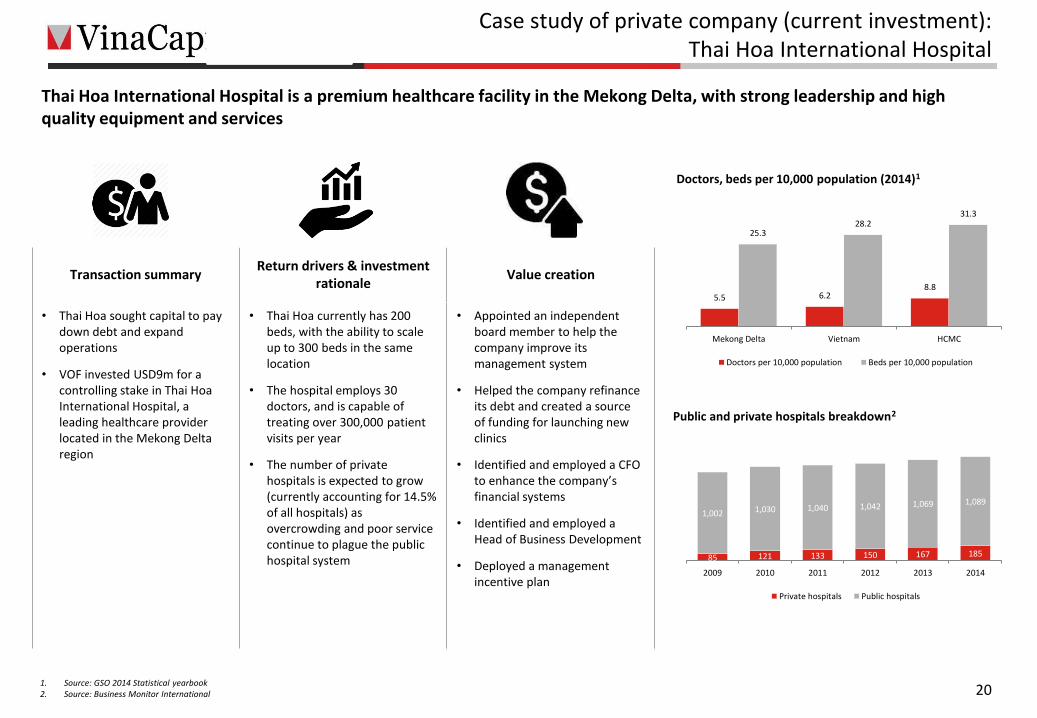
Case study of private company (current investment):Thai Hoa International Hospital
1. Source: GSO 2014 Statistical yearbook2. Source: Business Monitor International
Transaction summaryReturn drivers & investment
rationaleValue creation
• Thai Hoa sought capital to pay down debt and expand operations
• VOF invested USD9m for a controlling stake in Thai Hoa International Hospital, a leading healthcare provider located in the Mekong Delta region
• Thai Hoa currently has 200 beds, with the ability to scale up to 300 beds in the same location
• The hospital employs 30 doctors, and is capable of treating over 300,000 patient visits per year
• The number of private hospitals is expected to grow (currently accounting for 14.5% of all hospitals) as overcrowding and poor service continue to plague the public hospital system
• Appointed an independent board member to help the company improve its management system
• Helped the company refinance its debt and created a source of funding for launching new clinics
• Identified and employed a CFO to enhance the company’s financial systems
• Identified and employed a Head of Business Development
• Deployed a management incentive plan
Thai Hoa International Hospital is a premium healthcare facility in the Mekong Delta, with strong leadership and high quality equipment and services
5.5 6.28.8
25.328.2
31.3
Mekong Delta Vietnam HCMC
Doctors per 10,000 population Beds per 10,000 population
Public and private hospitals breakdown2
Doctors, beds per 10,000 population (2014)1
85 121 133 150 167 185
1,002 1,030 1,040 1,042 1,069 1,089
2009 2010 2011 2012 2013 2014
Private hospitals Public hospitals
Click to edit Master title styleClick to edit Master title style
21
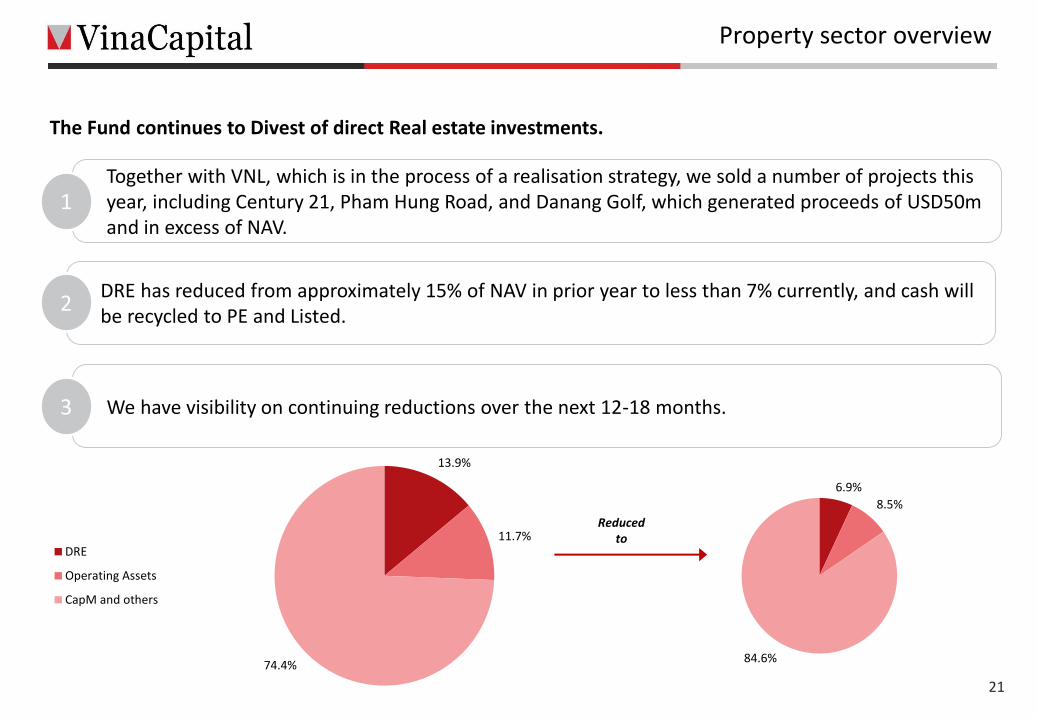
Property sector overview
The Fund continues to Divest of direct Real estate investments.
Together with VNL, which is in the process of a realisation strategy, we sold a number of projects this year, including Century 21, Pham Hung Road, and Danang Golf, which generated proceeds of USD50m and in excess of NAV.
1
DRE has reduced from approximately 15% of NAV in prior year to less than 7% currently, and cash will be recycled to PE and Listed.
2
We have visibility on continuing reductions over the next 12-18 months.3
6.9%
8.5%
84.6%
13.9%
11.7%
74.4%
DRE
Operating Assets
CapM and others
Reduced to
Click to edit Master title styleClick to edit Master title style
Performance & Summary
Click to edit Master title styleClick to edit Master title style
23
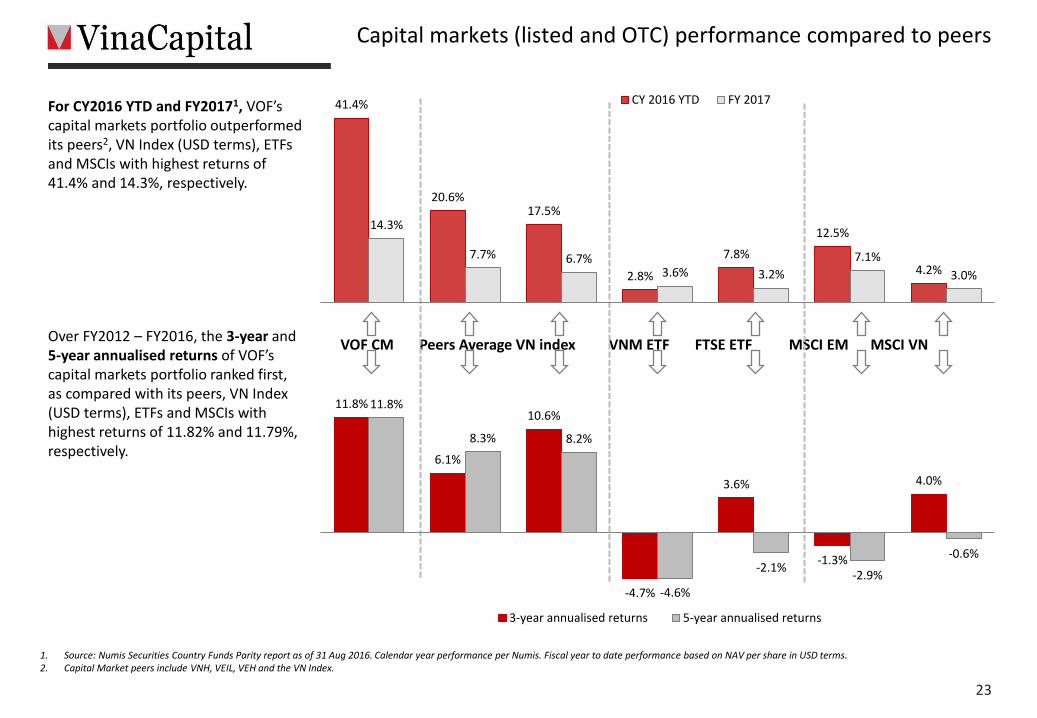
Capital markets (listed and OTC) performance compared to peers
1. Source: Numis Securities Country Funds Parity report as of 31 Aug 2016. Calendar year performance per Numis. Fiscal year to date performance based on NAV per share in USD terms.2. Capital Market peers include VNH, VEIL, VEH and the VN Index.
VOF CM Peers Average VN index VNM ETF FTSE ETF MSCI EM MSCI VN
For CY2016 YTD and FY20171, VOF’s capital markets portfolio outperformed its peers2, VN Index (USD terms), ETFs and MSCIs with highest returns of 41.4% and 14.3%, respectively.
Over FY2012 – FY2016, the 3-year and 5-year annualised returns of VOF’s capital markets portfolio ranked first, as compared with its peers, VN Index (USD terms), ETFs and MSCIs with highest returns of 11.82% and 11.79%, respectively.
41.4%
20.6%17.5%
2.8%
7.8%
12.5%
4.2%
14.3%
7.7% 6.7%3.6% 3.2%
7.1%
3.0%
CY 2016 YTD FY 2017
11.8%
6.1%
10.6%
-4.7%
3.6%
-1.3%
4.0%
11.8%
8.3% 8.2%
-4.6%
-2.1%-2.9%
-0.6%
3-year annualised returns 5-year annualised returns
Click to edit Master title styleClick to edit Master title style
24
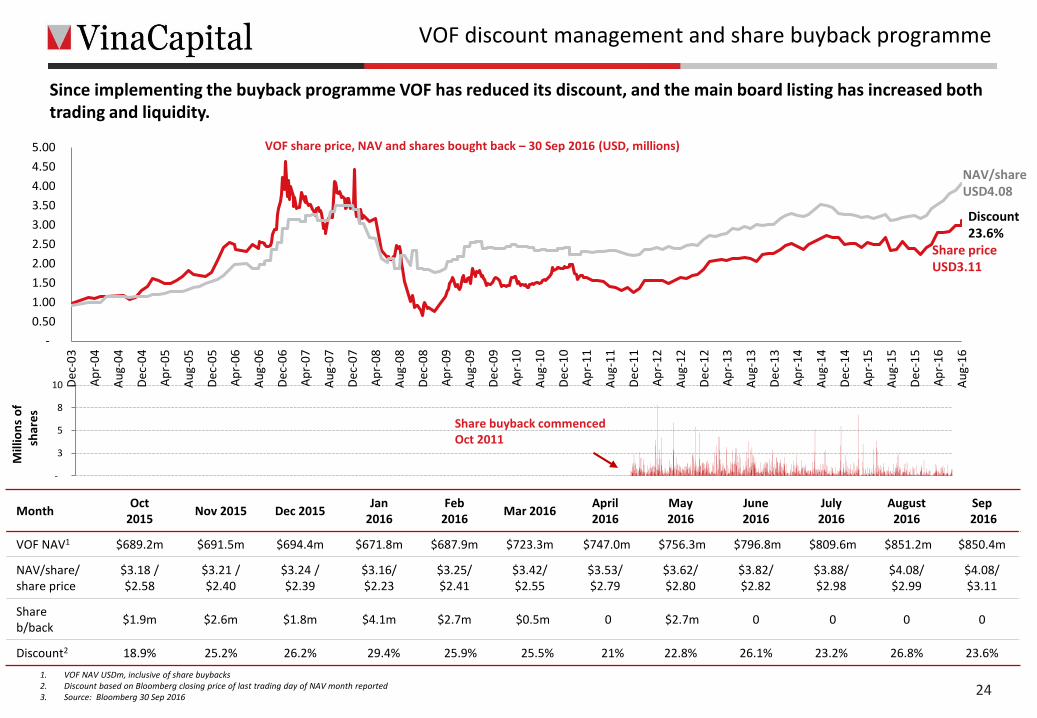
VOF discount management and share buyback programme
1. VOF NAV USDm, inclusive of share buybacks2. Discount based on Bloomberg closing price of last trading day of NAV month reported3. Source: Bloomberg 30 Sep 2016
Since implementing the buyback programme VOF has reduced its discount, and the main board listing has increased both trading and liquidity.
VOF share price, NAV and shares bought back – 30 Sep 2016 (USD, millions)
-
3
5
8
10
MonthOct
2015Nov 2015 Dec 2015
Jan2016
Feb 2016
Mar 2016April 2016
May2016
June 2016
July2016
August 2016
Sep2016
VOF NAV1 $689.2m $691.5m $694.4m $671.8m $687.9m $723.3m $747.0m $756.3m $796.8m $809.6m $851.2m $850.4m
NAV/share/ share price
$3.18 / $2.58
$3.21 / $2.40
$3.24 / $2.39
$3.16/$2.23
$3.25/$2.41
$3.42/$2.55
$3.53/$2.79
$3.62/$2.80
$3.82/$2.82
$3.88/$2.98
$4.08/$2.99
$4.08/$3.11
Share b/back
$1.9m $2.6m $1.8m $4.1m $2.7m $0.5m 0 $2.7m 0 0 0 0
Discount2 18.9% 25.2% 26.2% 29.4% 25.9% 25.5% 21% 22.8% 26.1% 23.2% 26.8% 23.6%
Share priceUSD3.11
NAV/shareUSD4.08
Discount23.6%
Mill
ion
s o
f sh
are
s
Share buyback commenced Oct 2011
-
0.50
1.00
1.50
2.00
2.50
3.00
3.50
4.00
4.50
5.00
De
c-0
3
Ap
r-0
4
Au
g-0
4
De
c-0
4
Ap
r-0
5
Au
g-0
5
De
c-0
5
Ap
r-0
6
Au
g-0
6
De
c-0
6
Ap
r-0
7
Au
g-0
7
De
c-0
7
Ap
r-0
8
Au
g-0
8
De
c-0
8
Ap
r-0
9
Au
g-0
9
De
c-0
9
Ap
r-1
0
Au
g-1
0
De
c-1
0
Ap
r-1
1
Au
g-1
1
De
c-1
1
Ap
r-1
2
Au
g-1
2
De
c-1
2
Ap
r-1
3
Au
g-1
3
De
c-1
3
Ap
r-1
4
Au
g-1
4
De
c-1
4
Ap
r-1
5
Au
g-1
5
De
c-1
5
Ap
r-1
6
Au
g-1
6
Click to edit Master title styleClick to edit Master title style
• An economy that is outperforming its peers
• Free trade agreements that open up over 75% of the world’s GDP to trade with Vietnam
• Domestic consumption growth that will favourdomestic companies
• Stable political regime that continues to support investment and is committed to lifting Foreign Ownership Limits
25
Summary
• A unique multi-asset strategy that take advantage of the inefficiencies in Vietnam’s investment environment
• Proven track record in public and private markets
• Real estate exits continue in 2016 and 2017
• Improved corporate governance
• Improved liquidity following move to the Main Market. All-share trackers have been buying in June
• Current discount to NAV is an opportunity for value
Positive outlook for Vietnam and VOF.
VOFEconomy
Click to edit Master title styleClick to edit Master title style
Why Vietnam
Click to edit Master title styleClick to edit Master title style
27
Why Vietnam
Vietnam’s growth is driven by rising domestic consumption and rapid infrastructure development.
• Demographics 94 million people with an average age under 30
• High GDP growthOne of the best performing emerging markets with 6.7% GDP growth (2015), 2016 expected to remain strong
• Rising foreign investment FDI inflows continue to support job creation, domestic consumption, industrialisation and enhance exports
• International tradeSeveral free-trade agreements will bolster economic growth
• Privatisations and market developmentCapital markets will continue to deepen and broaden through IPOs and large scale privatisations of SOE’s
Click to edit Master title styleClick to edit Master title styleSuccessful revitalisation of the economy
1 IMF World Economic Outlook, April 2016, emerging and frontier market classifications based on MSCI classificationsSource: IMF, ADB, General Statistics Office, VinaCapital Research & Analysis 28
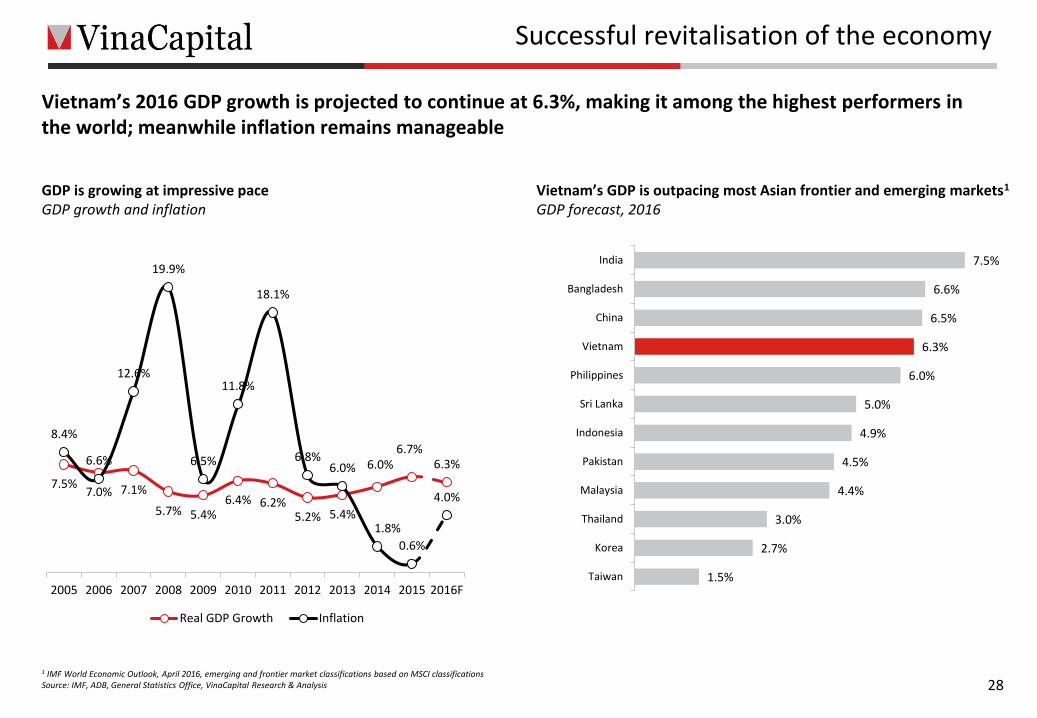
GDP is growing at impressive paceGDP growth and inflation
Vietnam’s GDP is outpacing most Asian frontier and emerging markets1
GDP forecast, 2016
Vietnam’s 2016 GDP growth is projected to continue at 6.3%, making it among the highest performers in the world; meanwhile inflation remains manageable
7.5%7.0% 7.1%
5.7% 5.4%6.4% 6.2%
5.2% 5.4%
6.0%6.7%
6.3%
8.4%
6.6%
12.6%
19.9%
6.5%
11.8%
18.1%
6.8%6.0%
1.8%
0.6%
4.0%
2005 2006 2007 2008 2009 2010 2011 2012 2013 2014 2015 2016F
Real GDP Growth Inflation
7.5%
6.6%
6.5%
6.3%
6.0%
5.0%
4.9%
4.5%
4.4%
3.0%
2.7%
1.5%
India
Bangladesh
China
Vietnam
Philippines
Sri Lanka
Indonesia
Pakistan
Malaysia
Thailand
Korea
Taiwan
Click to edit Master title styleClick to edit Master title style
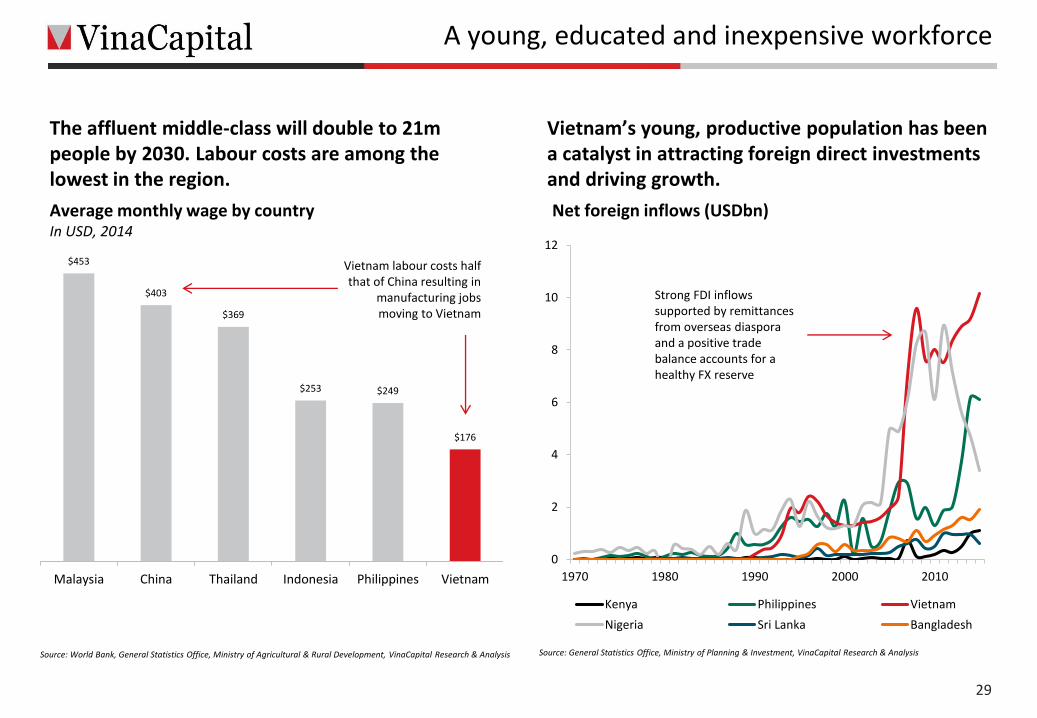
The affluent middle-class will double to 21m people by 2030. Labour costs are among the lowest in the region.
29
A young, educated and inexpensive workforce
Source: World Bank, General Statistics Office, Ministry of Agricultural & Rural Development, VinaCapital Research & Analysis
$453
$403
$369
$253 $249
$176
Malaysia China Thailand Indonesia Philippines Vietnam
Average monthly wage by country In USD, 2014
Vietnam’s young, productive population has been a catalyst in attracting foreign direct investments and driving growth.
Source: General Statistics Office, Ministry of Planning & Investment, VinaCapital Research & Analysis
0
2
4
6
8
10
12
1970 1980 1990 2000 2010
Kenya Philippines Vietnam
Nigeria Sri Lanka Bangladesh
Net foreign inflows (USDbn)
Vietnam labour costs half that of China resulting in
manufacturing jobs moving to Vietnam
Strong FDI inflows supported by remittances from overseas diasporaand a positive trade balance accounts for a healthy FX reserve
Click to edit Master title styleClick to edit Master title style
21%
21%
11%9%
5%
33%
Europe
USA
China
Japan
Korea
Others
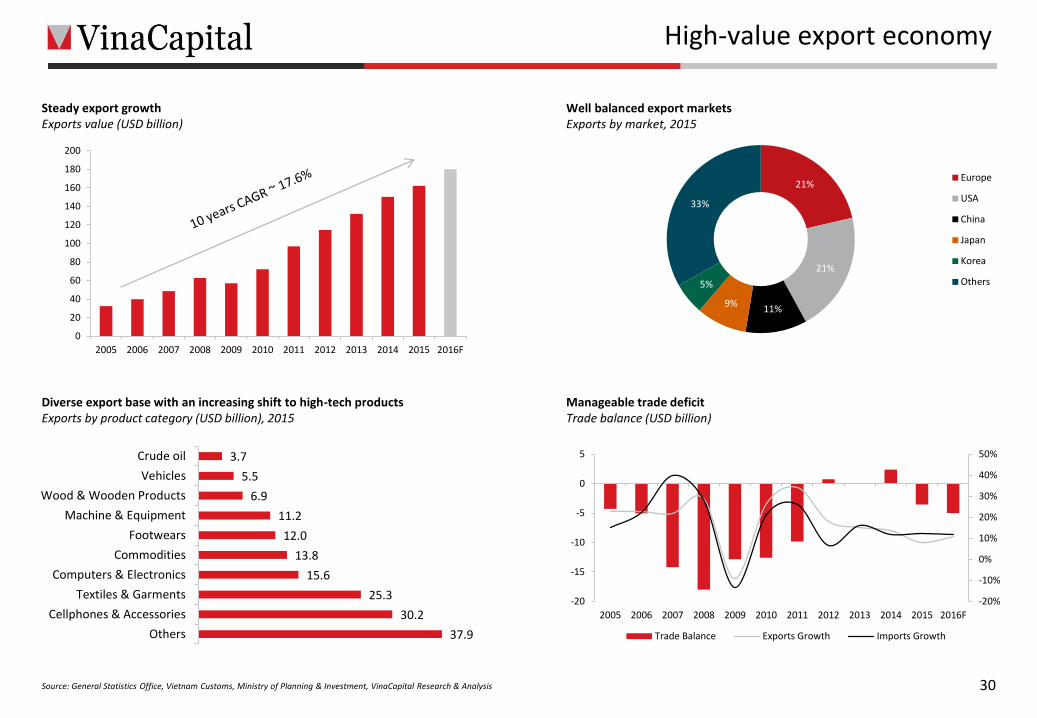
Well balanced export marketsExports by market, 2015
0
20
40
60
80
100
120
140
160
180
200
2005 2006 2007 2008 2009 2010 2011 2012 2013 2014 2015 2016F
Steady export growthExports value (USD billion)
High-value export economy
Source: General Statistics Office, Vietnam Customs, Ministry of Planning & Investment, VinaCapital Research & Analysis 30
3.7
5.5
6.9
11.2
12.0
13.8
15.6
25.3
30.2
37.9
Crude oil
Vehicles
Wood & Wooden Products
Machine & Equipment
Footwears
Commodities
Computers & Electronics
Textiles & Garments
Cellphones & Accessories
Others
Diverse export base with an increasing shift to high-tech productsExports by product category (USD billion), 2015
-20%
-10%
0%
10%
20%
30%
40%
50%
-20
-15
-10
-5
0
5
2005 2006 2007 2008 2009 2010 2011 2012 2013 2014 2015 2016F
Trade Balance Exports Growth Imports Growth
Manageable trade deficitTrade balance (USD billion)
Click to edit Master title styleClick to edit Master title style
0.0%
1.0%
2.0%
3.0%
4.0%
5.0%
6.0%
20
04
20
05
20
06
20
07
20
08
20
09
20
10
20
11
20
12
20
13
20
14
20
15E
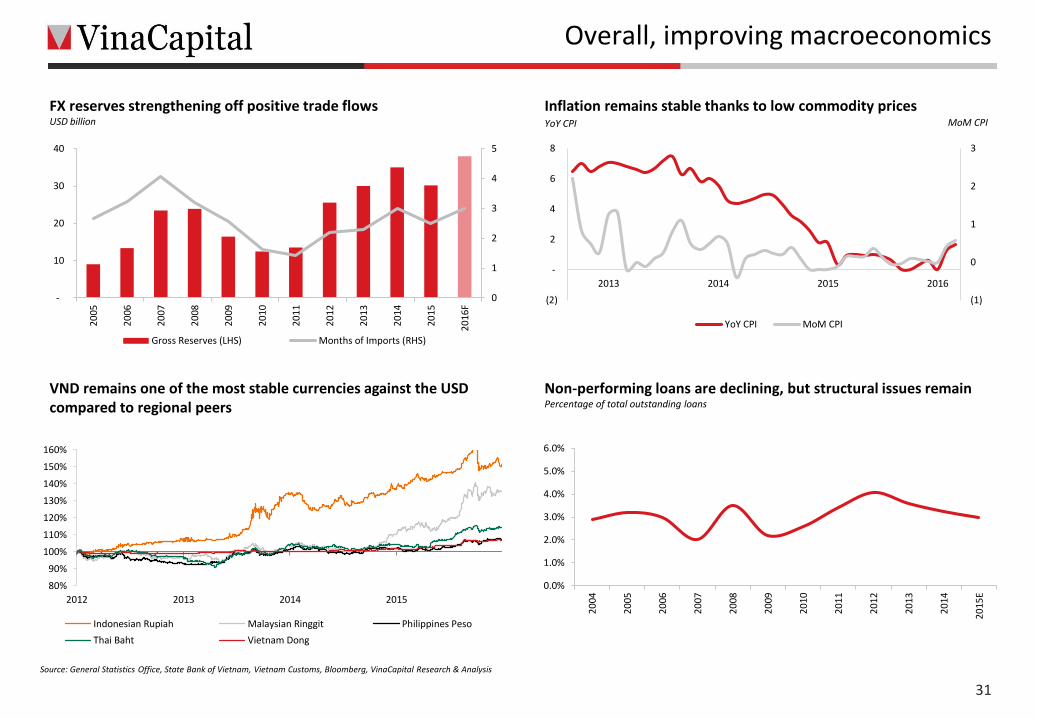
Non-performing loans are declining, but structural issues remainPercentage of total outstanding loans
0
1
2
3
4
5
-
10
20
30
40
20
05
20
06
20
07
20
08
20
09
20
10
20
11
20
12
20
13
20
14
20
15
20
16F
Gross Reserves (LHS) Months of Imports (RHS)
FX reserves strengthening off positive trade flows USD billion
80%
90%
100%
110%
120%
130%
140%
150%
160%
2012 2013 2014 2015
Indonesian Rupiah Malaysian Ringgit Philippines Peso
Thai Baht Vietnam Dong
VND remains one of the most stable currencies against the USD compared to regional peers
31
Overall, improving macroeconomics
Source: General Statistics Office, State Bank of Vietnam, Vietnam Customs, Bloomberg, VinaCapital Research & Analysis
(1)
0
1
2
3
(2)
-
2
4
6
8
2013 2014 2015 2016
YoY CPI MoM CPI
MoM CPIYoY CPI
Inflation remains stable thanks to low commodity prices
Click to edit Master title styleClick to edit Master title style
Supported by a 10 member research team, including CFA charter holders or MBA qualified
32
VOF portfolio management team
• 8 years at VinaCapital, currently MD of VOF and Chief Investment Officer of VinaCapital.
• Former Director of Investments at Prudential Vietnam, management positions at Dell Ventures and Ernst & Young in both the US and Vietnam.
• MBA from MIT Sloan School of Management, BS from the University of Colorado, USA Certified Public Accountant.
Andy Ho, MBAChief Investment Officer and Managing Director
• 2 years at VinaCapital, currently responsible for VOF’s capital market and PIPE investments.
• 20 years of experience including the last 9 years in Vietnam.
• Former Research Head at PXP Vietnam Asset Management, Senior Investment Analyst at ADIA in Abu Dhabi and Banks Analyst for Merrill Lynch in London.
• Supported by a director and investment manager accompanied by research team.
Duong Vuong, CFADeputy Managing Director, Capital Markets
• 8 years at VinaCapital, responsible for private equity investments and sourcing.
• Former Audit Manager for KPMG Vietnam and on the Management and Financial Accounting team at Unilever Vietnam.
• MBA from University of Hawaii, Vietnamese Certified Public Accountant and UK ACCA member.
• Supported by a director and two managers accompanied by research team.
Loan Minh Dang, MBADeputy Managing Director, Private Equity
• 5 years at VinaCapital, currently investment director (PIPEs) and member of VOF’s investment committee.
• Over 14 years of managerial experience in corporate finance, asset management, investment banking, and risk and compliance.
• Previously at Macquarie Bank based in New York and Sydney. Prior to that, he was with Deloitte and Arthur Andersen based in Sydney.
• Masters degree from University of New South Wales, Sydney.
Khanh Vu, M.ComInvestment Director
Click to edit Master title styleClick to edit Master title style
33
VinaCapital17th Floor, Sun Wah Tower115 Nguyen Hue StreetDistrict 1Ho Chi Minh City
Vietnam
+84 8 3821 9930
www.vinacapital.com
Ho Chi Minh City Hanoi Danang Singapore
Andy Ho – Managing [email protected]+84 8 3821 9930
Khanh Vu – Investment [email protected]+84 8 3821 9930
Contact details