Embed Size (px)
Citation preview
Android Through a Linux Lens
Jonathan Levin
http://Technologeeks.com - @Technologeeks
http://NewAndroidBook.com
Ready your Droids
• It helps to follow along and try some hands-on
– (this is, after all, a tutorial, and not just another lecture)
• If you have a real device – great
– But advanced tracing/debugging does need root access
• At a minimum, fire up an L/M emulator, and adb to it.
Preface
What this isn’t
• An ADB shell primer
• A CLI how-to
• A native-level/NDK how-to
• A debugging primer for Dalvik/DDMS
Preface
What this is
• Collection of native and CLI level debugging techniques
• Uses AOSP-supplied tools, and Linux facilities
• Actually also usable for Linux native level debugging
• An excerpt from my book (Volume I, Chapter 7)
Preface
The Book
“Android Internals: A Confectioner’s Cookbook”
– 深入解析Android操作系统 - Coming in Chinese (by Feb 2016)
– Volume I (Available now): Power User’s view
– Volume II (Available once I get cover art for it!): Developer’s View
– http://NewAndroidBook.com/TOC.html for detailed Table of Contents
– Unofficial sequel to Karim Yaghmour’s “Embedded Android”, different focus:
• More on the how and why Android frameworks and services work
• More on DEX and ART (this talk is an excerpt from Volume II)
• (presently) only in-depth book on the subject
– http://www.NewAndroidBook.com/ :
• Free and powerful tools
• Articles and bonus materials from Books
– Android Internals & Reverse Engineering: Feb 8th-12th, 2016, NYC
• http://Technologeeks.com/AIRE
Preface
Android Through a Linux Lens
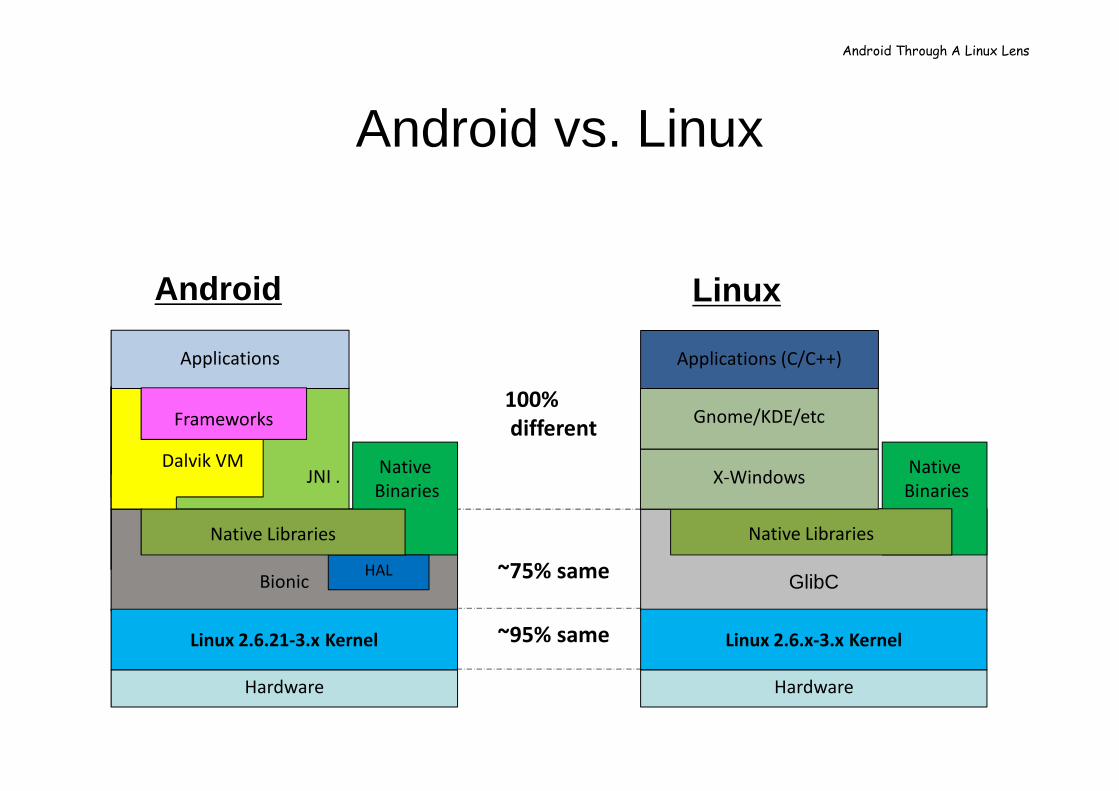
Android vs. Linux
Bionic
JNI . Dalvik VM Native
Binaries
Applications
Linux 2.6.21-3.x Kernel
Hardware
GlibC
Native
Binaries
Applications (C/C++)
Linux 2.6.x-3.x Kernel
Hardware
Native Libraries
Gnome/KDE/etc
X-Windows
HAL
Native Libraries
Frameworks
Android Linux
~95% same
~75% same
100%
different
Android Through A Linux Lens
Everything is a process
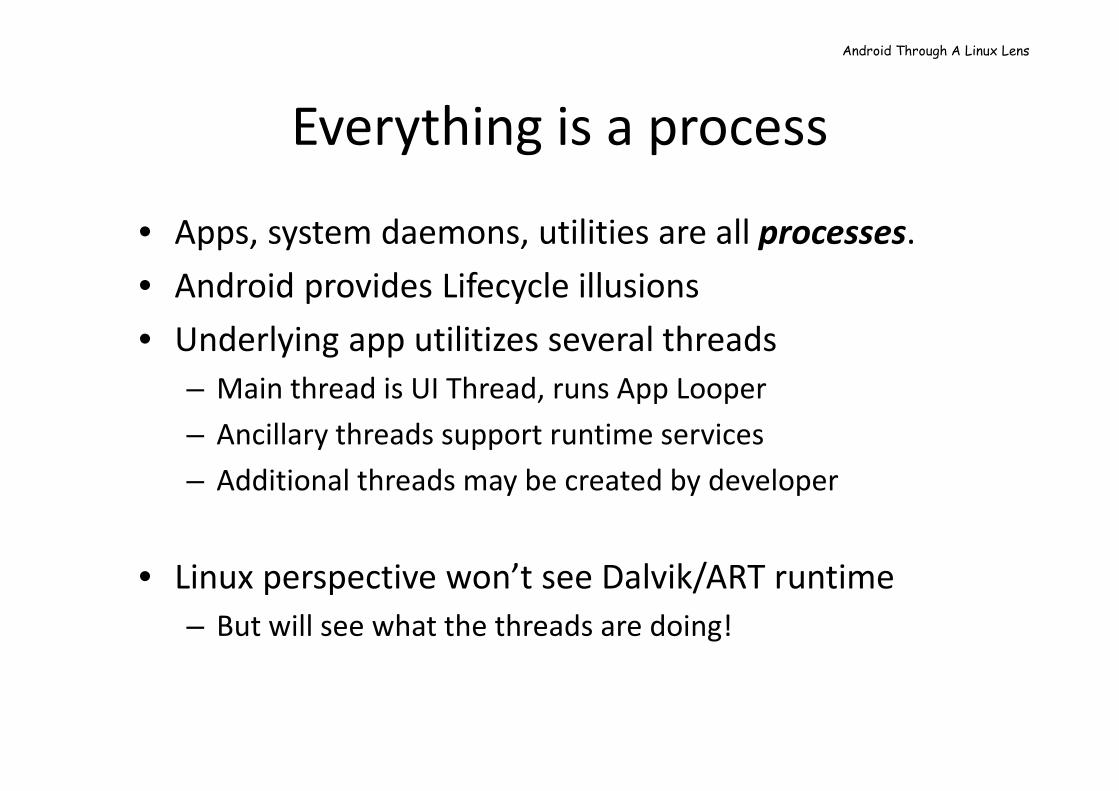
• Apps, system daemons, utilities are all processes.
• Android provides Lifecycle illusions
• Underlying app utilitizes several threads
– Main thread is UI Thread, runs App Looper
– Ancillary threads support runtime services
– Additional threads may be created by developer
• Linux perspective won’t see Dalvik/ART runtime
– But will see what the threads are doing!
Android Through A Linux Lens
ADB and the shell
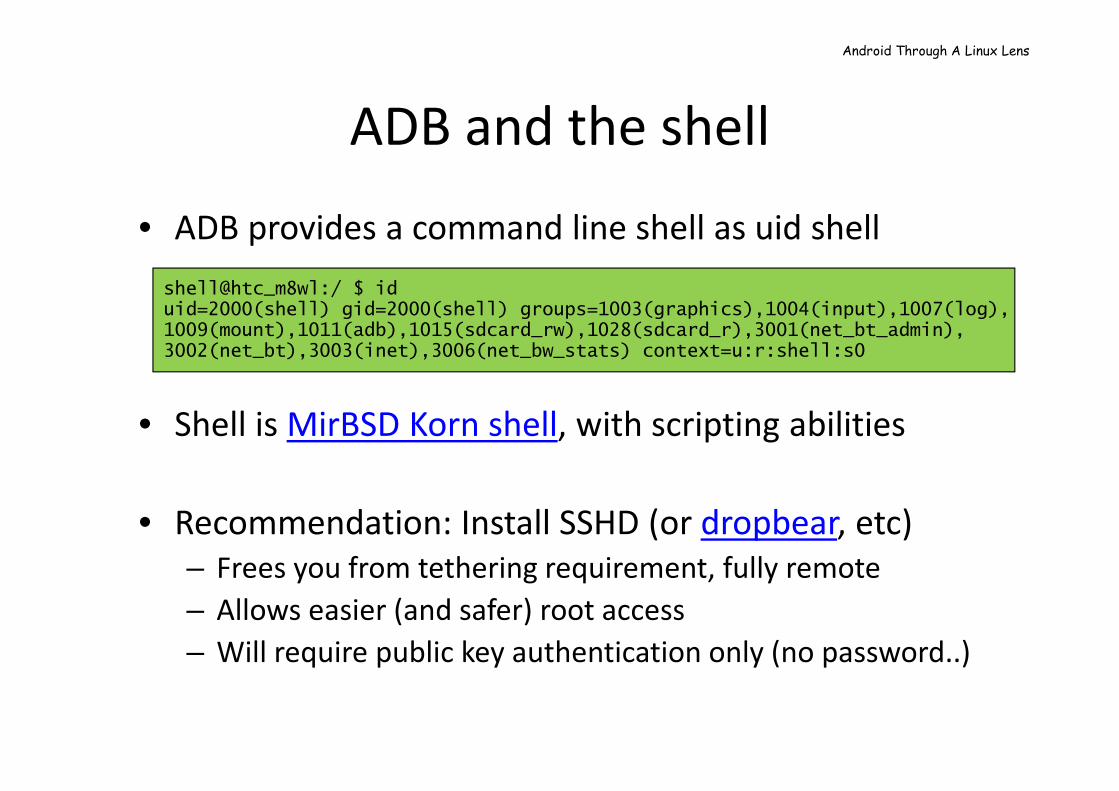
• ADB provides a command line shell as uid shell
• Shell is MirBSD Korn shell, with scripting abilities
• Recommendation: Install SSHD (or dropbear, etc)
– Frees you from tethering requirement, fully remote
– Allows easier (and safer) root access
– Will require public key authentication only (no password..)
shell@htc_m8wl:/ $ iduid=2000(shell) gid=2000(shell) groups=1003(graphics),1004(input),1007(log),1009(mount),1011(adb),1015(sdcard_rw),1028(sdcard_r),3001(net_bt_admin),3002(net_bt),3003(inet),3006(net_bw_stats) context=u:r:shell:s0
Android Through A Linux Lens
ToolBox vs. BusyBox
• Most CLI commands implemented via toolbox
• Toolbox is Android specific subset of busybox
– Pros: linked with Bionic, recognizes AIDs
– Cons: limited toolset, partial functionality
• Recommendation: Install BusyBox
– Statically linked binary, so no dependencies
– Can compile from source, but plenty of binaries out there
• M provides “toybox” with more tools (try –a)
Android Through A Linux Lens
Getting tools to your device
• A lot of the tools you need are right in the emulator
– Most in /system/xbin, and not present in most devices
• Can adb pull from emulator image, push to device
• Android version should match
• Remember to move libraries as well!
– Find dependencies using objdump –x | grep NEEDED
Android Through A Linux Lens
Using what’s already there
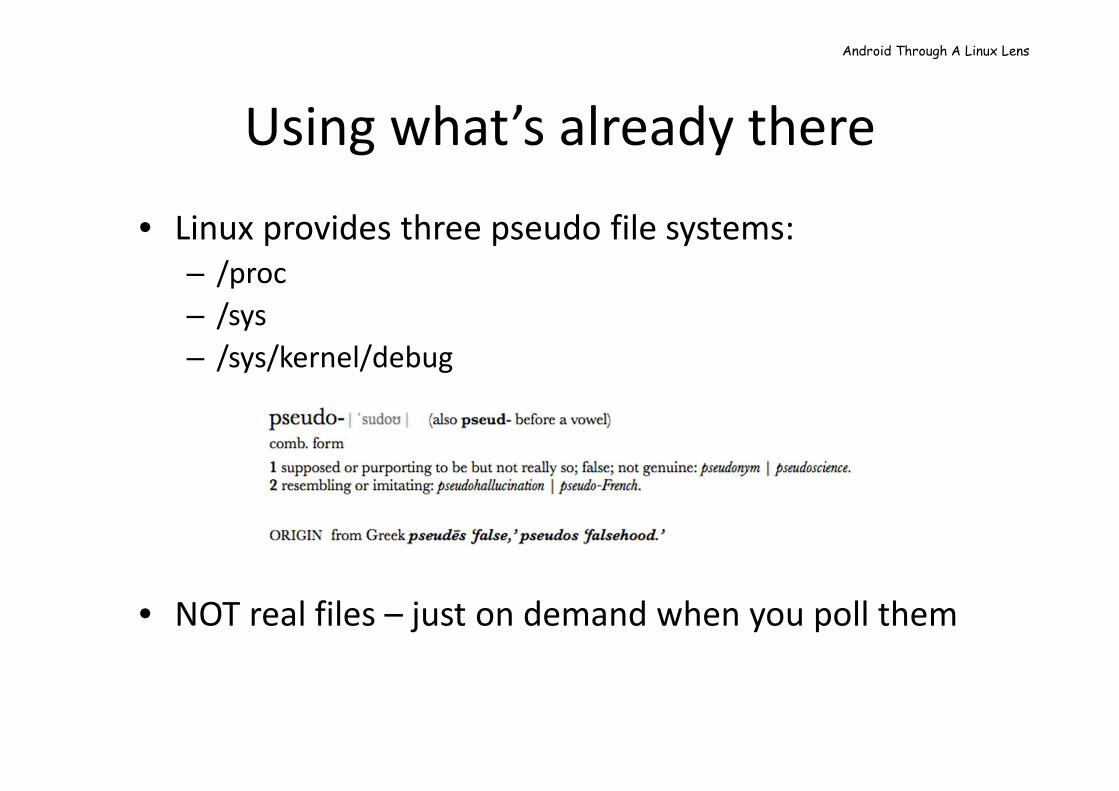
• Linux provides three pseudo file systems:
– /proc
– /sys
– /sys/kernel/debug
• NOT real files – just on demand when you poll them
Android Through A Linux Lens
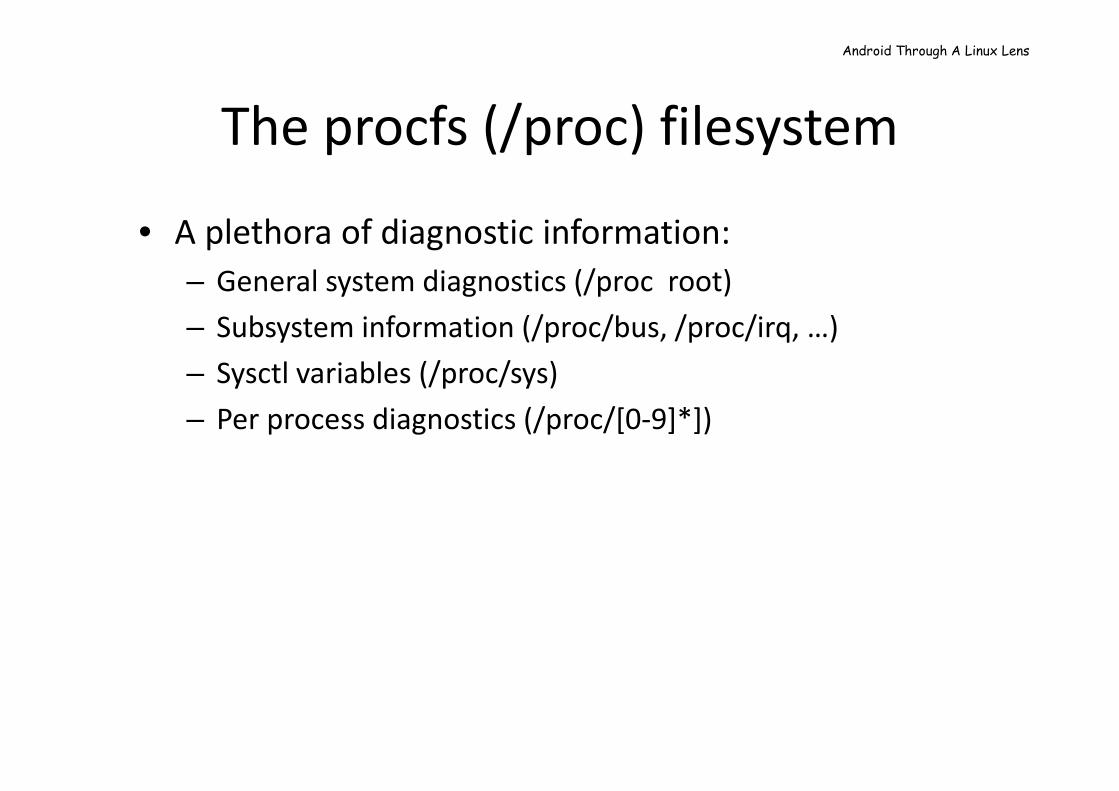
The procfs (/proc) filesystem
• A plethora of diagnostic information:
– General system diagnostics (/proc root)
– Subsystem information (/proc/bus, /proc/irq, …)
– Sysctl variables (/proc/sys)
– Per process diagnostics (/proc/[0-9]*])
Android Through A Linux Lens
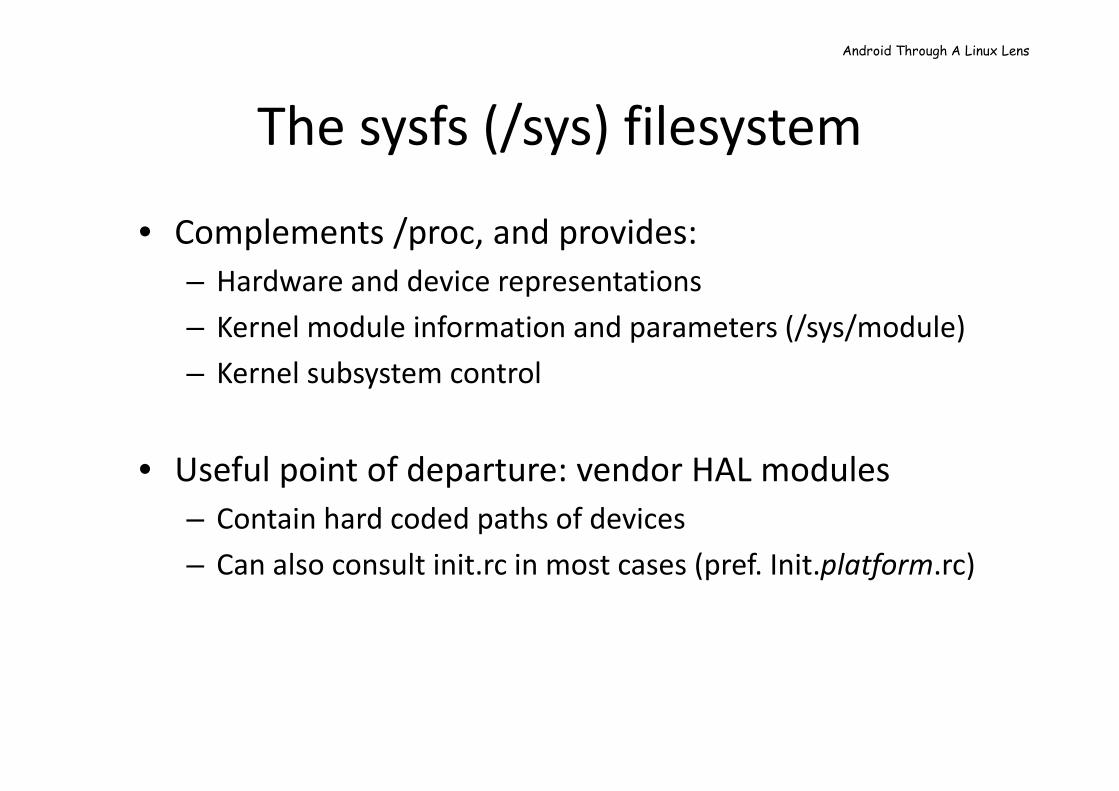
The sysfs (/sys) filesystem
• Complements /proc, and provides:
– Hardware and device representations
– Kernel module information and parameters (/sys/module)
– Kernel subsystem control
• Useful point of departure: vendor HAL modules
– Contain hard coded paths of devices
– Can also consult init.rc in most cases (pref. Init.platform.rc)
Android Through A Linux Lens
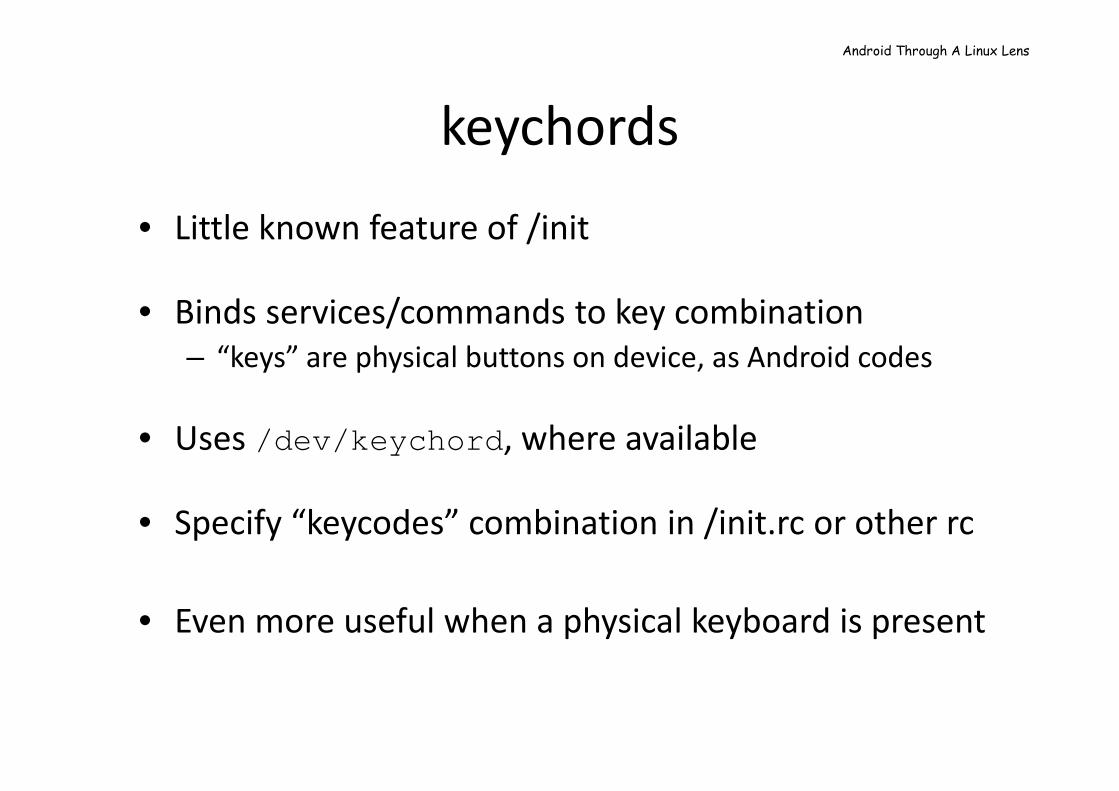
keychords
• Little known feature of /init
• Binds services/commands to key combination
– “keys” are physical buttons on device, as Android codes
• Uses /dev/keychord , where available
• Specify “keycodes” combination in /init.rc or other rc
• Even more useful when a physical keyboard is present
Android Through A Linux Lens
Activity Diagnostics
Activity Diagnostics
• Tracing = monitoring run time activity of process
• Uses:
– performance benchmarking
– Logging and monitoring resource access
Activity Diagnostics
Activity Diagnostics - /proc
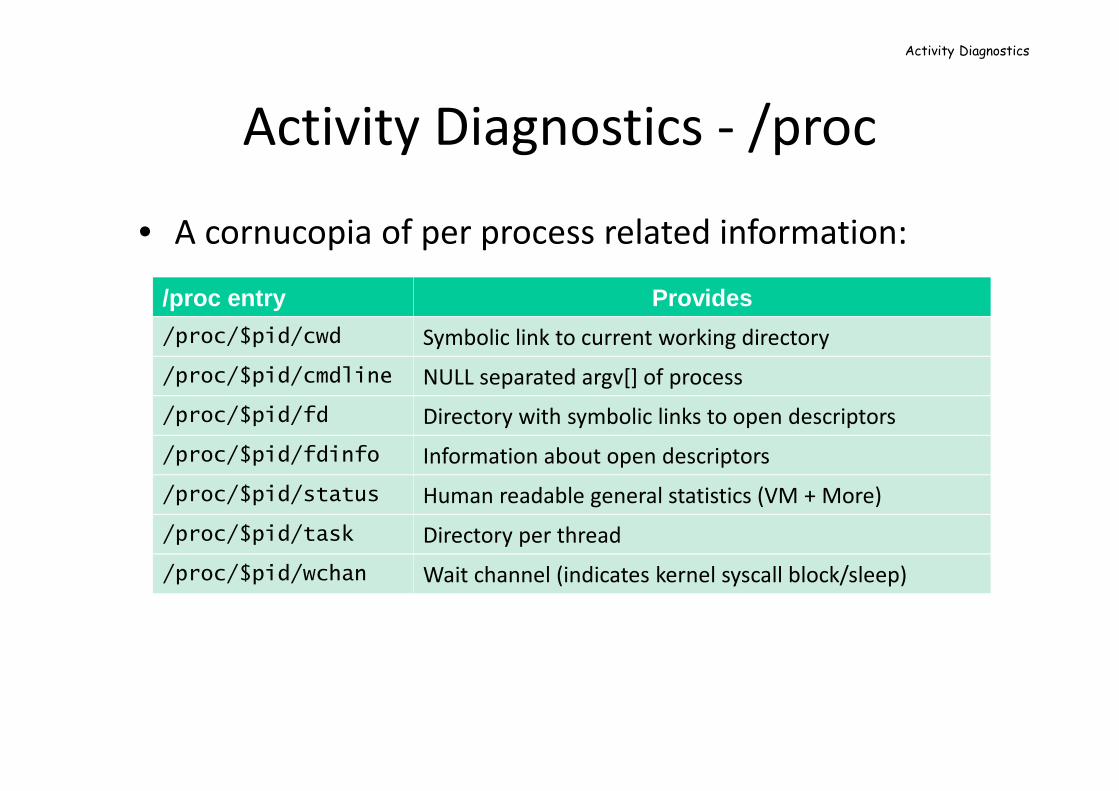
• A cornucopia of per process related information:
/proc entry Provides
/proc/$pid/cwd Symbolic link to current working directory
/proc/$pid/cmdline NULL separated argv[] of process
/proc/$pid/fd Directory with symbolic links to open descriptors
/proc/$pid/fdinfo Information about open descriptors
/proc/$pid/status Human readable general statistics (VM + More)
/proc/$pid/task Directory per thread
/proc/$pid/wchan Wait channel (indicates kernel syscall block/sleep)
Activity Diagnostics

Activity Diagnostics - /proc
Activity Diagnostics
Per Thread Diagnostics
• Iterating over task/* will show threads
• Threads largely have same stats, save:
– Status/Name – Dalvik threads are named with prctl(2)
– wchan – Kernel wait channel/syscall
• You can grep name $t/status to isolate threads
– cd to the target process’ task/directory
– Then try “for i in *; do grep Name $i/status; done”
• You can then trace or suspend specific threads
Activity Diagnostics
Per Thread Control
• kill is your friend
– Well, in most cases it isn’t, but in a few cases it is.
– Obviously “kill -9” will kill outright
– kill –STOP and kill –CONT can freeze/suspend threads
– Even lethal signals can be useful (for tombstones)
Activity Diagnostics
Activity Diagnostics - Tools
• AOSP provides the lsof tool to list open files
– Not just files, but actually any file descriptor for process
• Extremely useful with grep to isolate files
Activity Diagnostics
Activity Diagnostics - Tools
• AOSP also provides the strace binary to trace syscalls
– Hands down, the #1 debugging tool out there
– Based on ptrace(2) API, no dependencies
• Useful in oh-so-may ways:
– Can actually parse and present system call arguments
– Can follow forks and threads
– Can be used for timing of syscalls
– Can introduce artificial latency(!)
Activity Diagnostics
Activity Diagnostics - Tools
• The ltrace tool can also be ported to Android
– Similar to strace , but provides library call information
– Uses ptrace(2) , but a lot heavier, and needs libelf.
• Supplements strace when your problem is in a lib:
– Arguments and features similar to ltrace
– Can also be used for syscalls (with –S)
• http://NewOSXBook.com also offers jtrace
• Interactive, plug-in enabled tracing, and Android aware
Activity Diagnostics
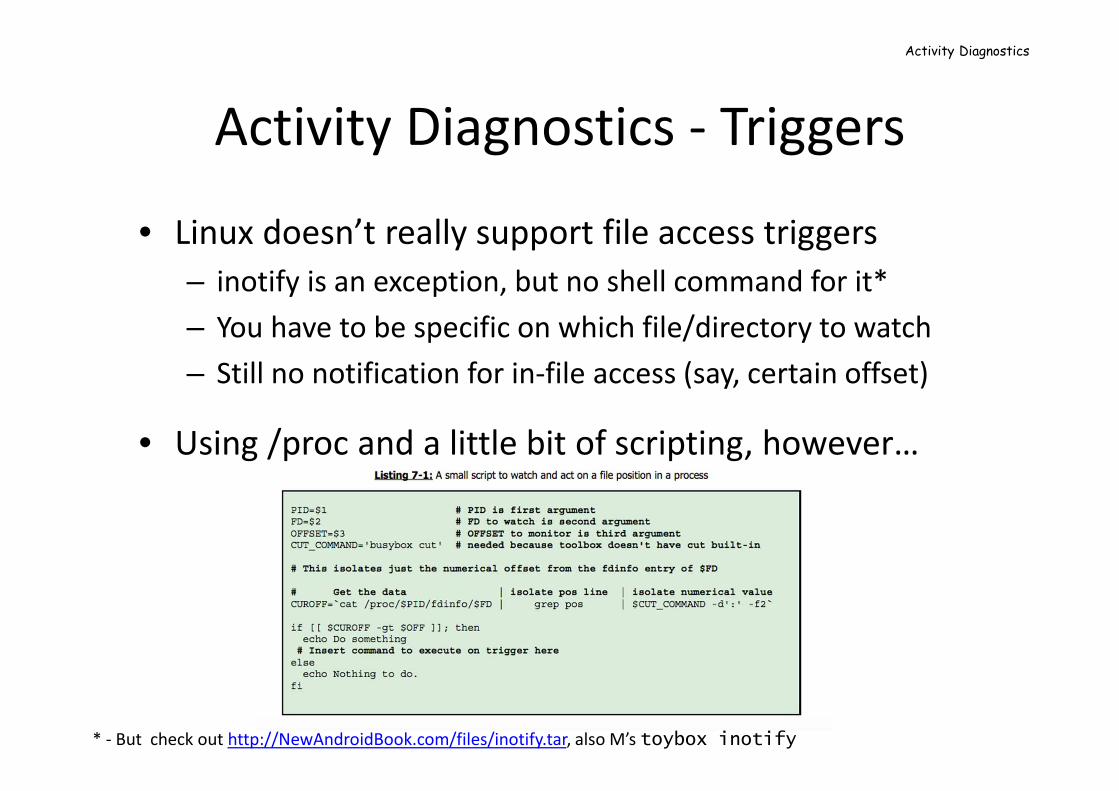
Activity Diagnostics - Triggers
• Linux doesn’t really support file access triggers
– inotify is an exception, but no shell command for it*
– You have to be specific on which file/directory to watch
– Still no notification for in-file access (say, certain offset)
• Using /proc and a little bit of scripting, however…
* - But check out http://NewAndroidBook.com/files/inotify.tar, also M’s toybox inotify
Activity Diagnostics
Memory Tracing and Debugging
Memory Diagnostics
• RAM is the most important resource in Android
• Applications leave in perpetual fear of OOM/LMK
• Most memory in Android is shared when possible
• Important to understand memory diagnostics
Memory Diagnostics
Low Memory Killer
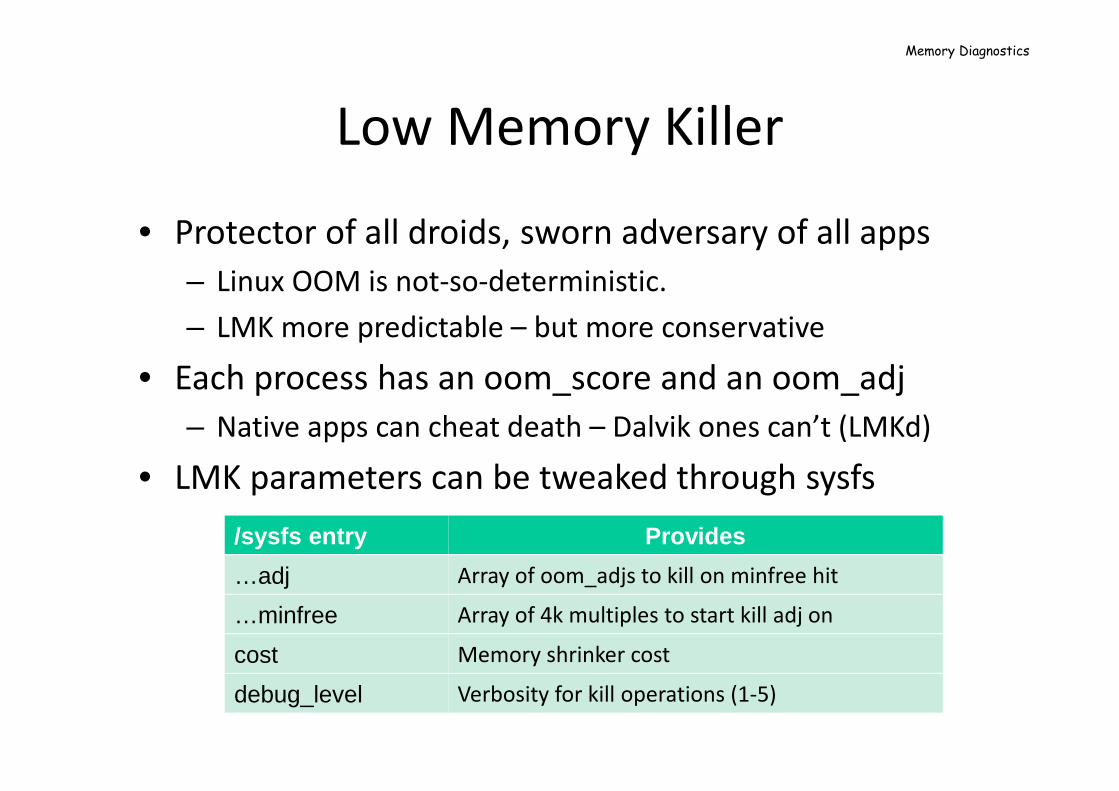
• Protector of all droids, sworn adversary of all apps
– Linux OOM is not-so-deterministic.
– LMK more predictable – but more conservative
• Each process has an oom_score and an oom_adj
– Native apps can cheat death – Dalvik ones can’t (LMKd)
• LMK parameters can be tweaked through sysfs
/sysfs entry Provides
…adj Array of oom_adjs to kill on minfree hit
…minfree Array of 4k multiples to start kill adj on
cost Memory shrinker cost
debug_level Verbosity for kill operations (1-5)
Memory Diagnostics
Memory Diagnostics
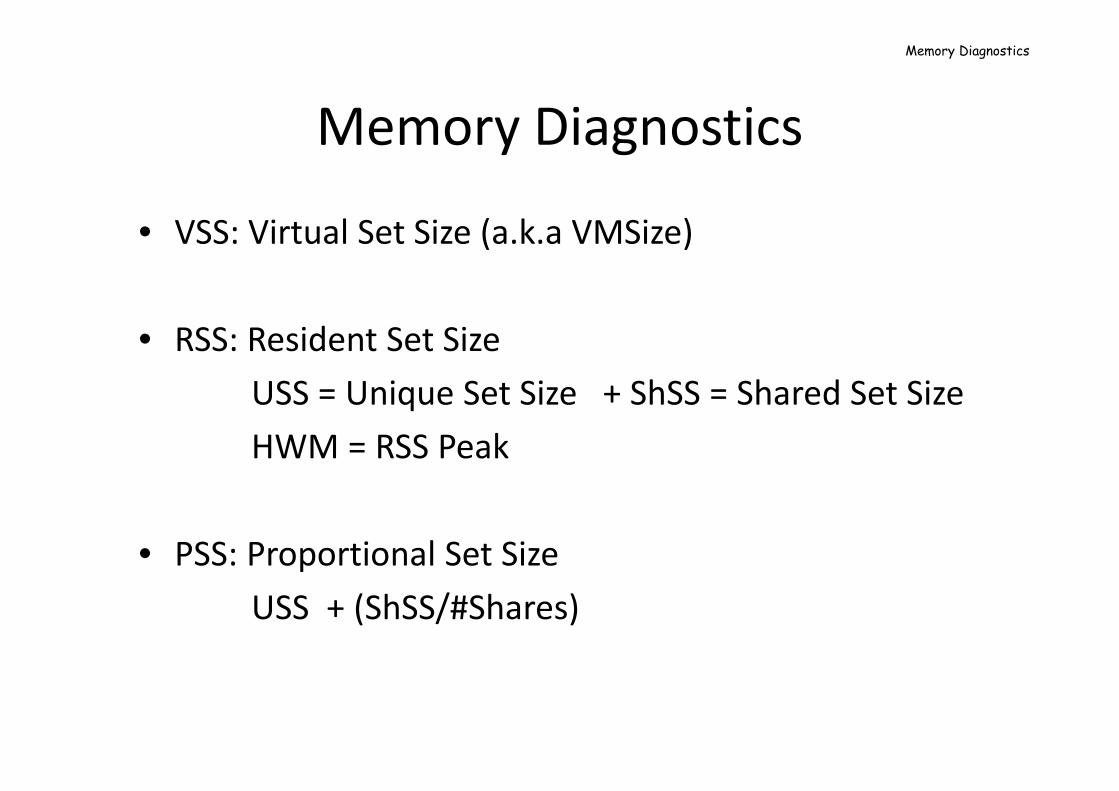
• VSS: Virtual Set Size (a.k.a VMSize)
• RSS: Resident Set Size
USS = Unique Set Size + ShSS = Shared Set Size
HWM = RSS Peak
• PSS: Proportional Set Size
USS + (ShSS/#Shares)
Memory Diagnostics
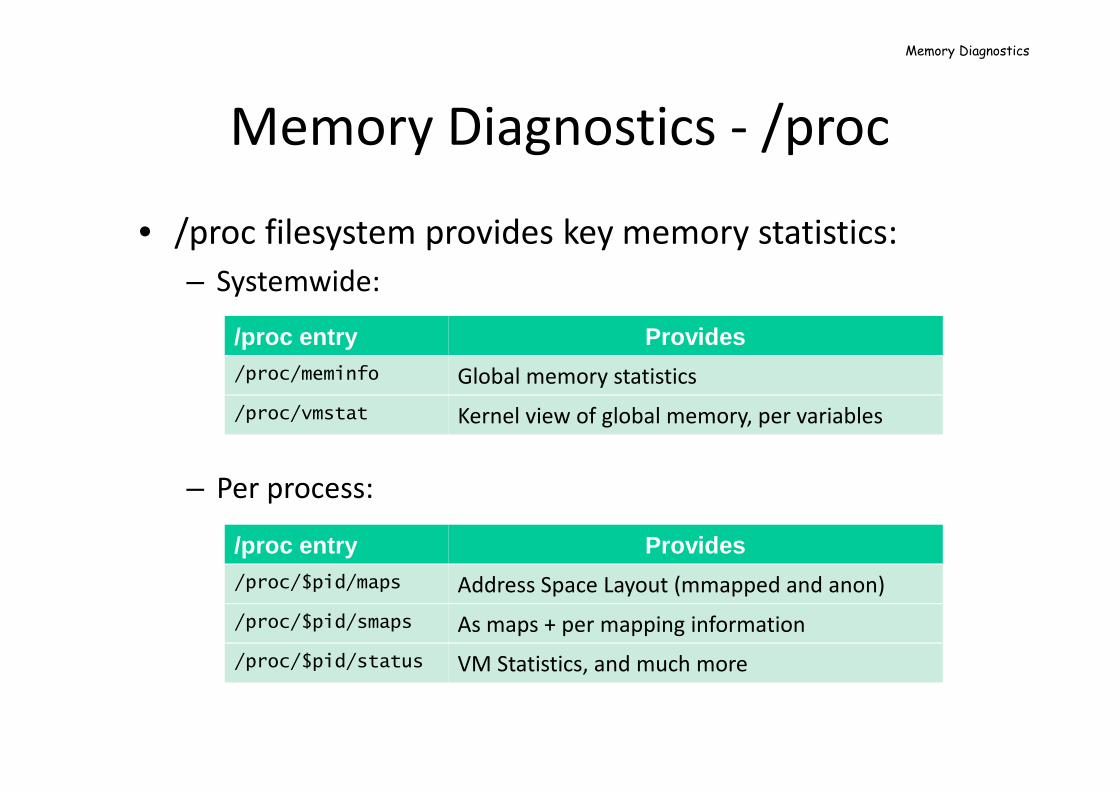
Memory Diagnostics - /proc
• /proc filesystem provides key memory statistics:
– Systemwide:
– Per process:
/proc entry Provides/proc/$pid/maps Address Space Layout (mmapped and anon)
/proc/$pid/smaps As maps + per mapping information
/proc/$pid/status VM Statistics, and much more
/proc entry Provides/proc/meminfo Global memory statistics
/proc/vmstat Kernel view of global memory, per variables
Memory Diagnostics
Memory Diagnostics - tools
• AOSP provides procrank and librank tools:
– procrank : Ranks processes by memory utilization
– librank : Ranks libraries by memory utilization (sharing)
• KitKat and later provide the memtrack tool
– Logs memory utilization to Android logs
Memory Diagnostics
Framework Level Debugging
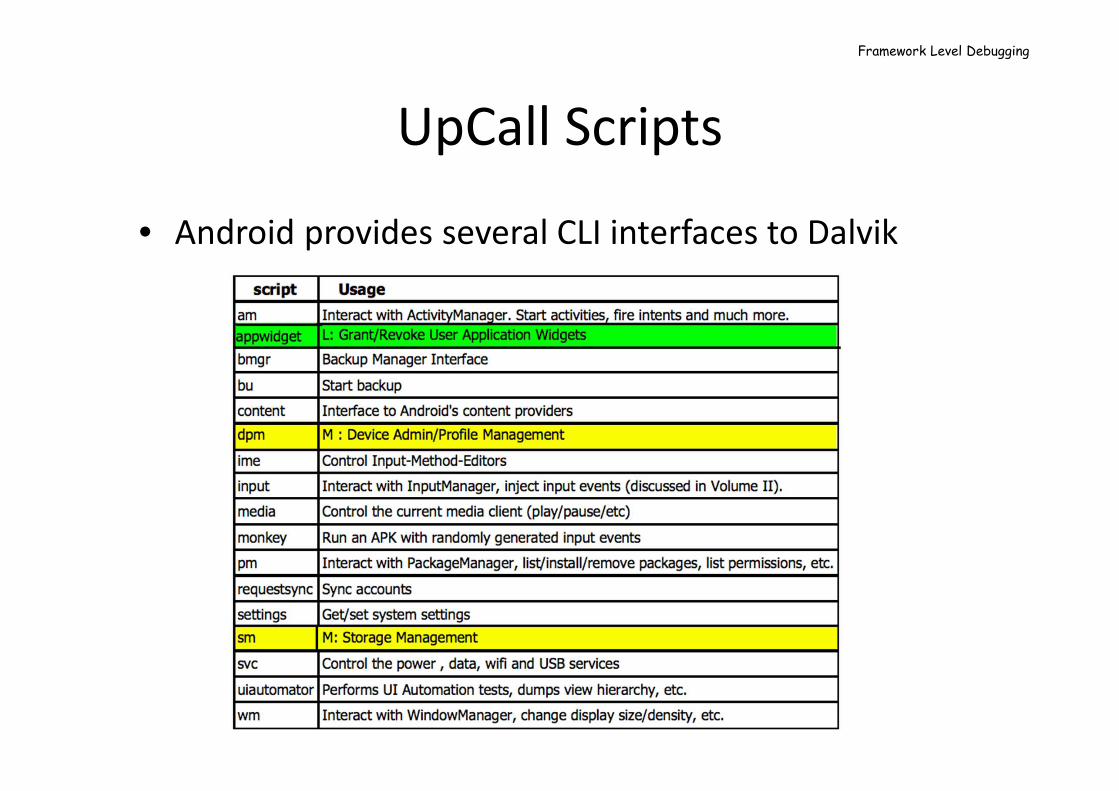
UpCall Scripts
• Android provides several CLI interfaces to Dalvik
Framework Level Debugging
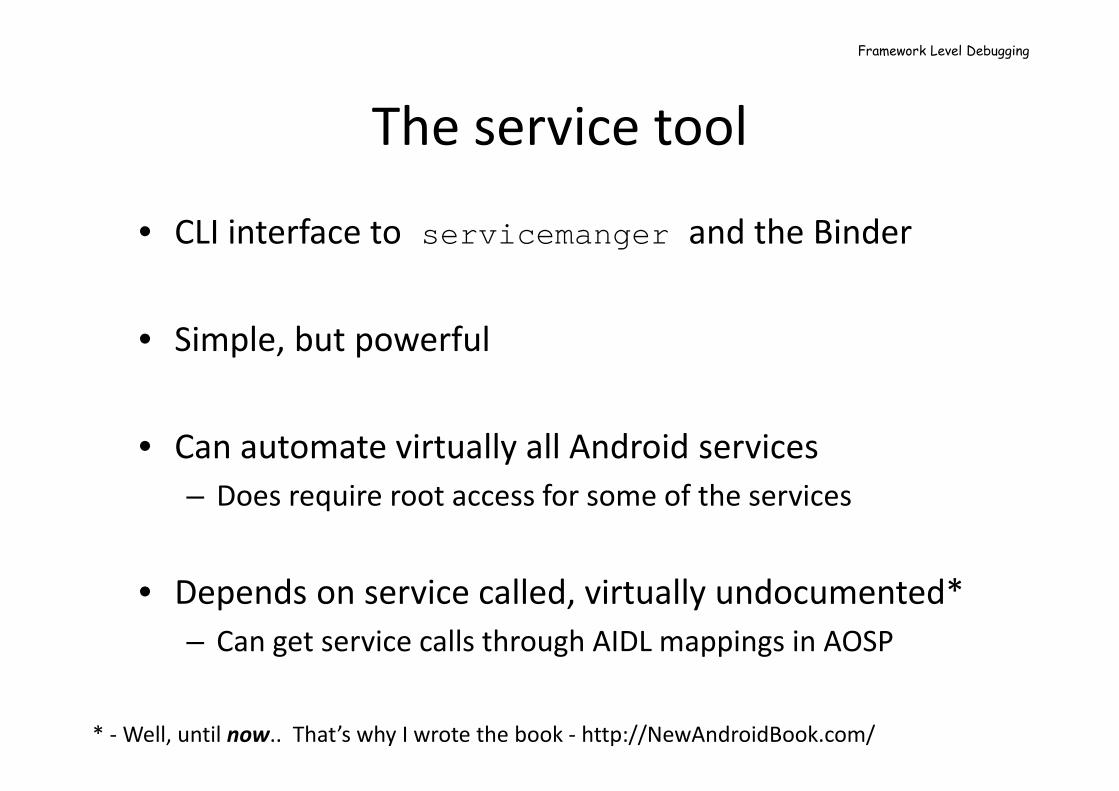
The service tool
• CLI interface to servicemanger and the Binder
• Simple, but powerful
• Can automate virtually all Android services
– Does require root access for some of the services
• Depends on service called, virtually undocumented*
– Can get service calls through AIDL mappings in AOSP
* - Well, until now.. That’s why I wrote the book - http://NewAndroidBook.com/
Framework Level Debugging
Input Events
• Toolbox’s getevent/sendevent can automate input
• The input upcall script can inject to input manager
• UIAutomator script handles more complex events
• The monkey script just goes wild all over the place
Framework Level Debugging
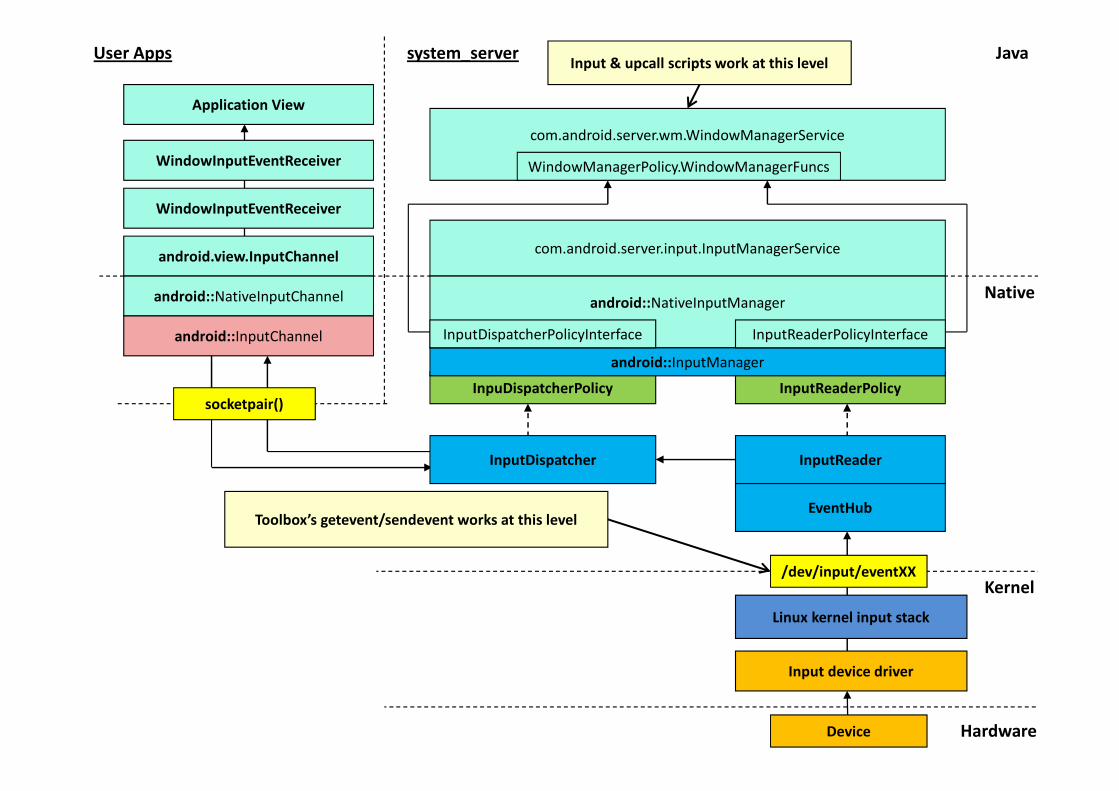
Toolbox’s getevent/sendevent works at this level
Application View
com.android.server.wm.WindowManagerService
com.android.server.input.InputManagerService
InputReader
Linux kernel input stack
EventHub
InputReaderPolicy
Native
Kernel
Java
Input device driver
InpuDispatcherPolicy
WindowInputEventReceiver
WindowInputEventReceiver
android.view.InputChannel
android::NativeInputChannel
android::InputChannel
android::NativeInputManager
android::InputManager
InputReaderPolicyInterfaceInputDispatcherPolicyInterface
socketpair()
system_serverUser Apps
InputDispatcher
/dev/input/eventXX
HardwareDevice
WindowManagerPolicy.WindowManagerFuncs
Input & upcall scripts work at this level

Post Mortem
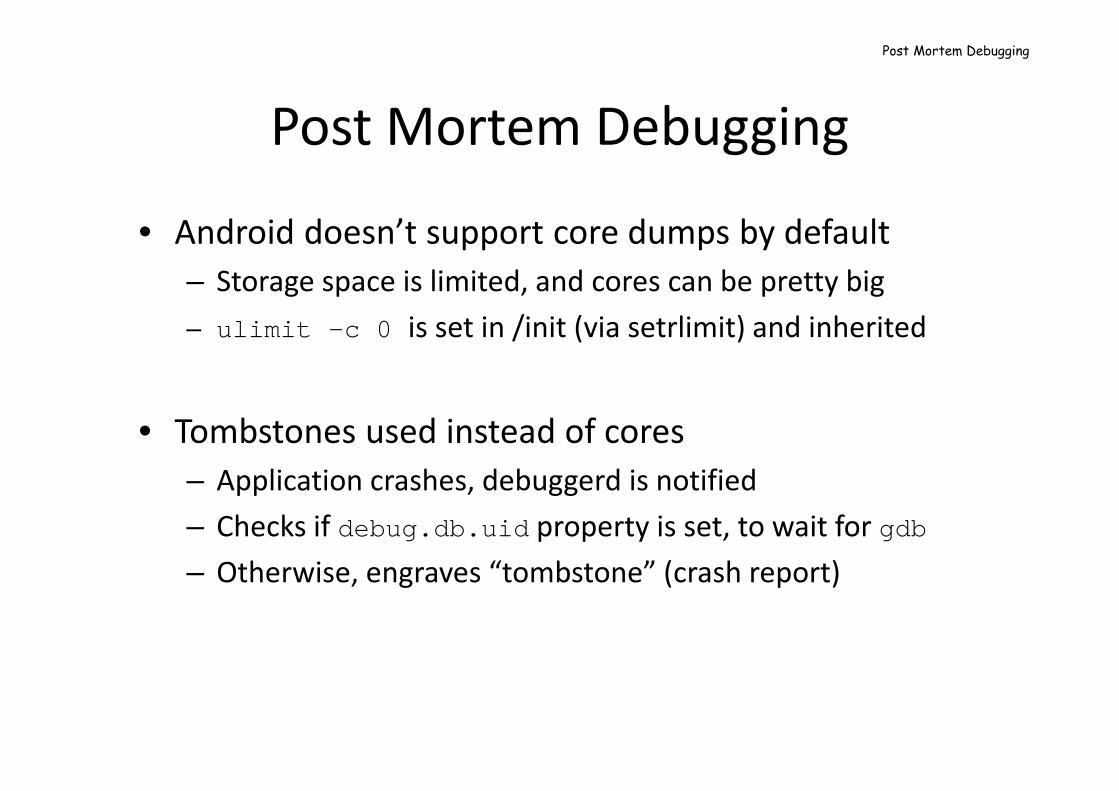
Post Mortem Debugging
• Android doesn’t support core dumps by default
– Storage space is limited, and cores can be pretty big
– ulimit –c 0 is set in /init (via setrlimit) and inherited
• Tombstones used instead of cores
– Application crashes, debuggerd is notified
– Checks if debug.db.uid property is set, to wait for gdb
– Otherwise, engraves “tombstone” (crash report)
Post Mortem Debugging
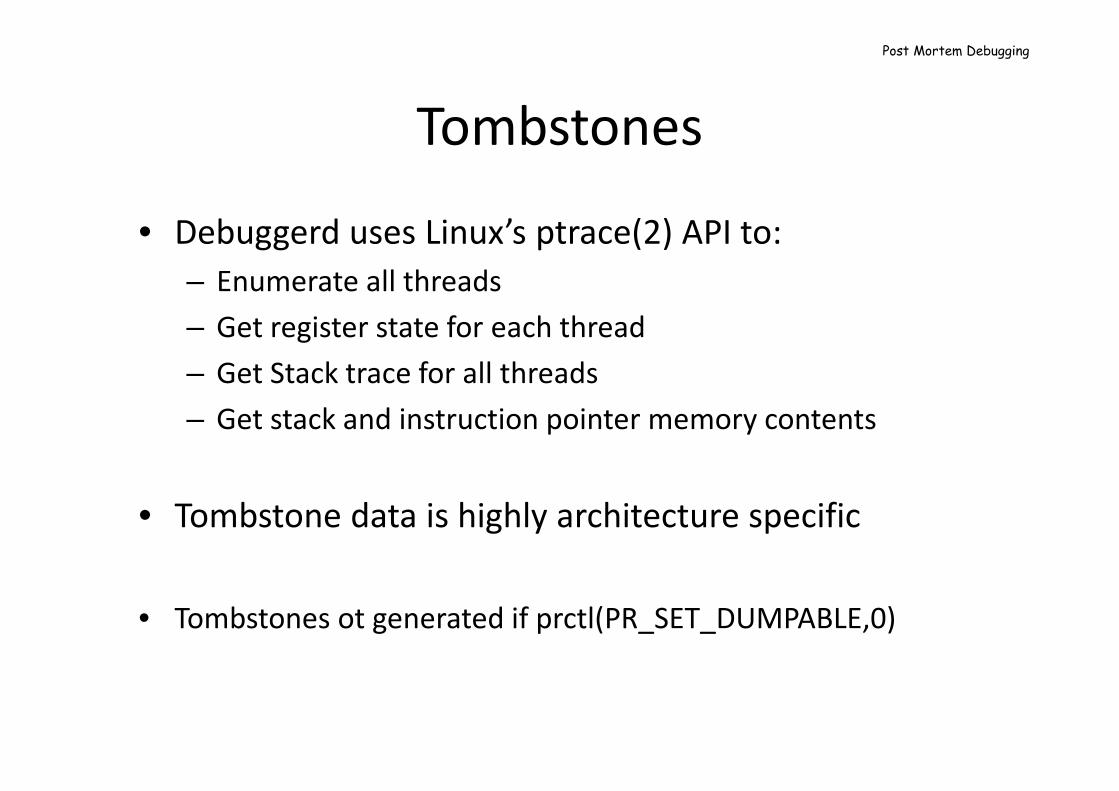
Tombstones
• Debuggerd uses Linux’s ptrace(2) API to:
– Enumerate all threads
– Get register state for each thread
– Get Stack trace for all threads
– Get stack and instruction pointer memory contents
• Tombstone data is highly architecture specific
• Tombstones ot generated if prctl(PR_SET_DUMPABLE,0)
Post Mortem Debugging
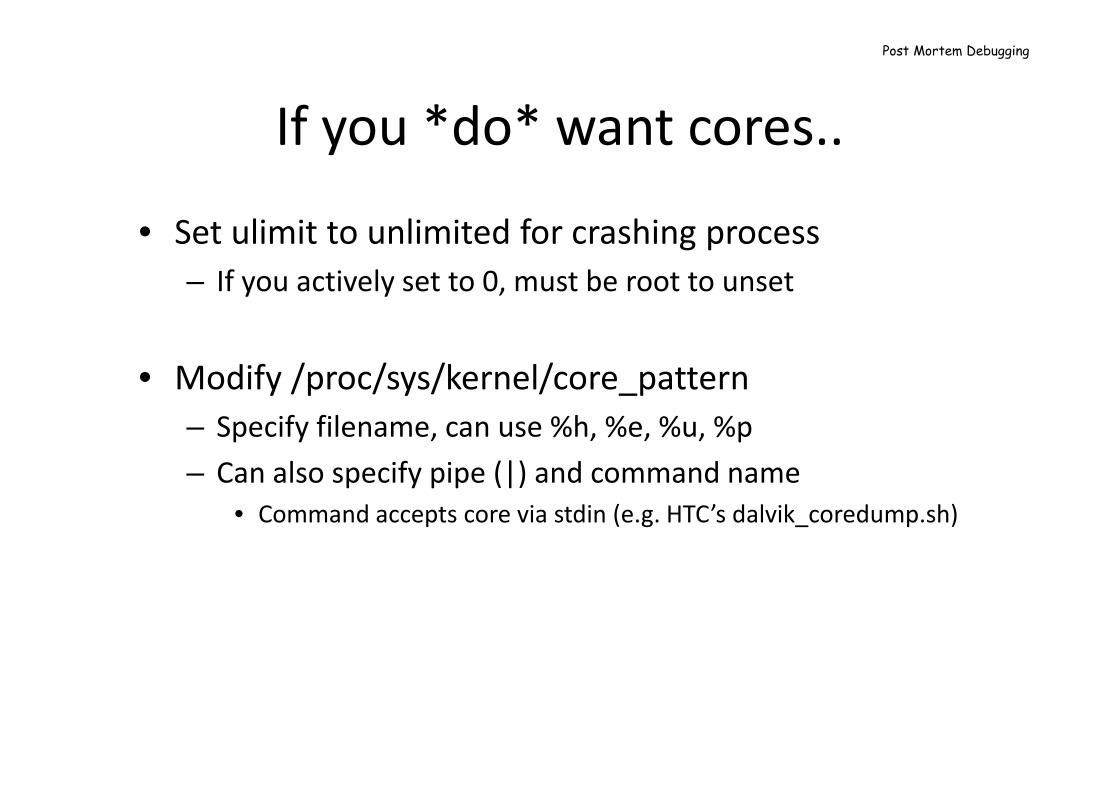
If you *do* want cores..
• Set ulimit to unlimited for crashing process
– If you actively set to 0, must be root to unset
• Modify /proc/sys/kernel/core_pattern
– Specify filename, can use %h, %e, %u, %p
– Can also specify pipe (|) and command name
• Command accepts core via stdin (e.g. HTC’s dalvik_coredump.sh)
Post Mortem Debugging
(time permitting)*
(light) Kernel Level Debugging
* - Time seldom permits us to do the fun things in life �
dmesg
• Output of kernel built-in printk API
• Recorded to in-kernel memory ring buffer
• Also accessible through /proc/kmsg
Kernel Level Debugging
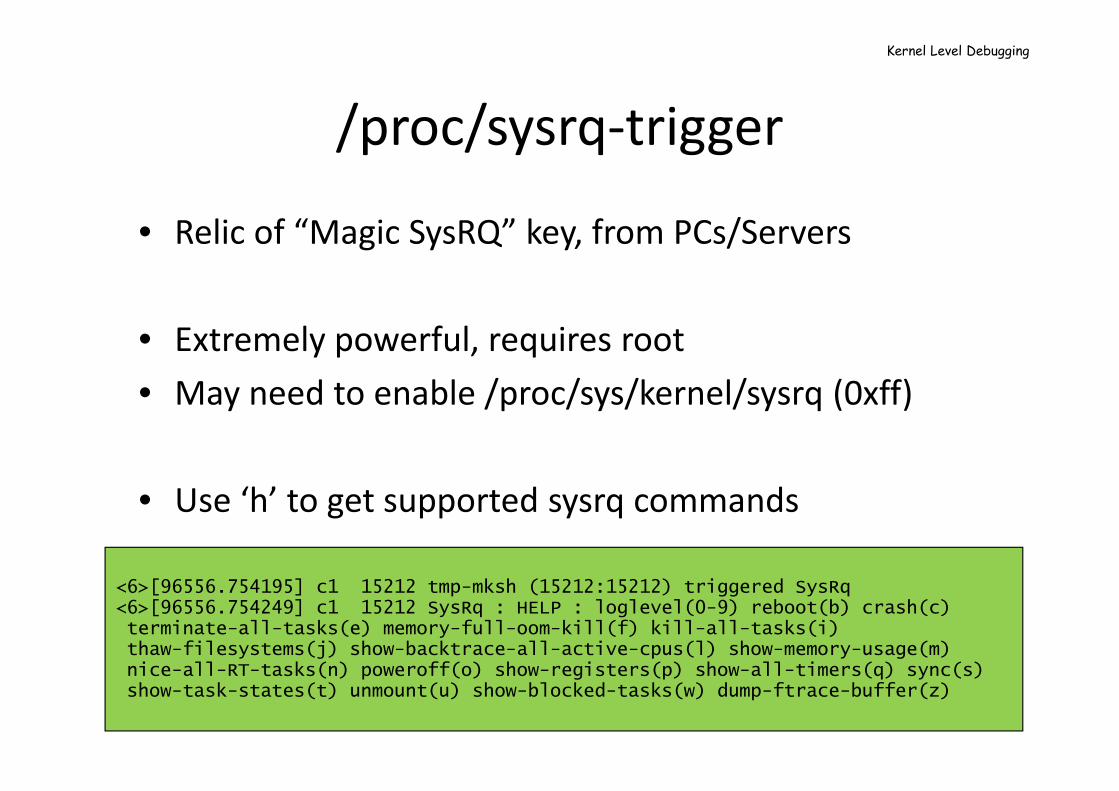
/proc/sysrq-trigger
• Relic of “Magic SysRQ” key, from PCs/Servers
• Extremely powerful, requires root
• May need to enable /proc/sys/kernel/sysrq (0xff)
• Use ‘h’ to get supported sysrq commands
<6>[96556.754195] c1 15212 tmp-mksh (15212:15212) triggered SysRq<6>[96556.754249] c1 15212 SysRq : HELP : loglevel(0-9) reboot(b) crash(c)terminate-all-tasks(e) memory-full-oom-kill(f) kill-all-tasks(i) thaw-filesystems(j) show-backtrace-all-active-cpus(l) show-memory-usage(m) nice-all-RT-tasks(n) poweroff(o) show-registers(p) show-all-timers(q) sync(s) show-task-states(t) unmount(u) show-blocked-tasks(w) dump-ftrace-buffer(z)
Kernel Level Debugging
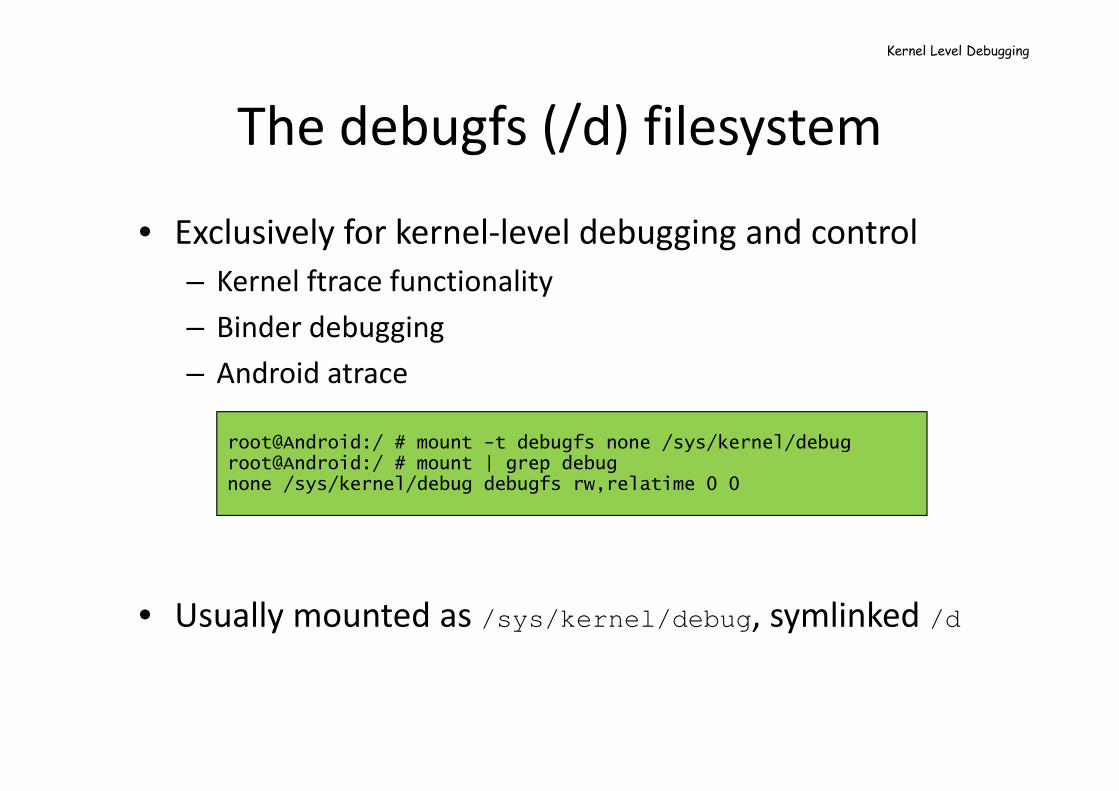
The debugfs (/d) filesystem
• Exclusively for kernel-level debugging and control
– Kernel ftrace functionality
– Binder debugging
– Android atrace
• Usually mounted as /sys/kernel/debug , symlinked /d
root@Android:/ # mount -t debugfs none /sys/kernel/debug root@Android:/ # mount | grep debugnone /sys/kernel/debug debugfs rw,relatime 0 0
Kernel Level Debugging
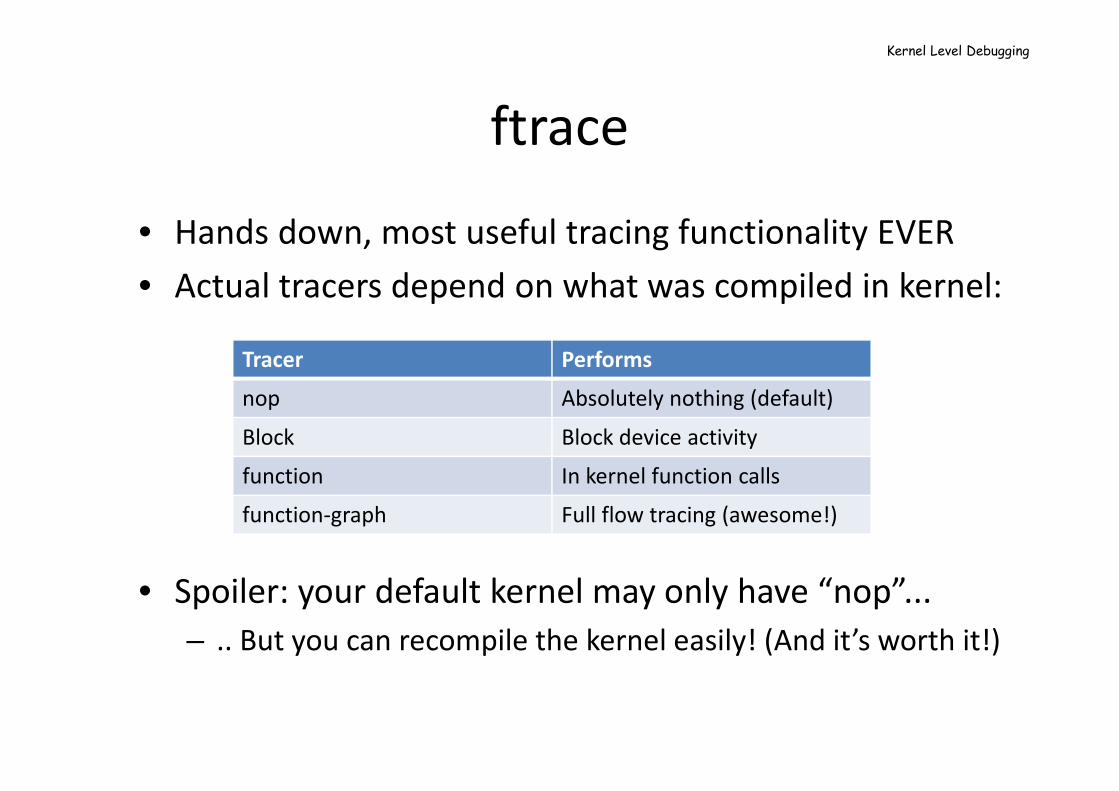
ftrace
• Hands down, most useful tracing functionality EVER
• Actual tracers depend on what was compiled in kernel:
Tracer Performs
nop Absolutely nothing (default)
Block Block device activity
function In kernel function calls
function-graph Full flow tracing (awesome!)
• Spoiler: your default kernel may only have “nop”...
– .. But you can recompile the kernel easily! (And it’s worth it!)
Kernel Level Debugging
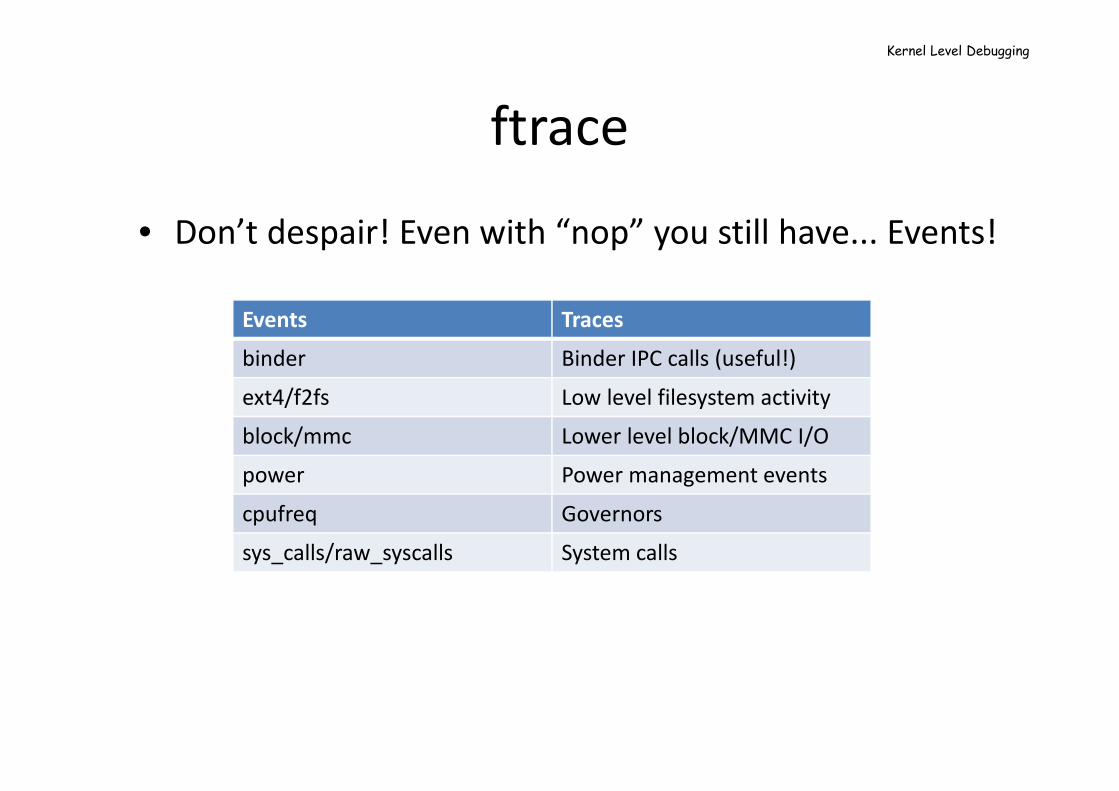
ftrace
• Don’t despair! Even with “nop” you still have... Events!
Events Traces
binder Binder IPC calls (useful!)
ext4/f2fs Low level filesystem activity
block/mmc Lower level block/MMC I/O
power Power management events
cpufreq Governors
sys_calls/raw_syscalls System calls
Kernel Level Debugging

And one more thing..
@Technologeeks Training
• “Android Internals & Reverse Engineering” training discusses all this, and more
– Native level debugging and tracing
– Binder internals
– Native services
– Frameworks
– DEX, OAT structure and reversing
• Based on “Android Internals” – (available) Volume I and (Jan 2016) Volume II
• http://Technologeeks.com/AIRE
– Next training: February 8th, 2016, NYC!
• Follow @Technologeeks for updates, training, and more!