Embed Size (px)
Citation preview
Regulation in the Market for Information*
Andrew Bird Stephen A. Karolyi Thomas G. Ruchti
September 2016
Abstract
The SEC regulates and standardizes information production in financial markets through financial reporting standards. With a novel dataset comprising several key features of this regulatory process, we investigate the market reaction to regulatory events that change these standards. New standards are met with positive market reactions, on average, but the market reacts more negatively to those which are controversial. In the cross-section of firms, we construct a new measure of ex ante sensitivity to information regulation and find that (i) sensitive firms have more negative market reactions to regulation, (ii) the information content of subsequent information events is higher for sensitive firms, and (iii) this change in information content comes from negative news, consistent with regulation constraining discretion in the disclosure of negative news. These results suggest that regulation in the market for information reduces the cost of capital and improves capital allocation by reducing asymmetric information in financial markets. JEL Classifications: G21, G28, G32, M41 Keywords: regulation, financial markets, asymmetric information, cost of capital, capital allocation
* Bird, Karolyi, and Ruchti are at the Tepper School of Business, Carnegie Mellon University ([email protected]; [email protected]; [email protected]). All remaining errors are our own.
0
1 Introduction
Financial markets rely on information to achieve optimal capital allocation (Akerlof
(1970); Leland and Pyle (1977); Myers and Majluf (1984); Admati (1985); Diamond and
Verrecchia (1991)). Through disagreement about asset values, asymmetric information prevents
efficient contracting and capital allocation (Diamond (1985)). With incomplete contracts,
agency conflicts can prevent managers from committing to publicly disseminate corporate
information in all states of the world (Jensen and Meckling (1976); Admati and Pfleiderer
(2000); Boot and Thakor (2001)). Moreover, with heterogeneous investors, disclosure, through
facilitating coordination, may produce positive governance externalities (Song and Thakor
(2006); Hermalin and Weisbach (1998, 2012)). Regulation in the market for information can
provide such commitment. Furthermore, standardization, a feasible component of regulation,
can reduce the costs of acquiring and processing information for investors. By ensuring
comparability, standardization improves cross-firm capital allocations and lowers the cost of
capital (Verrecchia (1982); Diamond and Verrecchia (1991); Easley and O’Hara (2004)).
Section 4 of the Securities Exchange Act of 1934 introduced the U.S. Securities and
Exchange Commission (SEC) to protect investors, maintain fair, orderly, and efficient markets,
and facilitate capital formation. In this mission, the SEC standardizes, regulates, and enforces
the dissemination of corporate information by publicly-listed companies. A key component of
the regulated information set is the set of financial statements, from which earnings is the
summary measure of periodic economic performance flows. Investors condition significantly on
1
SEC mandated quarterly earnings announcements; on average, the information content of
annual earnings announcements alone is 5.4 percentage points, suggesting that investors value
the economic information conveyed in earnings.1
For public companies, earnings must summarize the net economic benefits of millions of
transactions, so standardizing the treatment of classes of transactions can significantly affect the
quantification of earnings. To the great extent that investors respond to earnings
announcements, incremental regulation over the standards that define earnings, through altering
the aggregation technology used to quantify transactions, may have a significant impact on
perceived economic performance. Since 1973, the SEC has delegated regulation of financial
statements to the Financial Accounting Standards Board, which creates new standards as the
corporate landscape evolves and we observe financial innovation (e.g., securitization, leases,
stock options). Indeed, Arthur Levitt, former chairman of the SEC, stated, in remarks to the
Inter-American Development Bank in 1997, that “high quality accounting standards … improve
liquidity [and] reduce capital costs.”2
In this paper, we introduce a novel and comprehensive dataset of 171 FASB standards
and investigate the effects of these regulatory events on capital allocation and information
dissemination in financial markets. Two features of our dataset make this investigation feasible.
First, we collect data on the political economy determinants of regulation in this setting. For
1Moreover, in the cross-section of stock returns, cumulative earnings announcement date returns from the four earnings announcements per year explain, on average, 7.7% of annual stock returns, which, given 250 trading days per year, significantly exceeds the naïve expectation of 1.6%. 2 Remarks by Arthur Levitt at the Inter-American Development Bank on September 29, 1997. Also cited by Admati and Pfleiderer (2000) and Easley and O’Hara (2004).
2
each issued standard, we know (i) the number of formal comment letters submitted to the SEC
by market participants, (ii) the margin of victory in the FASB board member vote to issue the
standard, (iii) the regulatory delay between conception and issuance as well as between
conception and effective, and (iv) the number of standards being drafted and processed on
regulatory event dates. Second, we use textual analysis to collect the number of direct mentions
of each regulation in corporate disclosures, including those which happen before the effective
date of regulation. Relative to the characteristics of regulatory events, our corporate mentions
data allow us to explore within standard variation in the effects of regulation.
These data provide a platform to make four contributions to the literature that studies
regulation and information flows in financial markets. First, we provide evidence that
information regulation increases market values, on average, suggesting that incremental
information regulation reduces asymmetric information between firms and investors. Second, we
find that the political economy determinants of regulation moderate these capital allocation
effects. Standards that are controversial or have high implementation costs have smaller effects
on capital allocation and subsequent information flows. Third, firms which are ex ante sensitive
to regulation experience smaller valuation gains from regulation, but investors value their
subsequent information flows more. Fourth, the systematic post-regulation increase in the
information content of subsequent information flows for investors is driven by negative
information, suggesting that regulation succeeds in reducing discretion over the disclosure of
negative news.
3
To evaluate the valuation and capital allocation consequences of regulation, we utilize
cross-sectional variation in FASB standards and firms’ sensitivity to standards to explain the
aggregate and firm-level market reactions on key dates in the regulation process on which the
probability of regulation increases. On the first of these dates, the FASB issues an exposure
draft, which provides some details about a conceived standard. Although market participants
have not had formal opportunity to provide feedback on the draft and the FASB board
members have yet to vote to issue the standard, the exposure draft represents a significant
increase in the probability that a related standard will be issued. The second key date in the
standard setting process is the issuance date, which represents the public announcement that
the FASB board members have voted in favor of issuing the standard. Issuance resolves
uncertainty about the final set of regulatory changes and the timing of implementation (i.e.,
effective date).
In the cross-section of standards, we find that exposure draft and issuance dates are met
with statistically significant and economically large announcement returns, which suggests that
regulation increases capital allocation to regulated firms (i.e., U.S. publicly-listed corporations).
Although market reactions vary, and some are even negative, both equal-weighted and value-
weighted aggregate returns range from 0.30 percentage points to 0.63 percentage points. For
context, a 0.63 percentage point increase in the market capitalization of the U.S. public equity
market in 2015 corresponds to a $157.5 billion increase in value, or approximately the market
value of the 25th largest publicly-listed company in the U.S. We find some evidence that the
stock market anticipates issuance, which is consistent with information leakage regarding the
4
outcome of the FASB board member vote. We also find evidence that the stock market
underreacts to the exposure draft, which is consistent with investors not only learning about the
proposed regulation but also how it will impact individual firms.
Market participants, including investors, auditors, and corporations, have the
opportunity to provide feedback to the FASB by formally submitting comment letters.
Similarly, corporations can communicate the expected effects of the proposed regulation to
investors via public filings. Regulators may also condition on investors’ reactions to exposure
draft announcements. Discord among market participants, measured by the number of comment
letters, may generate issuance delays; FASB regulators must revise the exposure draft in
preparation for the vote and, eventual implementation.
We find that these factors – comment letters, corporate mentions, and the market
reaction to the exposure draft – determine FASB board member voting behavior. Using a
regression discontinuity design to isolate contentious votes, we find that FASB board members
are more likely to oppose regulation if the exposure draft was met with a negative market
response, if market participants submitted many comment letters, and if corporations frequently
mentioned the standard in their public filings. This evidence suggests that the regulator’s
objective incorporates agreement and valuation by market participants. These factors also
explain the market reaction to issuance. Similarly, standards with longer issuance delays are met
with lower issuance returns as well, although this may reflect implementation costs in addition
to discord among market participants.
5
Corporate mentions of specific standards before the standard’s effective date reflect the
ex ante sensitivity of the corporation to that standard. Indeed, we find that corporations that
are, by their own credible and public admission, sensitive to specific standards have lower
market reactions to the standard’s exposure draft and issuance. That is, on a relative basis,
capital is divested from firms that are ex ante sensitive to changes in regulation following
discrete increases in the probability of these changes in regulation. Moreover, these results hold
within firm and within standard-industry, suggesting that fixed sensitivity to changes in the
regulated aggregation technology and standard-specific sensitivity for each industry cannot
explain the link between ex ante sensitivity and capital allocation.
Because the regulator’s goal is to reduce asymmetric information between corporations
and investors, we investigate the channel through which in regulation increases equity value.
Regulation concerns the aggregation technology that generates earnings, the summary measure
of economic performance, so we explore cross-sectional variation in regulatory events to link the
determinants of capital allocation to changes in information transmission and processing in
financial markets. We find that regulation increases the information content of earnings, on
average, but also that this effect is larger for standards with many comment letters and
standards written while regulators are busy drafting or processing other standards. These results
suggest that regulators are successful in their selection of drafting and issuing regulation, and
that feedback from comment letters reflects apprehension about losing discretion over the
disclosure of negative information.
6
Furthermore, using corporate mentions as our measure of ex ante sensitivity, we find
that regulation-sensitive firms experience the largest increase in the information content of
earnings. Additionally, we find that this increase is almost entirely due to changes in the left tail
of the earnings announcement return distribution. Together, these results suggest that
regulation successfully limits corporate discretion over the aggregation technology and acts as a
commitment to disclose components in earnings by regulation-sensitive firms.
As this paper is, to our knowledge, the first to comprehensively address the
standardization and regulation of information in financial markets, it makes significant
contributions to the literatures that study the design and adoption of financial markets
regulation, information acquisition and processing in a market setting, and information
aggregation in equilibrium. Because the regulatory events we study reduce the information
acquisition and processing costs for investors via standardization, we provide evidence in
support of models that link costly information acquisition to asset prices, capital allocation, and
welfare (Verrecchia (1982); Admati (1985); Diamond and Verrecchia (1992); Admati and
Pfleiderer (2000)). Moreover, if interpreted through the lens of Diamond (1985), our evidence
suggests that investors are better off because incremental disclosure regulation increases public
information.
More generally, our evidence speaks to the central role of public information in welfare
and efficiency in games with coordination. Myatt and Wallace (2012) show that increased
coordination incentive leads agents to endogenously acquire information that is more public in
nature. Indeed, when agents endogenously acquire information, the signals that receive the
7
most attention are those that are most available, even if they have poor underlying accuracy.
The literature has looked extensively at the conditions for which improved public information
unambiguously improves welfare (Morris and Shin (2002), Angeletos and Pavan (2007),
Chahrour (2014) and Ui and Yoshizawa (2015)). Iachan and Nenov (2015) show that not only
may more public information be desirable, but the quality of that information matters. The
authors show that when payoffs in bad states are more sensitive to fundamentals than payoffs in
good states, that the quality of public information is paramount to financial stability.
2 Institutional setting
The SEC has overall responsibility for regulation of US capital markets, though it has
traditionally delegated the administration of accounting rules to the accounting profession. Since
1973, the body in charge has been the Financial Accounting Standards Board (FASB), a private
organization headquartered in Norwalk, Connecticut, itself overseen by the Financial
Accounting Foundation (FAF). The common set of accounting principles and rules, which are
promulgated by FASB, which companies must follow in preparing their financial statements, is
known as Generally Accepted Accounting Principles (GAAP). During our sample period, the
main updates to GAAP were called Statements of Financial Accounting Standards (SFAS).
In setting these standards, FASB’s stated objective is to “foster financial reporting by
nongovernmental entities that provides decision-useful information to investors and other users
8
of financial reports.”3 In fact, in line with the theoretical rationales for public disclosure and
comparability in disclosure discussed above, FASB’s Rules of Procedure specifically state that
“decisions about the allocation of resources rely heavily on credible, concise, and understandable
financial information.” Further, FASB explicitly recognizes that some decision makers cannot
require firms to provide the information they need directly and so must rely on public financial
reports. An important principle underlying the FASB’s work is a cost-benefit analysis of
proposed standards so that the cost of preparing, providing, and auditing the information is
explicitly taken into consideration.
The board of FASB consists of seven members appointed to five-year terms by the FAF,
which can be extended for one additional term.4 Because members must be independent, they
must sever ties with their previous organizations before joining the Board. The current
membership of the FASB has a diverse background; the majority of the members have previous
experience at one of the big public audit firms, but there is also one representative of the
academic accounting community, one member with experience on the company financial
reporting side and another member with experience on the investment side with past positions
as a money manager and as an equity analyst. Members are assisted by a technical staff of more
than sixty people.
The actual standard setting process involves a series of steps adopted under the
authority of the FAF. The board identifies a topic which it believes new standards could
3 http://bit.ly/2ctk7TK 4 In rare cases, such as in 2009, because of vacancies which were not immediately filled, FASB has only had five members.
9

improve, and then conducts research on the specific issues of relevance. These issues are
deliberated at a public meeting. FASB then releases an exposure draft, which outlines the views
of the board on the accounting issues at hand, in order to solicit feedback from the public on the
proposed new standard. Further public hearings are held, and the board considers comment
letters which it receives from stakeholders, such as investors, auditors, and public companies.
The board then makes a decision on the form and substance of the new accounting standard,
and the individual members vote on whether the standard should be issued. If the vote passes,
the standard is released publicly, and becomes part of GAAP.
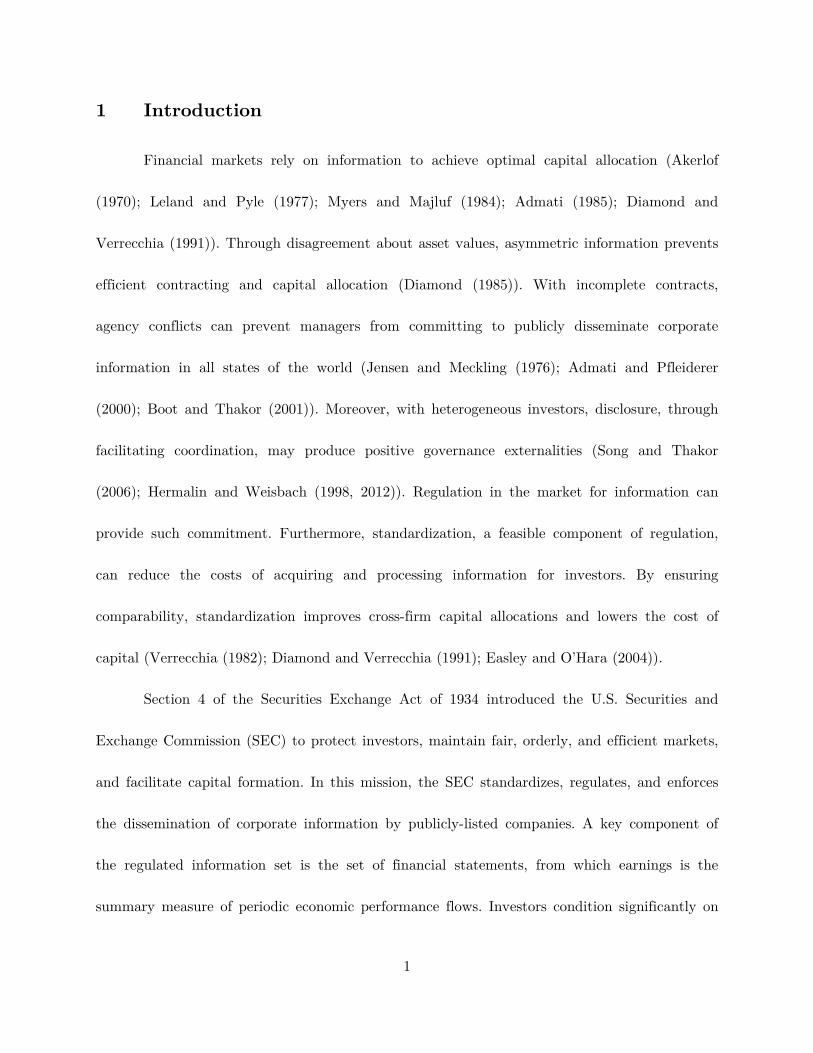
Figure 1 shows the number of standards issued by FASB in each year from 1973-2010,
for a total of 171 Statements of Financial Accounting Standards. There is considerable
intertemporal variation, with as many as 19 standards issued in 1981. The greater number of
standards in the 1970s and 1980s likely reflects the change in institutional structure of US
accounting rules, as well as the possibility that a less developed system of measurement for
financial reporting yields more opportunities for improvement. We end our sample in 2010
because the structure of accounting rules was changed in that year. The new and current model
is the culmination of a project to codify GAAP, which has resulted in the Accounting Standards
Codification. The Codification is updated by the issuance of Accounting Standards Updates,
following a very similar process to that described above. However, while the standards that we
study are the key building blocks of the Codification, the actual standards themselves (mentions
of which we collect, as described below) are now technically superseded.
10
3 Data and sample selection
We collect data on standards from two main sources: the text of the standards themselves, and
related documents, available through FASB, and mentions of standards in firms’ 10-Ks (annual
reports). In some tests, we are able to include information on all 171 standards issued by FASB.
Because of missing data concerning some aspects of the standards and the availability of
machine parseable 10-Ks, some of our tests only cover the period 1995-2010.
3.1 Dates
As described in Section 2, FASB takes several steps in the process of implementing a
standard. After deliberation and public consultation to determine pressing financial reporting
issues, the formal process begins with the drafting, by the members of the FASB, of an
“exposure draft” for a proposed standard. This exposure draft is disseminated to public firms as
well as the SEC for comments. We refer to the date on which this document is made public as
the exposure draft date. After a period of time, usually longer than a year, the FASB receives
input regarding the proposed standard, and revises the draft until a completed version is
decided upon. The standard is then made public, and becomes part of GAAP. We refer to the
date on which the standard is formally issued as the issuance date. Standards must be
announced before they can be implemented by firms and their auditors. The date the standard
becomes binding for all subsequently issued financial reports is the effective date.
11

We collected exposure draft dates from FASB press releases and the text of the
standards themselves from FASB, which includes details on the drafting and implementation
process such as the date of associated exposure drafts, the number of comment letters submitted
in relation to the exposure draft, and the voting outcomes when the standard was considered for
adoption. Several standards have multiple exposure drafts. When this is the case, we hand
collect the first exposure draft as the first event related to the standard. Because the FASB
standards themselves do not specify a day on which they were issued, only a month, we collect
issuance dates from FASB press releases regarding the issuance of the standard. Effective dates
were collected directly from the text of the standards themselves, which delineate the date at
which the standard must be implemented by firms.
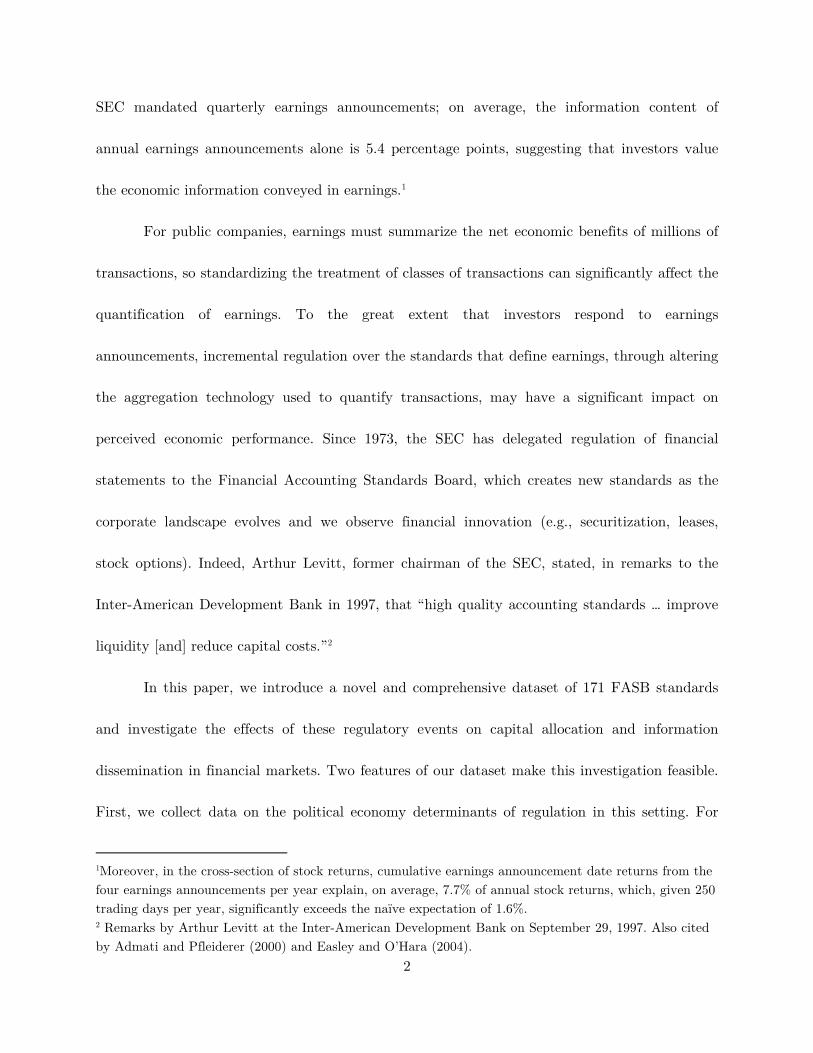
The amount of time taken by the drafting and implementation processes varies
considerably by standard. Figure 2 shows a histogram of the elapsed time between exposure
draft and issuance of the standard. This time difference is a function of the amount of time
spent deliberating on and revising the standard. The mean is 610 days with considerable
variation across standards.
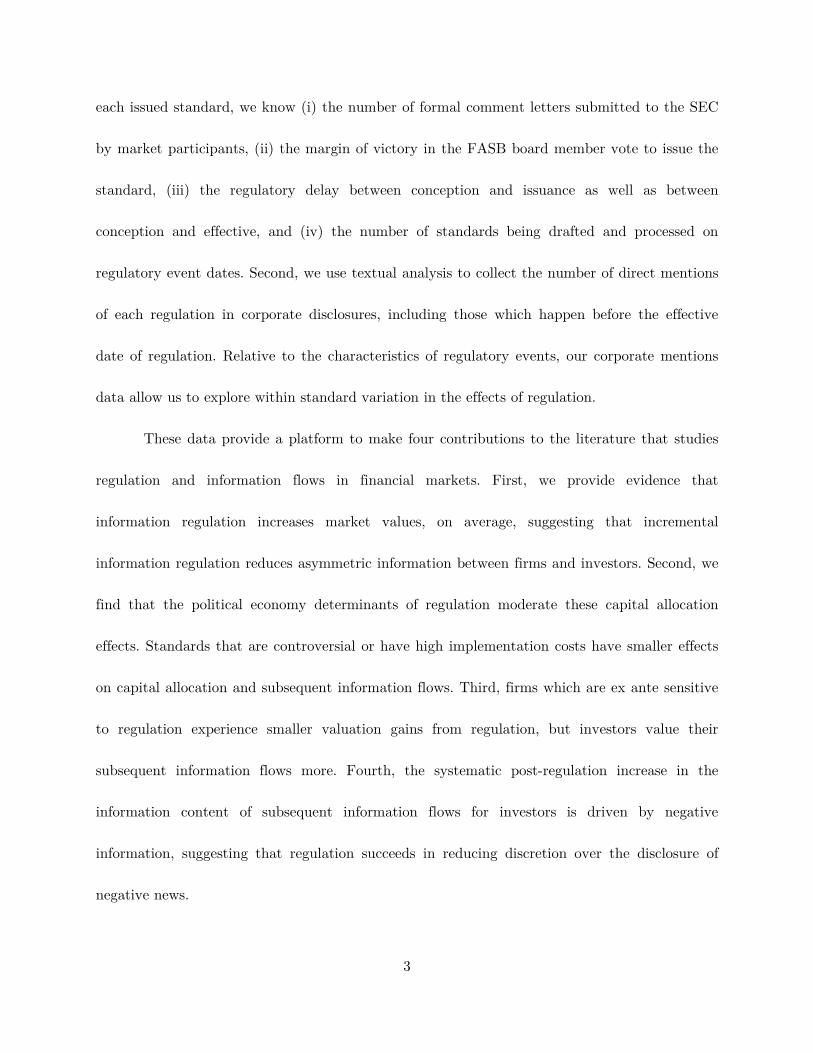
In contrast, Figure 3 shows the time between issuance of the standard and the
effective date. This difference reflects the actual implementation of the standard, such that
longer delays would be more likely for more complex standards, giving firms and auditors more
time in which to study and interpret the standard, as well as making the necessary adjustments
to internal accounting systems. The mean time to effective is more than two years, suggesting
12
that these changes to accounting rules are viewed by standard setters as having nontrivial
effects on firms’ disclosure environments.
3.2 Comment letters
During the time between first exposure draft and issuing the standard, the FASB allows
for upwards of a year for the public to voice concerns over the proposed standard. During this
time (between exposure draft date and issuance date), various interested parties, such as
auditors, investors and public companies, send comment letters so the FASB. We treat the
number of comment letters as a measure of disagreement regarding the standard. We hand
collect the number of comment letters from the narrative discussion in each standard.
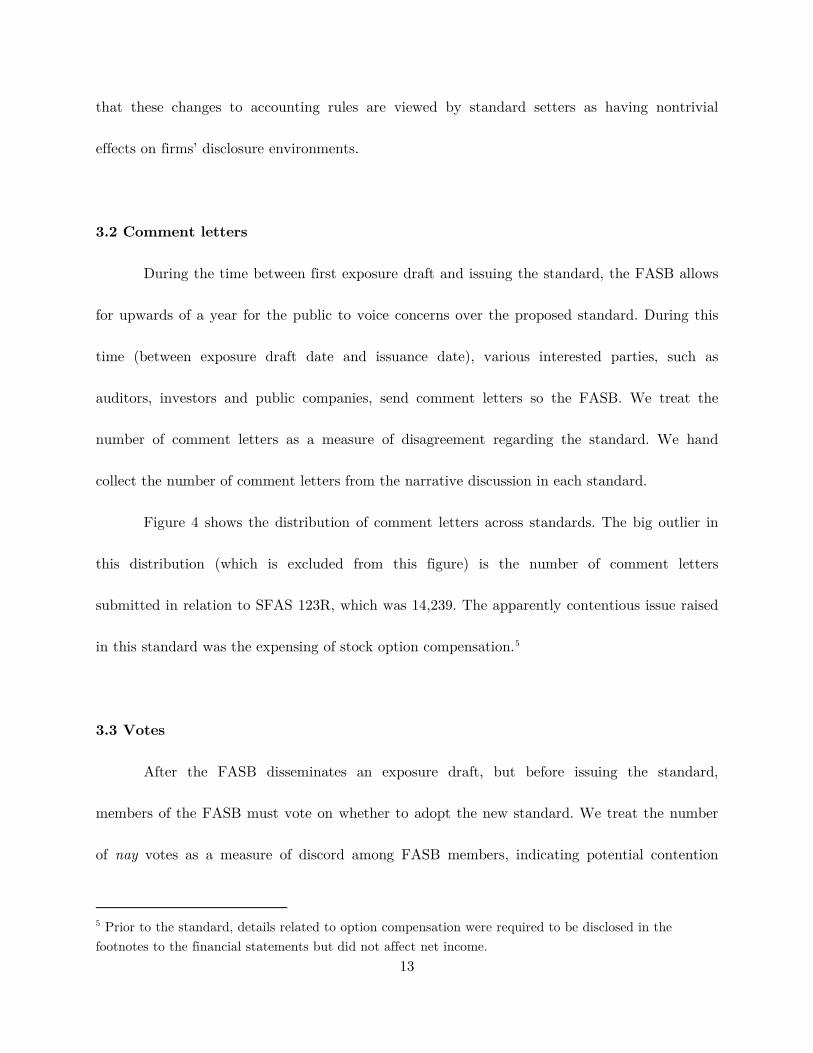
Figure 4 shows the distribution of comment letters across standards. The big outlier in
this distribution (which is excluded from this figure) is the number of comment letters
submitted in relation to SFAS 123R, which was 14,239. The apparently contentious issue raised
in this standard was the expensing of stock option compensation.5
3.3 Votes
After the FASB disseminates an exposure draft, but before issuing the standard,
members of the FASB must vote on whether to adopt the new standard. We treat the number
of nay votes as a measure of discord among FASB members, indicating potential contention
5 Prior to the standard, details related to option compensation were required to be disclosed in the footnotes to the financial statements but did not affect net income.
13
over the net benefit of the proposed standard. We hand collect final votes on each standard
from each standard pronouncement.
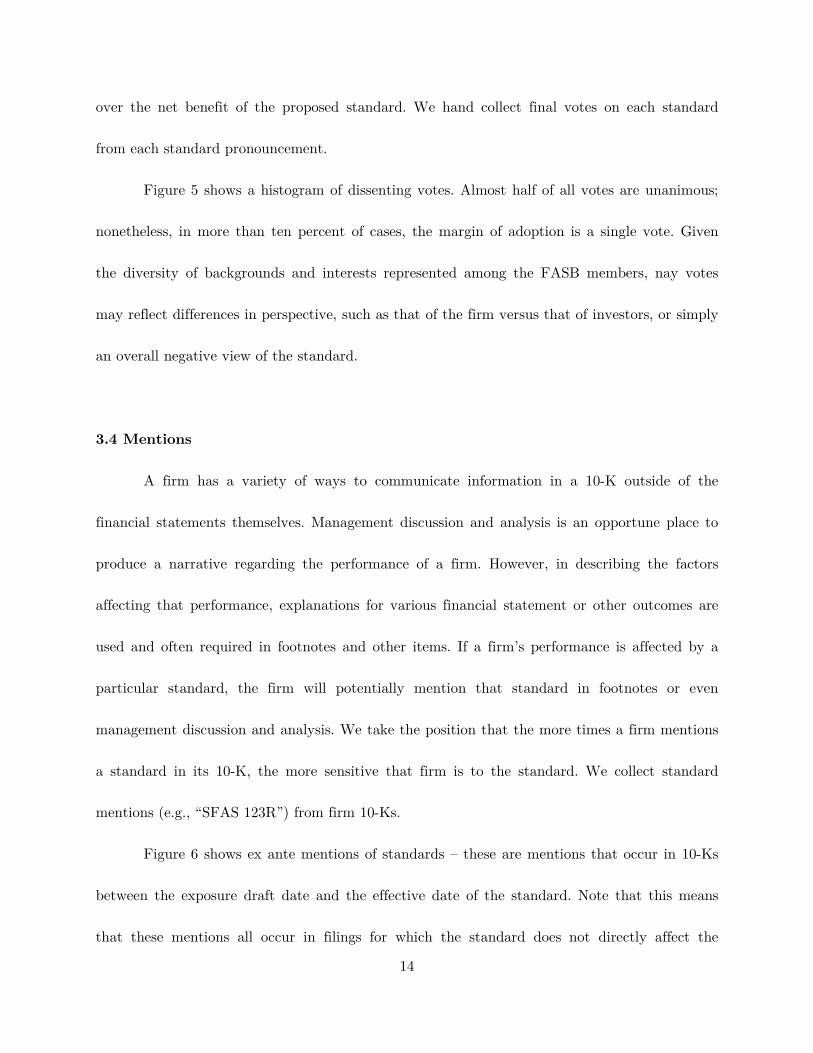
Figure 5 shows a histogram of dissenting votes. Almost half of all votes are unanimous;
nonetheless, in more than ten percent of cases, the margin of adoption is a single vote. Given
the diversity of backgrounds and interests represented among the FASB members, nay votes
may reflect differences in perspective, such as that of the firm versus that of investors, or simply
an overall negative view of the standard.
3.4 Mentions
A firm has a variety of ways to communicate information in a 10-K outside of the
financial statements themselves. Management discussion and analysis is an opportune place to
produce a narrative regarding the performance of a firm. However, in describing the factors
affecting that performance, explanations for various financial statement or other outcomes are
used and often required in footnotes and other items. If a firm’s performance is affected by a
particular standard, the firm will potentially mention that standard in footnotes or even
management discussion and analysis. We take the position that the more times a firm mentions
a standard in its 10-K, the more sensitive that firm is to the standard. We collect standard
mentions (e.g., “SFAS 123R”) from firm 10-Ks.
Figure 6 shows ex ante mentions of standards – these are mentions that occur in 10-Ks
between the exposure draft date and the effective date of the standard. Note that this means
that these mentions all occur in filings for which the standard does not directly affect the
14

reported numbers. Some standards have as many as 80,000 mentions in this period. Figure 7
shows total mentions of accounting standards by year, which are on the order of hundreds of
thousands of individual mentions, ex ante mentions by year, and the probability that firms
mention a particular standard in each year. The latter measure gets as high as 40% for some
particularly important standards.
3.5 Announcement returns
To evaluate whether FASB standards are value-increasing or not, we study market
reactions on two crucial dates in the standard setting process. First, we investigate the exposure
draft date, which follows a period of private consultation with select market participants and
drafting by FASB members. Due to the rarity of FASB exposure drafts that do not lead to
issued standards, investors can be nearly certain that a standard reflecting the content of the
exposure draft will, indeed, be issued. Figure 8 presents a histogram of the value-weighted three-
day cumulative announcement returns to exposure draft events for each of the 171 standards
issued since 1973. As can be seen in Table 1, the average exposure draft is met with a positive
response by investors; a 30 basis point increase in market capitalization.
Second, we study the issuance date, which follows an interim period of feedback by
market participants and eventual voting by the FASB members. Upon issuance, any remaining
uncertainty about the issuance and implementation of the standard is resolved, including when
the SEC will begin to enforce the standard. Figure 9 presents a histogram of value-weighted
three-day cumulative announcement returns to issuance dates, which shows positive skewness.
15
The average issuance date is met with a 63 basis point increase in market capitalization.
Because only 35 issuance dates are public knowledge, these tests are limited to a subsample of
35 standards.
Table 2 presents equal-weighted and value-weighted cumulative announcement returns
for exposure draft and issuance dates for a variety of event periods. We choose event periods
that begin one month in advance of the event date and end one month after the event date to
investigate anticipation and under-reaction. Whether we aggregate cross-sectional returns using
equal weights or market capitalization weights, we find statistically and economically significant
evidence of positive announcement returns on exposure draft and issuance dates. Our evidence
suggests that investors underreact to information contained in the exposure draft, which is
consistent with both investor learning and complexity. We also find evidence of information
leakage in the month leading up to the issuance date, which is consistent with information
about FASB member voting and comments letter preempting the announcement regarding
issuance.
4 Regulation and capital allocation
As discussed above, Tables 1 and 2 show that while market reactions to exposure drafts
and the issuance of standards varies considerably across firms and standards, the average
reaction is positive, which suggest that new accounting standards are value increasing. In Table
3, we investigate the determinants of this reaction at the standard level, including the number
16

of dissenting votes by the standard setters themselves, the total number of comment letters
received by the FASB regarding each standard, the total number of ex ante mentions of each
standard, and each standard’s issuance delay (time from exposure draft to issuance). We find
that if there more contention over whether the standard is good, both from the regulator’s
perspective, and firm perspective, leads to lower returns. Column (1) shows that an additional
dissenting vote leads to 19 basis points lower returns, whereas column (2) shows that a 10%
increase in the number of comments leads to a 20 basis point reduction in returns. If firms
display that they are more sensitive to the standard, as exhibited by mentions of the standard
in annual reports, then returns are more negative—column (3) shows that a 10% increase in ex
ante mentions of a standard leading to 54 basis points lower returns. This shows that if more
firms are warning investors that the standard is coming, then the market reacts more negatively
to the implementation of the standard. To reconcile this finding with the robust positive
response on average to new accounting standards seen in Table 2, it is helpful to think of two
competing economic effects. The first, in line with the theoretical rationale for mandatory public
and standardized disclosure, predicts that a new, well-designed, accounting standard will
improve firms’ information environments and so will be met with a positive response by
markets. The second economic effect is that, if mandatory disclosure is more likely to cause
negative news to be disclosed, as would be expected given most models of voluntary disclosure,
then mentions of the new standard by firms will reflect an increased likelihood of bad news in
the future. This would predict a negative response of firm value to the introduction of the new
standard for firms which are sensitive to that standard, which is what we find. While on average
17

the first effect dominates, for some standards the revelation of negative news may shift the net
market reaction negative, this is consistent with capital leaving the public sector, though in an
efficient way. To confirm that the positive effect on average is a result of an improved
information environment reducing firms’ cost of capital, in the next section we investigate the
effect of new accounting standards on the market response to earnings announcements and find
that standards improve the Informativeness of such announcements.
In Table 3, we next turn to the relationship between issuance delay and issuance date
returns, and find, in column (4), that a 1% increase in delay reduces returns from issuance by
nine basis points. There are several reasons why a standard could take longer to implement:
there could be greater discord among stakeholders or the board itself, the accounting issues
addressed by the standard could be particularly complex, or a longer delay could simply reflect
more time spent improving the standard. Greater discord may relate to the results in columns
(1) and (2), but the relatively negative returns may be due to the market disliking complex
standards. In the final column of the table, we look at the effects of all four together, and find
qualitatively similar results, though the effect of comment letters loses statistical significance,
while mentions and issuance delay become significant.
Table 4 shows firm-level analysis of the effect of mentions of a specific standard on that
standard’s exposure draft and issuance returns. In Panel A, we investigate exposure draft
returns. The sensitivity to each standard is measured by mentions of that standard by the firm
in 10-Ks between the exposure draft and the issuance of the standard. In column (1) we show
that a 1% increase in a firm’s mentions of a standard is associated with a 56 basis points lower
18

return for that firm at the time of the exposure draft. Firms that caution their investors more
about a standard’s effect—those that are more sensitive to the standard—are those that
received a lower market return at the time of the exposure draft to that standard. In column (2)
of Panel A, we use standard fixed effects, and still obtain a statistically significant result of a
1% increase in mentions being associated with a nine basis points lower return, meaning that
this effect is not due to fixed cross-standard differences, such as the importance of the relevant
reporting issue. In column (3) we also include firm fixed effects to control for a firm’s average
reactions to exposure drafts and achieve qualitatively similar results as in column (2). In column
(4) we further control for industry-standard fixed effects and get essentially the same result,
meaning that the effect for a firm is with respect to how abnormal its mentions are within the
industry, rather than simply industry-specific market reactions to each standard. Panel B
studies the relationship between a firm’s sensitivity to a standard and that firm’s return at the
standard’s issuance. While in column (1) we see that a 1% increase in mentions leads to an 18
basis point lower return at issuance, this effect goes away in columns (2)-(4) when we add
standard, standard and firm, and firm and industry-standard fixed effects. This result shows
that the market likely anticipates the effects the standard should have for any idiosyncratic
sensitivity. The magnitude of the effects are also lower than for the exposure draft, indicating
that the market has learned about the standard’s effect on changes to the information
aggregation technology.
19

5 Regulation and the information content of earnings
Table 5 demonstrates the way in which the aggregation technology has changed for firms
that are more sensitive to the standard, following the effective date of the standard. Using a
difference in difference design on the intensity of firm sensitivity to each standard (mentions), in
Panel A we look at the information content of earnings through the absolute market reaction to
earnings announcements surrounding the regulatory event, 2 years leading and 2 years following.
In column (1), we find that following the effective date of a standard, firms that are 1% more
sensitive to the standard (as measured by mentions) have a 20 basis point increase in absolute
market reaction (information content) to earnings announcements. This design employs controls
and standard fixed effects. In column (2) we add year fixed effects, and still find a three basis
point increase for every 1% increase in sensitivity. If we add firm and industry-year fixed
effects—as we do in columns (3) and (4)—our results remain qualitatively the same. While
increased sensitivity to a standard leads to increased information content of earnings following
implementation of the standard while controlling for industry-year variation as well as
idiosyncratic firm or standard contributions to information content, we may be concerned that
firms individually interact with standards differently. We incorporate firm-standard fixed effects
in addition to previous fixed effects in column (5) and show that our results hold, preserving
within-firm-standard effects of the sensitivity to a particular standard.
In Panel B we investigate the source of this increased information content of earnings,
and we find that this change is predominantly due to negative news. With similar fixed effects
20
regressions as in Panel A, we investigate signed market reactions to earnings announcements
and find results of the same magnitude, indicating that firms that are sensitive to a must now
more accurately report negative news to markets. This is in keeping with the notion that firms
have plenty of avenues to disclose good news, but may have the incentive to withhold bad news.
Table 6 investigates the absolute market reaction to earnings announcements in a
difference in difference design for each standard, but alternatively looking at the effect of a
firm’s absolute exposure draft returns as a proxy for sensitivity to the standard, following the
implementation of the standard. In Panel A, column (1) we include controls and standard fixed
effects and find that a 1% higher absolute exposure draft return for a firm leads to a 58 basis
point increase in absolute earnings announcement returns after the effective date of the
standard. Firms that are more sensitive to the standard see an increase in the information
content of their earnings following implementation of the standard. In column (2), we see that
while controlling for standard and year fixed effects, a 1% increase in absolute exposure draft
returns for a firm lead to 20 basis point higher absolute returns for the two earnings
announcements following implementation of the standard. In columns (3)-(5), we include firm,
industry-year, then finally firm-standard fixed effects and get roughly an eight basis point
increase in absolute earnings announcement returns for a 1% increase in absolute exposure draft
returns. These results show an alternative measure of sensitivity (to the standard mentions
explored in Table 5) to a standard is associated with an increase in the information content of
earnings for that firm.
21
Panel B tests signed returns, under similar specifications. As shown in Panel B of Table
5, the increase in the information content of earnings is primarily due to more accurate negative
news about firms. The increase in information content of earnings for high absolute exposure
draft return firms is primarily due to increased negative market reactions, as evidenced by
negative coefficients on the interaction term. Column (1) shows a 1% increase in absolute
exposure draft returns leads to a 62 basis point lower return surrounding earnings
announcements. Column (2) shows a 50 basis point effect, while Columns (3)-(5)—with
increasingly restrictive fixed effects—still show roughly 40 basis point lower earnings
announcement returns. As in Panel B, Table 5, these results show that the increase in the
information content of earnings for these firms is due to more negative reactions to earnings, in
line with the notion that standards increase the accuracy of disclosures of negative information.
We also may be interested in the way in which the standard setting process influences
the information content of earnings for firms. Table 7 reports difference-in-differences estimates
of the effects of new accounting standards on absolute market reaction to earnings
announcements in the two years surrounding implementation of the standard. Of note, we can
use at most standard and firm fixed effects due to the cross-section of standards. The
determinants that we investigate are comment letters and the issuance delay or time to
issuance. The number of comment letters is the total number of comment letters received by the
FASB regarding each standard following the exposure draft. The issuance delay is the time
between exposure draft and implementation of the standard. We perform firm level analysis,
clustering standard errors at the event and firm level. In column (1) we use standard fixed
22
effects and show that a 1% increase in comment letters for a particular standard leads to a three
basis point increase in the absolute market reaction to a firm’s earnings announcement. If we
add firm fixed effects, this result remains qualitatively and quantitatively similar in column (2),
at four basis points. These effects show that if firms signal to regulators that the standard is not
desirable—a credible signal due to the lower returns associated with individual firm mentions
(as in Table 4)—this is associated with an increase in information content of earnings. In
column (3), we see that a 1% increase in the time to issuance decreases information content by
54 basis points, while the effect is a 52 basis points reduction in column (4) when we add firm
fixed effects to the standard fixed effects. This similarly shows that if a standard is more
controversial or has high implementation cost, then the information content increases associated
with the standard are lower. We find similar results for standards drafted or processed at busy
times. Busy standard setters appear to produce standards which increase the information
content of earnings.
Panel B examines signed returns. We find that in column (1) and (2), with standard or
standard and firm fixed effects, that a 1% increase in comment letters leads to a two basis point
decrease in returns, meaning that the increase in information content is primarily due to
negative information not being accurately represented. In columns (3) and (4), we investigate
the signed return effects for issuance delay, and find that a 1% increase in time to issuance leads
to a six or eight basis point, respectively, lower return. This result points to the decreased
information content of earnings actually being due to lower returns. The same channel applies
standards written by busy regulators.
23
5.1 Identification
The leading identification concern with our inference that FASB standards increase the
information content of earnings announcements is that unobservable characteristics of FASB
standards may be correlated with the observable characteristics we study. For example,
unobservable macroeconomic or financial characteristics may create uncertainty over the
demand for the information a standard might regulate. Such uncertainty might increase issuance
delays or discord among market participants.
In our tests that investigate the political economy determinants of the information
content of earnings, these are valid concerns. However, alternative explanations must
simultaneously explain why standards with many comment letters and corporate mentions, busy
regulators, as well as large exposure draft announcement returns increase the information
content of earnings announcements and decrease the signed market reaction to earnings
announcements.
Our tests that exploit within firm variation in ex ante standard-sensitivity should further
alleviate concerns that unobservable characteristics of standards could explain our findings. This
is precisely because these tests exploit within standard variation. For the same standard, firms
with greater ex ante sensitivity experience larger increases in the information content of
earnings announcements and decrease the signed market reaction to earnings announcements.
A number of other empirical concerns might revolve around the robustness of our
findings. At a minimum, all of our results are robust to mean or median splits on explanatory
24

variables, and to using an indicator variable to identify firms that make at least one mention of
a given standard. Similarly, although our results on the information content of earnings use two
year event windows, they are quantitatively similar for three, four, and five year event windows.
For the difference-in-differences analyses of market responses to earnings announcements,
it is important to check the assumption of parallel trends. We do so in Figure 10 for firms with
high vs. low mentions of standards and firms with high vs. low market reactions to exposure
drafts, standards with high vs. low numbers of comment letters, those with some vs. no
dissenting votes, and those with long vs. short delays between exposure draft and issuance. In
each case, we find that the sensitivity of returns to earnings announcements changes similarly
over time for both groups in the three years prior to the effective date of the standard, and only
diverge after the standard becomes effective. Indeed, the statistical test of parallel trends is not
rejected for any of these variables at any conventional significance level. This is particularly
striking since market participants are aware of the standard well in advance of the effective
date; however, quarterly earnings themselves are not affected until then.
One might also be concerned about early adoption of standards, since such voluntary
adoption would naturally lead to more ex ante mentions. While early adoption is typically not
allowed, we check whether it is nonetheless affecting our results, by checking for robustness after
dropping mentions in the year prior to the effective date. These mentions could reflect actual
adoption of the standard and so be mechanical rather than an informative disclosure about the
firm’s sensitivity to the standard. Dropping such mentions does not qualitatively change any of
our results. In fact, it is unlikely even in theory that voluntary adoption could explain our
25

results since firms with more ex ante mentions experience lower returns around the issuance of
the standard. Since we would expect that firms would only voluntarily adopt early if they
thought the standard was value-increasing, this effect should attenuate our results.
6 Assessing the standard setting process
The results above reveal that standard setters fairly effective achieve their stated goal of
maintaining a system of accounting which provides decision-relevant information to investors.
While the stated goals of accounting standard setters are well known, we can also use the
outputs of the standard setting process to gain an insight into the actual goals of the members
of FASB by connecting these outcomes with observed votes.
Table 8 presents evidence on the cross-sectional determinants of the number of
dissenting votes at the standard level. In principle, standards with more dissenting votes are
standards that some members of FASB do not like. Column (1) shows that dissenting votes are
less likely when the aggregate market response to the relevant exposure draft was more positive.
Specifically, a one percentage point increase in the market reaction to the exposure draft is
associated with .089 fewer dissenting votes; alternatively, a one standard deviation increase in
the market reaction yields 16% fewer dissenting votes. This suggests that board members are
influenced by the capital market view of the standard.
Close votes are significantly more likely for more controversial standards, as measured
by either the volume of comment letters or mentions of the standard by firms. These findings
26

are confirmed when allowing each of the three factors to affect dissenting votes at the same
time, despite the fact that this requires a much smaller sample of 44 standards, after
conditioning on the availability of firm mentions. Panel B of Table 8 shows that we find similar
results on the determinants of vote margin when using a regression discontinuity design. This
setting focuses particularly on small vote margins (of one or two votes) and includes a linear
control for the actual vote margin. Despite this voting behavior, as shown in Table 7, these
controversial standards still increase the information content of earnings. A higher likelihood of
dissenting votes for standards that increase the information content of earnings, part of the
FASB’s stated goals in setting standards, suggests that members at least consider other
perspectives, perhaps those of firms or auditors, when making voting decisions.
We can also use this framework to assess the mechanics of the standard setting process
by investigating the quality of standards drafted or issued when the board is busy relative to
times when it is not. Several countervailing factors could be at play here. First, busy standard
setters may do a worse job of writing new standards because their attention is split across many
tasks. Alternatively, it could be the case that working on multiple standards could help build
expertise or that multiple standards simultaneously drafted or implemented could interact in
complementary ways. Time-varying demand for standards by market participants could also
lead to higher per-standard benefits if standard setters are time constrained and choose to
prioritize the most needed standards. The results in Table 9 show that the latter effects seem to
dominate. Standards with exposure drafts released during times when many other exposure
drafts were being drafted lead to economically and statistically significantly higher exposure
27
draft returns. Likewise, standards which are issued around the same time as many other
standards are associated with higher market reactions to issuance. We do not find significant
cross effects of drafting on implementation or vice versa – the drafting and
implementation/processing tasks appear to be relatively independent. Overall, these results
suggest that standard setters are not overworked and actually produce better new standards
when they are busy.
7 Conclusion
With a novel and comprehensive data set of FASB standards, we provide novel evidence
on the political economy and economic benefits of disclosure regulation. Disclosure regulation is
value-increasing, on average, but that regulation that is controversial or costly to implement is
less value-increasing and, in some cases, value-decreasing. Our investigation of FASB board
member voting behavior suggests that the regulators place weight on formal and public feedback
by market participants as well as initial signals about the value creation and capital allocation
effects of proposed regulation.
Cross-sectional analysis suggests that firms which are ex ante sensitive to regulation lose
value when the probability of regulation issuance discretely increases. By investigating firm-level
changes in the information content of regulated disclosure, we link the determinants of
regulatory value creation to information dissemination by affected firms. Ex ante sensitive firms
experience the largest increases in the information content of regulated disclosure, and this
28

increase is driven by the dissemination of negative information. Together, these results suggest
that regulation creates value by restricting discretion over the disclosure of negative information
by regulation-sensitive firms and reallocating capital away from these firms.
29

References
Admati, A. R. (1985). A noisy rational expectations equilibrium for multi-asset securities markets. Econometrica, 629-657.
Admati, A. R., & Pfleiderer, P. (2000). Forcing firms to talk: Financial disclosure regulation and externalities. Review of Financial Studies, 13(3), 479-519.
Akerlof, G. A. (1970). The Market for "Lemons": Quality Uncertainty and the Market Mechanism. Quarterly Journal of Economics, 84(3), 488-500.
Angeletos, G.-M., & Pavan, A. (2007). Efficient use of information and social value of information. Econometrica, 75(4), 1103-1142.
Boot, A. W., & Thakor, A. V. (2001). The many faces of information disclosure. Review of Financial Studies, 14(4), 1021-1057.
Chahrour, R. (2014). Public communication and information acquisition. American Economic Journal: Macroeconomics, 6(3), 73-101.
Diamond, D. W. (1985). Optimal release of information by firms. Journal of Finance, 40(4), 1071-1094.
Diamond, D. W., & Verrecchia, R. E. (1991). Disclosure, liquidity, and the cost of capital. Journal of Finance, 46(4), 1325-1359.
Easley, D., & O'hara, M. (2004). Information and the cost of capital. Journal of Finance, 59(4), 1553-1583.
Hellwig, C. (2002). Public information, private information, and the multiplicity of equilibria in coordination games. Journal of Economic Theory, 107(2), 191-222.
Hellwig, C., & Veldkamp, L. (2009). Knowing what others know: Coordination motives in information acquisition. Review of Economic Studies, 76(1), 223-251.
Hellwig, C., Kohls, S., & Veldkamp, L. (2012). Information choice technologies. American Economic Review, 102(3), 35-40.
Hermalin, B. E., & Weisbach, M. S. (1998). Endogenously chosen boards of directors and their monitoring of the CEO. American Economic Review, 96-118.
Hermalin, B. E., & Weisbach, M. S. (2012). Information disclosure and corporate governance. Journal of Finance, 67(1), 195-233.
Iachan, F. S., & Nenov, P. T. (2015). Information quality and crises in regime-change games. Journal of Economic Theory, 158, 739-768.
30
Jensen, M. C., & Meckling, W. H. (1976). Theory of the firm: Managerial behavior, agency costs and ownership structure. Journal of Financial Economics, 3(4), 305-360.
Leland, H. E., & Pyle, D. H. (1977). Informational asymmetries, financial structure, and financial intermediation. Journal of Finance, 32(2), 371-387.
Morris, S., & Shin, H. S. (2002). Social value of public information. American Economic Review, 92(5), 1521-1534.
Myatt, D. P., & Wallace, C. (2012). Endogenous information acquisition in coordination games. Review of Economic Studies, 79(1), 340-374.
Myatt, D. P., & Wallace, C. (2015). Cournot competition and the social value of information. Journal of Economic Theory, 158, 466-506.
Myers, S. C., & Majluf, N. S. (1984). Corporate financing and investment decisions when firms have information that investors do not have. Journal of Financial Economics, 13(2), 187-221.
Song, F., & Thakor, A. V. (2006). Information control, career concerns, and corporate governance. Journal of Finance, 61(4), 1845-1896.
Ui, T., & Yoshizawa, Y. (2015). Characterizing social value of information. Journal of Economic Theory, 158, 507-535.
Verrecchia, R. E. (1982). Information acquisition in a noisy rational expectations economy. Econometrica, 1415-1430.
Yang, M. (2015). Coordination with flexible information acquisition. Journal of Economic Theory, 158, 721-738.
31
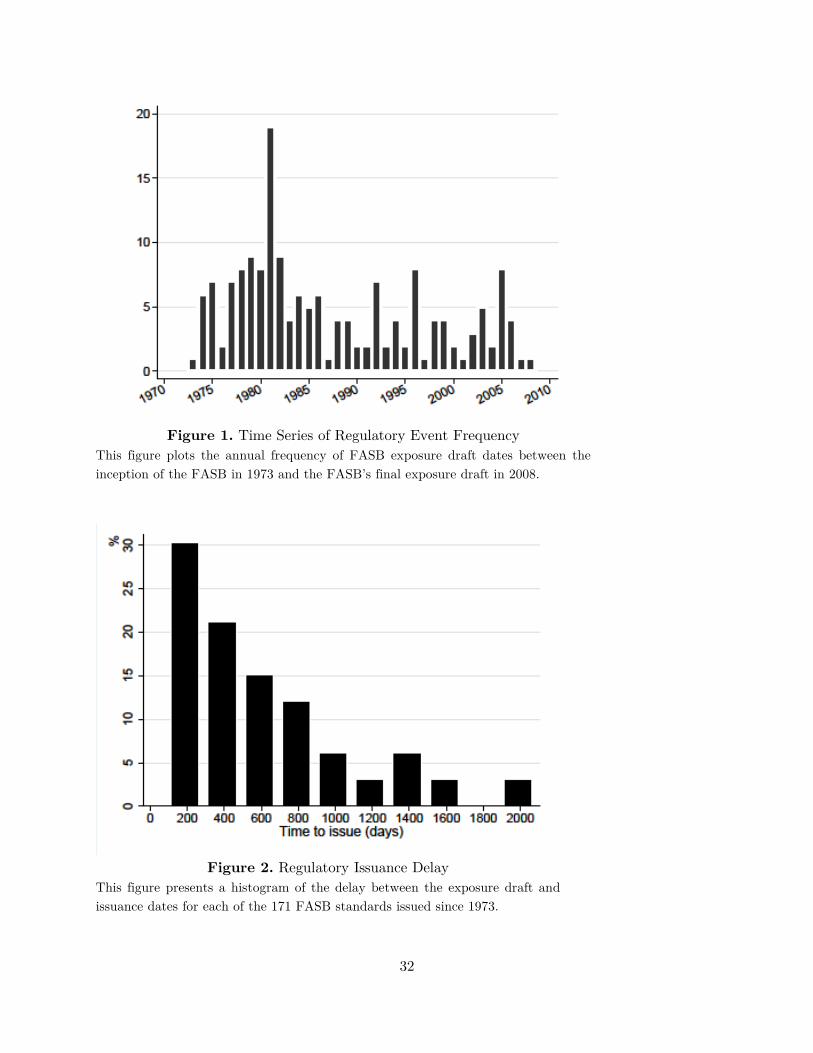
Figure 1. Time Series of Regulatory Event Frequency
This figure plots the annual frequency of FASB exposure draft dates between the inception of the FASB in 1973 and the FASB’s final exposure draft in 2008.
Figure 2. Regulatory Issuance Delay
This figure presents a histogram of the delay between the exposure draft and issuance dates for each of the 171 FASB standards issued since 1973.
32
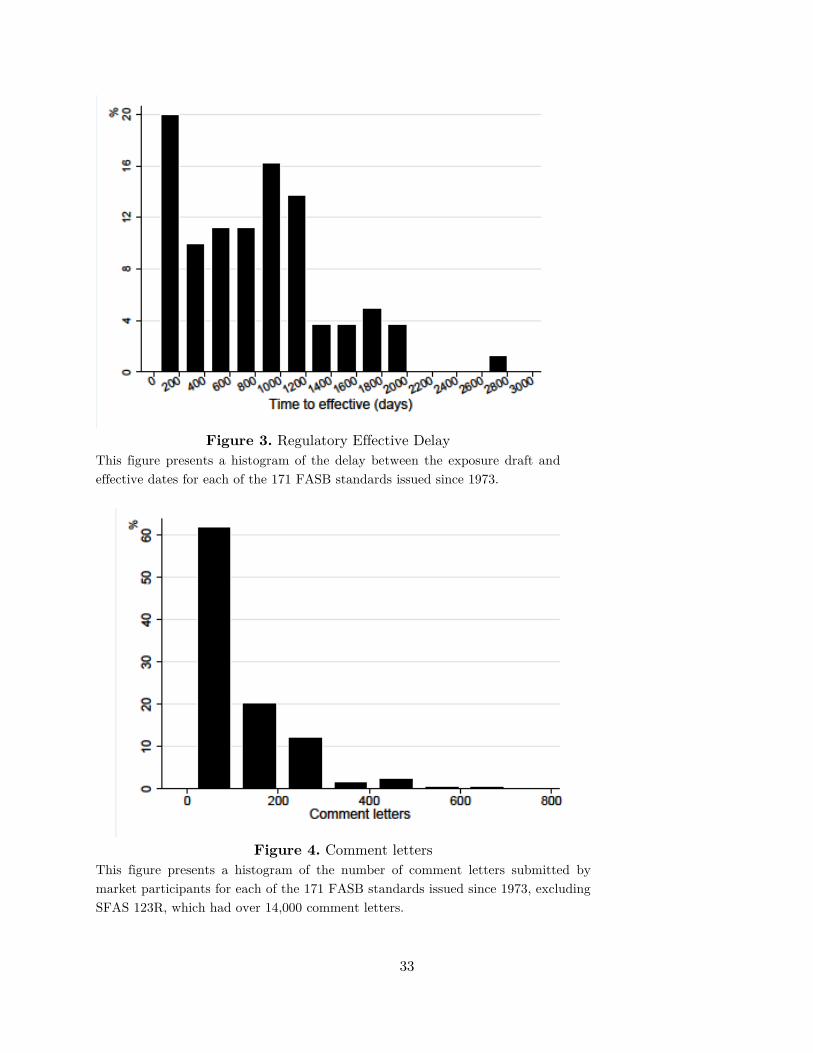
Figure 3. Regulatory Effective Delay
This figure presents a histogram of the delay between the exposure draft and effective dates for each of the 171 FASB standards issued since 1973.
Figure 4. Comment letters
This figure presents a histogram of the number of comment letters submitted by market participants for each of the 171 FASB standards issued since 1973, excluding SFAS 123R, which had over 14,000 comment letters.
33
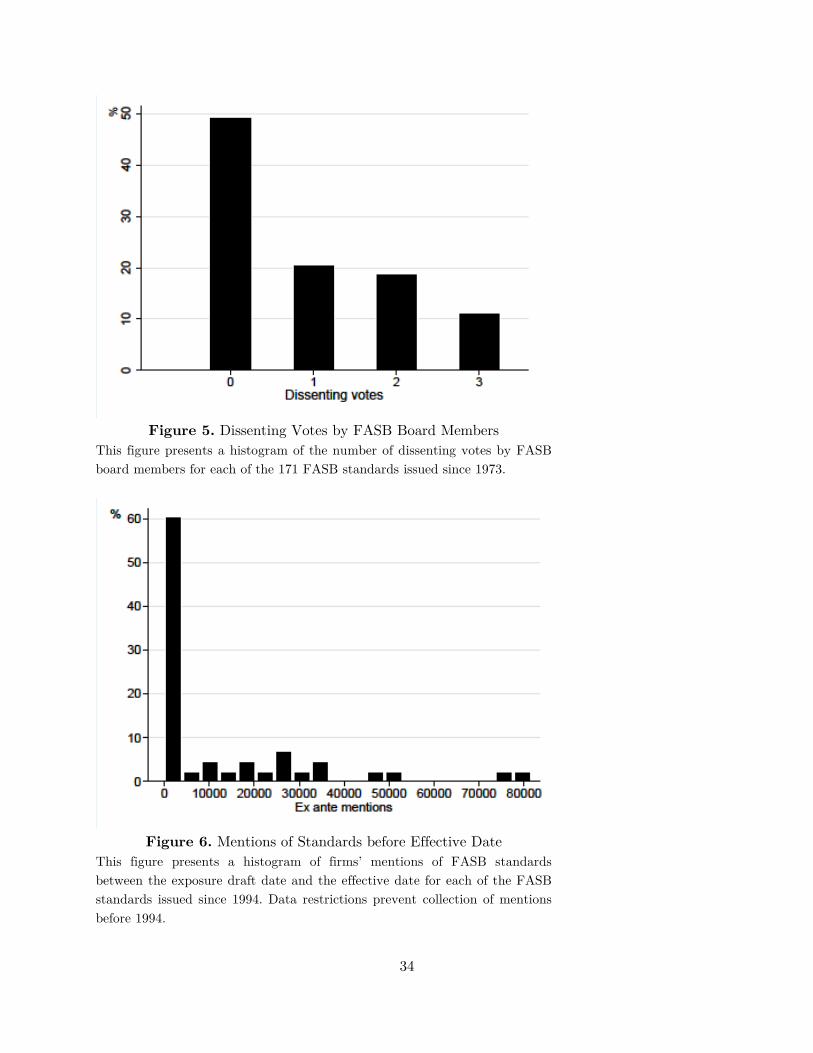
Figure 5. Dissenting Votes by FASB Board Members
This figure presents a histogram of the number of dissenting votes by FASB board members for each of the 171 FASB standards issued since 1973.
Figure 6. Mentions of Standards before Effective Date
This figure presents a histogram of firms’ mentions of FASB standards between the exposure draft date and the effective date for each of the FASB standards issued since 1994. Data restrictions prevent collection of mentions before 1994.
34
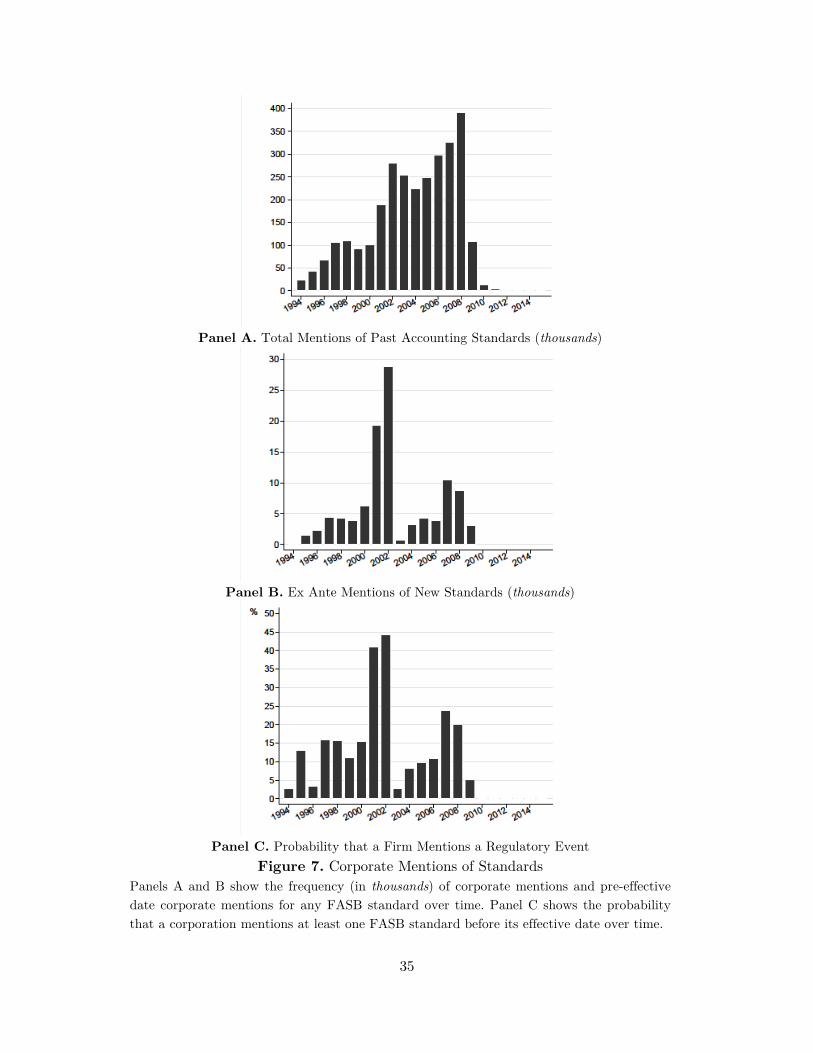
Panel A. Total Mentions of Past Accounting Standards (thousands)
Panel B. Ex Ante Mentions of New Standards (thousands)
Panel C. Probability that a Firm Mentions a Regulatory Event
Figure 7. Corporate Mentions of Standards Panels A and B show the frequency (in thousands) of corporate mentions and pre-effective date corporate mentions for any FASB standard over time. Panel C shows the probability that a corporation mentions at least one FASB standard before its effective date over time.
35
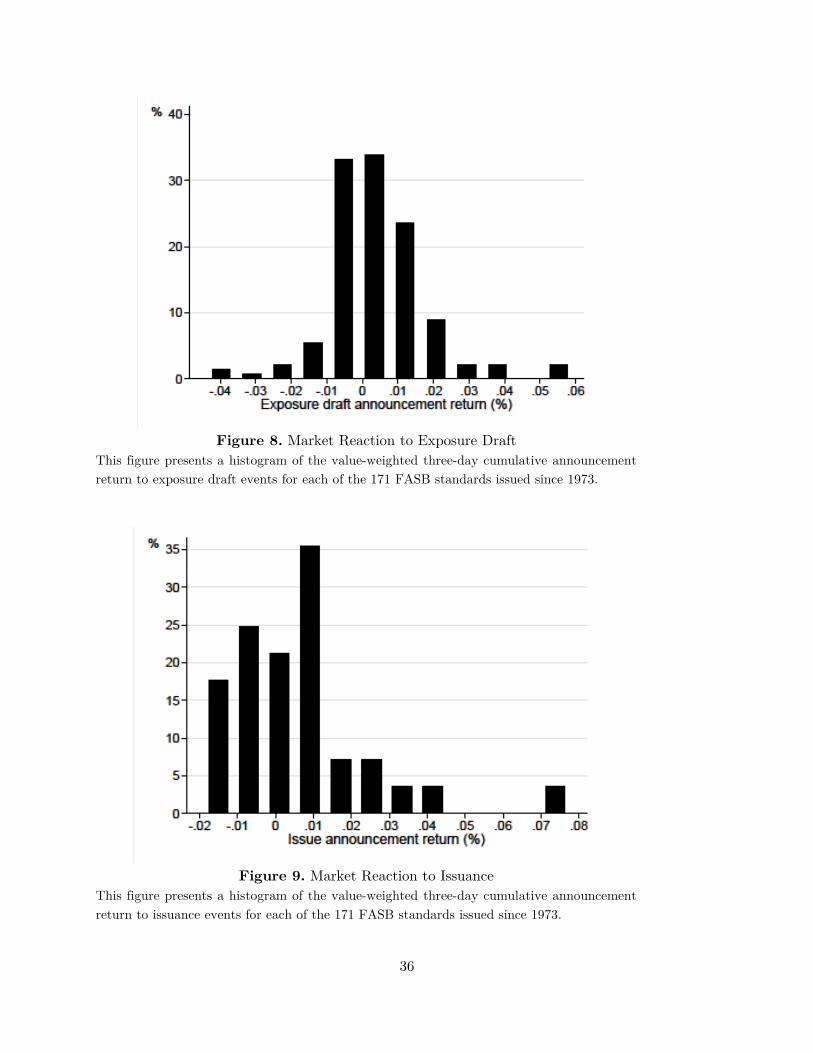
Figure 8. Market Reaction to Exposure Draft
This figure presents a histogram of the value-weighted three-day cumulative announcement return to exposure draft events for each of the 171 FASB standards issued since 1973.
Figure 9. Market Reaction to Issuance
This figure presents a histogram of the value-weighted three-day cumulative announcement return to issuance events for each of the 171 FASB standards issued since 1973.
36
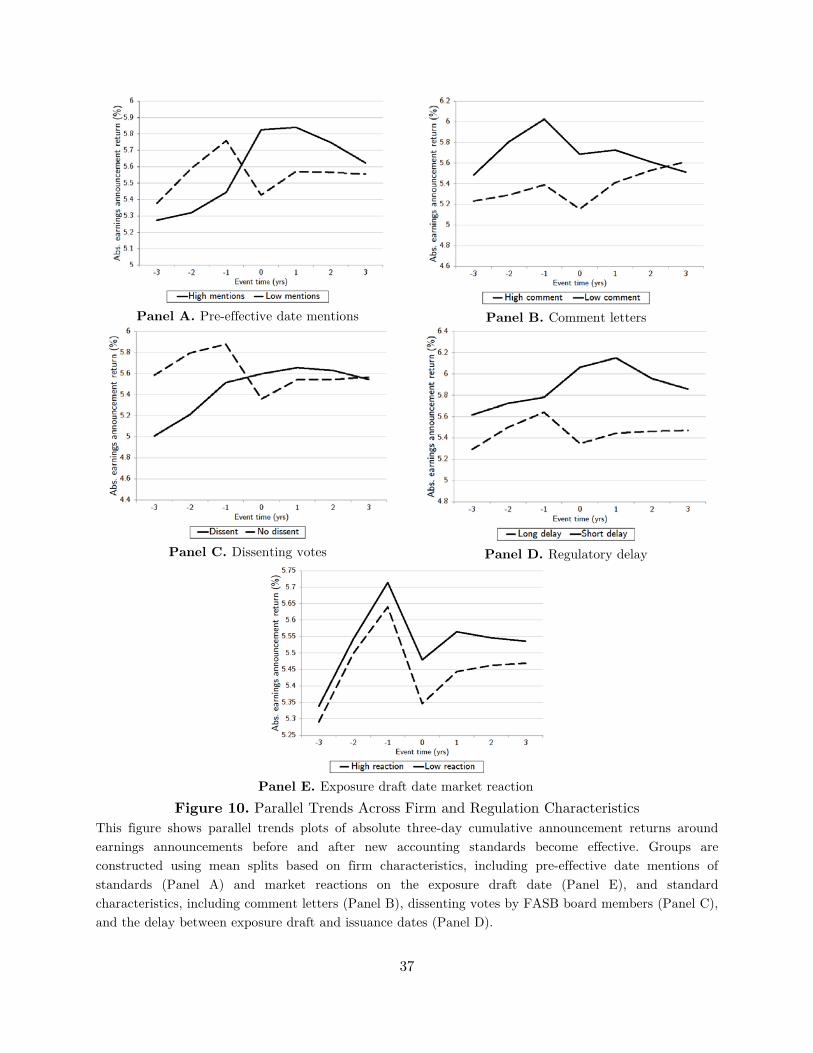
Panel A. Pre-effective date mentions
Panel B. Comment letters
Panel C. Dissenting votes
Panel D. Regulatory delay
Panel E. Exposure draft date market reaction
Figure 10. Parallel Trends Across Firm and Regulation Characteristics This figure shows parallel trends plots of absolute three-day cumulative announcement returns around earnings announcements before and after new accounting standards become effective. Groups are constructed using mean splits based on firm characteristics, including pre-effective date mentions of standards (Panel A) and market reactions on the exposure draft date (Panel E), and standard characteristics, including comment letters (Panel B), dissenting votes by FASB board members (Panel C), and the delay between exposure draft and issuance dates (Panel D).
37
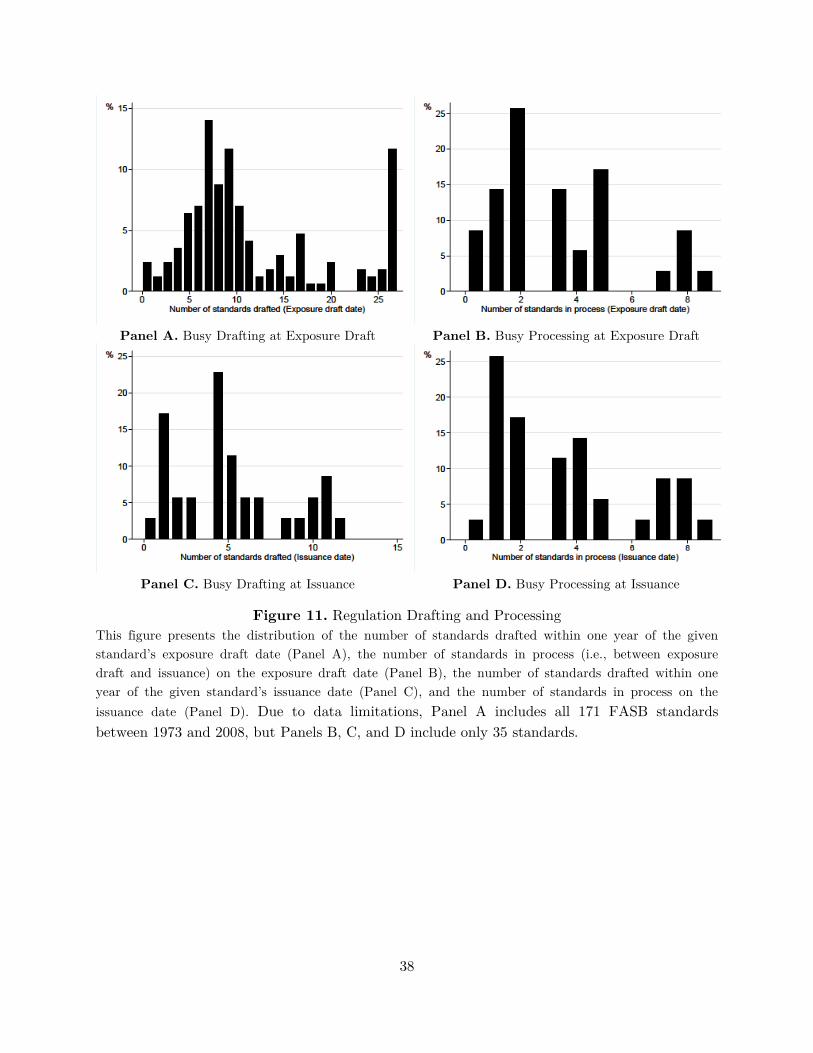
Panel A. Busy Drafting at Exposure Draft Panel B. Busy Processing at Exposure Draft
Panel C. Busy Drafting at Issuance Panel D. Busy Processing at Issuance
Figure 11. Regulation Drafting and Processing This figure presents the distribution of the number of standards drafted within one year of the given standard’s exposure draft date (Panel A), the number of standards in process (i.e., between exposure draft and issuance) on the exposure draft date (Panel B), the number of standards drafted within one year of the given standard’s issuance date (Panel C), and the number of standards in process on the issuance date (Panel D). Due to data limitations, Panel A includes all 171 FASB standards between 1973 and 2008, but Panels B, C, and D include only 35 standards.
38
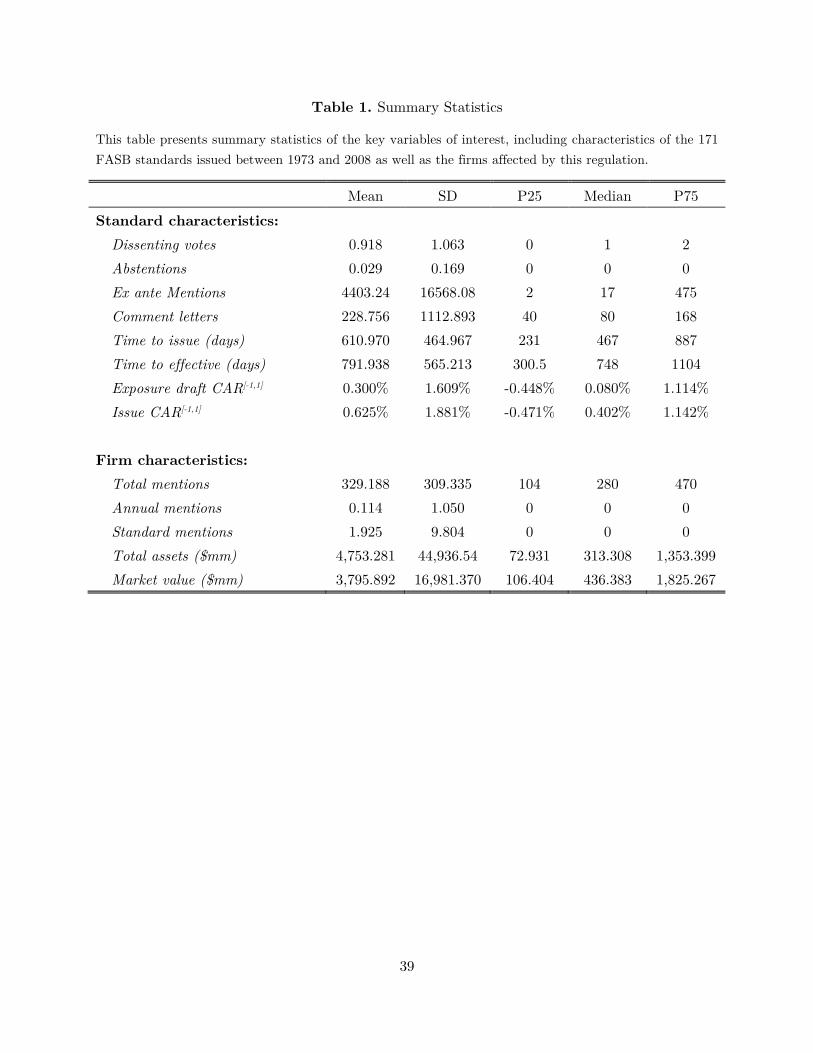
Table 1. Summary Statistics
This table presents summary statistics of the key variables of interest, including characteristics of the 171 FASB standards issued between 1973 and 2008 as well as the firms affected by this regulation.
Mean SD P25 Median P75 Standard characteristics:
Dissenting votes 0.918 1.063 0 1 2 Abstentions 0.029 0.169 0 0 0 Ex ante Mentions 4403.24 16568.08 2 17 475 Comment letters 228.756 1112.893 40 80 168 Time to issue (days) 610.970 464.967 231 467 887 Time to effective (days) 791.938 565.213 300.5 748 1104 Exposure draft CAR[-1,1] 0.300% 1.609% -0.448% 0.080% 1.114% Issue CAR[-1,1] 0.625% 1.881% -0.471% 0.402% 1.142%
Firm characteristics:
Total mentions 329.188 309.335 104 280 470 Annual mentions 0.114 1.050 0 0 0 Standard mentions 1.925 9.804 0 0 0 Total assets ($mm) 4,753.281 44,936.54 72.931 313.308 1,353.399 Market value ($mm) 3,795.892 16,981.370 106.404 436.383 1,825.267
39
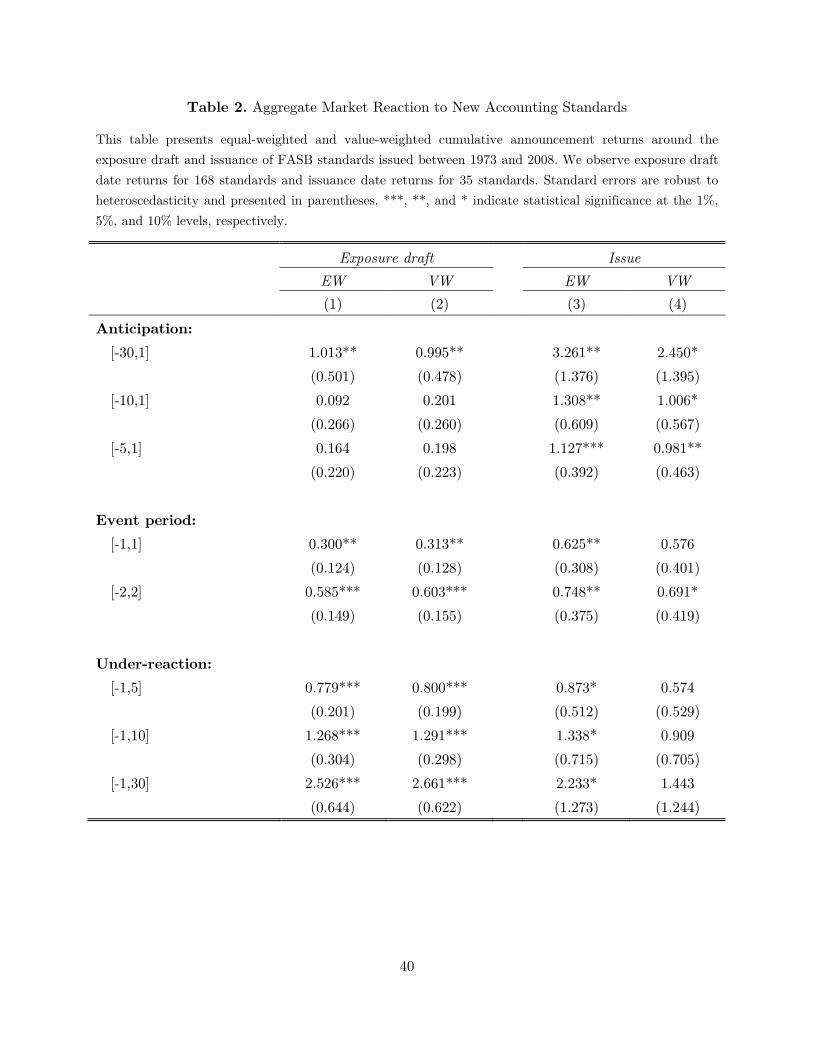
Table 2. Aggregate Market Reaction to New Accounting Standards
This table presents equal-weighted and value-weighted cumulative announcement returns around the exposure draft and issuance of FASB standards issued between 1973 and 2008. We observe exposure draft date returns for 168 standards and issuance date returns for 35 standards. Standard errors are robust to heteroscedasticity and presented in parentheses. ***, **, and * indicate statistical significance at the 1%, 5%, and 10% levels, respectively.
Exposure draft Issue
EW VW
EW VW
(1) (2) (3) (4) Anticipation:
[-30,1] 1.013** 0.995**
3.261** 2.450*
(0.501) (0.478)
(1.376) (1.395)
[-10,1] 0.092 0.201
1.308** 1.006*
(0.266) (0.260)
(0.609) (0.567)
[-5,1] 0.164 0.198
1.127*** 0.981**
(0.220) (0.223)
(0.392) (0.463)
Event period:
[-1,1] 0.300** 0.313**
0.625** 0.576
(0.124) (0.128)
(0.308) (0.401)
[-2,2] 0.585*** 0.603***
0.748** 0.691*
(0.149) (0.155)
(0.375) (0.419)
Under-reaction:
[-1,5] 0.779*** 0.800***
0.873* 0.574
(0.201) (0.199)
(0.512) (0.529)
[-1,10] 1.268*** 1.291***
1.338* 0.909
(0.304) (0.298)
(0.715) (0.705)
[-1,30] 2.526*** 2.661***
2.233* 1.443 (0.644) (0.622) (1.273) (1.244)
40
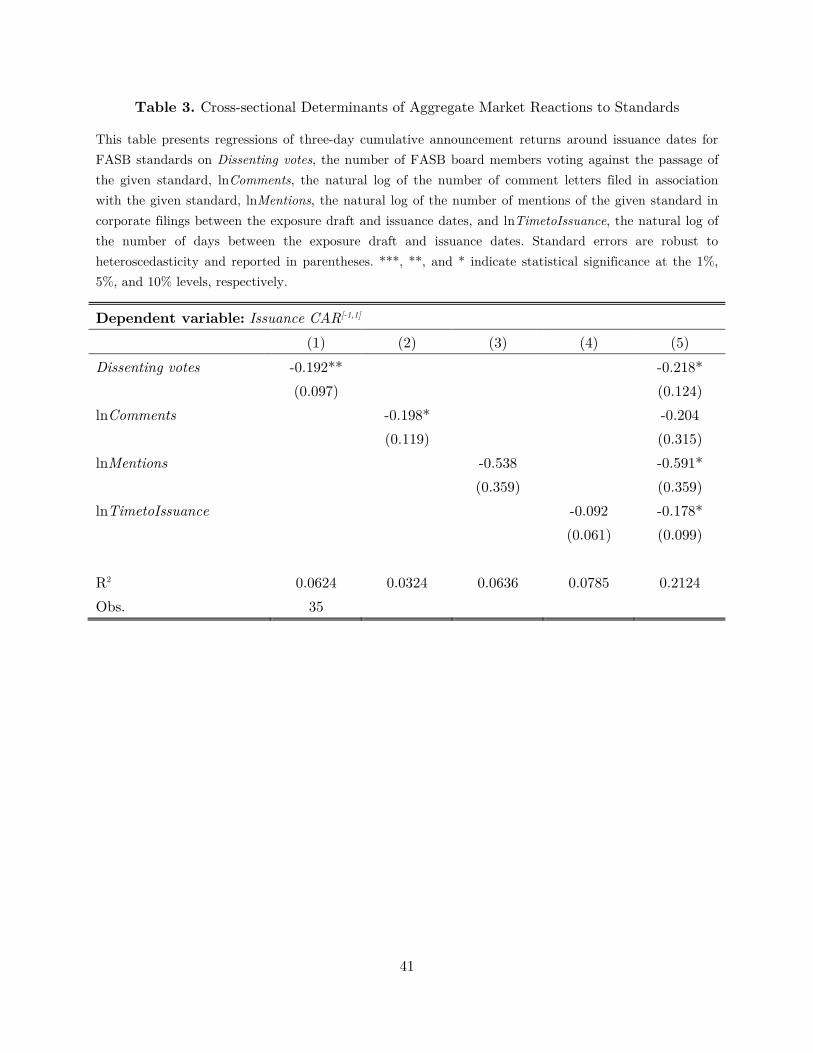
Table 3. Cross-sectional Determinants of Aggregate Market Reactions to Standards
This table presents regressions of three-day cumulative announcement returns around issuance dates for FASB standards on Dissenting votes, the number of FASB board members voting against the passage of the given standard, lnComments, the natural log of the number of comment letters filed in association with the given standard, lnMentions, the natural log of the number of mentions of the given standard in corporate filings between the exposure draft and issuance dates, and lnTimetoIssuance, the natural log of the number of days between the exposure draft and issuance dates. Standard errors are robust to heteroscedasticity and reported in parentheses. ***, **, and * indicate statistical significance at the 1%, 5%, and 10% levels, respectively.
Dependent variable: Issuance CAR[-1,1] (1) (2) (3) (4) (5)
Dissenting votes -0.192**
-0.218*
(0.097)
(0.124)
lnComments
-0.198*
-0.204
(0.119)
(0.315)
lnMentions
-0.538
-0.591*
(0.359)
(0.359)
lnTimetoIssuance
-0.092 -0.178*
(0.061) (0.099)
R2 0.0624 0.0324 0.0636 0.0785 0.2124 Obs. 35
41
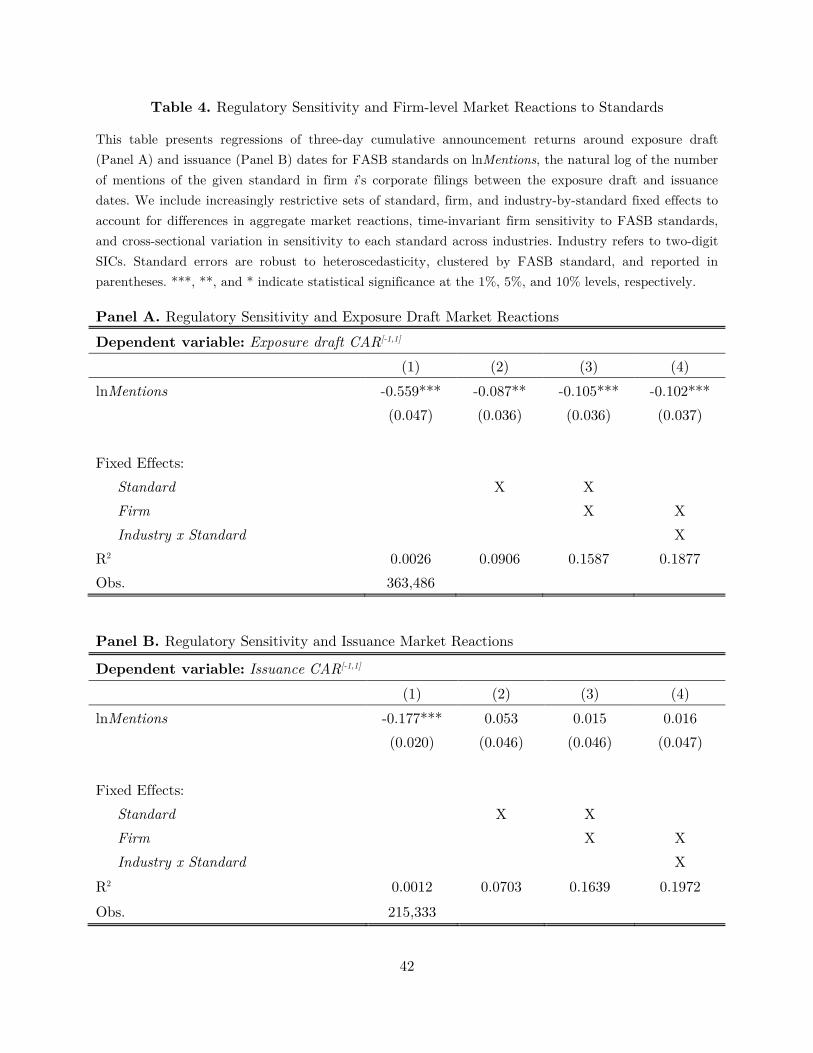
Table 4. Regulatory Sensitivity and Firm-level Market Reactions to Standards
This table presents regressions of three-day cumulative announcement returns around exposure draft (Panel A) and issuance (Panel B) dates for FASB standards on lnMentions, the natural log of the number of mentions of the given standard in firm i’s corporate filings between the exposure draft and issuance dates. We include increasingly restrictive sets of standard, firm, and industry-by-standard fixed effects to account for differences in aggregate market reactions, time-invariant firm sensitivity to FASB standards, and cross-sectional variation in sensitivity to each standard across industries. Industry refers to two-digit SICs. Standard errors are robust to heteroscedasticity, clustered by FASB standard, and reported in parentheses. ***, **, and * indicate statistical significance at the 1%, 5%, and 10% levels, respectively.
Panel A. Regulatory Sensitivity and Exposure Draft Market Reactions
Dependent variable: Exposure draft CAR[-1,1] (1) (2) (3) (4) lnMentions -0.559*** -0.087** -0.105*** -0.102***
(0.047) (0.036) (0.036) (0.037)
Fixed Effects:
__Standard
X X
__Firm
X X
__Industry x Standard
X R2 0.0026 0.0906 0.1587 0.1877 Obs. 363,486
Panel B. Regulatory Sensitivity and Issuance Market Reactions
Dependent variable: Issuance CAR[-1,1] (1) (2) (3) (4) lnMentions -0.177*** 0.053 0.015 0.016
(0.020) (0.046) (0.046) (0.047)
Fixed Effects:
__Standard
X X
__Firm
X X
__Industry x Standard
X R2 0.0012 0.0703 0.1639 0.1972
Obs. 215,333
42
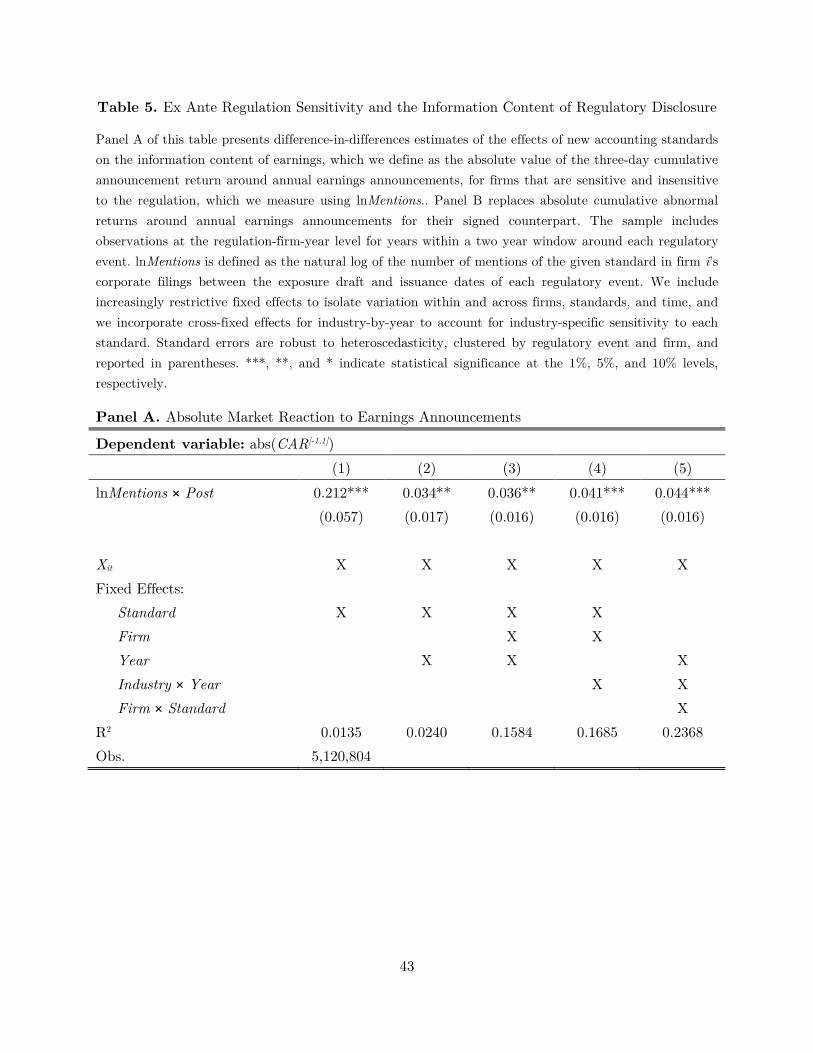
Table 5. Ex Ante Regulation Sensitivity and the Information Content of Regulatory Disclosure
Panel A of this table presents difference-in-differences estimates of the effects of new accounting standards on the information content of earnings, which we define as the absolute value of the three-day cumulative announcement return around annual earnings announcements, for firms that are sensitive and insensitive to the regulation, which we measure using lnMentions.. Panel B replaces absolute cumulative abnormal returns around annual earnings announcements for their signed counterpart. The sample includes observations at the regulation-firm-year level for years within a two year window around each regulatory event. lnMentions is defined as the natural log of the number of mentions of the given standard in firm i’s corporate filings between the exposure draft and issuance dates of each regulatory event. We include increasingly restrictive fixed effects to isolate variation within and across firms, standards, and time, and we incorporate cross-fixed effects for industry-by-year to account for industry-specific sensitivity to each standard. Standard errors are robust to heteroscedasticity, clustered by regulatory event and firm, and reported in parentheses. ***, **, and * indicate statistical significance at the 1%, 5%, and 10% levels, respectively.
Panel A. Absolute Market Reaction to Earnings Announcements
Dependent variable: abs(CAR[-1,1]) (1) (2) (3) (4) (5) lnMentions × Post 0.212*** 0.034** 0.036** 0.041*** 0.044***
(0.057) (0.017) (0.016) (0.016) (0.016)
Xit X X X X X Fixed Effects:
__Standard X X X X
__Firm
X X
__Year
X X
X
__Industry × Year
X X __Firm × Standard
X
R2 0.0135 0.0240 0.1584 0.1685 0.2368 Obs. 5,120,804
43
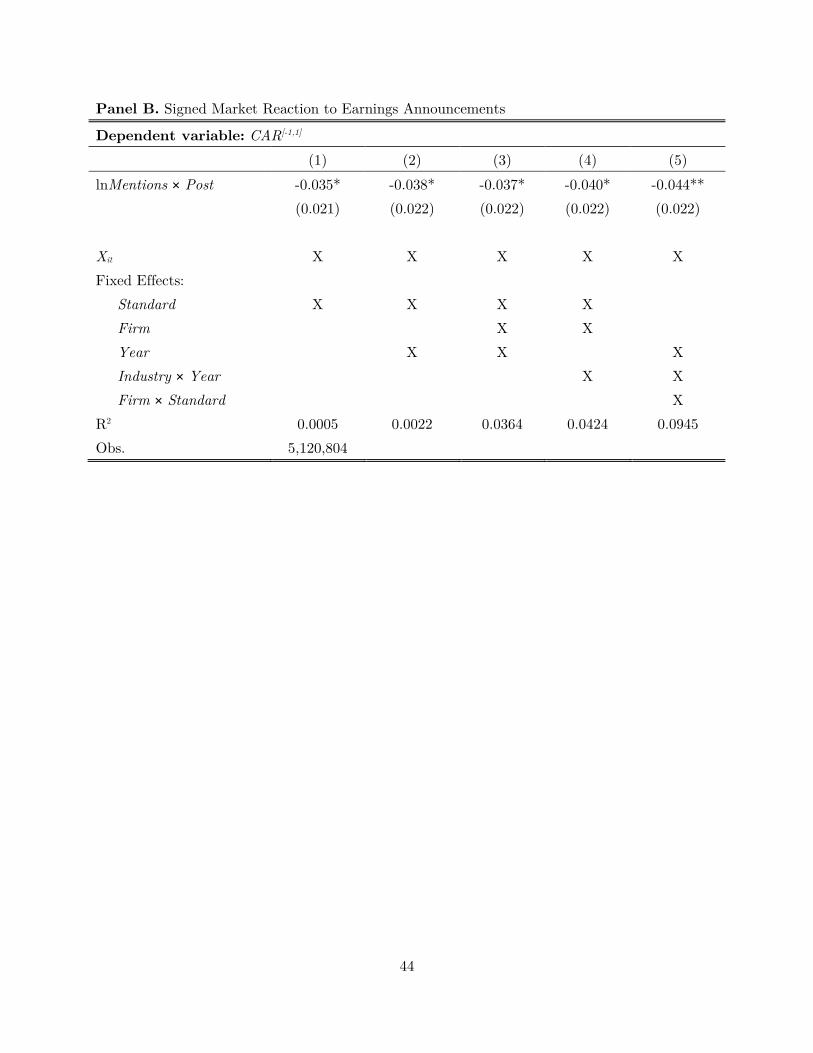
Panel B. Signed Market Reaction to Earnings Announcements
Dependent variable: CAR[-1,1] (1) (2) (3) (4) (5) lnMentions × Post -0.035* -0.038* -0.037* -0.040* -0.044**
(0.021) (0.022) (0.022) (0.022) (0.022)
Xit X X X X X Fixed Effects:
__Standard X X X X
__Firm
X X
__Year
X X
X
__Industry × Year
X X __Firm × Standard
X
R2 0.0005 0.0022 0.0364 0.0424 0.0945 Obs. 5,120,804
44
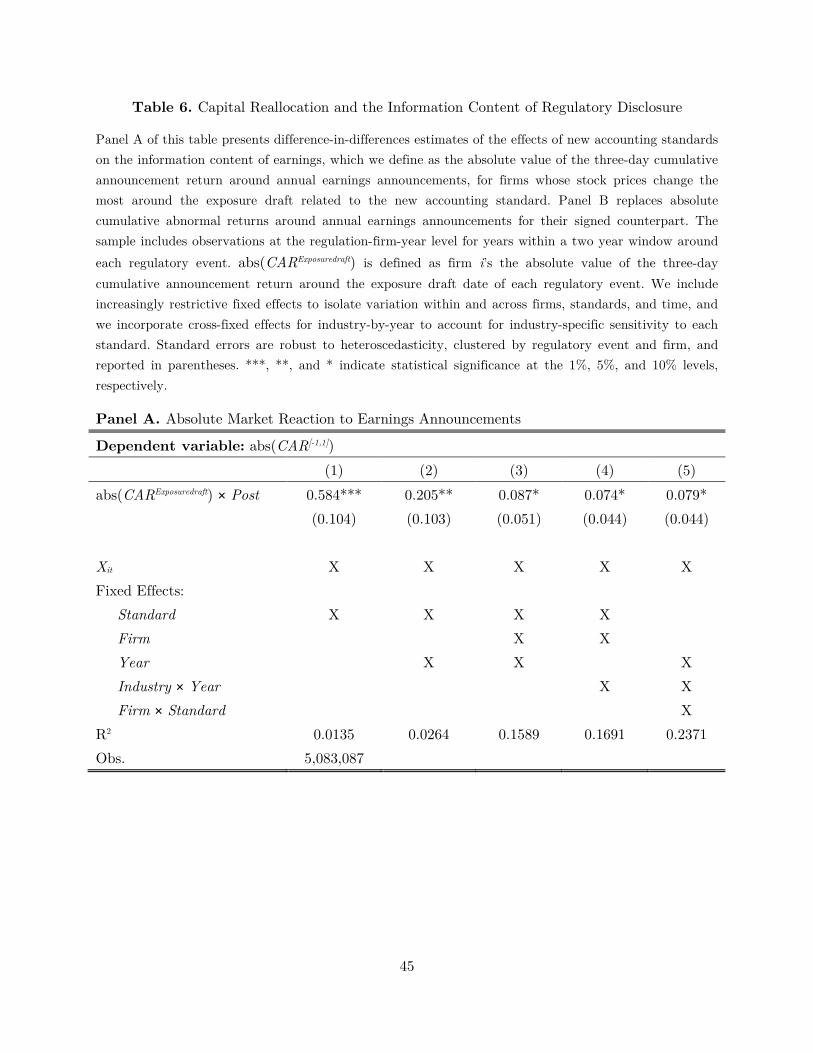
Table 6. Capital Reallocation and the Information Content of Regulatory Disclosure
Panel A of this table presents difference-in-differences estimates of the effects of new accounting standards on the information content of earnings, which we define as the absolute value of the three-day cumulative announcement return around annual earnings announcements, for firms whose stock prices change the most around the exposure draft related to the new accounting standard. Panel B replaces absolute cumulative abnormal returns around annual earnings announcements for their signed counterpart. The sample includes observations at the regulation-firm-year level for years within a two year window around each regulatory event. abs(CARExposuredraft) is defined as firm i’s the absolute value of the three-day cumulative announcement return around the exposure draft date of each regulatory event. We include increasingly restrictive fixed effects to isolate variation within and across firms, standards, and time, and we incorporate cross-fixed effects for industry-by-year to account for industry-specific sensitivity to each standard. Standard errors are robust to heteroscedasticity, clustered by regulatory event and firm, and reported in parentheses. ***, **, and * indicate statistical significance at the 1%, 5%, and 10% levels, respectively.
Panel A. Absolute Market Reaction to Earnings Announcements
Dependent variable: abs(CAR[-1,1]) (1) (2) (3) (4) (5) abs(CARExposuredraft) × Post 0.584*** 0.205** 0.087* 0.074* 0.079*
(0.104) (0.103) (0.051) (0.044) (0.044)
Xit X X X X X Fixed Effects:
__Standard X X X X
__Firm
X X
__Year
X X
X
__Industry × Year
X X __Firm × Standard
X
R2 0.0135 0.0264 0.1589 0.1691 0.2371 Obs. 5,083,087
45
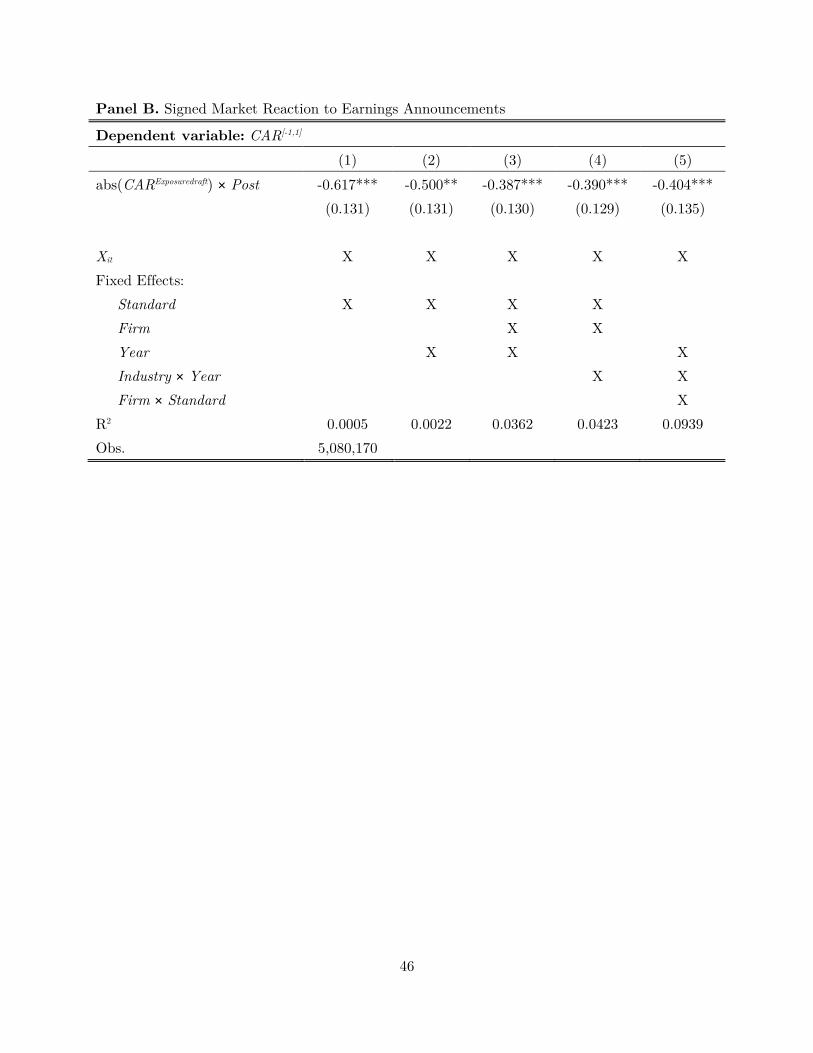
Panel B. Signed Market Reaction to Earnings Announcements
Dependent variable: CAR[-1,1] (1) (2) (3) (4) (5) abs(CARExposuredraft) × Post -0.617*** -0.500** -0.387*** -0.390*** -0.404***
(0.131) (0.131) (0.130) (0.129) (0.135)
Xit X X X X X Fixed Effects:
__Standard X X X X
__Firm
X X
__Year
X X
X
__Industry × Year
X X __Firm × Standard
X
R2 0.0005 0.0022 0.0362 0.0423 0.0939 Obs. 5,080,170
46
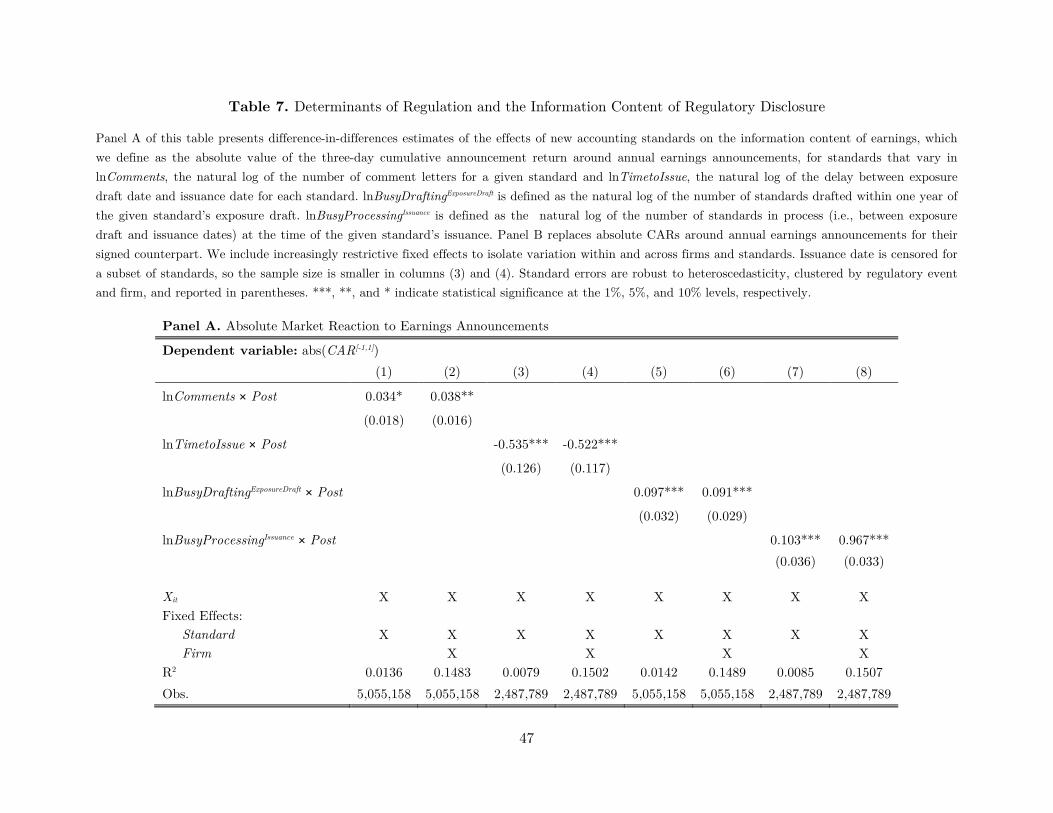
Table 7. Determinants of Regulation and the Information Content of Regulatory Disclosure
Panel A of this table presents difference-in-differences estimates of the effects of new accounting standards on the information content of earnings, which we define as the absolute value of the three-day cumulative announcement return around annual earnings announcements, for standards that vary in lnComments, the natural log of the number of comment letters for a given standard and lnTimetoIssue, the natural log of the delay between exposure draft date and issuance date for each standard. lnBusyDraftingExposureDraft is defined as the natural log of the number of standards drafted within one year of the given standard’s exposure draft. lnBusyProcessingIssuance is defined as the natural log of the number of standards in process (i.e., between exposure draft and issuance dates) at the time of the given standard’s issuance. Panel B replaces absolute CARs around annual earnings announcements for their signed counterpart. We include increasingly restrictive fixed effects to isolate variation within and across firms and standards. Issuance date is censored for a subset of standards, so the sample size is smaller in columns (3) and (4). Standard errors are robust to heteroscedasticity, clustered by regulatory event and firm, and reported in parentheses. ***, **, and * indicate statistical significance at the 1%, 5%, and 10% levels, respectively.
Panel A. Absolute Market Reaction to Earnings Announcements
Dependent variable: abs(CAR[-1,1]) (1) (2) (3) (4) (5) (6) (7) (8)
lnComments × Post 0.034* 0.038**
(0.018) (0.016)
lnTimetoIssue × Post
-0.535*** -0.522***
(0.126) (0.117)
lnBusyDraftingExposureDraft × Post
0.097*** 0.091***
(0.032) (0.029)
lnBusyProcessingIssuance × Post
0.103*** 0.967***
(0.036) (0.033)
Xit X X X X X X X X Fixed Effects:
__Standard X X X X X X X X __Firm
X
X
X
X
R2 0.0136 0.1483 0.0079 0.1502 0.0142 0.1489 0.0085 0.1507 Obs. 5,055,158 5,055,158 2,487,789 2,487,789 5,055,158 5,055,158 2,487,789 2,487,789
47
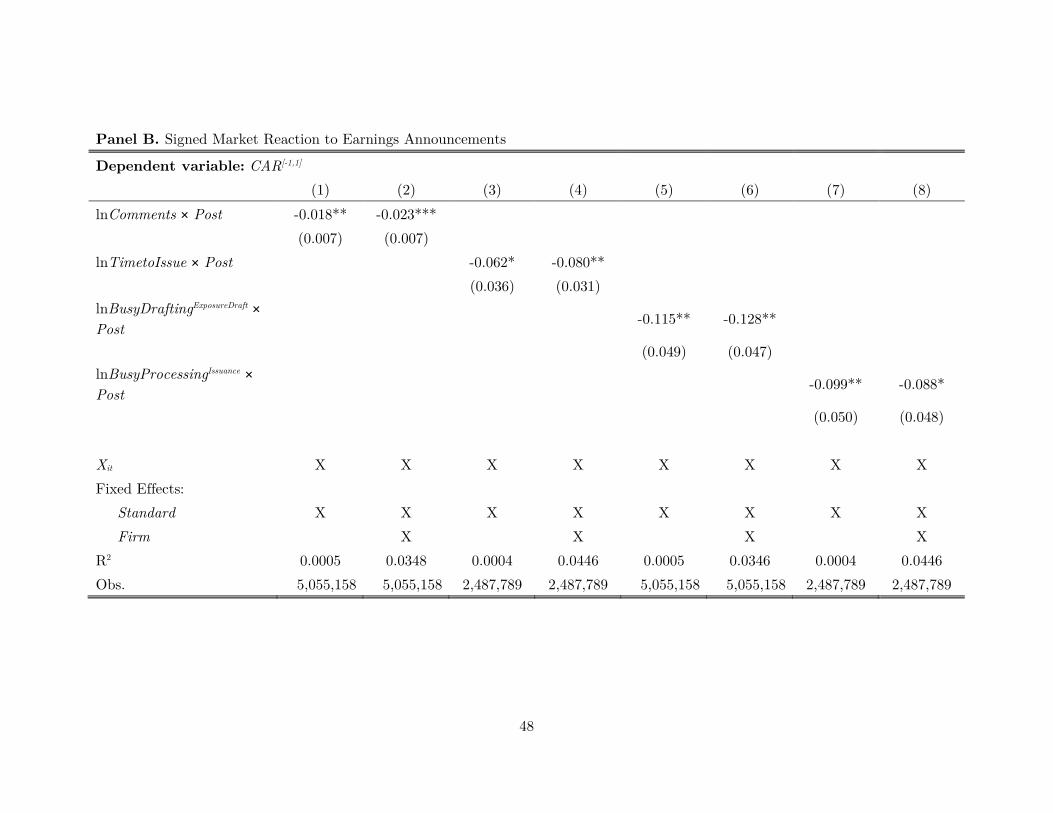
Panel B. Signed Market Reaction to Earnings Announcements
Dependent variable: CAR[-1,1] (1) (2) (3) (4) (5) (6) (7) (8) lnComments × Post -0.018** -0.023***
(0.007) (0.007)
lnTimetoIssue × Post
-0.062* -0.080**
(0.036) (0.031)
lnBusyDraftingExposureDraft × Post
-0.115** -0.128**
(0.049) (0.047)
lnBusyProcessingIssuance × Post
-0.099** -0.088*
(0.050) (0.048)
Xit X X X X X X X X Fixed Effects:
__Standard X X X X X X X X __Firm
X
X
X
X
R2 0.0005 0.0348 0.0004 0.0446 0.0005 0.0346 0.0004 0.0446 Obs. 5,055,158 5,055,158 2,487,789 2,487,789 5,055,158 5,055,158 2,487,789 2,487,789
48
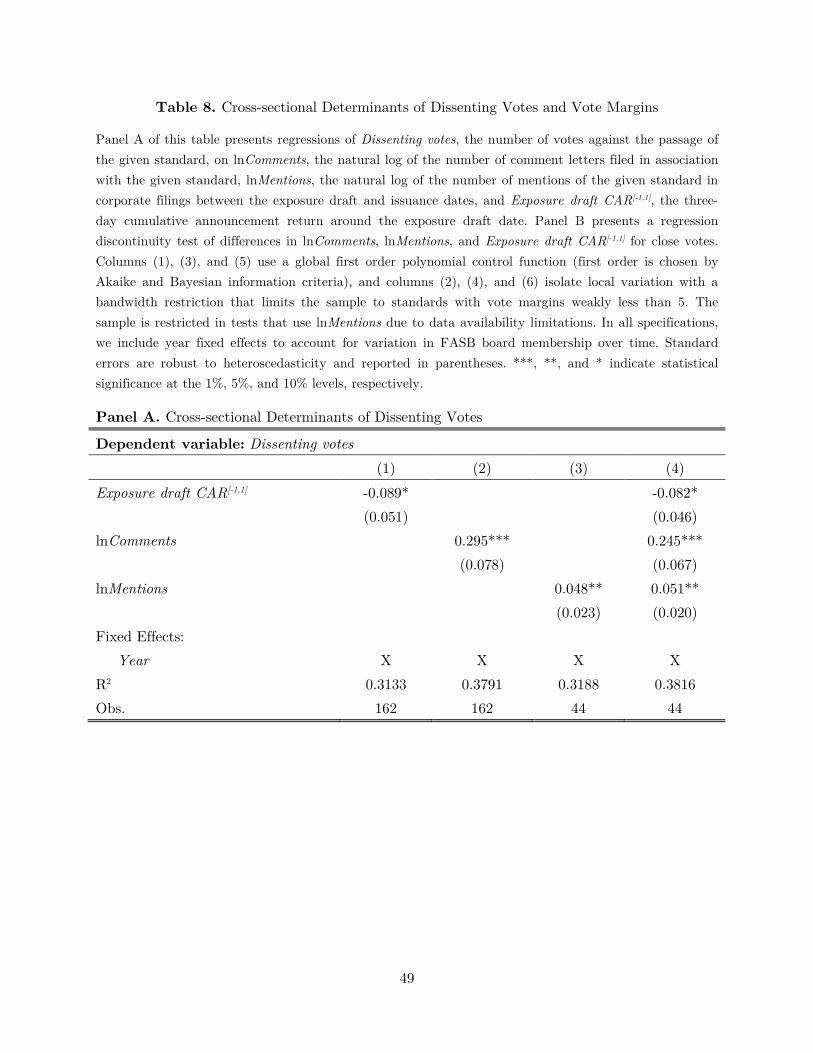
Table 8. Cross-sectional Determinants of Dissenting Votes and Vote Margins
Panel A of this table presents regressions of Dissenting votes, the number of votes against the passage of the given standard, on lnComments, the natural log of the number of comment letters filed in association with the given standard, lnMentions, the natural log of the number of mentions of the given standard in corporate filings between the exposure draft and issuance dates, and Exposure draft CAR[-1,1], the three-day cumulative announcement return around the exposure draft date. Panel B presents a regression discontinuity test of differences in lnComments, lnMentions, and Exposure draft CAR[-1,1] for close votes. Columns (1), (3), and (5) use a global first order polynomial control function (first order is chosen by Akaike and Bayesian information criteria), and columns (2), (4), and (6) isolate local variation with a bandwidth restriction that limits the sample to standards with vote margins weakly less than 5. The sample is restricted in tests that use lnMentions due to data availability limitations. In all specifications, we include year fixed effects to account for variation in FASB board membership over time. Standard errors are robust to heteroscedasticity and reported in parentheses. ***, **, and * indicate statistical significance at the 1%, 5%, and 10% levels, respectively.
Panel A. Cross-sectional Determinants of Dissenting Votes
Dependent variable: Dissenting votes (1) (2) (3) (4) Exposure draft CAR[-1,1] -0.089*
-0.082*
(0.051)
(0.046)
lnComments
0.295***
0.245***
(0.078)
(0.067)
lnMentions
0.048** 0.051**
(0.023) (0.020)
Fixed Effects:
__Year X X X X R2 0.3133 0.3791 0.3188 0.3816 Obs. 162 162 44 44
49
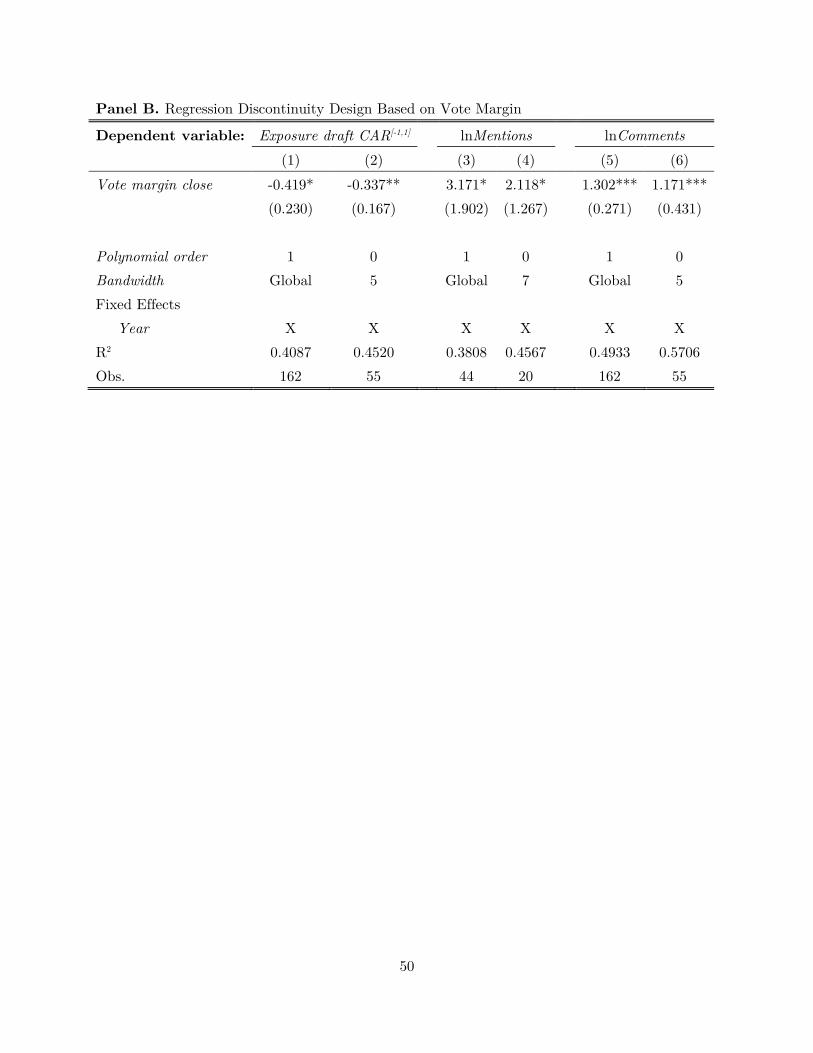
Panel B. Regression Discontinuity Design Based on Vote Margin
Dependent variable: Exposure draft CAR[-1,1] lnMentions lnComments (1) (2) (3) (4) (5) (6) Vote margin close -0.419* -0.337**
3.171* 2.118*
1.302*** 1.171***
(0.230) (0.167)
(1.902) (1.267)
(0.271) (0.431)
Polynomial order 1 0
1 0
1 0
Bandwidth Global 5
Global 7
Global 5 Fixed Effects
__Year X X
X X
X X
R2 0.4087 0.4520
0.3808 0.4567
0.4933 0.5706 Obs. 162 55 44 20 162 55
50
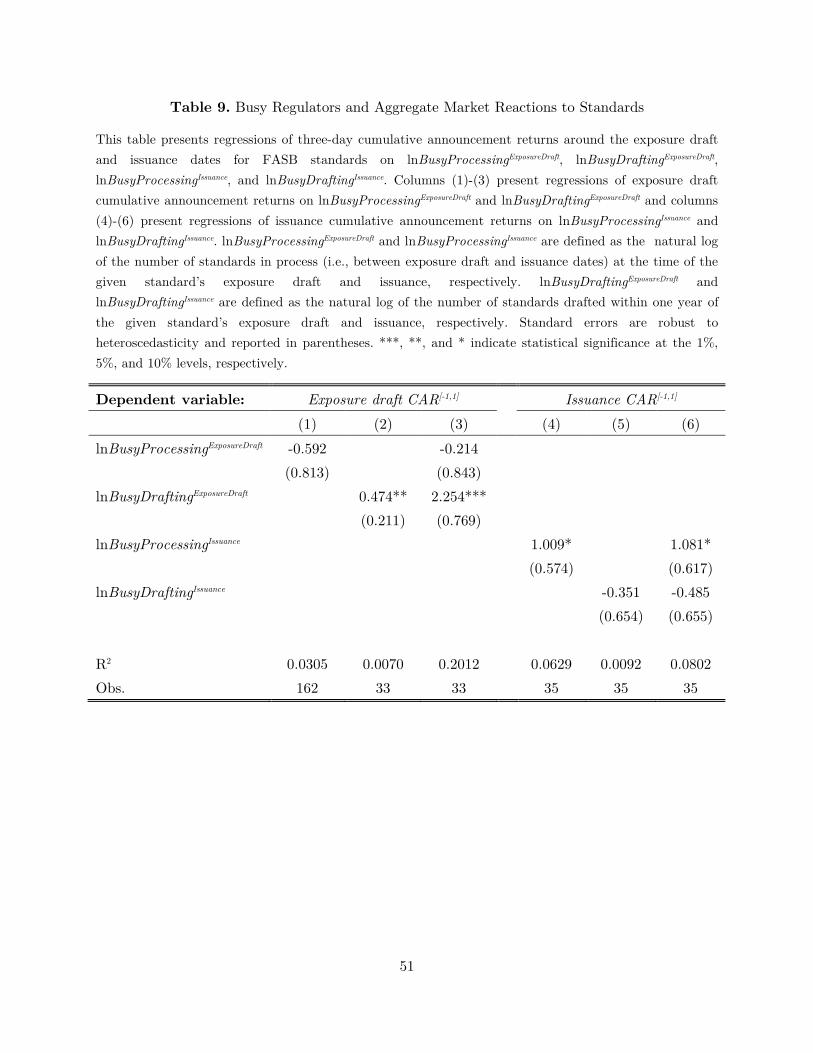
Table 9. Busy Regulators and Aggregate Market Reactions to Standards
This table presents regressions of three-day cumulative announcement returns around the exposure draft and issuance dates for FASB standards on lnBusyProcessingExposureDraft, lnBusyDraftingExposureDraft, lnBusyProcessingIssuance, and lnBusyDraftingIssuance. Columns (1)-(3) present regressions of exposure draft cumulative announcement returns on lnBusyProcessingExposureDraft and lnBusyDraftingExposureDraft and columns (4)-(6) present regressions of issuance cumulative announcement returns on lnBusyProcessingIssuance and lnBusyDraftingIssuance. lnBusyProcessingExposureDraft and lnBusyProcessingIssuance are defined as the natural log of the number of standards in process (i.e., between exposure draft and issuance dates) at the time of the given standard’s exposure draft and issuance, respectively. lnBusyDraftingExposureDraft and lnBusyDraftingIssuance are defined as the natural log of the number of standards drafted within one year of the given standard’s exposure draft and issuance, respectively. Standard errors are robust to heteroscedasticity and reported in parentheses. ***, **, and * indicate statistical significance at the 1%, 5%, and 10% levels, respectively.
Dependent variable: Exposure draft CAR[-1,1] Issuance CAR[-1,1] (1) (2) (3) (4) (5) (6)
lnBusyProcessingExposureDraft -0.592
-0.214
(0.813)
(0.843)
lnBusyDraftingExposureDraft
0.474** 2.254***
(0.211) (0.769)
lnBusyProcessingIssuance
1.009*
1.081*
(0.574)
(0.617)
lnBusyDraftingIssuance
-0.351 -0.485
(0.654) (0.655)
R2 0.0305 0.0070 0.2012
0.0629 0.0092 0.0802
Obs. 162 33 33 35 35 35
51