Embed Size (px)
Citation preview

Staff Recommendation:
Approve the Staff Draft Aspen Hill Minor Master Plan Amendment as the Public Hearing Draft Aspen Hill Minor Master Plan Amendment, and set the public hearing date for September 11, 2014.
Summary
On July 10, 2014, the Planning staff will present the Staff Draft Minor Master Plan Amendment. The proposed Staff Draft is a comprehensive minor amendment of the approved and adopted 1994 Aspen Hill Master Plan. The Planning Board approved the Scope of Work for the Aspen Hill Minor Master Plan Amendment on January 23, 2014. Between December 2013 and May 2014, Staff held three community meetings, and briefed the Planning Board on the project status, key issues, and preliminary recommendations on April 24 and June 5, 2014. The remaining milestones in the Aspen Hill Minor Master Plan Amendment process are as follows:
September 11, 2014: Planning Board public hearing
September-October 2014: Planning Board worksessions and approval of the Planning Board
Draft Minor Amendment Plan
November 2014: Planning Board transmits Planning Board Draft to the County
Executive and the County Council
January 2015 (tentative) County Council public hearing
February-March 2015: Council worksessions and approval
April-May 2015: Commission adoption, Sectional Map Amendment
Attachment
MONTGOMERY COUNTY PLANNING DEPARTMENT
THE MARYLAND-NATIONAL CAPITAL PARK AND PLANNING COMMISSION
MCPB Item No. Date: 07-10-14
Aspen Hill Minor Master Plan Amendment Staff Draft Presentation
Andrea Gilles, Senior Planner, Area 2 Division, [email protected], 301.495.4541
Nancy Sturgeon, Master Planner Supervisor, Master Plan Team, Area 2 Division, [email protected], 301.495.1308 Glenn Kreger, Chief, Area 2 Division, [email protected], 301.495.4653
Completed: 07-03-14

July 2014
Aspen Hill Minor Master Plan Amendment
LA
85
PA
RK
WA
Y
FRAN
KFO
RT
DRIVE
STREETPATH
BR
AN
CH
STREET
DRIV
E
ATH
AN
IA
ND
GREEN
GRENOBLE
DR
IVE
VA
ND
ALI
A LANE
WENDY
NEPSA
ROADHILL
GEO
RGIA
AVEN
UE
MD
97
AV
ENU
E
MD
1
CO
NN
EC
TIC
UT
STAFF DRAFT
An Amendment to the Aspen Hill Master Plan,1994, as amended; being also an amendment to the General Plan (On Wedges and Corridors) for the Physical Development of the Maryland-Washington Regional District in Montgomery and Prince George’s Counties.
Montgomery County Planning DepartmentM-NCPPCMontgomeryPlanning.org

2
ABSTRACT
An area master plan, after approval by the District Council and adoption by The Maryland-National Capital Park and Planning Commission, constitutes an amendment to The General Plan (On Wedges and Corridors) for Montgomery County. Each area master plan reflects a vision of future development that responds to the unique character of the local community within the context of a County-wide perspective. Area master plans are intended to convey land use policy for defined geographic areas and should be interpreted together with relevant County-wide functional master plans.
This Minor Master Plan Amendment contains text and supporting maps for a minor amendment to the 1994 Aspen Hill Master Plan. This Plan makes recommendations for land use, zoning, design, transportation, and environment. The minor amendment process provides an opportunity to reassess the Subject area and analyze alternative land use redevelopment, design, and zoning opportunities. The review considers existing development and reevaluates the area’s potential within the context of a changing market in the region, the intent and rationale of the 1994 Aspen Hill Master Plan, community input, and impacts to the surrounding land uses and transportation network.
Master and sector plans convey land use policy for defined geographic areas and should be interpreted together with relevant County-wide functional plans and County laws and regulations. Plan recommendations provide comprehensive guidelines for the use of public and private land and should be referred to by public officials and private individuals when making land use decisions. Public and private land use decisions that promote plan goals are essential to fulfilling a plan’s vision.
Master and sector plans look ahead 20 years from the date of adoption, although they are intended to be revised every 10 to 15 years. Moreover, circumstances when a plan is adopted will change and the specifics of a plan may become less relevant over time. Plans do not specify all development possibilities. Their sketches are for illustrative purposes only, intended to convey a sense of desirable future character rather than a recommendation for a particular design.
Master plans do not specify all development possibilities for a particular property or area. In order to understand the full range of development options, the reader should be aware of additional land uses and development potential available through permitted conditional uses; variances; transferrable development rights (TDRs); Moderately Priced Dwelling Units (MPDUs); rezoning by local map amendments; public projects and the mandatory referral process; and municipal annexations.
SOURCE OF COPIES The Maryland-National Capital Park and Planning Commission 8787 Georgia Avenue Silver Spring, MD 20910-3760 Online at: http://www.montgomeryplanning.org/community/aspenhill/
THE MARYLAND-NATIONAL CAPITAL PARK AND PLANNING COMMISSION The Maryland-National Capital Park and Planning Commission is a bi-county agency created by the General Assembly of Maryland in 1927. The Commission’s geographic authority extends to the great majority of Montgomery and Prince George’s Counties; the Maryland-Washington Regional District (M-NCPPC planning jurisdiction) comprises 1,001 square miles, while the Metropolitan District (parks) comprises 919 square miles, in the two counties.
The Commission is charged with preparing, adopting, and amending or extending The General Plan (On Wedges and Corridors) for the Physical Development of the Maryland-Washington Regional District in Montgomery and Prince George’s Counties.
The Commission operates in each county through Planning Boards appointed by the county government. The Boards are responsible for all local plans, zoning amendments, subdivision regulations, and administration of parks.

3
CERTIFICATION OF APPROVAL AND ADOPTION

4
CONTENTS
Introduction ..................................................................................................................................................................... 5
Analysis .......................................................................................................................................................................... 12
Land Use and Zoning Recommendations ...................................................................................................................... 15
Design Criteria ................................................................................................................................................................ 17
Transportation ............................................................................................................................................................... 21
Environment .................................................................................................................................................................. 27
Implementation ............................................................................................................................................................. 28
Maps
1. Minor Amendment Area .......................................................................................................................................... 5
2. Existing Land Use ..................................................................................................................................................... 6
3. Vicinity Map ............................................................................................................................................................. 8
4. Demographic Study Area - Greater Aspen Hill Neighborhood ............................................................................... 9
5. Minor Amendment Area and Surrounding Land Uses ........................................................................................... 11
6. Existing Zoning ....................................................................................................................................................... 13
7. Conversion Zoning ................................................................................................................................................. 13
8. Proposed Zoning .................................................................................................................................................... 14
9. Area Transit Service ............................................................................................................................................... 22
Tables
1. Aspen Hill and Montgomery County Demographic Comparison Profile ............................................................... 10
2. Comparison of Vehicle Trip Generation................................................................................................................. 23
3. Comparison of Trip Generation Sources for Retail Uses ....................................................................................... 23
4. Critical Lane Volume (CLV) Comparison ................................................................................................................ 24
Figures
1. Design Criteria ........................................................................................................................................................ 18
2. Georgia Avenue Study/Urban Design Framework ................................................................................................. 20
Appendix
A. Demographic Profile
B. Market Analysis
5
INTRODUCTION
Purpose
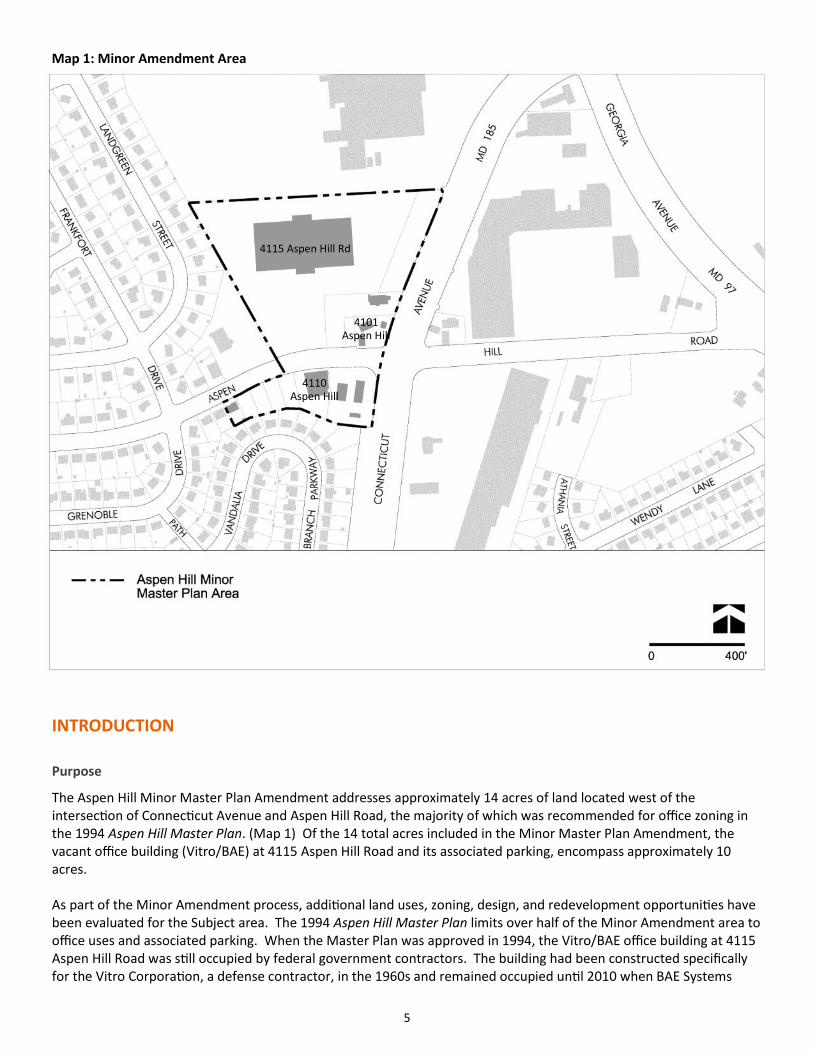
The Aspen Hill Minor Master Plan Amendment addresses approximately 14 acres of land located west of the intersection of Connecticut Avenue and Aspen Hill Road, the majority of which was recommended for office zoning in the 1994 Aspen Hill Master Plan. (Map 1) Of the 14 total acres included in the Minor Master Plan Amendment, the vacant office building (Vitro/BAE) at 4115 Aspen Hill Road and its associated parking, encompass approximately 10 acres. As part of the Minor Amendment process, additional land uses, zoning, design, and redevelopment opportunities have been evaluated for the Subject area. The 1994 Aspen Hill Master Plan limits over half of the Minor Amendment area to office uses and associated parking. When the Master Plan was approved in 1994, the Vitro/BAE office building at 4115 Aspen Hill Road was still occupied by federal government contractors. The building had been constructed specifically for the Vitro Corporation, a defense contractor, in the 1960s and remained occupied until 2010 when BAE Systems
Map 1: Minor Amendment Area
4110 Aspen Hill
4101 Aspen Hill
4115 Aspen Hill Rd

6
relocated to Rockville, MD. Since 2010, the approximately 265,000 square foot office building and surrounding parking have remained vacant and underutilized. In addition to the empty and deteriorating office property, the Minor Amendment area faces challenges to vehicular congestion at surrounding intersections; efficient vehicular, pedestrian, and bicycle circulation; and pedestrian safety.
Vision
The Aspen Hill Minor Master Plan Amendment area is adjacent to greater Aspen Hill’s largest suburban shopping areas, with access via two major highways (MD 185 and MD 97), and a potential future Bus Rapid Transit (BRT) station and line along Georgia Avenue. Although mature, the commercial area remains under-developed, but with potential to yield a greater mix of uses over time, for the benefit of surrounding communities. As redevelopment occurs, the area will apply strong urban design principles, as well as sustainable and low impact development to improve neighborhood connectivity, create new community open space and, by promoting distinctive architecture, define a stronger local identity. Context sensitive transitions in the scale of new development will be provided to the adjacent single-family residential neighborhoods. Safe, attractive, and well-connected pedestrian and bicycle linkages to and between neighborhoods, services, and amenities will strengthen the walkability and desirability of the area.
Map 2: Existing Land Use

7
Outreach
Outreach efforts included a combination of community meetings, small group and individual meetings, and online and social media platforms to engage the public in the development of the Staff Draft recommendations. Planners met with individual property owners, business owners, and community residents throughout the process. Spanish translation services, both oral and written, were available if needed. A project website (www.montgomeryplanning.org/community/aspenhill) was created with applicable meeting presentations and materials, and an opportunity to leave comments. The Planning Department’s main webpage was used to announce community meetings and interested parties were notified via e-mail. The Plan was also covered by local newspapers, including an editorial in the Washington Post. A project kick-off community meeting was held on December 3, 2013, at the Aspen Hill Community Library to introduce the project and timeline to the community. Aspen Hill area citizen and homeowner associations within two miles of the Minor Amendment site were contacted via email. Interested parties that had contacted the Planning Department about the Project in 2013 prior to its initiation were also notified and added to the e-mail distribution list. Approximately 35 people attended the initial meeting. Two additional community meetings were held on April 1, 2014 and May 13, 2014 with approximately 50 and 70 participants respectively. Each of the community meetings was held at the Aspen Hill Public Library, less than a half mile to the west of the Minor Amendment area. In addition to the community meetings, Staff attended the Aspen Hill Civic Association meeting on April 9, 2014 and the Aspen Hill Homeowners meeting on April 24, 2014 to respond to resident questions and concerns and to promote the final community meeting in May. Both meetings were held at the Aspen Hill Public Library. A robust dialogue was had at each of the community meetings and included a wide range of input from different stakeholder groups, specifically:
The vacant Vitro/BAE office building is a blight on the area and needs to be redeveloped; The land use and zoning should be changed to allow additional retail in the area; There is a need for more reasonably priced commercial goods and grocery in the area; The area is challenging for pedestrians; Traffic in the area, particularly along Aspen Hill Road, is already excessive and large-scale retail would only
make it worse; This area should not be rezoned ahead of the large area, 1994 Aspen Hill Master Plan update; Instead of land use and zoning that allows large-scale commercial uses, could a smaller-scale commercial
land use and zoning classification be considered for the amendment properties at the corners and north side of Aspen Hill Road?
Community meetings, Aspen Hill Public Library

8
Map 3: Vicinity Map

9
Planning Framework
The Minor Amendment area is located within the approximately 13.2-square mile 1994 Aspen Hill Master Plan boundary (Map 3, previous page), which is situated immediately to the east of the City of Rockville, to the north of the urbanized Wheaton-Glenmont communities, and to the south of Olney. Aspen Hill is considered a Suburban Community as defined by the 1993 General Plan Refinement. The 1994 Aspen Hill Master Plan recommended a change in land uses and zoning, accompanied by design guidelines for much of the Minor Amendment area, located to the west of the Aspen Hill Road and Connecticut Avenue intersection. In 2008, the Planning Board approved a Georgia Avenue Study/Urban Design Framework, which was intended to inform future master plan work for communities along the Georgia Avenue Corridor, including Aspen Hill. This study envisioned an evolution of the commercial node in Aspen Hill from an auto-oriented group of strip shopping centers to a more walkable community with a grid system of streets, a mix of uses, and enhanced pedestrian amenities. In November 2013, the County Council approved the Countywide Transit Corridors Functional Master Plan, which recommends additions to the County’s transportation network. The Plan recommends additional transit facilities along 11 corridors, one of which is North Georgia Avenue, to facilitate Bus Rapid Transit (BRT) service that will move more people to and from jobs, homes, shopping, and entertainment areas in urbanizing parts of the County. The Countywide Transit Corridors Functional Master Plan proposes a future BRT station location at the MD 97 and MD 185 intersection, less than a half-mile from the Minor Amendment area. In addition to this Amendment to the Master Plan, Montgomery County is concurrently in the final stages of completing an extensive process to update the County Zoning maps (zoning conversion) to reflect the Zoning Ordinance text rewrite that was adopted in March 2014. The new zoning classifications adopted by the rewrite, are scheduled for County Council approval in October 2014. As such, this Minor Amendment evaluates both the existing zoning to-date (July 2014) and the anticipated zoning conversion (October 2014). (see Map 7: Zoning Conversion)
Demographics
Research and Special Projects Staff established a baseline profile of the greater Aspen Hill Neighborhood to provide background and context for the Plan’s recommendations. The 2007-2011 American Community Survey 5-year estimate from the United States Census Bureau was utilized for 13 census tracts that match most closely to the greater Aspen Hill boundary. (Map 4 below)
Map 4: Demographic Study Area - Greater Aspen Hill Neighborhood

10
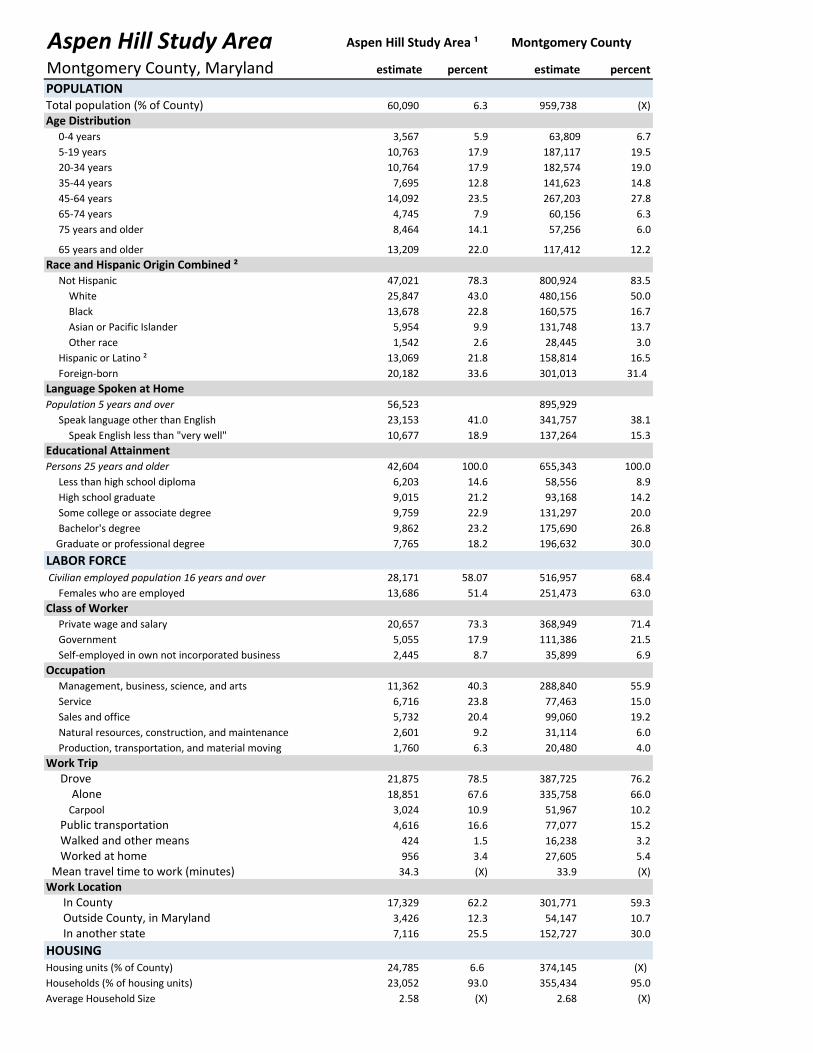
Table 1 below provides a summary of the neighborhood demographic profile as compared to Montgomery County. A full demographic profile for the greater Aspen Hill Neighborhood can be found in Appendix A. The greater Aspen Hill Neighborhood has a total population of approximately 60,090 people. It is a diverse community with the Hispanic or Latino and Non-Hispanic Black populations higher than the Countywide average. There is a significantly larger population of seniors age 65 and older in the greater Aspen Hill Neighborhood than the percentage Countywide. This can be attributed to the existence of the Leisure World age-restricted community as well as multiple senior and assisted living facilities within the area. The greater Aspen Hill area has a lower Median Household Income than the County as a whole, and a much greater percentage of the population that works in the Service industry.
Data Set Greater Aspen Hill Montgomery County
Total Population 60,090 (6.3 % of County)
959,738
65 years & older 22.0% 12.2%
Race and Hispanic Origin Combined* Not Hispanic White Black Asian or Pacific Islander Other race Hispanic or Latino**
78.3% 43.0% 22.8%
9.9% 2.6%
21.8%
83.5% 50.0% 16.7% 13.7%
3.0% 16.5%
Occupation Management, business, science, arts Service
40.3% 23.8%
55.9% 15.0%
Average Household Size 2.58 2.68
Tenure Owner-occupied Renter-occupied
69.9% 30.1%
68.8% 31.2%
2011 Median Household Income $70,072 $95,660
Table 1: Aspen Hill and Montgomery County Demographic Comparison Profile
*Those of Hispanic origin may be of any race. **Between 2000 & 2011 the Hispanic or Latino population in greater Aspen Hill grew from 14.1% to 21.8%; the fastest growing group with an increase of 63%. Sources: 2000 U.S. Census, 2007-2011 American Community Survey 5-year estimate, U.S. Census Bureau; Research & Special Projects, Montgomery County Planning Department, M-NCPPC

11
Minor Amendment Area
Map 5: Minor Amendment Area and Surrounding Land Uses
The Aspen Hill Minor Master Plan Amendment area adjoins one of the greater Aspen Hill neighborhood’s largest commercial areas, made up of three community shopping centers and two big-box retailers: Home Depot and Kmart. Immediately to the north of the Minor Amendment area is the Home Depot; to the east is Northgate Plaza which includes a Kohl’s, Michaels, and Rite Aid; to the southeast is the Aspen Hill Shopping Center which includes a Giant Grocery, U.S. Post Office, and Panera Bread; and east of Georgia Avenue is a Kmart, the Gate of Heaven Cemetery, and the Aspen Manor Shopping Center. Single-family detached homes, interspersed with institutional uses, are predominant to the south and west. Of the 14 total acres included in the Minor Amendment, the former Vitro/BAE vacant office building and associated parking encompass approximately 10 acres. A Dunkin Donuts is located adjacent to the former Vitro/BAE property to the south. Gas stations are situated on the northwest and southwest corners of the Connecticut Avenue and Aspen Hill Road intersection, and the Aspen View Center office building, its associated parking, and a residential detached home converted for an office use make up the remaining amendment properties on the south side of Aspen Hill Road.

12
ANALYSIS
The overall goal of the Plan is to facilitate the enhancement of Aspen Hill as a suburb where people can live, shop, work, and walk to community amenities. Different land use and zoning alternatives, design criteria, and infrastructure improvements were evaluated for the Minor Amendment area, including:
Rezoning the Minor Amendment area to acknowledge the changed office market and to capture the area’s retail market potential, while allowing for a mix of uses, compatible with surrounding land uses, to develop over time.
Establishing design criteria that address future form and function of the Minor Amendment area. Fine-tuning proposed zoning map conversions for properties in the Subject area to ensure consistency
with the Minor Amendment. Analyzing and addressing the impacts of added vehicular traffic on Aspen Hill Road and Connecticut
Avenue. Addressing pedestrian safety; connectivity; and vehicular, pedestrian, and bicycle circulation within the
Minor Amendment area. When the Aspen Hill Master Plan was approved 20 years ago, Vitro Corporation occupied the office building at 4115 Aspen Hill Road and had been a long standing employer in the area. Over the past decade, both Vitro and BAE have vacated the site and the 265,000 square foot office building has remained vacant since 2010. In general, the large-scale, single-tenant office market has changed and declined throughout the region. The current trend in office uses is to move away from the suburban car-oriented sprawling campus of past decades and to cluster more compact offices around multiple-use, mass transit centered areas. Medical offices, such as the Aspen View Center located on a smaller footprint on the south side of Aspen Hill Road, may be the exception to this trend, as providers favor suburban locations that are convenient to their patients. The property owner’s inability to attract an office tenant to reuse 4115 Aspen Hill Road after four years of marketing the building is indicative of the soft office market, generally, and the decreasing demand for large scale single tenant structures. The full market analysis completed by Research and Special Projects Staff is included in Appendix B. In light of the soft office market in the region, and the unlikely reuse of the obsolete office building at 4115 Aspen Hill Road, the market feasibility of additional land uses in the area, specifically retail and townhouse development, was evaluated. The strong commercial market base and land use pattern that currently surrounds the Minor Amendment area was an indication that additional retail may be supportable in the Minor Amendment area. In addition, a moderately dense residential land use would be an appropriate transition between the more dense commercial uses situated toward Connecticut Avenue and the single-family residential neighborhoods to the west. The Retail and Residential Feasibility Studies conducted by the Planning Department concluded that additional retail square footage could be supported in the trade area, whereas townhouses may be supported, but their feasibility is less certain at this time. (Appendix B)
Examples of townhouse and retail land uses

13
Map 6: Existing Zoning
Map 7: Conversion Zoning

14
Map 8: Proposed Zoning

15
LAND USE AND ZONING RECOMMENDATIONS
Properties North of Aspen Hill Road
The approximately 11.5-acres situated to the north of Aspen Hill Road include the currently vacant Vitro/BAE office building, parking areas, a Dunkin Donuts, and a Shell gas station. The 1994 Aspen Hill Master Plan identified the majority of this area as Significant Parcel #3 and stated that the site should be maintained as an office employment center for the Aspen Hill community (page 46). The Plan recommended a change in zoning from commercial (C-1 Convenience Commercial) to office (C-O Commercial, Office Building) to preserve this site as an employment center and preserve job opportunities for residents to work near their home (page 47). The R-90 (Residential, One-family) portions of the site which were used for parking, were reconfirmed. The Dunkin Donuts and Shell gas station properties were not included as part of Significant Parcel #3 in the 1994 Plan. The properties are currently zoned C-1. The properties north of Aspen Hill Road may support mixed-use development as the market evolves in the future, particularly if the properties are assembled and redeveloped comprehensively. More intense redevelopment should be focused toward Connecticut Avenue. Redevelopment of the vacant, former Vitro/BAE office building, should have its primary access off of Connecticut Avenue and access to/from Aspen Hill Road should be limited to a right-in/right-out driveway to alleviate queuing pressures on Aspen Hill Road and intersection congestion during peak hours. Projects adjacent to single-family residential neighborhoods should use compatible building mass, height and setback, and façade articulation to create a transition to those neighborhoods. The 1994 Plan recommends that no structure for building or parking should be closer to the single-family houses than the existing structure [at 4115 Aspen Hill Road]. (pg. 46) The existing structure sits approximately 96-feet from the west property line. In the event that this property is redeveloped, and the existing building demolished, the Plan recommends that any non-residential uses maintain a 100-foot no-build area along the western edge of the property adjacent to the single-family residential neighborhood. (see Figure 1, Design Guidelines) This Plan recognizes that there may be a phased redevelopment of the north side of Aspen Hill Road over a long period of time. It is likely that the former Vitro/BAE property will redevelop in the shorter term, followed by potential redevelopment of the remaining properties over time, as the market evolves to support a moderately dense mix of land uses. While this Plan recognizes the need to accommodate some near-term, single-use development, the overarching goal is to facilitate the opportunity for a comprehensive redevelopment of these sites over the long-term.
Recommendation
Rezone the entire Minor Amendment area north of Aspen Hill Road from C-O; R-90; and C-1, to a Commercial Residential Town Zone (CRT-1.5, C-0.5, R-1.0, H-60).
Aspen Hill Rd
Co
nn
ecti
cut
Ave
1994 Plan, Significant Parcels 3 & 4

16
Properties South of Aspen Hill Road
This area is made up of approximately 2.4-acres of land. A gas station is situated on the southwest corner of the Connecticut Avenue and Aspen Hill Road intersection, and the Aspen View Center office building, its associated parking, and a residence that has been converted to an office use make up the remaining amendment properties on the south side of Aspen Hill Road. The majority of the properties on the southwest side of Aspen Hill Road and Connecticut Avenue are identified as Significant Parcel #4: Mobil Service Station and Aspen View Center Office Building in the 1994 Aspen Hill Master Plan. The Plan recommended that the entire service station site be zoned C-1 to better reflect the actual use of the site. The entire office building [Aspen View Center] site would be appropriate for O-M zoning with no expansion of the existing development. (page 47) Currently, there are no plans to redevelop the south side of Aspen Hill Road. Should redevelopment occur over the long-term, compatible building mass, height, and setback transitions should be made to the residential neighborhoods to the south and west. Any future development should be focused toward framing the Connecticut Avenue and Aspen Hill Road corner and along the Aspen Hill Road frontage. (see Figure 1, Design Guidelines)
Recommendations
Confirm the proposed zoning conversion to CRT-0.5, C-0.5, R-0.25, with an adjustment to maximum building height (H) from 35 feet to 45 feet, for the southwest corner of Aspen Hill Road and Connecticut Avenue.
Confirm the proposed zoning conversion to EOF-1.5 (Employment Office) for the remaining properties south of Aspen Hill Road, with an adjustment to maximum building height from 60 and 75 feet to 45 feet.
1994 Plan, Significant Parcels 3 & 4
Aspen Hill Rd
Co
nn
ecti
cut
Ave

17
DESIGN CRITERIA
The commercial center of Aspen Hill is a fragmented, suburban district where most of the land is dedicated to low intensity uses with vast amounts of surface parking. Although mature, the district remains under-developed, but with potential to yield a greater mix of uses over time, for the benefit of surrounding communities. As redevelopment occurs, the area presents a good opportunity for applying strong urban design principles and sustainable and low impact development to improve neighborhood connectivity, create new community open space and, by promoting distinctive architecture, define a stronger local identity. Connectivity is an important goal of this Plan. As feasible, there should be internal vehicular and pedestrian connections between properties that will encourage dispersal of movement throughout the Plan area. The recommendations in this Amendment will create conditions that will allow for this type of connected, mixed-use development to occur, but achieving these goals will likely be incremental. Early development phases should set the stage to achieve longer-term goals.
As a minimum, redevelopment must do the following:
Promote the creation of frontages along Connecticut Avenue. Locate buildings as close to Connecticut Avenue as possible. This will begin to establish a street wall along this major thoroughfare and give maximum visibility to new uses.
Locate the front entrances and primary facades of new buildings on Connecticut Avenue or the shared entrance from Connecticut Avenue. Enhance the area’s identity and character by providing architectural elements that articulate the façade and provide visual interest.
Provide visual improvements that direct pedestrians to available transit options, and that clarify internal circulation patterns for vehicles, bicyclists, and pedestrians.
All connections should have adequate amenities for pedestrians, including generous sidewalks, green planting strips between pedestrians and vehicular areas, and significant tree planting.
Minimize the visibility of loading docks and locate them to have minimal impact on pedestrian activities. Loading docks and service areas must not front on Connecticut Avenue.
Consolidate vehicular entrances at the major roads. Locate surface parking areas behind the front building line; include significant planting areas and highly
visible landscaped pedestrian walks connecting uses with enhanced pedestrian areas along the public domain.
Shared use path, structures to road, façade articulation Landscaped pedestrian paths between uses

18
Redevelopment should foster the following, as the Plan area evolves over time: Promote compact, mixed-use development with high levels of internal connectivity. Concentrate high densities at locations where multimodal transportation choices are or might be available
to reduce dependence on automobile use. Provide networks of internal streets that create blocks that are pedestrian-scaled and walkable. These
streets should provide connections to surrounding communities. Create a development pattern with short blocks, and human-scaled buildings and streets, to create an
inviting and safe public realm. Create a recognizable center for the community, with identifiable edges to reinforce the form and identity
of the area. Provide places for community use where the public feels welcome and encouraged to congregate.
Design Guidelines The guidelines focus on the elements of the redevelopment that will reshape the public domain. The following diagrams illustrate where and how each element could be considered.
Figure 1: Design Criteria

19
Elements
Build-to areas designate an area along the public right-of-way where the front building façade should be located, to define the public domain and introduce street activating uses in areas where promoting pedestrian activity is desirable. Build-to-areas allow for some flexibility in locating the street wall within pre-established distances away from the public right-of-way. The Zoning Ordinance establishes a maximum setback from the public right-of-way for a standard method project. Setbacks for optional method projects are determined during the regulatory review process, but locating building facades as close as possible to the right-of-way is strongly encouraged.
Streetscape Improvements should include wide sidewalks, adequate illumination, landscaping, and street furnishings, to enhance and promote pedestrian activity, and must include implementing the Green Corridors Policy (1994 Aspen Hill Master Plan, pages 112-117). The green corridors concept designates major highways and through-residential streets that should be safe and attractive for pedestrians and bicyclists as well as vehicles, and preserves the character of those streets that already qualify as green corridors. Improve Connecticut Avenue and Aspen Hill Road with
sidewalks where they are lacking, bikeways as recommended by the Plan, trees and planted areas along the curb, and median trees where possible.
Sidewalks along Connecticut Avenue should include: a 6-foot wide green strip along the curb, with trees centered
on the strip; a minimum 10-foot wide shared use path; an 8- to 10-foot wide sidewalk.
Increase vegetation along the corridor to improve visual and environmental quality and to buffer adjacent uses and pedestrians from the high speed and noise of vehicles. The amount of tree canopy through neighborhood roads designated as green corridors should be maintained or enhanced. To promote the creation of a continuous canopy, tree spacing should be ±35 feet on center.
Transitions between commercially zoned properties and immediately adjacent single-family neighborhoods are defined in the Zoning Ordinance. Compatibility requirements, including height compatibility, are described in section 4.1.8.B.
Enhanced intersections refer primarily to how buildings can shape and highlight street crossings linking significant areas, to improve visibility for motorists and safety for pedestrians, while enhancing local character. Enhanced intersections should include: Where feasible, create street defining buildings at all corners, with entrances and/or activating uses oriented
toward or near the corner. Sidewalk streetscape elements (including trees) that clear the corner to improve visibility across the intersection
for pedestrians, cyclists, and motorists. Building corner placement and articulation that allows adequate space for pedestrians to congregate safely, away
from vehicular traffic. Consider speed-reducing measures at the road surface such as alternative materials at crosswalks. This would
require Montgomery County Department of Transportation (MCDOT) approval and coordination.
Build-to-areas
Streetscape improvements
Transitions
Enhanced intersections

20
Looking Forward
The study area is part of a larger commercial cluster, which serves as a neighborhood center for the Aspen Hill area. The scope of this amendment was limited to a group of properties along the western edge of the cluster, so the combined potential of the larger Aspen Hill commercial area was not explored in full detail by this exercise. An update to the 1994 Aspen Hill Master Plan is programmed to begin in July 2015, and will address the larger commercial area. In addition to changing land use dynamics in the region, the approval of priority planning and design studies of the North Georgia Avenue Bus Rapid Transit line, with a proposed station at Georgia Avenue and Connecticut Avenue, (see Transportation Section) has the potential to catalyze more compact development in this area. Future studies should include all the commercial properties in the area to assess their joint development potential, and to explore options for improved internal and external connectivity and for providing an interconnected network of spaces for public use. While the design criteria in the Minor Amendment includes considerations for possibly commercial-only development, the zoning recommendation for the current study area would also allow denser and more compact, mixed-use development. Property owners should consider all development scenarios while exploring redevelopment options.
The 2008 Georgia Avenue Study / Urban Design Framework, prepared by the Planning Department and approved by the Planning Board, illustrated the potential future transition of the Minor Amendment and surrounding areas. The Study recommends that a future amendment to the Aspen Hill Master Plan should explore the feasibility of creating a compact, mixed-use center on the existing commercially zoned areas at the intersection of Georgia and Connecticut Avenues to create a more walkable center with local retail, community facilities, and additional affordable housing. (pages 30-31)
Existing Grid Future Study Area Potential Mobility Network
Figure 2: Georgia Avenue Study/Urban Design Framework
Before After

21
TRANSPORTATION
The Minor Master Plan Amendment area is located on the western side of Connecticut Avenue (MD 185) along both the northern and southern sides of Aspen Hill Road. The portion located north of Aspen Hill Road, mainly occupied by the former Vitro/BAE vacant office building, is accessed by one full-movement access driveway to Aspen Hill Road, which is presently chained closed, and an internal connection to the Home Depot secondary access driveway to Connecticut Avenue. Connecticut Avenue (MD 185) is a six-lane major highway traversing in a northeast-southwest direction along the eastern frontage of the Minor Amendment area. Traffic signals exist at the nearby intersections with Aspen Hill Road and Georgia Avenue (MD 97). The Home Depot secondary access driveway (immediately north of the Vitro/BAE site) is currently undergoing a traffic signal warrant analysis as a condition of approval for the 30,000-square foot Home Depot expansion. This driveway is located approximately 750 feet north of Aspen Hill Road and approximately 850 feet south of the intersection with Georgia Avenue. The posted speed limit on Connecticut Avenue is 40 MPH. The 2013 annual average daily traffic (AADT) on Connecticut Avenue, as reported by the State Highway Administration (SHA), is approximately 36,300 vehicles per day. This represents a 3.6% decrease from 2011. Georgia Avenue (MD 97) is a six-lane major highway traversing in a northwest-southeast direction approximately a quarter mile east of the properties subject to the Minor Amendment. Traffic signals are in place at the nearby intersections with Aspen Hill Road and Connecticut Avenue. The posted speed limit on Georgia Avenue is 45 MPH. The 2013 AADT on Georgia Avenue, as reported by SHA for the segment near Norbeck Road (MD 28), is approximately 42,200 vehicles per day. This represents a 0.6% decrease from 2011. Georgia Avenue is planned as a bus-rapid transit (BRT) corridor with a station to be located at the intersection with Connecticut Avenue. SHA, Maryland Transit Administration (MTA), and MCDOT is currently considering various design and operations alternatives for this BRT line. Aspen Hill Road is a two-lane arterial west of Connecticut Avenue and a four-lane arterial east of Connecticut Avenue. It traverses in an east-west direction between the northern and southern portions of the Minor Amendment area. Currently, the full-movement primary site access driveway to the Vitro/BAE site is located on Aspen Hill Road approximately 400 feet west of the intersection with Connecticut Avenue. Traffic signals are in place at the nearby intersections with Connecticut Avenue and Georgia Avenue. In 2008, a traffic calming project was undertaken by MCDOT to install neckdowns and on-street parking which effectively reduced the section of Aspen Hill Road west of Connecticut Avenue from four- to two-lanes. According to MCDOT, between 2008 and 2011, the traffic calming project resulted in a reduction of average vehicular speed from 35 MPH to 34 MPH and the number of collisions over a three-year period reduced from 13 to 4. The posted speed limit on Aspen Hill Road is 30 MPH. The 2013 AADT on Aspen Hill Road, along the site frontage, as reported by SHA, is approximately 17,400 vehicles per day. This represents an increase of 0.2% from 2012.
Existing Bus Service
The Minor Amendment area is served by a number of bus routes provided by the County’s Ride On and the Washington Metropolitan Area Transit Authority’s (WMATA) Metrobus services (see Map 10, following page). Along Connecticut Avenue there are a total of four bus routes, three of which are provided by Ride On (#26, #34, #41) and one route (#L8) by Metrobus. Route #26 also runs east-west along Aspen Hill Road. The bus stops along the segment of Georgia Avenue in the vicinity of the Minor Amendment area are served by a total of five bus routes, one Ride-on (#53) and four Metrobus (#Y5, #Y7, #Y8, #Y9). Depending on time of day, these buses typically run every 20-30 minutes. There are two bus stops on Connecticut Avenue, between Aspen Hill Road and the shared drive between the Vitro/BAE site and the Home Depot, for which the 2011 SHA Pedestrian Road Safety Audit (PRSA) identified relocation to be closer to the intersection with Aspen Hill Road. Based on data collected by MCDOT, Division of Transit Services, more than 300 transit riders are served daily at these two bus stops. Relocation of these bus stops would enhance safety for pedestrians seeking to cross Connecticut Avenue.

22
Proposed Bus Rapid Transit on Georgia Avenue
In November 2013, the County Council approved the Countywide Transit Corridors Functional Master Plan. The plan recommends 11 Bus Rapid Transit (BRT) corridors throughout the County, including the segment of Georgia Avenue through the study area of this Minor Master Plan Amendment, to be developed in order to help ease congestion and improve travel times. According to the plans for this corridor (Corridor 1: Georgia Avenue North) a future BRT station is to be located at the intersection of Georgia Avenue and Connecticut Avenue. The MTA, SHA, and MCDOT are in the process of evaluating four different transit and BRT design options that include dedicated lanes for transit vehicles and operational upgrades for traffic signals to give priority to transit vehicles. There is currently no funding source identified for construction of this BRT line, however, the current planning phase is funded.
Map 9: Area Transit Services
Countywide Recommended BRT Corridors

23
Traffic Analysis
Since the Vitro/BAE site has been proposed for redevelopment, an analysis was conducted for several possible development scenarios to measure the impacts of increased traffic at three major signalized intersections surrounding the site. Under the recommended CRT Zone or the EOF Zone that would result from remapping the existing Zone pursuant to the Zoning Rewrite project, the Vitro/BAE site could theoretically be redeveloped with a variety of uses including a theoretical maximum of 320,000 square feet of general office, 218,000 square feet of general retail, or 349 multi-family residential units. The following table shows a comparison of trips generated by each of these scenarios, as well as other scenarios such as re-using the existing office building (268,000 square feet) and a 120,000-square foot big box retail building which has been previously discussed by the property owner. As shown in Table 2, an office development (either re-use of the existing building or maximizing the zoning potential on) would generate the most amount of traffic in the weekday morning peak hour, while a retail use would generate the most traffic during the weekday evening peak hour. Multi-family residential development would generate the least amount of traffic during both weekday morning and evening peak hours.
The trips shown in Table 2 represent the ‘worst-case’ scenarios for the Vitro/BAE site. Due to various constraints of the site (i.e., setbacks, parking, slopes) it is unlikely that the maximum allowable square footages for any of the uses could be achieved. Since the property owner has publicly expressed an interest in potentially pursuing a big box retail development, a further detailed trip generation analysis for retail uses was conducted to determine the highest (‘worst case’) traffic generating methodology. Table 3 below shows a comparison of sources of similar retail-type trip generation data.
Table 3 – Comparison of Trip Generation Sources for Retail Uses
Source Weekday
Peak Hour
Max CRT
Build-out
218k SF
Proposed
Big Box
120k SF
LATR & TPAR *
(General Retail)
AM 305 185
PM 1215 740
ITE 9th Edition *
(#813 Free-Standing Discount Superstore)
AM 260 145
PM 615 340
Wal-Mart **
(average of 32 sites nationwide)
AM 235 130
PM 735 405
Notes: *Trips shown for Local Area Transportation Review (LATR) & Transportation Policy Area Review (TPAR) Guidelines and Institute of Transportation Engineers (ITE) sources used a pass-by reduction rate of 35%, consistent with the ITE recommended methodology.
**A pass-by rate of 25% was used consistent with recommendations of the nationwide study.
Table 2 – Comparison of Vehicle Trip Generation - Aspen Hill Minor Master Plan Amendment
Weekday
Peak Hour
Office Residential Retail *
C-O Reuse
Exist. Bldg.
268k SF
Max EOF
Build-out
320k SF
Max CRT
Multi-Fam.
349 Units
Max CRT
Build-out
218k SF
Proposed
Big Box
120k SF
AM 450 660 145 305 185
PM 405 590 165 1215 740
Notes: * Retail trips include a pass-by reduction rate of 35%, consistent with the ITE recommended methodology, to account for vehicles that are already on the roadway network in the vicinity of the site that choose to enter the proposed development and then exit the site continuing on their original journey.

24
As shown in Table 3, the highest trip generating rates for a retail use comes from the Planning Department’s Local Area Transportation Review and Transportation Policy Area Review (LATR & TPAR) Guidelines. These rates were used in the following traffic analysis conducted by Staff to represent ‘worst case’ retail development scenarios. The standard methodology in Montgomery County for determining intersection congestion is to calculate an intersection’s critical lane volume (CLV). The CLV measures the traffic throughput of an intersection by determining the amount of conflicting traffic movements in the intersection. In the Aspen Hill Policy Area, the LATR & TPAR Guidelines state that intersections must operate at a CLV below 1475 in order for a proposed development to be approved without intersection improvements or other traffic mitigation. Table 4 shows a comparison of CLVs at nearby study intersections under the existing conditions, background (no build), and development (retail, residential, office) scenarios. This traffic analysis assumed for all scenarios that the existing primary access driveway for the Vitro/BAE site to Aspen Hill Road would be converted to a right-in/right-out driveway and primary access would be shifted to the existing shared Home Depot driveway onto Connecticut Avenue.
As shown in Table 4 above, except for the theoretical maximum build-out of retail and office uses, all intersections in all other scenarios would operate below the CLV threshold of 1475. In the cases of maximum general office and maximum general retail, the only intersection to exceed the 1475 threshold in either of the weekday peak hours is the Connecticut Avenue and Aspen Hill Road intersection. In the maximum office build-out scenario, this intersection would barely exceed the 1475 threshold with a CLV of 1480. In the maximum retail build-out scenario, this intersection would exceed the 1475 threshold with a CLV of 1540. As noted, the maximum square footages are unlikely to be achieved due to site constraints and the highest trip generation rates were used for the retail uses to present the most conservative (‘worst case’) analysis of traffic conditions.
Table 4 – Critical Lane Volume (CLV) Comparison - Aspen Hill Minor Master Plan Amendment
Intersection
Peak Hour
Existing
Currently Vacant
No Build
Remains Vacant
Office Residential Retail
C-O Reuse
Exist. Bldg.
268k SF
Max EOF
Build-out
320k SF
Max CRT
Multi-Fam.
349 Units
Max CRT
Build-out
218k SF
Proposed
Big Box
120k SF
Max SF w/
Accept. CLVs
170k SF
Georgia Ave & Connecticut Ave
AM 980 985 1005 1010 1000 1010 1005 1010
PM 1095 1100 1140 1155 1105 1205 1165 1185
Connecticut Ave & Aspen Hill Rd
AM 1300 1315 1430 1480 1340 1385 1355 1375
PM 1120 1130 1245 1300 1175 1540 1380 1470
Georgia Ave & Aspen Hill Rd
AM 935 940 1025 1065 970 1010 980 1010
PM 1125 1130 1245 1300 1160 1415 1305 1365
Notes: CLV standard is 1475 in the Aspen Hill Policy Area. CLV analysis assumed right-in/out access to Aspen Hill Road and primary access driveway on Connecticut Avenue for all scenarios.

25
An additional retail scenario was analyzed to determine the 1475 CLV ‘tipping point’ for retail development. The analysis shows that the site could develop with approximately 170,000 square feet of retail without the nearby intersections exceeding the 1475 CLV threshold during either of the AM or PM peak hours. This 170,000 square foot figure could be adjusted higher or lower based on changes to trip generation assumptions, distribution of site traffic, or location/design of access driveways. Pedestrian Safety
Crash data from SHA for the intersection of Aspen Hill Road and Connecticut Avenue does not indicate any conclusive collision patterns. There were two reported collisions with pedestrians between 2005 and 2012. Collisions with pedestrians are typically only reported if they result in a serious injury or fatality. In December 2011, SHA released the Pedestrian Road Safety Audit (PRSA) Review Report for the section of Connecticut Avenue in the vicinity of the properties subject to this Minor Amendment. The study made numerous recommendations to improve pedestrian safety. The highlights include:
Reconstruct the Home Depot secondary access driveway to Connecticut Avenue to eliminate channelized islands.
Consolidate driveways to businesses along Connecticut Avenue. Construct missing segments of sidewalks along Connecticut Avenue. Upgrade handicapped ramps to ADA standards along Connecticut Avenue. Improve pedestrian signage and crosswalks along Connecticut Avenue. Reduce corner turn radii at the intersection of Aspen Hill Road and Connecticut Avenue. Relocate bus stop on Connecticut Avenue closer to the intersection with Aspen Hill Road that is served by
four bus routes. Install a concrete median barrier with pedestrian refuge along Connecticut Avenue. Significantly reduce the radius of the free right-turn ramp from Georgia Avenue to Connecticut Avenue.
Transportation Policy Area Review (TPAR)
Per the LATR & TPAR Guidelines, the Aspen Hill Policy Area is deemed to have both ‘adequate’ roadway and transit capacity. Therefore, developments in Aspen Hill are not subject to the additional impact tax for transportation improvements. Transportation Recommendations
Based on the traffic analysis, site observations, community feedback, and studies conducted by other transportation agencies, this Plan recommends the following:
Access to Aspen Hill Road from the Vitro/BAE site should be provided via a right-in/right-out driveway. This will prevent entering/exiting left-turning vehicles from worsening the existing back-ups on eastbound Aspen Hill Road from the nearby traffic signal at Connecticut Avenue. Additionally, on the northern side of Aspen Hill Road between the Vitro/BAE site driveway and Connecticut Avenue traffic signal there are already three other curb cuts (two for the Shell gas station, one for Dunkin Donuts) in the short span of approximately 400 feet. This driveway should serve as secondary access and be shifted as far west as possible at the time the property is redeveloped.
Primary access to the Vitro/BAE site should be provided via the existing full-movement Home Depot access driveway to Connecticut Avenue. A traffic signal should be installed at this intersection to improve both traffic flow and pedestrian safety, subject to approval by SHA.
The SHA recommendations for improved access management and improved pedestrian safety should be implemented along Connecticut Avenue in the vicinity of the Minor Amendment area and at the intersection with Aspen Hill Road.

26
When/if the Vitro/BAE site and/or nearby properties are redeveloped (notably Dunkin Donuts and the Shell gas station) attention should be given to consolidating site driveways and creating interparcel access between properties. This will require future coordination between the developers, The Planning Department, and MCDOT.
The existing transition from four-lanes to two-lanes heading westbound on Aspen Hill Road should be shifted as far west as feasibly possible to provide more merging room for westbound vehicles and more stacking space for eastbound vehicles queuing from the traffic signal at Connecticut Avenue.
The southbound free-right ramp from Georgia Avenue to Connecticut Avenue should ultimately be removed. Instead, southbound right turns should come to the traffic signal with all other traffic. Removal of the free-right ramp will slow traffic traveling southbound on Connecticut Avenue by the Vitro/BAE site.
The 2005 Countywide Bikeways Functional Master Plan recommends a shared use path along the western side of Connecticut Avenue (reference code SP-27) to connect to the regional network including the Matthew Henson Trail. This shared use path should be constructed commensurate with redevelopment of the Vitro/BAE site.
Source: Pedestrian Road Safety Audit Review Report (PRSA), Connecticut Ave from Independence St to MD 97, MCDOT and SHA, Dec 2011
Excerpt from PRSA: Connecticut Ave between Georgia Ave and Aspen Hill Rd Conceptual Improvements
Excerpt from the PRSA: Connecticut Ave at Aspen Hill Rd Conceptual Improvements

27
ENVIRONMENT
The 1994 Aspen Hill Master Plan area is located in the Turkey Branch subwatershed of the Rock Creek watershed. The area is highly urbanized and completely developed with auto-centric uses. Most of the development occurred at a time before stormwater management regulations were in place. There are almost no natural resources or environmental functions remaining and there are no sensitive areas to protect. This Plan envisions more sustainable development within the footprint of the existing development. Incorporating new development into the existing developed area will reduce land consumption and vehicle miles travelled, improve our carbon footprint, and water and air quality. While the Amendment area is currently more than 90% impervious with very little stormwater management or tree canopy, redevelopment provides the opportunity to improve environmental conditions and create a greener community. Recommendations focus on increasing the livability of the community while optimizing the land use within the existing development footprint. Implementation will occur through the redevelopment process. Carbon Footprint Analysis
Montgomery County Bill number 32-07 establishes a goal to stop increasing greenhouse gas emissions by the year 2010, and to reduce emissions to 20 percent of 2005 levels by the year 2050. There are three main components to greenhouse gas emissions: embodied emissions, building energy emissions, and transportation emissions. Embodied emissions are emissions that are created through the extraction, processing, transportation, construction and disposal of building materials as well as emissions created through landscape disturbance (by both soil disturbance and changes in above ground biomass). Building energy emissions are created in the normal operation of a building including lighting, heating cooling and ventilation, operation of computers and appliances, etc. Transportation emissions are released by the operation of cars, trucks, buses, motorcycles, etc. While it is not possible to quantify the carbon footprint of this Plan due to the small geographic area, it is possible to qualitatively analyze the impacts of the recommended land uses on the County’s carbon footprint. The embodied emissions contribution to total greenhouse gas emissions will increase, due to the demolition of existing structures and construction of new structures. Newly developed buildings have decreased energy emissions due to substantial advances in energy efficiency. Total transportation emissions will increase because the majority of the current plan area is currently occupied by a vacant building. Mixed use development would typically have a lower carbon footprint than redevelopment under the current zoning due to the reduction of single-function automobile trips. Recommendations
Increase tree canopy cover by: Using advanced planting techniques such as constructed soil and interconnected tree pits to increase the
soil area for tree roots for new streets and sidewalks. Establishing a minimum of 30% tree canopy cover for new surface parking.
Minimize and mitigate for impervious surfaces by:
Using Environmental Site Design to reduce runoff from all impervious surfaces, including roofs, terraces, and paving.
Building new streets as “green streets” with urban stormwater management facilities in the right-of-way. Reduce energy consumption by:
Promoting non-auto transportation by providing for pedestrian linkages and incorporating transit stops within new development.
Integrating geothermal systems to reduce energy consumption and allowing and encouraging wind energy conversion systems and large district energy systems.

28
IMPLEMENTATION
This section outlines those steps necessary to implement the zoning recommendations of this Amendment. After the
adoption of this Plan, the Zoning recommendations will be implemented through a Sectional Map Amendment.
Proposed Zoning
The following table summarizes the zones proposed in this Minor Amendment:
Property Size (acres)
Existing Land Use Existing Zone Conversion Zone Proposed Zone
Parcel 544 8.96 Office (vacant Vitro/BAE) C-O; R-90 EOF-3.0 (H-60); R-90 CRT-1.5 (C-0.5 R-1.0 H-60)
Parcel 534 1.07 Parking C-O; R-90 EOF-3.0 (H-60); R-90 CRT-1.5 (C-0.5 R-1.0 H-60)
Parcel 600 0.97 Retail (Dunkin Donuts) C-1; C-0 CRT-1.0 (C-0.75 R-0.5 H-45); EOF-3.0 (H-60) CRT-1.5 (C-0.5 R-1.0 H-60)
Parcel 644 0.12 Parking C-1 CRT-1.0 (C-0.75 R-0.5 H-45) CRT-1.5 (C-0.5 R-1.0 H-60)
Parcel 643 0.46 Retail (Shell Gas) C-1 CRT-1.0 (C-0.75 R-0.5 H-45) CRT-1.5 (C-0.5 R-1.0 H-60)
Lot 49 1.03 Retail (Sunoco Gas) C-1 CRT-0.5 (C-0.5 R-0.25 H-35) CRT-0.5 (C-0.5 R-0.25 H-45)
Lot 48 0.53 Office (Aspen View Center) O-M EOF-1.5 (H-75) EOF-1.5 (H-45)
Lot 47 0.19 Parking O-M EOF-1.5 (H-60) EOF-1.5 (H-45)
Lot 46 0.17 Parking O-M EOF-1.5 (H-60) EOF-1.5 (H-45)
Lot 45 0.16 Parking O-M EOF-1.5 (H-60) EOF-1.5 (H-45)
Lot 44 0.14 Parking O-M EOF-1.5 (H-60) EOF-1.5 (H-45)
Lot 43 0.14 Residential Detached/Office O-M EOF-1.5 (H-60) EOF-1.5 (H-45)
Existing
29
ELECTED AND APPOINTED OFFICIALS
County Council
Craig Rice, President
George Leventhal, Vice-President
Phil Andrews
Roger Berliner
Cherri Branson
Marc Elrich
Nancy Floreen
Nancy Navarro
Hans Riemer
County Executive
Isiah Leggett
The Maryland-National Capital Park and Planning Commission
Elizabeth M. Hewlett, Chair
Françoise M. Carrier, Vice Chair
Commissioners
Montgomery County Planning Board Prince George’s County Planning Board
Françoise M. Carrier, Chair Elizabeth M. Hewlett, Chair
Marye Wells-Harley, Vice Chair Dorothy F. Bailey, Vice Chair
Casey Anderson Manuel R. Geraldo
Norman Dreyfuss John P. Shoaff
Amy Presley A. Shuanise Washington

30
THE PLAN PROCESS
A plan provides comprehensive recommendations for the use of publicly and privately owned land. Each plan reflects a
vision of the future that responds to the unique character of the local community within the context of a countywide
perspective.
Together with relevant policies, plans should be referred to by public officials and private individuals when making land
use decisions.
The STAFF DRAFT PLAN is prepared by the Montgomery County Planning Department for presentation to the
Montgomery County Planning Board. The Planning Board reviews the Staff Draft Plan, makes preliminary changes as
appropriate, and approves the Plan for public hearing. After the Planning Board’s changes are made, the document
becomes the Public Hearing Draft Plan.
The PUBLIC HEARING DRAFT PLAN is the formal proposal to amend an adopted master plan or sector plan. Its
recommendations are not necessarily those of the Planning Board; it is prepared for the purpose of receiving public
testimony. The Planning Board holds a public hearing and receives testimony, after which it holds public worksessions
to review the testimony and revise the Public Hearing Draft Plan as appropriate. When the Planning Board’s changes
are made, the document becomes the Planning Board Draft Plan.
The PLANNING BOARD DRAFT PLAN is the Board's recommended Plan and reflects their revisions to the Public Hearing
Draft Plan. The Regional District Act requires the Planning Board to transmit a sector plan to the County Council with
copies to the County Executive who must, within sixty days, prepare and transmit a fiscal impact analysis of the
Planning Board Draft Plan to the County Council. The County Executive may also forward to the County Council other
comments and recommendations.
After receiving the Executive's fiscal impact analysis and comments, the County Council holds a public hearing to
receive public testimony. After the hearing record is closed, the relevant Council committee holds public worksessions
to review the testimony and makes recommendations to the County Council. The Council holds its own worksessions,
then adopts a resolution approving the Planning Board Draft Plan, as revised.
After Council approval the plan is forwarded to the Maryland-National Capital Park and Planning Commission for
adoption. Once adopted by the Commission, the plan officially amends the master plans, functional plans, and sector
plans cited in the Commission's adoption resolution.
31
ACKNOWLEDGEMENTS
Gwen Wright, Director
Rose Krasnow, Deputy Director
Project Team
Area 2 Division
Glenn Kreger, Chief
Nancy Sturgeon, Master Planner Supervisor
Andrea Gilles (Lead Planner)
Luis Estrada Cepero, Urban Design
Amy Lindsey, Environment
Ed Axler, Transportation
Aaron Zimmerman, Transportation
Research and Special Projects Division
Valdis Lazdins, Chief
Richard Liu
Lisa Tate
Pam Zorich
Park Planning, Department of Parks
Brooke Farquhar
Charles Kines
Management Services
Bridget Schwiesow, Communications Manager
Kevin Leonard

32

APPENDIX A - DEMOGRAPHIC PROFILE
Aspen Hill Study AreaMontgomery County, Maryland estimate percent estimate percent
POPULATIONTotal population (% of County) 60,090 6.3 959,738 (X)
Age Distribution 0-4 years 3,567 5.9 63,809 6.7
5-19 years 10,763 17.9 187,117 19.5
20-34 years 10,764 17.9 182,574 19.0
35-44 years 7,695 12.8 141,623 14.8
45-64 years 14,092 23.5 267,203 27.8
65-74 years 4,745 7.9 60,156 6.3
75 years and older 8,464 14.1 57,256 6.0
65 years and older 13,209 22.0 117,412 12.2
Race and Hispanic Origin Combined ² Not Hispanic 47,021 78.3 800,924 83.5
White 25,847 43.0 480,156 50.0
Black 13,678 22.8 160,575 16.7
Asian or Pacific Islander 5,954 9.9 131,748 13.7
Other race 1,542 2.6 28,445 3.0
Hispanic or Latino ² 13,069 21.8 158,814 16.5
Foreign-born 20,182 33.6 301,013 31.4
Language Spoken at HomePopulation 5 years and over 56,523 895,929
Speak language other than English 23,153 41.0 341,757 38.1
Speak English less than "very well" 10,677 18.9 137,264 15.3
Educational AttainmentPersons 25 years and older 42,604 100.0 655,343 100.0
Less than high school diploma 6,203 14.6 58,556 8.9
High school graduate 9,015 21.2 93,168 14.2
Some college or associate degree 9,759 22.9 131,297 20.0
Bachelor's degree 9,862 23.2 175,690 26.8
Graduate or professional degree 7,765 18.2 196,632 30.0
LABOR FORCE Civilian employed population 16 years and over 28,171 58.07 516,957 68.4
Females who are employed 13,686 51.4 251,473 63.0
Class of Worker Private wage and salary 20,657 73.3 368,949 71.4
Government 5,055 17.9 111,386 21.5
Self-employed in own not incorporated business 2,445 8.7 35,899 6.9
Occupation Management, business, science, and arts 11,362 40.3 288,840 55.9
Service 6,716 23.8 77,463 15.0
Sales and office 5,732 20.4 99,060 19.2
Natural resources, construction, and maintenance 2,601 9.2 31,114 6.0
Production, transportation, and material moving 1,760 6.3 20,480 4.0
Work Trip Drove 21,875 78.5 387,725 76.2
Alone 18,851 67.6 335,758 66.0
Carpool 3,024 10.9 51,967 10.2
Public transportation 4,616 16.6 77,077 15.2
Walked and other means 424 1.5 16,238 3.2
Worked at home 956 3.4 27,605 5.4
Mean travel time to work (minutes) 34.3 (X) 33.9 (X)
Work Location In County 17,329 62.2 301,771 59.3
Outside County, in Maryland 3,426 12.3 54,147 10.7
In another state 7,116 25.5 152,727 30.0
HOUSINGHousing units (% of County) 24,785 6.6 374,145 (X)
Households (% of housing units) 23,052 93.0 355,434 95.0
Average Household Size 2.58 (X) 2.68 (X)
Aspen Hill Study Area ¹ Montgomery County

Aspen Hill Study AreaMontgomery County, Maryland estimate percent estimate percent
Aspen Hill Study Area ¹ Montgomery County
Tenure
Owner-occupied 16,109 69.9 244,497 68.8
Renter-occupied 6,943 30.1 110,937 31.2
Units in Structure
1-unit, detached 9,743 39.3 182,351 48.7
1-unit, attached 3,866 15.6 68,139 18.2
2 to 4 units 486 2.0 6,596 1.8
5 to 9 units 1,752 7.1 19,105 5.1
10 to 19 units 3,927 15.8 36,503 9.8
20 or more units 5,011 20.2 60,997 16.3
Households by Type:
Family households 15,023 65.2 242,848 68.3
Married-Couple 10,441 45.3 189,719 53.4
Single-Parent 2,336 10.1 27,474 7.7
Nonfamily households 8,029 34.8 112,586 31.7
Householder living alone 7,123 30.9 91,890 25.9
65 years and over 4,304 18.7 30,702 8.6
Residence 1 Year Ago
Population 1 year and over 59,404 100.0 947,660 100.0
Same Home 52,829 88.9 816,248 86.1
Elsewhere in County 3,779 6.4 66,780 7.0
Elsewhere in Maryland 694 1.2 14,652 1.5
Different state 1,351 2.3 34,920 3.7
Abroad 751 1.3 15,060 1.6
Selected Monthly Owner Costs
Housing units with a mortgage 10,495 100.0 195,241 100.0
Less than $700 201 1.9 1,710 0.9
$700 to $999 513 4.9 4,758 2.4
$1,000 to $1,499 1,457 13.9 19,124 9.8
$1,500 to $1,999 2,594 24.7 31,585 16.2
$2,000 or more 5,730 54.6 138,064 70.7
Median (dollars) (X) 2,592 (X)
Gross Rent
Occupied units paying rent 6,489 100.0 107,406 100.0
Less than $500 353 5.4 3,294 3.1
$500 to $749 469 7.2 3,434 3.2
$750 to $999 366 5.6 7,349 6.8
$1,000 to $1,499 2,619 40.4 40,925 38.1
$1,500 or more 2,592 39.9 50,993 47.5
Median (dollars) (X) 1,473 (X)
Households Spending More Than 35% of Income on Housing Costs
Homeowners with a mortgage 3,555 34.1 55,192 28.3
Renters 3,337 52.0 43,199 40.7
HOUSEHOLD INCOME2011 Household Income Distribution
Under $15,000 1,679 7.3 18,538 5.2
$15,000 to $34,999 3,881 16.8 34,335 9.7
$35,000 to $49,999 2,731 11.9 32,032 9.0
$50,000 to $74,999 3,934 17.1 54,511 15.3
$75,000 to $99,999 3,090 13.4 45,306 12.8
$100,000 to 149,999 4,043 17.5 70,469 19.8
$150,000 to 199,999 2,031 8.8 42,181 11.9
$200,000+ 1,663 7.2 58,062 16.3
2011 median household income (dollars) 70,072 (X) 95,660 (X)
People whose income is below the poverty level 5,261 8.85 59,793 6.3
65 years and over 662 5.1 6,996 6.2
¹ Study area defined by 13 U.S. Census tracts: 13.03, 32.01, 32.02, 32.13-32.16, 32.18-32.21, 33.01 and 33.02.
² Those of Hispanic origin may be of any race.
Source: 2007-2011 American Community Survey 5-year estimate, U.S. Census Bureau; Research & Special Projects, Montgomery
County Planning Dept., M-NCPPC.

ASPEN HILL MINOR MASTER PLAN AMENDMENT
Market Studies
Office Market Analysis
Residential Feasibility Study
Retail Feasibility Study
Prepared by the
RESEARCH & SPECIAL PROJECTS DIVISION Montgomery County Planning Department Valdis Lazdins, Chief, Research & Special Projects Division Rick Liu, Economic & Development Specialist Lisa Madigan Tate, Senior Economic Research Planner
April 15, 2014
APPENDIX B - MARKET ANALYSIS

Page 1
Office Market Analysis

Page 2
ASPEN HILL MINOR MASTER PLAN AMENDMENT
Office Market Analysis
RESEARCH & SPECIAL PROJECTS DIVISION Montgomery County Planning Department April 15, 2014
INTRODUCTION This report assesses the general feasibility for future office uses within the proposed Aspen Hill
Minor Master Plan Amendment (MMPA) area. It focuses on whether the market is likely to
absorb existing vacant office space or support construction of a comparable amount of new
office space in Aspen Hill as a whole and on the BAE/Vitro site in particular.
METHODOLOGY AND ASSUMPTIONS This analysis begins by examining key trends shaping office demand in general, and quantifies
existing levels of office supply and demand in the region. The analysis then assesses the
economic feasibility of large scale office use in Aspen Hill. It gauges Aspen Hill’s ability to attract
office users relative to alternative locations given tenant preferences regarding transit
accessibility, building design, and proximity to commercial centers. Site-specific challenges to
reusing, retrofitting or replacing office space in the MMPA area also are discussed.

Page 3
OFFICE MARKET OUTLOOK
National Office Market Assessment
Despite a brighter economic climate, office users nationwide are choosing to maintain smaller
physical footprints. Government and private sector tenants alike are consolidating operations,
lowering their square foot per employee ratios, taking on new space more slowly, and
negotiating shorter term leases.
These trends are driven by more than a desire to reduce occupancy costs. Telecommuting, new
technologies, and changing workplace designs (such as unassigned workspaces and smaller ‘on-
the-fly’ meeting spaces) make it easier for employers use space more intensively, but also
appeal to workers seeking more flexible, creative and collaborative work environments.
Changing tenant preferences for office locations and building characteristics also are
fundamentally reshaping the office market. Companies want to collocate with clients and
suppliers, reinforcing the pull of existing business clusters. Tenants also increasingly favor more
attractively-designed, greener and transit-accessible office spaces.
Newer spaces in higher density, mixed use environments are best positioned to compete for
these tenants. Older or obsolete properties, especially those located outside business clusters,
are at a growing competitive disadvantage.
Medical offices may be an exception to the move to smaller, centralized and transit-centered
offices. Demand for non-hospital health care space will be robust over the long term due to an
increase in insured patients under the Affordable Care Act (ACA) and continued growth in the
senior population. Medical providers increasingly favor suburban locations that are convenient
and accessible to patients, fostering a boom in medical office construction--according to
Colliers International, 25 percent of all office space under construction in the nation is medical
office space.
This category of demand will not necessarily cure rising vacancy rates in existing suburban
office buildings, as ACA compliance demands and cost containment are expected to spur
consolidation in both the health care and insurance industries, potentially creating vacancies in
medical and office buildings currently occupied by smaller providers. Medical offices have
higher buildout costs and other increasingly specialized space requirements; newer and larger
health care establishments typically prefer build-to-suit over existing office structures, and
close proximity to retail centers.
Page 4
Figure 1
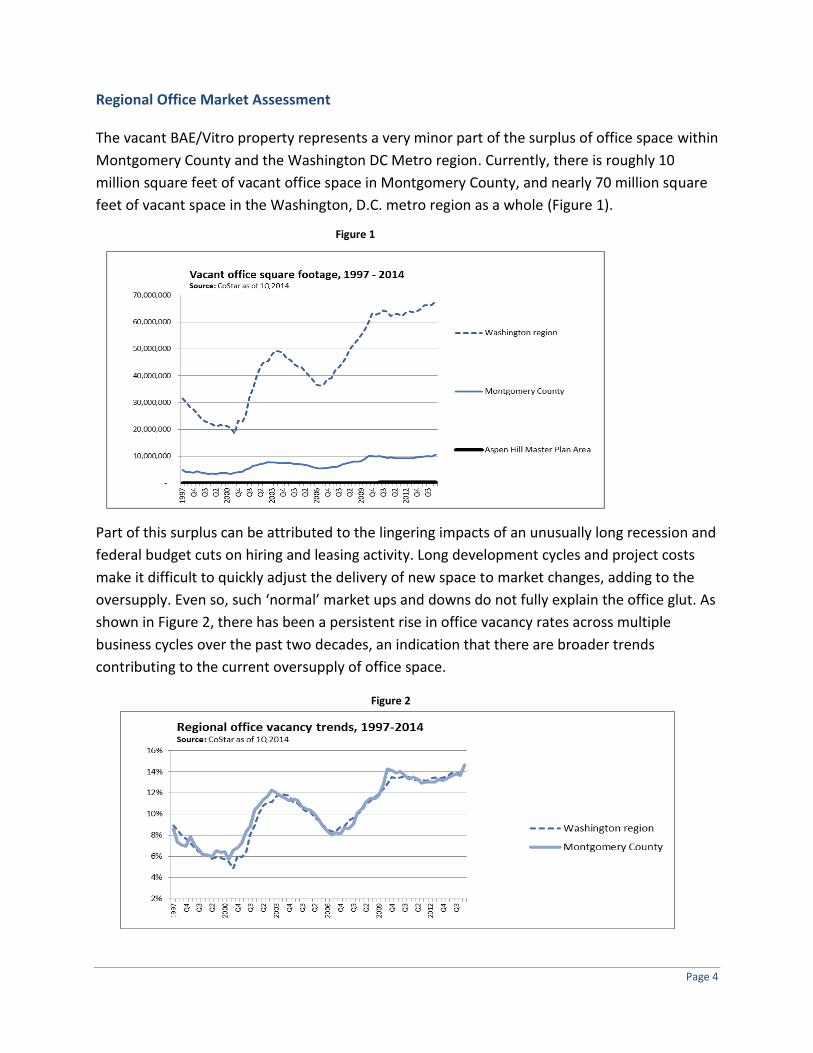
Regional Office Market Assessment
The vacant BAE/Vitro property represents a very minor part of the surplus of office space within
Montgomery County and the Washington DC Metro region. Currently, there is roughly 10
million square feet of vacant office space in Montgomery County, and nearly 70 million square
feet of vacant space in the Washington, D.C. metro region as a whole (Figure 1).
Part of this surplus can be attributed to the lingering impacts of an unusually long recession and
federal budget cuts on hiring and leasing activity. Long development cycles and project costs
make it difficult to quickly adjust the delivery of new space to market changes, adding to the
oversupply. Even so, such ‘normal’ market ups and downs do not fully explain the office glut. As
shown in Figure 2, there has been a persistent rise in office vacancy rates across multiple
business cycles over the past two decades, an indication that there are broader trends
contributing to the current oversupply of office space.
Figure 2

Page 5
The Federal mandate for reducing office footprint is likely to only increase the vacancy rate:
consolidation of federal space is expected to release 1 million square feet of space onto
Montgomery County’s office market alone. The current record-high 13.7 percent office vacancy
rate for Montgomery is consistent with weakness in the office market region-wide (Figure 3).
Aspen Hill Office Market Assessment
The 242,000 square foot office building currently on the Vitro site accounts for the vast majority
of office inventory in Aspen Hill. Consequently, the loss of the building’s sole tenant in 2010 and
the owner’s reported inability to release the space has had an outsized impact in Aspen Hill,
where the vacancy rate has hovered at around 71 percent. The Vitro vacancy has pushed the
vacancy rate in its wider Kensington-Wheaton office submarket to around 25 % (Figure 4).
Figure 3
Figure 4

Page 6
IMPACT ON DEMAND FOR OFFICE SPACE IN ASPEN HILL A long period of sustained economic growth and market adjustments may be needed to absorb
the existing vacant office inventory in the regional economy, indicating that there will likely be
fierce competition for office tenants for the foreseeable future. Changing office tenant location
preferences also put suburban centers that lack Metro access or a strong non-retail commercial
presence—such as Aspen Hill—at a significant competitive disadvantage.
It is important to note that the BAE/Vitro property, which accounts for most of Aspen Hill’s
office inventory, was custom-built for a large Federal defense contractor at a time when there
was less risk associated with long-term leases. In the current market climate, it would be
particularly difficult to attract a tenant large enough to absorb all 242,000 square feet of office
space. Most tenants who do not want to collocate with other users are seeking smaller
buildings that can be customized to their needs, as well as proximity to business partners as
well as Metro.
The BAE/Vitro building’s current interior layout (e.g., oddly placed stairwells and wall partitions)
was designed for a unique user and would be obsolete and unappealing to contemporary
tenants. Because the building was constructed with reinforced concrete, the cost of retrofitting
these features to accommodate a new tenant would be unusually high.
Subdividing into a multi-tenant property would also be cost-prohibitive because it would
require removing nearly all existing building components and essentially creating a new code-
compliant building over the existing foundation. This option would be more expensive than
fully demolishing and building new. Even then, it would be extremely challenging to find
multiple tenants given the overall weakness in the current office market.
Based on these factors, it can be reasonably concluded that the market probably will not
absorb the existing block of vacant office space or support the construction of a new or
replacement office space in the MMPA area in the near future. Limited demand may exist for
community-serving office uses, such as a medical or professional building.

Page 7
Residential Feasibility Study
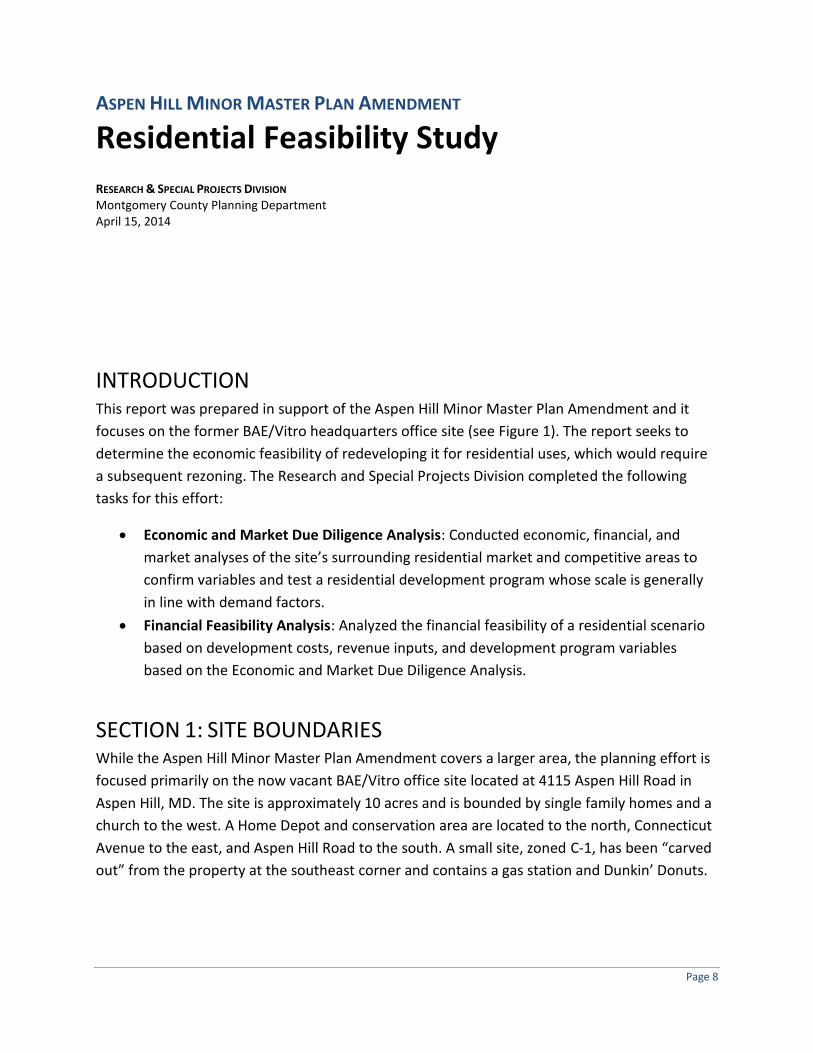
Page 8
ASPEN HILL MINOR MASTER PLAN AMENDMENT
Residential Feasibility Study RESEARCH & SPECIAL PROJECTS DIVISION Montgomery County Planning Department April 15, 2014
INTRODUCTION This report was prepared in support of the Aspen Hill Minor Master Plan Amendment and it
focuses on the former BAE/Vitro headquarters office site (see Figure 1). The report seeks to
determine the economic feasibility of redeveloping it for residential uses, which would require
a subsequent rezoning. The Research and Special Projects Division completed the following
tasks for this effort:
Economic and Market Due Diligence Analysis: Conducted economic, financial, and
market analyses of the site’s surrounding residential market and competitive areas to
confirm variables and test a residential development program whose scale is generally
in line with demand factors.
Financial Feasibility Analysis: Analyzed the financial feasibility of a residential scenario
based on development costs, revenue inputs, and development program variables
based on the Economic and Market Due Diligence Analysis.
SECTION 1: SITE BOUNDARIES While the Aspen Hill Minor Master Plan Amendment covers a larger area, the planning effort is
focused primarily on the now vacant BAE/Vitro office site located at 4115 Aspen Hill Road in
Aspen Hill, MD. The site is approximately 10 acres and is bounded by single family homes and a
church to the west. A Home Depot and conservation area are located to the north, Connecticut
Avenue to the east, and Aspen Hill Road to the south. A small site, zoned C-1, has been “carved
out” from the property at the southeast corner and contains a gas station and Dunkin’ Donuts.
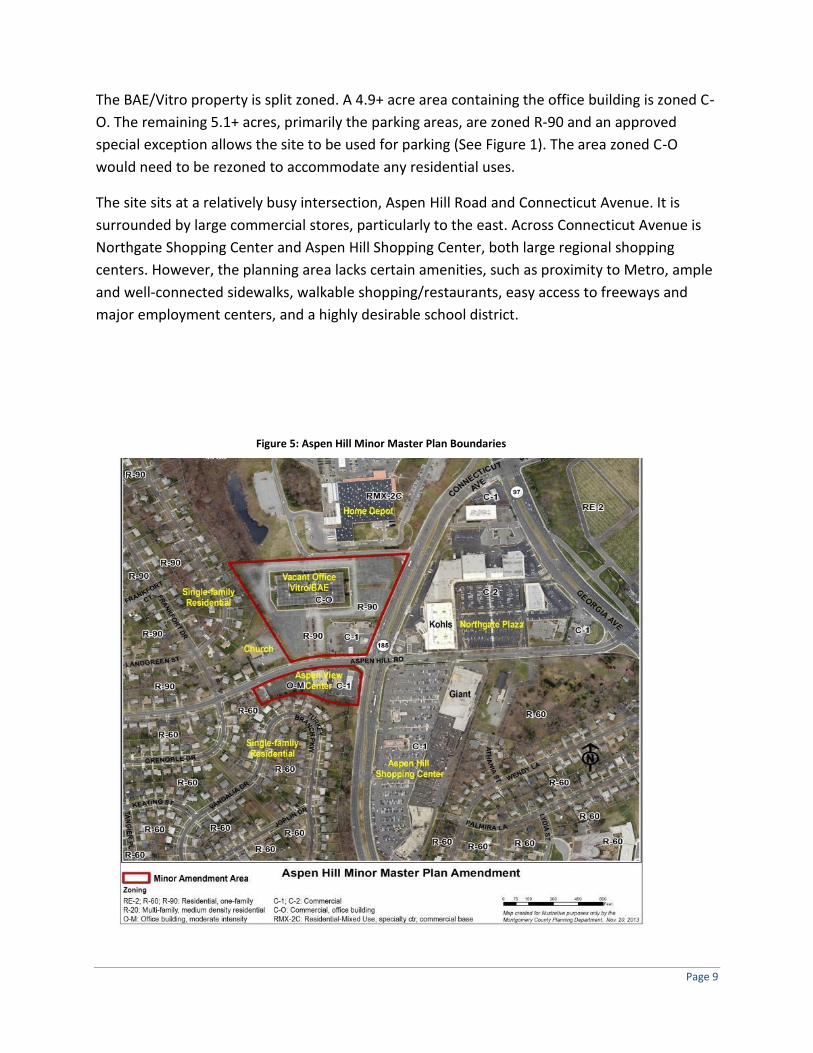
Page 9
The BAE/Vitro property is split zoned. A 4.9+ acre area containing the office building is zoned C-
O. The remaining 5.1+ acres, primarily the parking areas, are zoned R-90 and an approved
special exception allows the site to be used for parking (See Figure 1). The area zoned C-O
would need to be rezoned to accommodate any residential uses.
The site sits at a relatively busy intersection, Aspen Hill Road and Connecticut Avenue. It is
surrounded by large commercial stores, particularly to the east. Across Connecticut Avenue is
Northgate Shopping Center and Aspen Hill Shopping Center, both large regional shopping
centers. However, the planning area lacks certain amenities, such as proximity to Metro, ample
and well-connected sidewalks, walkable shopping/restaurants, easy access to freeways and
major employment centers, and a highly desirable school district.
Figure 5: Aspen Hill Minor Master Plan Boundaries

Page 10
SECTION 2: ECONOMIC AND MARKET OVERVIEW A residential market analysis typically addresses the appropriate scale and type of residential
development for a site. However, this study just looks at the feasibility of townhouse
development. This is because townhouses were determined to be the most compatible, given
surrounding land uses and because they can serve as a transitional land use between the
shopping centers to the east and single family homes to the west.
Section 2a: Demographic and Economic Assessment
The demographic and economic assessment looks at households, age, incomes, and Tapestry
Segments®1 in the two primary zip codes (20853, 20906) comprising Aspen Hill (the “Trade
Area”). Zip codes were used to define the Trade Area for two reasons:
Residential sales information is organized by zip code
To highlight the difference in the composition and characteristics between the zip
codes, which may lend support to different residential market opportunities.
While new development at the site may draw residents from Montgomery County and the Washington,
D.C. metro area, the Trade Area is the best indicator of trends, characteristics, and consumer
preferences that can be used to identify potential housing prices and the scale of development.
Trade Area
While land uses in both zip codes (see Figure
2) are primarily residential and retail, there
are significant differences between the two.
There is considerably less retail in 20853 than
in 20906, which contains the majority of
shopping centers in Aspen Hill. Additionally,
residential in 20853 contains higher priced
single family detached homes and fewer
attached units or condominiums than 20906.
The school districts in 20853 are also
considered more desirable; contributing to
the higher home prices. Lastly, Leisureworld, a
large, age-restricted community, is in 20906,
which adds a large senior population.
1 Community Tapesttry Segments are an ESRI trademarked classification system based on labor force
characteristics, median income, age, spending habits, etc. to categorize neighborhoods.
Figure 2: Trade Area (Zip Codes)

Page 11
Summa ry 2 0 13 2 0 18 Annua l
Growth 2 0 13 -
2 0 18
% Annua l
Growth
(2 0 13 - 2 0 18 )
Summa ry 2 0 13 2 0 18 Annua l
Growth 2 0 13
- 2 0 18
% Annua l
Growth
(2 0 13 - 2 0 18 )
Population 29,963 31,334 274 0.9% Population 49,345 52,269 585 1.2%
Households 9,782 10,193 82 0.8% Households 16,351 17,263 182 1.1%
Families 7,612 7,895 57 0.7% Families 11,218 11,749 106 0.9%
Average Household
Size
3.05 3.06 Average Household Size 2.99 3.00
Owner Occupied
Housing Units
8,287 8,67578 0.9%
Owner Occupied
Housing Units
10,840 11,570146 1.3%
Renter Occupied
Housing Units
1,495 1,5185 0.3%
Renter Occupied
Housing Units
5,511 5,69336 0.7%
Median Age 42.0 42.8 Median Age 36.1 37.1
Table 1: Population Growth in Trade Area
Source: ESRI Business Analyst Online
Zip Code 20853 Zip Code 20906
Populations/Households
In 2013 the population for zip code 20853 was 29,963 (9,782 households), while for 20906 it
was 49,345 (16,351 households). Household growth from 2013 – 2018 is expected to increase
annually in zip codes 20853 and 20906, about 0.9% and 1.2% respectively. This is
commensurate with the growth rate during the same period for Montgomery County as a
whole (1.1%). See Table 1.
Household Age and Income Distribution
Age and income distribution were evaluated for the Trade Area, since different age groups
generally prefer different types of residential units at differing prices. For example, the
Leesborough townhome community, located one half mile north of the Wheaton Metro
Station, offers townhomes to a primary market that includes singles, newlyweds, and one
parent families. Since townhomes are usually two stories or higher, they are less appealing to
seniors (65+) since they create mobility challenges.
In 2013 median ages for zip codes 20853 and 20906 were 42.0 and 36.1 respectively (see Table
2). Zip code 20906 had a slightly younger population, most likely because of more multifamily
and less expensive residential units. However, the population in both zip codes was fairly well
distributed. No age group represented more than 15% of the population, although the
demographic composition can generally be characterized as families with children, as well as
seniors. Families and seniors generally do not find townhomes a desirable housing choice.
However, the groups that would – singles and newlyweds (25-34 years) – are projected to
decrease over the next five years.
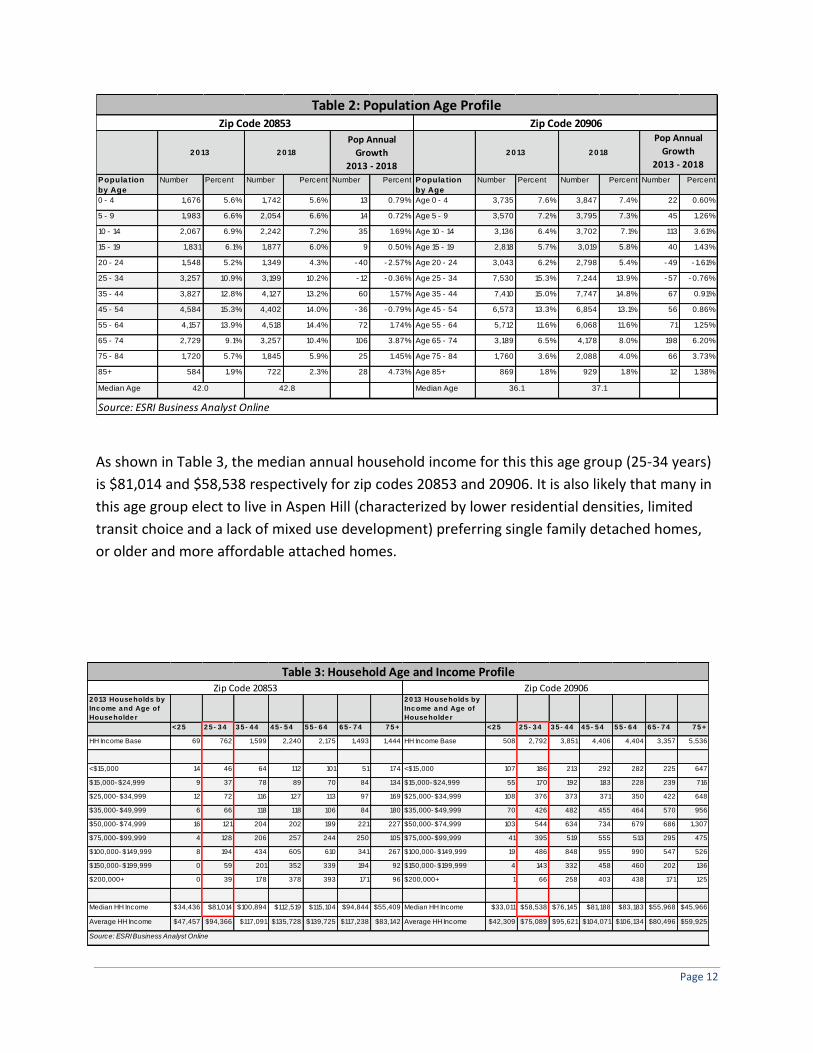
Page 12
Popula tion
by Age
Number Percent Number Percent Number Percent Popula tion
by Age
Number Percent Number Percent Number Percent
0 - 4 1,676 5.6% 1,742 5.6% 13 0.79% Age 0 - 4 3,735 7.6% 3,847 7.4% 22 0.60%
5 - 9 1,983 6.6% 2,054 6.6% 14 0.72% Age 5 - 9 3,570 7.2% 3,795 7.3% 45 1.26%
10 - 14 2,067 6.9% 2,242 7.2% 35 1.69% Age 10 - 14 3,136 6.4% 3,702 7.1% 113 3.61%
15 - 19 1,831 6.1% 1,877 6.0% 9 0.50% Age 15 - 19 2,818 5.7% 3,019 5.8% 40 1.43%
20 - 24 1,548 5.2% 1,349 4.3% - 40 - 2.57% Age 20 - 24 3,043 6.2% 2,798 5.4% - 49 - 1.61%
25 - 34 3,257 10.9% 3,199 10.2% - 12 - 0.36% Age 25 - 34 7,530 15.3% 7,244 13.9% - 57 - 0.76%
35 - 44 3,827 12.8% 4,127 13.2% 60 1.57% Age 35 - 44 7,410 15.0% 7,747 14.8% 67 0.91%
45 - 54 4,584 15.3% 4,402 14.0% - 36 - 0.79% Age 45 - 54 6,573 13.3% 6,854 13.1% 56 0.86%
55 - 64 4,157 13.9% 4,518 14.4% 72 1.74% Age 55 - 64 5,712 11.6% 6,068 11.6% 71 1.25%
65 - 74 2,729 9.1% 3,257 10.4% 106 3.87% Age 65 - 74 3,189 6.5% 4,178 8.0% 198 6.20%
75 - 84 1,720 5.7% 1,845 5.9% 25 1.45% Age 75 - 84 1,760 3.6% 2,088 4.0% 66 3.73%
85+ 584 1.9% 722 2.3% 28 4.73% Age 85+ 869 1.8% 929 1.8% 12 1.38%
Median Age Median Age
Table 2: Population Age Profile
Source: ESRI Business Analyst Online
42.0 42.8 36.1 37.1
2 0 13 2 0 18 2 0 13 2 0 18
Pop Annual
Growth
2013 - 2018
Pop Annual
Growth
2013 - 2018
Zip Code 20906Zip Code 20853
2 0 13 House holds by
Inc ome a nd Age of
House holde r
2 0 13 House holds by
Inc ome a nd Age of
House holde r
<2 5 2 5 - 3 4 3 5 - 4 4 4 5 - 5 4 5 5 - 6 4 6 5 - 7 4 7 5 + <2 5 2 5 - 3 4 3 5 - 4 4 4 5 - 5 4 5 5 - 6 4 6 5 - 7 4 7 5 +
HH Income Base 69 762 1,599 2,240 2,175 1,493 1,444 HH Income Base 508 2,792 3,851 4,406 4,404 3,357 5,536
<$15,000 14 46 64 112 101 51 174 <$15,000 107 186 213 292 282 225 647
$15,000- $24,999 9 37 78 89 70 84 134 $15,000- $24,999 55 170 192 183 228 239 716
$25,000- $34,999 12 72 116 127 113 97 169 $25,000- $34,999 108 376 373 371 350 422 648
$35,000- $49,999 6 66 118 118 106 84 180 $35,000- $49,999 70 426 482 455 464 570 956
$50,000- $74,999 16 121 204 202 199 221 227 $50,000- $74,999 103 544 634 734 679 686 1,307
$75,000- $99,999 4 128 206 257 244 250 105 $75,000- $99,999 41 395 519 555 513 295 475
$100,000- $149,999 8 194 434 605 610 341 267 $100,000- $149,999 19 486 848 955 990 547 526
$150,000- $199,999 0 59 201 352 339 194 92 $150,000- $199,999 4 143 332 458 460 202 136
$200,000+ 0 39 178 378 393 171 96 $200,000+ 1 66 258 403 438 171 125
Median HH Income $34,436 $81,014 $100,894 $112,519 $115,104 $94,844 $55,409 Median HH Income $33,011 $58,538 $76,145 $81,188 $83,183 $55,968 $45,966
Average HH Income $47,457 $94,366 $117,091 $135,728 $139,725 $117,238 $83,142 Average HH Income $42,309 $75,089 $95,621 $104,071 $106,134 $80,496 $59,925
Source: ESRI Business Analyst Online
Zip Code 20853 Zip Code 20906
Table 3: Household Age and Income Profile
As shown in Table 3, the median annual household income for this this age group (25-34 years)
is $81,014 and $58,538 respectively for zip codes 20853 and 20906. It is also likely that many in
this age group elect to live in Aspen Hill (characterized by lower residential densities, limited
transit choice and a lack of mixed use development) preferring single family detached homes,
or older and more affordable attached homes.

Page 13
Community Tapestry Segments
ESRI Business Analyst Online uses information such as labor force characteristics, median
income, age, and spending habits to categorize demographic information according to a
trademarked Community Tapestry classification system2. These tapestries provide insights into
the housing and shopping preferences of Trade Area residents and can help inform the types of
residential units that may be successful. The Community Tapestry Segments that characterize
zip codes 20853 and 20906 include: Wealthy Seaboard Suburbs; The Elders, Connoisseurs; and
Pleasant-Ville.
Wealthy Seaboard Suburbs, representing 27.8% of all households in zip codes 20853 and
11.0% in 20906 are generally described as older and more affluent. More than half work
in professional or management positions and their median net worth is more than four
times the U.S. median. Three fourths live in homes built before the 1970’s and 89
percent of Wealthy Seaboard Suburbs households live in single family homes. Slow to
change, they are the least likely to have moved in the last five years.
The Elders represents 20.4% of all households in zip code 20906. Their median age is
73.2, and most are married with no children living at home, or single. Most are on a
fixed income, receive Social Security benefits, and have a median household income of
$42,293. They favor communities designed for senior living or with a large share of
2 Community Tapestry segments descriptions provide national characteristics of the groups rather than Aspen Hill
specific data.
Ta pe stry Se gme nt Pe rc e nt Cumula tive
Pe rc e nt
Pe rc e nt Cumula tive
Pe rc e nt
Inde x
05. Wealthy Seaboard Suburbs 27.8% 27.8% 1.4% 1.4% 1,980
03. Connoisseurs 26.5% 54.3% 1.3% 2.7% 2,111
10. Pleasant- Ville 20.1% 74.4% 1.6% 4.3% 1,237
43. The Elders 20.4% 20.4% 0.6% 0.6% 3,178
05. Wealthy Seaboard Suburbs 11.0% 31.4% 1.4% 2.0% 783
10. Pleasant- Ville 10.4% 41.8% 1.6% 3.6% 636
Source: ESRI Business Analyst Online
Table 4: Community Tapestry SegmentationZip Code (20853)
Zip Code (20906)
House holds U.S . House holds

Page 14
seniors. Residential choice is mixed; half reside in single family homes, one-third in
multiunit buildings, and 17 percent in mobile homes.
Connoisseurs, representing 26.5% of the households in zip code 20853 are somewhat
older; being closer to retirement than child-rearing age. Of these, 64% hold a bachelor
or graduate degree and are in high paying management, professional, and sales jobs;
although many are self-employed. Their median net worth is nearly 7 times the national
average. The neighborhoods they live in are usually slow growing, established, and
affluent. Most live in single family homes built before 1970.
Pleasant-Ville represents 20.1% and 10.1% of the households in zip codes 20853 and
20906, respectively. They are characterized as middle-aged, married couples, and nearly
40 percent of the households have children. Labor force participation is above average
and employed residents work in diverse industry sectors, similar to U.S. distributions.
These households live in single family homes, with nearly half built between 1950 and
1970. They enjoy where they live; two-thirds have lived in the same house since 1995.
These Tapestry Segments typically have a preference for single family housing and are
disinterested in moving, or downsizing or upsizing their homes. These preferences suggest
weak market support within the Trade Area for townhouse development on the BAE/Vitro site.
For a townhome development to move forward it would likely need to:
Capture residents outside Aspen Hill.
Be priced lower than comparable townhome developments (in areas with greater
market support, such as Rockville or Wheaton).
Be smaller scale so that inventory does not exceed market demand.
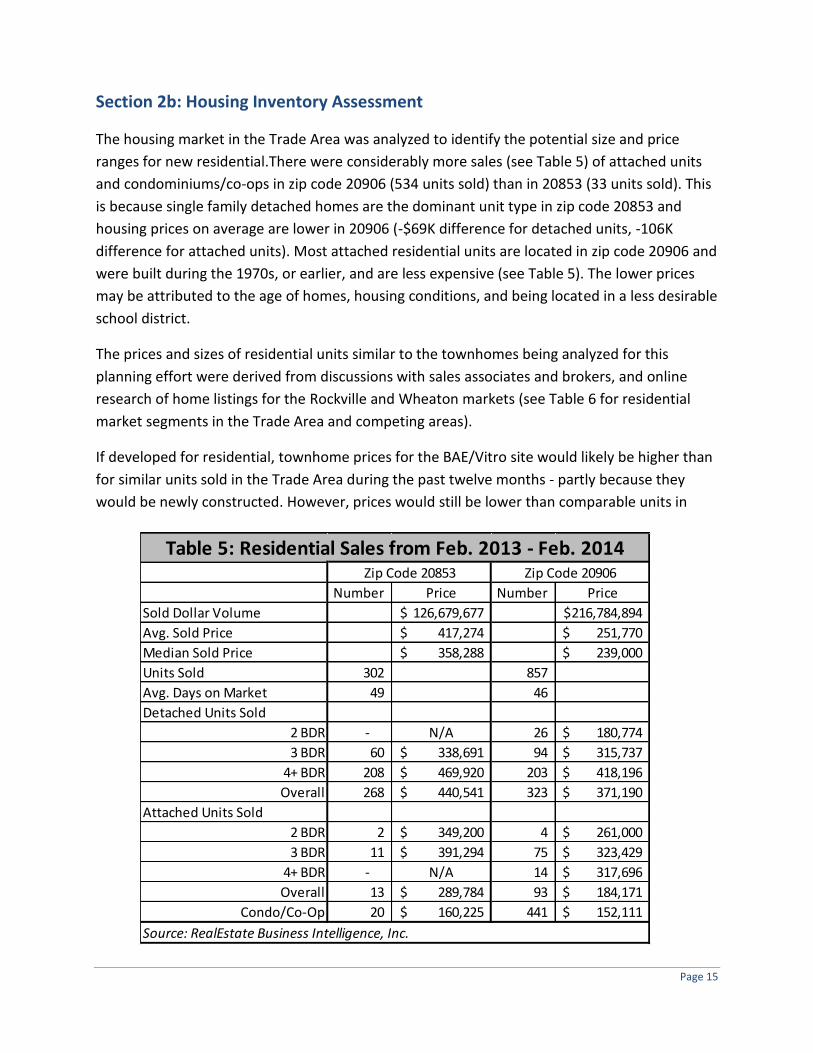
Page 15
Section 2b: Housing Inventory Assessment
The housing market in the Trade Area was analyzed to identify the potential size and price
ranges for new residential.There were considerably more sales (see Table 5) of attached units
and condominiums/co-ops in zip code 20906 (534 units sold) than in 20853 (33 units sold). This
is because single family detached homes are the dominant unit type in zip code 20853 and
housing prices on average are lower in 20906 (-$69K difference for detached units, -106K
difference for attached units). Most attached residential units are located in zip code 20906 and
were built during the 1970s, or earlier, and are less expensive (see Table 5). The lower prices
may be attributed to the age of homes, housing conditions, and being located in a less desirable
school district.
The prices and sizes of residential units similar to the townhomes being analyzed for this
planning effort were derived from discussions with sales associates and brokers, and online
research of home listings for the Rockville and Wheaton markets (see Table 6 for residential
market segments in the Trade Area and competing areas).
If developed for residential, townhome prices for the BAE/Vitro site would likely be higher than
for similar units sold in the Trade Area during the past twelve months - partly because they
would be newly constructed. However, prices would still be lower than comparable units in
Number Price Number Price
Sold Dollar Volume 126,679,677$ 216,784,894$
Avg. Sold Price 417,274$ 251,770$
Median Sold Price 358,288$ 239,000$
Units Sold 302 857
Avg. Days on Market 49 46
Detached Units Sold
2 BDR - N/A 26 180,774$
3 BDR 60 338,691$ 94 315,737$
4+ BDR 208 469,920$ 203 418,196$
Overall 268 440,541$ 323 371,190$
Attached Units Sold
2 BDR 2 349,200$ 4 261,000$
3 BDR 11 391,294$ 75 323,429$
4+ BDR - N/A 14 317,696$
Overall 13 289,784$ 93 184,171$
Condo/Co-Op 20 160,225$ 441 152,111$
Source: RealEstate Business Intelligence, Inc.
Zip Code 20853 Zip Code 20906
Table 5: Residential Sales from Feb. 2013 - Feb. 2014

Page 16
Rockville and Wheaton. This is primarily because the Plan area lacks amenities normally
expected by residents; in this case singles, newlyweds, and one parent households. Such
amenities include a nearby Metro station, ample and well-connected sidewalks, walkable
shopping/restaurants, good access to freeways and major employment centers, and desirable
school districts.
Based on comparable sales information (see Table 6), past sales data, and the capitalized value
of monthly payments affordable to the expected group of buyers3, an appropriate average unit
size for a townhouse on the BAE/Vitro site should be around 1,800 square feet (SF), and the
price per square foot (PSF) can be conservatively estimated to be between $208 - $226.
Average unit size is slightly lower than comparison neighborhoods, in order to mitigate costs in
a weaker market. The PSF is approximately 10% lower than for Wheaton North, the most
comparable neighborhood based on proximity. These estimates would generate a per unit price
between $375,000 and $407,000, which would be affordable to expected buyers. In particular,
this type of unit may appeal to a more budget conscious buyer looking for a more affordable
townhouse style residence.
3 Assume 30% of annual income from 25-34 age group in zip codes 20853 and 20906. Capitalized value derived
from amortized monthly payments using a 30-year, fixed rate mortgage at 5% interest.
Table 6: Attached Housing Price Ranges
Avg. Size
(SF)
Avg.
Price (Per
SF) Avg. Price
Rockville (west of I-270) 2,127 $332 $706,164
Wheaton (near Metro) 2,069 $213 $440,697
Wheaton North (closer to Aspen
Hill) 1,831 $241 $441,271
Past Sales Data (in 20906)
$150,000 -
$323,000
Townhome Affordability Factors (Based on household incomes of 25-34
age group in Trade Area. See Table 3)
$300,000 -
$415,000
Source: Zillow, Allan and Rocks, Leesborough Townhomes

Page 17
Section 2c: Project Scale / Market Absorption
While this study helps gauge the potential to redevelop the BAE/Vitro site for residential and
determine the number of units that could be supported by the market, it does so as an
informed estimate. The estimate is based on observations of market demand and additional
factors that may affect development scale. Should a residential option for the site proceed,
these factors, including competition from similar townhome developments in the pipeline or
under construction (limited in Aspen Hill) and financing that a developer can obtain based on
credit or prevailing interest rates, may require further investigation.
The methodology to estimate the number of supportable residential units is based on the
following:
Demand for townhouses from three primary buyers:
Singles
Newlyweds
One-parent families with children4
Demand from nearby Rockville and Wheaton, which also have comparable townhouse developments and compete for similar buyers.
Demand from people relocating within Montgomery County. About 20% of Montgomery County households will annually relocate based on a national home tenure of five years.
Capture rates (how many new households and transfers a development can “capture” compared to projects elsewhere in the metro area). Capture rates are largely based on proximity of new housing to concentrations of households and competition from similar development.
4 Singles, newlyweds, and one-parent families derived from data trends and ratios in 2010 U.S. Census

Page 18
Annual household capture estimates for the BAE/Vitro site are presented in Table 7.
A key group of potential home buyers, new single and newlywed households are not expected
to significantly grow over the next five years (see Table 2), affecting demand. In addition,
competition from townhomes with better amenities in Rockville and Wheaton further helps
limit development potential. Consequently, fewer than ten new households are expected to be
captured annually. Therefore, demand would be primarily generated by in-County transfers and
relocations. In total, approximately 50 residential units could annually be absorbed by
BAE/Vitro site development.
Typically, a developer will plan to sell out a project within 1.5 years to avoid increased risk and
carrying costs. A longer time frame may also make it less attractive for financing. Based on
these assumptions a residential development program is estimated to be 70-80 market-rate
units (50 x 1.5 = 75 unit average). An additional 9-10 Moderately Priced Dwelling Units (MPDU)
will be added to the development program, resulting in a total development program of 79-90
total units.5 The MPDU program stems from a regulatory policy that mandates affordable
housing in conjunction with residential development.
5 Per DHCA policy, MPDUs represent an additional 12.5% of total number of market rate units.
Table 7: Annual Household Demand (On-Site)
New Households (Aspen
Hill, Rockville, Wheaton)
Existing Household
Relocations (Montgomery
County) TOTAL
Singles 6 16 22
Newlyweds 1 5 6
One-Parent
Households 2 20 22
Total 9 41 50
Source: U.S. Census, ESRI Business Solutions
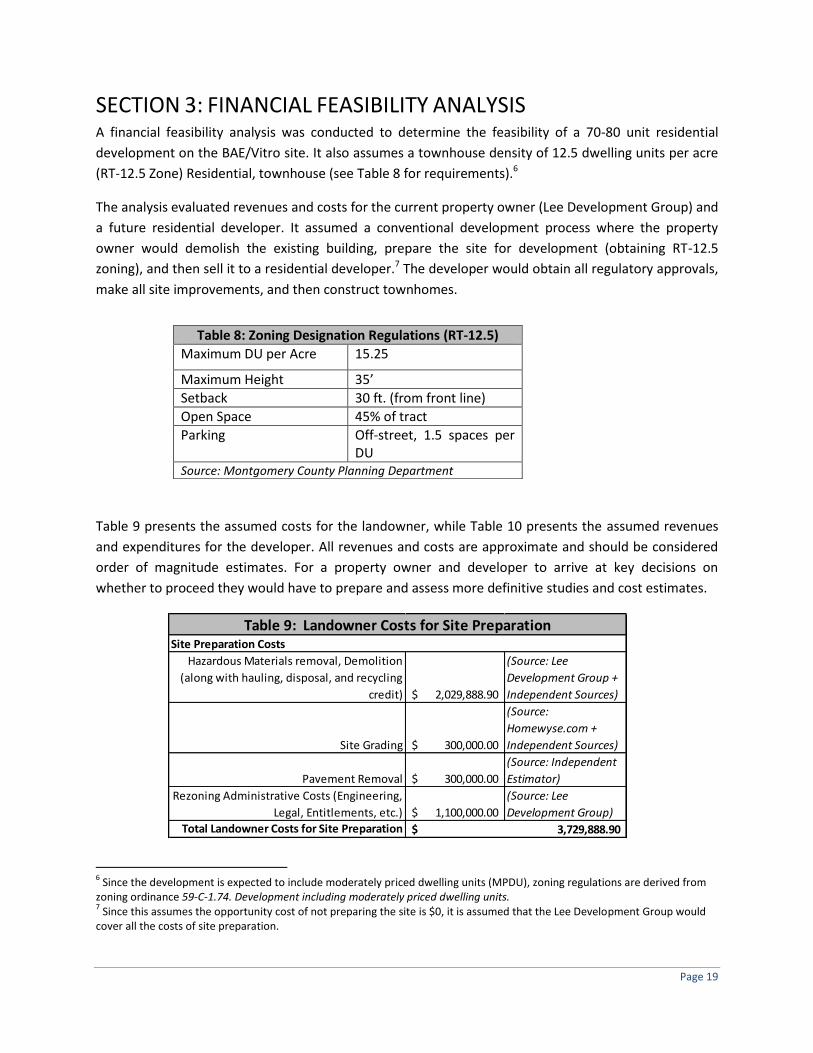
Page 19
Hazardous Materials removal, Demolition
(along with hauling, disposal, and recycling
credit) 2,029,888.90$
(Source: Lee
Development Group +
Independent Sources)
Site Grading 300,000.00$
(Source:
Homewyse.com +
Independent Sources)
Pavement Removal 300,000.00$
(Source: Independent
Estimator)
Rezoning Administrative Costs (Engineering,
Legal, Entitlements, etc.) 1,100,000.00$
(Source: Lee
Development Group)
Total Landowner Costs for Site Preparation
Site Preparation Costs
3,729,888.90$
Table 9: Landowner Costs for Site Preparation
SECTION 3: FINANCIAL FEASIBILITY ANALYSIS A financial feasibility analysis was conducted to determine the feasibility of a 70-80 unit residential
development on the BAE/Vitro site. It also assumes a townhouse density of 12.5 dwelling units per acre
(RT-12.5 Zone) Residential, townhouse (see Table 8 for requirements).6
The analysis evaluated revenues and costs for the current property owner (Lee Development Group) and
a future residential developer. It assumed a conventional development process where the property
owner would demolish the existing building, prepare the site for development (obtaining RT-12.5
zoning), and then sell it to a residential developer.7 The developer would obtain all regulatory approvals,
make all site improvements, and then construct townhomes.
Table 9 presents the assumed costs for the landowner, while Table 10 presents the assumed revenues
and expenditures for the developer. All revenues and costs are approximate and should be considered
order of magnitude estimates. For a property owner and developer to arrive at key decisions on
whether to proceed they would have to prepare and assess more definitive studies and cost estimates.
6 Since the development is expected to include moderately priced dwelling units (MPDU), zoning regulations are derived from
zoning ordinance 59-C-1.74. Development including moderately priced dwelling units. 7 Since this assumes the opportunity cost of not preparing the site is $0, it is assumed that the Lee Development Group would
cover all the costs of site preparation.
Table 8: Zoning Designation Regulations (RT-12.5)
Maximum DU per Acre 15.25
Maximum Height 35’
Setback 30 ft. (from front line)
Open Space 45% of tract
Parking Off-street, 1.5 spaces per DU
Source: Montgomery County Planning Department

Page 20
Section 3a: Landowner Costs
The cost to prepare the site for residential development is estimated to be approximately $3.5 -
$4.0 million. This includes remediating hazardous materials (asbestos, lead based paint, etc.);
building demolition, hauling, and disposing of or recycling debris; site clearing and pavement
removal; and site grading (assuming an earthwork balance).8
The analysis further assumes the landowner would secure a rezoning and all entitlements,
market the site, and sell it for the current assessed land value. It should be noted that the Vitro
property owner has indicated they have no plans to sell the property in the foreseeable future.
8 Assumes soil is not hauled into or from the site, which could increase costs considerably.

Page 21
Low Estimate High Estimate Source
Number of Units 70 80
Average Price PSF $208 $226
Average Unit Size (2 Floor Townhouse) 1,800 1,800
MPDU Number of Units 9 10 (DHCA)
MPDU Price Per Unit $150,000 $180,000 (DHCA)
MPDU Unit Size (2 Floor Townhouse) 1,500 1,500 (DHCA)
Total Building Development (SF) 139,125 159,000
Total Building Footprint (SF) 69,563 79,500
Total Potential Revenue $27,520,500 $34,344,000
Land Acquisition Cost Low Estimate High Estimate Source
Assessed Value of Site $10,098,800 $10,098,800 (County GIS Department)
Total Land Acquisition Cost $10,098,800 $10,098,800
Development Cost Low Estimate High Estimate Source
Building Construction (@ $140 PSF) $19,477,500 $22,260,000 (RS Means)
Repaving (70% of non-building footprint)
*Includes surface parking at 1.5 per DU* $714,279 $694,956
(Independent Estimator at
$25/SY)
On-Site Open Space & Landscaping (30% of non-
building footprint as concrete walkways,
bermuda grass, garden landscaping) $492,240 $478,924
(Homewyse, MNCPPC DR
Historic Information
Utilities (Electric) $80,000 $80,000
(MNCPPC DR Historic
Information)
Utilities (Gas) $120,000 $120,000
(MNCPPC DR Historic
Information)
Utilities (Sanitary Sewer + Water) $500,000 $500,000
(MNCPPC DR Historic
Information)
Utilities (Stormwater) $250,000 $250,000
(MNCPPC DR Historic
Information)
Amenities and Off-Site Improvements $300,000 $300,000
Planning, Design, Approvals, Contingency, and
Soft Costs (25% of Hard Costs) $5,483,505 $6,170,970
Marketing (6.0% of sales) $1,651,230 $2,060,640 (Urban Land Institute)
Administration and contingency (6.0% of sales) $1,651,230 $2,060,640 (Urban Land Institute)
Financing Cost (2% of Loan) $816,376 $901,499
Developer Hurdle Rate (i.e. Rate of Return) @
20% of equity @ 75% Loan To Value ratio $2,040,939 $2,253,747
Total Development Cost $33,577,299 $38,131,375
Low Estimate High Estimate
Total Project Cost (Land Acquisition +
Development Cost) $43,676,099 $48,230,175
Funding Gap ($16,155,599) ($13,886,175)
Table 10: Residential Developer SummaryDevelopment Revenue
Expenditures

Page 22
Section 3b: Developer Revenues and Costs
The following describes and considers both revenues (residential sales), and expenditures (land
acquisition, building construction, site improvement, infrastructure, marketing, and financing
costs) associated with the development of a townhouse project on the BAE/Vitro site.
Developer Revenues
The analysis assumes 79-90 townhome units9, comprised of 70-80 market rate and 9-10
Moderately Priced Dwelling Units (MPDUs). Based on discussions with Montgomery County’s
Department of Housing and Community Affairs, the MPDUs are expected to sell from $150,000
- $180,000.10 11 The potential revenues under this program may be approximately $27.5 - $34.3
million (see Table 10).
Developer Expenditures
Expenditures are divided between land acquisition costs ($10.1 million), and development costs
(see Table 10). In addition, a developer would anticipate financing the project for 75% of the
total cost of development and acquisition, and require a 20% “cash-on-cash” return on the total
project investment (i.e. 20% of developer equity, which is represented as 25% of the total cost
of development and acquisition). Total development costs are estimated to be $33 - $38
million, while total project cost (acquisition + development costs) is estimated to be $43 - $48
million. Such an imbalance would result in a project funding gap of approximately $14 - $16
million (see Table 10).
9 All units assume 2-story townhome with 2 baths, fireplace, upgraded kitchen, no basement, and no garage. Parking provided via surface parking at 1.5 spaces per DU. 10 Approximate estimates from Lisa Schwartz, Senior Planning Specialist, DHCA. 11 Due to MPDUs priced significantly below the market, 100% of the MPDUs are assumed to be absorbed independent of market forces.

Page 23
SECTION 4: CONCLUSION
Given an estimated funding gap of $14-$16 million, the analyses would indicate that a
townhome development on the BAE/Vitro site – in balance with market supply and demand
factors – is not economically feasible without some type of subsidy. Based on the financial
model and assumptions, a profitable and economically feasible project would require
considerably more units; approximately 270-300 units for revenues to exceed expenditures.12
This scale of development would not only exceed expected market demand, but it may also be
difficult to meet the zoning standard that requires 40% of a site to remain as open space.
Although townhome demand in the Trade Area is limited, and prices are expected to be lower
than comparable developments elsewhere in Montgomery County, opportunities to
complement residential with other uses may provide enhanced value. More in-depth studies
that consider a mix of residential, commercial/retail and other uses on the property may be
warranted. However, all development scenarios should carefully consider factors such as
compatibility with surrounding land uses, project phasing/staging that evolve with the market,
and the interests and intentions of the property owner.
12
This assumes keeping the price per unit constant, assumes a decrease in soft costs as a percentage of hard costs (currently 25%) due to economies of scale, and assumes additional costs for utility connections.

Page 24
Retail Feasibility Study

Page 25
ASPEN HILL MINOR MASTER PLAN AMENDMENT
Retail Feasibility Study RESEARCH & SPECIAL PROJECTS DIVISION Montgomery County Planning Department April 15, 2014
INTRODUCTION This report was prepared in support of the Aspen Hill Minor Master Plan Amendment and it
assesses the market potential for retail uses within the Minor Amendment area. It is aimed at
addressing two key concerns:
Determining the amount of unmet retail demand within the Aspen Hill trade area, and
consequently, the type of retail space that could be supported.
The impact to existing retailers from new retail development on the Vitro site, which
could potentially undermine existing businesses and create vacancies in nearby
shopping centers.
METHODOLOGY AND ASSUMPTIONS This analysis seeks to determine the economic feasibility for retail development in the Minor
Amendment area by assessing the overall retail market in Aspen Hill. In order to quantify the
amount of new retail space that could be supported, annual retail expenditures by residents
(demand) were compared to estimated retail sales from businesses (supply). Those sales not
captured represent the retail gap or “leakage”, which could be used to support additional retail
development.
The analysis evaluated retail market potential among all retail categories and in accordance
with surrounding land uses identified the potential type of retail and its format, which could be
supported by the findings. The Minor Master Plan Application (MMPA) submitted by the Vitro
property owner in 2012 that triggered this larger planning effort states that a prospective
tenant is interested in building a 118,000 square foot (SF) big-box department store on the
Vitro site; with a roughly equivalent mix between general merchandise and groceries. This
report also evaluates the economic viability of this scenario.

Page 26
ASPEN HILL RETAIL SPACEYear end 2013
Source: CoStar
Retail Inventory Aspen Hill Montgomery County
Buildings 52 2,255
Existing SF 1,262,028 39,652,767
Under Construction SF - 370,468
Retail Leasing Aspen Hill Montgomery County
NNN Rent Per SF $26.51 $25.09
Vacant SF 73,793 1,720,544
Vacancy Rate 5.8% 4.3%
Shopping Centers in Aspen HillCommunity and Neighborhood Centers located in the Aspen Hill Planning Area
SOURCE: CoStar; Montgomery County Planning Department
Center name Center type Year built Retail GLA Leased Anchors Anchor sf
Aspen Hill Shopping Center Community Center 1962 170,499 98% Giant Food 54,000
Northgate Plaza Shopping Center Community Center 1960 158,410 98% Kohl’s 36,700
Plaza del Mercado* Neighborhood Center 1969 104,232 64% CVS 14,999
Rock Creek Village Center Community Center 1968 103,075 100% Safeway 48,262
Leisureworld Plaza Neighborhood Center 1986 94,712 96% Giant Food 55,425
Aspen Manor Neighborhood Center 1971 76,467 100% AutoZone 7,547
Aspen Manor Shopping Center Neighborhood Center 1954 72,769 100% Lotte Supermarket 24,692
* Former 25,000 sf Giant Food store closed in 2011; anchor space has not been relet.
EXISTING RETAIL ASSESSMENT Retail inventory
Aspen Hill’s existing commercial base overwhelmingly consists of big-box retail and shopping
plazas. Roughly 1.26 million square feet of retail space is contained in 52 buildings within the
Aspen Hill Master Plan Area. Of this amount, around 74,000 square feet (5.8 percent) was
vacant as of the end of 2013. Most of the area’s shopping centers were built before 1970.
Occupancy rates are high, between 96 percent and 100 percent in most centers. The exception
is Plaza del Mercado, which accounts for nearly half of Aspen Hill’s vacant retail space13.
13
NNN rent, or “Triple Net” rent, represents the rental rate where the tenant is responsible for all costs relating to the asset being leased, such as real estate taxes, net building insurance, and net common area maintenance.

Page 27
Retail market activity
Retail space in the Aspen Hill market is generally stable. No new retail space has come on line in
the past decade. With a fixed inventory and steady demand, retail occupancy rates and average
asking rents in the area have been relatively high, compared to the County as a whole. In a
small market such as Aspen Hill store closings or turnovers tend have a more visible impact.
Aspen Hill’s overall retail vacancy rate spiked from 2.5 percent to 12.0 percent in 2011 following
the closure of two area grocery stores. The vacancy rate fell to 4.4 percent in 2012 after Kohl’s
department store replaced the former SuperFresh grocery store in Northgate Plaza, but it has
steadily ticked up since then. One factor is that Plaza del Mercado has not yet secured a new
anchor tenant to replace the 25,000 square foot Giant Food grocery store that closed in 2011
when the company consolidated its Aspen Hill stores. Area vacancies reached 7.7 percent in
2013, potentially putting downward pressure on Aspen Hill rents.

Page 28
Figure 6: PMA for Convenience and Shoppers Goods
PRIMARY TRADE AREA ANALYSIS Primary trade area definitions
The retail market analysis focuses on two Primary Trade Areas (PMAs)
5-Minute Driveshed from the Aspen Hill Vitro Site
10-Minute Driveshed from the Aspen Hill Vitro Site
A Primary Trade Area is the geographic area from which most of a retail establishment’s
customers originate. However, trade areas can differ based on the type of products offered. For
example, the trade area for a convenience good, such as milk, is typically smaller than that for a
shoppers good, or “comparison” good, such as furniture or apparel. The distance a consumer
will travel to buy a gallon of milk is significantly shorter than the travel distance tolerated to buy
a new sofa.
Another factor affecting the trade areas for convenience and shoppers goods is comparison
shopping. To purchase a gallon of milk, one does not need to compare brands or stores. To
purchase furniture, consumers are willing to travel farther to compare various merchandise.
Trade areas are also impacted by competitive retail destinations. A shopping district with little
nearby competition will have a much larger trade area than one with significant regional
competition.
Given the character of the Aspen Hill
commercial environment, as well as
its significant nearby competition, the
PMA for this market study is defined
as a 5-Minute Driveshed for
Convenience Goods and a 15-Minute
Driveshed for Shoppers Goods. While
Shoppers Goods generally have a
larger driveshed – for instance, big-
box retail tends to have a 30 minute
PMA driveshed according to the
Urban Land Institute – a 15-Minute
Driveshed was defined for this study
given the considerable retail
competition in the greater
Washington D.C. metro area. A map of

Page 29
the PMAs is presented in Figure 1.
Primary trade area demographics
The table below indicates that there are around 28,405 households and 81,945 residents within
a 5-Minute Driveshed of the Vitro site. Within a 15-Minute Driveshed, there are nearly 174,000
households. The data also show that Aspen Hill’s primary customer base has lower disposable
incomes relative to potential customers in the wider trade area. This suggests that there could
be relatively high demand for price-competitive retail in the area.
5 Minutes 15 Minutes
2013 Population 81,945 468,406
2013 Households by Disposable Income 28,405 173,749
<$15,000 2,390 9,017
$15,000 - $24,999 2,187 7,337
$25,000 - $34,999 3,077 10,969
$35,000 - $49,999 4,001 19,012
$50,000 - $74,999 5,274 26,835
$75,000 - $99,999 3,412 21,089
$100,000 - $149,999 4,956 35,630
$150,000 - $199,999 1,710 20,413
$200,000+ 1,397 23,446
2013 Median Household Income $59,673 $89,708
2013 Average Household Income $81,501 $117,157
2013 Per Capita Income $28,581 $43,701
Table 1: Primary Trade Area Demographic Characteristics
Source: ESRI Business Analyst Online

Page 30
RETAIL SUPPLY AND DEMAND ANALYSIS Retail supply and demand by trade area
This analysis quantifies existing retail demand and supply in the PMA for Convenience Goods
within the 5-Minute Driveshed and Shoppers Goods within the 15-Minute Driveshed. Both
Convenience and Shoppers Goods are organized by the North American Industrial Classification
System (NAICS) codes.
The four principal retail categories under Convenience Goods are: 1.) Food and
Beverage Stores, 2.) Health and Personal Care Stores, 3.) Miscellaneous Store Retailers,
and 4.) Food Service and Drinking Places.
The six principal retail categories under Shoppers Goods are: 1.) Furniture and Home
Furnishings Stores, 2.) Electronics and Appliance Stores, 3.) Building Materials, Garden
Equipment and Supply Stores, 4.) Clothing and Clothing Accessories Stores, 5.) Sporting
Goods, Hobby, Book & Music Stores, and 6.) General Merchandise.
Consumer expenditures (retail potential) provide a measure of household demand for retail
goods and services for different retail categories. Retail sales provide a measure of retail
inventory and supply for the same categories. The retail gap – retail demand minus retail sales –
represents available purchasing power, or retail opportunities.
If supply is greater than demand, the retail market is considered saturated and there is no
surplus demand to support a new store. If estimated spending by area households (demand)
exceeds sales by existing retailers (supply), the area is losing sales to outside retailers. A new
store or an existing store that repositions itself in the market, could try to capture at least a
percentage of those sales.
However, residents will frequently make retail purchases outside their trade area. Examples
include purchases made near one’s place of employment or while traveling, and business
purchases (consumer expenditures above cover only expenditures for personal use). Therefore,
market “capture rates” were derived for each retail category. Capture rates are a measure of
the percentage of household expenditures “captured” from or made within a defined PMA.
Sales not captured represent a retail gap or “leakage” - expenditures that take place outside of
the retail trade area.
Capture rates can vary given certain factors. These include the nature of a retail establishment,
the retail category, the age, quality and variety of merchandise, the customer base, a store’s
competitive position, and whether an establishment caters to local or regional consumers. As a

Page 31
rule, for retail categories where convenience and proximity are essential – such as grocery or
convenience stores – there is a comparatively larger share of sales derived from PMA
households (approximately 60-70%). Categories that draw people regionally – such as furniture
and home furnishings stores – have a smaller share of sales derived from PMA households (with
a high range of 30%-40%).
As shown in the Table 2 above, the retail gap is largest in Food and Beverage Stores (in the
Convenience Goods category) at $60.1 million, and General Merchandise (in the Shoppers
Goods category) at $319.0 million. Based on the large retail gaps in these two categories
suggests that from a market perspective a new big-box retailer selling general merchandise and
groceries (represented as Food and Beverage Stores) could be introduced to the Aspen Hill
market. The relatively large retail gaps in Building Materials/Supply Stores, Clothing and
Accessories Stores, and Food Services and Drinking Places offer potentially additional retail
opportunities.
The current gaps for most retail categories would further indicate that retail development on
the Vitro site is unlikely to adversely affect existing businesses in a significant way. Existing
retailers can still tap the available purchasing power within the PMAs without strictly
competing for existing household expenditures. Any new commercial development on the Vitro
Industry Group
Demand
(Retail Potential)
Supply
(Retail Sales)
Existing Capture
Rate from HH
(assumed) Retail Gap
Food and Beverage Stores $ 168,440,978 $ 88,184,242 75% $ 60,192,552
Health and Personal Care Stores $ 65,026,257 $ 153,136,318 70% $ (61,677,043)
Miscellaneous Store Retailers $ 25,196,427 $ 7,792,905 50% $ 8,701,761
Food Services and Drinking Places $ 95,029,156 $ 38,044,314 65% $ 37,040,147
Furniture and Home Furnishings
Stores $ 158,883,485 $ 184,143,464 25% $ (6,314,995)
Electronics and Appliance Stores $ 195,981,703 $ 172,564,342 35% $ 8,196,076
Building Materials, Garden
Equipment and Supply Stores $ 247,494,338 $ 89,552,975 40% $ 63,176,545
Clothing and Clothing Accessories
Stores $ 467,254,342 $ 296,956,802 20% $ 34,059,508
Sporting Goods, Hobby, Book &
Music Stores $ 187,997,998 $ 153,638,481 30% $ 10,307,855
General Merchandise $ 1,016,006,167 $ 218,539,329 40% $ 318,986,735
Table 2: 2013 Retail Supply and Demand
Convenience Goods (5-Minute Driveshed)
Shoppers Goods (15-Minute Driveshed)
Source: ESRI Business Analyst Online

Page 32
site should, however, be appropriately scaled so as not to create oversupply; especially in
categories with a limited demand (small or negative retail gap).
Supportable retail space
Projections for supportable retail space in the respective PMAs (see Table 3) are provided for
the existing retail environment, using the capture rates and retail gap for each category. Retail
sales gaps for respective categories were divided by sales productivity factors for new
development, based on sales per square foot14 to arrive at supportable space estimates.
Estimates indicate that Aspen Hill would find its greatest support for retail space in the General
Merchandise and Grocery category. Assuming new retail development is not large enough to
cause a supply and demand imbalance, the Vitro site would likely be able to support a big-box
store with an approximately 50/50 mix between General Merchandise and Groceries,
consistent with the minor master plan application. A following calculation demonstrates that
sufficient support likely exists for this store:
14 Sales per square foot were obtained from the Urban Land Institute, Dollars & Centers of Shopping Centers 2008, using the sales PSF factors for regional shopping centers.
Industry Group Retail Gap
PSF
Productivity
Factors
Supportable
SF in PMA
Food and Beverage Stores $ 60,192,552 $ 479 125,663
Health and Personal Care Stores $ (61,677,043) $ 231 (267,579)
Miscellaneous Store Retailers $ 8,701,761 $ 339 25,669
Food Services and Drinking Places $ 37,040,147 $ 470 78,809
Furniture and Home Furnishings Stores $ (6,314,995) $ 302 (20,911)
Electronics and Appliance Stores $ 8,196,076 $ 412 19,893
Building Materials, Garden Equipment
and Supply Stores $ 63,176,545 $ 325 194,389
Clothing and Clothing Accessories
Stores $ 34,059,508 $ 345 98,676
Sporting Goods, Hobby, Book & Music
Stores $ 10,307,855 $ 311 33,144
General Merchandise $ 318,986,735 $ 253 1,260,817
Source: ULI Dollars and Cents of Shopping Centers 2008: Regional Centers
Table 3: Supportable Retail Space in PMA
Convenience Goods (5-Minute Driveshed)
Shoppers Goods (15-Minute Driveshed)

Page 33
*MMPA Application: 118,000 total SF x 50% = 59,000 SF each for General Merchandise and
Groceries*
59,000 SF Grocery Store = 47% of Food and Beverage Store potential (125,663 SF)
59,000 SF General Merchandise = 5% of General Merchandise potential (1,260,817 SF)
Estimates also indicate support, albeit more limited, for Clothing and Clothing Accessories
retailers, Building Materials and Supply Stores, as well as Food Services and Drinking Places.15
Potential retail models for Aspen Hill
This analysis primarily focused on assessing the economic feasibility of retail uses on the Vitro
site, rather than identifying particular store sizes, layouts, or tenants. However, the following
retail formats could be appropriate, given surrounding land uses and market demand:
Big-Box Retail: Big-box retail is a large format retail store ranging from 20,000 – 170,000
SF. The types and mix of goods sold widely varies by store (see Appendix A for big-box
retail characteristics and trends). The area around the Vitro site already includes various
big-box stores, such as Home Depot to the north and Kohl’s across Connecticut Avenue.
These stores are generally large, free-standing, rectangular, single story buildings that sit
in the middle of a parking lot. Many of the retail categories with a potential for
additional sales in the Aspen Hill PMA are commonly served by big-box retail,
particularly General Merchandise, Food and Beverage Stores, and Building Materials and
Supply Stores. Examples of a big-box store with a 50/50 mix between General
Merchandise and Groceries include discount department stores such as a WalMart or
Target Supercenter.
Shopping Plaza: Shopping Plazas usually range from 5,000 SF to over 100,000 SF; with
an open-air layout. Stores are arranged in a row, with a sidewalk in front and are
generally developed as a unit. Shopping Plazas are generally anchored by a big-box
retailer and/or a grocery store. The ancillary retail may vary widely, from dry cleaners
and smaller restaurants (small shopping plazas) to electronic stores, bookstores, and
home improvement stores (larger shopping plazas). The Vitro site could accommodate a
larger shopping plaza; given market demand, with a discount department or grocery
store as the anchor. Smaller, ancillary stores would complement the anchor store,
tapping retail categories with available demand.
15 Supportable Retail Space in PMA estimates apply across the PMA but are not site-specific. Properly sizing site-specific development requires a case-by-case approach, since retail gravitation changes as newer, large-scale retail is
introduced into a market

Page 34
Impacts on Existing Retail
Commercial development of the Vitro site may affect existing businesses differently, depending
on whether the merchandise sold is complementary or competitive with surrounding
businesses.
Potential impact on complementary retail New big-box stores or shopping plazas do not necessarily cause nearby stores to decline. For
example, they may enhance the competitiveness of existing stores that sell similar or
complementary products by increasing the overall number of customers drawn to the area.
Assuming some sort of General Merchandise or Grocery use on the Vitro site, complementary
uses in the vicinity may benefit:
The Vitro site is next to an existing Home Depot, which commonly co-locates with large
discount department stores such as Wal-Mart or Target.
The Vitro site is across from the Northgate shopping center; anchored by Kohl’s and
Michael’s. Neither store typically competes directly with a large discount department
store.
The potential mix of adjacent large format retailers near the BAE/Vitro site could result
in the draw of a power center; with a comparable draw of additional customers that
may enhance nearby existing stores.
Impact on directly competitive retail The most important factor affecting the viability of existing businesses in Aspen Hill is their
ability to attract the same level of consumer expenditures, in their respective trade areas, from
potential customers. This is true whether the Vitro site is developed for retail uses, or not.
Consequently, if demand for Groceries, General Merchandise, or other retail categories is
sufficiently high, as shown by this study, the entrance of a major new competitor could have
minimal adverse economic impacts on existing businesses in Aspen Hill. However, given the
types of potential uses on the Vitro site the following should nevertheless be considered:
Traditional supermarkets within a 5-minute drive time of the study area may be
disadvantaged by the selection, price, and one-stop shopping advantages of a hybrid
discount department store/grocery store. If such advantages are significant, enough to
result in a store closing, the loss of a grocery store anchor could jeopardize the viability
of an existing shopping center. This could in turn impact the viability of other stores,

Page 35
especially those in the center. However, a discount department store with a slightly
scaled-down grocery component could reduce that potential.
Nontraditional supermarkets provide convenience, they have a wider customer base,
and they know the local market well; things that a large format retailer may lack. For
example, Lotte offers a wide selection of international foods at very low prices; the
store also has a different customer base and a wider trade area. Consequently, such a
retailer is less likely to be affected by the arrival of a large grocery store.
While a direct competitor in the discount department store category, the existing K-
Mart is older, less visible from main streets, and does not sell groceries. Without
improvements, K-Mart may experience increased competition and could potentially face
significant economic pressures. If a vacancy results, it could be challenging to find a
similar tenant.

Page 36
APPENDIX A: BIG-BOX RETAIL: CHARACTERISTICS AND TRENDS
The term “big box” describes a wide range of large format retail stores that vary by size, the kinds of items they sell and their main customer base. Big box stores generally fall into four subcategories:
These categories are not necessarily fixed. Big box retailers are continually developing new store models and refining their product mix, target markets and location strategies to respond to changing market conditions and consumer preferences. The following is a brief literature review on characteristics and trends of big-box retail, as well as how big box retailers interact with other retailers.
Big box stores reflect a long term trend toward retail consolidation. Sears and Woolworths are early examples of large format stores and retail chains that gradually displaced many smaller, locally-based businesses. Large scale retailers do not necessarily operate large scale stores. Their key economic advantages as large enterprises—including price, selection, branding, and shared overhead—enable them to achieve comparable market coverage and profitability with smaller, multi-site store formats.
Discount department stores nearly always include food sales, from basic non-perishables to full service grocery stores. The proportion of store area dedicated to food sales has steadily increased since the 1980s, when the major U.S. discount department store chains (Wal-Mart, Kmart and Target) introduced “hypermarkets” combining department store and grocery store formats in one 150,000 square foot or larger superstore. Grocery items generate a higher average sales per square foot compared to general merchandise items ($479 versus $253), but due to low profit margins, groceries are not necessarily a highly lucrative product line. The impetus behind adding grocery sales is because they enable stores to compete on the basis of one-stop shopping convenience, not just price.
Big box stores commonly co-locate with other large retailers. Colocation can benefit a big box retailer by increasing the overall number of customers drawn to an area. Big boxes often are clustered with other large-format retailers in non-competing retail categories. One example is the 250,000 to 1,000,000 square foot “power center” featuring three or more big box retailers in freestanding or in-line configurations. For example, Wal-Mart stores tend to co-locate with large hardware and building supply stores, such as Lowe’s or Home Depot; furniture stores also appear to benefit from proximity to a national discount retailer. If the consumer base is sufficiently large and differentiated, stores selling similar product lines, such as groceries, can
Category Size Range (square feet) Examples
Warehouse clubs 100,000 to 170,000 Costco, Sam’s Club
Discount department store 80,000 to 130,000 Wal-Mart, Kmart, Target
Category killers 20,000 to 120,000 Staples, Home Depot
Outlet stores 20,000 to 80,000 Nordstrom Rack, Burlington Coat Factory

Page 37
coexist with large discount chains by targeting a different market segment. For example, an Aldi supermarket and a forthcoming Wegman’s are adjacent to a Wal-Mart in Germantown, Maryland.
Big boxes also co-locate with smaller retailers by anchoring regional shopping malls or smaller scale community centers. Smaller retailers can survive by fulfilling a retail niche (e.g., offering specialty products, convenience, or a superior customer experience), or by locating in established small scale shopping districts or under-retailed areas. Small businesses that differentiate can survive or even thrive with an increase in traffic generated by a large retailer. Depending on the location, restaurants, specialty food markets and service-oriented retail, such as hair salons, generally are least at risk.
Big box retail formats are evolving. Due to their large footprint, most hypermarkets and power centers built to date are located in auto-oriented rural or suburban settings. Recent trends are forcing retailers and developers to come up with new formats and location strategies since rural and outer suburban markets are largely saturated. More significant is that population growth—and purchasing power—is migrating back to cities and older suburbs. To retain or expand market share, retailers need to follow.
Very large big box store formats do not readily adapt to denser urban environments. Higher land prices, more complex regulations, potential compatibility issues with existing uses, and political opposition make it more challenging to build. Consumer preferences also are more fragmented, making it more difficult to compete primarily on the basis of price and convenience. In large, diverse consumer markets already served by established retailers of all sizes and types, the potential for any new retailer to dominate the market is extremely limited. In such an environment, big box chain retailers can take advantage of localized gaps in retail coverage, but competition will limit their potential trade area and supportable square footage.