Embed Size (px)
Citation preview

2007/2010/2012/2014
Staff Development Comparison Report
By: Andrea Lassiter, Ph.D., primary investigator
Glenn Trussell, student investigator
and the Organizational Effectiveness Research Group
Minnesota State University, Mankato

2 | P a g 2007/2010/2012/2014 Staff Development Survey Comparison
2014 Staff Development Report
This report is part of a system-wide effort to address training and leadership development nee ds for staff among Minnesota State
Colleges and Universities.
Included in this report are the results of the 2014 non-faculty staff development survey. The goal of the staff development surveys is to
examine participation in professional development activities, perceptions of available resources for development, and nee d for
specific types of development opportunities. Results from this report will be used to help MNSCU plan for future staff development
opportunities.
Interpreting Results
Results are presented in tables that include the following:
Percent of employees that selected each response per item.
Total number of employees that selected each response per item.
Total number of employees that answered each item per year.
Percentages are based on number of employees that answered each item. The overall return rate was 3648/7295 or 50%.

3 | P a g 2007/2010/2012/2014 Staff Development Survey Comparison
2007 2010 2012 2014
1. Have you attended any professional /staff development or training activities on your campus or in the Minnesota State Colleges and Universities System in the past year?
Response Percent
Response
Total
Response Percent
Response
Total
Response Percent
Response
Total
Response Percent
Response Total
Yes 82.3% 2776 79.3% 2917 75% 3555 78% 3100
No 17.7% 597 20.7% 763 25% 1193 22% 852
Total 3373 3680 4748 3952
2007 2010 2012 2014
1b. If yes, was this training through: (Check all that apply.)
Response Percent
Response
Total
Response Percent
Response
Total
Response Percent
Response
Total
Response Percent
Response Total
You campus (e.g., new employee orientation, staff professional development days)
85.6% 2343 87.5% 2531 86% 2950 87% 2618
MnSCU system office (e.g. Art and Science of Supervision, Decision Maker Training)
31.0% 847 28.3% 819 33% 1118 30% 921
State of Minnesota, Department of Administration (e.g., Managerial Core, facilitation skills)
9.4% 257 7.5% 218 5% 156 5% 141
Total 2736 2892 3429 3024
2007 2010 2012 2014
2. How many activities have you attended in the past year?
Response
Percent
Response
Total
Response
Percent
Response
Total
Response
Percent
Response
Total
Response Percent
Response Total
None 13.7% 457 17.5% 638 22% 1008 688 18%
1 18.8% 626 21.3% 779 23% 1060 866 22%
2 26.3% 876 24.4% 892 26% 1201 1131 29%
3 16.6% 554 14.6% 533 14% 641 600 15%
4 or more 24.6% 820 22.2% 809 16% 722 620 16%
Total 3333 3651 4632 3905
4 | P a g 2007/2010/2012/2014 Staff Development Survey Comparison
2007 2010 2012 2014
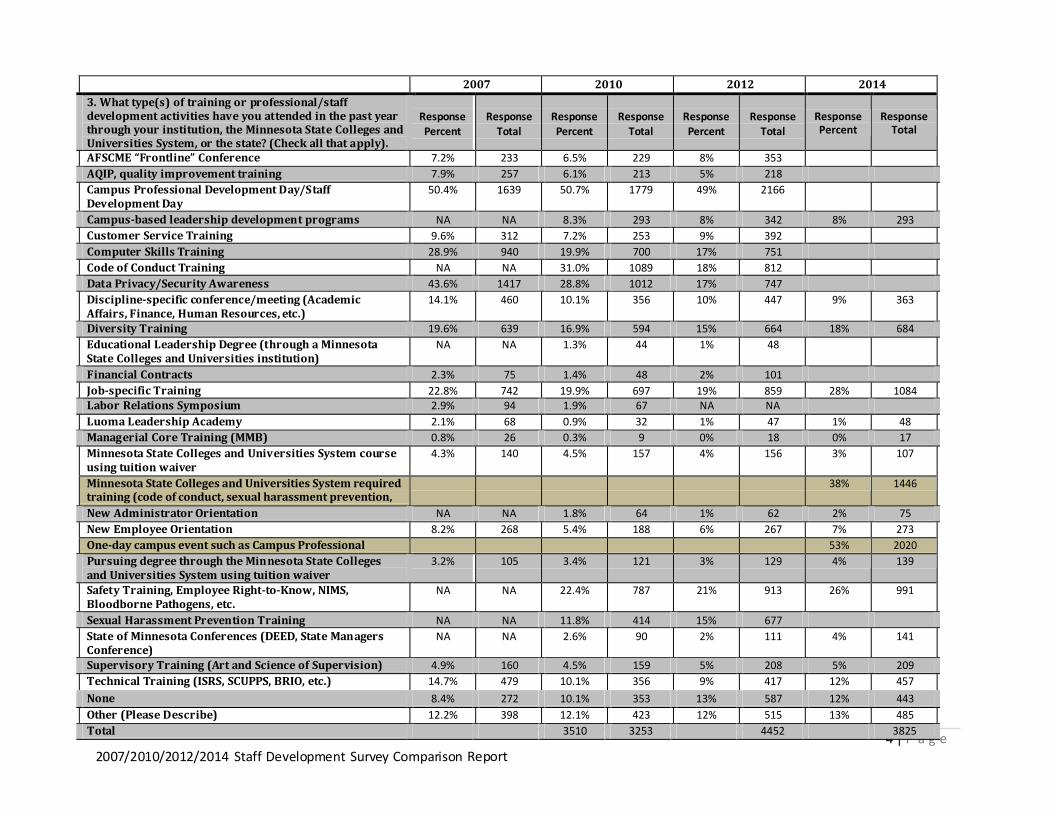
3. What type(s) of training or professional/staff development activities have you attended in the past year through your institution, the Minnesota State Colleges and Universities System, or the state? (Check all that apply).
Response Percent
Response
Total
Response Percent
Response
Total
Response Percent
Response
Total
Response Percent
Response Total
AFSCME “Frontline” Conference 7.2% 233 6.5% 229 8% 353
AQIP, quality improvement training 7.9% 257 6.1% 213 5% 218
Campus Professional Development Day/S taff Development Day
50.4% 1639 50.7% 1779 49% 2166
Campus-based leadership developmen t programs NA NA 8.3% 293 8% 342 8% 293
Customer Service Training 9.6% 312 7.2% 253 9% 392
Computer Skills Training 28.9% 940 19.9% 700 17% 751
Code of Conduct Training NA NA 31.0% 1089 18% 812
Data Privacy/Security Awareness 43.6% 1417 28.8% 1012 17% 747
Discipline-specific conference/meeting (Academic Affairs, Finance, Human Resources, etc.)
14.1% 460 10.1% 356 10% 447 9% 363
Diversity Training 19.6% 639 16.9% 594 15% 664 18% 684
Educational Leadership Degree (through a Minnesota State Colleges and Universities institution)
NA NA 1.3% 44 1% 48
Financial Contracts 2.3% 75 1.4% 48 2% 101
Job-specific Training 22.8% 742 19.9% 697 19% 859 28% 1084 Labor Relations Symposium 2.9% 94 1.9% 67 NA NA
Luoma Leadership Academy 2.1% 68 0.9% 32 1% 47 1% 48
Manag erial Core Training (MMB) 0.8% 26 0.3% 9 0% 18 0% 17
Minnesota State Colleges and Universities System course using tuition waiver
4.3% 140 4.5% 157 4% 156 3% 107
Minnesota State Colleges and Universities System required training (code of conduct, sexual harassment prevention, data privacy, etc.)
38% 1446
New Administrator Orientation NA NA 1.8% 64 1% 62 2% 75
New Employee Orientation 8.2% 268 5.4% 188 6% 267 7% 273
One-day campus event such as Campus Professional Development Day
53% 2020
Pursuing degree through the Min nesota State Colleges and Universities System using tuition waiver
3.2% 105 3.4% 121 3% 129 4% 139
Safety Training, Employee Right-to-Know, NIMS, Bloodborne Pathogens, etc.
NA NA 22.4% 787 21% 913 26% 991
Sexual Harassment Preven tion Training NA NA 11.8% 414 15% 677
State of Minnesota Conferences (DEED, State Man agers Conference)
NA NA 2.6% 90 2% 111 4% 141
Supervisory Training (Art and Science of Supervision) 4.9% 160 4.5% 159 5% 208 5% 209
Technical Training (ISRS, SCUPPS, BRIO, etc.) 14.7% 479 10.1% 356 9% 417 12% 457
None 8.4% 272 10.1% 353 13% 587 12% 443
Other (Please Describe) 12.2% 398 12.1% 423 12% 515 13% 485
Total 3510 3253 4452 3825
5 | P a g 2007/2010/2012/2014 Staff Development Survey Comparison
2007 2010 2012 2014
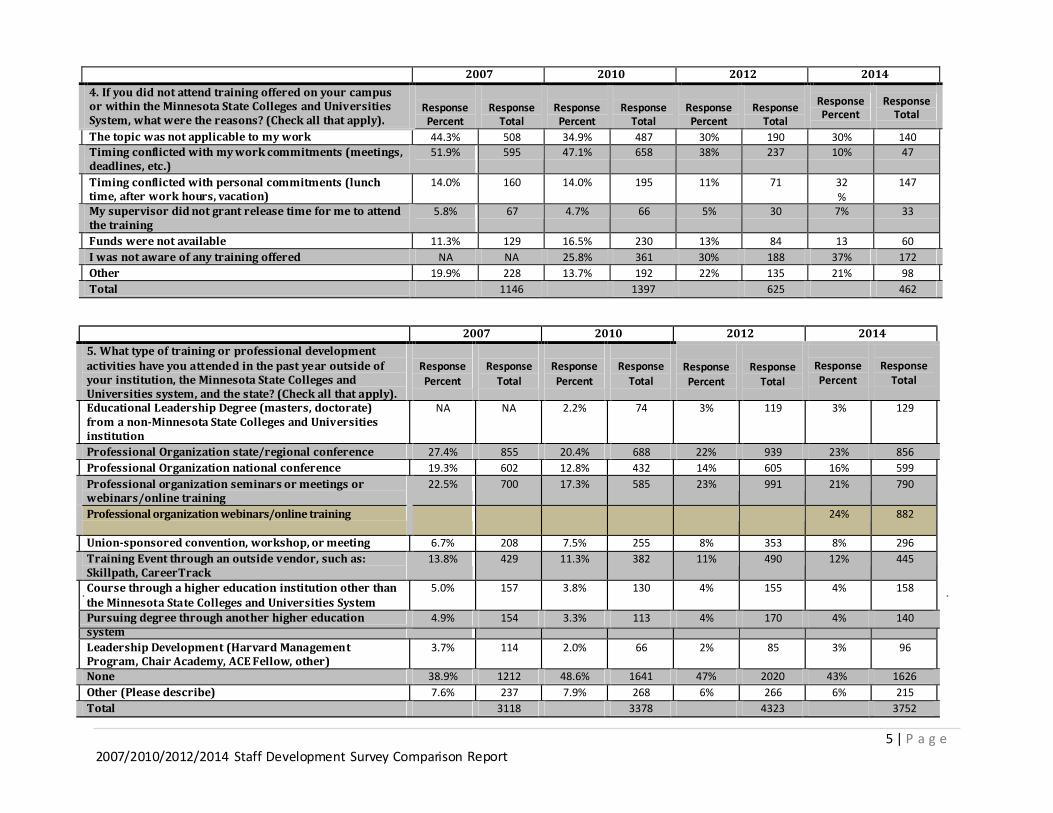
4. If you did not attend training offered on your campus or within the Minnesota State Colleges and Universities System, what were the reasons? (Check all that apply).
Response Percent
Response
Total
Response Percent
Response
Total
Response Percent
Response
Total
Response Percent
Response Total
The topic was not applicable to my work 44.3% 508 34.9% 487 30% 190 30% 140
Timing conflicted with my work commitments (meetings, deadlines, etc.)
51.9% 595 47.1% 658 38% 237 10% 47
Timing conflicted with personal commitments (lunch time, after work hours, vacation)
14.0% 160 14.0% 195 11% 71 32%
147
My supervisor did not grant release time for me to attend the training
5.8% 67 4.7% 66 5% 30 7% 33
Funds were not available 11.3% 129 16.5% 230 13% 84 13%
60
I was not aware of any training offered NA NA 25.8% 361 30% 188 37% 172
Other 19.9% 228 13.7% 192 22% 135 21% 98
Total 1146 1397 625 462
2007 2010 2012 2014
5. What type of training or professional development
activities have you attended in the past year outside of your institution, the Minnesota State Colleges and Universities system, and the state? (Check all that apply).
Response
Percent
Response
Total
Response
Percent
Response
Total
Response Percent
Response
Total
Response Percent
Response Total
Educational Leadership Degree (masters, doctorate) from a non-Minnesota State Colleges and Universities institution
NA NA 2.2% 74 3% 119 3% 129
Professional Organization state/regional conference 27.4% 855 20.4% 688 22% 939 23% 856
Professional Organization national conference 19.3% 602 12.8% 432 14% 605 16% 599
Professional organization seminars or meetings or webinars/online training
22.5% 700 17.3% 585 23% 991 21% 790
Professional organization webinars/online training 24% 882
Union-sponsored convention, workshop, or meeting 6.7% 208 7.5% 255 8% 353 8% 296
Training Event through an outside vendor, such as: Skillpath, CareerTrack
13.8% 429 11.3% 382 11% 490 12% 445
Course through a higher education institution other than the Minnesota State Colleges and Universities System
5.0% 157 3.8% 130 4% 155 4% 158
Pursuing degree through another higher education 4.9% 154 3.3% 113 4% 170 4% 140 system Leadership Developmen t (Harvard Managemen t Program, Chair Academy, ACE Fellow, other)
3.7% 114 2.0% 66 2% 85 3% 96
None 38.9% 1212 48.6% 1641 47% 2020 43% 1626
Other (Please describe) 7.6% 237 7.9% 268 6% 266 6% 215
Total 3118 3378 4323 3752

6 | P a g 2007/2010/2012/2014 Staff Development Survey Comparison
2007 2010 2012 2014
6. If you checked leadership development, please specify which of the following external programs you have attended in the last year:
Response Percent
Response
Total
Response Percent
Response
Total
Response Percent
Response
Total N/A N/A
AACC Future Leaders Institute 1.7% 3 3.7% 6 5% 4
American Council on Education (ACE) Fellows Program 1.7% 3 3.7% 6 8% 6
The Chair Academy Leadership and Training Program 17.6% 31 11.6% 19 20% 15
Community College Leadership Development Institu te
(CCLDI) Leadership Academy
1.7% 3 3.0% 5 7% 5
Harvard Graduate School of Education: Managem ent Development Program
2.3% 4 1.2% 2 NA
Harvard Graduate School of Education: Institute for Educational Man agement
0.6% 1 1.2% 2 NA
Harvard Graduate School of Education: Institute for Manag emen t and Lead ership in Education
1.1% 2 1.8% 3 NA
Harvard Graduate School of Education (MDP, IEM, IMLE) NA NA NA NA 9% 7
League for Innovation in th e Community College Executive Leadership Institute
2.8% 5 3.0% 5 8% 6
Local Chamber of Commerce Leadership Program 19.3% 34 20.1 33 26% 20
Other (Please list) 56.8% 100 62.8% 103 59% 45
Total 176 164 76
2007 2010 2012 2014
7. In your estimation, how much money has your departmen t/unit invested in your professional/career developmen t in the last year? (Include conference registrations, course/workshop fees, professional memberships, trade publications, books, travel, etc.)
Response Percent
Response
Total
Response Percent
Response
Total
Response Percent
Response
Total
Response
Percent
Response
Total
$0 19.7% 645 25.2% 900 24% 1056 24% 916
$0-$100 15.9% 519 18.8% 671 18% 798 17% 632
$100-$250 14.1% 462 15.0% 536 15% 654 14% 519
$250-$500 14.0% 457 14.0% 500 14% 593 13% 475
$500-$750 7.8% 254 6.7% 239 6% 270 7% 254
$750-$1000 7.2% 235 6.3% 226 6% 240 6% 224
$1000-$1500 6.9% 224 5.0% 178 6% 265 6% 224
$1500-$2000 5.3% 173 3.6% 178 4% 193 4% 168
Over $2000 9.1% 298 5.5% 197 6% 281 9% 334
Total 3267 3576 4350 3746
7 | P a g 2007/2010/2012/2014 Staff Development Survey Comparison
2007 2010 2012 2014
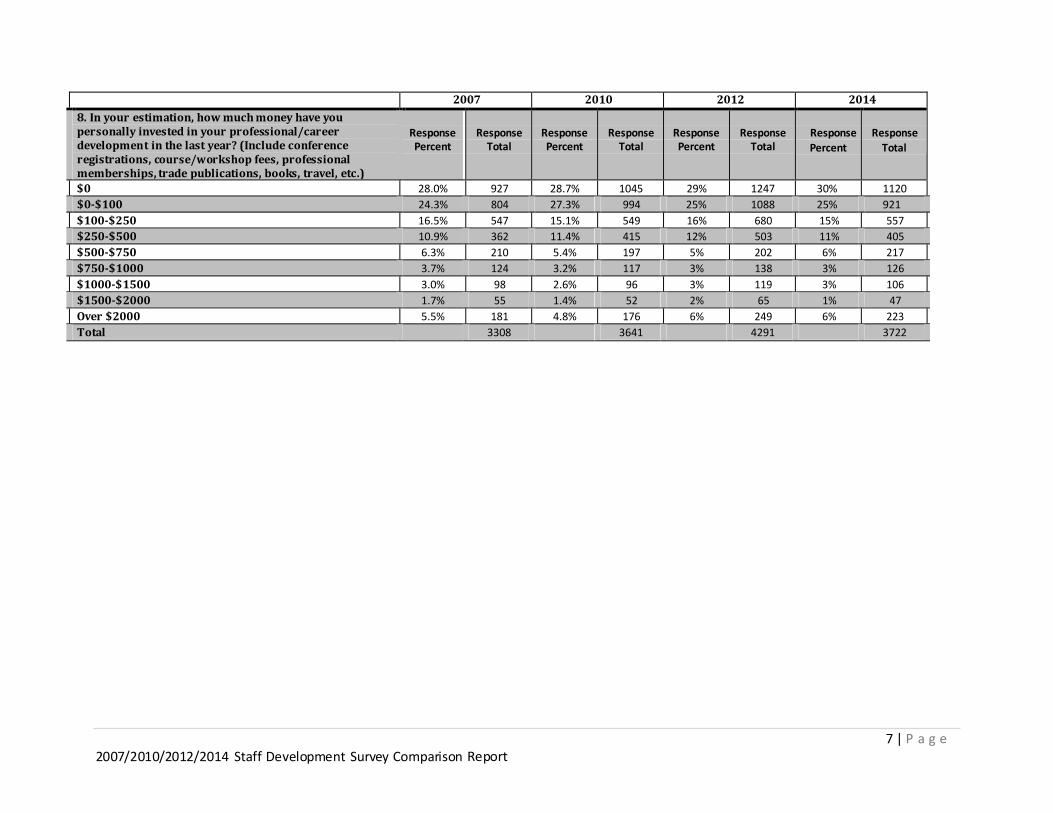
8. In your estimation, how much money have you personally invested in your professional/career developmen t in the last year? (Include conference registrations, course/workshop fees, professional memberships, trade publications, books, travel, etc.)
Response Percent
Response
Total
Response Percent
Response
Total
Response Percent
Response
Total
Response
Percent
Response
Total
$0 28.0% 927 28.7% 1045 29% 1247 30% 1120
$0-$100 24.3% 804 27.3% 994 25% 1088 25% 921
$100-$250 16.5% 547 15.1% 549 16% 680 15% 557
$250-$500 10.9% 362 11.4% 415 12% 503 11% 405
$500-$750 6.3% 210 5.4% 197 5% 202 6% 217
$750-$1000 3.7% 124 3.2% 117 3% 138 3% 126
$1000-$1500 3.0% 98 2.6% 96 3% 119 3% 106
$1500-$2000 1.7% 55 1.4% 52 2% 65 1% 47
Over $2000 5.5% 181 4.8% 176 6% 249 6% 223
Total 3308 3641 4291 3722

8 | P a g 2007/2010/2012/2014 Staff Development Survey Comparison
2007 2010 2012 2014
9. If you were to register for a training program tomorrow to fill your professional/career development needs, which of the following would you choose? (Check all that apply)
Response
Percent
Response
Total
Response
Percent
Response
Total
Response
Percent
Response
Total
Response
Percent
Response
Total
Budgeting/fin ancial systems 16.8% 556 15.8% 568 17% 732 20% 726
Building effective work teams 22.9% 756 21.1% 760 22% 923 25% 913
Coaching performance 12.1% 400 10.6% 381 13% 536 15% 559
Code of conduct NA NA 4.4% 158 4% 176 5% 192
Communication/interpersonal skills 25.8% 853 24.6% 885 22% 952 25% 941
Computer skills 42.8% 1411 37.7% 1359 36% 1530 34% 1281
Data privacy (FERPA, HIPAA, MN Statute) 6.6% 219 5.9% 212 10% 406 12% 442
Decision making 16.0% 529 14.9% 536 15% 642 18% 657
Diversity training 10.8% 358 10.6% 381 11% 480 14% 527
Hiring and orientation 6.9% 228 5.7% 204 7% 287 8% 300
HR systems training 5.0% 166 4.5% 161 5% 192 6% 236
Job-specific knowledge or skill training 49.6% 1636 48.5% 1747 51% 2168 53% 1976
Labor contracts 7.6% 252 7.5% 270 9% 396 9% 346
Leadership development 28.7% 946 27.9% 1006 29% 1215 33% 1216
Managi ng conflict 23.1% 763 21.2% 762 24% 1041 25% 943
Meetin g facilitation skills NA NA NA NA 9% 376 10% 378
Safety training 9.7% 319 8.4% 301 9% 377 10% 372
Strategic planning 15.0% 495 13.6% 491 15% 650 19% 706
Supervisory training 18.1% 598 16.1% 580 17% 711 19% 710
Technical training (ISRS, SCUPPS, BRIO, etc.) 28.4% 936 25.8% 928 24% 1041 28% 1031
Other (Please describe) 7.8% 259 7.6% 274 6% 250 6% 224
Total 3300 3602 4256 3723
9 | P a g 2007/2010/2012/2014 Staff Development Survey Comparison
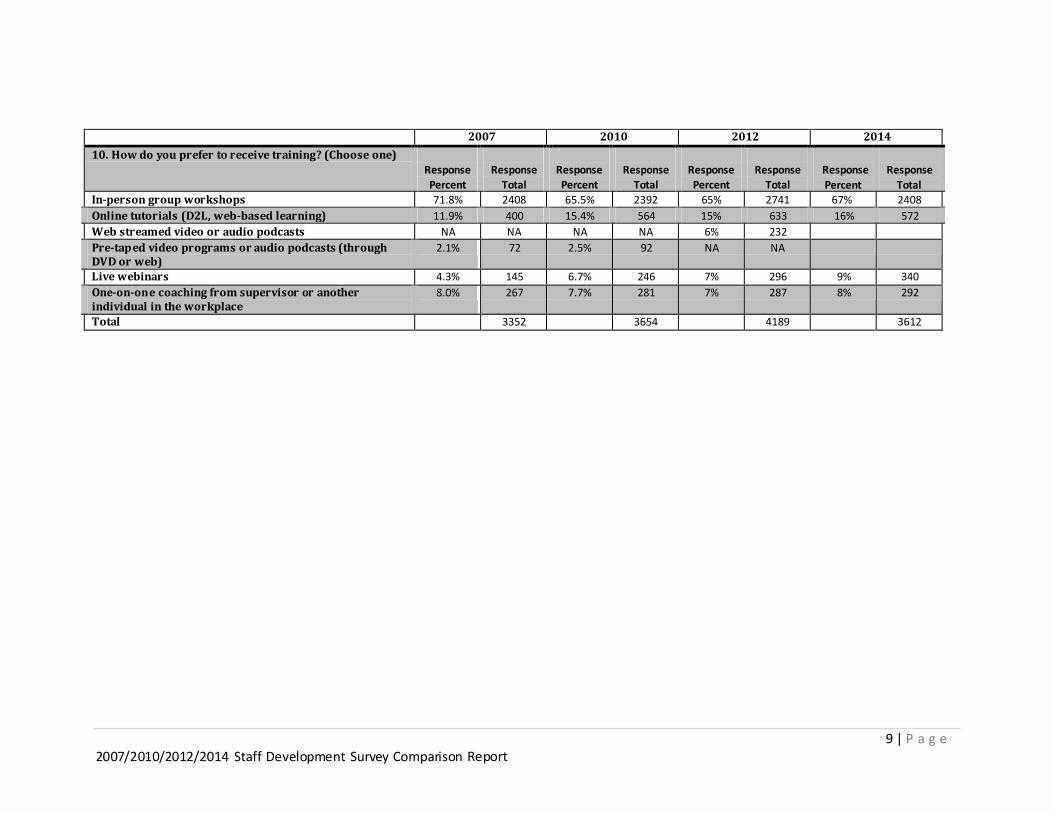
2007 2010 2012 2014
10. How do you prefer to receive training? (Choose one) Response
Percent
Response
Total
Response
Percent
Response
Total
Response
Percent
Response
Total
Response
Percent
Response
Total In-person group workshops 71.8% 2408 65.5% 2392 65% 2741 67% 2408
Online tutorials (D2L, web-based learning) 11.9% 400 15.4% 564 15% 633 16% 572
Web streamed video or audio podcasts NA NA NA NA 6% 232
Pre-tap ed video programs or audio podcasts (through DVD or web)
2.1% 72 2.5% 92 NA NA
Live webinars 4.3% 145 6.7% 246 7% 296 9% 340
One-on-on e coaching from supervisor or another individual in the workplace
8.0% 267 7.7% 281 7% 287 8% 292
Total 3352 3654 4189 3612

10 | P a g 2007/2010/2012/2014 Staff Development Survey Comparison
2007 2010 2012 2014
11. From a personal perspective, what is most important for you to support your professional developmen t and perform at your best? Rate the importance of each of the following:
Not
Impor tan t
Impor tan t
Very
Impor tan t
Response
Tota l
Not
Impor tan t
Impor tan t
Very
Impor tan t
Response
Tota l
Not
Impor tan t
Impor tan t
Very
Impor tan t
Response
Tota l
Not
Impor tan t
Impor tan t
Very
Impor tan t
Response
Tota l
Individual coaching/ feedback an d mentoring
11.8%
(399)
55.2%
(1859)
33.0%
(1111)
3695
13.2%
(489)
53.9%
(1993)
32.8%
(1213)
3369
12.1%
(512)
54.5%
(2301)
33.3%
(1406)
4219 465
(13%) 1971 (54%)
1248 (34%)
3684
Job-specific skills/ knowledge training
1.6%
(55)
31.0%
(1044)
67.4%
(2270)
3695
2.0%
(72)
30.3%
(1120)
67.7%
(2503)
3369
1.7%
(72)
30.3%
(1290)
68%
(2890)
4252
55 (1%) 1130 (31%)
2519 (68%)
3704
Supervisory/ management training
28.0% (943)
50.5% (1703)
21.5% (723)
3695
26.4% (974)
52.8% (1949)
20.9% (772)
3369
25.8% (1081)
53%
(2222)
21.2% (889)
4192 985
(27%) 1877 (51%)
798 (22%)
3660
Leadership opportunities (challenging assignments, institution- wide or system- wide committee service, mobility assignments, etc.)
16.4%
(554)
49.9%
(1681)
33.7%
(1134)
3695
19.9%
(734)
48.4%
(1790)
31.7%
(1171)
3369
17.3%
(729)
47.6%
(2004)
35.1%
(1477)
4210
612 (17%)
1741 (47%)
1322 (36%)
3675

11 | P a g 2007/2010/2012/2014 Staff Development Survey Comparison
2007 2010 2012 2014
12. From your perspective, given limited budget, what is most important for you the Minnesota State Colleges and Universities System to provide for the system to perform at its best? Rate the importance of each of the
following:
Not
Impor tan t
Impor tan t
Very
Impor tan t
Response
Tota l
Not
Impor tan t
Impor tan t
Very
Impor tan t
Response
Tota l
Not
Impor tan t
Impor tan t
Very
Impor tan t
Response
Tota l
Not
Impor tan t
Impor tan t
Very
Impor tan t
Response
Tota l
Individual coaching/ feedback an d mentoring
12.5% (409)
57.8% (1893)
29.7% (974)
3276
15.8% (566)
54.7% (1961)
29.6% (1060)
3587
16.7% (691)
55%
(2270)
28.3% (1169)
4130 563
(16%) 2057 (57%)
984 (27%)
3604
Job-specific skills/ knowledge training
1.9%
(63)
30.5%
(1013)
67.6%
(2250)
3326
2.5%
(89)
30.9%
(1118)
66.7%
(2415)
3622
2.2%
(92)
29.9%
(1253)
67.9%
(2847)
4192
84 (2%) 1175 (32%)
2410 (66%)
3669
Supervisory/ management training
11.2% (366)
55.8% (1827)
33.0% (1079)
3372
16.2% (577)
54.4% (1943)
29.4% (1051)
3571
15.8% (653)
56.2% (2316)
27.9% (1151)
4120 538
(15%) 2000 (56%)
1059 (29%) 3597
Leadership opportunities (challenging assignments, institution- wide or
system-wide committee
13.4% (441)
55.4% (1818)
31.2% (1023)
3282
18.6% (666)
52.7% (1887)
28.7% (1029)
3582
15.1% (625)
52.4% (2170)
32.5% (1343)
4138
546 (15%)
1858 (51%)
1213 (34%)
3617
service, mobility assignments)

12 | P a g 2007/2010/2012/2014 Staff Development Survey Comparison
Endorsed by the Leadership Council in May 2006, our Minnesota State Colleges and Universities Employee Development Philosophy states:
We are committed to developing the talents of Minnesota State Colleges and Universities' employees. We value our employees and understand
that continuous learning benefits the entire system by developing and maintaining employee skills that link directly to achieving organizational
goals and objectives. Supporting successful leaders at all levels also builds institutional capacity to better serve our students and our
communities. This commitment is realized as a shared responsibility between each employee and each college, university, or the Office of the
Chancellor.
2007 2010 2012 2014
13. Are you familiar with the employee developmen t philosophy above?
Response
Percent
Response
Total
Response
Percent
Response
Total
Response
Percent
Response
Total
Response Percent
Response
Total Yes 28.3% 951 28.9% 1063 38% 1615 38% 1420
No 71.7% 2410 71.1% 2615 62% 2639 62% 2291
Total 3373 3678 4254 3711
2007 2010 2012 2014
13b. If yes, how did you learn about it? Response
Percent
Response
Total
Response
Percent
Response
Total
Response
Percent
Response
Total
Response
Percent
Response
Total My Supervisor 24.2% 240 23.6% 258 17% 272 17% 244
My HR office 29.0% 287 28.5% 311 27% 437 29% 411
My Peers 13.7% 136 13.9% 152 11% 169 11% 160
My President 14.2% 141 10.8% 118 7% 107 6% 85 College/University Newsletter 22.9% 227 20.1% 220 21% 330 19% 265
Other (Please list) 19.8% 196 20.2% 221 18% 289 17% 247
Total 990 1092 1604 1412
13 | P a g 2007/2010/2012/2014 Staff Development Survey Comparison
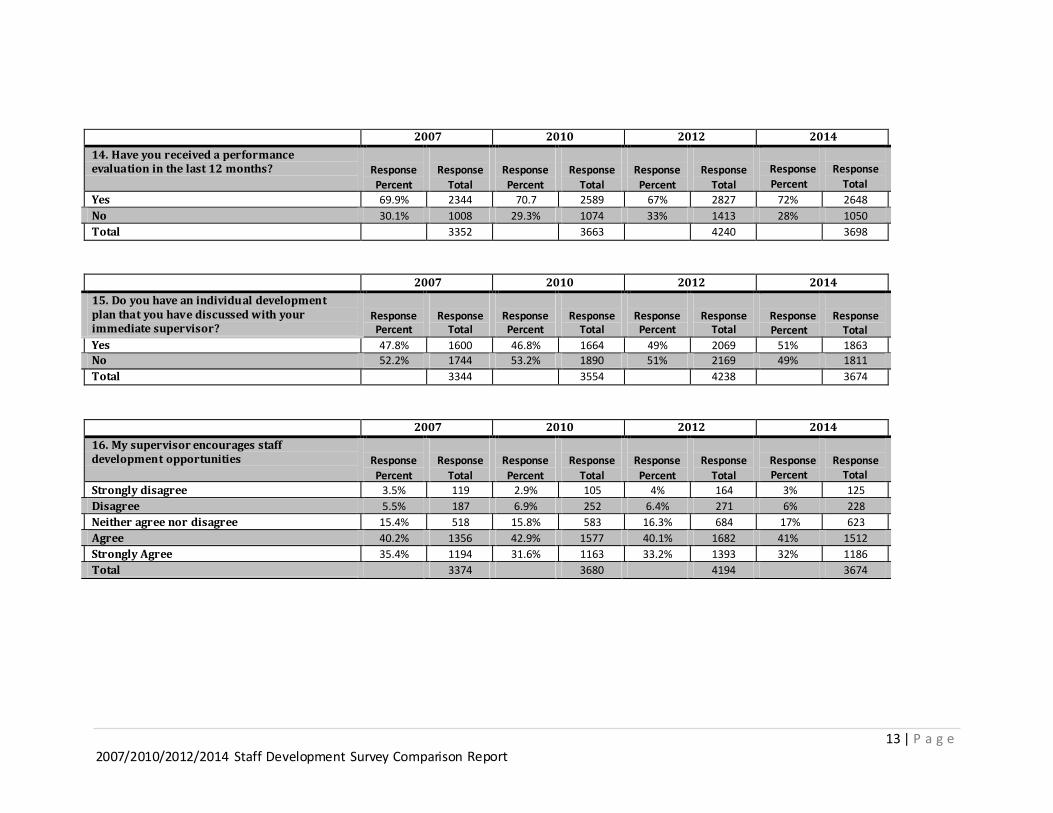
2007 2010 2012 2014
14. Have you received a performance evaluation in the last 12 months?
Response
Percent
Response
Total
Response
Percent
Response
Total
Response
Percent
Response
Total
Response
Percent
Response
Total Yes 69.9% 2344 70.7 2589 67% 2827 72% 2648
No 30.1% 1008 29.3% 1074 33% 1413 28% 1050
Total 3352 3663 4240 3698
2007 2010 2012 2014
15. Do you have an individu al developmen t plan that you have discussed with your immediate supervisor?
Response Percent
Response
Total
Response Percent
Response
Total
Response Percent
Response
Total
Response Percent
Response
Total Yes 47.8% 1600 46.8% 1664 49% 2069 51% 1863
No 52.2% 1744 53.2% 1890 51% 2169 49% 1811
Total 3344 3554 4238 3674
2007 2010 2012 2014
16. My supervisor encourages staff developmen t opportunities
Response
Percent
Response
Total
Response
Percent
Response
Total
Response
Percent
Response
Total
Response Percent
Response
Total Strongly disagree 3.5% 119 2.9% 105 4% 164 3% 125
Disagree 5.5% 187 6.9% 252 6.4% 271 6% 228
Neither agree nor disagree 15.4% 518 15.8% 583 16.3% 684 17% 623
Agree 40.2% 1356 42.9% 1577 40.1% 1682 41% 1512
Strongly Agree 35.4% 1194 31.6% 1163 33.2% 1393 32% 1186
Total 3374 3680 4194 3674
14 | P a g 2007/2010/2012/2014 Staff Development Survey Comparison
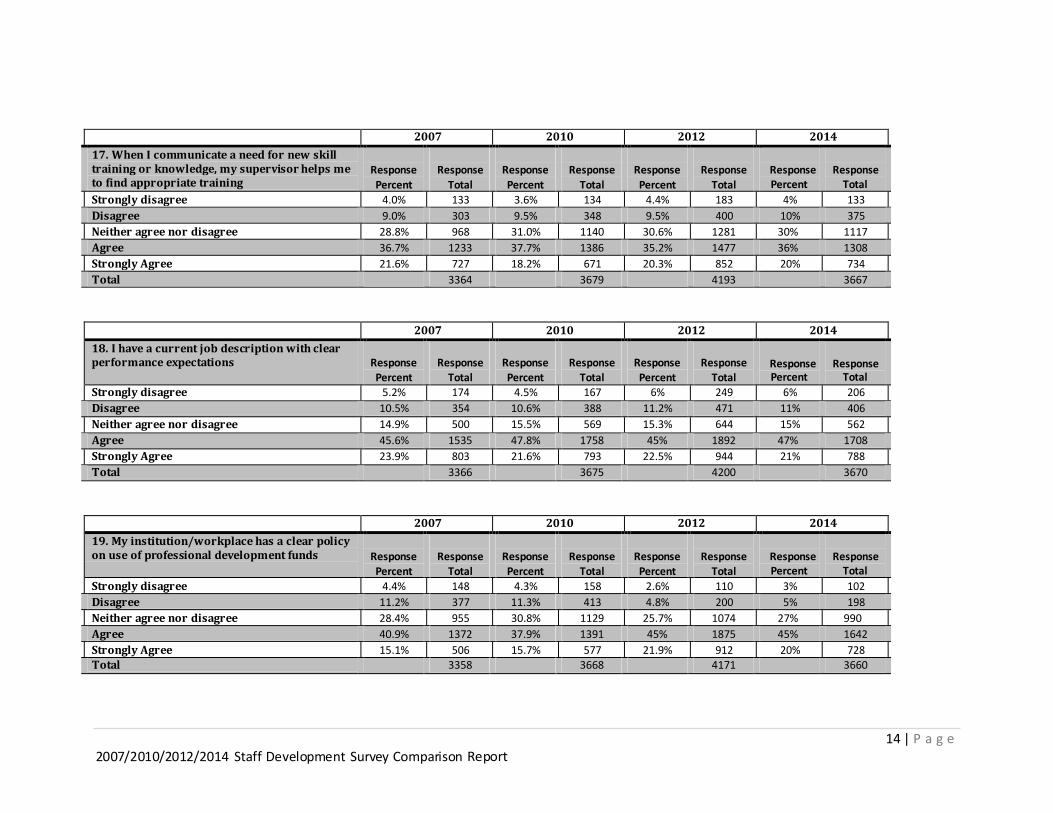
2007 2010 2012 2014
17. When I communicate a need for new skill training or knowledge, my supervisor helps me to find appropriate training
Response
Percent
Response
Total
Response
Percent
Response
Total
Response
Percent
Response
Total
Response Percent
Response
Total Strongly disagree 4.0% 133 3.6% 134 4.4% 183 4% 133
Disagree 9.0% 303 9.5% 348 9.5% 400 10% 375
Neither agree nor disagree 28.8% 968 31.0% 1140 30.6% 1281 30% 1117
Agree 36.7% 1233 37.7% 1386 35.2% 1477 36% 1308
Strongly Agree 21.6% 727 18.2% 671 20.3% 852 20% 734
Total 3364 3679 4193 3667
2007 2010 2012 2014
18. I have a current job description with clear performance expectations
Response Percent
Response
Total
Response Percent
Response
Total
Response Percent
Response
Total
Response Percent
Response
Total Strongly disagree 5.2% 174 4.5% 167 6% 249 6% 206
Disagree 10.5% 354 10.6% 388 11.2% 471 11% 406
Neither agree nor disagree 14.9% 500 15.5% 569 15.3% 644 15% 562
Agree 45.6% 1535 47.8% 1758 45% 1892 47% 1708
Strongly Agree 23.9% 803 21.6% 793 22.5% 944 21% 788
Total 3366 3675 4200 3670
2007 2010 2012 2014
19. My institution/workplace has a clear policy on use of professional development funds
Response Percent
Response
Total
Response Percent
Response
Total
Response Percent
Response
Total
Response Percent
Response
Total Strongly disagree 4.4% 148 4.3% 158 2.6% 110 3% 102
Disagree 11.2% 377 11.3% 413 4.8% 200 5% 198
Neither agree nor disagree 28.4% 955 30.8% 1129 25.7% 1074 27% 990
Agree 40.9% 1372 37.9% 1391 45% 1875 45% 1642
Strongly Agree 15.1% 506 15.7% 577 21.9% 912 20% 728 Total 3358 3668 4171 3660

15 | P a g 2007/2010/2012/2014 Staff Development Survey Comparison
2007 2010 2012 2014
20. My institution/workplace has a clear process for sponsoring individuals for professional development opportunities
Response
Percent
Response
Total
Response
Percent
Response
Total
Response
Percent
Response
Total
Response Percent
Response
Total Strongly disagree 5.7% 193 5.5% 200 5.7% 240 6% 214
Disagree 12.6% 425 14.0% 513 12.4% 519 14% 505
Neither agree nor disagree 32.4% 1090 34.7% 1272 31.5% 1318 33% 1197
Agree 36.4% 1255 33.1% 1214 34.7% 1451 34% 1262
Strongly Agree 12.8% 429 12.9% 472 15.7% 656 13% 485
Total 3362 3671 4184 3663
2007 2010 2012 2014
21. My institution/workplace encourages staff developmen t opportunities
Response Percent
Response
Total
Response Percent
Response
Total
Response Percent
Response
Total
Response Percent
Response
Total Strongly disagree 3.8% 127 3.8% 140 4.8% 201 5% 172
Disagree 8.6% 288 10.5% 386 9% 376 10% 381
Neither agree nor disagree 19.4% 652 22.1% 810 22.9% 960 21% 780
Agree 46.7% 1571 45.3% 1664 43.2% 1810 45% 1633
Strongly Agree 21.7% 729 18.3% 670 20% 839 19% 699
Total 3367 3670 4186 3665
2007 2010 2012 2014
22. My campus hosts staff development or professional development days
Response Percent
Response
Total
Response Percent
Response
Total
Response Percent
Response
Total
Response Percent
Response
Total Strongly disagree 2.4% 81 2.8% 104 2.6% 109 3% 101
Disagree 5.9% 199 6.4% 235 6.6% 277 6% 223
Neither agree nor disagree 16.7% 558 17.5% 640 17.5% 732 16% 601
Agree 48.8% 1633 47.6% 1743 46.1% 1926 49% 1788
Strongly Agree 26.2% 875 25.7% 939 27.2% 1135 26% 945 Total 3346 3661 4179 3658
16 | P a g 2007/2010/2012/2014 Staff Development Survey Comparison
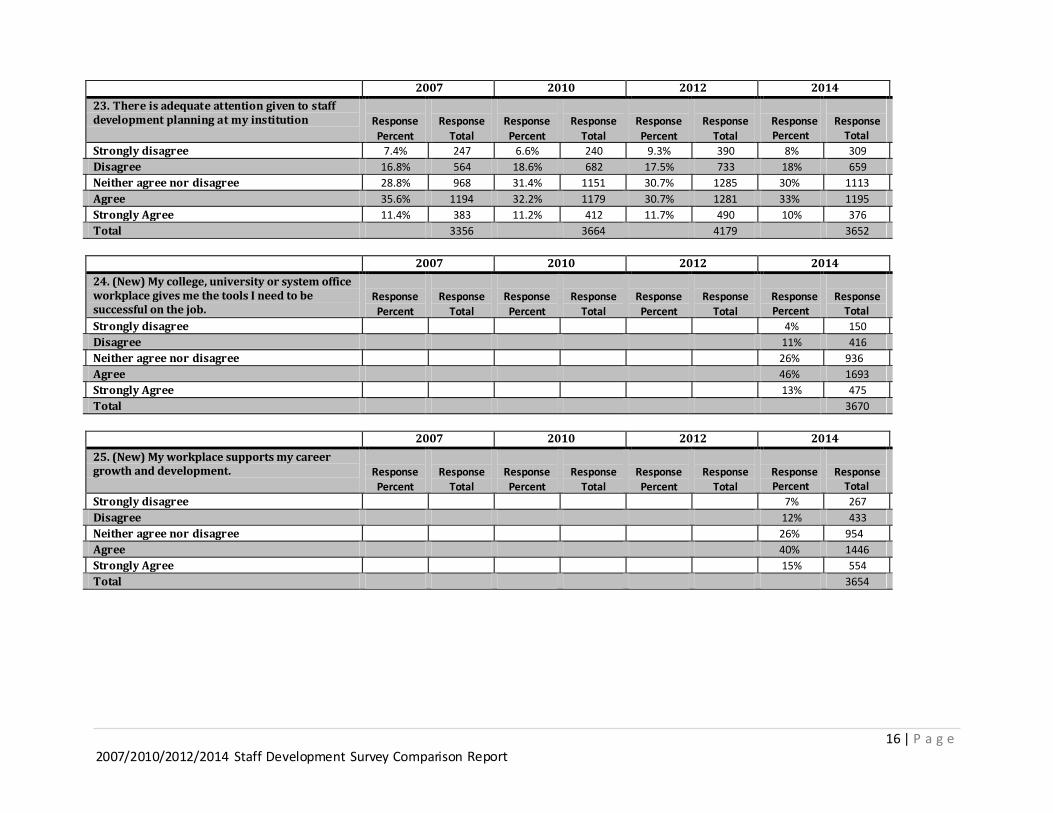
2007 2010 2012 2014
23. There is adequate attention given to staff development planning at my institution
Response
Percent
Response
Total
Response
Percent
Response
Total
Response
Percent
Response
Total
Response Percent
Response
Total Strongly disagree 7.4% 247 6.6% 240 9.3% 390 8% 309
Disagree 16.8% 564 18.6% 682 17.5% 733 18% 659
Neither agree nor disagree 28.8% 968 31.4% 1151 30.7% 1285 30% 1113
Agree 35.6% 1194 32.2% 1179 30.7% 1281 33% 1195
Strongly Agree 11.4% 383 11.2% 412 11.7% 490 10% 376
Total 3356 3664 4179 3652
2007 2010 2012 2014
24. (New) My college, university or system office workplace gives me the tools I need to be successful on the job.
Response
Percent
Response
Total
Response
Percent
Response
Total
Response
Percent
Response
Total
Response Percent
Response
Total Strongly disagree 4% 150
Disagree 11% 416
Neither agree nor disagree 26% 936
Agree 46% 1693
Strongly Agree 13% 475
Total 3670
2007 2010 2012 2014
25. (New) My workplace supports my career growth and development.
Response Percent
Response
Total
Response Percent
Response
Total
Response Percent
Response
Total
Response Percent
Response
Total Strongly disagree 7% 267
Disagree 12% 433
Neither agree nor disagree 26% 954
Agree 40% 1446
Strongly Agree 15% 554
Total 3654

17 | P a g 2007/2010/2012/2014 Staff Development Survey Comparison
2007 2010 2012 2014
26. (New) Even if I were offered a comparable position with similar pay and benefits at another company, I would continue working in my MnSCU position.
Response
Percent
Response
Total
Response
Percent
Response
Total
Response
Percent
Response
Total
Response Percent
Response
Total
Strongly disagree 8% 297
Disagree 12% 427
Neither agree nor disagree 28% 1043
Agree 30% 1101
Strongly Agree 22% 793
Total 3661
2007 2010 2012 2014
24. Do you currently supervise or manage others?
Response
Percent
Response
Total
Response
Percent
Response
Total
Response
Percent
Response
Total
Response Percent
Response
Total Yes 36.9% 1250 35.3% 1306 33% 1402 35% 1271
No 63.1% 2133 64.7% 2389 67% 2808 65% 2407
Total 3383 3695 4210 3678
2007 2010 2012 2014
24a. How long have you been supervising or managing others?
Response Percent
Response
Total
Response Percent
Response
Total
Response Percent
Response
Total
Response Percent
Response
Total 0-4 Years 34% 430
5-9 Years 22% 279
More than 10 Years 44% 556
Total 1265
2007 2010 2012 2014
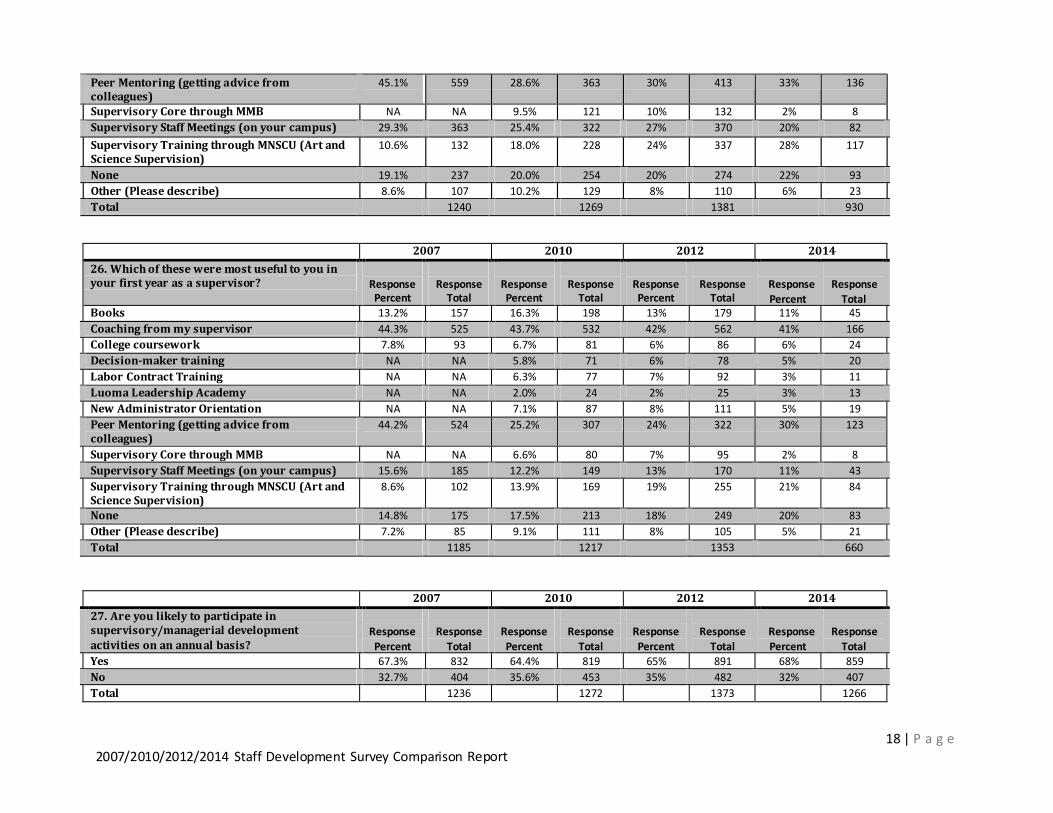
25. During the first year of your supervisory position which of the following activities did
you participate in?
Response Percent
Response
Total
Response Percent
Response
Total
Response Percent
Response
Total
Response
Percent
Response
Total Books 30.6% 380 31.8% 403 30% 412 26% 107
Coaching from my supervisor 49.2% 610 46.2% 586 46% 641 46% 194
College coursework 12.7% 157 12.2% 155 13% 177 11% 45
Decision-maker training NA NA 12.7% 161 15% 212 10% 40
Labor Contract Training NA NA 12.9% 164 15% 201 7% 30
Luoma Leadership Academy NA NA 2.3% 29 2% 33 3% 13
New Administrator Orientation NA NA 14.9% 189 18% 250 10% 42
18 | P a g 2007/2010/2012/2014 Staff Development Survey Comparison
Peer Mentoring (getting advice from colleagues)
45.1% 559 28.6% 363 30% 413 33% 136
Supervisory Core through MMB NA NA 9.5% 121 10% 132 2% 8
Supervisory Staff Meetings (on your campus) 29.3% 363 25.4% 322 27% 370 20% 82
Supervisory Training through MNSCU (Art and Science Supervision)
10.6% 132 18.0% 228 24% 337 28% 117
None 19.1% 237 20.0% 254 20% 274 22% 93
Other (Please describe) 8.6% 107 10.2% 129 8% 110 6% 23
Total 1240 1269 1381 930
2007 2010 2012 2014
26. Which of these were most useful to you in your first year as a supervisor?
Response Percent
Response
Total
Response Percent
Response
Total
Response Percent
Response
Total
Response
Percent
Response
Total Books 13.2% 157 16.3% 198 13% 179 11% 45
Coaching from my supervisor 44.3% 525 43.7% 532 42% 562 41% 166
College coursework 7.8% 93 6.7% 81 6% 86 6% 24
Decision-maker training NA NA 5.8% 71 6% 78 5% 20
Labor Contract Training NA NA 6.3% 77 7% 92 3% 11
Luoma Leadership Academy NA NA 2.0% 24 2% 25 3% 13
New Administrator Orientation NA NA 7.1% 87 8% 111 5% 19
Peer Mentoring (getting advice from colleagues)
44.2% 524 25.2% 307 24% 322 30% 123
Supervisory Core through MMB NA NA 6.6% 80 7% 95 2% 8
Supervisory Staff Meetings (on your campus) 15.6% 185 12.2% 149 13% 170 11% 43
Supervisory Training through MNSCU (Art and Science Supervision)
8.6% 102 13.9% 169 19% 255 21% 84
None 14.8% 175 17.5% 213 18% 249 20% 83
Other (Please describe) 7.2% 85 9.1% 111 8% 105 5% 21
Total 1185 1217 1353 660
2007 2010 2012 2014
27. Are you likely to participate in supervisory/managerial development
activities on an annu al basis?
Response
Percent
Response
Total
Response
Percent
Response
Total
Response
Percent
Response
Total
Response
Percent
Response
Total Yes 67.3% 832 64.4% 819 65% 891 68% 859
No 32.7% 404 35.6% 453 35% 482 32% 407
Total 1236 1272 1373 1266

19 | P a g 2007/2010/2012/2014 Staff Development Survey Comparison
2007 2010 2012 2014
28. Does your supervisor encourage you to participate in regular supervisory/managerial developmen t activities?
Response Percent
Response
Total
Response Percent
Response
Total
Response Percent
Response
Total
Response
Percent
Response
Total Yes 56.4% 690 55.2% 697 54% 738 54% 684
No 43.6% 534 44.8% 565 46% 626 46% 578 Total 1224 1262 1364 1262
2007 2010 2012 2014
29. In my annual performance review, I am rated on my supervisory/managerial effectiven ess (how I get work done through others).
Response
Percent
Response
Total
Response
Percent
Response
Total
Response
Percent
Response
Total
Response Percent
Response
Total
Strongly disagree 3.8% 47 5.7% 72 5% 67 4% 55
Disagree 7.1% 88 8.9% 113 8.4% 113 11% 137
Neither agree nor disagree 26.8% 330 28.0% 355 29.7% 398 30% 375
Agree 44.2% 544 39.7% 503 41.1% 550 39% 481
Strongly Agree 18.0% 222 17.7% 224 15.8% 211 15% 189
Total 1231 1267 1339 1237
2007 2010 2012 2014
30. I conduct annual performance reviews with my staff.
Response Percent
Response
Total
Response Percent
Response
Total
Response Percent
Response Total
Response Percent
Response
Total Strongly disagree 3.0% 37 3.1% 39 3.4% 46 2% 24
Disagree 8.8% 108 9.2% 116 9.7% 131 10% 126
Neither agree nor disagree 22.2% 273 22.8% 288 20.8% 281 21% 256
Agree 36.8% 453 36.9% 465 37.4% 504 36% 451
Strongly Agree 29.2% 360 28.1% 354 28.7% 387 31% 383
Total 1231 1262 1349 1240
20 | P a g 2007/2010/2012/2014 Staff Development Survey Comparison
2007 2010 2012 2014
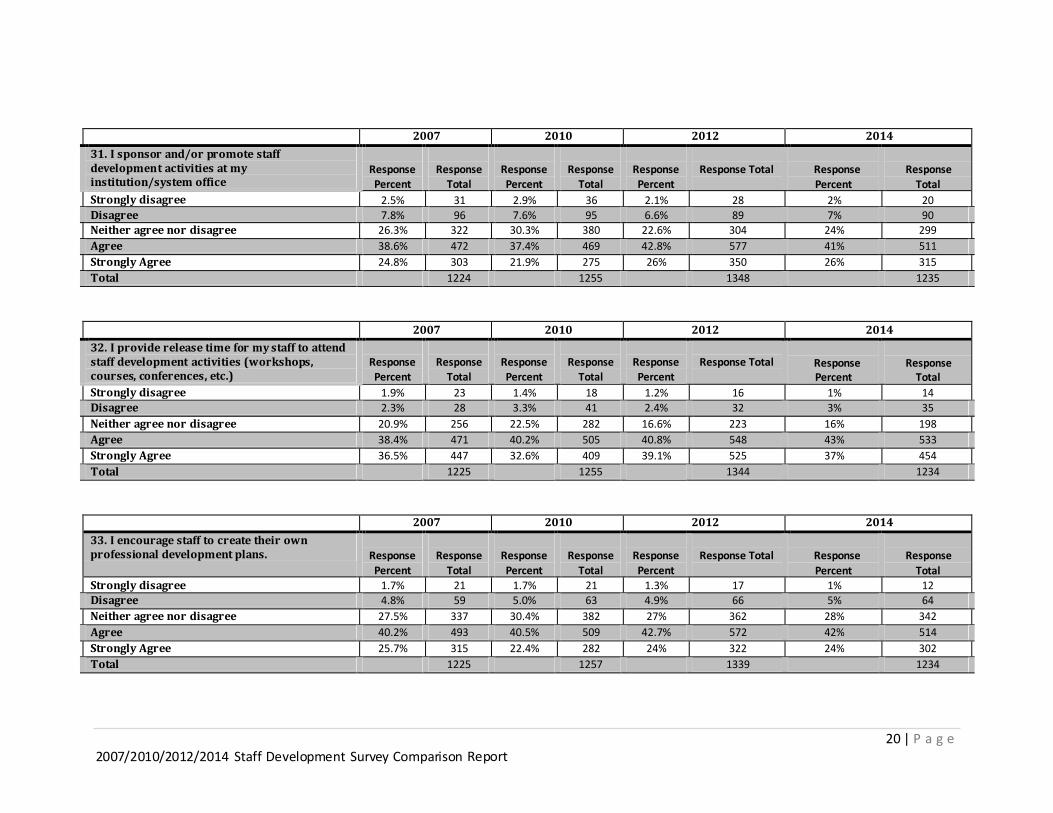
31. I sponsor and/or promote staff developmen t activities at my institution/system office
Response Percent
Response
Total
Response Percent
Response
Total
Response Percent
Response Total
Response
Percent
Response
Total Strongly disagree 2.5% 31 2.9% 36 2.1% 28 2% 20
Disagree 7.8% 96 7.6% 95 6.6% 89 7% 90 Neither agree nor disagree 26.3% 322 30.3% 380 22.6% 304 24% 299
Agree 38.6% 472 37.4% 469 42.8% 577 41% 511
Strongly Agree 24.8% 303 21.9% 275 26% 350 26% 315
Total 1224 1255 1348 1235
2007 2010 2012 2014
32. I provide release time for my staff to attend staff development activities (workshops, courses, conferences, etc.)
Response Percent
Response
Total
Response Percent
Response
Total
Response Percent
Response Total
Response Percent
Response
Total Strongly disagree 1.9% 23 1.4% 18 1.2% 16 1% 14
Disagree 2.3% 28 3.3% 41 2.4% 32 3% 35
Neither agree nor disagree 20.9% 256 22.5% 282 16.6% 223 16% 198
Agree 38.4% 471 40.2% 505 40.8% 548 43% 533
Strongly Agree 36.5% 447 32.6% 409 39.1% 525 37% 454
Total 1225 1255 1344 1234
2007 2010 2012 2014
33. I encourage staff to create their own professional development plans.
Response
Percent
Response
Total
Response
Percent
Response
Total
Response
Percent
Response Total
Response
Percent
Response
Total Strongly disagree 1.7% 21 1.7% 21 1.3% 17 1% 12 Disagree 4.8% 59 5.0% 63 4.9% 66 5% 64
Neither agree nor disagree 27.5% 337 30.4% 382 27% 362 28% 342
Agree 40.2% 493 40.5% 509 42.7% 572 42% 514
Strongly Agree 25.7% 315 22.4% 282 24% 322 24% 302
Total 1225 1257 1339 1234
21 | P a g 2007/2010/2012/2014 Staff Development Survey Comparison
2007 2010 2012 2014
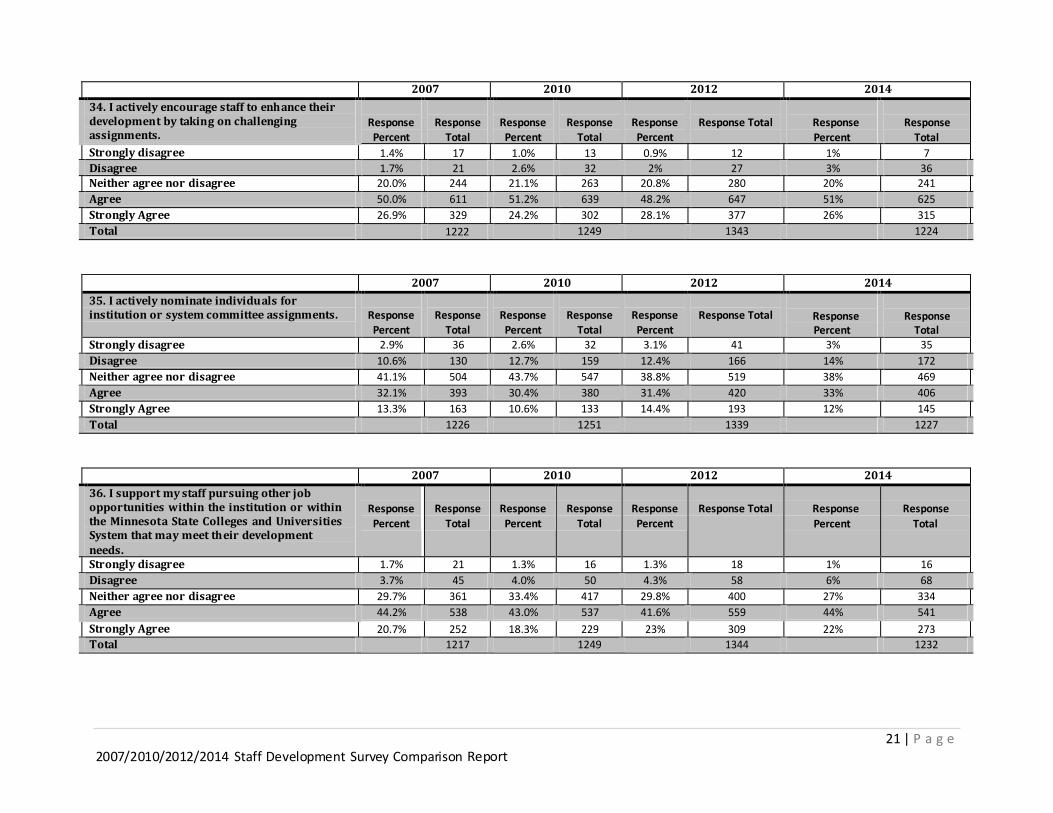
34. I actively encourage staff to enh ance their developmen t by takin g on challenging assignments.
Response Percent
Response
Total
Response Percent
Response
Total
Response Percent
Response Total
Response
Percent
Response
Total Strongly disagree 1.4% 17 1.0% 13 0.9% 12 1% 7
Disagree 1.7% 21 2.6% 32 2% 27 3% 36 Neither agree nor disagree 20.0% 244 21.1% 263 20.8% 280 20% 241
Agree 50.0% 611 51.2% 639 48.2% 647 51% 625
Strongly Agree 26.9% 329 24.2% 302 28.1% 377 26% 315
Total 1222 1249 1343 1224
2007 2010 2012 2014
35. I actively nominate individu als for institution or system committee assignments.
Response Percent
Response
Total
Response Percent
Response
Total
Response Percent
Response Total
Response Percent
Response
Total Strongly disagree 2.9% 36 2.6% 32 3.1% 41 3% 35
Disagree 10.6% 130 12.7% 159 12.4% 166 14% 172
Neither agree nor disagree 41.1% 504 43.7% 547 38.8% 519 38% 469
Agree 32.1% 393 30.4% 380 31.4% 420 33% 406
Strongly Agree 13.3% 163 10.6% 133 14.4% 193 12% 145
Total 1226 1251 1339 1227
2007 2010 2012 2014
36. I support my staff pursuing other job opportunities within the institution or within the Minnesota State Colleges and Universities System that may meet th eir development
needs.
Response
Percent
Response
Total
Response
Percent
Response
Total
Response
Percent
Response Total
Response
Percent
Response
Total
Strongly disagree 1.7% 21 1.3% 16 1.3% 18 1% 16
Disagree 3.7% 45 4.0% 50 4.3% 58 6% 68
Neither agree nor disagree 29.7% 361 33.4% 417 29.8% 400 27% 334
Agree 44.2% 538 43.0% 537 41.6% 559 44% 541
Strongly Agree 20.7% 252 18.3% 229 23% 309 22% 273
Total 1217 1249 1344 1232

22 | P a g 2007/2010/2012/2014 Staff Development Survey Comparison
2007 2010 2012
2014
37. Do you currently supervise other supervisors?
Response
Percent
Response
Total
Response
Percent
Response
Total
Response
Percent
Response Total
Response Percent
Response
Total Yes 22.3% 279 21.7% 283 22% 30
6 20% 256
No 77.7% 971 78.3% 1023 78% 1063
80% 993
Total 1250 1306 1369
1249
2007 2010 2012 2014
38. During annual performance reviews, do you evaluate your staff on their supervisory/managerial effectiveness (how they g et work done through others)?
Response Percent
Response
Total
Response Percent
Response
Total
Response Percent
Response Total
Response
Percent
Response
Total
Yes 91.7% 254 88.5% 247 85% 258 90% 228
No 8.3% 23 11.5% 32 15% 45 10% 26
Total 277 279 303 254
2007 2010 2012 2014
39. What is your gender? Response Percent
Response
Total
Response Percent
Response
Total
Response Percent
Response Total
Response
Percent
Response
Total Male 29.8% 997 30.0% 1092 31% 940 30% 1064
Female 70.2% 2344 70.0% 2550 69% 2153 70% 2504
Total 3341 3642 3093 3568
2007 2010 2012 2014
40. What is your age? Response Percent
Response
Total
Response Percent
Response
Total
Response Percent
Response Total
Response Percent
Response
Total Under 21 0.1% 3 0% 1 0% 3 0% 1
21-30 9.9% 329 11.3% 412 9% 338 10% 352
31-40 18.5% 616 18.5% 675 19% 673 21% 733 41-50 30.5% 1016 28.0% 1018 26% 917 25% 861
51-60 34.4% 1144 34.3% 1247 36% 1,293 34% 1189
61 or older 6.6% 219 7.9% 287 10% 363 10% 356
Total 3327 3640 3587 3492

23 | P a g 2007/2010/2012/2014 Staff Development Survey Comparison
2007 2010 2012 2014
41. What is your ethnicity? Response
Percent
Response
Total
Response
Percent
Response
Total
Response
Percent
Response Total
Response Percent
Response
Total African-American 2.2% 73 2.0% 71 2% 92 3% 100
American Indian 0.9% 30 1.1% 38 1% 41 1% 32
Asian-American/Asian-Pacific American 1.9% 62 1.8% 64 2% 69 3% 87
Caucasian/Non-Hispanic 89.5% 2954 89.0% 3213 88% 3545 87% 3027
Chicano/Latino 1.4% 46 1.2% 44 1% 37 1% 41
Multi-Racial 3.1% 103 1.2% 45 1% 49 2% 56
Other 3.1% 103 3.8% 137 4% 175 4% 124
Total 3301 3612 4008 3467
2007 2010 2012 2014
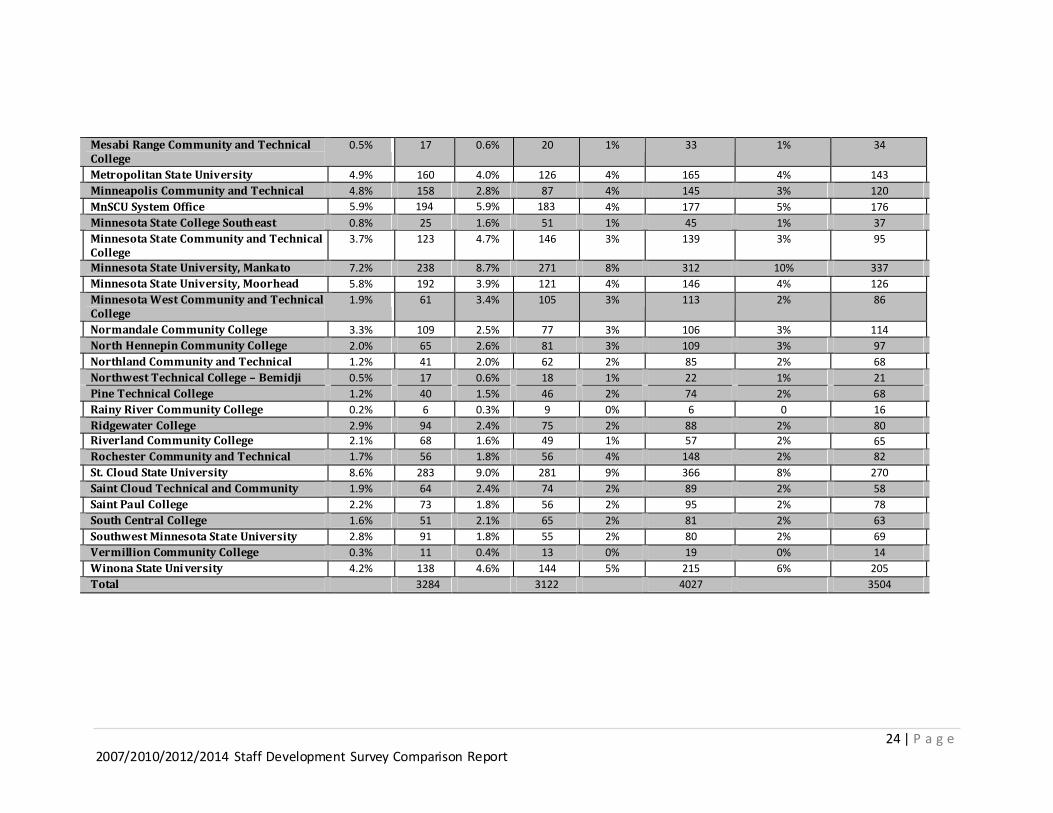
42. Where do you work? Response Percent
Response
Total
Response Percent
Response
Total
Response Percent
Response Total
Response
Percent
Response
Total Alexandria Technical College 2.0% 67 1.8% 55 2% 74 2% 60
Anoka-Ramsey Community College 2.8% 92 3.5% 108 3% 107 3% 111
Anoka Technical College 1.8% 58 1.5% 46 1% 36 1% 26
Bemidji State University 3.5% 114 3.0% 94 3% 123 3% 102
Central Lakes College 2.4% 78 2.2% 68 2% 85 2% 79
Century College 3.9% 128 5.0% 155 5% 201 5% 163
Dakota County Technical College 2.0% 67 1.7% 54 2% 61 2% 58
Fond du Lac Tribal and Community College 0.9% 28 0.8% 25 1% 35 1% 31
Hennepin Technical College 2.6% 86 2.8% 87 4% 155 4% 133
Hibbing Community College 0.7% 23 0.8% 25 1% 30 1% 30
Inver Hills Community College 1.8% 60 1.6% 50 2% 91 2% 87
Itasca Community College 0.6% 21 0.7% 22 1% 28 1% 32
Lake Superior College 2.6% 87 2.0% 62 2% 86 2% 70
24 | P a g 2007/2010/2012/2014 Staff Development Survey Comparison
Mesabi Range Community and Technical College
0.5% 17 0.6% 20 1% 33 1% 34
Metropolitan State University 4.9% 160 4.0% 126 4% 165 4% 143
Minneapolis Community and Technical College
4.8% 158 2.8% 87 4% 145 3% 120
MnSCU System Office 5.9% 194 5.9% 183 4% 177 5% 176
Minnesota State College South east Technical
0.8% 25 1.6% 51 1% 45 1% 37
Minnesota State Community and Technical College
3.7% 123 4.7% 146 3% 139 3% 95
Minnesota State University, Mankato 7.2% 238 8.7% 271 8% 312 10% 337
Minnesota State University, Moorhead 5.8% 192 3.9% 121 4% 146 4% 126
Minnesota West Community and Technical College
1.9% 61 3.4% 105 3% 113 2% 86
Normandale Community College 3.3% 109 2.5% 77 3% 106 3% 114
North Hennepin Community College 2.0% 65 2.6% 81 3% 109 3% 97
Northland Community and Technical College
1.2% 41 2.0% 62 2% 85 2% 68
Northwest Technical College – Bemidji 0.5% 17 0.6% 18 1% 22 1% 21
Pine Technical College 1.2% 40 1.5% 46 2% 74 2% 68
Rainy River Community College 0.2% 6 0.3% 9 0% 6 0%
16
Ridgewater College 2.9% 94 2.4% 75 2% 88 2% 80 Riverland Community College 2.1% 68 1.6% 49 1% 57 2% 65
Rochester Community and Technical College
1.7% 56 1.8% 56 4% 148 2% 82
St. Cloud State University 8.6% 283 9.0% 281 9% 366 8% 270
Saint Cloud Technical and Community College
1.9% 64 2.4% 74 2% 89 2% 58
Saint Paul College 2.2% 73 1.8% 56 2% 95 2% 78
South Central College 1.6% 51 2.1% 65 2% 81 2% 63
Southwest Minnesota State University 2.8% 91 1.8% 55 2% 80 2% 69
Vermillion Community College 0.3% 11 0.4% 13 0% 19 0% 14
Winona State Uni versity 4.2% 138 4.6% 144 5% 215 6% 205
Total 3284 3122 4027 3504

25 | P a g 2007/2010/2012/2014 Staff Development Survey Comparison
2007 2010 2012 2014
43. How many years have you been employed by Minnesota State Colleges and Universities or one of its predecessors?
Response
Percent
Response
Total
Response
Percent
Response
Total
Response
Percent
Response Total
Response
Percent
Response
Total 0-1 year 9.1% 304 6.1% 223 8% 326 8% 302
1-3 years 15.8% 529 17.2% 631 12% 497 15% 535
3-10 years 31.6% 1058 33.0% 1208 33% 1359 33% 1180 10-20 years 24.2% 810 22.4% 821 26% 1060 25% 874
20-30 years 13.9% 465 14.9% 547 15% 597 14% 484
Over 30 years 5.5% 184 6.4% 236 6% 243 5% 185
Total 3350 3666 4082 3560
2007 2010 2012 2014
44. What division/area do you report to? Response
Percent
Response
Total
Response
Percent
Response
Total
Response
Percent
Response Total
Response Percent
Response
Total Academic Affairs/Academic Department 21.3% 709 21.1% 764 23% 917 21% 744
Customized Training/Continuing Education 5.8% 192 5.5% 199 4% 170 4% 136
Development/Advancemen t/Foundation 2.6% 85 2.3% 83 2% 91 2% 75
Facilities/Building Services 7.5% 249 8.1% 295 9% 347 8% 287
Finance/Business Office 9.4% 314 8.7% 316 9% 345 9% 310
General Administrative Services 3.8% 127 3.7% 134 3% 137 3% 116
Human Resources 3.6% 119 3.8% 138 3% 122 3% 109
Information Technology 9.1% 302 9.6% 347 10% 387 10% 346
Marketing/ Public Relations/Communications 2.0% 66 1.7% 63 2% 75 2% 57
President’s Office/Chancellor’s Office 4.6% 153 3.7% 134 4% 152 3% 115
Student Affairs/ Student Services/Stud ent Life 22.3% 743 24.2% 876 24% 977 26% 896
Other (please describe) 8.1% 268 7.6% 277 8% 329 9% 321
Total 3327 3626 4049 3512
26 | P a g 2007/2010/2012/2014 Staff Development Survey Comparison
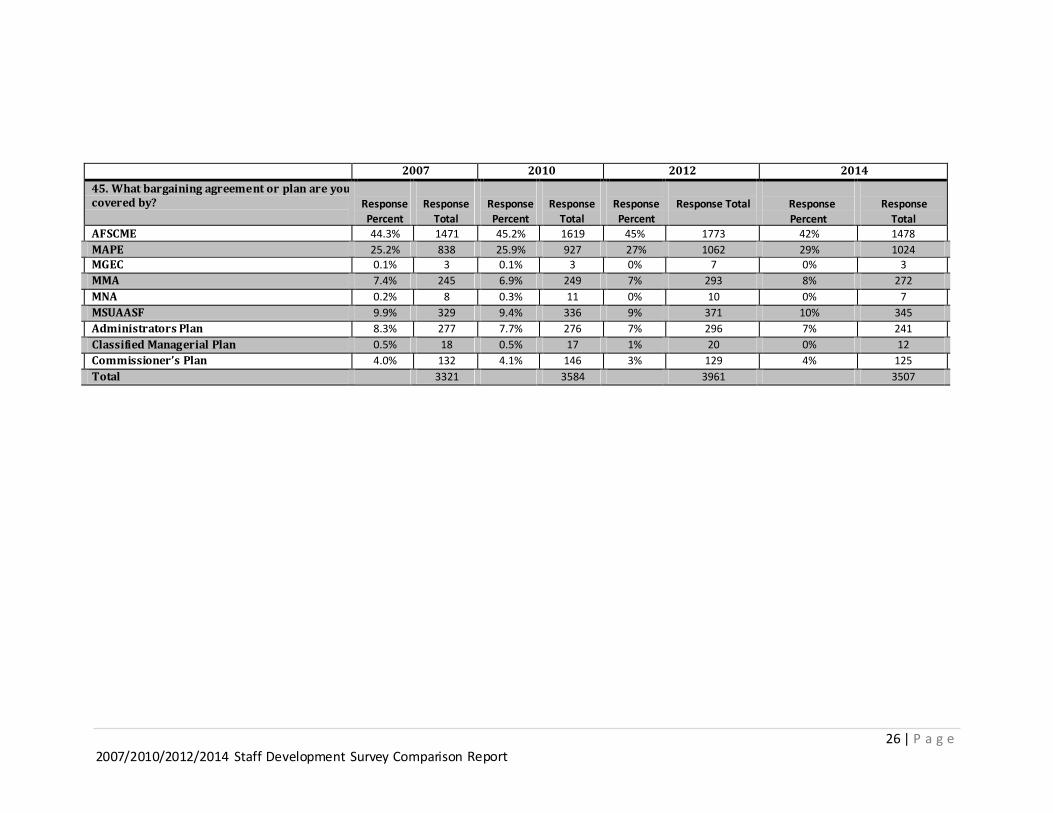
2007 2010 2012 2014
45. What bargaining agreement or plan are you covered by?
Response
Percent
Response
Total
Response
Percent
Response
Total
Response
Percent
Response Total
Response
Percent
Response
Total AFSCME 44.3% 1471 45.2% 1619 45% 1773 42% 1478
MAPE 25.2% 838 25.9% 927 27% 1062 29% 1024 MGEC 0.1% 3 0.1% 3 0% 7 0% 3
MMA 7.4% 245 6.9% 249 7% 293 8% 272
MNA 0.2% 8 0.3% 11 0% 10 0% 7
MSUAASF 9.9% 329 9.4% 336 9% 371 10% 345
Administrators Plan 8.3% 277 7.7% 276 7% 296 7% 241
Classified Manag erial Plan 0.5% 18 0.5% 17 1% 20 0% 12
Commissioner’s Plan 4.0% 132 4.1% 146 3% 129 4% 125
Total 3321 3584 3961 3507


![323970 1 En BookBackmatter 223. - Springer978-3-319-54224-9/1.pdf · 49. O. Haran, EPON vs. GPON, A practical comparison [html] (2005). . com/design/communications-design/40Q9354/EPON-vs-GPON-A-Practical-Comparison](https://img.pdfslide.us/doc/110x75/5b8868aa7f8b9a435b8dc896/323970-1-en-bookbackmatter-223-springer-978-3-319-54224-91pdf-49-o-haran.jpg)