Embed Size (px)
Citation preview

WORLD ANTIMONY FORUM
ANTIMONY RESOURCES
IN AUSTRALIATSX // MND
Andre Booyzen, GM Australasian Operations,
Mandalay Resources
Changsha, China
May 20 – 21, 2015

2
1. Mandalay Resources
2. Antimony in Australia
3. Costerfield Mine
Antimony in Australia

This presentation contains "forward-looking statements" within the meaning of applicable securities laws, including statements relating to life of
mine production plans, exploration plans and the growth and strategy of Mandalay. Actual results and developments may differ materially from
those contemplated by these statements depending on, among other things: exploration results or production results not meeting management’s
expectations; capital, production and operating cost results not meeting current plans; and changes in commodity prices and general market and
economic conditions. The factors identified above are not intended to represent a complete list of the factors that could affect Mandalay. A
description of additional risks that could result in actual results and developments differing from those contemplated by forward looking
statements in this news release can be found under the heading “Risk Factors” in Mandalay’s annual information form dated March 31, 2015 and
in its final prospectus dated September 2, 2014, copies of which are available under Mandalay's profile at www.sedar.com. Although Mandalay
has attempted to identify important factors that could cause actual actions, events or results to differ materially from those described in forward-
looking statements, there may be other factors that cause actions, events or results not to be as anticipated, estimated or intended. There can be
no assurance that forward-looking statements will prove to be accurate, as actual results and future events could differ materially from those
anticipated in such statements. Accordingly, readers should not place undue reliance on forward-looking statements.
Quality Control and AssuranceQuality control and assurance programs are implemented in line with the standards of National Instrument 43-101.
The exploration program at Costerfield is supervised by Chris Gregory (Member, Australian Institute of Geoscientists accredited Chartered
Professional (Mining)), General Manager of Australasian Business Development for Mandalay and a Qualified Person as defined under National
Instrument 43-101. Mr. Gregory regularly visits Costerfield, supervises the collection and interpretation of scientific and technical information
contained in this presentation.
The exploration programs on the Cerro Bayo project is supervised by Ronald Luethe (Member: American Institute of Professional Geologists and
an Idaho Registered Professional Geologist), General Manager of Mandalay Chile Ltda. and a Qualified Person as defined under National
Instrument 43-101. Mr. Luethe visits the Cerro Bayo project often, supervises the collection and interpretation of scientific and technical
information contained in this presentation.
Dr. Mark Sander (Member: AusIMM), President of Mandalay, has visited the Costerfield, Cerro Bayo, Challacollo, and Björkdal and has
supervised the preparation of this presentation.
All currency references in US$ unless otherwise indicated
Forward-looking Statements
3
2009
• Costerfield, Australia
• Gold & Antimony
2010• Cerro Bayo, Chile
• Silver & Gold
2013
• Challacollo, Chile
• Silver & Gold
2014
• Björkdal, Sweden
• Gold
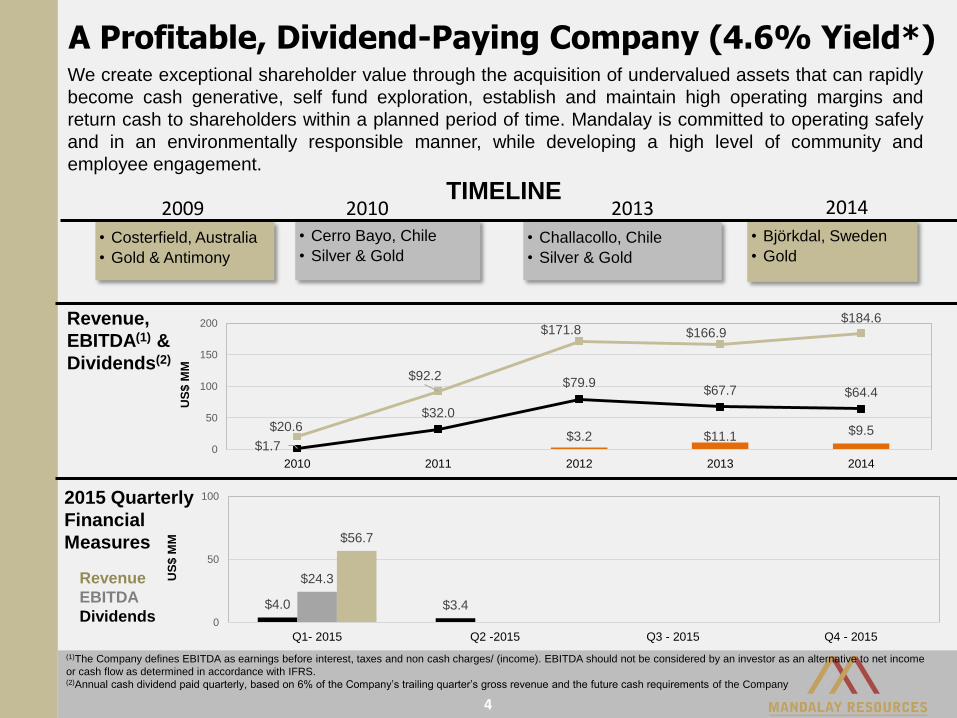
$3.2 $11.1 $9.5$20.6
$92.2
$171.8 $166.9$184.6
$1.7
$32.0
$79.9$67.7 $64.4
0
50
100
150
200
2010 2011 2012 2013 2014
US
$ M
M
A Profitable, Dividend-Paying Company (4.6% Yield*)
4
We create exceptional shareholder value through the acquisition of undervalued assets that can rapidly
become cash generative, self fund exploration, establish and maintain high operating margins and
return cash to shareholders within a planned period of time. Mandalay is committed to operating safely
and in an environmentally responsible manner, while developing a high level of community and
employee engagement.
(1)The Company defines EBITDA as earnings before interest, taxes and non cash charges/ (income). EBITDA should not be considered by an investor as an alternative to net income
or cash flow as determined in accordance with IFRS.(2)Annual cash dividend paid quarterly, based on 6% of the Company’s trailing quarter’s gross revenue and the future cash requirements of the Company
TIMELINE
2015 Quarterly
Financial
Measures
Revenue,
EBITDA(1) &
Dividends(2)
Revenue
EBITDA
Dividends$4.0 $3.4
$24.3
$56.7
0
50
100
Q1- 2015 Q2 -2015 Q3 - 2015 Q4 - 2015
US
$ M
M

5
Mining friendly operational jurisdictions with strong and diversified customer base
Operational Locations and Tradeflows

6
15,854 63,351
107,941 126,908
253,796
520,175 633,000
771,500
1,123,367
0
200,000
400,000
600,000
800,000
1,000,000
1,200,000
0
50,000
100,000
150,000
200,000
250,000
300,000
2010 2011 2012 2013 2014 2015
Oz A
u E
q.
Ye
ar-
En
d
Res
erv
es
Oz A
u E
q.
An
nu
al
P
rod
uc
tio
n
6
Reserves
Production
154,810
167,000 –
185,000 EGrowing Production and Reserves
Costerfield M&I Resource Additions & Depletion (Au Eq oz)
Bjorkdal M&I Resource Additions & Depletion (Au oz) Cerro Bayo M&I Resource Additions & Depletion (Ag oz)
Challacollo M&I Resource Additions & Depletion (Ag oz)

Financial Performance
7
Operational Performance
Q1, 2015 2014YE Q1, 2014 2013YE
Saleable Silver oz produced 590,755 3,329,519 743,569 3,145,537
Saleable Gold oz produced 27,740 77,900 13,105 50,240
Saleable Antimony t produced 969 3,639 858 3,275
Q1, 2015 2014YE Q1, 2014 2013YE
Net Cash/All-in cost/oz Ag at Cerro Bayo, $ 10.09 / 17.61 5.30 / 11.36 5.81 /11.31 6.84 / 12.07
Net Cash/All-in cost/oz Au Eq. at
Costerfield, $
566 / 744 771 / 1,035 800 / 1,052 819 / 1,062
Net Cash/All-in cost/oz Au Eq. at
Björkdal, $(1)
797 / 940 870 / 1,023 -(1) -(1)
EBITDA, $ million 24.3 64.4 16.0 67.7
Net Income, $ million 12.5 17.2 5.7 29.4
Cash and cash equiv., $ million 51.9 49.0 20.0 33.5
Q1 2015 Mandalay Performance
(1) Björkdal Acquired September 10, 2014
Site all-in costs include total cash operating costs, royalty expense, depletion, depreciation, accretion and write-off of exploration and evaluation.

8
Total Cerro Bayo Costerfield Björkdal
Saleable gold
production (oz)
101,000 – 116,000 23,000 – 27,000 32,000 – 37,000 46,000 – 52,000
Saleable silver
production (million oz)
2.7 – 3.1 2.7 – 3.1 -- --
Saleable antimony
production (t)
3,200 – 3,500 -- 3,200 – 3,500 --
Gold equivalent
production (oz)
167,000 – 185,000 -- -- --
Cash cost $/oz silver
net by-product
-- 6.00 – 8.00 -- --
Cash cost $/oz gold or
gold equivalent
-- -- 625 – 750 850 – 950
Capital expenditures
($ million)
38 – 44 12 – 14 16 – 18 10 – 12
Exploration ($ million) 7 3 1 3
Mandalay 2015 Full Year Production and Cost Guidance

9
1. Mandalay Resources
2. Antimony in Australia
3. Costerfield Mine
Antimony in Australia
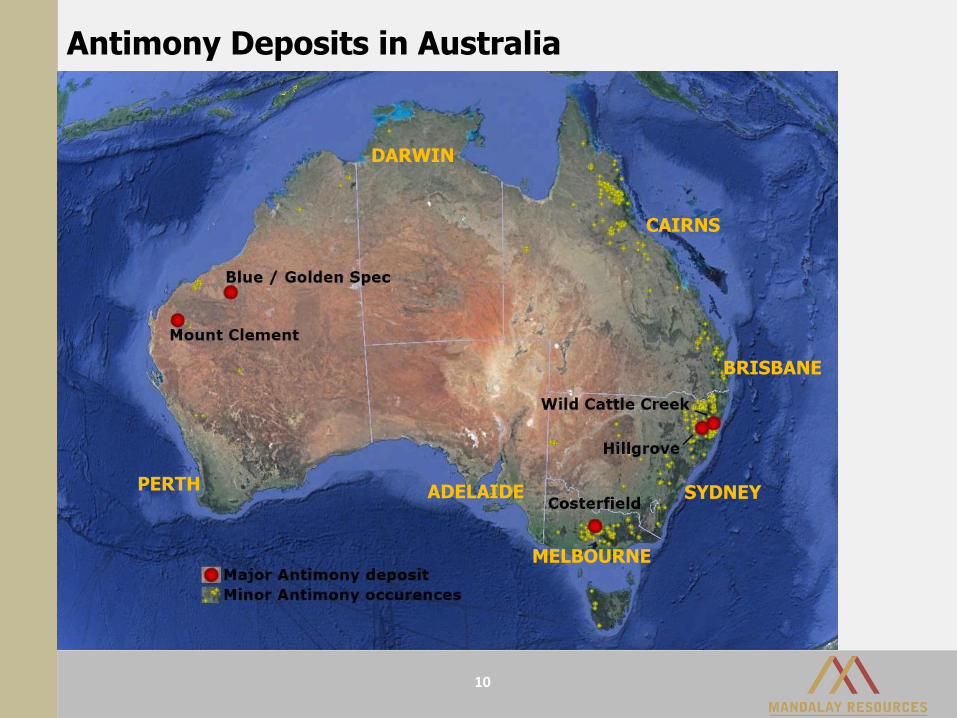
Antimony Deposits in Australia
MELBOURNE
PERTH SYDNEY
BRISBANE
DARWIN
CAIRNS
ADELAIDE
10
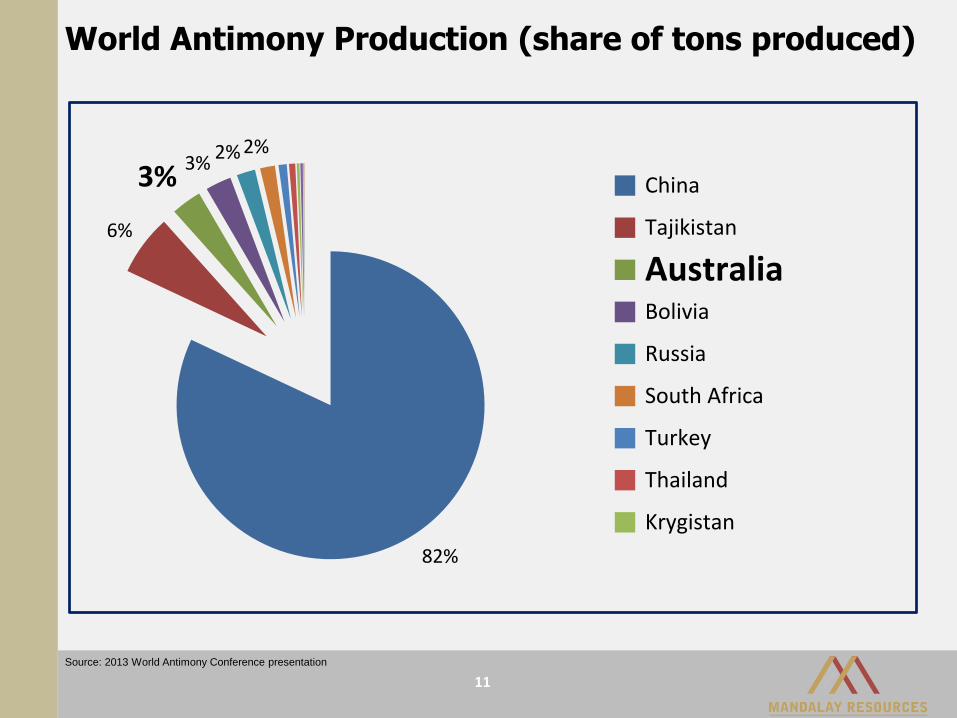
World Antimony Production (share of tons produced)
11
82%
6%
3%3%
2% 2%
China
Tajikistan
AustraliaBolivia
Russia
South Africa
Turkey
Thailand
Krygistan
Source: 2013 World Antimony Conference presentation

World Antimony Reserves (metal tonnes)
12
2,400,000
450,000
370,000
320,000
300,000
200,000
150,000
90,000 330,000China
Thailand
Russia
Bolivia
AustraliaSouth Africa
Tajikistan
USA
Other countries
Source: 2013 World Antimony Conference presentation
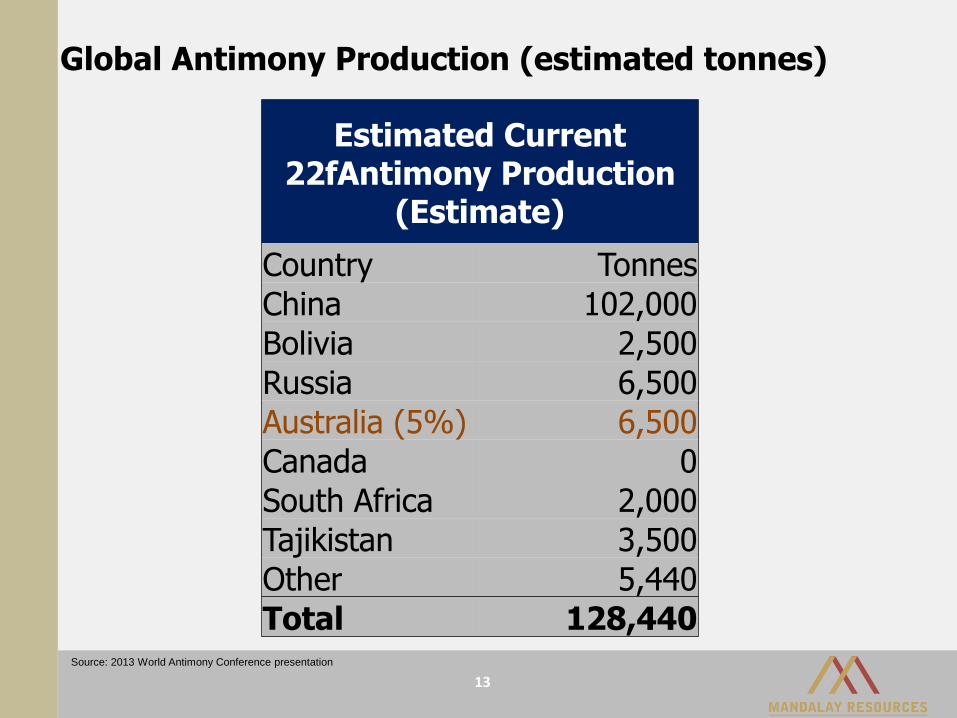
Global Antimony Production (estimated tonnes)
13
Estimated Current 22fAntimony Production
(Estimate)
Country Tonnes
China 102,000
Bolivia 2,500
Russia 6,500
Australia (5%) 6,500
Canada 0
South Africa 2,000
Tajikistan 3,500
Other 5,440
Total 128,440Source: 2013 World Antimony Conference presentation

Antimony Imports to China
14
Sb Ores/Concs Import (DMT) by China
2011 2012 2013 2014
Russia 10,702 18,851 20,761 16,055
Tajikistan 13,812 13,865 9,727 14,361
Australia (21%) 5,629 6,968 9,820 12,329
Myanmar 6,228 7,876 9,291 3,917
Kazakhstan 1,354 1,261 1,711 1,538
Bolivia 386 875 1,600 1,516
Thailand 7,989 6,059 5,238 1,490
Mexico 1,542 1,374 4 1,302
Laos 574 1,743 1,956 1,020
Peru 48 41 71 819
Zimbabwe 148 95 640 651
Turkey 0 0 646 611
Honduras 100 139 77 394
Iran 220 447 331 337
Kyrgyzstan 0 0 0 95
India 0 0 0 70
Morocco 22 0 0 69
Ecuador 0 0 0 23
South Africa 375 103 259 23
Indonesia 0 0 0 20
North Korea 22 40 50 10
Canada 9,574 6,811 1,237 0
Pakistan 58 516 1,004 0
Nigeria 0 0 72 0
Guatemala 0 0 18 0
Albania 0 956 0 0
Japan 128 43 0 0
Vietnam 1,012 515 0 0
Chile 39 0 0 0
TOTAL 59,961 68,580 64,515 56,649
Source: 2013 World Antimony Conference presentation

Antimony Resources in Australia
15

• Major deposits around Costerfield region. Long history of 150 years of
mining antimony.
• Deposits in Western Australia likely require substantially higher
antimony and/or gold prices.
• Hillgrove is understood to be ramping-up production, but not a public
company so current scale unconfirmed.
• Capital constraints exist for antimony exploration – funding today is
from active mine production.
• Unlikely to see new antimony ore producers from Australia in the near
future.
Costerfield is Australian antimony mining success story.
16
Future of Antimony Mining in Australia

17
1. Mandalay Resources
2. Antimony in Australia
3. Costerfield Mine
Antimony in Australia

Costerfield Gold-Antimony Mine: Overview
18
2015 Planned Exploration
Budget $1 million
Land package 1,293 hectares
Ownership 100%
2014 gold production 35,751 oz
2014 antimony production 3,639 t
2015E gold production 32,000 – 37,000 oz
2015E antimony production 3,200 – 3,500 t
P&P Reserves(1) 430,000 tonnes @ 8.1 g/t Au; 3.6% Sb
Current throughput 400 tpd
Plant recoveries (Q1 2015) Au: 89.9%, Sb: 95.0%
2015E Cash cost/oz Au Eq. / 2014A $625 - $750 / $771
(1) Refer to notes on reserves in the Appendix

Augusta Mine Site
19
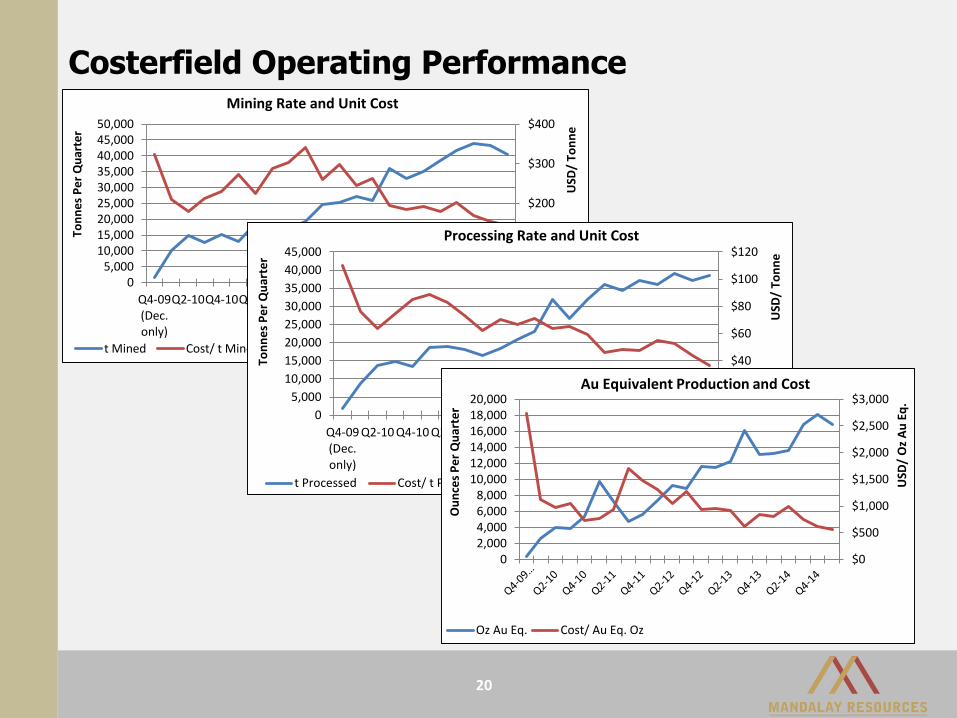
Costerfield Operating Performance
20
$0
$100
$200
$300
$400
05,000
10,00015,00020,00025,00030,00035,00040,00045,00050,000
Q4-09(Dec.only)
Q2-10Q4-10Q2-11Q4-11Q2-12Q4-12Q2-13Q4-13Q2-14Q4-14
USD
/ To
nn
e
Ton
nes
Pe
r Q
uar
ter
Mining Rate and Unit Cost
t Mined Cost/ t Mined
$0
$20
$40
$60
$80
$100
$120
0
5,000
10,000
15,000
20,000
25,000
30,000
35,000
40,000
45,000
Q4-09(Dec.only)
Q2-10 Q4-10 Q2-11 Q4-11 Q2-12 Q4-12 Q2-13 Q4-13 Q2-14 Q4-14
USD
/ To
nn
e
Ton
ne
s P
er
Qu
arte
r
Processing Rate and Unit Cost
t Processed Cost/ t Processed
$0
$500
$1,000
$1,500
$2,000
$2,500
$3,000
02,0004,0006,0008,000
10,00012,00014,00016,00018,00020,000
USD
/ O
z A
u E
q.
Ou
nce
s P
er
Qu
arte
r
Au Equivalent Production and Cost
Oz Au Eq. Cost/ Au Eq. Oz
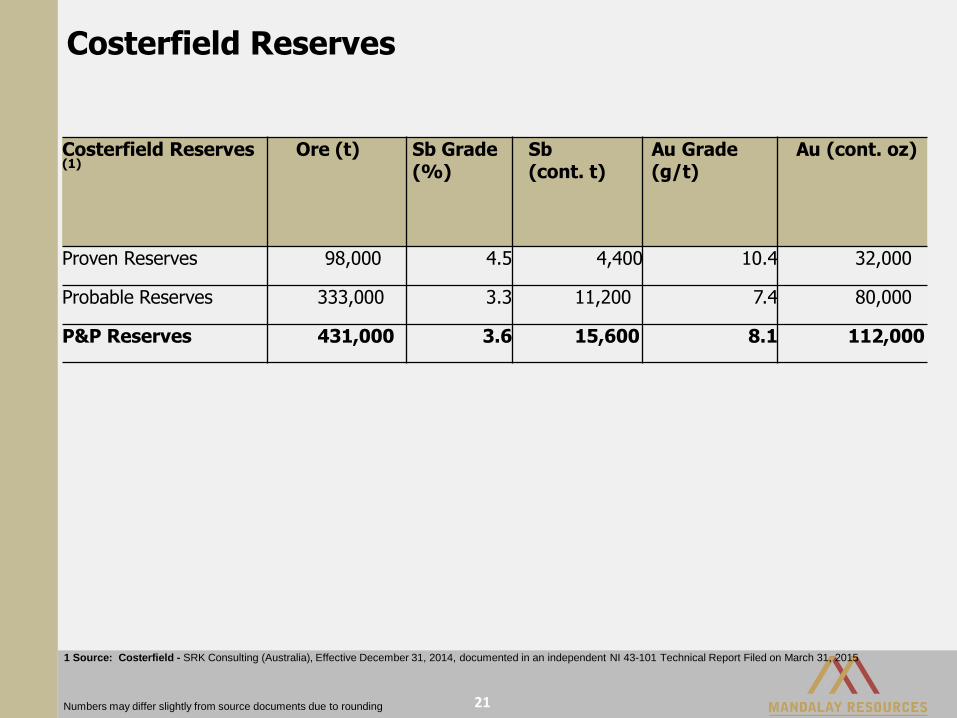
Numbers may differ slightly from source documents due to rounding 21
1 Source: Costerfield - SRK Consulting (Australia), Effective December 31, 2014, documented in an independent NI 43-101 Technical Report Filed on March 31, 2015
Costerfield Reserves(1)
Ore (t) Sb Grade(%)
Sb (cont. t)
Au Grade(g/t)
Au (cont. oz)
Proven Reserves 98,000 4.5 4,400 10.4 32,000
Probable Reserves 333,000 3.3 11,200 7.4 80,000
P&P Reserves 431,000 3.6 15,600 8.1 112,000
Costerfield Reserves
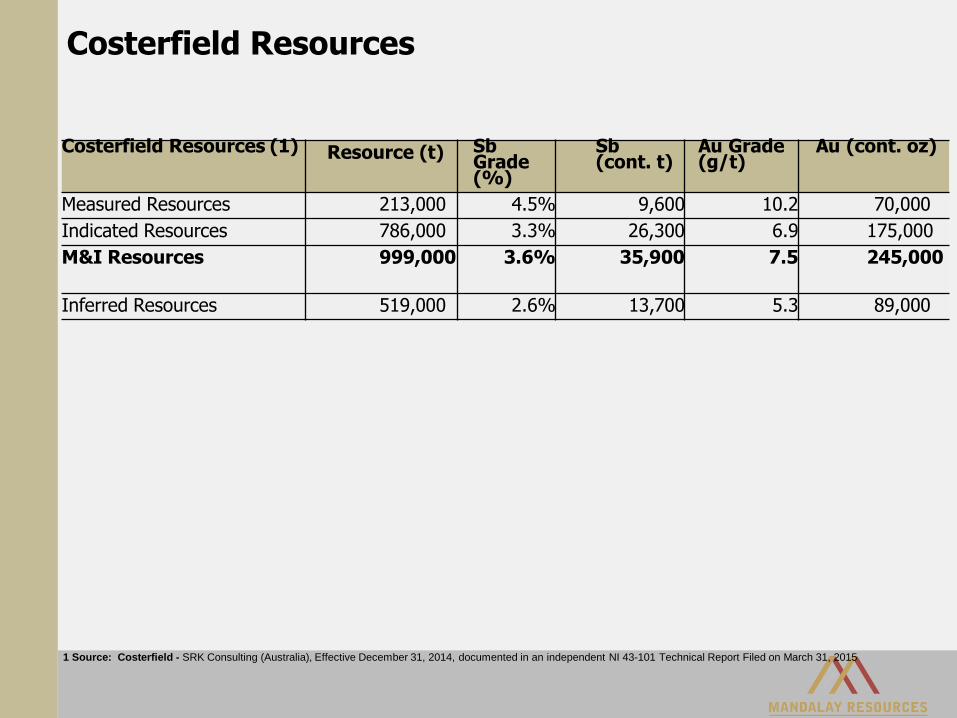
1 Source: Costerfield - SRK Consulting (Australia), Effective December 31, 2014, documented in an independent NI 43-101 Technical Report Filed on March 31, 2015
Costerfield Resources (1) Resource (t) Sb Grade (%)
Sb (cont. t)
Au Grade (g/t)
Au (cont. oz)
Measured Resources 213,000 4.5% 9,600 10.2 70,000
Indicated Resources 786,000 3.3% 26,300 6.9 175,000
M&I Resources 999,000 3.6% 35,900 7.5 245,000
Inferred Resources 519,000 2.6% 13,700 5.3 89,000
Costerfield Resources
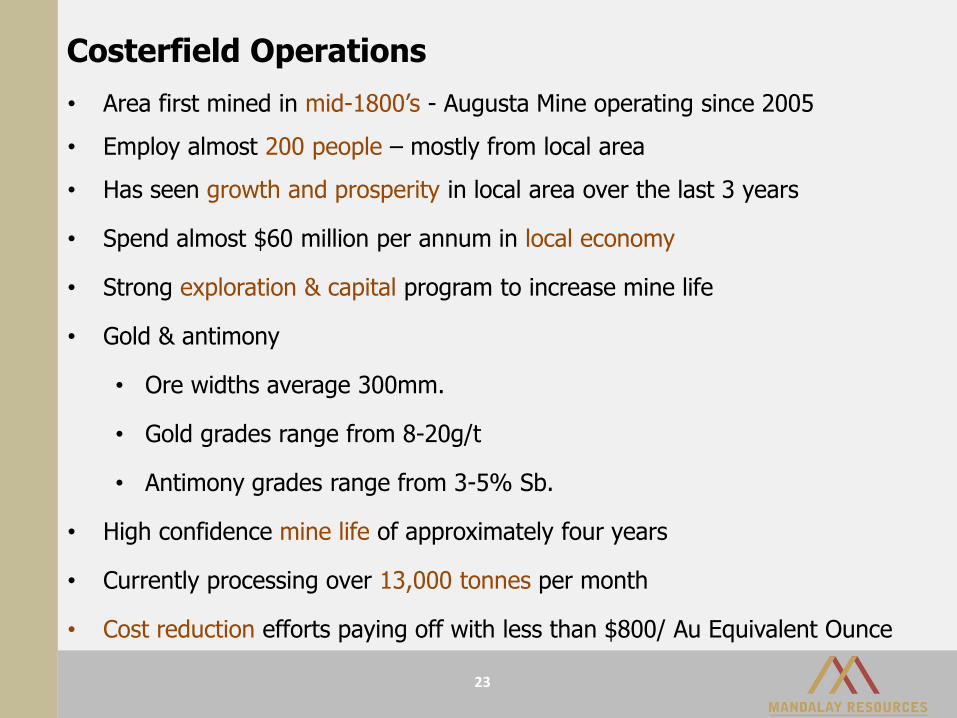
Costerfield Operations
• Area first mined in mid-1800’s - Augusta Mine operating since 2005
• Employ almost 200 people – mostly from local area
• Has seen growth and prosperity in local area over the last 3 years
• Spend almost $60 million per annum in local economy
• Strong exploration & capital program to increase mine life
• Gold & antimony
• Ore widths average 300mm.
• Gold grades range from 8-20g/t
• Antimony grades range from 3-5% Sb.
• High confidence mine life of approximately four years
• Currently processing over 13,000 tonnes per month
• Cost reduction efforts paying off with less than $800/ Au Equivalent Ounce
23

Costerfield Challenges in 2010 – now overcome
• Safety was unacceptable
• Staff morale poor – ineffective workforce
• Land acquisition – infrastructure and water disposal challenging
• Lack of cash – not making money
• Political and regulatory support
• High and rising costs
• Skills shortage in many areas
• Ground conditions
• Specialised narrow vein mine – labour intensive
• Operating restrictions – noise and zero discharge
• Electrical power required for growth
• Inefficient operations
24
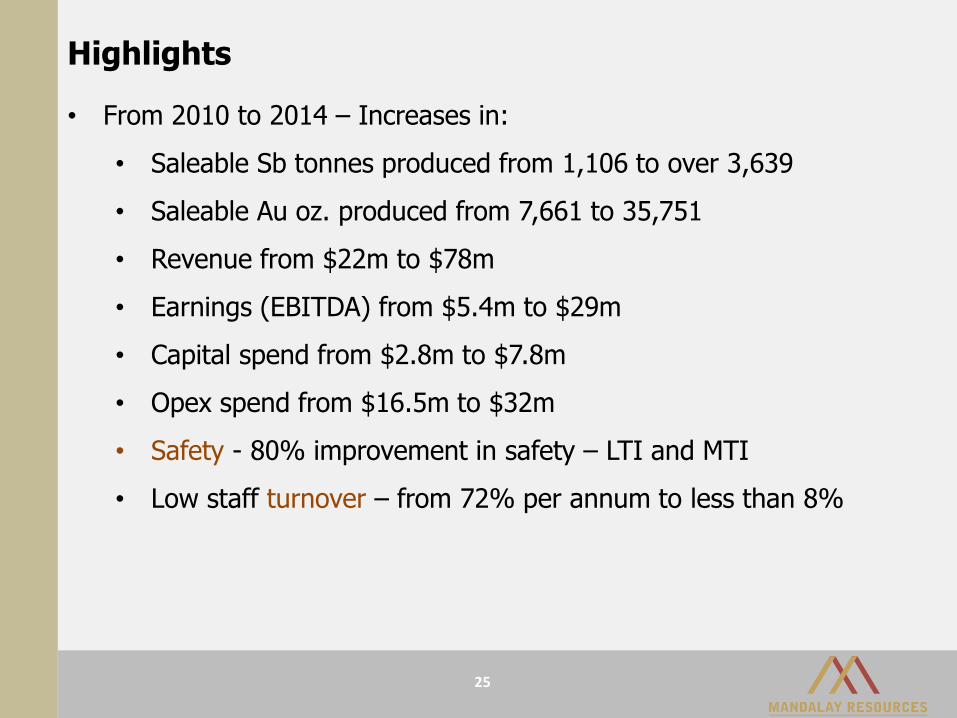
Highlights
25
• From 2010 to 2014 – Increases in:
• Saleable Sb tonnes produced from 1,106 to over 3,639
• Saleable Au oz. produced from 7,661 to 35,751
• Revenue from $22m to $78m
• Earnings (EBITDA) from $5.4m to $29m
• Capital spend from $2.8m to $7.8m
• Opex spend from $16.5m to $32m
• Safety - 80% improvement in safety – LTI and MTI
• Low staff turnover – from 72% per annum to less than 8%

• Culture of continuous improvement
• Incremental improvements across mining operations
• Empowered staff to realise cost savings in their own areas
• Improvement ongoing to drive bottom line and revenue growth
• Simple key indicators to manage the mine
• Management and supervisors enrolled in the culture
26
Mandalay Culture
Questions?
For more information, please contact:
Greg DiTomaso
Director, Investor Relations
Tel: 647.260.1566
Email: [email protected]
Company Website: www.mandalayresources.com
Twitter: @MandalayAuAg