Embed Size (px)
Citation preview
ORIGINAL ARTICLE
doi:10.1111/j.1558-5646.2009.00825.x
DEMOGRAPHIC SOURCE-SINK DYNAMICSRESTRICT LOCAL ADAPTATION IN ELLIOTT’SBLUEBERRY (VACCINIUM ELLIOTTII)Jill T. Anderson1,2,3 and Monica A. Geber1,4
1Ecology and Evolutionary Biology Department, Corson Hall, Cornell University, Ithaca, New York 148533E-mail: [email protected]: [email protected]
Received February 24, 2009
Accepted August 6, 2009
In heterogeneous landscapes, divergent selection can favor the evolution of locally adapted ecotypes, especially when interhabi-
tat gene flow is minimal. However, if habitats differ in size or quality, source-sink dynamics can shape evolutionary trajecto-
ries. Upland and bottomland forests of the southeastern USA differ in water table depth, light availability, edaphic conditions,
and plant community. We conducted a multiyear reciprocal transplant experiment to test whether Elliott’s blueberry (Vaccinium
elliottii) is locally adapted to these contrasting environments. Additionally, we exposed seedlings and cuttings to prolonged
drought and flooding in the greenhouse to assess fitness responses to abiotic stress. Contrary to predictions of local adaptation,
V. elliottii families exhibited significantly higher survivorship and growth in upland than in bottomland forests and under drought
than flooded conditions, regardless of habitat of origin. Neutral population differentiation was minimal, suggesting widespread
interhabitat migration. Population density, reproductive output, and genetic diversity were all significantly greater in uplands
than in bottomlands. These disparities likely result in asymmetric gene flow from uplands to bottomlands. Thus, adaptation to
a marginal habitat can be constrained by small populations, limited fitness, and immigration from a benign habitat. Our study
highlights the importance of demography and genetic diversity in the evolution of local (mal)adaptation.
KEY WORDS: Adaptation, flooding, gene flow, microsatellite markers, population structure, reciprocal transplant.
Environmental heterogeneity results in varying patterns of natu-
ral selection across the landscape (e.g., Heywood 1991; Dudley
1996; Nagy and Rice 1997). Divergent selection in alternate habi-
tats promotes adaptation of populations to local conditions (e.g.,
Hedrick 1986) and can drive differentiation in phenotypic and
phenological traits (e.g., Byars et al. 2007; Lowry et al. 2008).
If individuals mate assortatively, or hybrids exhibit reduced vi-
ability and fecundity, local adaptation can reproductively isolate
populations and foster incipient ecological speciation (Rieseberg
and Willis 2007; Lowry et al. 2008; Schluter 2009). Pervasive
interhabitat gene flow, in contrast, unifies populations and can
2Present address: Department of Biology, PO Box 90338, Duke Uni-
versity, Durham, North Carolina, 27708.
constrain the evolution of specialization because immigrants in-
troduce maladapted alleles and decrease the frequency of locally
adapted ecotypes (e.g., Slatkin 1985; Holt and Gomulkiewicz
1997; Stanton et al. 1997; Storfer et al. 1999; Hendry et al. 2002;
Langerhans et al. 2003).
This framework assumes that the quality of habitat patches
is relatively similar across the landscape; however, if habitat size
differs or fitness varies with habitat, source-sink dynamics can
influence the evolutionary trajectory of a species (Pulliam 1988;
Stanton and Galen 1997; Stanton et al. 1997; Turelli 1997). In
this scenario, the majority of the population is found in the source
habitat and natural selection favors traits that maximize fitness
there (Kawecki 2008). Source-sink dynamics can hinder adaptive
evolution in marginal habitats especially when adaptation to the
3 7 0C© 2009 The Author(s). Journal compilation C© 2009 The Society for the Study of Evolution.Evolution 64-2: 370–384
SOURCE-SINK DYNAMICS RESTRICT ADAPTATION
low-quality habitat comes at a cost of fitness in the source (Holt
and Gaines 1992; Kawecki 1995; Dias 1996; Kawecki 2008).
Even when habitat patches are equal in quality, asymmetrical
gene flow can establish source-sink dynamics (Kawecki and Holt
2002). For example, Mediterranean blue tits (Parus caeruleus)
inhabit both evergreen and deciduous forests and these habitats
differ in area across the landscape (Dias and Blondel 1996). This
species has the genetic variation necessary to adapt to both for-
est types, but source-sink dynamics result in local maladaptation
to the less common habitat within a region (Dias and Blondel
1996). Thus, evolution in heterogeneous landscapes depends on
the strength of divergent selection, the extent of genetic isolation
of populations in contrasting habitats, and differences in popula-
tion sizes and fecundity (Turelli 1997; Kawecki and Ebert 2004;
Leimu et al. 2006; Kawecki 2008).
The balance between migration and selection has long been
a central focus of evolutionary theory (Haldane 1930) and is
believed to be a driving force behind population divergence
and phenotypic evolution (Slatkin 1985; Hendry et al. 2001;
Lenormand 2002; Porter and Johnson 2002; Latta 2003). The-
oretical models predict that maladapted alleles can be maintained
in populations when gene flow swamps the effects of local selec-
tion (e.g., Hendry et al. 2001). Recently, a number of empirical
studies have demonstrated the constraining effects of gene flow on
local adaptation in vertebrates (Storfer et al. 1999; Hendry et al.
2002; Langerhans et al. 2003) and invertebrates (Nosil and Crespi
2004). Nevertheless, the importance of interhabitat gene flow in
natural plant populations remains unresolved. Plant populations
often adapt to very localized conditions due to their sedentary
nature, and strong selection can sustain population differentiation
despite extensive gene flow (Sambatti and Rice 2006). More em-
pirical studies are needed to analyze explicitly the influence of
gene flow, habitat quality, genetic variation, and population size
on the evolution of local adaptation in plants.
Our study examined the evolutionary dynamics of a peren-
nial shrub, V. elliottii Chapm. (Ericaceae), which inhabits both
upland and bottomland forests in the southeastern United States
(Radford et al. 1968; Godfrey and Wooten 1981). Bottomland
forests are dynamic systems that experience annual floods (Burke
et al. 1999) and have significantly greater soil moisture, bulk
density, and nutrient concentrations, and lower light levels than
upland forests (Anderson 2009). In contrast, drought stress can
be pronounced in the nutrient-poor sandy soils of upland forests
(Megonigal et al. 1997; Burke et al. 1999). Thus, divergent selec-
tion could lead to different phenotypic optima in these contrast-
ing habitats. Nonetheless, upland forests have greater density of
V. elliottii adults than bottomland forests (Anderson, pers. obs.),
suggesting that source-sink dynamics could influence adaptive
evolution in this species (Leimu et al. 2006; Kawecki 2008). We
designed our study to test whether spatial heterogeneity favors
local adaptation to contrasting habitats or interhabitat gene flow
restricts adaptive population differentiation, potentially resulting
in local maladaptation in ecologically marginal populations. We
selected upland and bottomland populations that abutted a sharp
ecotone, as well as more remote populations. This design per-
mitted us to test whether remote populations expressed a greater
degree of local adaptation than ecotonal populations, where inter-
habitat gene flow is likely to be high. To address our objectives, we
(1) conducted a multiyear reciprocal transplant experiment across
a complex gradient in hydrology, soil chemistry, and light avail-
ability; (2) isolated the effects of flooding and drought on plant fit-
ness in a greenhouse experiment; (3) analyzed genetic population
differentiation using microsatellite markers; and (4) implemented
a demographic study. This study advances our understanding of
the evolutionary dynamics of long-lived woody species, which are
understudied relative to herbaceous annuals and biennials (e.g.,
Leimu et al. 2006; Leimu and Fischer 2008).
Materials and MethodsFOCAL SPECIES
V. elliottii, a species of highbush blueberry reaching 1–3 m in
height, is widely distributed throughout the Southeast in season-
ally flooded bottomland and xeric upland forests (Radford et al.
1968; Godfrey and Wooten 1981). Bottomland and upland popu-
lations of this species are fully intercompatible. In a complemen-
tary study, we conducted cross-pollinations between individuals
in three upland and three bottomland populations in 2005 and
2006. Interhabitat crosses produced similar quantities of seeds
as intrahabitat crosses, seeds from both types of crosses germi-
nated readily and seedling survivorship has not varied by cross
type (J. T. Anderson, unpubl. data). Vaccinium flowers are insect-
pollinated and the seeds are animal-dispersed (Martin et al. 1951);
therefore, substantial gene flow between populations is possible,
potentially leading to low levels of population genetic differenti-
ation (Loveless and Hamrick 1984). Naturally recruited individ-
uals from upland and bottomland forests exhibit distinct foliar
and root-based phenotypes, which may be related to water stress
(Anderson 2009).
STUDY SYSTEM
The primary field site, Beidler Forest (N 33◦12, W 080◦18) in
the Four Holes Swamp watershed in the coastal plain of South
Carolina, consists of approximately 6475 hectares of bottomland
hardwood and swamp forests with conservation easements in xeric
upland forests (Porcher 1981; N. Brunswig, pers. comm.). Four
Holes Swamp is a diffuse brown-water floodplain system, which
averages 1.5–2.5 km wide (Porcher 1981). We also sampled pop-
ulations in the Pee Dee and Santee watersheds; however, popula-
tion genetic analyses were restricted primarily to the Four Holes
EVOLUTION FEBRUARY 2010 3 7 1

J. T. ANDERSON AND M. A. GEBER
Watershed (see Table S1 and Fig. S1 for geographical coordinates
of populations). All three sites lie within the Coastal Plain of South
Carolina and have similar average temperatures and rainfall lev-
els (NOAA 2002). In these watersheds, we sampled 7–9 popula-
tions from each of four forest types (32 total populations): remote
bottomlands (0.75–1.04 km from the nearest upland forest), re-
mote uplands (0.8–3.7 km from the nearest bottomland forest),
ecotonal uplands and their corresponding ecotonal bottomlands
(ecotonal populations <0.05 km apart). We located populations
with GIS-based maps from the U.S. Fish and Wildlife Service,
which identify habitats using National Wetland Indicator habitat
codes; this strategy minimized environmental differences between
sites within each habitat. The plant species composition of upland
and bottomland forests differs substantially (Porcher 1981) and
V. elliottii is the only species that was abundant enough in both
habitats for this study. In our statistical analyses (described be-
low), we distinguished between the effects of habitat of origin
(hereafter: habitat) and population proximity to the alternate habi-
tat (hereafter: proximity; coded as ecotone or remote).
Interannual variation in flooding duration is high in bottom-
land hardwood forests. Floods in bottomland forests of Four Holes
Swamp have lasted a total of 3–139 days/year since 1977 (aver-
age ± SD: 43.6 ± 36.1 days/year; Brunswig, N. and Dawson, M.,
Audubon Society, unpubl. data). Flood waters are only several
centimeters deep during flood events in this habitat. Precipitation
records at the field site also show periods of infrequent rainfall,
which ranges from 0 to 376.7 mm/month during the growing
season (average ± SD: 125.3 ± 79.8 mm/month; Brunswig and
Dawson, unpubl. data); this variability can result in drought stress
in upland forests. Additionally, soil nutrient levels are signifi-
cantly higher in the clay-rich soils of the bottomlands and light
availability in the understory is significantly lower under the dense
canopy of bottomland forests (Anderson 2009).
DEMOGRAPHY
To determine whether population size and reproductive fitness
varied by habitat, we established two 50 m × 10 m transects per
site in each of two remote and ecotonal upland and bottomland
habitats in April 2008 (n = 8 sites; 13 total transects; only one
transect was used at each of three sites). In both transects per site,
we recorded the abundance of adult plants (>50 cm tall, with
stems >0.5 cm diameter at the base; this size is the smallest at
which individuals flower in the field); we were careful to count
stems that represented distinct individuals (not clones). In one
transect per site, we quantified the total number of reproductive
structures (flower buds, flowers, and developing fruits) on each
adult. We conducted separate mixed model ANOVAs to test the ef-
fects of habitat, proximity, their interaction, and site nested within
habitat (a random effect) on two response variables: adult abun-
dance (Poisson distribution, Proc Glimmix, SAS ver. 9.2, SAS
Institute, Cary, NC) and per capita reproductive output (sum of all
reproductive structures per individual, Proc Mixed). As a Poisson
distribution showed poor fit to the model for the reproductive data,
we used a natural log transformation of reproductive structures
(+0.5 due to 0 values). Additionally, in March 2006, we counted
all reproductive structures on a haphazardly selected branch of
3 cm diameter on adult individuals in three remote upland and
three remote bottomland populations in the Four Holes Water-
shed (n = 28 adults total in upland habitat and 27 adults total in
bottomland habitat). A mixed model ANOVA tested the effect of
habitat on per capita reproductive fitness, with site nested within
habitat as a random effect; no data transformations were necessary
for this analysis.
RECIPROCAL TRANSPLANT EXPERIMENT
To test for local adaption, we conducted a multiyear reciprocal
transplant experiment. If V. elliottii exhibits local adaptation, but
there is interhabitat gene flow, adults could show greater adaptive
population divergence than juveniles; therefore, we transplanted
both seedlings and cuttings from adults. In 2004 and 2005, we
collected 4000 cuttings from adult V. elliottii individuals in 32
populations (populations: n = 9 remote upland; 7 remote bottom-
land; 8 ecotonal upland; 8 ecotonal bottomland). Cuttings were
made from new growth and were 10 cm in length. We removed all
but 2–3 leaves, applied rooting hormone (Rhizopon AA #3, 0.8%
IBA, Rhizopon bv, Hazerswoude, Holland), and placed cuttings
under an automated misting system until roots established (two
to three months). Rooted cuttings were grown in the greenhouse
until May (2005 and 2006) when they were transported to the field
site; they were approximately 20 cm tall and had woody stems at
planting. Because V. elliottii seeds are difficult to monitor in the
field due to their small size, we planted seedlings. In 2005, seeds
were collected from plants in 16 populations (n = 4 populations
in each habitat by proximity configuration) and were germinated
in the laboratory. Seedling families, which likely consist of a mix-
ture of half- and full-siblings, were planted in the field in 2006
when individuals were roughly 12 cm tall.
In 2005 and 2006, we transplanted individuals at 1 m intervals
in grids within the matrix of naturally recruiting vegetation in two
upland and two bottomland sites in Four Holes Swamp (data
on abiotic conditions available in Table S2). In 2005, we used
only cuttings (n = 1685 cuttings from 399 genotypes and 22
populations), whereas in 2006, we included both cuttings (n = 548
from 106 genotypes and 22 populations) and seedlings (n = 814
from 81 families and 16 populations). There were 14 populations
in common between the 2005 and 2006 transplant experiments, 7
populations unique to 2005 and 11 unique to 2006. We planted two
to three individuals per clone or seedling family in both upland
and bottomland habitats; however, in a small number of cases, we
could plant only one individual per family per habitat. Individuals
3 7 2 EVOLUTION FEBRUARY 2010

SOURCE-SINK DYNAMICS RESTRICT ADAPTATION
within a family were randomly assigned to bottomland or upland
transplant sites. Within a site, planting was done haphazardly so
that families were not spatially clumped. Prior to planting, we
measured the stem diameter(s) at the base of each individual to
estimate initial biomass (one analysis for both life history stages:
biomass0.5 = −0.29 + 0.59 × total stem diameter − 0.013 ×total stem diameter2 + 0.17 [added for cuttings only]; F3,88 =410, P < 0.0001, R2 = 0.94, n = 39 cuttings + 50 seedlings).
We watered all plants two times per week for two weeks after
outplanting.
Mortality censuses were conducted two to four times per
growing season from 2005 to spring 2008. To calculate relative
growth rate (RGR), we measured the diameter at the base of
each stem in October 2006 (for cuttings planted in 2005) and in
October 2007 (for all plants: cuttings planted in 2005 and cuttings
and seedlings planted in 2006). Statistical analyses are described
below.
The two transplant years differed substantially in abiotic
stress. The mean monthly rainfall in 2005 was 51 mm greater than
average growing season levels (N. Brunswig and M. Dawson,
unpubl. precipitation records). A 45-day flood occurred that
year after approximately half of the bottomland transplants were
planted. The water table was consistently high even after the
flood waters subsided. In contrast, 2006 was substantially drier
with monthly precipitation 16 mm less than the average growing
season value. By replicating this reciprocal transplant experiment
in two years, we were able to assess the effects of interannual
environmental variability on V. elliottii survivorship and
growth.
GREENHOUSE EXPERIMENT
In the greenhouse, we quantified performance of cuttings and
seedlings in response to prolonged drought and flooding. For
this experiment, we randomly allocated multiple individuals per
seedling and cutting families to two treatments: (1) flooded (wa-
ter level 5 cm above soil) and (2) drought (watered once per
week). Here, drought refers to a sustained period of infrequent
water availability. We measured initial stem diameter to estimate
initial biomass. To ensure that individuals had adequate time to
respond to treatment, we gradually exposed plants to increas-
ing or decreasing soil saturation over one month, beginning Oc-
tober 30, 2006. The treatments reached their final flooding or
drought levels on November 27, 2006 and were maintained until
May 4, 2007. We conducted mortality censuses every 7–10 days
on 201 families of seedlings and cuttings (n = 271 seedlings
from 87 families of 16 populations; n = 458 cuttings from
133 families of 25 populations). During the experiment, we
watered drought-stressed plants to saturation once per week
(∼150 mL of water/plant, volumetric water content of ∼32%
mL water/mL soil + water).
Treatment levels were determined based on long-term flood-
ing records from the field site, as well as a previous pilot ex-
periment. In our pilot experiment, we found that daily watering
optimizes V. elliottii growth and survivorship under our green-
house conditions (27–30◦C, 20–30% relative humidity, and 12-h
supplemental lighting). In the drought treatment, the soil dried
completely within three days of watering, resulting in a weekly
average of ∼8% volumetric water content, which is below the
volumetric water content that we measured in upland forests
in March 2007, 2008, and 2009 (mean ± SE: 11.3% ± 0.01,
J. T. Anderson unpubl. data). The drought imposed in the green-
house was likely more severe than most droughts that V. elliottii
experiences in nature as greenhouse plants do not have access to
a water table and are exposed to full light. To inform the flood-
ing treatment, we consulted a 30-year water level data set for the
Beidler Forest watershed (N. Brunswig and M. Dawson, unpubl.
records). Although the flooding period fluctuates considerably
from year to year, floods over 100 days of duration are not un-
common (up to 139 days in 2003). Individuals in both treatments
showed classical signs of stress, such as wilting, leaf abscission,
stem death, and biomass senescence. The prolonged drought and
flooding conditions in the greenhouse experiment are relevant to
conditions that plants could encounter in the field during extreme
years.
Prior to the experiment, plants were grown under well-
watered greenhouse conditions for ∼6 months. To provide space
for continued growth, we transferred all individuals from small
(SC10 Super Cell conetainers: volume = 164 mL) to larger cone-
tainers (Deepot D25L: volume = 410 mL, Stuewe and Sons, Inc.,
Corvallis, OR) in September 2006. We used a 1:1 mixture of peat
moss and sand to mimic the naturally acidic soil in the field.
The experiment consisted of 54 blocks, evenly divided between
treatments. Each block contained a conetainer tray cut to fit in a
14 gallon plastic bin (Rubbermaid Home Products, Fairlawn, OH)
with drainage holes drilled into the bottom of the drought bins. We
included seedlings and cuttings, as well as individuals of multiple
populations from remote and ecotonal upland and bottomlands
in each block. We rotated all blocks weekly and fertilized four
times during the experiment (November, December, February,
and March; Miracle-Gro Azalea, Camellia, Rhododendron Plant
Food, Scotts Miracle Gro Inc., Marysville, OH, 30:10:10 N:P:K).
At the end of the experiment, we harvested all living individuals,
dried (50–60◦C for four to five days), and weighed the biomass.
AnalysesLocal adaptation can be detected through genotype by environ-
ment interactions (G × E) in fitness, where genotype refers to the
habitat of origin of a genotype or family and environment refers
to either transplant environment (field) or treatment (greenhouse).
If interhabitat gene flow restricts adaptive population divergence,
EVOLUTION FEBRUARY 2010 3 7 3

J. T. ANDERSON AND M. A. GEBER
we predict that individuals from ecotonal populations (where gene
flow is likely high) will have reduced fitness relative to individ-
uals from remote populations within the home environment, but
enhanced fitness in the alternative environment (habitat of origin
× proximity × environment interaction). Survivorship and rel-
ative growth rate (RGR) were the fitness components for both
experiments because very few plants flowered. Fitness was ana-
lyzed as a function of habitat of origin (G), transplant habitat or
treatment (E), proximity (ecotone vs. remote), life history stage
(greenhouse experiment and 2006 transplants only), their inter-
actions, and initial plant size. In all analyses, we accounted for
nonindependence of individuals from the same family and popu-
lation by including family nested within population as a random
effect. We did not have sufficient denominator degrees of freedom
to include transplant site nested within environment or population
nested within habitat by proximity as random effects. We incor-
porated transplant site nested within environment as a fixed effect
to control for the effect of site while testing other predictors. All
analyses were conducted in SAS ver. 9.2, except as noted.
Fitness component: relative growth rateIn the field experiment, RGR was calculated as (ln(diametert) −ln(diameteri))/t, where t is elapsed time (in months), diametert
is the sum of the diameters at the base of each stem at time
t, and diameteri is the initial diameter. The three sets of RGR
measurements include (1) first year growth for 2005 transplants
(measured October 2006), (2) second year growth for 2005 trans-
plants (measured October 2007), and (3) first year growth for
2006 transplants (measured October 2007). We conducted a re-
peated measures analysis of variance (ANOVA) (Proc Mixed) on
the first and second year RGR values from the 2005 transplants
with a repeated statement for year. We analyzed RGR of the 2006
transplants separately (Proc Mixed).
In the greenhouse experiment, RGR was calculated as
(ln(final biomass)−ln(initial biomass))/t, where t is elapsed time
(in months) and initial biomass was estimated from initial diam-
eter measurements. Block nested within treatment was included
as a random effect in a mixed model ANOVA (Proc Mixed).
Fitness component: survivorshipSurvivorship was monitored 10 (2005 transplants) and eight (2006
transplants) times in the field experiment from planting until April
2008 and 16 times in the greenhouse experiment. We conducted
discrete-time survivorship analyses (Cox proportional hazards
models) separately for the two transplant years and the greenhouse
experiment. Random effects (frailty) modeling permits the analy-
sis of clustered survivorship data, which arise when time-to-event
data are collected on family members (e.g., Kelly 2004). We mod-
eled time until death with a Bayesian approach in WinBUGS ver.
1.4.3 (Imperial College and Medical Research Council, London,
United Kingdom, Bayesian Analysis using Gibbs Sampling; Lunn
et al. 2000) because standard statistical software cannot accom-
modate multiple random effects in survivorship analysis (Kelly
2004). We included family by population of origin as gamma-
distributed random variables and assumed these random state-
ments operated multiplicatively on the baseline hazard, which is
appropriate for clustering at the family level (Sastry 1997; Koissi
and Hognas 2005). In the greenhouse analysis, we incorporated
an additive random effect for block and excluded individuals that
died before final treatment levels were reached on November 27,
2006. We used uninformative priors with 100,000 iterations fol-
lowing a burn-in of 10,000. Convergence was assessed with diag-
nostics in Bayesian Output Analysis Program (Smith 2005). Cox
proportional hazards models assume that the difference in haz-
ard rates between treatments remains similar across time periods;
when this assumption was violated, we included time-dependent
predictor variables in the model (Cox 1972). The WinBugs codes
and datasets are available from the first author.
Fitness trade-offsWe tested whether fitness in bottomland sites (or flooded con-
ditions) comes at the cost of fitness in upland sites (or drought
treatment) in separate analyses for the two years of transplanting
and for the greenhouse experiment. To assess trade-offs in fit-
ness, we regressed family-level RGR and survivorship (number
survived/number planted) in bottomland (or flooded conditions)
against habitat of origin and family level RGR (Proc Mixed) or
survivorship (logistic regression in Proc Glimmix) in upland (or
drought conditions). We included population as a random effect.
For the 2006 transplants and the greenhouse experiment, we also
included life history stage, and interactions between fitness and
life stage. For these analyses, we excluded any families that were
not represented in both transplant environments or both green-
house treatments.
POPULATION GENETIC DIFFERENTIATION
Genetic differentiation can increase during ontogeny, when mal-
adapted seedlings that are the product of gene flow are eliminated
by selection; changes in genetic structure can, therefore, illumi-
nate the action of selection at different ontogenetic stages (Kalisz
et al. 2001; Kittelson and Maron 2001). We used microsatellite
markers to characterize interhabitat gene flow and genetic diver-
sity at two life history stages: adults and seeds. We used seeds
because naturally recruited seedlings and juveniles of V. elliottii
are rare at our field sites (Anderson, pers. obs.). Microsatellites
are highly informative in estimating gene flow (Hamilton et al.
1999) because they are codominant, (putatively) selectively neu-
tral, and highly variable regions of DNA (Jarne and Lagoda 1996).
We haphazardly sampled 315 adults from 17 populations in Four
Holes Watershed (mean ± SE, n = 18.5 ± 1.3 individuals per
population, see Table S3 for information on sampling locations
3 7 4 EVOLUTION FEBRUARY 2010
SOURCE-SINK DYNAMICS RESTRICT ADAPTATION
and sample sizes). Leaf samples were either collected in the field
and stored in silica gel until DNA extraction with Qiagen plant
kits (Qiagen Inc., Valencia, CA), or collected from living cuttings
in the greenhouse and ground fresh in liquid N2. During June and
July 2006 and 2007, we collected seeds directly from adults in 15
populations, germinated them in the lab, and extracted DNA from
fresh leaf tissue of 174 seedlings (n = 11.6 ± 0.73 individuals
per population). Predispersal seeds provide information on pollen
movement.
We used eight primers from a microsatellite library developed
for the heterospecific V. corymbosum (NA961, NA398,CA94F,
CA23F, CA787F, CA169F, CA855F, and CA190R) (Boches et al.
2005). Polymerase chain reaction (PCR) annealing temperatures
were the same as in Boches et al. (2005), but MgCl2 concentra-
tions were optimized for NA398 and CA94F. The 5′ end of each
primer was fluorescently labeled with NED (CA169F, NA398,
CA94F), 6-FAM (CA190R), PET (CA23F, CA855F), or VIC
(NA961, CA787F). Genotypes were resolved by electrophore-
sis using an ABI 3100 capillary sequencer in the evolutionary
genetics core facility at Cornell University. Data were collected
and scored with GeneMapper v. 3.0. We verified each allele score
manually and reamplified and rescored samples with potentially
problematic peaks (Dewoody et al. 2006). We also compared
genotypes of adults with their corresponding offspring for 86
pairs in the program CERVUS 3.0 (e.g., Hoffman and Amos 2005);
when mother and offspring did not share a common allele, both
individuals were reamplified. We assessed gametic disequilib-
rium among loci in GENEPOP (Rousset 2008), selective neutrality
in FDIST2 (Beaumont and Nichols 1996), and null alleles and scor-
ing errors in MICRO-CHECKER using individuals that amplified at
all loci (n = 465) to eliminate samples with potentially degraded
DNA (a subset of leaves stored in silica gel) (Van Oosterhout
et al. 2004).
We assumed an infinite allele mutational model because it
is more robust to violation than the stepwise mutational model
(Selkoe and Toonen 2006) and because one polymorphic locus
(CA855F) contained a compound repeat for which the stepwise
model is not appropriate. We tested for deviation from Hardy–
Weinberg equilibrium for each population and locus combination
for seeds and adults using GENALEX (Peakall and Smouse 2006).
We used FSTAT (Goudet 1995, ver. 2.9.3.2) to calculate observed
(HO) and expected heterozygosity (HE), F-statistics and pairwise
FST using the estimators of Weir and Cockerham (1984). A sim-
ple Mantel test using the program zt (100,000 iterations, Bonnet
and Peer 2002) assessed the difference in pairwise FST values be-
tween seeds and adults for the 15 populations for which we had
data at both life history stages. To assess isolation by distance,
and to detect whether intrahabitat gene flow exceeds interhabitat
gene flow, we used a partial Mantel test (100,000 iterations in zt)
to assess the correlation between pairwise genetic differentiation
(FST/(1 − FST)) and geographic distance (natural logarithm trans-
formed) (Rousset 1997) in a habitat context for both undispersed
seeds and adults. The habitat matrix included values of 1 for pop-
ulation pairs located in the same habitat, and 2 for population
pairs in opposing habitats.
POPULATION GENETIC DIVERSITY
We calculated standard metrics of within population genetic di-
versity using HP-RARE (Kalinowski 2005): allelic richness rarefied
to a sample of 10 genes, which was the minimum sample size per
locus per population after correction for null alleles (mean sample
size ± SE: 29.8 ± 0.79 genes; maximum: 56 genes); rar-
efied private allele richness, which measures the number of
unique alleles within a population; and expected heterozygosity
(HE), which represents the probability that two randomly cho-
sen alleles from a population are different (Kalinowski 2004;
Vellend 2004). We conducted a mixed multivariate analysis of
variance (MANOVA, Proc Mixed) to test the effects of life
history stage (seed vs. adult), habitat (bottomland vs. upland),
proximity (ecotone vs. remote), and two- and three-way inter-
actions on these response variables, with locus and life history
stage nested within population as random effects. Because the
MANOVA produced significant results (online Table S4), we
implemented univariate mixed ANOVAs to test each response
variable independently. These analyses were conducted in Proc
Glimmix with two R-sided covariance structures (equivalent to a
repeated statement) for the random effects of locus nested within
population and life history stage within population (Proc Glim-
mix: http://support.sas.com/rnd/app/papers/glimmix.pdf).
POPULATION GENETIC STRUCTURE
We assessed population structure with the Bayesian clustering
program STRUCTURE to assign individuals to K populations
(Pritchard et al. 2000). We conducted STRUCTURE analyses for
K = 1 to K = 15 (seeds) and K = 17 (adults) with 1 million
generations after a 200,000 MCMC (Markov Chain Monte Carlo)
burn-in to generate the posterior sample distribution for 10 iter-
ations at each level of K. We used the admixture and correlated
frequency models with λ = 1 for both life history stages and
determined the optimal value of K by comparing ln P(D) (the
likelihood of the data, given each value of K) at different K, fol-
lowing Pritchard and Wen (2003). If the optimal value K was >1,
we used the �K method of Evanno et al. (2005). We combined the
results of 20 runs at the optimal K using CLUMMP (Jakobsson
and Rosenberg 2007) and graphed with DISTRUCT (Rosenberg
2004).
GENE FLOW
We tested for asymmetrical gene flow using Bayesian inference in
MIGRATE ver. 3.0 (Beerli and Felsenstein 2001). Simulations were
performed separately for seeds and adults with two concurrent
EVOLUTION FEBRUARY 2010 3 7 5
J. T. ANDERSON AND M. A. GEBER
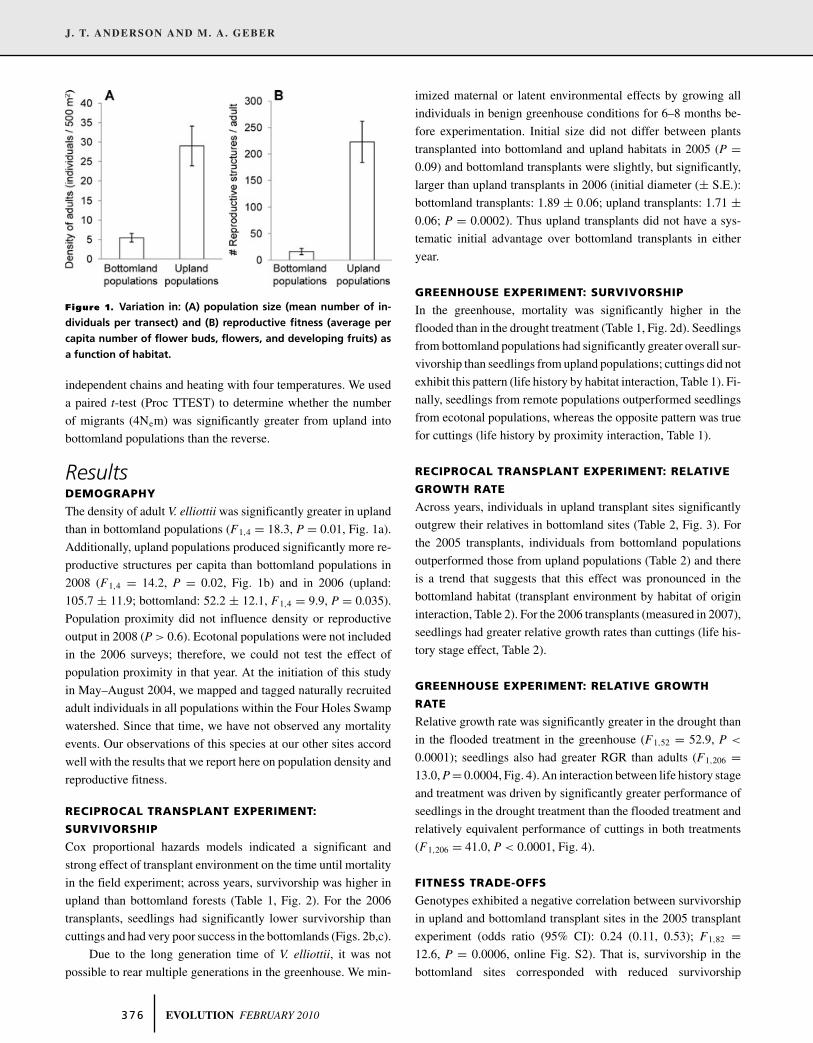
Figure 1. Variation in: (A) population size (mean number of in-
dividuals per transect) and (B) reproductive fitness (average per
capita number of flower buds, flowers, and developing fruits) as
a function of habitat.
independent chains and heating with four temperatures. We used
a paired t-test (Proc TTEST) to determine whether the number
of migrants (4Nem) was significantly greater from upland into
bottomland populations than the reverse.
ResultsDEMOGRAPHY
The density of adult V. elliottii was significantly greater in upland
than in bottomland populations (F1,4 = 18.3, P = 0.01, Fig. 1a).
Additionally, upland populations produced significantly more re-
productive structures per capita than bottomland populations in
2008 (F1,4 = 14.2, P = 0.02, Fig. 1b) and in 2006 (upland:
105.7 ± 11.9; bottomland: 52.2 ± 12.1, F1,4 = 9.9, P = 0.035).
Population proximity did not influence density or reproductive
output in 2008 (P > 0.6). Ecotonal populations were not included
in the 2006 surveys; therefore, we could not test the effect of
population proximity in that year. At the initiation of this study
in May–August 2004, we mapped and tagged naturally recruited
adult individuals in all populations within the Four Holes Swamp
watershed. Since that time, we have not observed any mortality
events. Our observations of this species at our other sites accord
well with the results that we report here on population density and
reproductive fitness.
RECIPROCAL TRANSPLANT EXPERIMENT:
SURVIVORSHIP
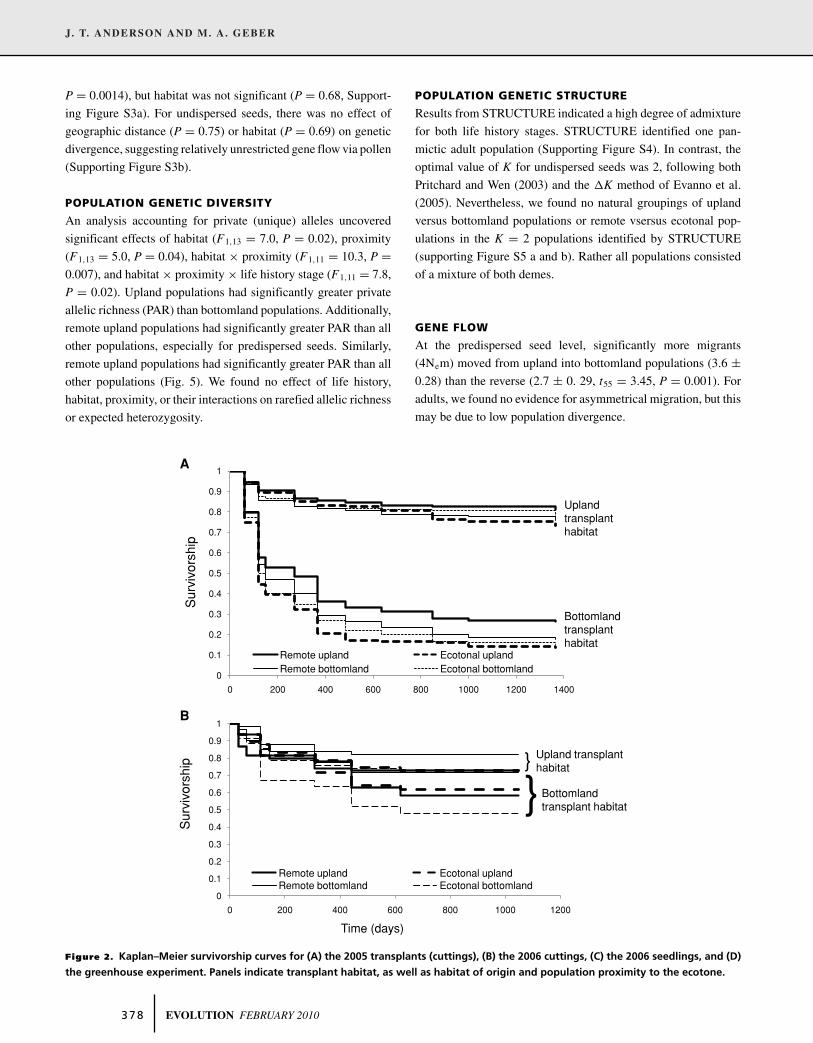
Cox proportional hazards models indicated a significant and
strong effect of transplant environment on the time until mortality
in the field experiment; across years, survivorship was higher in
upland than bottomland forests (Table 1, Fig. 2). For the 2006
transplants, seedlings had significantly lower survivorship than
cuttings and had very poor success in the bottomlands (Figs. 2b,c).
Due to the long generation time of V. elliottii, it was not
possible to rear multiple generations in the greenhouse. We min-
imized maternal or latent environmental effects by growing all
individuals in benign greenhouse conditions for 6–8 months be-
fore experimentation. Initial size did not differ between plants
transplanted into bottomland and upland habitats in 2005 (P =0.09) and bottomland transplants were slightly, but significantly,
larger than upland transplants in 2006 (initial diameter (± S.E.):
bottomland transplants: 1.89 ± 0.06; upland transplants: 1.71 ±0.06; P = 0.0002). Thus upland transplants did not have a sys-
tematic initial advantage over bottomland transplants in either
year.
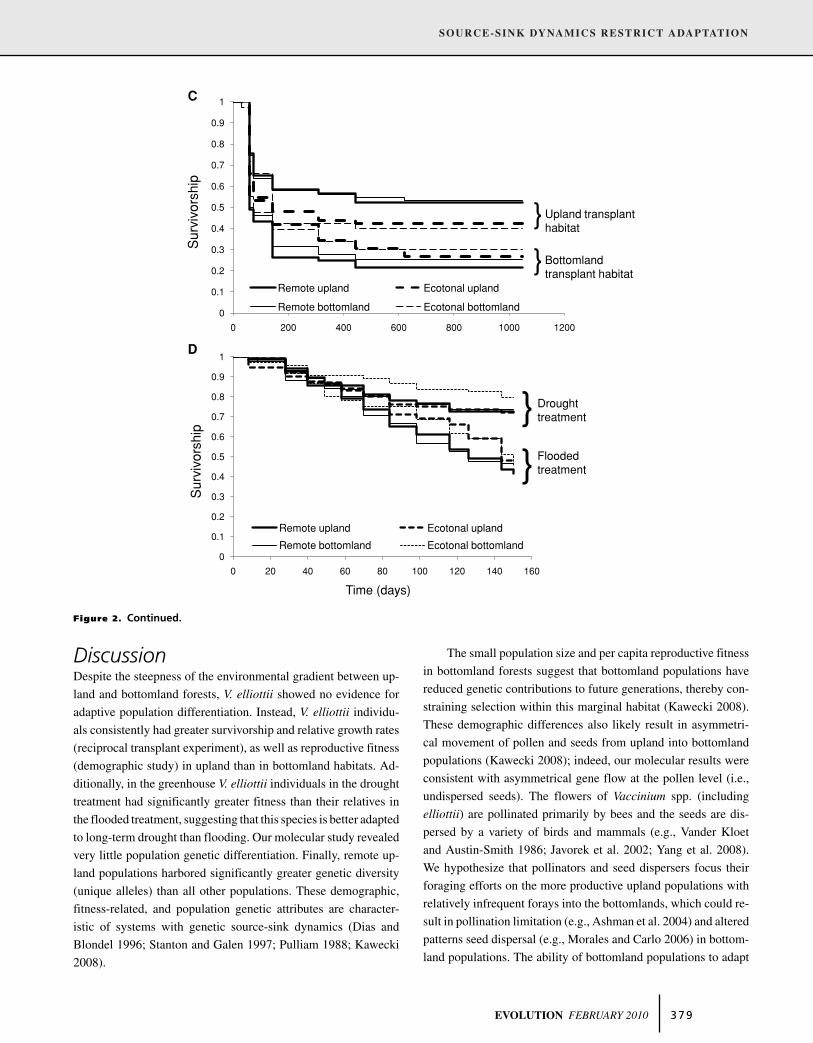
GREENHOUSE EXPERIMENT: SURVIVORSHIP
In the greenhouse, mortality was significantly higher in the
flooded than in the drought treatment (Table 1, Fig. 2d). Seedlings
from bottomland populations had significantly greater overall sur-
vivorship than seedlings from upland populations; cuttings did not
exhibit this pattern (life history by habitat interaction, Table 1). Fi-
nally, seedlings from remote populations outperformed seedlings
from ecotonal populations, whereas the opposite pattern was true
for cuttings (life history by proximity interaction, Table 1).
RECIPROCAL TRANSPLANT EXPERIMENT: RELATIVE
GROWTH RATE
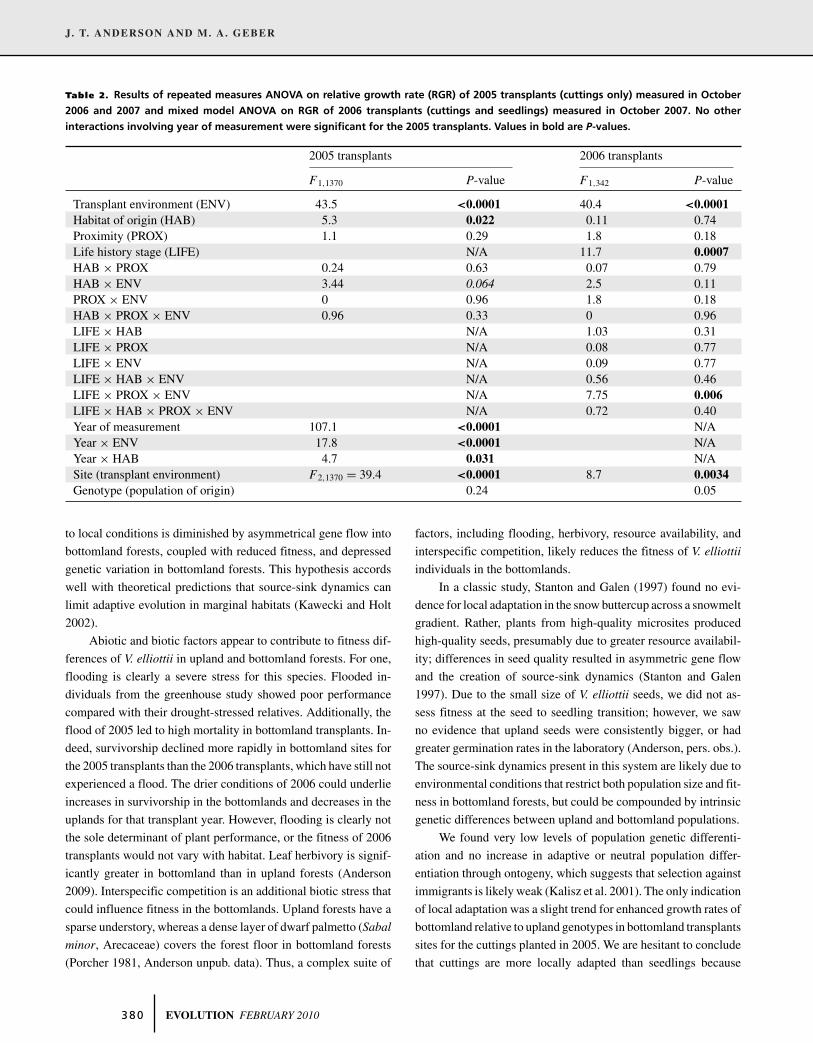
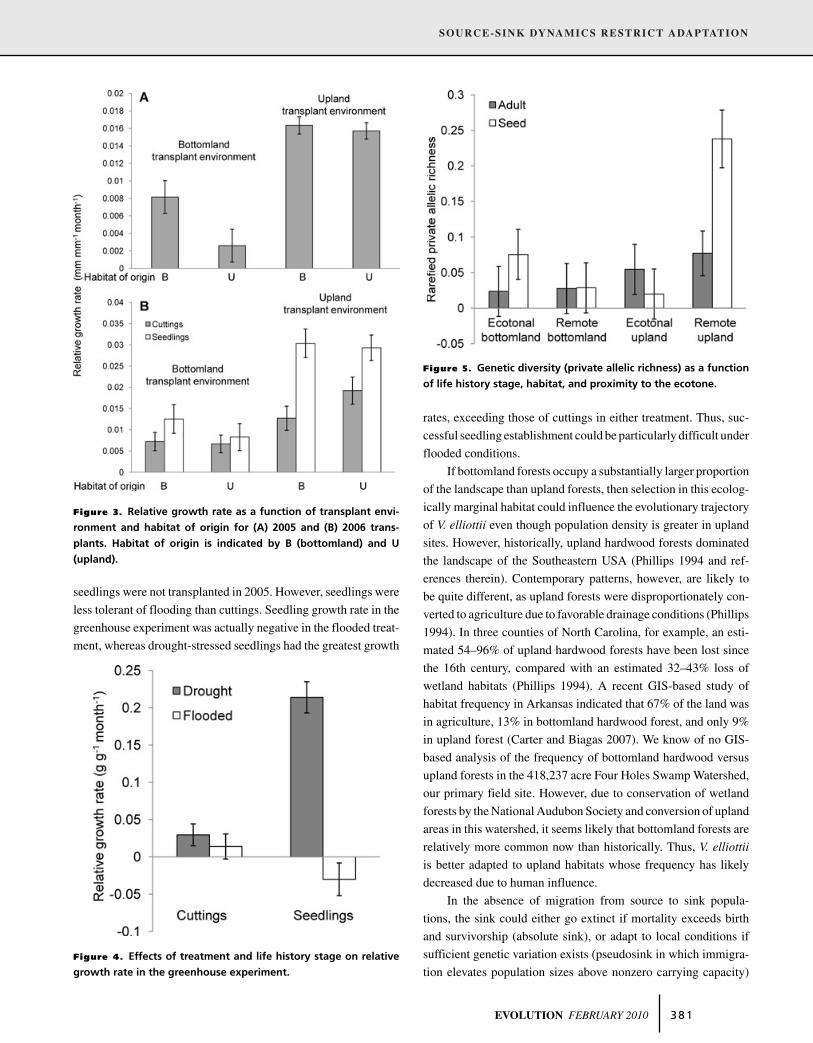
Across years, individuals in upland transplant sites significantly
outgrew their relatives in bottomland sites (Table 2, Fig. 3). For
the 2005 transplants, individuals from bottomland populations
outperformed those from upland populations (Table 2) and there
is a trend that suggests that this effect was pronounced in the
bottomland habitat (transplant environment by habitat of origin
interaction, Table 2). For the 2006 transplants (measured in 2007),
seedlings had greater relative growth rates than cuttings (life his-
tory stage effect, Table 2).
GREENHOUSE EXPERIMENT: RELATIVE GROWTH
RATE
Relative growth rate was significantly greater in the drought than
in the flooded treatment in the greenhouse (F1,52 = 52.9, P <
0.0001); seedlings also had greater RGR than adults (F1,206 =13.0, P = 0.0004, Fig. 4). An interaction between life history stage
and treatment was driven by significantly greater performance of
seedlings in the drought treatment than the flooded treatment and
relatively equivalent performance of cuttings in both treatments
(F1,206 = 41.0, P < 0.0001, Fig. 4).
FITNESS TRADE-OFFS
Genotypes exhibited a negative correlation between survivorship
in upland and bottomland transplant sites in the 2005 transplant
experiment (odds ratio (95% CI): 0.24 (0.11, 0.53); F1,82 =12.6, P = 0.0006, online Fig. S2). That is, survivorship in the
bottomland sites corresponded with reduced survivorship
3 7 6 EVOLUTION FEBRUARY 2010

SOURCE-SINK DYNAMICS RESTRICT ADAPTATION
Table 1. Results of Bayesian survivorship analyses, conducted in Winbugs. Environment refers to transplant environment (field) or
treatment (greenhouse). Parameter estimates are hazard ratios (HR), which represent the relative risk of mortality during each time
period for the baseline group compared with the alternate group. Parameters whose 95% credible intervals (C.I.) do not include 1 have
a significant influence on mortality and are highlighted in bold. Hazard ratios < 1 indicate that the baseline group had a significantly
increased risk of mortality. Baseline groups in these analyses were: bottomland (transplant environment and habitat of origin), remote
(proximity), seedling (life history stage), flooded (treatment). For the continuous variable (plant size), HR < 1 specifies that larger
individuals had a significantly diminished risk of mortality; for example, a 1 mm increase in initial diameter in the 2005 transplants
corresponded with a 25% reduction in mortality. Seedlings were not included in the 2005 transplants.
2005 transplants 2006 transplants Greenhouse experiment
Posterior Posterior PosteriorHR mean 95% C.I. HR mean 95% C.I. HR mean 95% C.I.
Initial plant size 0.75 (0.69, 0.81) 0.39 (0.35, 0.45) 0.93 (0.81, 1.06)Environment (ENV) 0.22 (0.1, 0.46) 0.32 (0.19, 0.54) 0.054 (0.0043, 0.56)Habitat of origin (HAB) 0.94 (0.83, 1.09) 0.93 (0.81, 1.06) 1.11 (0.95, 1.3)Proximity (PROX) 1.12 (0.96, 1.82) 0.99 (0.87, 1.14) 1.02 (0.97, 1.18)Life history stage (LIFE) N/A 0.86 (0.77, 0.98) 9.6 × 10⁻⁶ (7.8 × 10⁻⁷, 1.5 × 10⁻⁴)HAB × PROX 1.09 (0.94, 1.26) 094 (0.82, 1.08) 1.05 (0.9, 1.22)HAB × ENV 0.97 (0.90, 1.06) 1.04 (0.96,1.13) 1.04 (0.9, 1.2)PROX × ENV 1.06 (0.97, 1.15) 1.01 (0.93, 1.09) 0.99 (0.87, 1.14)HAB × PROX × ENV 1.07 (0.98, 1.16) 0.99 (0.91, 1.08) 1.06 (0.92, 1.21)LIFE × HAB N/A 0.94 (0.84, 1.05) 1.16 (1.02, 1.32)LIFE × PROX N/A 0.95 (0.85, 1.06) 1.15 (1.01, 1.31)LIFE × ENV N/A 0.95 (0.86, 1.05) 0.95 (0.82, 1.1)LIFE × PROX× ENV N/A 0.99 (0.89, 1.11) 1.01 (0.88, 1.17)LIFE × HAB × PROX × ENV N/A 0.99 (0.91, 1.09) 0.98 (0.86, 1.13)Site 0.086 (0.06, 0.12) 0.28 (0.20, 039) N/AVariance of Population 1.25 (1.1, 4.9) 1.22 (1.09, 1.45) 1.12 (1.05, 1.27)Variance of Family 1.16 (1.1, 1.2) 1.19 (1.07, 1.39) 1.11 (1.05, 1.23)Variance of Block N/A N/A 1.19 (1.07, 1.41)
(0.24 odds of survivorship) within the uplands. Habitat of ori-
gin (F1,21 = 0.6, P = 0.45) and the interaction between habitat
and survivorship in the bottomlands (F1,89 = 1.26, P = 0.26) were
nonsignificant in this model. No trade-offs were evident for the
2006 transplants and the greenhouse experiment.
POPULATION GENETIC DIFFERENTIATION
Our population genetic results are robust because our loci con-
formed to assumptions of neutrality and our genotyping had low
error rates. We detected no evidence for selection at any of the
eight loci tested (online Table S5); however, GENEPOP revealed
significant linkage disequilibrium between two loci (CA23F and
CA787F) and three others. We removed these two loci from the
dataset and resolved the disequilibrium problem. The remaining
six loci were in Hardy–Weinberg equilibrium; there were only
seven significant deviations out of 88 tests for adults (loci were
monomorphic at 14 population-locus combinations) and three de-
viations out of 80 tests for seedlings (10 monomorphic population-
locus combinations). MICROCHECKER found no evidence for scor-
ing errors due to stutter, or large allele drop out. Several loci
showed an excess of homozygotes, suggesting the presence of
null alleles. Null allele frequencies were estimated (Brookfield 2)
and used in downstream analyses (Brookfield 1996). Overall
genotyping error rate for mother offspring pairs was low (online
Table S6).
Multilocus estimates of F-statistics indicate that adults and
seeds were more homozygous than would be expected under ran-
dom mating, both across populations (adult F IT: 0.108, 95% CI:
[0.074, 0.127]; seedling F IT: 0.080, 95% CI: [0.034, 0.094]) and
within populations (adult F IS: 0.078, 95% CI: [0.044, 0.091];
seedling F IS: 0.043, 95% CI: [−0.013, 0.067]). Overall FST val-
ues were small, indicating little population differentiation (adult
FST: 0.032, 95% CI = 0.022, 0.045; seed FST: 0.038, 95% CI =0.027, 0.052). A Mantel test revealed no significant correlation
(r = 0.21, P = 0.2) between pairwise population differentiation
for the 15 populations assessed at the adult and seed life his-
tory stages. Per-locus and weighted multilocus F-statistics, and
observed and expected heterozygosities are presented in online
Tables S7 (adults) and S6 (seeds). Bottomland populations con-
tained a subset of the alleles present in upland populations. Partial
Mantel tests revealed that genetic population differentiation in
adults increased significantly with geographic distance (r = 0.42,
EVOLUTION FEBRUARY 2010 3 7 7
J. T. ANDERSON AND M. A. GEBER
P = 0.0014), but habitat was not significant (P = 0.68, Support-
ing Figure S3a). For undispersed seeds, there was no effect of
geographic distance (P = 0.75) or habitat (P = 0.69) on genetic
divergence, suggesting relatively unrestricted gene flow via pollen
(Supporting Figure S3b).
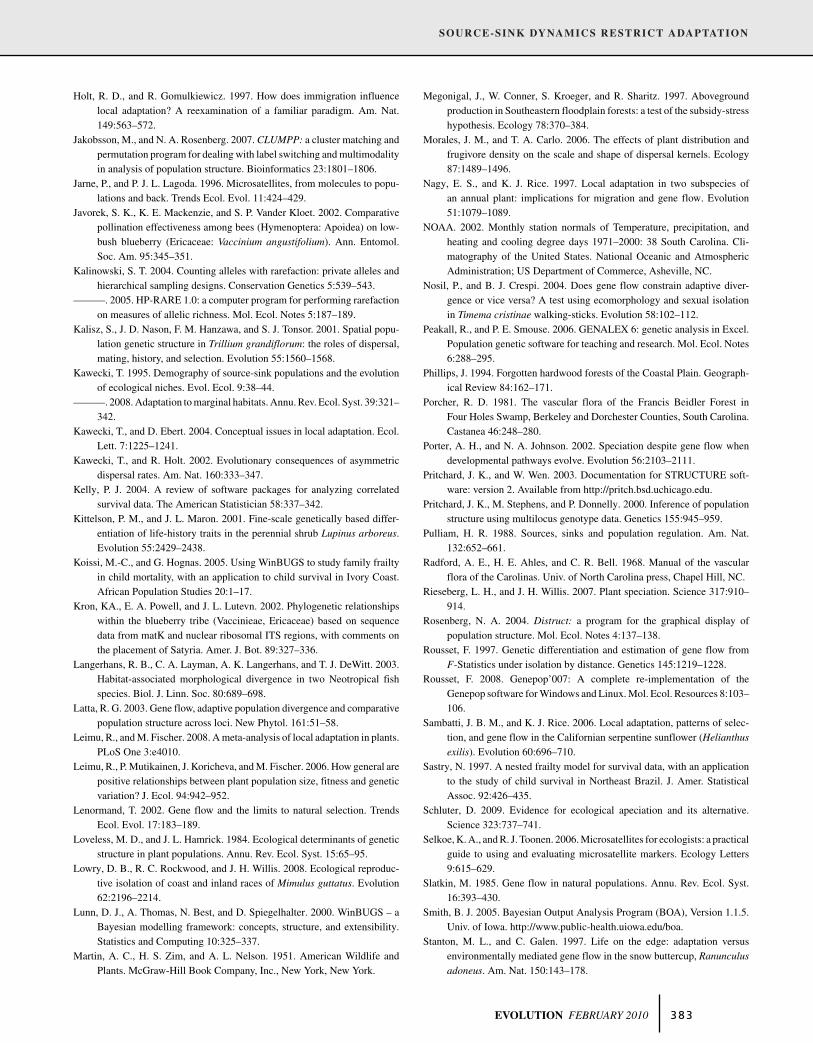
POPULATION GENETIC DIVERSITY
An analysis accounting for private (unique) alleles uncovered
significant effects of habitat (F1,13 = 7.0, P = 0.02), proximity
(F1,13 = 5.0, P = 0.04), habitat × proximity (F1,11 = 10.3, P =0.007), and habitat × proximity × life history stage (F1,11 = 7.8,
P = 0.02). Upland populations had significantly greater private
allelic richness (PAR) than bottomland populations. Additionally,
remote upland populations had significantly greater PAR than all
other populations, especially for predispersed seeds. Similarly,
remote upland populations had significantly greater PAR than all
other populations (Fig. 5). We found no effect of life history,
habitat, proximity, or their interactions on rarefied allelic richness
or expected heterozygosity.
Figure 2. Kaplan–Meier survivorship curves for (A) the 2005 transplants (cuttings), (B) the 2006 cuttings, (C) the 2006 seedlings, and (D)
the greenhouse experiment. Panels indicate transplant habitat, as well as habitat of origin and population proximity to the ecotone.
POPULATION GENETIC STRUCTURE
Results from STRUCTURE indicated a high degree of admixture
for both life history stages. STRUCTURE identified one pan-
mictic adult population (Supporting Figure S4). In contrast, the
optimal value of K for undispersed seeds was 2, following both
Pritchard and Wen (2003) and the �K method of Evanno et al.
(2005). Nevertheless, we found no natural groupings of upland
versus bottomland populations or remote vsersus ecotonal pop-
ulations in the K = 2 populations identified by STRUCTURE
(supporting Figure S5 a and b). Rather all populations consisted
of a mixture of both demes.
GENE FLOW
At the predispersed seed level, significantly more migrants
(4Nem) moved from upland into bottomland populations (3.6 ±0.28) than the reverse (2.7 ± 0. 29, t55 = 3.45, P = 0.001). For
adults, we found no evidence for asymmetrical migration, but this
may be due to low population divergence.
3 7 8 EVOLUTION FEBRUARY 2010
SOURCE-SINK DYNAMICS RESTRICT ADAPTATION
Figure 2. Continued.
DiscussionDespite the steepness of the environmental gradient between up-
land and bottomland forests, V. elliottii showed no evidence for
adaptive population differentiation. Instead, V. elliottii individu-
als consistently had greater survivorship and relative growth rates
(reciprocal transplant experiment), as well as reproductive fitness
(demographic study) in upland than in bottomland habitats. Ad-
ditionally, in the greenhouse V. elliottii individuals in the drought
treatment had significantly greater fitness than their relatives in
the flooded treatment, suggesting that this species is better adapted
to long-term drought than flooding. Our molecular study revealed
very little population genetic differentiation. Finally, remote up-
land populations harbored significantly greater genetic diversity
(unique alleles) than all other populations. These demographic,
fitness-related, and population genetic attributes are character-
istic of systems with genetic source-sink dynamics (Dias and
Blondel 1996; Stanton and Galen 1997; Pulliam 1988; Kawecki
2008).
The small population size and per capita reproductive fitness
in bottomland forests suggest that bottomland populations have
reduced genetic contributions to future generations, thereby con-
straining selection within this marginal habitat (Kawecki 2008).
These demographic differences also likely result in asymmetri-
cal movement of pollen and seeds from upland into bottomland
populations (Kawecki 2008); indeed, our molecular results were
consistent with asymmetrical gene flow at the pollen level (i.e.,
undispersed seeds). The flowers of Vaccinium spp. (including
elliottii) are pollinated primarily by bees and the seeds are dis-
persed by a variety of birds and mammals (e.g., Vander Kloet
and Austin-Smith 1986; Javorek et al. 2002; Yang et al. 2008).
We hypothesize that pollinators and seed dispersers focus their
foraging efforts on the more productive upland populations with
relatively infrequent forays into the bottomlands, which could re-
sult in pollination limitation (e.g., Ashman et al. 2004) and altered
patterns seed dispersal (e.g., Morales and Carlo 2006) in bottom-
land populations. The ability of bottomland populations to adapt
EVOLUTION FEBRUARY 2010 3 7 9
J. T. ANDERSON AND M. A. GEBER
Table 2. Results of repeated measures ANOVA on relative growth rate (RGR) of 2005 transplants (cuttings only) measured in October
2006 and 2007 and mixed model ANOVA on RGR of 2006 transplants (cuttings and seedlings) measured in October 2007. No other
interactions involving year of measurement were significant for the 2005 transplants. Values in bold are P-values.
2005 transplants 2006 transplants
F1,1370 P-value F1,342 P-value
Transplant environment (ENV) 43.5 <0.0001 40.4 <0.0001Habitat of origin (HAB) 5.3 0.022 0.11 0.74Proximity (PROX) 1.1 0.29 1.8 0.18Life history stage (LIFE) N/A 11.7 0.0007HAB × PROX 0.24 0.63 0.07 0.79HAB × ENV 3.44 0.064 2.5 0.11PROX × ENV 0 0.96 1.8 0.18HAB × PROX × ENV 0.96 0.33 0 0.96LIFE × HAB N/A 1.03 0.31LIFE × PROX N/A 0.08 0.77LIFE × ENV N/A 0.09 0.77LIFE × HAB × ENV N/A 0.56 0.46LIFE × PROX × ENV N/A 7.75 0.006LIFE × HAB × PROX × ENV N/A 0.72 0.40Year of measurement 107.1 <0.0001 N/AYear × ENV 17.8 <0.0001 N/AYear × HAB 4.7 0.031 N/ASite (transplant environment) F2,1370 = 39.4 <0.0001 8.7 0.0034Genotype (population of origin) 0.24 0.05
to local conditions is diminished by asymmetrical gene flow into
bottomland forests, coupled with reduced fitness, and depressed
genetic variation in bottomland forests. This hypothesis accords
well with theoretical predictions that source-sink dynamics can
limit adaptive evolution in marginal habitats (Kawecki and Holt
2002).
Abiotic and biotic factors appear to contribute to fitness dif-
ferences of V. elliottii in upland and bottomland forests. For one,
flooding is clearly a severe stress for this species. Flooded in-
dividuals from the greenhouse study showed poor performance
compared with their drought-stressed relatives. Additionally, the
flood of 2005 led to high mortality in bottomland transplants. In-
deed, survivorship declined more rapidly in bottomland sites for
the 2005 transplants than the 2006 transplants, which have still not
experienced a flood. The drier conditions of 2006 could underlie
increases in survivorship in the bottomlands and decreases in the
uplands for that transplant year. However, flooding is clearly not
the sole determinant of plant performance, or the fitness of 2006
transplants would not vary with habitat. Leaf herbivory is signif-
icantly greater in bottomland than in upland forests (Anderson
2009). Interspecific competition is an additional biotic stress that
could influence fitness in the bottomlands. Upland forests have a
sparse understory, whereas a dense layer of dwarf palmetto (Sabal
minor, Arecaceae) covers the forest floor in bottomland forests
(Porcher 1981, Anderson unpub. data). Thus, a complex suite of
factors, including flooding, herbivory, resource availability, and
interspecific competition, likely reduces the fitness of V. elliottii
individuals in the bottomlands.
In a classic study, Stanton and Galen (1997) found no evi-
dence for local adaptation in the snow buttercup across a snowmelt
gradient. Rather, plants from high-quality microsites produced
high-quality seeds, presumably due to greater resource availabil-
ity; differences in seed quality resulted in asymmetric gene flow
and the creation of source-sink dynamics (Stanton and Galen
1997). Due to the small size of V. elliottii seeds, we did not as-
sess fitness at the seed to seedling transition; however, we saw
no evidence that upland seeds were consistently bigger, or had
greater germination rates in the laboratory (Anderson, pers. obs.).
The source-sink dynamics present in this system are likely due to
environmental conditions that restrict both population size and fit-
ness in bottomland forests, but could be compounded by intrinsic
genetic differences between upland and bottomland populations.
We found very low levels of population genetic differenti-
ation and no increase in adaptive or neutral population differ-
entiation through ontogeny, which suggests that selection against
immigrants is likely weak (Kalisz et al. 2001). The only indication
of local adaptation was a slight trend for enhanced growth rates of
bottomland relative to upland genotypes in bottomland transplants
sites for the cuttings planted in 2005. We are hesitant to conclude
that cuttings are more locally adapted than seedlings because
3 8 0 EVOLUTION FEBRUARY 2010
SOURCE-SINK DYNAMICS RESTRICT ADAPTATION
Figure 3. Relative growth rate as a function of transplant envi-
ronment and habitat of origin for (A) 2005 and (B) 2006 trans-
plants. Habitat of origin is indicated by B (bottomland) and U
(upland).
seedlings were not transplanted in 2005. However, seedlings were
less tolerant of flooding than cuttings. Seedling growth rate in the
greenhouse experiment was actually negative in the flooded treat-
ment, whereas drought-stressed seedlings had the greatest growth
Figure 4. Effects of treatment and life history stage on relative
growth rate in the greenhouse experiment.
Figure 5. Genetic diversity (private allelic richness) as a function
of life history stage, habitat, and proximity to the ecotone.
rates, exceeding those of cuttings in either treatment. Thus, suc-
cessful seedling establishment could be particularly difficult under
flooded conditions.
If bottomland forests occupy a substantially larger proportion
of the landscape than upland forests, then selection in this ecolog-
ically marginal habitat could influence the evolutionary trajectory
of V. elliottii even though population density is greater in upland
sites. However, historically, upland hardwood forests dominated
the landscape of the Southeastern USA (Phillips 1994 and ref-
erences therein). Contemporary patterns, however, are likely to
be quite different, as upland forests were disproportionately con-
verted to agriculture due to favorable drainage conditions (Phillips
1994). In three counties of North Carolina, for example, an esti-
mated 54–96% of upland hardwood forests have been lost since
the 16th century, compared with an estimated 32–43% loss of
wetland habitats (Phillips 1994). A recent GIS-based study of
habitat frequency in Arkansas indicated that 67% of the land was
in agriculture, 13% in bottomland hardwood forest, and only 9%
in upland forest (Carter and Biagas 2007). We know of no GIS-
based analysis of the frequency of bottomland hardwood versus
upland forests in the 418,237 acre Four Holes Swamp Watershed,
our primary field site. However, due to conservation of wetland
forests by the National Audubon Society and conversion of upland
areas in this watershed, it seems likely that bottomland forests are
relatively more common now than historically. Thus, V. elliottii
is better adapted to upland habitats whose frequency has likely
decreased due to human influence.
In the absence of migration from source to sink popula-
tions, the sink could either go extinct if mortality exceeds birth
and survivorship (absolute sink), or adapt to local conditions if
sufficient genetic variation exists (pseudosink in which immigra-
tion elevates population sizes above nonzero carrying capacity)
EVOLUTION FEBRUARY 2010 3 8 1

J. T. ANDERSON AND M. A. GEBER
(Dias 1996; Garcı́a-Ramos and Kirkpatrick 1997; Pulliam 1988;
Kawecki and Holt 2002; Kawecki 2008). Vaccinium is not mono-
phyletic and a complete phylogeny of the hundreds of species in
this genus is not yet available (Kron et al. 2002). Without more de-
tailed phylogenetic data, it is difficult to resolve the ancestral niche
breadth of V. elliottii. Nevertheless, other species of Vaccinium
and other genera in the Ericaceae (e.g., Leucothoe) sustain pop-
ulations in bottomland habitats and five North American species
of Vaccinium are considered obligately associated with wetlands
(http://www.fws.gov/nwi/bha/downloads/1996/national.pdf). Be-
cause other Vaccinium species have adapted to wetland conditions
(Braendle and Crawford 1999), V. elliottii could harbor the ge-
netic potential to adapt to these conditions as well. However, in
our system, V.elliottii exhibits low fitness in bottomland forests
and flooded conditions at multiple life history stages. Spatial ge-
netic analyses indicated that gene flow is likely very high across
the landscape and may be primarily from upland to bottomland
populations. Asymmetrical migration is thought to inhibit adap-
tation to ecologically marginal habitats, especially when fitness
in marginal habitats comes at the cost of fitness in the core habitat
(Kawecki 2008) as is the case in our 2005 transplant experiment.
It seems likely that interhabitat gene flow, in conjunction with
small population size, fitness trade-offs, and limited genetic vari-
ation, reduces the potential for bottomland populations to adapt
to the local environment.
ACKNOWLEDGMENTSWe are very grateful to N. Brunswig, M. Dawson, A. Shahid, and thestaff of Beidler forest for logistical support and permission to conductthis research. Permission to sample at other sites was granted by the U.S.Forest Service and S.C. Department of Natural Resources. P. Marks, F.West, A. Landi, and T. Pendergast helped with the field work and E. Fabioassisted with the greenhouse experiment. S. Bogdanowicz aided with thegenotyping. We would like to thank B. Barringer, S. Cook, A. Eller, A.Erwin, L. Evanhoe, A. Flecker, P. Marks, A. Parachnowitsch, J. Paul, T.Pendergast, S. Reilly, and J. Sparks, for valuable discussions about thisresearch and insightful comments on previous versions of this manuscript.We thank T. Juenger, M. Stanton, and an anonymous reviewer for theirconstructive criticism on previous drafts. Funding was provided by anNSF Doctoral Dissertation Improvement Grant (DEB 0607992) and anAndrew Mellon foundation grant.
LITERATURE CITEDAnderson, J. T. 2009. Evolution of flooding tolerance in a spatially and tempo-
rally heterogeneous landscape. Ph.D. dissertation. Cornell Univ., Ithaca,NY.
Ashman, T. L., T. Knight, J. Steets, P. Amarasekare, M. Burd, D. Campbell,M. Dudash, M. Johnston, S. Mazer, R. Mitchell, et al. 2004. Pollenlimitation of plant reproduction: Ecological and evolutionary causes andconsequences. Ecology 85:2408–2421.
Beaumont, M. A., and R. A. Nichols. 1996. Evaluating loci for use in thegenetic analysis of population structure. Proc. R. Soc. Biol. Sci. Ser. B263:1619–1626.
Beerli, P., and J. Felsenstein. 2001. Maximum likelihood estimation of amigration matrix and effective population sizes in n subpopulations byusing a coalescent approach. Proc. Natl Acad. Sci. USA 98:4563–4568.
Boches, P. S., N. V. Bassil, and L. J. Rowland. 2005. Microsatellite markersfor Vaccinium from EST and genomic libraries. Mol. Ecol. Notes 5:657–660.
Bonnet, E., and V. D. Peer. 2002. zt: a software tool for simple and partialMantel tests. J. Stat. Soft. 7:1–12.
Braendle, R., and R. M. M. Crawford. 1999. Plants as amphibians. Perspect.Plant Ecol. Evol. Syst. 2:56–78.
Brookfield, J. F. Y. 1996. A simple new method for estimating null allelefrequency from heterozygote deficiency. Mol. Ecol. 5:453–455.
Burke, M. K., B. G. Lockaby, and W. H. Conner. 1999. Aboveground pro-duction and nutrient circulation along a flooding gradient in a SouthCarolina Coastal Plain forest. Can. J. For. Res. 29:1402–1418.
Byars, S., W. Papst, and A. A. Hoffmann. 2007. Local adaptation and cogradi-ent selection in the alpine plant, Poa hiemata, along a narrow altitudinalgradient. Evolution 61:2925–2941.
Carter, J., and J. Biagas. 2007. Prioritizing bottomland hardwood forest sitesfor protection and augmentation. Nat. Areas J. 27:72–82.
Cox, D. R. 1972. Regression models and life-tables. J. Roy. Stat. Soc. B.34:187–220.
Dewoody, J., J. D. Nason, and V. D. Hipkins. 2006. Mitigating scoring errors inmicrosatellite data from wild populations. Mol. Ecol. Notes 6:951–957.
Dias, P. C. 1996. Sources and sinks in population biology. Trends Ecol. Evol.11:326–330.
Dias, P. C., and J. Blondel. 1996. Local specialization and maladaptation inthe Mediterranean blue tit (Parus caeruleus). Oecologia 107:79–86.
Dudley, S. A. 1996. The response to differing selection on plant physiologicaltraits: evidence for local adaptation. Evolution 50:103–110.
Evanno, G., S. Regnaut, and J. Goudet. 2005. Detecting the number of clustersof individuals using the software STRUCTURE: a simulation study. Mol.Ecol. 14:2611–2620.
Garcı́a-Ramos, G., and M. Kirkpatrick. 1997. Genetic models of adaptationand gene flow in peripheral populations. Evolution 51:21–28.
Godfrey, R. K., and J. W. Wooten. 1981. Aquatic and wetland plants of South-eastern United States: Dicotyledons. University of Georgia, Athens,Georgia.
Goudet, J. 1995. FSTAT (Version 1.2): a computer program to calculate F-statistics. J. Hered. 86:485–486.
Haldane, J. B. S. 1930. A mathematical theory of natural and artificial selec-tion. Part IV. Isolation. Proc. Camb. Philol. Soc. 26:220–230.
Hamilton, M. B., E. L. Pincus, A. Di Fiore, and R. C. Fleischer. 1999. Universallinker and ligation procedures for construction of genomic DNA librariesenriched for microsatellites. BioTechniques 27:500–507.
Hedrick, P. W. 1986. Genetic polymorphism in heterogeneous environments:a decade later. Annu. Rev. Ecol. Syst. 17:535–566.
Hendry, A. P., T. Day, and E. B. Taylor. 2001. Population mixing and the adap-tive divergence of quantitative traits in discrete populations: a theoreticalframework for empirical tests. Evolution 55:459–466.
Hendry, A. P., E. B. Taylor, and J. D. McPhail. 2002. Adaptive divergence andthe balance between selection and gene flow: lake and stream sticklebackin the misty system. Evolution 56:1199–1216.
Heywood, J. S. 1991. Spatial analysis of genetic variation in plant populations.Annu. Rev. Ecol. Syst. 22:335–355.
Hoffman, J. I., and W. Amos. 2005. Microsatellite genotyping errors: detectionapproaches, common sources and consequences for paternal exclusion.Mol. Ecol. 14:599–612.
Holt, R. D., and M. S. Gaines. 1992. Analysis of adaptation in heterogeneouslandscapes: implications for the evolution of fundamental niches. Evol.Ecol. 6:433–447.
3 8 2 EVOLUTION FEBRUARY 2010
SOURCE-SINK DYNAMICS RESTRICT ADAPTATION
Holt, R. D., and R. Gomulkiewicz. 1997. How does immigration influencelocal adaptation? A reexamination of a familiar paradigm. Am. Nat.149:563–572.
Jakobsson, M., and N. A. Rosenberg. 2007. CLUMPP: a cluster matching andpermutation program for dealing with label switching and multimodalityin analysis of population structure. Bioinformatics 23:1801–1806.
Jarne, P., and P. J. L. Lagoda. 1996. Microsatellites, from molecules to popu-lations and back. Trends Ecol. Evol. 11:424–429.
Javorek, S. K., K. E. Mackenzie, and S. P. Vander Kloet. 2002. Comparativepollination effectiveness among bees (Hymenoptera: Apoidea) on low-bush blueberry (Ericaceae: Vaccinium angustifolium). Ann. Entomol.Soc. Am. 95:345–351.
Kalinowski, S. T. 2004. Counting alleles with rarefaction: private alleles andhierarchical sampling designs. Conservation Genetics 5:539–543.
———. 2005. HP-RARE 1.0: a computer program for performing rarefactionon measures of allelic richness. Mol. Ecol. Notes 5:187–189.
Kalisz, S., J. D. Nason, F. M. Hanzawa, and S. J. Tonsor. 2001. Spatial popu-lation genetic structure in Trillium grandiflorum: the roles of dispersal,mating, history, and selection. Evolution 55:1560–1568.
Kawecki, T. 1995. Demography of source-sink populations and the evolutionof ecological niches. Evol. Ecol. 9:38–44.
———. 2008. Adaptation to marginal habitats. Annu. Rev. Ecol. Syst. 39:321–342.
Kawecki, T., and D. Ebert. 2004. Conceptual issues in local adaptation. Ecol.Lett. 7:1225–1241.
Kawecki, T., and R. Holt. 2002. Evolutionary consequences of asymmetricdispersal rates. Am. Nat. 160:333–347.
Kelly, P. J. 2004. A review of software packages for analyzing correlatedsurvival data. The American Statistician 58:337–342.
Kittelson, P. M., and J. L. Maron. 2001. Fine-scale genetically based differ-entiation of life-history traits in the perennial shrub Lupinus arboreus.Evolution 55:2429–2438.
Koissi, M.-C., and G. Hognas. 2005. Using WinBUGS to study family frailtyin child mortality, with an application to child survival in Ivory Coast.African Population Studies 20:1–17.
Kron, KA., E. A. Powell, and J. L. Lutevn. 2002. Phylogenetic relationshipswithin the blueberry tribe (Vaccinieae, Ericaceae) based on sequencedata from matK and nuclear ribosomal ITS regions, with comments onthe placement of Satyria. Amer. J. Bot. 89:327–336.
Langerhans, R. B., C. A. Layman, A. K. Langerhans, and T. J. DeWitt. 2003.Habitat-associated morphological divergence in two Neotropical fishspecies. Biol. J. Linn. Soc. 80:689–698.
Latta, R. G. 2003. Gene flow, adaptive population divergence and comparativepopulation structure across loci. New Phytol. 161:51–58.
Leimu, R., and M. Fischer. 2008. A meta-analysis of local adaptation in plants.PLoS One 3:e4010.
Leimu, R., P. Mutikainen, J. Koricheva, and M. Fischer. 2006. How general arepositive relationships between plant population size, fitness and geneticvariation? J. Ecol. 94:942–952.
Lenormand, T. 2002. Gene flow and the limits to natural selection. TrendsEcol. Evol. 17:183–189.
Loveless, M. D., and J. L. Hamrick. 1984. Ecological determinants of geneticstructure in plant populations. Annu. Rev. Ecol. Syst. 15:65–95.
Lowry, D. B., R. C. Rockwood, and J. H. Willis. 2008. Ecological reproduc-tive isolation of coast and inland races of Mimulus guttatus. Evolution62:2196–2214.
Lunn, D. J., A. Thomas, N. Best, and D. Spiegelhalter. 2000. WinBUGS – aBayesian modelling framework: concepts, structure, and extensibility.Statistics and Computing 10:325–337.
Martin, A. C., H. S. Zim, and A. L. Nelson. 1951. American Wildlife andPlants. McGraw-Hill Book Company, Inc., New York, New York.
Megonigal, J., W. Conner, S. Kroeger, and R. Sharitz. 1997. Abovegroundproduction in Southeastern floodplain forests: a test of the subsidy-stresshypothesis. Ecology 78:370–384.
Morales, J. M., and T. A. Carlo. 2006. The effects of plant distribution andfrugivore density on the scale and shape of dispersal kernels. Ecology87:1489–1496.
Nagy, E. S., and K. J. Rice. 1997. Local adaptation in two subspecies ofan annual plant: implications for migration and gene flow. Evolution51:1079–1089.
NOAA. 2002. Monthly station normals of Temperature, precipitation, andheating and cooling degree days 1971–2000: 38 South Carolina. Cli-matography of the United States. National Oceanic and AtmosphericAdministration; US Department of Commerce, Asheville, NC.
Nosil, P., and B. J. Crespi. 2004. Does gene flow constrain adaptive diver-gence or vice versa? A test using ecomorphology and sexual isolationin Timema cristinae walking-sticks. Evolution 58:102–112.
Peakall, R., and P. E. Smouse. 2006. GENALEX 6: genetic analysis in Excel.Population genetic software for teaching and research. Mol. Ecol. Notes6:288–295.
Phillips, J. 1994. Forgotten hardwood forests of the Coastal Plain. Geograph-ical Review 84:162–171.
Porcher, R. D. 1981. The vascular flora of the Francis Beidler Forest inFour Holes Swamp, Berkeley and Dorchester Counties, South Carolina.Castanea 46:248–280.
Porter, A. H., and N. A. Johnson. 2002. Speciation despite gene flow whendevelopmental pathways evolve. Evolution 56:2103–2111.
Pritchard, J. K., and W. Wen. 2003. Documentation for STRUCTURE soft-ware: version 2. Available from http://pritch.bsd.uchicago.edu.
Pritchard, J. K., M. Stephens, and P. Donnelly. 2000. Inference of populationstructure using multilocus genotype data. Genetics 155:945–959.
Pulliam, H. R. 1988. Sources, sinks and population regulation. Am. Nat.132:652–661.
Radford, A. E., H. E. Ahles, and C. R. Bell. 1968. Manual of the vascularflora of the Carolinas. Univ. of North Carolina press, Chapel Hill, NC.
Rieseberg, L. H., and J. H. Willis. 2007. Plant speciation. Science 317:910–914.
Rosenberg, N. A. 2004. Distruct: a program for the graphical display ofpopulation structure. Mol. Ecol. Notes 4:137–138.
Rousset, F. 1997. Genetic differentiation and estimation of gene flow fromF-Statistics under isolation by distance. Genetics 145:1219–1228.
Rousset, F. 2008. Genepop’007: A complete re-implementation of theGenepop software for Windows and Linux. Mol. Ecol. Resources 8:103–106.
Sambatti, J. B. M., and K. J. Rice. 2006. Local adaptation, patterns of selec-tion, and gene flow in the Californian serpentine sunflower (Helianthus
exilis). Evolution 60:696–710.Sastry, N. 1997. A nested frailty model for survival data, with an application
to the study of child survival in Northeast Brazil. J. Amer. StatisticalAssoc. 92:426–435.
Schluter, D. 2009. Evidence for ecological apeciation and its alternative.Science 323:737–741.
Selkoe, K. A., and R. J. Toonen. 2006. Microsatellites for ecologists: a practicalguide to using and evaluating microsatellite markers. Ecology Letters9:615–629.
Slatkin, M. 1985. Gene flow in natural populations. Annu. Rev. Ecol. Syst.16:393–430.
Smith, B. J. 2005. Bayesian Output Analysis Program (BOA), Version 1.1.5.Univ. of Iowa. http://www.public-health.uiowa.edu/boa.
Stanton, M. L., and C. Galen. 1997. Life on the edge: adaptation versusenvironmentally mediated gene flow in the snow buttercup, Ranunculusadoneus. Am. Nat. 150:143–178.
EVOLUTION FEBRUARY 2010 3 8 3

J. T. ANDERSON AND M. A. GEBER
Stanton, M., C. Galen, and J. Shore. 1997. Population structure along a steepenvironmental gradient: consequences of flowering time and habitatvariation in the snow buttercup, Ranunculus adoneus. Evolution 51:79–94.
Storfer, A., J. Cross, V. N. Rush, and J. Caruso. 1999. Adaptive coloration andgene flow as a contraint to local adaptation in the streamside salamander,Ambystoma barbouri. Evolution 53:889–898.
Turelli, M. 1997. Environmental heterogeneity, maternal effects and spatialpatterns of genetic variation. Evolution 51:93–94.
Van Oosterhout, C., W. F. Hutchinson, D. P. M. Wills, and P. Shipley.2004. Micro-checker: Software for identifying and correcting genotyp-ing errors in microsatellite data. Mol. Ecol. Notes 4:535–538.
Vander Kloet, S. P., and P. J. Austin-Smith. 1986. Energetics, patterns andtiming of seed dispersal in Vaccinium section Cyanococcus. Am. Midl.Nat. 115:386–396.
Vellend, M. 2004. Parallel effects of land-use history on species diversity andgenetic diversity of forest herbs. Ecology 85:3043–3055.
Weir, B. S., and C. C. Cockerham. 1984. Estimating F-statistics for the analysisof population structure. Evolution 38:1358–1370.
Yang, S., J. G. Bishop, and M. S. Webster. 2008. Colonization genetics of ananimal-dispersed plant (Vaccinium membranaceum) at Mount St Helens,Washington. Mol. Ecol. 17:731–740.
Associate Editor: T. Juenger
Supporting InformationThe following supporting information is available for this article:
Table S1. Geographical locations of populations sampled for reciprocal transplant and greenhouse experiments.
Table S2. Abiotic conditions in upland and bottomland transplant sites.
Table S3. Populations sampled for genotyping with microsatellites.
Table S4. Results of multivariate analysis of variance (MANOVA) examining the effect of habitat, proximity, life history stage, and
two and three-way interactions on Vaccinium elliottii population-level genetic diversity.
Table S5. Test of selective neutrality of microsatellite loci used in this study.
Table S6. Genotyping scoring error rate for mother-offspring pairs.
Table S7. Adult Vaccinium elliottii mean F-statistics.
Table S8. Mean F-statistics for seeds of Vaccinium elliottii.
Figure S1. Map of (a) watersheds sampled in South Carolina and (b) populations in Four Holes Watershed.
Figure S2. Trade-off between survivorship in bottomland and upland transplant sites for families planted in both habitats in 2005.
Figure S3. Genetic population divergence as a function of geographic distance for (a) adults and (b) undispersed seeds.
Figure S4. STRUCTURE results for adults. Plot of K (population size) against ln P(D), which represents the likelihood of the data,
given each value of K.
Figure S5. STRUCTURE results for undispersed seeds. (a) The optimal value of K for undispersed seeds was 2, following both
Pritchard and Wen (2003) and the �K method of Evanno et al. (2005). (b) Neither upland versus bottomland nor remote versus
ecotonal populations corresponded well with the two demes identified by STRUCTURE.
Supporting Information may be found in the online version of this article.
(This link will take you to the article abstract).
Please note: Wiley-Blackwell is not responsible for the content or functionality of any supporting materials supplied by the authors.
Any queries (other than missing material) should be directed to the corresponding author for the article.
3 8 4 EVOLUTION FEBRUARY 2010