Embed Size (px)
Citation preview
International Consultants LtdAndrew Leung
China’s Low-Carbon Future and the Shale Gas Revolution
Andrew K P Leung, SBS, FRSA
A presentation to the JHIA Asia Pacific Conference 2013 Beijing Marriott Hotel Northeast
10-14 July, 2013
1
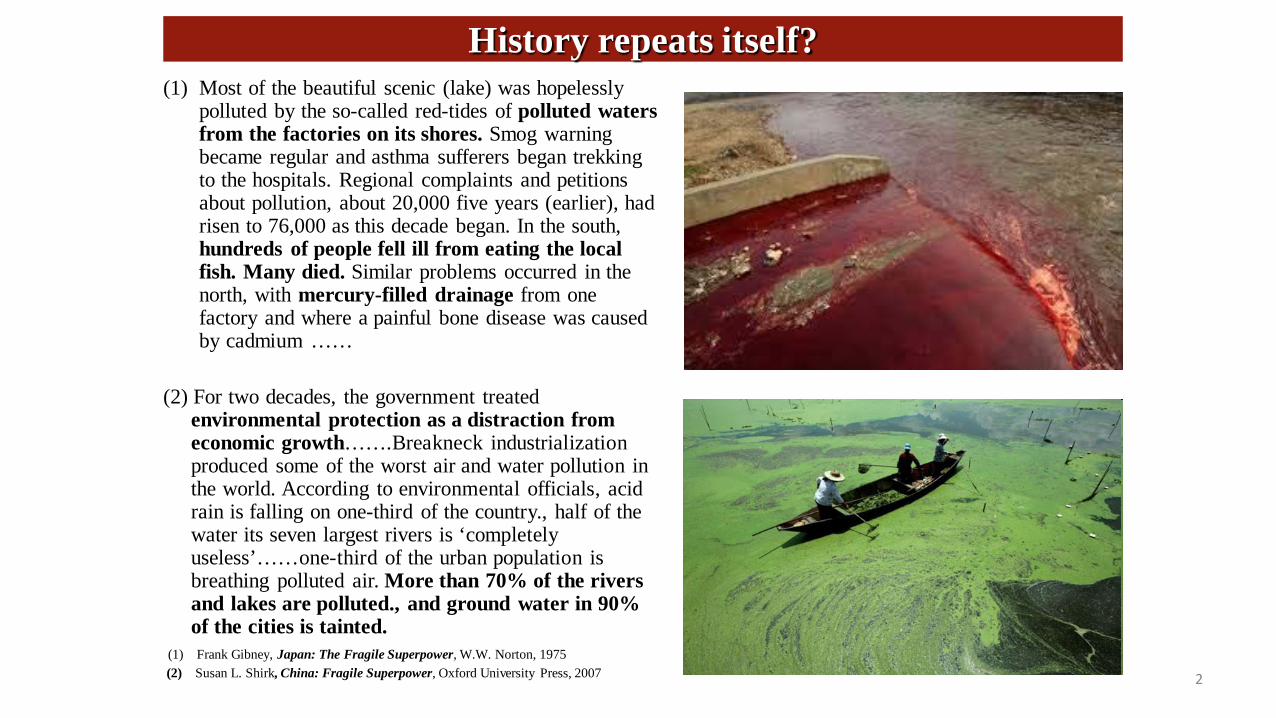
History repeats itself?(1) Most of the beautiful scenic (lake) was hopelessly
polluted by the so-called red-tides of polluted waters from the factories on its shores. Smog warning became regular and asthma sufferers began trekking to the hospitals. Regional complaints and petitions about pollution, about 20,000 five years (earlier), had risen to 76,000 as this decade began. In the south, hundreds of people fell ill from eating the local fish. Many died. Similar problems occurred in the north, with mercury-filled drainage from one factory and where a painful bone disease was caused by cadmium ……
(2) For two decades, the government treatedenvironmental protection as a distraction from economic growth…….Breakneck industrialization produced some of the worst air and water pollution in the world. According to environmental officials, acid rain is falling on one-third of the country., half of the water its seven largest rivers is ‘completely useless’……one-third of the urban population is breathing polluted air. More than 70% of the rivers and lakes are polluted., and ground water in 90% of the cities is tainted.
(1) Frank Gibney, Japan: The Fragile Superpower, W.W. Norton, 1975(2) Susan L. Shirk, China: Fragile Superpower, Oxford University Press, 2007 2

Persisting development problems•100 yrs of industrialization/pollution into a few decades
•China threatening the world – ‘When a Billion Chinese Jump’, Jonathan Watts, Faber and Faber, July 2010
•National Assessment Report on Climate Change (Dec 2006) + 1.3 - 2.1 degrees C by 2020. Glaciers Qinghai-Tibet Plateau dwindling 131.4 sq km p.a. (by 27.2% by 2050.) Extreme weather conditions - floods and droughts –water + food scarcity + diseases.
•5 Imbalances : Rural v Urban, Human v Env, Economic v Social, National v Local, Inward v Outward Investment(Premier Wen, NPC, 03.2005)
•40% export dependent v 11% in US – vulnerable to global vicissitudes + rivalry for resources
•Env-unfriendly, energy-inefficient, low-margin + over-export-dependent industrial production being phased out
•Air pollution costs- Health =4.3% GDP Non-health = 1.5% GDP Total: 5.8% GDP (World Bank, 2012)
•Young EP Ministry v growth-first agendas, backward technology, local protectionism and vested interests
3

Unsustainable resource-intensive, low value-added model
• IEA July 2010, China > US as largest energy consumer; although @ personal consumption = 1/15 American, 1/5 Japanese, but 2x Indian; energy intensity 50% > industrialized countries; efficiency much lower than Japan, UK and US
• Standard and Poor’s June 2010 report - lion’s share of global demand for resources - copper (39%), aluminium (43%), steel (42%), iron ore (60%), and coking coal (52%) – urbanization, transportation, Middle-Class lifestyles
• 40% GDP (10-20% if net ) directly and indirectly reliant on export (US11%)
• Only 3% manufacture owns proprietary technologies; 50% reliant on foreign brands/technology v 5% in Japan & US; 15% of value added of IT export;$1 profit DVD player; 1.65% value of iPod
• Vulnerable to external crisis, energy prices, competition, rivalry, geopolitics, age of scarcity.
(Foxcomm factory)
4
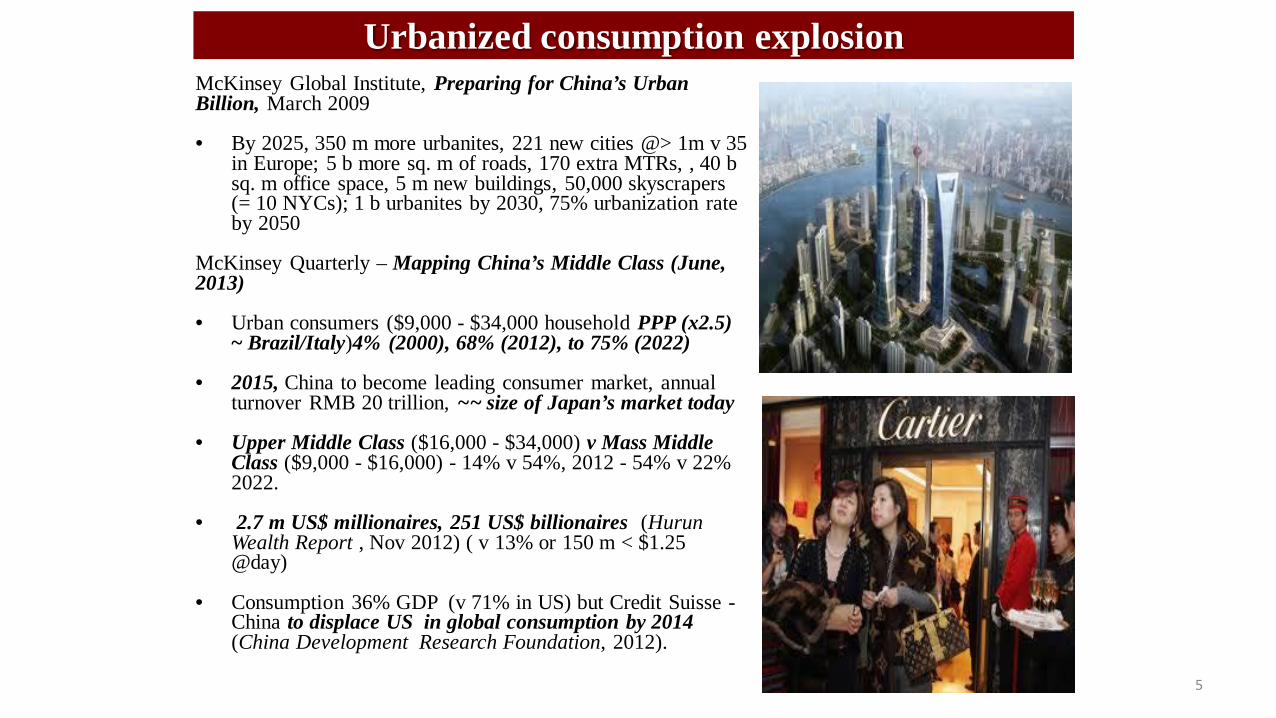
Urbanized consumption explosionMcKinsey Global Institute, Preparing for China’s Urban Billion, March 2009
• By 2025, 350 m more urbanites, 221 new cities @> 1m v 35 in Europe; 5 b more sq. m of roads, 170 extra MTRs, , 40 b sq. m office space, 5 m new buildings, 50,000 skyscrapers (= 10 NYCs); 1 b urbanites by 2030, 75% urbanization rate by 2050
McKinsey Quarterly – Mapping China’s Middle Class (June, 2013)
• Urban consumers ($9,000 - $34,000 household PPP (x2.5) ~ Brazil/Italy)4% (2000), 68% (2012), to 75% (2022)
• 2015, China to become leading consumer market, annual turnover RMB 20 trillion, ~~ size of Japan’s market today
• Upper Middle Class ($16,000 - $34,000) v Mass Middle Class ($9,000 - $16,000) - 14% v 54%, 2012 - 54% v 22% 2022.
• 2.7 m US$ millionaires, 251 US$ billionaires (HurunWealth Report , Nov 2012) ( v 13% or 150 m < $1.25 @day)
• Consumption 36% GDP (v 71% in US) but Credit Suisse -China to displace US in global consumption by 2014 (China Development Research Foundation, 2012).
5
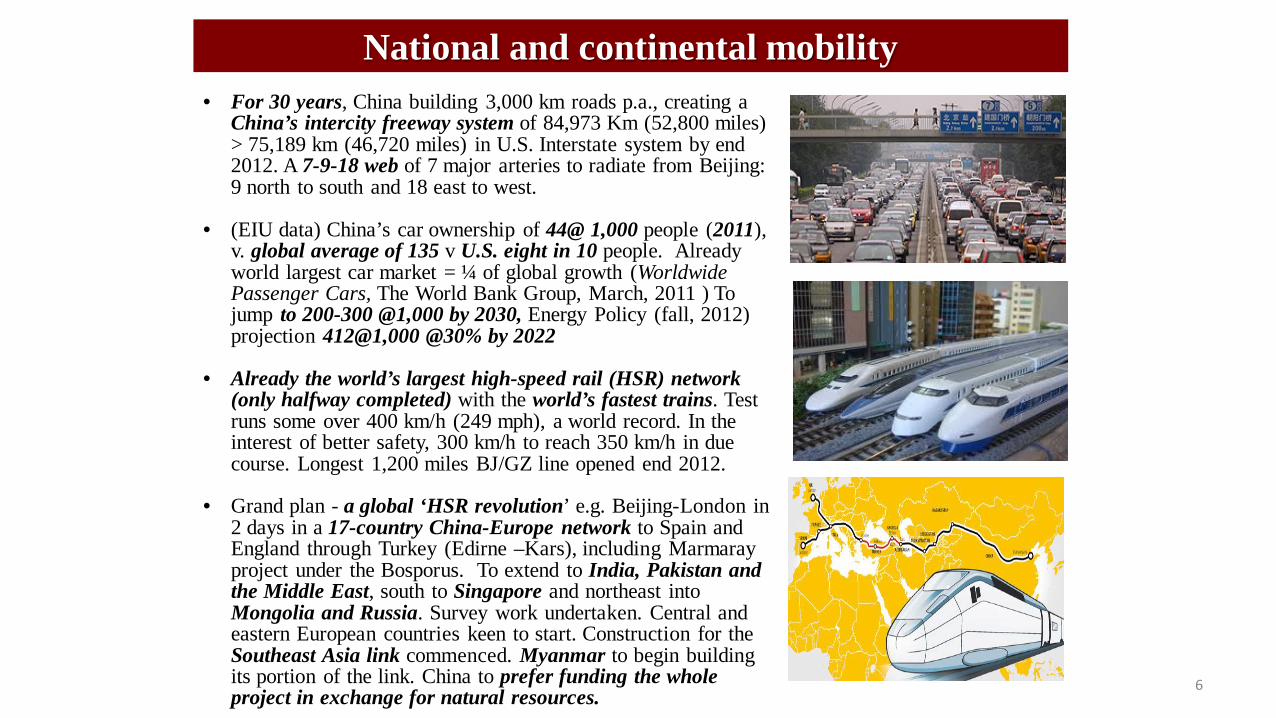
National and continental mobility • For 30 years, China building 3,000 km roads p.a., creating a
China’s intercity freeway system of 84,973 Km (52,800 miles) > 75,189 km (46,720 miles) in U.S. Interstate system by end 2012. A 7-9-18 web of 7 major arteries to radiate from Beijing: 9 north to south and 18 east to west.
• (EIU data) China’s car ownership of 44@ 1,000 people (2011), v. global average of 135 v U.S. eight in 10 people. Already world largest car market = ¼ of global growth (Worldwide Passenger Cars, The World Bank Group, March, 2011 ) To jump to 200-300 @1,000 by 2030, Energy Policy (fall, 2012) projection 412@1,000 @30% by 2022
• Already the world’s largest high-speed rail (HSR) network (only halfway completed) with the world’s fastest trains. Test runs some over 400 km/h (249 mph), a world record. In the interest of better safety, 300 km/h to reach 350 km/h in due course. Longest 1,200 miles BJ/GZ line opened end 2012.
• Grand plan - a global ‘HSR revolution’ e.g. Beijing-London in 2 days in a 17-country China-Europe network to Spain and England through Turkey (Edirne –Kars), including Marmarayproject under the Bosporus. To extend to India, Pakistan and the Middle East, south to Singapore and northeast into Mongolia and Russia. Survey work undertaken. Central and eastern European countries keen to start. Construction for the Southeast Asia link commenced. Myanmar to begin building its portion of the link. China to prefer funding the whole project in exchange for natural resources.
6

Sharpening energy security• Reasonably fast growth - aging profile in a few decades • 94% energy self sufficiency (OECD average 70%) inc Coal 77%.• Oil for urbanization. 8% of world crude oil demand (US 25%) but 1/3 of global
demand growth.• 40% dependent on oil import (hope to reduce to 12-15% eventually) v Japan
almost 100%, India – 60% - 70% • Choke points of Hormuz (Iran) and Malacca Strait (7th Fleet) • ME – Saudi Arabia 17% China’s imports; Iran – 10% ;$70 billion deal in
November 2004 to develop the Yadavaran• Central Asia – 1,200 km pipeline Kazakhstan to North Xinjiang completed, 10
million barrels of crude oil a year• SCO – China, Russia, Kazakhstan, Kyrjystan, Tajikistan and Uzbekistan.
Observers – Afghanistan, India, Iran, Mongolia, Pakistan; Dialogue Members –Belarus, Sri Lanka, Turkey; Guest attendees – ASEAN, CIS, Turkmenistan
• Africa – 1/3 China’s oil import, mainly from unstable and problematic countries like Angola and Sudan
• South America – Oil from America-bashing Venezuela and soybeans from Brazil, both in the US backyard
• Russia – trans-Siberia pipeline bypassing China except a southern link to Xinjiang but still much potential for energy cooperation with China
• Australia – a major minerals and gas supplier to China but contracted with Osaka Gas to supply 1.5 m tonnes LNG for 25 years from huge Gorgon field off NW coast of Australia, operated jointly by Chevron, Royal Dutch Shell and ExxonMobil. 2.5 m tonnes separately for US West Coast annually for 20 years.
7
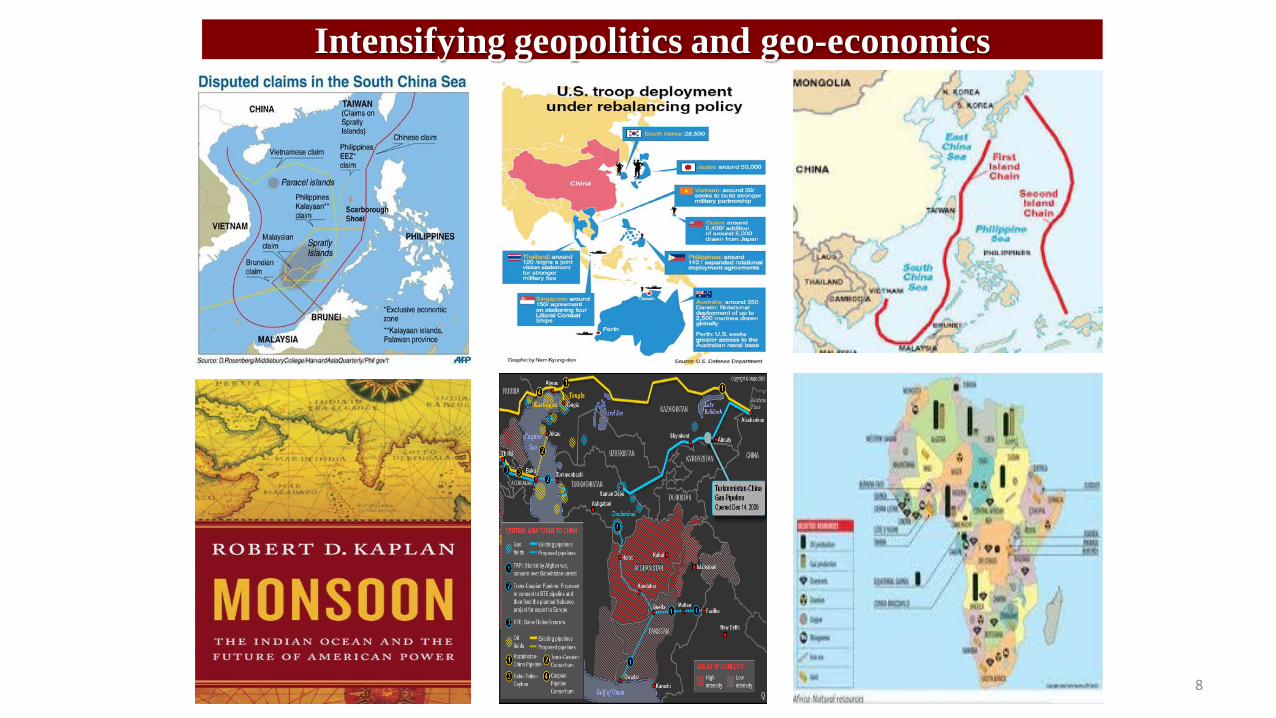
Intensifying geopolitics and geo-economics
8
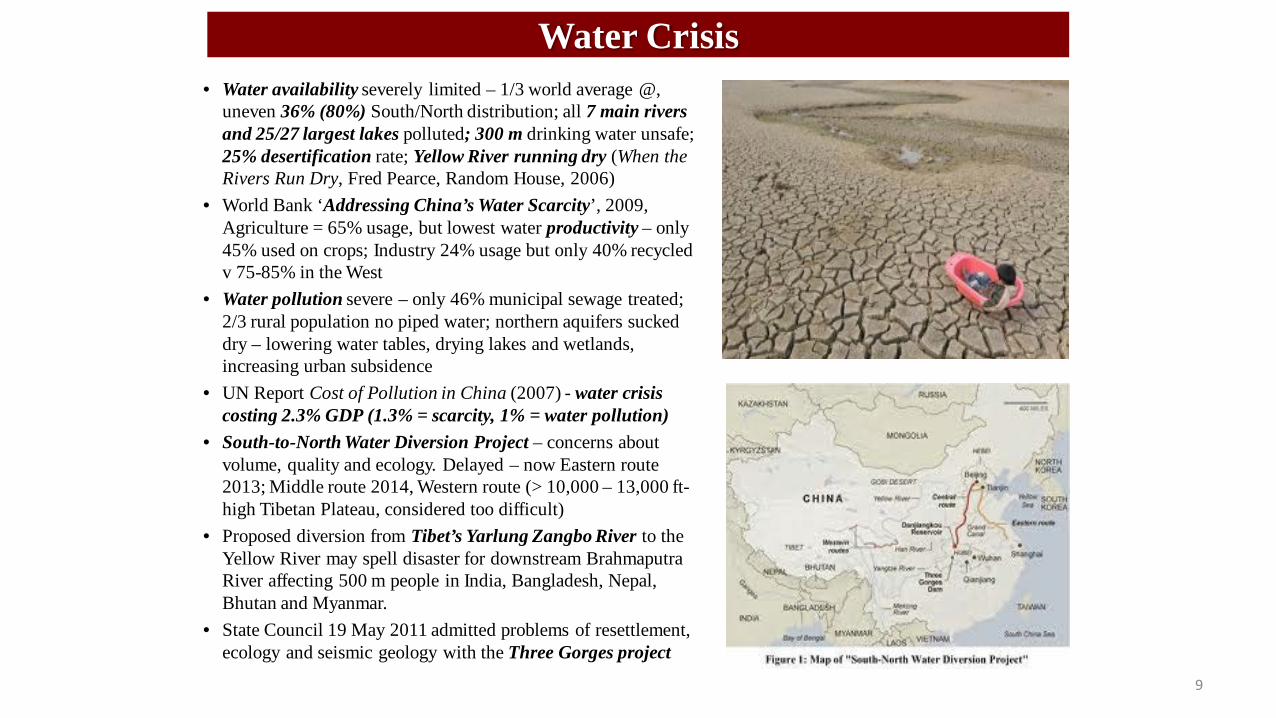
Water Crisis• Water availability severely limited – 1/3 world average @,
uneven 36% (80%) South/North distribution; all 7 main rivers and 25/27 largest lakes polluted; 300 m drinking water unsafe; 25% desertification rate; Yellow River running dry (When the Rivers Run Dry, Fred Pearce, Random House, 2006)
• World Bank ‘Addressing China’s Water Scarcity’, 2009, Agriculture = 65% usage, but lowest water productivity – only 45% used on crops; Industry 24% usage but only 40% recycled v 75-85% in the West
• Water pollution severe – only 46% municipal sewage treated; 2/3 rural population no piped water; northern aquifers sucked dry – lowering water tables, drying lakes and wetlands, increasing urban subsidence
• UN Report Cost of Pollution in China (2007) - water crisis costing 2.3% GDP (1.3% = scarcity, 1% = water pollution)
• South-to-North Water Diversion Project – concerns about volume, quality and ecology. Delayed – now Eastern route 2013; Middle route 2014, Western route (> 10,000 – 13,000 ft-high Tibetan Plateau, considered too difficult)
• Proposed diversion from Tibet’s Yarlung Zangbo River to the Yellow River may spell disaster for downstream Brahmaputra River affecting 500 m people in India, Bangladesh, Nepal, Bhutan and Myanmar.
• State Council 19 May 2011 admitted problems of resettlement, ecology and seismic geology with the Three Gorges project
9

Mounting food scarcity• With Climate Change unchecked, China’s production of wheat, rice and
corn to decrease by 37% by latter half of 21st century (March 2007 Joint government report)
• Population growth, global industrialization and urbanization, use of arable land for bio-fuels
• China only 7% of world’s arable land to feed 20% of world population, not helped by water scarcity and pollution. Western agriculture heavily subsidized US-50%, EU 60% and Japan 76.7% against 1.23% in China. In face of Western imports, 20 million farmers have left their land to seek alternative likelihood.
• Results of Five Year Plan (2005-2010) ‘Building a Socialist Countryside’ –(Morris Goldstein and Nicholas Lardy, The Future of China's Exchange Rate Policy, The Petersen Institute, Washington D.C., July 2009, pp.36-37 )(a) Partial reimbursement (about 30%) of healthcare costs - 20-fold increase
by 2007, covering 730 m people, quadruple the number covered in 2005; (b) Better health insurance (2009-2011) to cover 90% of population by
2011. (Government pays half or more , up from 16% in 2001);(c) Old Age Pensions averaged RMB 1,173 in January 2009 (higher than
national average wage, although still well below going wage in cities); (d) Minimum living standard guarantee program with dramatically-
increased monthly payments from RMB50 in 2002 to RMB140 by 2008.• Oil-rich but food-poor countries to invest in agricultural and livestock
projects overseas. Saudi Arabia. Libya talked to Ukraine on growing wheat.• Chinese companies acquiring farm land in Africa, Brazil and Argentina
10
Green Revolution drivers•China formulated ‘Agenda 21 – A White Paper on Population, Environment and Development in the 21st Century’ following UN Conference on Environment and Development in 1992 - ‘common but differentiated responsibilities’ for mitigation and adaptation at the UN Framework Convention on Climate Change (UNFCC).
•World Energy Council - China, highest energy intensity in 1980, strongest improvement in energy productivity - around 7.5% p.a. between 1990 and 2000. This trend has since drastically declined to only 1% p.a. China's energy intensity is now slightly above world average v 80% higher in 1990.
•China’s energy efficiency @GDP very low: 146 % less efficient than Japan, 73% less efficient than the US, and even 47% less efficient than India (Primary Energy Intensity, World Map by Country (2009) - Trends in Global Energy Efficiency 2011: An Analysis of Industry and Utilities,Enerdata and the Economist Intelligence Unit, sponsored by The ABB Group, Switzerland)
•June 2007, NDRC National Climate Change Program for the coming decades up to 2050.
11
Green milestones and roadmap•Five Year Plan (2006-10) narrowly delivered reduction of energy input @GDP by 20% and CO2 emission by 10%.
•Five Year Plan (2011-15) - non-fossil fuel to rise to 11.4% of total primary energy, energy intensity to reduce by 16%, and CO2 emission by 17%.
•IEA - China investing $2.3 trillion in energy development 2001-30. $200 billion for renewable energy within next 15 years, to grow from 7% to 10% annually by 2010 and 20% annually by 2020.
•National Development Reform Commission - 15% renewable energy by 2020. Government said to be planning to boost renewable energies target to 20% of China’s total energy needs.
•Roadmap to 2050, Chinese Academy of Sciences, 2010 – Fossil energy to decrease from 92.7% (2007) to 80% (2020), 66% (2030) and 45% (2050); nuclear energy from 1.8% (2003) to 4% (2020) 7% (2030) and 10% (2050); new and renewable energies to grow from 9% (2012), 16% (2020), 27% (2030) and 45% (2050) 12
Green innovations• ‘Project 863’ March 1986, - alternative vehicles - electric, hybrid,
compressed natural gas (CNG), + hydrogen fuel-cell cars. (330 million cars by 2030) Cars of the Future – Winning the Oil Endgame, Rocky Mountain Institute, 2004
• Daimler, Ford + Nissan re-committed to hydrogen fuel-cell cars (Jan, 2013). GM invested $1 b in hydrogen-fuel-cell-electric cars. The Obama administration’s Stimulus Bill granted $14.4 billion for plug-in hybrids. Electric cars to have 35% car market by 2025 - 10% pure electric and 25% hybrid (Harrop & Das, 2009). BYD plans to sell about 9 million electric vehicles by 2025 to surpass GM and Toyota and other global automakers in electric vehicle technology
• A ‘Low Carbon Eco-city Strategy’ launched by Chinese Society for Urban Studies in October 2009. Despite Dongtan, concept is now catching on nationwide.
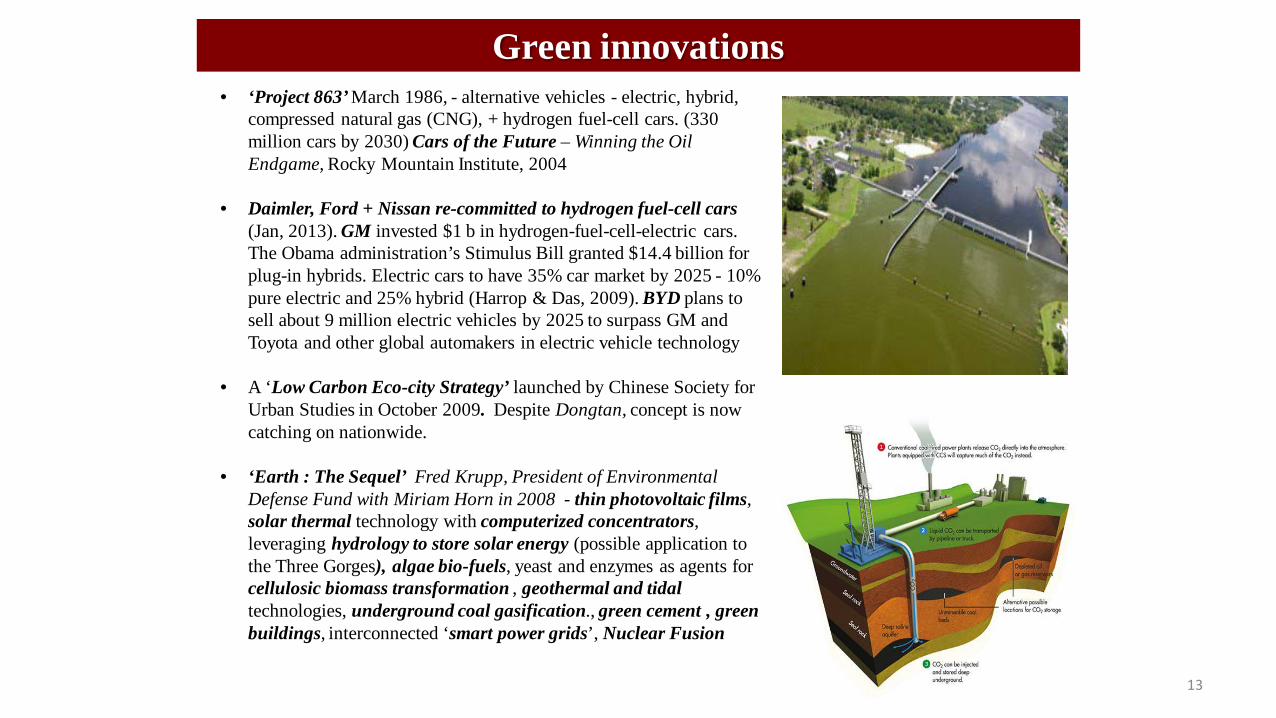
• ‘Earth : The Sequel’ Fred Krupp, President of Environmental Defense Fund with Miriam Horn in 2008 - thin photovoltaic films, solar thermal technology with computerized concentrators, leveraging hydrology to store solar energy (possible application to the Three Gorges), algae bio-fuels, yeast and enzymes as agents for cellulosic biomass transformation , geothermal and tidal technologies, underground coal gasification., green cement , green buildings, interconnected ‘smart power grids’, Nuclear Fusion
13
International cooperation & investmentsUS-China Clean Energy Cooperation Agreement signed on 17 November, 2009 including –
• US-China Clean Energy Research Centre with World Resources Institute, supported by $150 m combined public-private funding from US and China.
• Joint research and development in advanced coal research, carbon dioxide capture and storage, building energy efficiency, and clean vehicle technology.
• A US-China Electric Vehicle Initiative, a US-China Energy Efficiency Action Plan, a US-China Renewable Energy Partnership, a ‘21st Century Coal’ project on Carbon Capture and Storage and a US-China Energy Cooperation Program for renewable energy, smart grid, clean transportation, green building, clean coal, combined heat and power, and energy efficiency.
• The possibilities for technological cooperation with other countries are limitless, including EU, Japan, and Brazil
• Green investments – ‘Biggest job and wealth creation opportunity in 21st Century ‘ (The Economist, Nov 2006) 14
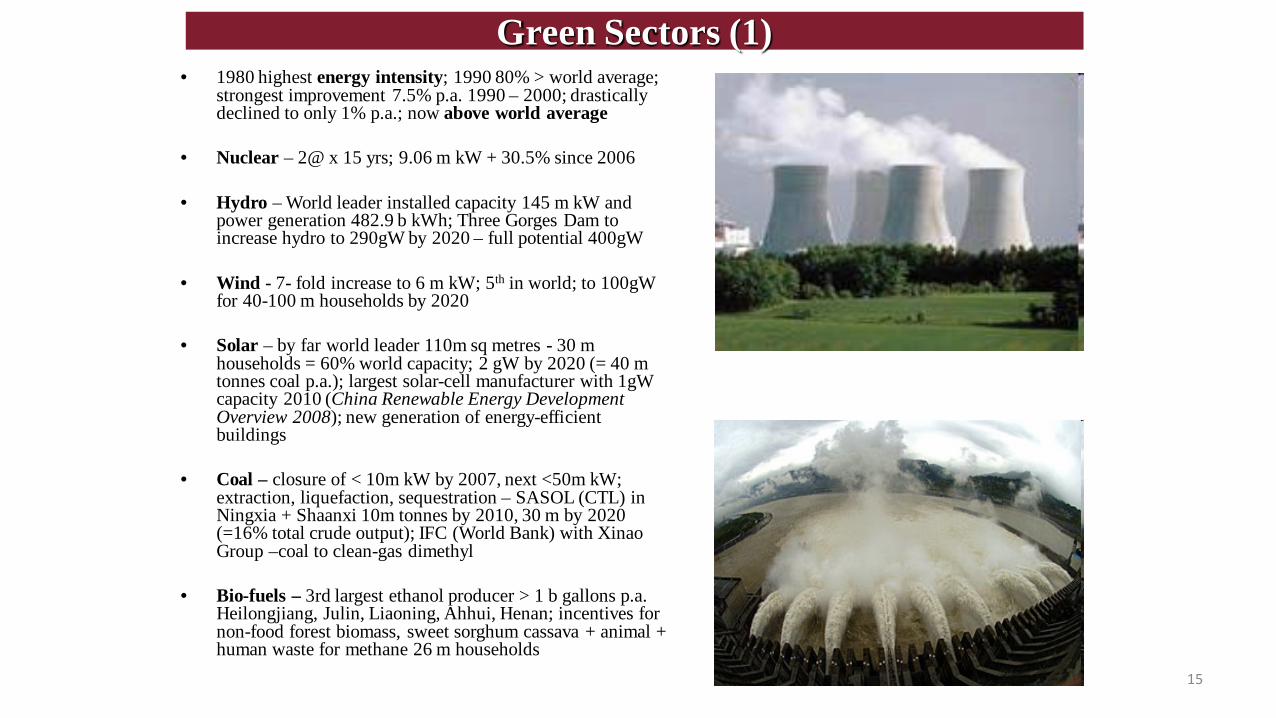
Green Sectors (1) • 1980 highest energy intensity; 1990 80% > world average;
strongest improvement 7.5% p.a. 1990 – 2000; drastically declined to only 1% p.a.; now above world average
• Nuclear – 2@ x 15 yrs; 9.06 m kW + 30.5% since 2006
• Hydro – World leader installed capacity 145 m kW and power generation 482.9 b kWh; Three Gorges Dam to increase hydro to 290gW by 2020 – full potential 400gW
• Wind - 7- fold increase to 6 m kW; 5th in world; to 100gW for 40-100 m households by 2020
• Solar – by far world leader 110m sq metres - 30 m households = 60% world capacity; 2 gW by 2020 (= 40 m tonnes coal p.a.); largest solar-cell manufacturer with 1gW capacity 2010 (China Renewable Energy Development Overview 2008); new generation of energy-efficient buildings
• Coal – closure of < 10m kW by 2007, next <50m kW; extraction, liquefaction, sequestration – SASOL (CTL) in Ningxia + Shaanxi 10m tonnes by 2010, 30 m by 2020 (=16% total crude output); IFC (World Bank) with XinaoGroup –coal to clean-gas dimethyl
• Bio-fuels – 3rd largest ethanol producer > 1 b gallons p.a. Heilongjiang, Julin, Liaoning, Ahhui, Henan; incentives for non-food forest biomass, sweet sorghum cassava + animal + human waste for methane 26 m households
15

Green Sectors (2)• IEA - China to invest $2.3 T (2001-30), inc $200 b for
renewables : + 7-10% p.a. by 2010 + 20% p.a. by 2020(target 15% total energy)
• Innovations in hydro, nuclear, coal-seam gas, biomass, wind, solar, terrestrial heat, wave, etc across provinces
• NGOs e.g. Green Peace in Climate Change projects in China + in developing Renewable Energy Law, effective 1.1.2006
• Electric Cars – Project 863, 1986; GM $1 b Shanghai; Tianjin launch in 2009; BYD E6 –range 195 km; 402 km single battery charge -Zoom: The Global Race to Fuel the Car of the Future, 2007
• UN Carbon Exchange in Beijing (5.2.2007)
• Eco-cities (post- Dongtan)
• Biggest job and wealth opportunity in the 21st C(Economist, 18.11.2006) (Microsoft (Bill Gates, Paul Allen) Sun Microsystems (Vinod Khosla), Larry Page and Sergey Brin (Google), Elon Musk (PayPal) + Warren Buffet
• Pentagon-sponsored Winnng the Oil Endgame (Amory Lovins et al, Rocky Mountain Institute, 2004).
16

Solar Energy (1) • World's largest solar-panel manufacturer, 70 % global
solar-energy market, capacity of 18 GW in 2010.• 2013 world’s largest solar market > Germany • 10 GW new projects in 2013, > x2 previous target + 3x 2012.
35 GW by 2015 v previous goal of 21 GW, 50 GW by 2020. • Worldwatch Institute, Washington DC - China has 30 m solar
households, 60% of world’s installed capacity• New generation of energy-efficient buildings incorporating
solar energies for application nationwide.• China now a leader in advanced solar technology. 2009, US
Applied Materials Inc., one of world's largest photovoltaic equipment suppliers, established solar technology centre in Xi'an, Shaanxi, one of the world's biggest and most-advanced private solar energy R&D facilities.
• 2/3 of China’s land area receives > 2,000 hrs sunlight annually, > many other regions of similar latitude, including Europe and Japan - a potential solar energy reserve = 1,700 b tons of coal.
• China’s single time-zone covers 3 time zones. When electricity is at peak in early evening in eastern areas, west China can still supply solar energy available in the daytime.
• Grid parity in China by 2018, two years ahead of US. 17
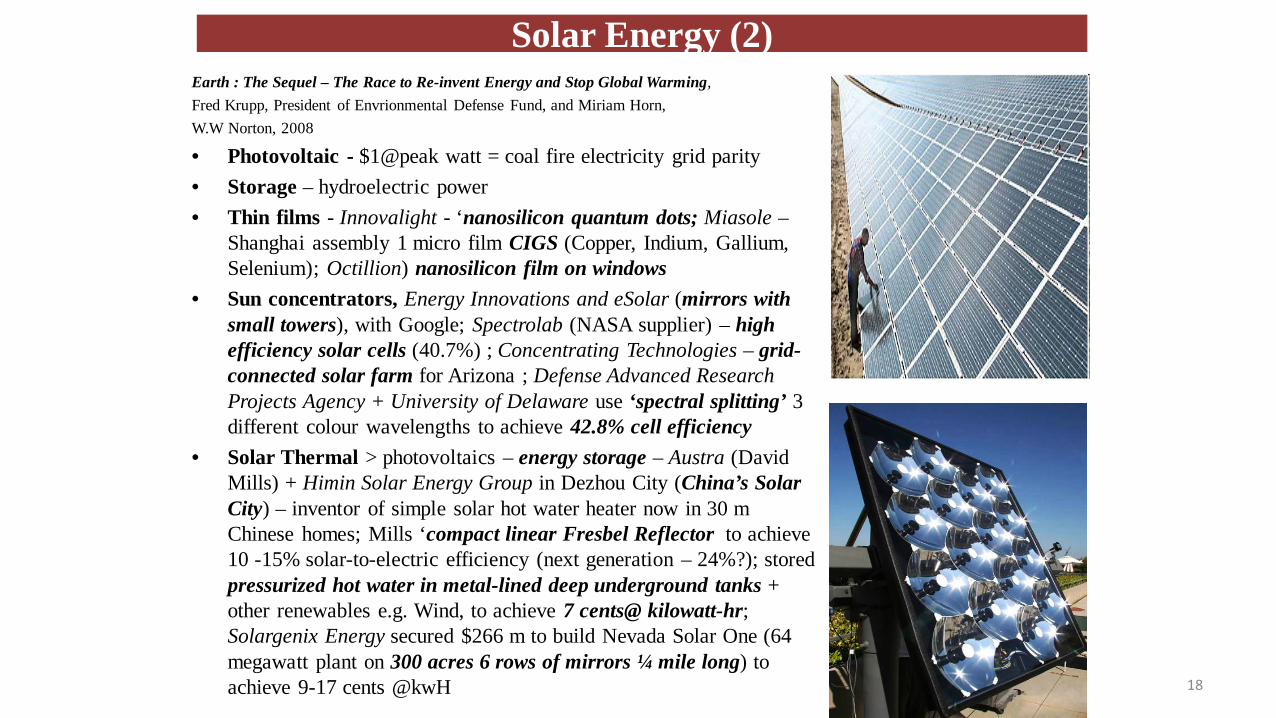
Solar Energy (2)Earth : The Sequel – The Race to Re-invent Energy and Stop Global Warming,Fred Krupp, President of Envrionmental Defense Fund, and Miriam Horn,W.W Norton, 2008
• Photovoltaic - $1@peak watt = coal fire electricity grid parity• Storage – hydroelectric power• Thin films - Innovalight - ‘nanosilicon quantum dots; Miasole –
Shanghai assembly 1 micro film CIGS (Copper, Indium, Gallium, Selenium); Octillion) nanosilicon film on windows
• Sun concentrators, Energy Innovations and eSolar (mirrors with small towers), with Google; Spectrolab (NASA supplier) – high efficiency solar cells (40.7%) ; Concentrating Technologies – grid-connected solar farm for Arizona ; Defense Advanced Research Projects Agency + University of Delaware use ‘spectral splitting’ 3 different colour wavelengths to achieve 42.8% cell efficiency
• Solar Thermal > photovoltaics – energy storage – Austra (David Mills) + Himin Solar Energy Group in Dezhou City (China’s Solar City) – inventor of simple solar hot water heater now in 30 m Chinese homes; Mills ‘compact linear Fresbel Reflector to achieve 10 -15% solar-to-electric efficiency (next generation – 24%?); stored pressurized hot water in metal-lined deep underground tanks + other renewables e.g. Wind, to achieve 7 cents@ kilowatt-hr; Solargenix Energy secured $266 m to build Nevada Solar One (64 megawatt plant on 300 acres 6 rows of mirrors ¼ mile long) to achieve 9-17 cents @kwH 18

Wind Energy
• CHINA > America as the world leader in wind energy in 2010, Global Wind Energy Council.
• China's installed wind capacity increased exponentially from 0.3GW in 2000 to 42.3GW in 2009, now 22% of world’s total.
• In 2010, more turbines were installed in China than America (The Economist, 3 February 2011)
• Wind power, much in Gansu, Xinjiang and Inner Mongolia, expected to grow from 1 GW to 30 GW, to power some 13-30 million households by 2020.
19
Bio-fuels
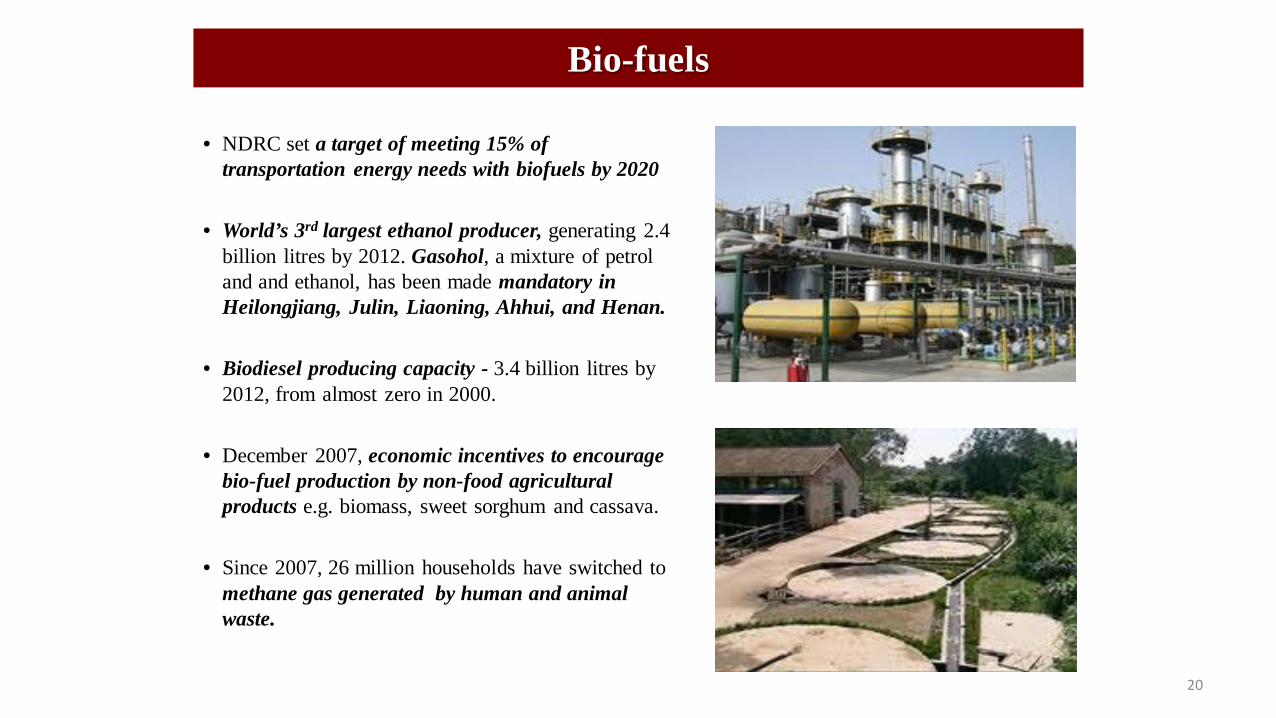
• NDRC set a target of meeting 15% of transportation energy needs with biofuels by 2020
• World’s 3rd largest ethanol producer, generating 2.4 billion litres by 2012. Gasohol, a mixture of petrol and and ethanol, has been made mandatory in Heilongjiang, Julin, Liaoning, Ahhui, and Henan.
• Biodiesel producing capacity - 3.4 billion litres by 2012, from almost zero in 2000.
• December 2007, economic incentives to encourage bio-fuel production by non-food agricultural products e.g. biomass, sweet sorghum and cassava.
• Since 2007, 26 million households have switched to methane gas generated by human and animal waste.
20

• Biofuels < 1/100 as efficient as best solar cell in converting solar radiation to energy; switchgrass, cutting-edge energy crop, converts only 0.3% of solar energy into chemical energy; huge demand for water + need for coal-fired boilers to generate required heat and pressure + competing for land and agriculture; 25 gallons of corn ethanol = @food for entire year
• Yeast catabolyzes sugar for own energy by excreting ethanol. Genome design to turn yeast into hyperactive ‘energy factory’ (Amyris (WHO-adopted Chinese anti-malaria cure) went public in 2010, but as of 2013, trading at less than 30% of IPO price. Approached by Virgin Fuels to develop low-carbon jet fuel.
• Cellulosic revolution – biomass energy balance (output/input) ratio 36BTU/1 v Brazilian ethanol 8BTU/1, corn-ethanol 1.3BTU/1; Verenium– bagasse (cane fibre), perennial grass and wood – non-food crops = 5x yield of grain-based ethanol – Amyris-style proprietary bacteria-fermenting technologies; BioEthanol Japan – wood construction waste; BP $80 m in British JV with jatropha
• Bio-prospecting – exotic enzymes e.g. extremophiles thriving in extreme conditions; guts of termites and wood-boring beetles, bio-mass degraders e.g button mushrooms for ‘green-gene’ enzymes); enzymes lower energy required for chemical reaction; Diversa ‘gigamatrix’ computerised system for enzyme cocktails; German CHOREN Industries applying CTL technology to liquify biomass; US research into re-generating tall perennial grass on the Great Plains
Yonder horizons – Bio-engineeringAlternative bio-fuels (1)
21
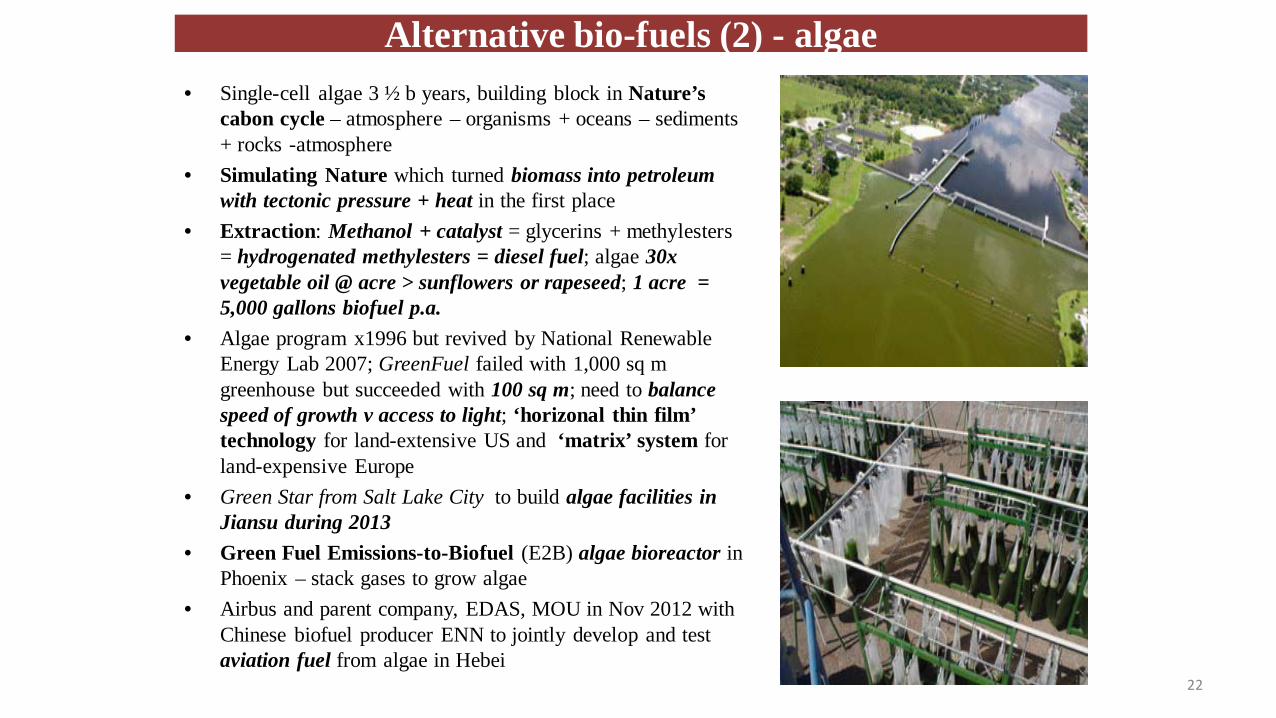
• Single-cell algae 3 ½ b years, building block in Nature’s cabon cycle – atmosphere – organisms + oceans – sediments + rocks -atmosphere
• Simulating Nature which turned biomass into petroleum with tectonic pressure + heat in the first place
• Extraction: Methanol + catalyst = glycerins + methylesters= hydrogenated methylesters = diesel fuel; algae 30x vegetable oil @ acre > sunflowers or rapeseed; 1 acre = 5,000 gallons biofuel p.a.
• Algae program x1996 but revived by National Renewable Energy Lab 2007; GreenFuel failed with 1,000 sq m greenhouse but succeeded with 100 sq m; need to balance speed of growth v access to light; ‘horizonal thin film’ technology for land-extensive US and ‘matrix’ system for land-expensive Europe
• Green Star from Salt Lake City to build algae facilities in Jiansu during 2013
• Green Fuel Emissions-to-Biofuel (E2B) algae bioreactor in Phoenix – stack gases to grow algae
• Airbus and parent company, EDAS, MOU in Nov 2012 with Chinese biofuel producer ENN to jointly develop and test aviation fuel from algae in Hebei
Alternative bio-fuels (2) - algae
22
Hydroelectric Power
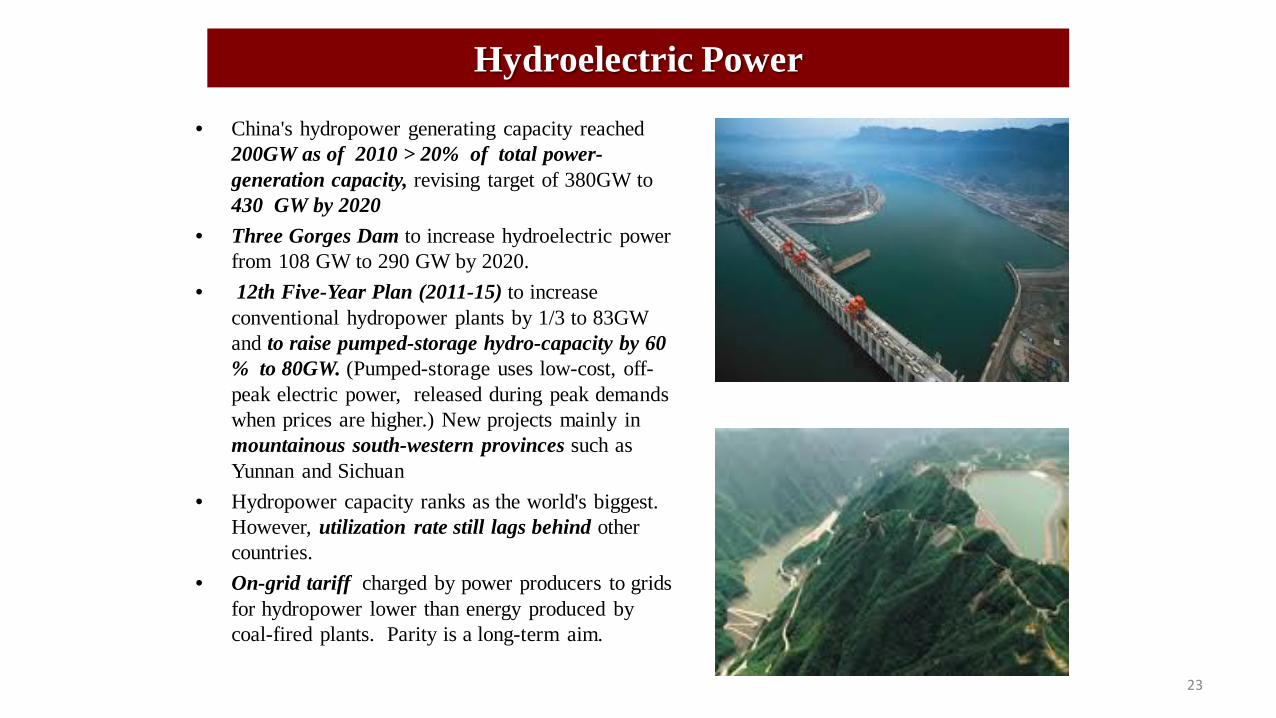
• China's hydropower generating capacity reached 200GW as of 2010 > 20% of total power-generation capacity, revising target of 380GW to 430 GW by 2020
• Three Gorges Dam to increase hydroelectric power from 108 GW to 290 GW by 2020.
• 12th Five-Year Plan (2011-15) to increase conventional hydropower plants by 1/3 to 83GW and to raise pumped-storage hydro-capacity by 60 % to 80GW. (Pumped-storage uses low-cost, off-peak electric power, released during peak demands when prices are higher.) New projects mainly in mountainous south-western provinces such as Yunnan and Sichuan
• Hydropower capacity ranks as the world's biggest. However, utilization rate still lags behind other countries.
• On-grid tariff charged by power producers to grids for hydropower lower than energy produced by coal-fired plants. Parity is a long-term aim.
23
Nuclear Energy
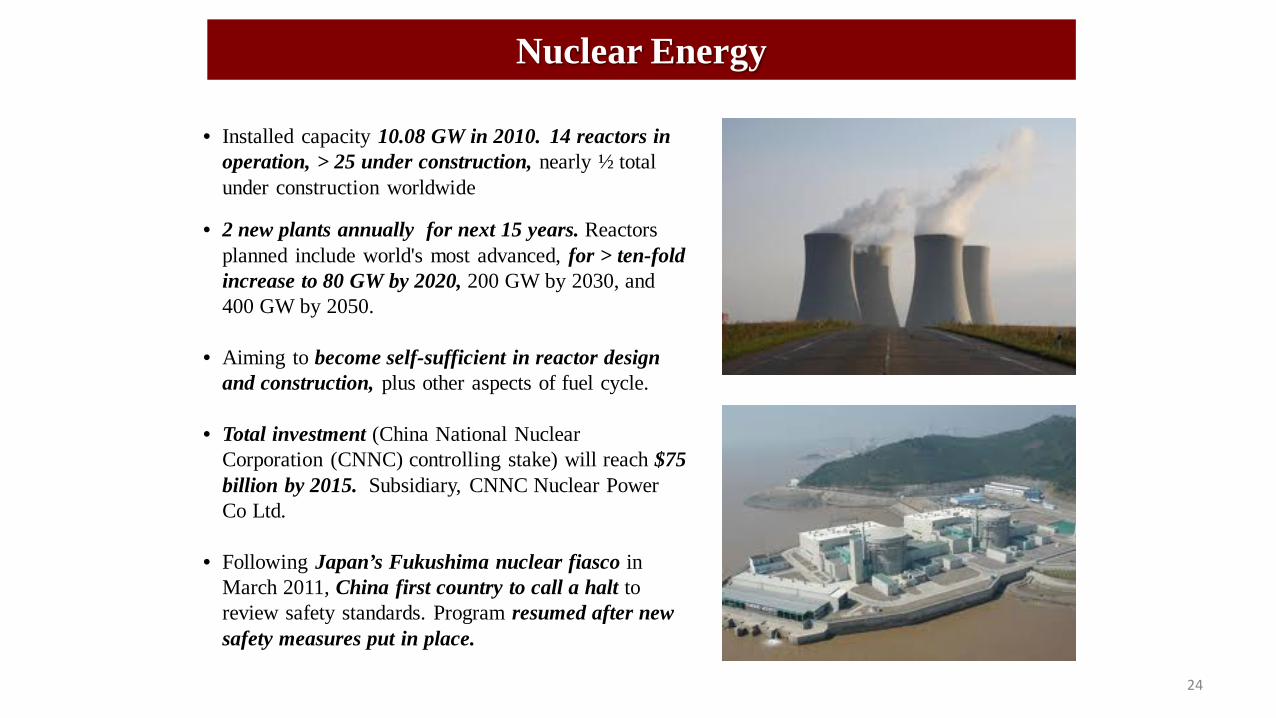
• Installed capacity 10.08 GW in 2010. 14 reactors in operation, > 25 under construction, nearly ½ total under construction worldwide
• 2 new plants annually for next 15 years. Reactors planned include world's most advanced, for > ten-fold increase to 80 GW by 2020, 200 GW by 2030, and 400 GW by 2050.
• Aiming to become self-sufficient in reactor design and construction, plus other aspects of fuel cycle.
• Total investment (China National Nuclear Corporation (CNNC) controlling stake) will reach $75 billion by 2015. Subsidiary, CNNC Nuclear Power Co Ltd.
• Following Japan’s Fukushima nuclear fiasco in March 2011, China first country to call a halt to review safety standards. Program resumed after new safety measures put in place.
24

• Potential fraction of Solar but consistency, predictability and intensity; computerisation, oceano-graphics, and hydro-acoustics (marine life). (Electric Power Research Institute)– potential to meet 10% of US energy demand); Europe’s Atlantic Coasts, W Australia, SW of S America and Africa. Europeans leading in hydroelectric technologies
• AcquaEnery – floating cluster AquaBuOYs @8 ft steel cylinder with rubber marine hosts at top and bottom pulling piston to drive a central turbine on a barge; 80 megawatt plant outside Makah Bay (NW tip of US) takes ½ sq mile of bay to supply ½ electricity of Olympic Peninsula
• Onshore - SW England Regional Development Agency $43 m for wave hub off Cornwall . Wavegen, Scotland - waves to compress /suck air in rock chamber to drive turbines (no seawater corrosion); Wave Dragon, Wales - waves through curved ramps into reservoir with turbines
• Offshore - Scotland’s Ocean Power Delivery - 500-ft articulated submerged ‘sea-snakes’ with hydraulic rams – 2.25 megawatt facility in Portugal + 3-megawatt project in Scotland 2008; $50 m from GE, Carbon Trust + European venture capital
• Tidal Energy– Voith Siemens Hydro to build 600 megawatt plant in Wando, S Korea by 2018; bridge-like structures + underwater ‘windmills’ with 50 ft blades; giant tidal generators to suspend in Gulf Stream?; NY Verdant Power + Washington-based Oceana Energy
Ocean Energy
25
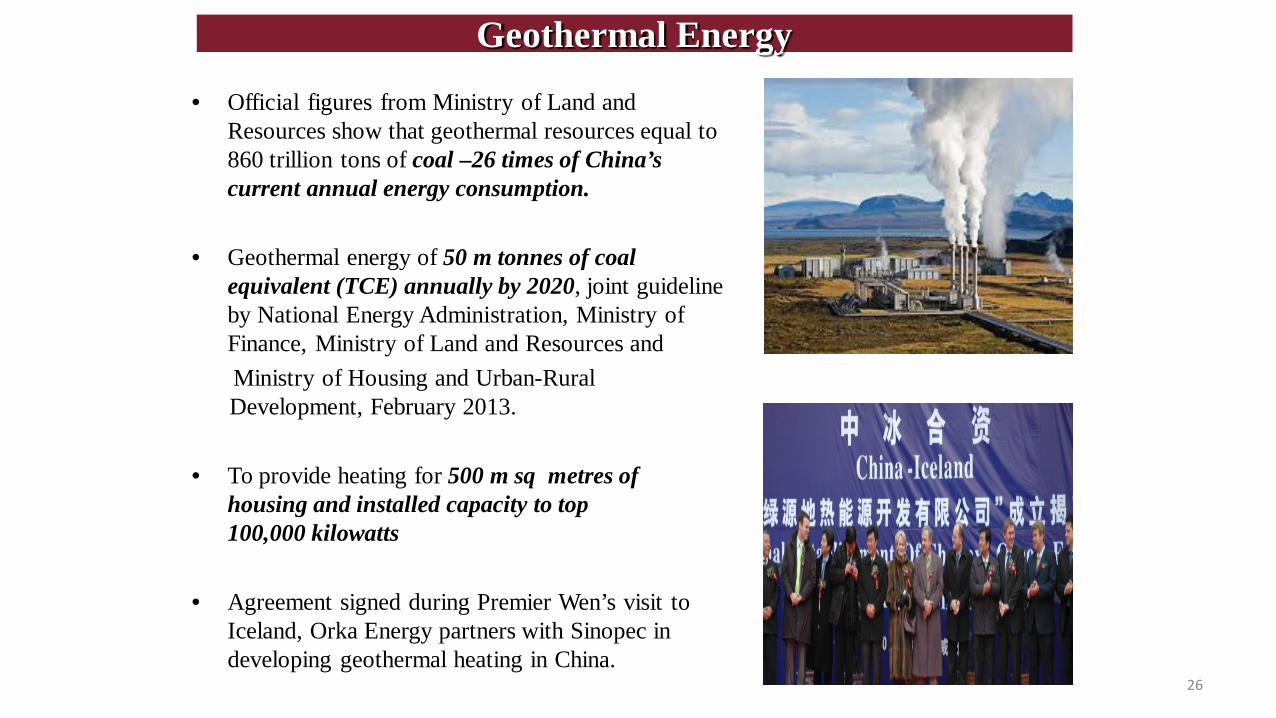
• Official figures from Ministry of Land and Resources show that geothermal resources equal to 860 trillion tons of coal –26 times of China’s current annual energy consumption.
• Geothermal energy of 50 m tonnes of coal equivalent (TCE) annually by 2020, joint guideline by National Energy Administration, Ministry of Finance, Ministry of Land and Resources andMinistry of Housing and Urban-Rural Development, February 2013.
• To provide heating for 500 m sq metres of housing and installed capacity to top 100,000 kilowatts
• Agreement signed during Premier Wen’s visit to Iceland, Orka Energy partners with Sinopec in developing geothermal heating in China.
Geothermal Energy
26
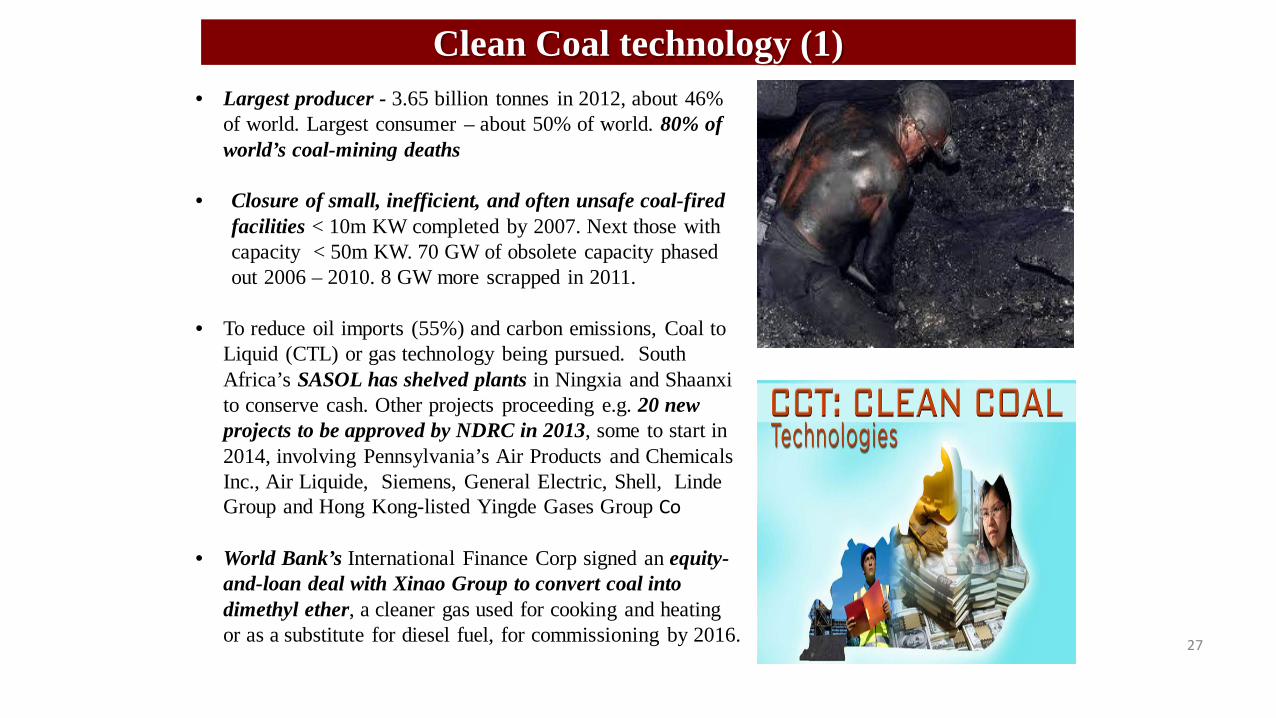
Clean Coal technology (1) • Largest producer - 3.65 billion tonnes in 2012, about 46%
of world. Largest consumer – about 50% of world. 80% of world’s coal-mining deaths
• Closure of small, inefficient, and often unsafe coal-fired facilities < 10m KW completed by 2007. Next those with capacity < 50m KW. 70 GW of obsolete capacity phased out 2006 – 2010. 8 GW more scrapped in 2011.
• To reduce oil imports (55%) and carbon emissions, Coal to Liquid (CTL) or gas technology being pursued. South Africa’s SASOL has shelved plants in Ningxia and Shaanxi to conserve cash. Other projects proceeding e.g. 20 new projects to be approved by NDRC in 2013, some to start in 2014, involving Pennsylvania’s Air Products and Chemicals Inc., Air Liquide, Siemens, General Electric, Shell, LindeGroup and Hong Kong-listed Yingde Gases Group Co
• World Bank’s International Finance Corp signed an equity-and-loan deal with Xinao Group to convert coal into dimethyl ether, a cleaner gas used for cooking and heating or as a substitute for diesel fuel, for commissioning by 2016. 27

• China ~80% electricity from coal, adding a 500 megawatt coal-fired plant @ 4 days; consuming more coal > US + EU + Japan; coal 1/3 global emissions
• Nearly all burn pulverized coal blown into a burner – ‘sub-critical’ temperature 35% energy conversion. ‘Super’ to ultra-critical’ up to 590 degrees C (40% efficiency) > 760 degrees = 50% efficiency
• Carbon capture -‘chilled ammonia process’– Chilling precipitates SO2 and mercury. Re-heated using waste heat from power plant to release pure CO2 for injection into ground.
• Carbozyme seeks to use enzymes to clean CO2 faster, binding CO2 first into bicarbonate before reversal into pure CO2
• Gasification with pure O produces only CO and H; CO + steam to turn into CO2 to be removed by solvent. H to be burnt for carbon-free energy. Integrated Gasification Combined Cycle (IGCC) uses hot gas from H combustion to produce steam to drive second turbine.
• Great Point Energy has entered into a $1.25 billion partnership with WanxiangHolding to build a large scale “”Hydromethanation” plant to produce .5% of China's projected energy needs. The first phase is expected to begin operation in 2015 with an initial natural gas production of 30 billion cubic feet
• Underground Coal Gasification (UCG) Siemens 1868, Lenin and Stalin up to WWII. Benefits - no mining calamities, no open pits, no polluted run-offs, no transportation, access to vast reserves. Ergo Energy price $1@million BTU = 1/3 –1/6 surface gasifier price; adding carbon capture = $30@megawatt–hr, not much above pulverized coal without carbon capture. Advanced computer simulation to avoid ground water contamination and surface subsidence. Now UGC in development worldwide, including China (largest).
• Geologic sequestration – using underground cavity created by UCG to store CO2 on the spot; risks of water contamination and subsidence
Clean Coal technology (2)
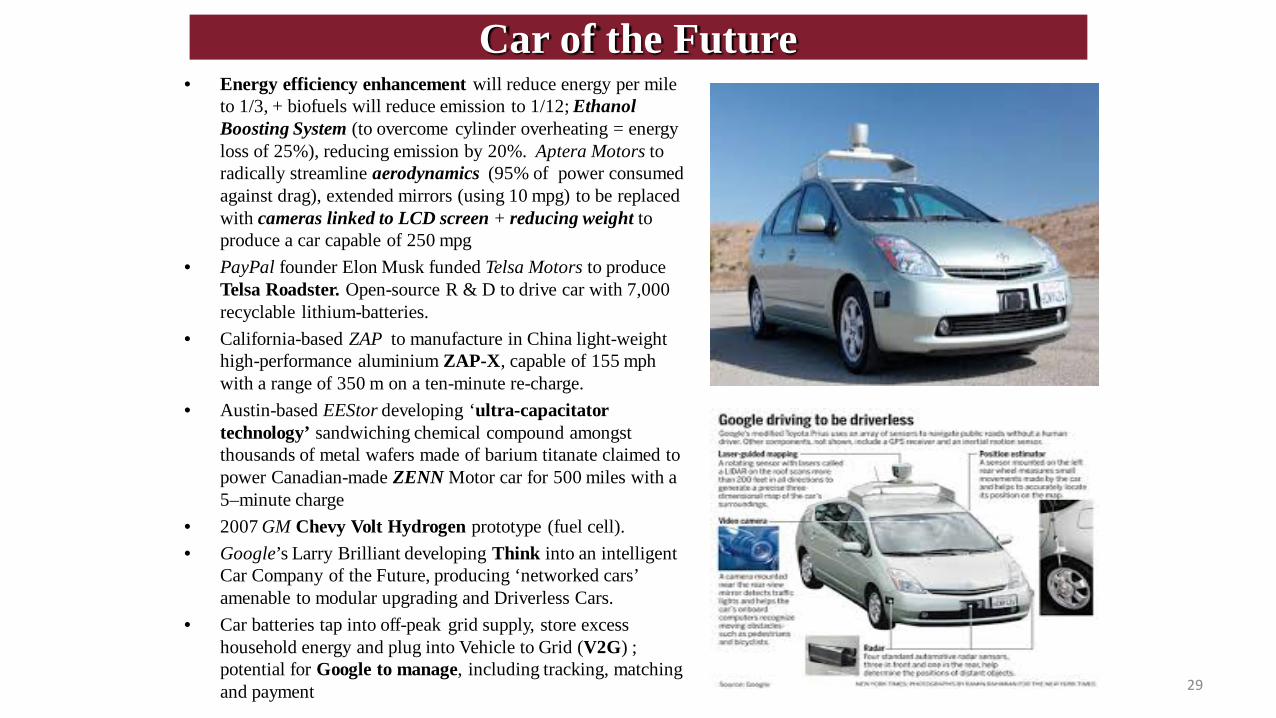
• Energy efficiency enhancement will reduce energy per mile to 1/3, + biofuels will reduce emission to 1/12; Ethanol Boosting System (to overcome cylinder overheating = energy loss of 25%), reducing emission by 20%. Aptera Motors to radically streamline aerodynamics (95% of power consumed against drag), extended mirrors (using 10 mpg) to be replaced with cameras linked to LCD screen + reducing weight to produce a car capable of 250 mpg
• PayPal founder Elon Musk funded Telsa Motors to produce Telsa Roadster. Open-source R & D to drive car with 7,000 recyclable lithium-batteries.
• California-based ZAP to manufacture in China light-weight high-performance aluminium ZAP-X, capable of 155 mph with a range of 350 m on a ten-minute re-charge.
• Austin-based EEStor developing ‘ultra-capacitatortechnology’ sandwiching chemical compound amongst thousands of metal wafers made of barium titanate claimed to power Canadian-made ZENN Motor car for 500 miles with a 5–minute charge
• 2007 GM Chevy Volt Hydrogen prototype (fuel cell).• Google’s Larry Brilliant developing Think into an intelligent
Car Company of the Future, producing ‘networked cars’ amenable to modular upgrading and Driverless Cars.
• Car batteries tap into off-peak grid supply, store excess household energy and plug into Vehicle to Grid (V2G) ; potential for Google to manage, including tracking, matching and payment
Car of the Future
29
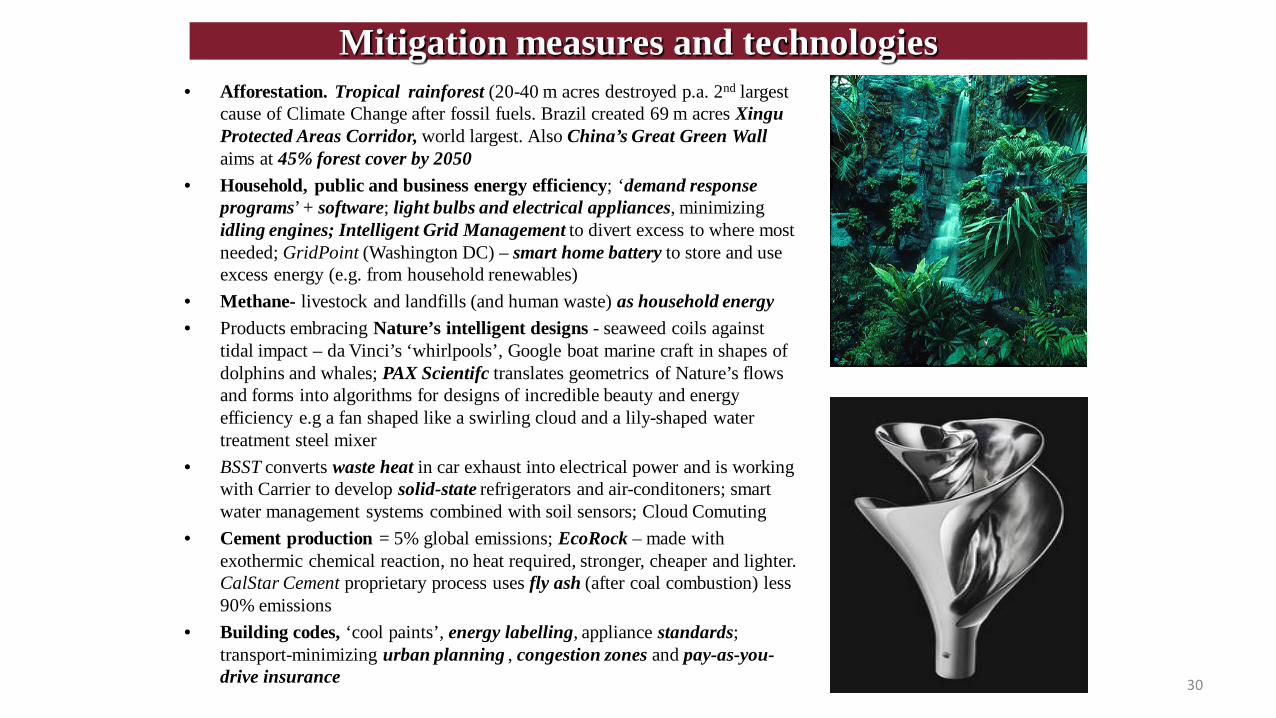
• Afforestation. Tropical rainforest (20-40 m acres destroyed p.a. 2nd largest cause of Climate Change after fossil fuels. Brazil created 69 m acres Xingu Protected Areas Corridor, world largest. Also China’s Great Green Wall aims at 45% forest cover by 2050
• Household, public and business energy efficiency; ‘demand response programs’ + software; light bulbs and electrical appliances, minimizing idling engines; Intelligent Grid Management to divert excess to where most needed; GridPoint (Washington DC) – smart home battery to store and use excess energy (e.g. from household renewables)
• Methane- livestock and landfills (and human waste) as household energy• Products embracing Nature’s intelligent designs - seaweed coils against
tidal impact – da Vinci’s ‘whirlpools’, Google boat marine craft in shapes of dolphins and whales; PAX Scientifc translates geometrics of Nature’s flows and forms into algorithms for designs of incredible beauty and energy efficiency e.g a fan shaped like a swirling cloud and a lily-shaped water treatment steel mixer
• BSST converts waste heat in car exhaust into electrical power and is working with Carrier to develop solid-state refrigerators and air-conditoners; smart water management systems combined with soil sensors; Cloud Comuting
• Cement production = 5% global emissions; EcoRock – made with exothermic chemical reaction, no heat required, stronger, cheaper and lighter. CalStar Cement proprietary process uses fly ash (after coal combustion) less 90% emissions
• Building codes, ‘cool paints’, energy labelling, appliance standards; transport-minimizing urban planning , congestion zones and pay-as-you-drive insurance
Mitigation measures and technologies
30

• Artificial leaves – light to electricity and chemical bonds (as in photosynthesis), but instead of sugar – methane, methanol, or hydrogen; viral batteries (3x storage)
• Artificial tree farms - using sodium carbonate to bind CO2 . 40 ft tree removes 1 ton of CO2@day. Investors include Jeffrey Sachs of Earth Institute at Columbia University and climate scientist Wally Broecker
• Mining the sky – Sky Wind Power, Colo. –flying generators 35,000 ft transmitting energy through aluminium tethers over ground base 10x20 miles; Royal Dutch Shell backed ‘ladder mill’ version of kites turning generator-linked wheels (50 megawatts @5 cents kwH); Cool Earth Solar, Ca - solar power in high altitudes using suspended concave bottom directed at high photovoltaic centre (National Security Space Office Advanced Concepts Office) – space orbiting arrays beaming electromagnetic energy to earth
• ‘Staircase to Heaven’ (Economist May 2007) – “auroral oval”, 1of 2 earth openings to outer space allowing charged particles of solar wind to slip into the atmosphere as ‘northern lights’; – Alfred Wong , UCLA proposes to ionize CO2 with powerful lasers to allow negatively-charged CO2 ions to go up along world’s magnetic force, spinned up with radio waves and aided by solar wind; lasers and radio waves driven by geothermal energy
• Nuclear Fusion – ITER (The Way) (EU, US, Russia, China, India, Japan and Korea); Tri Alpha (fusion of non-radioactive boron-11 (fibreglass) ‘impossible’ aneutronic fusion’ 5x energy barrier > normal deutrium/tritium fusion, staggering high temperatures, compact – size of a case of wine = 100 megawatt facility –Investors include Microsoft founder Paul Allen and Goldman Sachs. 5-15 years?
Yonder possibilities
31
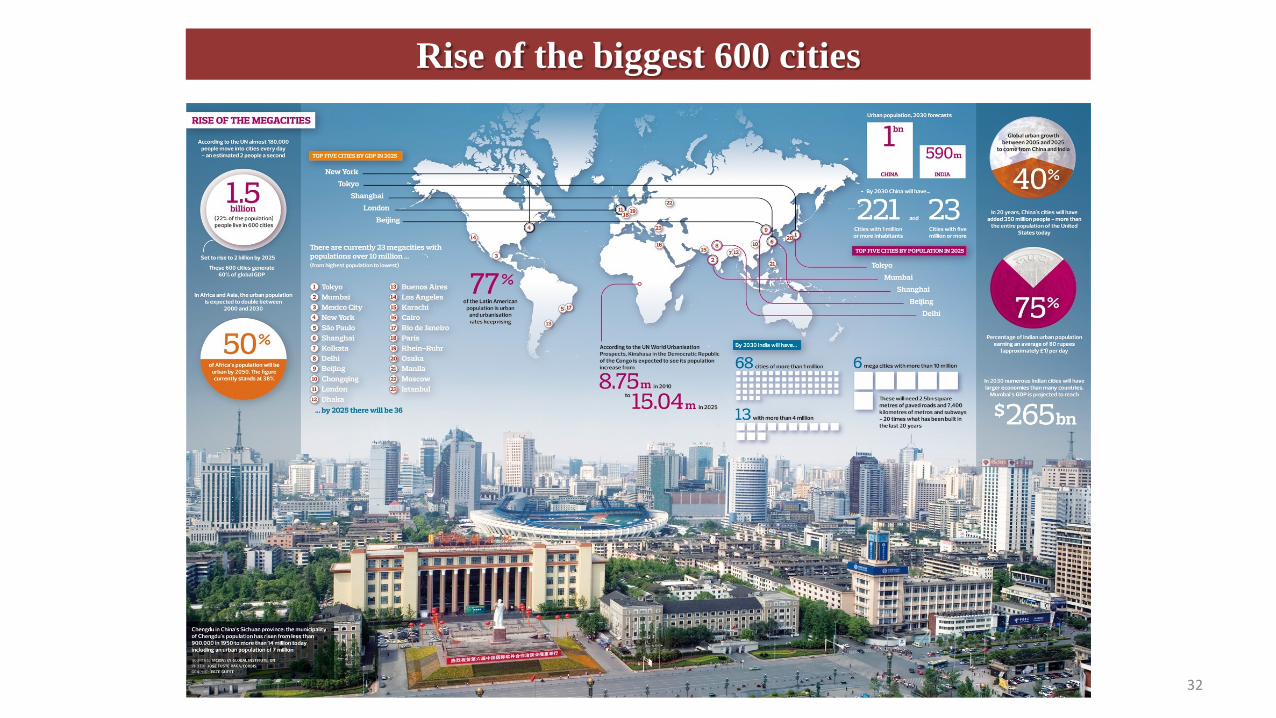
Rise of the biggest 600 cities
32
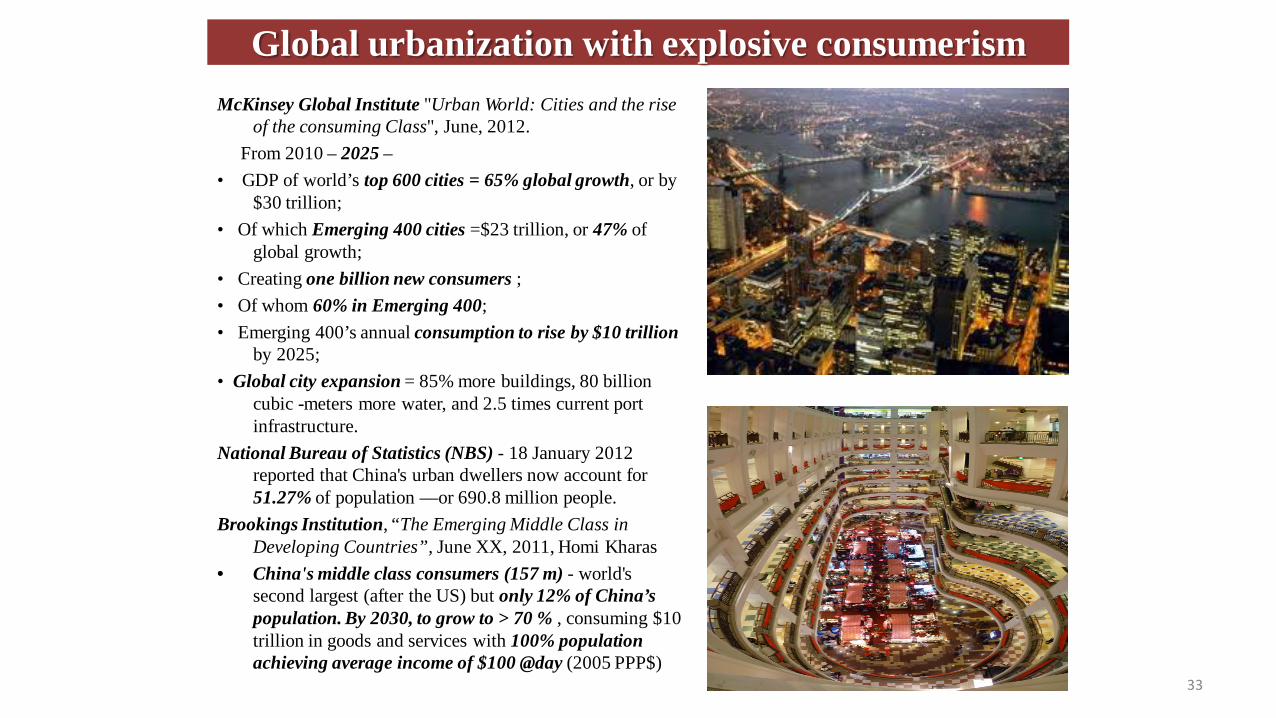
Global urbanization with explosive consumerism McKinsey Global Institute "Urban World: Cities and the rise
of the consuming Class", June, 2012.From 2010 – 2025 –
• GDP of world’s top 600 cities = 65% global growth, or by $30 trillion;
• Of which Emerging 400 cities =$23 trillion, or 47% of global growth;
• Creating one billion new consumers ;• Of whom 60% in Emerging 400;• Emerging 400’s annual consumption to rise by $10 trillion
by 2025;• Global city expansion = 85% more buildings, 80 billion
cubic -meters more water, and 2.5 times current port infrastructure.
National Bureau of Statistics (NBS) - 18 January 2012 reported that China's urban dwellers now account for 51.27% of population —or 690.8 million people.
Brookings Institution, “The Emerging Middle Class in Developing Countries”, June XX, 2011, Homi Kharas
• China's middle class consumers (157 m) - world's second largest (after the US) but only 12% of China’s population. By 2030, to grow to > 70 % , consuming $10 trillion in goods and services with 100% population achieving average income of $100 @day (2005 PPP$)
33

Rise of the cities in the developing world
34
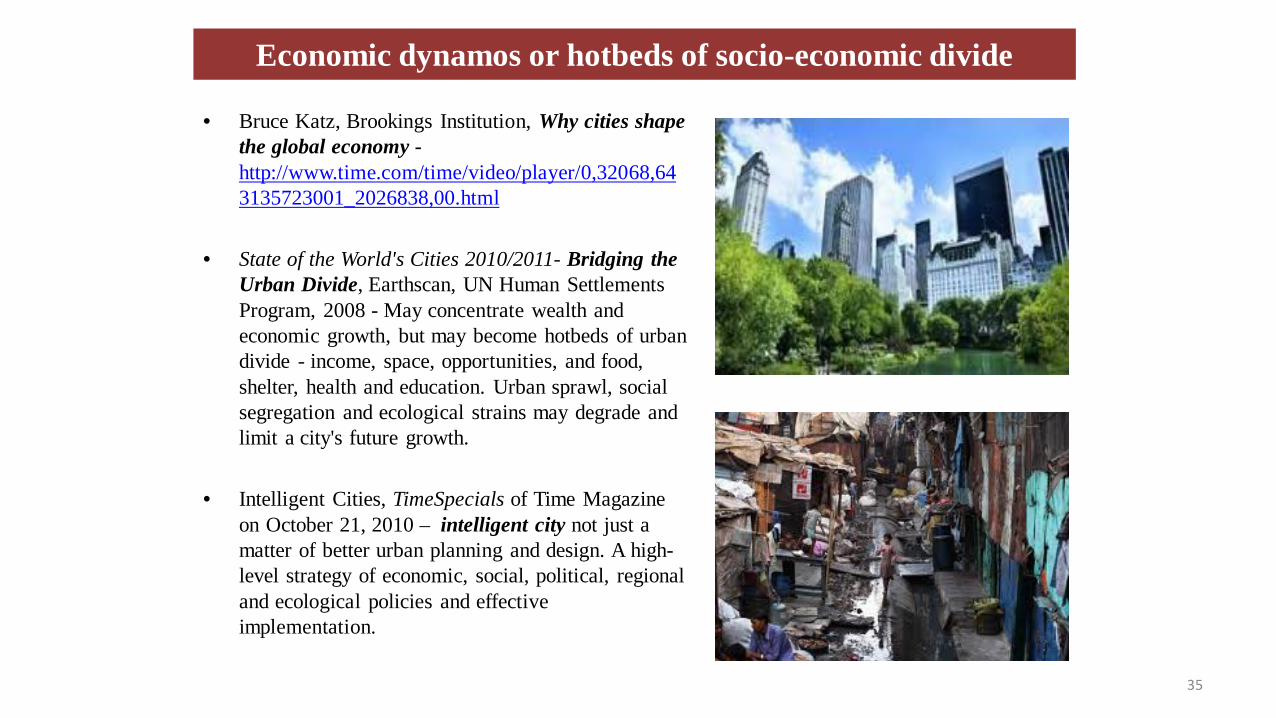
Economic dynamos or hotbeds of socio-economic divide
• Bruce Katz, Brookings Institution, Why cities shape the global economy -http://www.time.com/time/video/player/0,32068,643135723001_2026838,00.html
• State of the World's Cities 2010/2011- Bridging the Urban Divide, Earthscan, UN Human Settlements Program, 2008 - May concentrate wealth and economic growth, but may become hotbeds of urban divide - income, space, opportunities, and food, shelter, health and education. Urban sprawl, social segregation and ecological strains may degrade and limit a city's future growth.
• Intelligent Cities, TimeSpecials of Time Magazine on October 21, 2010 – intelligent city not just a matter of better urban planning and design. A high-level strategy of economic, social, political, regional and ecological policies and effective implementation.
35
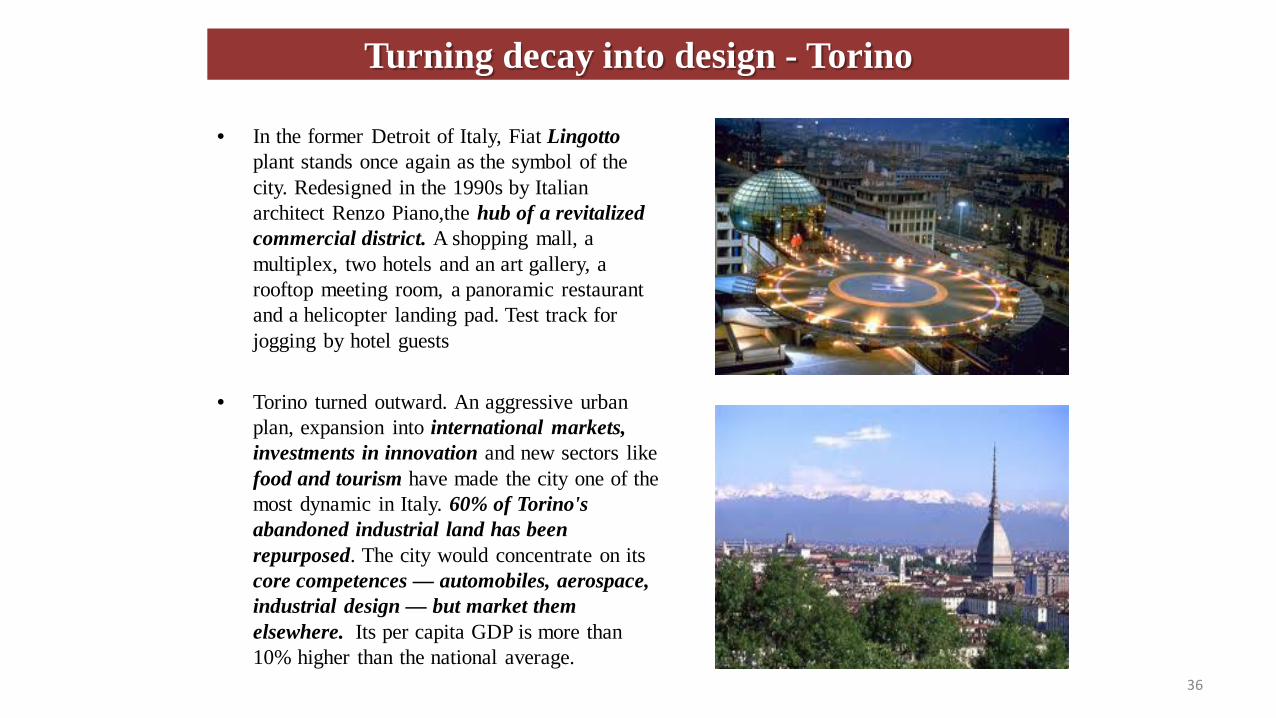
Turning decay into design - Torino
• In the former Detroit of Italy, Fiat Lingottoplant stands once again as the symbol of the city. Redesigned in the 1990s by Italian architect Renzo Piano,the hub of a revitalized commercial district. A shopping mall, a multiplex, two hotels and an art gallery, a rooftop meeting room, a panoramic restaurant and a helicopter landing pad. Test track for jogging by hotel guests
• Torino turned outward. An aggressive urban plan, expansion into international markets, investments in innovation and new sectors like food and tourism have made the city one of the most dynamic in Italy. 60% of Torino's abandoned industrial land has been repurposed. The city would concentrate on its core competences — automobiles, aerospace, industrial design — but market them elsewhere. Its per capita GDP is more than 10% higher than the national average.
36
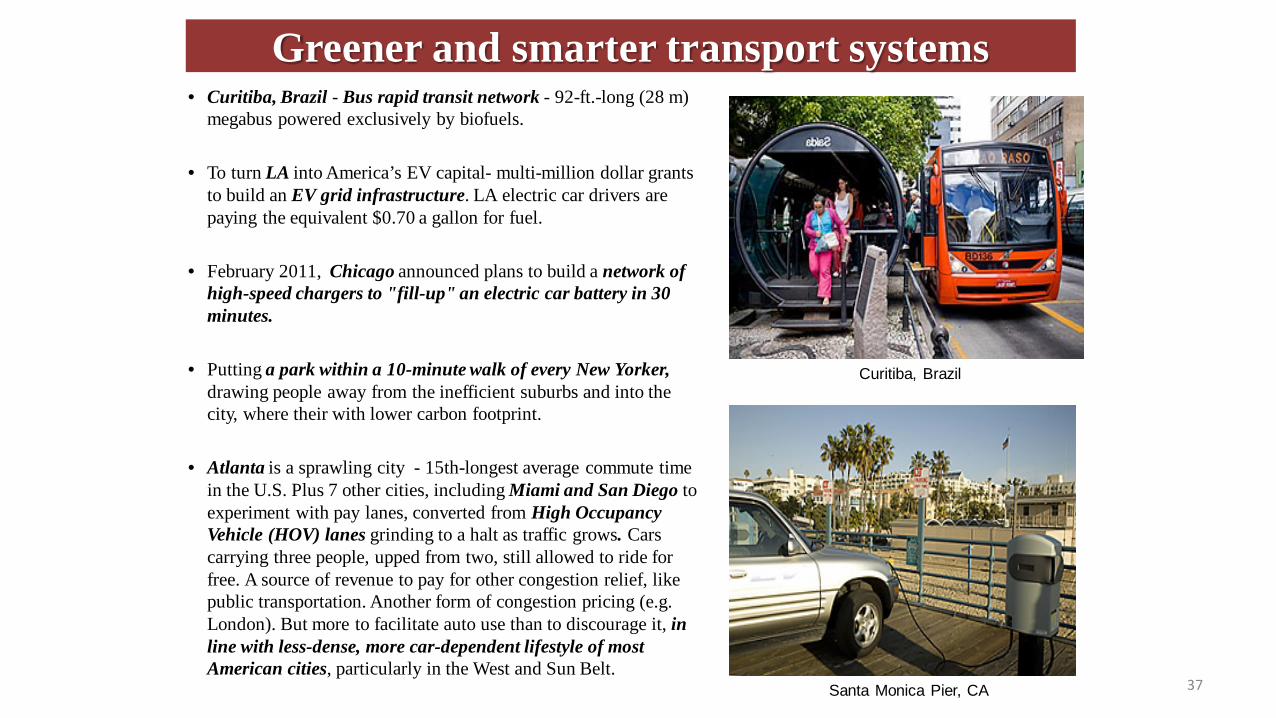
Greener and smarter transport systems• Curitiba, Brazil - Bus rapid transit network - 92-ft.-long (28 m)
megabus powered exclusively by biofuels.
• To turn LA into America’s EV capital- multi-million dollar grants to build an EV grid infrastructure. LA electric car drivers are paying the equivalent $0.70 a gallon for fuel.
• February 2011, Chicago announced plans to build a network of high-speed chargers to "fill-up" an electric car battery in 30 minutes.
• Putting a park within a 10-minute walk of every New Yorker, drawing people away from the inefficient suburbs and into the city, where their with lower carbon footprint.
• Atlanta is a sprawling city - 15th-longest average commute time in the U.S. Plus 7 other cities, including Miami and San Diego to experiment with pay lanes, converted from High Occupancy Vehicle (HOV) lanes grinding to a halt as traffic grows. Cars carrying three people, upped from two, still allowed to ride for free. A source of revenue to pay for other congestion relief, like public transportation. Another form of congestion pricing (e.g. London). But more to facilitate auto use than to discourage it, in line with less-dense, more car-dependent lifestyle of most American cities, particularly in the West and Sun Belt.
Curitiba, Brazil
Santa Monica Pier, CA 37

Smarter way to build Smart Grids•Boulder, Colorado, launched Smart Grid City project with Xcel Energy in 2008. Creating grid infrastructure to automatically adjust energy strains e.g. remotely turning down air conditioners according to outside temperature.
•To capture irregular renewable sources e.g. solar energy or wind power. To let prices fluctuate according to demand, to achieve optimized consumption, decreased costs, fewer power outages, lower environmental impact. Essential for expansion of electric cars.
•Xcel relied on expensive fibre-optic cable while wireless technologies have since improved dramatically. Misplaced initial focus on big infrastructural improvements to the aging grid, instead of helping consumers to reap early benefits in usage and pricing.
•Cities as diverse as Houston, San Diego and Chattanooga, Tennessee are now joining the act. Private investors increasingly interested . However, questions about privacy, security, technology, and regulation.
38
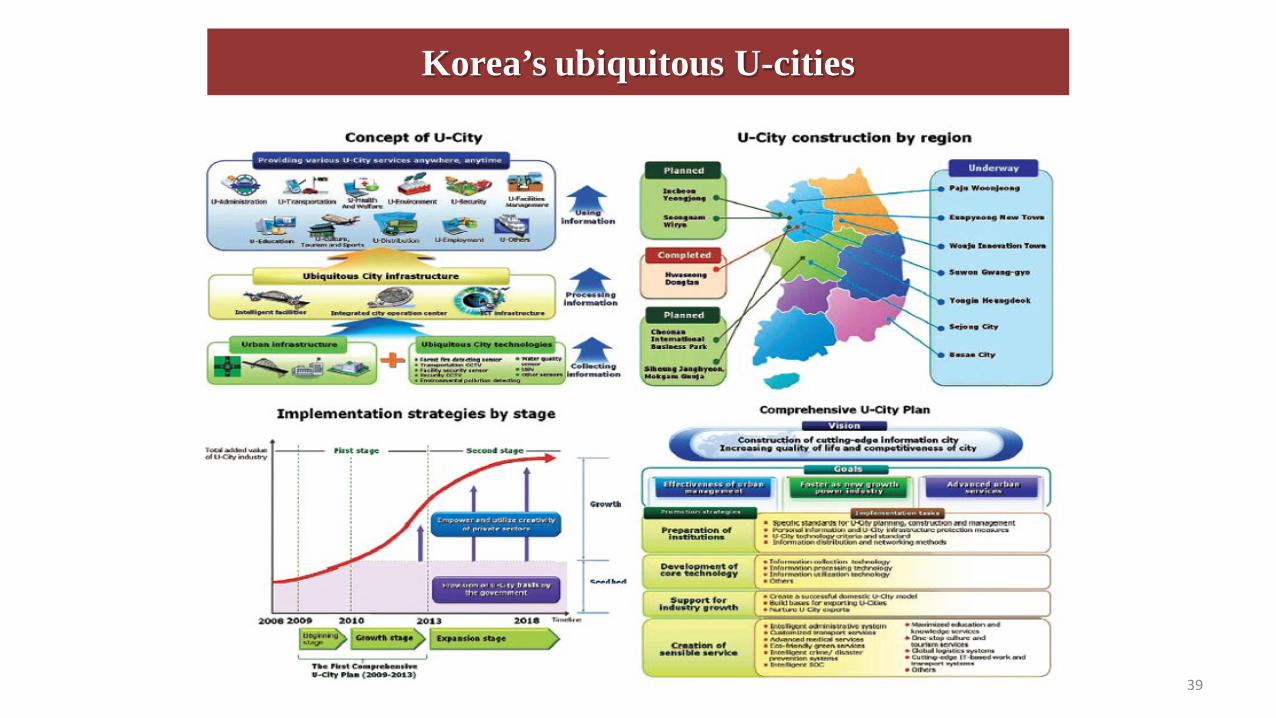
Korea’s ubiquitous U-cities
39

Ubiquitous City Apps • A society of Ubiquitous Information Networking for
every citizen by 2050 – Science and Technology in China: Roadmap to 2050, Chinese Academy of Sciences, 2010
• London Datastore, public info on city budgets, hospital performance, traffic congestion, tube operations, train schedules and bicycle-hire scheme locations
• Super-high speed internet – Tennessee’s Chattanooga -one gigabyte@second, or 200 times faster.
• San Francisco - smart phone to hail a cab, track a bus and pay a parking ticket. “SF Trees”, approach any tree in the city to find out its type, potholes, trash and graffiti problems. more than 50 privately produced apps from restaurants, health codes to most popular biking routes.
• Los Angeles, Seattle, Chicago, Boston, New York and Washington banded together with SF to brainstorm,
Bryant Park, New York, 2010
Seongnam U-City, Korea
40

Urban water conservation• A third of the water used in California could
be saved with existing technology – “Waste Not, Want Not: The Potential for Urban Water Conservation in California, the Pacific Institute, November 2003.
• Governor Schwarzenegger in his 20x2020 Plan determined that California needs to reduce the amount of water each person uses per day by 20 percent by 2020. Supported by legislation passed in November 2009.
• Tucson, Arizona – Gray water (down drains or out of washing machines) promoted. In 2007, a tax credit of up to $1,000 for homeowners who install gray water systems. Tuscan law requiring builders to include graywater plumbing in new constructions.
41

Zero-carbon buildings• Claimed World’s first zero-carbon building. HQs of the
Netherlands chapter of the World Wide Fund for Nature completed in October 2006. In Driebergseweg (Zeist). Naturally ventilated. Obtains heat from staff and office equipment while solar arrays provide electricity and hot water. A backup biomass system is available. Ceilings are moisture-balancing made of mud with continuous circulation of water through little glass tubes spreading human and mechanical warmth and cooling.
• China’s first zero-carbon building – Ningbo’s CSET building designed by Italian firm Mario Cucinella Architects at Nottingham University. A large roof opening shines natural light inside and creates a natural ventilation system. Façade features a dramatic folded pattern inspired by paper lanterns. Exterior is made from a double skin of glass printed with a subtle historical pattern.
• Hong Kong’s first zero-carbon building at Sheung Yuet Road in Kowloon Bay completed on 26 June, 2012 , developed by Construction Industry Council together with HKG. Three-story naturally-ventilated building designed to produce more energy than it uses, capable of provide surplus energy back to the public power grid. Solar panels and bio-diesel made of used cooking oil to generate renewable energy on site. An ECO-MAX adsorption chiller made in Athens by Power Partners, Inc., is part of a tri-generation system providing power, heat and cooling to the building.
42

Green and chic minimalist lifestyles?
43
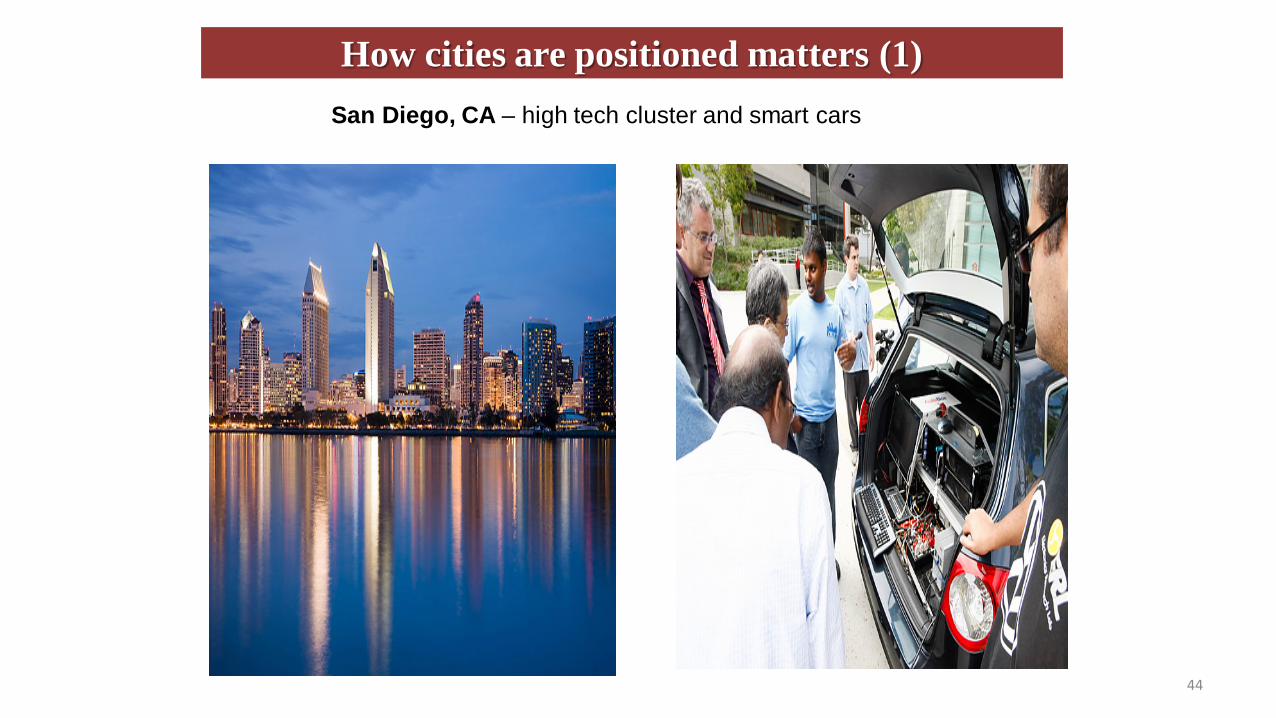
How cities are positioned matters (1) San Diego, CA – high tech cluster and smart cars
44
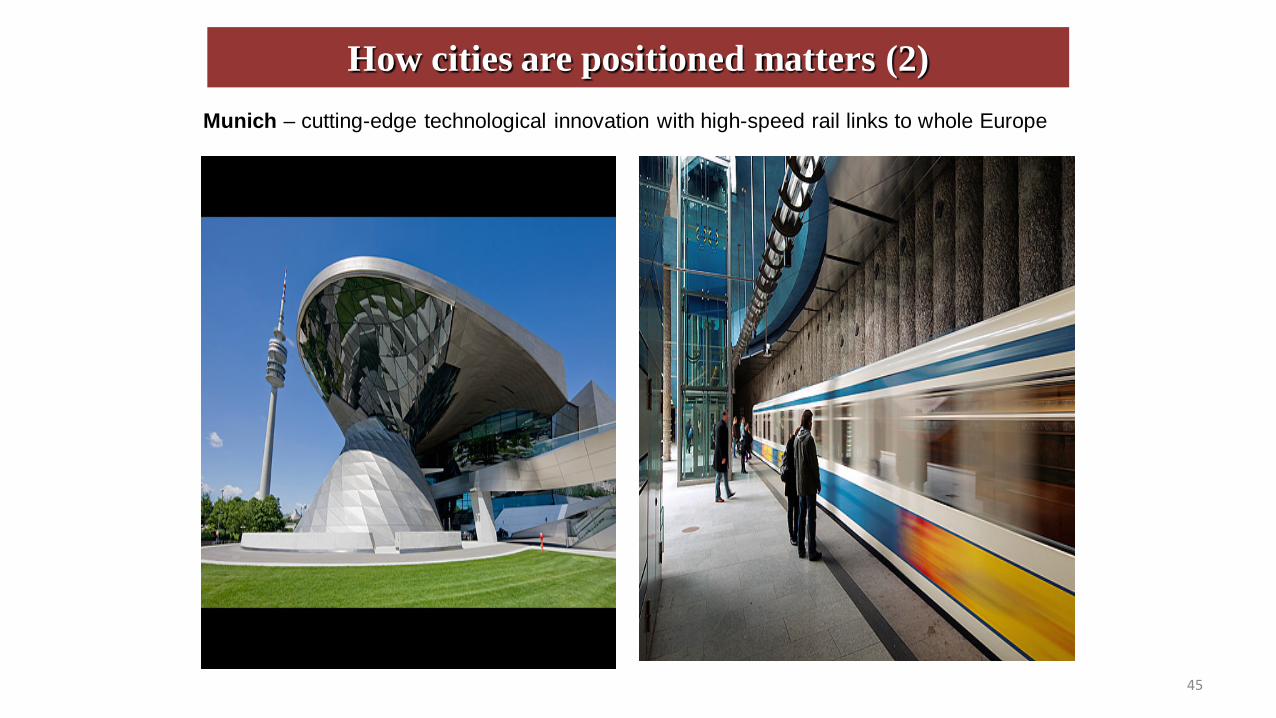
How cities are positioned matters (2) Munich – cutting-edge technological innovation with high-speed rail links to whole Europe
45
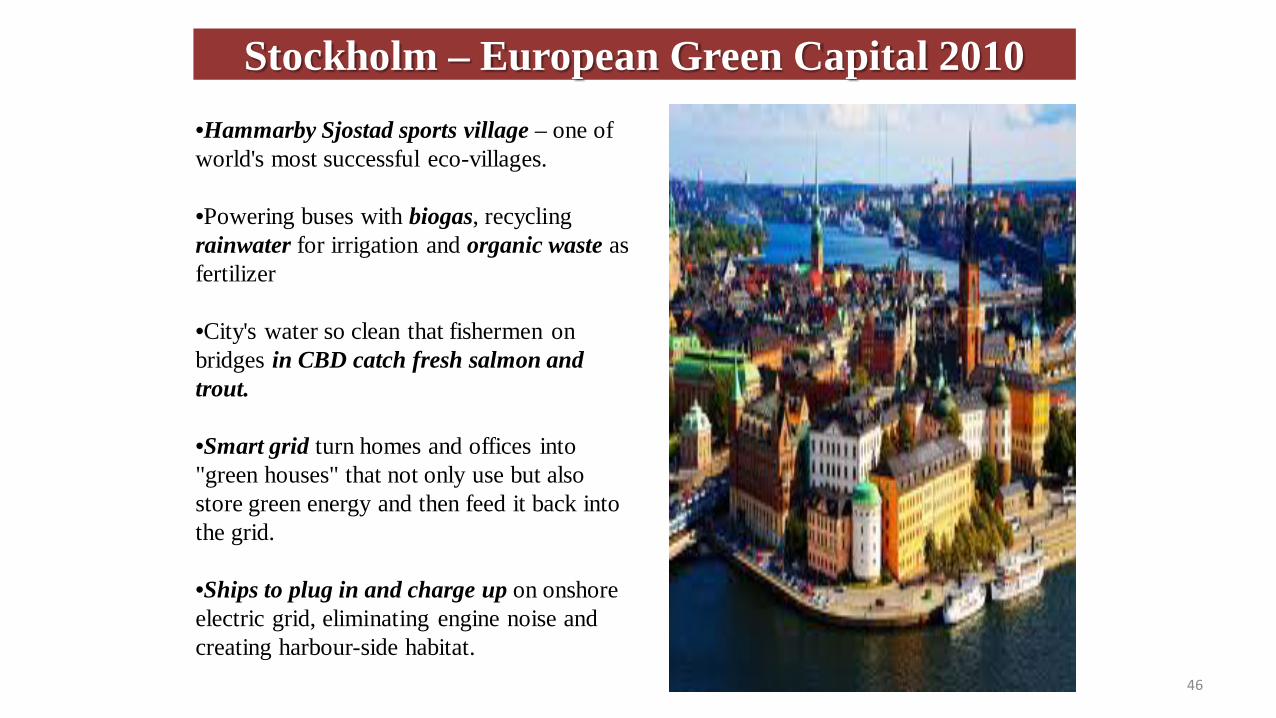
Stockholm – European Green Capital 2010•Hammarby Sjostad sports village – one of world's most successful eco-villages.
•Powering buses with biogas, recycling rainwater for irrigation and organic waste as fertilizer
•City's water so clean that fishermen on bridges in CBD catch fresh salmon and trout.
•Smart grid turn homes and offices into "green houses" that not only use but also store green energy and then feed it back into the grid.
•Ships to plug in and charge up on onshore electric grid, eliminating engine noise and creating harbour-side habitat.
46
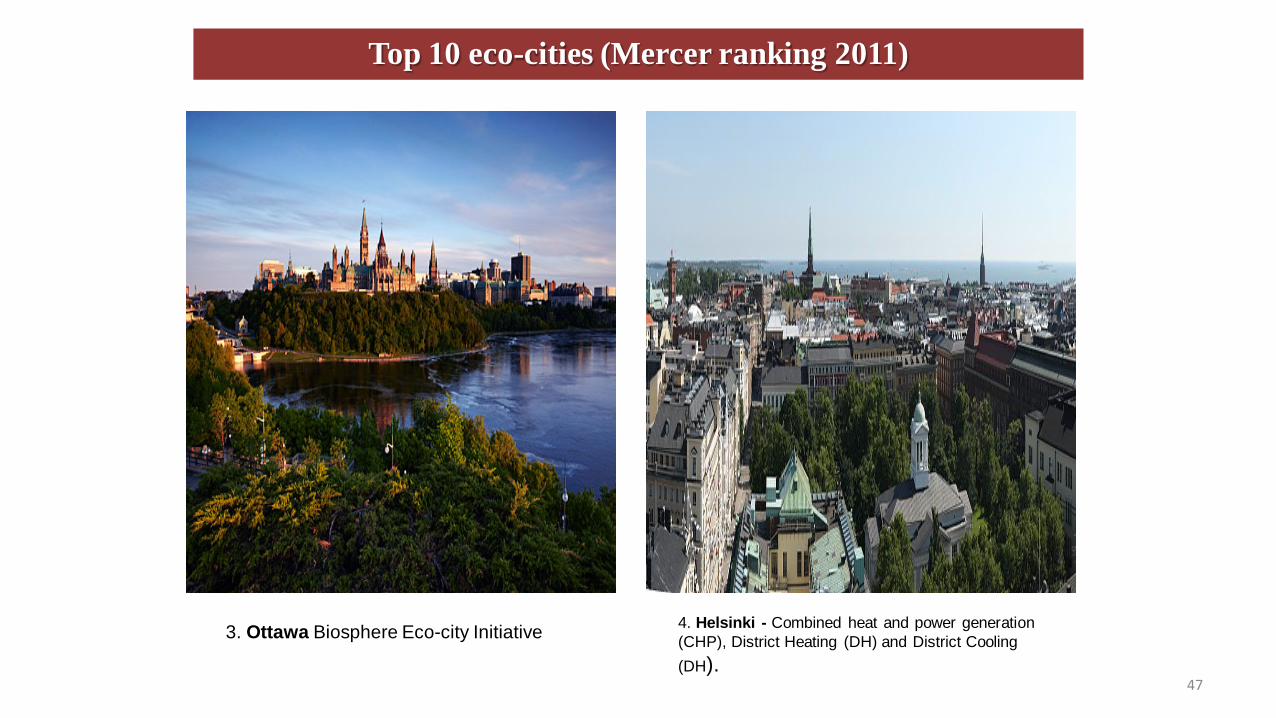
3. Ottawa Biosphere Eco-city Initiative 4. Helsinki - Combined heat and power generation (CHP), District Heating (DH) and District Cooling (DH).
Top 10 eco-cities (Mercer ranking 2011)
47

Top 10 eco-cities (Mercer ranking 2011)
5. Wellington - New Zealand’s Capital of lush hills and blue seascape. 33% citizens commute by bus
6. Minneapolis -16 lakes, 180 parks and 200 plus miles of green space; 120 miles of bike roads and highest @ bike-parking space
48

Top 10 eco-cities (Mercer ranking 2011)
7. Adelaide - highest proportion of grid-connected solar systems and rainwater tanks installed in households
8. Copenhagen - To become carbon neutral by 2025
49
Top 10 eco-cities (Mercer ranking 2011)
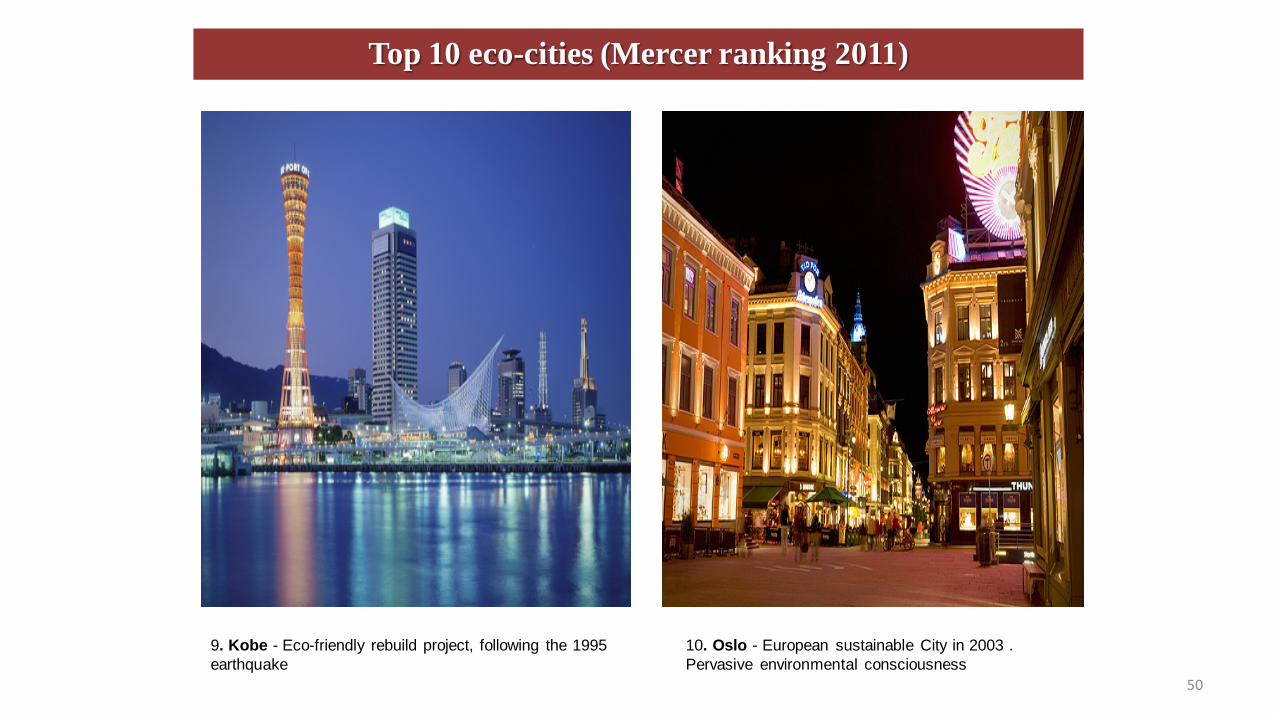
9. Kobe - Eco-friendly rebuild project, following the 1995 earthquake
10. Oslo - European sustainable City in 2003 . Pervasive environmental consciousness
50

Singapore – City in a Garden •$55,000 for a "certificate of entitlement.“ making cars very expensive.
•Singapore-MIT Alliance for Research and Technology (SMART) to study how cities can work better, Funded by Singapore's National Research Foundation, ~ 600 researchers.
•Clustering — attracting an entire industry segment so it builds on itself — money and media as two of its priorities.
•Becoming the Switzerland of Asia, offering Swiss-like confidentiality. Near airport sits FreePort, where the wealthy can store, buy and sell artworks and other precious items tax-free, no questions asked.
•Mediapolis, a "media ecosystem," e.g. digital production and broadcast facilities and soundstages for content creators, building on an existing animation-industry cluster. Nearby are Fusionopolisand Biopolis, which are hubs for engineering and biomedical clusters. Attracted companies like Procter & Gamble, building a $250 million innovation centre
•"Smart apps," for commuters, water conservation — innovative Singapore-based companies doing business in China and the Middle East — Singapore’s expertise in urban mobility, exporting the apps to traffic-crippled cities like Bangkok, Mumbai and New York.
•The city that banned chewing gum has become more liberal in its approach to art and culture and is building two multibillion-dollar gambling resorts. Just don't expect Las Vegas — style decadence.
51

China’s eco-city drive • In 2000, State Council issued directives to promote
"eco-provinces, eco-cities, eco-counties and eco-townships.” In 2002 ,The Cleaner Production Promotion Law and the Environment Impact Assessment Law were passed. In 2008, an amendment to China’s Energy Conservation Law held local government officials accountable for managing environmental standards.
• The Economist dated 22 February, 2012 - as of 2009, China had 40 eco-cities in development, including "4 smart-grid pilot cities, 21 LED-street-light cities, and 13 electric-vehicle cities".
• Near Shanghai, Dongtan eco-city designed by Arup was proclaimed as China's first, originally thought to be ready for the Beijing Olympics. It has since stalled. Another, the planned Sino-Singapore Tianjin Eco-City in collaboration with the World Bank, appears more promising. After some delay, now expected to be completed by 2020.
52

Shenzhen – UNESCO City of Design 2009
• China’s First Pioneer in Opening Up • Largest migrant city with youngest population• Proximity and links to Hong Kong• Culture-based strategy – (e.g. 8.2 piano @100 families,
highest in China; cartoon animation, design industries etc)• Birthplace of China’s modern design and
entrepreneurship • 6,000 design firms with 100,000 designers including
graphics, industrial, interior, architecture etc in 20 design clusters over 2,000 sq km
• A hub for high-tech industries – Patent filings tops China; virtual university campus to draw top national talent; half of high-tech output has own proprietary rights
• 9,000 software companies with 140,000 programmers; home to world-renowned Huawei, ZTE and Tencent
• World’s 4th busiest container port with a cluster of 16 ports served by a comprehensive network of rail and expressways
• Urban area 45% covered by greenery and 47% of total area by forests; won “Nations in Bloom” competition in Washington D.C.2000
53
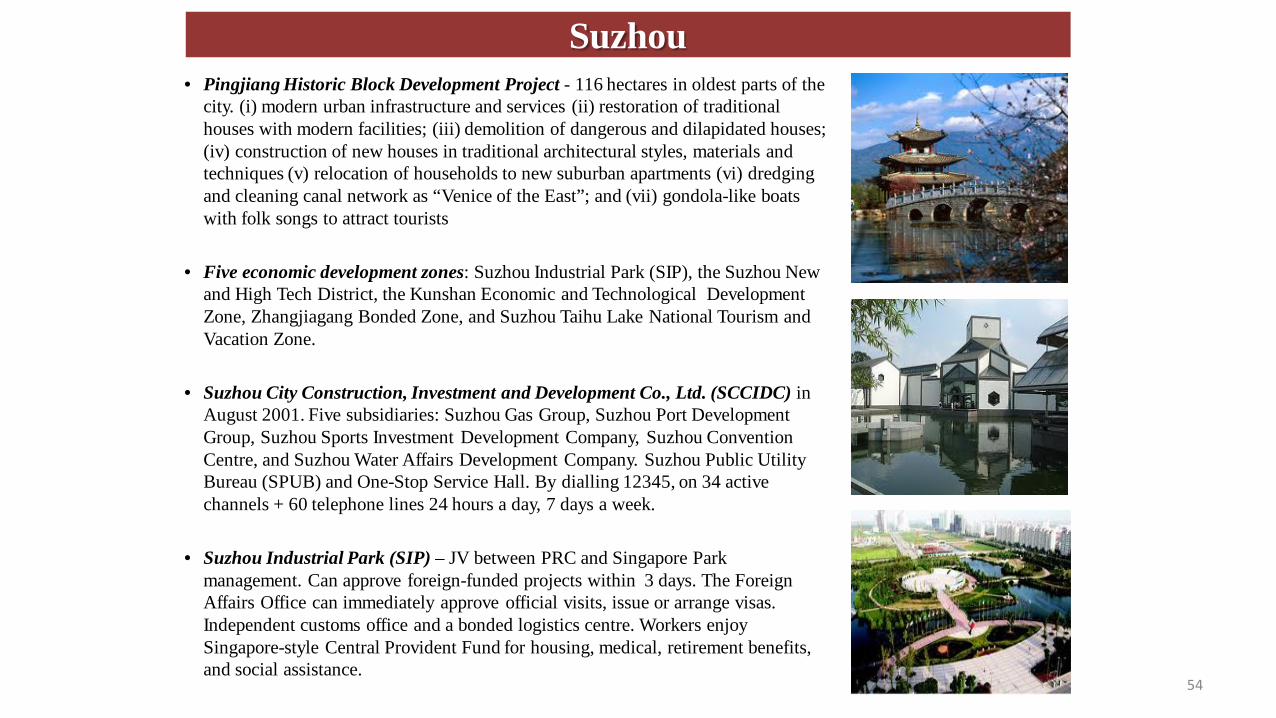
Suzhou• Pingjiang Historic Block Development Project - 116 hectares in oldest parts of the
city. (i) modern urban infrastructure and services (ii) restoration of traditional houses with modern facilities; (iii) demolition of dangerous and dilapidated houses; (iv) construction of new houses in traditional architectural styles, materials and techniques (v) relocation of households to new suburban apartments (vi) dredging and cleaning canal network as “Venice of the East”; and (vii) gondola-like boats with folk songs to attract tourists
• Five economic development zones: Suzhou Industrial Park (SIP), the Suzhou New and High Tech District, the Kunshan Economic and Technological Development Zone, Zhangjiagang Bonded Zone, and Suzhou Taihu Lake National Tourism and Vacation Zone.
• Suzhou City Construction, Investment and Development Co., Ltd. (SCCIDC) in August 2001. Five subsidiaries: Suzhou Gas Group, Suzhou Port Development Group, Suzhou Sports Investment Development Company, Suzhou Convention Centre, and Suzhou Water Affairs Development Company. Suzhou Public Utility Bureau (SPUB) and One-Stop Service Hall. By dialling 12345, on 34 active channels + 60 telephone lines 24 hours a day, 7 days a week.
• Suzhou Industrial Park (SIP) – JV between PRC and Singapore Park management. Can approve foreign-funded projects within 3 days. The Foreign Affairs Office can immediately approve official visits, issue or arrange visas. Independent customs office and a bonded logistics centre. Workers enjoy Singapore-style Central Provident Fund for housing, medical, retirement benefits, and social assistance.
54

Tianjin Eco-City• Tianjin Eco-City, 150 kilometres (95 miles) east of
Beijing, begun in 2008, to be completed by 2020• Mix of well-insulated housing, 60% household waste
recycled, solar-powered water heaters , renewable energy sources from wind, solar and geothermal power, with hybrid vehicles.
• Designed by Surbana Urban Planning Group, the city is being built just 10 minutes away by high-speed light rail from Tianjin Economic-Development Area.
• 350,000 residents expected to choose different landscapes from sun-powered “solarscape” to greenery-clad “earthscape”.
• "Three Harmonies" - social harmony; economic vibrancy; environmental sustainability
• "Three Abilities” - affordable and commercially viable technologies ; replicable models for other cities in China and even for other countries; scalable principles and models
55

How Chengdu copes with rural-urban migration
• Encouraging families to stay in the countryside by improving conditions –schools, shops, garbage collection, the sewerage system. People in the city considering moving to the country.
• Only super-large central city that has narrowed the urban-rural income gap. .
• Modified the hukou system, extending into the surrounding countryside. Farmers and urban workers alike enjoy contributory pension insurance after 15 years.
• Hundreds of new schools built in surrounding villages; successful head-teachers from city schools recruited to move into the countryside, partnerships between struggling rural schools and the best urban schools
56

A city’s Ethos, Spirit, or Life and Soul
• The Spirit of Cities, Princeton University Press, 2011, Daniel Bell and Avner de-Shalit -distinctive ethos or value in political, cultural, and economic life - ancient Athens stood for democracy - Spartan for military discipline.
• Modern cities exude own ethos e.g. Jerusalem (religion), Montreal (language), Singapore (nation building), Hong Kong (materialism), Beijing (political power), Oxford (learning), Berlin (tolerance and intolerance), Paris (romance), New York (ambition).
• Varied histories of each city, as well as novels, poems, biographies, tourist guides, architectural landmarks, and authors' own personal reflections and insights show how pride in a city's ethos can oppose the homogenizing tendencies of globalization and curb the excesses of nationalism.
57
New oil dynamics (IEA, Supply shock from North American oil rippling through global markets, 14. May, 2013)• Shale contributes to 30% of US oil and 40% gas production • US shale oil + Canadian tar sands to increase global capacity to 8.5 mb/d by 2018
> demand growth of 6.9 mb/d• US oil production (e.g. N Dakota) > Saudi Arabia by 2017, to become net oil exporter by 2030• North America to increase oil production by 3.9 mb/d 2012-18 (=2/3 of non-OECD growth) • World oil refining capacity to surge by 9.5 mb/d, led by China and ME• South China Sea alone has reserve of 200 billion barrels• PWC – oil prices set to drop 40% • Production cost threshold = $70@barrel at present (Harvard Kennedy School) AND –• Serious depletion of light-sweet crude (with little sulphur) and tight refining capacity for
processing heavy sour grades into heavy crude such as diesel and fuel. • Mature OPEC fields now declining at 5 to 6 % p.a. Non-OPEC fields declining 8 to 9 % p.a.• Each marginal barrel more expensive to extract• Growth in U.S. tight oil from fracking (1 m barrels @day) < declines elsewhere outside of OPEC.• Society of Petroleum Engineers (SPE) - more wells to be drilled in next decade > last 100 years.• For example, 10.5 billion barrels of oil estimated beneath coastal tundra of NE Alaska (Arctic
National Wildlife Refuge (ANWR)) but U.S. uses 7.3 b barrels of oil a year (= < 1 ½ yr supply).• Since 2007, US has cut foreign crude import by 40% , or 5 mb/d. Preparing to export natural gas.
China now imports 57% of oil, up from 48% 5 years ago. 22% natural gas imported 10x > 2007. 58
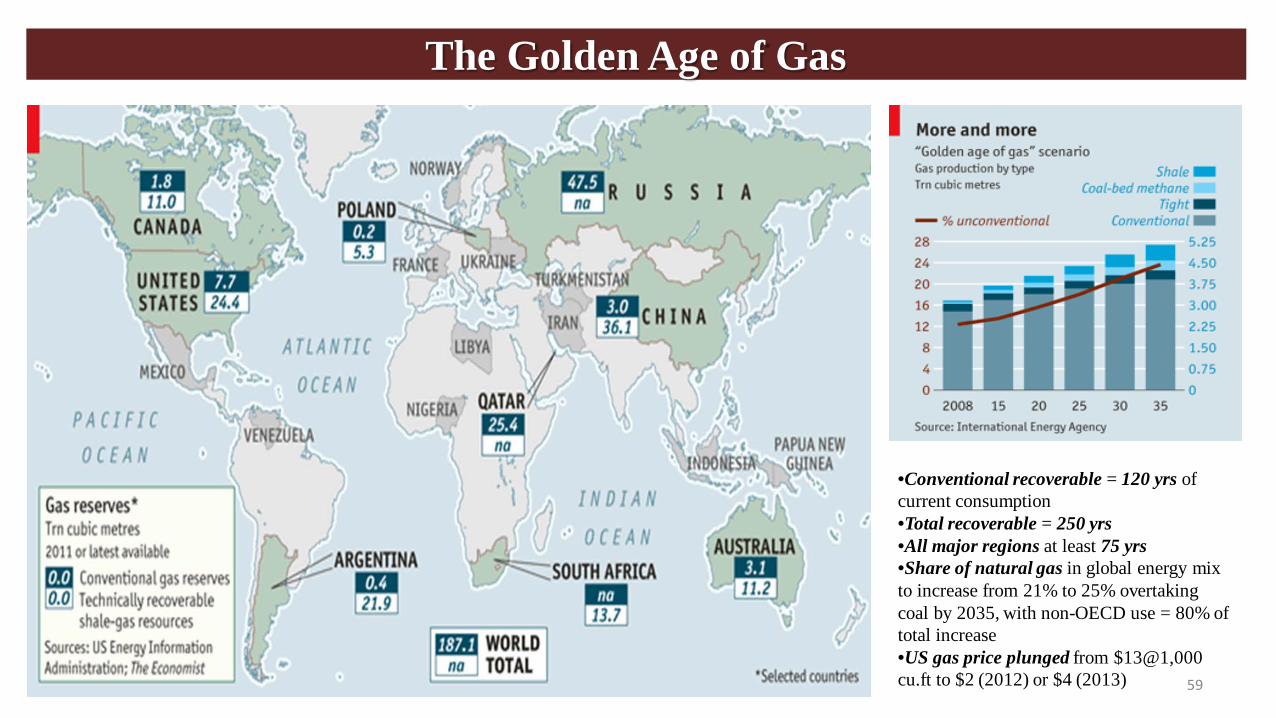
The Golden Age of Gas
•Conventional recoverable = 120 yrs of current consumption•Total recoverable = 250 yrs•All major regions at least 75 yrs•Share of natural gas in global energy mix to increase from 21% to 25% overtaking coal by 2035, with non-OECD use = 80% of total increase•US gas price plunged from $13@1,000 cu.ft to $2 (2012) or $4 (2013) 59

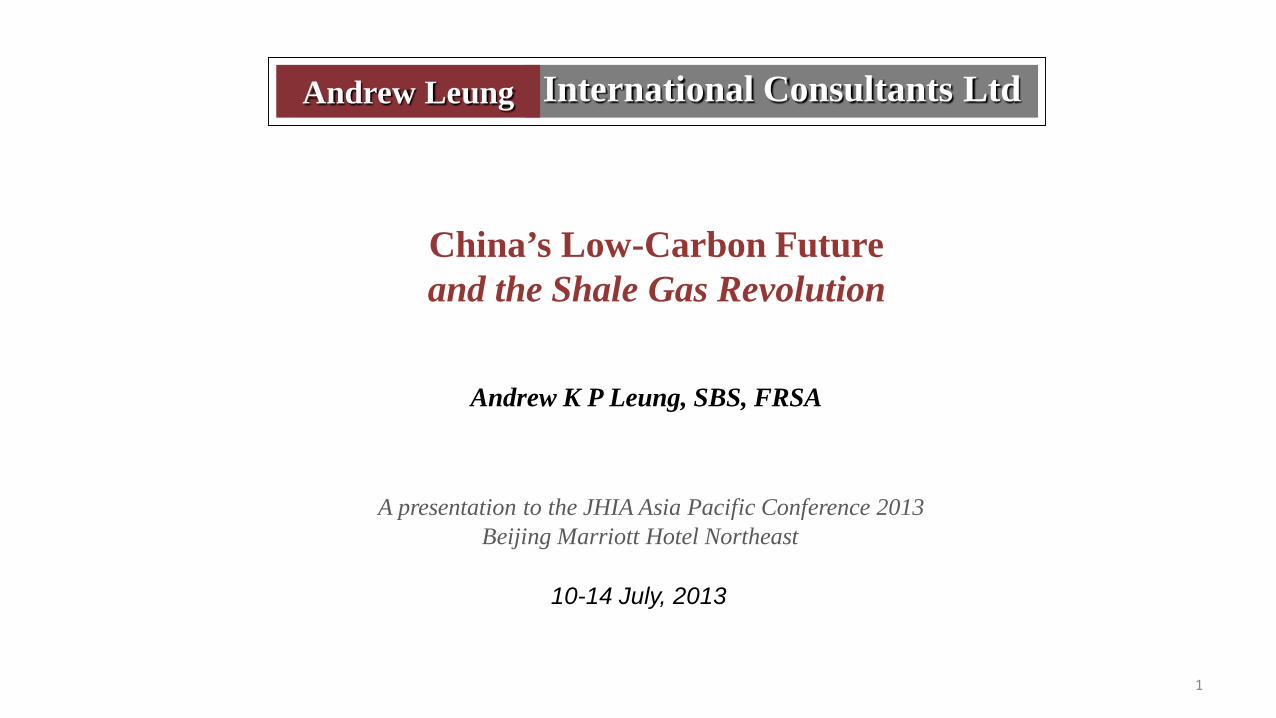
Fracking technology
60
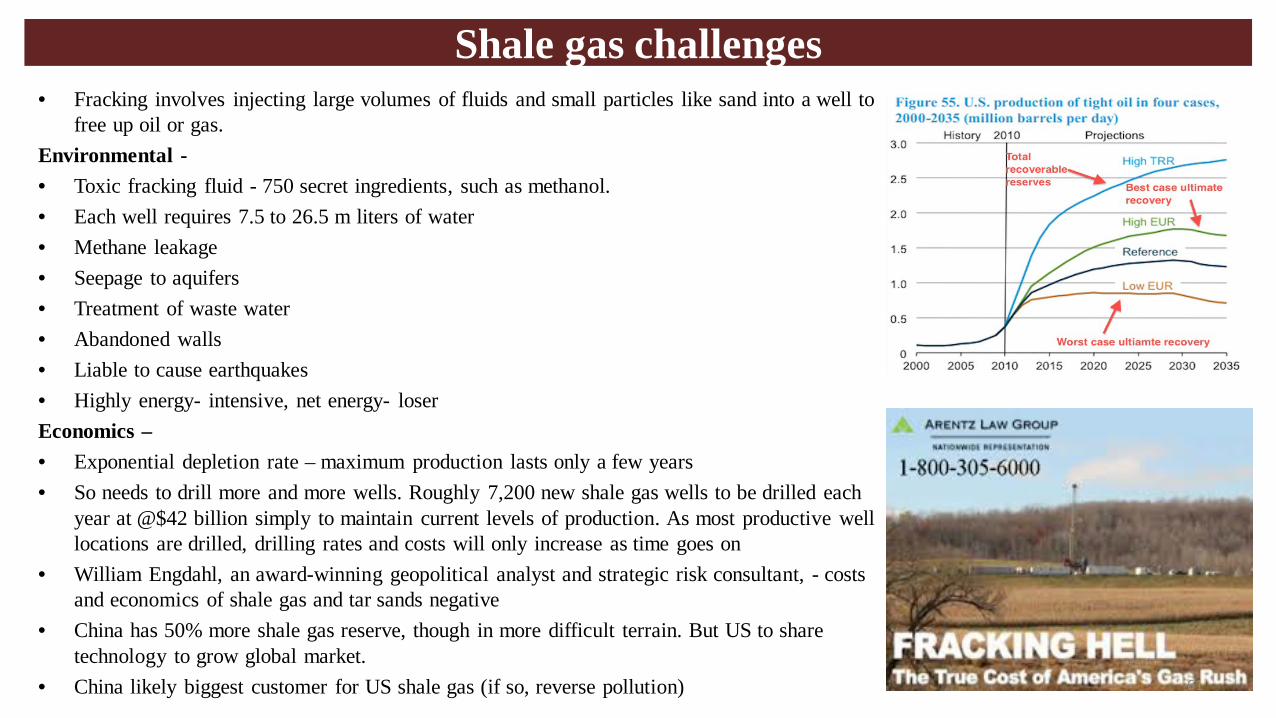
Shale gas challenges • Fracking involves injecting large volumes of fluids and small particles like sand into a well to
free up oil or gas. Environmental -• Toxic fracking fluid - 750 secret ingredients, such as methanol. • Each well requires 7.5 to 26.5 m liters of water• Methane leakage • Seepage to aquifers• Treatment of waste water• Abandoned walls• Liable to cause earthquakes• Highly energy- intensive, net energy- loserEconomics –• Exponential depletion rate – maximum production lasts only a few years• So needs to drill more and more wells. Roughly 7,200 new shale gas wells to be drilled each
year at @$42 billion simply to maintain current levels of production. As most productive well locations are drilled, drilling rates and costs will only increase as time goes on
• William Engdahl, an award-winning geopolitical analyst and strategic risk consultant, - costs and economics of shale gas and tar sands negative
• China has 50% more shale gas reserve, though in more difficult terrain. But US to share technology to grow global market.
• China likely biggest customer for US shale gas (if so, reverse pollution) 61

IPCC Special Report on renewable energies, May 2011
• Intergovernmental Panel on Climate Change (IPCC) Special Report on Renewable Energy Sources and Climate Change Mitigation (SRREN) approved by194 nations, Abu Dhabi on 9 May, 2011
• Global technical potential for RE substantially higher than global energy demand potential.
• ~ 80% of world’s energy demand could be met by RE by mid-century, subject to enabling government policies.
• Highlighted 6 RE technologies for the coming decades: Bio-energy, Direct solar energy, Geo-thermo energy, Hydro power, Ocean energy, Wind energy
• Solar energy is the highest, but substantial technical potential exists for all six RE sources
62
Report highlights• Cost of most RE technologies declining and technical advances would further lower costs• RE already economically competitive in some settings but policy measures still required. • Broader economic ,environmental and social aspects, including peak demands• R&D, economies of scale, deployment-oriented learning, and increased market competition
among RE suppliers.• Integrating RE into most existing energy supply systems and end-use sectors at an accelerated
rate technologically feasible, barring costs• Complementary technologies reduce integration. risks + costs • Thermal storage capability and flexible cogeneration overcome supply/demand variability.• District heating - solar, geothermal heat, or biomass. District cooling - cold natural waterways. • Agriculture + food + fibre process industries use biomass on-site.• Long-term integration - investment in infrastructure; institutional and governance frameworks;
social aspects, markets and planning; and capacity building in advance.• Bio-energy sustainability depends on land and biomass management• RE-specific policies include research, development, demonstration, level-playing field, feed-in-
tariffs, quotas, priority grid access, building mandates, bio-fuel blending requirements, and bio-energy sustainability criteria. Fiscal incentives include tax policies, rebates and grants; loans and guarantees. Wider policies such as carbon pricing mechanisms.
• Scenarios indicate that RE growth will be widespread globally.63
Integration into present and future energy systems
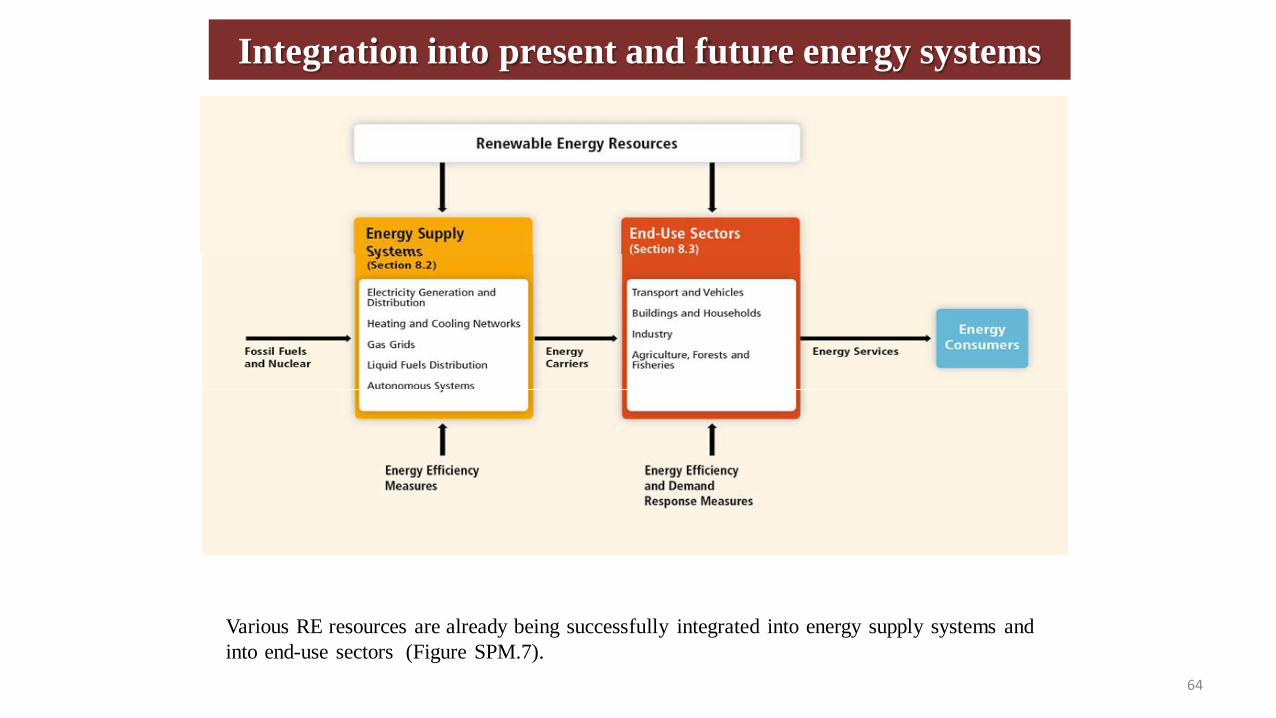
Various RE resources are already being successfully integrated into energy supply systems and into end-use sectors (Figure SPM.7).
64
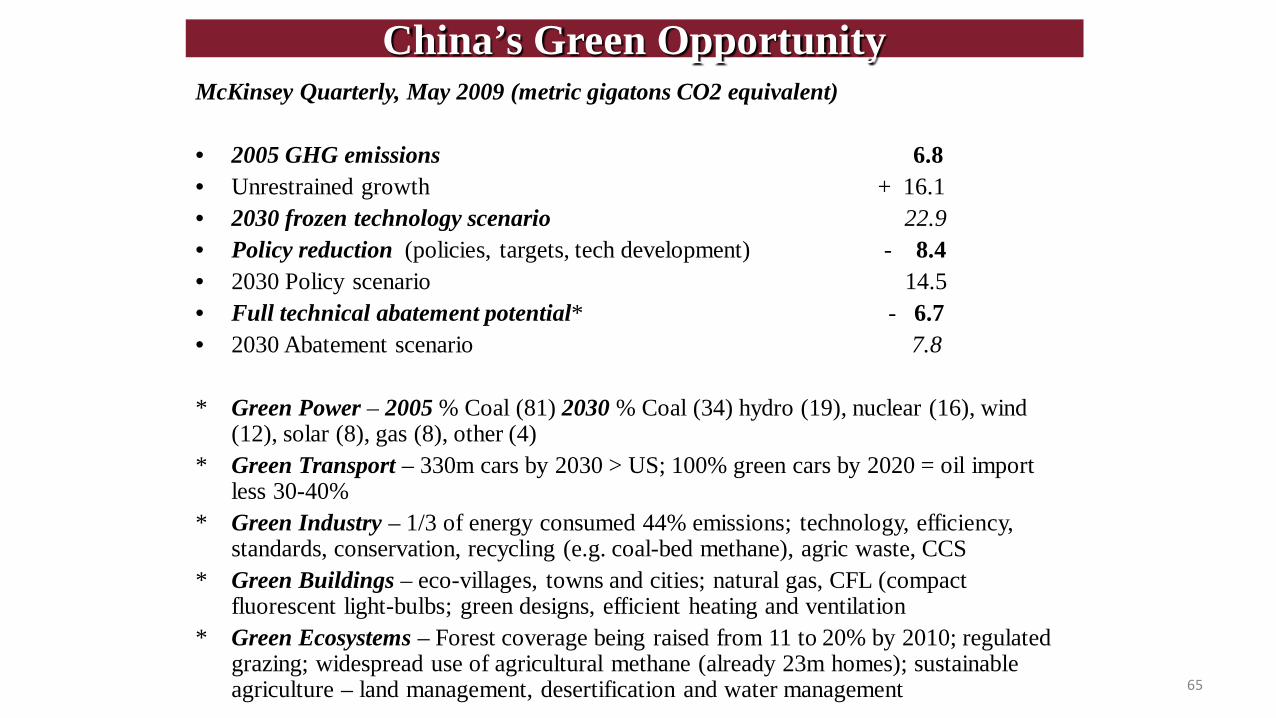
China’s Green Opportunity McKinsey Quarterly, May 2009 (metric gigatons CO2 equivalent)
• 2005 GHG emissions 6.8• Unrestrained growth + 16.1• 2030 frozen technology scenario 22.9• Policy reduction (policies, targets, tech development) - 8.4• 2030 Policy scenario 14.5• Full technical abatement potential* - 6.7• 2030 Abatement scenario 7.8
* Green Power – 2005 % Coal (81) 2030 % Coal (34) hydro (19), nuclear (16), wind (12), solar (8), gas (8), other (4)
* Green Transport – 330m cars by 2030 > US; 100% green cars by 2020 = oil import less 30-40%
* Green Industry – 1/3 of energy consumed 44% emissions; technology, efficiency, standards, conservation, recycling (e.g. coal-bed methane), agric waste, CCS
* Green Buildings – eco-villages, towns and cities; natural gas, CFL (compact fluorescent light-bulbs; green designs, efficient heating and ventilation
* Green Ecosystems – Forest coverage being raised from 11 to 20% by 2010; regulated grazing; widespread use of agricultural methane (already 23m homes); sustainable agriculture – land management, desertification and water management 65
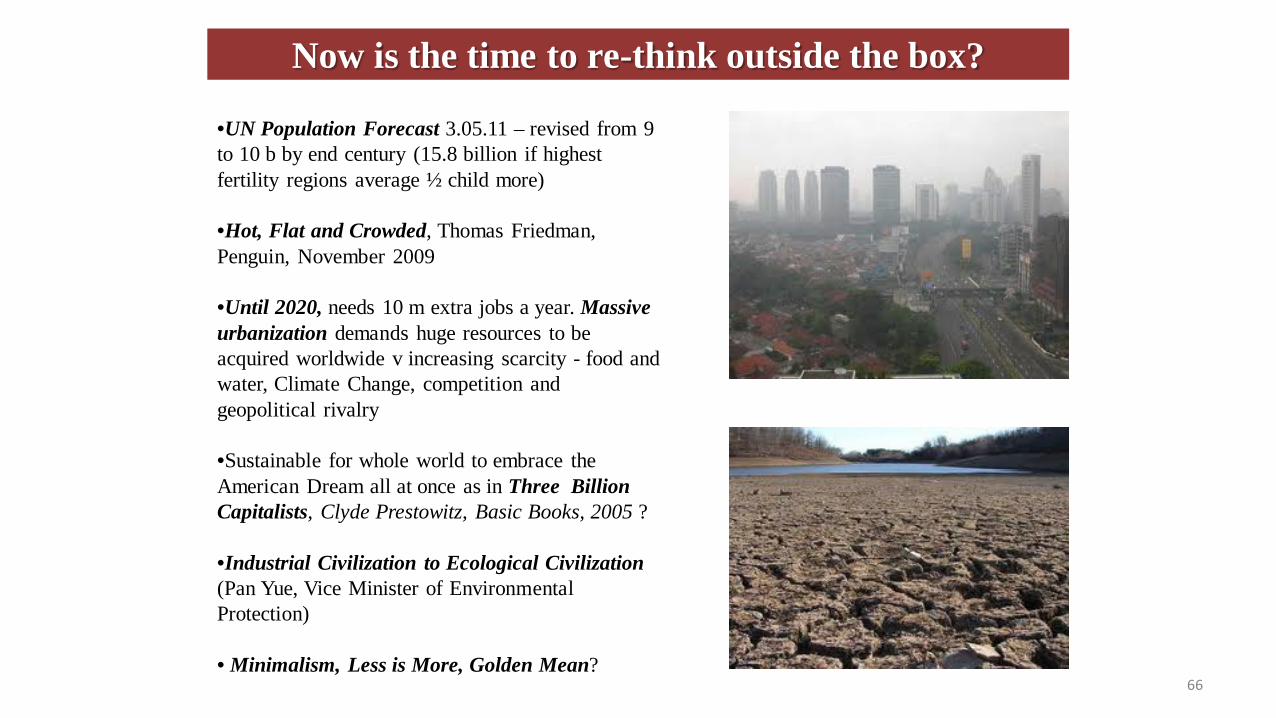
Now is the time to re-think outside the box?
•UN Population Forecast 3.05.11 – revised from 9 to 10 b by end century (15.8 billion if highest fertility regions average ½ child more)
•Hot, Flat and Crowded, Thomas Friedman, Penguin, November 2009
•Until 2020, needs 10 m extra jobs a year. Massive urbanization demands huge resources to be acquired worldwide v increasing scarcity - food and water, Climate Change, competition and geopolitical rivalry
•Sustainable for whole world to embrace the American Dream all at once as in Three Billion Capitalists, Clyde Prestowitz, Basic Books, 2005 ?
•Industrial Civilization to Ecological Civilization (Pan Yue, Vice Minister of Environmental Protection)
• Minimalism, Less is More, Golden Mean? 66

Ecological Civilization & Minimalism• GMO’s Jeremy Graham - ‘a disaster of biblical proportions’
• No way for both China and India to replicate the American Dream @energy and resource
• Revenge of Gaia, James Lovelock, Allen Lane, 2006
• Should Adam Smith’s Invisible Hand be guided by his long-forgotten Theory of Moral Sentiments?
• Pan Yue, Vice Minister of Environmental Protection – from “Industrial Civilization’’ to “Ecological Civilízation’’
• Should Confucianism ‘s Balance , 持衡保泰, The Golden Mean 中庸之道 , and Harmony between Man and Nature 天人合一 replace a zero-sum game?
• Minimalist chic not only in design and décor but as an innovative and green everyday lifestyle. Tang Dynasty poem ‘Ode to Humble Abode’ 陋室铭
• Should development pay more attention to ‘Gross National Happiness Index’ (as in Bhutan) than sheer GDP growth?
67

Vital questions for the 21st century• Not just preferred lifestyles and philosophical
debate, but a matter of national and global survival - Jared Diamond, Collapse: How Societies Choose to Fail or Survive, Penguin, Jan 2006.
• Can our planet and ecosystem sustain continuing mindless exploitation of her finite resources?
• Will this be the epoch of revolutionary change when the internal combustion engine is finally moving to the museums as the whole world embraces high-speed trains linking eco-cities and electric cars fuelled by green power grids?
• Should the world seek Minimalism over surfeit -conservation, moderation and frugality over waste, excess and vanity?
• Do we need another war or a civilization collapse in this century to remind us that there may be another way of life for all to share in this global village?
• When will we finally grasp that on the same planet, all our fates are linked and our survival lies in a new awakening and a new direction to embrace an innovative low-carbon future?
68

Andrew Leung International Consultants Ltd
Thank you
Andrew K P Leung, SBS, FRSA
www.andrewleunginternationalconsultants.com
69