Embed Size (px)
Citation preview
© Copyr i gh t 2013 O SIs o f t , LLC .
The Shale Revolution
Supporting Energy
Independence with
New Innovations in the
PI System
Craig Harclerode
Global Industry Principal,
O&G/Petrochem
© Copyr i gh t 2013 O SIs o f t , LLC . 2
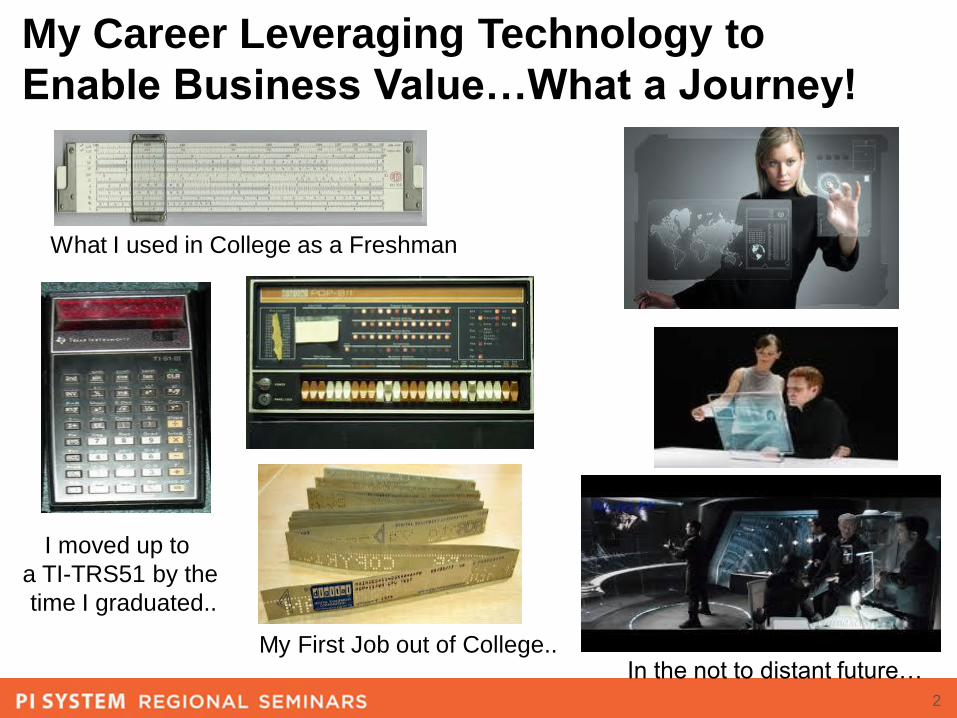
My Career Leveraging Technology to
Enable Business Value…What a Journey!
What I used in College as a Freshman
My First Job out of College..
I moved up to
a TI-TRS51 by the
time I graduated..
In the not to distant future…
© Copyr i gh t 2013 O SIs o f t , LLC . 3
Outline
• The PI System and “Energy Independence”
• Challenges and….. Opportunities
– The Shale Revolution
– Technological Trends
– Industry Challenges
• Innovative PI System Applications - “The Art of the Possible”
• Closing Comments
© Copyr i gh t 2013 O SIs o f t , LLC . 4
Outline
• The PI System and “Energy Independence”
• Challenges and….. Opportunities
– The Shale Revolution
– Technological Trends
– Industry Challenges
• Innovative PI System Applications - “The Art of the Possible”
• Closing Comments
© Copyr i gh t 2013 O SIs o f t , LLC . 5
The Foundation of “Energy Independence”
is Real-Time Data & Information….in Context
1. Efficiency, effectiveness, transparency, context
2. Balanced “All the above” approach
3. Holistic View
4. Continuous Improvement
5. Ability to Empower, React, and Make Timely and
Informed Decisions – the “Power of Data”
© Copyr i gh t 2013 O SIs o f t , LLC . 6
Outline
• The PI System and “Energy Independence”
• Challenges and….. Opportunities
– The Shale Revolution
– Technological Trends
– Industry Challenges
• Innovative PI System Applications - “The Art of the Possible”
• Closing Comments
© Copyr i gh t 2013 O SIs o f t , LLC . 7
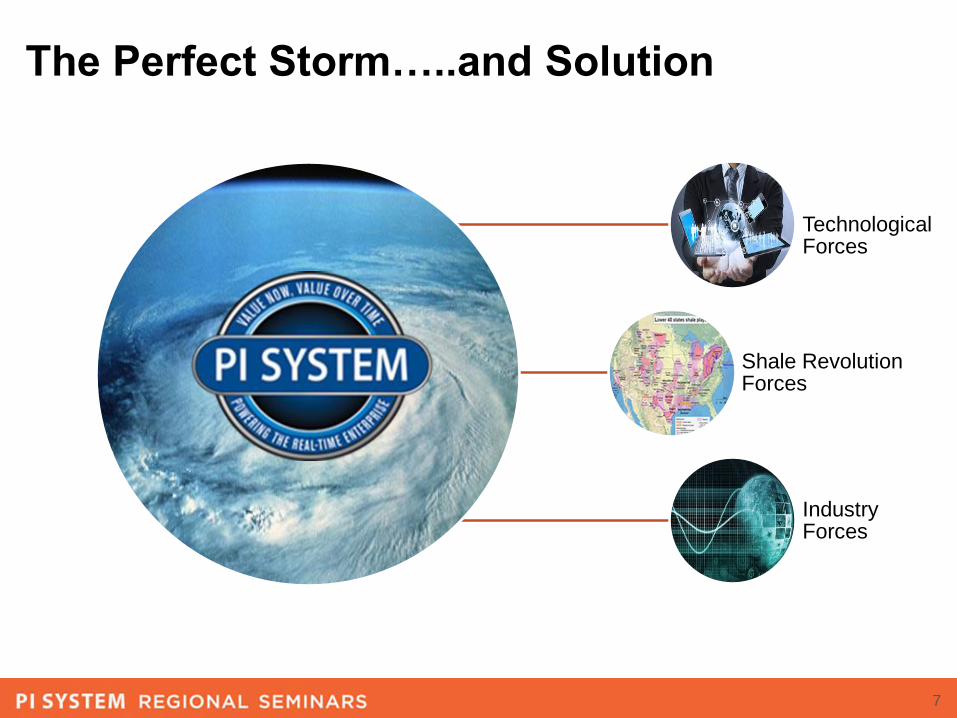
The Perfect Storm…..and Solution
Technological Forces
Shale Revolution Forces
Industry Forces
© Copyr i gh t 2013 O SIs o f t , LLC .
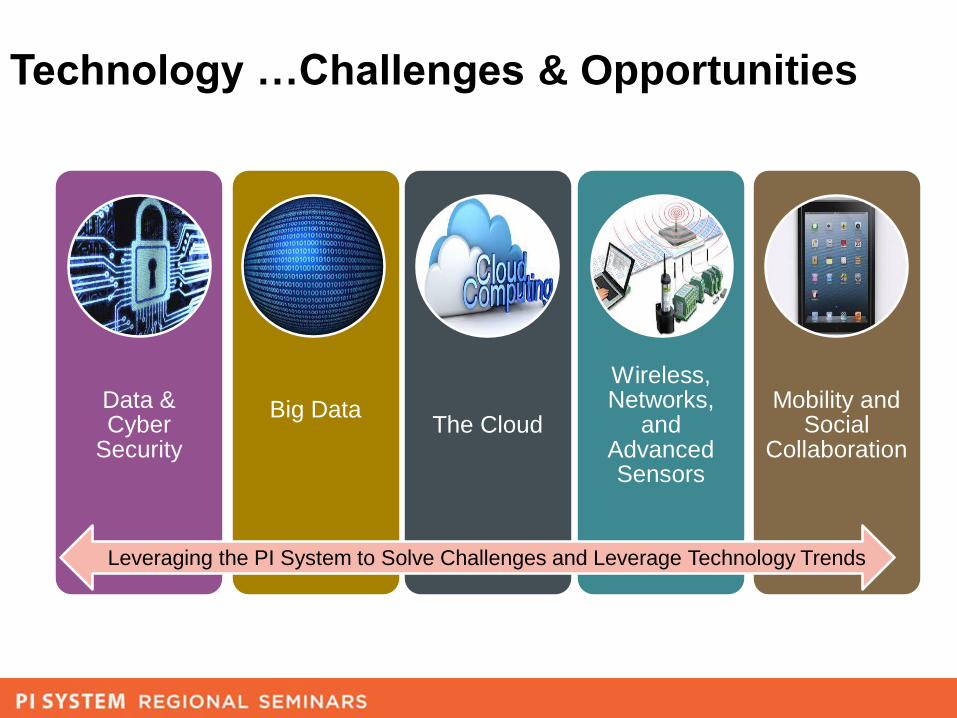
Technology …Challenges & Opportunities
Data & Cyber
Security
Big DataThe Cloud
Wireless, Networks,
and Advanced Sensors
Mobility and Social
Collaboration
Leveraging the PI System to Solve Challenges and Leverage Technology Trends
© Copyr i gh t 2013 O SIs o f t , LLC . 9
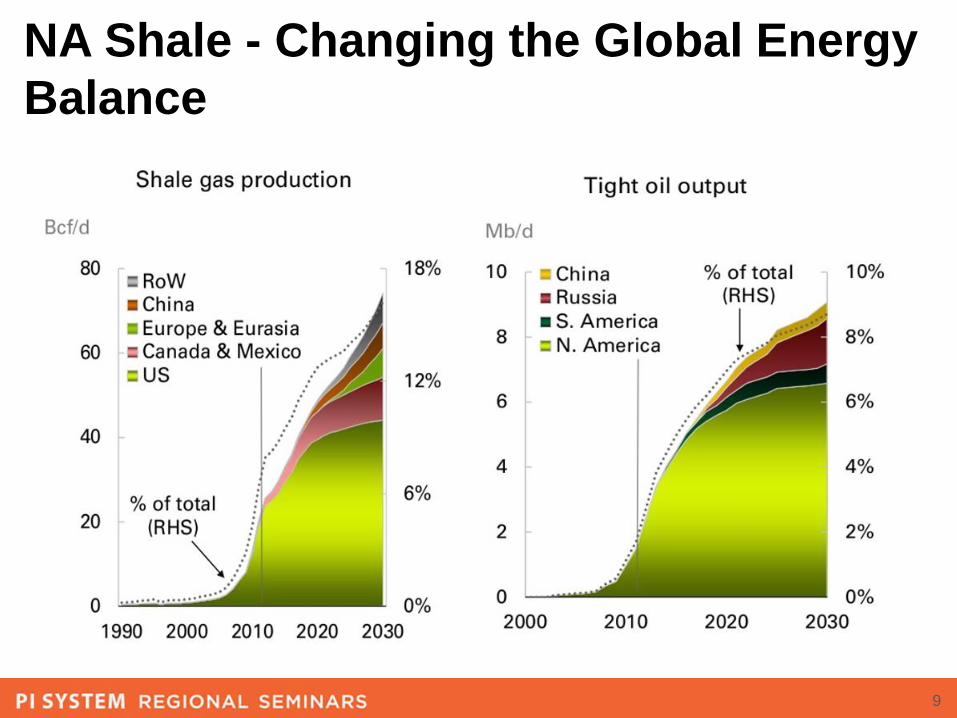
NA Shale - Changing the Global Energy
Balance
© Copyr i gh t 2013 O SIs o f t , LLC . 10
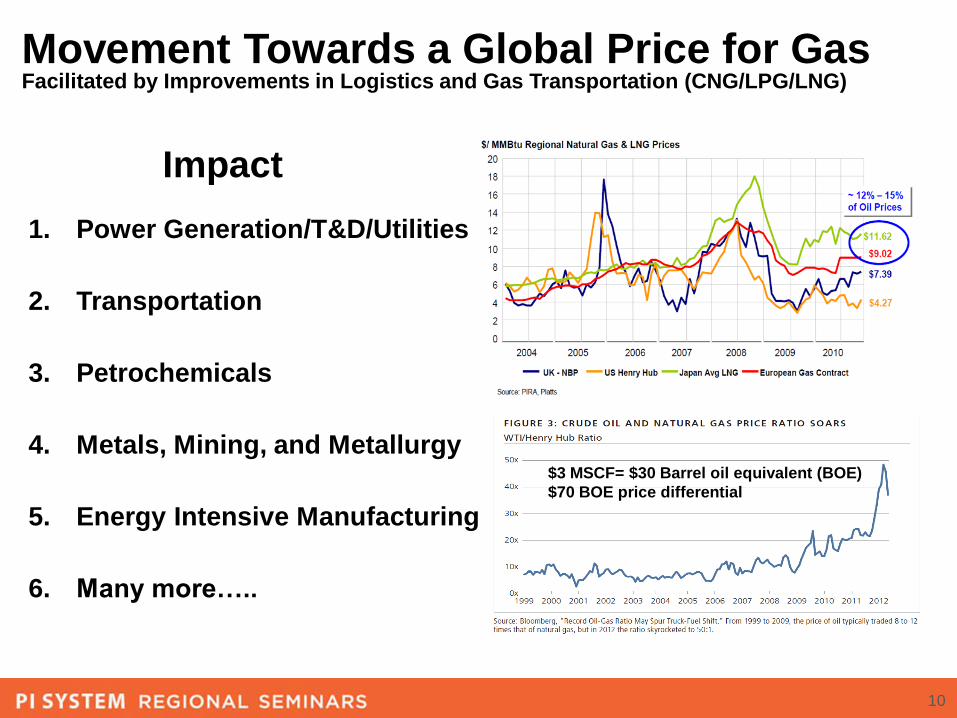
Movement Towards a Global Price for GasFacilitated by Improvements in Logistics and Gas Transportation (CNG/LPG/LNG)
1. Power Generation/T&D/Utilities
2. Transportation
3. Petrochemicals
4. Metals, Mining, and Metallurgy
5. Energy Intensive Manufacturing
6. Many more…..
$3 MSCF= $30 Barrel oil equivalent (BOE)
$70 BOE price differential
Impact
© Copyr i gh t 2013 O SIs o f t , LLC . 11
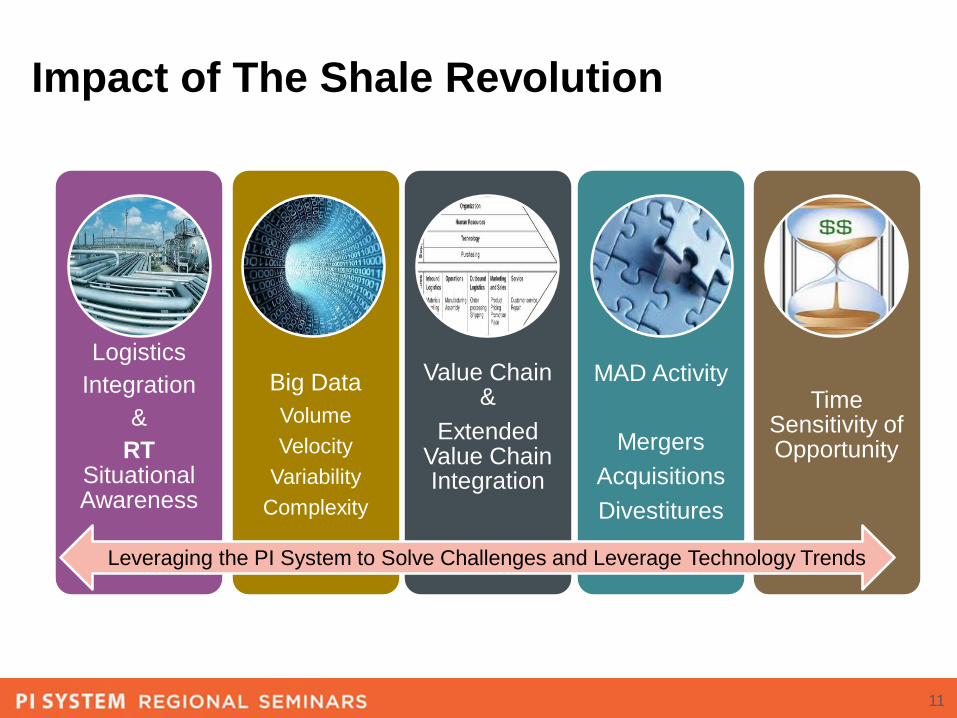
Impact of The Shale Revolution
Logistics
Integration
&
RTSituational Awareness
Big Data
Volume
Velocity
Variability
Complexity
Value Chain &
Extended Value Chain Integration
MAD Activity
Mergers
Acquisitions
Divestitures
Time Sensitivity of Opportunity
Leveraging the PI System to Solve Challenges and Leverage Technology Trends
© Copyr i gh t 2013 O SIs o f t , LLC .
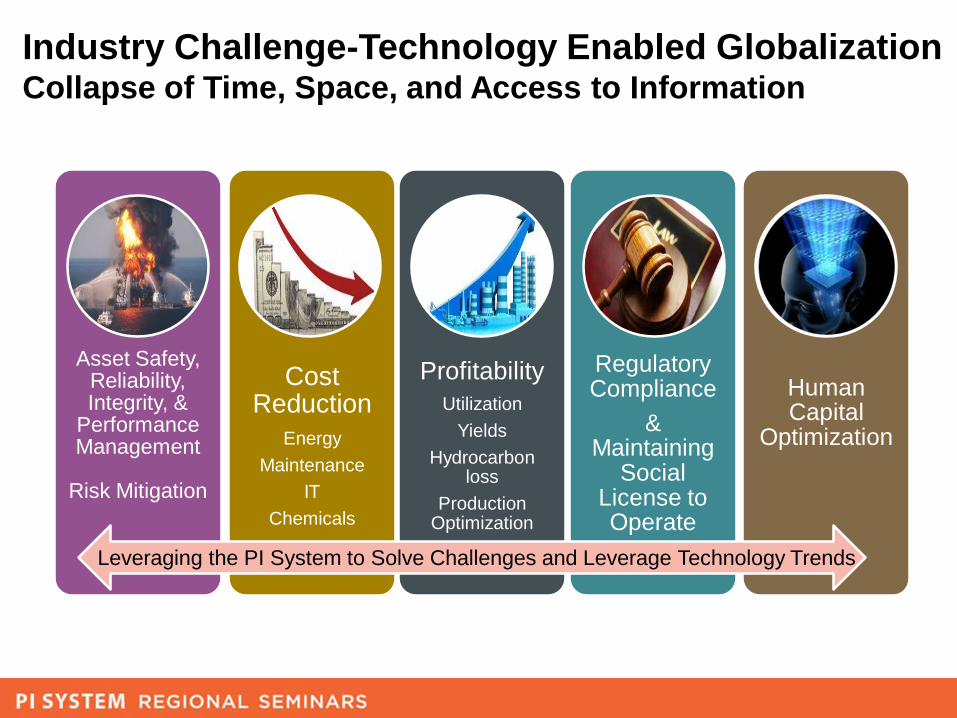
Industry Challenge-Technology Enabled GlobalizationCollapse of Time, Space, and Access to Information
Asset Safety, Reliability, Integrity, &
PerformanceManagement
Risk Mitigation
Cost Reduction
Energy
Maintenance
IT
Chemicals
Profitability
Utilization
Yields
Hydrocarbon loss
Production Optimization
Regulatory Compliance
& Maintaining
Social License to Operate
Human Capital
Optimization
Leveraging the PI System to Solve Challenges and Leverage Technology Trends

© Copyr i gh t 2013 O SIs o f t , LLC . 13
Outline
• The PI System and “Energy Independence”
• Challenges and….. Opportunities
– The Shale Revolution
– Technological Trends
– Industry Challenges
• Innovative PI System Applications - “The Art of the Possible”
• Closing Comments
© Copyr i gh t 2013 O SIs o f t , LLC .
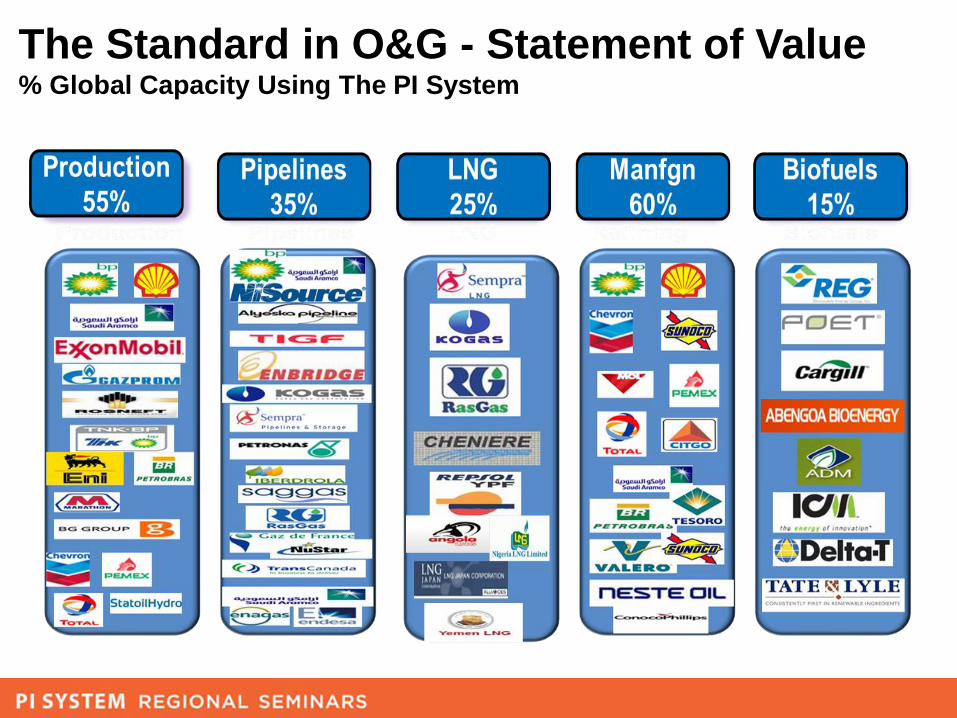
The Standard in O&G - Statement of Value % Global Capacity Using The PI System
© Copyr i gh t 2013 O SIs o f t , LLC .
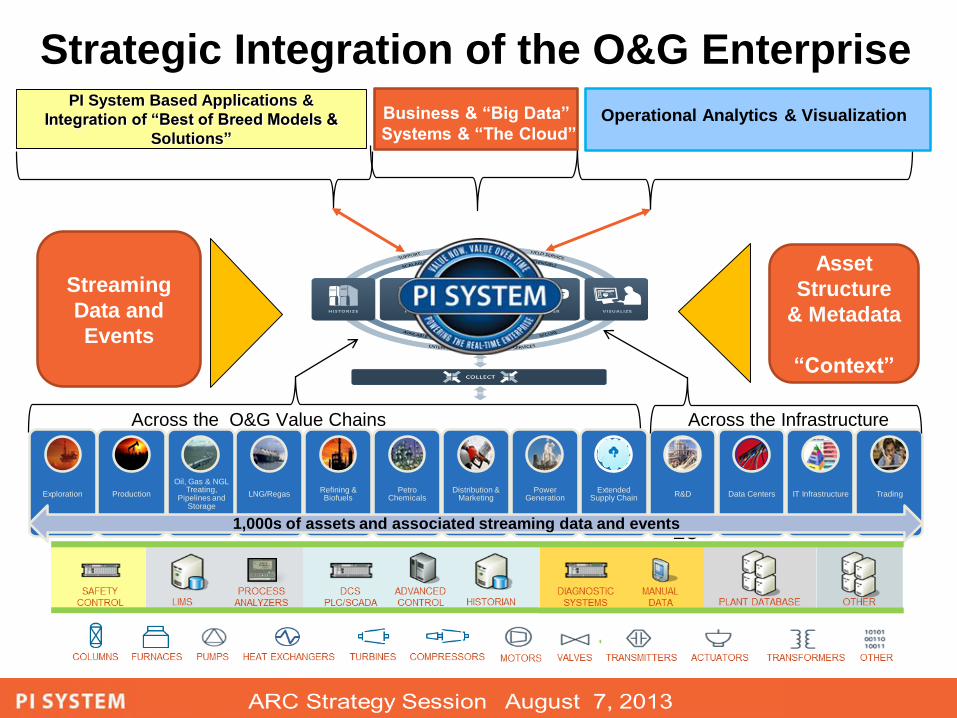
Strategic Integration of the O&G Enterprise
15
Across the O&G Value Chains Across the Infrastructure
1000’s of different real-time data sources
Streaming
Data and
Events
Asset
Structure
& Metadata
“Context”
Exploration Production
Oil, Gas & NGL Treating,
Pipelines and Storage
LNG/RegasRefining & Biofuels
Petro Chemicals
Distribution & Marketing
Power Generation
Extended Supply Chain
R&D Data Centers IT Infrastructure Trading
Business & “Big Data”
Systems & “The Cloud”
1,000s of assets and associated streaming data and events
PI System Based Applications &
Integration of “Best of Breed Models &
Solutions”
Operational Analytics & Visualization
© Copyr i gh t 2013 O SIs o f t , LLC . 16
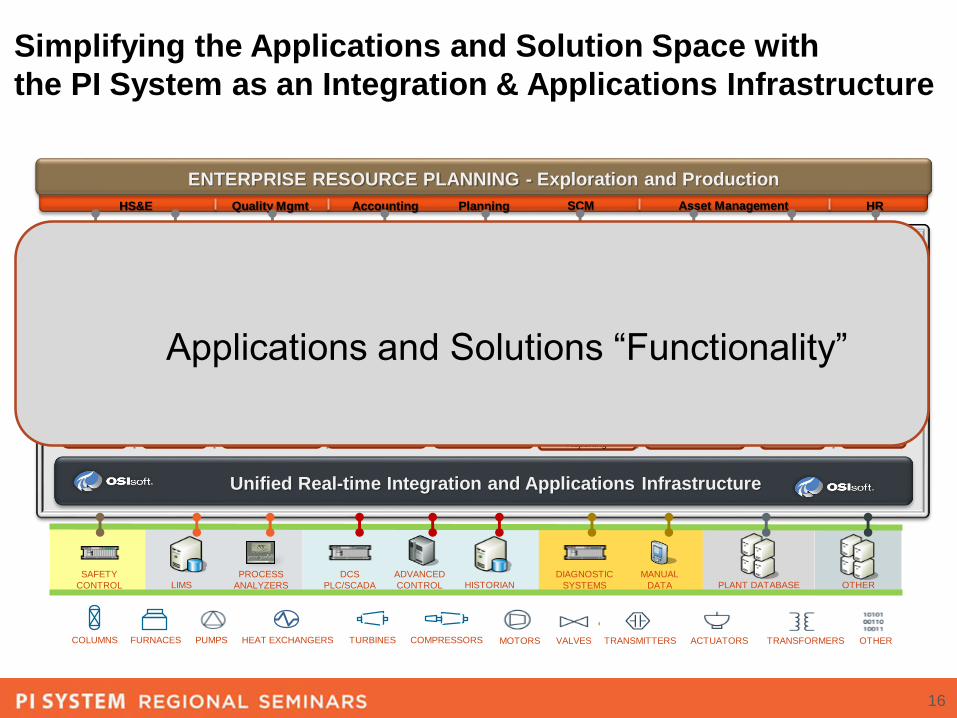
Simplifying the Applications and Solution Space with
the PI System as an Integration & Applications Infrastructure
Accounting HRAsset ManagementQuality Mgmt. SCMPlanningHS&E
ENTERPRISE RESOURCE PLANNING - Exploration and Production
PUMPS VALVES TRANSMITTERS ACTUATORS OTHERTRANSFORMERSMOTORSHEAT EXCHANGERSCOLUMNS FURNACES
D DTURBINES
DDCOMPRESSORS
LIMS
MANUAL
DATA
DCS
PLC/SCADA OTHER
ADVANCED
CONTROL PLANT DATABASEHISTORIAN
DIAGNOSTIC
SYSTEMS
PROCESS
ANALYZERS
SAFETY
CONTROL
Unified Real-time Integration and Applications Infrastructure
SM
SS
afe
ty M
anagem
ent
/ E
xpert
Syste
m
SAFETY
OT
S/L
MS
Opera
tor
Tra
inin
g / L
earn
ing
Managem
ent
PEOPLEENVIRON.
CE
MS
Continuous E
mis
sio
ns M
onitori
ng
Syste
m
PT/QMProduction Tracking /
Quality Monitoring
SQCStatistical Quality
Control
ARMAnalyzer Reliability
Monitoring
QUALITY
Well Survalance
and
Performance
OISOperational
Intelligence
OMSOperations
Monitoring &
Reporting
Production
Analytics
Production
Reporting
PRODUCTION & OPERATION MANAGEMENT
RBARisk Based
Analysis &
Evaluation
Compression
Analysis
CBMCondition Based
Monitoring
EH
MA
sset R
eliability /
Availability M
onitori
ng
ASSET AVAILABILITY & REL.
Production
Accounting
FPSO
Monitoring
Value Chain
Situational
Awarenss
Remote
Production
Monitoring
Applications and Solutions “Functionality”
© Copyr i gh t 2013 O SIs o f t , LLC .
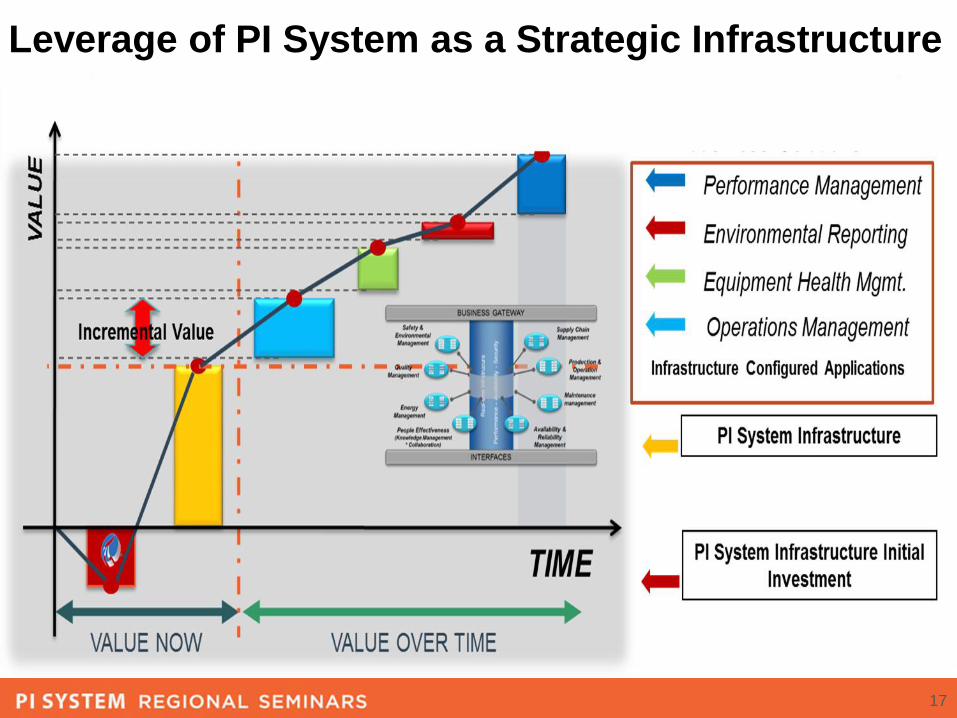
Leverage of PI System as a Strategic Infrastructure
17
18
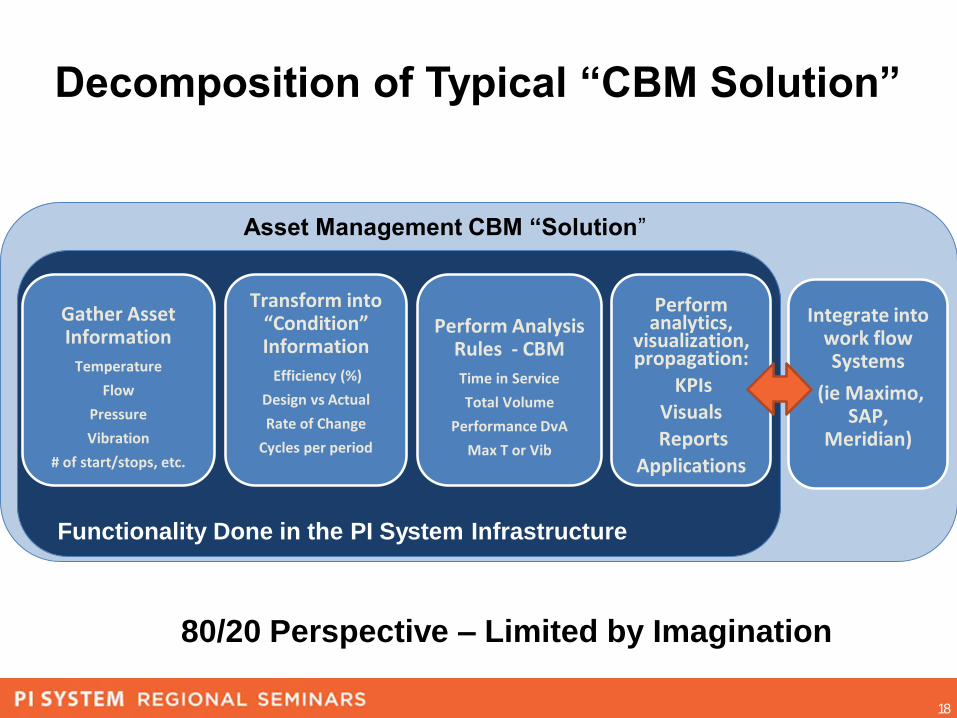
Decomposition of Typical “CBM Solution”
Asset Management CBM “Solution”
Integrate into work flow Systems
(ie Maximo, SAP,
Meridian)
Gather Asset Information
Temperature
Flow
Pressure
Vibration
# of start/stops, etc.
Transform into “Condition” Information
Efficiency (%)
Design vs Actual
Rate of Change
Cycles per period
Perform Analysis Rules - CBM
Time in Service
Total Volume
Performance DvA
Max T or Vib
Perform analytics,
visualization, propagation:
KPIs
Visuals
Reports
Applications
Functionality Done in the PI System Infrastructure
80/20 Perspective – Limited by Imagination

19
Broad Areas of PI System Use in O&G
Asset Performance Management and Reliability Operations Integration, Monitoring, Collaboration, BI
Value Chain & Extended Supply Chain Integration
& Real-Time Situational Awareness“Remoting” and Operations/ SME Collaboration Centers
© Copyr i gh t 2013 O SIs o f t , LLC .
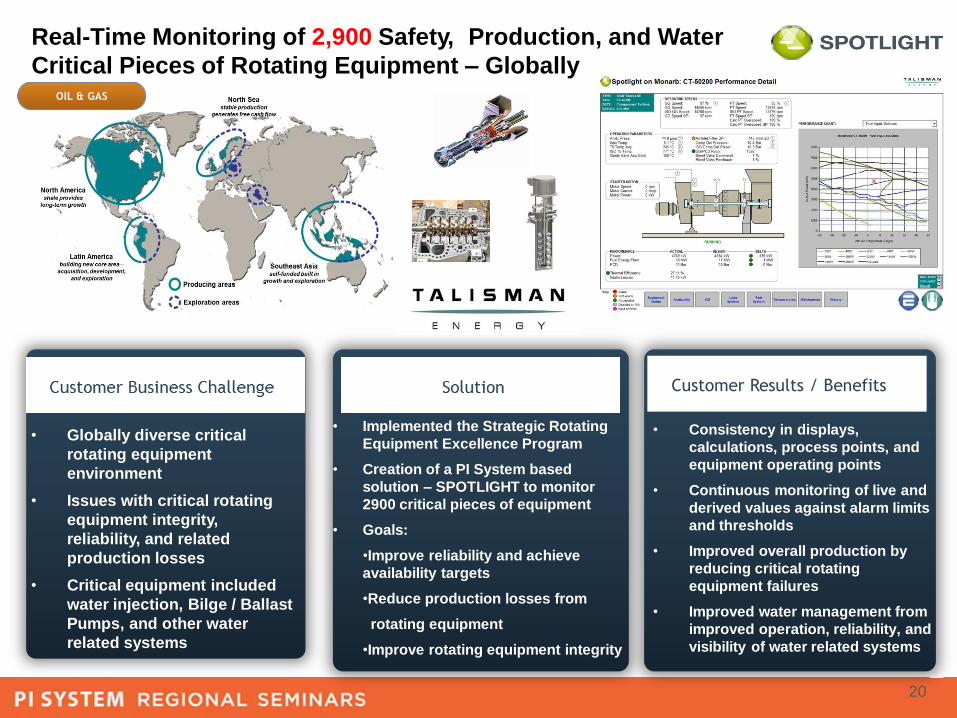
• Consistency in displays,
calculations, process points, and
equipment operating points
• Continuous monitoring of live and
derived values against alarm limits
and thresholds
• Improved overall production by
reducing critical rotating
equipment failures
• Improved water management from
improved operation, reliability, and
visibility of water related systems
Real-Time Monitoring of 2,900 Safety, Production, and Water
Critical Pieces of Rotating Equipment – Globally
• Globally diverse critical
rotating equipment
environment
• Issues with critical rotating
equipment integrity,
reliability, and related
production losses
• Critical equipment included
water injection, Bilge / Ballast
Pumps, and other water
related systems
• Implemented the Strategic Rotating
Equipment Excellence Program
• Creation of a PI System based
solution – SPOTLIGHT to monitor
2900 critical pieces of equipment
• Goals:
•Improve reliability and achieve
availability targets
•Reduce production losses from
rotating equipment
•Improve rotating equipment integrity
20
Customer Results / Benefits

© Copyr i gh t 2013 O SIs o f t , LLC .
Business Challenge – Improve Reliability on
2,800+ Global Critical Equipment Assets
Safety Critical Equipment
• 39 Diesel Drive Fire Pumps
• 6 Electric Drive Fire Pumps
• 8 Hydraulic drive fire pumps
• 15 Emergency Power Generation Packages
• 26 Bilge / Ballast Pumps
• 53 Other Safety Critical Pumps
Production Critical Equipment
• 56 Gas Turbines
• 40 Gas Compressors
• 9 Diesel Engines for Main Power Generation
• 27 Main Water Injection, P.W. & Artificial Lift
Pumps
• 35 Main Oil Line Pumps
• Circa 2711 Operational Pumps
21
© Copyr i gh t 2013 O SIs o f t , LLC .
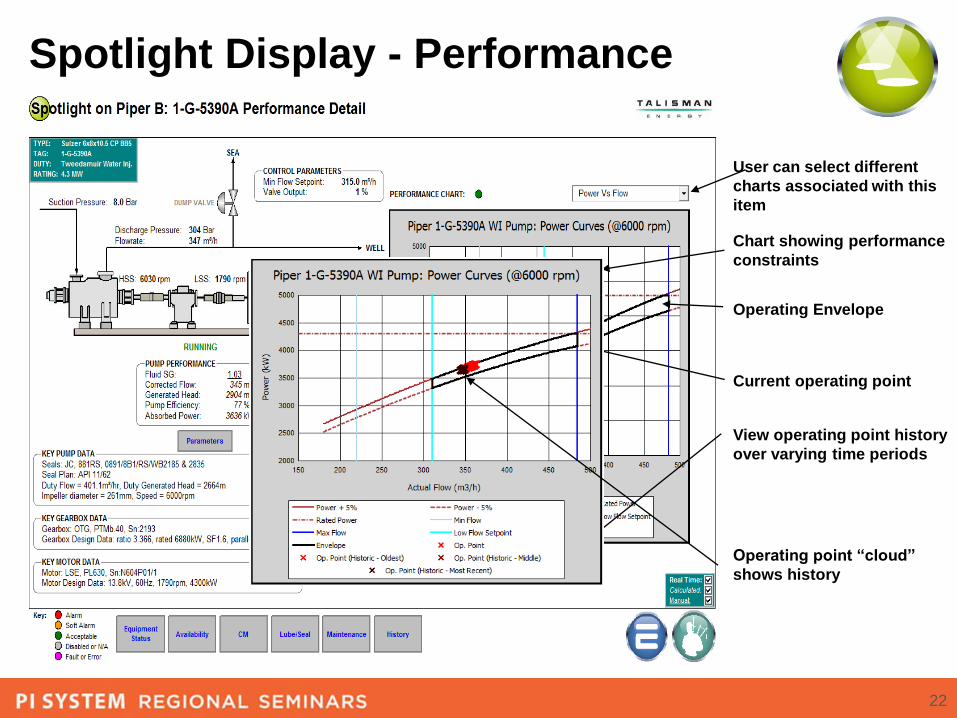
Spotlight Display - Performance
Chart showing performance
constraints
Operating Envelope
Current operating point
View operating point history
over varying time periods
User can select different
charts associated with this
item
Operating point “cloud”
shows history
22

© Copyr i gh t 2013 O SIs o f t , LLC .
KPI Displays with High Fidelity Drill Down
Links to detailed
displays for each item
of equipment
Traffic light shows
rolled up alarm status
for each sub-display
Water Injection
Equipment and
Systems
© Copyr i gh t 2013 O SIs o f t , LLC .
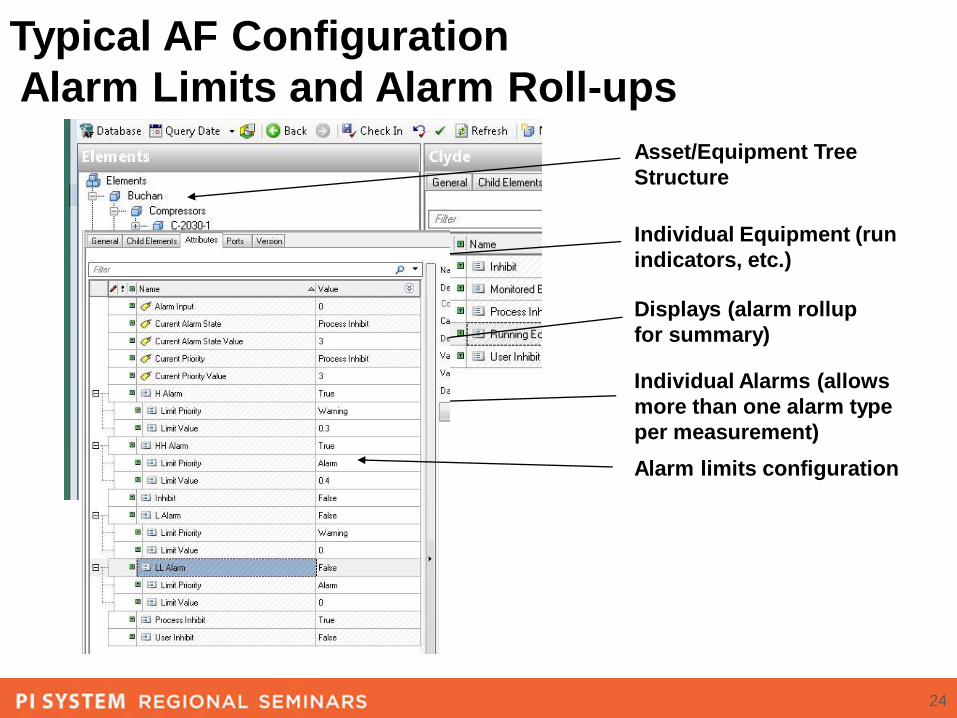
Typical AF Configuration
Alarm Limits and Alarm Roll-ups
Asset/Equipment Tree
Structure
Individual Equipment (run
indicators, etc.)
Displays (alarm rollup
for summary)
Individual Alarms (allows
more than one alarm type
per measurement)
Alarm limits configuration
24
© Copyr i gh t 2013 O SIs o f t , LLC . 25
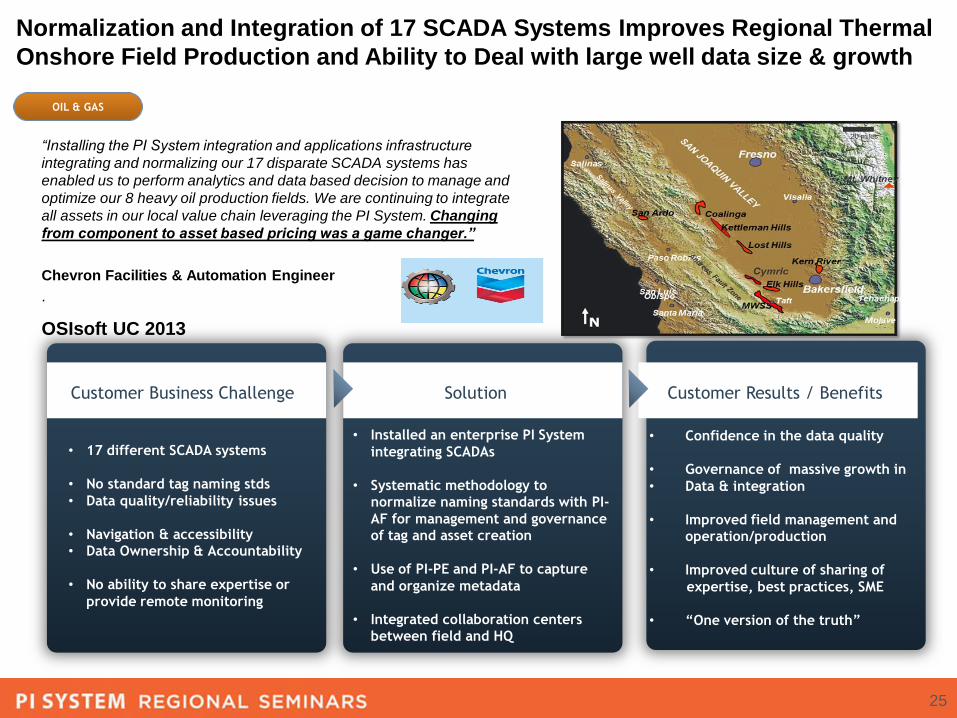
“Installing the PI System integration and applications infrastructure
integrating and normalizing our 17 disparate SCADA systems has
enabled us to perform analytics and data based decision to manage and
optimize our 8 heavy oil production fields. We are continuing to integrate
all assets in our local value chain leveraging the PI System. Changing
from component to asset based pricing was a game changer.”
Chevron Facilities & Automation Engineer
.
OSIsoft UC 2013
Customer Business Challenge Solution Customer Results / Benefits
• 17 different SCADA systems
• No standard tag naming stds
• Data quality/reliability issues
• Navigation & accessibility
• Data Ownership & Accountability
• No ability to share expertise or
provide remote monitoring
• Installed an enterprise PI System
integrating SCADAs
• Systematic methodology to
normalize naming standards with PI-
AF for management and governance
of tag and asset creation
• Use of PI-PE and PI-AF to capture
and organize metadata
• Integrated collaboration centers
between field and HQ
Normalization and Integration of 17 SCADA Systems Improves Regional Thermal
Onshore Field Production and Ability to Deal with large well data size & growth
• Confidence in the data quality
• Governance of massive growth in
• Data & integration
• Improved field management and
operation/production
• Improved culture of sharing of
expertise, best practices, SME
• “One version of the truth”
© Copyr i gh t 2013 O SIs o f t , LLC .
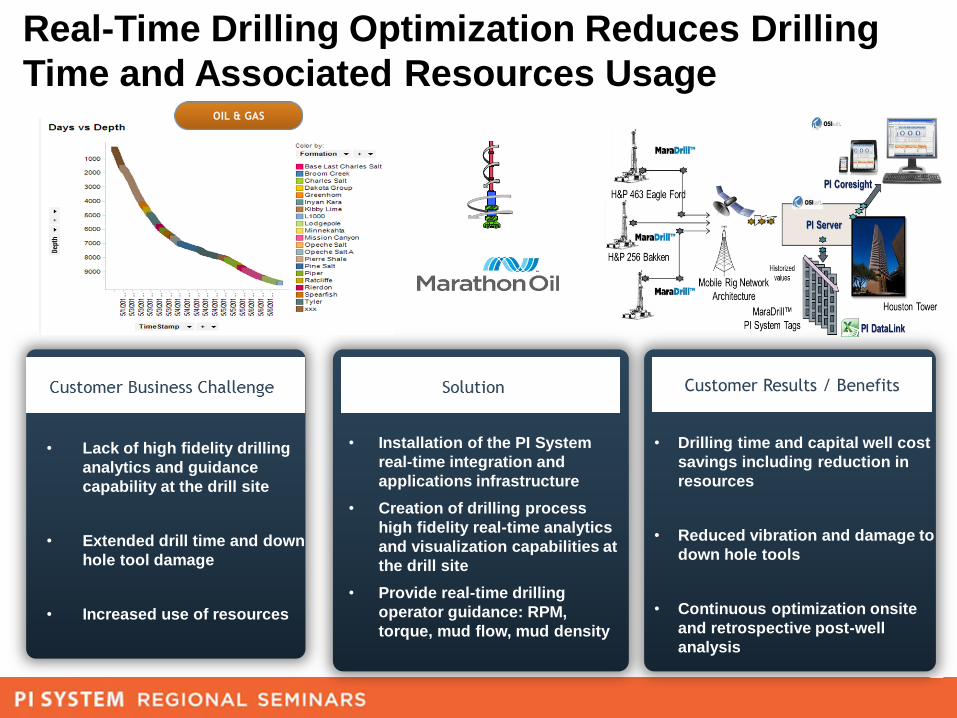
Customer Results / Benefits
• Drilling time and capital well cost
savings including reduction in
resources
• Reduced vibration and damage to
down hole tools
• Continuous optimization onsite
and retrospective post-well
analysis
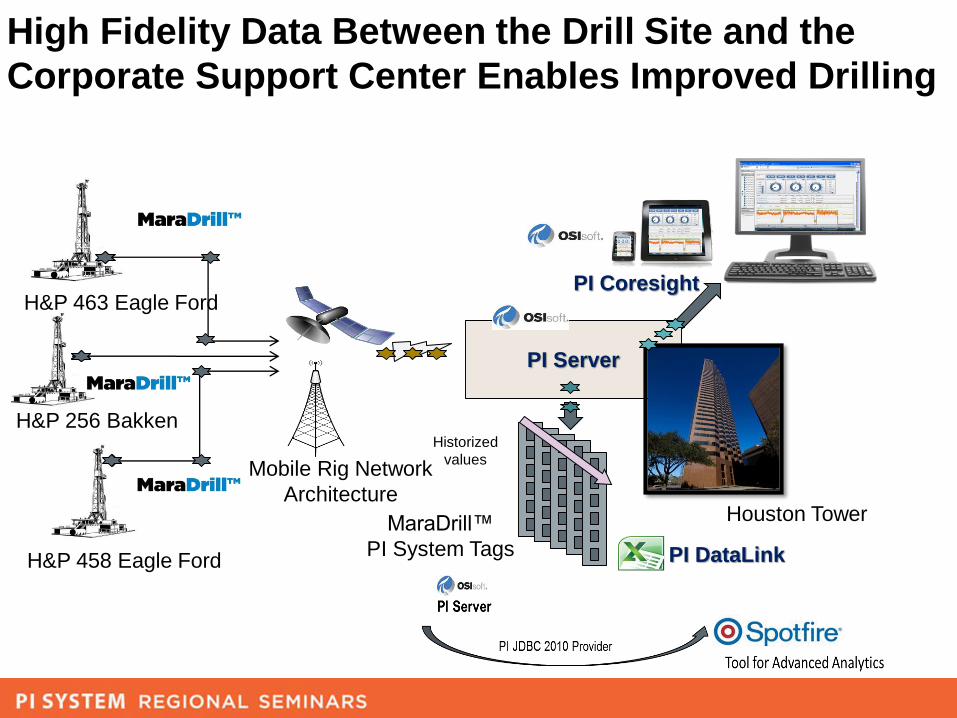
Real-Time Drilling Optimization Reduces Drilling
Time and Associated Resources Usage
• Lack of high fidelity drilling
analytics and guidance
capability at the drill site
• Extended drill time and down
hole tool damage
• Increased use of resources
• Installation of the PI System
real-time integration and
applications infrastructure
• Creation of drilling process
high fidelity real-time analytics
and visualization capabilities at
the drill site
• Provide real-time drilling
operator guidance: RPM,
torque, mud flow, mud density
Customer Results / Benefits
© Copyr i gh t 2013 O SIs o f t , LLC .
High Fidelity Data Between the Drill Site and the
Corporate Support Center Enables Improved Drilling
PI Server
H&P 463 Eagle Ford
H&P 256 Bakken
H&P 458 Eagle Ford
MaraDrill™
PI System Tags
Historized
values
Houston Tower
PI Coresight
Mobile Rig Network
Architecture
PI DataLink
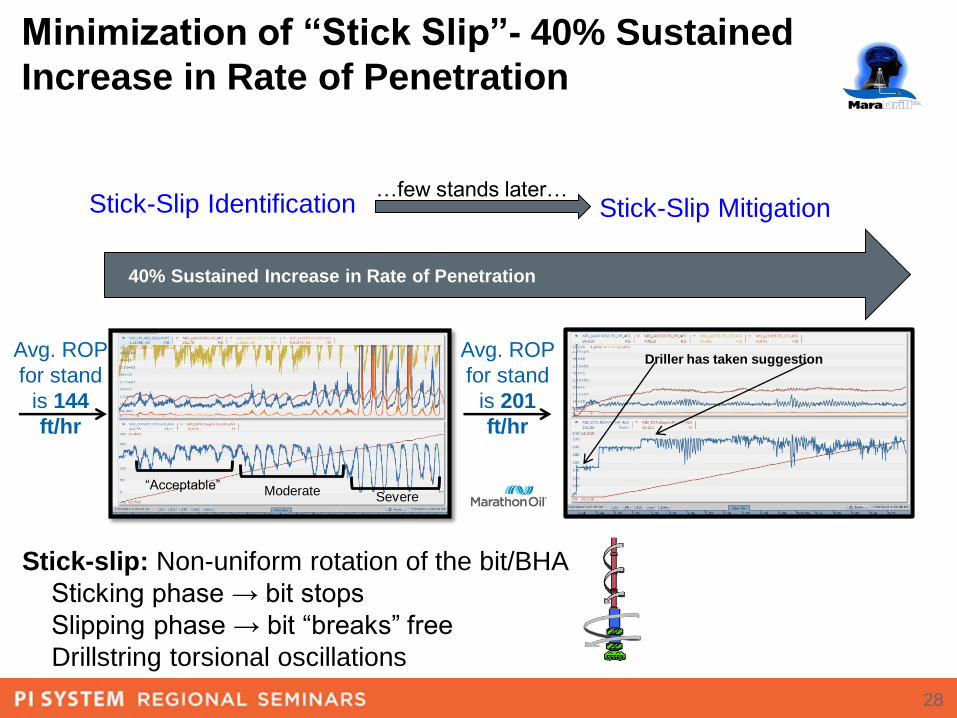
Minimization of “Stick Slip”- 40% Sustained
Increase in Rate of Penetration
28
“Acceptable” Moderate Severe
Avg. ROP
for stand
is 144
ft/hr
Avg. ROP
for stand
is 201
ft/hr
Driller has taken suggestion
Stick-Slip Identification Stick-Slip Mitigation…few stands later…
40% Sustained Increase in Rate of Penetration
Stick-slip: Non-uniform rotation of the bit/BHA
Sticking phase → bit stops
Slipping phase → bit “breaks” free
Drillstring torsional oscillations
© Copyr i gh t 2013 O SIs o f t , LLC .
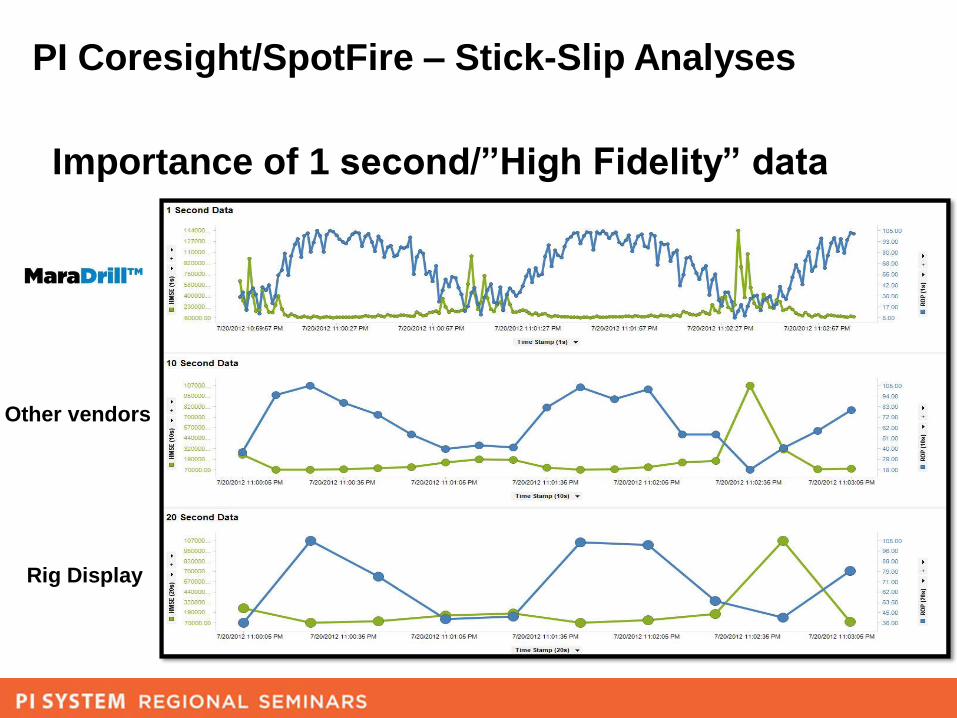
PI Coresight/SpotFire – Stick-Slip Analyses
Advisory in Real Time
Importance of 1 second/”High Fidelity” data
Other vendors
Rig Display
© Copyr i gh t 2013 O SIs o f t , LLC .
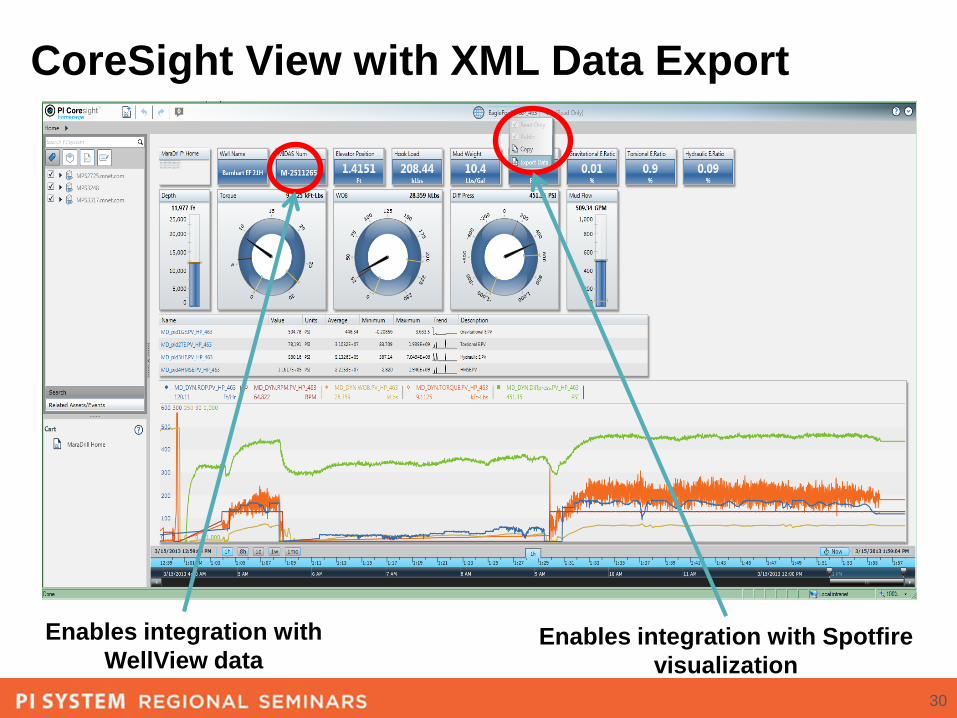
CoreSight View with XML Data Export
30
Enables integration with
WellView dataEnables integration with Spotfire
visualization
© Copyr i gh t 2013 O SIs o f t , LLC .
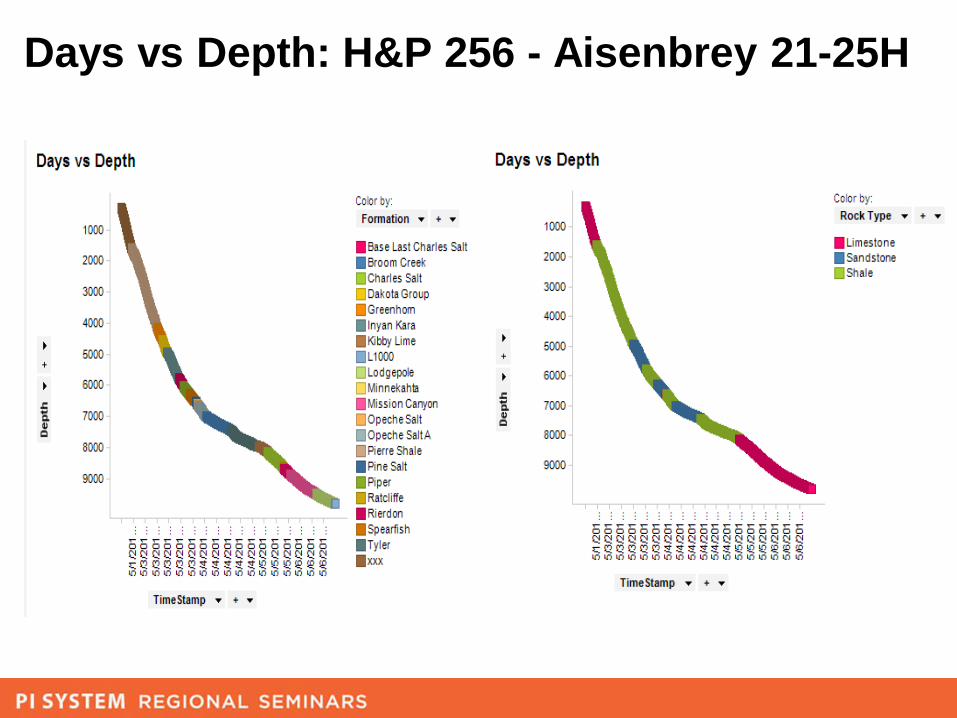
Days vs Depth: H&P 256 - Aisenbrey 21-25H
© Copyr i gh t 2013 O SIs o f t , LLC .
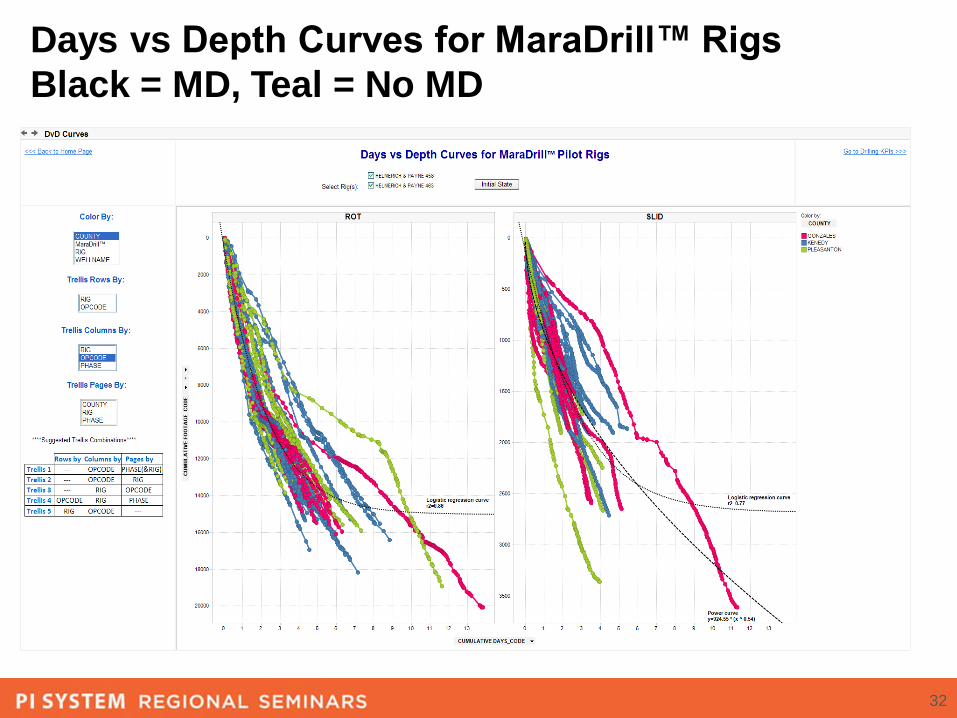
Days vs Depth Curves for MaraDrill™ Rigs
Black = MD, Teal = No MD
32
© Copyr i gh t 2013 O SIs o f t , LLC .
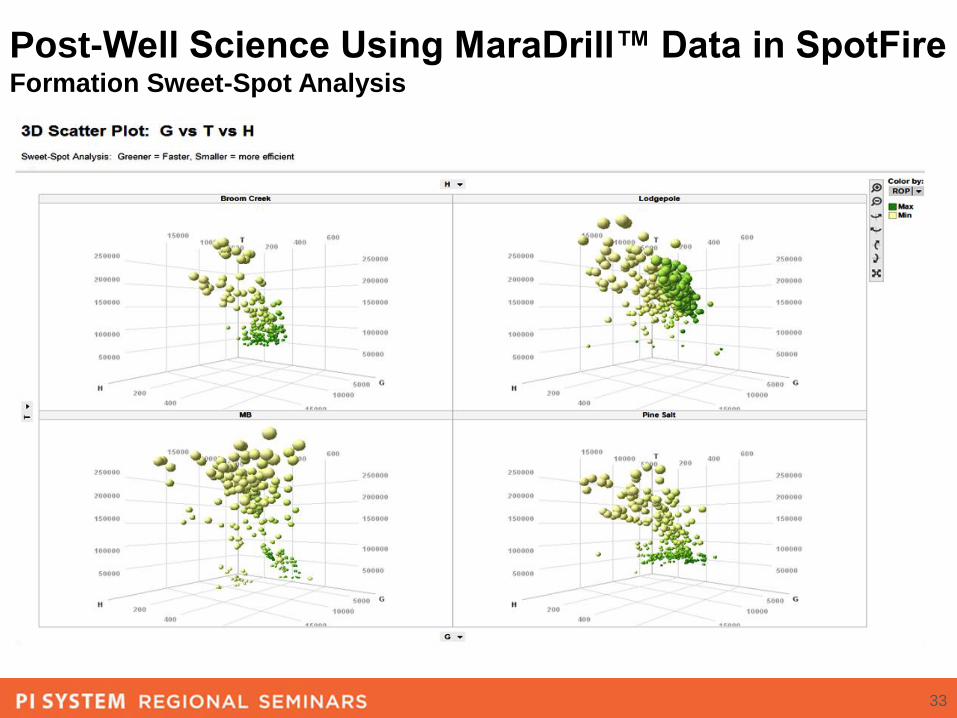
Post-Well Science Using MaraDrill™ Data in SpotFire Formation Sweet-Spot Analysis
33
© Copyr i gh t 2013 O SIs o f t , LLC .
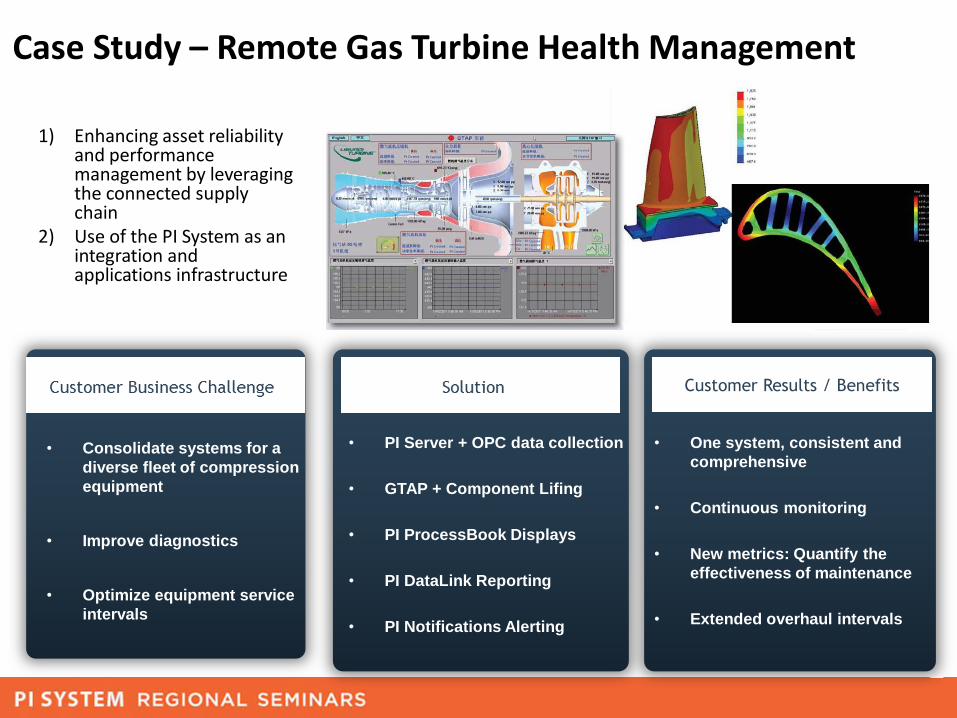
Customer Results / Benefits
• One system, consistent and
comprehensive
• Continuous monitoring
• New metrics: Quantify the
effectiveness of maintenance
• Extended overhaul intervals
• Consolidate systems for a
diverse fleet of compression
equipment
• Improve diagnostics
• Optimize equipment service
intervals
• PI Server + OPC data collection
• GTAP + Component Lifing
• PI ProcessBook Displays
• PI DataLink Reporting
• PI Notifications Alerting
Customer Results / Benefits
Case Study – Remote Gas Turbine Health Management
1) Enhancing asset reliability and performance management by leveraging the connected supply chain
2) Use of the PI System as an integration and applications infrastructure
© Copyr i gh t 2013 O SIs o f t , LLC .
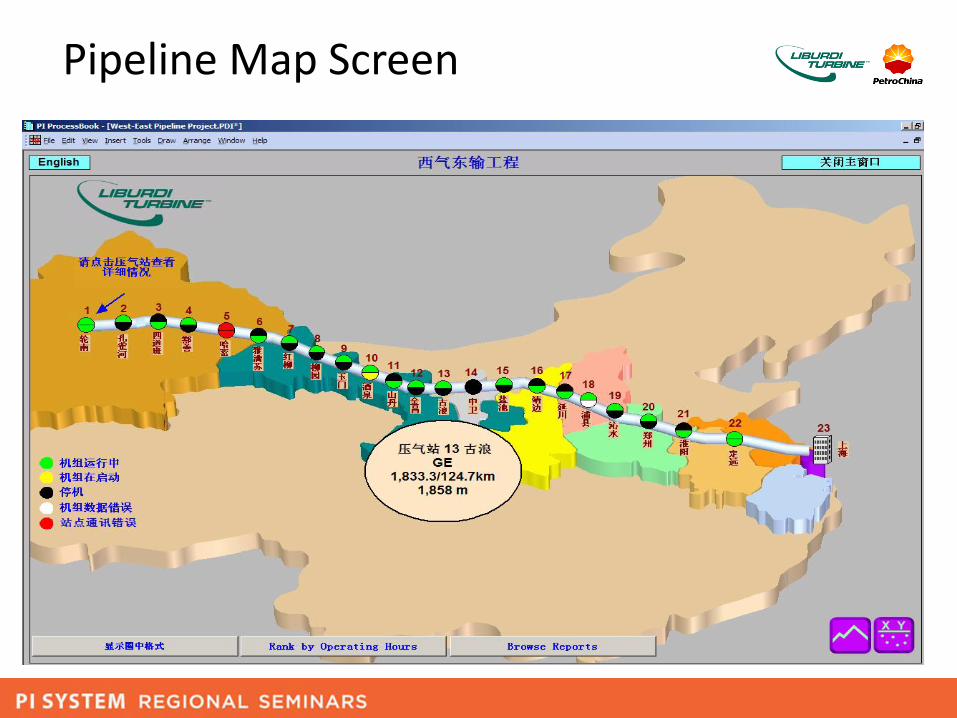
Pipeline Map Screen
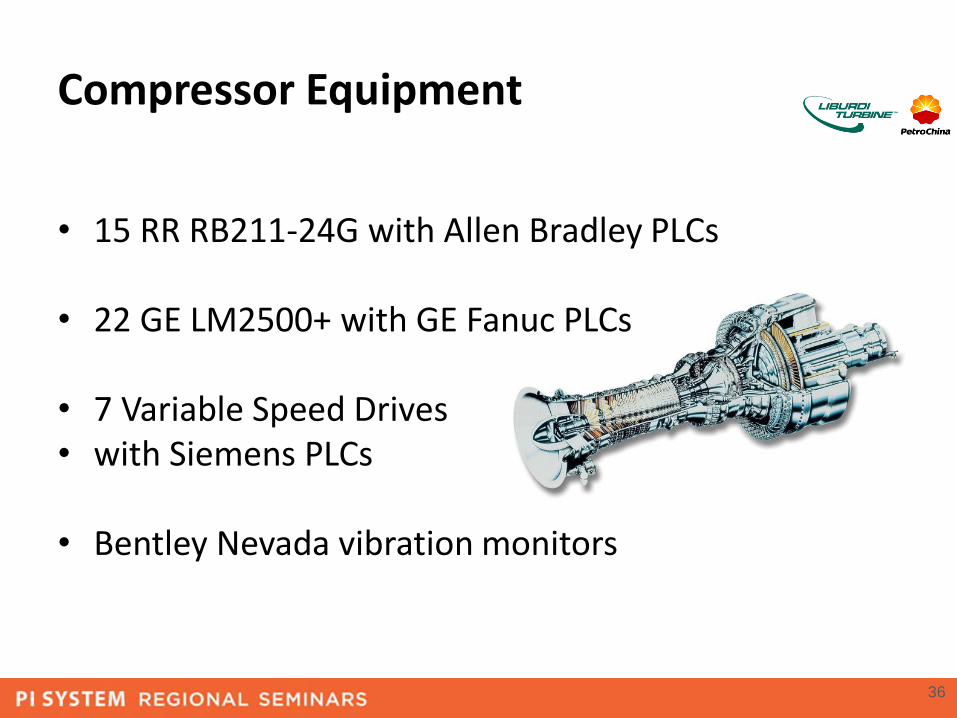
Compressor Equipment
36
• 15 RR RB211-24G with Allen Bradley PLCs
• 22 GE LM2500+ with GE Fanuc PLCs
• 7 Variable Speed Drives • with Siemens PLCs
• Bentley Nevada vibration monitors
© Copyr i gh t 2013 O SIs o f t , LLC .
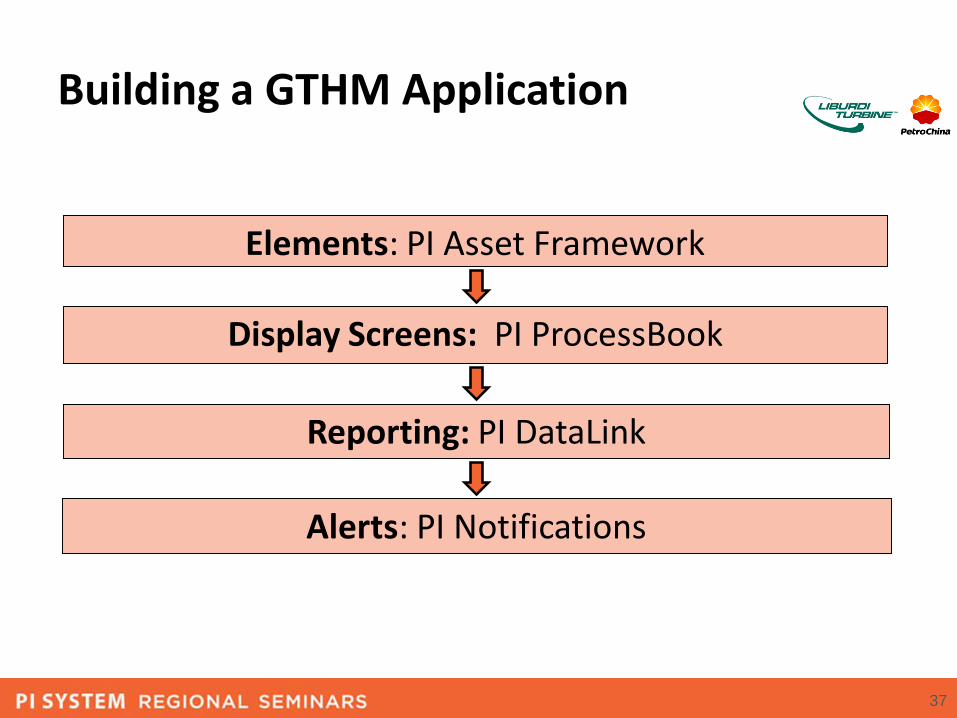
Building a GTHM Application
37
Elements: PI Asset Framework
Display Screens: PI ProcessBook
Reporting: PI DataLink
Alerts: PI Notifications
© Copyr i gh t 2013 O SIs o f t , LLC .
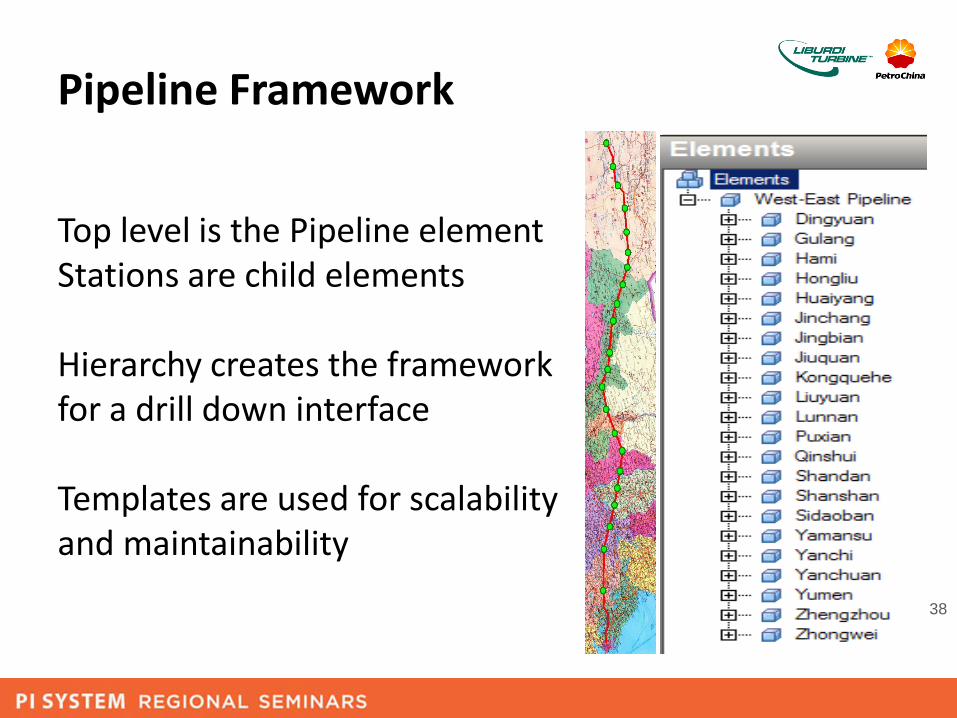
Pipeline Framework
38
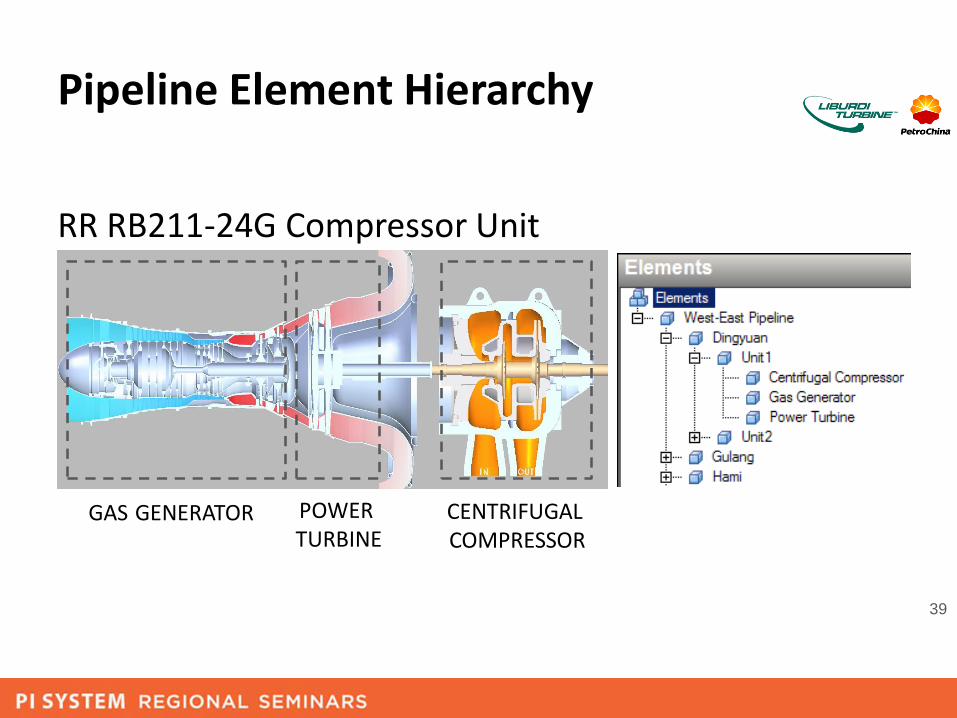
Top level is the Pipeline element Stations are child elements
Hierarchy creates the framework for a drill down interface
Templates are used for scalability and maintainability
© Copyr i gh t 2013 O SIs o f t , LLC .
Pipeline Element Hierarchy
39
GAS GENERATOR POWER TURBINE
CENTRIFUGAL COMPRESSOR
RR RB211-24G Compressor Unit
© Copyr i gh t 2013 O SIs o f t , LLC . 40
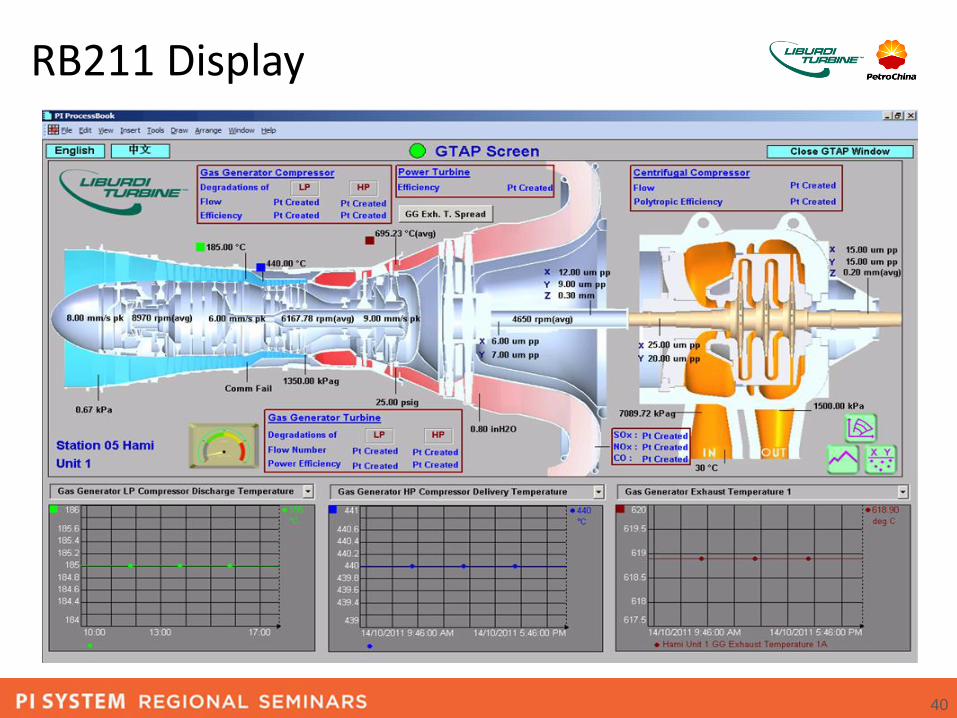
RB211 Display
© Copyr i gh t 2013 O SIs o f t , LLC . 41
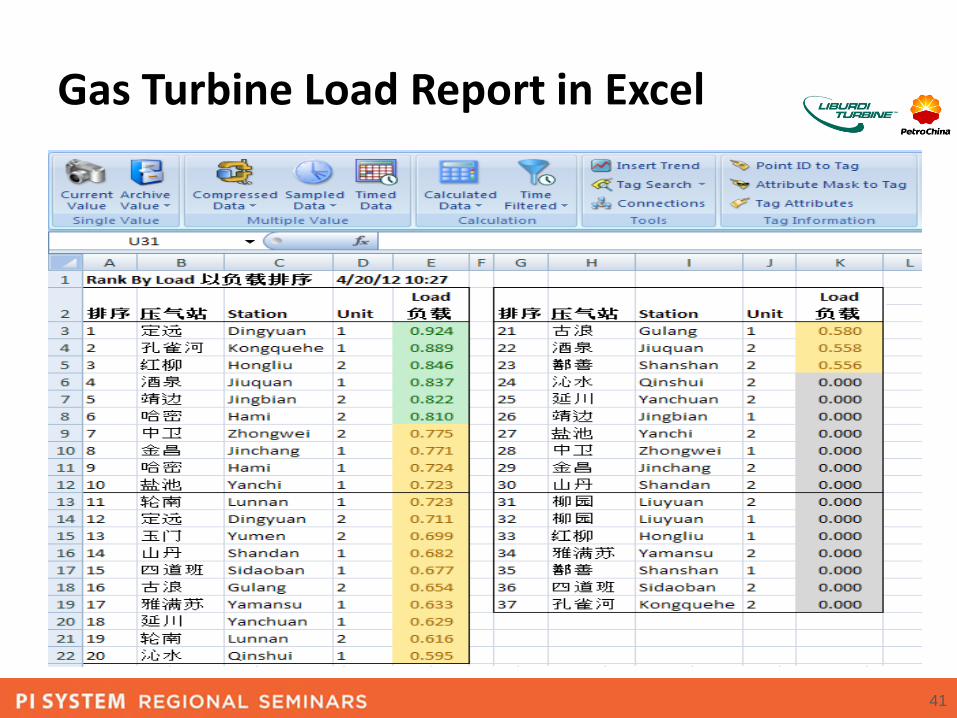
Gas Turbine Load Report in Excel

© Copyr i gh t 2013 O SIs o f t , LLC . 42
EGT Spread Monitor in Excel Radar Chart

© Copyr i gh t 2013 O SIs o f t , LLC . 43
Centrifugal Compressor Wheel Map – Excel XY Scatter Plot
© Copyr i gh t 2013 O SIs o f t , LLC . 44
Other “Art of
the Possible”
Examples
© Copyr i gh t 2013 O SIs o f t , LLC . 45
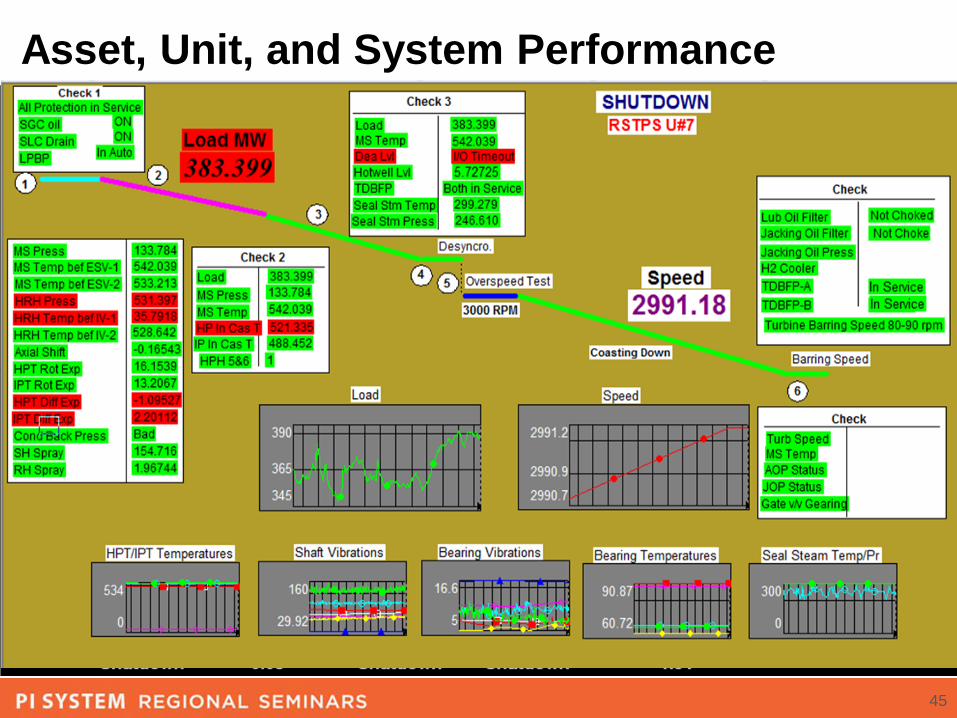
Asset, Unit, and System Performance
© Copyr i gh t 2013 O SIs o f t , LLC . 46
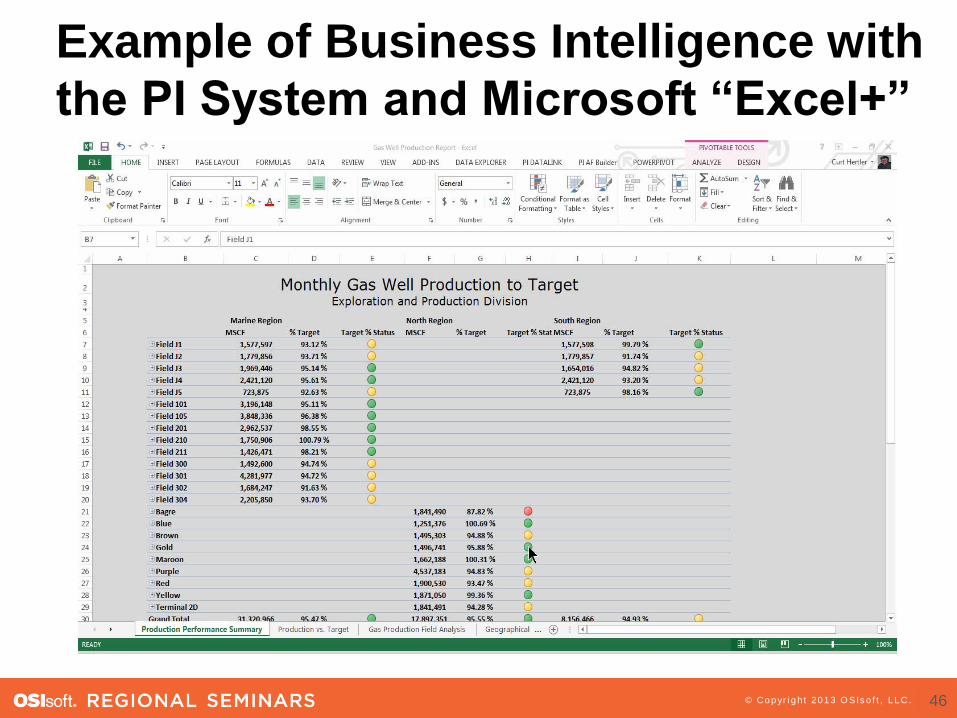
Example of Business Intelligence with
the PI System and Microsoft “Excel+”
© Copyr i gh t 2013 O SIs o f t , LLC .
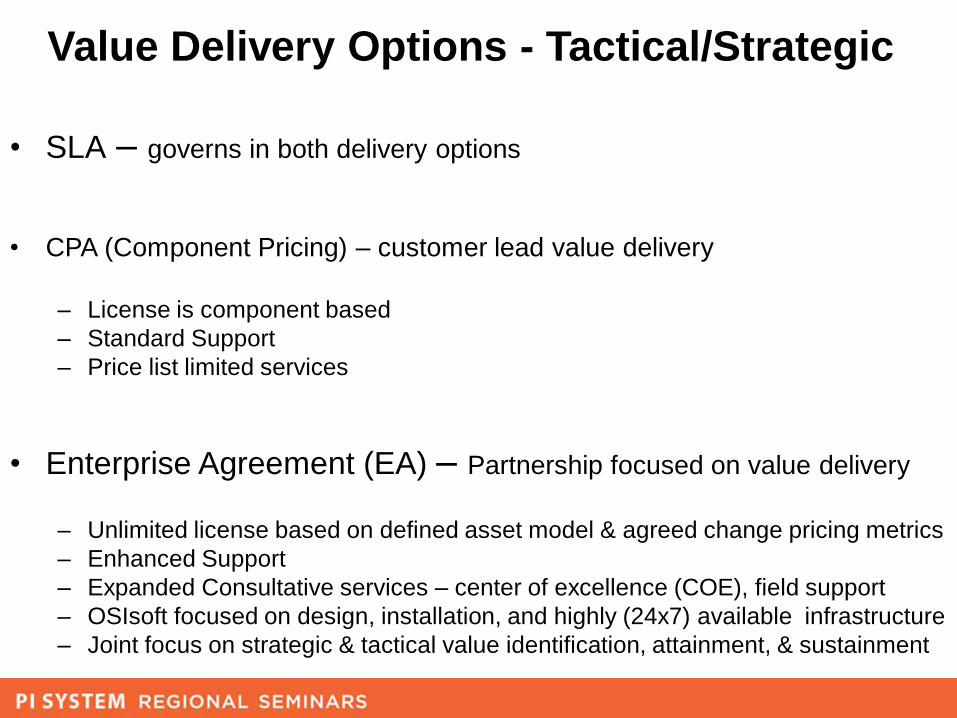
Value Delivery Options - Tactical/Strategic
• SLA – governs in both delivery options
• CPA (Component Pricing) – customer lead value delivery
– License is component based
– Standard Support
– Price list limited services
• Enterprise Agreement (EA) – Partnership focused on value delivery
– Unlimited license based on defined asset model & agreed change pricing metrics
– Enhanced Support
– Expanded Consultative services – center of excellence (COE), field support
– OSIsoft focused on design, installation, and highly (24x7) available infrastructure
– Joint focus on strategic & tactical value identification, attainment, & sustainment

© Copyr i gh t 2013 O SIs o f t , LLC .
“Strategic” Enterprise Agreement Customers in O&G
- Strategic element of their technology landscape
- Unlimited use of the PI System license across their enterprise
- Extensive Use of PI Analytics, PI-AF, PI-Notifications, & PI-Data Access
- Consultative partnership with OSIsoft focused on value creation and sustainment
- Revolutionizing their applications and solutions approach - significant value creation,
usability, & TOC Impact
- Core element of cyber and information security strategy
- Typical tags per unit capacity or assets typically x2 that of non-EA customers with
significant more use of PI AF and related advanced functionality delivering significance
value add and TCO Reduction
© Copyr i gh t 2013 O SIs o f t , LLC .
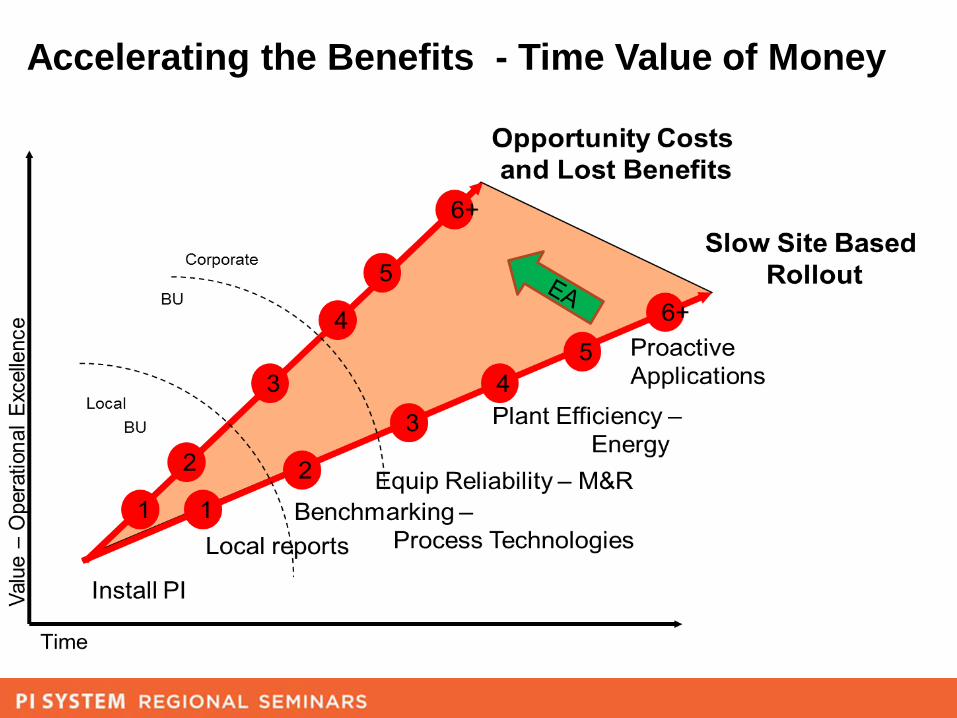
Accelerating the Benefits - Time Value of Money
© Copyr i gh t 2013 O SIs o f t , LLC . 50
Outline
• The PI System and “Energy Independence”
• Challenges and….. Opportunities
– The Shale Revolution
– Technological Trends
– Industry Challenges
• Innovative PI System Applications - “The Art of the Possible”
• Closing Comments
© Copyr i gh t 2013 O SIs o f t , LLC . 51
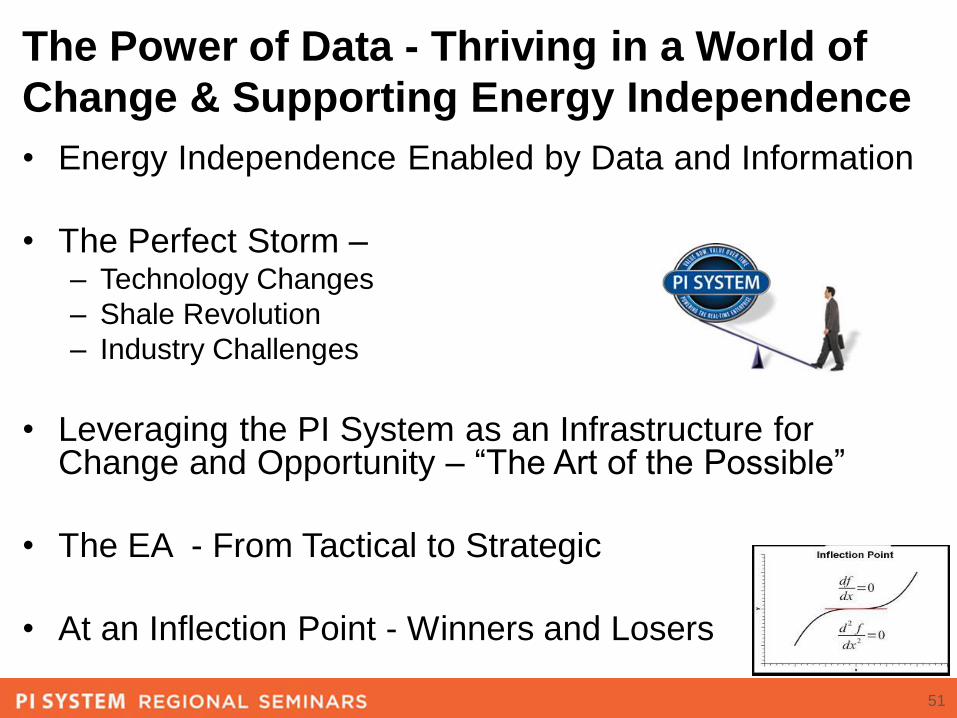
The Power of Data - Thriving in a World of
Change & Supporting Energy Independence
• Energy Independence Enabled by Data and Information
• The Perfect Storm –– Technology Changes
– Shale Revolution
– Industry Challenges
• Leveraging the PI System as an Infrastructure for Change and Opportunity – “The Art of the Possible”
• The EA - From Tactical to Strategic
• At an Inflection Point - Winners and Losers
© Copyr i gh t 2013 O SIs o f t , LLC .
Brought to you by