Embed Size (px)
Citation preview

Atmos. Chem. Phys., 5, 2847–2867, 2005www.atmos-chem-phys.org/acp/5/2847/SRef-ID: 1680-7324/acp/2005-5-2847European Geosciences Union
AtmosphericChemistry
and Physics
Global distribution of Earth’s surface shortwave radiation budget
N. Hatzianastassiou1,2, C. Matsoukas2,3, A. Fotiadi2, K. G. Pavlakis2,5, E. Drakakis2,4, D. Hatzidimitriou 2,3, andI. Vardavas2,3
1Laboratory of Meteorology, Department of Physics, University of Ioannina, Greece2Foundation for Research and Technology-Hellas, Heraklion, Crete, Greece3Department of Physics, University of Crete, Crete, Greece4Department of Electrical Engineering, Technological Educational Institute of Crete, Greece5Department of General Applied Science, Technological Educational Institute of Crete, Greece
Received: 5 July 2004 – Published in Atmos. Chem. Phys. Discuss.: 11 July 2005Revised: 7 October 2005 – Accepted: 13 October 2005 – Published: 1 November 2005
Abstract. The monthly mean shortwave (SW) radiationbudget at the Earth’s surface (SRB) was computed on 2.5-degree longitude-latitude resolution for the 17-year periodfrom 1984 to 2000, using a radiative transfer model ac-counting for the key physical parameters that determine thesurface SRB, and long-term climatological data from theInternational Satellite Cloud Climatology Project (ISCCP-D2). The model input data were supplemented by datafrom the National Centers for Environmental Prediction –National Center for Atmospheric Research (NCEP-NCAR)and European Center for Medium Range Weather Forecasts(ECMWF) Global Reanalysis projects, and other global databases such as TIROS Operational Vertical Sounder (TOVS)and Global Aerosol Data Set (GADS). The model surface ra-diative fluxes were validated against surface measurementsfrom 22 stations of the Baseline Surface Radiation Network(BSRN) covering the years 1992–2000, and from 700 sta-tions of the Global Energy Balance Archive (GEBA), cov-ering the period 1984–2000. The model is in good agree-ment with BSRN and GEBA, with a negative bias of 14 and6.5 Wm−2, respectively. The model is able to reproduce in-teresting features of the seasonal and geographical variationof the surface SW fluxes at global scale. Based on the 17-year average model results, the global mean SW downwardsurface radiation (DSR) is equal to 171.6 Wm−2, whereas thenet downward (or absorbed) surface SW radiation is equalto 149.4 Wm−2, values that correspond to 50.2 and 43.7%of the incoming SW radiation at the top of the Earth’s at-mosphere. These values involve a long-term surface albedoequal to 12.9%. Significant increasing trends in DSR andnet DSR fluxes were found, equal to 4.1 and 3.7 Wm−2, re-spectively, over the 1984–2000 period (equivalent to 2.4 and
Correspondence to:N. Hatzianastassiou([email protected])
2.2 Wm−2 per decade), indicating an increasing surface so-lar radiative heating. This surface SW radiative heating isprimarily attributed to clouds, especially low-level, and sec-ondarily to other parameters such as total precipitable water.The surface solar heating occurs mainly in the period startingfrom the early 1990s, in contrast to decreasing trend in DSRthrough the late 1980s. The computed global mean DSR andnet DSR flux anomalies were found to range within±8 and±6 Wm−2, respectively, with signals from El Nino and LaNina events, and the Pinatubo eruption, whereas significantpositive anomalies have occurred in the period 1992–2000.
1 Introduction
Knowledge and monitoring of the Earth’s radiation bud-get (ERB) is essential for improving our understanding ofthe Earth’s climate and potential climatic changes (IPCC,2001), since the radiative energy exchanges at the top ofthe atmosphere (TOA) and at the Earth’s surface regulatethe redistribution of energy and determine the energy bal-ance of the Earth-atmosphere system. Rather than exam-ining ERB as a whole, it is very important to quantify itscomponents, namely the Earth’s radiation budget at TOA(TOARB), within the atmosphere, and at the surface (SRB).Satellite observations, such as those from Nimbus-7 and theEarth Radiation Budget Experiment (ERBE) have greatly im-proved our knowledge of TOARB. Nevertheless, at presenttime, knowledge of SRB is far less advanced than the one forTOARB. The SRB, however, is a major component of the en-ergy exchanges between the atmosphere and the land/oceansurface, and hence affects temperature fields, atmosphericand oceanic circulation, and the hydrological cycle. Be-sides, SRB data constitute a valuable resource for initialising
© 2005 Author(s). This work is licensed under a Creative Commons License.
2848 N. Hatzianastassiou et al.: Global distribution of Earth’s surface shortwave radiation budget
and testing climate and general circulation models (GCMs).The estimation of SRB represents one of the most signifi-cant objectives of the World Climate Research Programme(WCRP) as demonstrated by its Global Energy and WaterCycle Experiment (GEWEX), and in particular the GEWEXSRB project (Stackhouse et al., 1999; Gupta et al., 1999).
The global distribution of SRB cannot be derived from sur-face observations because of the sparsity and nonhomogene-ity of stations (Li and Leighton, 1993; Li et al., 1997), espe-cially over oceans. Thus, global atlases from surface-basedobservations (Esbensen and Kushnir, 1981) suffer from thisshortcoming. Therefore, the modelling approach remainsas the only alternative, provided that the model results canbe trusted through validation against quality measurements.One way to solve the problem is to establish correlationsbetween TOA and surface radiative fluxes in order to de-rive surface fluxes directly using the satellite measurementsof TOA fluxes (for example, Ramanathan, 1986; Schmetz,1989; Weare, 1989; Cess et al., 1991; Darnell et al., 1992;Pinker and Laszlo, 1992; Li and Leighton, 1993). How-ever, there is uncertainty regarding the reliability of the cor-relations used to produce surface SW fluxes (Gupta et al.,1999). Another way to solve the problem of estimating SRBis to develop algorithms and models to compute SRB fluxeson a global scale using observations of atmospheric, cloud,and surface properties, preferably from operational satellitesources to provide global coverage. Recently, the amountand quality of satellite data have substantially improved, es-pecially in terms of clouds (whose some properties, such ascloud optical depth, represented the most difficult parametersto be derived for many years) with the International Satel-lite Cloud Climatology Project (ISCCP, Rossow and Schiffer,1991) that provides the most complete and comprehensiveexisting global cloud climatology. In the last two decades,a large number of studies estimating SRB have been pub-lished (e.g. Raschke et al., 1987; Darnell et al., 1988; Rossowand Lacis, 1990; Kyle at al., 1990; Stephens and Greenwald,1991; Darnell et al., 1992; Hartmann, 1993; Li and Leighton,1993; Kiehl et al., 1995; Rossow and Zhang, 1995; Whit-lock et al., 1995; Fowler and Randall, 1996; Del Genio etal., 1996; Chen and Roeckner, 1996; Wild et al., 1998a,b; Yu et al., 1999). Gupta et al. (1999) derived a 8-year(July 1983–June 1991) climatology of SRB by using satel-lite data from the ISCCP C-series, on a monthly mean ba-sis. Hatzianastassiou and Vardavas (1999, 2001) providedalso an 8-year climatology of the SW radiation budget of thenorthern and southern hemispheres, respectively, but this wasdone only on a 10-degree latitude zonal and monthly meanbasis. Furthermore, these studies have been performed byusing data from the ISCCP-C2 series. The new ISCCP D-series data include significant improvements, especially interms of cloud structure and cloud detection over highly re-flecting surfaces (cf. Rossow and Schiffer, 1999) and covera longer time period, extending up to year 2000. This isimportant, since the Earth’s radiation budget changes with
time. Although the more recent energy budget studies, in-cluding those from GCMs, but also results from reanaly-sis projects (such as the National Centers for Environmen-tal Prediction/National Center for Atmospheric Research,NCEP/NCAR, or the European Center for Medium RangeWeather Forecast, ECMWF), show good agreement with ob-servations at TOA, there is a considerable variation for SWSRB (called henceforth simply SRB) within about 20 Wm−2
(Kiehl and Trenberth, 1997). Moreover, estimated surfaceSW flux values tend to be systematically higher than ground-based station observations by significant amounts (Garratt,1994; Wild et al., 1995, 1998a, b; Li et al., 1997; Kiehl andTrenberth, 1997; Garratt et al., 1998; Wild, 2005). For exam-ple, the global and annual mean SW flux absorbed at the sur-face is generally larger than 170 Wm−2, with the exceptionof the European Center/Hamburg (ECHAM) model, whilethe only direct radiative surface flux measurements fromthe Global Energy Balance Archive (GEBA, Ohmura andGilgen, 1993), which constitutes the “best” estimate of theglobally averaged net SW flux, indicates values that are lowerby about 20–25 Wm−2. Only recently, Zhang et al. (2004)using ISCCP-D1 data, produced 18-year DSR fluxes that arelower than 170 Wm−2, in good agreement with both GEBAand BSRN measurements.
In this study we provide a 17-year (January 1984–December 2000) climatology of the Earth’s SRB, on a 2.5-degree longitude-latitude resolution, and on monthly meanbasis. A physical deterministic radiative transfer model isused to compute the SRB components, i.e. the SW down-ward surface radiation (DSR) and the net downward (or ab-sorbed) SW radiation (called henceforth net DSR) at theEarth’s surface. The model has been improved with re-spect to the versions used in previous studies (Hatzianastas-siou and Vardavas, 1999, 2001), as explicitly described inSect. 2. Nevertheless, note that in this study flux calcula-tions are performed using ISCCP-D2 monthly mean inputdata sets. Because of the non-linear relationship between ra-diative fluxes and the input physical parameters of the model,monthly mean input-based “monthly mean fluxes” are not thesame as the monthly-mean fluxes averaged from hourly/dailyfluxes. However, this problem is alleviated by the fact thatthe ISCCP-D2 cloud properties are based on a radiativelylinear average method, so that differences should be small.Note that there are available 3-hourly and decades-long fluxdatasets, also including DSR, namely GEWEX/SRB (Stack-house et al., 2001) and ISCCP-FD (Zhang et al., 2004). Ourmodel is also run using daily mean data at higher spatialresolution (1◦×1◦ latitude-longitude). Extensive compar-isons between the model results presented in this paper andthose of higher spatial and temporal resolution, have shownvery good agreement, with a correlation coefficient equal to98.5%. The daily mean model results cover a shorter period(10-year, 1985–1995) than the 17-year (1984–2000) periodcovered by the ISCCP-D2 data.
Atmos. Chem. Phys., 5, 2847–2867, 2005 www.atmos-chem-phys.org/acp/5/2847/

N. Hatzianastassiou et al.: Global distribution of Earth’s surface shortwave radiation budget 2849
Here, the seasonal and geographical variation of SRBcomponents is investigated, with emphasis given to patternsof averaged values over space and time, specific local andtemporal characteristics, and inter-annual variability. Cli-matological data for the surface and atmospheric parame-ters which are relevant to the transfer of SW radiation, weretaken from existing complete global data sets. Data forclouds, but also for other surface and atmospheric parame-ters were taken from ISCCP-D2, supplemented by humidityand temperature data taken from NCEP/NCAR and ECMWFreanalysis projects. Model input data were also taken fromother global data bases, such as the Television Infrared Ob-servational Satellite (TIROS) Operational Vertical Sounder(TOVS), whereas aerosol particles were accounted for in thestudy, by using relevant data from the Global Aerosol DataSet (GADS), as explained in Sect. 3. The model computa-tions are validated at the grid cell level against quality datafrom the Baseline Surface Radiation Network (BSRN) andGEBA. A brief description of the model is given in the nextsection, while Sect. 3 describes the model input data. Themodel results are given in Sect. 4, where patterns of seasonaland temporal distributions of SRB components are discussedon the basis of grid cell-level model results, while meanhemispherical and global, along with mean annual SRB re-sults are given and inter-annual variations and trends are ex-amined. Section 5 provides a sensitivity analysis of SRBcomponents to the various key surface and atmospheric pa-rameters. The results of the model validation at grid cell levelagainst BSRN and GEBA stations are given in Sect. 6, beforethe summary and conclusions (Sect. 7).
2 Model description
The SW radiative transfer model used is described in detail inthe work by Hatzianastassiou et al. (2004a), where it has beenused to compute the top of atmosphere (TOA) SW radiationbudget. It was developed from a radiative-convective model(Vardavas and Carver, 1984) and previous versions have beenused by Vardavas and Koutoulaki (1995) and Hatzianastas-siou and Vardavas (1999, 2001) to compute the SW radia-tion budget of northern and southern hemispheres on a meanmonthly and 10◦ latitude zonal basis. The model has beensuccessfully tested (cf. Hatzianastassiou and Vardavas, 1999;2001) according to the Intercomparison of Radiation Codesin Climate Models (ICRCCM) program, as well as againstEarth Radiation Budget Experiment (ERBE) S4 scanner data(cf. Hatzianastassiou et al., 2004a).
In brief, the radiative transfer model divides the SW radi-ation into two spectral bands, one for the ultraviolet-visible(UV-visible) wavelengths (λ<0.85µm) accounting for about60% of total solar radiation, and a second band for thenear-infrared (near-IR) wavelengths (0.85µm≤λ≤5µm) ac-counting for about 40% of total solar radiation. The modelachieves a compromise between accuracy of spectral model
computations and speed of computation of parameterisa-tion schemes. The monthly mean incoming total solar fluxat TOA for each 2.5-degree latitude-longitude grid cell, iscomputed theoretically, in the way explained in detail byHatzianastassiou et al. (2004a). The computed incoming so-lar radiation at TOA for each month and 2.5-degree grid cellmatches well the 5-year scanner S4 data from ERBE (model– ERBE differences within 2.5 Wm−2, with uncertainty ofERBE fluxes equal to 6 Wm−2). The solar radiative trans-fer in the Earth-atmosphere system is treated separately inthe UV-visible and near-IR spectral bands and accounts forabsorption and multiple scattering. The model takes intoaccount the physical parameters and processes that affectsignificantly the solar radiation transfer: ozone (O3), wa-ter vapour (H2O), carbon dioxide (CO2), aerosol particles,Rayleigh scattering, surface reflection and non-overlappingclouds (low, middle and high-level). For each grid cell, thesky is divided into clear and cloudy fractions, and hence di-rect and diffuse components are considered for solar radia-tion. The transfer of solar radiation in the Earth-atmospheresystem is treated separately for clear- and cloudy-sky atmo-spheric conditions, by taking into account the presence of therelevant surface and atmospheric parameters (for details seeHatzianastassiou et al., 2004a). The net incoming solar ra-diation at TOA (planetary absorption),F
↓
net,top, the outgoing
SW radiation (OSR) at TOA,F ↑
top, and the planetary albedoRp and planetary absorptivityαp, are computed as in Var-davas and Koutoulaki (1995).
Both clear- and cloudy-sky (corresponding to low, mid-dle and high-level clouds) components ofαp are computedby dividing the incoming solar radiation into UV-visibleand near-IR components, based on estimated transmissivi-ties, absorptivities, and reflectivities of the different atmo-spheric and cloud layers and the Earth’s surface (see Var-davas and Koutoulaki, 1995; Hatzianastassiou and Vardavas,1999, 2001). The reflectivity, transmissivity and absorptiv-ity of each atmospheric layer, due to O3, CO2, water vapour,and Rayleigh scattering, are computed by using parameteri-sations derived from laboratory measurements (Vardavas andKoutoulaki, 1995).
For each cloud and aerosol layer, computations are per-formed using two-stream approximation for purely scatteringclouds in the UV-visible, and a modified two-stream approx-imation allowing for cloud absorption in the near-IR (Var-davas and Koutoulaki, 1995; Hatzianastassiou and Vardavas,1999) and for aerosol absorption in the UV-visible. For clearsky, Rayleigh scattering is taken into account by the modelin the UV-visible, while it is neglected for the near-IR com-ponent, given that the Rayleigh scattering cross-section de-creases rapidly with wavelength. For a cloudy sky, Rayleighscattering is neglected since cloud optical depth is muchlarger than the Rayleigh scattering optical depth.
Reflection of incident solar radiation from the Earth’s sur-face is taken into account and the surface reflectivity,Rg,
www.atmos-chem-phys.org/acp/5/2847/ Atmos. Chem. Phys., 5, 2847–2867, 2005

2850 N. Hatzianastassiou et al.: Global distribution of Earth’s surface shortwave radiation budget
for each 2.5-degree grid cell, is computed considering fourgeneral types of surface: land, ocean, snow and ice (frozenocean). Then
Rg = flandRland + foceanRo + fsnowRs + ficeRi (1)
wherefi is the fractional coverage of the grid cell’s surfaceby each type−i of reflecting surface. The ocean reflectivity,Ro, is computed using Fresnel reflection corrected for a non-smooth surface for an incident angleφ= cos−1 µ from
Ro = 0.5
[(sina
sinb
)2
+
(tana
tanb
)2]
+ 0.016 cosϕ (2)
where
a=ϕ− sin−1 [sinϕ/1.333] (3)
b = 2ϕ − a (4)
For incident solar radiation onto a perfectly smooth wa-ter surface, the angle of reflection equals that of incidence,and for normal incidence the reflectivity is 0.021. For anocean we correct the Fresnel reflectivity to take into accountsurface roughness, which leads to a higher surface reflec-tivity of about 0.04 for incident solar radiation normal tothe water surface (Kondratyev, 1973). The correction fac-tor 0.016cosφ goes to zero when the radiation is parallel tothe ocean surface in order to maintain a Fresnel reflectivityof unity in this case. Further, we include the condition thatif Fresnel reflectivity is greater than ice- or snow reflectivity,which occurs for low solar elevations, then the reflectivitiesof ice or snow are set equal to the Fresnel one. Kuhn (1989)gives observations that clearly show this behaviour for snowcover in Antarctica.
Snow albedo,Rs , is set equal to 0.85 and 0.65 (Dickin-son et al., 1993) in the UV-visible and near-IR, respectively,while sea-ice albedo,Ri , is set equal to 0.7 and 0.5 (Roesch etal., 2002) in the UV-visible and near-IR, respectively, basedon recent estimates. Given that land shows a strong spatialvariability in terms of its type and associated reflectance val-ues, the data used were derived from ERBE data for clearsky, while overcast albedos were obtained by modifying thecorresponding clear-sky values for diffuse radiation condi-tions (Darnell et al., 1992). Information for fractional cover-age for each surface type (land, ocean, snow, ice) is obtainedfrom ISCCP-D2 data (Rossow et al., 1996), whereas suitablereflectivity values for each surface type are ascribed, basedon values taken from literature (Henderson-Sellers and Wil-son, 1983; Briegleb et al., 1986), which allow for spectraldependence over the UV-visible and near-IR range of wave-lengths, which is very important (Wei et al., 2001), but alsoallow for different values for the direct and diffuse compo-nents of solar radiation. A correction was applied to land-surface albedo for high-altitude mountainous areas such asTibet, Rocky Mountains or Antarctica’s plateau, consistingin a reduction of the albedo, in order to take into account the
decrease ofRg over mountainous non-forested areas, espe-cially during winter, due to the sub-grid orography (Roeschet al., 2001).
The downward SW radiation at the Earth’s surface (DSR)and the net downward (or absorbed) SW radiation at sur-face, are finally computed from the incoming SW radiation atTOA, F
↓
top, in terms of an effective atmospheric transmissiv-ity, t∗, with componentst∗s andt∗ci , for a clear-sky and cloudysky covered by cloud type−i, respectively,
DSR = t∗ · F↓
top (5)
where
t∗ = (1 − Ac) · t∗s +
∑i
Aci · t∗ci (6)
The effective atmospheric transmissivitiest∗s and t∗ciare computed from estimated transmissivities of ozone,Rayleigh, water vapour, carbon dioxide, aerosols, and low,middle and high-level clouds, as well as reflectivities ofsurface, clouds and Rayleigh, as given by Vardavas andKoutoulaki (1995).
3 The model data
3.1 Ozone, carbon dioxide and water vapour
The mean monthly 2.5-degree latitude-longitude grid celldata of the total O3 column abundance (in Dobson Units)covering the years 1984–2000, were taken from TOVS,archived in the ISCCP-D2 package. For CO2 a fixed to-tal atmospheric amount was taken, equal to 0.54 g cm−2,corresponding to 345 parts per million by volume (ppmv).The water vapour data used were taken from both theNCEP/NCAR and ECMWF Global Reanalysis Projects,which provide long-term climatological data. The layereddata for specific humidity and atmospheric temperature wereused to compute the total atmospheric water vapour content,WH2O. Relative humidity data were also used to compute thehumidity of the aerosol layer. The differences, arising fromthe use of the two data sets, in terms of surface SW radia-tive fluxes were found to be small (mostly within 1–2 Wm−2
at grid cell level), as discussed in Sect. 5. Therefore, in thisstudy we only show DSR fluxes computed by using watervapour data taken from NCEP/NCAR Reanalysis.
3.2 Clouds
Mean monthly cloud properties on 2.5-degree equal-anglegrid cell resolution for the study period (1984–2000) weretaken from the latest D2 stage data of ISCCP (Rossow et al.,1996; Rossow and Schiffer, 1999). Cloud properties are pro-vided from ISCCP for nine (9) cloud types which are groupedinto three categories: low-level clouds having top pressuresgreater than or equal to 680 mbar, high-level clouds with top
Atmos. Chem. Phys., 5, 2847–2867, 2005 www.atmos-chem-phys.org/acp/5/2847/
N. Hatzianastassiou et al.: Global distribution of Earth’s surface shortwave radiation budget 2851
pressures less than 440 mbar and mid-level clouds in between(Rossow et al., 1996). Low-level clouds are considered to beCu, St and Sc clouds. The middle ones include Ac, As andNs, while Ci, Cs and deep-convective clouds are consideredas high-level clouds. High clouds are treated as cold clouds,while each of the above low and middle clouds are subdi-vided into liquid- or ice-phase clouds, resulting in 15 cloudtypes for which properties such as cloud cover, cloud op-tical thickness, cloud-top temperature and pressure, as wellas liquid or ice water path are provided by ISCCP-D2. Thevalues for the 15 independent cloud types were then appro-priately averaged (see Hatzianastassiou and Vardavas, 1999)to yield data for low, mid and high-level clouds needed byour model. Note that in our study, the ISCCP-D2 individ-ual cloud data are used, which are derived by using the vis-ible/infrared (VIS/IR) analysis, rather than the low, mid andhigh-level cloud data, also provided by ISCCP-D2, which arederived by using the IR-only analysis. This was done becausethe combined VIS/IR analysis is superior to the IR-only dur-ing daytime (Rossow et al., 1996), and thus is more appropri-ate for SW radiation budget studies. The VIS/IR (individual)cloud data were found to dramatically improve the model re-sults at both TOA and surface, in terms of comparison withERBE-S4 satellite and BSRN and GEBA site measurements,respectively.
The total cloud cover fraction,Ac, is calculated from thesum of fractions,Aci , for low, middle and high clouds
Ac =
∑i
Aci (7)
Cloud optical thickness values for low, mid, and high-levelclouds were calculated from corresponding values for indi-vidual clouds, as described in Hatzianastassiou and Vardavas(1999). For the computation of the cloud SW transmissivityand reflectivity, the model also requires cloud absorption op-tical depth,τ a
c , cloud scattering optical depth,τ sc , and cloud
asymmetry parameter,gc. ISCCP-D2 provides, however,τ sc
only at the visible wavelength 0.6µm. Theτ sc (near-IR) and
τ ac (near-IR) values were derived by using either Mie com-
putations or existing parameterisations (Slingo, 1989; Ebertand Curry, 1992) for ISCCP-D2 liquid and ice clouds, byassuming the appropriate ISCCP-D2 cloud microphysics, asexplained in detail by Hatzianastassiou et al. (2004a). Themodel required values ofgc, not provided by ISCCP, mustdiffer between liquid and ice clouds (Liou, 2002). Thus, val-ues ofgc were computed separately for liquid and ice clouds,for both UV-visible and near-IR range of wavelengths, byusing both Mie computations and parameterisations, as ex-plained by Hatzianastassiou et al. (2004a). The computedgc
values in the UV-visible are equal to 0.85 and 0.78 for liquidand ice clouds, respectively, while the corresponding valuesin the near-IR range are equal to 0.82 and 0.8.
3.3 Rayleigh scattering, surface reflection and aerosol par-ticles
Rayleigh scattering is considered in the model as describedin Vardavas and Koutoulaki (1995). The surface reflectionis computed with the model at each grid cell for each monthin the period 1984–2000, by considering four types of sur-face: land, ocean, snow, and ice (frozen ocean). Informa-tion on spatial and temporal variation of the fractional cov-erage of the Earth’s surface by each type, was taken fromISCCP-D2. The radiative effect of aerosols is computed withour model by using a modified two-stream approximation al-lowing for scattering and absorption in the UV-visible andnear-IR ranges of wavelength. Our model requires aerosoloptical properties, namely aerosol optical thickness (AOT),single scattering albedo (ωaer), and asymmetry parameter(gaer). Currently, there is no data base providing such aerosoldata for the whole study period 1984–2000 on a globalscale. There are new satellite-based instruments (e.g. Mod-erate Resolution Imaging Spectro-Radiometer, MODIS, orPolarization and Directionality of the Earth’s Reflectance,POLDER) performing accurate spectral aerosol measure-ments on a global scale, but they have only started their op-eration from year 2001. There are some AOT data for thewhole period from the Global Aerosol Climatology Project(GACP), but without global coverage as they only cover theocean areas. On the other hand, there are AOT data withglobal coverage from the Total Ozone Mapping Spectrometer(TOMS, Torres et al., 2002), but noωaer, and gaer data. Newre-processed AOT data from TOMS, includingωaerdata, thatwill cover the period 1979–2000 will be released by NASAGoddard Space Flight Center (GSFC). In the meantime, as afirst step, the model-required aerosol data were derived fromthe Global Aerosol Data Set (GADS, Koepke et al., 1997).GADS provides AOT,ωaer, andgaer data, at 61 wavelengthsfrom 0.25 to 40µm, 27 of which lie in the SW range, andfor 8 values of relative humidity (0, 50, 70, 80, 90, 95, 98,and 99%). Given the strong dependence of aerosol opticalproperties on ambient relative humidity, the original GADSproperties were then re-computed in a realistic way, for ac-tual relative humidity values for the aerosol layer, as ex-plained in detail by Hatzianastassiou et al. (2004b) for eachmonth in the period from January 1984 to December 2000.Subsequently, the computed values of aerosol optical prop-erties were averaged into the UV-visible and near-IR ranges,weighted by the spectral distribution of the incoming solarflux (Thakaekara and Drummond, 1971). Note that there isuncertainty in terms of seasonal variation of the aerosol effecton DSR, due to the limitations of GADS, providing nominalaerosol optical properties for two seasons, i.e. winter andsummer. A complete description of the treatment of aerosolsin the model, as well as of GADS aerosol data, can be foundin the work by Hatzianastassiou et al. (2004b).
www.atmos-chem-phys.org/acp/5/2847/ Atmos. Chem. Phys., 5, 2847–2867, 2005
2852 N. Hatzianastassiou et al.: Global distribution of Earth’s surface shortwave radiation budget
(a) (b)
(c) (d)
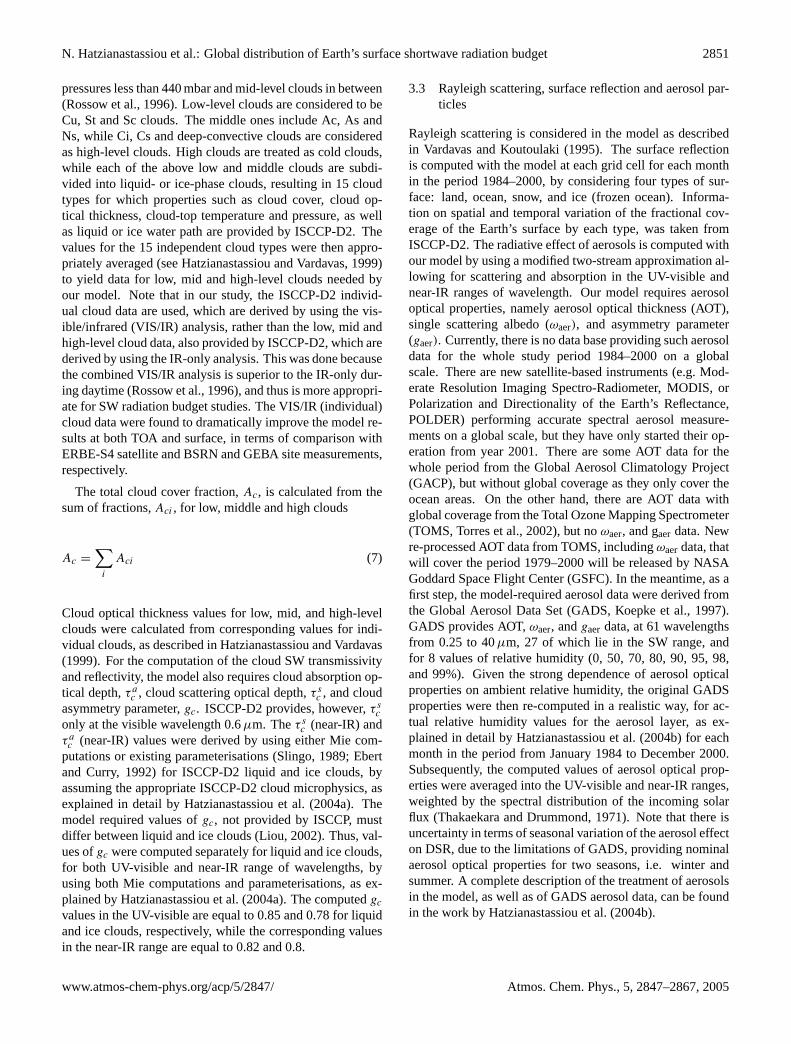
Fig. 1. Long-term (1984–2000) average global distribution of downward shortwave radiation (in Wm−2) at the Earth’s surface for themid-seasonal months of(a) January,(b) April, (c) July, and(d) October.
3.4 Cloud-top pressure, cloud physical thickness and sur-face pressure
The cloud-top pressure,pc, and physical thickness,dpc, bothdetermine the atmospheric layer where water vapour absorp-tion is replaced by cloud scattering and absorption. Valuesof pc were taken from ISCCP-D2 for low, mid, and high-level clouds. The ISCCP-D2 does not providedpc data, sothese were estimated from Peng et al. (1982) for the NorthernHemisphere, as explained in the work by Hatzianastassiouand Vardavas (1999), whiledpc values for Southern Hemi-sphere were estimated in the way described by Hatzianas-tassiou and Vardavas (2001), by combining the values fromPeng et al. and those derived from Liou (1992). A completetopography scheme (which is important for regions with highaltitude, such as the Tibetan plateau, Antarctica, Rocky orthe Andes mountains) is included in the model, which usessurface pressure,ps , data taken either from NCEP/NCAR or
from ECMWF Global Reanalysis Projects gridded in 2.5◦ by2.5◦ cells for each month of the 17-year period 1984–2000.
4 Model results
4.1 Seasonal and geographical distributions
The latitudinal gradient of the 17-year average downwardSW radiation (DSR) at the Earth’s surface is primarily deter-mined by the incoming solar flux at TOA, while the patternsof longitudinal variation are mostly determined by cloud andsurface properties. Therefore, large DSR fluxes are foundin polar regions (Figs. 1a, c) during local summer, equal toabout 300–350 Wm−2 over Antarctica in January and 200–250 Wm−2 over the Arctic in July. Our values are lower thanthose given by Gupta et al. (1999), which are equal to 400–450 Wm−2 in Antarctica and 250–300 Wm−2 in the Arctic.Note, however, that Gupta et al. (1999) used ISCCP C-series
Atmos. Chem. Phys., 5, 2847–2867, 2005 www.atmos-chem-phys.org/acp/5/2847/

N. Hatzianastassiou et al.: Global distribution of Earth’s surface shortwave radiation budget 2853
(a) (b)
(c) (d)
Fig. 2. Long-term (1984–1997) average global distribution of net downward (or absorbed) shortwave radiation (in Wm−2) at the Earth’ssurface for the mid-seasonal months of(a) January,(b) April, (c) July, and(d) October.
data to derive a 8-year (1983–1991) SRB against our 17-year(1984–2000) averages. The larger values over Antarcticathan the Arctic are due to the larger incoming solar radia-tion at TOA during perihelion (>500 Wm−2), but also to thesmaller ISCCP-D2 summer cloudiness in Antarctica than inthe Arctic (≈20% against≈60%, respectively). There is agradual DSR decrease from the summer to winter pole inJanuary and July, leading to zero values poleward of mid-to-high latitudes. The white areas in Fig. 1 correspond to miss-ing ISCCP model input data, but they do not affect our resultssince they coincide with polar night conditions. The latitu-dinal gradient of DSR is mitigated during spring and autumn(Figs. 1b, d). Overall, the DSR has maximum values overthe subsidence regions associated with anticyclonic condi-tions and small cloud amounts, such as oceanic areas in lowlatitudes of the summer hemisphere, as well as over the polarareas of the summer hemisphere. In contrast, small DSR val-ues are found over regions with large cloud amounts, such
as the middle latitudes of the summer hemisphere. Thus,DSR values as low as 140 Wm−2 are found over the storm-track zone of southern hemisphere (50◦–70◦ S) in January,whereas values down to about 100 Wm−2 are computed inOctober. Corresponding features, with DSR values equal to100–140 Wm−2 in April and July, exist over northern Pa-cific Ocean’s areas with large cloud amounts (equal to about90%). In general, there is a strong anti-correlation betweenDSR and cloud amount. Note the small DSR values off thewestern coasts of South America and South Africa in July,being smaller than corresponding DSR fluxes in adjacent re-gions of the same latitude, which are attributed to large cloudamounts (of about 80%). Also, note the relatively small DSRvalues over south-eastern Asia in July (≈150 Wm−2), wherelarge cloud cover (≈80%) exists, associated with monsoons.Apart from oceanic areas, there are some extended continen-tal regions with large DSR values, such as the United States,South Europe, North Africa and middle-East in April and
www.atmos-chem-phys.org/acp/5/2847/ Atmos. Chem. Phys., 5, 2847–2867, 2005

2854 N. Hatzianastassiou et al.: Global distribution of Earth’s surface shortwave radiation budget
(a)
56
JAN
FEB
MAR
APR
MAY
JUN
JUL
AUG
SEP
OCT
NOV
DEC
0
20
60
80
40
-20
-40
-60
-80
Latit
ude
(°)
JAN
FEB
MAR
APR
MAY
JUN
JUL
AUG
SEP
OCT
NOV
DEC
0
20
60
80
40
-20
-40
-60
-80
Latit
ude
(°)
(a)
JAN
FEB
MAR
APR
MAY
JUN
JUL
AUG
SEP
OCTNOV
DEC
0
20
60
80
40
-20
-40
-60
-80
Latit
ude
(°)
JAN
FEB
MAR
APR
MAY
JUN
JUL
AUG
SEP
OCTNOV
DEC
0
20
60
80
40
-20
-40
-60
-80
Latit
ude
(°)
(b)
Figure 3. Seasonal and latitudinal variation of 17-year (1984-2000) averages of monthly
mean (a) downward shortwave radiation (DSR) at the Earth’s surface and (b) net
downward shortwave radiation (Net DSR) at the Earth’s surface. Monthly mean quantities
over a 2.5°x2.5° geographical grid are plotted.
(b)
56
JAN
FEB
MAR
APR
MAY
JUN
JUL
AUG
SEP
OCT
NOV
DEC
0
20
60
80
40
-20
-40
-60
-80
Latit
ude
(°)
JAN
FEB
MAR
APR
MAY
JUN
JUL
AUG
SEP
OCT
NOV
DEC
0
20
60
80
40
-20
-40
-60
-80
Latit
ude
(°)
(a)
JAN
FEB
MAR
APR
MAY
JUN
JUL
AUG
SEP
OCTNOV
DEC
0
20
60
80
40
-20
-40
-60
-80
Latit
ude
(°)
JAN
FEB
MAR
APR
MAY
JUN
JUL
AUG
SEP
OCTNOV
DEC
0
20
60
80
40
-20
-40
-60
-80
Latit
ude
(°)
(b)
Figure 3. Seasonal and latitudinal variation of 17-year (1984-2000) averages of monthly
mean (a) downward shortwave radiation (DSR) at the Earth’s surface and (b) net
downward shortwave radiation (Net DSR) at the Earth’s surface. Monthly mean quantities
over a 2.5°x2.5° geographical grid are plotted.
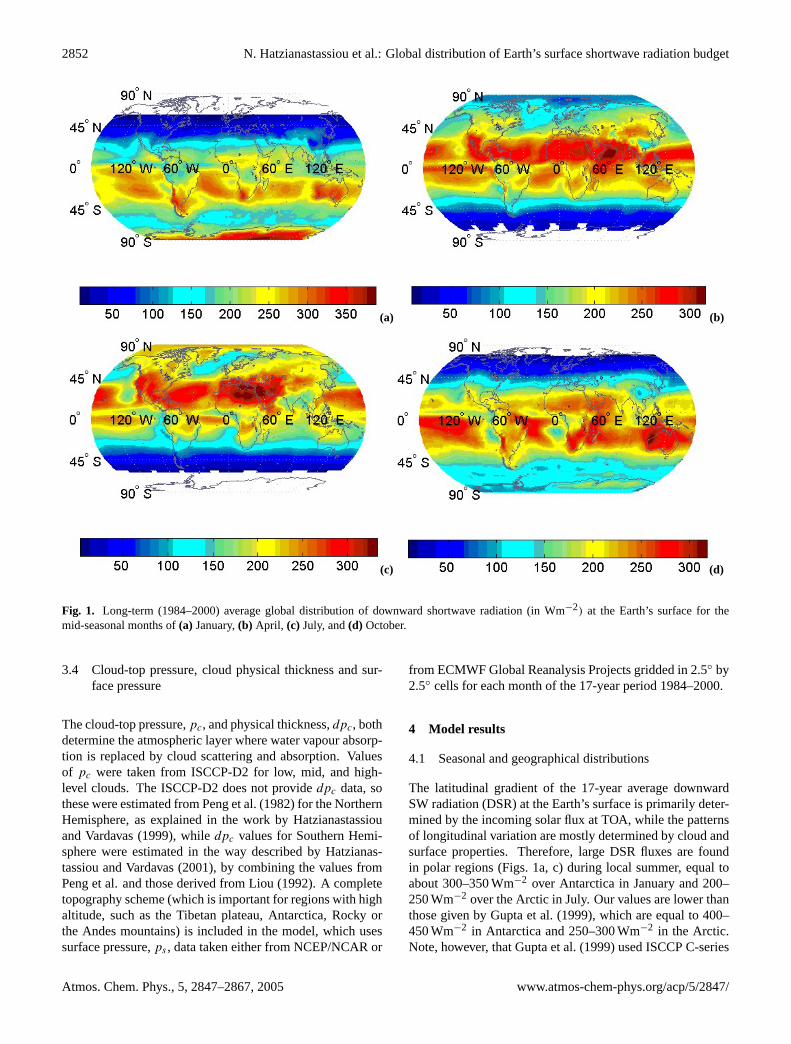
Fig. 3. Seasonal and latitudinal variation of 17-year (1984-2000) averages of monthly mean(a) downward shortwave radiation(DSR) at the Earth’s surface and(b) net downward shortwave ra-diation (Net DSR) at the Earth’s surface. Monthly mean quantitiesover a 2.5◦×2.5◦ geographical grid are plotted.
July, or South America, South Africa and Australia in Jan-uary and October. In general, the distribution of DSR hassimilar patterns with the outgoing SW radiation (OSR) atTOA (see Hatzianastassiou et al., 2004a), but with inversedminimum/maximum values.
The net DSR fluxes, given in Figs. 2a–d, are similar to theDSR fluxes. Over oceanic areas, with a small albedo, thedifferences are quite small, while the most important differ-ences are found over the highly reflecting surfaces, such asdeserts or snow- and ice-covered polar areas, having surfacealbedo values reaching 40 and 95%, respectively, leadingthus to small net DSR values (<100 Wm−2) over Antarcticain January and the Arctic in July. This is clearly illustratedby a comparison between the north African desert and theadjacent Mediterranean Sea for July (Fig. 2c), which showsdifferences of about 125–150 Wm−2, while there are no sig-nificant differences in DSR fluxes (Fig. 1c).
Latitude zonal averages, over the 17-year period, ofmonthly mean DSR and net DSR fluxes (Figs. 3a, b), showthat DSR fluxes vary from zero to 375 Wm−2, having max-ima over sub-tropical and polar areas of both hemispheresin summer, of about 310 and 370 Wm−2, respectively. Themaximum values at the South Pole are slightly larger thanthose of the North Pole, due to the slightly smaller Earth-Sundistance, smaller cloudiness and drier atmosphere. Smallseasonal variations exist in the tropics, where weak seasonalvariation in solar declination and cloudiness occur. The sea-sonal variability of DSR increases towards the poles, whereit can be up to 375 Wm−2. Large DSR values are found innorthern hemispherical areas extending from the equator tothe North Pole in July, whilst in the southern hemispherein January, there are relatively smaller DSR fluxes of about150 Wm−2 from 50◦ S to 70◦ S, due to large cloudiness alongthe storm-track zone of South Hemisphere. In both hemi-spheres, the maximum of DSR values occur in sub-tropicalareas (between 10 and 35◦ of latitude) rather than in the trop-ics, apart from the poles. This is due to the fact that to-tal cloudiness has minimum values (of about 50%) over theabove sub-tropical areas, and not along the equator, wherethe ITCZ involves total cloud cover values of about 60–70%,according to the ISCCP-D2 data. Our computed zonally av-eraged DSR values agree with the corresponding 8-year aver-ages given by Gupta et al. (1999), but they are smaller in thepolar areas by 30–80 Wm−2. In the tropics, (20◦ S–20◦ N),maximum DSR values occur during spring and autumn, andnot in summer as in sub-tropical, mid-latitude and polar ar-eas. This behaviour, which has been also reported by Darnellet al. (1992) and Hatzianastassiou and Vardavas (1999), is at-tributed to maximum values in the incoming solar radiationat TOA during these seasons over the tropics, as well as torelevant features in the annual cycle of cloudiness and totalprecipitable water. Our maximum DSR and net DSR valuesin tropical and sub-tropical areas (20◦ S–20◦ N) are slightlylarger (by ≈10 Wm−2) than those given by Hatzianastas-siou and Vardavas (1999) and even larger than those of Var-davas and Koutoulaki (1995), while over Antarctica they aresmaller than those given by Hatzianastassiou and Vardavas(2001) by 20–30 Wm−2. The zonally averaged values pre-sented here, however, are more reliable, since the earlier oneswere computed using zonal averages of model input data toproduce zonal mean fluxes, rather than grid cell-level inputdata. The net DSR fluxes (Fig. 3b) are quite similar to theDSR ones, but there are also some differences. Thus, thepolar areas do not show maxima in net DSR fluxes, whilethere is a significant inter-hemispherical contrast in terms ofthe magnitude of summer sub-tropical maximum net DSRvalues, due to the smaller surface albedo of the South Hemi-sphere (smaller land-to-sea ratio).
Atmos. Chem. Phys., 5, 2847–2867, 2005 www.atmos-chem-phys.org/acp/5/2847/
N. Hatzianastassiou et al.: Global distribution of Earth’s surface shortwave radiation budget 2855
(a)
57
0
20
60
80
40
-20
-40
-60
-80
Latit
ude
(°)
Jan-
1984
Jan-
1985
Jan-
1986
Jan-
1987
Jan-
1988
Jan-
1989
Jan-
1990
Jan-
1991
Jan-
1992
Jan-
1993
Jan-
1994
Jan-
1995
Jan-
1996
Jan-
1997
Jan-
1998
Jan-
1999
Jan-
2000
0
20
60
80
40
-20
-40
-60
-80
Latit
ude
(°)
Jan-
1984
Jan-
1985
Jan-
1986
Jan-
1987
Jan-
1988
Jan-
1989
Jan-
1990
Jan-
1991
Jan-
1992
Jan-
1993
Jan-
1994
Jan-
1995
Jan-
1996
Jan-
1997
Jan-
1998
Jan-
1999
Jan-
2000
(a)
0
20
60
80
40
-20
-40
-60
-80
Latit
ude
(°)
Jan-
1984
Jan-
1985
Jan-
1986
Jan-
1987
Jan-
1988
Jan-
1989
Jan-
1990
Jan-
1991
Jan-
1992
Jan-
1993
Jan-
1994
Jan-
1995
Jan-
1996
Jan-
1997
Jan-
1998
Jan-
1999
Jan-
2000
0
20
60
80
40
-20
-40
-60
-80
Latit
ude
(°)
Jan-
1984
Jan-
1985
Jan-
1986
Jan-
1987
Jan-
1988
Jan-
1989
Jan-
1990
Jan-
1991
Jan-
1992
Jan-
1993
Jan-
1994
Jan-
1995
Jan-
1996
Jan-
1997
Jan-
1998
Jan-
1999
Jan-
2000
(b)
Figure 4. Time-series of 10-degree latitude-zonal averages of monthly mean (a)
downward shortwave radiation (DSR) at the Earth’s surface and (b) net downward
shortwave radiation (Net DSR) at the Earth’s surface, for the period January 1984 –
December 2000. Monthly mean quantities over a 2.5°x2.5° geographical grid are used.
(b)
57
0
20
60
80
40
-20
-40
-60
-80
Latit
ude
(°)
Jan-
1984
Jan-
1985
Jan-
1986
Jan-
1987
Jan-
1988
Jan-
1989
Jan-
1990
Jan-
1991
Jan-
1992
Jan-
1993
Jan-
1994
Jan-
1995
Jan-
1996
Jan-
1997
Jan-
1998
Jan-
1999
Jan-
2000
0
20
60
80
40
-20
-40
-60
-80
Latit
ude
(°)
Jan-
1984
Jan-
1985
Jan-
1986
Jan-
1987
Jan-
1988
Jan-
1989
Jan-
1990
Jan-
1991
Jan-
1992
Jan-
1993
Jan-
1994
Jan-
1995
Jan-
1996
Jan-
1997
Jan-
1998
Jan-
1999
Jan-
2000
(a)
0
20
60
80
40
-20
-40
-60
-80
Latit
ude
(°)
Jan-
1984
Jan-
1985
Jan-
1986
Jan-
1987
Jan-
1988
Jan-
1989
Jan-
1990
Jan-
1991
Jan-
1992
Jan-
1993
Jan-
1994
Jan-
1995
Jan-
1996
Jan-
1997
Jan-
1998
Jan-
1999
Jan-
2000
0
20
60
80
40
-20
-40
-60
-80
Latit
ude
(°)
Jan-
1984
Jan-
1985
Jan-
1986
Jan-
1987
Jan-
1988
Jan-
1989
Jan-
1990
Jan-
1991
Jan-
1992
Jan-
1993
Jan-
1994
Jan-
1995
Jan-
1996
Jan-
1997
Jan-
1998
Jan-
1999
Jan-
2000
(b)
Figure 4. Time-series of 10-degree latitude-zonal averages of monthly mean (a)
downward shortwave radiation (DSR) at the Earth’s surface and (b) net downward
shortwave radiation (Net DSR) at the Earth’s surface, for the period January 1984 –
December 2000. Monthly mean quantities over a 2.5°x2.5° geographical grid are used.
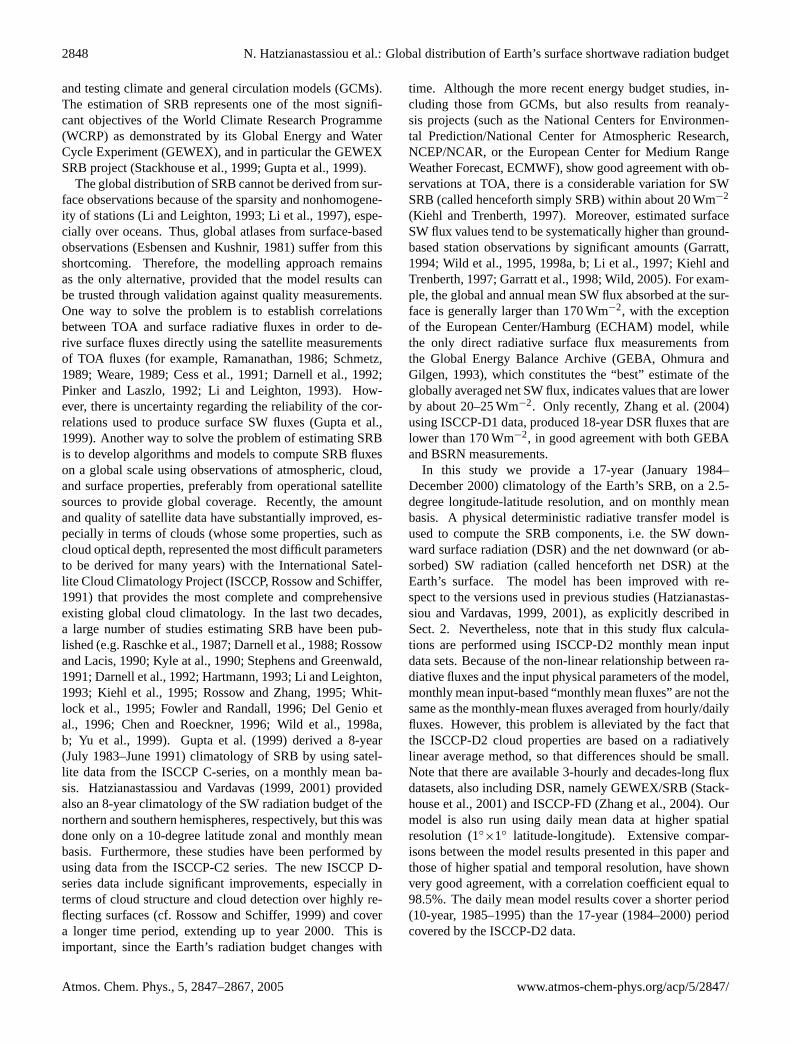
Fig. 4. Time-series of 10-degree latitude-zonal averages of monthlymean(a) downward shortwave radiation (DSR) at the Earth’s sur-face and(b) net downward shortwave radiation (Net DSR) at theEarth’s surface, for the period January 1984 – December 2000.Monthly mean quantities over a 2.5◦
×2.5◦ geographical grid areused.
4.2 Time series
The time series of global zonally averaged monthly meanDSR and net DSR fluxes over the entire 204-month period1984–2000 indicate that the patterns shown in Fig. 3 are re-peated over the 17-year period (Fig. 4). Thus, maximumDSR values of about 260–280 Wm−2 occur over sub-tropicalregions (10◦–40◦ N and S) during local summer, whereasmaximum values are also found in polar areas during sum-mer, which are slightly larger in the southern than northernpole. Local minimum values of about 200 Wm−2 are foundin equatorial areas, induced by the ITCZ cloudiness, as wellas over both hemispherical middle-to-high latitudes (around60◦ N and S), due to the large stratiform cloud amounts over
(a)
(b)
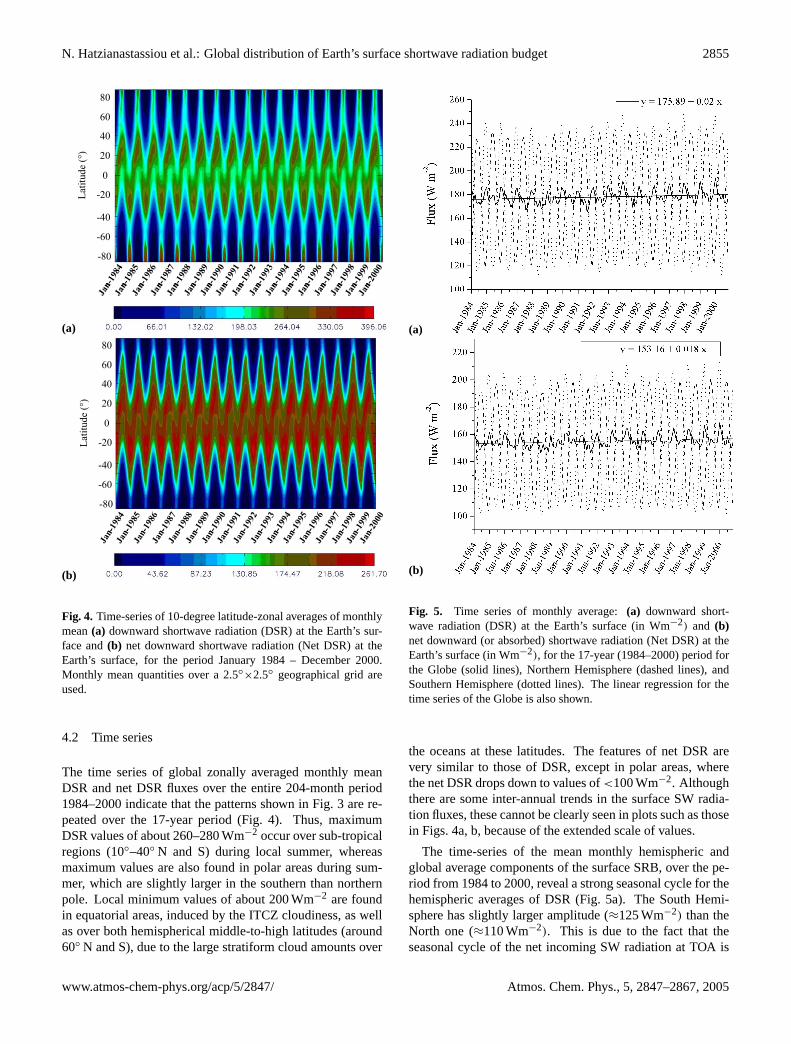
Fig. 5. Time series of monthly average:(a) downward short-wave radiation (DSR) at the Earth’s surface (in Wm−2) and (b)net downward (or absorbed) shortwave radiation (Net DSR) at theEarth’s surface (in Wm−2), for the 17-year (1984–2000) period forthe Globe (solid lines), Northern Hemisphere (dashed lines), andSouthern Hemisphere (dotted lines). The linear regression for thetime series of the Globe is also shown.
the oceans at these latitudes. The features of net DSR arevery similar to those of DSR, except in polar areas, wherethe net DSR drops down to values of<100 Wm−2. Althoughthere are some inter-annual trends in the surface SW radia-tion fluxes, these cannot be clearly seen in plots such as thosein Figs. 4a, b, because of the extended scale of values.
The time-series of the mean monthly hemispheric andglobal average components of the surface SRB, over the pe-riod from 1984 to 2000, reveal a strong seasonal cycle for thehemispheric averages of DSR (Fig. 5a). The South Hemi-sphere has slightly larger amplitude (≈125 Wm−2) than theNorth one (≈110 Wm−2). This is due to the fact that theseasonal cycle of the net incoming SW radiation at TOA is
www.atmos-chem-phys.org/acp/5/2847/ Atmos. Chem. Phys., 5, 2847–2867, 2005

2856 N. Hatzianastassiou et al.: Global distribution of Earth’s surface shortwave radiation budget
larger in the South Hemisphere (≈300 Wm−2) than in theNorth one (≈250 Wm−2). Another reason is that, as shownby our analysis using both NCEP/NCAR and ECMWF data,the total precipitable water of the Northern Hemisphereshows a stronger seasonal cycle than that of the SouthernHemisphere, with very large values (up to≈3.2 g cm−2) inJuly, against values of about 2.8 g cm−2 in the South Hemi-sphere, as also reported by Wittmeyer and Vonder Haar(1994). Therefore, the summer-maximum of DSR in theSouth Hemisphere reaches about 240 Wm−2, against 230Wm−2 in the North one. The hemispherical DSR averagesbalance each other to produce a monthly mean global aver-age DSR with a small seasonal variability (≈10–20 Wm−2),with primary and secondary maxima and minima. The ap-plied linear regression to the mean global DSR 17-year time-series, shows an increasing trend in DSR, equal to 4.1 Wm−2
over the time period 1984–2000, which is equivalent to adecadal increasing trend of 2.4 Wm−2. This increasing trendin DSR is associated with a 17-year decreasing trend in thereflected outgoing SW radiation (OSR) at TOA, equal to3.2 Wm−2, as shown by Hatzianastassiou et al. (2004a). Notethat Pinker et al. (2005), using a model with satellite records,estimated a global increase in DSR from 1983 to 2001 at arate of 1.6 Wm−2 per decade, slightly smaller than ours. Ouranalysis has shown that the trends in both DSR and OSRare statistically significant with a confidence level of 99%.These trends are not attributed to the incoming SW radia-tion at TOA, since the latter shows an insignificant trend of0.1 Wm−2, but they are attributed to internal physical pro-cesses of the Earth-atmosphere system. Apart from DSR, thenet DSR flux has also increased by 3.7 Wm−2 over the 17-year period from 1984 to 2000 (or by 2.2 Wm−2 on a decadalscale). Note that there is uncertainty in the computed trendsin DSR and net DSR, associated with corresponding uncer-tainties in model input data, especially of clouds. However,based on the reported uncertainties of the ISCCP-D2 data(see Rossow and Schiffer, 1999), and the model sensitivitytests (see, Sect. 5, Table 3) in terms of DSR and net DSRfluxes, the computed trends are larger than the uncertaintiesinduced by the model input data.
We have performed an analysis that shows that the increas-ing trend in global mean DSR arises, to a large extent, intropical and sub-tropical areas. Therefore, our study indi-cates that the change in tropical SW radiation budget at TOA(increasing planetary heating), indicated by both satellite ob-servations (Wielicki et al., 2002) and model computations(Hatzianastassiou et al., 2004a; Fotiadi et al., 2005) is as-sociated with a significant increasing surface solar radiativeheating, involving enhancements in both downward and ab-sorbed solar radiation at the Earth’s surface, especially inlow latitudes. It should be noted that since the long-termincrease in net DSR (3.7 Wm−2) exceeds the correspond-ing long-term decrease in OSR (3.2 Wm−2), there must bea long-term decrease in SW atmospheric absorption (cool-ing) by 0.5 Wm−2, verified by our study. Overall, our mod-
elling study indicates that over the 17-year period from 1984to 2000, a significant change in the SW radiation budget hastaken place, consisting in a planetary solar heating, result-ing from a stronger surface solar heating combined with asmaller atmospheric solar cooling. This should have affectedthe atmospheric dynamics by strengthening the Hadley andWalker circulations (Chen et al., 2002), altering the atmo-spheric temperature gradient and the formation of clouds andprecipitation. Of course, further and more detailed investiga-tions are necessary to draw definite conclusions. For exam-ple, the model results, in terms of DSR and net DSR trends,have to be inter-compared with corresponding trends in sta-tion measurements, and a relevant work is in preparation.Note that Wild et al. (2005) report a reversal from global dim-ming (i.e. decreasing DSR) up to 1990, to widespread bright-ening (i.e. increasing DSR) since the late 1980s, based onavailable GEBA and BSRN surface observations, in agree-ment with our results. The reasons of the apparent increas-ing trend in DSR need to be more thoroughly investigated.A preliminary analysis was performed, in which the correla-tion coefficients between long-term tendencies in DSR andvarious physical parameters that determine DSR, were com-puted. In our model these parameters are: cloud (low, middleand high-level) cover, cloud scattering and absorption opticaldepths, surface albedo, total precipitable water, total columnO3 concentration and incoming SW radiation at TOA. Theresults of our analysis show that a decrease in cloud cover,especially low-level, is primarily responsible for the increas-ing trend in DSR. We have also performed another study inwhich we have computed the contribution of each one of theabove relevant physical parameters to the computed trendsin DSR and net DSR, as in the works by Hatzidimitriou etal. (2004) and Fotiadi et al. (2005). The results of this anal-ysis show that about 70% of the total trend in surface solarradiation comes from the low-level clouds. The results ofthese preliminary analyses are in line with similar studiesperformed to investigate the physical sources of the corre-sponding decreasing trend in OSR (Hatzianastassiou et al.,2004a).
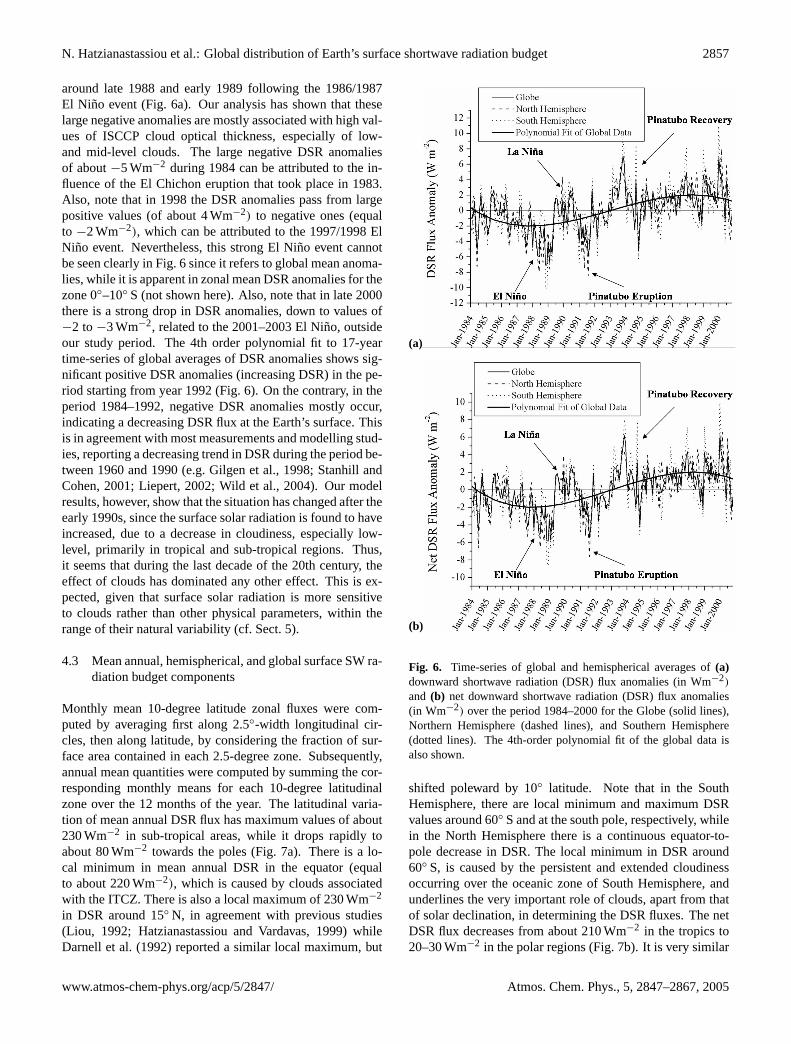
The computed anomalies in hemispherical mean DSRfluxes over the 17-year period (1984–2000), vary from−9to 9 Wm−2 (Fig. 6a), while the global mean DSR anomalyhas variations of up to 6 Wm−2, about the 17-year meanvalue. Large negative anomalies, i.e. decreased SW radia-tion reaching the Earth’s surface, are found for the period1991–1993, which can be attributed to the Mount Pinatuboeruption in June 1991, and to the 1991/1992 El Nino event.During the same period, the outgoing SW radiation has dras-tically increased by about 4 Wm−2 (see Hatzianastassiou etal., 2004a). The induced rapid decrease in DSR is followedby a recovery period, with positive DSR anomalies through1994. There are also other interesting features correspondingto climatic events, such as El Nino and La Nina, associatedwith negative and positive DSR anomalies, respectively. Forexample, negative DSR anomalies as large as 6 Wm−2 occur
Atmos. Chem. Phys., 5, 2847–2867, 2005 www.atmos-chem-phys.org/acp/5/2847/
N. Hatzianastassiou et al.: Global distribution of Earth’s surface shortwave radiation budget 2857
around late 1988 and early 1989 following the 1986/1987El Nino event (Fig. 6a). Our analysis has shown that theselarge negative anomalies are mostly associated with high val-ues of ISCCP cloud optical thickness, especially of low-and mid-level clouds. The large negative DSR anomaliesof about−5 Wm−2 during 1984 can be attributed to the in-fluence of the El Chichon eruption that took place in 1983.Also, note that in 1998 the DSR anomalies pass from largepositive values (of about 4 Wm−2) to negative ones (equalto −2 Wm−2), which can be attributed to the 1997/1998 ElNino event. Nevertheless, this strong El Nino event cannotbe seen clearly in Fig. 6 since it refers to global mean anoma-lies, while it is apparent in zonal mean DSR anomalies for thezone 0◦–10◦ S (not shown here). Also, note that in late 2000there is a strong drop in DSR anomalies, down to values of−2 to −3 Wm−2, related to the 2001–2003 El Nino, outsideour study period. The 4th order polynomial fit to 17-yeartime-series of global averages of DSR anomalies shows sig-nificant positive DSR anomalies (increasing DSR) in the pe-riod starting from year 1992 (Fig. 6). On the contrary, in theperiod 1984–1992, negative DSR anomalies mostly occur,indicating a decreasing DSR flux at the Earth’s surface. Thisis in agreement with most measurements and modelling stud-ies, reporting a decreasing trend in DSR during the period be-tween 1960 and 1990 (e.g. Gilgen et al., 1998; Stanhill andCohen, 2001; Liepert, 2002; Wild et al., 2004). Our modelresults, however, show that the situation has changed after theearly 1990s, since the surface solar radiation is found to haveincreased, due to a decrease in cloudiness, especially low-level, primarily in tropical and sub-tropical regions. Thus,it seems that during the last decade of the 20th century, theeffect of clouds has dominated any other effect. This is ex-pected, given that surface solar radiation is more sensitiveto clouds rather than other physical parameters, within therange of their natural variability (cf. Sect. 5).
4.3 Mean annual, hemispherical, and global surface SW ra-diation budget components
Monthly mean 10-degree latitude zonal fluxes were com-puted by averaging first along 2.5◦-width longitudinal cir-cles, then along latitude, by considering the fraction of sur-face area contained in each 2.5-degree zone. Subsequently,annual mean quantities were computed by summing the cor-responding monthly means for each 10-degree latitudinalzone over the 12 months of the year. The latitudinal varia-tion of mean annual DSR flux has maximum values of about230 Wm−2 in sub-tropical areas, while it drops rapidly toabout 80 Wm−2 towards the poles (Fig. 7a). There is a lo-cal minimum in mean annual DSR in the equator (equalto about 220 Wm−2), which is caused by clouds associatedwith the ITCZ. There is also a local maximum of 230 Wm−2
in DSR around 15◦ N, in agreement with previous studies(Liou, 1992; Hatzianastassiou and Vardavas, 1999) whileDarnell et al. (1992) reported a similar local maximum, but
(a)
(b)
Fig. 6. Time-series of global and hemispherical averages of(a)downward shortwave radiation (DSR) flux anomalies (in Wm−2)
and (b) net downward shortwave radiation (DSR) flux anomalies(in Wm−2) over the period 1984–2000 for the Globe (solid lines),Northern Hemisphere (dashed lines), and Southern Hemisphere(dotted lines). The 4th-order polynomial fit of the global data isalso shown.
shifted poleward by 10◦ latitude. Note that in the SouthHemisphere, there are local minimum and maximum DSRvalues around 60◦ S and at the south pole, respectively, whilein the North Hemisphere there is a continuous equator-to-pole decrease in DSR. The local minimum in DSR around60◦ S, is caused by the persistent and extended cloudinessoccurring over the oceanic zone of South Hemisphere, andunderlines the very important role of clouds, apart from thatof solar declination, in determining the DSR fluxes. The netDSR flux decreases from about 210 Wm−2 in the tropics to20–30 Wm−2 in the polar regions (Fig. 7b). It is very similar
www.atmos-chem-phys.org/acp/5/2847/ Atmos. Chem. Phys., 5, 2847–2867, 2005
2858 N. Hatzianastassiou et al.: Global distribution of Earth’s surface shortwave radiation budget
(a) (b)
(c) (d)
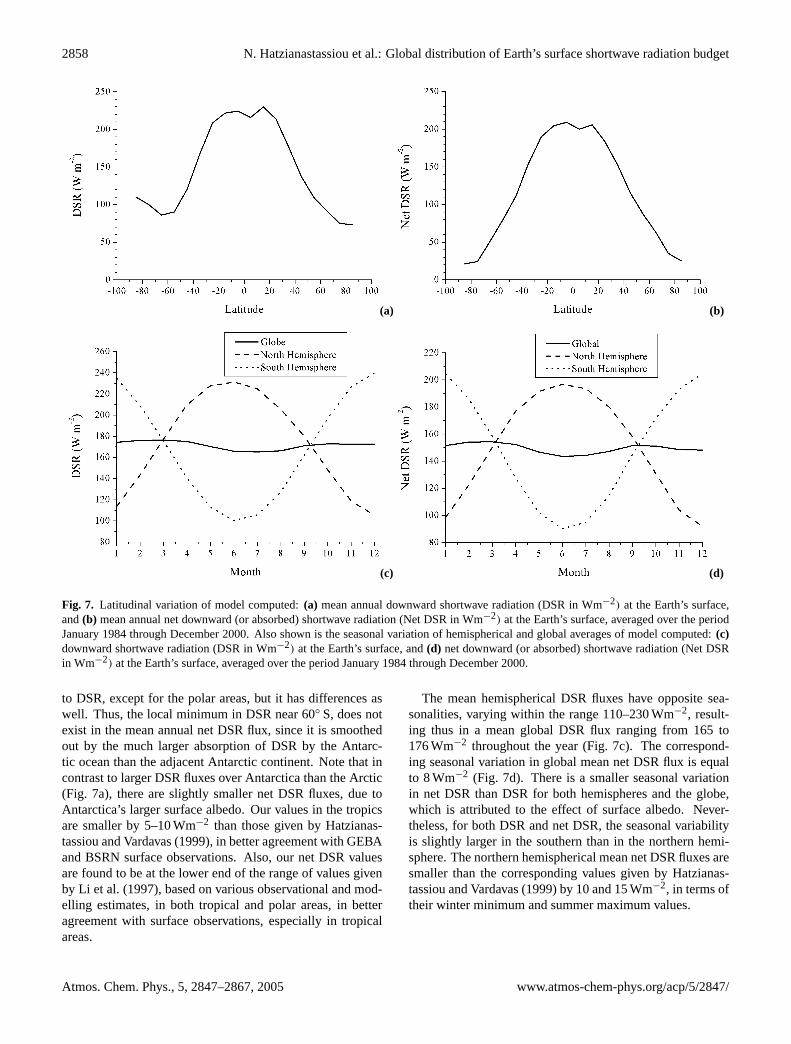
Fig. 7. Latitudinal variation of model computed:(a) mean annual downward shortwave radiation (DSR in Wm−2) at the Earth’s surface,and(b) mean annual net downward (or absorbed) shortwave radiation (Net DSR in Wm−2) at the Earth’s surface, averaged over the periodJanuary 1984 through December 2000. Also shown is the seasonal variation of hemispherical and global averages of model computed:(c)downward shortwave radiation (DSR in Wm−2) at the Earth’s surface, and(d) net downward (or absorbed) shortwave radiation (Net DSRin Wm−2) at the Earth’s surface, averaged over the period January 1984 through December 2000.
to DSR, except for the polar areas, but it has differences aswell. Thus, the local minimum in DSR near 60◦ S, does notexist in the mean annual net DSR flux, since it is smoothedout by the much larger absorption of DSR by the Antarc-tic ocean than the adjacent Antarctic continent. Note that incontrast to larger DSR fluxes over Antarctica than the Arctic(Fig. 7a), there are slightly smaller net DSR fluxes, due toAntarctica’s larger surface albedo. Our values in the tropicsare smaller by 5–10 Wm−2 than those given by Hatzianas-tassiou and Vardavas (1999), in better agreement with GEBAand BSRN surface observations. Also, our net DSR valuesare found to be at the lower end of the range of values givenby Li et al. (1997), based on various observational and mod-elling estimates, in both tropical and polar areas, in betteragreement with surface observations, especially in tropicalareas.
The mean hemispherical DSR fluxes have opposite sea-sonalities, varying within the range 110–230 Wm−2, result-ing thus in a mean global DSR flux ranging from 165 to176 Wm−2 throughout the year (Fig. 7c). The correspond-ing seasonal variation in global mean net DSR flux is equalto 8 Wm−2 (Fig. 7d). There is a smaller seasonal variationin net DSR than DSR for both hemispheres and the globe,which is attributed to the effect of surface albedo. Never-theless, for both DSR and net DSR, the seasonal variabilityis slightly larger in the southern than in the northern hemi-sphere. The northern hemispherical mean net DSR fluxes aresmaller than the corresponding values given by Hatzianas-tassiou and Vardavas (1999) by 10 and 15 Wm−2, in terms oftheir winter minimum and summer maximum values.
Atmos. Chem. Phys., 5, 2847–2867, 2005 www.atmos-chem-phys.org/acp/5/2847/

N. Hatzianastassiou et al.: Global distribution of Earth’s surface shortwave radiation budget 2859
The mean annual hemispherical and global average valuesover the 17-year period from 1984 to 2000, for the down-ward and net downward (i.e. absorbed) SW radiation at sur-face, along with corresponding values for the 4 mid-seasonalmonths of the year, are given in Table 1, while in Table 2, ourcomputed DSR and net DSR values are also intercomparedwith other published values. Note that very few other stud-ies give both SRB components for the two hemispheres andthe globe. On a 17-year basis, the Earth’s surface is foundto receive 171.6 Wm−2 and to absorb 149.4 Wm−2, result-ing in a long-term surface albedo equal to 12.9%. The inter-hemispherical differences are equal to 4.6 Wm−2 for DSRand only 0.3 Wm−2 for net DSR, implying slightly largernorthern than southern hemispherical surface solar radiativefluxes. Overall, according to our 17-year model results usingISCCP-D2 data, on a mean annual basis and at global scale,the Earth receives 50.2%, while it absorbs 43.7% of the in-coming SW radiation entering the Earth-atmosphere system.Our model-computed values are very close to those givenby surface observations (GEBA), with differences equal to2.6 and 1.6 Wm−2 for DSR and net DSR, respectively, whilethey are significantly smaller than most estimates from otherphysical deterministic models, GCMs and climatic models,as well as from reanalysis products, by up to 30 Wm−2.In contrast, our model results seem to be close to those ofthe ECHAM model and the recently published ISCCP-FDfluxes (Zhang et al., 2004), as well as those of ECMWF-ERA. Note that in previous SRB studies, a significant over-estimation of net DSR flux has been reported, with respectto the surface-based estimate given by Ohmura and Gilgen(1993), involving an uncertainty in the knowledge of SRB(Li et al., 1997; Kiehl and Trenberth, 1997) of about 20–25 Wm−2. This overestimation has been associated with ex-tra atmospheric solar absorption (by clouds or aerosols) asindicated by observational studies (Cess et al., 1995; Ra-manathan et al., 1995; Pilewski and Valero, 1995), but alsoverified by modelling studies (Garratt et al., 1998; Wild etal., 1998; Hinkelman et al., 1999). On the other hand, ithas been argued that the surface-based estimate by Ohmuraand Gilgen (1993) was probably too low, since it was derivedby measurements taken at a limited number of stations, usu-ally located over land areas (Kiehl and Trenberth, 1997) andespecially populated ones (Li et al., 1997). Since then, thenumber of stations involved in GEBA and BSRN networkshas increased, and their spatial coverage expanded to coverremote areas, such as Greenland and Antarctica. Recently,the “best” surface-based estimate of surface solar absorption(net DSR) has been revised to 151 Wm−2 for net DSR, closeto our model computed value of 149.4 Wm−2.
5 Sensitivity of surface SW radiation budget
The assessment and quantification of the role of variousphysical key parameters that determine the DSR and net DSR
Table 1. Model computed mean annual hemispherical (NH isNorthern Hemisphere, SH is Southern Hemisphere) and global av-erages of downward shortwave radiation (DSR) and net downwardshortwave radiation (net DSR) at the Earth’s surface for January,April, July, October, and the whole year, for the 17-year (1984–2000) period. The radiative fluxes are expressed in Wm−2. Num-bers in parenthesis are standard deviations and represent interannualvariabilities of the means.
NH SH Global
Downward Shortwave RadiationJanuary 113.8 (9.8) 234.8 (20.7) 174.3 (15.3)April 209.8 (16.5) 140.4 (11.5) 175.1 (14.0)July 224.8 (17.2) 105.6 (7.7) 165.2 (12.5)October 148.6 (12.0) 197.0 (16.6) 172.8 (14.3)Annual 173.9 (14.0) 169.3 (14.3) 171.6 (14.1)
Net Downward Shortwave RadiationJanuary 98.6 (2.7) 204.5 (6.5) 151.6 (4.6)April 177.0 (4.6) 127.5 (3.4) 152.2 (4.0)July 193.6 (5.1) 94.9 (2.1) 144.2 (3.6)October 130.9 (3.5) 171.6 (4.3) 151.2 (3.9)Annual 149.6 (3.9) 149.3 (4.0) 149.4 (4.0)
fluxes at surface is very important for SW radiation budgetstudies. To this aim, a series of sensitivity tests were per-formed with our model. In each test, the relevant parameter,V , was modified by a certain amount,1V , i.e. by 10% inmost cases, in relative percentage terms, and the modifica-tions of the downward SW radiation at surface,1 (DSR), andof the net DSR flux at surface,1 (NDSR), with respect to thedefined reference cases, were computed and subsequently ex-pressed either in absolute terms (in Wm−2) or in relative per-centage values. The results given in Table 3 provide valuesin absolute terms. The year 1988 was chosen to represent thereference case. The tests were performed on a monthly basisand at the grid cell level, but results are given here in termsof globally and annually averaged1 (DSR) and1 (NDSR)absolute values. Our model sensitivities are valuable for as-sessing possible sources for discrepancies between model-computed and surface-measured DSR and net DSR fluxes, aswell as for evaluating the uncertainties in the computed DSRand net DSR fluxes due to uncertainties in model input data.The results of our model sensitivity tests indicate that, on amean annual and global basis, DSR is found to be primarilysensitive to cloud parameters, namely the cloud cover, cloudoptical depth (especially the scattering one), cloud asymme-try parameter, as well as to total precipitable water. Increas-ing Ac by 10%, separately for low, middle, or high-levelclouds, resulted in a decrease of DSR by up to 3.2 Wm−2
(or about 2%). The DSR fluxes were found to be more sen-sitive to low rather than to middle or high-level clouds. Thisis also valid for the sensitivity of DSR toτ s
c ; thus, increas-ing τ s
c by 10% reduced DSR by up to 1.2 Wm−2. Modifying
www.atmos-chem-phys.org/acp/5/2847/ Atmos. Chem. Phys., 5, 2847–2867, 2005

2860 N. Hatzianastassiou et al.: Global distribution of Earth’s surface shortwave radiation budget
Table 2. Model mean annual hemispherical and global averages of downward shortwave radiation at the Earth’s surface (DSR), and netdownward shortwave radiation (i.e. absorbed) at the Earth’s surface (Net DSR), as computed in this study, compared with values fromothers. NH is Northern Hemisphere, SH is Southern Hemisphere. The radiative fluxes are expressed in Wm−2.
StudyDSR Net DSR
NH SH Globe NH SH Globe
Present Study (1984–2000) 173.9 169.3 171.6 149.6 149.3 149.4Zhang et al. (2004) 165.2Liou (2002) 189.0 161.0Hatzianastassiou and Vardavas (2001) 174.0 160.0Hatzianastassiou and Vardavas (1999) 177.9 156.6Global Energy Balance Archive (GEBA) 169.0 151.0Gupta et al. (1999) (8-yr 1983–1991) 186.7 182.6 184.7 160.2 161.5 160.9CSU/GCM (Gupta et al., 1999) 202.3 200.5 201.4 177.4 178.9 178.2NCAR/GCM2 (Gupta et al., 1999) 179.1 181.5 180.3NCAR/GCM3 (Gupta et al., 1999) 194.4 194.4 194.4 169.0 173.4 171.2Wild and Ohmura (1999 – ARPEGE) 174.0Wild et al. (1999 – HadAM2b) 175.0Wild (2004 – ECHAM5) 180.0 156.0Wild et al. (1998a – ECHAM4) 170.0 147.0Wild et al. (1998a – ECHAM3) 189.0 164.0GCM studies (Wild et al., 1998a) 164.0–182.0Garratt et al. (1998) 190.0–201 160.0-174.0Kiehl and Trenberth (1997) 168.0Modelling studies (Li et al., 1997) 157.0–190.6Del Genio et al. (1996) 172.0Fowler and Randall (1996) 172.0Li et al. (1995) 157.0Rossow and Zhang (1995) 193.4 165.1Vardavas and Koutoulaki (1995) 156.5Hartmann (1994) 171.0Li and Leighton (1993) 155.0 159.0 157.0Ohmura and Gilgen (1993) 142.0Darnell et al. (1992) 173.0 151.0Peixoto and Oort (1992) 171.0Rossow and Lacis (1990) 169.0Rossow and Lacis (1990) GISS GCM 158.0Ramanathan (1987) 169.0NCEP Reanalysis (1982–1994) 207.0 162.0ECMWF Reanalysis (1985–1993) 180.0 152.0NASA Reanalysis (1981–1992) 219.0 191.0NASA GEWEX Reanalysis (1983–1992) 186.2 164.6
the cloud asymmetry parameter,gc, by 5% in relative val-ues, modified DSR by as much as 8 Wm−2. This shows thatthe surface solar radiation is very sensitive togc, which jus-tifies the special care that was taken in modelling this cloudparameter in our study. According to our modelling study,changes in the incoming solar radiation at TOA by 1% (orby about 3.5 Wm−2) can modify DSR by 1.7 Wm−2 at theglobal scale, which is important in terms of possible climaticchange due to solar variability. It is interesting that, based onour model sensitivity study, increasing the total precipitablewater by 10%, results in a globally averaged decrease in DSRby about 2 Wm−2 (or about 1.1%), which can be important in
view of the existing differences between available humiditydata from different reanalysis products (e.g. NCEP/NCAR orECMWF). Much larger1 (DSR) values are computed on alocal scale in our sensitivity tests, as can be seen in Table 3.The sensitivity1 (NDSR) values are slightly smaller thanthe1 (DSR) ones, apart from the case of surface albedo.
In order to investigate the effect of using humidity datafrom different sources, we have performed another sen-sitivity study, in which the model was run for the years1985–1993 by using data either from the NCEP/NCARor the ECMWF ERA-15 reanalysis projects, and com-pared the resulting DSR fluxes at grid cell-level (2.5-degree
Atmos. Chem. Phys., 5, 2847–2867, 2005 www.atmos-chem-phys.org/acp/5/2847/

N. Hatzianastassiou et al.: Global distribution of Earth’s surface shortwave radiation budget 2861
Table 3. Global and annual mean differences,1 (DSR) and1
(NDSR) in Wm−2, in model computed downward SW radiationat the Earth’s surface (DSR), and net downward SW radiation at theEarth’s surface (Net DSR or NDSR), induced by variation (1V inrelative percentage value, %) of the variableV (Ac, cloud cover;τ s
c ,cloud scattering optical depth;τa
c , cloud absorption optical depth;gc, cloud asymmetry parameter;WH2O, total precipitable water;WO3, total ozone column abundance;WCO2, total column carbondioxide;Rg , surface albedo; ISR, incoming SW radiation at TOA;AOT, aerosol scattering optical depth;ωaer, aerosol single scatter-ing albedo;gaer, aerosol asymmetry parameter). In parenthesis, isgiven the range of variation for1 (DSR) and1 (NDSR) at grid cell(2.5-degree latitude-longitude) level, for each sensitivity test. Year1988 is the reference case.
reference 174.01 151.76
V 1V 1 (DSR) 1 (NDSR)
Low-Ac 10 −3.20 (−22.05–0.12) −2.79 (−21.06–0.03)Middle- Ac 10 −2.24 (−17.51–0.39) −1.87 (−16.46–0.12)High-Ac 10 −2.05 (−15.30–0.85) −1.83 (−14.6–0.8)Low-τ s
c 10 −1.17 (−5.92–0) −1.04 (−5.64–0.1)Middle-τ s
c 10 −0.81 (−5.21–0) −0.69 (−4.9–0.1)High-τ s
c 10 −1.07 (−5.84–0) −0.96 (−5.53–0.02)Low-τa
c 10 −0.32 (−1.64–0) −0.30 (−1.56–0)Middle-τa
c 10 −0.20 (−1.52–0) −0.17 (−1.28–0)High-τa
c 10 −0.25 (−1.37–0) −0.22 (−1.11–0)gc 5 7.93 (0–20.64) 6.98 (−0.69–19.66)WH2O 10 −1.94 (−6.65–0.02) −1.73 (−6.34–0.02)WO3 10 −0.72 (−3.37–0.01) −0.61 (−1.55–0.01)WCO2 10 −0.1 (−0.51–0.01) −0.08 (−0.33–0.01)Rg 10 −1.05 (0.02–13.41) −3.53 (−94.52–0)ISR 1 1.74 (0–4.63) 1.52 (0–3.22)AOT 10 −0.16 (−2.62–0.01) −0.12 (−2.03–0.01)ωaer 10 0.58 (0–11.81) 0.44 (−0.01–8.0)gaer 10 0.26 (−0.02–4.79) 0.21 (−0.05–3.72)
longitude-latitude) and on a monthly mean basis. The re-sults are given in Fig. 8, where one can see that overall, theDSR fluxes are highly correlated (R=99.96%), with a stan-dard deviation of 2.16 Wm−2 and a very small bias, equal to0.07 Wm−2, corresponding to only 0.04% of the mean an-nual global DSR flux. This verifies that using NCEP/NCARor ECMWF data in our model, has little impact on the com-puted DSR fluxes. Using ECMWF data generally leads tolarger DSR fluxes than using data from NCEP/NCAR. Nev-ertheless, our more detailed analysis has shown that some-what larger differences in DSR are found at the grid celllevel, although in the majority of cases they do not ex-ceed 2 Wm−2. For specific cases, however, DSR differ-ences reach values of 10 Wm−2; this is the case over areaswith a significant topography, such as the Tibetan plateau,Greenland, Rocky Mountains or the Andes. Over these ar-eas, the ECMWF specific humidity is lower than that ofNCEP/NCAR, by up to 10–20 g/Kg, leading thus to largerDSR fluxes.
Fig. 8. Scatter plot comparison between model-computed down-ward shortwave radiation (DSR) at Earth’s surface, over the timeperiod 1986–1993, by using model input data for surface and atmo-spheric properties, taken from the NCEP/NCAR and ECMWF databases.
6 Comparisons with surface-site measurements
The model computed DSR fluxes have been validatedthrough comparison with corresponding extensive measure-ments from stations. Such high-quality surface-based datawere taken from two sources, namely the Baseline Sur-face Radiation Network (BSRN, Ohmura et al., 1998) andthe Global Energy Balance Archive (GEBA, Gilgen andOhmura, 1999). The BSRN stations have to follow specificobservational and calibration procedures, resulting in stan-dardized data of very high accuracy. The temporal resolu-tion of the data is also exceptional, of the order of minutes.All flux data in the BSRN database are quality checked byWCRP. If more than 80% of the minute values in a specificday pass the quality control, they are subsequently averagedto yield daily values. If this happens for more than 20 daysin a month, then monthly values are also computed. We thencompare these monthly values with the monthly values cal-culated by our model. The BSRN network was established in1992 and the stations from which at least one monthly DSRvalue in the period 1992–2000 is available, are listed in Ta-ble 4. The comparison of observed versus calculated monthlymean DSR fluxes within the 2.5◦
×2.5◦ cell containing theBSRN station for all 22 stations, is shown in the scatterplot ofFig. 9a, while the summarised results of model-BSRN com-parison, in terms of bias, root mean square error (RMS) andthe slope of the least-squares line, for each station, are alsolisted in Table 4.
The scatterplot shows a bias equal to−14 Wm−2, with arelatively small scatter (RMS equal to 30.6 Wm−2). A moredetailed analysis of the results of model validation against
www.atmos-chem-phys.org/acp/5/2847/ Atmos. Chem. Phys., 5, 2847–2867, 2005
2862 N. Hatzianastassiou et al.: Global distribution of Earth’s surface shortwave radiation budget
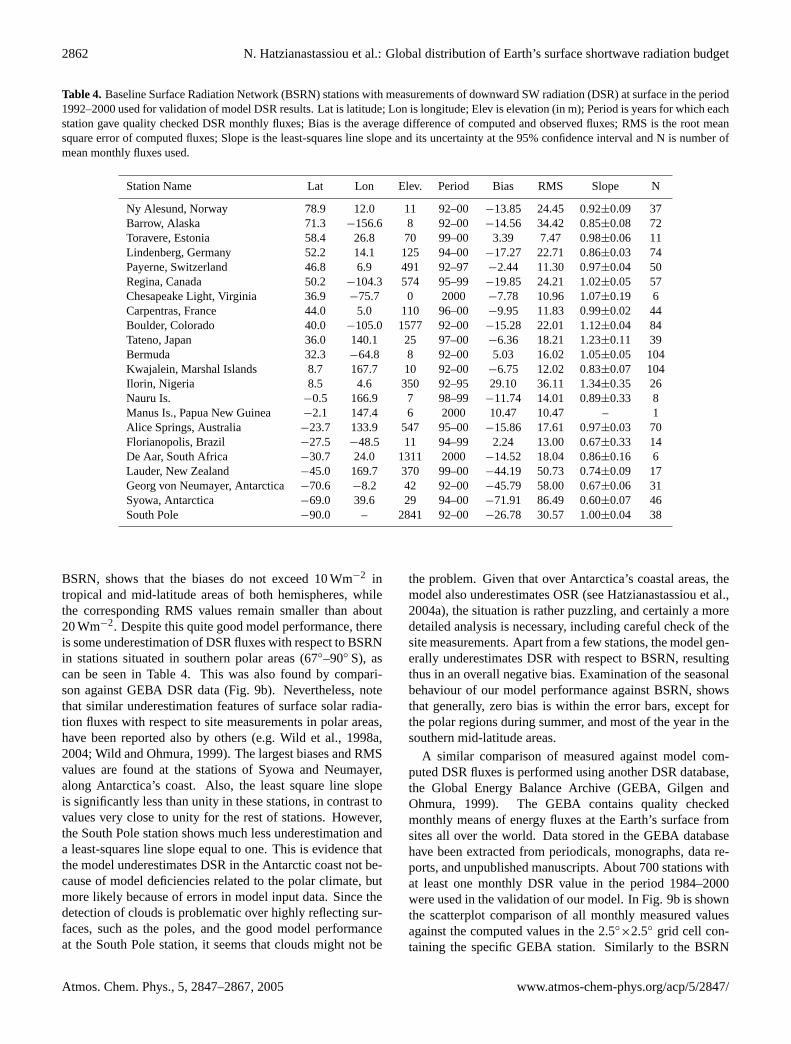
Table 4. Baseline Surface Radiation Network (BSRN) stations with measurements of downward SW radiation (DSR) at surface in the period1992–2000 used for validation of model DSR results. Lat is latitude; Lon is longitude; Elev is elevation (in m); Period is years for which eachstation gave quality checked DSR monthly fluxes; Bias is the average difference of computed and observed fluxes; RMS is the root meansquare error of computed fluxes; Slope is the least-squares line slope and its uncertainty at the 95% confidence interval and N is number ofmean monthly fluxes used.
Station Name Lat Lon Elev. Period Bias RMS Slope N
Ny Alesund, Norway 78.9 12.0 11 92–00−13.85 24.45 0.92±0.09 37Barrow, Alaska 71.3 −156.6 8 92–00 −14.56 34.42 0.85±0.08 72Toravere, Estonia 58.4 26.8 70 99–00 3.39 7.47 0.98±0.06 11Lindenberg, Germany 52.2 14.1 125 94–00−17.27 22.71 0.86±0.03 74Payerne, Switzerland 46.8 6.9 491 92–97−2.44 11.30 0.97±0.04 50Regina, Canada 50.2 −104.3 574 95–99 −19.85 24.21 1.02±0.05 57Chesapeake Light, Virginia 36.9 −75.7 0 2000 −7.78 10.96 1.07±0.19 6Carpentras, France 44.0 5.0 110 96–00−9.95 11.83 0.99±0.02 44Boulder, Colorado 40.0 −105.0 1577 92–00 −15.28 22.01 1.12±0.04 84Tateno, Japan 36.0 140.1 25 97–00−6.36 18.21 1.23±0.11 39Bermuda 32.3 −64.8 8 92–00 5.03 16.02 1.05±0.05 104Kwajalein, Marshal Islands 8.7 167.7 10 92–00−6.75 12.02 0.83±0.07 104Ilorin, Nigeria 8.5 4.6 350 92–95 29.10 36.11 1.34±0.35 26Nauru Is. −0.5 166.9 7 98–99 −11.74 14.01 0.89±0.33 8Manus Is., Papua New Guinea −2.1 147.4 6 2000 10.47 10.47 – 1Alice Springs, Australia −23.7 133.9 547 95–00 −15.86 17.61 0.97±0.03 70Florianopolis, Brazil −27.5 −48.5 11 94–99 2.24 13.00 0.67±0.33 14De Aar, South Africa −30.7 24.0 1311 2000 −14.52 18.04 0.86±0.16 6Lauder, New Zealand −45.0 169.7 370 99–00 −44.19 50.73 0.74±0.09 17Georg von Neumayer, Antarctica −70.6 −8.2 42 92–00 −45.79 58.00 0.67±0.06 31Syowa, Antarctica −69.0 39.6 29 94–00 −71.91 86.49 0.60±0.07 46South Pole −90.0 – 2841 92–00 −26.78 30.57 1.00±0.04 38
BSRN, shows that the biases do not exceed 10 Wm−2 intropical and mid-latitude areas of both hemispheres, whilethe corresponding RMS values remain smaller than about20 Wm−2. Despite this quite good model performance, thereis some underestimation of DSR fluxes with respect to BSRNin stations situated in southern polar areas (67◦–90◦ S), ascan be seen in Table 4. This was also found by compari-son against GEBA DSR data (Fig. 9b). Nevertheless, notethat similar underestimation features of surface solar radia-tion fluxes with respect to site measurements in polar areas,have been reported also by others (e.g. Wild et al., 1998a,2004; Wild and Ohmura, 1999). The largest biases and RMSvalues are found at the stations of Syowa and Neumayer,along Antarctica’s coast. Also, the least square line slopeis significantly less than unity in these stations, in contrast tovalues very close to unity for the rest of stations. However,the South Pole station shows much less underestimation anda least-squares line slope equal to one. This is evidence thatthe model underestimates DSR in the Antarctic coast not be-cause of model deficiencies related to the polar climate, butmore likely because of errors in model input data. Since thedetection of clouds is problematic over highly reflecting sur-faces, such as the poles, and the good model performanceat the South Pole station, it seems that clouds might not be
the problem. Given that over Antarctica’s coastal areas, themodel also underestimates OSR (see Hatzianastassiou et al.,2004a), the situation is rather puzzling, and certainly a moredetailed analysis is necessary, including careful check of thesite measurements. Apart from a few stations, the model gen-erally underestimates DSR with respect to BSRN, resultingthus in an overall negative bias. Examination of the seasonalbehaviour of our model performance against BSRN, showsthat generally, zero bias is within the error bars, except forthe polar regions during summer, and most of the year in thesouthern mid-latitude areas.
A similar comparison of measured against model com-puted DSR fluxes is performed using another DSR database,the Global Energy Balance Archive (GEBA, Gilgen andOhmura, 1999). The GEBA contains quality checkedmonthly means of energy fluxes at the Earth’s surface fromsites all over the world. Data stored in the GEBA databasehave been extracted from periodicals, monographs, data re-ports, and unpublished manuscripts. About 700 stations withat least one monthly DSR value in the period 1984–2000were used in the validation of our model. In Fig. 9b is shownthe scatterplot comparison of all monthly measured valuesagainst the computed values in the 2.5◦
×2.5◦ grid cell con-taining the specific GEBA station. Similarly to the BSRN
Atmos. Chem. Phys., 5, 2847–2867, 2005 www.atmos-chem-phys.org/acp/5/2847/

N. Hatzianastassiou et al.: Global distribution of Earth’s surface shortwave radiation budget 2863
comparison, our model underestimates DSR in the polar ar-eas, but everywhere else the agreement is very good, withan overall bias equal to−6.5 Wm−2 and a RMS value of23.5 Wm−2. The GEBA polar stations show that our modelunderestimates the DSR, similarly to the BSRN stations, butGEBA, in contrast to BSRN, does not show any evidenceof DSR underestimation in the southern mid latitudes. Themuch smaller number of BSRN measurements (939) thanthat of GEBA (27858), due to the shorter period covered(1992–2000 against 1984–2000), should be at least partly re-sponsible for the better agreement between model and GEBAthan BSRN. But, probably, the most important reason couldbe the different geographical distribution of stations in thetwo networks: a significant number of BSRN stations (7 outof 22) are located poleward of 50◦ N and S, while GEBA in-cludes a comparatively small fraction of stations (out of total700) located in sub-polar and polar areas. This is essential,since it is well known that the high-latitude areas are worsesampled by satellites than lower-latitude areas.
7 Summary and conclusions
An improved physical deterministic radiative transfer modelalong with long-term climatological data for various keyphysical surface and atmospheric parameters have been usedto compute the SW surface radiation budget (SRB) for the17-year period from 1984 to 2000, on a mean monthly ba-sis and 2.5◦ by 2.5◦ longitude-latitude grid cell resolution atglobal scale. The data were taken from large data bases suchas ISCCP-D2, TOVS, GADS, NCEP/NCAR and ECMWFGlobal Reanalysis projects. The model results were vali-dated against quality BSRN and GEBA data for the peri-ods 1992–2000 and 1984–2000, respectively, showing goodagreement with surface measurements, with an overall neg-ative bias of 14 and 6.5 Wm−2, with respect to BSRN andGEBA measurements, respectively. The better agreementwith GEBA than BSRN data is probably associated with thelarger number of GEBA than BSRN station measurements,and with the different geographical distribution of stations.Namely, the BSRN includes a larger fractional number of sta-tions located in sub-polar and polar areas than GEBA, whichare not as well sampled by satellites as areas of lower lati-tude. The differences between model-computed and surface-measured DSR fluxes, are within 10 Wm−2 at most stations,i.e. close to the uncertainty of BSRN and GEBA data, exceptfor two stations along Antarctica’s coast, where systemati-cally larger differences in DSR fluxes were found. Uncer-tainties in model input data are assessed to be the most likelysource for this model DSR underestimation, whereas similarunderestimation features at the same stations have been re-ported by other modelling studies, suggesting also an exami-nation of the quality of site measurements. A series of modelsensitivity tests has shown that DSR is primarily sensitive tocloud parameters, namely cloud cover and optical depth, es-
(a)
(b)
Fig. 9. Scatter plot comparison between model-computed and:(a)Baseline Surface Radiation Network (BSRN), and(b) Global En-ergy Balance Archive (GEBA) grid-cell data of monthly averagedownward shortwave radiation (DSR) at the Earth’s surface, overthe time periods 1992–2000 and 1984–2000, respectively. R andN are the correlation coefficient and number of matched data pairs,respectively.
pecially of low-level clouds, and secondarily to water vapouramount.
The 17-year model results indicate that the Earth’s surfacereceives 171.6 Wm−2, while it absorbs 149.4 Wm−2, valuesthat correspond to 50.2 and 43.7% of the incoming SW ra-diation at the top of the atmosphere. These values involvea long-term surface albedo equal to 12.9%. According toour analysis, using either NCEP/NCAR or ECMWF humid-ity and temperature data in our model, has generally littleeffect on the computed DSR fluxes. Our computed value of43.7% for the part of solar radiation that is absorbed by theEarth’s surface, is smaller than the values given in previousstudies, which are larger than 46%. In combination with along-term planetary albedo equal to 29.6% (Hatzianastassiou
www.atmos-chem-phys.org/acp/5/2847/ Atmos. Chem. Phys., 5, 2847–2867, 2005

2864 N. Hatzianastassiou et al.: Global distribution of Earth’s surface shortwave radiation budget
et al., 2004a), our modeling study indicates a partial absorp-tion of solar radiation within the terrestrial atmosphere, equalto 26.7%. Our values of 43.7 and 26.7% for the surface andatmospheric absorption of solar radiation, are significantlysmaller and larger, respectively, than the corresponding val-ues of about 50 and 20%, estimated by earlier studies. Ourvalue of 149.4 Wm−2 for the net downward surface solarradiation, is smaller than the values given by other modelsand reanalysis projects, by at least 10-20 Wm−2, except forversions 4 and 5 of ECHAM GCM, the ISCCP-FD fluxes(Zhang et al., 2004), and the ECMWF reanalysis. It is veryinteresting that our model computed value is very close tothe revised “best” estimate of about 150 Wm−2from surfacemeasurements. Comparable DSR and net DSR fluxes werecomputed for the northern and southern hemispheres.
The linear regression analysis applied to 204 global av-erages of monthly mean DSR fluxes, reveals a significantdecadal increase in SW radiation reaching the Earth’s sur-face, equal to 2.4 Wm−2, associated with a correspondingdecadal increase in surface solar absorption of 2.2 Wm−2,over the 17-year period 1984–2000. The performed analy-sis has shown that the increasing surface solar heating, indi-cated by positive DSR and net DSR anomalies, started afterthe year 1992, and that it has been caused by a significant re-duction in cloudiness during the last decade of 20th century.In contrast, mainly negative anomalies are found from 1984through the early 1990s. Our results are in agreement withsurface observations (Wild et al., 2005), also indicating anincrease in DSR starting after 1990. A further analysis hasdemonstrated that the reduction in low-level cloud amounts,accounts for about 70% of the computed increasing trend inDSR. This is consistent with the results of a sensitivity study,showing that the surface SW radiative fluxes are primarilysensitive to cloud parameters, and more specifically to low,middle, and high-level cloud cover (in that order), and sec-ondarily to other parameters, such as total precipitable water.
In the future, it is desirable to use more advanced mod-els to make such computations of SRB using the same orsimilar input data. This can improve the accuracy of the re-sults, though it involves other problems, for example greatlyincreasing computing time, which constitutes a problem incase of global scale studies. Further work is undertaken inorder to increase the spatial and temporal resolution of theperformed study, providing SRB fluxes at 1◦ by 1◦ latitude-longitude resolution or on a daily mean basis. Preliminaryresults show that there is good agreement with the ISCCP-D2 based monthly mean 2.5◦ resolution fluxes shown here.It is very important to perform validations of computed SRBfluxes on as long as possible time periods, since SRB changeswith time.
Acknowledgements.This research was funded by the EuropeanCommission (contract: EVK2-CT-2000-00055) under the The-matic Programme: Preserving the Ecosystem; Key Action 2:Global Change, Climate and Biodiversity. The ISCCP-D2 andISLSCP data were obtained from the NASA Langley Research
Center (LaRC) Atmospheric Sciences Data Center (ASDC). TheNCEP/NCAR Global Reanalysis Project data were obtained fromthe National Oceanic and Atmospheric Administration (NOAA)Cooperative Institute for Research in Environmental Sciences(CIRES) Climate Diagnostics Center, Boulder, Colorado, USA.The ERA-15 ECMWF data were obtained from the Data OrderingService of ECMWF. The GADS data were obtained from theMeteorological Institute of the University of Munich, Germany(http://www.meteo.physik.uni-muenchen.de/strahlung/aerosol/aerosol.htm). The BSRN data were obtained from the BSRNdatabase of the World Radiation Moniroring Center (WRMC) atEidgenossische Technische Hochschule (ETH). The GEBA datawere obtained from the GEBA database of the World ClimateProgam – Water (WMO/ICSU) at ETH.
Edited by: L. M. Frohn
References
Briegleb, B. P., Minnis, P., Ramanathan, V., and Harrison, E.: Com-parison of regional clear-sky albedos inferred from satellite ob-servations and model computations, J. Clim. Appl. Meteor., 25,214–226, 1986.
Cess, R. D., Dutton, E. G., DeLuisi, J. J., and Jiang, F.: Determiningsurface solar absorption from broadband satellite measurementsfor clear skies: Comparison with surface measurements, J. Cli-mate, 4, 236–247, 1991.
Cess, R. D., Zhang, M. H., Minnis, P., et al.: Absorption of solarradiation by clouds: Observations versus models, Science, 267,496–499, 1995.
Chen, C.-T. and Roeckner, E.: Validation of the Earth radiationbudget as simulated by the Max Planck Institute for Meteorol-ogy general circulation model ECHAM4 using satellite obser-vations of the Earth Radiation Budget Experiment, J. Geophys.Res., 101, 4269–4287, 1996.
Chen, J., Carlson, B. E., and Del Genio, A. D.: Evidence forstrengthening of the tropical general circulation in the 1990s, Sci-ence, 295, 838–841, 2002.
Darnell, W. L., Staylor, W. F., Gupta, S. K., and Denn, F. M.: Es-timation of surface insolation using Sun-synchronous satellitedata, J. Climate, 1, 820–835, 1988.
Darnell, W. L., Staylor, W. F., Gupta, S. K., Ritchey, N. A., andWilber, A. C.: Seasonal variation of surface radiation budget de-rived from International Satellite Cloud Climatology Project C1data, J. Geophys. Res., 97, 15 741–15 760, 1992.
Del Genio, A. D., Yao, M.-S., Kovari, W., and Lo, K. K.-W.: Aprognostic cloud water parameterization for global climate mod-els, J. Climate, 9, 270–304, 1996.
Dickinson, R., Henderson-Sellers, R., and Kennedy, P.: Biosphere-Atmosphere Transfer Scheme (BATS) Version 1e as cloupled tothe NCAR Community Climate Model, Tech. Note NCAR/TN-387+STR, Natl. Cent. For Atmos. Res., Boulder, Colo., 72 pp.,1993.
Ebert, E. E. and Curry, J. A.: A parameterization of ice cloud opticalproperties for climate models, J. Geophys. Res., 97, 3831–3836,1992.
Esbensen, S. K. and Kushnir, Y.: The heat budget of the globaloceans: An atlas based on surface marine observations, Rep. 29,Clim. Res. Inst., Oreg. State Univ., Corvallis, 1981.
Atmos. Chem. Phys., 5, 2847–2867, 2005 www.atmos-chem-phys.org/acp/5/2847/

N. Hatzianastassiou et al.: Global distribution of Earth’s surface shortwave radiation budget 2865
Fotiadi, A., Hatzianastassiou, N., Matsoukas, C., Pavlakis, K. G.,Drakakis, E., Hatzidimitriou and Vardavas, I.: Analysis of thedecrease in the tropical mean outgoing shortwave radiation atthe top of atmosphere for the period 1984-2000, Atmos. Chem.Phys., 5, 1721–1730, 2005,SRef-ID: 1680-7324/acp/2005-5-1721.
Fowler, L. D. and Randal, D. A.: Liquid and ice cloud microphysicsin the CSU general circulation model. Part II: Impact of cloudi-ness, the earth’s radiation budget, and the general circulation ofthe atmosphere, J. Climate, 9, 530–560, 1996.
Garratt, J. R.: Incoming shortwave fluxes at the surface – A com-parison of GCM results with observations, J. Clim., 7, 72–80,1994.
Garratt, J. R., Prata, A. J., Rotstayn, L. D., McAvaney, B. J., andCusack, S.: The surface radiation budget over oceans and conti-nents, J. Clim., 11, 1951–1968, 1998.
Gilgen, H. and Ohmura, A.: The Global Energy Balance Archive,Bull. Am. Meteor. Soc., 80, 831–850, 1999.
Gilgen, H., Wild, M., and Ohmura, A.: Means and trends of short-wave irradiance at the surface estimated from Global Energy Bal-ance Archive, J. Climate, 11, 2042–2061, 1998.
Gupta, S. K., Ritchey, N. A., Wilber, A. C., Whitlovk, C. H., Gib-son, G. G., and Stackhouse Jr., P. W.: A climatology of surfaceradiation budget derived from satellite data, J. Clim., 12, 2691–2710, 1999.
Hartmann, D. L.: Aerosol-Cloud-Climate Interactions, Radiativeeffects of clouds on Earth’s climate, International GeophysicsSeries, vol. 54, P. Hobbs, Acad. Press Inc., 151–173, 1993.
Hartmann, D. L.: Global Physical Climatology, Academic Press,411 pp., 1994.
Hatzianastassiou, N. and Vardavas, I.: Shortwave radiation budgetof the Northern Hemisphere using International Satellite CloudClimatology Project and NCEP/NCAR climatological data, J.Geophys. Res., 104, 24 401–24 421, 1999.
Hatzianastassiou, N. and Vardavas, I.: Shortwave radiation budgetof the Southern Hemisphere using ISCCP C2 and NCEP/NCARclimatological data, J. Clim., 14, 4319–4329, 2001.
Hatzianastassiou, N., Fotiadi, A., Matsoukas, C., Drakakis, E.,Pavlakis, K. G., Hatzidimitriou, N., and Vardavas, I.: Long-termglobal distribution of Earth’s shortwave radiation budget at thetop of atmosphere, Atmos. Chem. Phys., 4, 1217–1235, 2004a,SRef-ID: 1680-7324/acp/2004-4-1217.
Hatzianastassiou, N., Katsoulis, B., and Vardavas, I.: Global dis-tribution of aerosol direct radiative forcing in the ultraviolet andvisible arising under clear skies, Tellus, 56B, 51–71, 2004b.
Hatzidimitriou, D., Vardavas, I., Pavlakis, K., Hatzianastassiou, N.,Matsoukas, C., and Drakakis, E.: On the decadal increase in thetropical mean outgoing longwave radiation for the period 1984–2000, Atmos. Chem. Phys., 4, 1419–1425, 2004,SRef-ID: 1680-7324/acp/2004-4-1419.
Henderson-Sellers, A. and Wilson, M. F.: Surface albedo data forclimate modelling, Rev. Geophys., 21, 1743–1778, 1983.
Hinkelman, L. M., Ackerman, T. P., and Marchand, R. T.: An eval-uation of NCEP Eta model predictions of surface energy budgetand cloud properties by comparison with measured ARM data, J.Geophys. Res., 104, 19 535–19 549, 1999.
Intergovernmental Panel on Climate Change (IPCC): ClimateChange 2001, The Scientific Basis, 881 pp., edited by: HoughtonJ. T., Ding, Y., Griggs, D. J., et al., Cambridge Univ. Press, New
York, 2001.Kiehl, J. T. and Trenberth, K. E.: Earth’s annual global mean energy
budget, Bull. Am. Meteorol. Soc., 78, 197–208, 1997.Kiehl, J. T., Hack, J. J., Zhang, M. H., and Cess, R. D.: Sensitivity
of a GCM climate to enhanced shortwave cloud absorption, J.Clim., 8, 2200–2212, 1995.
Kondratyev, K. Y.: Radiation Characteristics of the Atmosphere andthe Earth’s surface, Amerind., SNew Delhi, 580 pp., 1973.
Koepke, P., Hess, M., Schult, I., and Shettle, E. P.: Global aerosoldata set, Rep. No. 243, Max-Planck Institut fur Meteorologie, 44pp., Hamburg, Germany, 1997.
Kuhn, M. H.: The role of land ice and snow in climate, in: Under-standing Climate Change, Geophys. Monogr. Ser., vol. 52, editedby: Berger, A., Dickinson, R. E., and Kidson, J. W., pp. 17–28,American Geophysical Union, Washington, D.C., 1989.
Kyle, H. L., Mecherikunnel, A., Ardanuy, P., Lanning, P., Grove-man, B., Garret-Gampbell, G., and Vonder Haar, T. H.: A com-parison of two major earth radiation budget data sets, J. Geophys.Res., 95, 9951–9970, 1990.
Li, Z. and Leighton, H. G.: Global climatologies of solar radia-tion budgets at the surface and in the atmosphere from 5 years ofERBE data, J. Geophys. Res., 98, 4919–4930, 1993.
Li, Z., Barker, H. W., and Moreau, L.: The variable effect of cloudson atmospheric absorption of solar radiation, Nature, 376, 486–490, 1995.
Li, Z., Moreau, L., and Arking, A.: On solar energy disposition: Aperspective from observation and modelling, Bull. Am. Meteo-rol. Soc., 78, 53–70, 1997.
Liepert, B. G.: Observed reductions of surface solar radiation atsites in the United States and worldwide from 1961 to 1990, Geo-phys. Res. Lett., 29(12), doi:10.1029/2002GL014910, 2002.
Liou, K. N.: Radiation and cloud processes in the atmosphere. The-ory, Observation and Modelling, Oxford University Press Inc.,487 pp., 1992.
Liou, K. N.: An introduction to atmospheric radiation, InternationalGeophysics Series, Vol. 84, Academic Press, 583 pp., 2002.
Ohmura, A. and Gilgen, H.: Re-evaluation of the global energybalance. Interactions between global climate subsystems: Thelegacy of Hann, Geophys. Monogr., No. 75, International Unionof Geodesy and Geophysics, 93–110, 1993.
Ohmura, A., Gilgen, H., Hegner, H., Mueller, G., Wild, M., Dut-ton, E. G., Forgan, B., Froehlich, C., Philippona, R., Heimo,A., Koenig-Langlo, G., McArthur, B., Pinker, R., Whitlock,C. H., and Dehne, K.: Baseline Surface Radiation Network(BSRN/WCRP): New precision radiometry for climate research,Bull. Am. Meteorol. Soc., 79, 2115–2136, 1998.
Peixoto, J. P. and Oort, A. H.: Physics of Climate, Springer, N.Y.,520 pp., 1992.
Peng, L. I., Chou, M.-D., and Arking, A.: Climate studies with amulti-layer energy balance model. Part I: Model description andsensitivity to the solar constant, J. Atmos. Sci., 39, 2639–2656,1982.
Pilewski, P. and Valero, F.: Direct observations of excess solar ab-sorption by clouds, Science, 257, 1626–1629, 1995.
Pinker, R. T. and Laszlo, I.: Modelling surface solar irradiance forsatellite applications on a global scale, J. Appl. Meteorol., 31,194–211, 1992.
Pinker R. T., Zhang, B., and Dutton E. G.: Do satellites detect trendsin surface solar radiation?, Science, 308, 850–854, 2005.
www.atmos-chem-phys.org/acp/5/2847/ Atmos. Chem. Phys., 5, 2847–2867, 2005

2866 N. Hatzianastassiou et al.: Global distribution of Earth’s surface shortwave radiation budget
Ramanathan, V.: Scientific use of surface radiation budget for cli-mate studies. Surface Radiation Budget for Climate Applica-tions, NASA PR-1169, 58–86, 1986.
Ramanathan, V.: The role of Earth Radiation Budget studies in cli-mate and general circulation research, J. Geophys. Res., 4075–4094, 1987.
Ramanathan, V., Subasilar, B., Zhang, G. J., Conant, W., Cess, R.D., Kiehl, J. T., Grassl, H., and Shi, L.: Warm pool heat budgetand shortwave cloud forcing: S missing physics, Science, 267,499–503, 1995.
Raschke, E., Gratzki, A., and Rieland, M.: Estimates of global radi-ation at the ground from the deduced data sets of the InternationalCloud Climatology Project, J. Climatol., 7, 205–213, 1987.
Roesch, A., Wild, M., Gilgen, H., and Ohmura, A.: A new snowcover fraction parameterization for the ECHAM4 GCM, Clim.Dyn., 17, 933–946, 2001.
Roesch, A., Wild, M., Pinker, R., and Ohmura, A.: Compari-son of surface spectral albedos and their impact on the generalcirculation model estimated surface climate, J. Geophys. Res.,107(D14), doi:10.1029/2001JD000809, ACL 13-1–ACL 13-8,2002.
Rossow, W. B. and Lacis, A. A.: Global, seasonal cloud variationsfrom satellite radiance measurements. Part II: Cloud propertiesand radiative effects, J. Clim., 3, 1204–1253, 1990.
Rossow, W. B. and Zhang, Y.-C.: Calculation of surface and topof atmosphere radiative fluxes from physical quantities based onISCCP data sets 2. Validation and first results, J. Geophys. Res.,100, 1167–1197, 1995.
Rossow, W. B. and Schiffer, R. A.: Advances in understandingclouds from ISCCP, Bull. Am. Meteorol. Soc., 80, 2261–2287,1999.
Rossow, W. B., Walker, A. W., Beuschel, D. E., and Roiter, M.D.: International Satellite Cloud Climatology Project (ISCCP).Documentation of new cloud datasets, 115 pp., Wold Meteorol.Org. Geneva, 1996.
Schmetz, J.: Towards a surface radiation climatology: Retrieval ofdownward irradiance from satellites, Atmos. Res., 23, 287–321,1989.
Slingo, A.: A GCM parameterization for the shortwave radiativeproperties of water clouds, J. Atmos. Sci., 46, 1419–1427, 1989.
Stephens, G. L.: Optical properties of eight water cloud types, Tech.Pap. 36, CSIRO Div. of Atmos. Phys., 254 pp., 1979.
Stephens, G. L. and Greenwald, T. J.: The earth’s radiation bud-get and its relation to atmospheric hydrology, 2, Observations ofcloud effects, J. Geophys. Res., 96, 15 325–15 340, 1991.
Stackhouse Jr., P. W., Cox, S. T., Gupta, S. K., Dipasquale, R.C., and Brown, D. R.: The WCRP/GEWEX Surface RadiationBudget Project Release 2: First results at 1 degree resolution.Preprints, 10th Conf. on Atmospheric Radiation: A Symp. WithTributes to the Works of Verner Suomi. Madison, WI, Am. Me-teorol. Soc., 520–523, 1999.
Stackhouse Jr., P. W., Cox, S. J., Gupta, S. K., Chiacchio, M., andMikovitz, J. C.: The WCRP/GEWEX surface radiation budgetproject release 2: An assessment of surface fluxes at 1 degree res-olution. International Radiation Sysposium, St. Petersburg, Rus-sia, 24–29 July 2000, IRS 2000: Current Problems in Atmo-spheric Radiation, edited by: Smith, W. L. and Timofeyev, Y.,A. Deepak Publishing, 147, 2001.
Stanhill, G. and Cohen, S.: Global dimming: A review of the evi-
dence for a widespread and significant reduction in global radia-tion with discussion of its probable causes and possible agricul-tural consequences, Agricult. Forest. Meteorol., 107, 255–278,2001.
Suttles, J. T. and Ohring, G.: Surface radiation budget for climateapplications, NASA Reference Publication 1169, NASA, Wash-ington D.C., 132 pp., 1986.
Thekaekara, M. P. and Drummond, A. J.: Standard values for thesolar constant and its spectral components, Nature Phys. Sci.,229, 6–9, 1971.
Torres, O., Barthia, P. K., Herman, J. R., Sinyuk, A., Ginoux, R.,and Holben B.: A long-term record of aerosol optical depthfrom TOMS observations and comparison to AERONET mea-surements, J. Atmos. Sci., 59, 398–413, 2002.
Vardavas, I. and Carver, J. H.: Solar and terrestrial parameteri-zations for radiative convective models, Planet. Space Sci., 32,1307–1325, 1984.
Vardavas, I. M. and Koutoulaki, K.: A model for the solar radia-tion budget of the Northern Hemisphere: Comparison with EarthRadiation Budget Experiment data, J. Geophys. Res., 100, 7303–7314, 1995.
Weare, B.-C.: Relationships between net radiation at the surface andthe top of atmosphere derived from a general circulation model,J. Clim., 2, 193–197, 1989.
Wei, X., Hahmann, A. N., Dickinson, R. E., et al.: Comparison ofalbedos computed by land surface models and evaluation againstremotely sensed data, J. Geophys. Res., 106, 20 687–20 702,2001.
Whitlock, C. H., Charlock, T. P., Staylor, W. F., et al.: First globalWCRP shortwave surface radiation budget dataset, Bull. Amer.Meteor. Soc., 76, 905–922, 1995.
Wielicki, B. A., Wong, T. M., Allan, R. P., et al.: Evidence for largedecadal variability in the tropical mean radiative energy budget,Science, 295, 841–844, 2002.
Wild, M.: Solar radiation budgets in atmospheric model inter-comparison from surface perspective, Geophys. Res. Lett., 32,L07704, doi:10.1029/2005GL022421, 2005.
Wild, M. and Ohmura, A.: The role of clouds and the cloud-freeatmosphere in the problem of underestimated absorption of solarradiation in GCM atmospheres, Phys. Chem. Earth, 24B, 261–268, 1999.
Wild, M., Ohmura A., Gilgen H., and Roeckner E.: Validation ofgeneral circulation model radiative fluxes using surface observa-tions, J. Clim., 8, 1309–1324, 1995.
Wild, M., Ohmura A., Gilgen H., Roeckner E., Giorgetta M., andMorcrette J.-J: The disposition of radiative energy in the globalclimate system: GCM-calculated versus observational estimates,Clim. Dyn., 14, 853–869, 1998a.
Wild, M., Ohmura, A., Gilgen, H., and Morcrette, J.-J: The distri-bution of solar energy at the Earth’s surface as calculated in theECMWF Re-analysis, Geophys. Res. Lett., 25, 23, 4373–4376,1998b.
Wild, M., Ohmura A., Gilgen, H., and Rosenfeld, D.: On the con-sistency of trends in radiation and temperature records and im-plications for the global hydrological cycle, Geophys. Res. Lett.,31, L11201, doi:10.1029/2003GL019188, 2004.
Wild, M., Gilgen, H., Roesch, A., et al.: From dimming to bright-ening: decadal changes in solar radiation at Earth’s surface, Sci-ence, 308, 847–850, 2005.
Atmos. Chem. Phys., 5, 2847–2867, 2005 www.atmos-chem-phys.org/acp/5/2847/

N. Hatzianastassiou et al.: Global distribution of Earth’s surface shortwave radiation budget 2867
Wittmeyer, I. L. and Vonder Haar, T. H.: Analysis of the global IS-CCP TOVS water vapor climatology, J. Clim., 8, 325–333, 1994.
Yu, R., Zhang, M., and Cess, R. D.: Analysis of the atmosphericenergy budet: A consistency study of available data sets, J. Geo-phys. Res., 108, 9655–9661, 1999.
Zhang, Y.-C., Rossow, W. B., Lacis, A. A., Oinas V.,and Mishchenko, M. I.: Calculation of radiative fluxesfrom the surface to top-of-atmosphere based on ISCCP andother global datasets: Refinements of the radiative transfermodel and the input data, J. Geophys. Res., 109, D19105,doi:10.1029/2003JD004457, 2004.
www.atmos-chem-phys.org/acp/5/2847/ Atmos. Chem. Phys., 5, 2847–2867, 2005