Embed Size (px)
Citation preview

Vol. 12: 263-273, 1997 1 AQUATIC MICROBIAL ECOLOGY Aquat Microb Ecol l Published May 29
Trophic interactions between picophytoplankton and micro- and nanozooplankton in the western
Arabian Sea during the NE monsoon 1993
Marcus Reckermannl,*, Marcel J. W. veldhuis2
'Institut fur Ostseeforschung. Seestr. 15, D-18119 Warnemunde, Germany '~nstituut voor Onderzoek der Zee. Postbus 59,1790 AB Den Burg. The Netherlands
ABSTRACT: The grazing pressure of micro- and nanozooplankton on phytoplankton was estimated in serial dilution experiments in the northwestern Arabian Sea and its adjacent areas (the Somali Current, the Somali Basin, the Gulf of Aden and the southern Red Sea) during the NE monsoon 1992-1993. Microzooplankton grazing rates @) on total phytoplankton (analyzed as chl a ) were generally exceeded by phytoplankton growth rates (g = 0.2 to 1.19 d-l, mean 0.48 d-'; p = 0.52 to 1.12 d-', mean 0.72 d-'1, resulting in an average daily consumption of 38% of the phytoplankton standing stock and 67% of the primary production. Microzooplankton grazing on 4 picophytoplankton groups (Prochlorococcus spp., Synechococcus spp., and 2 picoeukaryotes) analyzed by flow cytonletry showed growth (p = 0.27 to 0.92 d-l, mean 0.68 d") and grazing mortality rates @ = 0.26 to 0.73 d-l, mean 0.67 d-l) well in balance, with an average of 49% of the standing stock and 102% of the primary production grazed per day. Pico- phytoplankton growth and grazing mortality rates increased dramatically when grazers > l 0 pm were removed. These results suggest a control of the small grazers by larger ones (trophic cascade) and a close coupling between picoautotrophic prey and small grazers. The trophic cascade within the micro- bial food web of the nanoplankton encompasses 3 trophic levels: picoplankton - small HNF - larger flagellates and ciliates.
KEY WORDS: Grazing . Picophytoplankton . Prochlorococcus . Synechococcus . Picoeukaryotes Flow cytometry . Arabian Sea . Trophic cascade
INTRODUCTION
Photoautotrophic picoplankton (size 0.2 to 2 pm) often dominates the phytoplankton community within the euphotic zone of oligotrophic oceans (Campbell & Vaulot 1993, Fogg 1995), and particularly so during the inter-monsoon periods in the Arabian Sea (Burkill et al. 1993, Jochem 1995). The prokaryotic species Pro- chlorococcus marina (Chisholm et al. 1992) and Syne- chococcus spp. (Johnson & Sieburth 1979, Waterbury et al. 1979), as well as eukaryotic algae of various tax- onomic groups (Johnson & Sieburth 1982, Simon et al. 1994) are the predominant autotrophs within this size class. In order to assess their role in oceanic carbon flux, information on their growth and grazing mortality
'Present address: Forschungs- und Technologiezentrum West- kiiste, Hafentorn, D-25761 Biisum, Germany. E-mail: [email protected]
rates is essential. Knowledge of the size of the principal predators of picoplankton is important as well, as size largely determines the fraction of carbon which is passed on to higher trophic levels (Sherr et al. 1986). Grazing can be assumed to be the most significant loss factor for these organisms, as direct sedimentation is unlikely due to their small size, although they may form a significant component in sinking aggregates (Lochte & Turley 1988). Prochlorococcus, reaching abundances of up to 350 000 cm-3 in the euphotic zone of oligotrophic regions (Olson et al. 1990, Veldhuis & Kraay 1993, Lindell & Post 1995, Buck et al. 1996), can- not be discriminated reliably from heterotrophic bacte- ria by epifluorescence microscopy, due to their dim and fast-fading autofluorescence (Monger & Landry 1993), and many have been mistakenly counted as heterotrophic bacteria for that reason (Campbell et al. 1994, Sieracki et al. 1995). Although the occurrence of Prochlorococcus was shown in the NW Indian Ocean
O Inter-Research 1997

Aquat Microb Ecol 12: 263-273, 1997
(Pollehne et al. 1993, Veldhuis & Kraay 1993, Jochem 60 E
1995), information on the dynamics of these tiny pri- N
mary producers has been scarce. To date, information on Prochlorococcus growth rates is available only from the Sargasso Sea (Goericke & Welschmeyer 1993) and ,, the equatorial Pacific (Vaulot et al. 1995); grazing esti- mates have been reported only from the equatorial Pacific (Landry et al. 1995a, b) . Information on eukary- otic picoplankton dynamics is also rare. For Syne- chococcus, Burkill et al. (1993) reported high bio- masses and turnover rates in the Arabian Sea during the autumn inter-monsoon period. 10
We report here specific phytoplankton growth and grazing mortality rates by microzooplankton (measured as bulk chl a and as separate picoautotrophic groups by iivw cyiu111et1 y : Pruciiiur-ucuccus, Syr~ec'i~ucocc~ls, 2 picoeukaryotes, and occasionally 2 sub-populations of Prochlorococcus and Synechococcus) at different loca- S O M A L I B A ~ ~ ~
tions in the Somali Current, the Gulf of Aden, and the o
southern Red Sea during the NE monsoon period (January-February 1993). The standard dilution proto- col of Landry & Hassett (1982) was modified in order to S
account for the respective grazing impact of different 40 W 60 E
grazer size within the microzoo~lankton Fig, 1, Investigation area with in the Somali Current, munity (grazers c 2 0 , < 1 0 , c 3 and < 2 pm). the Gulf of Aden and the southern Red Sea. Arrows indicate
the direction of the Somali Current during the NE rnonsoon
MATERIAL AND METHODS
Micro- and nanozooplankton grazing experiments (Landry & Hassett 1982) were carried out aboard RV 'Tyro' on cruise B2 of the Netherlands Indlan Ocean Programme 1992-1993 (Baars et al. 1994) at 8 stations in the Arabian Sea off Somalia, in the Gulf of Aden and the Red Sea (Fig. 1) during the NE monsoon (January-February 1993). Water samples were taken from the upper mixed layer (10 to 30 m) on the uphaul with a Seabird CTD rosette water sampler equipped with 10.5 1 NoEx bottles. Water samples were prescreened through a 200 pm mesh (to remove mesozooplankton) and diluted with particle-free sea-
water (prepared by sterile, preflushed 0.2 pm filter capsules; Nalgene) to give 4 dilution steps (100, 75, 50 and 25% original water) and incubated on board in 5 1 glass bottles for 24 h, starting at sunrise. In situ condltlons were simulated in a light-screened flow- through bath which ensured mixed layer tempera- tures and irradiances corresponding to the sampling depths (Table 1). For chl a analyses, samples (1 to 2.5 1) were filtered over a GF/F glass fibre filter (47 mm; Whatman) at the beginning and at the end of each respective experiment. Filters were stored at -80°C until fluorometric analysis according to Veld- huis et al. (1993).
Table 1 Locations, dates and ambient environmental conditions for the experiments in the Somali Basin (SB2 to SI), the Gulf of Aden (GA1, GA2) and the southern Red Sea (RS1, RS2) during the NE rnonsoon 1993. FC: flow cytometry
Expt Phytoplankton Stn Date Simulated incubation Temperature NO, Chl a analyzed by (1993) depth (m) ("c) (l.lM) (pg d m 'I
1 chl a, FC SB2 (809-1) Jan 15 20 26 9 0 13 0 35 2 chl a, FC US1 (813-1) Jan 18 20 26.7 0.23 0.28 3 chl a, FC US2 (818-5) Jan 21 20 26.0 0.80 0.30 4 chl a, FC S1 (820-1) Jan 24 20 26.0 0.93 0.25 5 chl a GA1 (826-4) Jan 26 20 25 9 0.30 0 50 6 chl a, FC GA2 (832-11) Jan 30 20 25.4 1.53 0 46 7 chl a RSI (840-4) Feb 02 10 25.7 0.02 0.95 8 chl a, FC RS2 (842-14) Feb 04 10 25.8 0.40 1.04

Reckermann & Veldhuis: Trophic interact~ons arnong plankton
In parallel treatments, the standard serial dilution protocol was modified to the effect that in addition to grazers > 200 pm, also grazers > 20, > 10, > 3 and > 2 pm were removed by prescreening in order to determine the respective grazing pressure of smaller grazer size classes on the picoautotroph community. The experi- mental water was siphoned from the CTD bottle into a light-screened 2 l plastic beaker by means of a sub- merged silicon tube. The water was prescreened by gravity through meshes (for the size fractions c20 and < l 0 pm) or presoaked polycarbonate filters (for the smaller fractions) and collected in dark plastic bottles. The prescreened water samples were then combined with particle-free seawater (prepared by preflushed encapsulated 0.2 pm syringe filters; Schleicher & Schuell Red Edge) from the beaker according to the 4 dilution steps (see above) and incubated in parallel in 60 m1 polystyrene culture bottles on board under simu- lated in situ conditions (free floating in a light-screened container flushed with running seawater; see above) for 24 h , starting 1 h after sunnse. All experimental gear was washed thoroughly with 10Y0 HC1 and rinsed with 0.2 pm-filtered seawater. After incubation, the samples were counted immediately, or stored cool in the dark at 4°C until counted (up to 3 h). Cells were counted with a Coulter Epics CS flow cytometer as described by Veld- huis & Kraay (1993), with the difference that 458 nm instead of 488 nm was used as excitation wavelength.
Chl a and cell concentrations of the respective phyto- plankton groups before and after the incubations were used to calculate apparent (k) and specific (p) growth rates as well as specific grazing mortality rates (g) according to Landry & Hassett (1982). Linear regres- sions of dilution plots (apparent growth rates vs dilu- tion factor) were considered significant at p < 0.05. Only those data were used for further calculations. Percentages of phytoplankton standing stock con- sumed per day were calculated as % cons. = (1 - e s ) X
100; percentages of primary production consumed per day as % cons. = @/p) X 100. Absolute ph.ytoplankton consumption rates were calculated using the average phytoplankton concentrations (C) in the incubation bottles according to Frost (1972): C,,,, = (C) X (1 - eg). Chl a-based total phytoplankton carbon consumption rates were estimated using a C:chl a conversion factor of 190 which was determined experimentally by relat- ing flow cytometric cell counts (using the cell-to- carbon conversion factors) and red fluorescence inten- sities to fluorometrically measured chl a concentrations as described in detail by Veldhuis et al. (1997).
Cell numbers were converted to carbon biomass according to Veldhuis et al. (1997): Synechococcus 175 fg C cell-' and Prochlorococcus 92 fg C cell-'. Approximate picoeukaryotic cell sizes were calculated after examining polycarbonate filters retaining ca 50 %
of the respective picophytoplankton group (filters in the range of 8 to 0.45 pm pore size were used). Using a volume-to-carbon factor of 220 fg C pm-"Booth e t al. 1988), and depending on the variation in scatter signals, a carbon content of 975 (Stn SB2), 1880 (Stn US1) and 2500 fg C cell-' (other stations) was assumed for the small picoeukaryotes, and 5090 fg C cell.' for the large plcoeukaryotes.
RESULTS
Hydrography and phytoplankton composition
Strong northwesterly winds (4 to 7 Bft, average 5) prevailed during the investigation period. A sharp thermocline was detected only at the southernmost stations in the Somali Basin, and mixed layer tempera- tures ranged between 25.4 and 26.g°C. Mixed layer concentrations of nitrate were low but not depleted in the southern Somali Basin (0.13 to 0.23 PM), but increased substantially in the northern Somali Basin and the Gulf of Aden (0.8 to 1.53 pM), while in the southern Red Sea, concentrations were as low as 0.02 to 0.4 pM (Table 1). Generally, a distinct nutricline coincided with the thermocline. Meteorological condi- tions and decreasing water temperatures indicated a wind-induced entrainment of nutrient-enriched water from deeper layers into the surface layer, both in the northern Somali Basin (elevated concentrations at US2 and SI) and the Gulf of Aden (GA2). Mixed layer con- centrations of phosphate (0.3 to 0.5 PM) and silicate (1.5 to 2.5 PM) were also low but not depleted.
Chlorophyll concentrations were low in the Somali. Basin and Gulf of Aden ( ~ 0 . 5 pg dm-7; only in the southern Red Sea did chl a concentrations exceed 1 pg dm-3 (Table 1). A distinct deep chlorophyll maximum was absent at all stations. Phytoplankton in the Somali Basin was dominated by picoplankton, specifically Synechococcus, Prochlorococcus and some unidenti- fied pico- and nano-eukaryotes. At some stations, sub- groups of Synechococcus and Prochlorococcus (dim and bright fluorescent) could be discriminated (Table 2). HPLC (high-performance liquid chromatog- raphy) pigment analysis indicated the presence of Prymnesiophyceae, Pelagophyceae, and Micromonas- type phytoplankton species (Veldhuis et al. 1994). Dinoflagellates were also abundant during the entire cruise (Gymnodinium and Amphidinium species), while cryptophytes were present only in low numbers. Prochlorococcus was present in the Somali Basin (up to 66000 cm-3), but virtually absent in the inner Gulf of Aden and the southern Red Sea, while Synechococcus was present in high abundances (up to 142000 cm-3) throughout the cruise. In the Gulf of Aden (GA2) and

266 Aquat Microb Ecol 12: 263-273, 1997
Table 2 Cell concentrations (cells cm-3) of photosynthetic picoplankton at the beginning of the experiments analyzed by flow cytometry. ' Prochlorococcus not analyzed, -: not detected
I Expt Stn Prochlorococcus Dim Bright Synechococcus Dim Br~ght Small euks Ldrye euks
Table 3. Results of chl a-based dilution grazing experiments (representing the total phytoplankton population). Growth and grazing coefficients derived from dilution plots (apparent growth rate vs dllution factor) accord- ing to Landry & Hassett (1982). Consumption rates calculated according to Frost (1972). ns: linear regressions of dilution plots not significant (p > U.ir5)
Stn Growth Grazlng Consumption of ( l ) g (d-l) Chl a Carbon
(mg m-3 d-l) (mg m-3 d-l)
phytoplankton growth rates in the micro- zooplankton grazing treatments also showed 1 division d-l on average (p = 0.67); h ~ l ~ ~ l l e r , picoph ytoplankton qrazing mor- tality rates caused by microzooplankton were in the same range, resulting in a quasi- steady-state system with grazing losses compensated by growth (filled circles in
the southern Red Sea (RS2), a highly diverse phyto- plankton community was found, consisting of large diatoms (Chaetoceros, Nitzschia, Coscinodiscus, Bid- dulph~a) , dinoflagellates (Gymnodinium and Amphi-
SB2 0.653 0.192 0.07 14.16 0.442 12 ns US1 0.595 0.042 0.02 3.22 0.076 12 ns US2 0.520 0 201 0.08 15.33 0.630 12 <0.05 S1 0.928 0.503 0.18 34.69 0.729 12 <0.01
dinium) and cryptophytes, as well as Phaeocystis-type colonies.
Fig. 2, Table 5). Total phytoplankton carbon consump-
tion rates by microzooplankton increased from the Somali Basin (US2 and SI)
Phytoplankton growth and grazing mortality by microzooplankton
Results of microzooplankton dilution grazing experi- ments are summarized in Tables 3 & 4. Grazing on total phytoplankton (based on chl a ) increased from the south- ern stations towards the northern Somali Basin, the Gulf of Aden and the southern Red Sea (Table 3). Total phyto- plankton (chl a ) grazing mortality rates were generally lower than specific growth rates, indicating an overall in- crease in phytoplankton biomass over time (Fig.2: chl a, open squares). However, in the Gulf of Aden (GA2) and the southern Red Sea (RSl), specific growth and grazing
12 <0.01 towards the Gulf of Aden (GA2) and the
12 <0.01 southern Red Sea (RSI and RS2; Table 3). 12 <0.01 I There, carbon consumption by microzoo-
plankton was highest (148 mg m-3 d-' at RS1). Picophytoplankton carbon con-
sumption was relatively conservative throughout the cruise and made up total phytoplankton consumption in the Somali Basin (Fig. 3A; US2 and SI). However, in
Sedy Slate Lire / Ir=g
/
mortality rates were higher and grazing loss by micro- Fig. 2. Relationship between specific growth and grazing
zooplankton roughly accounted for total phytoplankton mortality rates phytop1ankton, as Ineasured in the dilution experiments. Data from Table 4 , sorted for the dif-
biomass production, p = g 3). On average' ferent grazer size class incubations (only data at p 0.05 ~ h ~ t o ~ l a n k t o n (chl a ) divided once a day @J = 0.72; plotted). Dotted line represents steady-state conditions,
2.0 - ' Gr- Sue Classes
Table 5). Flow cytometrically estimated specific pico- where p = g
- F
- '0 m 8 1.5 -
P
X / e ~ m ( ~ . a ) 1 / / / a a m
*(+ / O <2$m
++ + <low m 1 m 1 0 / + --
E (I)
Popllatia, I m
/ L " g 0.0 ' , I I l 1
0.0 0.5 1.0 1.5 2.0 2 5 Speafic Growth Rate p (d 'l)

Keckerlnann & Veldhuis: Trophic interactions among plankton 267
Table 4 . As Table 3, but for picophytoplankton andlyzed by flow cytometry in slze-fractionation experiments. Results of exper- iments involving grazers c 2 pm not shown (ns)
Stn Growth v (d ' 1
Grazing g ( d ' 1
Consumption of r n Cells (no , cm-.' d.') Carbon [my m-:' d.')
Grazers c200 pm P ~ O ~ J / O I ' O C O C C ~ / ~ IJS2 GA2 Synechococcus SB2 u s 1 US2 GA2 RS2 Small picoeukaryotes SB2 US1 US2 GA2 Large picoeukaryotes GA2 RS2 Grazers c20 pm Prochlorococcus u s 2 GA2 Synechococcus US2 GA2 Small picoeukaryotes US2 GA2 Large picoeukaryotes GA2 Grazers c10 pm Prochlorococcus US2 S I GA 2 Synechococcus u s 2 S1 GA2 Small picoeukaryotes u s 2 SI GA2 Large picoeukaryotes S1
Grazers c3 pm Proch1orococcus US2 S1 GA2 Synechococcus US2 S1 GA2 Small picoeukaryotes US2 S 1 GA2 Large picoeukaryotes S1

Reckermann & Veldhuls: Trophic interactions among plankton 269
Picophytoplankton growth and grazing mortality by nanozooplankton
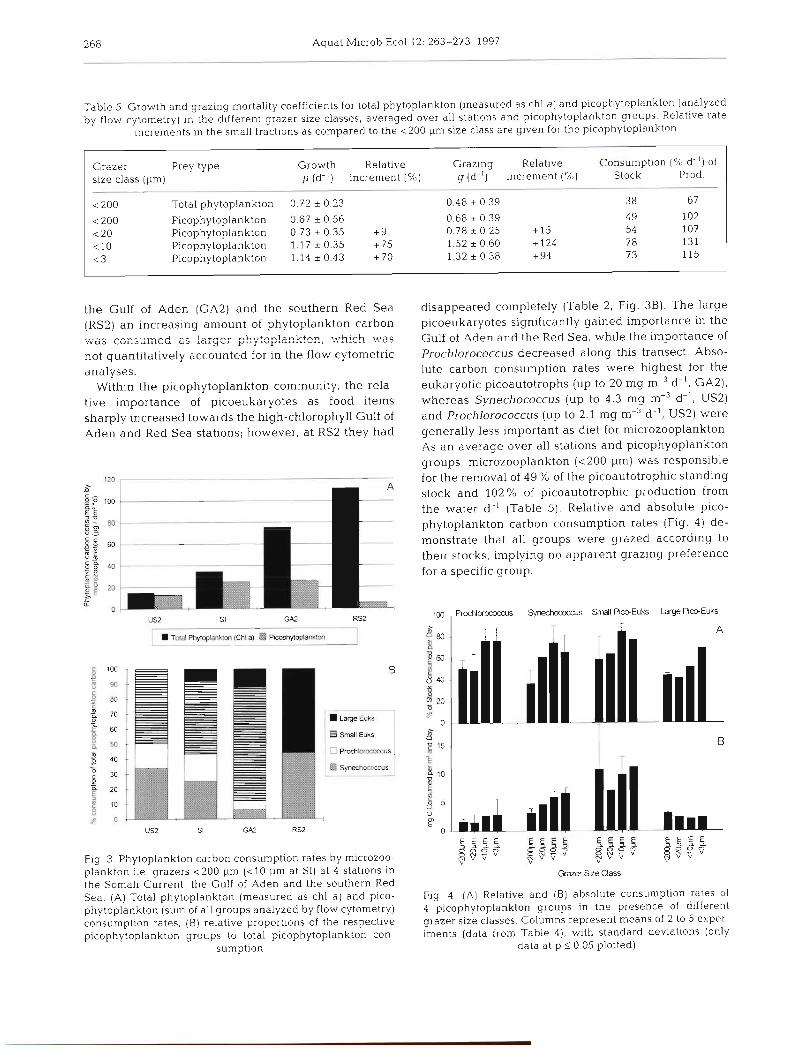
Removal of the microzooplankton and larger nanozooplankton (10 to 200 pm) from the incubation water resulted in a considerable increase of grazing pressure on the autotrophic picoplankton (Figs. 2 & 4, Table 4) . In the samples containing the entire nano- (c20 pm) and microzooplankton (c200 pm), rates for all picoplankton groups were much lower and in the similar range as for chl a (Fig 2). Hence, the larger microzooplankton obviously exerted a strong control over first-order consumers of the picoplankton, there- by relieving the picoplankton from being grazed. As an average over all stations and picophytoplankton groups, grazers c l 0 and c 3 pm consumed 78 and 73 % of the picoautotrophic standing stock d-l, and 131 and 115% of picoautotrophic production d-l, respectively (Table 5). The prokaryotic genera Proch1orococcus and Synechococcus, as well as the small eukaryotic picoau- totrophs, experienced the highest growth and grazing mortality rates in the small size fractions < l 0 and < 3 pm; the rates for the large picoeukaryotes in these fractions were lower (Table 4) .
At some stations, sub-populations of Prochlorococcus and Synechococcus could be analyzed, termed 'dim' and 'bright', according to their red fluorescence inten- sity (Table 2). While the 2 sub-groups of Synechococ- cus showed similar growth and grazing rates, the dynamics of the 2 sub-populations of Prochlorococcus were remarkably different: the 'dim' type showed growth rates slightly exceeding grazing mortality, whereas the 'bright' type virtually did not grow but experienced the same grazing pressure as the 'dim' type (Fig. S), consequently it decreased in biomass. As for all analyzed picoautotrophic groups, growth and grazing mortality rates were dramatically elevated in the absence of grazers > l 0 pm.
DISCUSSION
Phytoplankton growth and grazing mortality by microzooplankton
Our data indicate a highly dynamic turnover of autotrophic picoplankton in the western Arabian Sea. Picophytoplankton divided roughly once a day, the same rate at which they were removed from the water column by microzooplankton grazing. This implies a balanced steady-state system with respect to this very small phytoplankton. However, we found that larger phytoplankton biomass could increase with specific growth rates exceeding grazing mortal- ity rates. The same effect was described in the equa-
Steady State Lne /)1=9
/ e c l o ~ m /
0.0 0.5 1 .O 1.5 2.0 2.5 Specific Grawth Rate p (d .l)
Fig. 5. As Fig. 2, for 2 Prochlorococcus and Synechococcus sub-populations ('dim' and 'bright' types). Respective grazer size classes are indicated for each data point (only data at
p 5 0.05 plotted)
torial Pacific by Landry et al. (1995a, b), where they found chlorophyll-based growth rates exceeding grazing estimates, while the picoautotrophic commu- nity was more or less in balance or experienced a net decrease due to high grazing rates at concomitantly lower growth rates. As mesozooplankton, the potent grazers of the large phytoplankton, had been removed from the incubations (c200 pm), the large phytoplankton could increase in biomass. On the other hand, the microbial food web remained more or less unaffected in these treatments, resulting in a balanced system. The proportion of larger phyto- plankton increased along the transect from the Somali Current into the Gulf of Aden and the Red Sea, and was increasing!^ utilized by microzooplank- ton, whereas the proportion provided by picoauto- trophs remained relatively constant (Fig. 3A). As the C:chl a ratio we used (190) was determined by flow cytometry (Veldhuis et al. 1997), it may overestimate phytoplankton carbon values at stations rich in chlo- rophyll (Gulf of Aden and Red Sea) to a certain ex- tent; for stations low in chlorophyll, however, such high ratios are reasonable (as discussed in detail by Buck et al. 1996). However, our interpretation with respect to the relative importance of the picoauto- trophic organisms as a diet for the microzooplankton remains unaffected.
Within the picoautotrophic compartment, eukary- otes gained importance with increasing chlorophyll concentrations, while Prochlorococcus decreased in concentration along this gradient and was virtually absent in the southern Red Sea. This confirms recent

Aquat Microb Ecol 12: 263-273, 1997
observations demonstrating Prochlorococcus to be a true open-ocean organism, largely restricted to oligo- trophic warm stratified waters (Lindell & Post 1995, Suzuki et al. 1995, Buck et al. 1996). However, hardly any rate estimates have been published for Prochloro- coccus. Goericke & Welschmeyer (1993) found rela- tively low growth rates in the Sargasso Sea (below 1 division d-l), while Vaulot et al. (1995) report on divi- sion rates of 1 d-' in the surface layer of the equatorial Pacific. Growth and grazing estimates from the same region are presented by Landry et al. (1995a, b): in their experiments, Prochlorococcus grazing mortality considerably exceeded specific growth rates, which were extraordinarily low (mostly p = 0 to 0.26 d-l). The existence of 2 different strains of Prochlorococcus had vccll demons:ratcd zzrr!iz: in the subtropical r\lort.h. Atlantic on the basis of pigment types (Goericke & Repeta 1993) and different chlorophyll and DNA con- tents at the HOT site (Hawaii, subtropical North Pacific; Campbell & Vaulot 1993). The data presented here suggest that the 2 sub-populations also may ex- perience different growth characteristics, with an apparently healthy growing population ('dim') and a hardly active one ('bright'; Fig. 5).
Phytoplankton grazing estimates from the Arabian Sea have been reported so far only by Burkill et al. (1993). During the autumn inter-monsoon period, they found Synechococcus to be a highly abundant and dynamic component of the food web, with growth and grazing mortality well in balance. Syne- chococcus was the dominant picoautotroph during our investigations in terms of cell numbers, but the picoeukaryotes, due to their larger size, dominated in terms of carbon biomass. They were the most impor- tant picoautotrophic carbon source for the microzoo- plankton (Fig. 3B). Prochlorococcus was less abun- dant by a factor of 4 during the NE monsoon (up to 66000 cm-" than during the spring inter-monsoon (up to 276000 cm-3; Veldhuis & Kraay 1993), so its contribution to micro- and nanozooplankton diet was rath.er low during this season. However, at abun-
dances typical for oligotrophic conditions (up to 350000 cm-3; e.g. Campbell & Vaulot 1993, More1 et al. 1993, Lindell & Post 1995, Buck et al. 1996), the nutritional importance of Prochlorococcus lliigllt be equal to, or even higher than, that of Synechococcus or the picoeukaryotes.
The sue-fractionation experiments suggest that small heterotrophic nanoflagellates (HNF) are the main consumers of Prochlorococcus, Synechococcus and picoeukaryotes in the Arabian Sea. Epifluores- cence analysis revealed that the vast majority of HNF (>go%) was smaller than 3 pm, with the biomass peak still within the <5 pm size range (data not shown). Small HNF are known to be mainly responsible for the removal of heterotrophic bacteria (e.g. Fenchel 1986): h ~ ~ t a r e also able to consume coccoid cyanobac- teria in sitv (Caron et al. 1991). Parslow et al. (1986) reported that the small HNF Pseudobodo (2 X 4 pm) is capable of rapidly reproducing on the picoeukaryotic alga Micromonas pusilla (1 to 2 pm) as sole food source. Calculations assuming HNF to be the only consumers of picoautotroph carbon imply that they could well be able to satisfy their daily carbon demand exclusively from this source (up to 1200% of their own body carbon consumed d-'; Table 6: daily ration). Although this assumption is a simplification (larger protozoa will probably contribute to the removal of picoautotroph carbon to a certain extent, and heterotrophic bacteria will still be a major diet for HNF), it nevertheless shows that c3 pm HNF may apply a vigorous grazing pressure on picophytoplank- ton. There is also direct microscopical evidence for the ingestion of autotrophic picoplankton by HNF: a large number of HNF <3 pm contained 1 or 2 whole or partly digested Synechococcus cells, which can be identified reliably by their bright yellow autofluores- cence under blue excitation. Although some dino- flagellates also contained Synechococcus cells, their frequency was much lower than the Synechococcus- containing HNF. Ciliates containing Synechococcus cells were not detected.
Table 6. Absolute picophytoplankton carbon consumption rates as the sum of all picophytoplankton groups in the <200 pm fractions (SI: < l 0 pm) at 4 stations in the Somali Current, the Gulf of Aden, and the Red Sea. Ambient HNF and total protozoan biomasses (HNF + ciliates + heterotrophic dinoflagellates) are given to estimate daily rations of the grazers [prey carbon ingested as %, ot grazer body carbon). Protozoan biomasses were derived from epifluorescence counts (data not shown) according to the
JGOFS protocols (Knap et al. 1994)
Stn P~cophytoplankton HNF Total protozoa consumption C biomass Daily ration C biomass Daily ration (mg m- ' d.') (mg m--') of HNF (%) (mg m-?) of protozoa ( ' X , )
US2 12.68 2.98 4 26 4.84 262 S1 25.08 2.12 1183 4.59 546 GA2 26.33 2.92 902 4 61 57 1 RS2 5.63 1.90 296 7.18 78

Keckermann & Veldhuis: Trophic interactions among plankton
Multiple trophic interactions within the microbial food web
The number of trophic levels within the micro- zooplankton comnlunity and the size of the pr~ncipal grazers of picoplankton are important variables when estimating carbon flux in picoplankton-dominated sys- tems. Eukaryotic and prokaryotic bacterivores have been found in the bacterial size class, i.e. 0.2 to 2 pm (Fuhrman & McManus 1984, Guerrero et al. 1986). Wikner & Hagstrom (1988) presented experimental evidence for the existence of 4 trophic levels in the size class 112 pm, with the primary bacterivores being smaller than 3 pm and controlled by the larger proto- zoa. Glibert et al. (1992) found a similar effect in size- fractionated grazing and NH,' regeneration ex- periments in Chesapeake Bay (USA) waters. When organisms > l 0 pm were removed from their incuba- t i o n ~ , ammonium regeneration rates increased signifi- cantly.
A linkage between the predators of the first-order consumers and the prey is a well-known feature in terrestrial ecology and limnology (trophic cascade; Carpenter et al. 1985. Strong 1992) and has recently also been described for marine pelagic food webs of different trophic conditions (Wikner & Hagstrom 1988, Weisse & Scheffel-Moser 1991, Hansen et al. 1993, reviewed in Verity & Smetacek 1996). For the Red Sea, Weisse (1989) reported on a 2-step protozoan food ch.ain. heterotrophic bacteria profit from larger proto- zoa feeding on the major bactenvores, the HNF. Our data indicate that this effect also applies to the auto- trophic picoplankton in the region. The enhanced grazing pressure on picophytoplankton in the absence of grazers > l 0 and >3 pm demonstrates that first-order consumers of picoplankton (i.e. the small HNF) are preyed upon by larger nanozooplankton and micro- zooplankton in the field, which act as carhnn mediators from picoplanktonic autotrophs to higher trophic lev- els. The extent of this transfer largely depends on the metabolic rates of the primary consumers of the auto- trophic picoplankton.
The elevated grazing rates in the fractions < l 0 pm may be due either to a n increased per cell ingestion rate at constant grazer biomass, or to an increased grazer biomass at constant per cell ingestion rates. The former possibility seems unlikely as initial prey con- centrations were identical in all parallel size fractiona- tions; hence, a n adjustment of the individual feeding effort as a reaction to different prey concentrations can be excluded. Moreover, extraordinarily high HNF growth rates have been measured in the absence of large predators by various authors (v > 2 d-l, corre- sponding to more than 3 doublings d-l; Sherr et al. 1983, Parslow et al. 1986, Kuosa 1991). Thus, if we
assume that the increased grazing rates are sympto- matic of an increased grazer biomass, it is possible to roughly estimate grazer growth and predation mortal- ity rates from the size-fractionated experiments. I t can then be estimated that grazers c10 pm more than doubled their biomass within 1 d when predators > l 0 pm were removed (increase of 124'%,; Table 5 ) , which is a realistic figure (see above). When these results are extrapolated to field conditions, this means that small HNF, like their prey, divide once a day, and are removed by their predators at a similar rate. This is a strong indication for the presence of a trophic cas- cade encompassing a t least 3 trophic levels within the nanoplankton: picoautotrophs - small HNF - larger protozoa.
In our experiments, the picophytoplankton also increased their specific growth rates when they were exposed to a n increased grazing pressure (on average by 75 %, in the < l 0 pm fractions relative to the <200 pm fractions; Table 5, Fig 2) . A close coupling between prey growth rates and grazing pressure (mediated by enhanced nutrient regeneration) has long been acknowledged as a prerequisite for the functioning of the microbial loop and has been demonstrated in labo- ratory and field experiments (i.e. Goldman & Caron 1985, Rassoulzadegan & Sheldon 1986, Berman e t al. 1987, Wikner & Hagstrom 1988). Similar to our find- ings, Glibert et al. (1992) found ammonium regenera- tion rates to be substantially higher in their c10 pm fractions as compared to the <200 pm fractions, and Ferrier & Rassoulzadegan (1991) demonstrated that autotrophic pico- and nanoplanktonic growth was limited by protozoan standing stocks or their re- mineralizing, i.e. grazing, activity. Our data indicate that this linkage between grazer and prey may hold true also in the presence of considerable amounts of new nutrients, at least for the prokaryotic pico- autotrophs and the small picoeuliaryotes. Such d pref- erential uptake of ammonium in small phytoplankton cells in the presence of excess nitrate has been demon- strated in the field (Harrison & Wood 1988, Wheeler & Kokkinakis 1990, Price et al. 1994). These observations strongly substantiate the notion of the ubiquitous nature of this tight coupling between the smallest phytoplankton and their primary grazers, with grazing mortality and growth as the 2 sides of the coin.
Our data imply the existence of a multi-step food chain with respect to the small phytoplankton in the Arabian Sea, as had been demonstrated earlier for heterotrophic bacteria in the same region (Weisse 1989). On the one hand, this means that a certain amount of phytogenic carbon is forwarded from the autotrophic picoplankton via small heterotrophic fla- gellates and larger protozoa to the mesozooplankton; on the other hand, the high turnover rates and the size

Aquat Microb %col 12: 263-273, 1997
of these first-order consumers indicate that this amount of picoplanktonic primary production reaching higher trophic levels will be smaller than in systems with larger herbivores. In such a system, where tiny primary producers (closely coupled to their grazers) represent the major fraction of primary production, recycling of nutrients and respiration within the euphot~c zone will be quite high. As we believe that the mechanisms described also apply to other oceans, the resulting great potential to recycle CO2 in the euphotic zone may help explain the minimal effect of iron fertilization on sea-surface CO2 concentrations (Watson et al. 1994) within the framework of the IRONEX I experiment (Martin et al. 1994), as supposed by Banse (1995). Although IRONEX I1 (Coale et al. 1996) succeeded in triggering a diatom 'u1oo111 (ijioinass iiiciease S%), associated with a considerable decrease of CO2 in sur- face waters (Cooper et al. 1996), picophytoplankton only doubled in biomass, and was tightly coupled to microzooplankton (i.e. protozoan) biomass. This obser- vation gives further evidence for a tightly coupled picophytoplankton-protozoa link which itself is rather loosely coupled to the food web involving larger organisms.
Acknowledgements. We thank Drs Martien A . Baars, Peter H. Burkill, Bodo von Bodungen. Falk Pollehne and Karin Lochte for l~vely discussions and critical reading of earlier versions of the manuscript. Gjisbert W. Kraay for supplying the chloro- phyll data, and Karel M. J . Bakker for the nutrient data. Spe- cial thanks to the chief scient~st of the project B-cruises of the Netherlands Indian Ocean Programme, 4Iartien Baars, and to the dedicated technical staff and crew of RV 'Tyro'
LITERATURE CITED
Baars MA, Bakker KMJ, de Bruin TF, van Coutvelaar M, Hiehle MA, Kraay GW, Oosterhuis SS. Schalk PH, Sprong I, Veldhuis MJW, Wiebinga CJ. Witte JIJ (1994) Seasonal fluctuations in, plankton hlomass and productivity in the ecosystems of the Somali Current, the Gulf of Aden and southern Red Sea. In: Baars MA (ed) Monsoons and pelagic systems. Crulse Report Vol 1 of the Netherlands Indian Ocean Programme, National Museum of Natural History, Leiden, p 13-34
Banse K (1995) Community response to IRONEX. Nature 375: 112
Berman T, Nawrocki M, Taylor GT, Karl DM (1987) Nutrient flux between bacteria, bacterivorous nanoplankton protists and algae. Mar Microb Food LVebs 2(2):69%82
Booth BC. Lewin J , Lorenzen CJ (1988) Spring and summer growth rates of subarctic Pacific phytoplankton assem- blages determined from carbon uptake and cell volumes estimated using epifluorescence microscopy. Mar Bio1.98: 287-298
Buck KR. Chavez FP, Campbell L (1996) Basin-wide distribu- tions of living carbon components and the inverted trophic pyramid of the central gyre of the North Atlantic Ocean, summer 1993. Aquat Microb Ecol 10:283-289
Burkill PH, Leakey RJG, Owens NJP, Mantoura RFC (1993) Synechococcus and its importance to the microbial food
web of the northwest Indian Ocean. Deep Sea Res I1 40: 773-782
Campbell L, Nolla HA, Vaulot D (1994) The importance of Prochlorococcrr.~ to community structure In the central North Pacific Ocean. Limnol Oceanogr 39(4):954-961
Campbell L, Vaulot D (1993) Photosynthet~c picoplankton community structure in the subtropical North Pacific Ocean near Hawaii (station ALOHA). Deep Sea Res 1 40(10):2043-2060
Caron DA, Lim EL. Miceli G, Waterbury JB, Valois FW (1991) Grazlng and utll~zation of chroococcoid cyanobac- teria and heterotrophic bacteria by protozoa in laboratory cultures and a coastal community. Mar Ecol Prog Ser 76: 205-217
Carpenter SR, Kitchell JF, Hodgson JR (1985) Cascading trophic interactions and lake productivity. BioScl 35(10): 634-639
Chisholm SW, Frankel SL, Goericke R , Olson RL, Palenik B, Waterbury JB, West-Johnsrud L, Zettler ER (1992) Pro- chlorococcus marinus nov. gen. nov. spec.: an oxyphoto- trophic marine prokaryote containing divinyl chlorophyll a and b. Arch Microb 157:297-300
Coale KH and 19 co-workers (1996) A massive phytoplankton bloom induced by an ecosystem-scale Iron fertilization experiment in the equatorial Pacific Ocean. Nature 383: 495-501
Cooper DJ, Watson AJ, Nightingale PD (1996) Large decrease in ocean-surface CO2 fugacity in response to in situ fer- tilization. Nature 38351 1-513
Fenchel T (1986) The ecology of heterotrophic microflagel- lates. Adv Microb Ecol 9:57-97
Ferrier C , Rassoulzadegan F (1991) Density-dependent effects of protozoans on specific growth rates in pico- and nano- planktic assemblages. Llmnol Oceanogr 36(4):657-669
Fogg GE (1995) Some comments on picoplankton and its importance in the pelagic ecosystem. Aquat Mlcrob Ecol 8:33-39
Frost BW (1972) Effects of size and concentration of food particles on the feeding behaviour of the manne plank- tonic copepod Calanus paclficus. Limnol Oceanogr 17(6): 805-815
Fuhrman JA. McManus GB (1984) Do bacteria-sized marine eukaryotes consume significant bacterial production? Science 224: 1257-1260
Glibert PM, Miller CA, Garside C, Roman MR, McManus GB (1992) NH,+ regeneration and grazing: Interdependent processes in size fractionated I5NH4+ experiments. Mar Ecol Prog Ser 82-65-74
Goericke R, Repeta DJ (1993) Chlorophylls a and b and divinyl chlorophylls a and b in the open subtropical North Atlantic Ocean. Mar Ecol Prog Ser 101:307-313
Goericke R, Welschmeyer NA (1993) The marine prochloro- phyte Prochlorococcus contributes significantly to phyto- plankton biomass and primary production in the Sargasso Sea. Deep Sea Res 140(11/12):2283-2294
Goldman JC, Caron DR (1985) Expenmental studies on an omnivorous microflagellate: implications for grazing and nutrient regeneration in the marine microbial food chain. Deep Sea Res 32(8):899-915
Guerrero R, Pedros-Alio C, Esteve I, Mas J , Chase D, Margulis L (1986) Predatory prokaryotes: predation and primary consumption evolved in bacteria. Proc Natl Acad Sci USA 83:2138-2142
Hansen FC, Reckermann M, Kleln Breteler LVCM, R~egman R (1993) Phaeocystis blooming enhanced by copepod preda- tion on protozoa: evidence from Incubation experiments. Mar Ecol Prog Ser 102:51-57

Reckern~ann & Veldhuis: Trophic interactions among plankton 273
Harrison WG, Wood LJE (1988) Inorganic nitrogen uptake by marine picoplankton: evidence for size partitioning. Limnol Oceanogr 33(3):468-475
Jochem FJ (1995) Phototrophic picoplankton community structure in three different pelagic regimes in the Arabian Sea. Mar Ecol Prog Ser 117:307-314
Johnson PW, Sieburth JM (1979) Chroococcoid cyanobacteria in the Sea: a ub~quitous and diverse phototrophic biomass. Limnol Oceanogr 24:928-935
Johnson PW, Sieburth JM (1982) In-situ morphology and occurrence of eukaryotic phototrophs of bacterian size in the picoplankton of estuarine and oceanic waters. J Phycol 18.318-327
Knap A, Michaels A, Close A, Ducklo~v H , Dickson A (eds) (1994) Protocols for the Joint Global Ocean Flux Study (JGOFS) Core Measurements. JGOFS Report No. 19. Re- print of the IOC Manuals and Guides No. 29, UNESCO 1994. lnternet address: http://ads.smr.uib.no/jgofs/publicat.htm
Kuosa H (1991) Picoplanktic algae in the northern Baltic Sea: seasonal dynamics and flagellate grazing. Mar Ecol Prog Ser 73:269-276
Landry MR, Hassett RP (1982) Estimating the grazing impact of marine micro-zooplankton. Mar Biol67:283-288
Landry MR. Kirshtein J , Constantinou J (1995a) A refined di- lution technique for measuring the community grazing im- pact of microzooplankton, w ~ t h expenmental tests in the central equatorial Pacific. Mar Ecol Prog Ser 120:53-63
Landry MR, Kirshtein J , Constantinou J (1995b) Microzoo- plankton grazing in the central equatorial Pacific during February and August 1992. Deep Sea Res 11 42(2-3): 657-671
Lindell D, Post AF (1995) Ultraphytoplankton succession is triggered by deep winter mixing in the Gulf of Aqaba (Eilat), Red Sea. Limnol Oceanogr 40(6):1130-1141
Lochte K, Turley CM (1988) Bacteria and cyanobacteria asso- ciated with phytodetritus in the deep sea. Nature 333: 67-69
Martin JH and 44 co-workers (1994) Testing the Iron hypoth- esis in ecosystems of the equatorial Pacific Ocean. Nature 371: 123-129
Monger BC, Landry MR (1993) Flow cytometric analysis of marine bacteria with Hoechst 33342 Appl Environ Micro- bl01 59:905-911
Morel A. Ahn YH, Partensky F, Vaulot D, Claustre H (1993) Prochlorococcus and Synechococcc~s: a comparative study of their optical properties in relation to their size and pig- mentation. J Mar Res 51:617-649
Olson RJ, Chisholm SW, Zettler ER, Altabet MA, Dusenberry JA (1990) Spacial and temporal distributions of prochloro- phyte picoplankton in the North Atlantic Ocean. Limnol Oceanogr 37(6):1033-1051
Parslow JS, Doucette GJ, Taylor FJR, Harrison PJ (1986) Feeding by the zooflagellate Pseudobodo sp. on the picoplanktonic prasinomonad Micromonas pusilla. Mar Ecol Prog Ser 29:237-246
Pollehne F, Klein B, Zeitzschel B (1993) Low light adaptation and export production in the deep chlorophyll maximum layer in the northern Indian Ocean. Deep Sea Res I1 40: 737-752
Price NM, Ahner BA, Morel FMM (1994) The equatorial Pacific Ocean: grazer-controlled phytoplankton populations in a n iron-limited ecosystem. Limnol Oceanogr 39(3):520-534
Rassoulzadegan F, Sheldon RW (1986) Predator-prey interac- tions of nanozooplankton and bacteria in an oligotrophic marine environment. Limnol Oceanogr 31(5):1010-1021
Responsible Subject Editor: S. Chisholm, Cambridge, Massachusetts, USA
Sherr BF, Sherr EB, Berman T (1983) Grazing, growth and ammonium excretion rates of a heterotrophic microflagel- late fed with four species of bacteria. Appl Environ Micro- biol 45(4):1196 -1201
Sherr EB, Sherr BF. Paffenhofer GA (1986) Phagotrophlc pro- tozoa as food for metazoans: d 'missing' t roph~c link in ma- rine pelagic food webs? Mar Microb Food Webs 1(2):61-80
Sieracki ME. Haugen EM, Cucci TL (1995) Overestimation of heterotrophic bacteria in the Sargasso Sea: direct evi- dence by flow and lnlaglng cytometry. Deep Sea Res I 4218) 1399-1409
Sinion N. Barlow RG, Mane D, Partensky F, Vaulot D (1994) Characterization of oceanic photosynthetic picoeukary- otes by flow cytometry. J Phycol 30.922-935
Stl-ong DR (1992) Are trophic cascades all wet? Dlfferentiation and donor-control in speciose ecosystems. Ecology 73(3): 747-754
Suzuki K, Handa N, l y o s a w a H, Ishizaka J (1995) Distribu- tion of the prochlorophyte Prochlorococcus in the central Pacific Ocean as measured by HPLC. Limnol Oceanogr 40(5):983-989
Vaulot D. Marie D, Olson RJ. Chisholm SW (1995) Growth of Prochlorococcus, a photosynthetic prokaryote, in the equatorial Pacific Ocean. Science 268:1480-1482
Veldhuis MJW, Kraay GW (1993) Cell dbundance and fluo- rescence of picoplankton in relation to growth irradiance and n~trogen availability in the Red Sea. Neth J Sea Res 31 135-145
Veldhuls hlJW, Kraay GW, Gieskes WWC (1993) Growth and fluorescence characteristics of ultraplankton on a north- south transect in the eastern North Atlantic. Deep Sea Res 40:609-626
Veldhuis MJW, Kraay GW, van Bleijswijk J (1994) Phyto- plankton biomass and productivity. In: Baars MA (ed) Monsoons and pelagic systems. Cruise Report Vol 1 of the Netherlands Indian Ocean Programme, National Museum of Natural History, Leiden, p 45-54
Veldhuts MJW, Kraay GW. van Bleijswijk J. Baars MA (1997) Seasonal and spatial variability of phytoplankton biomass, productivity and growth in the north-western Indian Ocean (the SW and NE monsoon 1992-1993). Deep Sea Res 1 (in press)
Ver~ty PG, Smetacek V (1996) Organism llfe cycles, preda- tlon, and the structure of marine pelagic ecosystems. Mar Ecol Prog Ser 130:277-293
Waterbury JB, Watson SB. Guillard RRL, Brand LE (1979) Widespread occurrence of a unicellular, marine, plank- tonic cyanobacterium. Nature 277:293-294
Watson AJ and 10 co-workers (1994) Minimal effects of iron fertilization on sea-surface carbon dioxide concentrations. Nature 371:143-145
Weisse T (1989) The microbial loop in the Red Sea: dynamics of pelagic bacteria and heterotrophic nanoflagellates. Mar Ecol Prog Ser 55:241-250
Welsse T, Scheffel-Moser U (1991) Uncoupling the microbial loop. growth and grazing loss rates of bacteria and hetero- trophic nanoflagellates in the North Atlantic. Mar Ecol Prog Ser 71:195-205
Wheeler PA, Kokkinakis SA (1990) Ammonium recycling limits nitrate use in the oceanic subarctic Pacific. Limnol Oceanogr 35:1267-1278
Wikner J , Hagstrijm A (1988) Evidence for a tightly coupled nanoplanktonic predator-prey link regulating the bacteri- vores in the marine environment. Mar Ecol Prog Ser 50: 137-145
Manuscript first received: April 4, 1995 Revised version accepted: February 3, 1997