Embed Size (px)
Citation preview

4. SEASONAL PROGRESSION OF THEARABIAN SEA MONSOON*
This section describes the typical sequences of weather events that occurduring the four basic seasons of the Arabian Sea region. Climatological chartssupporting the discussions are presented in Appendix A, and it is recommended
that the reader refer to them frequently for a clearer visualization of thesubject. Included in this appendix are monthly charts of surface wind roses forboth the Arabian Sea and Gulf of Aden; airflow charts at 3000 and 10,000 ft;
and streamline analyses for the months of January, May, July and October for the500-mb, 300-mb and 200-mb levels. Also included are climatological charts ofsuch significant meteorological parameters as mean cloud amounts, mean air andsea-surface temperatures, visibilities (less than 2 n mi), tropical storm tracksand sea heights.
Interpretation of the sea height charts, which are presented in two formats,requires some explanation. In the first, the frequencies of sea waves greaterthan or equal to 10 feet were constructed from data in various volumes of theSummary of Synoptic Meteorological Observations published by the U.S. NavalWeather Service Command. This sea wave data (A-33) includes only waves generatedby the local winds in the vicinity of the observer. Also, the heights are the
"significant" heights -- the average of the one-third-highest sea waves. Thesecond format (A-34) provides isoline analyses of the mean "significant" waveheights (U.S. Naval Weather Service Command, 1g74a). Data on these analyses
include both sea and swell waves. If both are present in an observation, onlythe higher of the two is used. However, if only one of the wave groups isobserved, either sea or swell, this one group is used in the summary.
Although climatological information for various ports is not included inAppendix A, this information is easily obtained from Climatic Summaries forMajor Indian Ocean Ports and Waters (U.S. Naval Weather Service Command,1974a). It must be emphasized that although several illustrations from theSummaries have been reproduced in this document for the convenience of thereader, reference to the Summaries themselves is a necessity for the operationalforecaster in the Arabian Sea.
References are made in this section to illustrations contained inAppendixes A, B and C. For brevity within text, these references will oftenappear simply as the referenced figure's number, e.g., (A-l) (B-2), ratherthan in the longer form (see Figure A-i) (see Figure B-2).
4-1
In the following discussions of seasonal events, information in Section 3is frequently referenced. In this way, emphasis can be placed on important
variations from the normal in both time and space as well as on possible aids
to the forecasting of significant meteorological phenomena.
4.1 THE WINTER MONSOON - DECEMBER THROUGH MARCH
Because of the extensive mountain barrier to the north of the Arabian Sea,
the region's winter monsoon is much weaker than the northeast monsoon of the
South China Sea (Cuming, 1973). as is also the case in the Bay of Bengal. The
surface wind roses (A-2. A-3, A-4, A-13) show wind speeds on the average under
10 kt over the northern Arabian Sea and under 21 kt in the south. With these
relatively light winds, sea heights are generally low (A-33, A-34) -- only
along the Somali coast are the mean wave heights greater than 4 ft. However,
and probably due to the cold surges (see Para. 3.4.2), locally wind-generated
waves do reach 10 ft at times (<5% frequency) in the western Arabian Sea. It
is also quite likely that behind an extremely strong cold front, winds and seas
in the northern Arabian Sea reach much higher values. (The example shown in
Figures C-l through C-3 is probably such a case.) Wind directions during the
winter monsoon are generally from the northeast. The easterly winds in the
Gulf of Aden are directed by the channeling effect of the mountains on either
side of this gulf.
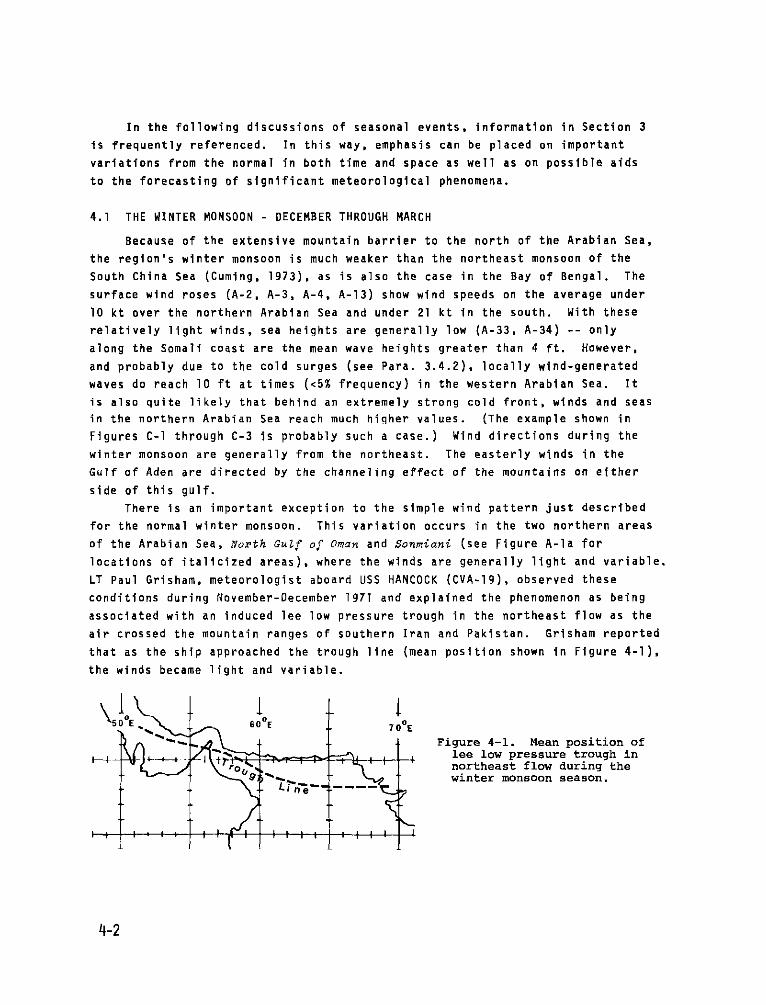
There is an important exception to the simple wind pattern just described
for the normal winter monsoon. This variation occurs in the two northern areas
of the Arabian Sea, North Gulf of Oman and Sonmiani (see Figure A-la for
locations of italicized areas), where the winds are generally light and variable.
LT Paul Grisham, meteorologist aboard USS HANCOCK (CVA-19). observed these
conditions during November-December 1971 and explained the phenomenon as being
associated with an induced lee low pressure trough in the northeast flow as the
air crossed the mountain ranges of southern Iran and Pakistan. Grisham reported
that as the ship approached the trough line (mean position shown in Figure 4-1),
the winds became light and variable.
Figure 4-1. Mean position oflee low pressure trough innortheast flow during thewinter monsoon season.
4-2

During the winter monsoon, cloud amounts are generally small and visibili-
ties are good over the Arabian Sea (A-30a, A-32a, b). The cloud amountsincrease southward, however, with a maximum at 5SN near the position of the
weak Northern Hemisphere near-equatorial trough (see Figures A-14, A-15, A-16
and A-25 for lower troposphere positions of this trough during winter).Although the mean cloud amounts are higher over the Bay of Bengal then
over the Arabian Sea during the winter monsoon (A-30a), somewhat more low-level
cumulus and stratocumulus are observed over the Arabian Sea, especially southof 20'N. This cloudiness is generally found between 60-65°E spreading outtoward the south-southwest and south. Figure 4-? for 27 January 1974 shows an
excellent example of this cloudiness. Gurunadham (1971) attributes this rather
semipermanent cloudiness to the cold dry air that travels toward the south overthe northern Arabian Sea and picks up moisture by evaporation from a relativelywarm water surface that is about 10C warmer than the air, especially during thefirst half of winter (A-31). The cold air is associated with cold surges (rare
in the Bay of Bengal) following western disturbances (see Para. 3.4.2). In thisregard, it will be interesting to note that the satellite photograph in Figure4-2 was taken one day after the cold surge shown in Figures C-i through C-3.
Gurunadham believes that an indication of the strength of the cold air invadingthe Arabian Sea, and thus of the wind strength, is the increased density of thesmall packed cells of clouds, often in bands, that spread out in the direction
of the low-level winds.Another common weather phenomenon of the northern Arabian Sea is the
occurrence of dust associated with cold fronts moving off the Arabian Peninsula(see Para. 3.4.2). LT Grisham on USS HANCOCK reported such a situation during
November 1973:
"The heavy dust which enveloped the northern Arabian Sea wasnot detected by marine observers for a period of about six to eighthours after the cold frontal passage (about midnight local time).The earlier sunset revealed an otherwise clear sky to be quite red.indirectly indicating dust to be present in the atmosphere. Thepassage of the dry front was determined with reasonableness by amarked drop in dew point temperature, a sharp wind shift and increasein wind speed and, most importantly, by surface analysis continuity.
Shortly after daybreak a heavy cloud was detected on the westernhorizon by observers aboard a USN unit. This rapidly-moving cloudappeared to be fog, even though a check of the measurable parametersindicated that the air was much too dry to support such a phenomenon.Within an hour of the first sighting, the ship was enveloped by dustwhich reduced horizontal visibility to two miles and slant rangevisibility to 1/2 mile. The tops were measured by aircraft to be8500 feet and further indicated that the dust was continuous atleast 300 nm in all directions. The next day showed visibilities of5-7 miles. The atmosphere was not clean for about one week."
4-3

a
Figure 4-2. Satellite photograph showing typical cloudiness in the ArabianSea region during the winter monsoon. 0451 GM 27 January 1974 (NOAA-2).
4-4

Although wind speeds In this case reached only 15-20 kt, It is quite likelythat gale force winds might be expected in stronger situations (see example inAppendix C). It has been shown that high-resolution DMSP data are very usefulas indicators of the horizontal extent of such a dust storm.
Similar cases of dust and dust haze, but covering a much more extensivearea, are documented in the literature. In one notable case, a cold wave andextensive dust haze covered practically the whole of India during the secondweek of February, 1950.
Cold fronts associated with western disturbances and moving out over thenorthern Arabian Sea have been known to cause other changes in the normal wintermonsoon weather. Observers aboard USS HANCOCK noted that cold fronts on twooccasions resulted in the development of a well-defined surface high pressurecell over the northern Arabian Sea separate from the high pressure cell to thenorth. With this change in the pressure pattern, southerly winds accompaniedby cloudiness were observed along the southeast coast of the Arabian Peninsula.However. the cloudiness lost its vertical characteristics on moving into thearea of the high, and was observed in that reqion to be stratocumulus capped bya strong inversion at about 4000 feet.
Rain, though rare, is another effect seen in conjunction with slow-movingcold fronts during the winter monsoon. Observers aboard SS ENTERPRISE (CVN-65)reported that during a five-day period in the Gulf of Oman in January 1975.
two weak western disturbances crossed the Persian Gulf. The associated slow-moving cold fronts moved southeastward across the Gulf of Oman causing 1000 ftceilings and rain.
Among mesoscale effects to be exoected are land/sea breezes along theArabian Sea coastlines (see Para. 3.5.1), such as those at the port of Mombasa,Kenya, where observers on USS ENTERPRISE reported a strong sea breeze regimeduring the winter monsoon. Although Mombasa is south of the equator, radiationalcooling over the Arabian Peninsula coupled with radiational heating over theKalahari Desert causes the northeast flow of the winter monsoon to affect thisregion (see surface wind roses in Figures A-2a, A-3a. A-4a and A-13a). Thewinter monsoon flow is so enhanced by the afternoon sea breeze at Mombasa that
the northeasterlies increase to 18-25 kt each afternoon.Tropical cyclones during the winter monsoon are extremely rare, and only
during December have such storms been recorded. Figure A-36j shows their tracks.
4-5

4.2 THE SPRING TRANSITION SEASON - APRIL THROUGH MAY
During April and May, changes in the surface flow which were firstdiscernible in the latter half of winter (February, March). take place rapidly.These changes are associated with both the slow northward movement of the near-equatorial trough and the development of a strong heat trough over the ArabianPeninsula and Indian subcontinent (between 200 N and 30'N).
At the surface (A-5), the winds in the northern Arabian Sea even by Aprilhave turned westerly in response to the developing heat trough. Over thesouthern half, the winds during April generally remain northeasterly as thenear-equatorial trough is normally still located to the south. An exception isthe Somati Coast SE area, most of which is south of the near-equatorial trough(A-17a). Wind speeds in all cases are light during April. It is only along theextreme northern coast, in response to the developing heat trough, that windsgreater than 21 kt appear in the wind rose summaries. These summaries, ofcourse, do not indicate the occurrence of the relatively rare tropical stormwith its much stronger winds. It is interesting to note that the winds over theGulf of Aden shown in Figure A-5b have continued easterly. However, it shouldbe remembered that the diurnal effects are present near the shores (seePara. 3.5.1).
By May, the effect of the continental heat trough on the surface winds (A-6)has become dominant except for the southern areas -- Arabian Sea SW, Arabian
Sea S and Arabian Sea SE -- which are still occasionally under the influenceof the near-equatorial trough. Wind speeds have increased markedly along theSomali coastal region where winds greater than 33 kt are reported and probablyare related to the development of the low-level jet (see Para. 3.1.2). Inconjunction with these speed increases, the frequency of locally generated seaheights greater than l0 ft are showing marked increases in the western ArabianSea (A-33a). The easterly winds in the Gulf of Aden are still present in May,but speeds have become extremely light. In the area N GuZf of Oman the windsare variable, a condition which appears to persist throughout the summer season.
The mean location of the near-equatorial trough aloft during the springtransition season, with its slow northward movement at both 3000 and 10,000 ft.is shown in Figures A-17 and A-lB. Note that along the eastern coast ofequatorial Africa, marked changes take place in the lower troposphere as thelow-level jet becomes established in May (see Para. 3.1.3).
Skies are generally clear and visibility good during the spring transitionseason. Comparing Figures A-30a and A-30b, it can be seen that except in theregion of the near-equatorial trough, the skies are actually clearer In springthan during the winter. Although sea-surface temperatures have shown markedincreases (A-31), the sea is no longer warmer than the air -- thus the lowcumulus and stratocumulus common during the winter have decreased.
4-6

It can be seen in Figure 4-3b that ships leaving the Gulf of Aden would probablyhave experienced combined sea heights of at least 9 ft on 21 May 1974. (Highwinds associated with tropical cyclones are rare at the port of Karachi,Pakistan (see Appendix D). until June, a summer monsoon month, when tropicalcyclones Influence this port.)
4.3 THE SUMMER MONSOON - JUNE THROUGH SEPTEMBER
From the standpoint of surface winds (used in the definition of the monsoongiven in Para. 2.1), the summer monsoon of the Arabian Sea is firmly establishedby June. Indian meteorologists who define the monsoon by the start of the rainy
season along the west coast of India, use a later date shown in Figure 4-4.Surface winds (A-7 through A-10) reach a maximum during July with the
highest speeds reported off the northern Somali coast where frequencies of windsgreater than 33 kt occur up to 28% of the time (see areas SomaZi Coast NE,
Socotra Ia. and Arabian Sea Sw). These winds are associated with the combined
effect of the low-level jet and cold upwelling of water off the Somali coast(see Para. 3.1.2). Excellent sources of forecasts in this region are theshipping broadcasts issued by the East African Meteorological Department.
Figure 4-4. Average onset dates of the rainy season.Roman numerals indicate months (from Ramage, 2971).
Wind speeds are usually lower in the Gulf of Aden (A-7b through A-lOb), but
strong diurnal effects are felt near the coast (Figure 3-27). Another important
feature in the vicinity of the Gulf of Aden is the mesoscale eddy at Ras Asir
(Cape Guardafui) discussed in Para. 3.5.2. The existence of this eddy, with
associated rapid wind changes as one travels from the Gulf of Aden to off the
Somali coast, is documented by observers aboard USS CHICAGO (CG-11) transiting
the area in Summer 1974:

The major meteorological events of the spring transition season (and the
autumn transition season as well) are tropical storms. Generally speaking, as
long as the near-equatorial trough remains over the sea, and the farther it
moves from the equator as during the spring, the more often tropical cyclones
will develop in it (see Para. 3.3.2). It must be remembered that this near-
equatorial trough does not move continuously northward, but changes locations
and intensities from day to day. Also, as the heat trough to the north develops,
the near-equatorial trough tends to weaken and finally disappear by the summer
monsoon season. Preferred tracks of tropical storms are shown in Figures A-35a
through A-35c for the months of April through June. The actual tracks for this
same period are found in Figures A-36b through A-36d.
Examples of two tropical storms that developed in the Arabian Sea during
the spring transition season are discussed in Para. 3.3.3 (see Appendix B for
satellite pictures). To give the forecaster an indication of what effect these
tropical storms had on the otherwise calm sea experienced during the spring
(A-34d, A-34e), a study by Brand et al. (1973) was used to estimate sea heights
at the time of maximum intensity of each storm. The combined sea height, a
parameter defined as the square root of the sum of the squares of the"significant" sea and swell height, was used in this study. As suggested for
analysis of South China Sea tropical cyclones, the average radii of the 9- and
15-ft isopleths of combined sea height for Arabian Sea tropical cyclones were
similarly reduced by 20% of the expected values of western North Pacific storms.
Asymmetry considerations described in the study were also included. The final
results are shown in Figures 4-3a and 4-3b for both the 9-ft and 15-ft isopleths.
Figure 4-3. Combined sea height around two tropical storms (9- and 15-footisopleths) obtained from equations modified for asymmetry in Brand et al.,1973: (a) 0000 GMT 15 April 1974 and (b) 0000 GMT 21 May 1974.
4-7

"Winds throughout the Gulf of Aden were from the southwest at15 to 25 kt increasing to a higher average of 20 to 30 kt when ahigh seas warning for the northern Arabian Sea was in effect. Theonly exception to this was found at the anchorage area approximately15 miles north of Cape Guardafui, where an eddy effect producedsoutheasterly winds averaging 10 to 15 kt or less. This continueduntil CHICAGO passed through 520 E, at which time the southwesterlywinds again prevailed. After rounding Cape Guardafui the windsincreased as expected to 30 to 40 kt with gusts to 45 kt from thesouthwest."
As the persistent strong winds would indicate, sea heights in the ArabianSea during the summer monsoon are high. Figure A-33 shows the the frequency oflocally driven sea heights greater than or equal to 10 ft, which occur over 40%of the time in the areas of Socotra Is. and Arabian Sea SW. The analyses inFigures A-34f, g, h show that the mean significant wave heights (includingswell) are 10-11 ft in this same general area from June through August, and itis quite possible that these results might even be on the low side. During theperiod 4 July to 7 August 1974, while USS CHICAGO was stationed along the
Somali coast, observers reported combined significant sea heights of 12 ft orgreater (up to 17 ft) 80% of the time.
The upper-level flow during the summer monsoon consists of deep westerliesup to 500 mb along the west coast of India (A-28a). Also a major feature is ashallower but strong low-level jet extending across the equator over Kenya andoff shore in the vicinity of Cape Guardafui (A-19 through A-22). Note thatalthough these analyses show the near-equatorial trough near the entrance of theGulf of Oman at 3000 ft and sloping southeastward with increasing height to aline at 10.000 ft from approximately 20ON along the west coast of India to thevicinity of Cape Guardaful, the surface (heat) trough's usual summer locationover land prevents the development of tropical cyclones (Ramage, 1974).
During June the near-equatorial trough occasionally reintensifies over theArabian Sea and leads to tropical cyclogenesis. Figure A-36d shows that tropicalcyclones reaching storm intensity in June generally develop off the west coastof India and move northwestward to the vicinity of Karachi, Pakistan, wherethey cause high winds (see Appendix D). It should be noted, however, that thehigh winds at Karachi during July and to a lesser extent in August and September
(Appendix D) are associated with the remnants of monsoon depressions thatdeveloped in the Bay of Bengal (see Cuming, 1973).
The mean cloud cover for July shown in Figure A-30c displays the resultsof the essential differences in the monsoon regime between the eastern andwestern sections of the Arabian Sea. Near the western coast of India, large-scale upward motion causes general cloudiness to prevail along with frequent
4-9

showers and periods of rain that reduce visibilitles (A-32a). To the west,
large-scale subsidence (Ramage, 1971) keeps this cloudiness to a minimum. The
reductions in visibility in the Gulf of Aden (A-32b) and western Arabian Sea(A-32a) are reported to be caused by haze, dust and some light fog. Theoccurrence of dust over the Gulf of Aden was considered a serious problem byobservers aboard USS CHICAGO who reported:
"The most significant meteorological phenomenon of the Gulf ofAden is the continual presence of fine dust in the air. Within afew hours of entering the Gulf of Aden, a layer of dust had coatedthe outside of the ship. The major problem with the dust was in theclogging of air filters and inlet ducts, a problem partially solvedby taping cheese cloth over all topside inlets. This is not anoptimum solution as the high winds continually tore the tape loose."
The probable cause of this persistent dust are the occurrences of numerousmesoscale dust storms that develop over land and move out to sea during theevening hours. These dust (sand) storms are similar to the "haboobs" whichaffect Khartoum (Ramage, 1971). In the case of the Gulf of Aden. strong convec-tive activity is initiated in the coastal mountains during the afternoon along
the convergence zones shown in Figure 3-27b (Atkinson, 1971). These zones arecaused by the upslope sea breezes associated with the daytime heating (seePara. 3.5.1). Outflows from the convective systems pick up large amounts ofdust (sand) as they move seaward and dissipate during the evening. At Aden(see locator map. Figure 1-1), these storms usually beqin about sunset and at
times blow hard until 2200 LT. The air becomes so thick with sand thatvisibility is sharply reduced. The only forewarning of these dust storms is adense sand cloud appearing to the northward and northwestward of the port anhour or two before sunset. The wind then blows hard from the north, starts todecrease and finally becomes calm in about one to two hours. After a short
interval, the wind blows hard from the south for another two hours before thestorm ends (Port Directory, Volume VI, Indian Ocean). These dust/sand conditionsappear to be almost daily events during the summer monsoon, not only at Aden butalso to the east at Riyan (U.S. Naval Weather Service Command, 1974a).
The strong upwelling of cold water off the Somali coast during the summer
monsoon is evident in Figures A-3af through A-31i. As expected, the coldesttemperatures occur during July when the surface winds are strongest. Unlikea situation such as that off the coast of California, fog is not associatedwith the cold upwelling. Ramage (1971) attributes this lack of fog off theSomali coast to strong low-level divergence in the southwesterly flow whichbrings a strong subsidence inversion down to the surface, ensuring a supply ofdry air adequate to prevent fog formation.
4-10

As is emphasized by several researchers (e.g., Cuming, 1973; Ramage, 1971;
and Ramage et al., 1969), the features of the summer monsoon are not constant
phenomena -- large variations in wind, cloudiness and precipitation patterns are
observed from day to day. For example, two basic variations in the summer
monsoon are described in Para. 3.2.2. These basic patterns, called strong and
weak monsoon, are compared by the differences in flow (Figures 3-9 through 3-12)
and by differences in cloud cover and rainfall (see satellite pictures in
Figures 3-15 and 3-16). Fortunately there are some useful forecasting aids
available to anticipate these changes. Findlater (1969) described changes in
the strength of the low-level Jet over Garissa, Kenya, and what appeared to be
a one- to two-day lag in the rainfall (surface wind and cloudiness) along the
west coast of India (see Para. 3.1.3).
Still another feature that appears related to the intensity of the summer
monsoon is the development of the subtropical cyclone. A likely prerequisite
for subtropical cyclogenesis -- with consequent increased wind, cloudiness and
rain associated with strong monsoon conditions -- is the existence of a monsoon
depression in the Bay of Bengal or northeastern India (see Para. 3.2.3). In a
negative sense, there does not appear to be a relationship between the central
pressure of the heat trough over Pakistan and the variations of winds, cloudiness
and precipitation over the Arabian Sea (see Para. 3.2.2).
4.4 THE AUTUMN TRANSITION SEASON - OCTOBER THROUGH NOVEMBER
As the amount of insolation received over the Northern Hemisphere decreases
as summer progresses into autumn, the heat trough over Pakistan and vicinity
weakens and the near-equatorial trough again reappears over the Arabian Sea
(Ramage. 1974). With the near-equatorial trough over the water, the occurrence
of tropical cyclones reaches a secondary maxima for the year (see Para. 3.3.2).
Typical tracks of tropical storms for October and November are shown in Figures
A-35d and A-35e. The actual tracks of tropical cyclones that reached storm
intensity are shown in Figures A-36h and A-361. As discussed more fully in
Appendix D. these tropical storms do occasionally affect the port of Karachi,
Pakistan.
As indicated by the surface wind roses shown in Figure A-ll, the October
surface winds are again light and variable over most of the Arabian Sea as they
were in April. In the Gulf of Aden the winds have again become easterly.
However, it would be expected that intensifications of the near-equatorial
trough (see Adler, et al., 1970) -- with or without tropical cyclogenesis --
will lead to periods of increased northeasterly winds over most of the Arabian
Sea north of the trough, as is the case in the South China Sea. On the other
hand, cold frontal passages during October should be extremely rare (as noted by
Perrone, publication pending), so increases in the northeasterlies over the
northern Arabian Sea from this source are not to be expected.
4-1I

By November (A-12), the surface northeasterltes over the Arabian Sea arewell established although speeds are generally still moderate (less than 22 kt).
In the Gulf of Aden the prevailing easterlies have also increased and will
remain the dominant wind flow until the end of the spring transition season.
As is the case during the winter monsoon, the winds in the two northernmost
areas -- N GuZf of Oman and sonmiani -- are light and variable due to their
proximity to the lee trough (see Figure 4-1) described in Para. 4.1. Increases
in the intensity of the monsoon flow during November are related not only totropical storm development and near-equatorial trough intensification, but also
to passages of cold fronts into the northern Arabian Sea (described by observer
aboard USS HANCOCK. Para. 4.1). These cold surges, however, are likely to be
only short-lived (one to two days) in comparison to the winter monsoon surges
(see Para. 3.4.2).
Cloud cover during autumn, as in spring, has reached a minimum (A-30d).
Although water temperatures are very high (A-31j, A-31k), little if any cool airis advected out over the sea to cause the increased cumulus and stratocumuluscommon during the winter. With the generally clear skies, diurnal effects
should predominate along all coasts (see Para. 3.5.1).
Visibilities during autumn are generally very good (A-32). The onlyexceptions would be the effects of tropical storms and dust storms related to
cold frontal passages off the Arabian Peninsula. Due to the generally light
winds during this season, sea heights (A-33, A-34) are again minimal.
4-12