Embed Size (px)
Citation preview
Workplace Injuriesand Illnesses Safety(WIIS) Report
This report covers only the rates of injuries and illnesses as published by the BLS.
2007–2016
by the U.S. Oil and Natural Gas Industry
Copyright 2017 – API, all rights reserved. 2
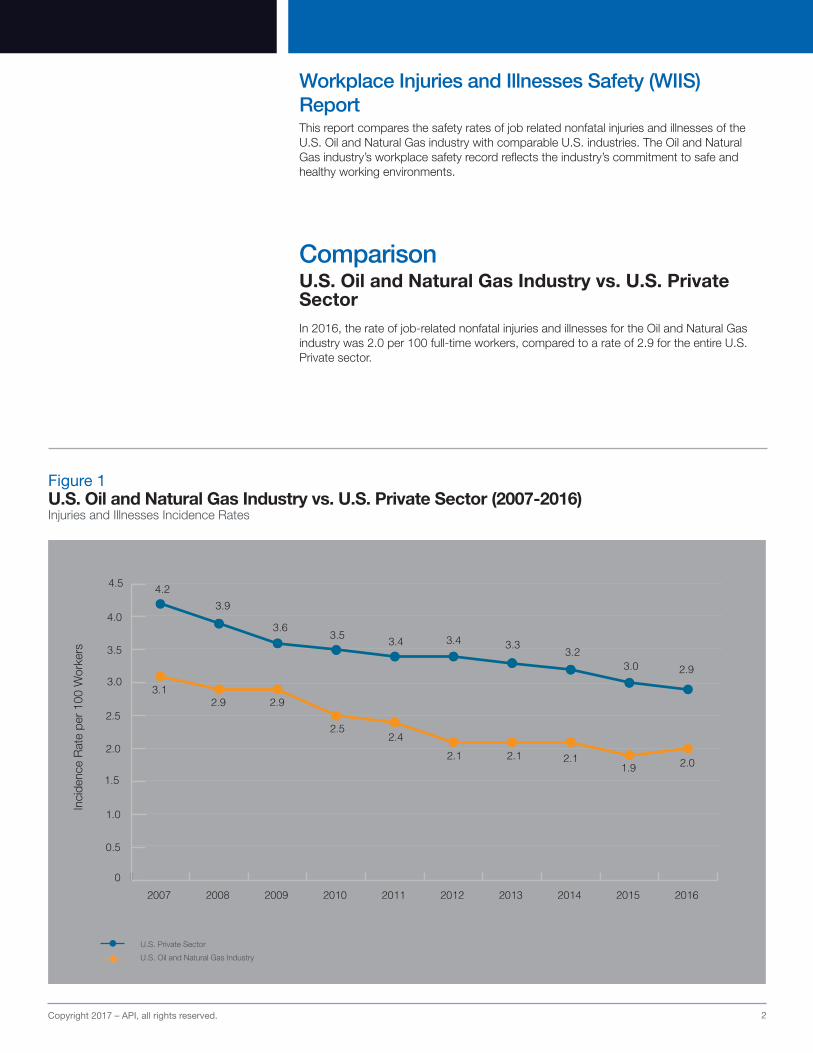
Figure 1U.S. Oil and Natural Gas Industry vs. U.S. Private Sector (2007-2016)Injuries and Illnesses Incidence Rates
Water:25% | $4.1
Workplace Injuries and Illnesses Safety (WIIS) ReportThis report compares the safety rates of job related nonfatal injuries and illnesses of the U.S. Oil and Natural Gas industry with comparable U.S. industries. The Oil and Natural Gas industry’s workplace safety record reflects the industry’s commitment to safe and healthy working environments.
ComparisonU.S. Oil and Natural Gas Industry vs. U.S. Private SectorIn 2016, the rate of job-related nonfatal injuries and illnesses for the Oil and Natural Gas industry was 2.0 per 100 full-time workers, compared to a rate of 2.9 for the entire U.S. Private sector.
0
0.5
1.0
1.5
2.0
2.5
3.0
3.5
4.0
4.5
2016201520142013201220112010200920082007
3.12.9 2.9
2.52.4
2.1 2.1 2.11.9 2.0
3.4 3.4 3.3 3.23.0 2.9
4.23.9
3.63.5
Inci
denc
e R
ate
per
100
Wor
kers
U.S. Private Sector
U.S. Oil and Natural Gas Industry

Copyright 2017 – API, all rights reserved. 3
Figure 2Exploration and Production vs. Mining (2007-2016)Injuries and Illnesses Incidence Rates
Water:25% | $4.1
ComparisonU.S. Oil and Natural Gas Industry – Exploration and Production1 vs. U.S. MiningIn 2016, the rate of job-related nonfatal injuries and illnesses among U.S. Oil and Natural Gas exploration and production workers was 1.1 per 100 full-time workers, compared with 1.5 for the U.S. Mining sector. The U.S. Offshore industry2, a segment of the U.S. Oil and Natural Gas Exploration and Production sector had a rate of 0.5 per 100 full-time workers.
1 E&P is a weighted average calculated by API using BLS data. Support activities for oil and gas operations, drilling oil and gas wells,
and oil and gas extraction make up the Exploration and Production sector. In 2008 and 2009, BLS did not publish the rates of
injuries and illnesses for drilling oil and gas wells because they did not meet BLS criteria.
2 Offshore incidence rates were calculated using data from Bureau of Safety and Environmental Enforcement (BSEE). Beginning
March 31, 2011, operators were required to submit their forms (previously MMS -131, now BSEE, 131) annually. Thus, the number
of incidents shown for 2010 and beyond may be affected by this change when compared to previous years. Offshore Illness and
Injuries rate excludes construction workers. Injuries and Illnesses rates are self-reported injuries for a sample.
U.S. Private Sector – Mining
U.S. Oil and Natural Gas Industry – Exploration and Production
U.S. Offshore (Exploration and Production)
0.0
0.5
1.0
1.5
2.0
2.5
3.0
3.5
2016201520142013201220112010200920082007
1.91.8
2.3
1.9 1.91.8 1.8 1.8
1.0 1.1
2.7
3.12.9
2.42.2 2.1
2.0 2.0
1.41.5
1.0
0.6 0.6 0.90.8 0.7
0.60.5 0.5 0.5
Inci
denc
e R
ate
per
100
Full-
Tim
e W
orke
rs
Copyright 2017 – API, all rights reserved. 4
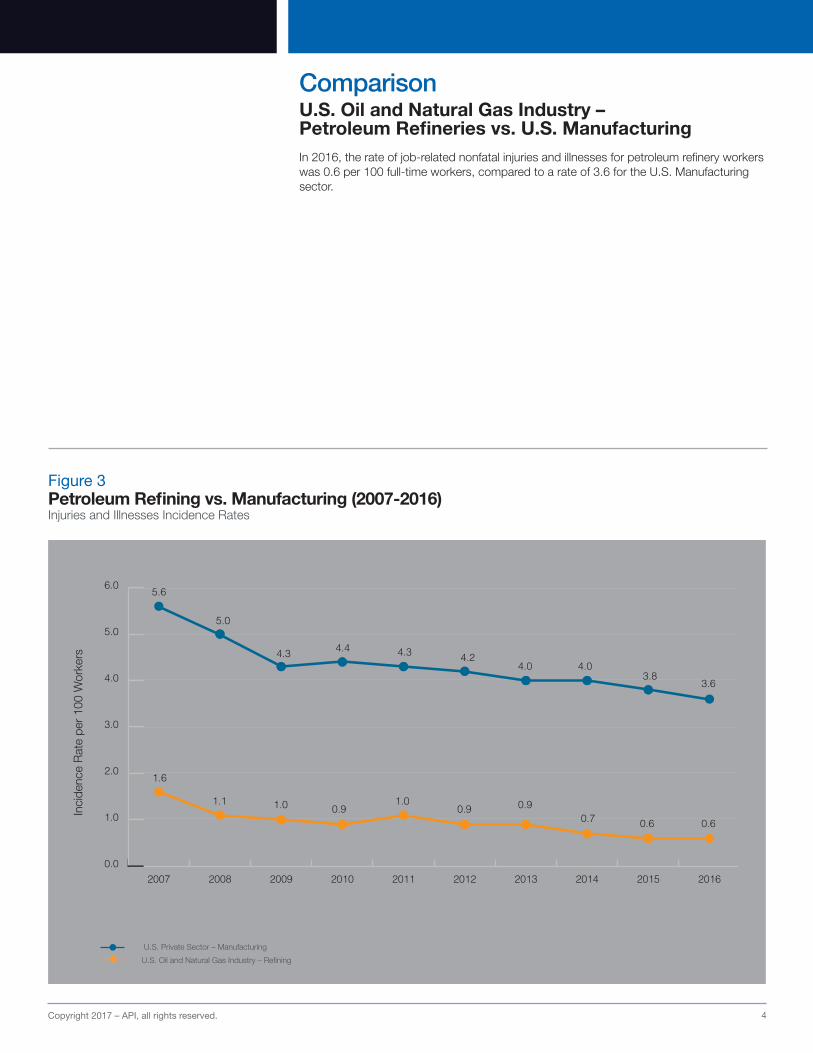
Figure 3Petroleum Refining vs. Manufacturing (2007-2016) Injuries and Illnesses Incidence Rates
Water:25% | $4.1
ComparisonU.S. Oil and Natural Gas Industry – Petroleum Refineries vs. U.S. ManufacturingIn 2016, the rate of job-related nonfatal injuries and illnesses for petroleum refinery workers was 0.6 per 100 full-time workers, compared to a rate of 3.6 for the U.S. Manufacturing sector.
Inci
denc
e R
ate
per
100
Wor
kers
U.S. Private Sector – Manufacturing
U.S. Oil and Natural Gas Industry – Refining
4.3
3.6
4.4
4.0
1.6
1.1 1.0 0.9 0.90.7 0.6 0.6
5.6
5.0
4.3
3.8
4.24.0
1.00.9
0.0
1.0
2.0
3.0
4.0
5.0
6.0
2016201520142013201220112010200920082007
Copyright 2017 – API, all rights reserved. 5
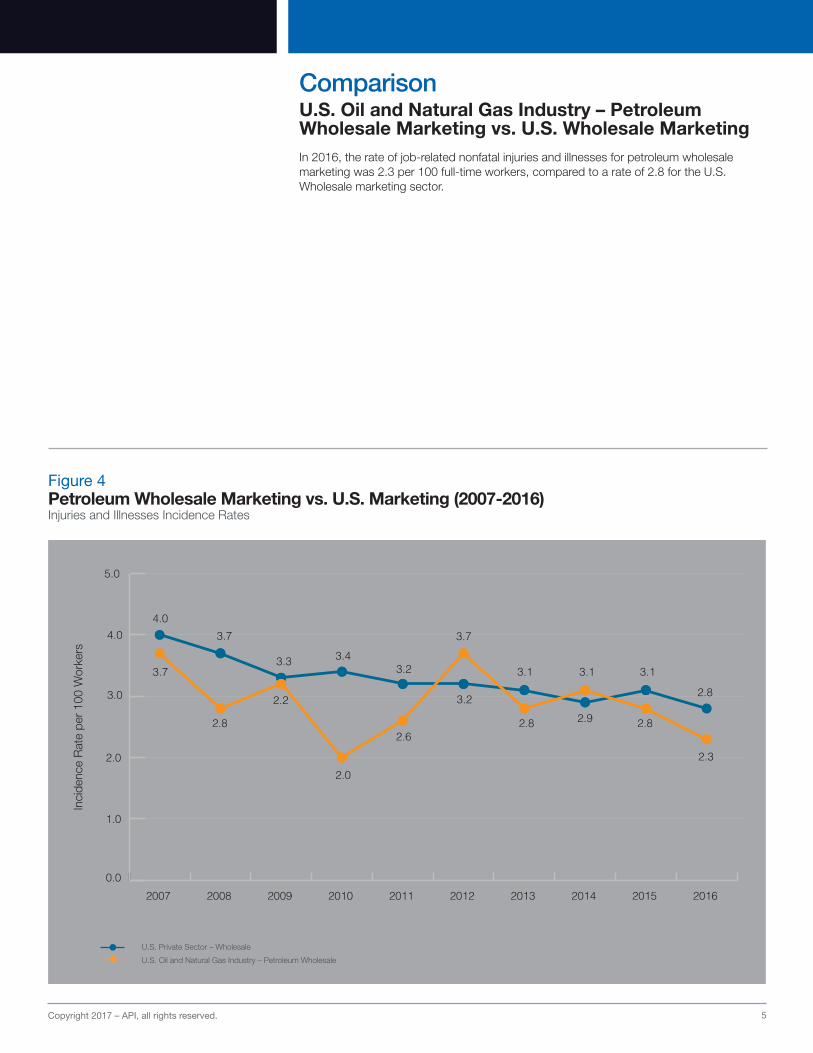
Figure 4Petroleum Wholesale Marketing vs. U.S. Marketing (2007-2016)Injuries and Illnesses Incidence Rates
Water:25% | $4.1
ComparisonU.S. Oil and Natural Gas Industry – Petroleum Wholesale Marketing vs. U.S. Wholesale MarketingIn 2016, the rate of job-related nonfatal injuries and illnesses for petroleum wholesale marketing was 2.3 per 100 full-time workers, compared to a rate of 2.8 for the U.S. Wholesale marketing sector.
Inci
denc
e R
ate
per
100
Wor
kers
U.S. Private Sector – Wholesale
U.S. Oil and Natural Gas Industry – Petroleum Wholesale
0.0
1.0
2.0
3.0
4.0
5.0
2016201520142013201220112010200920082007
3.7
2.8
2.2
2.0
2.6
3.2
2.8 2.9 2.8
2.3
3.2
3.7
3.1 3.1 3.1
2.8
4.03.7
3.3 3.4

Copyright 2017 – API, all rights reserved. 6
Figure 5U.S. Oil and Natural Gas Industry- Retail Marketing vs. U.S. Retail Marketing (2007-2016)Injuries and Illnesses Incidence Rates
Water:25% | $4.1
ComparisonU.S. Oil and Natural Gas Industry – Retail Marketing vs. U.S. Retail MarketingIn 2016, the rate of job-related nonfatal injuries and illnesses among U.S. Oil and Natural Gas retail marketing personnel was 2.8 per 100 full-time workers, compared to a rate of 3.3 for the U.S. Retail Marketing sector.
Inci
denc
e R
ate
per
100
Wor
kers
U.S. Private Sector – Retail
U.S. Oil and Natural Gas Industry – Retail
0.0
1.0
2.0
3.0
4.0
5.0
6.0
2016201520142013201220112010200920082007
4.8
3.23.4 3.4
2.92.7
2.22.4 2.3 2.8 2.8
4.44.2 4.1
3.9 4.03.8
3.6 3.53.3

Copyright 2017 – API, all rights reserved. 7
Figure 6U.S. Oil and Natural Gas Pipelines vs. U.S. Transportation and Warehousing (2007-2016)Injuries and Illnesses Incidence Rates
Water:25% | $4.1
ComparisonU.S. Oil and Natural Gas Industry – Pipelines3 vs. U.S. Transportation and WarehousingIn 2016, the rate of job-related nonfatal injuries and illnesses among U.S. Oil and Natural Gas pipeline transportation personnel4 was 0.1 per 100 full-time workers, compared to a rate of 4.6 for the U.S. Transportation and Warehousing sector.
3 Pipeline injuries and illnesses numbers are from PHMSA. BLS does not consistently report pipeline data.
4 Pipeline data includes contract workers.
Inci
denc
e R
ate
per
100
Wor
kers
U.S. Private Sector – Transportation and Warehousing
U.S. Oil and Natural Gas Industry – Pipeline
0.0
1.0
2.0
3.0
4.0
5.0
6.0
7.0
2016201520142013201220112010200920082007
6.4
0.1 0.10.0 0.0 0.0 0.0 0.0 0.0 0.0 0.0
5.7
5.2 5.24.9 4.9 4.7 4.8
4.5 4.6

Copyright 2017 – API, all rights reserved. 8
Figure 7U.S. Oil and Natural Gas Industry – Natural Gas Distribution vs. U.S. Utilities (2007-2016)Injuries and Illnesses Incidence Rates
Water:25% | $4.1
ComparisonU.S. Oil and Natural Gas Industry – Natural Gas Distribution5 vs. U.S. UtilitiesIn 2016, the rate of job-related nonfatal injuries and illnesses among U.S. Oil and Natural Gas Industry’s natural gas distribution personnel was 2.8 per 100 full-time workers, compared to a rate of 2.1 for the U.S. Utilities sector.
5 Natural Gas Distribution incidents where fire/explosion was the primary cause of failure, such as a house fire that subsequently
resulted in - but was not caused by - a distribution line failure are excluded.
Inci
denc
e R
ate
per
100
Wor
kers
U.S. Oil and Natural Gas Industry – Natural Gas Distribution
U.S. Private Sector – Utilities
0.0
0.5
1.0
1.5
2.0
2.5
3.0
3.5
4.0
4.5
5.0
2016201520142013201220112010200920082007
4.7
4.0
3.5 3.33.1
3.5
2.8
2.42.1 2.2
2.4
2.1
4.3 4.2
3.7
4.0
2.9 3.0
2.62.8
Copyright 2017 – API, all rights reserved. 9
Water:25% | $4.1
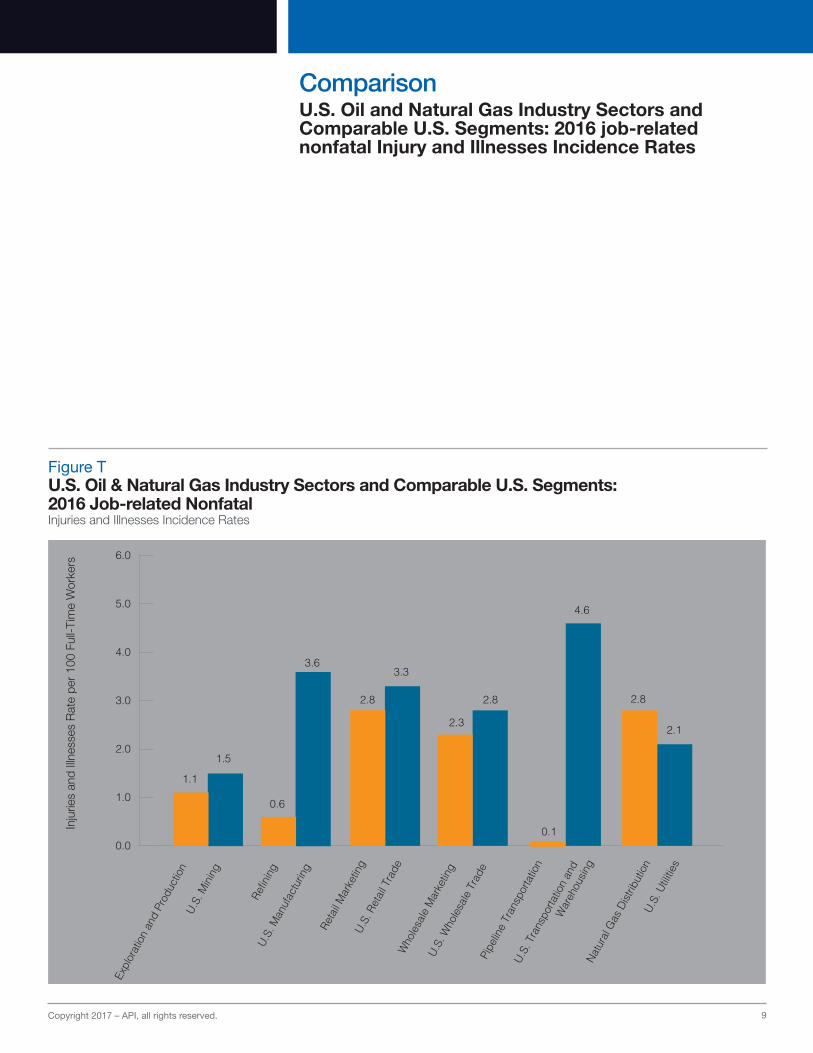
Figure TU.S. Oil & Natural Gas Industry Sectors and Comparable U.S. Segments: 2016 Job-related Nonfatal Injuries and Illnesses Incidence Rates
ComparisonU.S. Oil and Natural Gas Industry Sectors and Comparable U.S. Segments: 2016 job-related nonfatal Injury and Illnesses Incidence Rates
0.0
1.0
2.0
3.0
4.0
5.0
6.0
Expl
orat
ion a
nd P
rodu
ction
U.S.
Mini
ng
Refin
ingU.
S. M
anuf
actu
ring
Reta
il Mar
ketin
gU.
S. R
etail
Tra
deW
holes
ale M
arke
ting
U.S.
Who
lesale
Tra
dePi
pelin
e Tr
ansp
orta
tion
U.S.
Tra
nspo
rtatio
n an
d
War
ehou
sing
Natu
ral G
as D
istrib
ution
U.S.
Utili
ties
1.1
1.5
0.6
3.6
2.8
3.3
2.3
2.8
0.1
4.6
2.8
2.1
Inju
ries
and
Illne
sses
Rat
e pe
r 10
0 Fu
ll-Ti
me
Wor
kers
Copyright 2017 – API, all rights reserved. 10
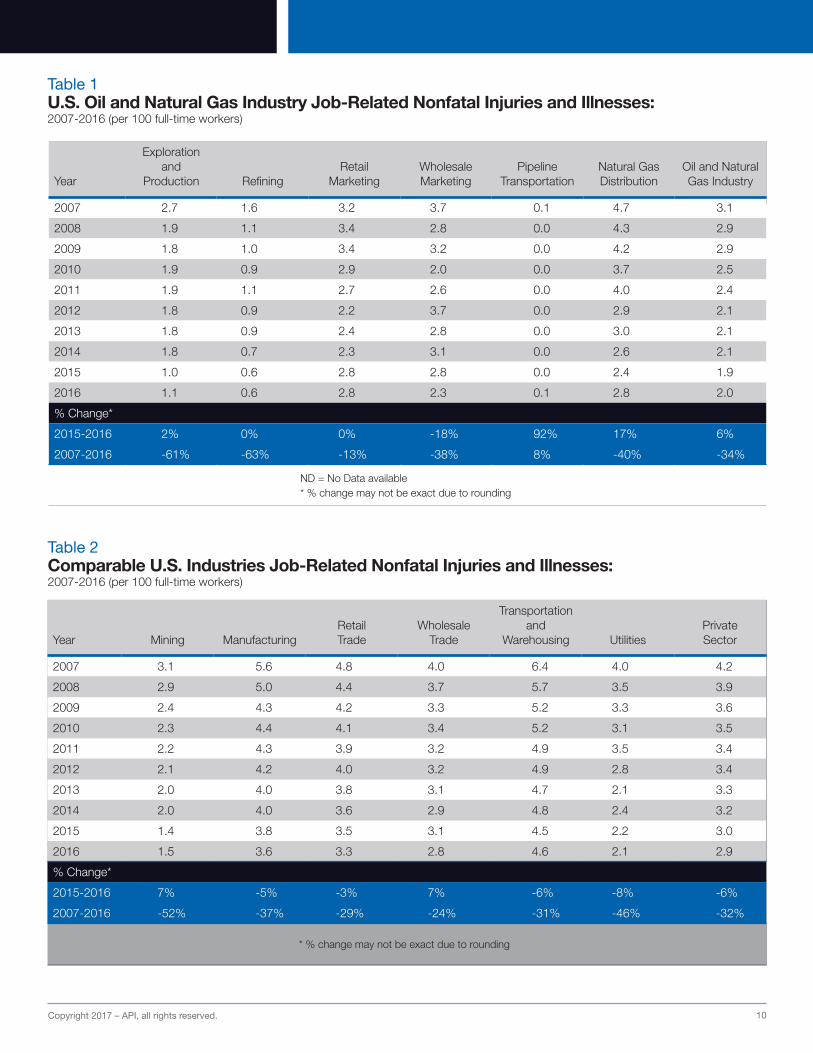
Table 1U.S. Oil and Natural Gas Industry Job-Related Nonfatal Injuries and Illnesses: 2007-2016 (per 100 full-time workers)
Table 2Comparable U.S. Industries Job-Related Nonfatal Injuries and Illnesses: 2007-2016 (per 100 full-time workers)
Year Mining ManufacturingRetailTrade
Wholesale Trade
Transportationand
Warehousing UtilitiesPrivate Sector
2007 3.1 5.6 4.8 4.0 6.4 4.0 4.2
2008 2.9 5.0 4.4 3.7 5.7 3.5 3.9
2009 2.4 4.3 4.2 3.3 5.2 3.3 3.6
2010 2.3 4.4 4.1 3.4 5.2 3.1 3.5
2011 2.2 4.3 3.9 3.2 4.9 3.5 3.4
2012 2.1 4.2 4.0 3.2 4.9 2.8 3.4
2013 2.0 4.0 3.8 3.1 4.7 2.1 3.3
2014 2.0 4.0 3.6 2.9 4.8 2.4 3.2
2015 1.4 3.8 3.5 3.1 4.5 2.2 3.0
2016 1.5 3.6 3.3 2.8 4.6 2.1 2.9
% Change*
2015-2016 7% -5% -3% 7% -6% -8% -6%
2007-2016 -52% -37% -29% -24% -31% -46% -32%
* % change may not be exact due to rounding
Year
Exploration and
Production RefiningRetail
MarketingWholesale Marketing
Pipeline Transportation
Natural Gas Distribution
Oil and Natural Gas Industry
2007 2.7 1.6 3.2 3.7 0.1 4.7 3.1
2008 1.9 1.1 3.4 2.8 0.0 4.3 2.9
2009 1.8 1.0 3.4 3.2 0.0 4.2 2.9
2010 1.9 0.9 2.9 2.0 0.0 3.7 2.5
2011 1.9 1.1 2.7 2.6 0.0 4.0 2.4
2012 1.8 0.9 2.2 3.7 0.0 2.9 2.1
2013 1.8 0.9 2.4 2.8 0.0 3.0 2.1
2014 1.8 0.7 2.3 3.1 0.0 2.6 2.1
2015 1.0 0.6 2.8 2.8 0.0 2.4 1.9
2016 1.1 0.6 2.8 2.3 0.1 2.8 2.0
% Change*
2015-2016 2% 0% 0% -18% 92% 17% 6%
2007-2016 -61% -63% -13% -38% 8% -40% -34%
ND = No Data available* % change may not be exact due to rounding

Copyright 2017 – API, all rights reserved. 11
Table 3U.S. Oil and Natural Gas Industry Job-Related Nonfatal Injuries and Illnesses: 2007-2016 Relative Standard Error
Table 4Comparable U.S. Industries Job-Related Nonfatal Injuries and Illnesses: 2007-2016 Relative Standard Error
Year Private SectorMining
[NAICS 21] Utilities [221]Manufacturing [NAICS 31-33]
Wholesale Trade
[NAICS 42]Retail Trade
[NAICS 44-45]
Transportation and Warehousing
[NAICS 48-49]
2007 1.0 4.0 3.0 1.0 2.0 1.0 1.0
2008 1.0 11.0 3.0 1.0 2.0 1.0 1.0
2009 1.0 4.0 4.0 1.0 3.0 1.0 1.0
2010 0.5 3.7 4.0 0.7 2.9 1.0 1.5
2011 0.5 5.3 6.8 0.8 2.3 1.1 1.5
2012 0.5 5.1 5.0 0.8 2.6 1.1 1.6
2013 0.5 4.9 4.7 0.9 2.6 1.2 1.7
2014 0.5 4.9 5.0 0.8 2.3 1.2 1.5
2015 0.5 4.4 5.7 0.8 2.2 1.2 1.5
2016 0.6 5.7 4.3 0.8 2.5 1.2 1.5
Year
Oil & Gas Extraction
[NAICS 211]
Drilling Oil & Gas Wells
[NAICS 213111]
Support Activities for Oil & Gas Operations [NAICS 213112]
Natural Gas Distribution
[NAICS 2212]
Petroleum Refineries [NAICS 32411]
Petroleum Wholesale
Trade [NAICS 4247]
Gasoline Stations
[NAICS 447]
Pipeline Transportation [NAICS 486]
2007 22.0 5.0 9.0 7.0 17.0 18.0 8.0 15.0
2008 20.0 ND 18.0 4.0 13.0 16.0 8.0 20.0
2009 19.0 ND 10.0 7.0 11.0 15.0 8.0 24.0
2010 19.0 8.4 8.7 6.0 4.9 12.3 6.8 28.5
2011 21.3 12.3 10.1 13.2 10.0 19.7 9.2 44.1
2012 19.2 12.7 11.3 7.6 13.3 19.3 9.1 26.6
2013 16.9 12.5 10.4 9.5 13.6 16.1 7.1 30.8
2014 ND 16.3 8.5 8.8 13.8 18.3 8.0 23.0
2015 15.4 11.9 11.1 10.6 10.9 13.5 9.7 34.6
2016 22.2 18.4 14.4 5.6 15.4 20.6 8.1 28.4
ND = No Data available
Copyright 2017 – API, all rights reserved. 12
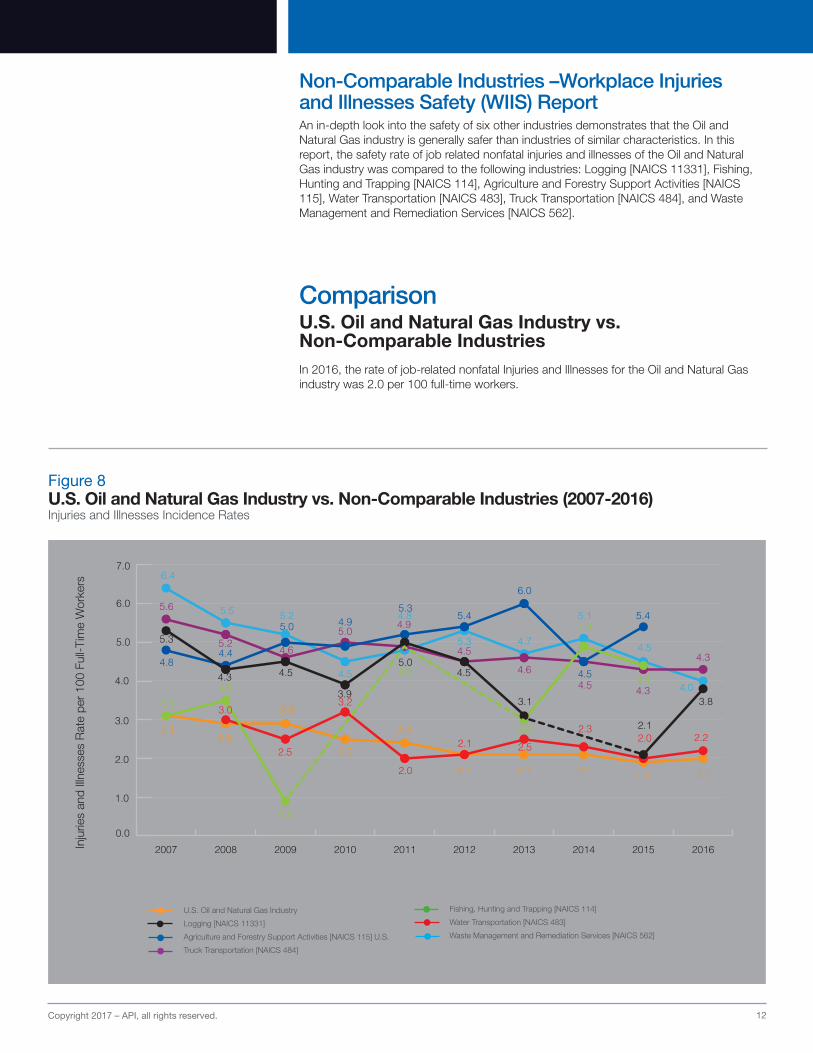
Figure 8U.S. Oil and Natural Gas Industry vs. Non-Comparable Industries (2007-2016)Injuries and Illnesses Incidence Rates
Water:25% | $4.1
Non-Comparable Industries –Workplace Injuries and Illnesses Safety (WIIS) Report An in-depth look into the safety of six other industries demonstrates that the Oil and Natural Gas industry is generally safer than industries of similar characteristics. In this report, the safety rate of job related nonfatal injuries and illnesses of the Oil and Natural Gas industry was compared to the following industries: Logging [NAICS 11331], Fishing, Hunting and Trapping [NAICS 114], Agriculture and Forestry Support Activities [NAICS 115], Water Transportation [NAICS 483], Truck Transportation [NAICS 484], and Waste Management and Remediation Services [NAICS 562].
ComparisonU.S. Oil and Natural Gas Industry vs. Non-Comparable IndustriesIn 2016, the rate of job-related nonfatal Injuries and Illnesses for the Oil and Natural Gas industry was 2.0 per 100 full-time workers.
0.0
1.0
2.0
3.0
4.0
5.0
6.0
7.0
2016201520142013201220112010200920082007
3.12.9
2.9
2.4
2.12.1 1.9 2.0
2.5
2.1
6.4
4.85.5 5.2
4.5
5.3
4.0
4.7 4.5
5.1
4.84.4
5.0 4.95.3
5.4 5.4
6.0
4.5
3.1
0.9
3.54.9
3.0
4.9
4.4
3.03.2
2.5
2.0
2.1 2.22.5
2.02.3
5.6
4.9
5.2 4.6
5.0
4.5 4.34.6
4.34.5
5.3
4.3 4.5
3.9
5.04.5
3.1
2.1
3.8
Inju
ries
and
Illne
sses
Rat
e pe
r 10
0 Fu
ll-Ti
me
Wor
kers
U.S. Oil and Natural Gas Industry
Logging [NAICS 11331]
Agriculture and Forestry Support Activities [NAICS 115] U.S.
Truck Transportation [NAICS 484]
Fishing, Hunting and Trapping [NAICS 114]
Water Transportation [NAICS 483]
Waste Management and Remediation Services [NAICS 562]
Copyright 2017 – API, all rights reserved. 13
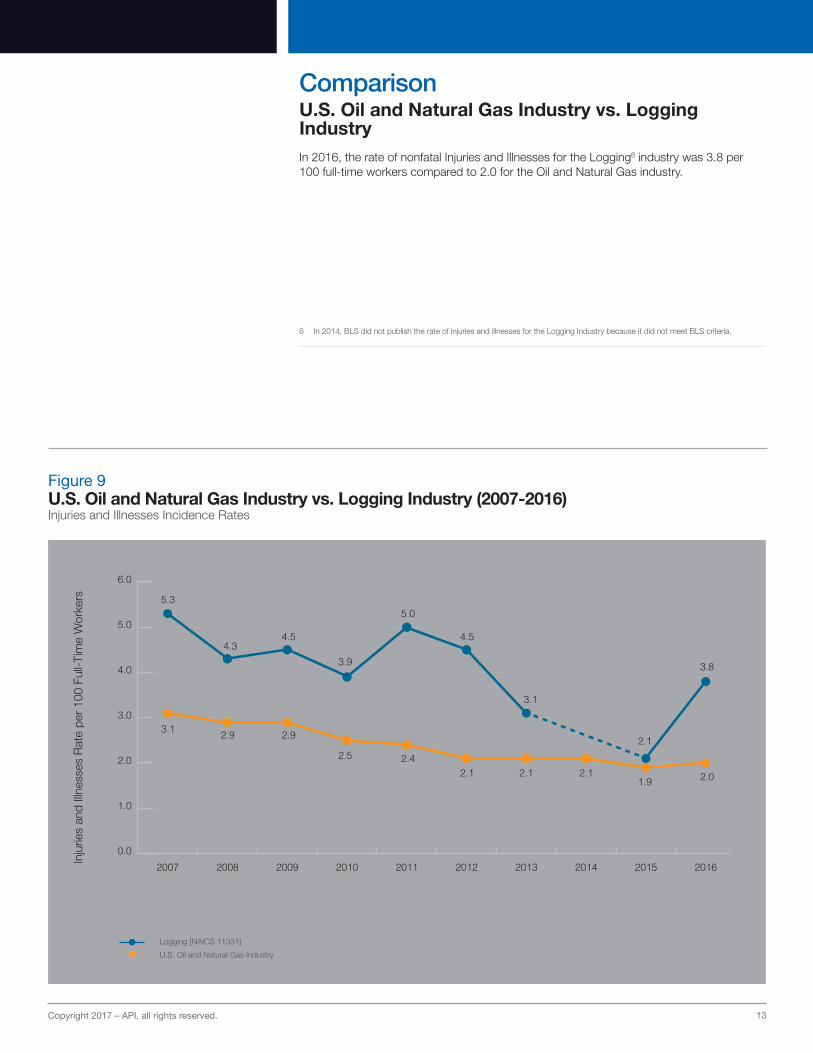
Figure 9U.S. Oil and Natural Gas Industry vs. Logging Industry (2007-2016)Injuries and Illnesses Incidence Rates
Water:25% | $4.1
ComparisonU.S. Oil and Natural Gas Industry vs. Logging IndustryIn 2016, the rate of nonfatal Injuries and Illnesses for the Logging6 industry was 3.8 per 100 full-time workers compared to 2.0 for the Oil and Natural Gas industry.
6 In 2014, BLS did not publish the rate of injuries and illnesses for the Logging Industry because it did not meet BLS criteria.
Inju
ries
and
Illne
sses
Rat
e pe
r 10
0 Fu
ll-Ti
me
Wor
kers
0.0
1.0
2.0
3.0
4.0
5.0
6.0
2016201520142013201220112010200920082007
5.3
3.1 2.9 2.9
2.5 2.42.1 2.1 2.1
1.9 2.0
4.34.5
3.9
5.0
4.5
3.1
2.1
3.8
Logging [NAICS 11331]
U.S. Oil and Natural Gas Industry

Copyright 2017 – API, all rights reserved. 14
Figure 10U.S. Oil and Natural Gas Industry vs. Fishing, Hunting, and Trapping Industry (2007-2016)Injuries and Illnesses Incidence Rates
Water:25% | $4.1
ComparisonU.S. Oil and Natural Gas Industry vs. Fishing, Hunting and Trapping IndustryIn 2016, the BLS did not publish the rate of job-related nonfatal Injuries and Illnesses for the Fishing, Hunting, and Trapping7 industry because it did not meet BLS criteria. However, the rate of job-related nonfatal Injuries and Illnesses for the Oil and Natural Gas industry was 2.0 per 100 full-time workers.
7 In 2010, 2012, and 2016, BLS did not publish the rate of job-related nonfatal Injuries and Illnesses for the Fishing, Hunting, and
Trapping industry because it did not meet BLS criteria.
Inju
ries
and
Illne
sses
Rat
e pe
r 10
0 Fu
ll-Ti
me
Wor
kers
Fishing, Hunting and Trapping [NAICS 114]
U.S. Oil and Natural Gas Industry
0.0
1.0
2.0
3.0
4.0
5.0
6.0
2016201520142013201220112010200920082007
3.1
3.1 2.9
0.9
2.5 2.42.1 2.1 2.1
1.9 2.0
3.5
2.9
4.9
3.0
4.9
4.4

Copyright 2017 – API, all rights reserved. 15
Figure 11U.S. Oil and Natural Gas Industry vs. Agriculture and Forestry Support Activities Industry (2007-2016) Injuries and Illnesses Incidence Rates
Water:25% | $4.1
ComparisonU.S. Oil and Natural Gas Industry vs. Agriculture and Forest Support Activities IndustryIIn 2016, the BLS did not publish the rate of job-related nonfatal Injuries and Illnesses for the Agriculture and Forestry Support Activities8 industry because it did not meet BLS criteria. However, the rate of job-related nonfatal Injuries and Illnesses for the Oil and Natural Gas industry was 2.0 per 100 full-time workers.
8 In 2016, BLS did not publish the rate of job-related nonfatal Injuries and Illnesses for the Agriculture and Forestry Support Activities
industry because it did not meet BLS criteria.
Inju
ries
and
Illne
sses
Rat
e pe
r 10
0 Fu
ll-Ti
me
Wor
kers
Agriculture and Forestry Support Activities [NAICS 115]
U.S. Oil and Natural Gas Industry
0.0
1.0
2.0
3.0
4.0
5.0
6.0
2016201520142013201220112010200920082007
4.8
3.1 2.9
2.5 2.42.1 2.1 2.1
1.9 2.0
4.4
2.9
5.0 4.95.3 5.4 5.4
6.0
4.5
Copyright 2017 – API, all rights reserved. 16
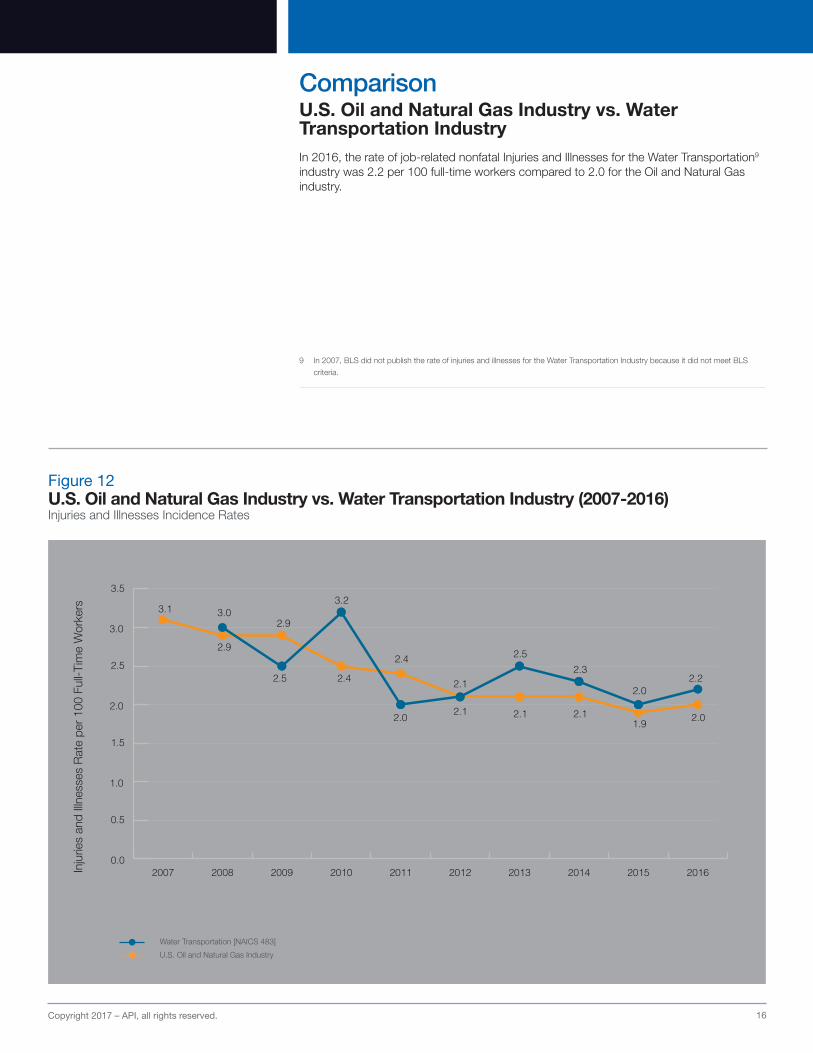
Figure 12U.S. Oil and Natural Gas Industry vs. Water Transportation Industry (2007-2016) Injuries and Illnesses Incidence Rates
Water:25% | $4.1
ComparisonU.S. Oil and Natural Gas Industry vs. Water Transportation IndustryIn 2016, the rate of job-related nonfatal Injuries and Illnesses for the Water Transportation9 industry was 2.2 per 100 full-time workers compared to 2.0 for the Oil and Natural Gas industry.
9 In 2007, BLS did not publish the rate of injuries and illnesses for the Water Transportation Industry because it did not meet BLS
criteria.
Inju
ries
and
Illne
sses
Rat
e pe
r 10
0 Fu
ll-Ti
me
Wor
kers
Water Transportation [NAICS 483]
U.S. Oil and Natural Gas Industry
0.0
0.5
1.0
1.5
2.0
2.5
3.0
3.5
2016201520142013201220112010200920082007
3.1
2.9
2.4
2.4
2.12.11.9 2.0
3.02.9
3.2
2.5
2.0
2.1
2.1
2.2
2.5
2.0
2.3
Copyright 2017 – API, all rights reserved. 17
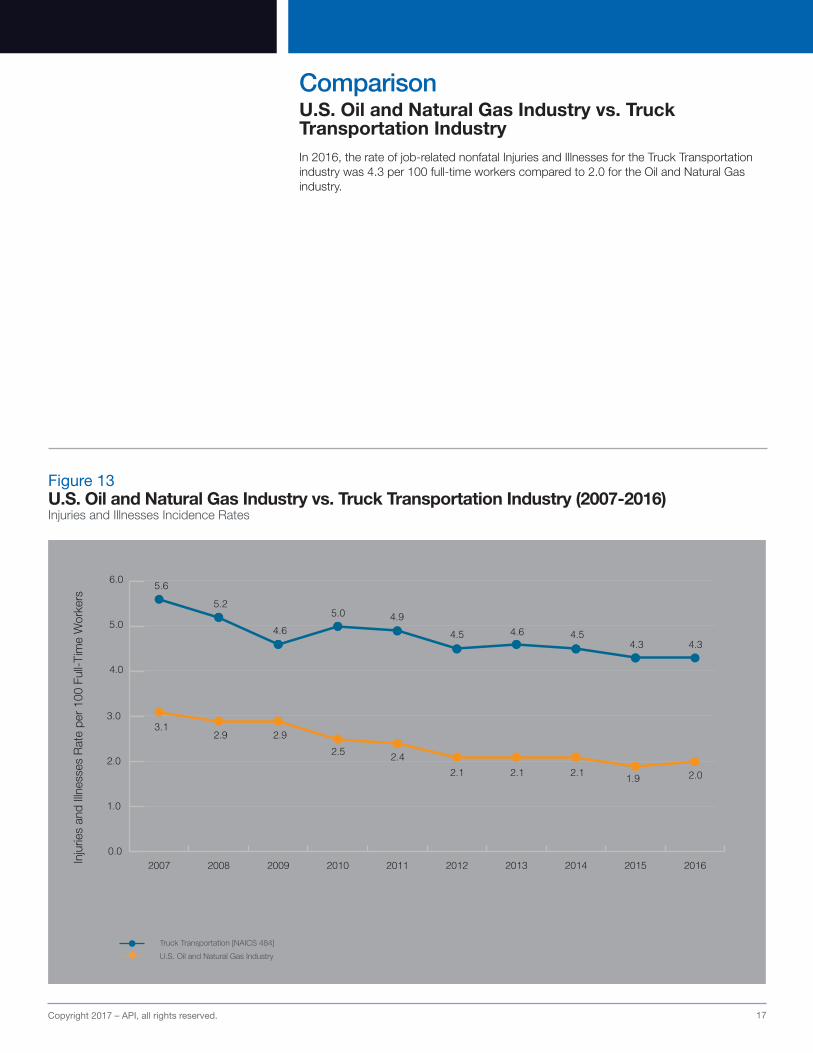
Figure 13U.S. Oil and Natural Gas Industry vs. Truck Transportation Industry (2007-2016) Injuries and Illnesses Incidence Rates
Water:25% | $4.1
ComparisonU.S. Oil and Natural Gas Industry vs. Truck Transportation IndustryIn 2016, the rate of job-related nonfatal Injuries and Illnesses for the Truck Transportation industry was 4.3 per 100 full-time workers compared to 2.0 for the Oil and Natural Gas industry.
Inju
ries
and
Illne
sses
Rat
e pe
r 10
0 Fu
ll-Ti
me
Wor
kers
Truck Transportation [NAICS 484]
U.S. Oil and Natural Gas Industry
0.0
1.0
2.0
3.0
4.0
5.0
6.0
2016201520142013201220112010200920082007
5.6
3.12.9 2.9
2.4
4.9
2.12.1 1.9 2.0
5.2
4.65.0
2.5
4.5
2.1
4.34.6
4.34.5
Copyright 2017 – API, all rights reserved. 18
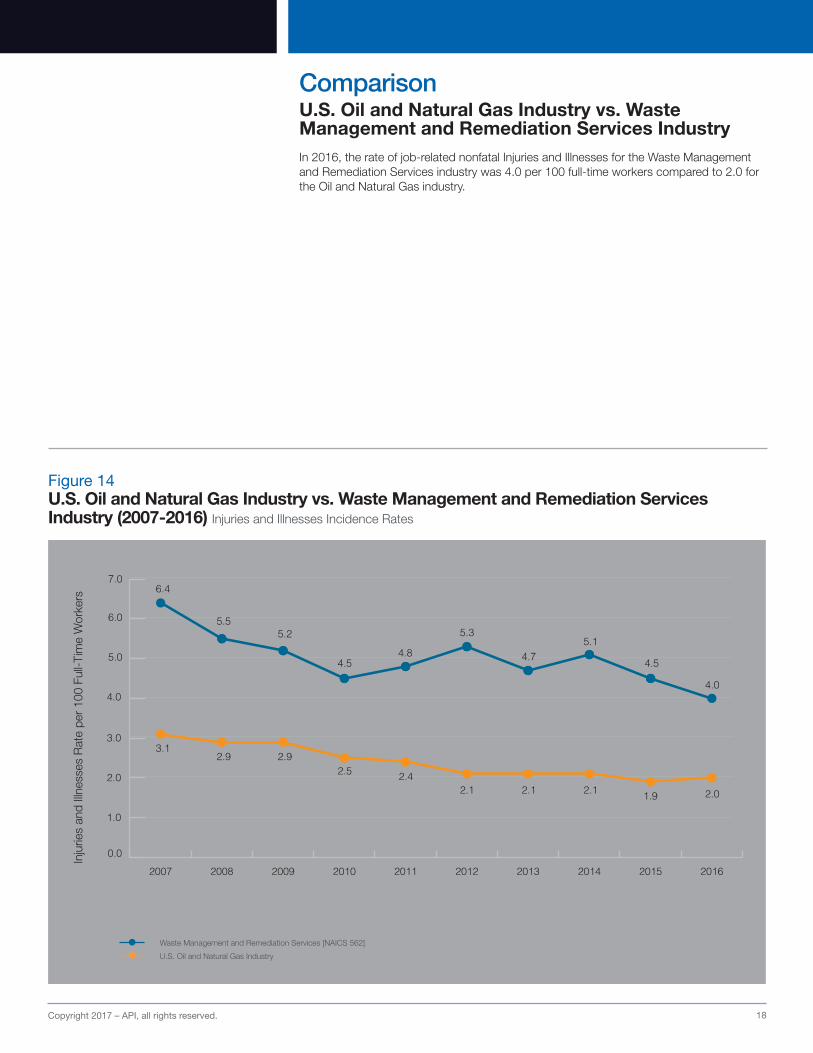
Figure 14U.S. Oil and Natural Gas Industry vs. Waste Management and Remediation Services Industry (2007-2016) Injuries and Illnesses Incidence Rates
Water:25% | $4.1
ComparisonU.S. Oil and Natural Gas Industry vs. Waste Management and Remediation Services IndustryIn 2016, the rate of job-related nonfatal Injuries and Illnesses for the Waste Management and Remediation Services industry was 4.0 per 100 full-time workers compared to 2.0 for the Oil and Natural Gas industry.
Inju
ries
and
Illne
sses
Rat
e pe
r 10
0 Fu
ll-Ti
me
Wor
kers
Waste Management and Remediation Services [NAICS 562]
U.S. Oil and Natural Gas Industry
0.0
1.0
2.0
3.0
4.0
5.0
6.0
7.0
2016201520142013201220112010200920082007
6.4
4.8
5.55.2
4.5
5.3
3.12.9 2.9
2.42.12.1 1.9 2.0
2.5
2.1
4.0
4.7 4.5
5.1

Copyright 2017 – API, all rights reserved. 19
Table 5:Select U.S. Industries Job-Related Nonfatal Injuries and Illnesses Rate: 2007-2016 (per 100 full-time workers)
Year
Logging NAICS [11331]
Fishing, Hunting and
Trapping NAICS [114]
Agriculture and Forestry
Support Activities
NAICS [115]
Water Transportation NAICS [483]
Truck Transportation NAICS [484]
Waste Management
and Remediation Services NAICS
[562]
U.S. Oil and Natural Gas
Industry
2007 5.3 3.1 4.8 ND 5.6 6.4 3.1
2008 4.3 3.5 4.4 3.0 5.2 5.5 2.9
2009 4.5 0.9 5.0 2.5 4.6 5.2 2.9
2010 3.9 ND 4.9 3.2 5.0 4.5 2.5
2011 5.0 4.9 5.2 2.0 4.9 4.8 2.4
2012 4.5 ND 5.4 2.1 4.5 5.3 2.1
2013 3.1 3.0 6.0 2.5 4.6 4.7 2.1
2014 ND 4.9 4.5 2.3 4.5 5.1 2.1
2015 2.1 4.4 5.4 2.0 4.3 4.5 1.9
2016 3.8 ND ND 2.2 4.3 4.0 2.0
% Change*
2015-2016 81% ND ND 10% 0% -11% 6%
2007-2016 -28% ND ND ND -23% -38% -34%
ND = No Data available* % change may not be exact due to rounding
Copyright 2017 – API, all rights reserved. 20
About This ReportThis report is based on information from the U.S. Bureau of Labor Statistics’ (BLS) Survey of Occupational Injuries, Illnesses, and Fatalities (www.bls.gov/iif), the Bureau of Safety and Environmental Enforcement (BSEE), formerly part of the Bureau of Ocean Energy Management, Regulation and Enforcement (BOEMRE) (https://www.bsee.gov/resources-and-tools/compliance/), as well as the U.S. Department of Transportation Pipeline Hazardous Materials Safety Administration (PHMSA) (http://www.phmsa.dot.gov/pipeline/library/data-stats). The Survey of Occupational Injuries, Illnesses, and Fatalities is a Federal and State program in which employer reports are collected from the private sector. It excludes the self-employed; farms with fewer than 11 employees; private household workers; volunteers; Federal government agencies; and, for national estimates, employees in state and local government agencies.
The annual survey provides estimates of the number and frequency (incidence rates) of workplace nonfatal injuries and illnesses based on logs required to be kept by private industry employers throughout the year. These records reflect not only the year’s injuries and illnesses experience, but also the employers’ understanding of which cases are work-related under recordkeeping rules revised by the Occupational Safety and Health Administration (OSHA), U.S. Department of Labor and made effective on January 1, 2002. These revisions affected how employers record various nonfatal job-related injuries and illnesses, and how the information is aggregated by BLS.
The pipeline incidence rates in this report were calculated by dividing the number of injuries reported to PHMSA by the total hours worked by all employees during a calendar year. The offshore incidence numbers were calculated by dividing the number of injuries reported to BSEE by the total hours reported to BSEE.
The total hours worked for the sectors are derived by multiplying the employment figures published in BLS’s Table 1. Incidence rates of nonfatal occupational injuries and illnesses by industry and cases types, YEAR by 2000 hours (40 hours and 50 weeks per year per full time employee).
In 2012, BLS stopped publishing the employment numbers in Table 1. Incidence rates of nonfatal occupational injuries and illnesses by industry and cases types, YEAR. As a result, beginning with 2012 data, the employment numbers and hours will be derived by ‘reverse engineering’. i.e., calculating the employment numbers using the published rates, injuries based on 2000 hours. The employment numbers are an annual average aggregate.
The North American Industry Classification System (NAICS) is the industry classification system used by the statistical agencies of the United States. It is the first economic classification system to be constructed based on a single economic concept. Establishments that use the same or similar processes to produce goods or services are grouped together. It was developed jointly by the United States, Canada, and Mexico, and reflects the structure of today’s economy in these three countries, including the emergence and growth of the service sector and new and advanced technologies. The 2007 survey was based on the 2002 NAICS Manual, while the 2012 survey used the 2007 NAICS Manual. Surveys for subsequent years (2013-2016) utilized the 2012 NAICS Manual.
Copyright 2017 – API, all rights reserved. 21
DefinitionsFull-time worker: For purposes of this report, the equivalent of someone who works 40 hours per week for 50 weeks a year or 2,000 hours per year. Thus, two people working 1,000 hours apiece count as one full-time worker.
Nonfatal injury or illness: A nonfatal job-related injury or illness is an abnormal condition or disorder that results in days away from work, restricted work, or transfer to another job, medical treatment beyond first aid, or loss of consciousness. Injuries include cases such as, but not limited to, a cut, fracture, sprain, or amputation. Illnesses include both acute and chronic illnesses, such as, but not limited to, a skin disease, respiratory disorder, or poisoning.

1220 L Street, NW Washington, DC 20005-4070 Phone: 202-682-8039Email: [email protected]
www.api.org
Copyright 2017 - American Petroleum Institute,all rights reserved. API and the API logo are either trademarks or registered trademarks of API in the United States and/or other countries.
API Digital Media: 2017-091 | 12.01 | PDF