Embed Size (px)
Citation preview
. . r"
-- -- +.• +-: +-
=
NASA_Technical
== Paper---_3257
March 1993
...... 1,
• __ - L
r
i
?
u
, ,
=
= _- • -.
- - ......... =--- ; + + _
- _ _ _ -= ,
r -
• +
-+
i
.
• -- . _+ : ....
. :_ - =
%
_
and AerothermalStatic '-- -_'Z - -- _ ..... " |
- : - - L
Tests of .....Superalloy+a .+ .: .i
Honeycomb Prepackaged .'.... _ !
Thermal Protectjo+nSystem _++ + .... i; . |, . + • _ _ , = + +
I
j / - _ -_ ++ff - _ _ " : ..... _-
.... i+, . ........ "" _ ' -- _ ;
- _+i+ |_ ._ _.
£
• = |
/
Mark P. Gorton, _-:
Johnt_'._momr,_'-'e_=- ..... : : • /' " " " '- ' .......- -_: = --"
and Granville L. Web.b - " " :- ="-
.. _a
!:_-
(NASA-TD-3257) STATIC ANDAER_THE_MAL TESTS OF h SUPERALLOYHONEYCOMB PREPACKAGED THERMALPROTECTION SYSTEM (NASA) 51 p
N93-24096 JI
Unclas +
iHI/34 0153120
(
https://ntrs.nasa.gov/search.jsp?R=19930014907 2018-07-15T18:31:56+00:00Z

L
. __ r
k
v
T
z -
.r
NASATechnical
Paper3257
1993
National Aeronautics and
Space Administration
Office of Management
Scientific and Technical
Information Program
Static and Aerothermal
Tests of a SuperalloyHoneycomb PrepackagedThermal Protection System
Mark P. Gorton
Lockheed Engineering & Sciences Company
Hampton, Virginia
John L. Shideler and Granville L. Webb
Langley Research Center
Hampton, Virginia
The use of trademarks or names of manufacturers in this
report is for accurate reporting and does not constitute an
official endorsement, either expressed or implied, of such
products or manufacturers by the National Aeronautics and
Space Administration.
Summary
A reusable metallic thermal protection system
(TPS), called superalloy honeycomb prepackaged
TPS, has been developed for vehicles with maximum
surface temperatures of up to 2000°F. An array of
two 12- by 12-in. panels was subjccted to radiantheating tests that simulated entry temperature and
pressure histories for the Space Shuttle. Results in-
dicate that this thermal protection system, with amass of 2.201 lbm/ft 2, can successfully prevent the
typical aluminum primary structure of an entry ve-hicle like tile Space Shuttle from exceeding tempera-
turcs greater than 350°F at a location on the vehiclcwhere the maximum surface temperature is 1900_F.
A comparison of measured temperatures with tem-peratures calculated with a finite-element analysis
shows that the maximum measured temperature of
the aluminum support plate (304°F) agrccs with the
maximum calculated temperature (312°F). Acoustic
tests performed on the two-panel array caused no
settling of the fiberous insulation contained withinthe panels and caused no change in thermal perfor-
mance. A flat array of 20 panels was exposed toaerothermal flow conditions at a Mach number of
6.75. The panels were installed in a worst-case ori-
entation with the gaps between the panels parallelto the flow. Results from the aerothermal tests indi-
cated that convective heating occurred from hot gas
flow in the gaps between the panels. Proposed design
changes to prevent gap heating include orienting pan-
els so that gaps are not parallel to the flow and using
a packaged, compressible gap-filler material betweenpanels to block hot gas flow in the gaps.
Results from these thermal, acoustic, and acro-
thermal tests show that the superalloy honeycomb
TPS panels can repeatedly endure a realistic entryenvironment and maintain their effectiveness. The
panels limit the primary-structure temperature, have
low mass, and exhibit tolerance to damage in anaerothermal environment. Based on these tests, this
thermal protection system appears to be a viable
candidate for use on future hypcrsonic vehicles like
the Space Shuttle.
Introduction
Space transportation vehicles entering the Earth's
atmosphere at hypersonic speeds encounter aero-dynamic heating. Some form of thermal protection
is usually required to limit the maximum tempera-
ture of the primary structure of the vehicle during
entry. Ideally, the thermal protection system (TPS)should be reusable and have low mass, long life, and
sufficient strength and stiffness to support aerody-
namic and thermal loads. Also, tile TPS must be
able to (1) withstand handling during installation, in-spection, and removal, (2) endure less-than-excellent
weather conditions during flight, and (3) remain op-
erational after sustaining partial damage.
Three general reusable TPS classes have bccn de-veloped over the past years: metallic (for tempera-
tures less than about 2300°F, refs. 1 and 2), ceramic
(for temperatures less than about 2700°F, ref. 3),
and high-temperature composite (for temperatures
greater than about 2700°F, ref. 4). Three metal-lie TPS concepts have bccn developed and tested
for potential application in the lower temperature
range: metallic stand-off TPS (ref. 1), multiwall TPS
(ref. 1), and superalloy honeycomb (SAHC) TPS
(ref. 5). Tile superalloy honeycomb TPS consists of
12- by 12-in. honeycomb-stiffened panels that encap-sulate fiberous insulation. The panels are mechani-
cally attached to the exterior of the primary struc-
ture of the vehicle, where they form a reusable and
durable insulating layer. The panels are designed fora maximum surface temperature of 2000°F, and de-
pending on the heating history of the design, theycan be several inches thick. This report describes
the fabrication and testing of a 2-panel array and a
20-panel array of the superalloy honeycomb TPS.
An array of two panels was subjected to radiant
heating tests at NASA Johnson Space Center (JSC).The test conditions simulated entry temperature and
pressure histories for the Space Shuttle. The two-
panel array was also placed in an acoustic chamber
at JSC and subjected to an acoustic environment
representative of that which occurs near the aft endof the Space Shuttle during liftoff. In addition, the
SAHC two-panel array was thermally analyzed with
the finite-element method. An array of 20 panelswas exposed to Math 6.75 flow conditions in the
Langley 8-Foot High-Temperature Tunnel (8_HTT).
Ttle aerothermal tests were performed to study panel
behavior in hypersonic flow conditions and to assessthe effects of convective heating, particularly in the
gaps between panels. Thermal and acoustic test datafor the two-panel array were contributed by DonaldJ. Tillian and James D. Johnston of NASA Johnson
Space Center, Houston, Texas.
Superalloy Honeycomb TPS Design and
Fabrication
Design Requirements
The superalloy honeycomb TPS panels tested in
this program were sized to limit the temperature of
the primary aluminum structure of an entry vehi-cle like the Space Shuttle to less than 350°F. Fig-
ure 1 illustrates the typical entry pressure and surface
temperatureconditionsforwhichthepanelswerede-signed.Thepressureandtemperaturehistoriesrep-resentconditionsat SpaceShuttlebody point 1300during trajectory14414.1C(ref. 1). A typicalen-try cyclelastsabout2000scc.Themaximumentrytemperatureof 1900°Foccursat about500secintotile trajectoryat apressureof 0.26psia.Tile surfaceheatingis essentiallycompletedbeforethepressurestartsto riseat aboutI600see.
A typicalSAHCTPSpanel,shownin figure2(a),wasdesignedto supportanascentpressureloadof2psiandto withstandtemperature-gradient-inducedthermalstressesassociatedwith the entry temper-ature history. The panel consistsof inner andouter layersof metallichoneycomb-coresandwichwith fibcrousinsulationcontainedbetweenthe twolayers. (Seeref. 5.) Beadedsideclosuresaroundthe perimeterof the paneljoin the two layersofhoneycomb-coresandwichandenclosetheinsulationto formadiscretepanel.Theouterhoneycomb-coresandwich,whichmustsurvivetemperaturesup to2000°F,is madeof IncoAlloysInconel617.Thein-nerhoneycomb-coresandwich,whichdoesnotgetashot, is madeof lighterweighttitanium alloy. Simi-larly,theouterlayerof fiberousinsulation,ManvilleCeraehrome,isa high-temperatureinsulation(maxi-mumtemperatureof2600°F)andisrelativelyheavy(6 lb/ft 3 density). The inner layer,ManvilleQ-Fiber felt, is a lowertemperatureinsulation(max-imumtemperatureof 1800°F)and is lighterweight(3.5lb/ft 3density)than theouterlayer.Overhang-ing lips on two edgesof the panelinhibit flowofhot gasesbetweenpanels. Underhanginglips ontile other two edgesprotect the materialbeneaththepanelsfrom directradiationheating.Fourme-chanicalattachments,whicharesubsequentlyde-scribedin detail,areprovidedto securethe panelto theprimarystructureof thevehicle.A ventholewith a 0.31-in.diameterwaslocatedin the innerhoneycomb-coresandwichof eachpanelto equalizepressuredifferentialsbetweenthepanelinteriorandexterior.TheVentholewascoveredwitha400-meshscreento preventthe entranceof liquid waterintothepanel.
Panel Fabrication
Eachpanelwasfabricatedin a three-steppro-ccss. In the first fabricationstep, an Inconel617outerhoneycomb-coresandwichanda beadedside-closureassemblywerediffusionbrazed. The 0.25-in-widesquare-cellhoneycombcorewas fabricatedfrom 0.002-in-thickcorrugatedfoil. The tlficknessof the facesheetswas0.005in., andthe depthofthe corewas0.28in. The four sideclosureswere
beadedbyusingaformingtool to presscorrugationsandflangesinto0.003-in-thickInconel617foil sheetsthatwerethentrimmedto theirfinalsize.A brazeal-loy (1.97B-0.02C-13.13Cr-3.4Fe-Nibalance)wasap-pliedto onesideof eachfacesheetandto onesideofa flangeoneachsideclosure.Thehoneycombcorewasplacedbetweenthe facesheets,andthebeadedsideclosureswereresistancespotweldedto the facesheets.Theassemblywasplacedona flat referencesurfacein a vacuumfurnace,andtungstenpelletswereplacedon theassemblyto providecontactpres-surefor the diffusionbrazingprocess.Thefurnacewasevacuatedto 10.4 torr andheatedto 2150°F.Theassemblywasheldat this temperaturefor3min,cooledto 1900°F,andthenheldat this temperaturefor 1hr.
In the secondfabrication step, the innerhoneycomb-coresandwichwasfabricatedfrom0.006-in-thickfacesheets(Ti-6A1-4V)anda 0.170-in-deepcore(Ti-3A1-2.5V).The 0.1875-in-widesquare-cellhoneycombcorewasmanufacturedfrom 0.002-in-thick corrugatedfoil. Flangeson two sidesof theTi-6A1-4Vfacesheetswereshapedwith form toolsduringa superplasticforming(SPF)process.Afterbeingcleaned,theedgesof thehoneycombcorewereplatedwithaLiquid Interface Diffusion (LID) 1 bond-
ing material. The core and face sheets were placed to-gether, inserted into a vacuum furnace, and heated to1725°F to diffusion bond the core to the face sheets.
In the third fabrication step, the Inconel 617 as-
sembly and the titanium assembly were joined to-
gether. The flanges of the assemblies were platedwith the LID bonding alloy. The Inconel 617
honeycomb and beaded side-closure assembly wasfilled with a 0.5-in-thick layer of Cerachromc insula-
tion and a 1.39-in-thick layer of Q-Fiber felt insula-
tion. The titanium honeycomb assembly was placed
over the Q-Fiber felt insulation, and the flanges ofboth assemblies were resistance spot welded together
to form a panel. The panel was again placed on a flatreference surface in a vacuum furnace at 10 -5 torr
and heated to 1725°F. The flanges of the two as-semblies were thus LID bonded together to form a
completed panel. Reference 6 provides a more de-tailed description of this fabrication procedure. Fig-
ure 2(b) shows a fully assembled panel, with overall
dimensions of 12 by 12 by 2.35 in.
Panel Attachment
Two mechanical attachment concepts were devel-
oped: a bayonet-clip attachment concept (ref. 1) and
a through-panel fastener assembly concept (ref. 5).
1 Proprietary joining process for Rohr Industries, Inc.
P
Both attachment concepts were designed to allow
easy installation and removal of panels, tolerance forminor misalignment of panels, and accommodation
of thermal expansion and deflection of panels.
The bayonet-clip attachment concept, illustrated
in figure 3(a), consists of three parts: a vehicle clip
a Ti-6AI-4V panel clip, and a Ti-6AI-4V bayonet.
Two bayonets are LID bonded to the underside ofthe front of a panel, and two panel clips are LIDbonded to the underside of the rear of a panel.
Vehicle clips are attached to the vehicle structure
at locations matching the TPS panel layout. The
bayonet-clip attachment concept requires that panelsbe installed in rows. The front of the first panel is
anchored by inserting its bayonets into the vehicle
clips. The bayonets of a panel immediately behind
the first panel are inserted through tile vehicle clips
and then through the panel clips of the first panel.
Successive panels are installed in the same manneruntil a row is completed. Then, the last panel in a
row is fastened to the vehicle structure by another
attachment concept (i.e., a pair of through-panel
fasteners). To remove a panel or a row of panels,
this process is reversed.
Figure 3(b) illustrates the through-panel fastenerassembly concept. Four Inconel 617 through-panel
fastener assemblies, which are diffusion brazed to the
Inconel 617 honeycomb layer, are LID bonded to the
titanium honeycomb layer during the last step of the
panel fabrication process. Shoulder bolts, inserted ateach corner of the panel, are used to attach a panelto the vehicle structure. Three of the four holes in
the titanium honeycomb (TiHC) layer are oversized
to allow lateral movement (due to thermal growth)
of the panel. Removal of an individual panel requiresthe removal of shoulder bolts from the panel and from
adjacent panels. The panel is moved laterally and
lifted away from the vehicle structure, so that the
underhanging lips clear the undersides of surrounding
panels. Thus, the use of through-panel fastenersallows the removal of individual panels with minimal
disturbance of adjacent panels.
Two-Panel Array Assembly
A two-panel array was assembled and instru-
mented for cyclic radiant heating tests. As shown
in figure 4, the array consisted of two panels that
were mechanically fastened to an aluminum platewith bayonet-clip attachments. A nominal gap spac-
ing of 0.220 in. between the two panels was used
to accommodate thermal expansion. The aluminum
plate was sized to represent the thermal mass ofthe vehicle structure of the Space Shuttle at a lo-
cation where the maximum design surface tempera-
ture is 1900°F. Strips of Du Pont Nomex felt used
to cushion the panels were bonded to the 0.190-
in-thick aluminum plate with an elastomeric Gen-
eral Electric RTV (room temperature vulcanizing)silicone adhesive. The felt strips, made of a mat
of randomly oriented horizontal Nomex fibers, were
1.0 in. wide by 0.190 in. thick (ref. 7). The stripswere laid in a square pattern not only to cush-
ion the edges of each panel but also to minimize
air flow beneath each panel. A single gap width
of 0.125 in. in the felt pattern under each panelwas used to vent the underside of a panel to the
atmosphere.
Each of the two panels in the array is about 12 in.
wide by 12 in. long by 2.35 in. thick. A diagram of the
array (fig. 5) identifies the locations of 26 Chromel-
Alumel (type K) thermocouples used to sense panel
and aluminum plate temperatures during testing.Five thermocouples were peened to the aluminum
plate, nine thermocouples were tack welded to the
underside of the panels, three thermocouples were
tack welded to panel 1 on the exterior of the side
closure in the gap region, and nine thermocoupleswere tack welded to the upper surfaces of the panels.
All thermoeouple wires were No. 30 AWG (American
Wire Gauge) and were fiberglass sheathed except for
the upper surface wires, which were metal sheathed.
After the array was assembled and instrumented,
a noncatalytic ceramic coating was applied to the
upper surface of the array and allowed to air dry.
The 0.0015- to 0.002-in-thick coating is a commer-
cially available, water-based, silica-alumina propri-
etary coating designated CRC-SBE, which is pro-duced by the Ceramic-Refractory Corporation. It
has good adhesion to the Inconel 617 foil sheets, anemittance of 0.65, and the capability of withstanding
temperatures greater than 1800°F (ref. 8). The ce-ramic coating was applied to the surface of the panels
with conventional spray painting equipment and air
dried at room temperature. The panels were coatedto evaluate the adherence of a nonmetallic, noncat-
alytic coating to an SAHC TPS panel surface. Such
a coating is of interest because, for the same entryconditions, a catalytic metallic surface is subjected to
a higher heat load than a noncatalytic surface. Thisdifference occurs because metallic surfaces are gener-
ally catalytic to the recombination of dissociated airmolecules, and the energy released during recombina-tion adds to the heat load. Therefore, a noncatalytie
coating increases the thermal efficiency of a metal-
lic TPS by delaying recombination and thus loweringthe net heat flux absorbed by the panel. (See ref. 8.)
20-PanelArray Assembly
A 20-panelarraywasfabricatedandinstrumentedforradiantheatingandacrothermaltests.Thearray,shownin figure6, wasconfiguredto fit a standardpanelholderusedin theLangley8PHTT.Twopanelsizes,about12in.wideby 12in. longandabout6-in.wideby 12in. long,wereusedto fill a 42.5-in-wideby 60-in-longopeningill thepanelholder.A 0.190-in-thickaluminumplate,representingthevehiclepri-marystructure,supportedtim panelssuchthat thesurfacesof thepanelswereflushwittl thesurfaceofthepanelholder.Theedgesof the ahlmimnnplateweresealedto thepanelholderwithRTVsiliconead-hesive.A nominalgapspacingof 0.220in.wasusedbetweensideclosuresof adjacentpanels.Panels2A,2B,2E,andall panelsof row3 (seefig. 6) werefas-tenedwith bayonet-clipattachments;panels1Cand1Dwerefastenedwith through-panelfasteners.Theremainingpanelswerefastenedwithacombinationofbayonet-clipattachmentsandthrough-panelfasten-ers. As with the two-panel array, the panels were
cushioned on 1.0-in-wide by 0.190-in-thick Nomex
felt strips. The felt strips, which were fitted around
the areas having bayonet-clip attachments, werebonded to the aluminum support structure with RTVadhesive.
Figure 7 shows the locations of thermocoupleand pressure instrumentation for the 20-panel array.
Fifty-five Chromel-Ahnnel (type K) thermocouples
were used to record panel and structure temperatures
during testing. The thermocouple mounting methods
and sheathing of the No. 30 AWG wire were similar tothose used on the two-panel array. For the 20-panel
array, 24 thermocouples were mounted on the uppersurface of the array, 9 were mounted on the external
surfaces of selected side closures (in the gaps between
panels), 3 were mounted on the internal surface of a
side closure (section D-D of fig. 7), 2 were mountedat the center on the interior face sheets of a panel
(section E-E of fig. 7), 10 were mounted on the lowersurface of selected panels, and 7 were mounted on the
support structure (aluminum plate and frame). Thelead wires of the internally mounted thcrmocouples
exited through the bottom of the panel, while thelead wires on the external surfaces of the side closureswere routed down the side closure and under the
panel. The lead wires of thermocouples mountedon the upper surface of a panel were routed to
the trailing edge, down the side closure, and under
the panel. Eleven pressure probes were used to
monitor pressures beneath the panels and in the gaps
between panels. Seven probes, which penetrated
the aluminum plate, were located beneath selectedpanels, and four probes were inserted from the edge
of the array into selected gaps. The probes located
in the gaps were used to monitor gap pressures
to determine whether significant pressure gradients
occurred during the aerothermal tests.
Ttle noncatalytic ceramic coating, CRC-SBE, was
applied to the upper surfaces of the panels along
rows 1 and 2 of the 20-panel array to evaluate its
adherence. (This coating was also used on the two-
panel array.) Also, a black coating, Pyromark 2500,was applied to the upper surfaces of the panels along
rows 3 and 4. Pyromark is a commercially avail-
able, high-temperature, high-emittancc (0.85) paint,
which is manufactured by Big Three Industries.
Test Facilities and Procedures
Cyclic Radiant Heating Tests of
Two-Panel Array
The cyclic radiant heating tests were conducted
in a radiant heating test chamber at NASA Johnson
Space Center. The chamber, shown in figure 8, is
designed to simulate the thermal and static pressureenvironments to which spacecraft thermal protection
systems are exposed during the ascent, orbit, and
entry phases of a mission.
The test chamber has a volume of 400 ft 3 and
can accommodate models up to 2 by 2 ft. A radiant
heater and a cryogenically cooled panel located insidethe test chamber are mounted on rails to allow either
one to be positioned over a test model during testing.
(The cryogenically cooled panel was not used duringthese tests.) The heater consists of electrically heated
graphite elements enclosed in a nitrogen-purged fix-ture box. One side of tile fixture box is a heated
niobium susceptor plate that reradiates thermal en-
ergy to the test model. A mechanical vacuum pump
is used to control static pressure conditions withinthe chamber. Thus, a test model can be heated or
cooled while pressure conditions are maintained. For
the cyclic radiant heating tests, only the pressure and
radiant heater systems were used to simulate entry
conditions for the two-panel array.
Tile test model, shown in figure 9, contained
the two-panel array and its support structure. The
support structure consisted of an aluminum panelholder and several types of insulation. The insulation
was located beneath and around the sides of the array
to minimize heat loss between the array and the panel
holder during testing.
Heater operating conditions, environmental testconditions, and model temperature response data
were recorded by two data acquisition systems. The
first system is an analog-to-digital recording system
that digitizesanalogdataforallchannelsandrecordsthe data on magnetictape. Tile secondsystem,whichrecordsanddisplaysreal-timedatafrom thefirst system,consistsof self-balancingpotentiometerstrip-chartrecordersthat alsoserveas a backupsystemfor theanalog-to-digitalsystem.
Thearraywassubjectedto anelevatedtemper-aturecurecyclefor about4600seeto removethevolatilecomponentsfromtheceramiccoating.Thefirst stepof the curecycleconsistedof heatingthesurfaceof the panels,underambientpressure,fromroomtemperatureto 225°Foveraperiodof 1000secandholdingat this temperaturefor 900sec.Thesec-ondstepconsistedof increasingthesurfacetemper-atureto 350°Fovera periodof 300secandholdingat this temperaturefor 900see.Thethird stepcon-sistedofincreasingthesurfacetemperatureto 500°Foveraperiodof 300seeandholdingat this tempera-turefor900sec.Thefourthstepconsistedofturningoff theheatersat 4300seeandallowingthe surfaceof thepanelsto air coolto ambienttemperature.
After thecurecycle,the arraywassubjectedto26thermal-pressurecyclesin thetestchamber.A cy-cleconsistedof evacuatingthechamberto 10-4 torrand exposingthe arrayto the surfacetemperatureandstaticpressurehistoriesshownin figure1. Thedetailsofthethermal-pressurecyclesaresummarizedin table I. The maximumsurfacetemperatureforcycles1 through25wasthe designtemperatureof1900°F.Thesurfaceof the arraywasintentionallyexposedto anover-temperatureconditionof 2000°Fduringcycle26,andthearraywasexposedto acous-tic testsbetweencycles 16 and 17.
Acoustic Tests of Two-Panel Array
The two-panel array was subjected to acoustic
tests in the Sonic Fatigue Laboratory (SFL) located
at Johnson Space Center. The SFL is used to expose
structural components to simulated rocket-launch-
induced and aerodynamically induced acoustic noiseenvironments. The primary test equipment consists
of a 16- by 20- by 40-ft reverberant test chamber
that can accommodate panels up to 15 by 20 ft. Testsound levels to 166 dB (reference level: 2.9 × 10 -9
psia) can be imposed on a test article. Excitation isnormally provided by one 20-Hz, one 40-Hz, two 100-
Hz, and eight 250-Hz horns. The horns are driven
by appropriate low- or high-frequency air modula-
tors (noise generators). These noise generators op-erate by chopping a compressed air stream provided
by a manifold. The manifold distributes the air from
three compressors that can be operated individually
or in combination toprovide a continuous total flowof 54 000 standard fta/min (SCFM) at a pressure of
about 30 psig. As many as twenty 300 000-acoustic-
watt and eighteen 10000-acoustic-watt noise gcner-ators arc available to drive the horns. The noise
generators are controllcd by 24 solid-state power am-
plifiers, each having an output capability of 4 kVA.
The acoustic test assembly was located on thefloor of the sound chamber and instrumented with
microphones and accelerometers. (See schematic
shown in fig. 10.) The two-panel array was placed on
a 0.25-in-thick foam pad, and the sides of the arraywere shielded from the sound chamber environment
by a plastic sheet and a layer of putty. The sheetwas placed between the putty and the sides of the
panels to protect the panels from putty contamina-
tion. Four microphones were mounted oil the floor
of the chamber, each located about 6 in. from a cor-
ner of the array. Two accelerometers, each with a
mass of 1.919 x 10 .4 slugs (2.8 g), were mounted on
the surface of panel 1. (See fig. 10.) AccelerometerA1 was located 2 in. from a corner of the panel, andaceelerometcr A2 was located at the center of the
panel.
After being exposed to the 16 thermal cycles de-
scribed in table I, the array was exposed to the acous-
tic spectrum (fig. 11) that corresponds to an overall
sound pressure level of 161 dB. The spectrum is rep-resentative of the sound environment near the aft end
of the Space Shuttle during launch. The array was
cxposcd to the acoustic spectrum for 15 rain. Based
on the assumption that the most severe acoustical ex-
posure occurs during the first 8 sec. of launch (ref. 2),this exposure approximates the cumulative acousticenvironment for 25 missions with a scatter factor of 4.
Aerothermal Tests of 20-Panel Array
The 20-panel array was exposed to thermal and
aerodynamic loads at hypersonic speeds in the Lang-
ley 8_HTT. The tunnel is a large blowdown facility
that can generate, for run times up to about 2 min,a test stream that simulates conditions at a nomi-
nal Mach number of 7 at altitudes between 80 000
and 125000 ft. (Sec schenmtic shown in fig. 12.)
The high energy needed for this simulation is ob-
tained by burning a mixture of methane and air
under pressure in the combustor (fig. 12(a)) and ex-panding the products of combustion through a coni-
cally contoured nozzle into an open-jet test chamber.
The flow enters a supersonic diffuser where an air
ejector pumps the flow through a mixing tube andexhausts the flow through a subsonic diffuser into
the atmosphere. This tunnel operates at combustor
total temperatures between 2060°F and 3140°F, at
free-stream dynamic pressures from 2.0 to 12.5 psia,
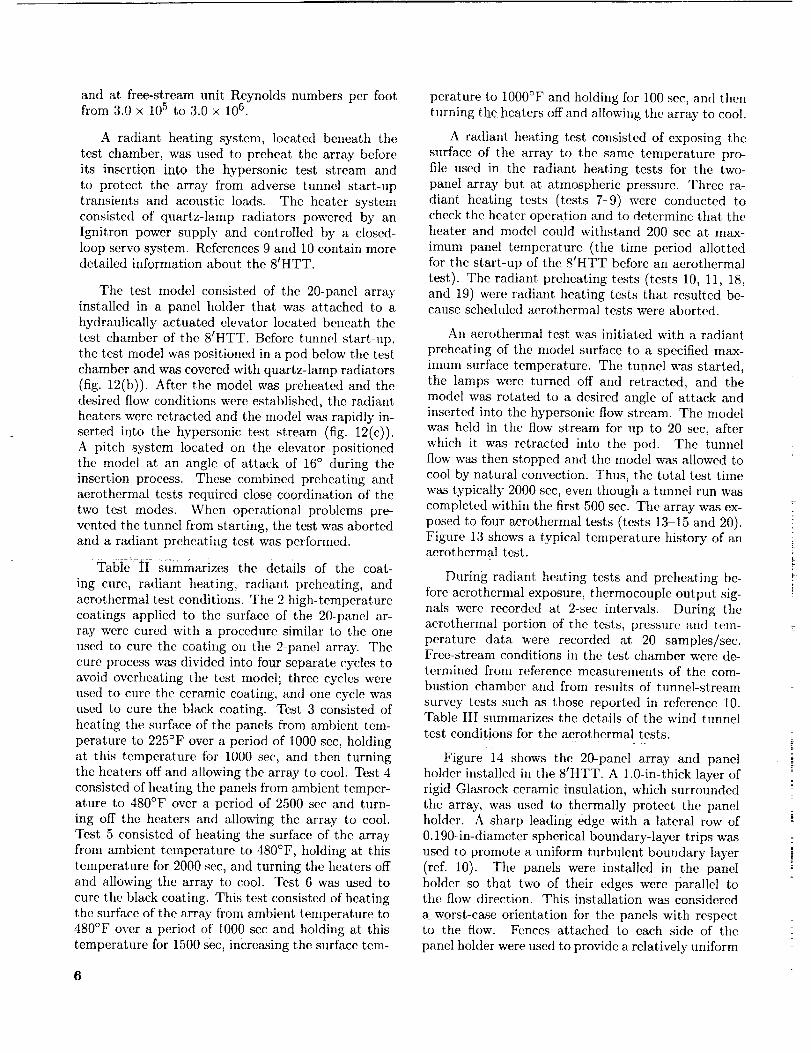
andat free-streamunit Reynoldsnumbersper footfrom3.0x 105to 3.0x 10⁶.
A radiantheatingsystem,locatedbeneaththetest chamber,wasusedto preheatthe arraybeforeits insertioninto the hypersonictest streamandto protect the array from adversetunnelstart-uptransientsand acousticloads. The heatersystemconsistedof quartz-lampradiatorspoweredby anIgnitron powersupplyand controlledby a closed-loopservosystem.References9and10containmoredetailedinformationaboutthe8_HTT.
The test modelconsistedof the 20-panelarray.installedin a panelholderthat wasattachedto ahydraulicallyactuatedelevatorloea{edbeneaththetest chamberof the 8_HTT.Beforetmmelstart-up,thetestmodelwaspositionedinapodbelowthetestchamberandwascoveredwithquartz-lampradiators(fig. 12(b)).After themodelwaspreheatedandthedesiredflowconditionswereestablished,theradiantheaterswereretractedandthemodelwasrapidlyin-sertedinto the hypersonictest stream(fig. 12(c)).A pitch systemlocatedon the elevatorpositionedthe modelat an angleof attack of 16° duringtheinsertionprocess.Thesecombinedpreheatingandaerothermaltestsrequiredclosecoordinationof thetwo test modes.Whenoperationalproblemspre-ventedthetunnelfromstarting,thetestwasabortedanda radiantpreheatingtestwasperformed.
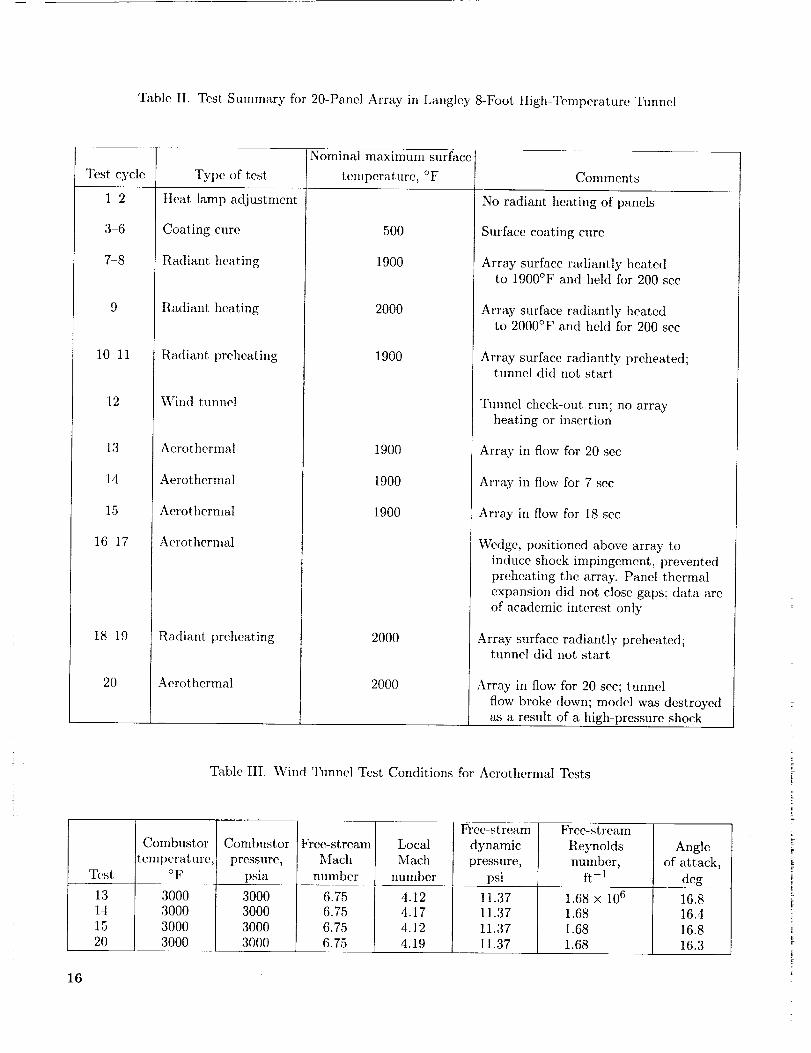
Table__I siimmarizesthe details of the coat-ing cure, radiantheating,radiantpreheating,andacrothermaltestconditions.The2high-temperaturecoatingsappliedto the surfaceof the 20-panelar-ray werecuredwith a proceduresimilarto theoneusedto curethecoatingon the 2-panelarray.Thecureprocesswasdividedintofourseparatecyclestoavoidoverheatingthe testmodel;threecycleswereusedto curetheceramiccoating,andonecyclewasusedto curethe blackcoating.Test3 consistedofheatingthesurfaceof thepanelsfromambienttem-peratureto 225°Fovera periodof 1000see,holdingat this temperaturefor 1000see,andthen turningtheheatersoff andallowingthearrayto cool.Test4consistedofheatingthepanelsfromambienttemper-atureto 480°Fovera periodof 2500secandturn-ing off the heatersandallowingthe array to cool.Test5 consistedof heatingthe surfaceof the arrayfromambienttemperatureto 480°F,holdingat thistemperaturefor2000see,andturningtheheatersoffandallowingthe arrayto cooI. Test6 wasusedtocuretheblackcoating.Thistestconsistedof heatingtile surfaceof thearrayfromambienttemperatureto480°Fovera periodof 1000seeandholdingat thistemperaturefor 1500sec,increasingthesurfacetem-
peratureto 1000°Fandholdingfor 100sec,andthenturningtheheatersoffandallowingthearray,to cool.
A radiantheatingtestconsistedof exposingthesurfaceof the array to the sametemperaturepro-file usedin the radiantheatingtestsfor the two-panelarraybut at atmosphericpressure.Threera-diant heatingtests (tests7 9) wereconductedtochecktheheateroperationandto determinethat theheaterand modelcouldwithstand200secat mayimumpaneltemperature(the time periodallottedforthestart-upof the8'HTT beforeanaerothermaltest). Theradiantpreheatingtests(tests10,11,18,and19)wereradiantheatingteststhat resultedbe-causescheduledaerothermaltestswereaborted.
An aerothermaltestwasinitiatedwith aradiant.preheatingof tile modelsurfaceto a specifiedmax-imumsurfacetemperature.Thetunnelwasstarted,the lampswereturnedoff and retracted,and themodelwasrotatedto a desiredangleof attackandinsertedinto thehypersonicflowstream.Themodelwasheld in the flowstreamfor up to 20see,afterwhich it wasretractedinto the pod. The tunnelflowwasthenstoppedandthemodelwasallowedtocoolbynaturalconvection.Thus,thetotal testtimewastypically2000see,eventhoughatunnelrunwascompletedwithin thefirst500see.Thearraywasex-posedto fouraerothermaltests(tests 13 15 and 20).
Figure 13 shows a typical temperature history of anaerotherm M test.
During radiant heating tests and preheating be-
fore aerothermal exposure, thermocouple output sig-
nals were recorded at 2-see intervals. During theaerothermal portion of the tests, pressure and tem-
perature data were recorded at 20 samples/see.Free-stream conditions in the test chamber were de-termined from reference measurements of the com-
bustion chamber and from results of tunnel-stream
survey tests such as those reported in reference 10.Table III summarizes the details of the wind tunneltest conditions for the aerothermal tests.
Figure 14 shows the 20-panel array and panel
holder installed in the 8tHTT. A 1.0-in-thick layer ofrigid Glasrock ceramic insulation, which surrounded
tile array, was used to thermally protect the panel
holder. A sharp leading edge with a lateral row of
0.190-in-diameter spherical boundary-layer trips was
used to promote a uniform turbulent boundary layer(refl i0). The panels were installed in the panel
holder so that two of their edges were parallel tothe flow direction. This installation was considered
a worst-case orientation for the panels with respectto the flow. Fences attached to each side of the
panel holder were used to provide a relatively uniform
two-dimensionalflowoverthe surfaceof the panelholder. Thelight-coloredcoatingon thepanelsonthe right in figure14 is the ceramic,noncatalyticcoating,andthedark-colored(black)coatingon thepanelson the left is the high-temperature,high-emittancepaint.
Thermal Analysis
Thethermalresponseof theSAHCtwo-panelar-raywaspredictedwithafinite-elementcomputerpro-gramcalledthe SPARThermalAnalyzer(ref. 11).The SPAR programcan be appliedto steady-state and transientthermal-analysisproblemsin-volvingconduction,convection,radiation,andmasstransport.
Finite-Element Thermal Model
Thefinite-elementthermalmodelshownin fig-ure 15representsa sectionof the arrayextendingfrom thecenterof panel1 to thecenterof panel2.
The Inconel 617 honeycomb sandwich, Cerachrome
insulation, Q-Fiber felt insulation, titanium honey-
comb sandwich, Nomex felt, air, and aluminum were
represented by three-dimensional (3-D) hexahedral
conduction elements. Elements representing air werelocated between the side closures in the gap region
and between the underside of each panel and the
aluminum plate. Heat transfer through the air was
by conduction. The Inconel 617 metal side closure,
overhanging lip, and underhanging lip were repre-
sented by two-dimensional (2-D) quadrilateral radi-ation elements superimposed on 2-D quadrilateral
conduction elements. The gap region, treated as
an enclosure for radiation analysis purposes, also
contained 2-D quadrilateral radiation elements onthe front and back openings of the gap. Although
three-dimensional elements were used throughout the
model, the analysis was considered to be a two-dimensional analysis because heat transfer occurred
only in the X-Y plane. Adiabatic wall boundary con-
ditions were applied to the four sides and the bot-
tom surface of the model. Measured surface temper-
ature data from the radiant heating tests (cycle 5)of the two-panel array were used as input data for
a time-dependent, temperature boundary condition
that was uniformly applied to the top surface of the
model. Conduction and radiation were the primary
modes of heat transfer considered; convective heat
transfer was neglected in the analysis.
The model, consisting of 1146 nodes and 585 ele-ments, represented a region 2.68 in. high, 12 in. long,
and 0.10 in. thick. The spacing between the panels
was 0.040 in. wide at the top of the gap and 0.232 in.
wide at the bottom of the gap. These dimensions ac-
count for upper and lower face sheet expansions dueto their respective increases in temperature at the
time of maximum surface heating. Even though the
gap dimensions on the actual array changed through-out the thermal cycle because of thermal deforma-
tions, this fixed-gap geometry was used throughout
the analysis. Also, a gap width dimension of 0.240 in.
at room temperature was used (for analytical pur-
poses only) as the reference spacing between adjacent
panels.
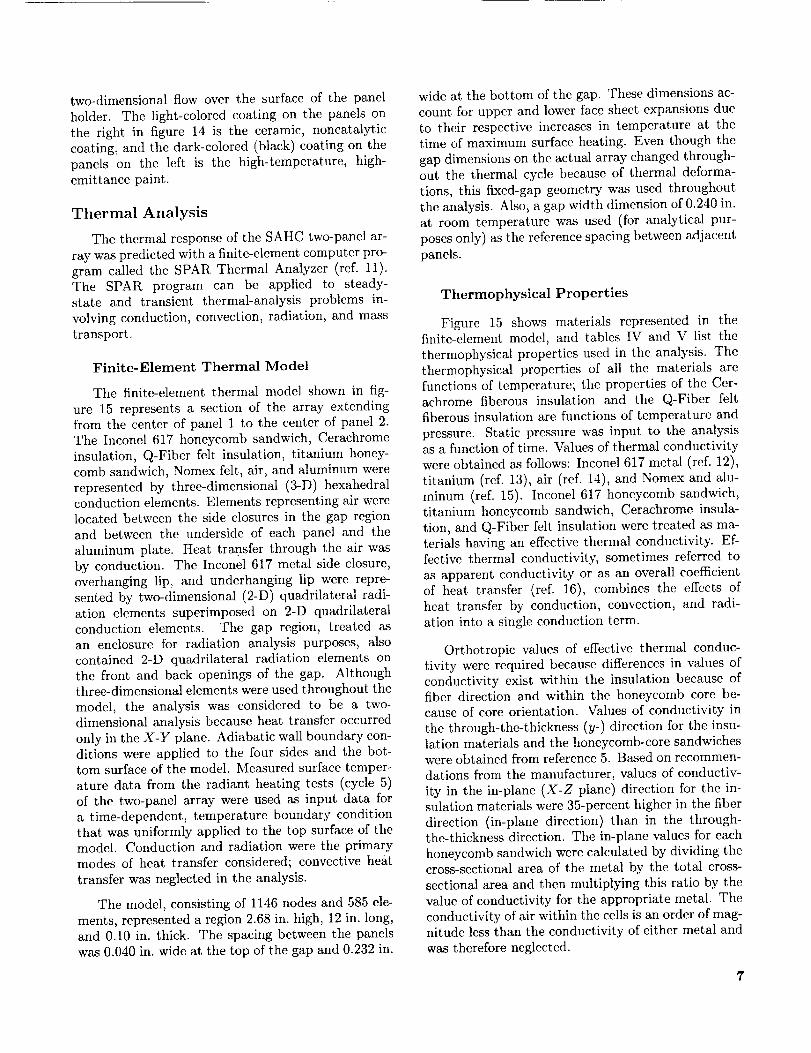
ThermophysicaI Properties
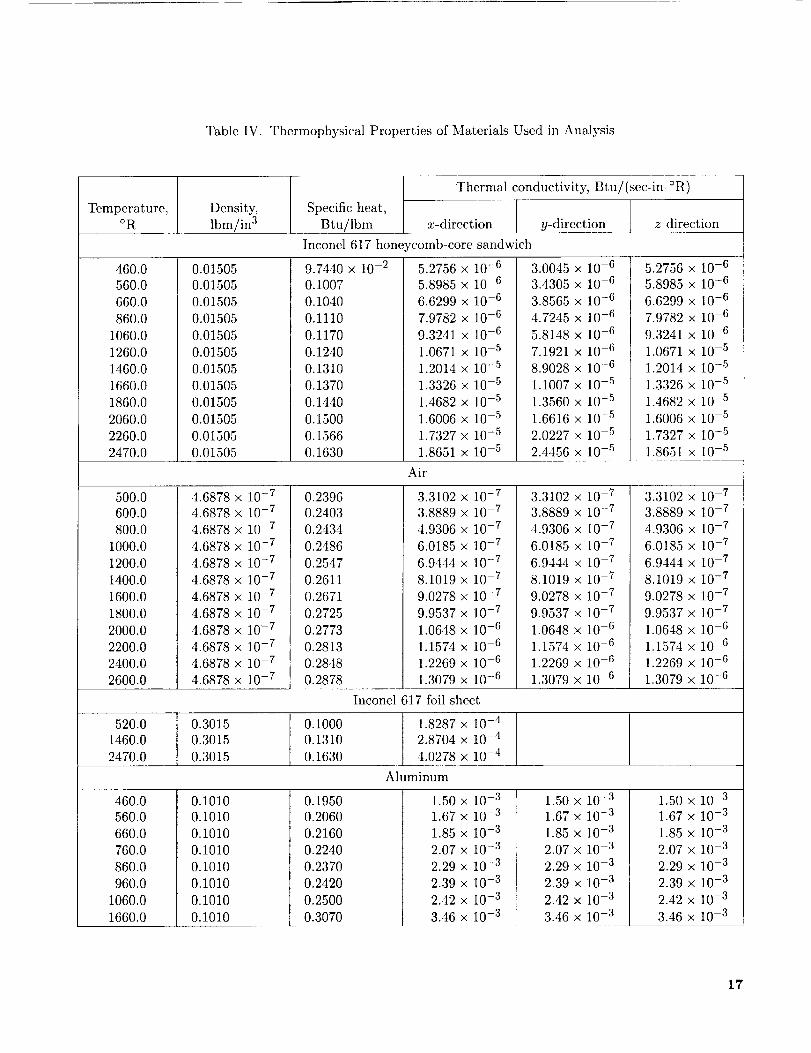
Figure 15 shows materials rcpresented in thefinite-element model, and tables IV and V list the
thermophysical properties used in the analysis. The
thermophysical properties of all the materials are
functions of temperature; the properties of the Cer-
aehrome fiberous insulation and the Q-Fiber feltfiberous insulation are functions of temperature and
pressure. Static pressure was input to the analysis
as a function of time. Values of thermal conductivity
were obtained as follows: Inconel 617 metal (ref. 12),
titanium (ref. 13), air (ref. 14), and Nomex and alu-
minum (ref. 15). Inconel 617 honeycomb sandwich,
titanium honeycomb sandwich, Cerachrome insula-tion, and Q-Fiber felt insulation were treated as ma-
terials having an effective thermal conductivity. Ef-
fective thermal conductivity, sometimes referred to
as apparent conductivity or as an overall coefficient
of heat transfer (ref. 16), combines the effects of
heat transfer by conduction, convection, and radi-ation into a single conduction term.
Orthotropic values of effective thermal conduc-tivity were required because differences in values of
conductivity exist within the insulation because of
fiber direction and within the honeycomb core be-cause of core orientation. Values of conductivity in
the through-the-thickness (y-) direction for the insu-
lation materials and the honeycomb-core sandwicheswere obtained from reference 5. Based on recommen-
dations from the manufacturer, values of conductiv-
ity in the in-plane (X-Z plane) direction for the in-sulation materials were 35-percent higher in the fiber
direction (in-plane direction) than in the through-the-thickness direction. The in-plane values for each
honeycomb sandwich were calculated by dividing the
cross-sectional area of the metal by the total cross-
sectional area and then multiplying this ratio by the
value of conductivity for the appropriate metal. The
conductivity of air within the cells is an order of mag-
nitude less than the conductivity of either metal and
was therefore neglected.
Figures16(a)and 16(b)showtheeffectivether-mal conductivitiesof Q-Fiberfelt insulationandofCerachromc insulation at atmospheric pressure asfunctions of temperature. The solid and dashed
curves shown in figure 16(a) are the upper and lowerboundaries of data taken from references 5 and 17
to 19. Tile data used to generate the curves in fig-ure 16(b) were obtained from references 5, 17, and
20. The data for Q-Fiber felt insulation (fig. 16(a))
show little scatter throughout the temperature range;however, significant scatter exists within tile data
for Cerachrome insulation (fig. 16(b)), especially at
the higher temperatures. An 87-percent difference in
conductivity exists between the lower boundary andupper boundary at 2000°F. The values at tile lower
boundary shown in the figures, which were taken
from reference 5, were used as input in the finite-
clement thermal analysis. Table 1Xr is a listing of the
data for the lower boundary presented as a functionof temperature amt pressure.
The thermophysical properties assigned to the ra-diation elements were emissivity, reflcctivity, and ab-
sorptivity. These properties, which are listed in ta-ble V, were held constant in temperature. Elements
with an emissivity of 1.0 (blackbody elements) were
used to close the fi'ont and back openings of thegap. These elements simulated radiation exchange
between the gap and the portions of the gap outsidethe plane of the model.
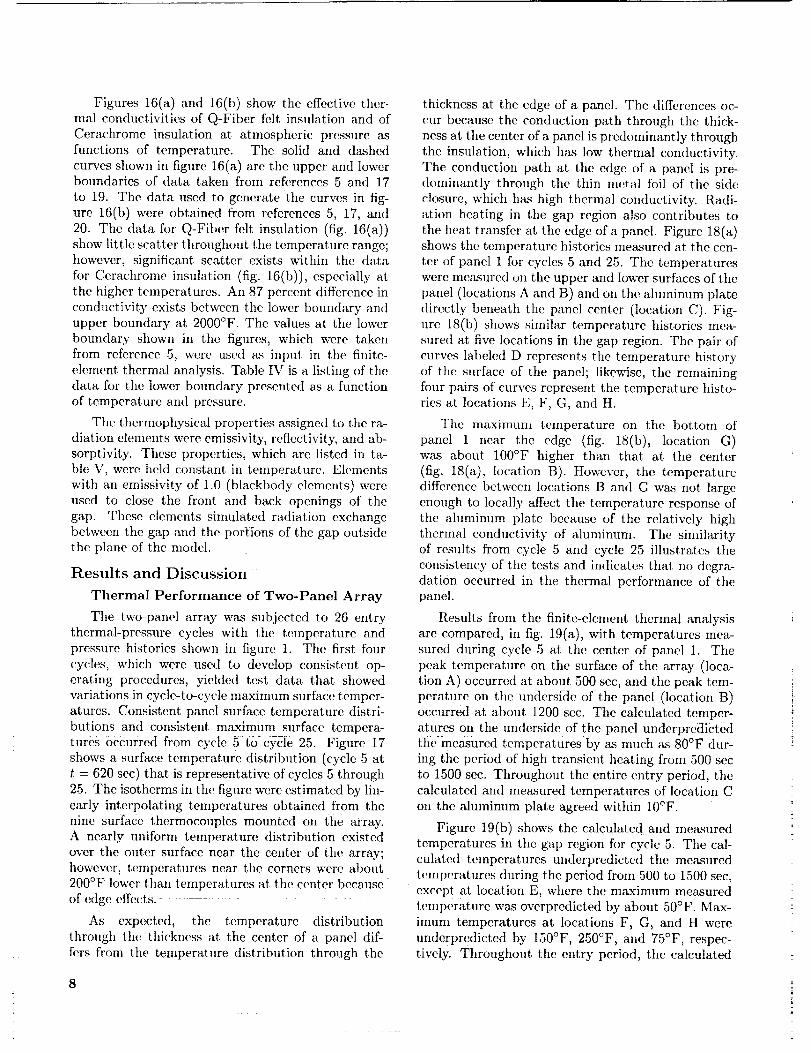
Results and Discussion
Thermal Performance of Two-Panel Array
The two-panel array was subjected to 26 entry
thermal-pressure cycles with the temperature and
pressure histories shown in figure 1. The first fourcycles, which were used to develop consistent op-
erating procedures, yielded test data that showed
variations in Cycle-to-cycle maximum surface temper-atures. Consistent panel surface temperature distri-
butions and consistent maximum surface tempera-
tures Occurred from cycle 5 t0 Cycle 25. Figure 17
shows a surface temperature distribution (cycle 5 at
t = 620 scc) that is representative of cycles 5 through
25. The isotherms in the figure were estimated by lin-early interpolating temperatures obtained from the
nine surface thermocouples mounted on tile array.A nearly uniform temperature distribution existed
over the outer surface near the center of the array;however, temperatures near the corners were about
200°F lower than temperatures at the center because
of edge effects. - ....
As expected, the temperature distribution
through the thickness at the center of a paneI dif-
Drs from the temperature distribution through the
thickness at the edge of a panel. The differences oc-
cur because the conduction path through the thick-
ness at the center of a panel is predominantly through
the insulation, which has low thermal conductivity.The conduction path at the edge of a panel is pre-dominantly through the thin metal foil of the side
closure, which has high thermal conductivity. Radi-ation heating in the gap region also contributes to
the heat transfer at the edge of a panel. Figure 18(a)shows the temperature histories measured at the cen-
ter of panel 1 for cycles 5 and 25. The temperatureswere measured on the upper and lower surfaces of the
panel (locations A and B) and on the aluminum plate
directly beneath the panel center (location C). Fig-ure 18(b) shows similar temperature histories mea-
sured at five locations in the gap region. The pair of
curves labeled D represents tile temperature history
of the surface of the panel; likewise, tile remainingfour pairs of curves represent the temperature histo-
ries at locations E, F, G, and H.
The maximum temperature on the bottom of
panel 1 near the edge (fig. 18(b), location G)was about 100°F higher than that at the center
(fig. 18(a), location B). However, the temperature
difference between locations B and G was not large
enough to locally affect the temperature response of
the aluminum plate because of the relatively high
thermal conductivity of aluminum. The similarityof results from cycle 5 and cycle 25 illustrates the
consistency of the tests and indicates that no degra-
dation occurred in the thermal performance of thepanel.
Results from tile finite-element thermal analysis
are compared, in fig. 19(a), with temperatures mea-sured during cycle 5 at the center of panel 1. The
peak temperature on the surface of the array (loca-tion A) occurred at about 500 sec, and tile peak tem-
perature on tile underside of the panel (location B)
occurred at about 1200 sec. The calculated temper-atures on the underside of the panel underpredicted
tim measured temperatures by as much as 80°F dur-
ing the period of high transient heating from 500 sec
to 1500 see. Throughout the entire entry period, thecalculated and measured temperatures of location C
on the aluminum plate agreed within 10°F.
Figure 19(b) shows the calculated and measured
temperatures in the gap region for cycle 5. The cal-
culated temperatures underprcdictcd the measured
temperatures during the period from 500 to 1500 sec,except at location E, where the maximum measured
temperature was ovcrpredicted by about 50°F. Max-
imum temperatures at locations F, G, and H were
undcrprcdicted by 150°F, 250°F, and 75°F, respec-
tively. Throughout the entry period, the calculated
and measured temperatures at location I on the alu-
minum plate agreed within 20°F. During all 26 entry
cycles, the TPS panels repeatedly limited tile maxi-
nmm temperature of the aluminum structure to well
below the design limit of 350°F.
Although the reason for ttle differences between
calculated and measured temperatures during tran-sient heating is not known, the use of standard
thermal material properties may have caused tile
differences. These properties are determined from
measurements taken during steady-state conditions
(refs. 19 and 20) and may not be adequate for the pr_
diction of temperatures under highly transient con-
ditions. Nevertheless, the relatively accurate predic-
tion of the panel, gap region, and aluminum plate
temperatures after 1500 sec (less transient condition)indicates that the overall thermal performance of the
TPS panels can be predicted.
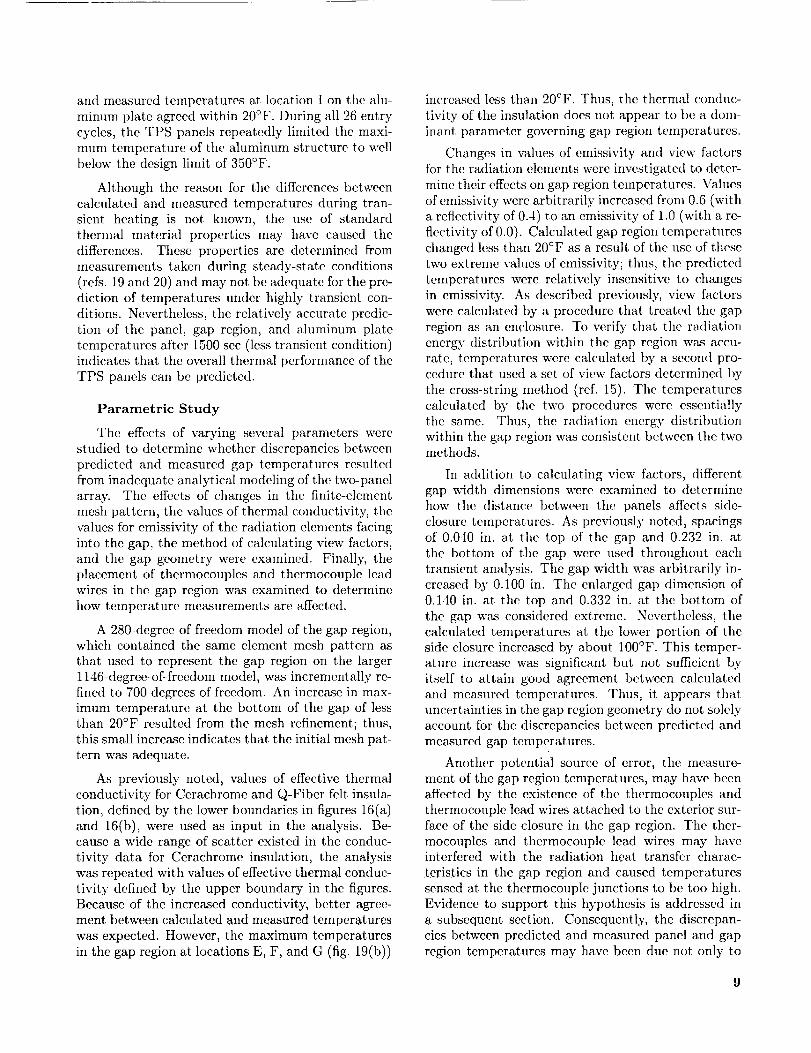
Parametric Study
The effects of varying several parameters were
studied to determine whether discrepancies between
predicted and measured gap temperatures resulted
from inadequate analytical modeling of the two-panel
array. Ttle effects of changes in the finite-elementmesh pattern, tile values of thermal conductivity, the
values for emissivity of the radiation elements facing
into the gap, the method of calculating view factors,
and the gap geometry were examined. Finally, the
placement of thermocouples and thermocouple leadwires in the gap region was examined to determine
how temperature measurements are affected.
A 280-degree-of-freedom model of the gap region,
which contained the same element mesh pattern as
that used to represent the gap region on the larger
1146-degree-of-freedom model, was incrementally re-fined to 700 degrees of freedom. An increase in max-
imum temperature at tile bottom of the gap of lessthan 20°F resulted from the mesh refinement; thus,
this small increase indicates that the initial mesh pat-
tern was adequate.
As previously noted, values of effective thermal
conductivity for Cerachrome and Q-Fiber felt insula-
tion, defined by the lower boundaries in figures 16(a)
and 16(b), were used as input in the analysis. Be-cause a wide range of scatter existed in the conduc-
tivity data for Ccrachrome insulation, the analysis
was repeated with values of effective thermal conduc-
tivity defined by the upper boundary in the figures.
Because of the increased conductivity, better agree-ment between calculated and measured temperatures
was expected. However, the maximum temperatures
in the gap region at locations E, F, and G (fig. 19(b))
increased less than 20°F. Thus, the thermal conduc-
tivity of the insulation does not appear to be a dom-
inant parameter governing gap region temperatures.
Changes in values of emissivity and view factorsfor the radiation elements were investigated to deter-
mine their effects on gap region temperatures. Valuesof emissivity wcrc arbitrarily increased from 0.6 (with
a reflectivity of 0.4) to an emissivity of 1.0 (with a rc-
flectivity of 0.0). Calculated gap region temperatures
changed less than 20°F as a result of ttle use of these
two extreme values of emissivity; thus, the predicted
temperatures were relatively insensitive to changes
in emissivity. As described previously, view factorswere calculated by a procedure that treated tile gap
region as an enclosure. To verify that the radiationenergy distribution within the gap region was accu-
rate, temperatures were calculated by a second pro-cedure that used a set of view factors determined by
the cross-string method (ref. 15). The temperaturescalculated by the two procedures were essentially
the same. Thus, the radiation energy distribution
within the gap region was consistent between the twomethods.
In addition to calculating view factors, different
gap width dimensions were examined to determine
how the distance between the panels affects side-
closure temperatures. As previously noted, spacings
of 0.040 in. at the top of tile gap and 0.232 in. at
the bottom of the gap were used throughout eachtransient analysis. The gap width was art/itrarily in-
creased by 0.100 in. The enlarged gap dimension of
0.140 in. at the top and 0.332 in. at the bottom of
the gap was considered extreme. Nevertheless, the
calculated temperatures at tim lower portion of theside closure increased by about 100°F. This temper-
ature increase was significant but not sufficient by
itself to attain good agreement between calculated
and measured temperatures. Thus, it appears thatuncertainties in the gap region geometry do not solely
account for the discrepancies between predicted and
measured gap temperatures.
Another potential source of error, the measure-
mcnt of the gap region temperatures, may have been
affected by the existence of tile thermocouples andthermocouple lead wires attached to the exterior sur-
face of the side closure in the gap region. The ther-
mocouples and thermocouple lead wires may haveinterfered with the radiation heat. transfer charac-
teristics in the gap region and caused temperatures
sensed at the thermocouple junctions to be too high.Evidence to support this hypothesis is addressed in
a subsequent section. Consequently, the discrepan-
cies between predicted and measured panel and gap
region temperatures may have been due not only to
9
deficienciesin the analysisbut alsoto temperaturemeasurementerrors.
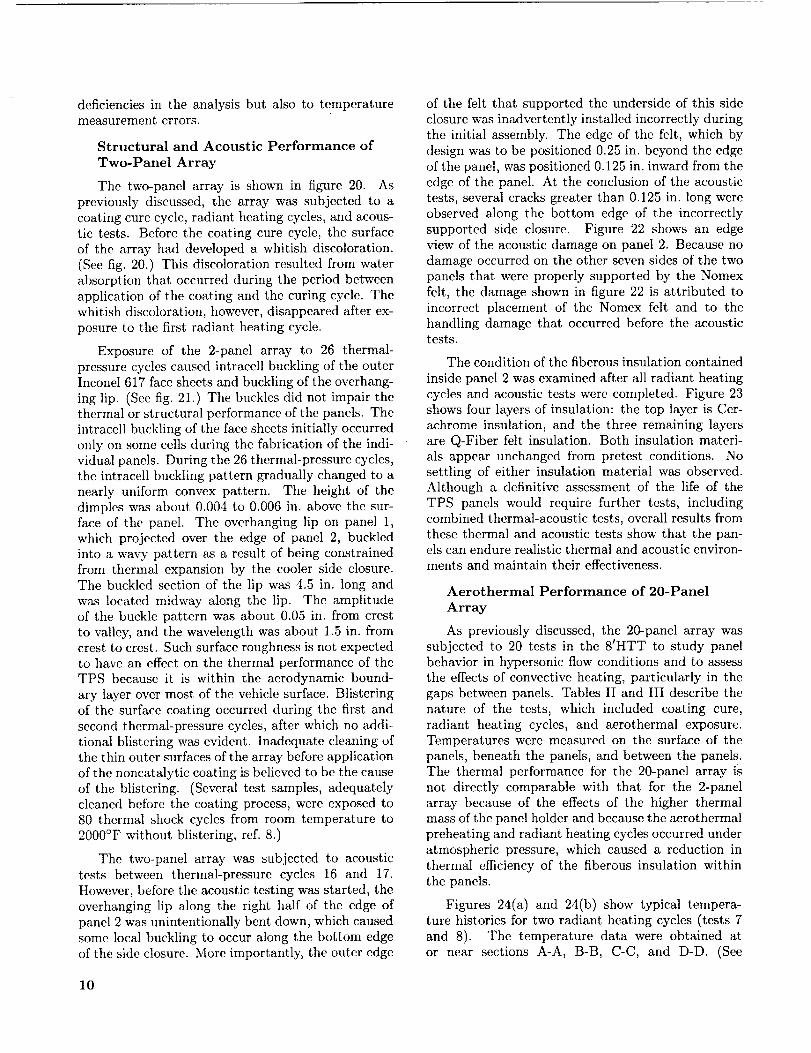
Structural and Acoustic PerformanceofTwo-PanelArrayThe two-panelarrayis shownin figure20. As
previouslydiscussed,the arraywassubjectedto acoatingcurecycle,radiantheatingcycles,andacous-tic tests.Beforethecoatingcurecycle, the surface
of the array had developed a whitish discoloration.
(See fig. 20.) This discoloration resulted from waterabsorption that occurred during the period between
application of the coating and the curing cycle. The
whitish discoloration, however, disappeared after ex-
posure to the first radiant heating cycle.
Exposure of the 2-panel array to 26 thermal-pressure cycles caused intracell buckling of the outer
Inconel 617 face sheets and buckling of the overhang-
ing lip. (See fig. 21.) The buckles did not impair thethermal or structural performance of the panels. The
intracell buckling of the face sheets initially occurred
only on some cells during the fabrication of the indi-
vidual panels. During the 26 thermal-pressure cycles,the intracell buckling pattern gradually changed to a
nearly uniform convex pattern. The height of the
dimples was about 0.004 to 0.006 in. above the sur-face of tile panel. The overhanging lip on panel 1,
which projected over the edge of panel 2, buckled
into a wavy pattern as a result of being constrained
from thermal expansion by the cooler side closure.The buckled section of the lip was 4.5 in. long and
was located midway along the lip. The amplitude
of the buckle pattern was about 0.05 in. from crest
to valley, and the wavelength was about 1.5 in. fromcrest to crest. Such surface roughness is not expected
to have an effect on the thermal performance of the
TPS because it is within the aerodynamic bound-
ary layer over most of the vehicle surface. Blisteringof the surface coating occurred during the first and
second thermal-pressure cycles, after which no addi-
tional blistcring was evident. Inadequate cleaning oftile thin outer surfaces of tile array before application
of the noncatalytic coating is believed to be the causeof the blistering. (Several test samples, adequately
cleaned before the coating process, were exposed to
80 thermal shock cycles from room temperature to2000°F without blistering, ref. 8.)
The two-panel array was subjected to acoustic
tests between thermal-pressure cycles 16 and 17.
However, before the acoustic testing was started, the
overhanging lip along the right half of the edge of
panel 2 was unintentionally bent down, which causedsome local buckling to occur along the bottom edge
of the side closure. More importantly, the outer edge
10
of the felt that supported the underside of this side
closure was inadvertently installed incorrectly during
the initial assembly. The edge of the felt, which by
design was to be positioned 0.25 in. beyond the edge
of the panel, was positioned 0.125 in. inward from the
edge of the panel. At the conclusion of the acoustictests, several cracks greater than 0.125 in. long were
observed along the bottom edge of the incorrectly
supported side closure. Figure 22 shows an edge
view of the acoustic damage on panel 2. Because nodamage occurred on the other seven sides of the two
panels that were properly supported by the Nomex
felt, the damage shown in figure 22 is attributed to
incorrect placement of the Nomex felt and to the
handling damage that occurred before the acoustictests.
The condition of the fiberous insulation contained
inside panel 2 was examined after all radiant heating
cycles and acoustic tests were completed. Figure 23
shows four layers of insulation: the top layer is Cer-achrome insulation, and the three remaining layers
are Q-Fiber felt insulation. Both insulation materi-
als appear unchanged from pretest conditions. No
settling of either insulation material was observed.Although a definitive assessment of the life of the
TPS panels would require further tests, includingcombined thermal-acoustic tests, overall results from
these thermal and acoustic tests show that the pan-els can endure realistic thermal and acoustic environ-ments and maintain their effectiveness.
Aerothermal Performance of 20-Panel
Array
As previously discussed, the 20-panel array wassubjected to 20 tests in the 8'HTT to study panel
behavior in hypersonic flow conditions and to assess
the effects of convective heating, particularly in the
gaps between panels. Tables II and III describe the
nature of the tests, which included coating cure,
radiant heating cycles, and aerothermal exposure.Temperatures were measured on the surface of the
panels, beneath the panels, and between the panels.The thermal performance for the 20-panel array is
not directly comparable with that for the 2-panel
array because of the effects of the higher thermal
mass of the panel holder and because the aerothermal
preheating and radiant heating cycles occurred underatmospheric pressure, which caused a reduction in
thermal efficiency of the fiberous insulation within
the panels.
Figures 24(a) and 24(b) show typical tempera-
ture histories for two radiant heating cycles (tests 7
and 8). The temperature data were obtained ator near sections A-A, B-B, C-C, and D-D. (See
fig. 7.) All temperaturesshownweremeasuredinthegapsbetweenpanelsexceptthesurfacetemper-atures,whichweremeasuredabout6 in. from thecorrespondingsectionlocation.All gapthermocou-plesandthermocoupleleadwiresweremountedex-ternally (solid lines in fig. 24) to the panelsideclosuresexceptthoseat sectionD-D, whichweremountedinternally(dashedlinesin fig. 24). Tem-peraturesat thetop of eachgapwerenot availablebecausethermocouplesmountedat the top of thegapsweredamagedinprevioustests.
Temperaturessensedby externally mountedthermocouplcswere,in general,higherthan tem-peraturessensedby internallymountedthermocou-ples. Althoughthe externallymountedthermocou-pleswerenot locatedat the samepositionon thearrayastheinternallymountedthermocouples(sec-tion D-D), the surfacetemperaturesmeasuredatsectionD-D wereequalto or higherthan thoseatsectionA-A. A comparisonof temperaturesat sec-tionsD-DandA-Ain test7andtest8(fig.24)showsthat externallymountedthermocouplesatthemiddleandat thebottomof thegapsensehighertemper-aturesandsensetemperaturechangesmorerapidlythaninternallymountedthermocouples.Thesecom-parisonsindicatethat theexternallymountedther-mocouplesandthermocoupleleadwires,asa resultof beingin a moreexposedlocation,weresensitiveto radiationheattransfer. Additionally,theexter-nally mountedthermocoupleleadwiresmayhavepreventedthegapsfromclosingwhenthepanelswereheated.Theseheatingeffectsmayhavealsooccurredduringthetestingofthetwo-panelarraybecausethetwo-panelarrayhadsimilarthermocoupleinstrumen-tationandwassubjectedto similarradiantheatingconditions.
Figure25showsa typicaltemperaturehistoryforan aerothermaltest (test 13). The temperaturesshownweremeasuredat sectionE-E at the centerof panel2C. (Seefig. 7.) The inset showsthetemperaturehistorywith an expandedtime scalefrom30secbeforethetimelabeledmodel-in (when
the model was inserted into the tunnel flow) to the
time labeled model-out (when the model was removed
from the tunnel flow). Thermocouples 15 and 44were located on the outer and inner face sheets of the
Inconel 617 honeycomb sandwich, thcrmocouples 45and 30 were located on the inner and outer face
sheets of the titanium honeycomb sandwich, and
thermocouple 54 was located on the aluminum plate.
The surface of the array was preheated with the
radiant heat lamps to about 1900°F. During the time
required to retract the heaters and insert the model
into the hypersonic flow, the surface temperature of
the array decreased to about 1100 ° . (For example,see thermocouple 15, fig. 25.) When the model was
inserted into the flow, the surface temperature of
the panel rapidly increased to about 1700°F because
of aerodynamic heating. The constant temperatureof thermocouple 30 (fig. 25) is representative of allthe thermocouples located on the underside of the
panels and indicates that forced convective heatingdid not occur under the panels. After the model was
retracted from the flow, the array was allowed to cool.
One objective of the aerothermal tests was todetermine whether convective heating occurs in the
gaps between panels when the gaps are aligned withthe flow. Previous tests on an array of thinner metal-
lic panels with gaps skewed 30 ° to the flow (ref. 21)
revealed no gap heating. The SAHC panels wereinstalled in a worst-case orientation with the gaps
parallel to the flow. This orientation may cause hot
gas flow to occur in the gaps between panels. Fig-ure 26 shows temperature histories measured during
tests 13, 14, 15, and 20 at the bottom of the gaps at
sections A-A, B-B, C-C, and D-D (thermocouples 37,
40, 43, and 48, respectively). The temperature his-tories of thermocouples 37, 40, and 43 (solid lines
in fig. 26) show an increase of 400°F at the bot-tom of the gaps when the array was inserted into
the hypersonic flow. This rapid rise in temperatureresulted from convective heating caused by hot gas
flow in the gaps that contained thermocouple leadwires at the top and the middle of the gap. The
presence of the lead wires may have created a hot
gas flow path that caused or contributed to the con-vective heating. However, for each of the four tests,
the temperatures sensed by ttle internally mounted
thermocouple (thcrmocouple 48, shown by dashedlines in fig. 26) did not indicate a rapid tempera-
ture rise. Thus, even though forced convective heat-
ing occurred in the gaps, the one instrumented gaparea without thermocouple wires showed negligible
convective heating. Because the existence of thermo-
couple wires in the gaps between panels may have
contributed to the gap heating, a definitive conclu-sion as to the severity of aerothermal heating in gaps
that arc parallel to the flow is not possible.
If convective heating in the gaps between pan-els does occur when the direction of flow over the
surface of a vehicle is parallel to the orientation of
the gaps between panels, the TPS concept may re-quire modification to eliminate or at least sharply
reduce such heating. One proposed modification con-sists of a beaded Inconel 617 foil bag filled with
Cerachrome insulation placed between the side clo-
sures of adjacent panels so that it meshes withthe beads of the side closure. This compressible
11
gap-filler design, which is described in reference 22, islightweight (0.38 lbm/ft2), is easily brazed to the side
closure, and does not interfere with the installation or
removal of the panels. Another proposed modifica-
tion described in reference 22 uses a short foil strip
attached at one corner of each panel to block the flow
in the gap. However, no such modifications wcrc in-corporated or evaluated during these tests.
Before test 20, the surface of the array was inten-
tionally damaged in four places to obtain a qualita-tive assessment of the effects of a hypersonic flow over
different types of surface irregularities that may ex-
ist. on a TPS panel. These surface irregularities were
holes of about 0.5 in. in diameter that represented
several types of damage. (See fig. 27.) hnpact dam-age was simulated by grinding the outer face sheet
and core and by punching through the outer face
sheet and crushing the core. Lightning strike damage
(ref. 2) was simulated by burning through only theouter face sheet by gas torch, and accidental loss of
an attachment plug was simulated by removing an
attachment plug.
Figure 28 shows the effects of aerodynamic heat-
ing on the intentionally damaged surface of the model
during test 20. The only lighting used to expose the
fihn of the photograph was that radiating from thesurface of the array. The surface temperature was
about 1850°F. Tile torch burn-through damage is the
bright hot spot on the right side of fgure 28. How-ever, the other holes, which were similar in size but
deeper, are not apparent in the figure. These results
suggest, that the appearance of the hot spot was dueto the exposure of the honeycomb core to the hyper-sonic stream.
Additional hot spots at four locations on the ar-
ray surface (fig. 28) were caused by corners of gapcovers (panel overhanging lips) bent up into the flow
stream. The corner of tile gap cover located near the
center of the array may have been pushed up intotile flow stream as a result of differences in panel
corner rotations that resulted from a unique com-
bination of bayonet-clip attachments and through-
panel fasteners at the intersection of the four ad-
jacent panels (panels 1B, 1C, 2B, and 2C, shown
in fig. 6). The bent up gap covers along the trail-ing edge of the array were probably caused by the
panels thermally deforming against rigid Glasrock
insulation that surrounded the array. The thermaldeflections of the heated panels resulted in pillow-
ing which caused slightly higher surface temperatures
and greater brightness to occur on the upstream sideand at the center rather than on the downstream
side of individual panels. For example, the maximum
temperatures at thermocouples 21 and 22 (fig. 7)
were 1760°F and 1850°F, respectively. The greater
brightness of the right-hand side of the array was
caused by the panels with the noncatalytic coating
having a lower emissivity, and thus a higher temper-ature, than the panels with the high-emissivity black
surface coating. (Catalytic reactions were not a fac-
tor in these tests because the enthalpy of tile Langley
8tHTT is not high enough to cause dissociation.) Thehot spots identified as face sheet buckles were due to
local separation of the face sheet from the core; this
separation was caused by thermal shock when molten
glass contacted the panel surface. The molten glass
resulted during wind tunnel start-up when fiberglass
curtains (which were used to confine radiant heatto the surface of the array during radiant heating
tests) contacted tile radiant heat lamps, melted, and
dripped onto the array surface.
After the array was in the hypersonic flow for
about 20 see during test 20, the bolts holding the
lower leading edge cover plate to the panel holder (seefig. 14) failed and allowed the plate to separate from
the panel holder. This failure choked the hypersonicflow and caused the tunnel to unstart. A strong shock
wave of undefined strength (greater than 10 psia rise
in 0.2 see) passed through the test section and over
the array. The panels, which were designed to with-
stand only a pressure load of 2 psi, were completelydestroyed by the shock wave. Figure 29 shows the
remnants of the array and the locations of panels 1C,1D, 2C, and 2D. The only components of the ar-
ray that survived the unstart were the aluminum
plate, Nomex felt, and various pieces, such as fas-
tener tubes, vehicle clips, titanium honeycomb sand-
wich panels, and thermoeouple lead wires. Scorchingof the Nomex felt strips occurred near the corners of
panels and at locations along the edges of some pan-
els. The longitudinal felt strips were more severely
scorched than the transverse strips. Although scorch-
ing of the felt could have occurred during the radiantheating tests, previous tunnel tests, or unstarting of
the hypersonic flow, this scorching pattern suggests
that some forced convective heating occurred in the
gaps between panels during the tunnel tests. These
results support the conclusion stated previously inthe discussion of figure 26; that is, forced convec-
tive heating caused a rapid gap temperature increasewhen the model was inserted into the flow.
Concluding Remarks
Superalloy honeycomb (SAHC) metallic thermal
protection system (TPS) panels, which were fabri-
cated with foil-gauge Inconel and titanium metals
and fiberous insulation, were subjected to thermal,
acoustic, and aerothermal tests. The panels had a
12
massof 2.201lbm/ff2andcouldbemechanicallyat-tachedto the primarystructureof anentry vehi-cle. Thepurposeof tile testswasto assessthevi-ability of the TPSconceptandto identifypossibleshortcomings.
A 2-panelarrayof SAHCTPSpanelswassub-jected to 26 entry thermal-pressurecyclesthatsimulatedaSpaceShuttleentrytrajectoryat a loca-tionon thevehiclewith amaximumsurfacetemper-atureof 1900°F.Theresultsfrom theradiantheat-ingtestsandthermalanalysesindicatethattheTPSpanelsrepeatedlylimitedthemaximumtemperatureof thealuminumprimarystructureto wellbelowthedesignlimit of 350°F.Thefiberousinsulationcon-tainedwithin thepanelsdid not settleor changeinappearanceafteracoustictestingandradiantheat-ingtesting.Cracks,observedaftercompletionof theacoustictests,occurredin onesidewallthat wasnotadequatelysupportedby Nomexfelt. No damage
occurred on the other seven sides of the two panels,which were properly supported by the Nomex felt.
However, a definitive assessment of acoustic life of
the TPS panels would require further tests.
Aerothermal test results show that a 20-panel ar-
ray of SAHC TPS panels can successfully survive the
aerodynamic and thermal conditions of a hypersonic
flowstream. The panels were installed in a worst-case
orientation with the gaps parallel to the flow. This
orientation may have caused or contributed to the
hot gas flow that occurred in the gaps between thepanels. The existence of thermocouple wires in the
gaps between panels may have contributed to the gap
heating. Proposed design changes to eliminate gap
heating include avoiding placement of foreign mate-
rial (such as thermocouple wires) between panels, ori-enting panels so that gaps are not parallel to the flow,
and using a packaged, compressible gap-filler mate-
rial between panels to block hot gas flow.
Results from these thermal, acoustic, and aero-
thermal tests show that the SAHC TPS panels can
repeatedly endure a realistic entry environment and
maintain their effectiveness. The panels limit the
primary-structure temperature as designed, have lowmass, and exhibit tolerance to damage in an aerother-
mal environment. Based on these tests, this thermal
protection system appears to be a viable candidatefor use on future hypersonic vehicles like the SpaceShuttle.
NASA Langley Research CenterHampton, VA 23681-0001November 24, 1992
References
1. Jackson, L. Robert; and Dixon, Sidney C.: A DesignAssessment of Multiwall, Metallic Stand-Off, and RS[Reusable Thermal Protection Systems Including SpaceShuttle Application. NASA TM-81780, 1980.
2. Shideler, J. L.; Webb, G. L.; and Pittman, C. M.: Verifi-cation Tests of Durable TPS Concepts. NASA TM-86313,1984.
3. Burns, A. B.; Bantus, R. P.; and Izu, Y. D.: AdvancedCeramic TPS Concepts. Advances in TPS and Struc-tures for Space Transportation Systems, H. Neale Kellyand James E. Gardner, compilers, NASA CP-2315, 1984,pp. 239 258.
4. Webb, Granville L.; and Pittman, Claud M.: Design,Fabrication, and Test of a Multipost ACC TPS Concept.Advances in TPS and Structures for Space TransportationSystems, H. Neale Kelly and James E. Gardner, compilers,NASA CP-2315, 1984, pp. 489 508.
5. Blair, W.; Meaney, J. E.; and Rosenthal, H. A.: Fab-rication of Prepackaged SuperaIloy Honeycomb ThcrmalProtection System (TPS) Panels. NASA CR-3755, 1985.
6. Blair, Winford: Manufacturing Experiences for AdvancedMultiwall and Prepackaged Metallic TPS. Advances inTPS and Structures for Space Transportation Systems,H. Neale Kelly and James E. Gardner, compilers, NASACP-2315, 1984, pp. 261 301.
7. Sawyer, James Wayne: Mechanical Properties of the Shut-tle Orbiter Thermal Protection System Strain IsolatorPad. AIAA-82-0789, May 1982.
8. Pittman, Claud M.; Brown, Ronaht D.; and Shideler, JohnL.: Evaluation of a Non-Catalytic Coating for MetallicTPS. NASA TM-85745, 1984.
Deveikis, William D.; Bruce, Walter E., Jr.; and Karns,John R.: Techniques for Ae.rothermal Tests of Large,FIightweight Thermal Protection Panels in a Mach 7 WindTunnel. NASA TM X-71983, 1974.
t0. Deveikis, William D.; and Hunt, L. Roane: Loading andHeating of a Large Flat Plate at Mach 7 in the Langley8-Foot High-Temperature Structures Tunnel. NASA TND-7275, 1973.
11. Marlowe, M. B.; Moore, R. A.; and Whetstone, W. D.:SPAR Thermal Analysis Processors Reference Manual,System Level I6. NASA CR-159162, 1979.
12. Brown, William F., Jr.; Mindlin, Harold; and Ho,C. Y.: Aerospace Structural _letals Handbook--Volume 5,1992 ed. (Incorporating Supplements through 1991).CINDAS/Purdue Univ., c.1992.
13. Military Standardization Handbook Metallic Materialsand Elements for Aerospace Vehicle Structures, Volume 2.
MIL-HDBK-5C, U.S. Dep. of Defense, Sept. 15, 1976.
13
14. Keenan, Joseph It.; Chao, ling; and Kaye, Joseph: Gas
Tables Thermodynamic Properties of Air Prvduets of
Combustion and Component Gases Compressible Flow
Functions (Including Those of Ascher H. Shapiro and
Gilbert M. Edelman), Second ed. (English Units). John
Wiley & Sons, Inc., c.1980.
15. Shideler, John L.; Sawyer, James V_ayne; Blosser, Max
L.; and Webb, Granville L.: Multiwall/RSI Concept for
Local Application to Space Shuttle Body Flap. NASA
TM-87589, 1985.
16. Kreith, Frank; and Black, William Z.: Basic IIeat Trans-
fer. Harper & Row, Publ., c.1980.
17. Hays, D.: An Assessment of Alternate Thermal Pwtection
Systems for the Space Shuttle Orbiter. NASA CR-165790,
1982.
18. Ho, T.; and Allsup, H. C.: ACC Heat Shield Viability.
NASA CR-177934, 1985.
I9. Aerospace Insulation Q-Fiber® Felt. A1-8, Manville
Products Corp., Sept. 1982.
20. Refractory P_vducts Cerachrome TM Blanket. R-510,
Sec. 120, Pt. 20, Manville Products Corp., Mar. 1984.
(Cancels Aug. t983.)
21. Avery, Don E.; Shideler, John L.; and Stuckey, Robert
N.: Thermal and Aerothermal Performance of a Titanium
Multiwall Thermal Protection System.. NASA TP-1961,
1981.
22. Anderson, J.; LeHolm, R. B.; Meaney, J. E.; and Rosen-
thal, H. A.: Development of Reusable Metallic Ther-
mal Protection System Panels for Entry Vehicles. NASA
CR-181783, 1989.
14
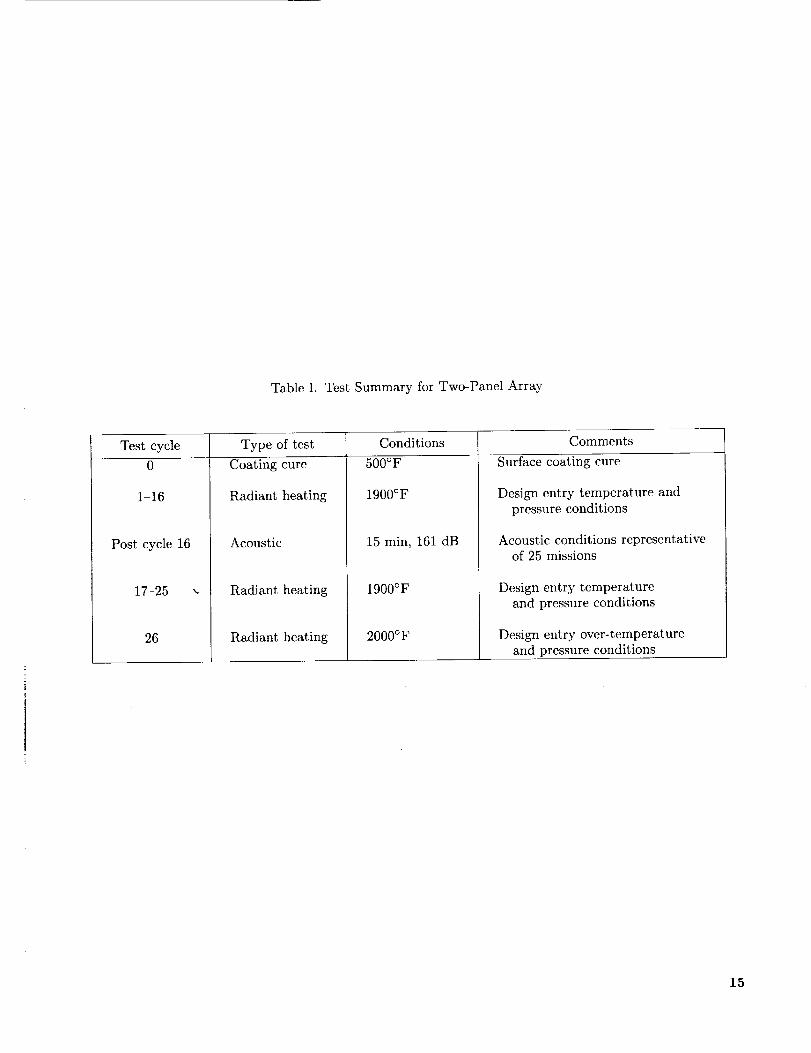
Table I. Test Summary for Two-Panel Array
Test cycle
0
1 16
Post cycle 16
17-25
26
Type of test
Coating cure
Radiant heating
Acoustic
Radiant heating
Radiant heating
Conditions
500OF
1900°F
15 rain, 161 dB
1900°F
2000°F
Comments
Surface coating cure
Design entry temperature and
pressure conditions
Acoustic conditions representativeof 25 missions
Design entry temperature
and pressure conditions
Design entry over-temperature
and pressure conditions
15
TableII. TestSummaryfor 20-PanelArray in Langley8-FootHigh-TemperatureTunnel
Testcycle12
36
78
10 11
12
13
14
15
16 17
1819
2O
Typeof test
tteat lampadjustment
Coatingcure
Radiantheating
Radiantheating
Radiantpreheating
Wind tunnel
Aerothermal
Aerothermal
Aerothermal
Aerothcrmal
Radiantpreheating
Aerothermal
Nominalmaximumsurfacetemperature,°F
500
1900
2000
1900
1900
1900
1900
2000
2000
Comments
Noradiantheatingof panels
Surfacecoatingcure
Arraysurfaceradiantlyheatedto 1900°Fandhehtfor 200see
Arraysurfaceradiantlyheatedto 2000°Fandheldfor 200 sec
Array- surface radiantly preheated;tunnel did not start
Tunnel check-out run; no array"heating or insertion
Array in flow for 20 sec
Array in flow for 7 see
Array" in flow for 18 sec
Wedge, positioned above array to
induce shock impingenmnt, preventedpreheating the array. Panel thermal
expansion did not close gaps; data are
of academic interest only
Array surface radiantly preheated;tunnel did not start
Array in flow for 20 sec; tunnel
flow broke down; model was destroyedas a result of a high-pressure shock
Table III. Wind Tunnel Test Conditions for Aerothermal Tests
Test
1314
15
20
Combustor
temperature,oF
30003000
3000
3000
Combustor
pressure,
psia
300030003000
3000
Free-streamMaeh
number
6.756.75
6.75
6.75
Local
Mach
numl)er
4.12
4.174.12
4.19
Free-stream
dynamic
pressure,
psi
11.3711.37
11.3711.37
Free-stream
Reynolds
number,ft-I
1.68 x 10⁶
1.681.68
1.68
Angleof attack,
deg
16.816.4
16.8
16.3
16
TableIV. ThermophysicalPropertiesof MaterialsUsedin Analysis
Temperature,oR
Density,lbm/in3
Specificheat,Btu/lbm
Thermalconductivity,Btu/(sec-in-°R)
x-direction y-direction z-direction
460.0
560.0
660.0
860.0
1060.0
1260.0
1460.0
1660.0
1860.0
2060.0
2260.0
2470.0
Inconel 617 honeycomb-core sandwich
0.01505 9.7440 x 10 .2
0.1007
0.1040
0.1110
0.1170
0.1240
0.1310
0.1370
0.1440
0.1500
0.1566
0.1630
0.01505
0.01505
0.01505
0.01505
0.01505
0.01505
0.01505
0.01505
O.O15O5
0.01505
0.O1505
5.2756 x 10 .6
5.8985 x 10 6
6.6299 x 10 -6
7.9782 x 10 6
9.3241 x 10 -6
1.0671 x 10 -5
1.2014 x 10 .5
1.3326 x 10 -5
1.4682 x 10 .5
1.6006 x 10 .5
1.7327 x 10 .5
1.8651 x 10 .5
3.0045
3.4305
3.8565
4.7245
5.8148
7.1921
8.9028
1.1007
1.3560
1.6616
2.0227
2.4456
x 10 .6
x 10 .6
x 10 .6
x 10 .6
x 10 .6
x 10 .6
x 10 -6
x 10 .5
x 10 .5
x 10 -5
x 10 .5
x 10 -5
5.2756 x 10 .6
5.8985 x 10 -6
6.6299 x 10 .6
7.9782 x 10 6
9.3241 x 10 -6
1.0671 x 10 -5
1.2014 x 10 .5
1.3326 x 10 -5
1.4682 x 10 -5
1.6006 x 10 -5
1.7327 x 10 -5
1.8651 x 10 -5
Air
500.0600.0
800.0
1000.0
1200.0
1400.0
1600.0
1800.0
2000.0
2200.0
2400.0
2600.0
4.6878 x 10 .7
4.6878 x 10 -7
4.6878 x 10 -7
4.6878 x 10 -7
4.6878 x 10 -7
4.6878 x 10 .7
4.6878 x 10 .7
4.6878 x 10 -7
4.6878 x 10 .7
4.6878 x 10 .7
4.6878 x 10 .7
4.6878 x 10 -7
0.2396
0.2403
0.2434
0.2486
0.2547
0.2611
0.2671
0.2725
0.2773
0.2813
0.2848
0.2878
3.3102 x 10 .73.8889 × 10 .7
4.9306 × 10 .7
6.0185 x 10 .7
6.9444 x 10 .7
8.1019 x 10 .7
9.0278 x 10 .7
9.9537 x 10 -7
1.0648 x 10 -6
1.1574 x 10 -6
1.2269 x 10 -6
1.3079 x 10 -6
3.3102
3.8889
4.9306
6.0185
6.9444
8.1019
9.0278
9.9537
1.0648
1.1574
1.2269
1.3079
x 10 .7
x 10 .7
x 10 .7
x 10 .7
x 10 .7
x 10 .7
x 10 .7
x 10 .7
x 10 -6
x 10 .6
xlO 6
x 10 .6
3.3102 x 10 .7
3.8889 x 10 -7
4.9306 x 10 -7
6.0185 x 10 .7
6.9444 x 10 -7
8.1019 x 10 -7
9.0278 x 10 -7
9.9537 x 10 -7
1.0648 x 10 -6
1.1574 x 10 6
1.2269 x 10 -6
1.3079 x l0 -6
Inconel 617foilsheet
520.0 0.3015 0.1000 1.8287 x 10 -4
1460.0 0.3015 0.1310 2.8704 x 10 -4
2470.0 0.3015 0.1630 4.0278 x 10 -4
Aluminum
460.0
560.0
660.0
760.0
860.0
960.0
1060.0
1660.0
0.1010
0.1010
0.1010
0.1010
0.1010
0.1010
0.1010
0.1010
0.1950
0.2060
0.2160
0.2240
0.2370
0.2420
0.250O
0.3070
1.50 x 10 -3
1.67 x 10 .3
1.85 x 10 .3
2.07 x 10 -3
2.29 x 10 .3
2.39 x 10 -3
2.42 x 10 .3
3.46 x 10 -3
1.50 x 10 .3
1.67 x 10 .3
1.85 x 10 .3
2.07 x 10 .3
2.29 x 10 .3
2.39 x 10 .3
2.42 x 10 .3
3.46 x 10 .3
1.50 x 10 -3
1.67 x 10 .3
1.85 x 10 .3
2.07 x 10 .3
2.29 x 10 .3
2.39 x 10 .3
2.42 x 10 .3
3.46 x 10 .3
17
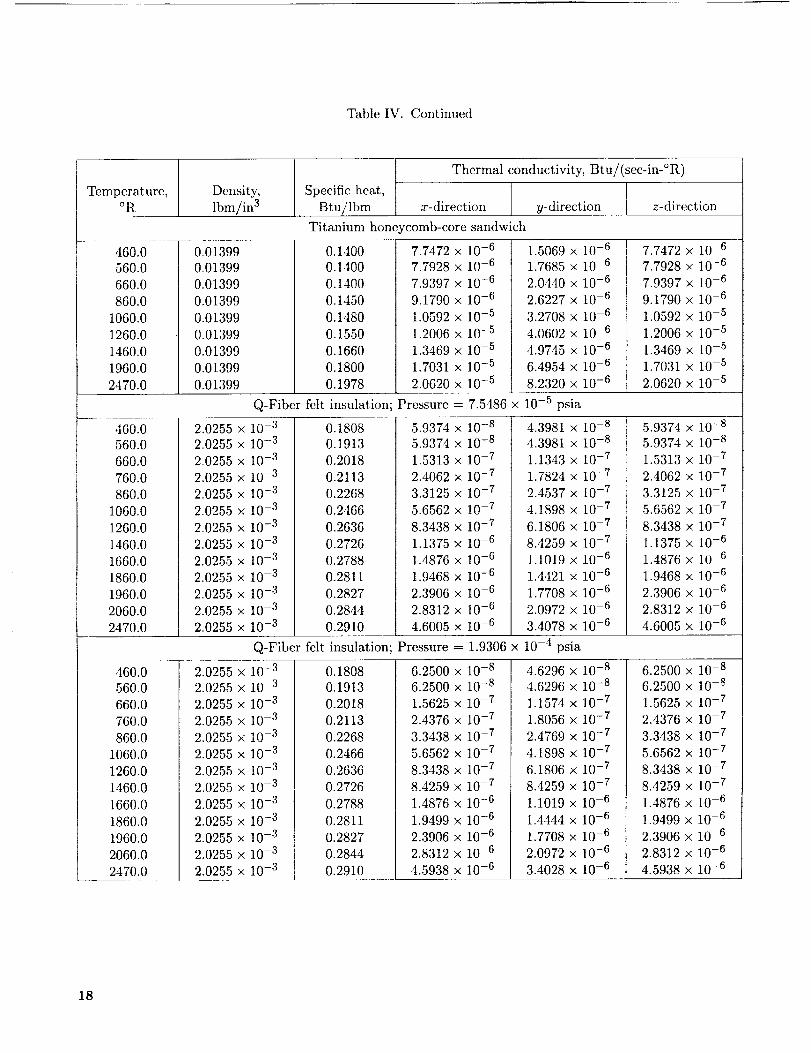
TableIV. Contimled
Temperature,oR
460.0560.0660.0860.0
1060.01260.01460.01960.02470.0
Density,lbm/in3
Thermalconductivity,Btu/(sec-in-°R)Specificheat,
Btu/lbm
0.013990.013990.013990.013990.013990.013990.013990.01399
Q-Fiber
x-direction y-direction z-direction
Titanium honeycomb-core sandwich
0.1400
0.1400
0.1400
0.1450
0.1480
0.1550
0.1660
0.1800
1.5069 × 10 -61.7685 × 10 -6
2.0440 × 10 -6
2.6227 × 10 -6
3.2708 × 10 -6
4.0602 × 10 -6
4.9745 × 10 -6
6.4954 × 10 -6
8.2320 × 10 -6
x 10-6
x 10-6
x 10-6
x 10-6
x 10-5
x 10-5
x 10-5
x 10-5
x 10 -5
7.7472 x 10 -6
7.7928 x 10 -6
7.9397 x 10 6
9.1790 x 10 -6
1.0592 x 10 -5
1.2006 x 10 -5
1.3469 x 10 -5
1.7031 x 10 -5
2.0620 x 10 -50.01399
7.74727.7928
7.9397
9.1790
1.0592
1.2006
1.3469
1.7031
0.1978 2.0620
felt insulation; Pressure = 7.5486 x 10 -5 psia
460.0
560.0
660.0
760.0
860.0
1060.0
1260.0
1460.0
1660.0
1860.0
1960.0
2060.0
2470.0
460.0
560.0
660.0
760.0
860.0
1060.0
1260.0
1460.0
1660.0
1860.0
1960.0
2060.0
2470.0
2.0255 x I0-3
2.0255 x 10⁻³
2.0255 x I0-3
2.0255 × I0-3
2.0255 x 10⁻³
2.0255 x 10⁻³
2.0255 x 10⁻³
2.0255 x 10⁻³
2.0255 x 10⁻³
2.0255 x 10⁻³
2.0255 x 10⁻³
2.0255 x 10⁻³
2.0255 x 10⁻³
0.1808
0.1913
0.2018
0.2113
0.2268
0.2466
0.2636
0.2726
0.2788
0.2811
0.2827
0.2844
0.2910
5.9374 x 10 -85.9374 x 10 -8
1.5313 x 10 7
2.4062 x 10 -7
3.3125 x 10 -7
5.6562 x 10 7
8.3438 x 10 -7
1.1375 x 10 -6
1.4876 x 10 -6
1.9468 × 10 -6
2.3906 x 10 -6
2.8312 x 10 -6
4.6005 x 10 -6
4.3981 x 10 -s4.3981 x 10 -8
1.1343 x 10 -7
1.7824 x 10 -7
2.4537 × 10 -7
4.1898 × 10 -7
6.1806 x 10 -7
8.4259 x 10 -7
1.1019 x 10 -6
1.4421 x 10 -6
1.7708 x 10 -6
2.0972 x 10 -6
3.4078 x 10 -6
5.9374 x 10 -8
5.9374 x 10 -8
1.5313 x 10 -7
2.4062 x 10 -7
3.3125 x 10 -7
5.6562 × 10 -7
8.3438 x 10 -7
1.1375 x 10 -6
1.4876 x 10 -6
1.9468 x 10 -6
2.3906 x 10 -6
2.8312 x 10 -6
4.6005 x 10 -6
Q-Fiber felt insulation; Pressure = 1.9306 x 10 -4 psia
2.0255 x 10⁻³
2.0255 x i0-3
2.0255 x I0-3
2.0255 x 10⁻³
2.0255 x lO-3
2.0255 x 10 -3
2.0255 x 10 -3
2.0255 x 10 -3
2.0255 x 10 -3
2.0255 x 10 -3
2.0255 x 10 -3
2.0255 x 10 -3
2.0255 x 10 -3
0.18080.1913
0.2018
0.2113
0.2268
0.2466
0.2636
0.2726
0.2788
0.2811
0.2827
0.2844
0.2910
6.2500 x 10 -86.2500 x 10 -8
1.5625 x 10 -7
2.4376 x 10 .7
3.3438 x 10 -7
5.6562 x 10 -7
8.3438 x 10 -7
8.4259 x 10 -7
1.4876 x 10 -6
1.9499 x 10 -6
2.3906 x 10 -6
2.8312 x l0 -6
4.5938 x 10 -6
4.6296 x 10 -8
4.6296 x 10 -8
1.1574 x 10 -7
1.8056 x 10 -7
2.4769 x 10 .7
4.1898 x 10 .7
6.1806 x 10 .7
8.4259 x 10 .7
1.1019 x 10 -6
1.4444 x 10 .6
1.7708 x 10 .6
2.0972 x 10 .6
3.4028 x 10 .6
6.2500 x 10 -8
6.2500 x 10 -s
1.5625 x 10 -7
2.4376 x 10 -7
3.3438 x 10 -7
5.6562 x 10 -7
8.3438 x 10 -7
8.4259 x 10 -7
1.4876 x 10 -6
1.9499 x 10 -6
2.3906 x 10 6
2.8312 x 10 -6
4.5938 x 10 -6
18
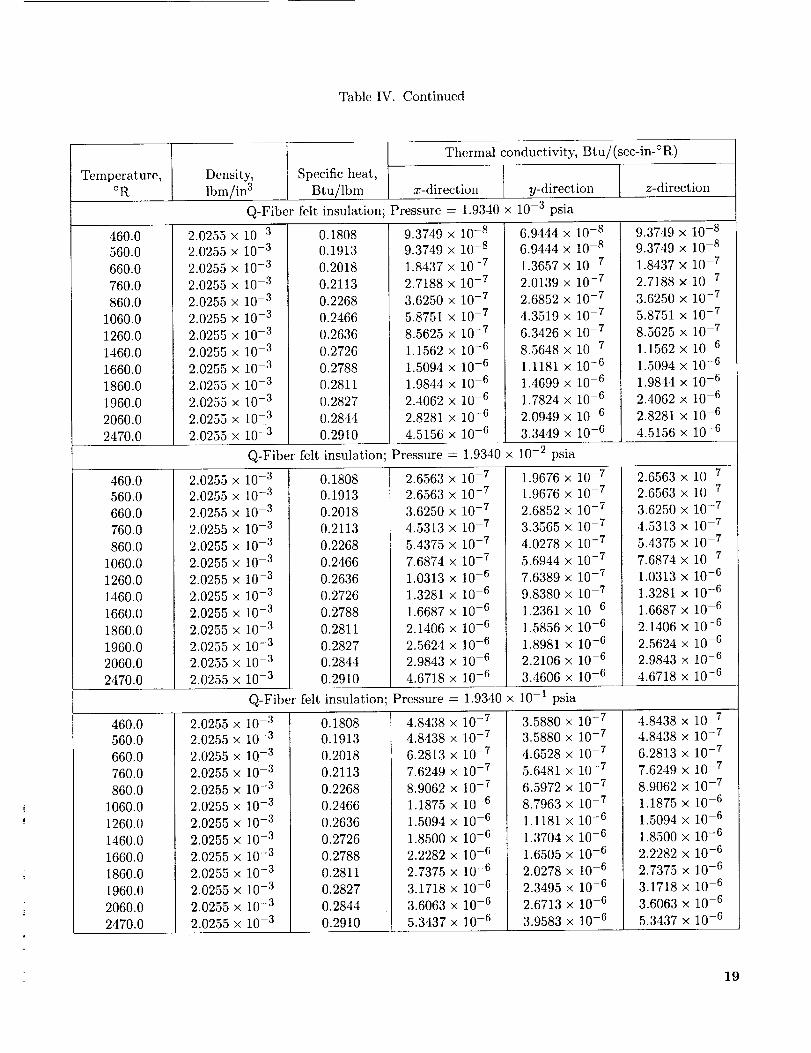
TableIV. Continued
Temperature,oR
Density,
lbm/in 3
Specific heat,
Btu/lbm
Thermal conductivity, Btu/(sec-in-°R)I
x-direction y-direction [ z-direction
Q-Fiber felt insulation; Pressure = 1.9340 x 10 .3 psia
460.0 2.0255 ×
560.0 2.0255 x
660.0 2.0255 x
760.0
860.0
1060.0
1260.0
1460.0
1660.0
1860.0
1960.0
2060.0
2470.0
10-3
10-3
10-3
2.0255 x 10 .3
2.0255 x 10 -3
2.0255 × 10 -3
2.0255 x 10 -3
2.0255 x 10 -3
2.0255 x 10 -3
2.0255 x 10 -3
2.0255 x 10 .3
2.0255 x 10 -3
2.0255 x 10 -3
Q-Fiber
0.1808
0.1913
0.2018
0.2113
0.2268
0.2466
0.2636
0.2726
0.2788
0.2811
0.2827
0.2844
0.2910
9.3749 x 10 -s
9.3749 × 10 -s
1.8437 x 10 -7
2.7188 x 10 -7
3.6250 x 10 -7
5.8751 x 10 -7
8.5625 x 10 -7
1.1562 x 10 -6
1.5094 x 10 -6
1.9844 x 10 -6
2.4062 x 10 -6
2.8281 x 10 -6
4.5156 x 10 -6
6.9444 x 10 -8
6.9444 x 10 -8
1.3657 x 10 -7
2.0139 x 10 -7
2.6852 x 10 -7
4.3519 x 10 -7
6.3426 x 10 -7
8.5648 x 10 -7
1.1181 × 10 .6
1.4699 x 10 -6
1.7824 x 10 -6
2.0949 x 10 -6
3.3449 x 10 -6
9.3749 x 10 -8
9.3749 x 10 -8
1.8437 × 10 -7
2.7188 × 10 -7
3.6250 x 10 -7
5.8751 x 10 -7
8.5625 x 10 -7
1.1562 x 10 -6
1.5094 x 10 -6
1.9844 x 10 -6
2.4062 × 10 -6
2.8281 x 10 -6
4.5156 × 10 -6
felt insulation; Pressure = 1.9340 x 10 -2 psia
460.0
560.0
660.0
760.0
860.0
1060.0
1260.0
1460.0
1660.0
1860.0
1960.0
2060.0
2470.0
460.0
560.0
660.0
760.0
860.0
1060.0
1260.0
1460.0
1660.0
1860.0
1960.0
2060.0
2470.0
2.0255 x 10 -3
2.0255 x 10 -3
2.0255 x 10 -3
2.0255 x 10 -3
2.0255 × 10 -3
2.0255 × 10 -3
2.0255 x 10 -3
2.0255 × 10 -3
2.0255 × 10 -3
2.0255 × 10 -3
2.0255 x 10 -3
2.0255 × 10 -3
2.0255 x 10 -3
0.1808
0.1913
0.2018
0.2113
0.2268
0.2466
0.2636
0.2726
0.2788
0.2811
0.2827
0.2844
0.2910
2.6563
2.6563
3.6250
4.5313
5.4375
7.6874
1.0313
1.3281
1.6687
2.1406
2.5624
2.9843
4.6718
Q-Fiber felt insulation Pressure
2.0255 x
2.0255 ×
2.0255 x
2.0255 x
2.0255 ×
2.0255 x
2.0255 ×
2.0255 ×
2.0255 ×
2.0255 x
2.0255 ×
2.0255 x
2.0255 ×
10-3
10-3
10-3
10-3
10-3
10-3
10-3
10-3
10-3
10-3
i0-3
10-3
10-3
0.1808
0.1913
0.2018
0.2113
0.2268
0.2466
0.2636
0.2726
0.2788
0.2811
0.2827
0.2844
0.2910
4.8438
4.8438
6.2813
7.6249
8.9062
1.1875
1.5094
1.8500
2.2282
2.7375
3.1718
3.6063
5.3437
x 10-7 1.9676 x
× 10-7 1.9676 x
x 10-7 2.6852 x
x 10-7 3.3565 x
x 10 -7 4.0278 x
x 10 -7 5.6944 x
x 10 -6 7.6389 x
x 10-6 9.8380 x
× 10 -6 1.2361 x
x 10 -6 1.5856 x
× lO -6 1.8981 x
x 10 -6 2.2106 x
10-7
10-7
10-7
10-7
10-7
10-7
10-7
10-7
10-6
10-6
10-6
10-6
2.6563 x 10 -72.6563 X 10 -7
3.6250 X 10 -7
4.5313 x 10 -7
5.4375 × 10 -7
7.6874 x 10 -7
1.0313 × 10 -6
1.3281 x 10 -6
1.6687 X 10 -6
2.1406 × 10 -6
2.5624 × 10 -6
2.9843 × 10 -6
x 10 -6 3.4606 x 10 -6 4.6718
= 1.9340 x 10 -1 psia
x I0-7
x 10.7
x 10.7
x 10-7
x 10-7
x 10-6
x 10-6
x 10-6
x 10 -6
x 10 -6
x 10 -6
x 10 -6
xlO 6
3.5880 x 10 -73.5880 x 10 .7
4.6528 x 10 -7
5.6481 × 10 -7
6.5972 x 10 -7
8.7963 × 10 -7
1.1181 × 10 -6
1.3704 × 10 -6
1.6505 × 10 -6
2.0278 × 10 -6
2.3495 x 10 -6
2.6713 × 10 -6
3.9583 × 10 -6
4.84384.8438
6.2813
7.6249
8.9062
1.1875
1.5094
1.8500
2.2282
2.7375
3.1718
3.6063
5.3437
x 10 -6
xlO 7
x i0-7
x 10-7
x 10-7
x 10-7
x 10-6
x 10-6
x 10-6
x 10-6
x 10 -6
x 10 -6
x 10 .6
x 10 -6
19
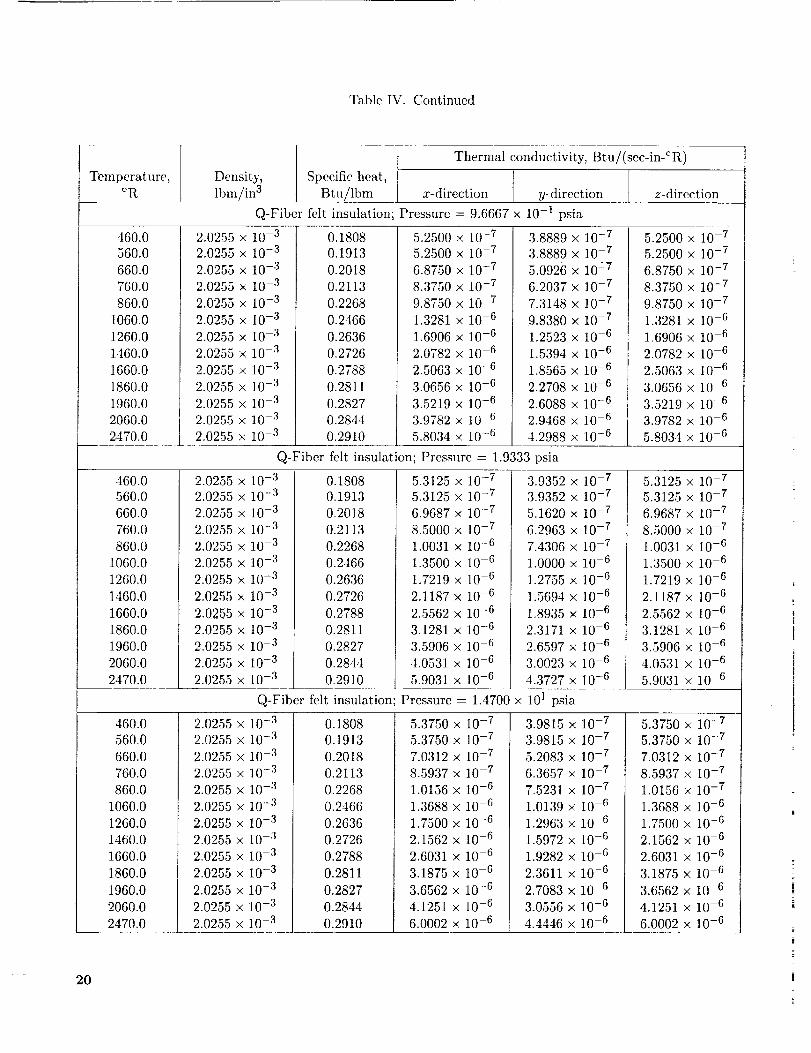
TableIV. Continued
Temperature,oR
Density,lbm/in3
Q-Fiber
Thermalconductivity,Btu/(sec-in-°R)
Specificheat, ]Btu/lbm x-direction y-direction z-direction
felt insulation; Pressure = 9.6667 x 10 -1 psia
460.0
560.0
660.0
760.0
860.0
1060.0
1260.0
1460.0
I660.0
1860.0
1960.0
2060.0
2.0255 x I0 -3
2.0255 x 10 -3
2.0255 x 10 -3
2.0255 x lO -3
2.0255 x 10 -3
2.0255 x 10 -3
2.0255 x 10 3
2.0255 x 10 -3
2.0255 x 10 -3
2.0255 x 10 -3
2.0255 x 10 -3
2.0255 × 10 -3
x 10 -32470.0 2.0255
0.1808
0.1913
0.2018
0.2113
0.2268
0.2466
0.2636
0.2726
0.2788
0.2811
0.2827
0.2844
0.2910
5.2500 x 10 -75.2500 x 10 .7
6.8750 x 10 .7
8.3750 × 10 .7
9.8750 x 10 -7
1.3281 x 10 6
1.6906 x 10 .6
2.0782 x 10 -6
2.5063 x 10 -6
3.0656 x 10 -6
3.5219 x 10 -6
3.9782 x 10 -6
5.8034 × 10 -6
3.8889 x 10 -7
3.8889 x 10 -7
5.0926 x 10 -7
6.2037 × 10 -7
7.3148 x 10 -7
9.8380 x 10 -7
1.2523 x 10 .6
1.5394 × 10 .6
1.8565 x 10 .6
2.2708 x 10 .6
2.6088 x 10 -6
2.9468 x 10 -6
4.2988 × 10 -6
5.2500 x 10 -7
5.2500 x 10 -7
6.8750 x 10 -7
8.3750 × 10 .7
9.8750 x 10 .7
1.3281 x 10 .6
1.6906 × 10 .6
2.0782 x 10 .6
2.5063 x 10 .6
3.0656 × 10 -6
3.5219 × 10 .6
3.9782 × 10 6
5.8034 × 10 .6
Q-Fiber felt insulation; Pressure = 1.9333 psia
460.0
560.0
660.0
760.0
860.0
1060.0
1260.0
1460.0
1660.0
1860.0
1960.0
2060.0
2470.0
2.0255
2.0255
2.0255
2.0255
2.0255
2.0255
2.0255
2.O255
2.0255
2.0255
2.0255
2.0255
2.0255
× 10 -3
× 10 -3
× 10 -3
x 10 -3
x 10 -3
× 10 .3
x 10 -3
x 10 -3
× 10 -3
× 10 -3
x 10 -3
× 10 -3
x 10 -3
0.1808
0.1913
0.2018
0.2113
0.2268
0.2466
0.2636
0.2726
0.2788
0.2811
0.2827
0.2844
0.2910
5.3125 × 10 -75.3125 x 10 -7
6.9687 × 10 -7
8.5000 x 10 .7
1.0031 x 10 .6
1.3500 × 10 6
1.7219 x 10 6
2.1187 x 10 6
2.5562 x 10 -6
3.1281 x 10 .6
3.5906 x 10 .6
4.0531 × 10 .6
5.9031 x 10 -6
3.9352 × 10 -7
3.9352 × 10 -7
5.1620 × 10 -7
6.2963 × 10 -7
7.4306 × 10 -7
1.0000 × 10 -6
1.2755 × 10 -6
1.5694 x 10 .6
1.8935 x 10 .6
2.3171 × 10 .6
2.6597 x 10 -6
3.0023 × 10 -6
4.3727 x 10 -6
5.3125 × 10 -7
5.3125 x 10 -7
6.9687 × 10 -7
8.5000 × 10 -7
1.0031 x 10 -6
1.3500 x 10 -6
1.7219 × 10 -6
2.1187 × l0 -6
2.5562 x 10 -6
3.1281 x 10 -6
3.5906 × 10 -6
4.0531 × 10 -6
5.9031 × 10 -6
Q-Fiber felt insulation Pressure = 1.4700 x 101 psia
460.0
560.0
660.0
760.0
860.0
1060.0
1260.0
1460.0
1660.0
1860.0
1960.0
2060.0
2470.0
2.0255
2.0255
2.0255
2.0255
2.0255
2.0255
2.0255
2.0255
2.0255
2.0255
2.0255
2.0255
2.0255
x 10 -3
× 10 .3
x 10 -3
× 10 .3
x 10 -3
x 10 -3
× 10 -3
x 10 -3
× 10 -3
x 10 -3
x 10 -3
x 10 .3
x 10 -3
0.1808
0.1913
0.2018
0.2113
0.2268
0.2466
0.2636
0.2726
0.2788
0.2811
0.2827
0.2844
0.2910
5.3750 x 10 -7
5.3750 x 10 -7
7.0312 x 10 -7
8.5937 x 10 -7
1.0156 x l0 -6
1.3688 x 10 -6
1.7500 × 10 -6
2.1562 x 10 -6
2.6031 x 10 -6
3.1875 x 10 -6
3.6562 x 10 .6
4.1251 × 10 6
6.0002 x 10 -6
3.9815 x 10 .7
3.9815 × 10 -7
5.2083 x 10 -7
6.3657 × 10 -7
7.5231 × 10 -7
1.0139 x 10 6
1.2963 x 10 -6
1.5972 x 10 -6
1.9282 x 10 -6
2.3611 × 10 -6
2.7083 x 10 -6
3.0556 x 10 -6
4.4446 x 10 -6
5.3750 × 10 .7
5.3750 × 10 .7
7.0312 × 10 -7
8.5937 x 10 .7
1.0156 x 10 -7
1.3688 × 10 -6
1.7500 x 10 -6
2.1562 × 10 -6
2.6031 × 10 -6
3.1875 x 10 -6
3.6562 × 10 -6
4.1251 × 10 -6
6.0002 x 10 -6
20
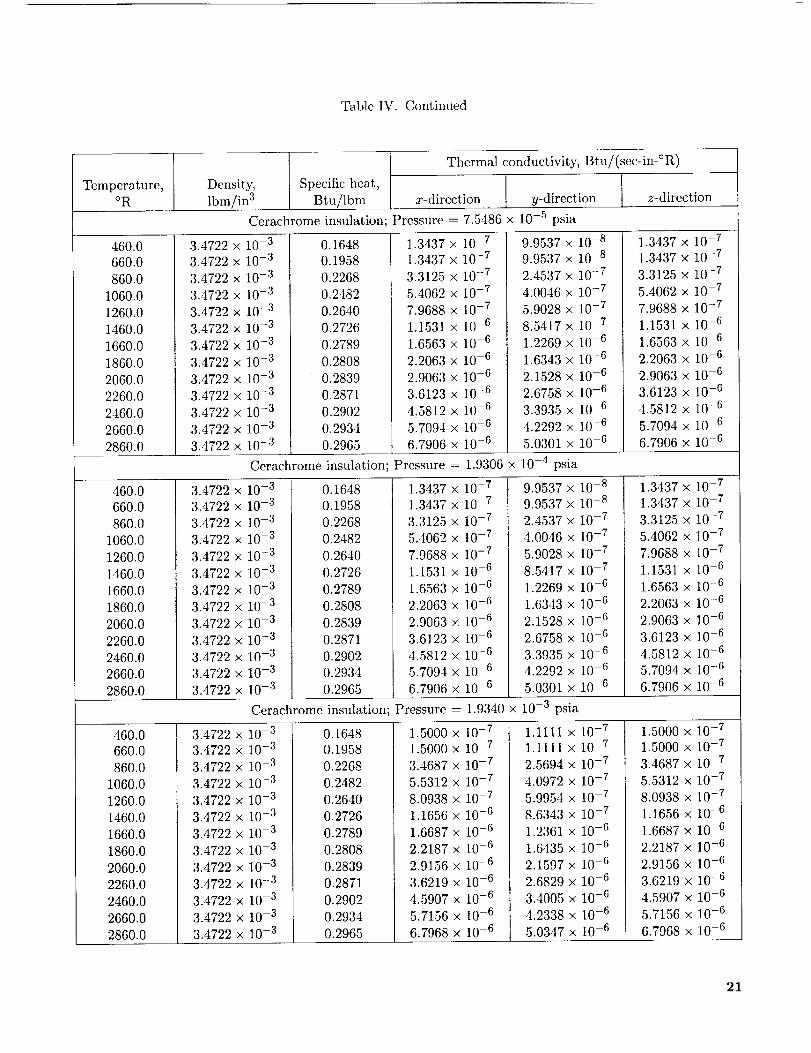
TableIV. Continued
Temperature,oR
Density,lbm/in3
Specificheat,Btu/lbm
Thermalconductivity,Btu/(sec-in-°R)
x-direction y-direction z-direction
Cerachrome insulation; Pressure = 7.5486 x 10 .5 psia
460.0660.0
860.0
1060.0
1260.0
1460.0
1660.0
1860.0
2060.0
2260.0
2460.O
2660.0
2860.0
3.4722 x 10 -3
3.4722 x 10 -3
3.4722 x 10 -3
3.4722 x 10 -3
3.4722 x 10 -3
3.4722 x 10 -3
3.4722 x 10 -3
3.4722 x 10 -3
3.4722 x 10 -3
3.4722 x 10 -3
3.4722 x 10 -3
3.4722 x 10 -3
3.4722 x 10 -3
0.1648
0.1958
0.2268
0.2482
0.2640
0.2726
0.2789
0.2808
0.2839
0.2871
0.2902
0.2934
0.2965
1.3437 × 10 -7
1.3437 × 10 -7
3.3125 × 10 -7
5.4062 × 10 -7
7.9688 × 10 -7
1.153I x 10 -6
1.6563 x 10 -6
2.2063 × 10 -6
2.9063 × l0 -6
3.6123 × 10 -6
4.5812 × 10 -6
5.7094 × 10 -6
6.7906 x 10 -6
9.9537 x 10 -s
9.9537 × 10 -s
2.4537 × 10 -7
4.0046 × 10 -7
5.9028 × 10 -7
8.5417 × 10 -7
1.2269 × 10 -6
1.6343 x 10 -6
2.1528 x 10 -6
2.6758 × 10 -6
3.3935 × 10 -6
4.2292 × 10 -6
5.0301 x 10 -6
Ccrachrome insulation; Pressure = 1.9306 x 10 -4 psia
1.3437 × 10 -71.3437 × 10 -7
3.3125 x 10 -7
5.4062 × 10 -7
7.9688 x 10 -7
1.1531 × 10 -6
1.6563 x 10 -6
2.2063 × 10 -6
2.9063 × 10 -6
3.6123 × 10 -6
4.5812 × 10 -6
5.7094 × 10 -6
6.7906 x 10 -6
460.0
660.0
860.0
1060.0
1260.0
1460.0
1660.0
1860.0
2060.0
2260.0
2460.0
2660.0
2860.0
3.4722
3.4722
3.4722
3.4722
3.4722
3.4722
3.4722
3.4722
3.4722
3.4722
3.4722
3.4722
3.4722
x 10 -3
× 10 -3
× 10 -3
× 10 -3
× 10 -3
× 10 -3
x i0 -3
× 10 -3
x 10 -3
x 10 -3
× 10 -3
x 10 -3
x 10 -3
0.1648
0.1958
0.2268
0.2482
0.2640
0.2726
0.2789
0.2808
0.2839
0.2871
0.2902
0.2934
0.2965
1.3437 x 10 -7
1.3437 × 10 7
3.3125 x 10 -7
5.4062 × 10 -7
7.9688 x 10 -7
1.1531 × 10 -6
1.6563 x 10 -6
2.2063 × 10 -6
2.9063 × 10 -6
3.6123 x 10 -6
4.5812 x 10 -6
5.7094 x 10 -6
6.7906 x 10 -6
9.9537 × I0 -s9.9537 x 10 -8
2.4537 x 10 -7
4.0046 × 10 -7
5.9028 x 10 -7
8.5417 × 10 -7
1.2269 x 10 -6
1.6343 x 10 -6
2.1528 x 10 -6
2.6758 × 10 .6
3.3935 x 10 .6
4.2292 x 10 -6
5.0301 x 10 -6
1.3437 × 10 -7
1.3437 × 10 -7
3.3125 × 10 -7
5.4062 × 10 -7
7.9688 × 10 -7
1.1531 × 10 -6
1.6563 x 10 -6
2.2063 × 10 -6
2.9063 × 10 -6
3.6123 × 10 -6
4.5812 × 10 -6
5.7094 x 10 -6
6.7906 × 10 -6
460.0
660.0
860.0
1060.0
1260.0
1460.0
1660.0
1860.0
2060.0
2260.0
2460.0
2660.0
2860.0
3.4722
3.4722
3.4722
3.4722
3.4722
3.4722
3.4722
3.4722
3.4722
3.4722
3.4722
3.4722
3.4722
Cerachrome insulation; Pressure = 1.9340 x 10 -3 psia
10-310-3
10-3
10-3
10-3
10-3
10-3
10-3
10-3
10-3
10-3
10-3
10-3
0.16480.1958
0.2268
0.2482
0.2640
0.2726
0.2789
0.2808
0.2839
0.2871
0.2902
0.2934
0.2965
1.5000 × 10 -7
1.5000 × 10 -7
3.4687 × 10 -7
5.5312 × 10 -7
8.0938 × 10 -7
1.1656 × 10 -6
1.6687 × 10 -6
2.2187 × 10 -6
2.9156 × 10 -6
3.6219 x 10 -6
4.5907 × 10 -6
5.7156 × 10 -6
6.7968 × 10 -6
1.1Ill × 10 .7
1.1111 × 10 -7
2.5694 × 10 -7
4.0972 x 10 .7
5.9954 × 10 .7
8.6343 × 10 .7
1.2361 × 10 .6
1.6435 x 10 .6
2.1597 × 10 .6
2.6829 × 10 .6
3.4005 × 10 .6
4.2338 × 10 -6
5.0347 × 10 -6
1.5000 × 10 -71.5000 × 10 -7
3.4687 x 10 -7
5.5312 x 10 -7
8.0938 × 10 .7
1.1656 × 10 -6
1.6687 × 10 -6
2.2187 x 10 -6
2.9156 × 10 .6
3.6219 × 10 -6
4.5907 × 10 -6
5.7156 x 10 -6
6.7968 × 10 6
21
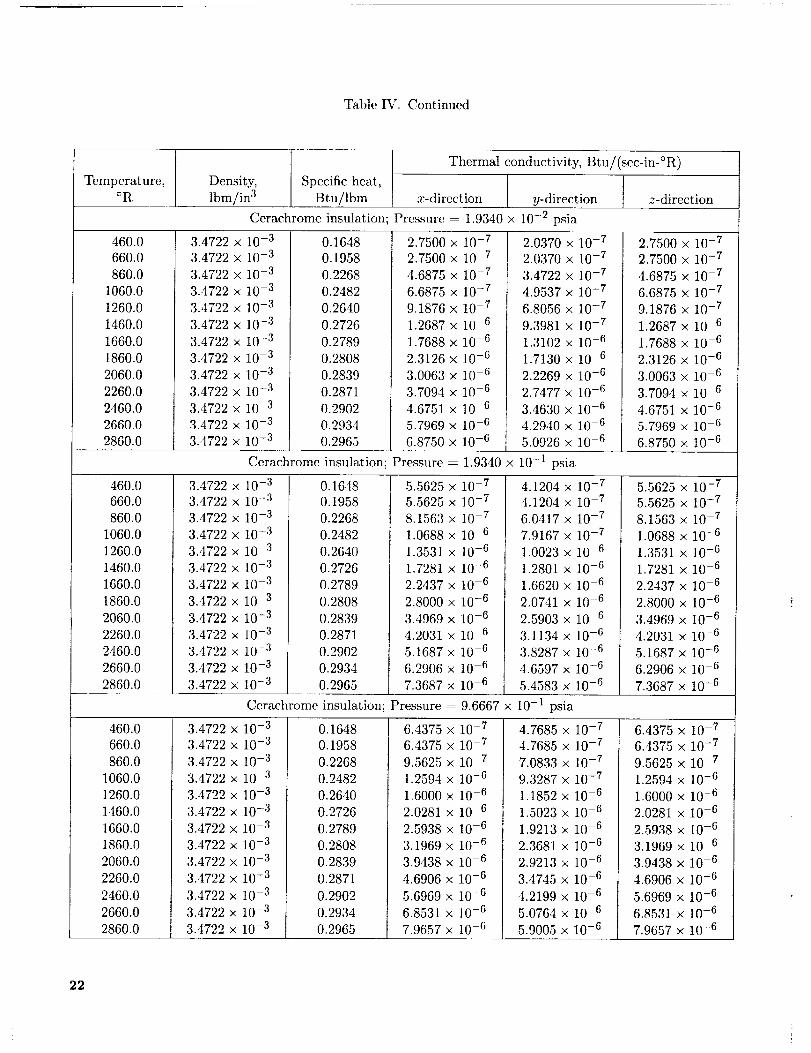
TableFVLContinued
Temperature,oR
Density,lbm/in3
Specificheat,Btu/lbm
Thermalconductivity,Btu/(sec-in-°R)
x-direction y-direction z-direction
Cerachrome
460.0
660.0
860.0
1060.0
1260.0
1460.0
1660.0
1860.0
2060.0
2260.0
2460.0
2660.0
2860.0
3.47223.4722
3.4722
3.4722
3.4722
3.4722
3.4722
3.4722
3.4722
3.4722
3.4722
3.4722
3.4722
x 10.3
x 10.3
x 10.3
x 10-3
x 10.3
x 10-3
x 10-3
x 10.3
x 10-3
x 10.3
x 10.3
x 10-3
x 10-3
Cerachrome
insulation; Pressure = 1.9340 x 10 -2 psia
0.1648
0.1958
0.2268
0.2482
0.2640
0.2726
0.2789
0.2808
0.2839
0.2871
0.2902
0.2934
0.2965
2.7500 x 10 .7
2.7500 x 10 .7
4.6875 x 10 -7
6.6875 x 10 -7
9.1876 x 10 .7
1.2687 x 10 -6
1.7688 x 10 6
2.3126 × 10 .6
3.0063 x 10 .6
3.7094 x 10 -6
4.6751 x 10 6
5.7969 x 10 -6
6.8750 x 10 -6
2.0370 x 10 .7
2.0370 x 10 .7
3.4722 x 10 .7
4.9537 x 10 -7
6.8056 x 10 -7
9.3981 x 10 -7
1.3102 x 10 -6
1.7130 x 10 6
2.2269 x 10 -6
2.7477 x 10 -6
3.4630 x 10 -6
4.2940 x 10 -6
5.0926 × 10 -6
2.7500 x 10 .7
2.7500 x 10 .7
4.6875 x 10 -7
6.6875 x 10 .7
9.1876 x 10 .7
1.2687 x 10 .6
1.7688 x 10 .6
2.3126 x 10 .6
3.0063 x 10 .6
3.7094 x 10 6
4.6751 x 10 -6
5.7969 x 10 -6
6.8750 x 10 -6
insulation; Pressure = 1.9340 x 10 -1 psia
460.0660.0
860.0
1060.0
1260.0
1460.0
1660.0
1860.0
2060.0
2260.0
2460.0
2660.0
2860.0
3.47223.4722
3.4722
3.4722
3.4722
3.4722
3.4722
3.4722
3.4722
3.4722
3.4722
3.4722
3.4722
x 10.3
x 10-3
x 10-3
x 10-3
x 10.3
x 10.3
x 10.3
xlO 3
x 10.3
x 10.3
x 10-3
x 10 .3
x 10 -3
0.1648
0.1958
0.2268
0.2482
0.2640
0.2726
0.2789
0.2808
0.2839
0.2871
0.2902
0.2934
0.2965
5.5625 x 10 .75.5625 x 10 .7
8.1563 x 10 .7
1.0688 x 10 6
1.3531 x 10 -6
1.7281 x 10 -6
2.2437 x 10 -6
2.8000 x 10 .6
3.4969 x 10 .6
4.2031 x 10 6
5.1687 x 10 .6
6.2906 x 10 .6
7.3687 x 10 .6
4.1204 x 10 .7
4.1204 x 10 .7
6.0417 x 10 .7
7.9167 x 10 .7
1.0023 x 10 .6
1.2801 x 10 .6
1.6620 x 10 .6
2.0741 x 10 .6
2.5903 x 10 .6
3.1134 x 10 .6
3.8287 x 10 .6
4.6597 x 10 .6
5.4583 x 10 .6
5.5625 x 10 -7
5.5625 x 10 -7
8.1563 x 10 .7
1.0688 x 10 -6
1.3531 x 10 -6
1.7281 x 10 -6
2.2437 x 10 -6
2.8000 x 10 .6
3.4969 x 10 -6
4.2031 x 10 -6
5.1687 x 10 -6
6.2906 x 10 -6
7.3687 x 10 -6
Cerachrome insulation Pressure = 9.6667 x I0 -1 psia
460.0
660.0
860.0
1060.0
1260.0
1460.0
1660.0
1860.0
2060.0
2260.0
2460.0
2660.0
2860.0
3.4722
3.4722
3.4722
3.4722
3.4722
3.4722
3.4722
3.4722
3.4722
3.4722
3.4722
3.4722
3.4722
x 10.3
x 10.3
x 10.3
x 10.3
x 10.3
x 10-3
x 10.3
x 10.3
x lO-3
x 10.3
x 10-3
x 10-3
x lO-3
0.1648
0.1958
0.2268
0.2482
0.2640
0.2726
0.2789
0.2808
0.2839
0.2871
0.2902
0.2934
0.2965
6.4375 x 10 .7
6.4375 x 10 .7
9.5625 x 10 .7
1.2594 x 10 .6
1.6000 x 10 -6
2.0281 x 10 6
2.5938 x 10 -6
3.1969 x 10 -6
3.9438 x 10 -6
4.6906 x 10 -6
5.6969 x 10 -6
6.8531 x 10 -6
7.9657 × 10 .6
4.7685 x 10 .7
4.7685 x 10 .7
7.0833 x 10 .7
9.3287 x 10 -7
1.1852 x 10 -6
1.5023 x 10 .6
1.9213 x 10 -6
2.3681 x 10 -6
2.9213 x 10 -6
3.4745 x 10 -6
4.2199 x 10 -6
5.0764 x 10 -6
5.9005 x 10 -6
6.4375 x 10 .7
6.4375 x 10 .7
9.5625 x 10 .7
1.2594 x 10 .6
1.6000 x 10 -6
2.0281 x 10 -6
2.5938 x 10 -6
3.1969 x 10 6
3.9438 x 10 -6
4.6906 x 10 -6
5.6969 x 10 .6
6.8531 x 10 -6
7.9657 x 10 -6
22
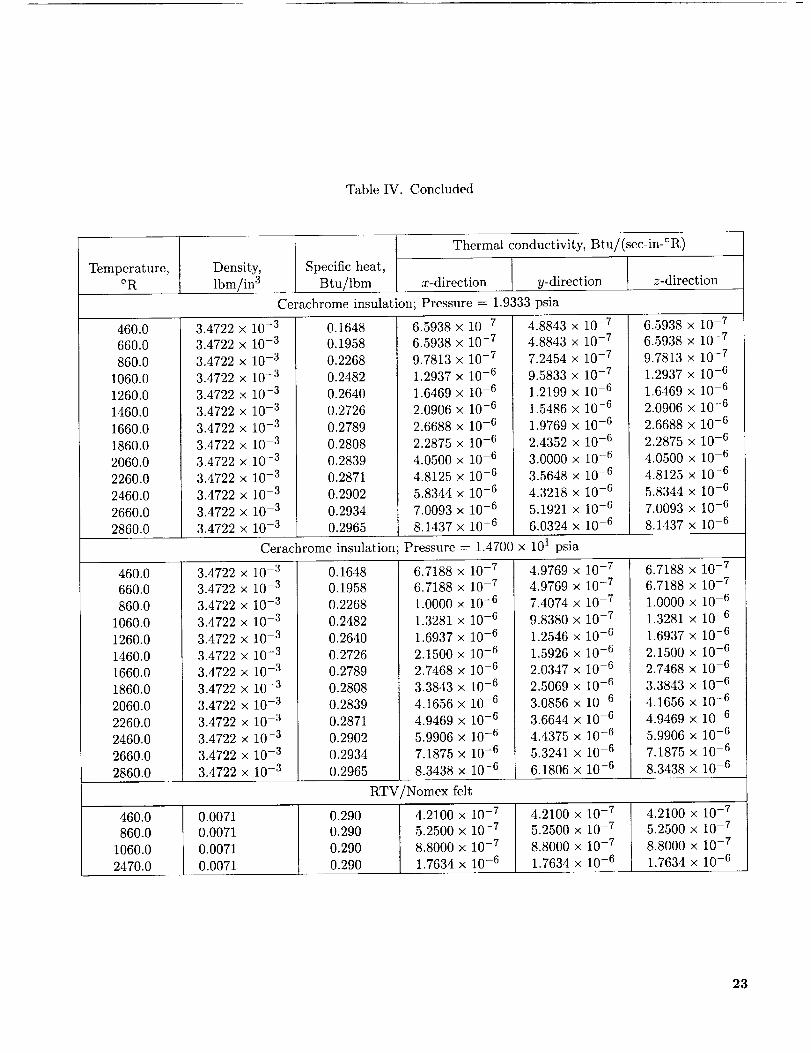
TableIV. Concluded
Temperature,°R
Density,lbm/in3
Specificheat,Btu/lbm
Thermalconductivity,Btu/(sec-in-°R),
x-direction y-direction I z-direction
Cerachrome insulation; Pressure -- 1.9333 psia
460.0 3.4722
660.0 3.4722
860.0
1060.0
1260.0
1460.0
1660.0
1860.0
2060.0
2260.0
2460.0
266O.0
2860.0
3.4722
3.4722
3.4722
3.4722
3.4722
3.4722
3.4722
3.4722
3.4722
3.4722
3.4722
x 10 -3
x 10 -3
x 10 -3
x 10 -3
x 10 -3
× 10 -3
x 10 -3
x 10 -3
x 10 -3
x 10 -3
× 10 -3
x 10 -3
x 10 -a
Cerachrome
0.1648
0.1958
0.2268
0.2482
0.2640
0.2726
0.2789
0.28O8
0.2839
0.2871
0.2902
0.2934
O.2965
insulation;
6.5938 x 10⁻⁷
6.5938 x 10⁻⁷
9.7813 x 10⁻⁷
1.2937 x 10⁻⁶
1.6469 x 10⁻⁶
2.0906 x lO-6
2.6688 x 10⁻⁶
2.2875 × 10⁻⁶
4.0500 x 10 -6
4.8125 x 10 -6
5.8344 x 10 -6
7.0093 x 10 -6
8.1437 x 10 -6
4.8843 ×
4.8843 x
7.2454 ×
9.5833 ×
1.2199 x
1.5486 x
1.9769 x
2.4352 ×
3.0000 ×
3.5648 ×
4.3218 ×
5.1921 ×
6.0324 x
10-7
10-7
10-7
10-7
10-6
10-6
10-6
10-6
10-6
10-6
10-6
10-6
10-6
6.5938 × 10⁻⁷
6.5938 × 10⁻⁷
9.7813 × 10⁻⁷
1.2937 x 10⁻⁶
1.6469 × lO-6
2.0906 x 10⁻⁶
2.6688 × 10⁻⁶
2.2875 x 10⁻⁶
4.0500 x 10⁻⁶
4.8125 x 10⁻⁶
5.8344 × 10⁻⁶
7.0093 x lO-6
8.1437 x 10⁻⁶
Pressure = 1.4700 x 101 psia
460.0
660.0
860.0
1060.0
1260.0
1460.0
1660.0
1860.0
2060.0
2260.0
2460.0
3.4722
3.4722
3.4722
3.4722
3.4722
3.4722
3.4722
3.4722
3.4722
3.4722
3.4722
× 10-3
x 10-3
× 10-3
x 10-3
x 10-3
× 10-3
× 10-3
× 10-3
x lO-3
x lO-3
x 10-3
0.1648
0.1958
0.2268
0.2482
0.2640
0.2726
0.2789
0.2808
0.2839
0.2871
0.2902
6.7188 x 10 -7
6.7188 x 10 -7
1.0000 × 10 -6
1.3281 × 10 -6
1.6937 x 10 -6
2.1500 × 10 -6
2.7468 x 10 -6
3.3843 x 10 -6
4.1656 x 10 -6
4.9469 × 10 -6
5.9906 x 10 -6
4.9769 x
4.9769 x
7.4074 ×
9.8380 x
1.2546 x
1.5926 x
2.0347 x
2.5069 x
3.0856 x
3.6644 x
4.4375 x
10-7
10-7
10-7
10-7
10-6
10-6
10-6
10-6
10-6
10-6
10-6
6.7188 × 10⁻⁷
6.7188 × 10⁻⁷
1.0000 × 10⁻⁶
1.3281 × 10⁻⁶
1.6937 × 10⁻⁶
2.1500 × 10⁻⁶
2.7468 × 10⁻⁶
3.3843 x 10 -6
4.1656 x 10 -6
4.9469 x 10 -6
5.9906 x 10 -6
2660.0
2860.0
460.0
860.0
1060.0
2470.0
3.4722
3.4722
0.0071
0.0071
0.0071
0.0071
× 10-3
x 10-3
0.2934
0.2965
0.290
0.290
0.290
0.290
7.1875 × 10 -6
8.3438 x 10 -6
RTV/Nomex felt
4.2100 x 10 -7
5.2500 x 10 -7
8.8000 x 10 -7
1.7634 x 10 -6
5.3241 x
6.1806 x
4.2100 x
5.2500 ×
8.8000 x
1.7634 x
10-6
10-6
10-7
10-7
10-7
10-6
7.1875 x 10⁻⁶
8.3438 × 10⁻⁶
4.2100 × 10 -7
5.2500 × 10 -7
8.8000 x 10 -7
1.7634 x 10 -6
23
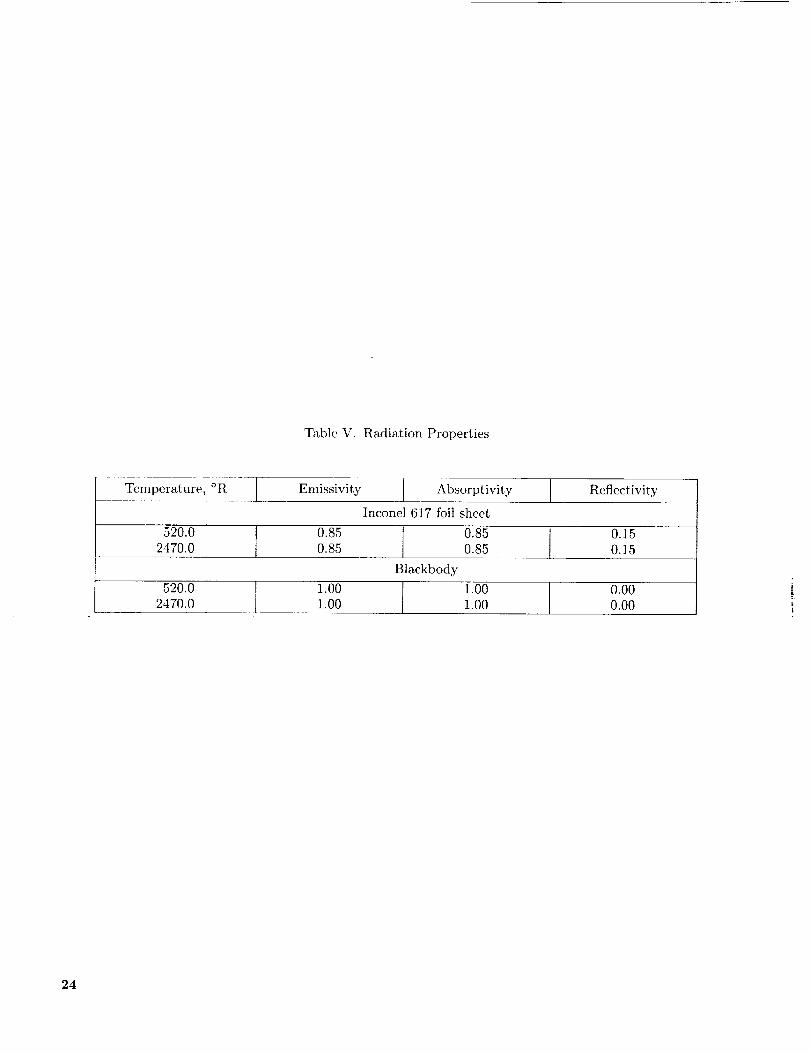
TableV. RadiationProperties
Temperature,°R
520.02470.0
Emissivity I AbsorptivityInconel617foil shcet
0.85 [ 0.850.85 0.85Blackbody
520.0 [ 1.00 t 1.002470.0 1.00 1.00
Reflectivity
0.15
0.15
0.00
0.00
24
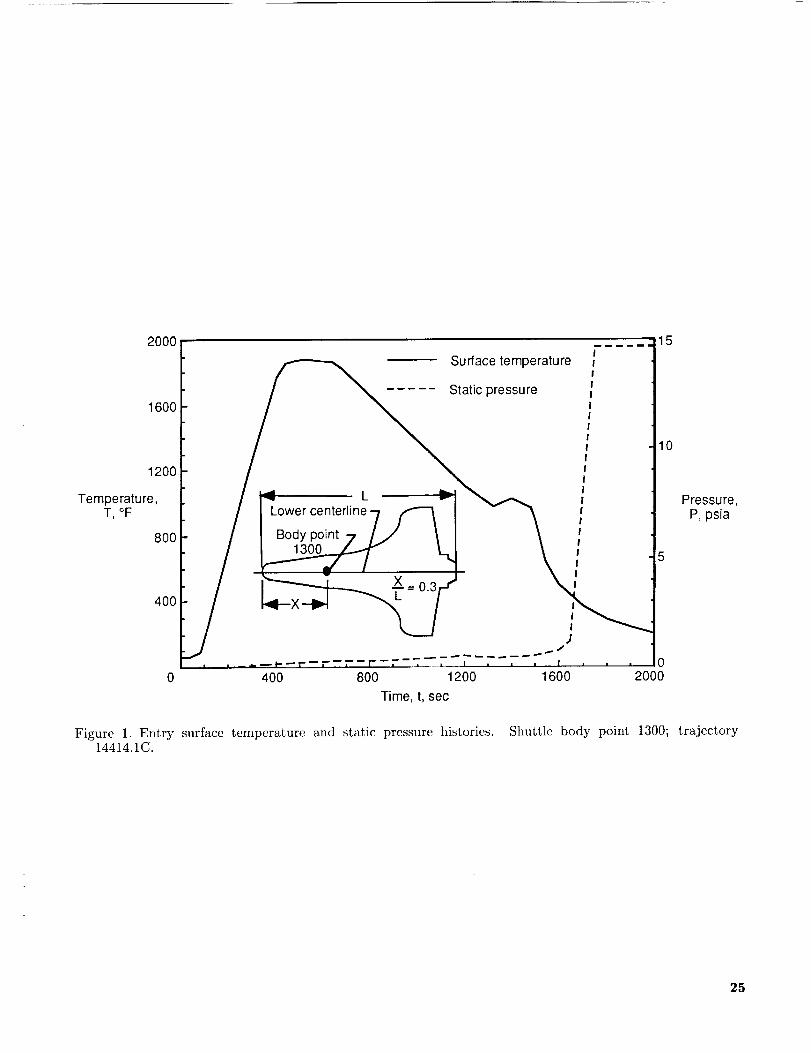
2000
1600
1200
Temperature,T,°F
800
400
Surface temperature
Static pressure
Lowercenterline7 f'_ IBody point 7 [J _ I
400 800 12000
0 1600 2O0O
Time, t, sec
15
10
Figure 1. Entry surface tcmpcrature and static pressure histories. Shuttle body point 1300;14414.1C.
Pressure,P, psia
trajectory
25
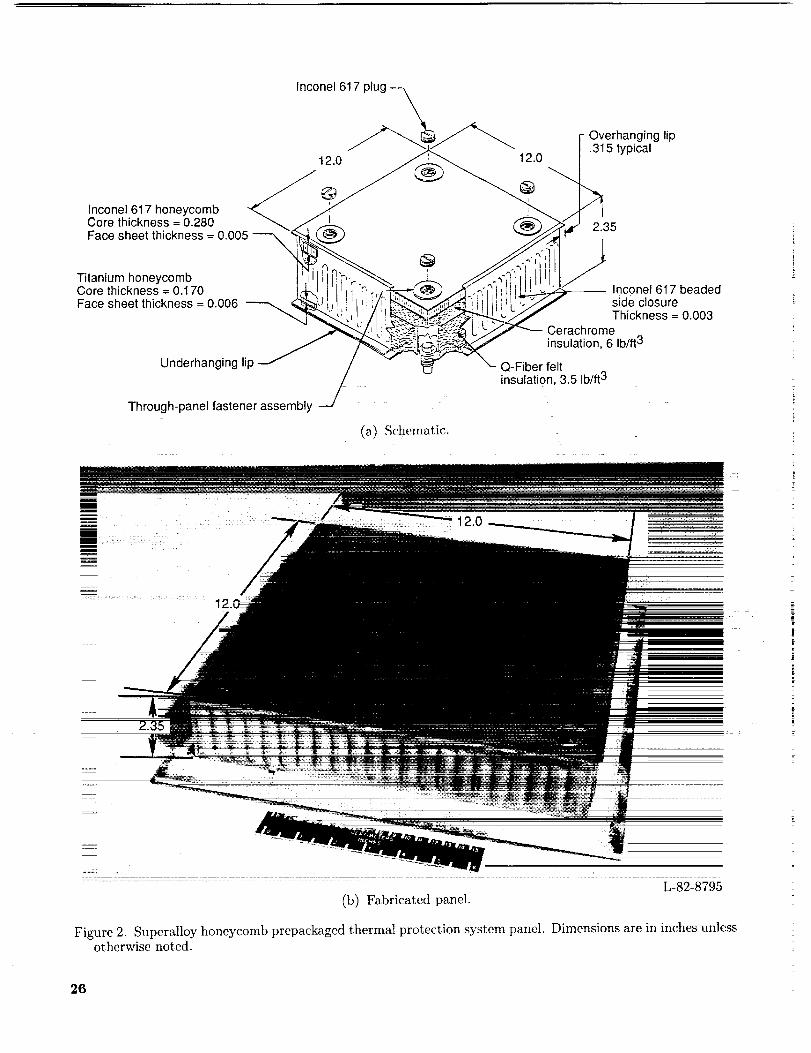
Inconel 617 plug --_
\F Overhanging lip
120 _ 120_ 5typicalInconel 617 honeycomb _" ...._'Q'-_ -- _)
Core thickness = 0.280 _.,.J, I_ (_)_'_." 2.35
Face sheet thickness = 0.005 ---__ "_ 'q_ ,6_ _.__
Titaniumhoneycomb I'; IIli [ ..J_..' _.__"_
!Core thickness = 0.170 1,_-,1|' " lnconel 617 beadedFace sheet thickness = 0.006 I ' F,- _ .._ pl '
side closure• , _, . Thickness = 0.003
__ Cerachrome
insulation, 6 Ib/ft 3
Underhanging lip Q-Fiber feltinsulation, 3.5 Ib/ft 3
Through-panel fastener assembly ---./
(a) Schematic.
12.(
12.0
L-82-8795
(b) Fabricated panel.
Figure 2. Superalloy honeycomb prepackaged thermal protection system panel. Dimensions are in inches unlessotherwise noted.
26
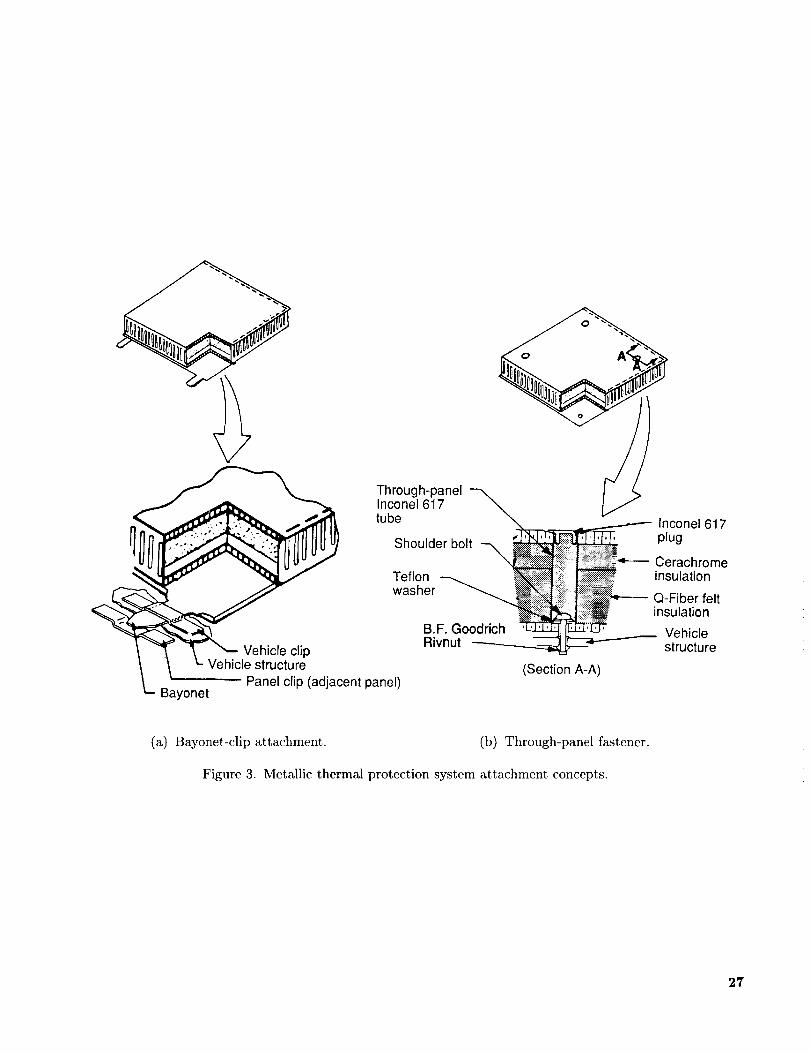
c,VehlC'c uCl'e"L
- Panel clip (adjacent panel)- Bayonet
Through-panelInconel 617tube
Shoulder bolt
Teflonwasher
B.F. Goodrich
Rivnut
(Section A-A)
lnconel 617plug
Cerachromeinsulation
Q-Fiber feltinsulation
Vehiclestructure
(a) Bayonet-clip attachment. (b) Through-panel fastener.
Figure 3. Metallic thermal protection system attachment concepts.
27
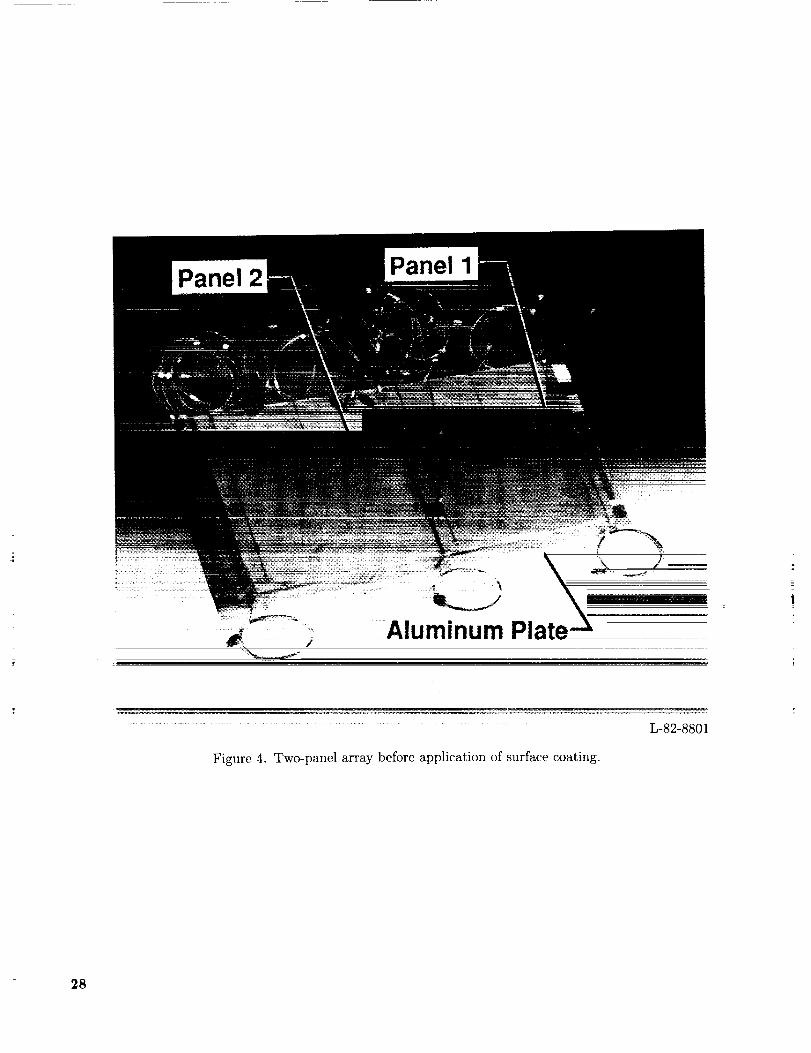
Panel 2Panel 1
Aluminum Pl
Figure 4. Two-panel array before application of surface coating.
L-82-8801
28
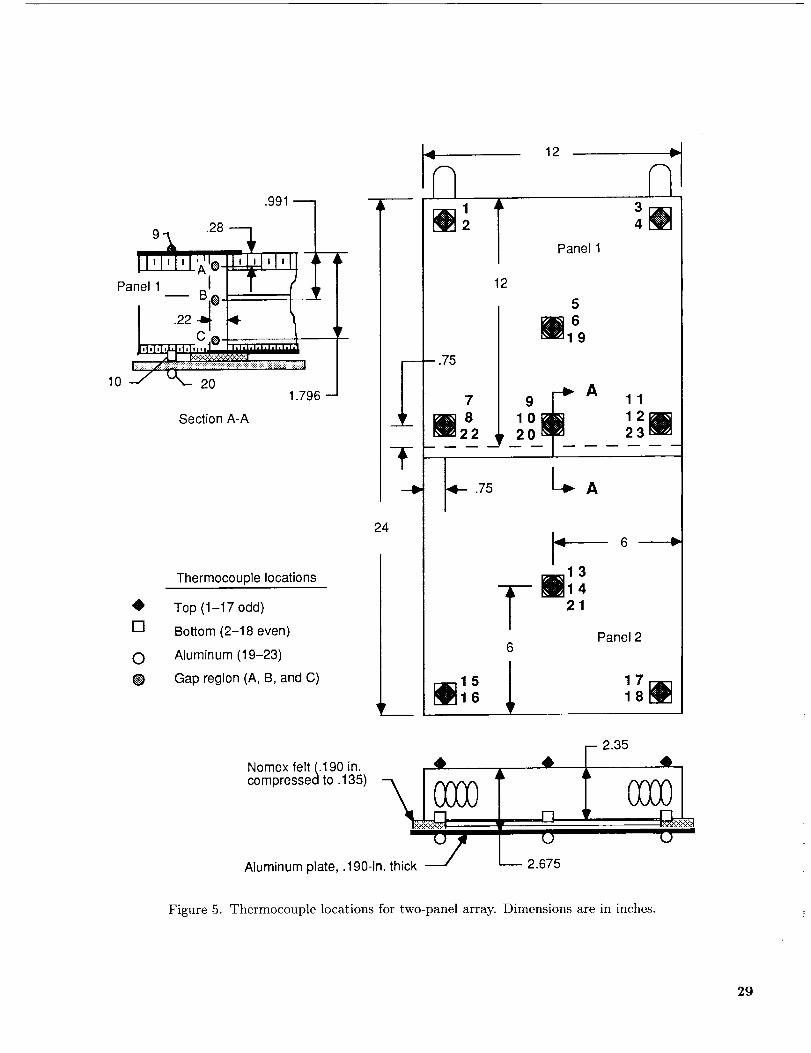
.991
,Ll_t_ld_'_Io-.Ld.d,I,Panel 1 I 1' ,p,
4
I,hl,hhhhl,I
_ili i:ii?i:??ii!i:i:?!:!:_:!:i:!:::::::::::::-:
1.796 -
Section A-A
12
1
Panel 1
,,,J
3
12
7
5
181619
2o_ A 1110 12_23
.75 I__ A
4)
[]
©
®
Thermocouple locations
Top (1-I7 odd)
Bottom (2-18 even)
Aluminum (19-23)
Gap region (A, B, and C)
24
15
Nomex felt (.190 in. r-icompressed to. 135)
Aluminum plate, .190-in. thick=m=__
L,,
I"13
--lr Ij1421
6
6
Panel 2
2.675
Figure 5. Thermocouplc locations for two-panel array. Dimensions are in inches.
29
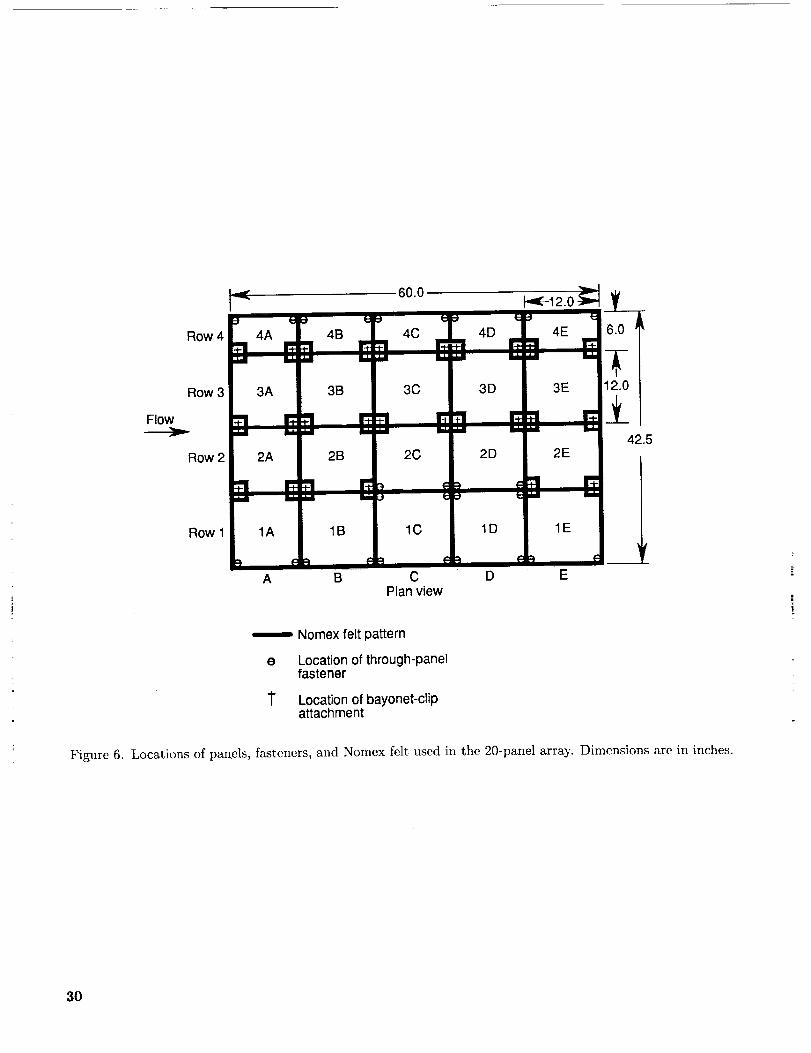
Row 4 4A
Row 3 3A
Flow t'1
Row 2
Row 1
2A
..1.1
t: :9
I.A. _11
i,d. _.1
4B
3B
2B
60.0
% ::t
4Cr_hi ,_1
3C
r_
2c
iJl .i-i
1A 1B
A B
J _
1C
CPlan view
t_I{-12.0
4D 4E
hi. ,,I-m Idld I1_
3D 3E
Iml ,,I-I i_ ill
2D
1D
D
2E
_: .In
1E
E
hlh
42.5
Nomex felt pattern
e Location of through-panelfastener
T Location of bayonet-clipattachment
Figure 6. Locations of panels, fasteners, and Nomex felt used in the 20-panel array. Dimensions are in inches.
30
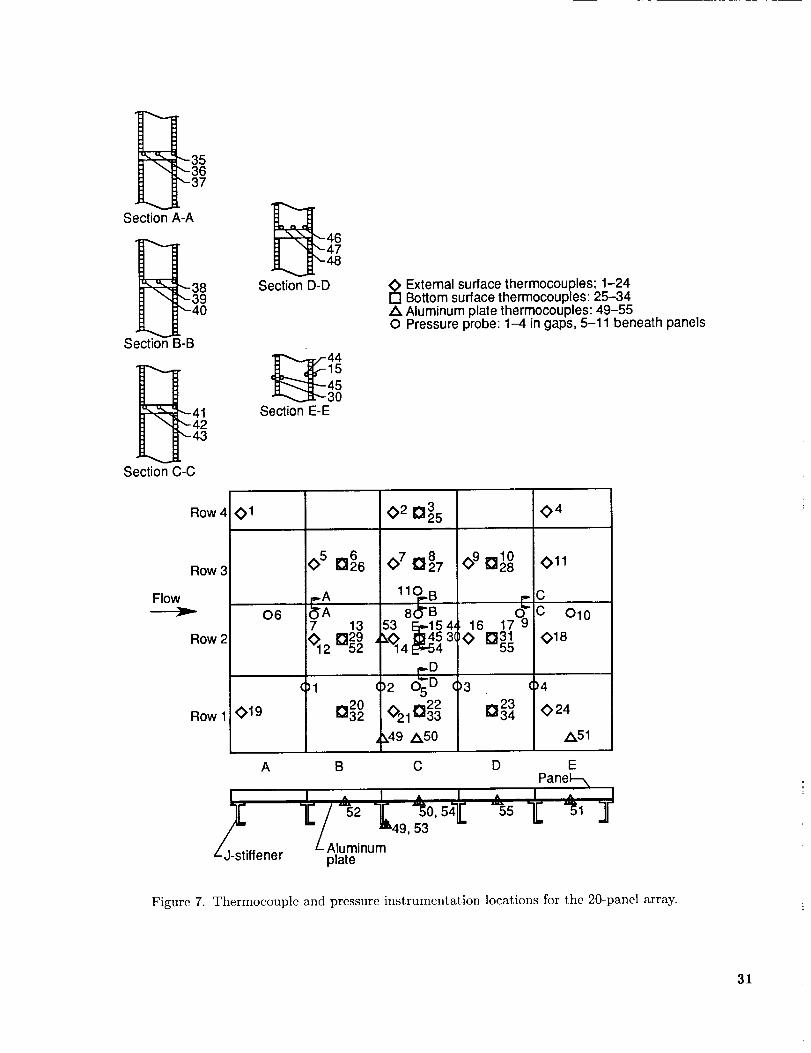
Section A-A
3940
Secticn B-B
Section C-C
Row 4
Row 3
Flow
Row 2
Row 1
__E_ 464748
Section D-D
44
15453O
Section E-E
_ xternal surface thermocouples: 1-24Bottom surface thermocouples: 25-34Z_ Aluminum plate thermocouples: 49-55O Pressure probe: 1-4 in gaps, 5-11 beneath panels
<>1
O6
O19
7 13
07
140 B8oC::B
53 _!4'_O14 3(
_D)2 o5D
_, _2221 33
_49 Z_50
0
16 17 9tO
()3
04
011
C
C O10
D31 O1855
)4
10,23 02434
Z_51
A B C D EPanel--_
L/ 52 L 5°,54[L 55 "_ "51
--/ ==49, 53 --/
z_Aluminumiffener plate
I
-11
Figure 7. Thermocouple and pressure instrumentation locations for the 20-panel array.
31
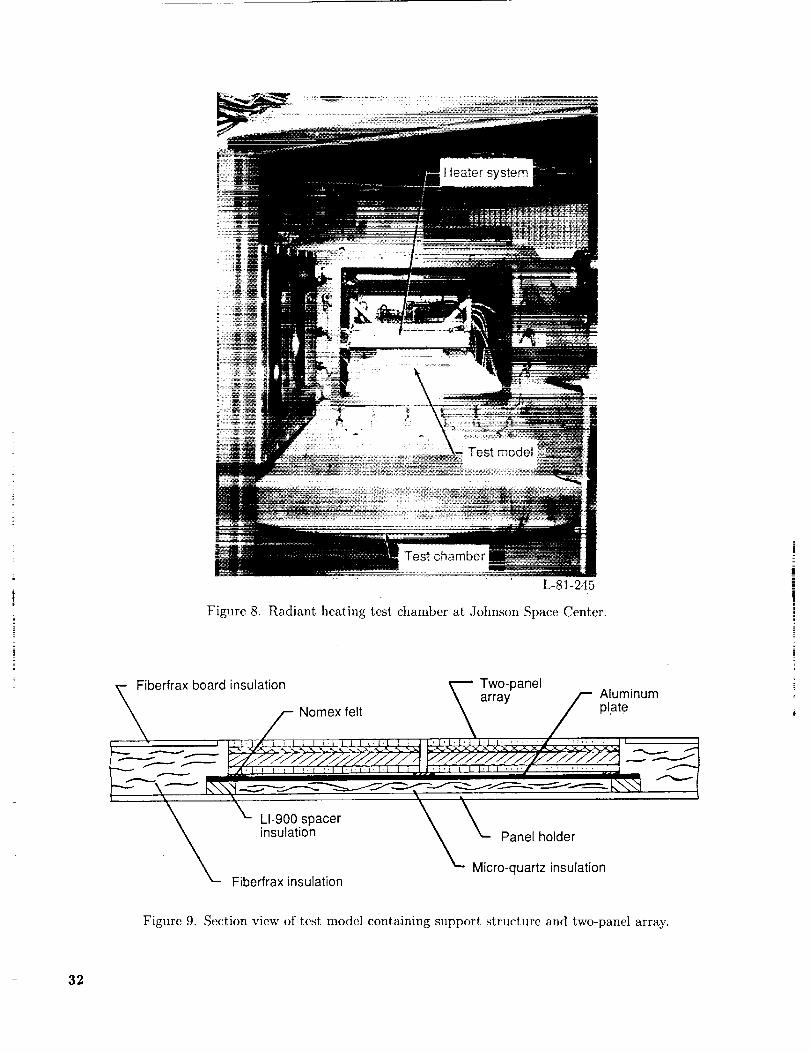
Figure 8.
L-81-245
Radiant heating test chamber at Johnson Space Center.
_Fiberfrax board insulation _ Two-panel\ array /-- Aluminum
fNomexfelt _ /plate
I _ _ V//_J__/Y/J////J/////4 W_/_/////_//t////////J ---.- _---__1_ l,N,I;iCI21 1,1_i t'l,l'i.i'l'l't I [ II'i'i I I'l'J I ,,!,J _A" 'i ...... I "_'_-_""1
_ LI-900spacer _ _
insulation _ k.. Panel holder
"- Micro quartz insulation_-- Fiberfrax insulation
Figure 9. Section view of test model containing support structure and two-panel array.
32
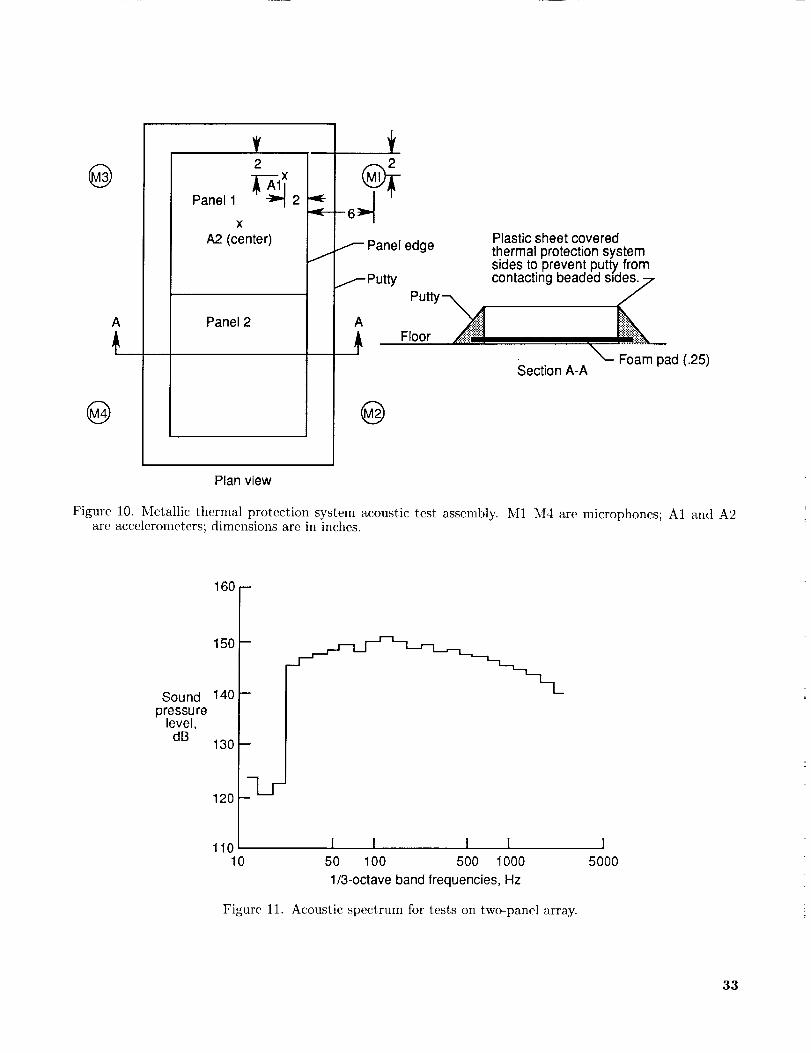
®
A
®
2
I AI::Panel 1 _ 2
x
A2 (center)
Panel 2
JPanel edge
_Putty
A
®
Plastic sheet coveredthermal protection systemsides to prevent putty fromcontacting beaded sides_7
Floor /_:-"-::'-"! - '_*!-.,,,,i!_
_- Foam pad (.25)Section A-A
Plan view
Figure 10. Metallic thermal protection system acoustic test assembly.are acceleromctcrs; dimensions are in inches.
M1 M4 are microphones; A1 and A2
160 -
Soundpressu re
level,dB
150
140
130
120
110 I I I I10 50 100 500 1000
1/3-octave band frequencies, Hz
Figure 11. Acoustic spectrum for tests on two-panel array.
15000
33
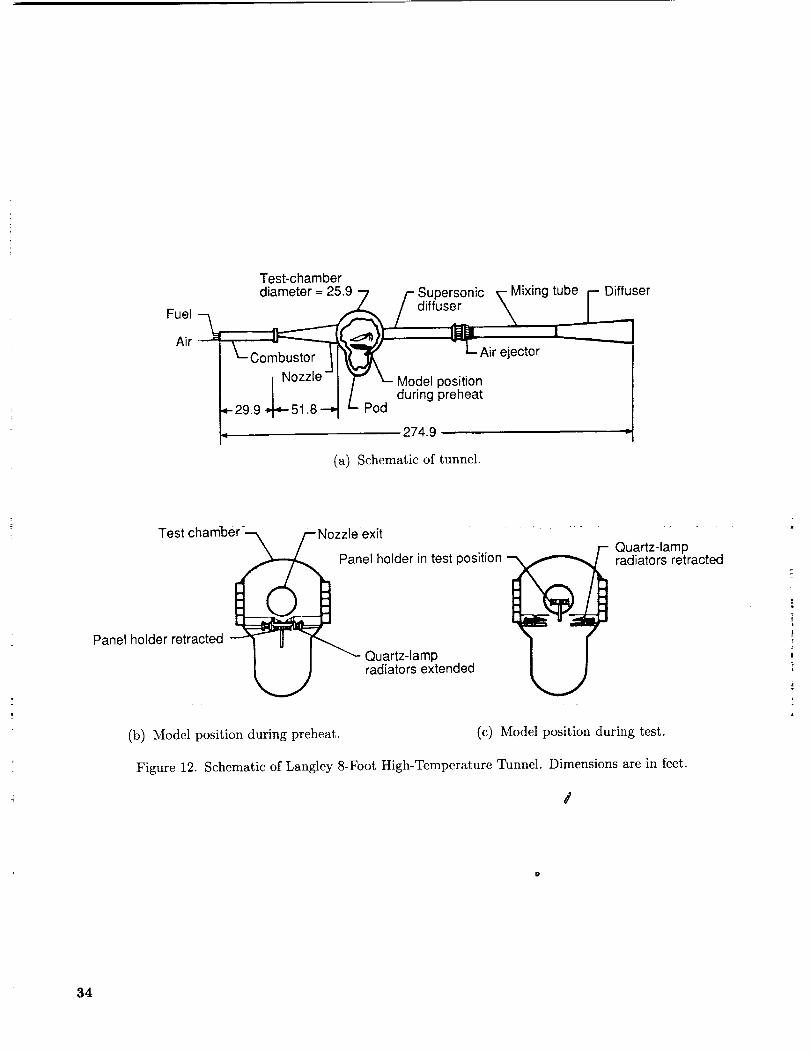
Fuel---_Air
Test-chamberdiameter=25.9-7 /- Supersonic _- Mixing tube r-
/diffuser \ /!
_--Combusto: __1"_ _ q,- Air ejector
I Nozzle-} _ k_. Model positionI I during preheat
_- 29.9 -,,_-51.8 --_ Pod
4 274.9
(a) Schematic of tunnel.
Diffuser
Test chamber
Panel holder retracted
exit
el holder in test position
Quartz-lampradiators extended
Quartz-lampradiators retracted
(b) Model position during preheat. (c) Model position during test.
Figure 12. Schematic of Langley 8-Foot High-Temperature Tunnel. Dimensions are in feet.
U
34
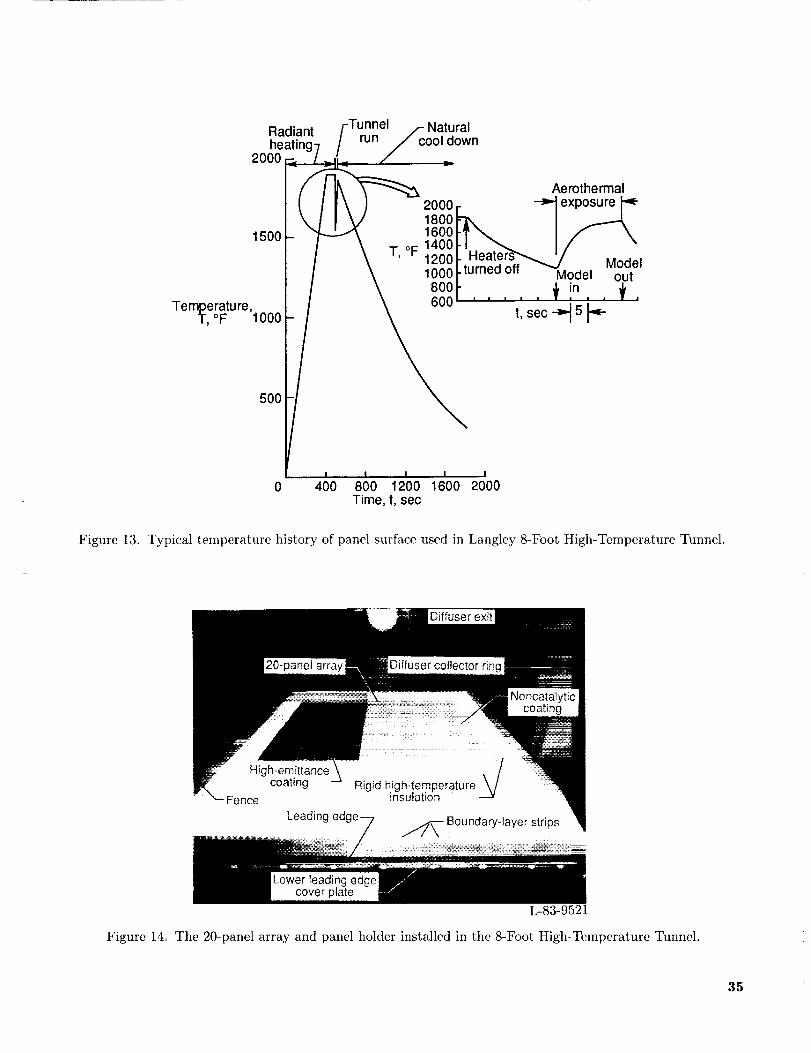
Radiantheating-
2000
1500
Temperatu re,T, °F 1000
Tunnel
run
uralcool down
2000180016001400
T'°F 1200
10008OO600
Aerothermal
• !°i i i i it, sec _ 5
5O0
I I I I
0 400 800 1200 1600 2000Time, t, sec
Figure 13. Typical temperature history of panel surface used in Langley 8-Foot High-Temperature Tunnel.
Diffuser exit
High-emittancecoating
Fence
Leading ed!
Rigid high-temperature jinsulation
L-83-9521
Figure 14. The 20-panel array and panel holder installed in the 8-Foot High-Temperature Tunnel.
35
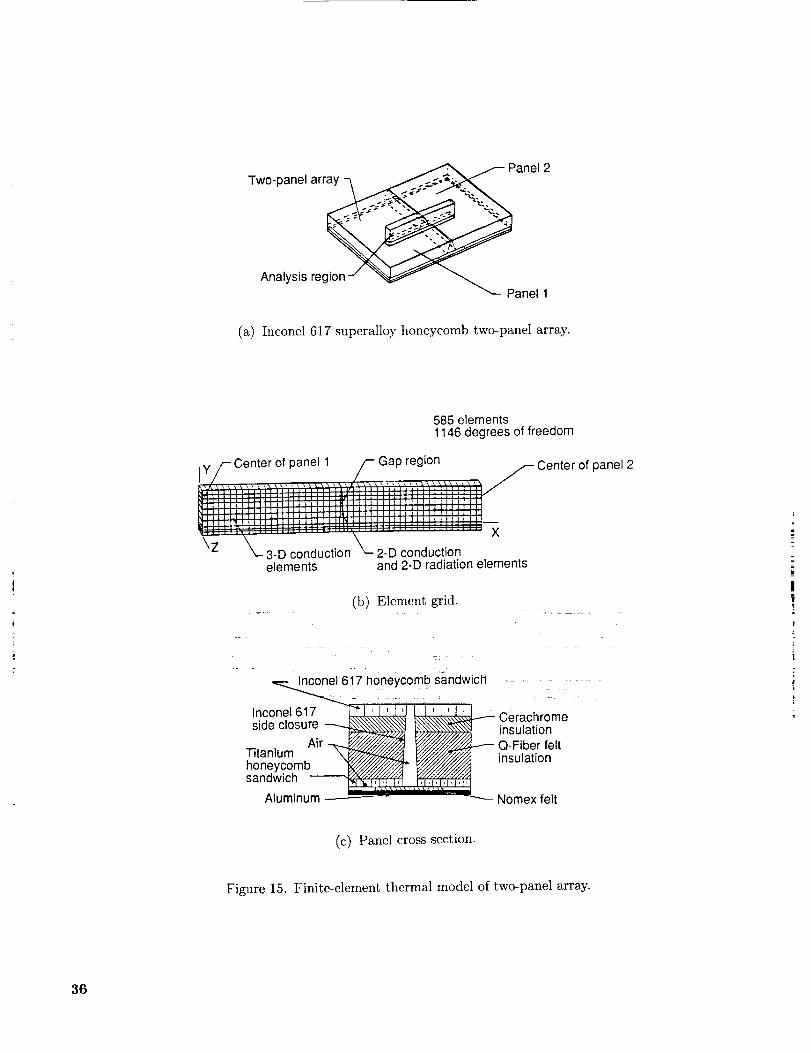
Two-panelarr _ _--Panel 2
Analysis region-" _Panel 1
(a) Inconel 617 superalloy honeycomb two-panel array.
585 elements1146 degrees of freedom
iyj-Center of panel 1 p Gap region _- Center_,...... J ......... _ ,_.__..........I_t ; _" l''i.Ll_ ', : , ] , , ', ', ', ', M ',] " 1 t t ', ', _,' : ', ', ', ', ', ; ; ; ', ', " >"
] II I I1 |ltl 1 II I tttllll tt IIIIt II]
] I I t I [1tl rl III t IIII Ill III II II I II
"_" ..... , ...... \ X\Z _- 3-D conduction k_ 2-D conduction
elements and 2-D radiation elements
of panel 2
(b) Element grid.
17 honeycomb sandwich _ _ _
lncone1617 'l' [' ' '1'17sale _ _-'_'['_'_'@-insulationi closure × Cerachrome
A_r• _ Q-Fiber feltTiotaen'Ummb-@_ _/__ insu,ation
sand _woh. _ _-_"_ _;L'!',L',_,,,/LL2'JcI'l't' I
Aluminum - _ Nomex felt
(c) Panel cross section.
Fig_ire i5. Finite-element thermal model of two-panel array.
36
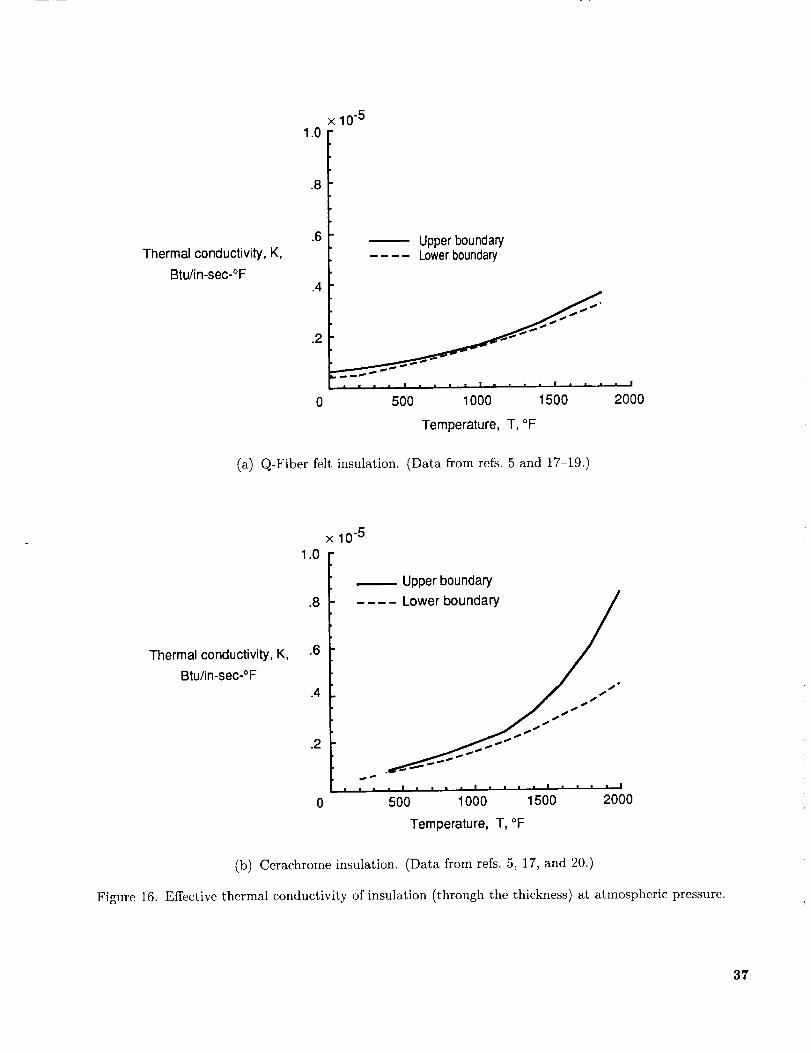
Thermal conductivity, K,
Btu/in-sec-°F
1.0
.8
.6
x 10-5
.4
.2
Upper boundaryLowerboundary
• • I • • • I • I • • •
500 1000 1500
Temperature, T, °F
(a) Q-Fiber felt insulation. (Data from refs. 5 and 17-19.)
•1
2000
Thermal conductivity, K,
Btu/in-sec-°F
1.0
.8
.6
.4
.2
x 10 -5
Upper boundary
Lower boundaryw
S _
I I , | • • I i • • | I • , l • I
500 1000 1500 2000
Temperature, T, °F
(b) Cerachrome insulation. (Data from refs. 5, 17, and 20.)
Figure 16. Effective thermal conductivity of insulation (through the thickness) at atmospheric pressure.
37
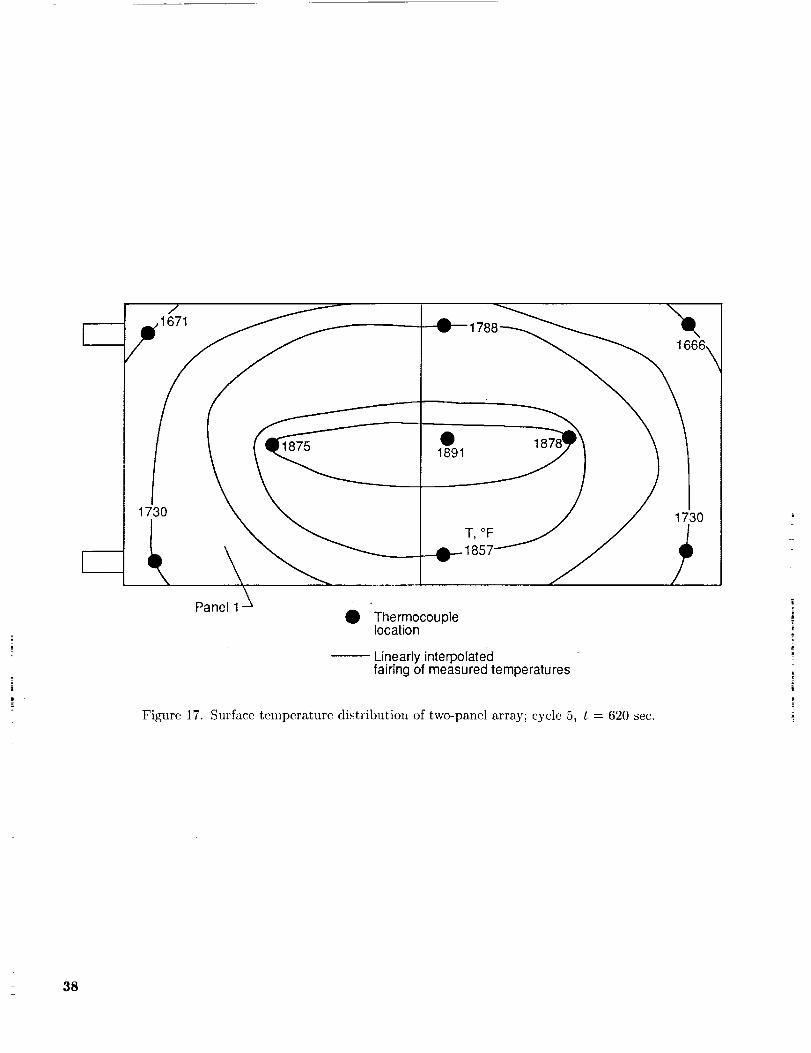
7
0
0 Thermocouplelocation
-- Linearly interpolatedfairing of measured temperatures
Figure 17. Surface temperature distribution of two-panel array; cycle 5, t = 620 sec.
38
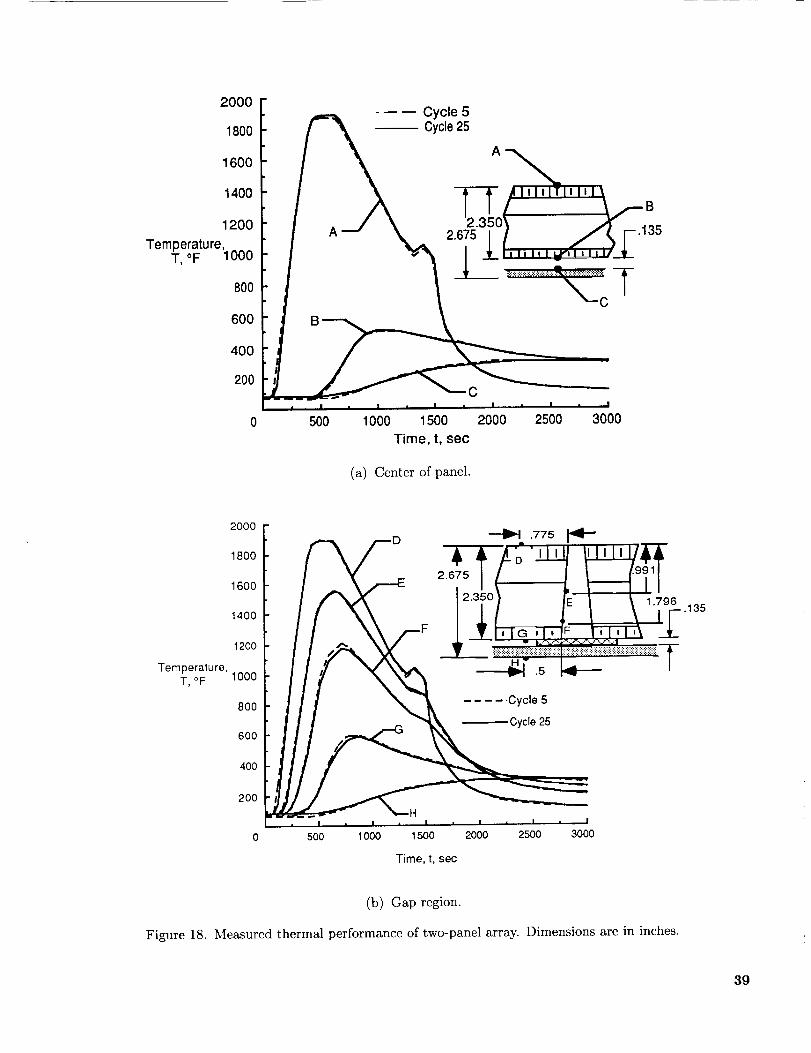
2000
1800
1600
1400
1200
Temperature,T, °F 1000
800
6O0
4O0
200 "1
B
5OO
m __ Cycle 5Cycle25
1000
C
1500 2000 2500 3000
Time, t, sec
(a) Center of panel.
Temperature,T,°F
2000 -
1800 -
1600 -
1400 -
1200 -
1000 i
800
600
400
200
.775
2.675
..... Cycle 5
_Cycle 25
H
0 500 1000 1500 2000 2500
Time, t, sec
3000
1.796.135
(b) Gap region.
Figure 18. Measured thermal performance of two-panel array. Dimensions are in inches.
39
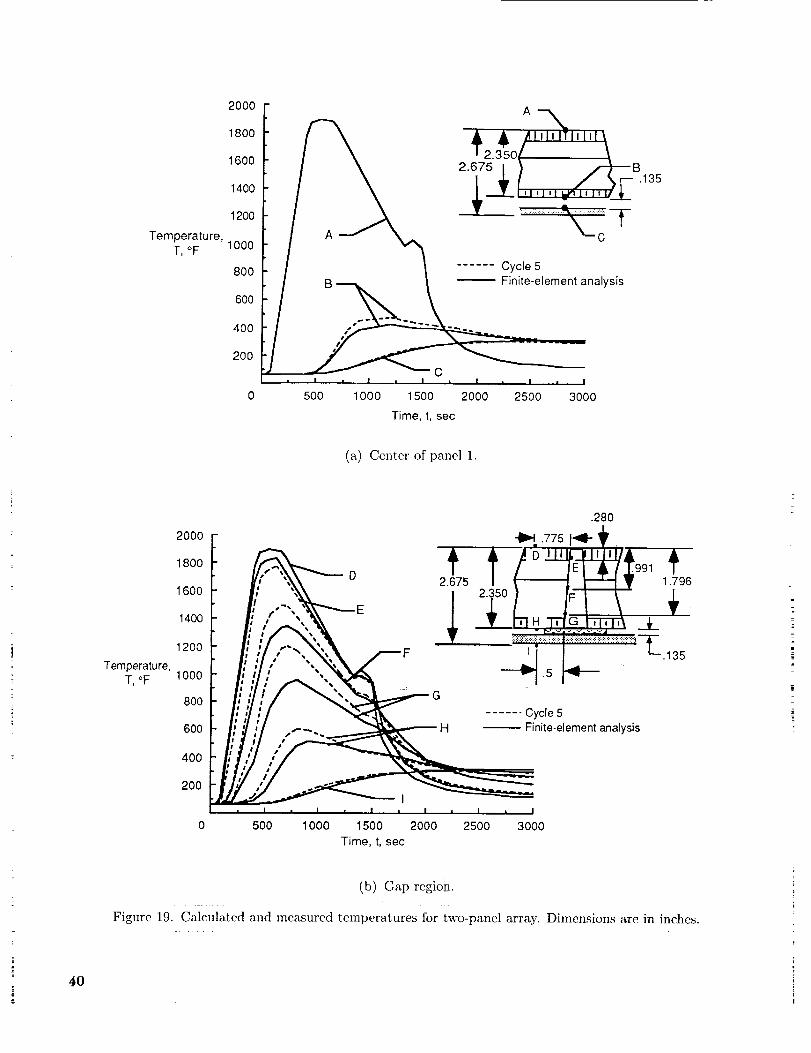
Temperature,T, °F
20OO
1800
1600
1400
1200
1000
8OO
6OO
4O0
2OO
Time, t, sec
(a) Center of panel 1.
Temperature,T, °F
2OO0
1800
1600
1400
1200
1000
800
6O0
40O
2OO
/ f--"" "'"DE
II . I , I ,
500 1000 1500
Time, t, sec
280
...... Cycle 5
Finite-element analysis
i _ _ I _ I
0 2000 2500 3000
(b) Cap region.:2L ::. " :
Figure 19. Calculated and measured temperatures for two-panel array. Dimensions are in inches.
4O
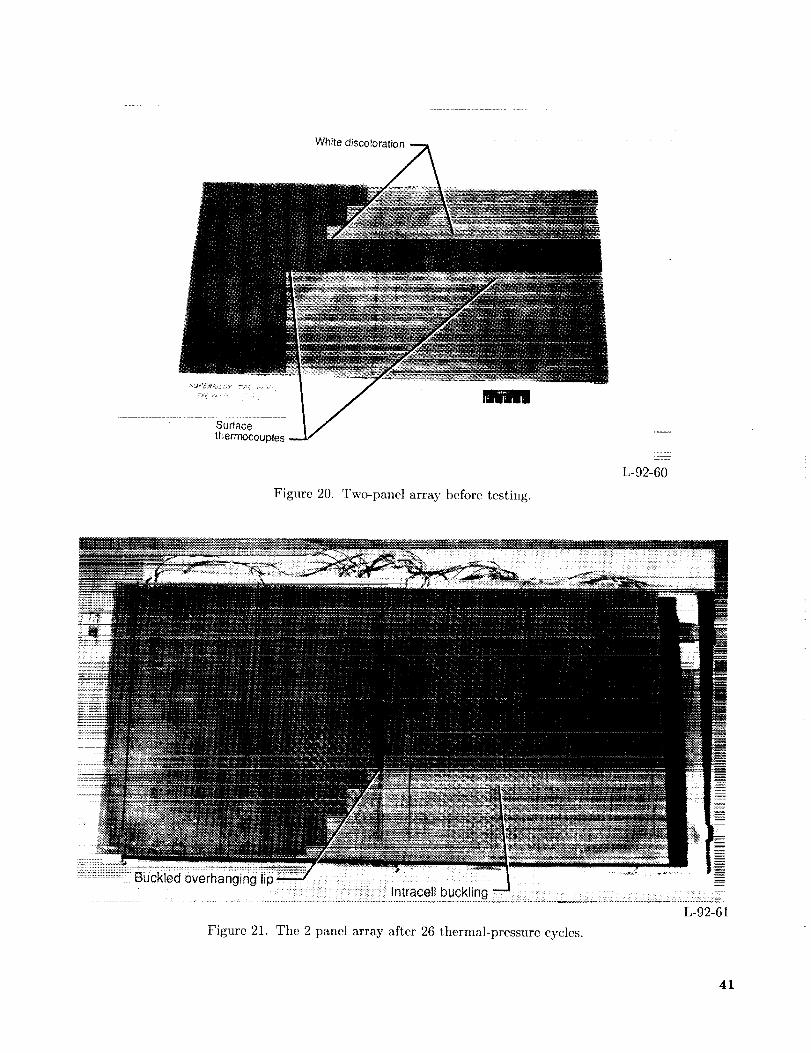
White discoloration
.............. thermocouples
Figure 20. Two-panel array before testing.
L-92-60
@
i:....
!!!_!!!!!!!!!!!Z!!!!BuCkled overhanging lip
Figure 21. The 2-panel array after 26 thermal-pressure cycles.
L-92-61
41
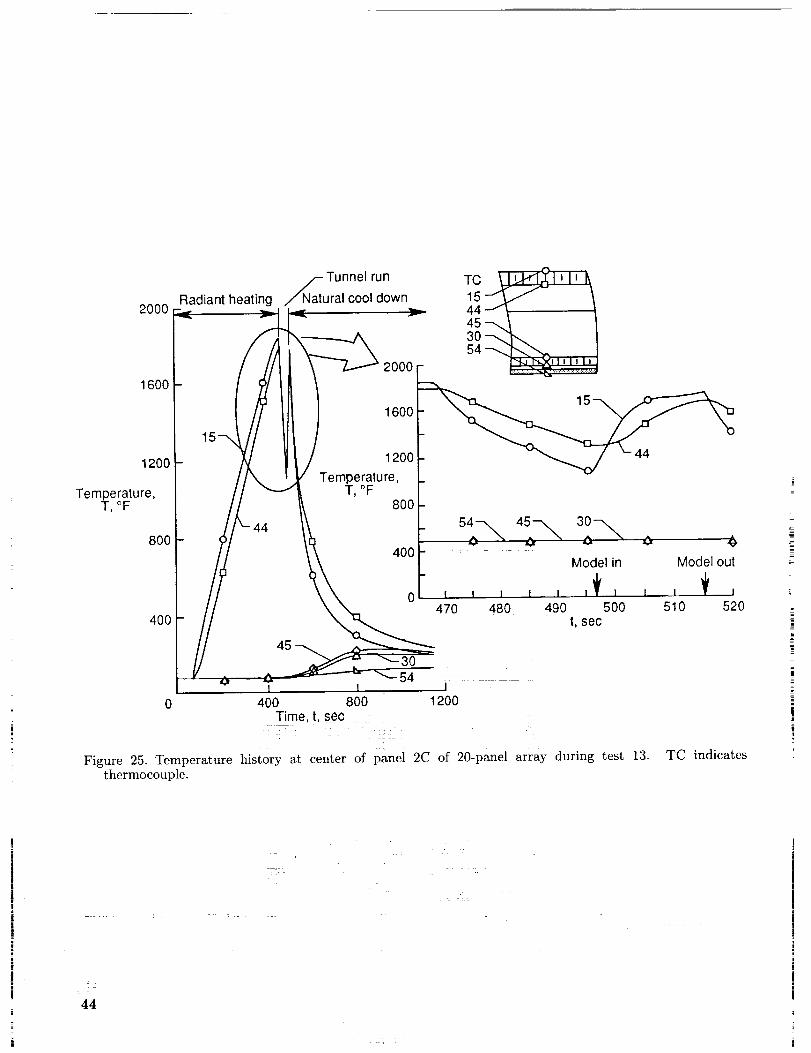
2000
1600
1200
Temperature,T,°F
800
400
Radiant heating/_Nat Tunnel run
ural cool down
2000 -
1600
1200
Temperature,T,°F
800
4O0Model in Model out
, , , , , ,_ , i, _ ,
470 460 490 500 510 520l, sec
0I I
400 800Time, t, sec
3O54
i1200
Figure 25. Temperature history at center of panel 2C of 20-panel array during test 13.thermocouplc.
TC indicates
44
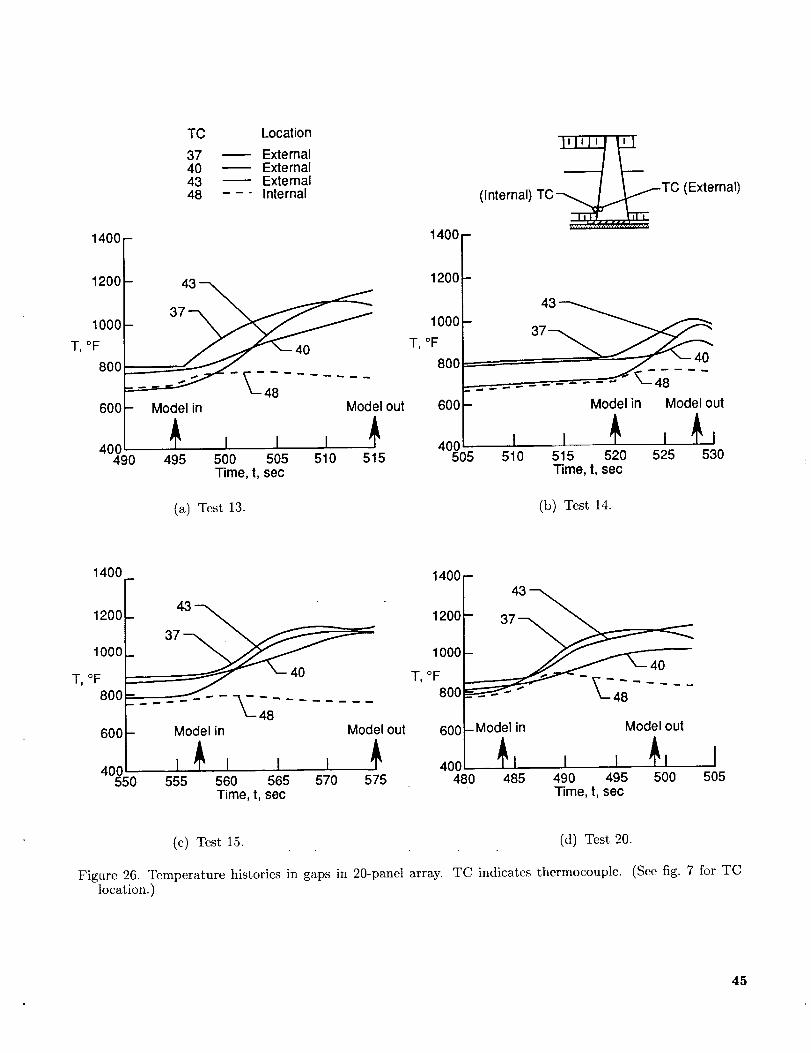
TC Location
37 -----" External40 "----- External43 "----- External48 --" Internal
1400/- 140t
1200/- 43_ 120(
T,;ooo/-o 1001
iiii" 40 T, °F
_ 800
Model in Model out 600 -
490 495 500 505 510 515 50STime, t, sec
(a) Test 13.
(Internal) TC-TC (External)
37
I510
Model in Model out
,_515 520 525 530Time, t, sec
(b) Test 14.
1400
1200 43 --_
1000 t 37_
600 -
40(55_
---___........Model in
Model out
_ ,__, ,___5 5 560 56,5 570 575
Time, t, sec
1400 -
120(
100C
T, °F80(
601 - Model in
,o,,L_,48_ 485
(c) Test 15.
Figure 26. Temperature histories in gaps in 20-panel array.location.)
- 37
Model out
490 495 500 505Time, t, sec
(d) Test 20.
TC indicates thermocouple. (See fig. 7 for TC
45
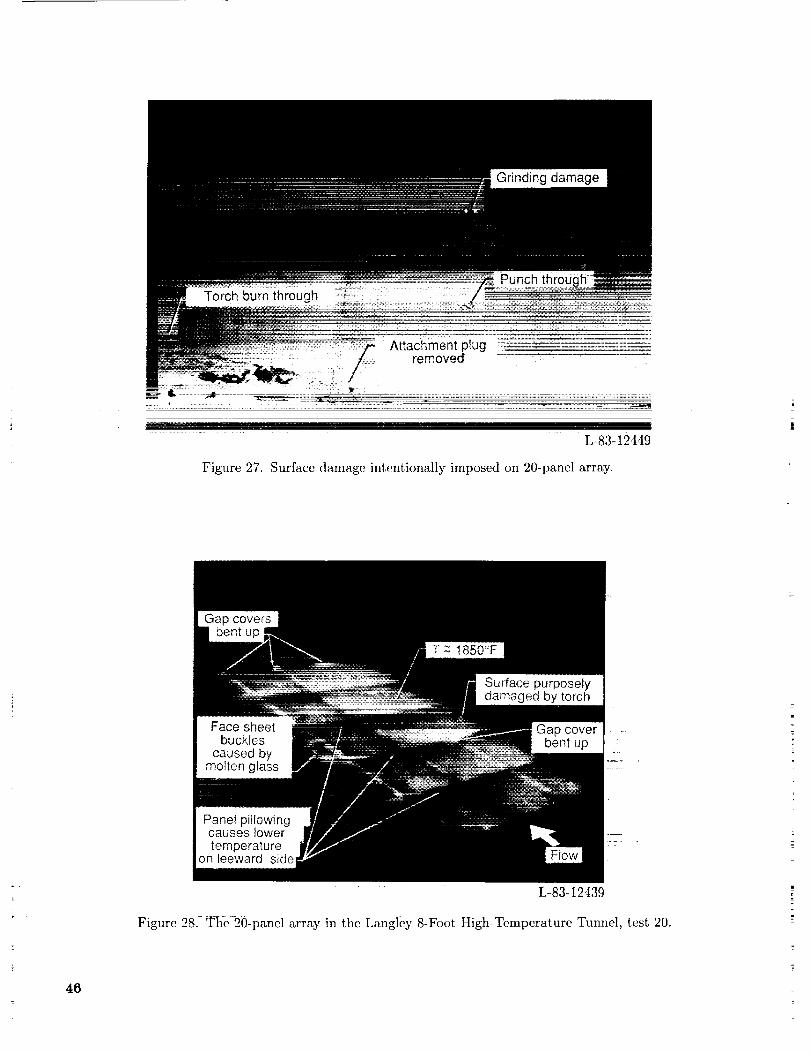
Attachment plug --- ..................removed ---
Figure 27.
L-83-12449
Surface damage intentionally imposed on 20-panel array.
L-83-12439
Figure 28. The 20-panel array in tile Langley 8-Foot High-Temperature _Smnel, test 20.
46
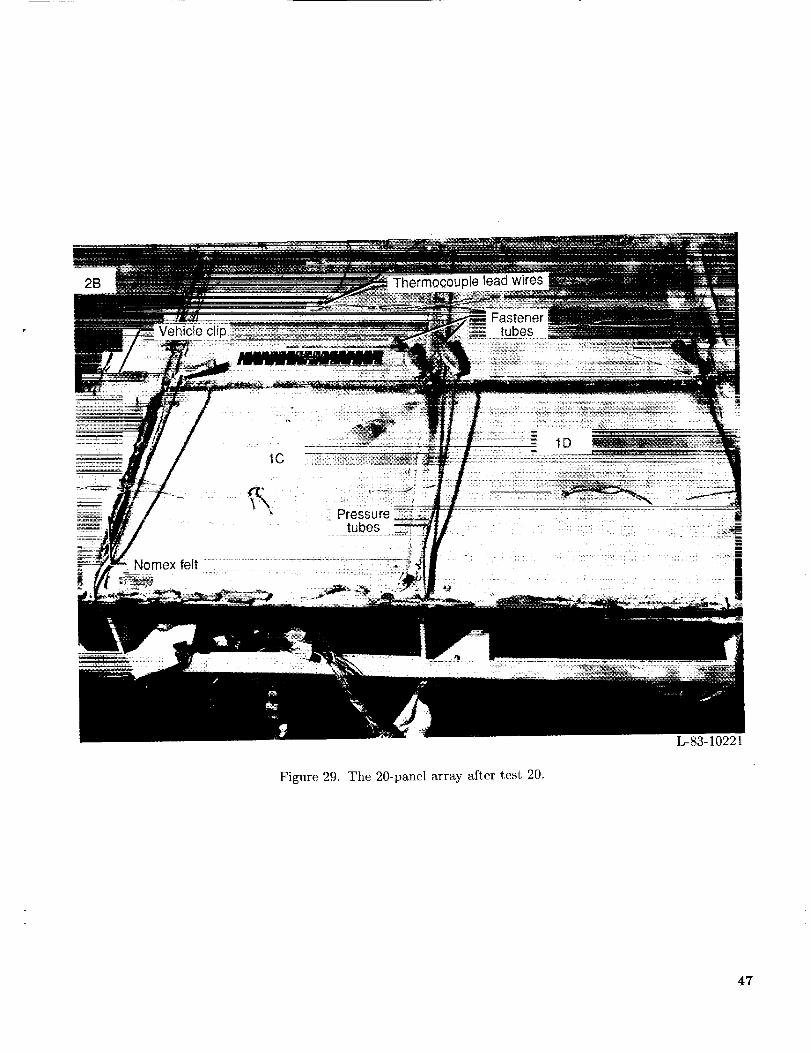
2B
Vehicle cli
Nomex felt
1C
Pressuretubes
pie lead wires
Fastenertubes
= 1D
Figure 29. The 20-panel array after test 20.
L-83-10221
47

; = - _;_-; _i_;-_;i_! - - _7_'_ _;!_ .... _........... "-__; " -_': "_ " = i

Form ApprovedREPORT DOCUMENTATION PAGE OMB No. 0704-0188
i Public reporting burden for this collection of information is estimated to average 1 hour per response, including the time for reviewing instructions, searching existing data sources,gathering and maintaining the data needed, and completing and reviewing the collection of information. Send comments regarding this burden estimate or any other aspect of thiscollection of information including suggestions for reducing this burden, to Washington Headquarters Services, Directorate for Information Operations and Reports, 1215 JeffersonDavis Highway, Suite 1204, Arlington, VA 22202 4302, and to the Office of Management and Budget, Paperwork Reduction Project (0704-0188), Wash ngton, DC 20503.
I. AGENCY USE ONLY(Leave blank) 2. REPORT DATE 3. REPORT TYPE AND DATES COVERED
March 1993 Technical Paper
4. TITLE AND SUBTITLE 5. FUNDING NUMBERS
Static and Aerothermal Tests of a Superalloy Honeycomb
Prepackaged Thermal Protection System WU 506-43-71-04
6. AUTHOR(S)
Mark P. Gorton, John L. Shideler, and Granville L. _,Vebb
7. PERFORMING ORGANIZATION NAME(S) AND ADDRESS(ES)
NASA Langley Research Center
Hampton, VA 23681-0001
9. SPONSORING/MONITORING AGENCY NAME(S) AND ADDRESS(ES)
National Aeronautics and Space Administration
Washington, DC 20546-0001
8. PERFORMING ORGANIZATION
REPORT NUMBER
L-17084
10. SPONSORING/MONITORINGAGENCY REPORT NUMBER
NASA TP-3257
11. SUPPLEMENTARY NOTES
Gorton: Lockheed Engineering 8z Sciences Company, Hampton, VA; Shideler
Center, Hampton, VA.
and Webb: Langley Rcscarch
12a. DISTRIBUTION/AVAILABILITY STATEMENT
Unclassified Unlimited
Subject Category 34
12b. DISTRIBUTION CODE
i3. ABSTRACT (Maximum 200 words)
A reusable metallic thernml protection system has been developed for vehicles with maximum surfacetemperatures of up to 2000°F. An array of two 12- by 12-in. panels was subjected to radiant heating tests
that sinmlated Space Shuttle entry temperature and pressure histories. Results indicate that this thermal
protection system, with a mass of 2.201 lbm/ft 2, can successfully prevent typical ahnninum primary, structure
of an entry vehicle like the Space Shuttle from exceeding temperatures greater than 350°F at a location onthe vehicle where the maximum surface temperature is 1900°F. A flat array of 20 panels was exposed toaerothermal flow conditions at a Math number of 6.75. The panels were installed in a worst-ca.se orientation
with the gaps between panels parallel to the flow. Results from the aerothermal tests indicated that convective
heating occurred from hot gas flow in the gaps between the panels. Proposed design changes to prevent gap
heating include orienting panels so that gaps are not parallel to the flow and using a packaged, compressiblegap-filler material between panels to block hot g_s flow in the gaps.
14. SUBJECT TERMS
Thermal protection systems; Metallic prepackaged TPS; Radiant heating tests;
High-temperature insulation
17. SECURITY CLASSIFICATION
OF REPORT
Unclassified
ISN 7540-01-280-5500
18. SECURITY CLASSIFICATION
OF THIS PAGE
Unclassified
19. SECURITY CLASSIFICATION
OF ABSTRACT
15. NUMBER OF PAGES
48
16. PRICE CODE
A03
20, LIMITATION
OF ABSTRACT
Standard Form298(Rev, 2-89)Pre_rlbed by ANSI Std Z39-18298-102
NASA-Langley, 1993