Embed Size (px)
Citation preview
Research ArticleAn Automated Procedure for Assessing Local ReliabilityIndex and Life-Cycle Cost of Alternative Girder BridgeDesign Solutions
Ilaria Venanzi 1 Riccardo Castellani2 Laura Ierimonti1 and Filippo Ubertini 1
1Department of Civil and Environmental Engineering University of Perugia Via G Duranti 93-06125 Perugia Italy2Professional Engineer Via V Martinozzi Giove 86-05024 Terni Italy
Correspondence should be addressed to Ilaria Venanzi ilariavenanziunipgit
Received 17 July 2018 Revised 21 November 2018 Accepted 9 December 2018 Published 20 January 2019
Academic Editor Mariano Angelo Zanini
Copyright copy 2019 Ilaria Venanzi et al+is is an open access article distributed under the Creative Commons Attribution Licensewhich permits unrestricted use distribution and reproduction in any medium provided the original work is properly cited
Stakeholders of civil infrastructures have to usually choose among several design alternatives in order to select a final design rep-resenting the best trade-off between safety and economy in a life-cycle perspective In this framework the paper proposes anautomated procedure for the estimation of life-cycle repair costs of different bridge design solutions+e procedure provides the levelsof safety locally guaranteed by the selected design solution and the related total life-cycle cost+emethod is based on the finite elementmodeling of the bridge and uses design traffic models as suggested by international technical standards Both the global behavior andthe transversal cross section of the bridge are analyzed in order to provide local reliability indexes Several parameters involved in thedesign such as geometry and loads andmaterialsrsquo characteristics are considered as uncertain Degradationmodels are adopted for steelcarpentry and rebars+e application of the procedure to a road bridge case study shows its potential in providing local safety levels fordifferent limit states over the entire lifetime of the bridge and the life-cycle cost of the infrastructure highlighting the importance of thelocal character of the life-cycle cost analysis
1 Introduction
Road infrastructures represent an important public asset andrequire large public expenditure for their construction andmaintenance Several failures of bridges all over the worlddemonstrate that many pieces of the road networks inwestern countries need strengthening or renovation [1]When designing new road bridges or retrofitting old onesusually several design alternatives are available for a singlestructure that are often very different in terms of economicinvestment and safety level
In the traditional designmethod the first most economicdesign alternative providing the prescribed safety level isselected In the last decade a new design approach hasbecome popular designated as the life-cycle cost analysis(LCCA) method that evaluates the expected cost for thewhole life cycle of the bridge accounting for initial costsmaintenance costs and direct and indirect costs related to
repair and disposal in a probabilistic framework [2ndash10] Allthe uncertainties involved in the problem can potentially betaken into account like the uncertainty on load charac-terization on structural parameters on materialsrsquo resistanceand on damage occurrence [11ndash14] Multiple hazards can beeasily taken into account by the LCCA approach [15 16]
+e evaluation of repair costs requires the computationof failure probability that for large structures such as roadbridges can be a very cost-expensive operation Indeed thefailure probability has to be computed for several structuralelements and for numerous limit states accounting for alarge number of uncertainties and load conditions Life-cyclecost has been used to optimize structural solutions andbridge design [17ndash26] to optimize retrofitting solutions [27]or in order to optimize bridge management and themaintenance program [28ndash32] Deterioration of the mate-rials is also typically included by considering time-variantstrength degradation models [1 33ndash39]
HindawiAdvances in Civil EngineeringVolume 2019 Article ID 5152031 17 pageshttpsdoiorg10115520195152031
In the present paper an automated procedure isproposed for the LCCA of road girder bridges +e life-cycle cost is related to failure probability which is locallyand automatically computed over the entire bridge deckfor several limit states +e procedure accounts for themain peculiarities involved in the girder bridge designMaterialrsquos degradation and several sources of uncertaintyin load and strength quantification are considered Designtraffic actions on the bridge suggested by up-to-datestandards are also adopted considering the interactionbetween deck and girder loads Different constructionphases of composite steel-reinforced concrete beams areanalyzed +e procedure leads to the evaluation of thetime-dependent reliability index and failure probabilityfor all the considered limit states and in correspondence ofeach location along the deck and the girder It alsoprovides the expected life-cycle cost thus allowing aquantitative comparison between different design alter-natives +e main progress of the methodology with re-spect to the existing literature is the local character of thereliability assessment and the life-cycle cost analysis thatallows to decide the priority of intervention that isstrongly dependent on the structural details of the deckand on the materialrsquos degradation model +e rest of thepaper is organized as follows Section 2 presents theproposed procedure for automatic LCCA of bridgesSection 3 presents an illustrative case study while theresults of the numerical simulations are presented inSections 4 and 5 Finally some concluding remarks aregiven in Section 7
2 The Proposed Procedure
+e proposed procedure is a general automated tool for theLCCA of girder bridges which accounts for the main pe-culiarities involved in the girder bridge design It can takeinto consideration the real actions on a structure also ac-counting for interaction between deck and girder loadsdifferent construction phases of composite steel-reinforcedconcrete beams uncertainties in load and strength quan-tification and materialsrsquo degradation models +e procedureleads to the evaluation of the reliability index and failureprobability for all the considered limit states and in corre-spondence of each location along the deck and the girder Italso allows for the computation of the expected life-cyclecost thus allowing quantitative comparison between dif-ferent design alternatives
21 Life-Cycle Cost Analysis for Girder Bridges +e expectedlife-cycle cost for a bridge can be expressed as
E C tl( 11138571113858 1113859 CI + 1113944
tl
t1
E CM(t)1113858 1113859 + E CR(t)1113858 1113859
(1 + r)t1113890 1113891 (1)
where E[] is the expected value CI is the initial cost CM isthe maintenance cost at time t after construction CR is therepair cost at time t after construction tl is the lifetime of thestructure and r is the discount rate
+e initial cost CI includes charges for design testingexpropriation materials and construction and it is usuallyassumed to be deterministic
+e maintenance cost CM includes the cost for in-spection and ordinary maintenance performed at regulartime intervals [5 40] It is often assumed during the designphase to be directly proportional to the construction costand it can be minimized by planning an optimal series ofmaintenance and inspection activities Maintenance actionshave a non-negligible influence on structural reliabilityWhen a maintenance action is performed the materials andthe structural elements are reported to be in their originalconditions with a consequent increase in reliabilityNonetheless as the maintenance cost is weakly dependenton the specific structural solution it can be neglected in thepreliminary design phase when the aim is to compare dif-ferent structural alternatives [2 30 41]
Rehabilitation or repair has to be carried out when thestructure reaches a critical limit state [5 42] +e directrepair cost is the amount spent for the structural retrofit andcan be computed as a function of the failure probability Tocompute the expected life-cycle repair costs it is assumedthat the structure is restored to its original condition aftereach occurrence of damage Under this hypothesis the LCrepair cost of a structural element can be written as
E CR(t)1113858 1113859 1113944
J
j11113944
K
k1P
f
jk(t)njcRj (2)
where J is the total number of independent limit states j K isthe total number of relevant sections k along the structuralmembers P
f
jk is the time-dependent probability of failurefor the j-th limit state at section k cRj is the repair cost forlimit state j referred to a length Lj across the sectiondepending on the limit state j and nj is the number ofelements subjected to limit state j Additionally the socialimpact of a failure can be taken into account through in-direct costs representing all the losses hanging on thecommunity for the closing or load-bearing capacity re-duction of the bridge [19 43] Indirect costs refer to non-tangible charges for the community and can be splitted intime loss for road users injuries or fatalities and socio-economic losses due to local production decrease [17 44] Asindirect costs are slightly dependent on the structural so-lution they are neglected in the current study but could beeasily included if needed in the proposed framework
22 Outline of the Procedure +e outline of the procedure isshown in Figure 1
In the proposed procedure as it is common in a girderbridge design at the stage of preliminary structural analysisfor comparing different design alternatives a transversalanalysis of the deck is performed at first (local analysis)followed by a longitudinal analysis of the girders (globalanalysis) With this aim a simplified modeling of thestructure is carried out in which the structure of the bridge isideally divided into two interconnected parts the deck andthe girder representing its local and global behavior
2 Advances in Civil Engineering
respectively e deck part is a modelization of the trans-verse section of the bridge while the girder part is amodelization of the longitudinal composite reinforcedconcrete-steel girder In the preliminary design phase whenthe goal is to evaluate which is the best design alternative theuse of a simplied model instead of a complex nite elementmodel is computationally advantageous and does not lead torelevant errors in the life-cycle cost evaluation
In the deck analysis block the FE model of the deck isassigned as input for the structural analysis which is re-peated for each possible trac load condition and posi-tion to provide automatically the envelope of the internalforces
In the girder analysis block the FE model of the lon-gitudinal beam is built and analyzed It is loaded withconstraint reactions of the deck structure corresponding toforces acting on girders provided by the deck analysis blockin addition to the other loads acting on the bridge such asthermal actions and transverse loadsen a set of uncertainparameters such as geometric data materialsrsquo characteris-tics and load intensities are modeled as random variableswith assigned probability distributions Materialrsquos degra-dation can be considered by varying with time the geometricdata and the properties of materialsrsquo strength e reliabilityanalysis is performed providing locally in each section theprobability of failure and the corresponding reliability indexfor each output section of the deck and the girder Finallythe life-cycle cost analysis is carried out by relating theprobability of failure to the expected life-cycle cost of theanalyzed bridge
e procedure built in a Matlab environment [45]requires the implementation of two FE models one for thedeck (in the deck analysis block) and one for the girder (inthe girder analysis block) For each model the discretizationis chosen in order to dierentiate between the dierent cross
sections and between the sections with dierent re-inforcements Moreover a suciently dense mesh has to beadopted in order to allow the movement of the concentratedor distributed loads over the structural elements e en-velope of stresses and displacements for moving loads is thencomputed in each section
Courbonrsquos method of analysis is adopted to properlyallocate trac loads between the girders e girders areloaded with the maximum reactions obtained from the deckanalysis
e structural response is computed through staticanalyses for the three typical life phases of the steel-concretemixed structure construction short term and long termSeveral types of loads are considered in addition to dead andtrac loads like thermal action transverse wind load andcentrifugal force Results are directly provided for a pre-selected number of output stations along the deck and thegirder
Without loss of generality to compute the failureprobability Pfjk(t) in equation (2) for each considered limitstate and for each output station the rst order secondmoment method ie the Hasofer-Lind procedure isadopted Probabilities of failure are calculated consideringstochastic independence between all the involved randomvariables and treating them as normally distributed In thisway the probability of failure is related to the well-knownreliability index β which represents the shortest distance ofthe selected limit state function from the origin of thereference system in the space of normal standard randomvariables If random variables are not normally distributedbut their distribution is approximately known the rst ordersecondmoment method can still be used by using equivalentnormal random variables As in the problem under in-vestigation the occurrence of limit states is checked locallythe reliability index depends on the output station k It also
Deck block Girder block
Structuralanalysis
Start
Loads
FEmodel
Girder loads
Reliabilityanalysis
Randomvariables
Life-cyclecost analysis
Costparameters
Loads
FEmodel
Structuralanalysis
End
Figure 1 Outline of the proposed automated procedure
Advances in Civil Engineering 3
depends on the considered limit state j and on the time afterconstruction (βjk(t)) +erefore the failure probability canbe computed as
Pf
jk(t) Φ minusβjk(t)1113872 1113873 (3)
where Φ is the normal cumulative distribution function
3 The Case Study Road Bridge
31 3e Road Bridge and the Two Design Alternatives+e general procedure described in Section 2 has beenapplied for the design of a road bridge selected as the casestudy It is a 550m-long continuous steel-concrete com-posite viaduct with 10 spans with variable length +e deckwidth is 1255m including 975m roadway and a 18msidewalk
Two design alternatives of the viaduct are available thefirst one corresponds to the original design while the secondone is a variant proposed by the contractor leading to areduction of the initial investment of about one millioneuros
In alternative 1 the deck is a 30 cm thick concrete slabsupported by two steel box girders +e beams are stiffenedand connected to each other at the supports with a steelplate In alternative 2 the deck is a 26 cm thick concrete slabsupported by two double-T steel girders connected bytransverse beams+e slab is designed as an equivalent beamwith a plate behavior thus guaranteeing that a thickness of26 cm is sufficient to support the design loads Figure 2 il-lustrates the transversal deck sections for both alternativesin order to better understand the differences between thestructural systems +e positions of the piers are different inthe two design alternatives as shown in Figure 3
+e strength class of concrete is C2835 according toEuropean guidelines [46] and the characteristic yieldstrength of reinforcement steel is 450MPa Steel S355 is usedfor the girders
32 Finite ElementModeling In order to carry out structuraland reliability analyses finite element models of the deckand the girders are built for both design alternativesSeparate models have been adopted for the deck and for themain girder as described in the following sections
321 Deck Modeling +e deck has been modeled as acontinuous reinforced concrete beam For the deckanalysis the girders are considered as fixed supportslocated in correspondence with the girdersrsquo axes Figure 4shows the deck modeling for the two design alternatives+e deck FE models for alternatives 1 and 2 are designatedas D1 and D2 respectively +e nodes between the ex-ternal supports are evenly spaced at every 50 cm in orderto correctly reproduce traffic load positioning with alimited computational effort Noneven distribution ofnodes is adopted for the sidewalks in order to account forthe slab height variation and for the concentrated load
positioning Nodes are connected by beam elements with3 degrees of freedom for each node +e displacementsand the internal forces are computed not only in corre-spondence with the 24 joints of the model but also atintermediate sections between two adjacent nodes for atotal of 69 output sections
+ree different cross sections are assigned to the framesin D1 differing from each other in terms of slab thick-ness and reinforcements Five different cross sections areassigned to the frames in D2 according the available pre-liminary design
322 Girder Modeling +e girders are modeled as con-tinuous beams as shown in Figure 5 +e girders are simplysupported at piers and hinged at fixed abutments +eseconstraints reflect the behavior of the real supports to beused in the two design alternatives +e jointsrsquo locations arechosen to reproduce traffic load positioning support loca-tion and to account for reinforcementrsquos variations +egirder FE models for alternatives 1 and 2 are designated asG1 and G2 respectively Model G1 consists of 89 nodes andmodel G2 consists of 107 nodes
Stiffness properties have been calculated considering thedifferent life phases of the steel-concrete compositestructure
(1) Phase1 (P1) the construction phase in which steelgirders only contribute to resistance loads due togirders and deck self-weight are applied
(2) Phase2 (P2) the short-term phase in which theconcrete deck contributes to section resistance(modular ratio n0 618 according to [47]) deadloads are applied
(3) Phase3 (P3) the long-term phase in which theconcrete deck contributes to section resistance(modular ratio nL 1705 [47]) dead and live loadsare applied
+erefore for each model (G1 and G2) three differentmodel variants are considered corresponding to the first thesecond and the third phases (G1-1 G1-2 G1-3 G2-1 G2-2and G2-3) +e effect of shrinkage is neglected as shrinkage-reducing admixtures are used for the deck concrete
33 Load Analysis To properly describe the probabilisticnature of traffic loads the load cases (self-weight dead andvariable loads) have been treated separately
Self-weights correspond to the weight of the reinforcedconcrete slabs and the steel girders +e dead loads include theweight of the pavement the guard rail and the parapet +efirst one is a uniformly distributed load while the other onesare concentrated loads Variable loads are traffic loads andthermal fluctuation +e seismic action has not been consid-ered at this stage of the work
According to European guidelines [48 49] differenttraffic load models are considered as follows
Road traffic loads
4 Advances in Civil Engineering
(i) Load model 1 (LM1) concentrated and uniformlydistributed loads which cover most of the eects ofthe trac of lorries and cars
(ii) Load model 2 (LM2) a single-axle load applied onspecic tyre-contact areas which represents anexceptionally heavy vehicle and also the dynamiceects of the normal trac on short structuralmembers
Actions on footways
(i) Uniformly distributed load (UDL) a uniformlydistributed load equal to 5 kNm2 for globalverications
(ii) Concentrated load (CL) a concentrated load on asquare imprint having a 01m side equal to 10 kNfor local verications
In LM1 the roadway is divided into 3 equivalent lanes3m wide Any equivalent lane contains a distributed loadacting over the whole lane width and two distributed loadsrepresenting wheels of heavy vehicles acting in a 04m sidesquare imprint to be diused till half the deck thicknessLM2 consists of two 200 kN loads on footprints of06mtimes 035m 2m spaced to be diused till half the deckthickness e worst load position along the roadway has tobe considered Values of lane loads heavy vehicles wheelloads number of equivalent lanes and any other details onload models are given in [49]
For the deck analysis the self-weight the dead loads andthe load models LM1 LM2 UDL and CL are consideredFigure 6 shows the applied loads for design alternative D1(Figure 6(a)) and for design alternative D2 (Figure 6(b)) Forthe girder analysis the following types of loads are
030m 050m25m
3m3m 3m
(a)
026m 046m
7m
3m
(b)
Figure 2 Cross sections of the two bridge design alternatives (D1 and D2)
45m 60m 65m 55m 60m 60m 66m 50m 60m 30m
(a)
44m 60m 60m 50m 55m 55m 60m 71m 70m 50m
(b)
Figure 3 Longitudinal sections with span length of the two bridge design alternatives (G1 and G2)
0 05 1 15 2 25 3 35 4 45 5 55 6 65 7 75 8 85 9 95 10 105 11 115 12 125x (m)
SupportsJointsFrames
(a)
0 05 1 15 2 25 3 35 4 45 5 55 6 65 7 75 8 85 9 95 10 105 11 115 12 125x (m)
SupportsJointsFrames
(b)
Figure 4 Schematic representation of the deck FE models in the two design alternatives (a) Alternative 1 D1 (b) Alternative 2 D2
Advances in Civil Engineering 5
considered acting on girders the self-weight of deck andgirder the trac loads (LM1) the thermal action and thetransverse loads due to wind Deck self-weight and tracloads are applied to the girders by computing the constraintreactions acting on the deck e analyses with LM1 in alimited number of spans have been omitted at this stage ofthe work since considering the favourable eect of LM1would lead to a signicant increase in the number of loadcases and would not give an important contribution in theperspective of comparing dierent design alternatives
Figure 7 shows the applied loads for design alternativeG1 (Figure 7(a)) and for design alternative G2 (Figure 7(b))e applied loads depend on the construction phase in P1only the girder and deck self-weight are considered while inP2 and P3 dead loads trac loads thermal action andtransverse loads are also taken into account Trac loads anddeck self-weight produce dierent constraint reactions inG1 the symmetrical component of the reactions produces auniform bending of the box girder while the antisymmetricalone produces a torsion in G2 the reactions produce a
0 50 100 150 200 250 300 350 400 450 500 550y (m)
SupportsJointsFrames
(a)
0 50 100 150 200 250 300 350 400 450 500 550y (m)
SupportsJointsFrames
(b)
Figure 5 Schematic representation of the girder FE models in the two design alternatives (a) Alternative 1 G1 (b) Alternative 2 G2
Self-weight
Dead loads
Load model LM1
Load model LM2
UDL on footways
CL on footways
Global traffic scheme
(linear add)
Self-weight
Load model LM1
UDL on footways
Load model LM2Local traffic scheme
(envelope)CL on footways
Torque
Distributed torque
Thermal gradient
Concentrated load
Distributed load
Mobile concentrated loads
Dead loads
(a) (b)
Figure 6 Schematic representation of the applied loads for the deck analysis (a) Alternative 1 D1 (b) Alternative 2 D2
6 Advances in Civil Engineering
uniform bending of the girders Transverse loads consist inwind force and spin-dryer force applied by the vehiclesrunning the 545m radius curve ey produce a torsionalmoment due to the eccentricity between the point of ap-plication of the load and the geometric center of the deckthat results in torque in the box girder in G1 and in auniformly distributed vertical load on the girders in G2given by the global torsion divided by the girdersrsquo distance
34 Random Variables and Degradation Model With theaim of computing failure probabilities it is necessary toconsider the probabilistic nature of strength properties andloads and the uncertainties in geometrical properties of themembers Without loss of generality of the procedure inorder to comply with the Hasofer-Lind hypothesis (Section22) all the random variables are assumed as normallydistributed As the main purpose of the application of theprocedure is the comparison between dierent design al-ternatives the simplied assumption of normally distributedrandom variables has been regarded as appropriate for theproblem at hand in the understanding that adopting dif-ferent probability distributions would not signicantly aectthe result
For some quantities a degradation model is adopted toreproduce the progressive decrease of mechanical charac-teristics due to damage In this application in order toaccount for corrosion mechanisms the damage is consid-ered to aect the steel rebarsrsquo yield strength (fy) the area(As) and the steel girder yield strength (fg)e degradation
is represented by the following simplied relationships[50ndash52]
As(t) 1minus δAs(t)[ ]As0 (4)
fy(t) 1minus δfy(t)[ ]fy0 (5)
fg(t) 1minus δfg(t)[ ]fg0 (6)
Es(t) 1minus δEs(t)[ ]Es0 (7)
where δAs δfs
δfg and δEs are dimensionless damage in-
dexes which provide a measure of the damage level withinthe range [0 1] and As0 fy0 fg0 and Es0 are the initialvalues of the deteriorating variablese evolution with timeof the damage indexes depends on the degradation processWithout loss of generality dierent degradation modelscould be included in the procedure to describe the inherentcomplexity of the damage processes Nonetheless whencomparing dierent design alternatives the choice of arelatively simple model seems to be justiable [52]
It is assumed that δAs δfs
δfg δEs δ computed as
δ ω(1minusρ)τρ τ leω
1minus(1minusω)(1minusρ)( )(1minus τ)ρ ωlt τ lt 11 τ ge 1
(8)
Steel girder self-weight(a) (b)
Concrete self-weight
Dead loads
Global traffic scheme (LM1 + UDL)
Wind
Thermal gradient
Torque
Distributed torque
Thermal gradient
Concentrated load
Distributed load
Mobile concentrated loads
Steel girder self-weight
Concrete self-weight
Global traffic scheme (LM1 + UDL)
Wind
Thermal gradient
Dead loads
Figure 7 Schematic representation of the applied loads for the girder analysis (a) Alternative 1 G1 (b) Alternative 2 G2
Advances in Civil Engineering 7
where ω 075 ρ 15 τ tT1 and T1 150 years whichis the time instant in which the failure threshold is reachedFigure 8(a) shows the coefficient δ as a function of time t andFigure 8(b) shows the decrease of As with time (equation(5))
Table 1 summarizes the parameters of the probabilisticdistribution of random variables (mean values and standarddeviations) that are used in this study +e parameters ofvariables 1 to 5 are taken from the probabilistic model code[53] while all the other parameters are taken from theliterature [17 29] For time-dependent variables (from 1 to 3in Table 1) the mean values of the distributions evolveaccording to equations (5)ndash(8) +e standard deviations areconsidered as constant with time
Since the loads vary around nominal (mean) values theinternal forces obtained through the structural analysis varyaccordingly +e envelopes of the deformed shape of theshear forces and of the bending moments obtained byvarying the positions of the traffic loads along the deck andthe girder are computed from the FE models for each loadcase and for each one of the three construction phasesFigure 9 shows sample envelopes of the shear forces andbendingmoments in the deck corresponding to the envelopeof LM2 and CL for both design alternatives D1 and D2 +euncertainty in load characterization leads to variation of theenvelope diagrams around the mean value
35 Limit State Equations
351 Deck Limit States +e achievement of the ultimatebending moment and the ultimate shear force are the limitstates taken into account for the reliability analysis of the deck
+e limit state function for bending is computed in anysection of the deck as follows
gDM(x) As(x)fy(x)09d(z)minus1113944
iM
Di (x) (9)
where the coordinate x identifies the position along thetransverse section As is the area of rebars fy is the tensileyield stress and MD
i is the bending moment due to load casei on deck d is given by
d(x) H(x)minus cminusΔc (10)
where H is the section depth c is the nominal value for theconcrete cover that is 1 cm for lower reinforcements (due tothe presence of predalles) and 4 cm for upper re-inforcements and Δc is a random variable expressingfluctuation of the concrete cover All the items in equations(9) and (10) are random variables except for H and c that areassumed as deterministic
Table 1 Random variables used in the case study
No Variable Symbol Mean value CoV1 Steel bar yield strength fy0 570MPa 00522 Steel bar area As0 Nominal value 00203 Steel girder yield strength fg0 38126MPa 00704 Deviation from concrete cover measure Δc 1 cm 10005 Concrete compression strength fc 3655MPa 01806 Internal forces due to deck self-weight VD
1 MD1 Nominal values 0010
7 Internal forces due to deck dead loads VD2 MD
2 Nominal values 00258 Internal forces due to deck traffic loads VD
3 MD3 Nominal values 0200
9 Internal forces due to girder self-weight VG1 MG
1 TG1 Nominal value 0080
10 Internal forces due to girder dead loads VG2 MG
2 TG2 Nominal value 0025
11 Internal forces and deflection due to global trafficloads VG
3 MG3 TG
3 DG3 Nominal values 0200
12 Internal forces and deflection due to wind VG4 MG
4 TG4 DG
4 Nominal values 020013 Internal forces and deflection due to thermal action VG
5 MG5 DG
5 Nominal values 0200
0 50 100 150 200t
0
02
04
06
08
1
δ(t)
(a)
0 50 100 150 200t
0
02
04
06
08
1
As(t
)A
s0
(b)
Figure 8 Degradation model as a function of time (t) (a) and representation of the decrease of As with time expressed in years (b)
8 Advances in Civil Engineering
e limit state function for shear is computed adoptingthe shear strength for concrete beams without stirrups takenfrom the Eurocode 2 [46] given by
gDV(x) 018 1 +
200d(x)
radic
100As(x)fc
d(x)b3
radic
bd(x)
minussumi
VDi (x)
(11)
where b is the width of the section fc is the concretecompression strength and VD
i is the shear force due to loadcase i acting on the deck e random variables involved inequation (11) are d(z) As fc and VD
i
352 Girders Limit States For girders analysis three limitstates have been considered ultimate bending ultimateshear (shear-torsion for model G1) and excessive debrvbarectionin long-term conditions (P3)
Bending strength corresponds to yield deformation ofsteel sections e corresponding limit state equation can bewritten as follows
gGM(y) MGy (y)minussum
i
MGi (y) (12)
where the coordinate y identies the position on the lon-gitudinal section MG
i is the bending moment due to loadcase i on girders andMG
y is the ultimate bending moment atyield deformation e value ofMG
y depends on which partof the girder reaches the yield deformation rst (concrete orsteel) It in turn depends on the position of the neutral axisthat does not depend on the applied stresses in the elasticeld Furthermore if steel reaches the yield deformationbefore concrete only the loads applied to steel have to beconsidered (ie steel-concrete self-weight) us for MG
y the following equations can be used
MGy (y) fs minus
Σ2i1MGi (y)( )ys(y)Js(y)
[ ]JLT(y)zLT(y)
for zLT(y)lt zcr(y)
MGy (y) fcn
JLT(y)Hminus zLT(y)
for zLT(y)gt zcr(y)
(13)
where fs is the steel girdersrsquo yield stress fc is the concretecompression strength n is the modular ratio H is the totalsteel-concrete section height zcr is the neutral axis positionfor which top concrete and bottom steel reach the ultimatedeformation and yield deformation respectively zs and Jsare the neutral axis and moment of inertia of the steelsection and zLT and JLT are the neutral axis and moment ofinertia for steel-concrete section homogenized with the longterm modular ratio Random variables involved in thegirdersrsquo bending limit state are fc fs and MG
i Shear limit state for girders can be expressed as follows
gGV(y) VGR(y)minussum
i
VGi (y) (14)
whereVGi is the shear due to load case i on girders andVG
R isthe shear strength e value of VG
R is dierent in both al-ternatives because in ordinary double-T girders only theweb contributes to resistance while in the box sections thetorque inbrvbaruence is not negligibleus forVG
R the followingexpressions have been assumed
VGR(y)
fsAv(y)3
radic 1minus3
radicsumiTG
i (y)2Ω(y)fst(y)
( ) for G1
VGR(y)
Av(y)fs3
radic for G2
(15)
wherefGy is the steel yield stressAv is the shear area dierent
for both alternativesTGi (x) is the torque at x-position due to
load case i Ω is the area inside the average line in thickness
0 2 4 6 8 10 12x (m)
200
100
0
ndash100Be
ndin
g m
omen
t (kN
m)
MD1min
MD1min
MD2min
MD2min
(a)
0 2 4 6 8 10 12x (m)
ndash120
ndash40
40
120
Shea
r (kN
)
VD1min
VD1min
VD2min
VD2min
(b)
Figure 9 Envelopes of the bending moment and shear force in the deck for the two design alternatives (D1 and D2)
Advances in Civil Engineering 9
of box sections and t is the web thickness where shearstresses are maxima Random variables involved in thegirdersrsquo shear limit state are fs VG
i and TGi
Deformability limit state concerns deflections due tovariable load that in long terms leads to road surface damage+e limit state equation for deformability is the following
gD(y) L
350minus1113944
i
Di(y A) (16)
where Di is the deflection due to the load case i (LM1 UDLwind and thermal load) at y-position on girders dependingon Es (steel stiffness module) and JLT (moment of inertia)Random variables involved in the girdersrsquo deformabilitylimit state is Di
36 Cost Analysis Total expected life-cycle cost is computedaccording to equations (1) and (2) A discount rate r 005is adopted
361 Initial Costs +e initial cost CI is taken from quantitysurveys of the two design alternatives Tables 2 and 3summarize the initial costs of the two design alternativesfor the deck and girders respectively
362 Repair Costs For the computation of the repair costsonly direct costs are considered as it is assumed that indirectrepair costs are almost the same in the two designalternatives
Expected values of direct repair costs E[CR(t)] are de-fined as in equation (2) +e repair cost of a structural el-ement for damage related to the j-th limit state can becomputed as a fraction α of the initial cost CI as follows
cRj αCI (17)
+e cost cRj is considered as a unit cost referred to areference length Lj across the considered section Withoutloss of generality it is assumed Lj 2 m for the limit statesrelated to the deck and Lj 12 m for the limit states relatedto the girders +e coefficient α is taken to be equal to 02 forthe deformability limit state and equal to 11 for all otherlimit states to account also for disposal costs [54]
4 Results of the Reliability Analysis
+e reliability index is computed according to the FORMmethod as illustrated in Section 22 At first the degradationof the materials is neglected and the failure probability isconsidered to be independent of time
With reference to the deck model β is computed for eachoutput node along the transverse section and for the twodesign alternatives (D1 and D2) Figure 10 compares theenvelopes of the reliability indexes at any reference sectionfor the bending moment limit state (Figure 10(a)) and shearlimit state (Figure 10(b)) for D1 and D2 It is possible toobserve that the design alternative D2 has smaller reliabilityindex for both bending and shear limit states+e shear limitstate is the one providing a smaller reliability index +e β
diagrams do not have the same trend as the internal forces(cf Figure 9) because β locally depends on the re-inforcement +is result highlights that the main advantageof the proposed procedure is its ability to provide localreliability indexes and therefore to locally check theachievement of a limit state Indeed as it can be seen fromFigure 9 it may happen that the reliability index exhibitslocal or global minima in sections where there is a change ingeometry or reinforcements
Regarding the girder model β is computed for eachoutput node and for the two design alternatives (G1 and G2)Figure 11 shows the envelopes of the minimum reliabilityindex at any reference section for the bending moment limitstate (Figure 11(a)) shear limit state (Figure 11(b)) anddeformability limit state (Figure 11(c)) Also for the girderanalysis it can be inferred that the design alternative G2 has asmaller reliability index +e different positions of localmaxima in the graphs are due to the different lengths of thefree spans in the two design alternatives (Figure 3) +ebending limit state is the one leading to a smaller reliabilityindex
Table 4 summarizes the minimum β indexes with thecorresponding failure probabilities Pf for the analyzed limitstates and the two design alternatives It also reported theposition from the left bound of the structure x (for the deck)and y (for the girder) at which the minimum β (maximumfailure probability) occurs
In order to highlight the effect of considering thematerialsrsquo degradation the reliability analysis has beenrepeated by taking into account the time-dependentrandom variables as in equations (5)ndash(8) Figure 12shows the β indexes for deck bending and shear limitstates at the initial construction time (t = 0) and after 30and 60 years It can be observed that the β index signif-icantly decreases with time While in alternative D2 justafter construction (t = 0) the smallest reliability index is
Table 2 Initial costs of the two design alternatives for the deck
Cost item Cost in alternative 1(euro)
Cost in alternative 2(euro)
Construction 695509 1011634Safety burdens 52017 102348Terrain purchase 12378 12378Testing 20865 30349Design 48685 70814Total initial costCI
829454 1227523
Table 3 Initial costs of the two design alternatives for the girders
Cost item Cost inalternative 1 (euro)
Cost inalternative 2 (euro)
Construction 4673660 3331431Safety burdens 349548 337046Terrain purchase 83182 83182Testing 140209 99942Design 327156 233200Total initial cost 5573755 4084801
10 Advances in Civil Engineering
for shear after 60 years the bending becomes the limitstate providing the smallest level of safety β changes withthe increase in time Similar results can be inferred fromFigure 13 showing the evolution with time of the β indexesfor bending shear and deformability limit states at theinitial construction time (t = 0) and after 30 and 60 yearse decrease with time of the reliability indexes related tobending and shear limit states is greater than that relatedto deformability Table 5 summarizes the minimum βindexes for the two design alternatives and for the dif-ferent analyzed lifetimes After 60 years the β indexes ofsome limit states drop below values considered un-acceptable by technical standards (corresponding tofailure probabilities higher than 10minus5) e result is strictlydependent on the damage model chosen to representmaterialrsquos degradation highlighting the need of correctlypredicting the evolution of damage in the specic siteconditions e results in terms of local reliability indexemphasize the utility of the proposed procedure inidentifying the most critical locations and limit stateswith the main aim to decide the priority of interventionthat is strongly dependent on the structural details of thedeck and on the materialrsquos degradation model
5 Results of the Cost Analysis
In this Section the total expected life-cycle cost is computedtrough the proposed procedure based on the results of thereliability analysis Maintenance costs are neglected as theydo not vary signicantly in the two design alternativeserefore without loss of generality equation (1) is sim-plied as follows
E C tl( )[ ] CI +sumtl
t1
E CR(t)[ ](1 + r)t
(18)
e time-dependent probabilities of failure Pfjk(t) areused to compute the expected repair costs according toequation (2) Figure 14 shows the expected repair costs overits lifetime for the deck (a) and the girder (b) for the twodesign alternatives It can be observed that the repair costsare higher for design alternative 2 for lifetimes higher thanabout 60 years is is due to the higher failure probabilities
that pertain to D2 and G2 with respect to D1 and G1 ashighlighted in Figures 12 and 13 Figure 15 shows the ex-pected total costs as a function of lifetime in the two designalternatives In particular Figure 15(a) compares the initialand total expected repair costs for the two alternatives andFigures 15(b) and 15(c) show the total cost increase withrespect to the initial cost for the two design alternatives It ispossible to observe that the increase in cost with respect toinitial costs is much higher for design alternative 2 How-ever for lifetimes lower than about 95 years alternative 2 isthe most economic as the total expected cost is smaller thanthat in alternative 1 Conversely for lifetimes greater thanabout 95 years the total expected cost is greater for alter-native 2 Indeed if the costs are evaluated in a life-cycleperspective a design solution initially considered the mosteconomic can reveal to be the most expensive e pro-cedure gives quantitative information to decide which is themost eective solution from the life-cycle cost point of viewhighlighting at the same time which are the deck and girdercross sections where maintenance interventions are neededwith priority
6 Parametric Analysis
In order to study the inbrvbaruence of the degradation modeldescribed in equations (5)ndash(8) a parametric analysis iscarried out by varying the time corresponding to the failurethreshold T1 from 100 to 250 years with ω 075 andρ 15 e following degradation models (DM) are ana-lyzed and compared DM1 with T1 100 DM2 withT1 150 DM3 with T1 200 and DM4 with T1 250
Moreover to account for the fact that corrosion can havea dierent eect on the steel area reduction As with respectto other mechanical parameters like fy fg and Es anadditional model (DM5) is introduced in the analysis In thislast case according to equation (8) the damage index δAs
isevaluated by considering T1 150 while δfs
δfg and δEs
areevaluated with T1 250
Numerical results reported in Table 6 summarize theminimum values of β for the two design alternatives and for t 30 years obtained for dierent degradation models It canbe observed that the degradation model has a signicant
0
β
1 2 3 4 5 6 7 8 9 10 11 12x (m)
6
9
12
15
18
21
SupportsD1
SupportsD2MD1
MD2
(a)
β
0 1 2 3 4 5 6 7 8 9 10 11 12x (m)
48
52
56
6
SupportsD1
SupportsD2VD1
VD2
(b)
Figure 10 Reliability index β for the deck in the two design alternatives related to the bending limit state (a) and to the shear limit state (b)
Advances in Civil Engineering 11
0 100 200 300 400 500y (m)
β
5
7
9
11
13
15
SupportsG1
SupportsG2MG1
MG2
(a)
β
0 100 200 300 400 500y (m)
89
101112131415
SupportsG1
SupportsG2VG1
VG2
(b)
β
SupportsG1
SupportsG2DG1
DG2
0 100 200 300 400 500y (m)
0
20
40
60
80
100
(c)
Figure 11 Reliability index β for girders in the two design alternatives related to the bending limit state (a) to the shear limit state (b) andto the deformability limit state (c)
Table 4 Results of the reliability analysis for the two design alternatives
Limit state D1 D2β Pf x β Pf x
Bending deck 1239 137eminus 35 475 808 320eminus 16 375Shear deck 510 164eminus 07 475 502 249eminus 07 978
Limit state G1 G2β Pf y β Pf y
Bending girder 688 303eminus 12 49100 548 213eminus 08 49466Shear girder 1274 177eminus 37 34530 806 388eminus 16 53964Deformability girder 1181 169eminus 32 37860 1050 440eminus 26 41894
12 Advances in Civil Engineering
β
1 2 3 4 5 6 7 8 9 10 11 12x (m)
0
5
10
15
20
0
SupportsD1t=0 years
D1t=30 yearsD1t=60 years
(a)
β
0 1 2 3 4 5 6 7 8 9 10 11 12x (m)
0
5
10
15
20
SupportsD2t=0 years
D2t=30 yearsD2t=60 years
(b)
β
0 1 2 3 4 5 6 7 8 9 10 11 12x (m)
45
5
55
6
SupportsD1t=0 years
D1t=30 yearsD1t=60 years
(c)
β
0 1 2 3 4 5 6 7 8 9 10 11 12x (m)
45
5
55
6
SupportsD2t=0 years
D2t=30 yearsD2t=60 years
(d)
Figure 12 Reliability index for the deck for dierent lifetimes
SupportsG1t=0 years
G1t=30 yearsG1t=60 years
0 100 200 300 400 500y (m)
β
0369
1215
(a)
SupportsG2t=0 years
G2t=30 yearsG2t=60 years
β
0 100 200 300 400 500y (m)
0369
1215
(b)
SupportsG1t=0 years
G1t=30 yearsG1t=60 years
β
0 100 200 300 400 500y (m)
579
111315
(c)
SupportsG2t=0 years
G2t=30 yearsG2t=60 years
β
0 100 200 300 400 500y (m)
579
111315
(d)
Figure 13 Continued
Advances in Civil Engineering 13
inbrvbaruence on the reliability index In particular as the failuretime threshold T1 increases the reliability index conse-quently increases e degradation model has greater in-brvbaruence on reliability related to bending than on reliabilityrelated to shear or deformability e eect of dierentdegradation models on life-cycle costs is also investigatedFigure 16 depicts the expected repair costs for design al-ternatives 1 and 2 considering the ve deterioration modelsand dierent lifetimes (t = 60 80 and 100 years) It ispossible to observe the signicant inbrvbaruence of the choice ofthe degradation model on the estimated repair cost whichrebrvbarects the expected inbrvbaruence of the degradation rate on therepair costs also highlighting that repair costs are stronglyinbrvbaruenced by the aggressiveness of the environment
7 Conclusions
epresent paper has proposed a procedure for the life-cyclecost analysis of road girder bridges e life-cycle cost isrelated to the failure probability which is locally and au-tomatically computed along the entire bridge deck forseveral limit states e procedure accounts in a simpliedway for material degradation by introducing the dependencyon time of several damage-dependent parameters Load andstrength parameters are considered uncertain with a normalprobability distribution Design trac actions on the bridgesuggested by international technical standards are alsoadopted considering the interaction between deck and girderloads Dierent construction phases of composite steel-
SupportsG1t=0 years
G1t=30 yearsG1t=60 years
β
0 100 200 300 400 500y (m)
020406080
100
(e)
SupportsG2t=0 years
G2t=30 yearsG2t=60 years
β
0 100 200 300 400 500y (m)
020406080
100
(f )
Figure 13 Reliability index for the girder for dierent lifetimes
Table 5 Minimum β indexes for the two design alternatives and for dierent lifetimes
Limit state t 0 year t 30 years t 60 yearsD1 D2 D1 D2 D1 D2
Bending deck 1239 808 1027 616 614 241Shear deck 510 502 504 495 483 475Limit state G1 G2 G1 G2 G1 G2Bending girder 687 548 580 446 372 230Shear girder 1274 806 1134 681 868 443Deformability girder 1181 1050 1016 894 702 596
1 11 21 31 41 51 61 71 81 91Time (years)
0
02
04
06
08
1
D1D2
Expe
cted
repa
ir co
st (M
euro)
(a)
0 10 20 30 40 50 60 70 80 90 100Time (years)
0
01
02
03
04
05
G1G2
Expe
cted
repa
ir co
st (M
euro)
(b)
Figure 14 Expected repair costs over a lifetime for the deck (a) and the girder (b) for the two design alternatives
14 Advances in Civil Engineering
Table 6 Minimum β indexes for the two design alternatives and for t 30 years for dierent degradation models
Limit state DM1 DM2 DM3 DM4 DM5D1 D2 D1 D2 D1 D2 D1 D2 D1 D2
Bending deck 869 472 1027 616 1120 684 1141 719 1099 673Shear deck 497 489 504 495 507 498 508 499 504 495Limit state G1 G2 G1 G2 G1 G2 G1 G2 G1 G2Bending girder 500 362 580 446 627 483 638 502 634 501Shear girder 1032 589 1134 681 1195 725 1209 748 1209 748Deformability girder 895 779 1016 894 1088 948 1104 977 1104 977
0 10 20 30 40 50 60 70 80 90 100Time (years)
5
55
6
65
7
75
CI1
E[C(tl)]1
Expe
cted
tota
l cos
t (M
euro)
CI2
E[C(tl)]2
(a)
0 20 40 60 80 100Time (years)
0
0002
0004
0006
0008
001
0012
0014
0016
0018
Cos
t inc
reas
e (
)
(b)
0 20 40 60 80 100Time (years)
0
0025
005
0075
01
0125
015
0175
02
0225
025
Cos
t inc
reas
e (
)
(c)
Figure 15 (a) Expected total costs of the two design alternatives compared with the corresponding initial costs (b) total cost increase withrespect to initial cost in design alternative 1 and (c) and total cost increase with respect to initial cost in design alternative 2
DM1 DM2 DM3 DM4 DM50
2
4
6
8
10
12
14
16
18
t = 60t = 80t = 100
Expe
cted
repa
ir co
st (M
euro)
(a)
DM1 DM2 DM3 DM4 DM50
2
4
6
8
10
12
14
16
18
t = 60t = 80t = 100
Expe
cted
repa
ir co
st (M
euro)
(b)
Figure 16 Expected repair costs for dierent deterioration models and for t 60 80 100 (a) design alternative 1 and (b) design alternative 2
Advances in Civil Engineering 15
reinforced concrete beams are analyzed Reliability analysisis carried out for all the considered limit states and incorrespondence of each location along the deck and thegirder to provide local values of the reliability index andfailure probability +e procedure is applied to a case studyof a road bridge for which in the design phase two differentdesign alternatives were proposed Results show that thereliability index is strongly dependent on the consideredlimit state and on the structural details of the deck thusemphasizing the importance of the local reliability assess-ment in order to estimate the priority and timing of in-terventions +e computation of the expected life-cycle costallows a quantitative comparison between the two differentdesign alternatives in a life-cycle perspective +e choice ofthe most economic solution strongly depends of the lifetimeexpected for the structure and on the degradation modeladopted to account for materialrsquos deterioration
Data Availability
+e numerical data used to support the findings of this studyare available from the corresponding author upon request
Conflicts of Interest
+e authors declare that they have no conflicts of interest
References
[1] C Liu Y Gong S Laflamme B Phares and S Sarkar ldquoBridgedamage detection using spatiotemporal patterns extractedfrom dense sensor networkrdquo Measurement Science andTechnology vol 28 no 1 article 014011 2016
[2] Y K Wen and Y J Kang ldquoMinimum building life-cycle costdesign criteria I Methodologyrdquo Journal of Structural Engi-neering vol 127 no 3 pp 330ndash337 2001
[3] D M Frangopol Y Dong and S Sabatino ldquoBridge life-cycleperformance and cost analysis prediction optimisation anddecision-makingrdquo Structure and Infrastructure Engineeringvol 13 no 10 pp 1239ndash1257 2017
[4] D M Frangopol ldquoLife-cycle performance management andoptimisation of structural systems under uncertainty ac-complishments and challenges1rdquo Structure and InfrastructureEngineering vol 7 no 6 pp 389ndash413 2011
[5] N Okasha andDM Frangopol ldquoComputational platform forthe integrated life-cycle management of highway bridgesrdquoEngineering Structures vol 33 no 7 pp 2145ndash2153 2011
[6] L Ierimonti L Caracoglia I Venanzi and A L MaterazzildquoInvestigation on life-cycle damage cost of wind-excited tallbuildings considering directionality effectsrdquo Journal of WindEngineering and Industrial Aerodynamics vol 171 pp 207ndash218 2017
[7] L Gao Y Li and J Hu ldquoLife-cycle cost framework analysisfor a bridgerdquo WIT Transactions on the Built Environmentvol 140 pp 85ndash88 2013
[8] D M Frangopol and M Soliman ldquoLife-cycle of structuralsystems recent achievements and future directionsrdquo Structureand Infrastructure Engineering vol 12 no 1 pp 1ndash20 2015
[9] S-H KimM-S Choi K-I Cho and S-J Park ldquoDeterminingthe optimal structural target reliability of a structure with aminimal life-cycle cost perspectiverdquo Advances in StructuralEngineering vol 16 no 12 pp 2075ndash2091 2016
[10] M Stewart ldquoReliability-based assessment of ageing bridgesusing risk ranking and life cycle cost decision analysesrdquoReliability Engineering and System Safety vol 74 no 3pp 263ndash273 2001
[11] C D Eamon E A Jensen N F Grace and X Shi ldquoLife-cyclecost analysis of alternative reinforcement materials for bridgesuperstructures considering cost and maintenance un-certaintiesrdquo Journal of Materials in Civil Engineering vol 24no 4 pp 373ndash380 2012
[12] K Ozbay D Jawad N Parker and S Hussain ldquoLife-cycle costanalysis State of the practice versus state of the artrdquo Trans-portation Research Record vol 1864 no 1 pp 62ndash70 2004
[13] M Akiyama D M Frangopol and K Takenaka ldquoReliability-based durability design and service life assessment of rein-forced concrete deck slab of jetty structuresrdquo Structure andInfrastructure Engineering vol 13 no 4 pp 468ndash477 2016
[14] L Ierimonti I Venanzi and L Caracoglia ldquoLife-cycledamage-based cost analysis of tall buildings equipped withtuned mass dampersrdquo Journal of Wind Engineering and In-dustrial Aerodynamics vol 176 pp 54ndash64 2018
[15] Y K Wen ldquoMinimum lifecycle cost design under multiplehazardsrdquo Reliability Engineering and System Safety vol 73no 3 pp 223ndash231 2001
[16] I Venanzi O Lavan L Ierimonti and S Fabrizi ldquoMulti-hazard loss analysis of tall buildings under wind and seismiclaodsrdquo Structure and Infrastructure Engineering vol 14no 10 pp 1295ndash1311
[17] K-M Lee H-N Cho and Y-M Choi ldquoLife-cycle cost-effective optimum design of steel bridgesrdquo Journal of con-structional steel research vol 60 no 11 pp 1585ndash1613 2004
[18] M Jiang R Corotis and H Ellis ldquoOptimal life-cycle costingwith partial observabilityrdquo Journal of Infrastructure Systemsvol 6 no 2 pp 56ndash66 2001
[19] L Saad A Aissani A Chateauneuf and W RaphaelldquoReliability-based optimization of direct and indirect LCC ofRC bridge elements under coupled fatigue-corrosion de-terioration processesrdquo Engineering Failure Analysis vol 59pp 570ndash587 2016
[20] J J Veganzones Muntildeoz L Pettersson H Sundquist andR Karoumi ldquoLife-cycle cost analysis as a tool in the de-veloping process for new bridge edge beam solutionsrdquoStructure and Infrastructure Engineering vol 12 no 9pp 1185ndash1201 2016
[21] N Ta A Orcesi and C Cremona ldquoA comparative life-cyclecost analysis of steel-concrete composite bridgesrdquo in Life-Cycle and Sustainability of Civil Infrastructure Systems Pro-ceedings of the 3rd International Symposium on Life-CycleCivil Engineering pp 696ndash702 Vienna Austria October2012
[22] S-H Han W-S Lee and M-S Bang ldquoProbabilistic optimalsafety with minimum life-cycle cost based on stochasticfinite element analysis of steel cable-stayed bridgesrdquo In-ternational Journal of Steel Structures vol 11 no 3pp 335ndash349 2011
[23] Y S Shin J H Park and D-H Ha ldquoOptimal design of a steelbox girder bridge considering life cycle costrdquo KSCE Journal ofCivil Engineering vol 13 no 6 pp 433ndash440 2009
[24] M E Fagen and B M Phares ldquoLife-cycle cost analysis of alow-volume road bridge alternativerdquo Transportation ResearchRecord Journal of the Transportation Research Boardvol 1696 no 1 pp 8ndash13 2018
[25] M S Bang ldquoOptimal design of suspension bridge based onminimization of life cycle costrdquo Advanced Materials Researchvol 919-921 pp 577ndash582 2014
16 Advances in Civil Engineering
[26] T Garca-Segura V Yepes and D Frangopol ldquoMulti-objective design of post-tensioned concrete road bridgesusing artificial neural networksrdquo Structural and Multidisci-plinary Optimization vol 56 no 1 pp 139ndash150 2017
[27] J E Padgett K Dennemann and J Ghosh ldquoRisk-basedseismic life-cycle cost-benefit (LCC-B) analysis for bridgeretrofit assessmentrdquo Structural Safety vol 32 no 3pp 165ndash173 2010
[28] M Liu and D M Frangopol ldquoOptimizing bridge networkmaintenance management under uncertainty with conflictingcriteria life-cycle maintenance failure and user costsrdquoJournal of Structural Engineering vol 132 no 11 pp 1835ndash1845 2006
[29] S Sabatino D M Frangopol and Y Dong ldquoSustainability-informed maintenance optimization of highway bridgesconsidering multi-attribute utility and risk attituderdquo Engi-neering Structures vol 102 pp 310ndash321 2015
[30] J O Almeida P F Teixeira and R M Delgado ldquoLife cyclecost optimisation in highway concrete bridges managementrdquoStructure and Infrastructure Engineering vol 11 no 10pp 1263ndash1276 2013
[31] B Le and J Andrews ldquoPetri net modelling of bridge assetmanagement using maintenance-related state conditionsrdquoStructure and Infrastructure Engineering vol 12 no 6pp 730ndash751 2015
[32] A Cunha E Caetano F Magalhatildees andM Carlos ldquoDynamicidentification and continuous dynamic monitoring of bridgesdifferent applications along bridges life-cyclerdquo Structure andInfrastructure Engineering vol 14 no 4 pp 445ndash467 2017
[33] G Moutinho D Frangopol and M Soliman ldquoOptimizationof life-cycle maintenance of deteriorating bridges with respectto expected annual system failure rate and expected cumu-lative costrdquo Journal of Structural Engineering (United States)vol 140 no 4 article 04013043 2017
[34] A Hatami and G Morcous ldquoDeterioration models for life-cycle cost analysis of bridge decks in Nebraskardquo Trans-portation Research Record vol 2313 no 1 pp 3ndash11 2012
[35] P Liu ldquoLife cycle cost analysis of anticorrosive coating of steelbridgerdquo Advanced Materials Research vol 496 pp 121ndash1252012
[36] N M Okasha D M Frangopol F B Fletcher andA D Wilson ldquoLife-cycle cost analyses of a new steel forbridgesrdquo Journal of Bridge Engineering vol 17 no 1pp 168ndash172 2012
[37] R Bhaskaran N Palaniswamy and N Rengaswamy ldquoLife-cycle cost analysis of a concrete road bridge across open seardquoMaterials Performance vol 45 pp 51ndash55 2006
[38] D M Frangopol K-Y Lin and A C Estes ldquoLife-cycle costdesign of deteriorating structuresrdquo Journal of StructuralEngineering vol 123 no 10 pp 1390ndash1401 1997
[39] A N Kallias B Imam and M K ChryssanthopoulosldquoPerformance profiles of metallic bridges subject to coatingdegradation and atmospheric corrosionrdquo Structure and In-frastructure Engineering vol 13 no 4 pp 440ndash453 2016
[40] M Safi H Sundquist and R Karoumi ldquoCost-efficient pro-curement of bridge infrastructures by incorporating life-cyclecost analysis with bridge management systemsrdquo Journal ofBridge Engineering vol 20 no 6 article 04014083 2015
[41] M Safi H Sundquist R Karoumi and G Racutanu ldquoIn-tegration of life-cycle cost analysis with bridge managementsystemsrdquo Transportation Research Record Journal of theTransportation Research Board vol 2292 no 1 pp 25ndash1332018
[42] H S Shim and S H Lee ldquoDeveloping a probable cost analysismodel for comparing bridge deck rehabilitation methodsrdquoKSCE Journal of Civil Engineering vol 20 no 1 pp 68ndash762015
[43] P+oft-Christensen ldquoLife-cycle cost-benefit (LCCB) analysisof bridges from a user and social point of viewrdquo Structure andInfrastructure Engineering vol 5 no 1 pp 49ndash57 2009
[44] K Lee H Cho and C Cha ldquoLife-cycle cost-effective optimumdesign of steel bridges considering environmental stressorsrdquoEngineering Structures vol 28 no 9 article 12521265 2006
[45] +e MathWorks Inc MATLAB R2009b Release Note UserrsquosGUIDE +e MathWorks Inc Natick MA USA 2009
[46] European Committee for Standardization 1992-1-12005-Eurocode 2-Design of Concrete Structures-Part 1-1 GeneralRules and Rules for Buildings European Committee forStandardization 36 rue de Stassart B 1050 Brussels 2005
[47] European Committee for Standardization 1994-1-12004-Euro-code 4 Design of Composite Steel and Concrete Structures-Part 1-1 General Rules and Rules for Buildings European Committeefor Standardization 36 rue de Stassart B 1050 Brussels 2004
[48] European Committee for Standardization 1991-12003-Eurocode 1 Actions on Structures-Part 1-1 General actions-Densities Self-Weight Imposed Loads for Buildings EuropeanCommittee for Standardization 36 rue de Stassart B 1050Brussels 2003
[49] European Committee for Standardization 1991-22003-Eurocode 1 Actions on Structures-Part 1-2 Traffic Loads OnBridges European Committee for Standardization
[50] F Biondini and G Zani ldquoLife-cycle multi-objective optimi-zation of deteriorating structuresrdquo in Life Cycle Civil Engi-neering pp 285ndash291 Taylor F Group London UK 2008
[51] F Biondini and D Frangopol ldquoLife-cycle multi-objectiveoptimization of deteriorating structuresrdquo in Life Cycle CivilEngineering pp 285ndash291 Taylor F Group London UK 2008
[52] F Biondini and A Marchiondelli ldquoEvolutionary design ofstructural systems with time-variant performancerdquo Structureand Infrastructure Engineering vol 4 no 2 pp 163ndash1762008
[53] Joint Committee on Structural Safety Probabilistic ModelCode Chap Part 3 Material Properties Joint Committee onStructural Safety 2000
[54] S Noponen and A Jutila ldquoLCC case studies for bridges indifferent design phasesrdquo in Life Cycle Civil Engineeringpp 851ndash856 Taylor and Francis Group London UK 2008
Advances in Civil Engineering 17
International Journal of
AerospaceEngineeringHindawiwwwhindawicom Volume 2018
RoboticsJournal of
Hindawiwwwhindawicom Volume 2018
Hindawiwwwhindawicom Volume 2018
Active and Passive Electronic Components
VLSI Design
Hindawiwwwhindawicom Volume 2018
Hindawiwwwhindawicom Volume 2018
Shock and Vibration
Hindawiwwwhindawicom Volume 2018
Civil EngineeringAdvances in
Acoustics and VibrationAdvances in
Hindawiwwwhindawicom Volume 2018
Hindawiwwwhindawicom Volume 2018
Electrical and Computer Engineering
Journal of
Advances inOptoElectronics
Hindawiwwwhindawicom
Volume 2018
Hindawi Publishing Corporation httpwwwhindawicom Volume 2013Hindawiwwwhindawicom
The Scientific World Journal
Volume 2018
Control Scienceand Engineering
Journal of
Hindawiwwwhindawicom Volume 2018
Hindawiwwwhindawicom
Journal ofEngineeringVolume 2018
SensorsJournal of
Hindawiwwwhindawicom Volume 2018
International Journal of
RotatingMachinery
Hindawiwwwhindawicom Volume 2018
Modelling ampSimulationin EngineeringHindawiwwwhindawicom Volume 2018
Hindawiwwwhindawicom Volume 2018
Chemical EngineeringInternational Journal of Antennas and
Propagation
International Journal of
Hindawiwwwhindawicom Volume 2018
Hindawiwwwhindawicom Volume 2018
Navigation and Observation
International Journal of
Hindawi
wwwhindawicom Volume 2018
Advances in
Multimedia
Submit your manuscripts atwwwhindawicom
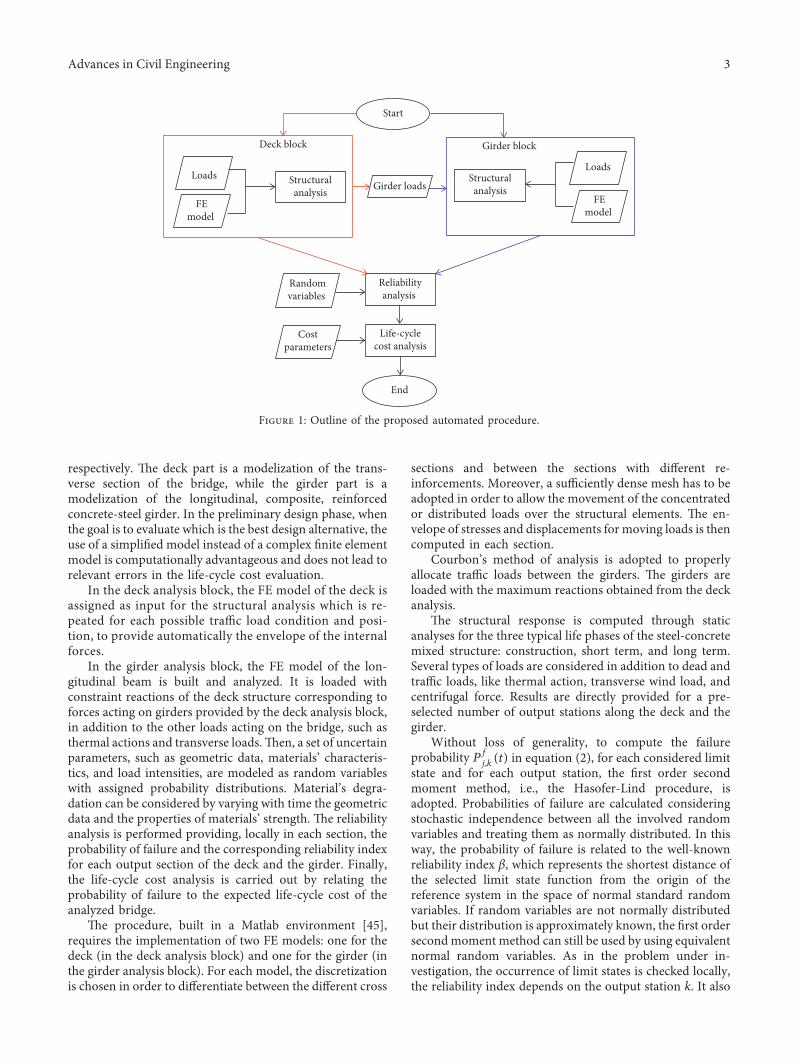
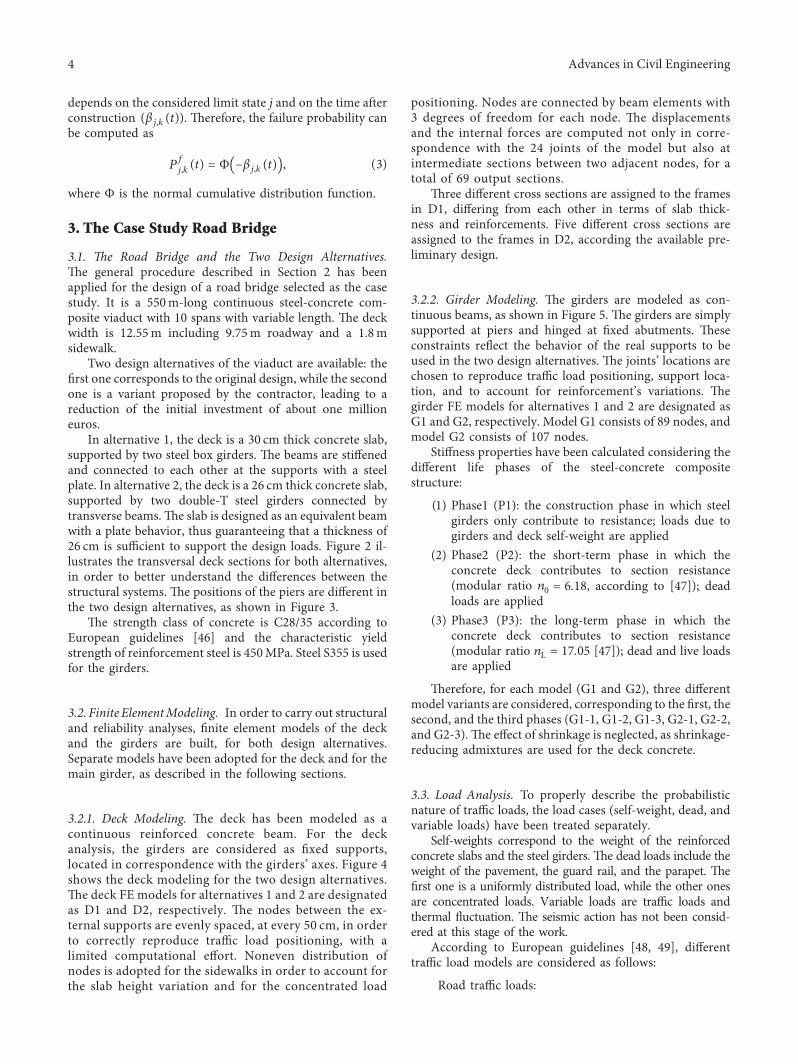
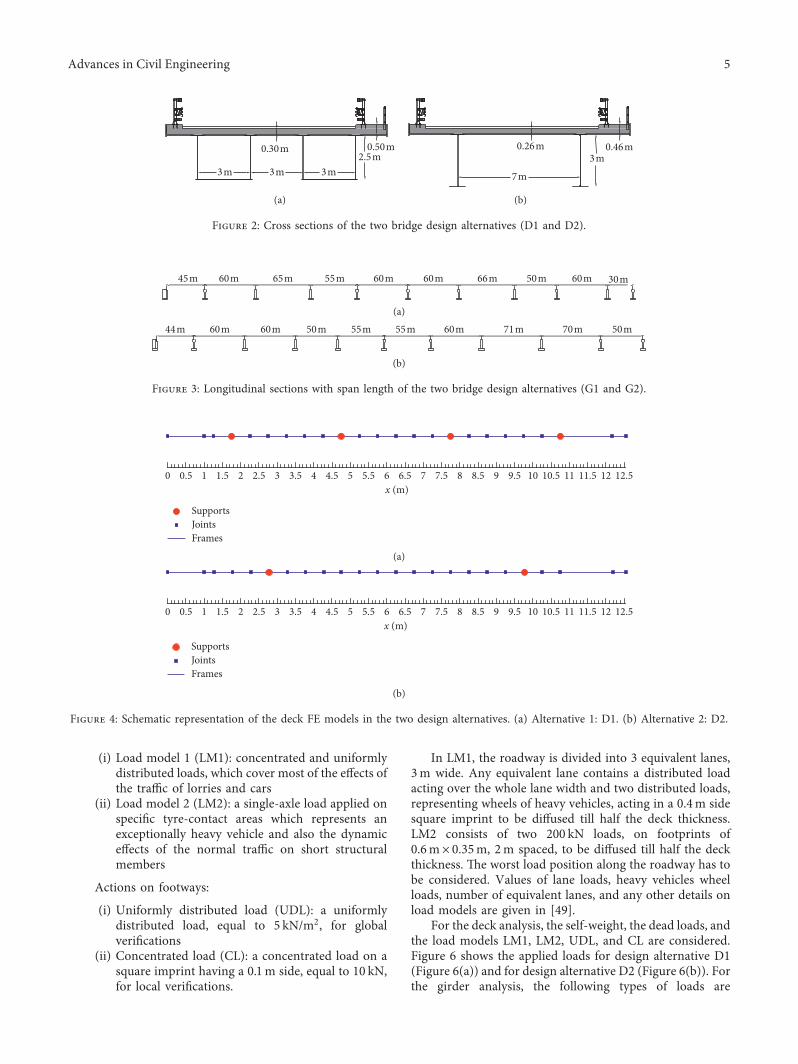
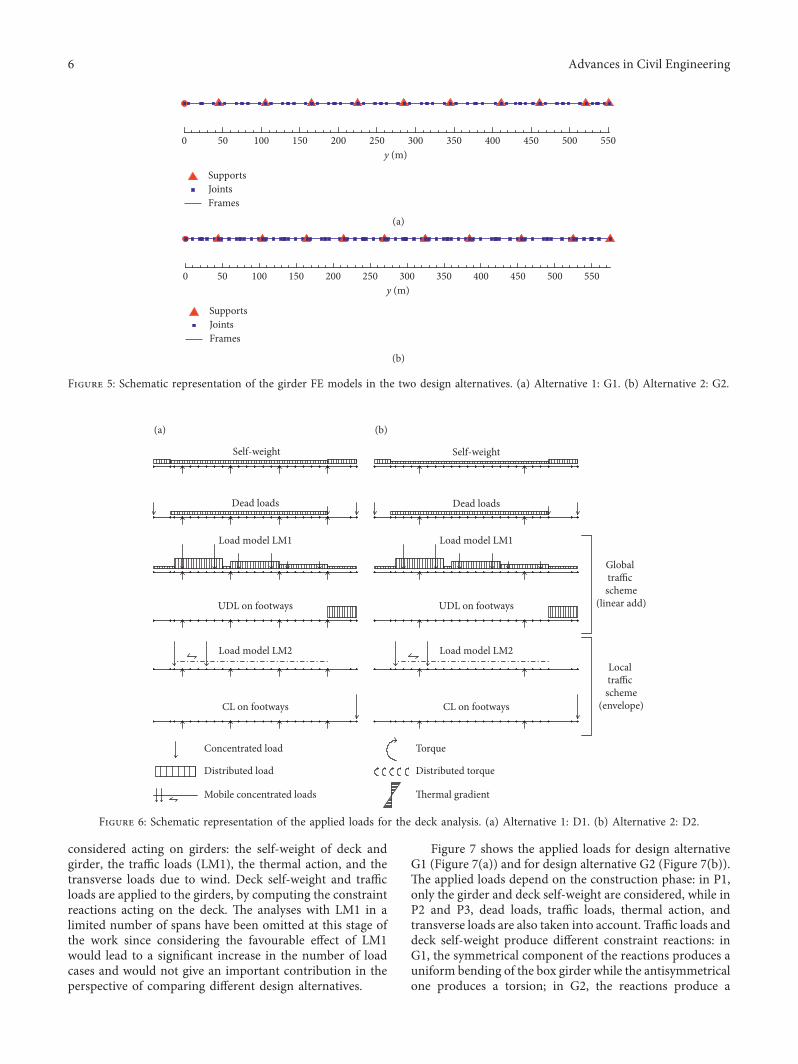
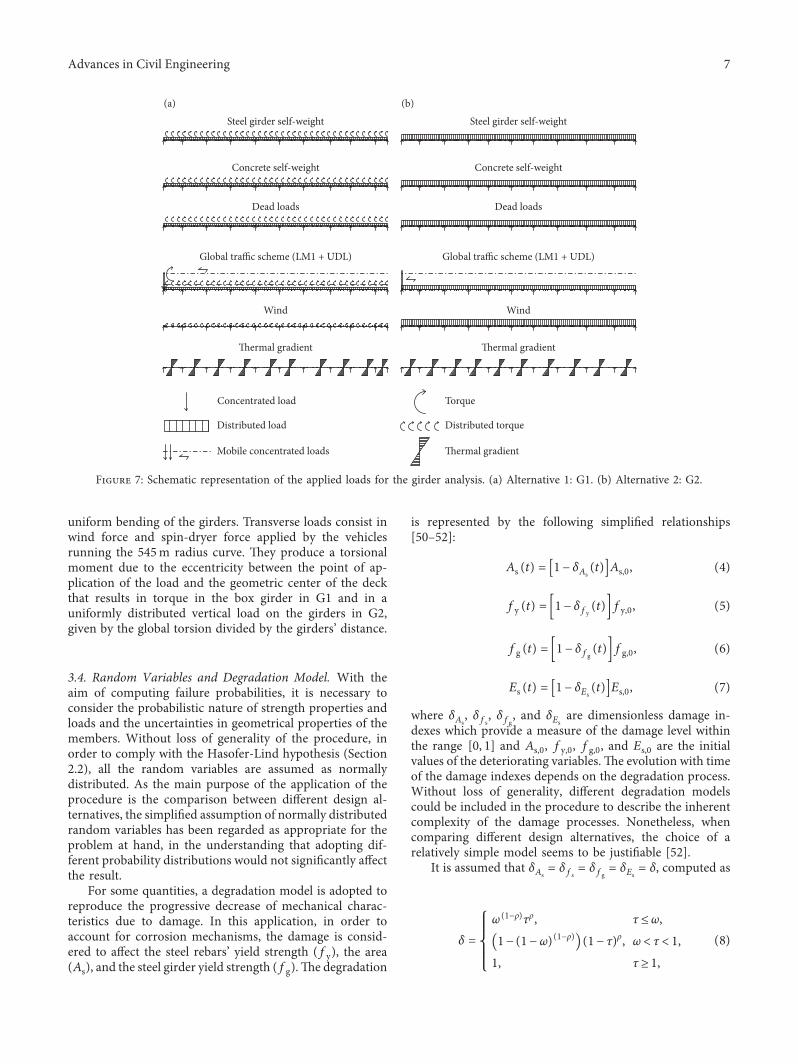
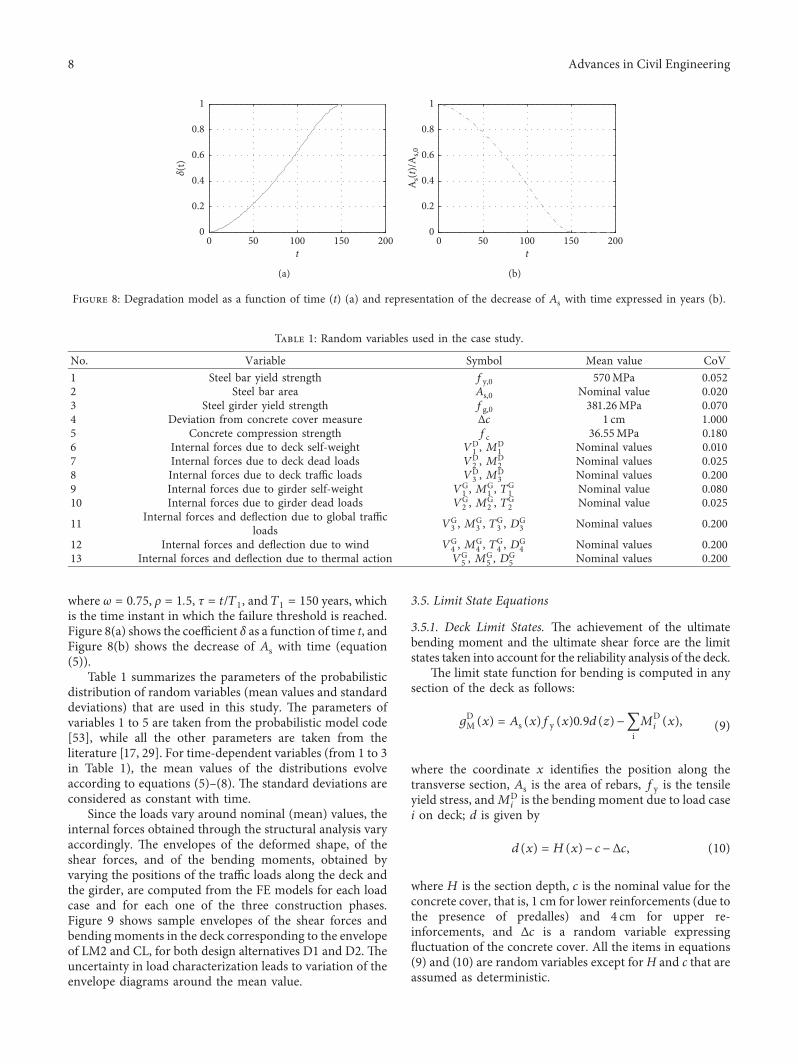
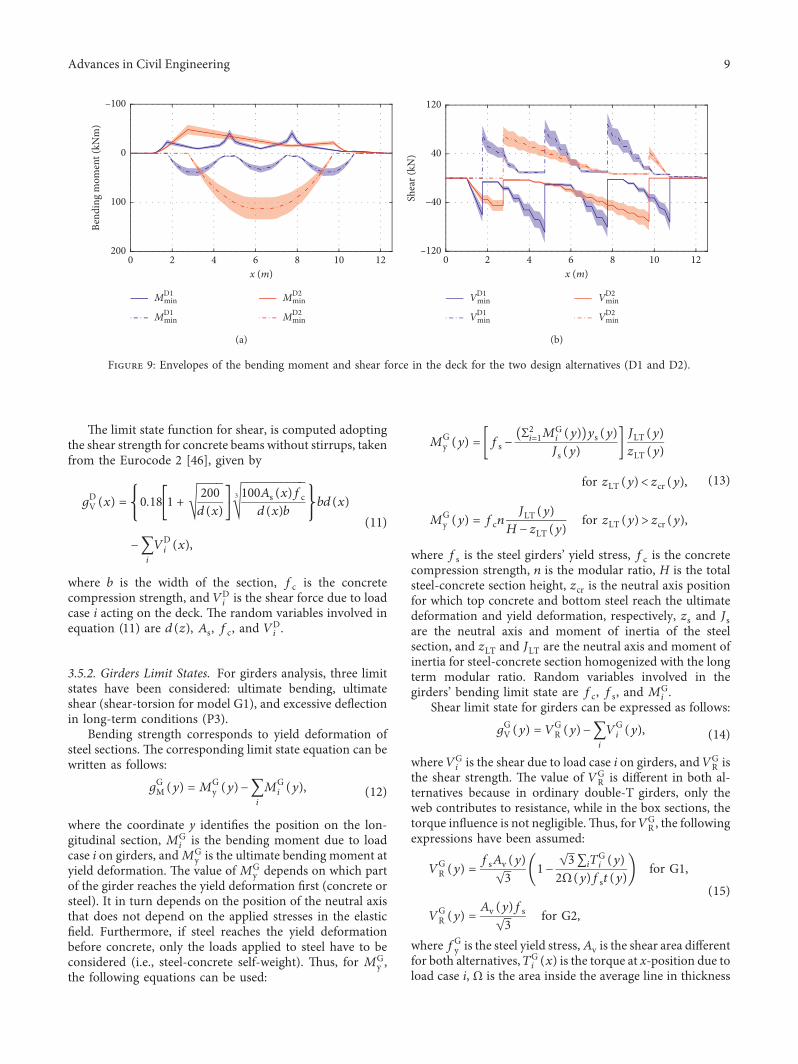
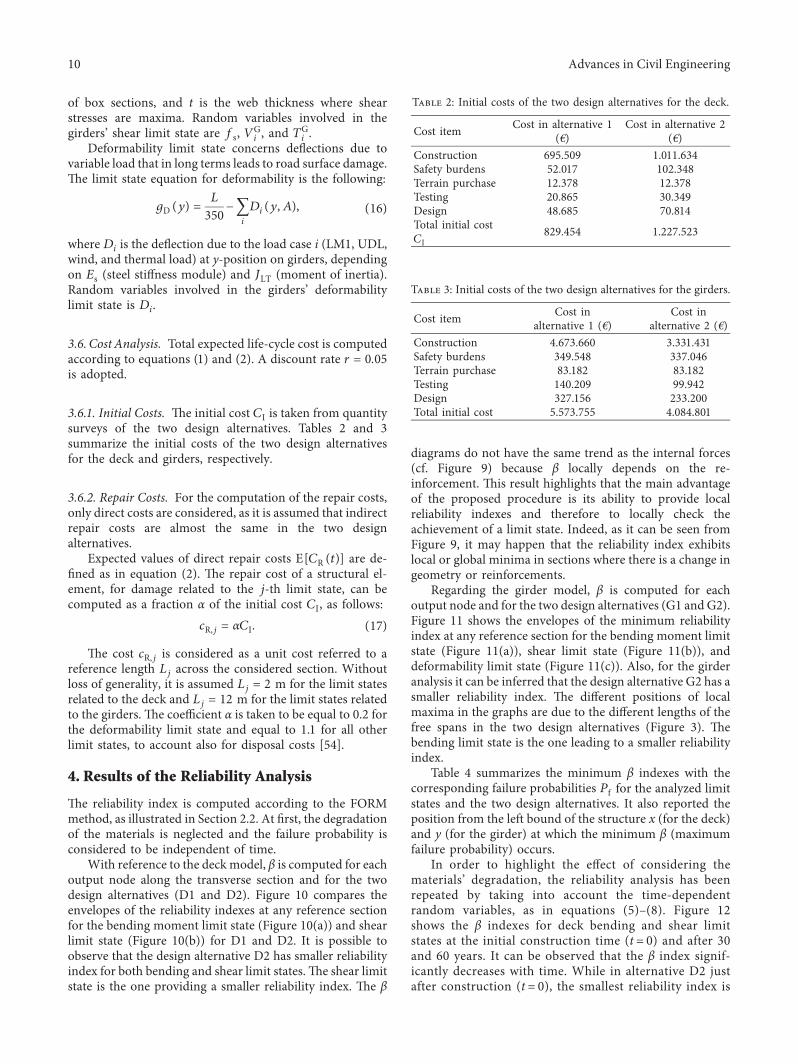
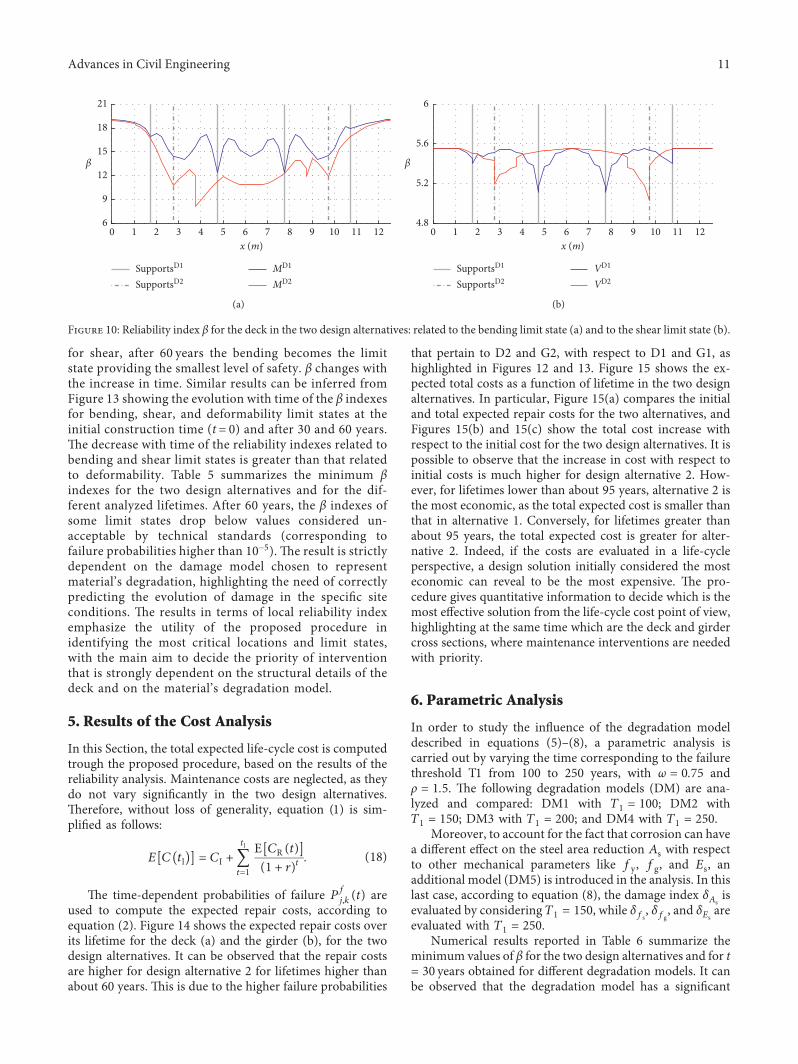
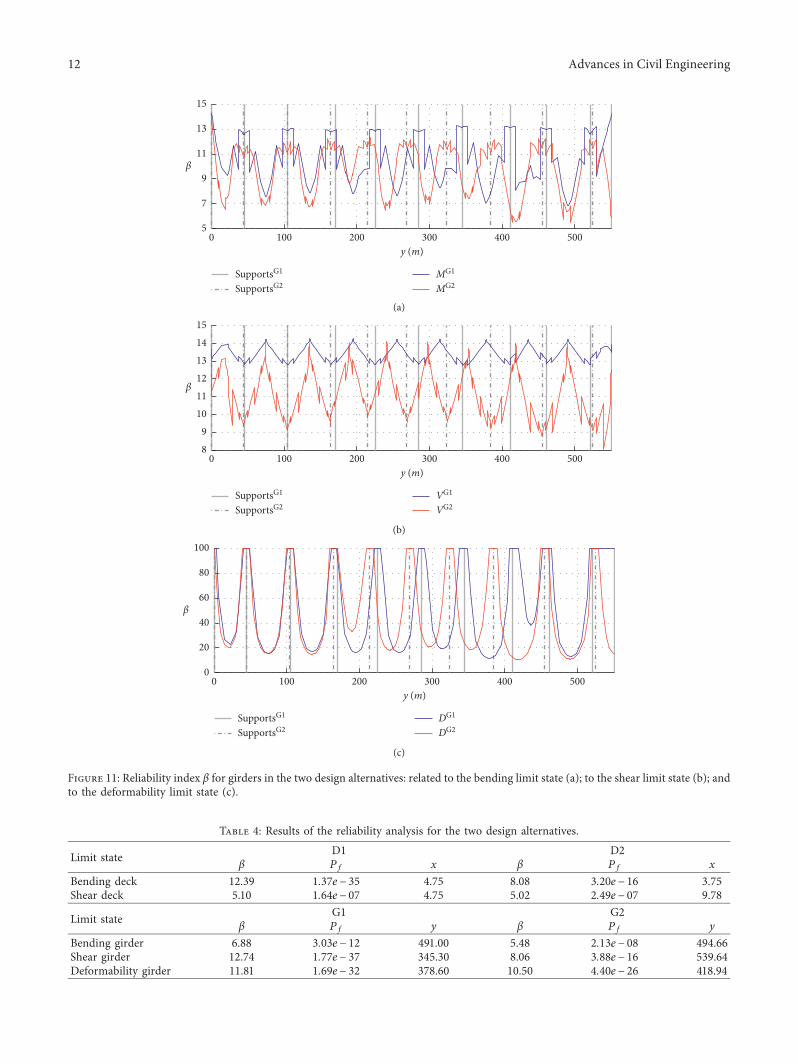
0 100 200 300 400 500y (m)
β
5
7
9
11
13
15
SupportsG1
SupportsG2MG1
MG2
(a)
β
0 100 200 300 400 500y (m)
89
101112131415
SupportsG1
SupportsG2VG1
VG2
(b)
β
SupportsG1
SupportsG2DG1
DG2
0 100 200 300 400 500y (m)
0
20
40
60
80
100
(c)
Figure 11 Reliability index β for girders in the two design alternatives related to the bending limit state (a) to the shear limit state (b) andto the deformability limit state (c)
Table 4 Results of the reliability analysis for the two design alternatives
Limit state D1 D2β Pf x β Pf x
Bending deck 1239 137eminus 35 475 808 320eminus 16 375Shear deck 510 164eminus 07 475 502 249eminus 07 978
Limit state G1 G2β Pf y β Pf y
Bending girder 688 303eminus 12 49100 548 213eminus 08 49466Shear girder 1274 177eminus 37 34530 806 388eminus 16 53964Deformability girder 1181 169eminus 32 37860 1050 440eminus 26 41894
12 Advances in Civil Engineering
β
1 2 3 4 5 6 7 8 9 10 11 12x (m)
0
5
10
15
20
0
SupportsD1t=0 years
D1t=30 yearsD1t=60 years
(a)
β
0 1 2 3 4 5 6 7 8 9 10 11 12x (m)
0
5
10
15
20
SupportsD2t=0 years
D2t=30 yearsD2t=60 years
(b)
β
0 1 2 3 4 5 6 7 8 9 10 11 12x (m)
45
5
55
6
SupportsD1t=0 years
D1t=30 yearsD1t=60 years
(c)
β
0 1 2 3 4 5 6 7 8 9 10 11 12x (m)
45
5
55
6
SupportsD2t=0 years
D2t=30 yearsD2t=60 years
(d)
Figure 12 Reliability index for the deck for dierent lifetimes
SupportsG1t=0 years
G1t=30 yearsG1t=60 years
0 100 200 300 400 500y (m)
β
0369
1215
(a)
SupportsG2t=0 years
G2t=30 yearsG2t=60 years
β
0 100 200 300 400 500y (m)
0369
1215
(b)
SupportsG1t=0 years
G1t=30 yearsG1t=60 years
β
0 100 200 300 400 500y (m)
579
111315
(c)
SupportsG2t=0 years
G2t=30 yearsG2t=60 years
β
0 100 200 300 400 500y (m)
579
111315
(d)
Figure 13 Continued
Advances in Civil Engineering 13
inbrvbaruence on the reliability index In particular as the failuretime threshold T1 increases the reliability index conse-quently increases e degradation model has greater in-brvbaruence on reliability related to bending than on reliabilityrelated to shear or deformability e eect of dierentdegradation models on life-cycle costs is also investigatedFigure 16 depicts the expected repair costs for design al-ternatives 1 and 2 considering the ve deterioration modelsand dierent lifetimes (t = 60 80 and 100 years) It ispossible to observe the signicant inbrvbaruence of the choice ofthe degradation model on the estimated repair cost whichrebrvbarects the expected inbrvbaruence of the degradation rate on therepair costs also highlighting that repair costs are stronglyinbrvbaruenced by the aggressiveness of the environment
7 Conclusions
epresent paper has proposed a procedure for the life-cyclecost analysis of road girder bridges e life-cycle cost isrelated to the failure probability which is locally and au-tomatically computed along the entire bridge deck forseveral limit states e procedure accounts in a simpliedway for material degradation by introducing the dependencyon time of several damage-dependent parameters Load andstrength parameters are considered uncertain with a normalprobability distribution Design trac actions on the bridgesuggested by international technical standards are alsoadopted considering the interaction between deck and girderloads Dierent construction phases of composite steel-
SupportsG1t=0 years
G1t=30 yearsG1t=60 years
β
0 100 200 300 400 500y (m)
020406080
100
(e)
SupportsG2t=0 years
G2t=30 yearsG2t=60 years
β
0 100 200 300 400 500y (m)
020406080
100
(f )
Figure 13 Reliability index for the girder for dierent lifetimes
Table 5 Minimum β indexes for the two design alternatives and for dierent lifetimes
Limit state t 0 year t 30 years t 60 yearsD1 D2 D1 D2 D1 D2
Bending deck 1239 808 1027 616 614 241Shear deck 510 502 504 495 483 475Limit state G1 G2 G1 G2 G1 G2Bending girder 687 548 580 446 372 230Shear girder 1274 806 1134 681 868 443Deformability girder 1181 1050 1016 894 702 596
1 11 21 31 41 51 61 71 81 91Time (years)
0
02
04
06
08
1
D1D2
Expe
cted
repa
ir co
st (M
euro)
(a)
0 10 20 30 40 50 60 70 80 90 100Time (years)
0
01
02
03
04
05
G1G2
Expe
cted
repa
ir co
st (M
euro)
(b)
Figure 14 Expected repair costs over a lifetime for the deck (a) and the girder (b) for the two design alternatives
14 Advances in Civil Engineering
Table 6 Minimum β indexes for the two design alternatives and for t 30 years for dierent degradation models
Limit state DM1 DM2 DM3 DM4 DM5D1 D2 D1 D2 D1 D2 D1 D2 D1 D2
Bending deck 869 472 1027 616 1120 684 1141 719 1099 673Shear deck 497 489 504 495 507 498 508 499 504 495Limit state G1 G2 G1 G2 G1 G2 G1 G2 G1 G2Bending girder 500 362 580 446 627 483 638 502 634 501Shear girder 1032 589 1134 681 1195 725 1209 748 1209 748Deformability girder 895 779 1016 894 1088 948 1104 977 1104 977
0 10 20 30 40 50 60 70 80 90 100Time (years)
5
55
6
65
7
75
CI1
E[C(tl)]1
Expe
cted
tota
l cos
t (M
euro)
CI2
E[C(tl)]2
(a)
0 20 40 60 80 100Time (years)
0
0002
0004
0006
0008
001
0012
0014
0016
0018
Cos
t inc
reas
e (
)
(b)
0 20 40 60 80 100Time (years)
0
0025
005
0075
01
0125
015
0175
02
0225
025
Cos
t inc
reas
e (
)
(c)
Figure 15 (a) Expected total costs of the two design alternatives compared with the corresponding initial costs (b) total cost increase withrespect to initial cost in design alternative 1 and (c) and total cost increase with respect to initial cost in design alternative 2
DM1 DM2 DM3 DM4 DM50
2
4
6
8
10
12
14
16
18
t = 60t = 80t = 100
Expe
cted
repa
ir co
st (M
euro)
(a)
DM1 DM2 DM3 DM4 DM50
2
4
6
8
10
12
14
16
18
t = 60t = 80t = 100
Expe
cted
repa
ir co
st (M
euro)
(b)
Figure 16 Expected repair costs for dierent deterioration models and for t 60 80 100 (a) design alternative 1 and (b) design alternative 2
Advances in Civil Engineering 15
reinforced concrete beams are analyzed Reliability analysisis carried out for all the considered limit states and incorrespondence of each location along the deck and thegirder to provide local values of the reliability index andfailure probability +e procedure is applied to a case studyof a road bridge for which in the design phase two differentdesign alternatives were proposed Results show that thereliability index is strongly dependent on the consideredlimit state and on the structural details of the deck thusemphasizing the importance of the local reliability assess-ment in order to estimate the priority and timing of in-terventions +e computation of the expected life-cycle costallows a quantitative comparison between the two differentdesign alternatives in a life-cycle perspective +e choice ofthe most economic solution strongly depends of the lifetimeexpected for the structure and on the degradation modeladopted to account for materialrsquos deterioration
Data Availability
+e numerical data used to support the findings of this studyare available from the corresponding author upon request
Conflicts of Interest
+e authors declare that they have no conflicts of interest
References
[1] C Liu Y Gong S Laflamme B Phares and S Sarkar ldquoBridgedamage detection using spatiotemporal patterns extractedfrom dense sensor networkrdquo Measurement Science andTechnology vol 28 no 1 article 014011 2016
[2] Y K Wen and Y J Kang ldquoMinimum building life-cycle costdesign criteria I Methodologyrdquo Journal of Structural Engi-neering vol 127 no 3 pp 330ndash337 2001
[3] D M Frangopol Y Dong and S Sabatino ldquoBridge life-cycleperformance and cost analysis prediction optimisation anddecision-makingrdquo Structure and Infrastructure Engineeringvol 13 no 10 pp 1239ndash1257 2017
[4] D M Frangopol ldquoLife-cycle performance management andoptimisation of structural systems under uncertainty ac-complishments and challenges1rdquo Structure and InfrastructureEngineering vol 7 no 6 pp 389ndash413 2011
[5] N Okasha andDM Frangopol ldquoComputational platform forthe integrated life-cycle management of highway bridgesrdquoEngineering Structures vol 33 no 7 pp 2145ndash2153 2011
[6] L Ierimonti L Caracoglia I Venanzi and A L MaterazzildquoInvestigation on life-cycle damage cost of wind-excited tallbuildings considering directionality effectsrdquo Journal of WindEngineering and Industrial Aerodynamics vol 171 pp 207ndash218 2017
[7] L Gao Y Li and J Hu ldquoLife-cycle cost framework analysisfor a bridgerdquo WIT Transactions on the Built Environmentvol 140 pp 85ndash88 2013
[8] D M Frangopol and M Soliman ldquoLife-cycle of structuralsystems recent achievements and future directionsrdquo Structureand Infrastructure Engineering vol 12 no 1 pp 1ndash20 2015
[9] S-H KimM-S Choi K-I Cho and S-J Park ldquoDeterminingthe optimal structural target reliability of a structure with aminimal life-cycle cost perspectiverdquo Advances in StructuralEngineering vol 16 no 12 pp 2075ndash2091 2016
[10] M Stewart ldquoReliability-based assessment of ageing bridgesusing risk ranking and life cycle cost decision analysesrdquoReliability Engineering and System Safety vol 74 no 3pp 263ndash273 2001
[11] C D Eamon E A Jensen N F Grace and X Shi ldquoLife-cyclecost analysis of alternative reinforcement materials for bridgesuperstructures considering cost and maintenance un-certaintiesrdquo Journal of Materials in Civil Engineering vol 24no 4 pp 373ndash380 2012
[12] K Ozbay D Jawad N Parker and S Hussain ldquoLife-cycle costanalysis State of the practice versus state of the artrdquo Trans-portation Research Record vol 1864 no 1 pp 62ndash70 2004
[13] M Akiyama D M Frangopol and K Takenaka ldquoReliability-based durability design and service life assessment of rein-forced concrete deck slab of jetty structuresrdquo Structure andInfrastructure Engineering vol 13 no 4 pp 468ndash477 2016
[14] L Ierimonti I Venanzi and L Caracoglia ldquoLife-cycledamage-based cost analysis of tall buildings equipped withtuned mass dampersrdquo Journal of Wind Engineering and In-dustrial Aerodynamics vol 176 pp 54ndash64 2018
[15] Y K Wen ldquoMinimum lifecycle cost design under multiplehazardsrdquo Reliability Engineering and System Safety vol 73no 3 pp 223ndash231 2001
[16] I Venanzi O Lavan L Ierimonti and S Fabrizi ldquoMulti-hazard loss analysis of tall buildings under wind and seismiclaodsrdquo Structure and Infrastructure Engineering vol 14no 10 pp 1295ndash1311
[17] K-M Lee H-N Cho and Y-M Choi ldquoLife-cycle cost-effective optimum design of steel bridgesrdquo Journal of con-structional steel research vol 60 no 11 pp 1585ndash1613 2004
[18] M Jiang R Corotis and H Ellis ldquoOptimal life-cycle costingwith partial observabilityrdquo Journal of Infrastructure Systemsvol 6 no 2 pp 56ndash66 2001
[19] L Saad A Aissani A Chateauneuf and W RaphaelldquoReliability-based optimization of direct and indirect LCC ofRC bridge elements under coupled fatigue-corrosion de-terioration processesrdquo Engineering Failure Analysis vol 59pp 570ndash587 2016
[20] J J Veganzones Muntildeoz L Pettersson H Sundquist andR Karoumi ldquoLife-cycle cost analysis as a tool in the de-veloping process for new bridge edge beam solutionsrdquoStructure and Infrastructure Engineering vol 12 no 9pp 1185ndash1201 2016
[21] N Ta A Orcesi and C Cremona ldquoA comparative life-cyclecost analysis of steel-concrete composite bridgesrdquo in Life-Cycle and Sustainability of Civil Infrastructure Systems Pro-ceedings of the 3rd International Symposium on Life-CycleCivil Engineering pp 696ndash702 Vienna Austria October2012
[22] S-H Han W-S Lee and M-S Bang ldquoProbabilistic optimalsafety with minimum life-cycle cost based on stochasticfinite element analysis of steel cable-stayed bridgesrdquo In-ternational Journal of Steel Structures vol 11 no 3pp 335ndash349 2011
[23] Y S Shin J H Park and D-H Ha ldquoOptimal design of a steelbox girder bridge considering life cycle costrdquo KSCE Journal ofCivil Engineering vol 13 no 6 pp 433ndash440 2009
[24] M E Fagen and B M Phares ldquoLife-cycle cost analysis of alow-volume road bridge alternativerdquo Transportation ResearchRecord Journal of the Transportation Research Boardvol 1696 no 1 pp 8ndash13 2018
[25] M S Bang ldquoOptimal design of suspension bridge based onminimization of life cycle costrdquo Advanced Materials Researchvol 919-921 pp 577ndash582 2014
16 Advances in Civil Engineering
[26] T Garca-Segura V Yepes and D Frangopol ldquoMulti-objective design of post-tensioned concrete road bridgesusing artificial neural networksrdquo Structural and Multidisci-plinary Optimization vol 56 no 1 pp 139ndash150 2017
[27] J E Padgett K Dennemann and J Ghosh ldquoRisk-basedseismic life-cycle cost-benefit (LCC-B) analysis for bridgeretrofit assessmentrdquo Structural Safety vol 32 no 3pp 165ndash173 2010
[28] M Liu and D M Frangopol ldquoOptimizing bridge networkmaintenance management under uncertainty with conflictingcriteria life-cycle maintenance failure and user costsrdquoJournal of Structural Engineering vol 132 no 11 pp 1835ndash1845 2006
[29] S Sabatino D M Frangopol and Y Dong ldquoSustainability-informed maintenance optimization of highway bridgesconsidering multi-attribute utility and risk attituderdquo Engi-neering Structures vol 102 pp 310ndash321 2015
[30] J O Almeida P F Teixeira and R M Delgado ldquoLife cyclecost optimisation in highway concrete bridges managementrdquoStructure and Infrastructure Engineering vol 11 no 10pp 1263ndash1276 2013
[31] B Le and J Andrews ldquoPetri net modelling of bridge assetmanagement using maintenance-related state conditionsrdquoStructure and Infrastructure Engineering vol 12 no 6pp 730ndash751 2015
[32] A Cunha E Caetano F Magalhatildees andM Carlos ldquoDynamicidentification and continuous dynamic monitoring of bridgesdifferent applications along bridges life-cyclerdquo Structure andInfrastructure Engineering vol 14 no 4 pp 445ndash467 2017
[33] G Moutinho D Frangopol and M Soliman ldquoOptimizationof life-cycle maintenance of deteriorating bridges with respectto expected annual system failure rate and expected cumu-lative costrdquo Journal of Structural Engineering (United States)vol 140 no 4 article 04013043 2017
[34] A Hatami and G Morcous ldquoDeterioration models for life-cycle cost analysis of bridge decks in Nebraskardquo Trans-portation Research Record vol 2313 no 1 pp 3ndash11 2012
[35] P Liu ldquoLife cycle cost analysis of anticorrosive coating of steelbridgerdquo Advanced Materials Research vol 496 pp 121ndash1252012
[36] N M Okasha D M Frangopol F B Fletcher andA D Wilson ldquoLife-cycle cost analyses of a new steel forbridgesrdquo Journal of Bridge Engineering vol 17 no 1pp 168ndash172 2012
[37] R Bhaskaran N Palaniswamy and N Rengaswamy ldquoLife-cycle cost analysis of a concrete road bridge across open seardquoMaterials Performance vol 45 pp 51ndash55 2006
[38] D M Frangopol K-Y Lin and A C Estes ldquoLife-cycle costdesign of deteriorating structuresrdquo Journal of StructuralEngineering vol 123 no 10 pp 1390ndash1401 1997
[39] A N Kallias B Imam and M K ChryssanthopoulosldquoPerformance profiles of metallic bridges subject to coatingdegradation and atmospheric corrosionrdquo Structure and In-frastructure Engineering vol 13 no 4 pp 440ndash453 2016
[40] M Safi H Sundquist and R Karoumi ldquoCost-efficient pro-curement of bridge infrastructures by incorporating life-cyclecost analysis with bridge management systemsrdquo Journal ofBridge Engineering vol 20 no 6 article 04014083 2015
[41] M Safi H Sundquist R Karoumi and G Racutanu ldquoIn-tegration of life-cycle cost analysis with bridge managementsystemsrdquo Transportation Research Record Journal of theTransportation Research Board vol 2292 no 1 pp 25ndash1332018
[42] H S Shim and S H Lee ldquoDeveloping a probable cost analysismodel for comparing bridge deck rehabilitation methodsrdquoKSCE Journal of Civil Engineering vol 20 no 1 pp 68ndash762015
[43] P+oft-Christensen ldquoLife-cycle cost-benefit (LCCB) analysisof bridges from a user and social point of viewrdquo Structure andInfrastructure Engineering vol 5 no 1 pp 49ndash57 2009
[44] K Lee H Cho and C Cha ldquoLife-cycle cost-effective optimumdesign of steel bridges considering environmental stressorsrdquoEngineering Structures vol 28 no 9 article 12521265 2006
[45] +e MathWorks Inc MATLAB R2009b Release Note UserrsquosGUIDE +e MathWorks Inc Natick MA USA 2009
[46] European Committee for Standardization 1992-1-12005-Eurocode 2-Design of Concrete Structures-Part 1-1 GeneralRules and Rules for Buildings European Committee forStandardization 36 rue de Stassart B 1050 Brussels 2005
[47] European Committee for Standardization 1994-1-12004-Euro-code 4 Design of Composite Steel and Concrete Structures-Part 1-1 General Rules and Rules for Buildings European Committeefor Standardization 36 rue de Stassart B 1050 Brussels 2004
[48] European Committee for Standardization 1991-12003-Eurocode 1 Actions on Structures-Part 1-1 General actions-Densities Self-Weight Imposed Loads for Buildings EuropeanCommittee for Standardization 36 rue de Stassart B 1050Brussels 2003
[49] European Committee for Standardization 1991-22003-Eurocode 1 Actions on Structures-Part 1-2 Traffic Loads OnBridges European Committee for Standardization
[50] F Biondini and G Zani ldquoLife-cycle multi-objective optimi-zation of deteriorating structuresrdquo in Life Cycle Civil Engi-neering pp 285ndash291 Taylor F Group London UK 2008
[51] F Biondini and D Frangopol ldquoLife-cycle multi-objectiveoptimization of deteriorating structuresrdquo in Life Cycle CivilEngineering pp 285ndash291 Taylor F Group London UK 2008
[52] F Biondini and A Marchiondelli ldquoEvolutionary design ofstructural systems with time-variant performancerdquo Structureand Infrastructure Engineering vol 4 no 2 pp 163ndash1762008
[53] Joint Committee on Structural Safety Probabilistic ModelCode Chap Part 3 Material Properties Joint Committee onStructural Safety 2000
[54] S Noponen and A Jutila ldquoLCC case studies for bridges indifferent design phasesrdquo in Life Cycle Civil Engineeringpp 851ndash856 Taylor and Francis Group London UK 2008
Advances in Civil Engineering 17
International Journal of
AerospaceEngineeringHindawiwwwhindawicom Volume 2018
RoboticsJournal of
Hindawiwwwhindawicom Volume 2018
Hindawiwwwhindawicom Volume 2018
Active and Passive Electronic Components
VLSI Design
Hindawiwwwhindawicom Volume 2018
Hindawiwwwhindawicom Volume 2018
Shock and Vibration
Hindawiwwwhindawicom Volume 2018
Civil EngineeringAdvances in
Acoustics and VibrationAdvances in
Hindawiwwwhindawicom Volume 2018
Hindawiwwwhindawicom Volume 2018
Electrical and Computer Engineering
Journal of
Advances inOptoElectronics
Hindawiwwwhindawicom
Volume 2018
Hindawi Publishing Corporation httpwwwhindawicom Volume 2013Hindawiwwwhindawicom
The Scientific World Journal
Volume 2018
Control Scienceand Engineering
Journal of
Hindawiwwwhindawicom Volume 2018
Hindawiwwwhindawicom
Journal ofEngineeringVolume 2018
SensorsJournal of
Hindawiwwwhindawicom Volume 2018
International Journal of
RotatingMachinery
Hindawiwwwhindawicom Volume 2018
Modelling ampSimulationin EngineeringHindawiwwwhindawicom Volume 2018
Hindawiwwwhindawicom Volume 2018
Chemical EngineeringInternational Journal of Antennas and
Propagation
International Journal of
Hindawiwwwhindawicom Volume 2018
Hindawiwwwhindawicom Volume 2018
Navigation and Observation
International Journal of
Hindawi
wwwhindawicom Volume 2018
Advances in
Multimedia
Submit your manuscripts atwwwhindawicom
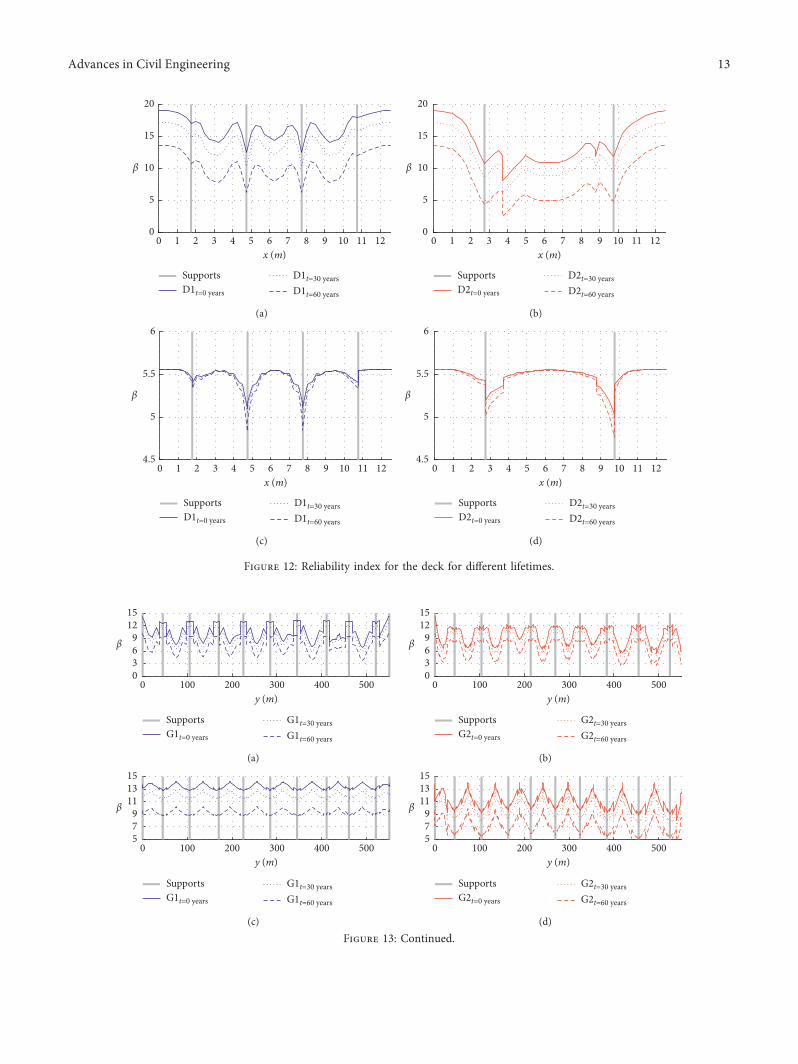
β
1 2 3 4 5 6 7 8 9 10 11 12x (m)
0
5
10
15
20
0
SupportsD1t=0 years
D1t=30 yearsD1t=60 years
(a)
β
0 1 2 3 4 5 6 7 8 9 10 11 12x (m)
0
5
10
15
20
SupportsD2t=0 years
D2t=30 yearsD2t=60 years
(b)
β
0 1 2 3 4 5 6 7 8 9 10 11 12x (m)
45
5
55
6
SupportsD1t=0 years
D1t=30 yearsD1t=60 years
(c)
β
0 1 2 3 4 5 6 7 8 9 10 11 12x (m)
45
5
55
6
SupportsD2t=0 years
D2t=30 yearsD2t=60 years
(d)
Figure 12 Reliability index for the deck for dierent lifetimes
SupportsG1t=0 years
G1t=30 yearsG1t=60 years
0 100 200 300 400 500y (m)
β
0369
1215
(a)
SupportsG2t=0 years
G2t=30 yearsG2t=60 years
β
0 100 200 300 400 500y (m)
0369
1215
(b)
SupportsG1t=0 years
G1t=30 yearsG1t=60 years
β
0 100 200 300 400 500y (m)
579
111315
(c)
SupportsG2t=0 years
G2t=30 yearsG2t=60 years
β
0 100 200 300 400 500y (m)
579
111315
(d)
Figure 13 Continued
Advances in Civil Engineering 13
inbrvbaruence on the reliability index In particular as the failuretime threshold T1 increases the reliability index conse-quently increases e degradation model has greater in-brvbaruence on reliability related to bending than on reliabilityrelated to shear or deformability e eect of dierentdegradation models on life-cycle costs is also investigatedFigure 16 depicts the expected repair costs for design al-ternatives 1 and 2 considering the ve deterioration modelsand dierent lifetimes (t = 60 80 and 100 years) It ispossible to observe the signicant inbrvbaruence of the choice ofthe degradation model on the estimated repair cost whichrebrvbarects the expected inbrvbaruence of the degradation rate on therepair costs also highlighting that repair costs are stronglyinbrvbaruenced by the aggressiveness of the environment
7 Conclusions
epresent paper has proposed a procedure for the life-cyclecost analysis of road girder bridges e life-cycle cost isrelated to the failure probability which is locally and au-tomatically computed along the entire bridge deck forseveral limit states e procedure accounts in a simpliedway for material degradation by introducing the dependencyon time of several damage-dependent parameters Load andstrength parameters are considered uncertain with a normalprobability distribution Design trac actions on the bridgesuggested by international technical standards are alsoadopted considering the interaction between deck and girderloads Dierent construction phases of composite steel-
SupportsG1t=0 years
G1t=30 yearsG1t=60 years
β
0 100 200 300 400 500y (m)
020406080
100
(e)
SupportsG2t=0 years
G2t=30 yearsG2t=60 years
β
0 100 200 300 400 500y (m)
020406080
100
(f )
Figure 13 Reliability index for the girder for dierent lifetimes
Table 5 Minimum β indexes for the two design alternatives and for dierent lifetimes
Limit state t 0 year t 30 years t 60 yearsD1 D2 D1 D2 D1 D2
Bending deck 1239 808 1027 616 614 241Shear deck 510 502 504 495 483 475Limit state G1 G2 G1 G2 G1 G2Bending girder 687 548 580 446 372 230Shear girder 1274 806 1134 681 868 443Deformability girder 1181 1050 1016 894 702 596
1 11 21 31 41 51 61 71 81 91Time (years)
0
02
04
06
08
1
D1D2
Expe
cted
repa
ir co
st (M
euro)
(a)
0 10 20 30 40 50 60 70 80 90 100Time (years)
0
01
02
03
04
05
G1G2
Expe
cted
repa
ir co
st (M
euro)
(b)
Figure 14 Expected repair costs over a lifetime for the deck (a) and the girder (b) for the two design alternatives
14 Advances in Civil Engineering
Table 6 Minimum β indexes for the two design alternatives and for t 30 years for dierent degradation models
Limit state DM1 DM2 DM3 DM4 DM5D1 D2 D1 D2 D1 D2 D1 D2 D1 D2
Bending deck 869 472 1027 616 1120 684 1141 719 1099 673Shear deck 497 489 504 495 507 498 508 499 504 495Limit state G1 G2 G1 G2 G1 G2 G1 G2 G1 G2Bending girder 500 362 580 446 627 483 638 502 634 501Shear girder 1032 589 1134 681 1195 725 1209 748 1209 748Deformability girder 895 779 1016 894 1088 948 1104 977 1104 977
0 10 20 30 40 50 60 70 80 90 100Time (years)
5
55
6
65
7
75
CI1
E[C(tl)]1
Expe
cted
tota
l cos
t (M
euro)
CI2
E[C(tl)]2
(a)
0 20 40 60 80 100Time (years)
0
0002
0004
0006
0008
001
0012
0014
0016
0018
Cos
t inc
reas
e (
)
(b)
0 20 40 60 80 100Time (years)
0
0025
005
0075
01
0125
015
0175
02
0225
025
Cos
t inc
reas
e (
)
(c)
Figure 15 (a) Expected total costs of the two design alternatives compared with the corresponding initial costs (b) total cost increase withrespect to initial cost in design alternative 1 and (c) and total cost increase with respect to initial cost in design alternative 2
DM1 DM2 DM3 DM4 DM50
2
4
6
8
10
12
14
16
18
t = 60t = 80t = 100
Expe
cted
repa
ir co
st (M
euro)
(a)
DM1 DM2 DM3 DM4 DM50
2
4
6
8
10
12
14
16
18
t = 60t = 80t = 100
Expe
cted
repa
ir co
st (M
euro)
(b)
Figure 16 Expected repair costs for dierent deterioration models and for t 60 80 100 (a) design alternative 1 and (b) design alternative 2
Advances in Civil Engineering 15
reinforced concrete beams are analyzed Reliability analysisis carried out for all the considered limit states and incorrespondence of each location along the deck and thegirder to provide local values of the reliability index andfailure probability +e procedure is applied to a case studyof a road bridge for which in the design phase two differentdesign alternatives were proposed Results show that thereliability index is strongly dependent on the consideredlimit state and on the structural details of the deck thusemphasizing the importance of the local reliability assess-ment in order to estimate the priority and timing of in-terventions +e computation of the expected life-cycle costallows a quantitative comparison between the two differentdesign alternatives in a life-cycle perspective +e choice ofthe most economic solution strongly depends of the lifetimeexpected for the structure and on the degradation modeladopted to account for materialrsquos deterioration
Data Availability
+e numerical data used to support the findings of this studyare available from the corresponding author upon request
Conflicts of Interest
+e authors declare that they have no conflicts of interest
References
[1] C Liu Y Gong S Laflamme B Phares and S Sarkar ldquoBridgedamage detection using spatiotemporal patterns extractedfrom dense sensor networkrdquo Measurement Science andTechnology vol 28 no 1 article 014011 2016
[2] Y K Wen and Y J Kang ldquoMinimum building life-cycle costdesign criteria I Methodologyrdquo Journal of Structural Engi-neering vol 127 no 3 pp 330ndash337 2001
[3] D M Frangopol Y Dong and S Sabatino ldquoBridge life-cycleperformance and cost analysis prediction optimisation anddecision-makingrdquo Structure and Infrastructure Engineeringvol 13 no 10 pp 1239ndash1257 2017
[4] D M Frangopol ldquoLife-cycle performance management andoptimisation of structural systems under uncertainty ac-complishments and challenges1rdquo Structure and InfrastructureEngineering vol 7 no 6 pp 389ndash413 2011
[5] N Okasha andDM Frangopol ldquoComputational platform forthe integrated life-cycle management of highway bridgesrdquoEngineering Structures vol 33 no 7 pp 2145ndash2153 2011
[6] L Ierimonti L Caracoglia I Venanzi and A L MaterazzildquoInvestigation on life-cycle damage cost of wind-excited tallbuildings considering directionality effectsrdquo Journal of WindEngineering and Industrial Aerodynamics vol 171 pp 207ndash218 2017
[7] L Gao Y Li and J Hu ldquoLife-cycle cost framework analysisfor a bridgerdquo WIT Transactions on the Built Environmentvol 140 pp 85ndash88 2013
[8] D M Frangopol and M Soliman ldquoLife-cycle of structuralsystems recent achievements and future directionsrdquo Structureand Infrastructure Engineering vol 12 no 1 pp 1ndash20 2015
[9] S-H KimM-S Choi K-I Cho and S-J Park ldquoDeterminingthe optimal structural target reliability of a structure with aminimal life-cycle cost perspectiverdquo Advances in StructuralEngineering vol 16 no 12 pp 2075ndash2091 2016
[10] M Stewart ldquoReliability-based assessment of ageing bridgesusing risk ranking and life cycle cost decision analysesrdquoReliability Engineering and System Safety vol 74 no 3pp 263ndash273 2001
[11] C D Eamon E A Jensen N F Grace and X Shi ldquoLife-cyclecost analysis of alternative reinforcement materials for bridgesuperstructures considering cost and maintenance un-certaintiesrdquo Journal of Materials in Civil Engineering vol 24no 4 pp 373ndash380 2012
[12] K Ozbay D Jawad N Parker and S Hussain ldquoLife-cycle costanalysis State of the practice versus state of the artrdquo Trans-portation Research Record vol 1864 no 1 pp 62ndash70 2004
[13] M Akiyama D M Frangopol and K Takenaka ldquoReliability-based durability design and service life assessment of rein-forced concrete deck slab of jetty structuresrdquo Structure andInfrastructure Engineering vol 13 no 4 pp 468ndash477 2016
[14] L Ierimonti I Venanzi and L Caracoglia ldquoLife-cycledamage-based cost analysis of tall buildings equipped withtuned mass dampersrdquo Journal of Wind Engineering and In-dustrial Aerodynamics vol 176 pp 54ndash64 2018
[15] Y K Wen ldquoMinimum lifecycle cost design under multiplehazardsrdquo Reliability Engineering and System Safety vol 73no 3 pp 223ndash231 2001
[16] I Venanzi O Lavan L Ierimonti and S Fabrizi ldquoMulti-hazard loss analysis of tall buildings under wind and seismiclaodsrdquo Structure and Infrastructure Engineering vol 14no 10 pp 1295ndash1311
[17] K-M Lee H-N Cho and Y-M Choi ldquoLife-cycle cost-effective optimum design of steel bridgesrdquo Journal of con-structional steel research vol 60 no 11 pp 1585ndash1613 2004
[18] M Jiang R Corotis and H Ellis ldquoOptimal life-cycle costingwith partial observabilityrdquo Journal of Infrastructure Systemsvol 6 no 2 pp 56ndash66 2001
[19] L Saad A Aissani A Chateauneuf and W RaphaelldquoReliability-based optimization of direct and indirect LCC ofRC bridge elements under coupled fatigue-corrosion de-terioration processesrdquo Engineering Failure Analysis vol 59pp 570ndash587 2016
[20] J J Veganzones Muntildeoz L Pettersson H Sundquist andR Karoumi ldquoLife-cycle cost analysis as a tool in the de-veloping process for new bridge edge beam solutionsrdquoStructure and Infrastructure Engineering vol 12 no 9pp 1185ndash1201 2016
[21] N Ta A Orcesi and C Cremona ldquoA comparative life-cyclecost analysis of steel-concrete composite bridgesrdquo in Life-Cycle and Sustainability of Civil Infrastructure Systems Pro-ceedings of the 3rd International Symposium on Life-CycleCivil Engineering pp 696ndash702 Vienna Austria October2012
[22] S-H Han W-S Lee and M-S Bang ldquoProbabilistic optimalsafety with minimum life-cycle cost based on stochasticfinite element analysis of steel cable-stayed bridgesrdquo In-ternational Journal of Steel Structures vol 11 no 3pp 335ndash349 2011
[23] Y S Shin J H Park and D-H Ha ldquoOptimal design of a steelbox girder bridge considering life cycle costrdquo KSCE Journal ofCivil Engineering vol 13 no 6 pp 433ndash440 2009
[24] M E Fagen and B M Phares ldquoLife-cycle cost analysis of alow-volume road bridge alternativerdquo Transportation ResearchRecord Journal of the Transportation Research Boardvol 1696 no 1 pp 8ndash13 2018
[25] M S Bang ldquoOptimal design of suspension bridge based onminimization of life cycle costrdquo Advanced Materials Researchvol 919-921 pp 577ndash582 2014
16 Advances in Civil Engineering
[26] T Garca-Segura V Yepes and D Frangopol ldquoMulti-objective design of post-tensioned concrete road bridgesusing artificial neural networksrdquo Structural and Multidisci-plinary Optimization vol 56 no 1 pp 139ndash150 2017
[27] J E Padgett K Dennemann and J Ghosh ldquoRisk-basedseismic life-cycle cost-benefit (LCC-B) analysis for bridgeretrofit assessmentrdquo Structural Safety vol 32 no 3pp 165ndash173 2010
[28] M Liu and D M Frangopol ldquoOptimizing bridge networkmaintenance management under uncertainty with conflictingcriteria life-cycle maintenance failure and user costsrdquoJournal of Structural Engineering vol 132 no 11 pp 1835ndash1845 2006
[29] S Sabatino D M Frangopol and Y Dong ldquoSustainability-informed maintenance optimization of highway bridgesconsidering multi-attribute utility and risk attituderdquo Engi-neering Structures vol 102 pp 310ndash321 2015
[30] J O Almeida P F Teixeira and R M Delgado ldquoLife cyclecost optimisation in highway concrete bridges managementrdquoStructure and Infrastructure Engineering vol 11 no 10pp 1263ndash1276 2013
[31] B Le and J Andrews ldquoPetri net modelling of bridge assetmanagement using maintenance-related state conditionsrdquoStructure and Infrastructure Engineering vol 12 no 6pp 730ndash751 2015
[32] A Cunha E Caetano F Magalhatildees andM Carlos ldquoDynamicidentification and continuous dynamic monitoring of bridgesdifferent applications along bridges life-cyclerdquo Structure andInfrastructure Engineering vol 14 no 4 pp 445ndash467 2017
[33] G Moutinho D Frangopol and M Soliman ldquoOptimizationof life-cycle maintenance of deteriorating bridges with respectto expected annual system failure rate and expected cumu-lative costrdquo Journal of Structural Engineering (United States)vol 140 no 4 article 04013043 2017
[34] A Hatami and G Morcous ldquoDeterioration models for life-cycle cost analysis of bridge decks in Nebraskardquo Trans-portation Research Record vol 2313 no 1 pp 3ndash11 2012
[35] P Liu ldquoLife cycle cost analysis of anticorrosive coating of steelbridgerdquo Advanced Materials Research vol 496 pp 121ndash1252012
[36] N M Okasha D M Frangopol F B Fletcher andA D Wilson ldquoLife-cycle cost analyses of a new steel forbridgesrdquo Journal of Bridge Engineering vol 17 no 1pp 168ndash172 2012
[37] R Bhaskaran N Palaniswamy and N Rengaswamy ldquoLife-cycle cost analysis of a concrete road bridge across open seardquoMaterials Performance vol 45 pp 51ndash55 2006
[38] D M Frangopol K-Y Lin and A C Estes ldquoLife-cycle costdesign of deteriorating structuresrdquo Journal of StructuralEngineering vol 123 no 10 pp 1390ndash1401 1997
[39] A N Kallias B Imam and M K ChryssanthopoulosldquoPerformance profiles of metallic bridges subject to coatingdegradation and atmospheric corrosionrdquo Structure and In-frastructure Engineering vol 13 no 4 pp 440ndash453 2016
[40] M Safi H Sundquist and R Karoumi ldquoCost-efficient pro-curement of bridge infrastructures by incorporating life-cyclecost analysis with bridge management systemsrdquo Journal ofBridge Engineering vol 20 no 6 article 04014083 2015
[41] M Safi H Sundquist R Karoumi and G Racutanu ldquoIn-tegration of life-cycle cost analysis with bridge managementsystemsrdquo Transportation Research Record Journal of theTransportation Research Board vol 2292 no 1 pp 25ndash1332018
[42] H S Shim and S H Lee ldquoDeveloping a probable cost analysismodel for comparing bridge deck rehabilitation methodsrdquoKSCE Journal of Civil Engineering vol 20 no 1 pp 68ndash762015
[43] P+oft-Christensen ldquoLife-cycle cost-benefit (LCCB) analysisof bridges from a user and social point of viewrdquo Structure andInfrastructure Engineering vol 5 no 1 pp 49ndash57 2009
[44] K Lee H Cho and C Cha ldquoLife-cycle cost-effective optimumdesign of steel bridges considering environmental stressorsrdquoEngineering Structures vol 28 no 9 article 12521265 2006
[45] +e MathWorks Inc MATLAB R2009b Release Note UserrsquosGUIDE +e MathWorks Inc Natick MA USA 2009
[46] European Committee for Standardization 1992-1-12005-Eurocode 2-Design of Concrete Structures-Part 1-1 GeneralRules and Rules for Buildings European Committee forStandardization 36 rue de Stassart B 1050 Brussels 2005
[47] European Committee for Standardization 1994-1-12004-Euro-code 4 Design of Composite Steel and Concrete Structures-Part 1-1 General Rules and Rules for Buildings European Committeefor Standardization 36 rue de Stassart B 1050 Brussels 2004
[48] European Committee for Standardization 1991-12003-Eurocode 1 Actions on Structures-Part 1-1 General actions-Densities Self-Weight Imposed Loads for Buildings EuropeanCommittee for Standardization 36 rue de Stassart B 1050Brussels 2003
[49] European Committee for Standardization 1991-22003-Eurocode 1 Actions on Structures-Part 1-2 Traffic Loads OnBridges European Committee for Standardization
[50] F Biondini and G Zani ldquoLife-cycle multi-objective optimi-zation of deteriorating structuresrdquo in Life Cycle Civil Engi-neering pp 285ndash291 Taylor F Group London UK 2008
[51] F Biondini and D Frangopol ldquoLife-cycle multi-objectiveoptimization of deteriorating structuresrdquo in Life Cycle CivilEngineering pp 285ndash291 Taylor F Group London UK 2008
[52] F Biondini and A Marchiondelli ldquoEvolutionary design ofstructural systems with time-variant performancerdquo Structureand Infrastructure Engineering vol 4 no 2 pp 163ndash1762008
[53] Joint Committee on Structural Safety Probabilistic ModelCode Chap Part 3 Material Properties Joint Committee onStructural Safety 2000
[54] S Noponen and A Jutila ldquoLCC case studies for bridges indifferent design phasesrdquo in Life Cycle Civil Engineeringpp 851ndash856 Taylor and Francis Group London UK 2008
Advances in Civil Engineering 17
International Journal of
AerospaceEngineeringHindawiwwwhindawicom Volume 2018
RoboticsJournal of
Hindawiwwwhindawicom Volume 2018
Hindawiwwwhindawicom Volume 2018
Active and Passive Electronic Components
VLSI Design
Hindawiwwwhindawicom Volume 2018
Hindawiwwwhindawicom Volume 2018
Shock and Vibration
Hindawiwwwhindawicom Volume 2018
Civil EngineeringAdvances in
Acoustics and VibrationAdvances in
Hindawiwwwhindawicom Volume 2018
Hindawiwwwhindawicom Volume 2018
Electrical and Computer Engineering
Journal of
Advances inOptoElectronics
Hindawiwwwhindawicom
Volume 2018
Hindawi Publishing Corporation httpwwwhindawicom Volume 2013Hindawiwwwhindawicom
The Scientific World Journal
Volume 2018
Control Scienceand Engineering
Journal of
Hindawiwwwhindawicom Volume 2018
Hindawiwwwhindawicom
Journal ofEngineeringVolume 2018
SensorsJournal of
Hindawiwwwhindawicom Volume 2018
International Journal of
RotatingMachinery
Hindawiwwwhindawicom Volume 2018
Modelling ampSimulationin EngineeringHindawiwwwhindawicom Volume 2018
Hindawiwwwhindawicom Volume 2018
Chemical EngineeringInternational Journal of Antennas and
Propagation
International Journal of
Hindawiwwwhindawicom Volume 2018
Hindawiwwwhindawicom Volume 2018
Navigation and Observation
International Journal of
Hindawi
wwwhindawicom Volume 2018
Advances in
Multimedia
Submit your manuscripts atwwwhindawicom
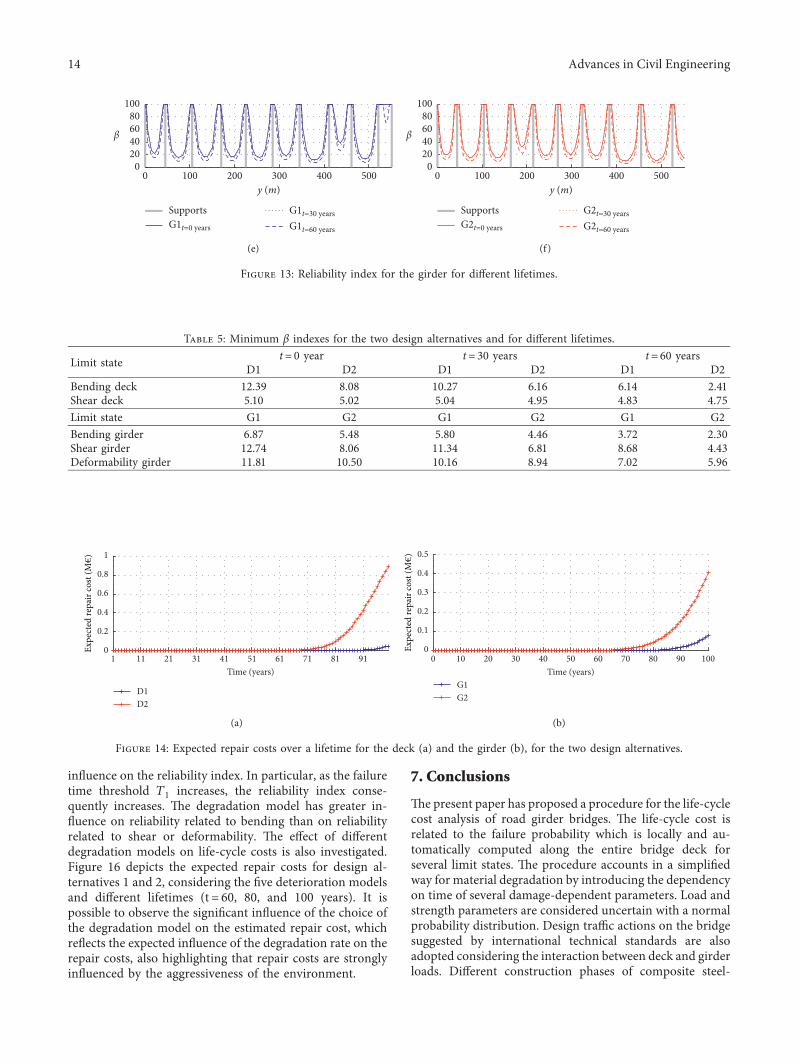
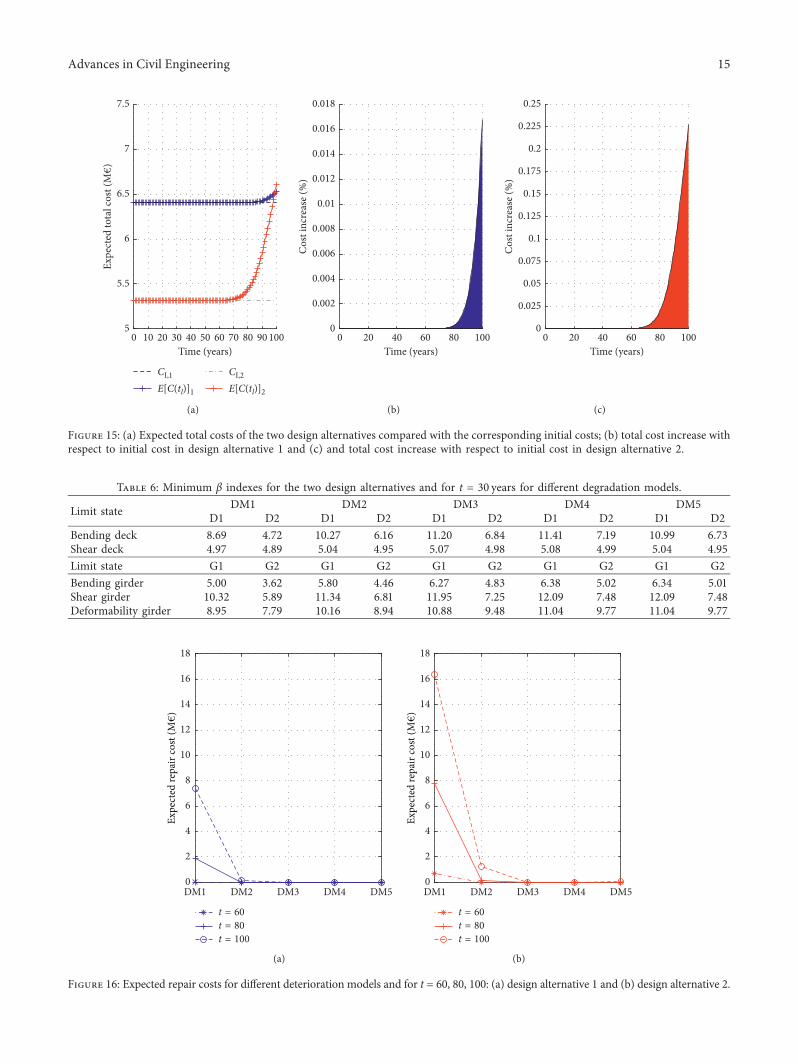

International Journal of
AerospaceEngineeringHindawiwwwhindawicom Volume 2018
RoboticsJournal of
Hindawiwwwhindawicom Volume 2018
Hindawiwwwhindawicom Volume 2018
Active and Passive Electronic Components
VLSI Design
Hindawiwwwhindawicom Volume 2018
Hindawiwwwhindawicom Volume 2018
Shock and Vibration
Hindawiwwwhindawicom Volume 2018
Civil EngineeringAdvances in
Acoustics and VibrationAdvances in
Hindawiwwwhindawicom Volume 2018
Hindawiwwwhindawicom Volume 2018
Electrical and Computer Engineering
Journal of
Advances inOptoElectronics
Hindawiwwwhindawicom
Volume 2018
Hindawi Publishing Corporation httpwwwhindawicom Volume 2013Hindawiwwwhindawicom
The Scientific World Journal
Volume 2018
Control Scienceand Engineering
Journal of
Hindawiwwwhindawicom Volume 2018
Hindawiwwwhindawicom
Journal ofEngineeringVolume 2018
SensorsJournal of
Hindawiwwwhindawicom Volume 2018
International Journal of
RotatingMachinery
Hindawiwwwhindawicom Volume 2018
Modelling ampSimulationin EngineeringHindawiwwwhindawicom Volume 2018
Hindawiwwwhindawicom Volume 2018
Chemical EngineeringInternational Journal of Antennas and
Propagation
International Journal of
Hindawiwwwhindawicom Volume 2018
Hindawiwwwhindawicom Volume 2018
Navigation and Observation
International Journal of
Hindawi
wwwhindawicom Volume 2018
Advances in
Multimedia
Submit your manuscripts atwwwhindawicom