1
Overview of the Surge Pricing Mechanism Results Hypotheses Discussion Methods Praneeth Alla | WH’ 23, SEAS ‘23 Analyzing the Impact of the COVID-19 Pandemic on the Ride-Sharing Industry PURM Mentor: Prof. Gad Allon (OIDD) Ride-sharing companies, including Uber and Lyft, have developed surge pricing algorithms that are meant to increase the fare of trips when the demand for rides significantly exceeds the supply of drivers Trips originating from a given pickup area are multiplied by a surge multiplier, which ranges from 1.2 to a city-specified maximum Despite the income-targeting driver behavior outlined by previous literature, surge-pricing is still used as an intervention to temporarily increase the supply of drivers in certain locations and time periods If we assume that surge pricing decreases the demand for rides and increases the supply of drivers as intended, then studying the change in its usage before and after the COVID-19 pandemic could provide significant insight on the magnitude of the supply and demand shocks caused by the pandemic A decrease in the usage of surge pricing would indicate that the demand shock was more significant than the supply shock, and vice versa. H1: Ride-sharing companies decreased their use of surge pricing after experiencing significant demand and supply shocks This would imply that in comparison to the initial demand shock induced by the pandemic, the proceeding supply shock was less significant H2: The time-of-day distribution of surged trips changed as a result of the COVID-19 pandemic (i.e. surged trips occurred during different times of day) This suggests that the magnitude of the demand and supply shocks induced by the pandemic were dependent on the time of day In order to analyze the change in the usage of surge-pricing before and after the pandemic, we utilized a dataset of 152 million trips that took place in Chicago from November 2018 to March 2020 Because the dataset did not indicate which trips were surged trips, we created an algorithm to estimate the surge multiplier of each trip using a robust linear regression model, which iteratively eliminates “irregular” (i.e. surged) data The equation for the predictive model is as follows: By dividing the actual fare of a trip by the fare predicted by our robust model, we are able to calculate the surge multiplier for each trip Using these estimated surge multipliers, we analyzed the change in the usage of surge pricing (i.e. the percentage of trips with a surge multiplier greater than 1.2) and the magnitude of surge multipliers For each of the 77 community areas in Chicago, we analyzed the change in the use of surge pricing from February 2020 to March 2020, from March 2019 to March 2020, and from March 2020 pre-lockdown to March 2020 post-lockdown In order to analyze whether these surged trips occurred during different times of day, we calculated the proportion of trips that were surged during each of five time periods (AM Off Peak, AM Peak, Midday, PM Peak, PM Off Peak) out of all surged trips in a given day We then identified the community areas in which the proportion of trips that occurred during a certain time period changed significantly in order to determine whether the magnitude of the demand and supply shocks varied with the time of day When we compared the March 2020 surge multipliers to those in February 2020, we found that the usage of surge pricing decreased significantly in 70 out of 77 community areas Similarly, we found that from March 2020 pre-lockdown (March 1 to March 14) vs. post-lockdown (March 15 to March 31), the usage of surge pricing decreased in 66 community areas When we analyzed the time-of-day distribution of surged trips, we found that from February 2020 to March 2020, the proportion of surged trips that occurred during AM Off Peak hours increased significantly, and the proportion that occurred during PM Peak hours decreased significantly Similarly, from March 2019 to March 2020, the proportion of surged trips that occurred during AM Off Peak hours increased, and the proportion that occurred during PM Off Peak hours decreased significantly During our analysis, we found significant evidence that the usage of surge pricing decreased significantly as a result of the COVID-19 pandemic, suggesting that the gap between the demand for rides and the supply of drivers decreased Therefore, the demand shock induced by the pandemic was more significant than the supply shock, suggesting that the ride-sharing industry is more susceptible to demand shocks This could be explained by increasing unemployment and uncertainty during the pandemic that motivated drivers to keep working despite the significant health risks We also found that the time-of-day distribution of surged trips shifted to be later in the day, which could have been caused by one of two reasons: (1) drivers have begun to work later hours as a result of the pandemic and/or (2) the distribution of the demand for rides has shifted earlier in the day Drivers may also shifted the hours that they work because of an overall shift from working for ride-sharing services like Uber to working for food delivery services like Uber Eats The shift in the distribution of the demand for rides could be explained by the closure of bars and restaurants that decreased the demand for rides during PM ”leisure” hours

Analyzing the Impact of the COVID-19 Pandemic on the Ride

  • Upload
    others

  • View
    1

  • Download
    0

Embed Size (px)

Citation preview

Overview of the Surge Pricing Mechanism Results

Hypotheses

Discussion

Methods

Praneeth Alla | WH’ 23, SEAS ‘23

Analyzing the Impact of the COVID-19 Pandemic on the Ride-Sharing Industry

PURM Mentor: Prof. Gad Allon (OIDD)

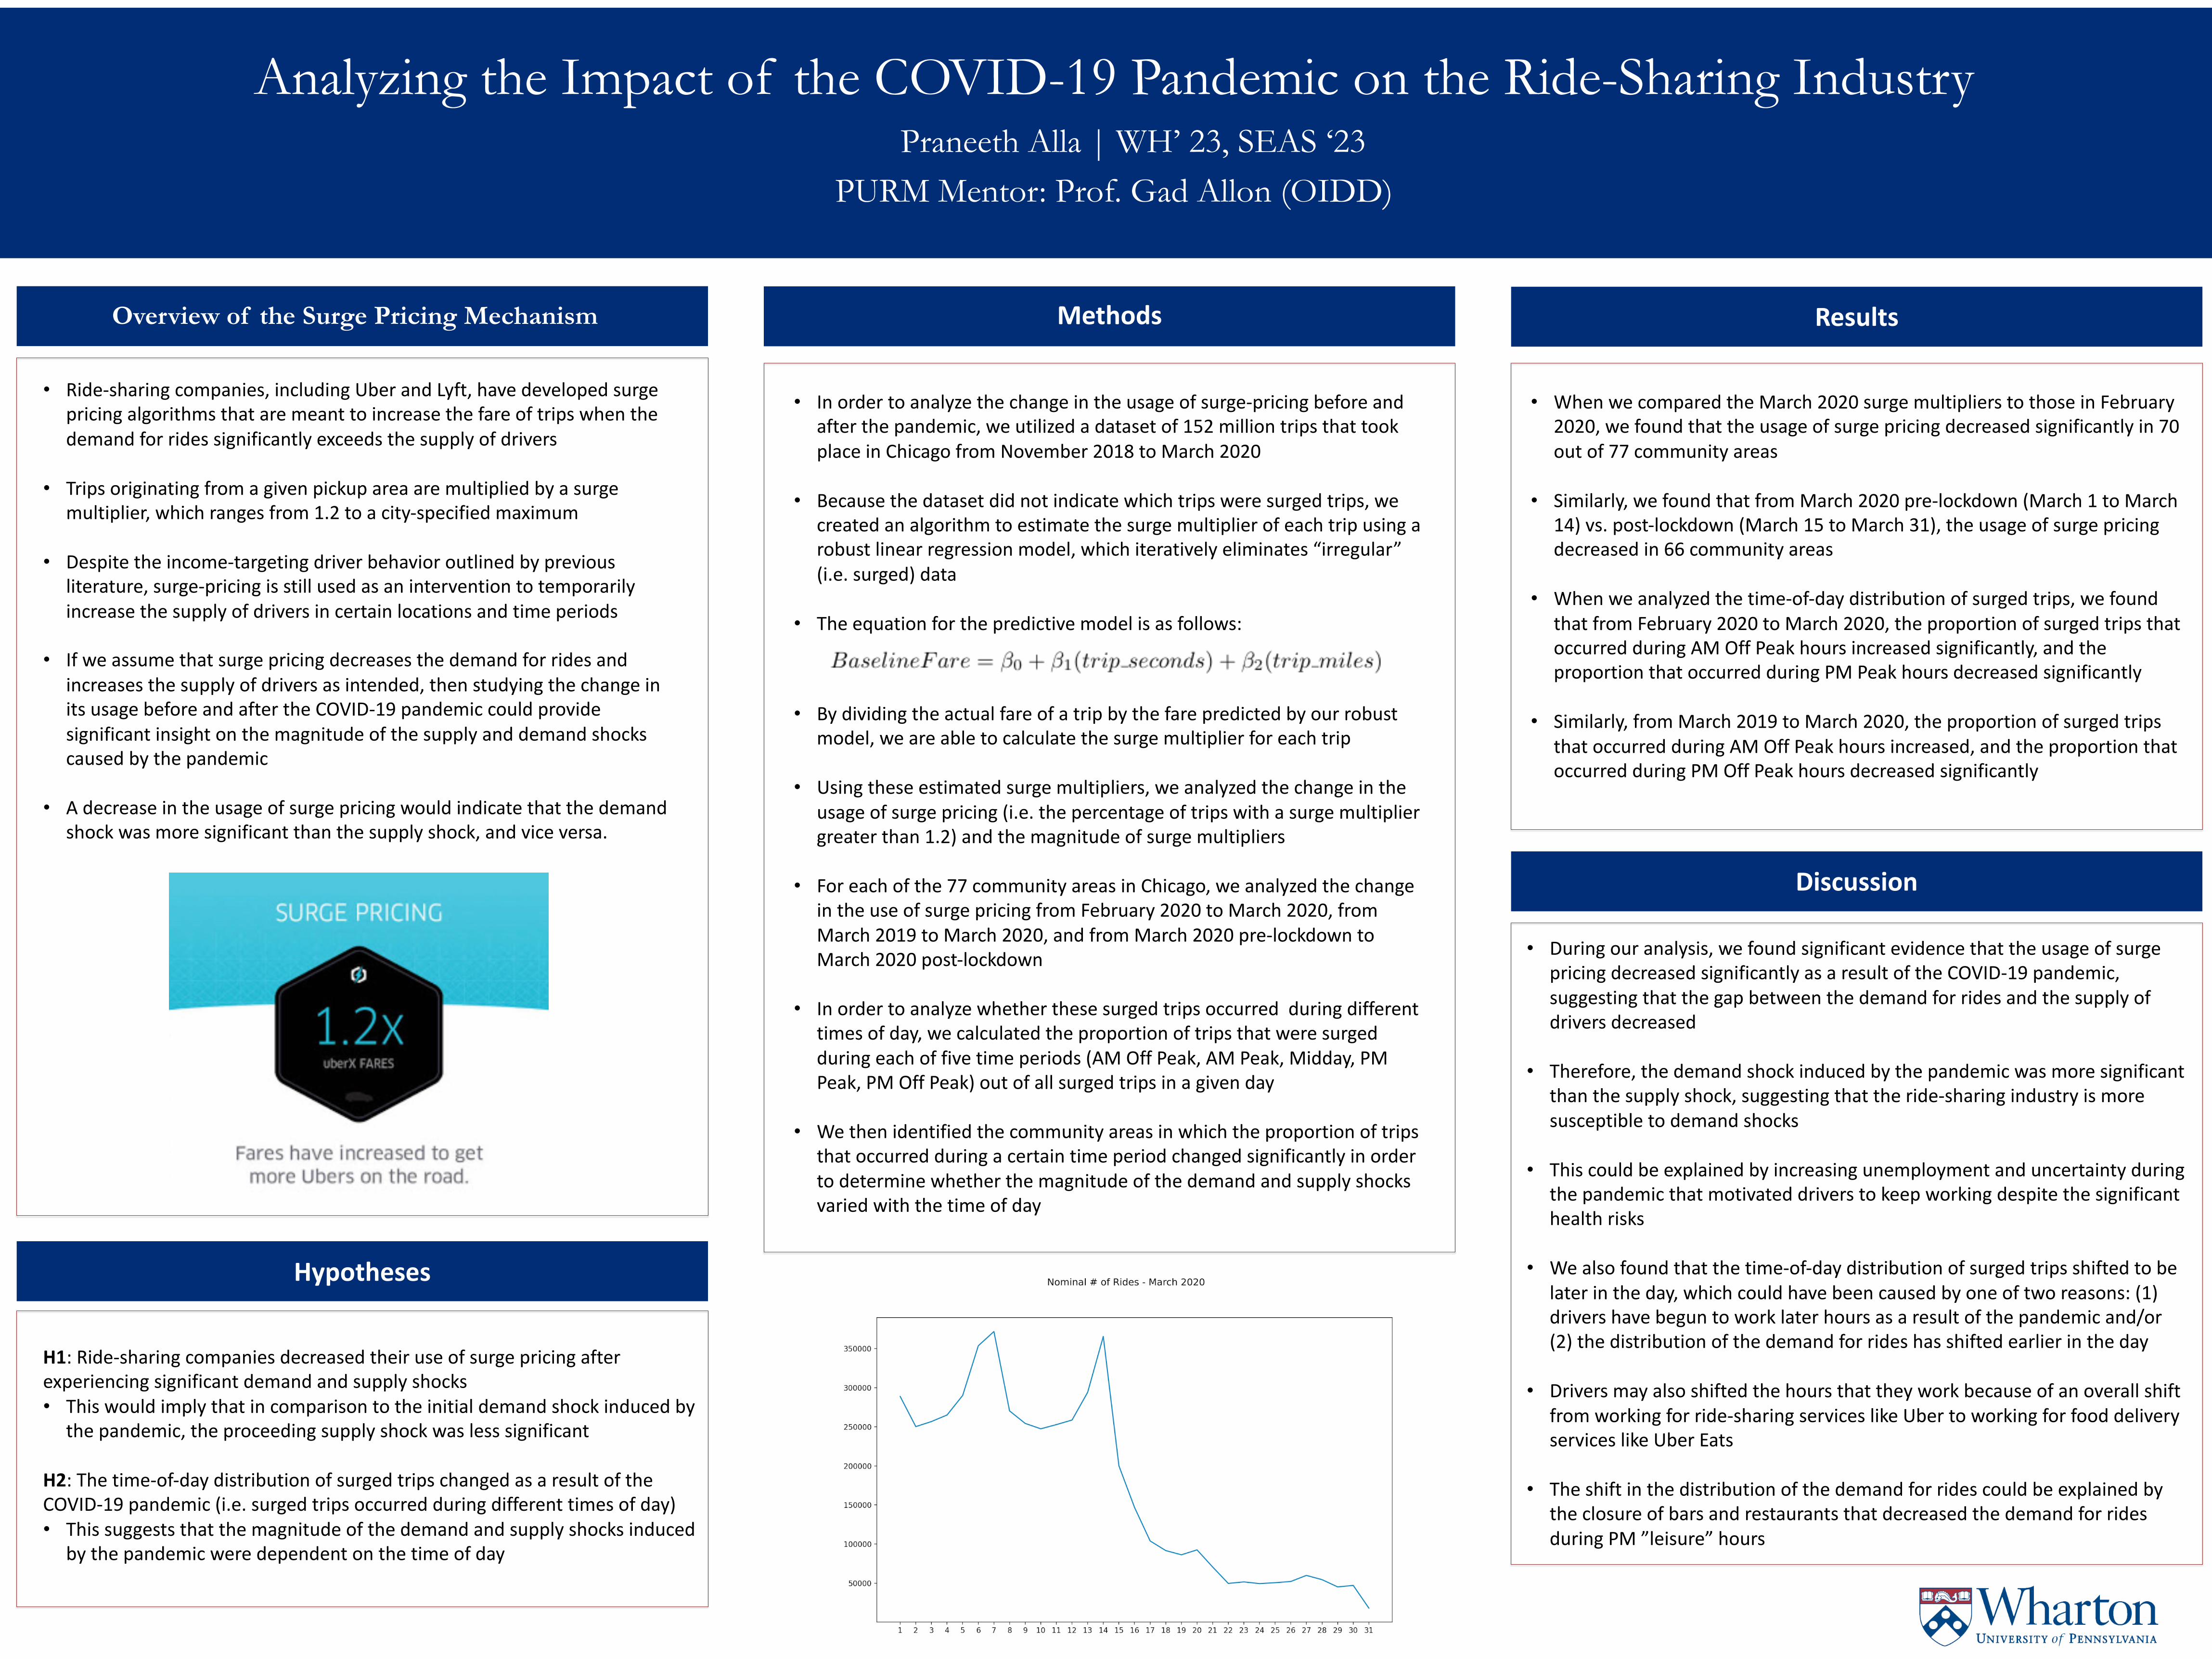
• Ride-sharing companies, including Uber and Lyft, have developed surge pricing algorithms that are meant to increase the fare of trips when the demand for rides significantly exceeds the supply of drivers

• Trips originating from a given pickup area are multiplied by a surge multiplier, which ranges from 1.2 to a city-specified maximum

• Despite the income-targeting driver behavior outlined by previous literature, surge-pricing is still used as an intervention to temporarily increase the supply of drivers in certain locations and time periods

• If we assume that surge pricing decreases the demand for rides and increases the supply of drivers as intended, then studying the change in its usage before and after the COVID-19 pandemic could provide significant insight on the magnitude of the supply and demand shocks caused by the pandemic

• A decrease in the usage of surge pricing would indicate that the demand shock was more significant than the supply shock, and vice versa.

H1: Ride-sharing companies decreased their use of surge pricing after experiencing significant demand and supply shocks• This would imply that in comparison to the initial demand shock induced by

the pandemic, the proceeding supply shock was less significant

H2: The time-of-day distribution of surged trips changed as a result of the COVID-19 pandemic (i.e. surged trips occurred during different times of day)• This suggests that the magnitude of the demand and supply shocks induced

by the pandemic were dependent on the time of day

• In order to analyze the change in the usage of surge-pricing before and after the pandemic, we utilized a dataset of 152 million trips that took place in Chicago from November 2018 to March 2020

• Because the dataset did not indicate which trips were surged trips, we created an algorithm to estimate the surge multiplier of each trip using a robust linear regression model, which iteratively eliminates “irregular” (i.e. surged) data

• The equation for the predictive model is as follows:

• By dividing the actual fare of a trip by the fare predicted by our robust model, we are able to calculate the surge multiplier for each trip

• Using these estimated surge multipliers, we analyzed the change in the usage of surge pricing (i.e. the percentage of trips with a surge multiplier greater than 1.2) and the magnitude of surge multipliers

• For each of the 77 community areas in Chicago, we analyzed the change in the use of surge pricing from February 2020 to March 2020, from March 2019 to March 2020, and from March 2020 pre-lockdown to March 2020 post-lockdown

• In order to analyze whether these surged trips occurred during different times of day, we calculated the proportion of trips that were surged during each of five time periods (AM Off Peak, AM Peak, Midday, PM Peak, PM Off Peak) out of all surged trips in a given day

• We then identified the community areas in which the proportion of trips that occurred during a certain time period changed significantly in order to determine whether the magnitude of the demand and supply shocks varied with the time of day

• When we compared the March 2020 surge multipliers to those in February 2020, we found that the usage of surge pricing decreased significantly in 70out of 77 community areas

• Similarly, we found that from March 2020 pre-lockdown (March 1 to March 14) vs. post-lockdown (March 15 to March 31), the usage of surge pricing decreased in 66 community areas

• When we analyzed the time-of-day distribution of surged trips, we found that from February 2020 to March 2020, the proportion of surged trips that occurred during AM Off Peak hours increased significantly, and the proportion that occurred during PM Peak hours decreased significantly

• Similarly, from March 2019 to March 2020, the proportion of surged trips that occurred during AM Off Peak hours increased, and the proportion that occurred during PM Off Peak hours decreased significantly

• During our analysis, we found significant evidence that the usage of surge pricing decreased significantly as a result of the COVID-19 pandemic, suggesting that the gap between the demand for rides and the supply of drivers decreased

• Therefore, the demand shock induced by the pandemic was more significant than the supply shock, suggesting that the ride-sharing industry is more susceptible to demand shocks

• This could be explained by increasing unemployment and uncertainty during the pandemic that motivated drivers to keep working despite the significanthealth risks

• We also found that the time-of-day distribution of surged trips shifted to be later in the day, which could have been caused by one of two reasons: (1) drivers have begun to work later hours as a result of the pandemic and/or (2) the distribution of the demand for rides has shifted earlier in the day

• Drivers may also shifted the hours that they work because of an overall shiftfrom working for ride-sharing services like Uber to working for food delivery services like Uber Eats

• The shift in the distribution of the demand for rides could be explained by the closure of bars and restaurants that decreased the demand for rides during PM ”leisure” hours