Embed Size (px)
Citation preview
Proceedings Book of ICBSSS, 2014, Malaysia
Handbook on Business Strategy and Social Sciences
ISBN: 978-969-9952-00-5
176
Analyzing Stimulus Factors of Purchase
Intention towards Small Business of Sabana
Fried Chicken viewed from Y and Z Generation
Consumers in order to Sustain Other Small
Business or Franchise
Astrid Wina Lestari1 -- Herry Hudrasyah, MA.
1
1School of Business and Management Institut Teknologi Bandung
ABSTRACT
1. Background Small business is one of the steps to start a business for people who have never owned a business
before. Nowadays, everyone wants to run business, ranging from teenagers to adults even though they
already have a steady income. The reason for running their businesses are varies such as to gain income,
to add pocket money, to get new experience, to try out new things or to become a successful and famous
person.
A few years ago, people were afraid to run business, even though to start a small business and only
several people who were able to run a business. It made business dominated by one person. Relatively,
now everyone can start to run a small business with a smaller risk. Actually, it makes small businesses go
thrive. The competitions of small businesses make all businesses compete to provide the best service and
product to the market.
Nowdays, there are a lot of creative industries like food, fashion, and art. Since then small businesses
bloom, Bandung becomes a city that has a lot of creative small businesses especially in culinary ranging
Nowdays, not all of small businesses can run successfully, even some of them are bankrupt. Researcher
found that actually several of small business did not know what factors that make the consumers purchase
the product. One of small business as the object for this research is Sabana Fried Chicken. In this research
Sabana Fried Chicken was selected as a success role model because they have more than one thousand
branches. This study aims to analyze the stimulus factors that influence consumers to buy Sabana Fried
Chicken product and how much the weight value affected, especially for generation Y and Z in order to
makes sustainability for other small business.
This study was largely based on existing theories in Marketing by Armstrong and Kotler & Marketing
Management, Kotler Keller , 14th edition. There are two methods used, first exploratory research with in-
depth interview and descriptive research through questionnaires to Sabana Fried Chicken consumers
especially for Y and Z generation. After that, researcher made quantitative result by crosstab analysis and
confirmatory factor analysis with SPSS and Lisrel program to know the weight of each factor.
The result shows that from the six factors, the third highest weights affect for Y and Z generation to make a
purchase in Sabana Fried Chicken are retail outlet with weight of 91.5%, products with weight of 72.4%,
and the last is advertisement with weight of 66.1%, Thus, researcher can make a conclusion that the three
factors above must be considered by small businesses owners.
Keywords: Small Business, Purchase Decision, Purchase Intention, Stimulus Factor, Crosstab Analysis,
Confirmatory Factor Analysis
Analyzing Stimulus Factors of Purchase Intention towards…..
177
from a small business on their own or franchising. Mang Dadang, the owner of Fried Chicken Outlet on
Dago Street said that he runs his business because of people current condition. Demand of fried chicken is
high but they do not have enough money to buy fried chicken in big fast food restaurants such as Mc
Donald’s and KFC. Mang Dadang said that his target market is middle low people around Dago village.
On the other hand, Mang Udin, the owner of Fried chicken on Tubagus Street said that he runs his
business because of his daughter who frequently wants to buy fried chicken in McDonald’s but fried
chicken price is not affordable for him. On their journey, Sabana does not use the massive marketing to
engage their customers, but concern in the quality of taste, hygiene, halal and satisfaction of their partner
of business. Up to the present time, Sabana has more than one thousand outlets in Indonesia. On the other
hand, not all of small businesses have a good prospect even among them are on the horns of bankruptcy.
Regarding the Sabana’s success, this research will analyze consumers’ perception towards the selection of
fried chicken consumption based on their needs, especially on small businesses, Sabana Fried Chicken. It
is very important for a small business to be able to understand the important factors that can influence
consumers to make a purchase. This research is also related to the factors that caused the sustainability of
Sabana Fried Chicken from Y and Z generation’s point of view in Bandung.
After seen, interviewed, and observed, the turnover of several small businesses in Bandung, like
Semerbak Coffee, Donald's Burger, and Ma Icih continue to decline over time and some of them are
already bankrupt. It is certainly much different from the current condition of Sabana Fried Chicken.
Author found that actually several of small business did not know what factors that make the consumer
purchase the product. In fact, it’s become very important for small business to be able to understand the
important factors that can influence customers to make a purchase. So the problem identification was
“What stimulus factors that really affected the consumers to buy product in Sabana Fried Chicken
especially for Y and Z generation that can make Sabana Fried Chicken sustain up to the present time?”
This Research was conducted to observe and answer the specific problems with a valid method and
knowledge. This research objective was to find out the stimulus factors that really affected the consumers
to buy Sabana Fried Chicken by analyzing several variable consumer purchase intention such as product,
retail outlets, advertisement, sales personnel, price and situation in order to make a sustainability of other
small business.
Based on the problem identification above, there are two questions for this research to answer:
1. What dominant stimulus factors that influence consumers to buy Sabana Fried Chicken?
2. What is the weight contribution for each stimulus variable factors that can influence
consumer purchase intention to buy Sabana Fried Chicken?
The researcher can find all factors first by observing the current condition of Sabana, so that at the
end of this research we figure out the factors that really influence consumers.
This research has a short time to be finished and there are some boundary set of limits that are
used for this research. The observation was done in Sabana Fried Chicken located in front of Parahyangan
University, Gelap Nyawang Street, and Tubagus Ismail Street. The research was limited to male and
female respondents from Y and Z generation who live in Bandung due to the location of Sabana’s outlet
itself. The people ages are between 17to 32 years old with middle low class economy because Sabana
sells product with affordable price.
2. Literature Review The theories for this research are collected from books, websites, journals and other references. All of
theories are about small business, franchise, shopper behavior, consumer purchasing process, purchase
decision and factor influencing consumer purchasing decision. This research will be answered based on
the theories.
2.1. Small Business Small business is one that is independently owned and operated, is organized for profit, and is not
dominant in its field (The U.S Small Business Administration, 2010). Depending on the industry, size
standard eligibility is based on the average number of employees for the preceding twelve months or on
sales volume averaged over a three-year period. For Retailing small business annual receipts may not
exceed $5.0 to $21.0 million, depending on the particular product being provided.
2.2. Ten keys to Franchise Success According to chapter 18 of Franchising for Dummies, Dave (Said and Thomas (2000)), ten keys to
franchise success are:
Handbook on Business Strategy and Social Sciences
178
1. make sure that you have enough money;
2. follow the system;
3. do not neglect your loved ones;
4. be an enthusiastic operator;
5. recruit the best talent and treat them with respect;
6. teach your employees;
7. give customers Great Service;
8. get Involved with the community;
9. stay in touch with your franchisor and fellow Franchisees;
10. watch the details.
2.3. Consumer Behavior Consumer behavior is the consumer’s decision with respect to the acquisition, consumption and
disposition of goods, service, time and ideas by human decision-making units (Hoyer and Macinnis,
2010). In Marketing Management, Kotler Keller, 14th edition, consumer behavior is the study of how
individuals, groups and organizations select, buy, use and dispose of goods, services, ideas, or
experiences to satisfy their needs and wants (Keller and Philip, 2012).
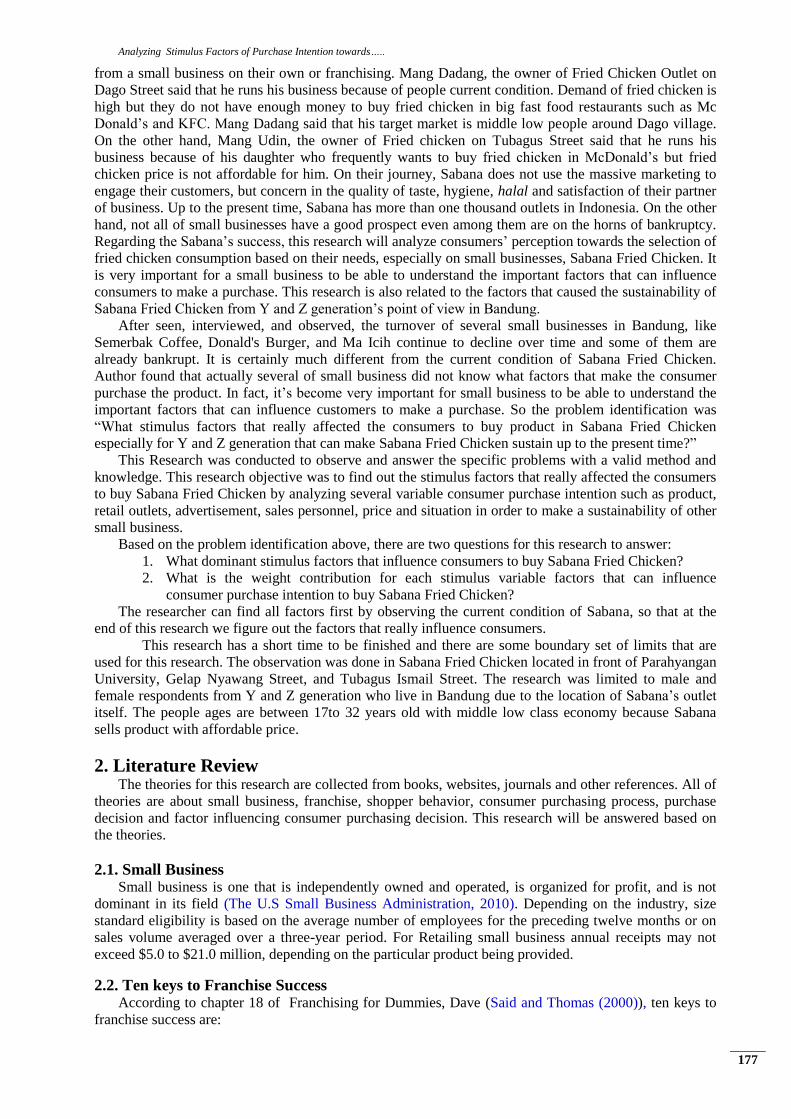
2.4. Consumer Purchasing Process According to Marketing Management, Kotler Keller, 14
th edition, the basic psychological process we’
have reviewed plays an important role in consumers’ actual buying decision. The consumer typically
passes through five stages: problem recognition, information search, evaluation of alternatives, purchase
decision, and post purchase behavior. Clearly, the buying process starts long before the actual purchase
and has consequences long afterward.
Figure-2.1. Five-Stage Model of the Consumer Buying Process
2.4.1. Purchase Decision According to Marketing Management, Kotler Keller,14
th edition, in the evaluating stage, the
consumer forms preferences among the brands in the choice set and may also form an intention to buy the
most preferred brand. In executing a purchase intention, the consumer may make up to five sub decisions:
brand (brand A), dealer (dealer 2), quantity (one computer), timing (weekend), and payment method
(credit card)
Analyzing Stimulus Factors of Purchase Intention towards…..
179
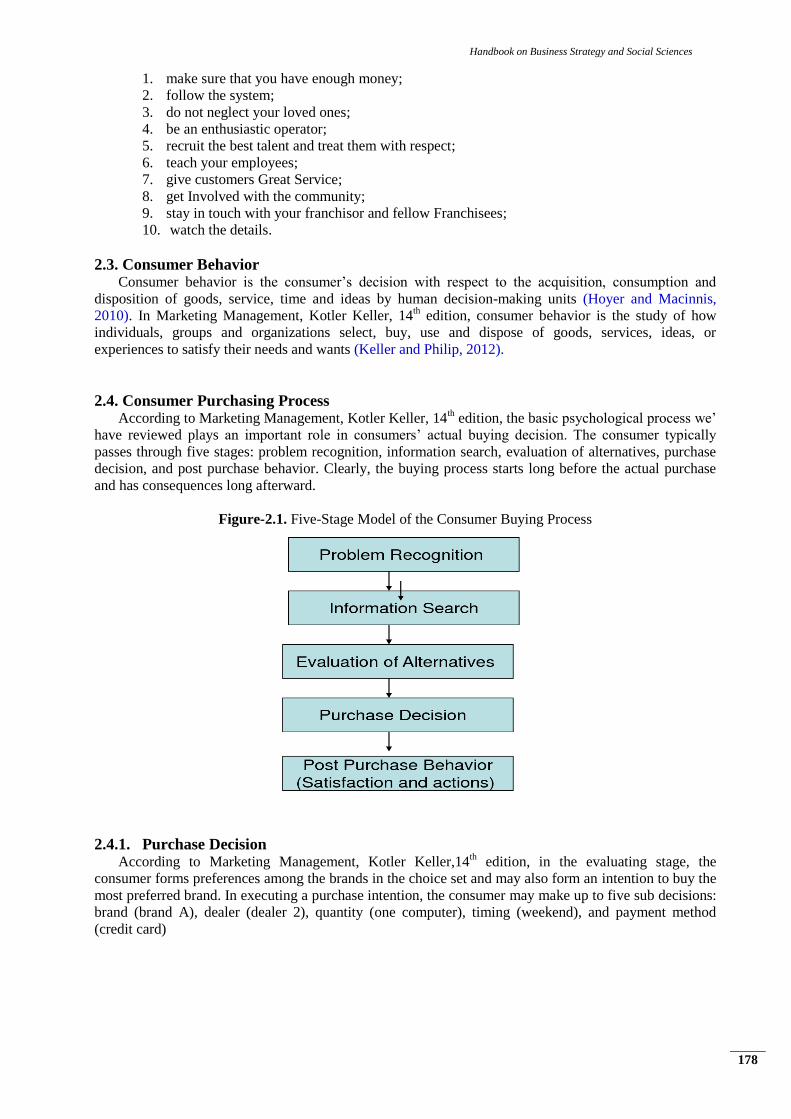
Figure-2.2. Steps between Evaluation of Alternatives and a Purchase Decision
2.4.1.1. Purchase Intention Dodds et al. (1991) explain purchase intention is an attempt to buy a product. Moreover, Kotler
(2000) explains purchase decision in consumer behavior occurs when consumers are stimula Led by
external factors based on their personal characteristics and decision making process. The external factors
are including choosing a product, brand, retailer, Liming and quantity. In other word, purchase intention
will arise after consumers influenced by the choice of a product or brand (Kotler, 2000). Moreover,
purchase intention can be classified as one of the components of consumer cognitive behavior on how an
individual intends to buy a specific brand (Kwek et al., 2010).
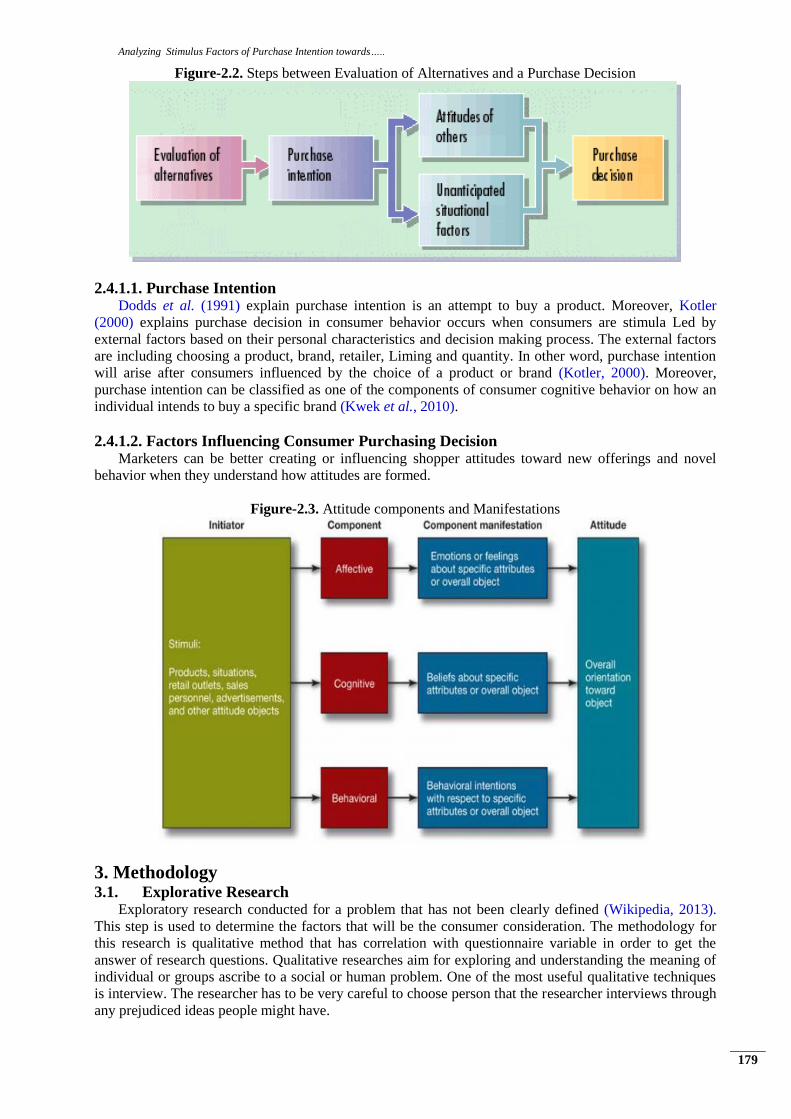
2.4.1.2. Factors Influencing Consumer Purchasing Decision Marketers can be better creating or influencing shopper attitudes toward new offerings and novel
behavior when they understand how attitudes are formed.
Figure-2.3. Attitude components and Manifestations
3. Methodology 3.1. Explorative Research
Exploratory research conducted for a problem that has not been clearly defined (Wikipedia, 2013).
This step is used to determine the factors that will be the consumer consideration. The methodology for
this research is qualitative method that has correlation with questionnaire variable in order to get the
answer of research questions. Qualitative researches aim for exploring and understanding the meaning of
individual or groups ascribe to a social or human problem. One of the most useful qualitative techniques
is interview. The researcher has to be very careful to choose person that the researcher interviews through
any prejudiced ideas people might have.
Handbook on Business Strategy and Social Sciences
180
The strength of qualitative research is its ability to provide complex textual descriptions of how
people experience a given research issue. It provides information about the “human” side of an issue –
that is, the often-contradictory behaviors, beliefs, opinions, emotions, and relationships of individuals.
Qualitative method also effective in identifying intangible factors, such as social norms, socioeconomic
status, gender roles, ethnicity, and religion, whose role in the research issue may not be readily apparent.
When used along with quantitative methods, qualitative research can help us to interpret and better
understand the complex reality of a given situation and the implication of quantitative data.
3.1.1. In-depth Interview Interview is gathering data by asking some question to employee or business owner and customers in
this research. Researcher divided in- depth interview into two session in different place.
3.1.2.Pre In-depth Interview Researcher interviewed three people of fried chicken small business owner and one of ex-owner
coffee small business in order to identify existing condition of fried chicken small business and small
business world. Researcher also interviewed two people of Sabana Fried Chicken sellers in order to
identify existing condition of Sabana Fried Chicken.
3.1.3. Consumers In-depth Interview Researcher conducted perspective perception from customers who ever buy Sabana Fried Chicken to
various ages and genders. The questions varied from the opinion about Sabana Fried Chicken itself and
suggestion to improve stimulus factors that can make them make a purchase.
3.1.4. Observation Observation is a process of data gathering method by observing something carefully in order to gain
information. Observation was also held to identify all the stimulus variable that can be found based on the
theories. Researcher has observed the current condition of Sabana fried chicken related to encouraging
stimulus. The observation included taking some photos to record and to see the needed information.
3.2. Descriptive Research The descriptive research is used to describe characteristic of a population or phenomenon being
studied (Wikipedia 2014). The description is used for frequencies, averages and other statistical
calculations. Based on social science research, the conceptualizing of descriptive research precedes the
hypotheses of explanatory research. For a discussion of how the underlying conceptualization of
exploratory research, descriptive research and explanatory research fit together see conceptual
framework.
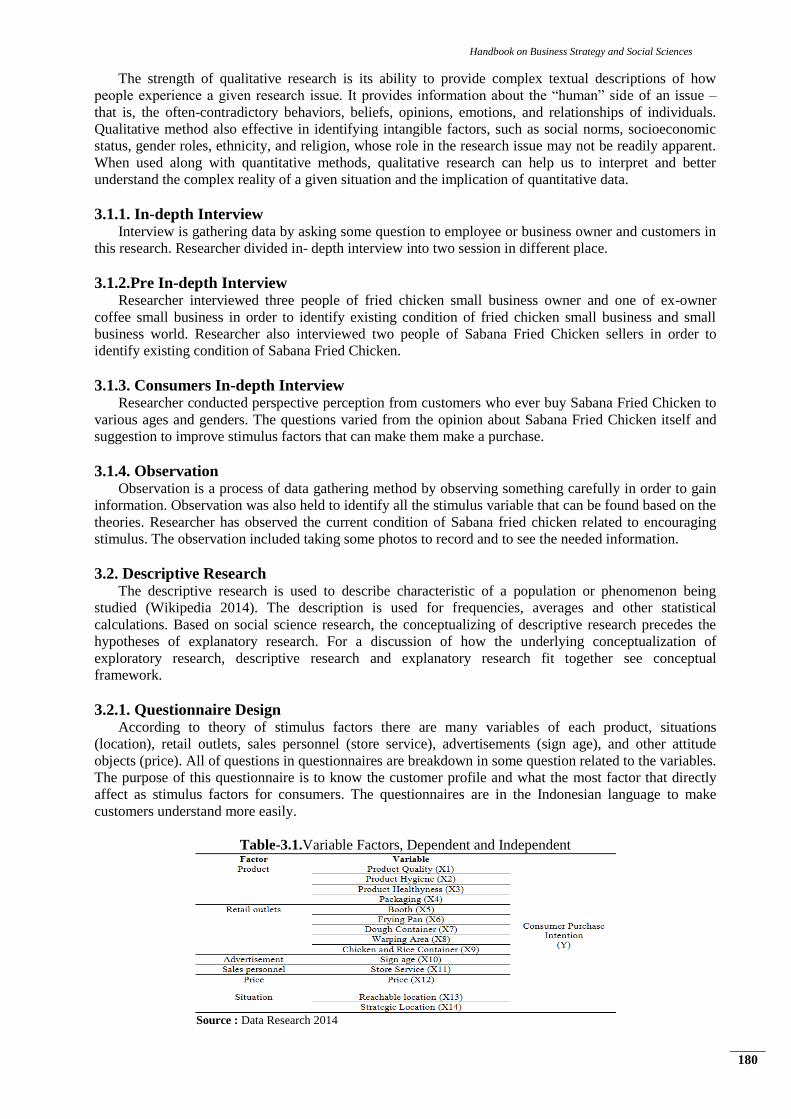
3.2.1. Questionnaire Design According to theory of stimulus factors there are many variables of each product, situations
(location), retail outlets, sales personnel (store service), advertisements (sign age), and other attitude
objects (price). All of questions in questionnaires are breakdown in some question related to the variables.
The purpose of this questionnaire is to know the customer profile and what the most factor that directly
affect as stimulus factors for consumers. The questionnaires are in the Indonesian language to make
customers understand more easily.
Table-3.1.Variable Factors, Dependent and Independent
Source : Data Research 2014
Analyzing Stimulus Factors of Purchase Intention towards…..
181
The respondents answered all questions using multiple choice for consumer demography and multiple
choice multiple response. For descriptive questions Likert scale answer was used, where:
5 = sangat setuju
4 = setuju
3 = biasa saja
2 = setuju
1 = sangat setuju
The researcher distributed the questionnaires to Sabana Fried Chicken consumers. Researcher also made
questionnaires online by Google and distributed them by email or social media.
For quantitative data, questionnaire analysis was conducted by using SPSS to test the reliability and
validity of the questionnaires. For the reliability, The Crombach’s Alpha score was used as guideline and
it has to be above 0.70. For the validity analysis, the corrected item-total correlation from the Reliability
Test was used. Then it was found that all of the variables are valid because the number are greater than
0.3.
After SPSS analysis, the researcher conducted Crosstab analysis. It shows a distribution between two
variables and usually presented as a matrix in the form of a table.Than for the descriptive data analysis
researcher conducted Confirmatory Factor Analysis using LISREL 8.7 to measure the weight of each
independent variable to dependent variable and analyze correlation among indicators variable to make it
explainable to map or to group at correct common factors and as a method to confirm the regression result
on this result.
For the first step, researcher conducted normality distribution asumption test for each variable
indicator both Univariate and Multivariate with this criteria (Barker et al., 2002):
1. Unvariate Normal distribution test : if p-value Chi-square Skweness and Kurtosis are greater
than 0,05 it means Unvariate normal distribution.
2. Multivariate Normal distribution test : if p-value score for Skewness and Kurtosis is less than
0,05 the suitable estimation method for multivariate no normal distribution is Robust Maximum
Likelihood (RML).
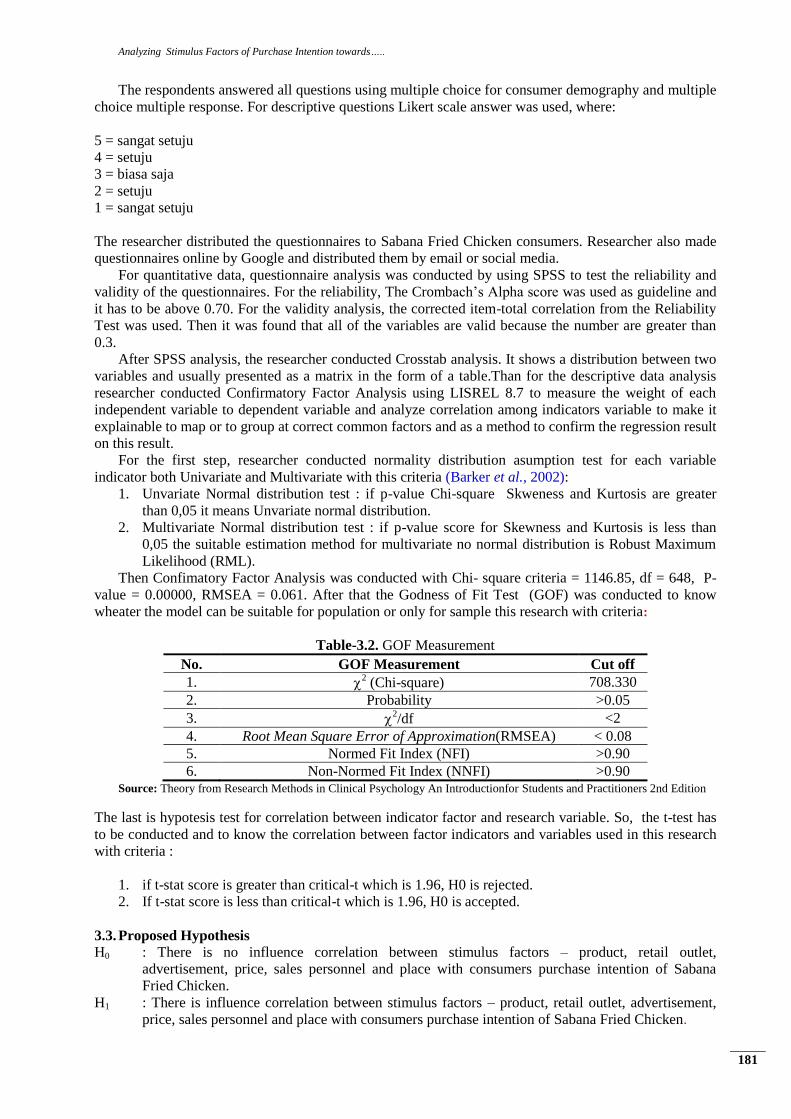
Then Confimatory Factor Analysis was conducted with Chi- square criteria = 1146.85, df = 648, P-
value = 0.00000, RMSEA = 0.061. After that the Godness of Fit Test (GOF) was conducted to know
wheater the model can be suitable for population or only for sample this research with criteria:
Table-3.2. GOF Measurement
No. GOF Measurement Cut off
1. 2 (Chi-square) 708.330
2. Probability >0.05
3. 2/df <2
4. Root Mean Square Error of Approximation(RMSEA) < 0.08
5. Normed Fit Index (NFI) >0.90
6. Non-Normed Fit Index (NNFI) >0.90 Source: Theory from Research Methods in Clinical Psychology An Introductionfor Students and Practitioners 2nd Edition
The last is hypotesis test for correlation between indicator factor and research variable. So, the t-test has
to be conducted and to know the correlation between factor indicators and variables used in this research
with criteria :
1. if t-stat score is greater than critical-t which is 1.96, H0 is rejected.
2. If t-stat score is less than critical-t which is 1.96, H0 is accepted.
3.3. Proposed Hypothesis
H0 : There is no influence correlation between stimulus factors – product, retail outlet,
advertisement, price, sales personnel and place with consumers purchase intention of Sabana
Fried Chicken.
H1 : There is influence correlation between stimulus factors – product, retail outlet, advertisement,
price, sales personnel and place with consumers purchase intention of Sabana Fried Chicken.
Handbook on Business Strategy and Social Sciences
182
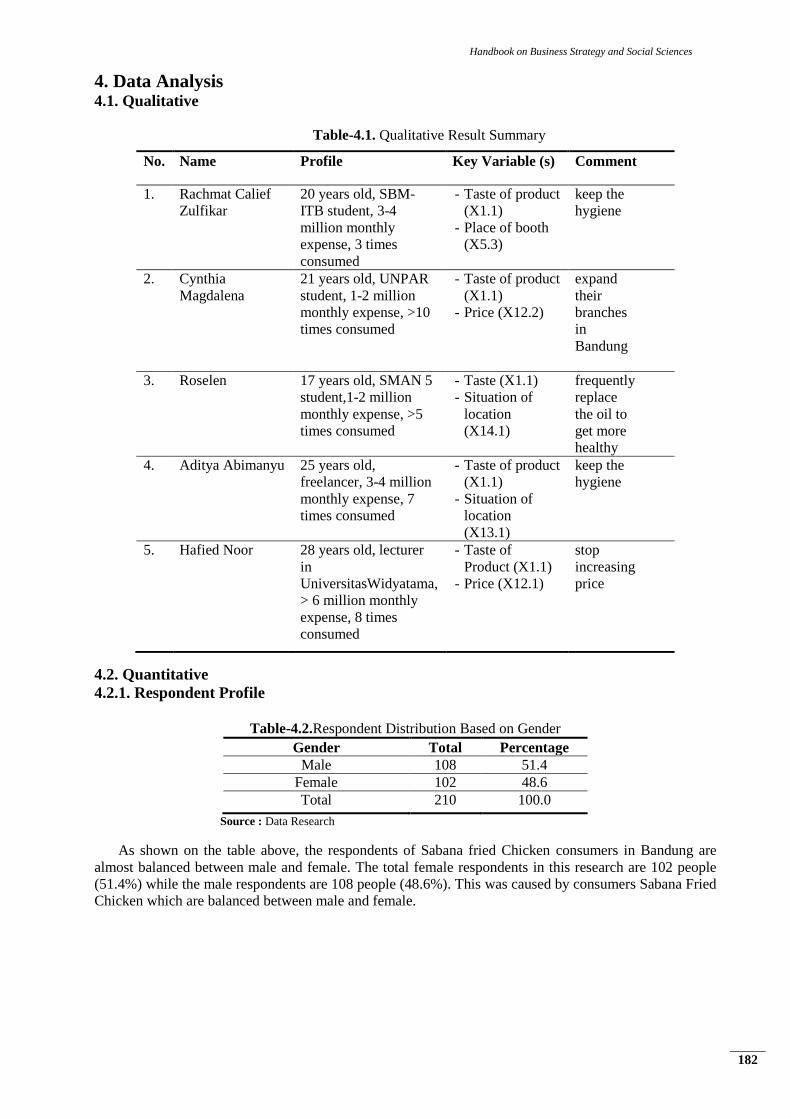
4. Data Analysis 4.1. Qualitative
Table-4.1. Qualitative Result Summary
4.2. Quantitative
4.2.1. Respondent Profile
Table-4.2.Respondent Distribution Based on Gender
Gender Total Percentage
Male 108 51.4
Female 102 48.6
Total 210 100.0
Source : Data Research
As shown on the table above, the respondents of Sabana fried Chicken consumers in Bandung are
almost balanced between male and female. The total female respondents in this research are 102 people
(51.4%) while the male respondents are 108 people (48.6%). This was caused by consumers Sabana Fried
Chicken which are balanced between male and female.
No. Name Profile Key Variable (s) Comment
1. Rachmat Calief
Zulfikar
20 years old, SBM-
ITB student, 3-4
million monthly
expense, 3 times
consumed
- Taste of product
(X1.1)
- Place of booth
(X5.3)
keep the
hygiene
2. Cynthia
Magdalena
21 years old, UNPAR
student, 1-2 million
monthly expense, >10
times consumed
- Taste of product
(X1.1)
- Price (X12.2)
expand
their
branches
in
Bandung
3. Roselen 17 years old, SMAN 5
student,1-2 million
monthly expense, >5
times consumed
- Taste (X1.1)
- Situation of
location
(X14.1)
frequently
replace
the oil to
get more
healthy
4. Aditya Abimanyu 25 years old,
freelancer, 3-4 million
monthly expense, 7
times consumed
- Taste of product
(X1.1)
- Situation of
location
(X13.1)
keep the
hygiene
5. Hafied Noor 28 years old, lecturer
in
UniversitasWidyatama,
> 6 million monthly
expense, 8 times
consumed
- Taste of
Product (X1.1)
- Price (X12.1)
stop
increasing
price
Analyzing Stimulus Factors of Purchase Intention towards…..
183
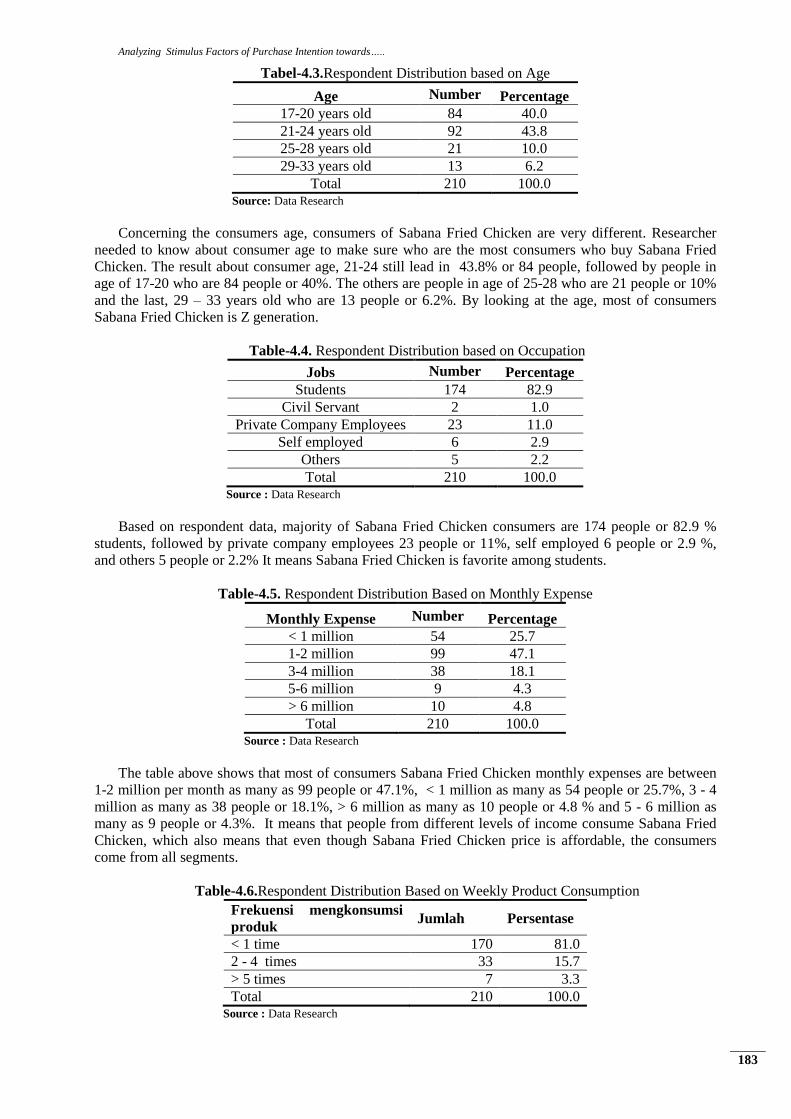
Tabel-4.3.Respondent Distribution based on Age
Age Number Percentage
17-20 years old 84 40.0
21-24 years old 92 43.8
25-28 years old 21 10.0
29-33 years old 13 6.2
Total 210 100.0 Source: Data Research
Concerning the consumers age, consumers of Sabana Fried Chicken are very different. Researcher
needed to know about consumer age to make sure who are the most consumers who buy Sabana Fried
Chicken. The result about consumer age, 21-24 still lead in 43.8% or 84 people, followed by people in
age of 17-20 who are 84 people or 40%. The others are people in age of 25-28 who are 21 people or 10%
and the last, 29 – 33 years old who are 13 people or 6.2%. By looking at the age, most of consumers
Sabana Fried Chicken is Z generation.
Table-4.4. Respondent Distribution based on Occupation
Jobs Number Percentage
Students 174 82.9
Civil Servant 2 1.0
Private Company Employees 23 11.0
Self employed 6 2.9
Others 5 2.2
Total 210 100.0 Source : Data Research
Based on respondent data, majority of Sabana Fried Chicken consumers are 174 people or 82.9 %
students, followed by private company employees 23 people or 11%, self employed 6 people or 2.9 %,
and others 5 people or 2.2% It means Sabana Fried Chicken is favorite among students.
Table-4.5. Respondent Distribution Based on Monthly Expense
Monthly Expense Number Percentage
< 1 million 54 25.7
1-2 million 99 47.1
3-4 million 38 18.1
5-6 million 9 4.3
> 6 million 10 4.8
Total 210 100.0 Source : Data Research
The table above shows that most of consumers Sabana Fried Chicken monthly expenses are between
1-2 million per month as many as 99 people or 47.1%, < 1 million as many as 54 people or 25.7%, 3 - 4
million as many as 38 people or 18.1%, > 6 million as many as 10 people or 4.8 % and 5 - 6 million as
many as 9 people or 4.3%. It means that people from different levels of income consume Sabana Fried
Chicken, which also means that even though Sabana Fried Chicken price is affordable, the consumers
come from all segments.
Table-4.6.Respondent Distribution Based on Weekly Product Consumption
Frekuensi mengkonsumsi
produk Jumlah Persentase
< 1 time 170 81.0
2 - 4 times 33 15.7
> 5 times 7 3.3
Total 210 100.0 Source : Data Research
Handbook on Business Strategy and Social Sciences
184
Based on the data above, mostly respondents consume Sabana Fried chicken once a week which
can be seen on the table that 170 out of 210 or 81% consume Sabana Fried Chicken followed by 2-4
times a week that 33 out of 210 or 15.7 percent and > 5 times a week that 7 people out of 210 or 3.3%
consume Sabana Fried Chicken.
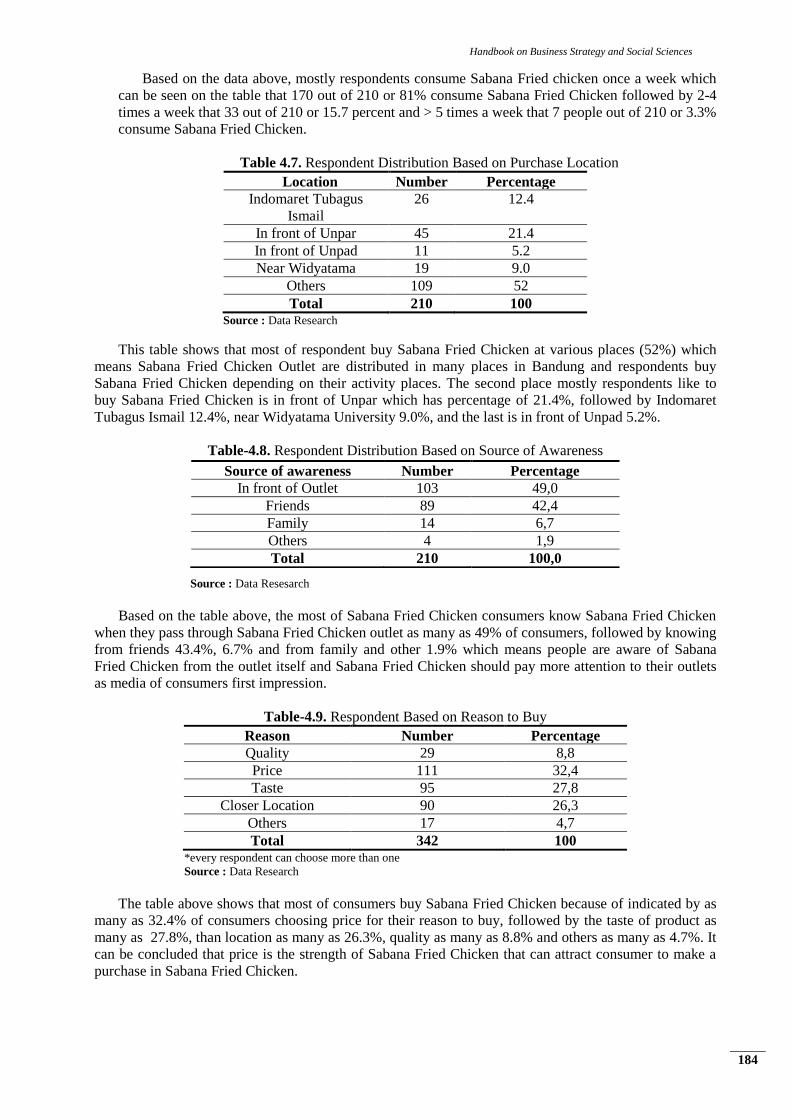
Table 4.7. Respondent Distribution Based on Purchase Location
Location Number Percentage
Indomaret Tubagus
Ismail
26 12.4
In front of Unpar 45 21.4
In front of Unpad 11 5.2
Near Widyatama 19 9.0
Others 109 52
Total 210 100 Source : Data Research
This table shows that most of respondent buy Sabana Fried Chicken at various places (52%) which
means Sabana Fried Chicken Outlet are distributed in many places in Bandung and respondents buy
Sabana Fried Chicken depending on their activity places. The second place mostly respondents like to
buy Sabana Fried Chicken is in front of Unpar which has percentage of 21.4%, followed by Indomaret
Tubagus Ismail 12.4%, near Widyatama University 9.0%, and the last is in front of Unpad 5.2%.
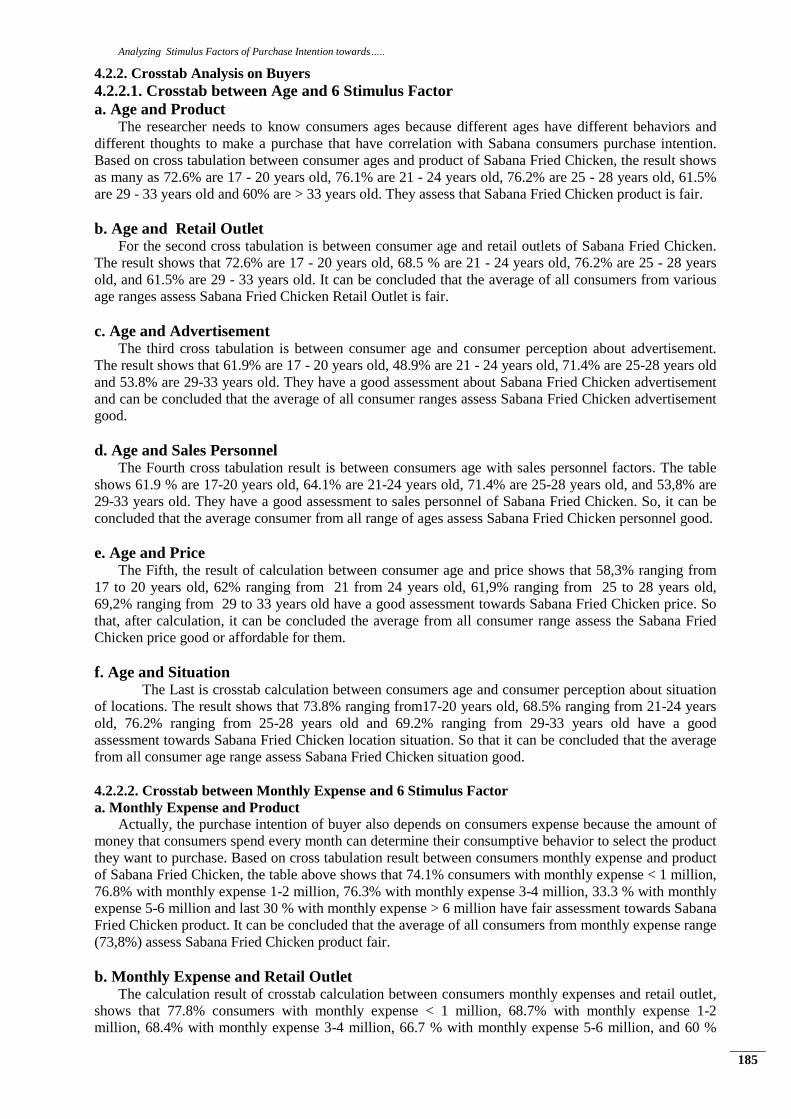
Table-4.8. Respondent Distribution Based on Source of Awareness
Source : Data Resesarch
Based on the table above, the most of Sabana Fried Chicken consumers know Sabana Fried Chicken
when they pass through Sabana Fried Chicken outlet as many as 49% of consumers, followed by knowing
from friends 43.4%, 6.7% and from family and other 1.9% which means people are aware of Sabana
Fried Chicken from the outlet itself and Sabana Fried Chicken should pay more attention to their outlets
as media of consumers first impression.
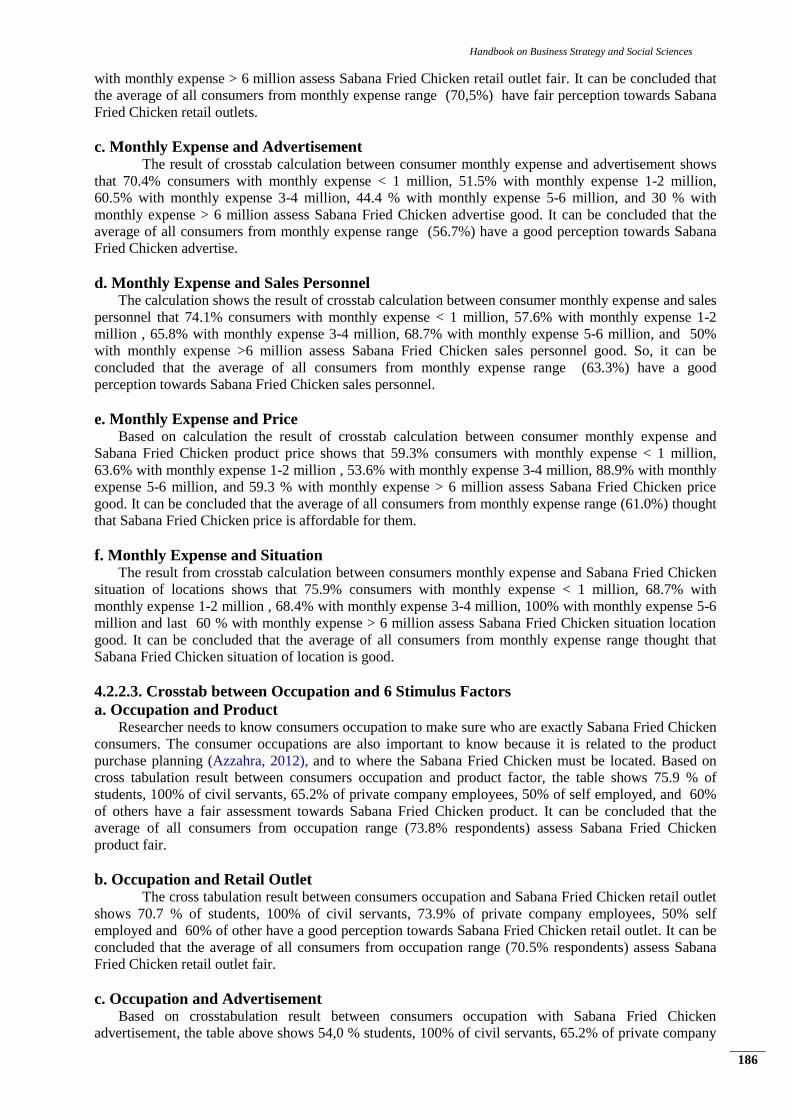
Table-4.9. Respondent Based on Reason to Buy
Reason Number Percentage
Quality 29 8,8
Price 111 32,4
Taste 95 27,8
Closer Location 90 26,3
Others 17 4,7
Total 342 100 *every respondent can choose more than one
Source : Data Research
The table above shows that most of consumers buy Sabana Fried Chicken because of indicated by as
many as 32.4% of consumers choosing price for their reason to buy, followed by the taste of product as
many as 27.8%, than location as many as 26.3%, quality as many as 8.8% and others as many as 4.7%. It
can be concluded that price is the strength of Sabana Fried Chicken that can attract consumer to make a
purchase in Sabana Fried Chicken.
Source of awareness Number Percentage
In front of Outlet 103 49,0
Friends 89 42,4
Family 14 6,7
Others 4 1,9
Total 210 100,0
Analyzing Stimulus Factors of Purchase Intention towards…..
185
4.2.2. Crosstab Analysis on Buyers
4.2.2.1. Crosstab between Age and 6 Stimulus Factor
a. Age and Product The researcher needs to know consumers ages because different ages have different behaviors and
different thoughts to make a purchase that have correlation with Sabana consumers purchase intention.
Based on cross tabulation between consumer ages and product of Sabana Fried Chicken, the result shows
as many as 72.6% are 17 - 20 years old, 76.1% are 21 - 24 years old, 76.2% are 25 - 28 years old, 61.5%
are 29 - 33 years old and 60% are > 33 years old. They assess that Sabana Fried Chicken product is fair.
b. Age and Retail Outlet For the second cross tabulation is between consumer age and retail outlets of Sabana Fried Chicken.
The result shows that 72.6% are 17 - 20 years old, 68.5 % are 21 - 24 years old, 76.2% are 25 - 28 years
old, and 61.5% are 29 - 33 years old. It can be concluded that the average of all consumers from various
age ranges assess Sabana Fried Chicken Retail Outlet is fair.
c. Age and Advertisement The third cross tabulation is between consumer age and consumer perception about advertisement.
The result shows that 61.9% are 17 - 20 years old, 48.9% are 21 - 24 years old, 71.4% are 25-28 years old
and 53.8% are 29-33 years old. They have a good assessment about Sabana Fried Chicken advertisement
and can be concluded that the average of all consumer ranges assess Sabana Fried Chicken advertisement
good.
d. Age and Sales Personnel The Fourth cross tabulation result is between consumers age with sales personnel factors. The table
shows 61.9 % are 17-20 years old, 64.1% are 21-24 years old, 71.4% are 25-28 years old, and 53,8% are
29-33 years old. They have a good assessment to sales personnel of Sabana Fried Chicken. So, it can be
concluded that the average consumer from all range of ages assess Sabana Fried Chicken personnel good.
e. Age and Price The Fifth, the result of calculation between consumer age and price shows that 58,3% ranging from
17 to 20 years old, 62% ranging from 21 from 24 years old, 61,9% ranging from 25 to 28 years old,
69,2% ranging from 29 to 33 years old have a good assessment towards Sabana Fried Chicken price. So
that, after calculation, it can be concluded the average from all consumer range assess the Sabana Fried
Chicken price good or affordable for them.
f. Age and Situation The Last is crosstab calculation between consumers age and consumer perception about situation
of locations. The result shows that 73.8% ranging from17-20 years old, 68.5% ranging from 21-24 years
old, 76.2% ranging from 25-28 years old and 69.2% ranging from 29-33 years old have a good
assessment towards Sabana Fried Chicken location situation. So that it can be concluded that the average
from all consumer age range assess Sabana Fried Chicken situation good.
4.2.2.2. Crosstab between Monthly Expense and 6 Stimulus Factor
a. Monthly Expense and Product
Actually, the purchase intention of buyer also depends on consumers expense because the amount of
money that consumers spend every month can determine their consumptive behavior to select the product
they want to purchase. Based on cross tabulation result between consumers monthly expense and product
of Sabana Fried Chicken, the table above shows that 74.1% consumers with monthly expense < 1 million,
76.8% with monthly expense 1-2 million, 76.3% with monthly expense 3-4 million, 33.3 % with monthly
expense 5-6 million and last 30 % with monthly expense > 6 million have fair assessment towards Sabana
Fried Chicken product. It can be concluded that the average of all consumers from monthly expense range
(73,8%) assess Sabana Fried Chicken product fair.
b. Monthly Expense and Retail Outlet The calculation result of crosstab calculation between consumers monthly expenses and retail outlet,
shows that 77.8% consumers with monthly expense < 1 million, 68.7% with monthly expense 1-2
million, 68.4% with monthly expense 3-4 million, 66.7 % with monthly expense 5-6 million, and 60 %
Handbook on Business Strategy and Social Sciences
186
with monthly expense > 6 million assess Sabana Fried Chicken retail outlet fair. It can be concluded that
the average of all consumers from monthly expense range (70,5%) have fair perception towards Sabana
Fried Chicken retail outlets.
c. Monthly Expense and Advertisement The result of crosstab calculation between consumer monthly expense and advertisement shows
that 70.4% consumers with monthly expense < 1 million, 51.5% with monthly expense 1-2 million,
60.5% with monthly expense 3-4 million, 44.4 % with monthly expense 5-6 million, and 30 % with
monthly expense > 6 million assess Sabana Fried Chicken advertise good. It can be concluded that the
average of all consumers from monthly expense range (56.7%) have a good perception towards Sabana
Fried Chicken advertise.
d. Monthly Expense and Sales Personnel The calculation shows the result of crosstab calculation between consumer monthly expense and sales
personnel that 74.1% consumers with monthly expense < 1 million, 57.6% with monthly expense 1-2
million , 65.8% with monthly expense 3-4 million, 68.7% with monthly expense 5-6 million, and 50%
with monthly expense >6 million assess Sabana Fried Chicken sales personnel good. So, it can be
concluded that the average of all consumers from monthly expense range (63.3%) have a good
perception towards Sabana Fried Chicken sales personnel.
e. Monthly Expense and Price Based on calculation the result of crosstab calculation between consumer monthly expense and
Sabana Fried Chicken product price shows that 59.3% consumers with monthly expense < 1 million,
63.6% with monthly expense 1-2 million , 53.6% with monthly expense 3-4 million, 88.9% with monthly
expense 5-6 million, and 59.3 % with monthly expense > 6 million assess Sabana Fried Chicken price
good. It can be concluded that the average of all consumers from monthly expense range (61.0%) thought
that Sabana Fried Chicken price is affordable for them.
f. Monthly Expense and Situation The result from crosstab calculation between consumers monthly expense and Sabana Fried Chicken
situation of locations shows that 75.9% consumers with monthly expense < 1 million, 68.7% with
monthly expense 1-2 million , 68.4% with monthly expense 3-4 million, 100% with monthly expense 5-6
million and last 60 % with monthly expense > 6 million assess Sabana Fried Chicken situation location
good. It can be concluded that the average of all consumers from monthly expense range thought that
Sabana Fried Chicken situation of location is good.
4.2.2.3. Crosstab between Occupation and 6 Stimulus Factors
a. Occupation and Product Researcher needs to know consumers occupation to make sure who are exactly Sabana Fried Chicken
consumers. The consumer occupations are also important to know because it is related to the product
purchase planning (Azzahra, 2012), and to where the Sabana Fried Chicken must be located. Based on
cross tabulation result between consumers occupation and product factor, the table shows 75.9 % of
students, 100% of civil servants, 65.2% of private company employees, 50% of self employed, and 60%
of others have a fair assessment towards Sabana Fried Chicken product. It can be concluded that the
average of all consumers from occupation range (73.8% respondents) assess Sabana Fried Chicken
product fair.
b. Occupation and Retail Outlet The cross tabulation result between consumers occupation and Sabana Fried Chicken retail outlet
shows 70.7 % of students, 100% of civil servants, 73.9% of private company employees, 50% self
employed and 60% of other have a good perception towards Sabana Fried Chicken retail outlet. It can be
concluded that the average of all consumers from occupation range (70.5% respondents) assess Sabana
Fried Chicken retail outlet fair.
c. Occupation and Advertisement Based on crosstabulation result between consumers occupation with Sabana Fried Chicken
advertisement, the table above shows 54,0 % students, 100% of civil servants, 65.2% of private company
Analyzing Stimulus Factors of Purchase Intention towards…..
187
employees, 66.7% of self employed, and 80% of others have a good assessment towards advertisement.
It can be concluded that the average of all consumers from occupation range (56.7%) respondents assess
Sabana Fried Chicken advertisement good.
d. Occupation and Sales Personnel The cross tabulation result between consumers occupation and Sabana Fried Chicken sales personnel
shows 64.9% of students, 100% of civil servants, 47.8% of private company employees, 50% of self
employed and 80% of others have a good perception towards Sabana Fried Chicken sales personnel. It
can be concluded that the average of all consumers from occupation range (63.3%) respondents assess
Sabana Fried Chicken sales personnel good.
e. Occupation and Price The cross tabulation calculation result between consumers occupation and price of Sabana Fried
Chicken product shows 60.3% of students, 0% of civil servants, 60.9% of private company employees,
83.3% of self employed, and 80% of others said that Sabana Fried Chicken price is good for them. It can
be concluded that the average of all consumers from occupation range (61.0%) respondents assess Sabana
Fried Chicken price affordable for them.
f. Occupation and Situation The last is cross tabulation calculation between consumer occupation and Sabana Fried Chicken
location situation. The result shows 72.4% of students, 100% of civil servants, 60.9% of private company
employees, 83.3% of self employed, and 60% of others have a good perception towards Sabana Fried
Chicken location situation. . It can be concluded that the average of all consumers from occupation range
(71.4% respondents) assess Sabana Fried Chicken location good.
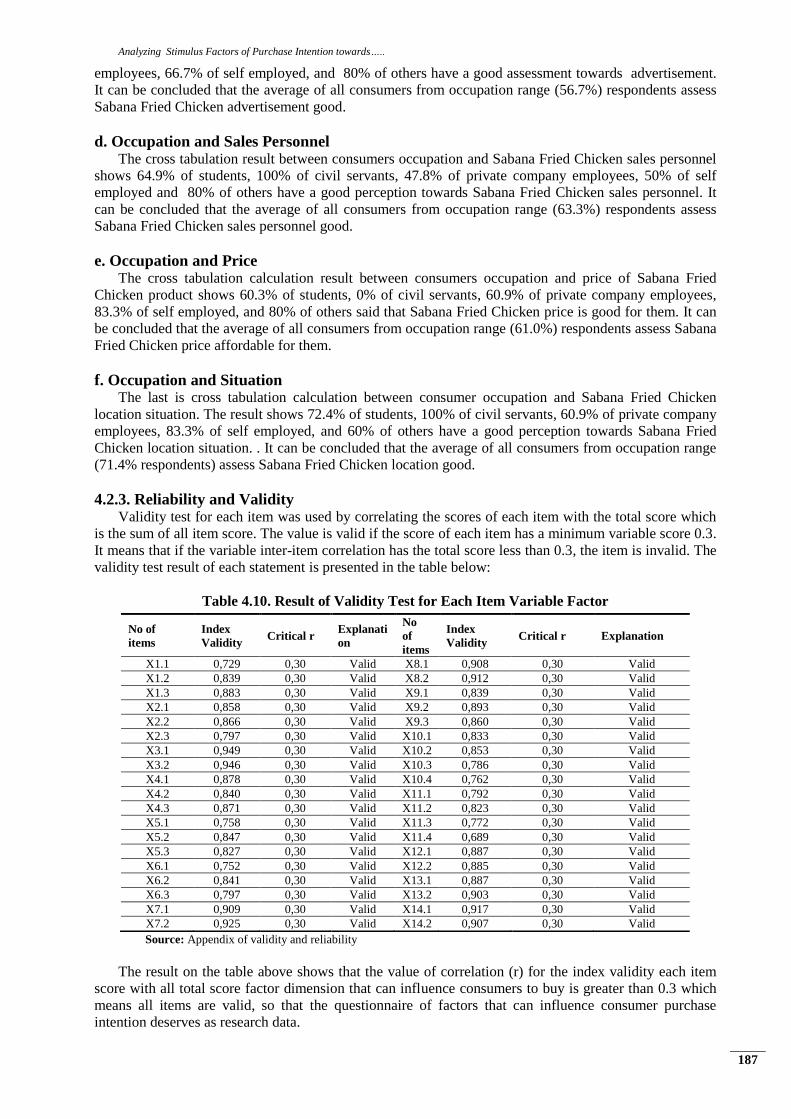
4.2.3. Reliability and Validity Validity test for each item was used by correlating the scores of each item with the total score which
is the sum of all item score. The value is valid if the score of each item has a minimum variable score 0.3.
It means that if the variable inter-item correlation has the total score less than 0.3, the item is invalid. The
validity test result of each statement is presented in the table below:
Table 4.10. Result of Validity Test for Each Item Variable Factor
Source: Appendix of validity and reliability
The result on the table above shows that the value of correlation (r) for the index validity each item
score with all total score factor dimension that can influence consumers to buy is greater than 0.3 which
means all items are valid, so that the questionnaire of factors that can influence consumer purchase
intention deserves as research data.
No of
items
Index
Validity Critical r
Explanati
on
No
of
items
Index
Validity Critical r Explanation
X1.1 0,729 0,30 Valid X8.1 0,908 0,30 Valid
X1.2 0,839 0,30 Valid X8.2 0,912 0,30 Valid
X1.3 0,883 0,30 Valid X9.1 0,839 0,30 Valid
X2.1 0,858 0,30 Valid X9.2 0,893 0,30 Valid
X2.2 0,866 0,30 Valid X9.3 0,860 0,30 Valid
X2.3 0,797 0,30 Valid X10.1 0,833 0,30 Valid
X3.1 0,949 0,30 Valid X10.2 0,853 0,30 Valid
X3.2 0,946 0,30 Valid X10.3 0,786 0,30 Valid
X4.1 0,878 0,30 Valid X10.4 0,762 0,30 Valid
X4.2 0,840 0,30 Valid X11.1 0,792 0,30 Valid
X4.3 0,871 0,30 Valid X11.2 0,823 0,30 Valid
X5.1 0,758 0,30 Valid X11.3 0,772 0,30 Valid
X5.2 0,847 0,30 Valid X11.4 0,689 0,30 Valid
X5.3 0,827 0,30 Valid X12.1 0,887 0,30 Valid
X6.1 0,752 0,30 Valid X12.2 0,885 0,30 Valid
X6.2 0,841 0,30 Valid X13.1 0,887 0,30 Valid
X6.3 0,797 0,30 Valid X13.2 0,903 0,30 Valid
X7.1 0,909 0,30 Valid X14.1 0,917 0,30 Valid
X7.2 0,925 0,30 Valid X14.2 0,907 0,30 Valid

Handbook on Business Strategy and Social Sciences
188
The reliability test used is Crombach Alpha formula. The test results can be reliable if the score of
reliability coefficient positive and above 0.7. Based on calculation process by SPSS the result is as follows:
Table-4.11.Result of Reability Test
Reliability Statistics
Cronbach's
Alpha
N of Items
0.949 38 Source : Appendix of Validity and Reliability Test
The result table above shows that the questionnaire all of variables factors influencing consumer
purchasing decisions have reliability coefficient greater than 0.70, so that the questionnaire variables are
empirically reliable and can be used in this research for further research.
4.2.4. Data Analysis 4.2.4.1 Confirmatory Analysis
a. Normal Distribution Test The correct estimation method for Confirmatory Factor Analysis can be determined based on type of
data distribution that for the first step, researcher is to conduct normality distribution asumption test for
each variable indicator for both Univariate and Multivariate. Normality Univariate test aims to check
wheter each item variable data is normal distribution or not, while Normality Multivariate test is used to
know whether all of variables indicators are normal distribution or not.
For normal distribution data, the parameter estimation test is used with Maximum Likelihood method,
while for data with not normal distribution the test is used with Robust Maximum Likelihood method.
Normality the test is conducted by seeing the score of Skewness and Kurtosis statistic. The criteria for
this test, if p-value Chi-square Skweness and Kurtosis is greater than 0.05, it means Unvariate normal
distribution. The result of normality test for this research shown on the table below :
Tabel-4.12. Unvariate Normal Distribution Test
Variabel
Skewness Kurtosis Skewness and
Kurtosis Keterangan
Z-
Score
P-
Value Z-Score
P-
Value
Chi-
Square P-Value
X1.1 -4.655 0.000 3.427 0.001 33.409 0.000 Tidak Normal
X1.2 -1.877 0.061 0.062 0.950 3.525 0.172 Normal
X1.3 -2.029 0.043 1.103 0.270 5.333 0.070 Normal
X2.1 -2.651 0.008 0.167 0.868 7.055 0.029 Tidak Normal
X2.2 -2.014 0.044 0.583 0.560 4.396 0.111 Normal
X2.3 -2.179 0.029 -0.883 0.377 5.527 0.063 Normal
X3.1 1.254 0.210 -1.975 0.048 5.474 0.065 Normal
X3.2 0.575 0.565 -0.019 0.985 0.331 0.847 Normal
X4.1 -0.995 0.320 -0.958 0.338 1.906 0.385 Normal
X4.2 -1.309 0.190 -0.891 0.373 2.508 0.285 Normal
X4.3 -2.294 0.022 0.444 0.657 5.458 0.065 Normal
X5.1 -2.061 0.039 1.849 0.064 7.669 0.022 Tidak Normal
X5.2 -1.937 0.053 0.831 0.406 4.444 0.108 Normal
X5.3 -3.430 0.001 0.400 0.689 11.924 0.003 Tidak Normal
X6.1 -3.518 0.000 1.243 0.214 13.922 0.001 Tidak Normal
X6.2 -0.362 0.717 -0.813 0.416 0.793 0.673 Normal
X6.3 -1.066 0.286 -0.399 0.690 1.295 0.523 Normal
X7.1 -2.402 0.016 -0.028 0.978 5.772 0.056 Normal
X7.2 -1.565 0.118 -0.778 0.437 3.053 0.217 Normal
X8.1 -1.611 0.107 0.077 0.938 2.601 0.272 Normal
X8.2 -0.455 0.649 -0.284 0.776 0.287 0.866 Normal
X9.1 -1.844 0.065 -0.453 0.650 3.606 0.165 Normal
Continue
Analyzing Stimulus Factors of Purchase Intention towards…..
189
X9.2 -1.157 0.247 -0.498 0.619 1.586 0.452 Normal
X9.3 -3.166 0.002 0.340 0.734 10.137 0.006 Tidak Normal
X10.1 -2.312 0.021 0.171 0.864 5.373 0.068 Normal
X10.2 -2.456 0.014 -1.597 0.110 8.583 0.014 Tidak Normal
X10.3 0.860 0.390 -0.521 0.602 1.012 0.603 Normal
X10.4 -1.899 0.058 -2.095 0.036 7.995 0.018 Tidak Normal
X11.1 -2.735 0.006 0.376 0.707 7.621 0.022 Tidak Normal
X11.2 -2.707 0.007 -0.062 0.950 7.330 0.026 Tidak Normal
X11.3 -2.606 0.009 0.657 0.511 7.225 0.027 Tidak Normal
X11.4 -1.866 0.062 0.578 0.563 3.814 0.149 Normal
X12.1 -4.272 0.000 0.806 0.420 18.898 0.000 Tidak Normal
X12.2 -1.197 0.231 -2.162 0.031 6.105 0.047 Tidak Normal
X13.1 -1.911 0.056 -1.091 0.275 4.842 0.089 Normal
X13.2 -1.094 0.274 -1.948 0.051 4.989 0.083 Normal
X14.1 -3.422 0.001 1.645 0.100 14.414 0.001 Tidak Normal
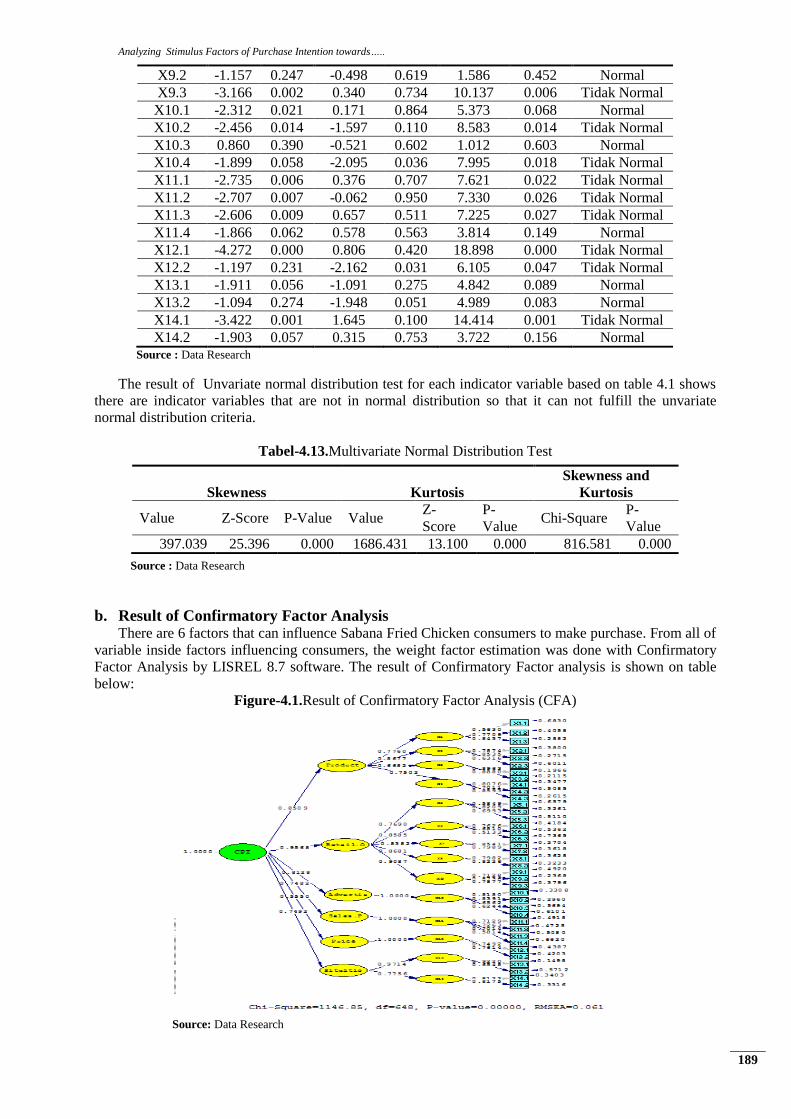
X14.2 -1.903 0.057 0.315 0.753 3.722 0.156 Normal Source : Data Research
The result of Unvariate normal distribution test for each indicator variable based on table 4.1 shows
there are indicator variables that are not in normal distribution so that it can not fulfill the unvariate
normal distribution criteria.
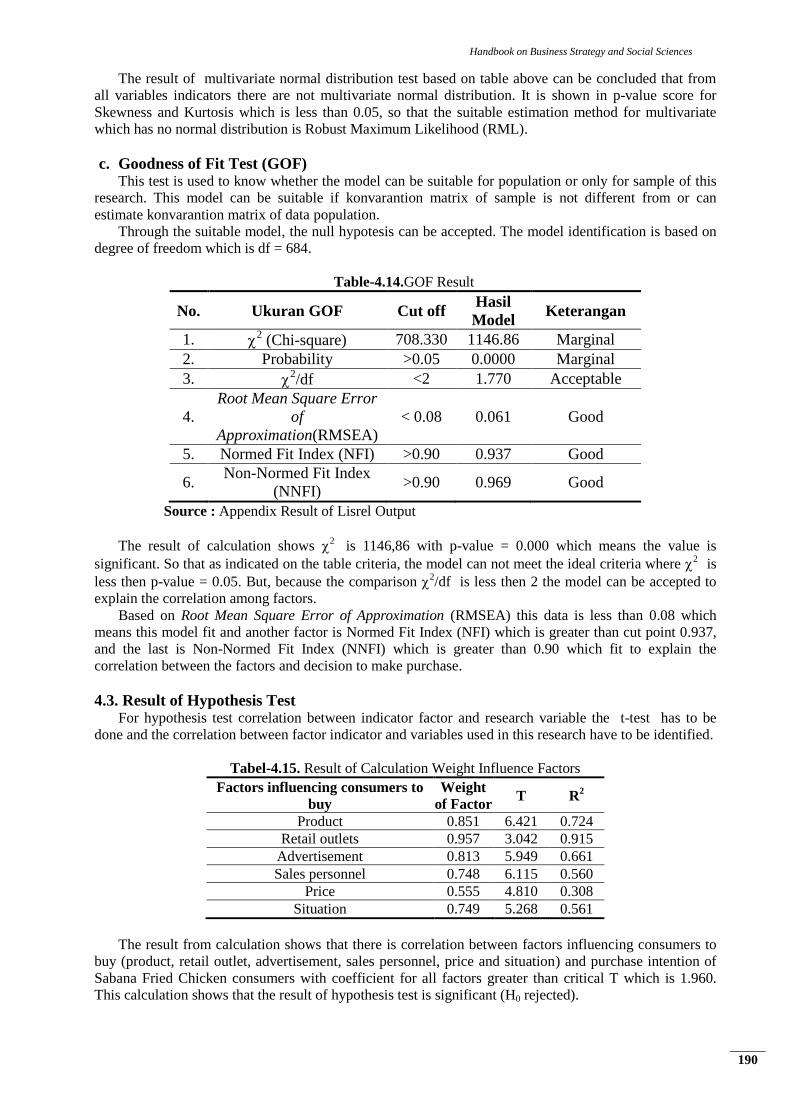
Tabel-4.13.Multivariate Normal Distribution Test
Source : Data Research
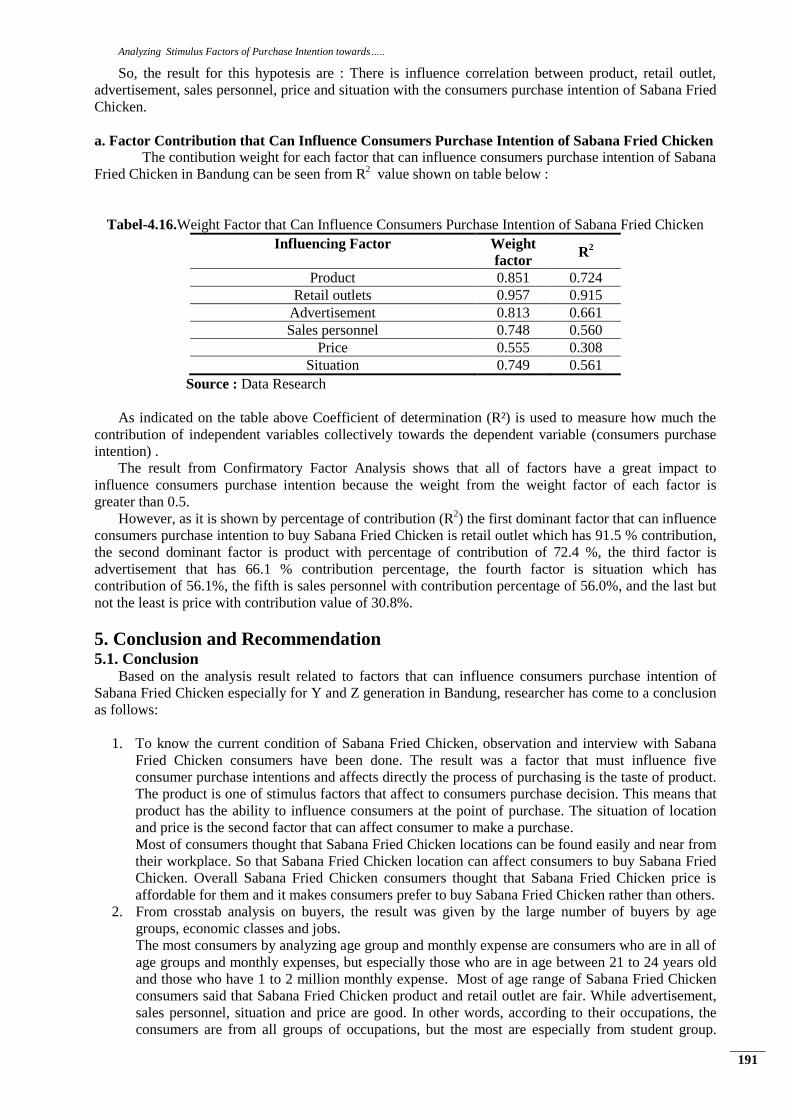
b. Result of Confirmatory Factor Analysis There are 6 factors that can influence Sabana Fried Chicken consumers to make purchase. From all of
variable inside factors influencing consumers, the weight factor estimation was done with Confirmatory
Factor Analysis by LISREL 8.7 software. The result of Confirmatory Factor analysis is shown on table
below:
Figure-4.1.Result of Confirmatory Factor Analysis (CFA)
Source: Data Research
Skewness Kurtosis
Skewness and
Kurtosis
Value Z-Score P-Value Value Z-
Score
P-
Value Chi-Square
P-
Value
397.039 25.396 0.000 1686.431 13.100 0.000 816.581 0.000
Handbook on Business Strategy and Social Sciences
190
The result of multivariate normal distribution test based on table above can be concluded that from
all variables indicators there are not multivariate normal distribution. It is shown in p-value score for
Skewness and Kurtosis which is less than 0.05, so that the suitable estimation method for multivariate
which has no normal distribution is Robust Maximum Likelihood (RML).
c. Goodness of Fit Test (GOF) This test is used to know whether the model can be suitable for population or only for sample of this
research. This model can be suitable if konvarantion matrix of sample is not different from or can
estimate konvarantion matrix of data population.
Through the suitable model, the null hypotesis can be accepted. The model identification is based on
degree of freedom which is df = 684.
Table-4.14.GOF Result
No. Ukuran GOF Cut off Hasil
Model Keterangan
1. 2 (Chi-square) 708.330 1146.86 Marginal
2. Probability >0.05 0.0000 Marginal
3. 2/df <2 1.770 Acceptable
4.
Root Mean Square Error
of
Approximation(RMSEA)
< 0.08 0.061 Good
5. Normed Fit Index (NFI) >0.90 0.937 Good
6. Non-Normed Fit Index
(NNFI) >0.90 0.969 Good
Source : Appendix Result of Lisrel Output
The result of calculation shows 2
is 1146,86 with p-value = 0.000 which means the value is
significant. So that as indicated on the table criteria, the model can not meet the ideal criteria where 2
is
less then p-value = 0.05. But, because the comparison 2/df is less then 2 the model can be accepted to
explain the correlation among factors.
Based on Root Mean Square Error of Approximation (RMSEA) this data is less than 0.08 which
means this model fit and another factor is Normed Fit Index (NFI) which is greater than cut point 0.937,
and the last is Non-Normed Fit Index (NNFI) which is greater than 0.90 which fit to explain the
correlation between the factors and decision to make purchase.
4.3. Result of Hypothesis Test For hypothesis test correlation between indicator factor and research variable the t-test has to be
done and the correlation between factor indicator and variables used in this research have to be identified.
Tabel-4.15. Result of Calculation Weight Influence Factors
Factors influencing consumers to
buy
Weight
of Factor T R
2
Product 0.851 6.421 0.724
Retail outlets 0.957 3.042 0.915
Advertisement 0.813 5.949 0.661
Sales personnel 0.748 6.115 0.560
Price 0.555 4.810 0.308
Situation 0.749 5.268 0.561
The result from calculation shows that there is correlation between factors influencing consumers to
buy (product, retail outlet, advertisement, sales personnel, price and situation) and purchase intention of
Sabana Fried Chicken consumers with coefficient for all factors greater than critical T which is 1.960.
This calculation shows that the result of hypothesis test is significant (H0 rejected).
Analyzing Stimulus Factors of Purchase Intention towards…..
191
So, the result for this hypotesis are : There is influence correlation between product, retail outlet,
advertisement, sales personnel, price and situation with the consumers purchase intention of Sabana Fried
Chicken.
a. Factor Contribution that Can Influence Consumers Purchase Intention of Sabana Fried Chicken The contibution weight for each factor that can influence consumers purchase intention of Sabana
Fried Chicken in Bandung can be seen from R2
value shown on table below :
Tabel-4.16.Weight Factor that Can Influence Consumers Purchase Intention of Sabana Fried Chicken
Influencing Factor Weight
factor R
2
Product 0.851 0.724
Retail outlets 0.957 0.915
Advertisement 0.813 0.661
Sales personnel 0.748 0.560
Price 0.555 0.308
Situation 0.749 0.561
Source : Data Research
As indicated on the table above Coefficient of determination (R²) is used to measure how much the
contribution of independent variables collectively towards the dependent variable (consumers purchase
intention) .
The result from Confirmatory Factor Analysis shows that all of factors have a great impact to
influence consumers purchase intention because the weight from the weight factor of each factor is
greater than 0.5.
However, as it is shown by percentage of contribution (R2) the first dominant factor that can influence
consumers purchase intention to buy Sabana Fried Chicken is retail outlet which has 91.5 % contribution,
the second dominant factor is product with percentage of contribution of 72.4 %, the third factor is
advertisement that has 66.1 % contribution percentage, the fourth factor is situation which has
contribution of 56.1%, the fifth is sales personnel with contribution percentage of 56.0%, and the last but
not the least is price with contribution value of 30.8%.
5. Conclusion and Recommendation 5.1. Conclusion
Based on the analysis result related to factors that can influence consumers purchase intention of
Sabana Fried Chicken especially for Y and Z generation in Bandung, researcher has come to a conclusion
as follows:
1. To know the current condition of Sabana Fried Chicken, observation and interview with Sabana
Fried Chicken consumers have been done. The result was a factor that must influence five
consumer purchase intentions and affects directly the process of purchasing is the taste of product.
The product is one of stimulus factors that affect to consumers purchase decision. This means that
product has the ability to influence consumers at the point of purchase. The situation of location
and price is the second factor that can affect consumer to make a purchase.
Most of consumers thought that Sabana Fried Chicken locations can be found easily and near from
their workplace. So that Sabana Fried Chicken location can affect consumers to buy Sabana Fried
Chicken. Overall Sabana Fried Chicken consumers thought that Sabana Fried Chicken price is
affordable for them and it makes consumers prefer to buy Sabana Fried Chicken rather than others.
2. From crosstab analysis on buyers, the result was given by the large number of buyers by age
groups, economic classes and jobs.
The most consumers by analyzing age group and monthly expense are consumers who are in all of
age groups and monthly expenses, but especially those who are in age between 21 to 24 years old
and those who have 1 to 2 million monthly expense. Most of age range of Sabana Fried Chicken
consumers said that Sabana Fried Chicken product and retail outlet are fair. While advertisement,
sales personnel, situation and price are good. In other words, according to their occupations, the
consumers are from all groups of occupations, but the most are especially from student group.
Handbook on Business Strategy and Social Sciences
192
Most of Sabana Fried Chicken consumers from all occupation groups said that Sabana Fried
Chicken product is fair, while advertisement, sales personnel, situation and price are good.
3. To answer the hypothesis test using t test, all six stimulus factors that can influence consumer
purchase intention of Sabana Fried Chicken in Bandung are significantly affect with t score for
each variable factor greater than critical t 1.96 which means that there is a correlation between six
factors (X) and consumers purchase intention (Y).
4. Moreover, based on Confirmatory Factor analysis, six stimulus factors influence consumers
purchase intention of Sabana Fried Chicken especially for Y and Z generation, by looking at R2
which shows the weight for each variable. There are three dominant factors that are most
important to influence consumers purchase intention.
The first is retail outlet with dominant impact of value contribution of 91.5%, the second factor is
product that can influence consumers purchase decision with value contribution of 72.4%, and the
third dominant factor is advertisement (sign age) that can form purchase decision of Sabana Fried
Chicken consumers of 66.1%. Other factors are situation which has weight contribution of 56.1 %,
followed by sales personnel with 56.0 % contribution, and the last but not the least is price with
contribution value of 30.8%.
5.2. Recommendation a. According to the interview result, most of consumers buy Sabana Fried Chicken because of
product, price and situation itself. To improve this, the suggestion for Sabana Fried Chicken is
they should focus on their product especially for taste to get more consumers and make current
consumers loyal. If the taste is still delicious or improved to be more delicious automatically the
figures of sales and revenue will be increased. The second factor that affects consumer purchase
intention is price.
Sabana Fried Chicken should also consider if they want to increase the price because pricing is
one of the strength factors for Sabana Fried Chicken rather than other brands. The third factor is
situation. The situation affects consumer purchase intention because many consumers buy Sabana
Fried Chicken because the locations of Sabana Fried Chicken are near from their activity places.
Sabana Fried Chicken should consider the locations which are closer to the buyers. The
recommendation from consumers is that Sabana Fried Chicken should keep health and hygiene
because sometimes sales personnel of Sabana Fried chicken are lack of it. If Sabana Fried
Chicken increases the hygiene and health it will improve their consumer trust to buy Sabana Fried
Chicken.
b. Based on crosstab analysis on buyer result, the results may provide input to the owner of Sabana
Fried Chicken outlet indirectly. By analyzing age group and monthly expense, Sabana Fried
Chicken should improve the quality of product and retail outlets because these factors are the two
most important stimulus factors that can influence consumers purchase intention of Sabana Fried
Chicken.
If both factors are improved in quality it will automatically improve the influence of consumers
to buy Sabana fried Chicken. In other words, the number of buyers according to the occupation,
Sabana Fried chicken should improve the quality of product as wel
The three factors from different group classification shows the most important thing for Sabana
Fried Chicken is to improve the quality of product itself including the quality of taste, quality of
raw materials and chicken, because these factors will affect consumers especially for student
buyers.
c. From confirmatory analysis result, there are three factors which are derived from six stimulus
factor variables. The variables that have highest weight forming factor analysis are product, retail
outlet and advertisement.
Through these results, product quality, product hygiene, product health, product packaging, frying
pan, dough container, wrapping area, chicken and rice containers, and sign age must be
considered by Sabana Fried Chicken owner in developing their business and increasing sales.

Analyzing Stimulus Factors of Purchase Intention towards…..
193
References Azzahra, A., 2012. Analyzing the factors that affecting consumer’s purchase intention on toimoi store Jakarta. Institut Teknologi
Bandung. pp: 7-20.
Barker, C., P. Nancy and E. Robert, 2002. Research methods in clinical psychology an introduction for students and practitioners.
2nd Edn., Ohio: John Wiley & Sons, Ltd.
Dodds, W.B., K.B. Monroe and D. Grewal, 1991. Effect of price, brand and store information on buyers’ product evaluations.
Journal of Marketing Research, 28(3): 307-319.
Hoyer, W.D. and D.J. Macinnis, 2010. Consumer behavior. United States of America: Harcourt College.
Keller, K.L. and K. Philip, 2012. Marketing management. 14th Edn., England: Pearson.
Kotler, P., 2000. Marketing management: Analysis, planning, implementation, and control. 10th Edn., New Jersey: Prentice-Hall.
Kwek, C.L., H.P. Tan and T.C. Lau, 2010. Investigating the shopping orientations on online purchase intention in the e-
commerce environment: A Malaysian study .Journal of Internet Banking and Commerce, August 2010, 15(2).
Said and Thomas, 2000. Franchising for dummies. New York: Hungry Minds.
The U.S Small Business Administration, 2010. Small business. Available from http://www.sba.gov/content/what-sbas-definition-
small-business-concern [Accessed 24 March 2014].
Wikipedia, 2013. Exploratory research. Available from http://en.wikipedia.org/wiki/Exploratory_research [Accessed 24 March
2014].