Embed Size (px)
Citation preview
HISTORIC AMERICAN ENGINEERING RECORD ANALYZING COVERED BRIDGE FLOOR SYSTEMS
HAER No. NH-53
LOCATION: Beebe River Road, Campton Hollow, Grafton County, New Hampshire. The bridge model was located at latitude: 43.829946, longitude: -71.648767. This coordinate was obtained in October 2017, using a GPS mapping grade unit accurate to +/- 3 meters after differential correction. The coordinate’s datum is North American Datum 1983. The bridge model location has no restriction on its release to the public.
DATES OF RESEARCH: 2016-2019
STRUCTURE TYPE:
PRESENT USE:
SIGNIFICANCE:
RESEARCHERS:
PROJECT INFORMATION:
Town lattice wooden truss bridge
Full-size bridge model, disassembled after testing
It has been observed that current methods of calculating the strength of the timber floor systems of covered bridges seem to underestimate the actual strength of these systems to a greater extent than would be explained by the factors of safety used in conventional calculations. If so, historic covered bridge systems may be unnecessarily replaced, or load limits may be set so low that bridge replacement becomes probable. To explore apparent differences between current design practices and actual floor performance, researchers instrumented the floor of a Town lattice covered bridge with transducers and then drove a heavy truck of known weight across the span while resulting strains in floor components were recorded. Researchers then studied the strains to discern whether interactions between the trusses, joists and deck were strengthening the joists. The team varied floor system parameters (such as type and density of fasteners, deck thickness, and test vehicle speed) during the test in an effort to determine what factors most significantly affected strains in the floor components.
James Barker, VS Engineering; Timothy Andrews, Barns and Bridges of New England; Matthew Reckard, 2019
The National Covered Bridges Recording Project was undertaken by the Historic American Engineering Record (HAER), a long-range program to

ANALYZING COVERED BRIDGE FLOOR SYSTEMS HAER No. NH-53
Page 2
document historically significant engineering and industrial works in the United States. HAER is administered by the Heritage Documentation Programs Division (Dana Lockett, Acting Chief), a division of the National Park Service, U.S. Department of the Interior. The Federal Highway Administration's National Historic Covered Bridge Preservation Program (Sheila Rimal Duwadi, administrator) funded the project. Christopher H. Marston, HAER Architect, served as project leader and editor of the report. The project was authorized under Task Agreement Number P14AC01504 of Cooperative Agreement Number P14AC01002, originally signed September 2014. James Barker of VS Engineering led the research and wrote the report under a contract with the National Society for the Preservation of Covered Bridges (William Caswell, President). Timothy Andrews of Barns and Bridges of New England built the full-size model Town lattice truss bridge. Matthew Reckard completed additional research and compiled the bibliography. Joe Vangampler prepared graphics and arranged the report.

ANALYZING COVERED BRIDGE FLOOR SYSTEMS HAER No. NH-53
Page 3
TABLE OF CONTENTS
I. INTRODUCTION 6
II. DESIGN OF EXPERIMENTAL WORK, OVERVIEW Bridge Structure 7 Instrumentation 9 Changes to Deck during Testing 9 Test Runs 11 Laboratory Testing at the University of Maine 12
III. PLANNED ANALYTICAL WORK, OVERVIEW End Fixity 13 T-beam Effect 13 Distribution Factor 14 Screws vs. Spikes 14 Fasteners vs. No Fasteners 15 Light vs. Normal Fasteners 15 Truck Speed 15 Deck Thickness and Number of Layers 15
IV. FIELD TESTING, DETAILED DESCRIPTION Test Structure, Detailed Description 16 Instrumentation, Detailed Description 17 Test Runs and Deck Configurations, Detailed Description 20
V. TESTING RESULTS Plunger Gauges, Data Obtained and Immediate Observations 27 Strain Gauges, Data Obtained and Immediate Observations 28 Figure 17. Strains in joist 1 at midspan and ends 29 Figure 18. Strains in Joist 1 under a wheel line 31 Figure 19. Strains in joist 2 at midspan and ends 33 Figure 20. Strains in joist 3 at midspan and ends 35 Figure 21. Strains in deck planks at joist 1, in direction parallel to joists 37 Figure 22. Strains in deck planks at joist 1 midspan, in direction perpendicular
to joists 39 Figure 23. Strains in deck planks, between joists, in direction perpendicular
to joists 41 Figure 24. Truss lower chord rotation at joist 1 43
ANALYZING COVERED BRIDGE FLOOR SYSTEMS HAER No. NH-53
Page 4
VI. INSTRUMENTATION DIFFICULTIES 45
VII. PRIMARY FINDINGS End Fixity 48 T-beam Effect (Deck Acting Compositely with Joists) 49 Distribution Factor 57
VIII. CONCLUSIONS AND RECOMMENDATIONS Conclusions 63 Other Research Factors 63 Recommendations 64
APPENDIX A Bridge Joist Tests, prepared by University of Maine’s Advanced Structures
and Composites Center 66
APPENDIX B Covered Bridge Floor Systems Study Literature Search 85 Bibliography 93

ANALYZING COVERED BRIDGE FLOOR SYSTEMS HAER No. NH-53
Page 5
LIST OF FIGURES Figure 1a Constructing the test bridge 8 Figure 1b The bridge is ready for testing in July 2016 8 Figure 2 Location and orientation of transducers 10 Figure 3 Plan view of deck, showing plank stagger and fastener patterns 11 Figure 4 Two types of fasteners used to attach deck to joists 11 Figure 5 Tire geometry of test truck and weights of each axle during tests 12 Figure 6 End fixity 13 Figure 7 Starting to install strain transducers 18 Figure 8 Transducers mounted on joists 1 and 2 19 Figure 9 Detail view of strain transducers at midspan of joists 1 and 2 20 Figure 10 Truck scales leased to provide accurate weights of both axles 24 Figure 11 Attaching the first layer of deck using GRK timber screws 24 Figure 12 Test truck entering the bridge for one of the test runs 25 Figure 13 After removing the deck screws, reattaching the deck 25 Figure 14 Installing the second layer of decking 26 Figure 15 Installing the second layer of deck planks 26 Figure 16 Maximum deflection of joist 1 at midspan 28 Figure 17 Strains in joist 1 at midspan and ends 30 Figure 18 Strains in joist 1 directly under a wheel line 32 Figure 19 Strains in joist 2 at midspan and ends 34 Figure 20 Strains in joist 3 at midspan and ends 36 Figure 21 Strains in deck planks at joist 1, in direction parallel to joists 38 Figure 22 Strains in deck planks at joist 1 midspan, in direction perpendicular to joists 40 Figure 23 Strains in deck planks, between joists, in direction perpendicular to joists 42 Figure 24 Truss lower chord rotation at joist 1 44 Figure 25 Strains in joist 1 at midspan and ends, prior to calibration 46 Figure 26 Strains in joist 1 at midspan and end, unusable data 47 Figure 27 Ratio of top midspan strain to bottom midspan strain in joist 1 56 Figure 28 A plot of strain gauge readings used to calculate distribution constants 59 Figure 29 Calculation of distribution constants 60 Figure 30 The project researchers with the volunteer team 65
LIST OF TABLES
Table 1 Description of test runs and plunger gauge readings 22 Table 2 Max – min peak strains at midspan of joists and on deck 52 Table 3 Summary of measured distribution constants for joists 62

ANALYZING COVERED BRIDGE FLOOR SYSTEMS HAER No. NH-53
Page 6
I. INTRODUCTION
Covered bridges are increasingly rare and appreciated touchstones of our cultural history. They are landmarks that contribute to their region’s cultural identity and “pride of place.” However, such bridges have long been far from the mainstream of construction technology, so some aspects of their performance and repair may never have been carefully investigated. One little-studied part of a covered bridge structure is its floor system, consisting of the deck boards that carry the vehicles’ tires, and the joists (AKA floor beams) that support the deck and transmit deck loads to the main trusses. It may seem that the structural behavior of a floor system using wooden planks on timber joists would be simple, and not nearly as interesting as the action and ingenuity exhibited in the trusses. In consequence, even though the amount of wood used in typical floor systems often equals that used in the main trusses, little research has been performed on deck systems. Floor system behavior, however, is more complex and more subtle than first appearances suggest. For most covered bridges with original decks the floor system is, by traditional calculation methods, the weakest part of the bridge. However, it has been observed, over many years for many covered bridges, that present design and load rating methods underestimate the strength of these decks and joists. This has, in turn, put those covered bridges at risk because they have been perceived as being weaker and less safe than they really are. Low load limits decrease the usability of those bridges, increasing calls for their replacement. It may also cause heavy-handed, inappropriate deck and floorbeam replacements that degrade the authenticity of the landmark while adding unnecessary dead weight that the main trusses must carry. Researchers initially planned to test a bridge made from salvaged timbers of the Bartonsville, VT covered bridge. But, those timbers proved to be too deteriorated for use. Therefore, a new full-sized bridge was built for testing. In early 2016 Tim Andrews of Barns and Bridges of New England built a Town lattice span at Campton Hollow, NH following traditional proportions and details. On July 31, 2016, that bridge was tested by researchers James Barker and Matthew Reckard, and volunteers from the National Society for the Preservation of Covered Bridges (Figure 30). The objective of this study has been to measure the strains and deformations of an actual covered bridge floor system under load from a typical and known heavy truck, to investigate the correspondence of these with the strains and deformations that might be expected if certain possible mechanisms were strengthening the joists, and to thereby improve our understanding of how timber decks behave. It is thought that such knowledge will enable better methods of designing and load rating covered bridges. The project’s work investigated three plausible, but previously unstudied effects that might explain the difference between calculated floor system strengths and their observed strengths. All pertain to the interaction of the decking, the joists which run between the main trusses and support the deck boards, and the main bridge trusses. See Figure 1b for photo of deck, joists, and main trusses.
ANALYZING COVERED BRIDGE FLOOR SYSTEMS HAER No. NH-53
Page 7
These plausible effects are:
1) End fixity of the joists where they attach to the trusses. If the joists are rigidly fixed to the main trusses, that might help the joists carry deck loads, at least compared to the standard assumption that the joist ends are free to rotate (Figure 6).
2) T-beam effect. Traditionally, the deck is assumed to just lie on the joists. But, when fastened to
the joists, the deck might become an extra part of each joist, like a top flange, and so make the joists stronger. Each composite joist would then have a “T” shaped cross section.
3) Distribution factor. Assumptions are always made about the way adjacent joists share the concentrated axle load of a passing truck. If the assumptions are inaccurate and overly conservative, additional joists may share the load and thus reduce the load on any one joist. The assumed load sharing is accounted for in calculations by a distribution factor.
The team investigated the effects of: varying floor system thickness and number of layers, varying the type of fasteners employed, varying the spatial density of fasteners, and varying the truck speed.
II. DESIGN OF EXPERIMENTAL WORK, OVERVIEW
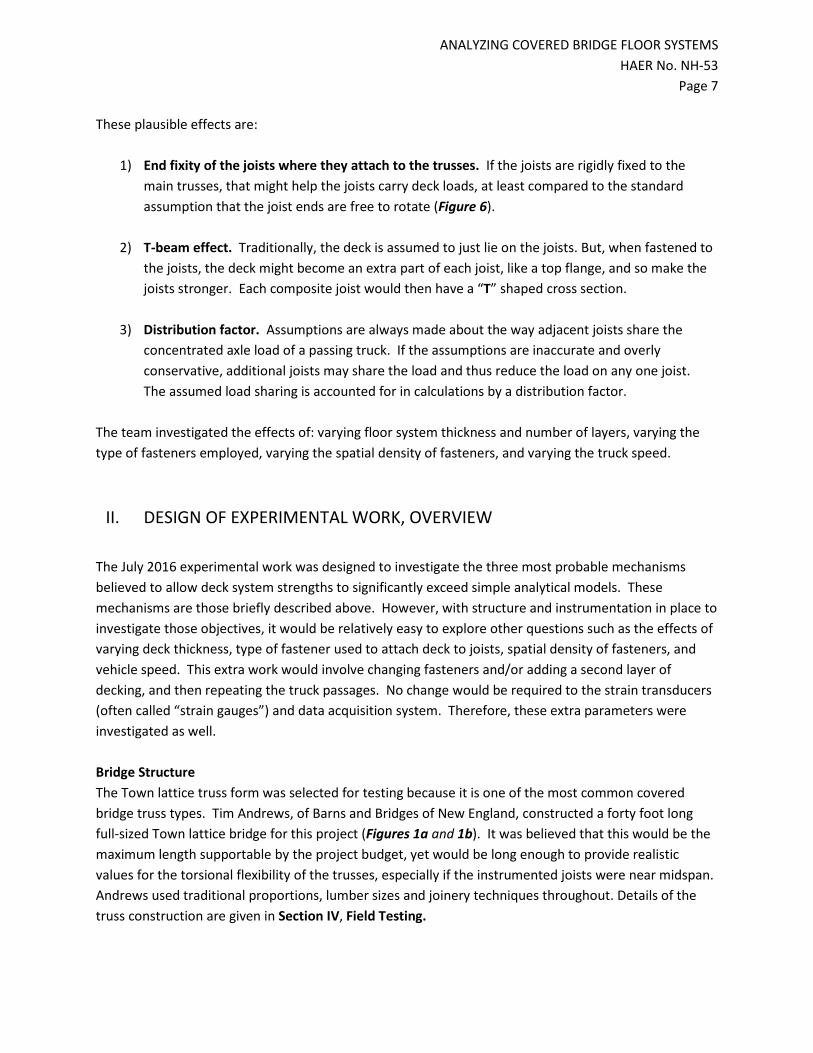
The July 2016 experimental work was designed to investigate the three most probable mechanisms believed to allow deck system strengths to significantly exceed simple analytical models. These mechanisms are those briefly described above. However, with structure and instrumentation in place to investigate those objectives, it would be relatively easy to explore other questions such as the effects of varying deck thickness, type of fastener used to attach deck to joists, spatial density of fasteners, and vehicle speed. This extra work would involve changing fasteners and/or adding a second layer of decking, and then repeating the truck passages. No change would be required to the strain transducers (often called “strain gauges”) and data acquisition system. Therefore, these extra parameters were investigated as well. Bridge Structure The Town lattice truss form was selected for testing because it is one of the most common covered bridge truss types. Tim Andrews, of Barns and Bridges of New England, constructed a forty foot long full-sized Town lattice bridge for this project (Figures 1a and 1b). It was believed that this would be the maximum length supportable by the project budget, yet would be long enough to provide realistic values for the torsional flexibility of the trusses, especially if the instrumented joists were near midspan. Andrews used traditional proportions, lumber sizes and joinery techniques throughout. Details of the truss construction are given in Section IV, Field Testing.
ANALYZING COVERED BRIDGE FLOOR SYSTEMS HAER No. NH-53
Page 8
Joist 3
Joist 2 (behind truss)
Figure 1a. Constructing the test bridge, a Town lattice truss, in the spring of 2016.
Figure 1b. The bridge is ready for testing in July 2016. Note alternate joists sticking through the lattice and sitting on the outer lower chord member.
Main Truss
Floor Planks
Joist 1
ANALYZING COVERED BRIDGE FLOOR SYSTEMS HAER No. NH-53
Page 9
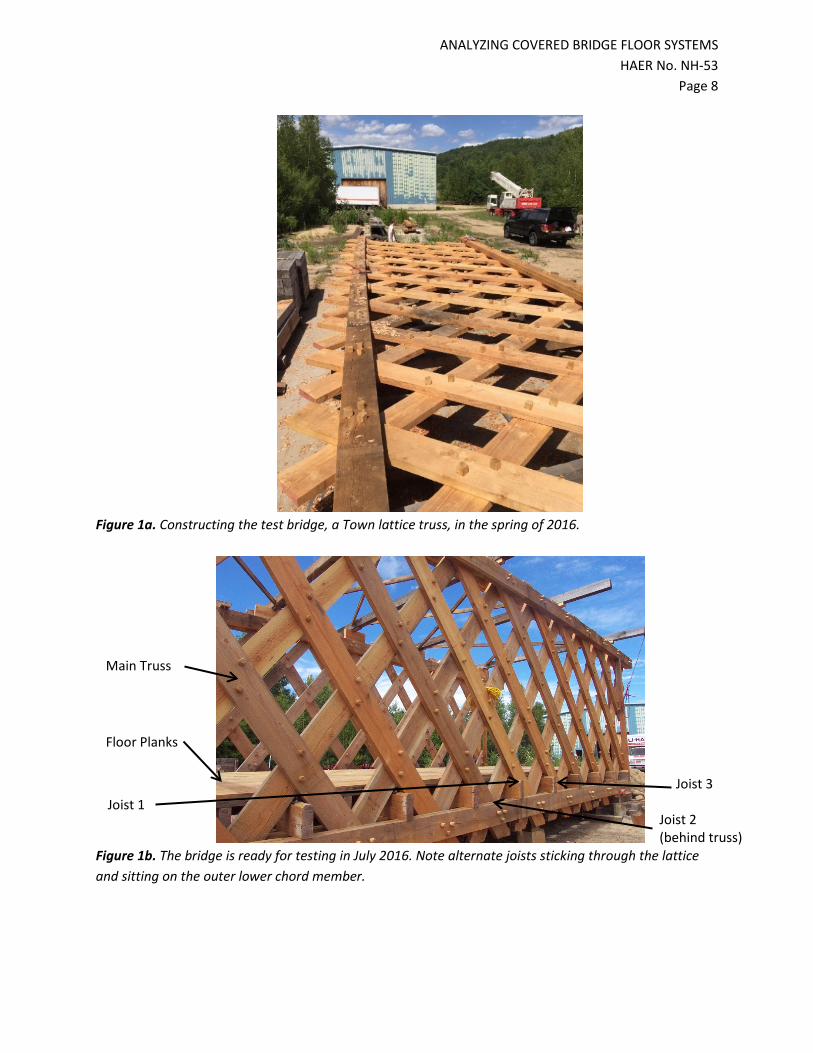
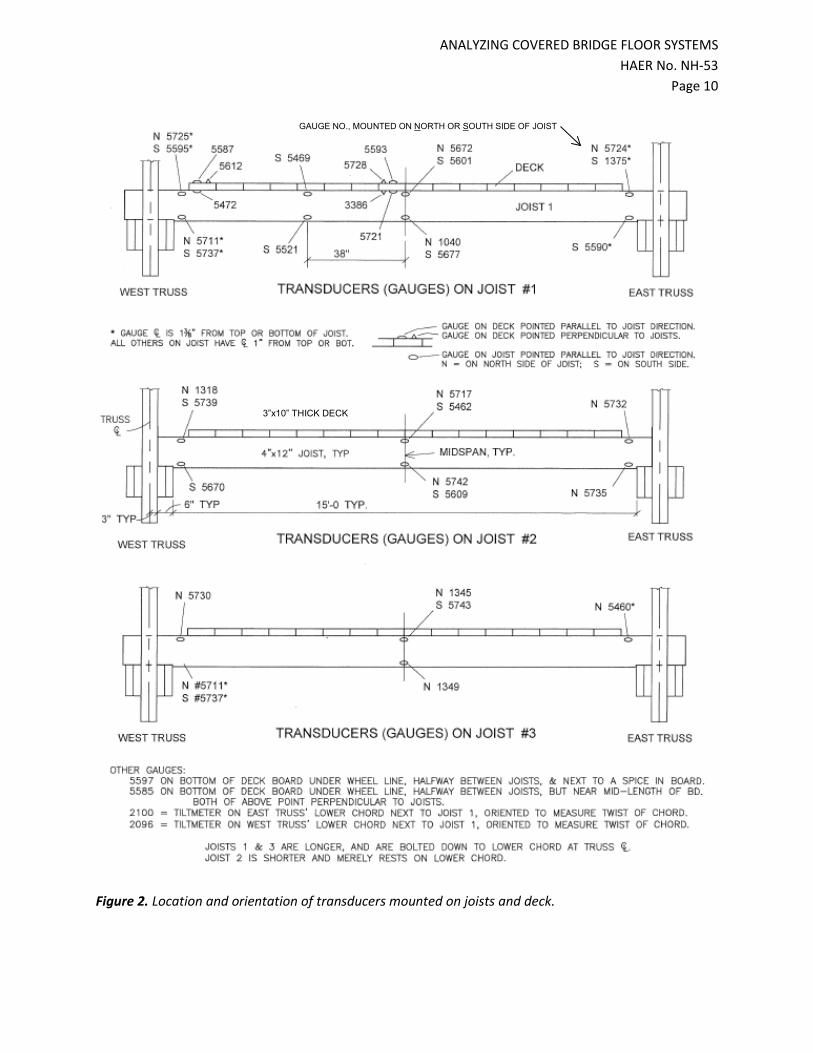
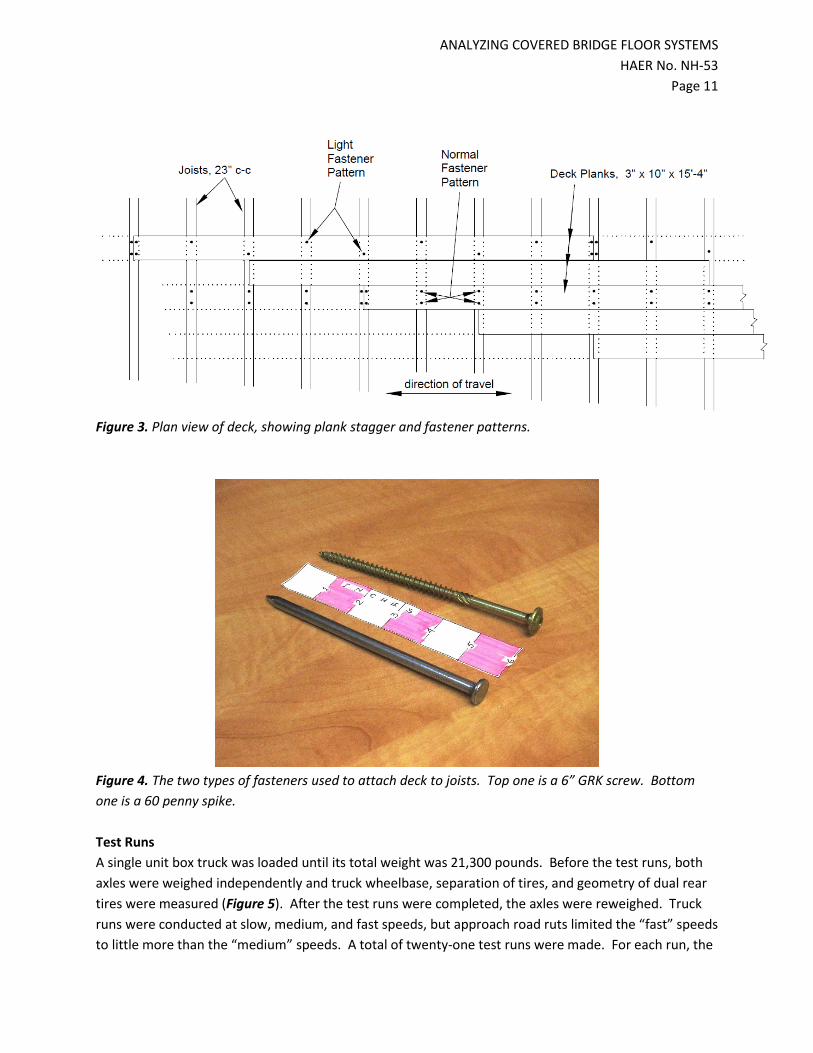
Instrumentation Two adjacent joists near bridge midspan were chosen to be instrumented. Joist #1 poked through holes in the Town lattice truss and extended to the outside faces of the truss lower chords. Due to the geometry of the Town lattice truss, alternate joists must stop short, at the inside surface of the diagonal boards. One of these, adjacent to joist 1, was selected for instrumentation as joist #2. In addition, a third joist was lightly instrumented to check the consistency of strains between two joists that should behaved almost identically. Strain transducers were attached at locations on joists 1 and 2 to investigate the study’s primary questions. Other strain transducers were attached to deck planks. Some of these pointed along the joists, while others pointed perpendicular to the joists. A rotation gauge (tiltmeter) was attached to the lower chord of each truss between joist 1 and joist 2. Figure 2 shows the locations and orientations of these gauges. In addition, plunger gauges were mounted below joist 1 at midspan and at both ends. These provided direct readouts of the maximum deflection of joist 1 for each test run. The data acquisition system measured and recorded the strain value at each transducer ten times per second. Changes to Deck during Testing Due to the significant cost of leasing the instrumentation hardware and software, the field testing work was designed to allow the maximum number of deck configurations to be tested in a minimum of time. Eighteen test runs were made with a single layer of deck planks, but with varying fasteners and truck speeds. Fastener configurations explored were: (a) no fasteners at all, (b) “light” screws, (c) “normal” screws, (d) “light” spikes, or (e) “normal” spikes. Then a second layer of deck planks was added, secured with “normal” spikes, and three additional truck runs were made. The term “light” screws or spikes denotes using a single fastener through each deck plank at each joist, except at plank ends, where two were used. The word “normal” denotes placing two fasteners through each plank into each joist. The two arrangements are shown in Figure 3. Setting up the instrumentation required several days of sometimes frantic effort. But once working properly, the twenty one truck runs and associated deck changes were accomplished in a single day. The help of volunteers from the National Society for the Preservation of Covered Bridges was all-important in this difficult work.
ANALYZING COVERED BRIDGE FLOOR SYSTEMS HAER No. NH-53
Page 10
Figure 2. Location and orientation of transducers mounted on joists and deck.
GAUGE NO., MOUNTED ON NORTH OR SOUTH SIDE OF JOIST
3”x10” THICK DECK
ANALYZING COVERED BRIDGE FLOOR SYSTEMS HAER No. NH-53
Page 11
Figure 3. Plan view of deck, showing plank stagger and fastener patterns.
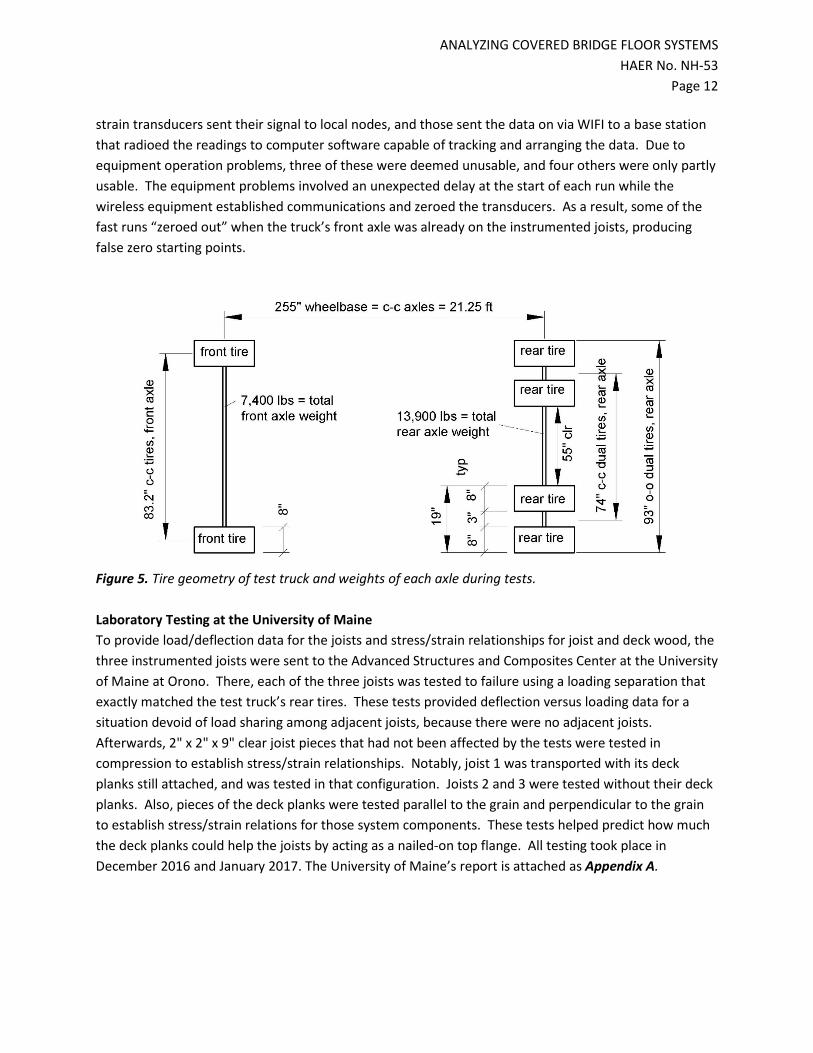
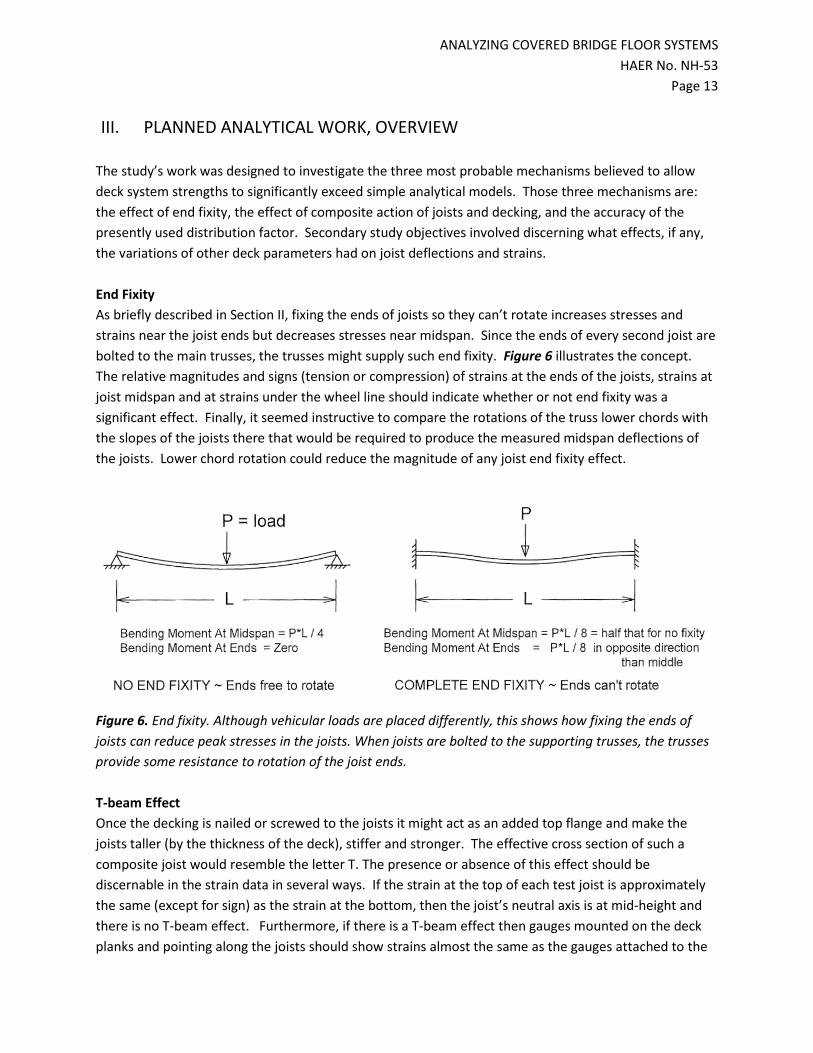
Figure 4. The two types of fasteners used to attach deck to joists. Top one is a 6” GRK screw. Bottom one is a 60 penny spike. Test Runs A single unit box truck was loaded until its total weight was 21,300 pounds. Before the test runs, both axles were weighed independently and truck wheelbase, separation of tires, and geometry of dual rear tires were measured (Figure 5). After the test runs were completed, the axles were reweighed. Truck runs were conducted at slow, medium, and fast speeds, but approach road ruts limited the “fast” speeds to little more than the “medium” speeds. A total of twenty-one test runs were made. For each run, the
ANALYZING COVERED BRIDGE FLOOR SYSTEMS HAER No. NH-53
Page 12
strain transducers sent their signal to local nodes, and those sent the data on via WIFI to a base station that radioed the readings to computer software capable of tracking and arranging the data. Due to equipment operation problems, three of these were deemed unusable, and four others were only partly usable. The equipment problems involved an unexpected delay at the start of each run while the wireless equipment established communications and zeroed the transducers. As a result, some of the fast runs “zeroed out” when the truck’s front axle was already on the instrumented joists, producing false zero starting points.
Figure 5. Tire geometry of test truck and weights of each axle during tests. Laboratory Testing at the University of Maine To provide load/deflection data for the joists and stress/strain relationships for joist and deck wood, the three instrumented joists were sent to the Advanced Structures and Composites Center at the University of Maine at Orono. There, each of the three joists was tested to failure using a loading separation that exactly matched the test truck’s rear tires. These tests provided deflection versus loading data for a situation devoid of load sharing among adjacent joists, because there were no adjacent joists. Afterwards, 2" x 2" x 9" clear joist pieces that had not been affected by the tests were tested in compression to establish stress/strain relationships. Notably, joist 1 was transported with its deck planks still attached, and was tested in that configuration. Joists 2 and 3 were tested without their deck planks. Also, pieces of the deck planks were tested parallel to the grain and perpendicular to the grain to establish stress/strain relations for those system components. These tests helped predict how much the deck planks could help the joists by acting as a nailed-on top flange. All testing took place in December 2016 and January 2017. The University of Maine’s report is attached as Appendix A.
ANALYZING COVERED BRIDGE FLOOR SYSTEMS HAER No. NH-53
Page 13
III. PLANNED ANALYTICAL WORK, OVERVIEW The study’s work was designed to investigate the three most probable mechanisms believed to allow deck system strengths to significantly exceed simple analytical models. Those three mechanisms are: the effect of end fixity, the effect of composite action of joists and decking, and the accuracy of the presently used distribution factor. Secondary study objectives involved discerning what effects, if any, the variations of other deck parameters had on joist deflections and strains. End Fixity As briefly described in Section II, fixing the ends of joists so they can’t rotate increases stresses and strains near the joist ends but decreases stresses near midspan. Since the ends of every second joist are bolted to the main trusses, the trusses might supply such end fixity. Figure 6 illustrates the concept. The relative magnitudes and signs (tension or compression) of strains at the ends of the joists, strains at joist midspan and at strains under the wheel line should indicate whether or not end fixity was a significant effect. Finally, it seemed instructive to compare the rotations of the truss lower chords with the slopes of the joists there that would be required to produce the measured midspan deflections of the joists. Lower chord rotation could reduce the magnitude of any joist end fixity effect.
Figure 6. End fixity. Although vehicular loads are placed differently, this shows how fixing the ends of joists can reduce peak stresses in the joists. When joists are bolted to the supporting trusses, the trusses provide some resistance to rotation of the joist ends. T-beam Effect Once the decking is nailed or screwed to the joists it might act as an added top flange and make the joists taller (by the thickness of the deck), stiffer and stronger. The effective cross section of such a composite joist would resemble the letter T. The presence or absence of this effect should be discernable in the strain data in several ways. If the strain at the top of each test joist is approximately the same (except for sign) as the strain at the bottom, then the joist’s neutral axis is at mid-height and there is no T-beam effect. Furthermore, if there is a T-beam effect then gauges mounted on the deck planks and pointing along the joists should show strains almost the same as the gauges attached to the
ANALYZING COVERED BRIDGE FLOOR SYSTEMS HAER No. NH-53
Page 14
top of the adjacent joist. Thirdly, the University of Maine’s load/deflection test of the joist with deck attached (joist 1) should show a greater stiffness than the same for the other two joists, which were tested without attached deck boards. Fourthly, if the T-beam effect is active then the strains of the deck gauges that point along the joists should decrease slightly when the second layer of deck is added (because that would raise the joists’ neutral axis), and midspan deflection should decrease noticeably. Distribution Factor This factor is a way to account for load sharing that occurs between adjacent or neighboring joists due to the deck boards acting as a broad, thin, continuous beam that spreads out the concentrated wheel loads. The factor sets the assumed portion of a wheel load that must be carried by a single joist. The American Association of State Highway and Transportation Officials (AASHTO) defines the distribution factor (D.F.) for wooden joists supporting plank decks to be the joist spacing in feet divided by 4.0, where the 4.0 may be called the “distribution constant”. This fraction, or ratio, has remained unchanged for the last sixty years, and given the paucity of experimental data on the matter it is easy to see why. Yet it much affects design and load limit calculations.1 One way to check the distribution constant would be to put strain gauges on many joists and then check each one when a truck axle was directly above the middle instrumented joist. This would show how much load sharing was occurring, but would require many strain transducers. However, there was a way to gather the same or similar data with only one instrumented joist, and that method was used. On all but the last run, the truck driver was instructed to maintain a constant speed across the bridge. The wheelbase of the truck (distance between axles) was measured as 255", center to center. And the strain data for each run, recorded ten times per second, clearly showed the elapsed times that each axle passed over joist #1, the most heavily instrumented joist. From this, the speed of the truck could be accurately calculated. Then, knowing the joist spacing (1'-11"), it could be determined when the rear axle was directly above each neighboring joist, and the value of the single heavily instrumented joist at that precise time would give a load sharing value, just the same as if the other joist was measured when the wheel was over the instrumented joist. In that way, the actual distribution factor, and hence distribution constant, could be calculated and checked against 4.0. The effects of varying five construction and operational parameters were also explored. These are:
1) Screws vs. Spikes. The deck screws used for the tests were GRK 5/16" RSS screws 6" long (Figure 4). These have an outside threaded dimeter of 0.30", but an actual shank diameter of 0.223". The spikes used were 60d common wire nails, which were 6" long and had a shank diameter of 0.27". The researchers looked for significant differences in the overall joist deflections as measured by the plunger gauges, and for differences in the strains recorded by the transducers attached to the joists.
1 AASHTO, LRFD Bridge Design Specifications (Washington, DC: American Association of State Highway and Transportation Officials, 2014), Table 4.6.2.2.2f.

ANALYZING COVERED BRIDGE FLOOR SYSTEMS HAER No. NH-53
Page 15
2) Fasteners vs. No Fasteners. Truck runs at different speeds were made with no fasteners whatsoever between deck planks and joists. Think of each of those as a sort of “control run”. Joist midspan deflections and joist strains were recorded, and compared to runs made with fasteners in place. 3) Light vs. Normal Fasteners. For both screws and spikes, test runs were made with two different spatial densities of fasteners (Figure 3). The “light” runs had two fasteners at each end of each deck board (the ends of adjacent boards being staggered but always occurring directly above a joist), and then had one fastener into each joist for the rest of the board’s length. The “normal” runs had two fasteners attaching each board to each joist. The latter is more commonly used in modern covered bridge redecking, but the “light” pattern is occasionally used to reduce time and expense. Joist deflections measure by the plunger gauges and joist strains measured by the transducers were compared.
4) Truck Speed. Some runs, for each of the fastener options, were made with the truck moving slowly, at about 4 mph. For others, the driver was instructed to drive as fast as he felt was safe, and these were at about 8 mph, varying + or – 2 mph. For still other runs the driver was asked to travel at moderate speed, roughly halfway between slow and fast runs. Joist deflections at midspan and joist strains were compared for the different speeds.
5) Deck Thickness and Number of Layers. Time and cost limited the range of these parameters that could be tested. However, the following procedure was undertaken. After completing all test runs on the single layer deck, a second deck layer was spiked on top the first, with both layers running along the direction of travel. The edge seams of the top layer were positioned at mid width of the bottom layer, so the top layer did more than increase the deck thickness. It increased the stiffness of the deck in the direction that the joists ran, because small gaps between bottom layer planks (sometimes called “seating gaps”) could no longer open and close unhindered. The top layer was only 1.88" thick (nominal 2” boards), whereas the first or bottom layer of decking was nominal 3" boards (2.88" actual when tested). All deck boards were 10" nominal width. Joist deflections and joist strains were compared with those for a single layer deck.
The joist and deck dimensions and materials are typical for Town lattice bridges. For these proportions, the joists’ calculated load limit for shear is more than 50% greater than their load limit for bending, so the experiments and analyses have been directed towards identifying how the variable parameters and questionable parameters affect bending moment.
ANALYZING COVERED BRIDGE FLOOR SYSTEMS HAER No. NH-53
Page 16
IV. FIELD TESTING, DETAILED DESCRIPTION Test Structure, Detailed Description For this project a 40-foot span, full-sized, Town lattice truss bridge was constructed by expert builder Tim Andrews (Figure 1). Andrews, having worked on several historic and new Town lattice bridges, used his experience and knowledge to construct a test bridge that closely matched traditional construction techniques and proportions. The test bridge allowed the deck system to be accurately modeled, particularly in regards to the end fixity of the joists. Dimensions and materials of the bridge are:
Truss Height: 12'-8" between upper and lower chords, center to center of chords Truss Width: 15'-0" clear between chords, 16'-6" center to center of chords Truss Length: 40'-0"
Lower Chord: four nominal 3" x 12" boards, two on each side of the truss diagonals boards. Upper Chord: same as lower chord
Truss Diagonals: two layers of nominal 3" x 12" boards in a crisscross pattern (Fig 2), each layer being inclined 53 degrees from vertical. Diagonals are 1'-11" apart c-c measured in a horizontal direction. Diagonals extended 10” beyond upper and lower chords.
Upper Lateral Bracing: cross timbers at ten-foot intervals, keyed into upper chords Lower Lateral Bracing: none. The joists and decking provide the lower lateral bracing. Floor Joists: 4" x 12" nominal dimensions.
Alternate joists extend to outer surface of lower chords and connect to the lower chords by a 3/4" steel rod at truss centerline. Between these, alternate joists stop 3/8" from the inside surface of truss diagonals and are not held down by rods, but merely sit on the lower chords with the top surface held by deck planks. One floor beam at each end of bridge is 6" thick to counteract impact forces there. Joists are spaced at 1'-11" center-center, which is 3'-10" spacing for joists having same length (i.e., longer ones or shorter ones).
Bottom Layer of Deck Planks: 3" x 10" x 16' long boards laid in the direction that vehicles travel (i.e. perpendicular to joists). The ends of deck boards are staggered per Figure 3. Top Layer of Deck Planks (used only for last three test runs): 2" x 10" x 16' long boards laid with seams between boards lying at mid-width of bottom layer boards, and wedged tight.
Trunnels: 2" diameter x 7½" long shank, lathe turned white oak. Wood for Trusses: No. 1 or better Douglas fir, air dried to 20% moisture at time of testing. Wood for Joists: No. 1 or better Douglas fir, air dried to 20% moisture at time of testing. Wood for Deck Boards, Bottom layer: No 2 Eastern Hemlock, 19% moisture at time of testing. Wood for Deck Boards, Top layer: No 2 Eastern Hemlock, 19% moisture at time of testing.
ANALYZING COVERED BRIDGE FLOOR SYSTEMS HAER No. NH-53
Page 17
End bents were built to support the bridge, so that the bottom of the lower chord was about 18" above grade. This placed the deck surface about three feet above ground level. End bents consisted of timber cribbing set into ground below grade. Earth ramps about fifty feet long were built to provide access to the bridge deck for test vehicles. Instrumentation, Detailed Description
Thirty eight strain transducers and a compatible data acquisition system were leased from Bridge Diagnostic Systems (BDI) of Boulder Colorado. This system was selected because of its easy zeroing and temperature compensating abilities, and because this system offered a comprehensive turnkey integration of the strain transducers and the data acquisition hardware and software. Figure 2 shows transducer locations and Figures 8 and 9 show actual installation. The leased equipment came with its own laptop computer, which had the proper data acquisition software already installed. In this system, each transducer was connected to a “node”. Each node could accept data from four transducers, and wirelessly send the data on to a “base station”. The base station transmitted all data to the laptop computer. Thus, the maze of wiring often associated with multiple transducers was minimized. Data from each transducer would be recorded ten times per second. Since all system elements were battery powered, there was no need to run power to the site. Strain transducers were attached at 13 locations on joist 1, nine locations on joist 2, and five locations on joist 3. Locations were selected to investigate the primary research questions of the study. Joist 3, a nominal twin of joist 1, was lightly instrumented to check the consistency of results between it and joist 1, two joists that should be nearly identical. Other transducers were attached to deck planks within a few inches of joist 1. Some of these pointed along the joists, while others pointed perpendicular to the joists. Two strain transducers were attached to the deck midway between joists: one about a foot from the end of a deck board, the other about five feet from the nearest end of its deck board. A rotation gauge was attached to the lower chord of each truss, positioned between joists 1 and 2, and oriented to measure rocking motions that could affect fixed end moments in the joists. Figure 2 shows the locations and orientations of the transducers on joists and deck. The strain transducers were attached using wood screws as recommended by BDI. To facilitate the movement of the test truck at speed, the bridge was supported with bottom of joists only 30" above ground. Therefore a trench was dug (Figure 7) to facilitate installation of the gauges.
ANALYZING COVERED BRIDGE FLOOR SYSTEMS HAER No. NH-53
Page 18
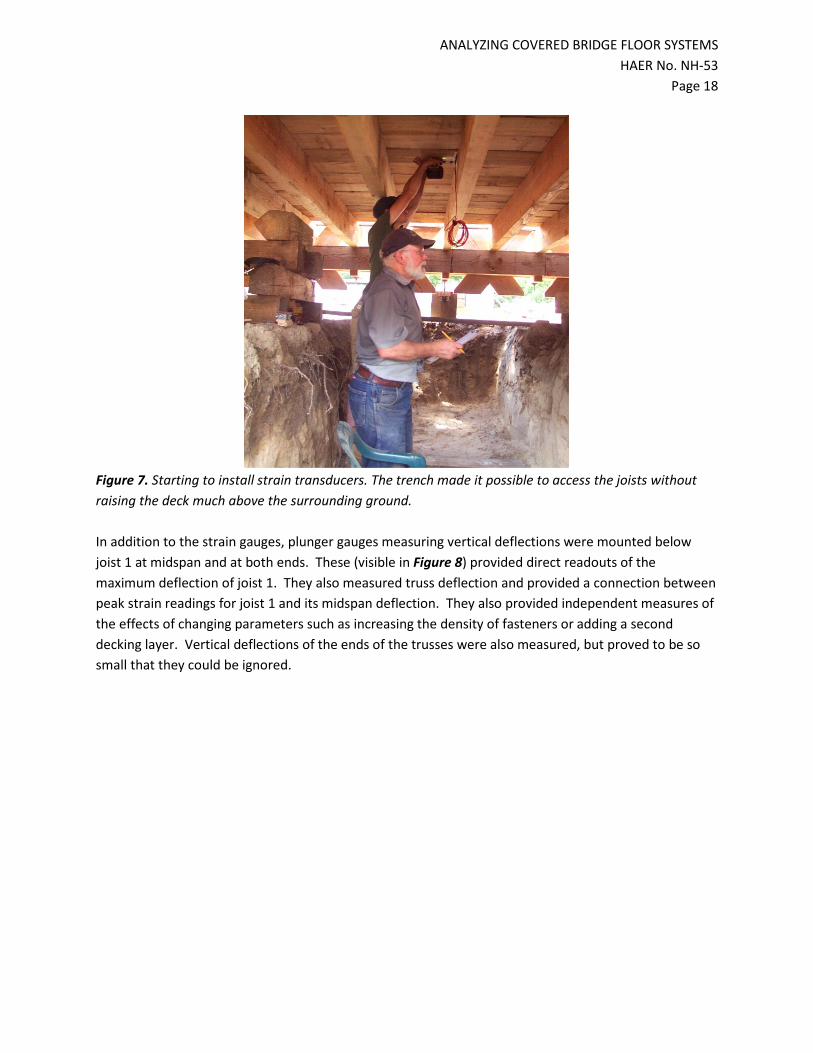
Figure 7. Starting to install strain transducers. The trench made it possible to access the joists without raising the deck much above the surrounding ground. In addition to the strain gauges, plunger gauges measuring vertical deflections were mounted below joist 1 at midspan and at both ends. These (visible in Figure 8) provided direct readouts of the maximum deflection of joist 1. They also measured truss deflection and provided a connection between peak strain readings for joist 1 and its midspan deflection. They also provided independent measures of the effects of changing parameters such as increasing the density of fasteners or adding a second decking layer. Vertical deflections of the ends of the trusses were also measured, but proved to be so small that they could be ignored.

ANALYZING COVERED BRIDGE FLOOR SYSTEMS HAER No. NH-53
Page 19
Figure 8. Transducers mounted on joists 1 (to right) and 2 (to left). Nodes that transmit transducer outputs to base station are visible, as are the plunger gauges at midspan and west end of joist 1. Each node can handle four transducers. Instrumentation setup presented some difficulties. Making the changes to the deck between test runs (changing fasteners, fastener density, number of deck layers) would take the effort of many people to be accomplished in reasonable time. Therefore, the operation was planned as a volunteer work day for the National Society for the Preservation of Covered Bridges. Enough members signed up to enable the testing to be done in a single day: Saturday, July 30, 2016. Arrangements were made to have the testing equipment arrive three days earlier so there would be time to set it up, install the transducers, and make sure it all would be working properly on Saturday. The plan was to install and debug the equipment on Wednesday and Thursday, and have Friday to spare in case there were problems. Instead, the equipment arrived Friday afternoon, and would not turn on. About 4 pm on Friday it was realized that the reason was that most of the nodes’ batteries were exhausted. Andrews produced a generator and this deficiency was soon fixed. Then, at about 5 pm, it was discovered that the nodes and base station would not communicate with the software on the computer. And 25 volunteers would be coming early the next morning to help change deck configurations. However, the schedule was saved by the time difference between the test site in New Hampshire and the BDI offices in Colorado. It was just 3 pm in Colorado, still part of the work day, and very competent and persistent people at BDI helped us sort through possible remedies. By 9 pm Friday night things were working correctly. The computer had previously been used by an agency oriented towards European interests, and had been set to use the Linux operating system, which is similar to, but not identical to, Windows. The computer could not
Nodes that conveyed data to base station
Joist 2 Joist 3
Joist 1
Plunger Gauge
Deck Planks
ANALYZING COVERED BRIDGE FLOOR SYSTEMS HAER No. NH-53
Page 20
communicate with the base station that was using Windows. Once the computer was switched to Windows, everything worked as expected and the early arrivers went to bed much relieved.
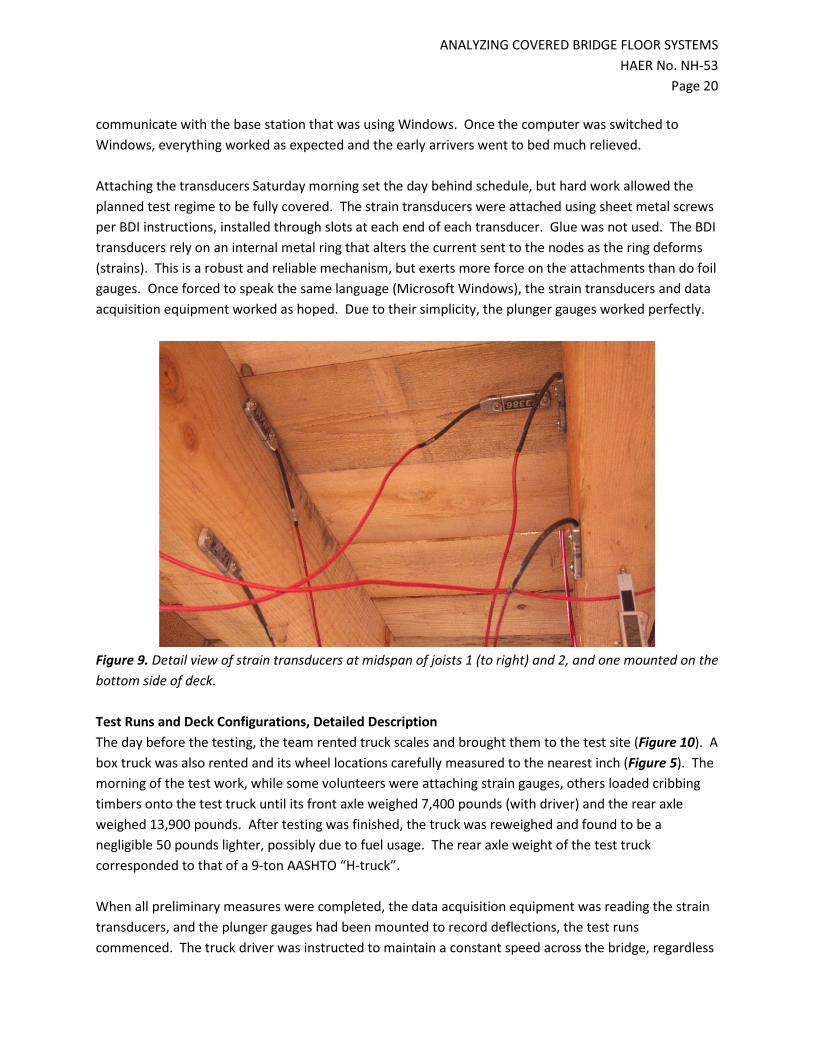
Attaching the transducers Saturday morning set the day behind schedule, but hard work allowed the planned test regime to be fully covered. The strain transducers were attached using sheet metal screws per BDI instructions, installed through slots at each end of each transducer. Glue was not used. The BDI transducers rely on an internal metal ring that alters the current sent to the nodes as the ring deforms (strains). This is a robust and reliable mechanism, but exerts more force on the attachments than do foil gauges. Once forced to speak the same language (Microsoft Windows), the strain transducers and data acquisition equipment worked as hoped. Due to their simplicity, the plunger gauges worked perfectly.
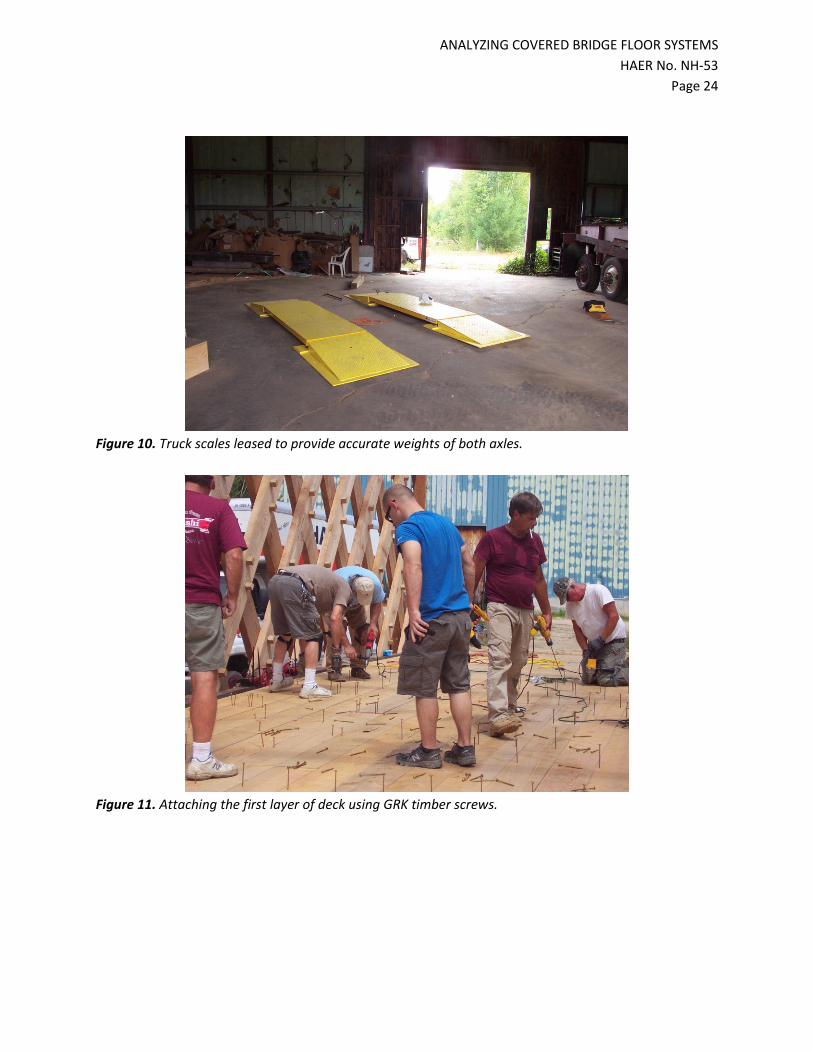
Figure 9. Detail view of strain transducers at midspan of joists 1 (to right) and 2, and one mounted on the bottom side of deck. Test Runs and Deck Configurations, Detailed Description The day before the testing, the team rented truck scales and brought them to the test site (Figure 10). A box truck was also rented and its wheel locations carefully measured to the nearest inch (Figure 5). The morning of the test work, while some volunteers were attaching strain gauges, others loaded cribbing timbers onto the test truck until its front axle weighed 7,400 pounds (with driver) and the rear axle weighed 13,900 pounds. After testing was finished, the truck was reweighed and found to be a negligible 50 pounds lighter, possibly due to fuel usage. The rear axle weight of the test truck corresponded to that of a 9-ton AASHTO “H-truck”. When all preliminary measures were completed, the data acquisition equipment was reading the strain transducers, and the plunger gauges had been mounted to record deflections, the test runs commenced. The truck driver was instructed to maintain a constant speed across the bridge, regardless

ANALYZING COVERED BRIDGE FLOOR SYSTEMS HAER No. NH-53
Page 21
of the speed used (fast, medium or slow). As an exception, and for the final run of the day, the truck stopped with its rear axle directly above joist 1 for about four seconds. For two other runs, # 3 and #18, the truck noticeably slowed during the run. This was visible as an asymmetry in the plots of joist strains for those two runs. Symmetry, before and after the peaks of strain for other runs, evidenced uniform speed across the test area. Table 1 shows the various deck and fastener configurations tested. The table is arranged in the chronological order that the test runs were made. The test order was chosen to enable relatively rapid deck changes between runs. For instance, if nails had been installed first, their removal would have consumed the entire day. Therefore, nails were installed last, and were not removed before volunteers went home and the truck was returned to its source. For each configuration, test runs were made at a slow speed, roughly 4 mph, and again at faster truck speeds. These different deck configurations were made to test the effects of:
a) Type of fasteners used b) Spatial density of fasteners c) Deck thickness d) Vehicle speed

ANALYZING COVERED BRIDGE FLOOR SYSTEMS HAER No. NH-53
Page 22
Table 1. Description of test runs and plunger gauge readings.

ANALYZING COVERED BRIDGE FLOOR SYSTEMS HAER No. NH-53
Page 23
The first test runs were without any fasteners attaching deck boards to joists. These were intended to establish control data that could be compared with results from other fastener configurations. Then, three test runs were made with “light” screws used. This spatial density is occasionally found in covered bridge decks, but is less common than “normal” fasteners. The locations of light and normal fasteners are shown in Figure 3. Following the “light” fastener runs, the number of screws was almost doubled to get the “normal” screws configuration, and four more test runs were made. The screws used were 6" long GRK 5/16" RSS screws (Figure 4) having an actual shank diameter of 0.23". Screw holes were piloted through the deck boards so that the boards would be tightly clamped to the joists. Next, all screws were removed and two more test runs were made to confirm that the deck was back performing similar to the first “no fastener” runs. This was observed. Then spikes were driven in the “light” configuration. The spikes were 6" long, 0.264" diameter common wire nails, commonly called 60-penny nails or 60-penny spikes. Two test runs were made for this deck, and then additional spikes were added to produce a “normal” nail configuration. Three test runs were made for this. Finally, a second layer of 2" x 10" deck boards was added. These ran parallel to the bottom boards, and had the same width, but the seams between top layer boards were place along the mid-width of each bottom layer board. The top layer was attached using the “normal” configuration of spikes, which were two fasteners in each board at each joist. The top layer not only produced a thicker deck, but the upper layer provided a connection between adjacent bottom layer boards so the bottom layer boards could not act independently along the joists’ length by having small cracks between them open or close unhindered (the “seating effect”) as the joists deflected under load. Thus, it was expected that adding the second deck layer would produce observable changes to strains and joist deflections. The final work of the day for the volunteers from the National Society for the Preservation of Covered Bridges was to unload the timber cribbing from the truck. This was followed by much needed rehydration. Figures 11 through 15 show some of the work.
ANALYZING COVERED BRIDGE FLOOR SYSTEMS HAER No. NH-53
Page 24
Figure 10. Truck scales leased to provide accurate weights of both axles.
Figure 11. Attaching the first layer of deck using GRK timber screws.

ANALYZING COVERED BRIDGE FLOOR SYSTEMS HAER No. NH-53
Page 25
Figure 12. Test truck entering the bridge for one of the test runs.
Figure 13. After removing the deck screws, reattaching the deck with the 60 penny spikes.

ANALYZING COVERED BRIDGE FLOOR SYSTEMS HAER No. NH-53
Page 26
Figure 14. Installing the second layer of decking. Seams between top planks lie along mid-width of bottom planks.
Figure 15. Installing the second layer of deck planks. A pry bar with tip embedded in bottom layer is used to make boards tight against one another as they are nailed.

ANALYZING COVERED BRIDGE FLOOR SYSTEMS HAER No. NH-53
Page 27
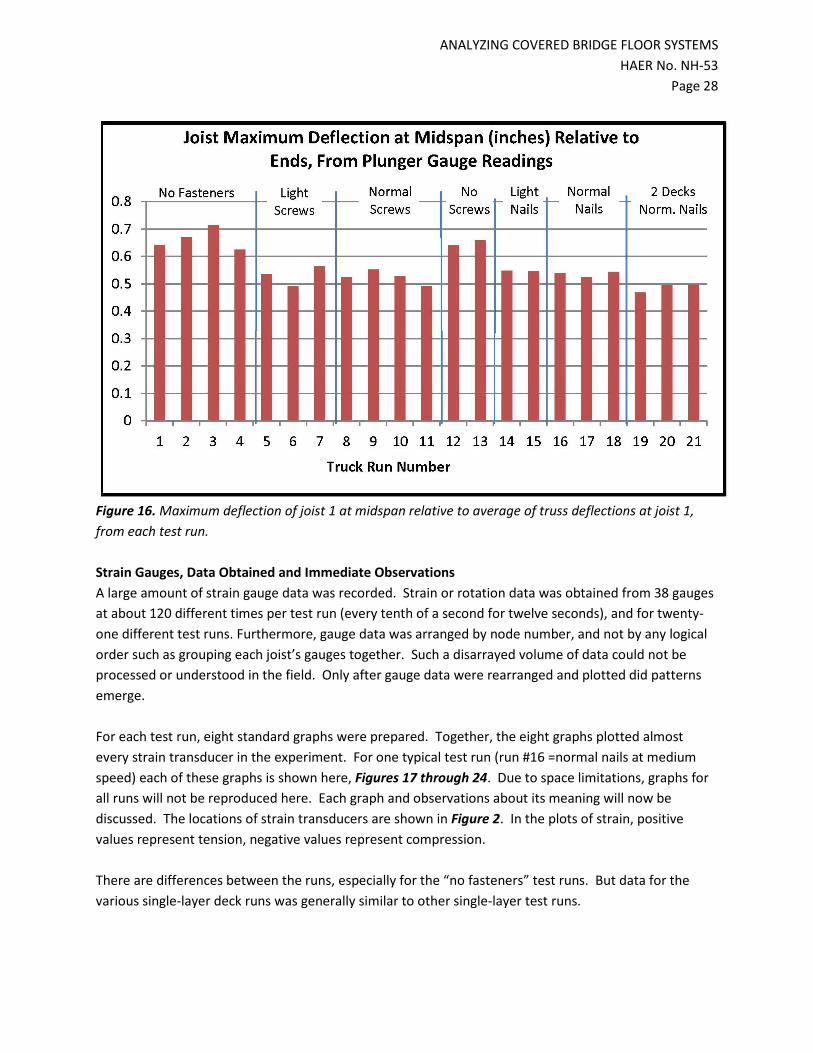
V. TESTING RESULTS Plunger Gauges, Data Obtained and Immediate Observations The plunger gauge data was direct and simple, and could be presented in a single page (Table 1). It was also plotted (Figure 16). Since the test runs stressed joists and deck in the linear elastic range, or nearly so, variations in midspan deflections reflected variations in stress, stiffness and relative safety of the different deck configurations. All test runs were successfully measured by this simple method. Table 1 and Figure 16 immediately indicate several things:
1) The no fasteners runs had the greatest deflections. This could be expected because load sharing with nearby joists would be reduced. Without fasteners, only floor planks directly under the truck tires would deflect with the load and thus transmit some load to adjacent joists. The other planks would just remain straight and transfer no load. Also, there could be no T-beam effect since the deck and joists were not connected. The no-fasteners condition is not an operational condition for covered bridges. However, for this testing it provided baseline data against which the magnitude of the beneficial effects of fasteners could be judged.
2) Test runs made with the two-layer deck had slightly reduced deflections, compared to the other runs. But this was not very much less. The difference was less than would be expected if the T-beam effect was important. This provided the first suggestion that the so-called T-beam effect was not occurring.
3) There were no significant differences in the deflections for any of the other test runs. Midspan deflections did not vary with type of fastener, density of fasteners, or truck speed, at least within the ranges of each variable tested.
ANALYZING COVERED BRIDGE FLOOR SYSTEMS HAER No. NH-53
Page 28
Figure 16. Maximum deflection of joist 1 at midspan relative to average of truss deflections at joist 1, from each test run. Strain Gauges, Data Obtained and Immediate Observations A large amount of strain gauge data was recorded. Strain or rotation data was obtained from 38 gauges at about 120 different times per test run (every tenth of a second for twelve seconds), and for twenty-one different test runs. Furthermore, gauge data was arranged by node number, and not by any logical order such as grouping each joist’s gauges together. Such a disarrayed volume of data could not be processed or understood in the field. Only after gauge data were rearranged and plotted did patterns emerge. For each test run, eight standard graphs were prepared. Together, the eight graphs plotted almost every strain transducer in the experiment. For one typical test run (run #16 =normal nails at medium speed) each of these graphs is shown here, Figures 17 through 24. Due to space limitations, graphs for all runs will not be reproduced here. Each graph and observations about its meaning will now be discussed. The locations of strain transducers are shown in Figure 2. In the plots of strain, positive values represent tension, negative values represent compression. There are differences between the runs, especially for the “no fasteners” test runs. But data for the various single-layer deck runs was generally similar to other single-layer test runs.
ANALYZING COVERED BRIDGE FLOOR SYSTEMS HAER No. NH-53
Page 29
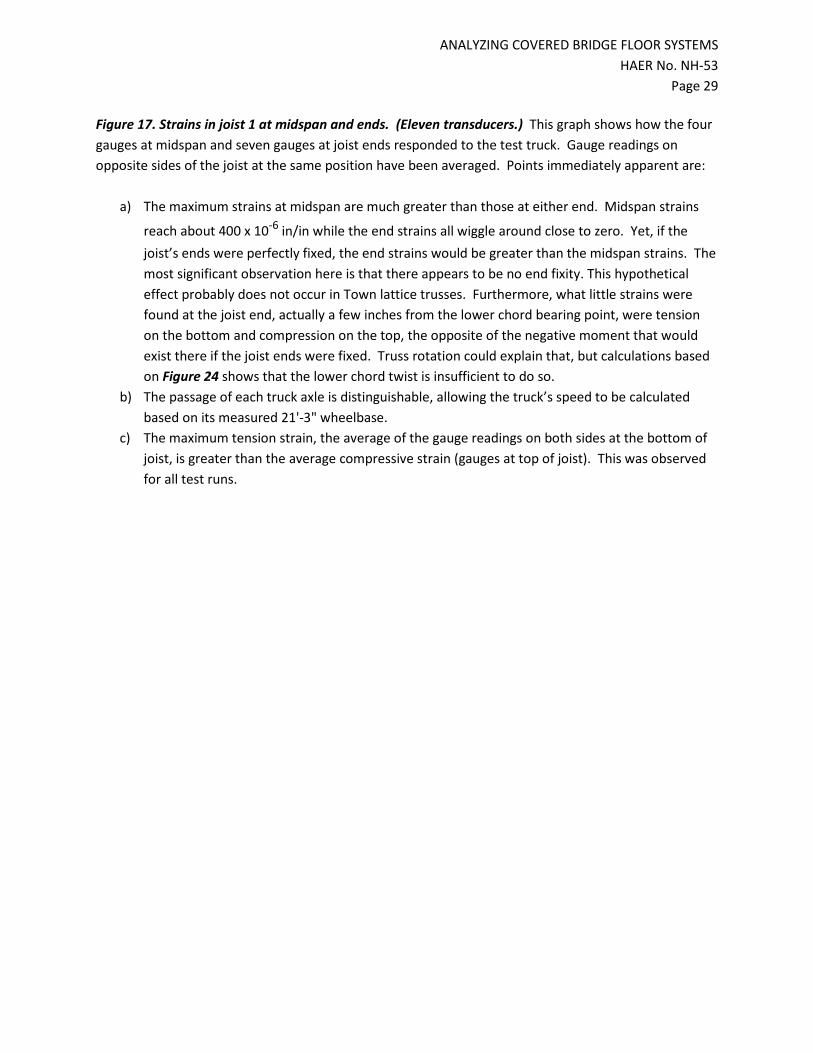
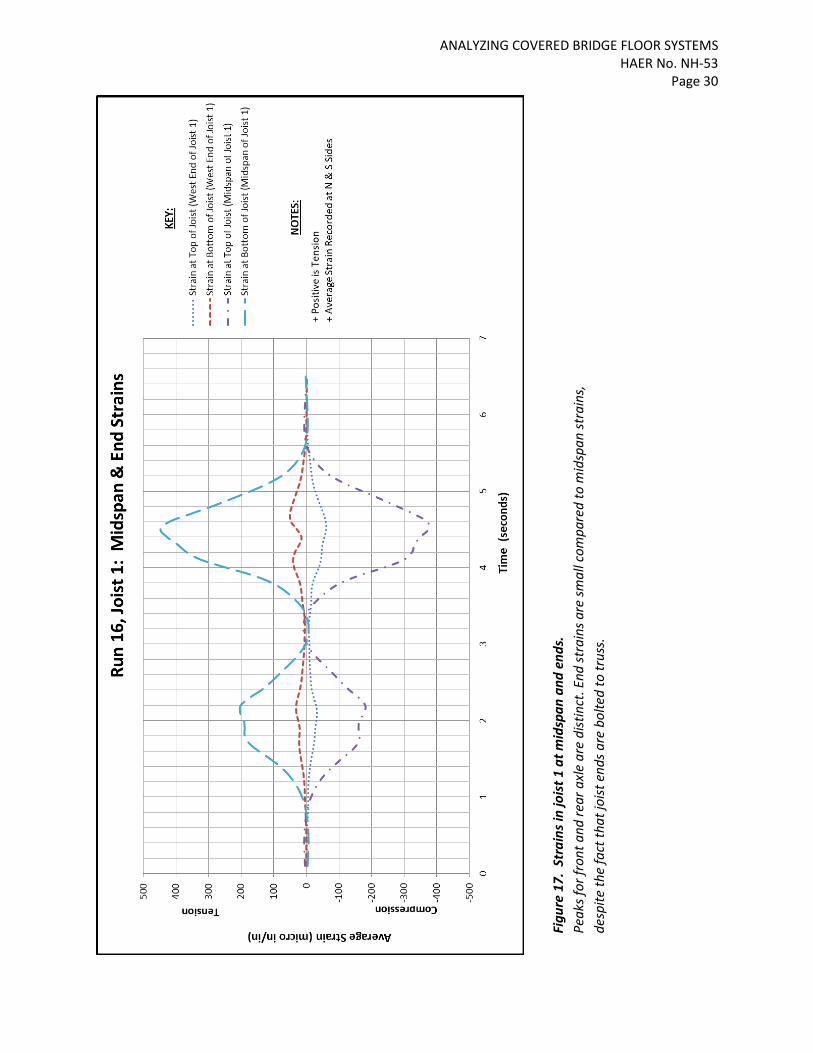
Figure 17. Strains in joist 1 at midspan and ends. (Eleven transducers.) This graph shows how the four gauges at midspan and seven gauges at joist ends responded to the test truck. Gauge readings on opposite sides of the joist at the same position have been averaged. Points immediately apparent are:
a) The maximum strains at midspan are much greater than those at either end. Midspan strains
reach about 400 x 10-6 in/in while the end strains all wiggle around close to zero. Yet, if the joist’s ends were perfectly fixed, the end strains would be greater than the midspan strains. The most significant observation here is that there appears to be no end fixity. This hypothetical effect probably does not occur in Town lattice trusses. Furthermore, what little strains were found at the joist end, actually a few inches from the lower chord bearing point, were tension on the bottom and compression on the top, the opposite of the negative moment that would exist there if the joist ends were fixed. Truss rotation could explain that, but calculations based on Figure 24 shows that the lower chord twist is insufficient to do so.
b) The passage of each truck axle is distinguishable, allowing the truck’s speed to be calculated based on its measured 21'-3" wheelbase.
c) The maximum tension strain, the average of the gauge readings on both sides at the bottom of joist, is greater than the average compressive strain (gauges at top of joist). This was observed for all test runs.
ANALYZING COVERED BRIDGE FLOOR SYSTEMS HAER No. NH-53
Page 30
Figu
re 1
7. S
trai
ns in
jois
t 1 a
t mid
span
and
end
s.
Peak
s for
fron
t and
rear
axl
e ar
e di
stin
ct. E
nd st
rain
s are
smal
l com
pare
d to
mid
span
stra
ins,
de
spite
the
fact
that
joist
end
s are
bol
ted
to tr
uss.

ANALYZING COVERED BRIDGE FLOOR SYSTEMS HAER No. NH-53
Page 31
Figure 18. Strains in joist 1 under a wheel line. (Two transducers.) This graph plots the two strain gauges placed under a wheel line, three feet from midspan. Only two were placed here, both on the south side of the joist. If we had the experiment to do over, we would have placed four gauges here, top and bottom on both sides of joist, and fewer transducers at the ends of the joists. Immediately apparent points are:
a) The peaks here are sharper, more well-defined, than those at midspan of either instrumented joist. It is almost as if the strains get spread out the further from the application point they are measured. The base of the peaks, where strains approach zero, occupies about the same time span as those in Figure 17, but the shapes of the peaks are sharper.
b) Maximum values of strain are about 30% greater than at midspan. c) The maximum value of compressive strain is greater than the maximum tension strain. This is
the reverse of the situation at midspan, and was observed for every test run.

ANALYZING COVERED BRIDGE FLOOR SYSTEMS HAER No. NH-53
Page 32
Figu
re 1
8. S
trai
ns in
jois
t 1 d
irect
ly u
nder
a w
heel
line
. Pe
aks f
or fr
ont a
nd re
ar a
xles
are
shar
per t
han
at m
idsp
an, a
nd m
axim
um m
agni
tude
s are
gre
ater
.
ANALYZING COVERED BRIDGE FLOOR SYSTEMS HAER No. NH-53
Page 33
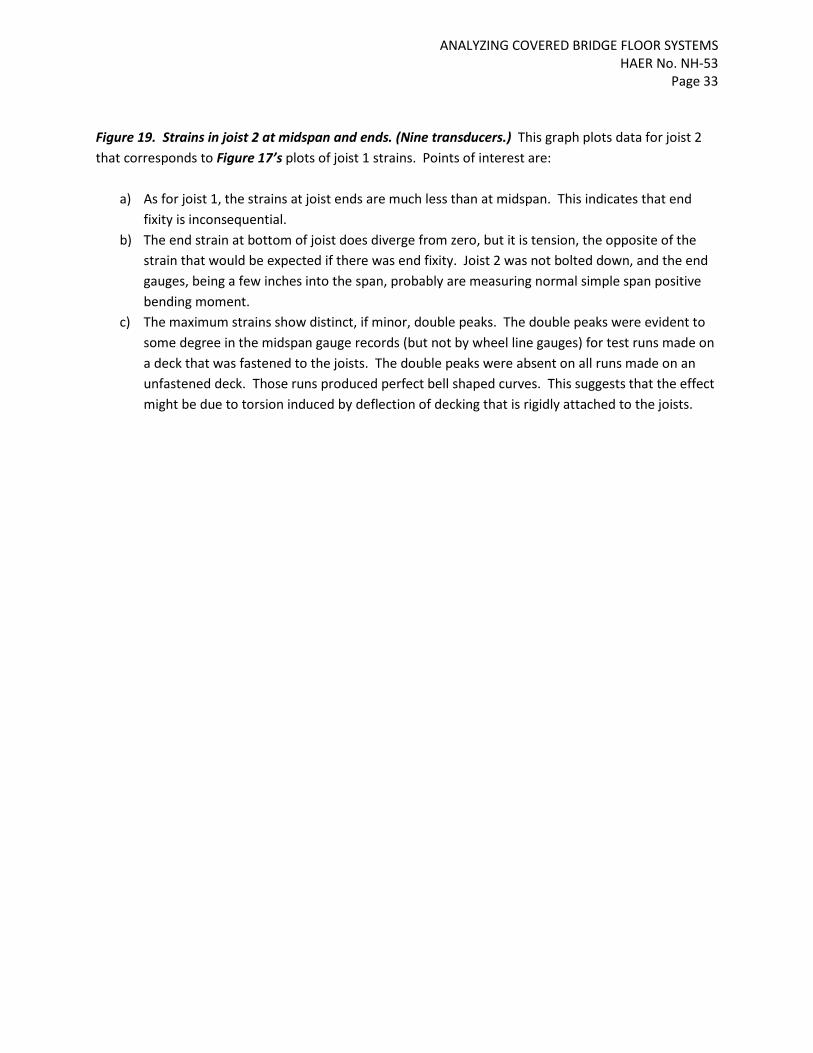
Figure 19. Strains in joist 2 at midspan and ends. (Nine transducers.) This graph plots data for joist 2 that corresponds to Figure 17’s plots of joist 1 strains. Points of interest are:
a) As for joist 1, the strains at joist ends are much less than at midspan. This indicates that end fixity is inconsequential.
b) The end strain at bottom of joist does diverge from zero, but it is tension, the opposite of the strain that would be expected if there was end fixity. Joist 2 was not bolted down, and the end gauges, being a few inches into the span, probably are measuring normal simple span positive bending moment.
c) The maximum strains show distinct, if minor, double peaks. The double peaks were evident to some degree in the midspan gauge records (but not by wheel line gauges) for test runs made on a deck that was fastened to the joists. The double peaks were absent on all runs made on an unfastened deck. Those runs produced perfect bell shaped curves. This suggests that the effect might be due to torsion induced by deflection of decking that is rigidly attached to the joists.
ANALYZING COVERED BRIDGE FLOOR SYSTEMS HAER No. NH-53
Page 34
Figu
re 1
9. S
trai
ns in
jois
t 2 a
t mid
span
and
end
s.
Peak
s for
fron
t and
rear
axl
e ar
e di
stin
ct. E
nd st
rain
s are
smal
l com
pare
d to
mid
span
stra
ins.
ANALYZING COVERED BRIDGE FLOOR SYSTEMS HAER No. NH-53
Page 35
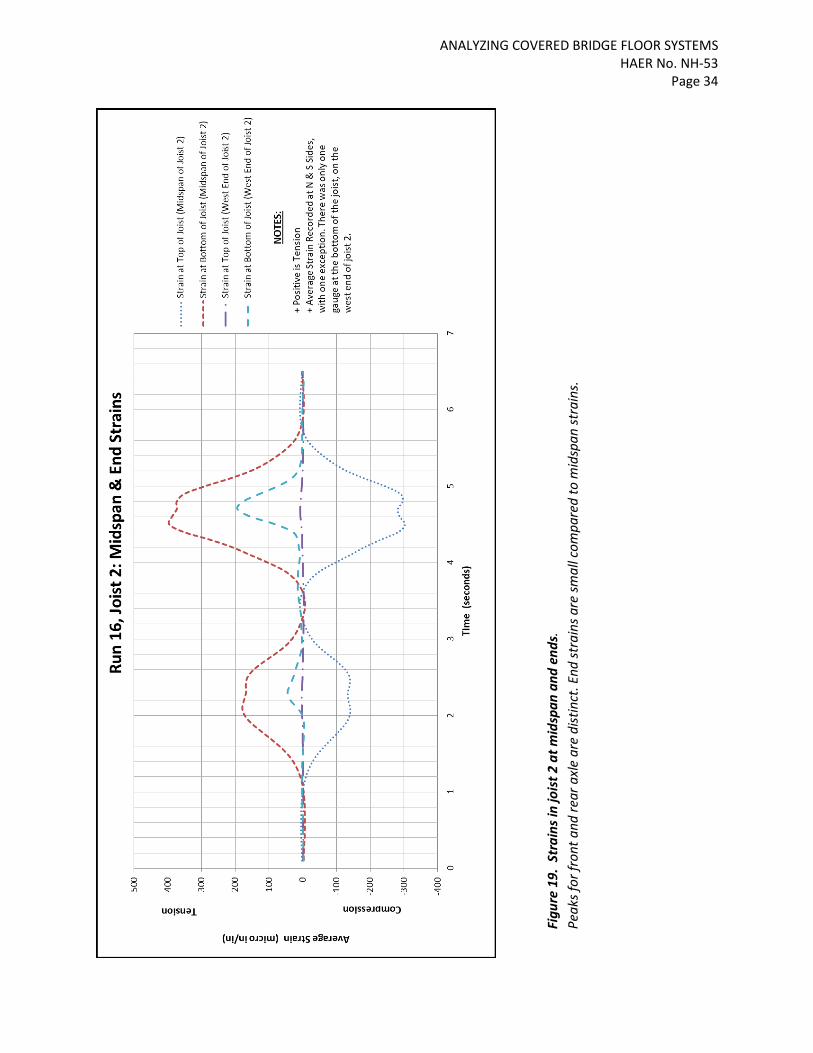
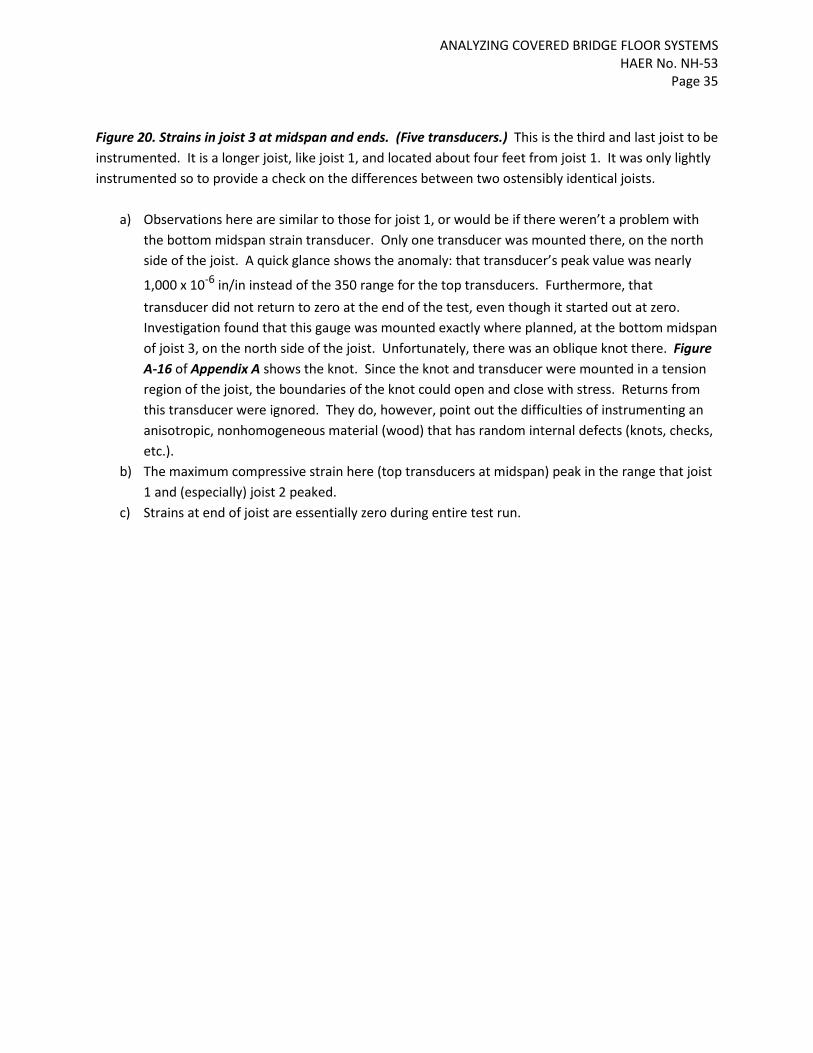
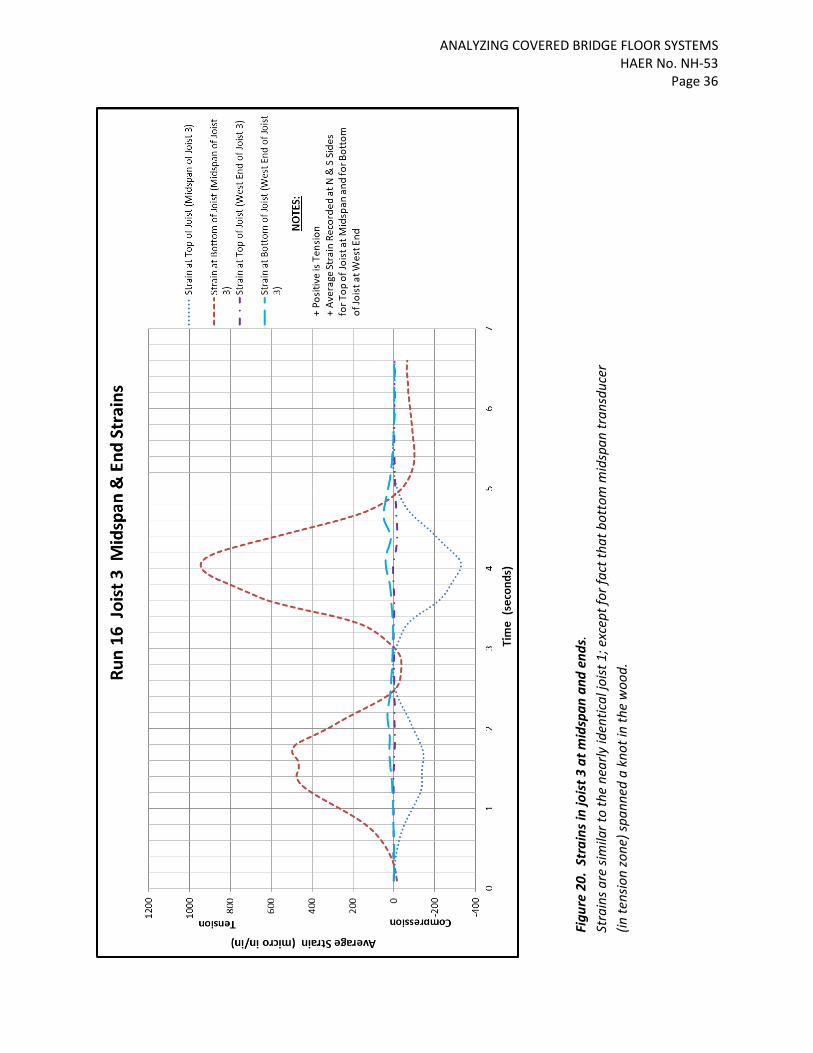
Figure 20. Strains in joist 3 at midspan and ends. (Five transducers.) This is the third and last joist to be instrumented. It is a longer joist, like joist 1, and located about four feet from joist 1. It was only lightly instrumented so to provide a check on the differences between two ostensibly identical joists.
a) Observations here are similar to those for joist 1, or would be if there weren’t a problem with the bottom midspan strain transducer. Only one transducer was mounted there, on the north side of the joist. A quick glance shows the anomaly: that transducer’s peak value was nearly
1,000 x 10-6 in/in instead of the 350 range for the top transducers. Furthermore, that transducer did not return to zero at the end of the test, even though it started out at zero. Investigation found that this gauge was mounted exactly where planned, at the bottom midspan of joist 3, on the north side of the joist. Unfortunately, there was an oblique knot there. Figure A-16 of Appendix A shows the knot. Since the knot and transducer were mounted in a tension region of the joist, the boundaries of the knot could open and close with stress. Returns from this transducer were ignored. They do, however, point out the difficulties of instrumenting an anisotropic, nonhomogeneous material (wood) that has random internal defects (knots, checks, etc.).
b) The maximum compressive strain here (top transducers at midspan) peak in the range that joist 1 and (especially) joist 2 peaked.
c) Strains at end of joist are essentially zero during entire test run.
ANALYZING COVERED BRIDGE FLOOR SYSTEMS HAER No. NH-53
Page 36
Figu
re 2
0. S
trai
ns in
jois
t 3 a
t mid
span
and
end
s. St
rain
s are
sim
ilar t
o th
e ne
arly
iden
tical
joist
1; e
xcep
t for
fact
that
bot
tom
mid
span
tran
sduc
er
(in te
nsio
n zo
ne) s
pann
ed a
kno
t in
the
woo
d.
ANALYZING COVERED BRIDGE FLOOR SYSTEMS HAER No. NH-53
Page 37
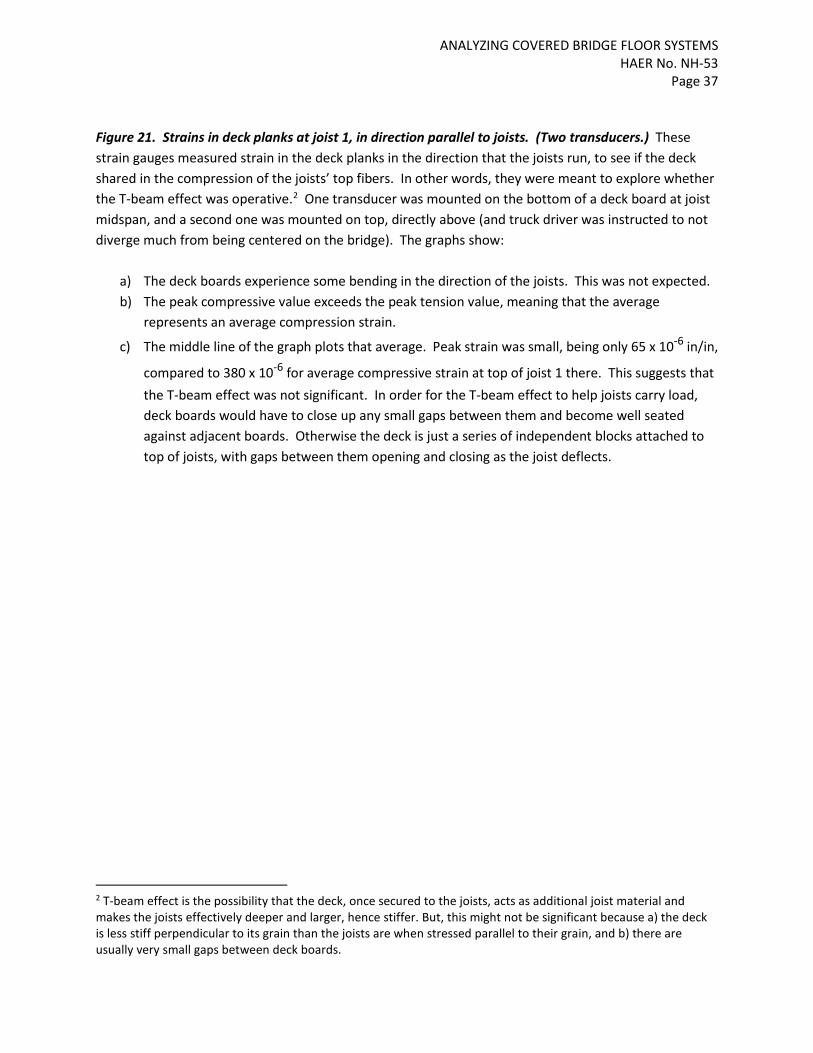
Figure 21. Strains in deck planks at joist 1, in direction parallel to joists. (Two transducers.) These strain gauges measured strain in the deck planks in the direction that the joists run, to see if the deck shared in the compression of the joists’ top fibers. In other words, they were meant to explore whether the T-beam effect was operative.2 One transducer was mounted on the bottom of a deck board at joist midspan, and a second one was mounted on top, directly above (and truck driver was instructed to not diverge much from being centered on the bridge). The graphs show:
a) The deck boards experience some bending in the direction of the joists. This was not expected. b) The peak compressive value exceeds the peak tension value, meaning that the average
represents an average compression strain.
c) The middle line of the graph plots that average. Peak strain was small, being only 65 x 10-6 in/in,
compared to 380 x 10-6 for average compressive strain at top of joist 1 there. This suggests that the T-beam effect was not significant. In order for the T-beam effect to help joists carry load, deck boards would have to close up any small gaps between them and become well seated against adjacent boards. Otherwise the deck is just a series of independent blocks attached to top of joists, with gaps between them opening and closing as the joist deflects.
2 T-beam effect is the possibility that the deck, once secured to the joists, acts as additional joist material and makes the joists effectively deeper and larger, hence stiffer. But, this might not be significant because a) the deck is less stiff perpendicular to its grain than the joists are when stressed parallel to their grain, and b) there are usually very small gaps between deck boards.

ANALYZING COVERED BRIDGE FLOOR SYSTEMS HAER No. NH-53
Page 38
Figu
re 2
1. S
trai
ns in
dec
k pl
anks
at j
oist
1, i
n di
rect
ion
para
llel t
o jo
ists
. Av
erag
e pe
ak st
rain
is o
nly
70 x
10-6
in/in
, com
pare
d to
380
x 1
0-6 in
/in a
few
inch
es a
way
and
in sa
me
dire
ctio
n in
joist
1.

ANALYZING COVERED BRIDGE FLOOR SYSTEMS HAER No. NH-53
Page 39
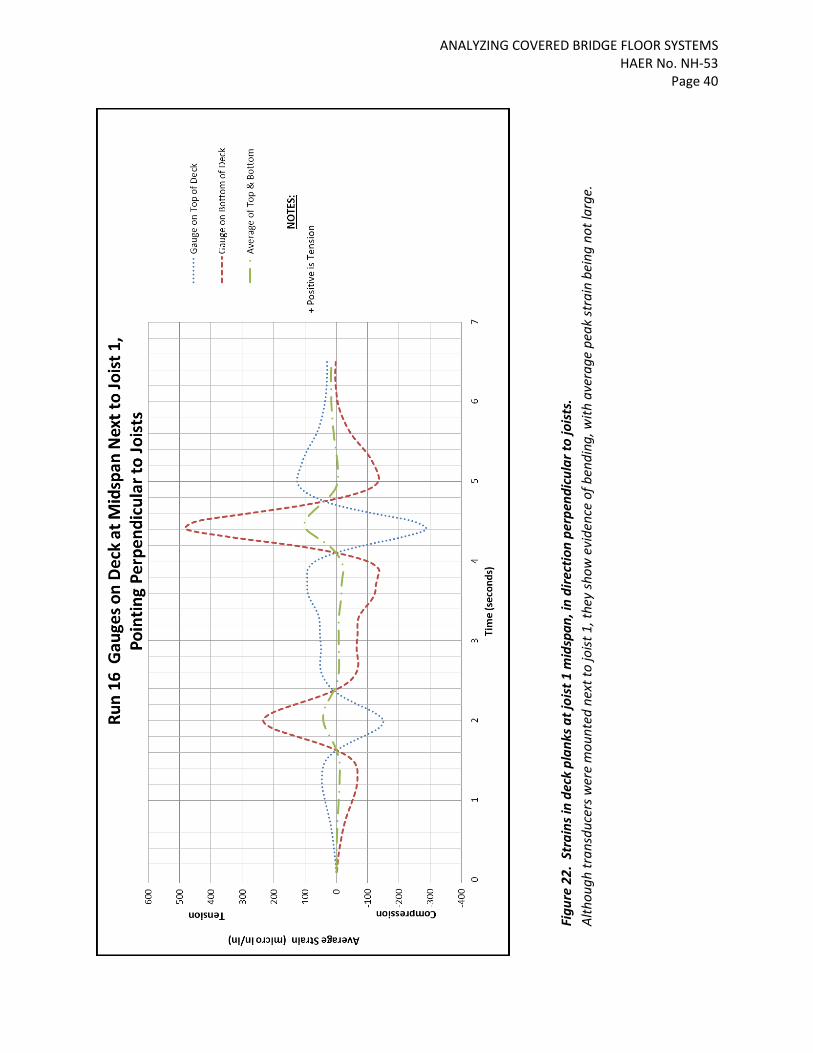
Figure 22. Strains in deck planks at joist 1 midspan, in direction perpendicular to joists. (Two transducers.) These were placed with the intent of measuring strains occurring in the deck boards in the travel direction of the test truck. One gauge was mounted on the top surface of the deck, the other one on the bottom. One might expect some bending to occur as the axles move between joists, especially tensile strain on the top surface gauge as the truck caused what is commonly termed “negative moment” near the joist, which supports the deck there. Figure 22 shows:
a) There is indeed bending in deck boards perpendicular to joists, but it is not negative moment for gauges right next to joists. It is positive moment (tension on bottom and compression on top). But the tensile forces were larger, and the averaged or net strains were tension. This could be expected. As joist 1 deflected more than its neighbors the deck would be stretched, overall. But the lower graph shows that as the truck axle moved to be over the adjacent joists in either direction the net, average strain in the deck boards became zero or slightly compressive.
b) A comparison of the average strains in Figures 22 and 21 indicates that the peak strains along the grain of the deck boards (i.e., perpendicular to joists) was greater than the average strains parallel to the joists. This could hardly be the case if there was a strong T-beam effect in operation.
ANALYZING COVERED BRIDGE FLOOR SYSTEMS HAER No. NH-53
Page 40
Figu
re 2
2. S
trai
ns in
dec
k pl
anks
at j
oist
1 m
idsp
an, i
n di
rect
ion
perp
endi
cula
r to
jois
ts.
Alth
ough
tran
sduc
ers w
ere
mou
nted
nex
t to
joist
1, t
hey
show
evi
denc
e of
ben
ding
, with
ave
rage
pea
k st
rain
bei
ng n
ot la
rge.
ANALYZING COVERED BRIDGE FLOOR SYSTEMS HAER No. NH-53
Page 41
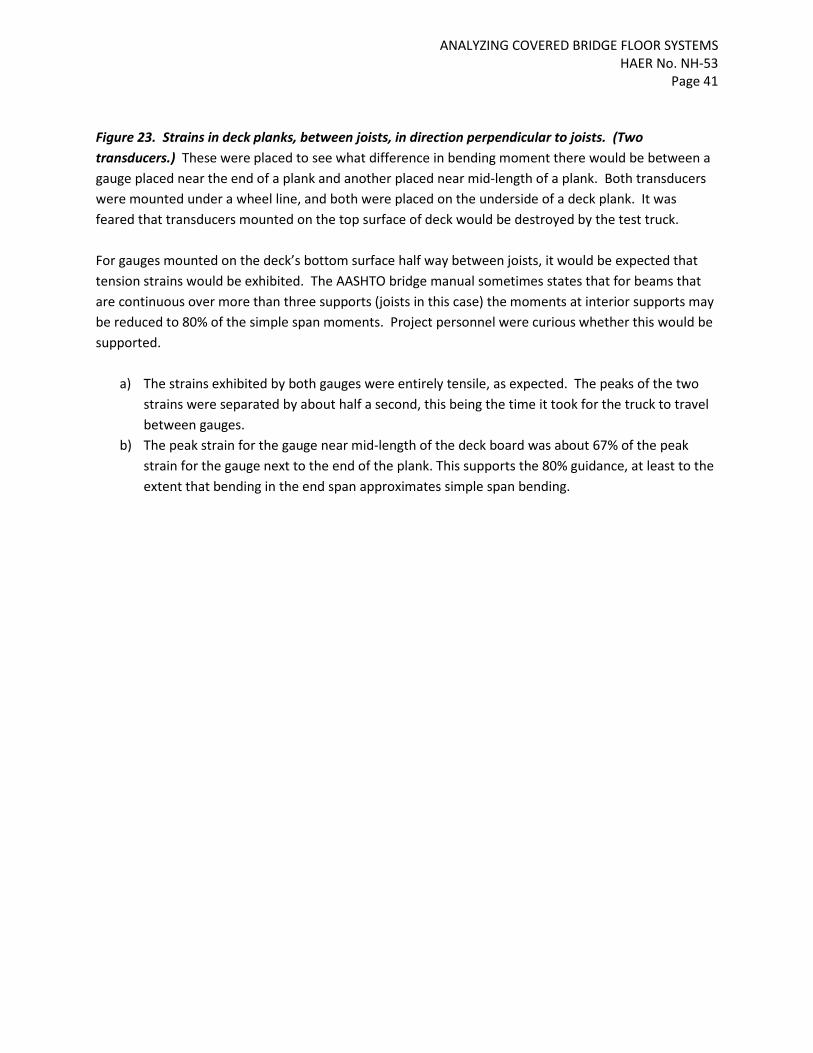
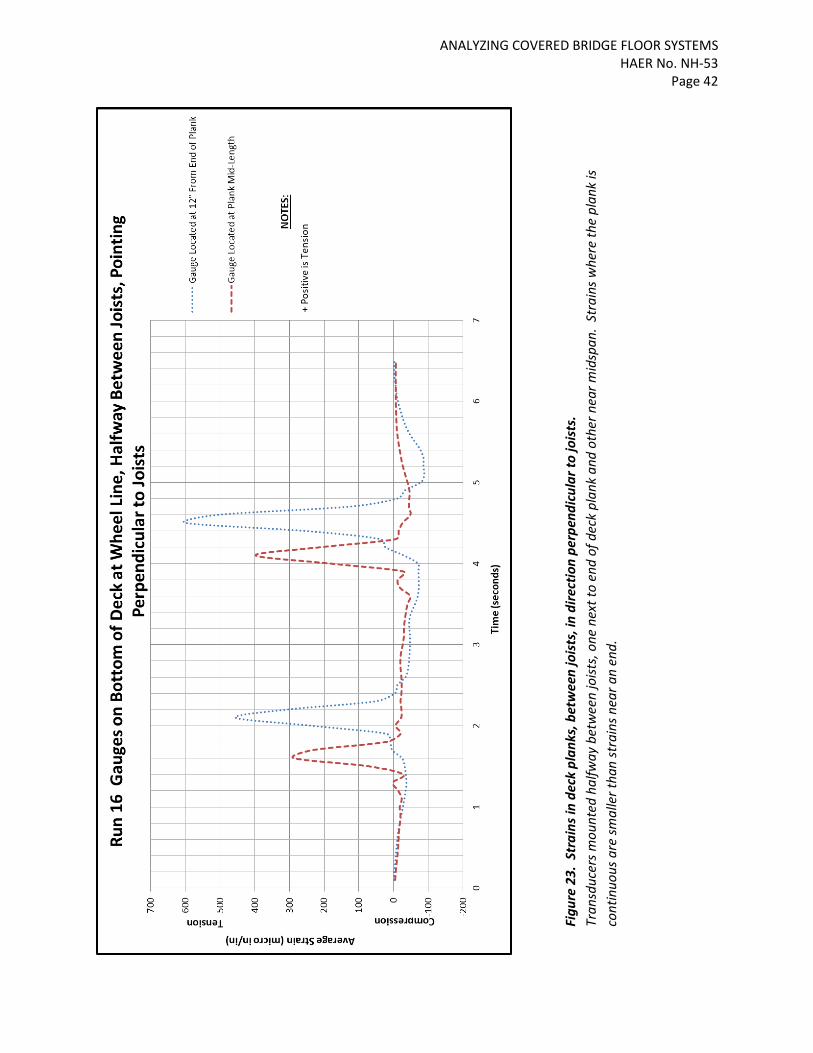
Figure 23. Strains in deck planks, between joists, in direction perpendicular to joists. (Two transducers.) These were placed to see what difference in bending moment there would be between a gauge placed near the end of a plank and another placed near mid-length of a plank. Both transducers were mounted under a wheel line, and both were placed on the underside of a deck plank. It was feared that transducers mounted on the top surface of deck would be destroyed by the test truck. For gauges mounted on the deck’s bottom surface half way between joists, it would be expected that tension strains would be exhibited. The AASHTO bridge manual sometimes states that for beams that are continuous over more than three supports (joists in this case) the moments at interior supports may be reduced to 80% of the simple span moments. Project personnel were curious whether this would be supported.
a) The strains exhibited by both gauges were entirely tensile, as expected. The peaks of the two strains were separated by about half a second, this being the time it took for the truck to travel between gauges.
b) The peak strain for the gauge near mid-length of the deck board was about 67% of the peak strain for the gauge next to the end of the plank. This supports the 80% guidance, at least to the extent that bending in the end span approximates simple span bending.
ANALYZING COVERED BRIDGE FLOOR SYSTEMS HAER No. NH-53
Page 42
Figu
re 2
3. S
trai
ns in
dec
k pl
anks
, bet
wee
n jo
ists
, in
dire
ctio
n pe
rpen
dicu
lar t
o jo
ists
. Tr
ansd
ucer
s mou
nted
hal
fway
bet
wee
n jo
ists,
one
nex
t to
end
of d
eck
plan
k an
d ot
her n
ear m
idsp
an.
Stra
ins w
here
the
plan
k is
cont
inuo
us a
re sm
alle
r tha
n st
rain
s nea
r an
end.
ANALYZING COVERED BRIDGE FLOOR SYSTEMS HAER No. NH-53
Page 43
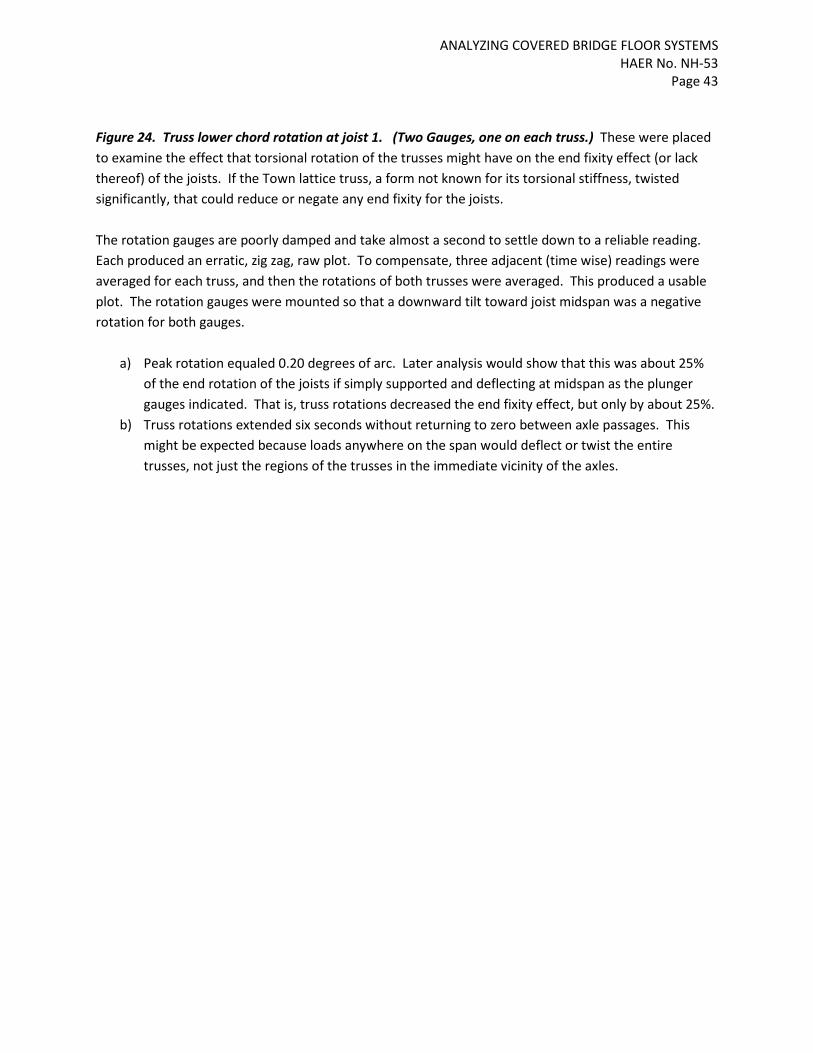
Figure 24. Truss lower chord rotation at joist 1. (Two Gauges, one on each truss.) These were placed to examine the effect that torsional rotation of the trusses might have on the end fixity effect (or lack thereof) of the joists. If the Town lattice truss, a form not known for its torsional stiffness, twisted significantly, that could reduce or negate any end fixity for the joists. The rotation gauges are poorly damped and take almost a second to settle down to a reliable reading. Each produced an erratic, zig zag, raw plot. To compensate, three adjacent (time wise) readings were averaged for each truss, and then the rotations of both trusses were averaged. This produced a usable plot. The rotation gauges were mounted so that a downward tilt toward joist midspan was a negative rotation for both gauges.
a) Peak rotation equaled 0.20 degrees of arc. Later analysis would show that this was about 25%
of the end rotation of the joists if simply supported and deflecting at midspan as the plunger gauges indicated. That is, truss rotations decreased the end fixity effect, but only by about 25%.
b) Truss rotations extended six seconds without returning to zero between axle passages. This might be expected because loads anywhere on the span would deflect or twist the entire trusses, not just the regions of the trusses in the immediate vicinity of the axles.

ANALYZING COVERED BRIDGE FLOOR SYSTEMS HAER No. NH-53
Page 44
Figu
re 2
4. T
russ
low
er ch
ord
rota
tion
at jo
ist 1
. Ea
st a
nd w
est t
russ
rota
tions
are
ave
rage
d. R
otat
ions
do
not r
etur
n to
zero
as q
uick
ly a
s do
stra
ins i
n an
in
divi
dual
joist
bec
ause
the
pres
ence
of t
he te
st tr
uck
in a
ny p
art o
f the
brid
ge’s
mid
span
regi
on c
ause
s rot
atio
n.

ANALYZING COVERED BRIDGE FLOOR SYSTEMS HAER No. NH-53
Page 45
VI. INSTRUMENTATION DIFFICULTIES Strain data from the various transducers did not originally appear in the data recording computer in order. The order was random. Only later, after being reorganized and studied, did several deficiencies in the test procedure become evident. The need to make changes to the deck and proceed with twenty-one test runs in a single day precluded studying the data immediately. As a result, three deficiencies in the instrumentation were not recognized while the testing was going on. Had this been possible, immediate and easy corrections could have been made.
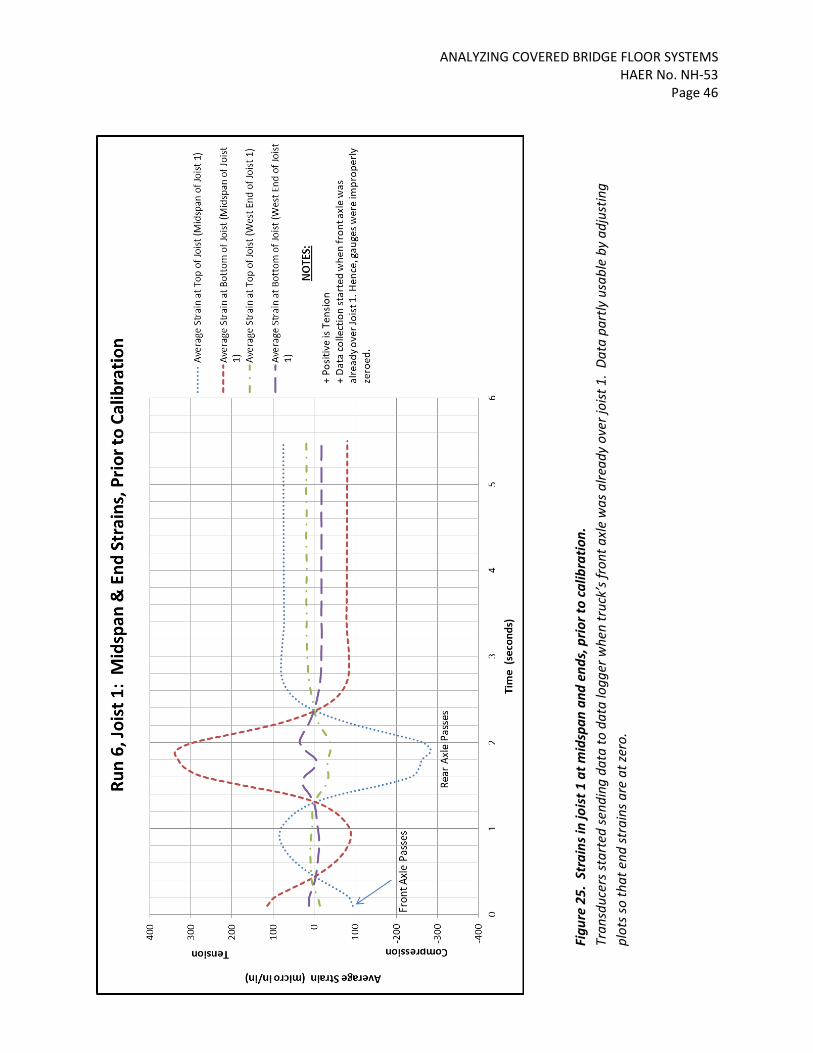
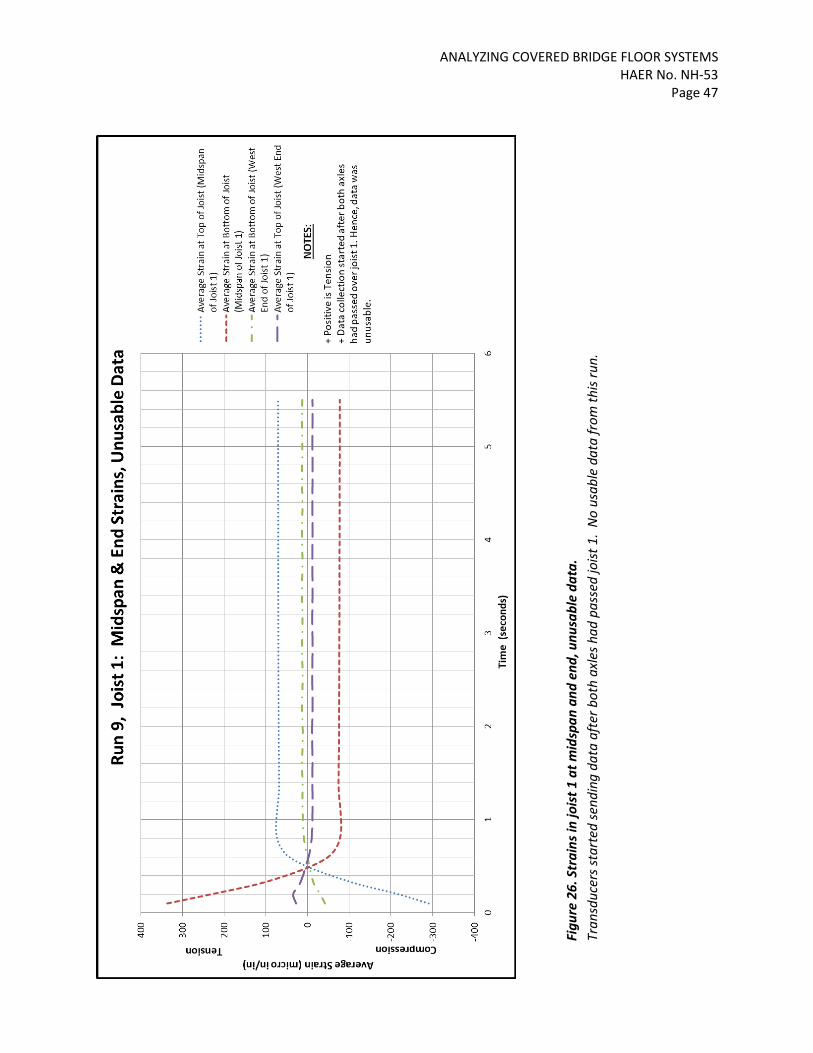
1) It was not realized that after starting to record a test run, time elapsed while the wireless parts established communications and zeroed out the thirty-eight transducers. As a result, for several of the runs the front or rear axle was already on the instrumented joists when the transducers were zeroed. This produced false starting values for strain. Figures 25 and 26 show what those data plots look like. In Figure 26 both front and rear axles have passed the instrumented joists, and nothing useful was obtained. In Figure 25, the entire rear axle passage was recorded but with false zero staring points. For this graph, the lines could be adjusted up and down to make all of the tail ends equal zero, and some useful data could be obtained.
2) A few of the gauges had at least one mounting screw that was insufficiently tightened, which allowed slippage. Figure 20 shows an example of this: the red line starts out at zero, but at the end did not return to zero. One end slipped during loading and the transducer finished with a 50 x 10-6 in/in strain. The other transducers in Figures 17 through 23 correctly returned to zero after the test truck left. This defect only affected a few gauges, and those not every run. The plots give a good idea which ones are suspect because the properly fastened gauges returned to zero strain at the end of each test run.
3) The third defect was already mentioned. The bottom midspan transducer on joist 3 was attached across a knot, so the readings were exaggerated and unusable. Figure 20 plots errant gauge reading along with other, usable, returns.
ANALYZING COVERED BRIDGE FLOOR SYSTEMS HAER No. NH-53
Page 46
Figu
re 2
5. S
trai
ns in
jois
t 1 a
t mid
span
and
end
s, p
rior t
o ca
libra
tion.
Tr
ansd
ucer
s sta
rted
send
ing
data
to d
ata
logg
er w
hen
truc
k’s f
ront
axl
e w
as a
lread
y ov
er jo
ist 1
. Da
ta p
artly
usa
ble
by a
djus
ting
plot
s so
that
end
stra
ins a
re a
t zer
o.
ANALYZING COVERED BRIDGE FLOOR SYSTEMS HAER No. NH-53
Page 47
Figu
re 2
6. S
trai
ns in
jois
t 1 a
t mid
span
and
end
, unu
sabl
e da
ta.
Tran
sduc
ers s
tart
ed se
ndin
g da
ta a
fter
bot
h ax
les h
ad p
asse
d jo
ist 1
. N
o us
able
dat
a fr
om th
is ru
n.

ANALYZING COVERED BRIDGE FLOOR SYSTEMS HAER No. NH-53
Page 48
VII. PRIMARY FINDINGS As described earlier, the project’s objective has been to understand why the floor systems of covered bridges perform so much better than standard load calculations predict. Three possible explanations or contributing actions were thought reasonably likely to occur. These were:
1) partial end fixity, illustrated in Figure 6; 2) deck acting as extra top flange for joists (sometimes called a T-beam effect); and 3) an overly conservative value for the “distribution factor”, commonly used to describe how the
decking acts as a continuous beam that makes several neighboring joists share the wheel loads. End Fixity If end fixity is occurring it should show up as significant negative moment in the joists near their ends. To look for this more transducers were placed on the ends of the joists than were located in the midspan and wheel line regions. If end fixity was complete, with the joists rigidly attached to the truss lower chords and the chords disinclined to rotate, and the decking firmly attached to the joists and loaded at the truck tire locations, the negative moment in the ends of the joists should be nearly twice as great as the bending moment at midspan. Also, bending moment at the fixed ends should have the opposite sign than the moment in the span (tension on top at ends, vs. tension at bottom at midspan). Whether or not these signs were observed would tell whether end fixity was present and significant. With complete end fixity, the midspan stresses are not reduced to zero, but would be merely reduced to about one-third of their simple span magnitude. So it would take considerable negative moment at the ends of joists to make a significant difference in midspan strains. The strain gauge data show that end fixity, while present in small amounts, is not a significant factor in the performance of the floor joists. A typical example of the data is Figure 17. Whereas the midspan strains peaked at about 450 micro in/in, the end of joist strain gauges peaked around 55 micro in/in, or about one-eighth of the midspan strain. Yet, as Figure 6 illustrates, if end fixity was fully effective then the end strains should be approximately the same magnitude as midspan strains and of opposite sign. Testing data indicated no end fixity took place because the joist end strains were not only small compared to those at midspan; they were also the same sign as the midspan strains. The right hand drawing in Figure 6 shows that if end fixity was occurring then the direction of curvature at the ends would be the opposite direction than at midspan. (i.e.: tension on the top at ends, compression in the top at midspan). This means that there is essentially no fixed-end support for the joists, even those that are bolted to the lower chord. This is the case for all runs where the deck was fastened to the joists. The small positive moment strains (tension on bottom, compression on top) is probably due to the gauges being mounted several inches inward from the inside edge of the lower chord.

ANALYZING COVERED BRIDGE FLOOR SYSTEMS HAER No. NH-53
Page 49
Joist 2, the one that was not attached to the truss but merely rested on the chord, showed similarly small end strains. But these strains (Figure 19) wavered as if unable to decide whether to be positive or negative bending. Again, evidence of helpful end fixity is absent. All runs exhibited the characteristics described above. Study results indicate that end fixity does not occur to a significant degree. The strain gauges at joist ends did show an odd dip in the tension of the gauges at top of joists just when the rear axle passes the joist. This was probably caused by torsion forces in the joists as adjacent joists deflect differently. But for now, the important aspect is that the end strains are small compared to the strains out in the span. T-beam Effect (Deck Acting Compositely with Joists) This was initially expected to be a significant effect. However, these expectations were not supported by testing results. It was initially thought that the deck boards, once fastened to the joists, might act as additional top flange material for the joists, similar to the way a concrete deck can be made to strengthen supporting concrete or steel beams in more modern bridge construction. If composite action between the deck and joists (here called “T-beam effect” for brevity) were significant, several effects should be apparent in the testing data. These include:
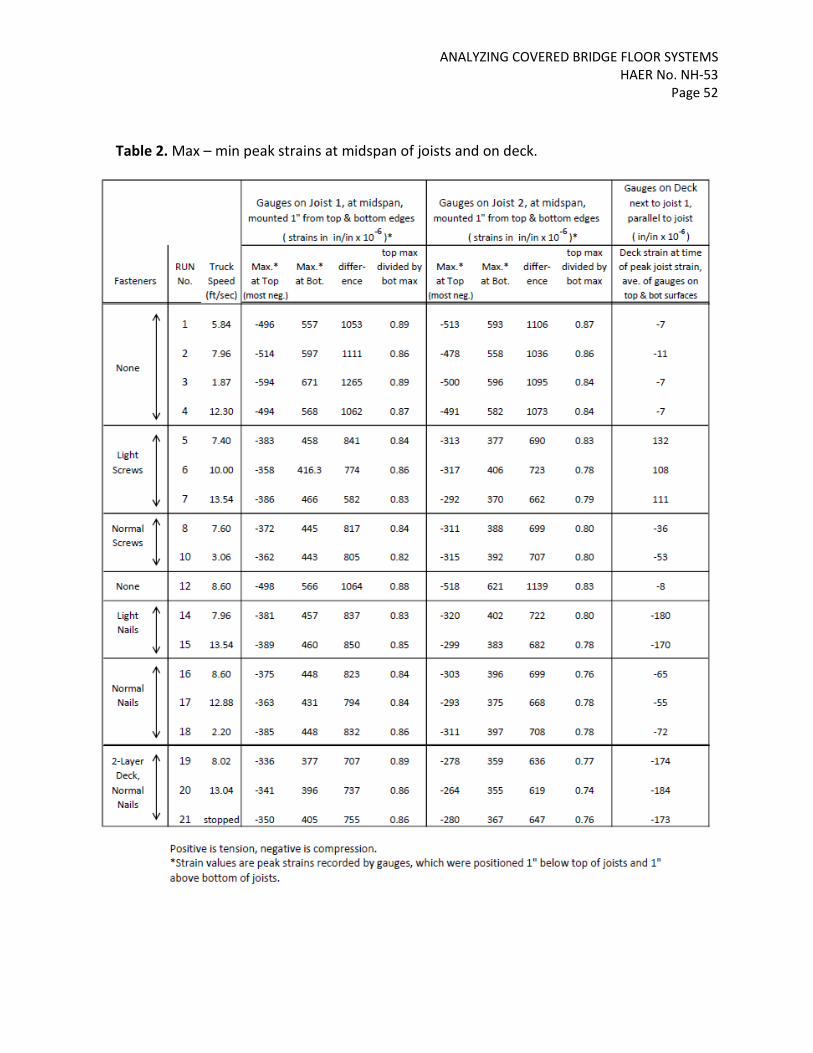
1) In deck planks, strains parallel to the direction that joists run should match strains at top of joists.
2) University of Maine’s testing should show that joist with deck attached was stiffer than others. 3) Top and bottom strains in joists should show that neutral axis shifted upwards for runs made
with attached deck. 4) For the no fasteners runs, hypothetical effects 1) and 3) should be absent. 5) When second deck layer was added, there should be corresponding reductions in joist strains. 6) There should be differences in midspan deflection for no fasteners, fasteners, and two-layer
runs These predicted effects should be observable if the deck is acting as additional top flange for the joists. However, predicted effects 5) and 6) could also be caused by an attached deck changing the distribution factor for the joists, and hence are less definitive. These six effects will be discussed in the order given above.
1) Strains in deck planks. As Figure 21 shows, the strain in the deck boards in the direction the joists run is much lower than the strain at the top of the adjacent joist. For all runs, the deck strains were mostly bending, with small

ANALYZING COVERED BRIDGE FLOOR SYSTEMS HAER No. NH-53
Page 50
differentials representing actual average deck strain in the direction of the joists. For the runs with no
fasteners, the maximum deck compressive strain was 11 x 10-6 in/in at joist midspan, compared to 600 x
10-6 in/in at the tops of the joists there (after accounting for gauges being 1" below top of joist). This was effectively no deck strain. For all of the single-layer, deck-fastened runs, the deck strain averaged
60 x 10-6 in/in, but with one run reaching 180, compared to 500 x 10-6 in/in at the top of joists. This was almost no force effect after accounting for the difference in moduli of elasticity between deck and joist. That means the deck helped the joists very little. The modulus of elasticity of the joists was measured by University of Maine (Appendix A) as 1,350 ksi, parallel to the grain. The Hemlock deck planks, however, were strained transverse to grain,
predominantly tangent to the growth rings. For this situation the Wood Handbook gives the Edeck as about 50 ksi, or 3.7 % of the joist’s modulus of elasticity.3 University of Maine tests (Appendix A, Figure A-23) give the measured modulus between 70 ksi for the steep initial slope and 25 ksi if the test were run out to the standard strain (0.1"). That softness (50 ksi vs. 1350 ksi) combined with the fact that the deck is strained only about one-tenth as much as the joist, makes the deck’s contribution to bending stiffness almost nil. For the three runs made with a two-layer deck, the peak compressive deck board strains were all close
to 180 x 10-6 in/in; similar to the highest of the runs made with the single deck layer. So, to summarize, the no fastener test runs showed almost no deck strain; the single-layer, fastened-deck runs showed peak deck strains between 60 and 180 x 10-6 in/in; and the two-layer deck runs showed slightly greater deck strains. All of these were far below the corresponding strains in the joists for those runs, and in much softer material. These factors mean that the attached deck did not significantly improve the bending strength of the joists and cannot explain the admirable performance of covered bridge floor systems.
2) Stiffness of joist with deck attached vs. stiffness of joists without decking. In December 2016, the material testing laboratory at the University of Maine tested the three joists that were instrumented during the July 30, 2016 fieldwork. For joist 1 (the most heavily instrumented joist) the bottom layer of deck was cut in the field and left attached to the joist. It was not cut halfway to adjacent joists, but right at the edge of neighboring joists, thus providing a 44"-wide top flange. Joists 2 and 3 were tested after all decking was removed. The joists were supported fifteen feet apart, matching the support separation in the field testing. Loading was applied in two places, replicating the geometry
3 Wood Handbook: Wood as an Engineering Material, General Technical Report FPL-GTR-190 (Madison, WI: U.S. Department of Agriculture, Forest Service, Forest Products Laboratory, 2010), 5-2.

ANALYZING COVERED BRIDGE FLOOR SYSTEMS HAER No. NH-53
Page 51
of the rear tires of the test truck. The full report is attached here as Appendix A. In that report, Figures A-1 and A-2 in Appendix A show joist 1, and Figure 6 shows the testing of joist 2. A key result of the laboratory testing is shown in Appendix A’s Figure A-9, plotting the applied load vs. midspan deflection for each joist. The vertical scale is total applied loading, equal to both wheel line loads added together. The test truck had a rear axle load of 13,900 pounds, which corresponds to the rear axle of a standard AASHTO H-9 truck (nine tons total weight). The graph shows that the joist with deck attached was no stiffer than the other two. The slope of the deflection vs. load curve for joist 1 was very close to the average slope of the other two joists. This means that the moment of inertia of joist 1 was not increased by leaving the deck attached. In the service load regime, the laboratory tests showed no T-beam effect. As the loading continued to destruction, the joist with deck attached reached a greater deflection before failing (3.8" midspan deflection for joist 1 vs. 2.8" for the others). The failing load for the joist-with-deck was no higher than for joist 3, but was 45 % higher than for joist 2. These comparisons could be interpreted as indicating that a well-fastened deck does make the joists stronger, but only at heavy loadings, well above the usual service load region, after the joists have bent enough to close up gaps between deck planks. The figure also illustrates the variability in mechanical properties of wood. Joists 2 and 3 were the same species and grade, and were both tested identically and without deck planks. Yet joist 3 was 45 % stronger than joist 2.
3) Strains in joists at midspan. Since the top and bottom gauges at midspan were all mounted 1" from top and bottom edges, they should record equal and opposite strains, at least for pure bending with the joists getting no help from deck or other effects. However, the top and bottom gauges recorded different peak strain magnitudes, and markedly consistent different strains. In all cases the top strains were less than bottom strains. Table 2 shows the differences, summarized separately for joist 1 (bolted to truss) and joist 2 (not fastened to truss). Table 2 also shows the differences grouped by unfastened deck, fastened one-layer deck and fastened two-layer deck. All of the differences correspond to something raising the neutral axis of the joist. The differences are so consistent that they indicate, or at least suggest, that some physical phenomenon is causing them; not random experimental noise.
ANALYZING COVERED BRIDGE FLOOR SYSTEMS HAER No. NH-53
Page 52
Table 2. Max – min peak strains at midspan of joists and on deck.

ANALYZING COVERED BRIDGE FLOOR SYSTEMS HAER No. NH-53
Page 53
If the deck planks were laid so tightly against each other that there was no seating slack, and were well fastened to the joists, a T-beam effect could account for the observed differences in top and bottom joist strains. However, closer consideration raises doubts that this is what was happening. First, the deck boards all had very slight sweep, and although pushed against each other at installation, still probably had some small gaps and seating slack. With that, the T-beam effect cannot account for the differences in midspan joist strains. Second, deck gauge data shows clearly that for the unfastened runs there is no strain in the deck boards in the direction that the joists run. This means that the differences between top and bottom joist gauges should disappear for the unfastened runs. This did not happen. Although the differences were somewhat smaller for the unfastened-deck runs (Table 2) they still were strikingly present. Third, if the T-beam effect was effective, then the University of Maine testing (Appendix A) should show that the joist tested with deck still attached was stiffer than the two joists tested sans deck boards. However, Figure A-9 of that report (Appendix A) shows that joist with deck attached was no stiffer than the others. Joist 1 ran to a greater deflection, but was no stiffer in the elastic region that the 9-ton test truck stressed. This might mean that the deck helps after extreme deflections beyond the service load environment, but does not help for loads in the normal usage range. The three above considerations suggest that something other than the T-beam effect must be causing the joists’ neutral axis to rise.
4) For test runs made with unfastened deck, there should be no strain in the deck in the direction the joists run, and no differences between top and bottom strains in the joists.
Gauges on the deck planks at midspan of joists, and pointing parallel to the joists (Figure 2 and Table 2) show that the net deck strain does indeed stay near zero for the test runs made without attaching the deck to the joists. However, as mentioned in previous paragraphs, the differences in top and bottom strains in the joists (indicating a rise in neutral axis) do not disappear. This is a problem because if the neutral axis rise is due to a T-beam effect, there has to be net force, and hence strain, in the deck planks. The dichotomy of the two suggests that something else is causing the differences in magnitude of the strains at top and bottom joists.
5) Adding a second deck layer should reduce midspan strains in joists.
Attaching the second deck layer, offset a half-board width from bottom layer, might be expected to make the deck continuous along the joists’ length, instead of being a group of spaced blocks (i.e., deck planks) nailed to the top of the joists. Adding the second deck layer should produce (1) an increase in strain in the deck boards measured parallel to joists, (2) decreased strain at top of the joists, and (3) decreased midspan deflection. All of these effects were noticeable. The first and second of these can be seen in Table 2. The third can be seen in Figure 16, the plunger gauge results. However, Table 2 indicates that the reduction of the joist strain (and hence, stress) is only about 9%. And Figure 16 indicates the reduction of deflections (and hence, stress) is only 8%. Whether the second layer’s added cost and added weight is worth such reductions will be left to designers.
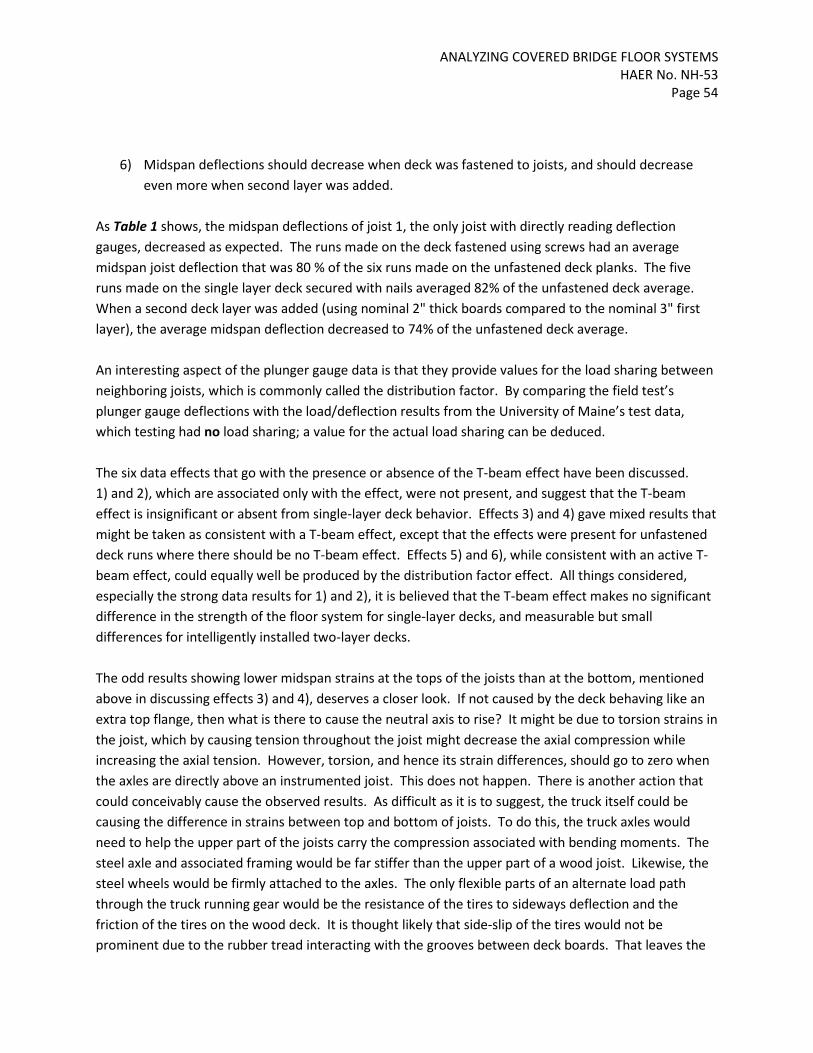
ANALYZING COVERED BRIDGE FLOOR SYSTEMS HAER No. NH-53
Page 54
6) Midspan deflections should decrease when deck was fastened to joists, and should decrease
even more when second layer was added.
As Table 1 shows, the midspan deflections of joist 1, the only joist with directly reading deflection gauges, decreased as expected. The runs made on the deck fastened using screws had an average midspan joist deflection that was 80 % of the six runs made on the unfastened deck planks. The five runs made on the single layer deck secured with nails averaged 82% of the unfastened deck average. When a second deck layer was added (using nominal 2" thick boards compared to the nominal 3" first layer), the average midspan deflection decreased to 74% of the unfastened deck average. An interesting aspect of the plunger gauge data is that they provide values for the load sharing between neighboring joists, which is commonly called the distribution factor. By comparing the field test’s plunger gauge deflections with the load/deflection results from the University of Maine’s test data, which testing had no load sharing; a value for the actual load sharing can be deduced. The six data effects that go with the presence or absence of the T-beam effect have been discussed. 1) and 2), which are associated only with the effect, were not present, and suggest that the T-beam effect is insignificant or absent from single-layer deck behavior. Effects 3) and 4) gave mixed results that might be taken as consistent with a T-beam effect, except that the effects were present for unfastened deck runs where there should be no T-beam effect. Effects 5) and 6), while consistent with an active T-beam effect, could equally well be produced by the distribution factor effect. All things considered, especially the strong data results for 1) and 2), it is believed that the T-beam effect makes no significant difference in the strength of the floor system for single-layer decks, and measurable but small differences for intelligently installed two-layer decks. The odd results showing lower midspan strains at the tops of the joists than at the bottom, mentioned above in discussing effects 3) and 4), deserves a closer look. If not caused by the deck behaving like an extra top flange, then what is there to cause the neutral axis to rise? It might be due to torsion strains in the joist, which by causing tension throughout the joist might decrease the axial compression while increasing the axial tension. However, torsion, and hence its strain differences, should go to zero when the axles are directly above an instrumented joist. This does not happen. There is another action that could conceivably cause the observed results. As difficult as it is to suggest, the truck itself could be causing the difference in strains between top and bottom of joists. To do this, the truck axles would need to help the upper part of the joists carry the compression associated with bending moments. The steel axle and associated framing would be far stiffer than the upper part of a wood joist. Likewise, the steel wheels would be firmly attached to the axles. The only flexible parts of an alternate load path through the truck running gear would be the resistance of the tires to sideways deflection and the friction of the tires on the wood deck. It is thought likely that side-slip of the tires would not be prominent due to the rubber tread interacting with the grooves between deck boards. That leaves the
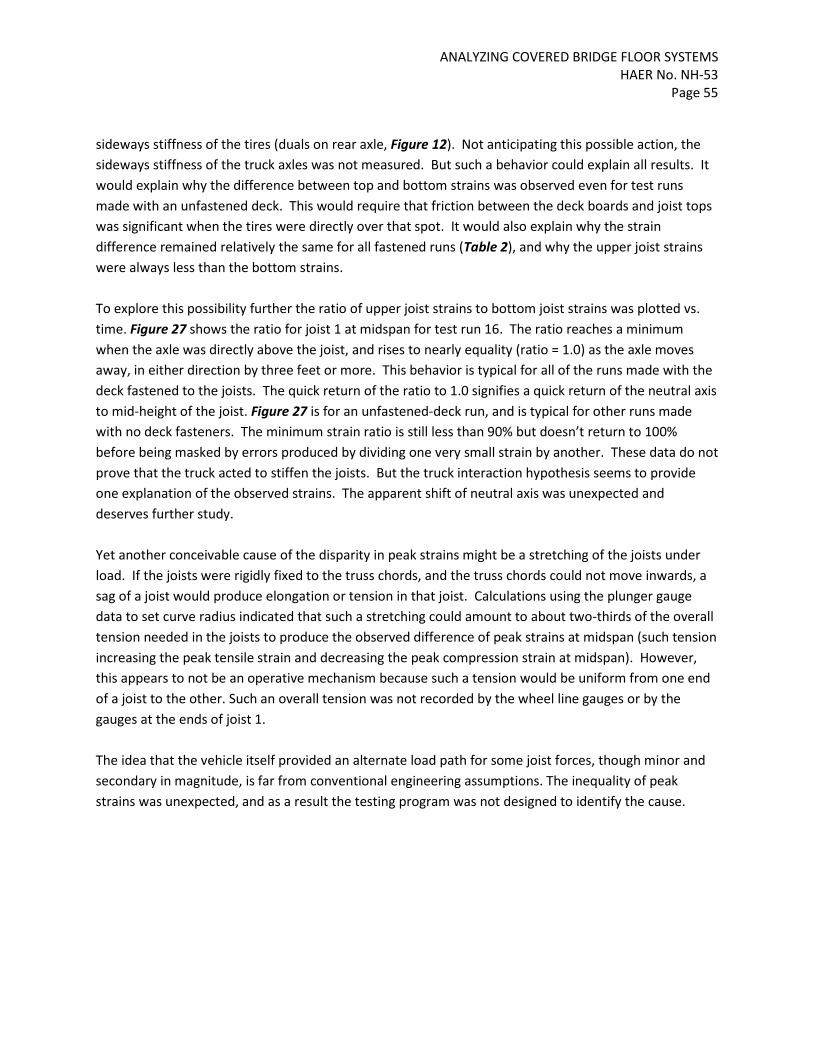
ANALYZING COVERED BRIDGE FLOOR SYSTEMS HAER No. NH-53
Page 55
sideways stiffness of the tires (duals on rear axle, Figure 12). Not anticipating this possible action, the sideways stiffness of the truck axles was not measured. But such a behavior could explain all results. It would explain why the difference between top and bottom strains was observed even for test runs made with an unfastened deck. This would require that friction between the deck boards and joist tops was significant when the tires were directly over that spot. It would also explain why the strain difference remained relatively the same for all fastened runs (Table 2), and why the upper joist strains were always less than the bottom strains. To explore this possibility further the ratio of upper joist strains to bottom joist strains was plotted vs. time. Figure 27 shows the ratio for joist 1 at midspan for test run 16. The ratio reaches a minimum when the axle was directly above the joist, and rises to nearly equality (ratio = 1.0) as the axle moves away, in either direction by three feet or more. This behavior is typical for all of the runs made with the deck fastened to the joists. The quick return of the ratio to 1.0 signifies a quick return of the neutral axis to mid-height of the joist. Figure 27 is for an unfastened-deck run, and is typical for other runs made with no deck fasteners. The minimum strain ratio is still less than 90% but doesn’t return to 100% before being masked by errors produced by dividing one very small strain by another. These data do not prove that the truck acted to stiffen the joists. But the truck interaction hypothesis seems to provide one explanation of the observed strains. The apparent shift of neutral axis was unexpected and deserves further study. Yet another conceivable cause of the disparity in peak strains might be a stretching of the joists under load. If the joists were rigidly fixed to the truss chords, and the truss chords could not move inwards, a sag of a joist would produce elongation or tension in that joist. Calculations using the plunger gauge data to set curve radius indicated that such a stretching could amount to about two-thirds of the overall tension needed in the joists to produce the observed difference of peak strains at midspan (such tension increasing the peak tensile strain and decreasing the peak compression strain at midspan). However, this appears to not be an operative mechanism because such a tension would be uniform from one end of a joist to the other. Such an overall tension was not recorded by the wheel line gauges or by the gauges at the ends of joist 1. The idea that the vehicle itself provided an alternate load path for some joist forces, though minor and secondary in magnitude, is far from conventional engineering assumptions. The inequality of peak strains was unexpected, and as a result the testing program was not designed to identify the cause.

ANALYZING COVERED BRIDGE FLOOR SYSTEMS HAER No. NH-53
Page 56
Figure 27. Ratio of top midspan strain to bottom midspan strain in joist 1 as truck axles pass by. Top graph is for a test run on unfastened deck boards. Ratio drops below 90% when an axle is over joist, and doesn’t return to 100% as the axle moves away and before being masked. Bottom graph is for test run 16 and is similar to other runs on fastened decks. The ratio drops to 82 % when an axle is at the joist, but quickly returns to 100% as axle moves away from joist 1.
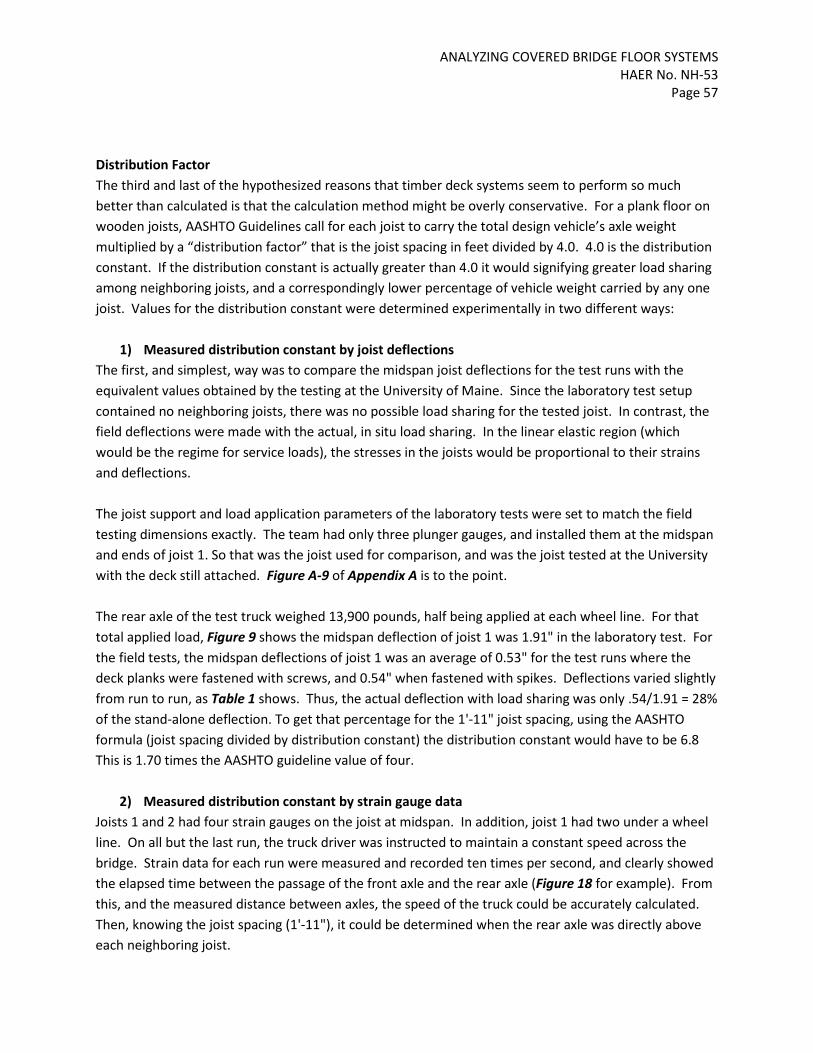
ANALYZING COVERED BRIDGE FLOOR SYSTEMS HAER No. NH-53
Page 57
Distribution Factor The third and last of the hypothesized reasons that timber deck systems seem to perform so much better than calculated is that the calculation method might be overly conservative. For a plank floor on wooden joists, AASHTO Guidelines call for each joist to carry the total design vehicle’s axle weight multiplied by a “distribution factor” that is the joist spacing in feet divided by 4.0. 4.0 is the distribution constant. If the distribution constant is actually greater than 4.0 it would signifying greater load sharing among neighboring joists, and a correspondingly lower percentage of vehicle weight carried by any one joist. Values for the distribution constant were determined experimentally in two different ways:
1) Measured distribution constant by joist deflections The first, and simplest, way was to compare the midspan joist deflections for the test runs with the equivalent values obtained by the testing at the University of Maine. Since the laboratory test setup contained no neighboring joists, there was no possible load sharing for the tested joist. In contrast, the field deflections were made with the actual, in situ load sharing. In the linear elastic region (which would be the regime for service loads), the stresses in the joists would be proportional to their strains and deflections. The joist support and load application parameters of the laboratory tests were set to match the field testing dimensions exactly. The team had only three plunger gauges, and installed them at the midspan and ends of joist 1. So that was the joist used for comparison, and was the joist tested at the University with the deck still attached. Figure A-9 of Appendix A is to the point. The rear axle of the test truck weighed 13,900 pounds, half being applied at each wheel line. For that total applied load, Figure 9 shows the midspan deflection of joist 1 was 1.91" in the laboratory test. For the field tests, the midspan deflections of joist 1 was an average of 0.53" for the test runs where the deck planks were fastened with screws, and 0.54" when fastened with spikes. Deflections varied slightly from run to run, as Table 1 shows. Thus, the actual deflection with load sharing was only .54/1.91 = 28% of the stand-alone deflection. To get that percentage for the 1'-11" joist spacing, using the AASHTO formula (joist spacing divided by distribution constant) the distribution constant would have to be 6.8 This is 1.70 times the AASHTO guideline value of four.
2) Measured distribution constant by strain gauge data
Joists 1 and 2 had four strain gauges on the joist at midspan. In addition, joist 1 had two under a wheel line. On all but the last run, the truck driver was instructed to maintain a constant speed across the bridge. Strain data for each run were measured and recorded ten times per second, and clearly showed the elapsed time between the passage of the front axle and the rear axle (Figure 18 for example). From this, and the measured distance between axles, the speed of the truck could be accurately calculated. Then, knowing the joist spacing (1'-11"), it could be determined when the rear axle was directly above each neighboring joist.

ANALYZING COVERED BRIDGE FLOOR SYSTEMS HAER No. NH-53
Page 58
Assuming that all joists were alike, the load carried by any neighboring joist when an axle was directly above joist 1 should be the same as the load carried by joist 1 when that axle was directly above that neighboring joist. Although joists are not alike on an individual basis, they should be on an overall basis, with published usable maximum stresses set to account for the greater variability of timber compared to other building materials. A comparison of Figure 16 and Figure A-9 of Appendix A shows that field testing kept joist stresses, strains and deflections well within the linear elastic range. So by measuring the strains in joists 1 and 2 when the test truck’s rear axle was directly above neighboring joists, as well as when the axle was directly above the instrumented joist, values for load sharing could be determined and a distribution constant calculated. A simple example might make the concept clear: if an axle is at joist 1, and the strain in joist 1 happens to equal the sum of the strains in all the nearby joists, then it can be presumed that, at that moment, joist 1 carries half of the axle weight and the neighboring joists combine to carry the remaining half. Furthermore, the strain in a neighboring joist when the axle is at joist 1 should be equal to the strain in joist 1 when the axle has moved to that other joist. And the latter value could be measured. Plots were drawn of the midspan strains and wheel line strains for joists 1 and 2. Then a vertical line was drawn at the time of peak strain (Figure 28 for example). This corresponds to the time when the axle was directly over the joist. Then vertical lines were drawn to each side, separated by the time needed for the axle to travel to or from the adjacent joists. The strain values, both positive and negative, at each vertical line were measured. All of the deflected (strained) joists acted together to support the axle, so the relative magnitudes of strains at the various vertical lines tell the degree to which neighboring joists help the instrumented joist carry the load when the axle is over the instrumented joist. Then, for each of the graphs like Figure 28, a spreadsheet like Figure 29 was used to compare the strain measurements and determine the maximum portion of the axle load carried by the instrumented joist. The graphs such as Figure 28 were put into an AutoCAD program so the strain magnitudes could be measured more accurately, although not in the same units. An example of the connection is: in Figure
28 the peak value of the strain at top midspan and on the north side of joist is 480 x 10-6 in/in. But it scales just 2.016 units in the AutoCAD drawing. So the values in Figure 29 for that gauge can be scaled up by 238 times to convert distances measured in the graph to actual strains.
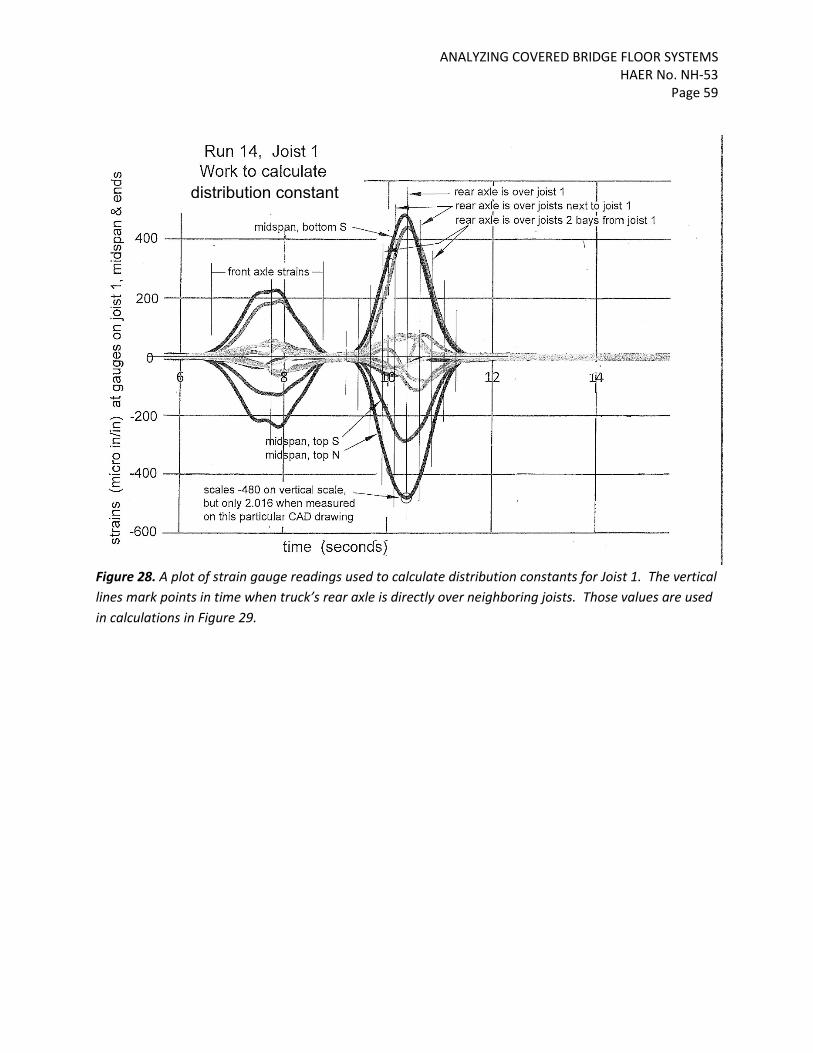
ANALYZING COVERED BRIDGE FLOOR SYSTEMS HAER No. NH-53
Page 59
Figure 28. A plot of strain gauge readings used to calculate distribution constants for Joist 1. The vertical lines mark points in time when truck’s rear axle is directly over neighboring joists. Those values are used in calculations in Figure 29.
distribution constant
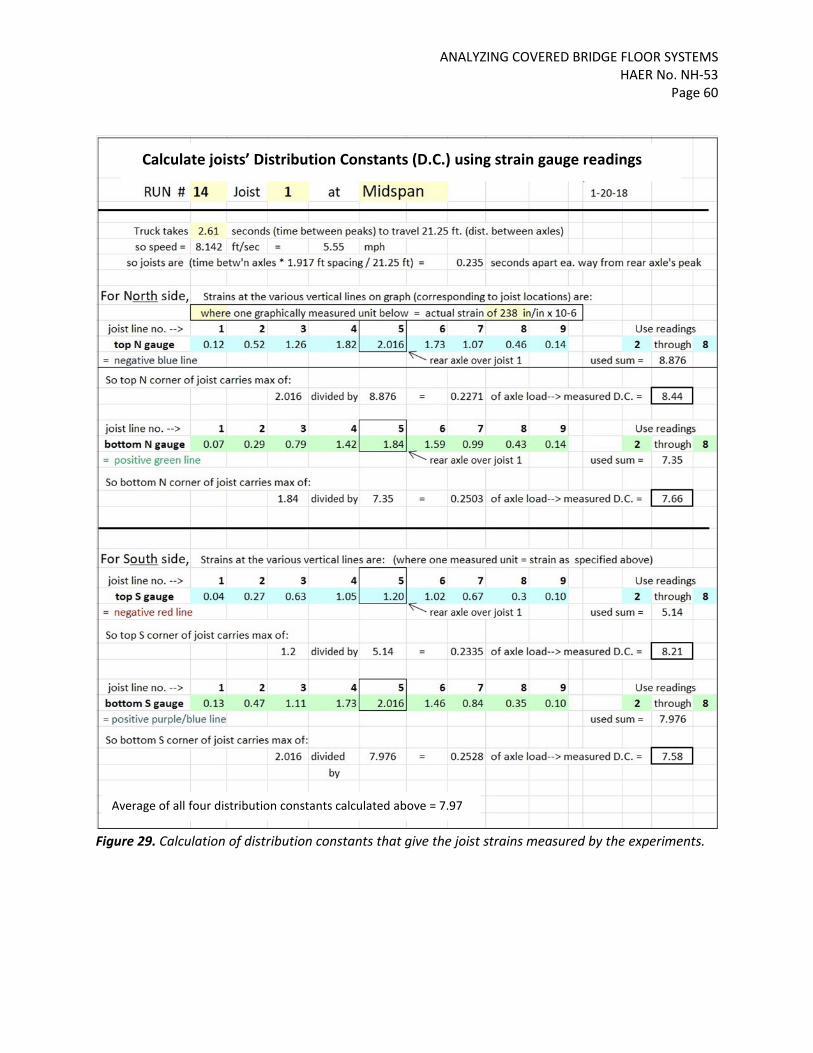
ANALYZING COVERED BRIDGE FLOOR SYSTEMS HAER No. NH-53
Page 60
Figure 29. Calculation of distribution constants that give the joist strains measured by the experiments.
Calculate joists’ Distribution Constants (D.C.) using strain gauge readings
Average of all four distribution constants calculated above = 7.97

ANALYZING COVERED BRIDGE FLOOR SYSTEMS HAER No. NH-53
Page 61
In that top line of Figure 29 the sum of the strains in excess of 0.42 (= 100 in/in x 10-6 actual strain) of all joists was 8.876. Of that, the strain in joist 1 was 2.016. Therefore, for this gauge, when the test truck’s rear axle was directly over joist 1 that joist carried 2.016 / 8.876 = 0.227 of the total axle load. For the 1'-11"-foot joist spacing, this was a distribution constant of 8.44. This work was repeated for each of the four midspan gauges on joist 1, and the measurements and calculations for each are shown in Figure 29. An identical procedure was used to determine distribution constants for the midspan gauges on joist 2 and for the under wheel line gauges on joist 1 all for Run #14. Then this procedure was repeated for eight other runs. The results are summarized in Table 3. For several test runs the data logger started too late to provide reliable data. For a few other runs asymmetry of the curves indicated that the truck did not maintain a uniform speed. These runs were not used for the distribution constant calculations. In Table 3 the measured distribution constants for gauges under the wheel line were consistently lower than at midspan. This appears to be because strains at the gauges at the wheel lines rise and fall more sharply than do the strains of the gauges at midspan. Figure 19, when compared to Figure 17, illustrates this point.

ANALYZING COVERED BRIDGE FLOOR SYSTEMS HAER No. NH-53
Page 62
VIII. CONCLUSIONS AND RECOMMENDATIONS Conclusions
Table 3. Summary of measured distribution constants for joists.
Thicker deck noticeably increases distribution constant: reasonable since deck is a thin beam spreading axle weight

ANALYZING COVERED BRIDGE FLOOR SYSTEMS HAER No. NH-53
Page 63
The ends of joists do not appear to be fixed against rotation to any significant degree, and hypothetical end fixity contributes no significant amount to the load capacity of the joists. It is speculated that low torsional stiffness of Town lattice trusses, combined with weak connections between joists and trusses contribute to this situation. The deck, when fastened tightly to the joists, contributes no significant amount to the stiffness of the joists for loadings up to the legal limits posted on covered bridges. Tests described in Appendix A, although limited in number, suggest that composite action of deck and joists may increase joist load capacity when the applied loads greatly exceed the service load limits set by AASHTO guidelines for wooden decks. It is speculated that small gaps between deck boards do not close up until extreme and undesirable loads are applied and joist deflections become excessive. Of the three hypothesized explanations for the surprising robustness of covered bridge decks, a greater-than-expected value of the distribution constant (causing a smaller-than-expected distribution factor) appears to be the only one that is significant. The distribution constants determined by both the joist deflection method and the strain gauge data method indicate that a good, conservative value for the distribution constant for plank decks atop transverse timber beams in Town lattice trusses or similar is 6.0, possibly 6.5. For two-layer decks a somewhat higher value might be safely used. Table 3 suggests that a value of 7.0 would be conservative for a multiple layer deck having a total nominal thickness of 5" or more. These values reflect greater measured load sharing between neighboring joists than currently assumed by the AASHTO guidelines. Other Research Factors Vehicle Speed The speed with which the test truck drove through the bridge was varied. Although the conditions of the road approaches limited the top speed to 10 mph, data for transits below that speed indicated that vehicle speed has no effect on strains in the joists or deck. Type of fastener Experimental data showed no significant difference in the strains and distribution constants for runs conducted with screws and those conducted with nails securing the deck planks to the joists. If anything, experimental data showed very slightly lower deflections for the #6 spikes than for screws. Density of fasteners The two densities of fasteners tested, “light” and “normal”, are shown in Figure 4. The testing showed no significant difference between these two spatial densities. Deck Thickness Deck thickness was varied by adding a second layer on top of the first layer after the first layer had been secured with spikes. The second layer added 2" to the 3" nominal thickness of the first layer, and, being
ANALYZING COVERED BRIDGE FLOOR SYSTEMS HAER No. NH-53
Page 64
laid parallel to the bottom layer but offset by half a plank width, bridged any gaps between bottom layer planks. The increased deck thickness was noticeable in the test results, both in reduced midspan deflections (Table 1) and in reduced strains in the joists (Table 2). However, the differences may not be significant enough to warrant the additional cost and weight of the second layer. Designers have used both single-layer and two-layer decks successfully. However it is clear that a thicker deck spreads the load to more joists and thus increases the distribution constant. The field testing caused no damage whatsoever to the subject truss. Such testing can be termed “nondestructive” in every respect. However, to supplement the field testing three joists were removed from the bridge and loaded to failure at the University of Maine. The complete strain gauge data will be freely furnished by the project’s researchers to any reader who requests it.
Recommendations This study suggests that the present AASHTO distribution constant (4.0) for load sharing among joists for wooden plank decks on wood joists is lower than the actual load sharing, and that a value of 7.0 agrees better with study results. But before any change can be recommended different joist spacings and different ratios of deck stiffness to joist stiffness need to be studied. The study instrumented joists near the bridge’s midspan, so a caveat exists for joists at the ends of a bridge deck. Since tire loads cannot spread both ways at a deck’s end, joist strains higher than measured in the interior may be expected there. It would seem advisable for designers to compensate by increasing the size of the end joist, decreasing the spacing there, doubling the end joists, or by other means. The behavior of decks of Howe trusses and Burr-arch trusses should be studied in the same way as this project investigated deck behavior for a typical Town lattice truss. Both of these truss types have greater torsional stiffness than Town lattices, and the joists or floor beams of Burr-arches are usually clamped to the trusses by two bolts. Howe and Burr-arch trusses usually have greater distances between joists. Many Burr-arch truss bridges also have transverse-laid decks. The hypothesis that vehicular wheels and axles could provide a supplemental load path to those of the deck components should be investigated.

ANALYZING COVERED BRIDGE FLOOR SYSTEMS HAER No. NH-53
Page 65
Figure 30. The project researchers with the volunteer team from the National Society for the Preservation of Covered Bridges. These people provided the labor and the brain power to make the experiment successful. They are, from left to right, kneeling: Matt Reckard, Will Truax; standing: Karl Olson, Scott Wagner, Sue Wagner, Michelle Andrews, Christopher Marston, Evan Andrews, Julia Marston, James Barker, Ron Wagner, Tim Andrews, Kyle Guay, Jay Hayden; on truss in background: Steve Brown and Bill Caswell.
ANALYZING COVERED BRIDGE FLOOR SYSTEMS HAER No. NH-53
Page 66
APPENDIX A
Bridge Joist Tests
Prepared for:
Timothy Andrews, Barns and Bridges of New England
US Dept. of the Interior, National Park Service, Cooperative Agreement # P14AC01002, Task Agreement # P14AC01504
University of Maine’s Advanced Structures and Composites Center Report Number: 17-23-1481
April 26, 2017
Prepared by: Reviewed by:
Thomas Snape Shawn Eary, PE Research Engineer Research Engineer
This report is released for publication by the University of Maine’s Advanced Structures and Composites Center (ASSC). The ASCC is an ISO 17025 accredited testing laboratory, accredited
by the International Accreditation Service.
ANALYZING COVERED BRIDGE FLOOR SYSTEMS HAER No. NH-53
Page 67
Table of Contents
Summary ...................................................................................................................................... 68
Specimen Description ................................................................................................................. 68
Bending Test Description ........................................................................................................... 70
Bending Test Results................................................................................................................... 72
Bending Test Calculated Properties .......................................................................................... 77
Compression Test Description ................................................................................................... 78
Compression Test Results Parallel to Grain ............................................................................ 79
Compression Test Results Perpendicular to Grain ................................................................. 81
Equipment List ............................................................................................................................ 84

ANALYZING COVERED BRIDGE FLOOR SYSTEMS HAER No. NH-53
Page 68
Summary The University of Maine’s Advanced Structures and Composites Center (ASCC) was contracted to perform tests on wooden bridge joists by Barns and Bridges of New England (BBofNE).
The following tests were performed:
1. Four-point bend tests to failure of three Douglas fir bridge joists2. Compression tests on samples prepared from the failed bridge joists.
Specimen Description The three bridge joists were received at ASCC on December 14, 2016. One of the joists had a section of deck boards attached. Each joist was marked with identification (#1, #2, or #3). One end of each joist was marked “west”. Nominal dimensions of all joists were 12” deep by 4” wide. Bearing points 180” apart were marked on each joist.
Joist #1 included a section of deck attached. The width of the deck was 44”. The deck planks were of nominal size 10.5” by 2.75” and were spiked to the joist. Figure A-1 shows joist #1 mounted in the test frame before being loaded. Figure A-2 shows sketches of the locations of large knots on each side of the joist.
Figure A-1. Joist #1 with deck attached, set up in test frame, before test.
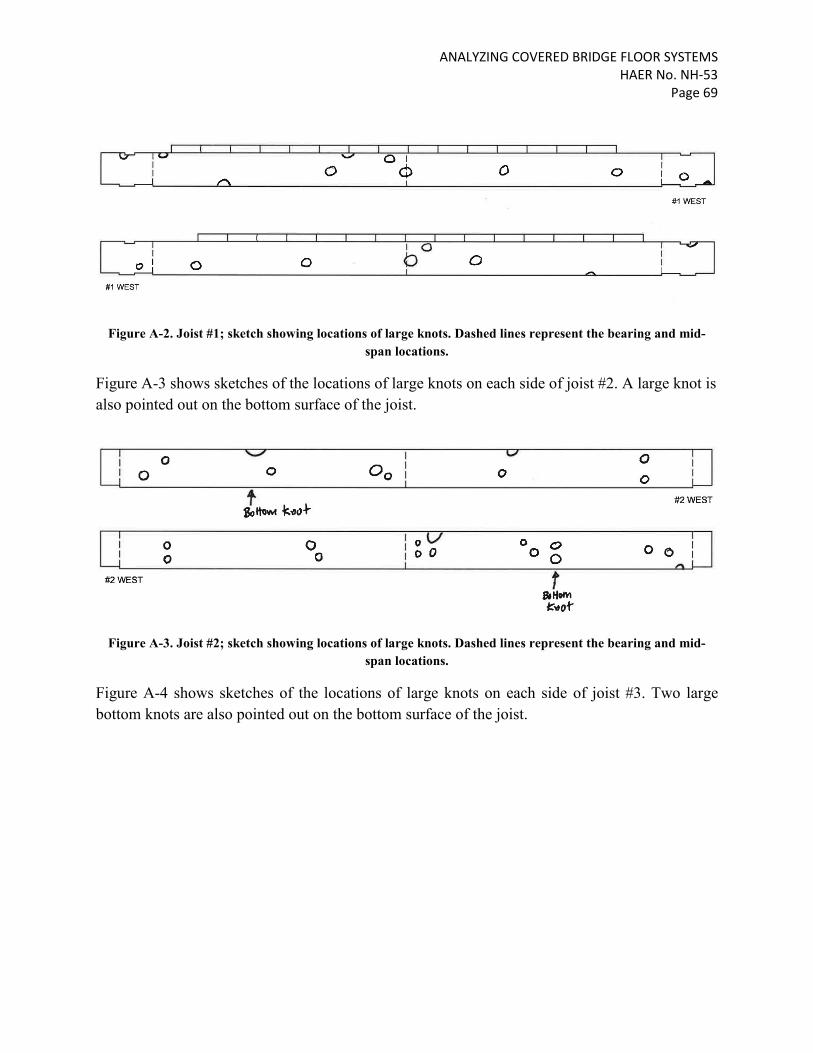
ANALYZING COVERED BRIDGE FLOOR SYSTEMS HAER No. NH-53
Page 69
Figure A-2. Joist #1; sketch showing locations of large knots. Dashed lines represent the bearing and mid-span locations.
Figure A-3 shows sketches of the locations of large knots on each side of joist #2. A large knot is also pointed out on the bottom surface of the joist.
Figure A-3. Joist #2; sketch showing locations of large knots. Dashed lines represent the bearing and mid-span locations.
Figure A-4 shows sketches of the locations of large knots on each side of joist #3. Two large bottom knots are also pointed out on the bottom surface of the joist.
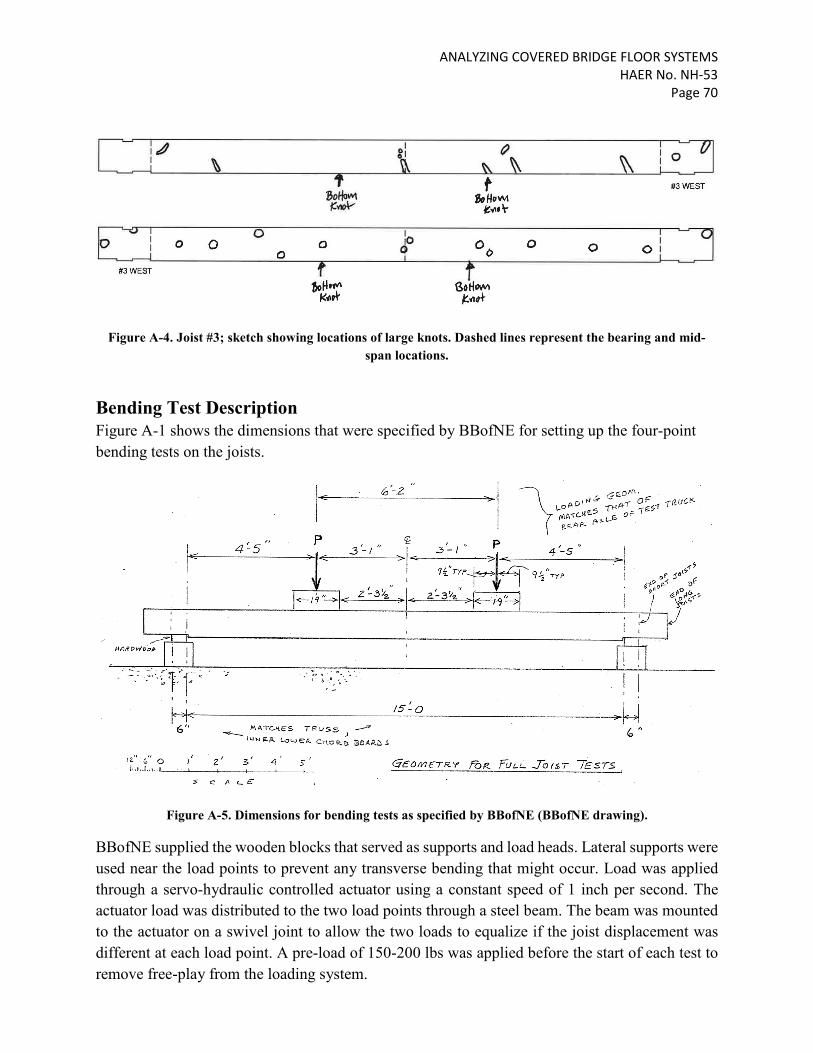
ANALYZING COVERED BRIDGE FLOOR SYSTEMS HAER No. NH-53
Page 70
Figure A-4. Joist #3; sketch showing locations of large knots. Dashed lines represent the bearing and mid-span locations.
Bending Test Description Figure A-1 shows the dimensions that were specified by BBofNE for setting up the four-point bending tests on the joists.
Figure A-5. Dimensions for bending tests as specified by BBofNE (BBofNE drawing).
BBofNE supplied the wooden blocks that served as supports and load heads. Lateral supports were used near the load points to prevent any transverse bending that might occur. Load was applied through a servo-hydraulic controlled actuator using a constant speed of 1 inch per second. The actuator load was distributed to the two load points through a steel beam. The beam was mounted to the actuator on a swivel joint to allow the two loads to equalize if the joist displacement was different at each load point. A pre-load of 150-200 lbs was applied before the start of each test to remove free-play from the loading system.
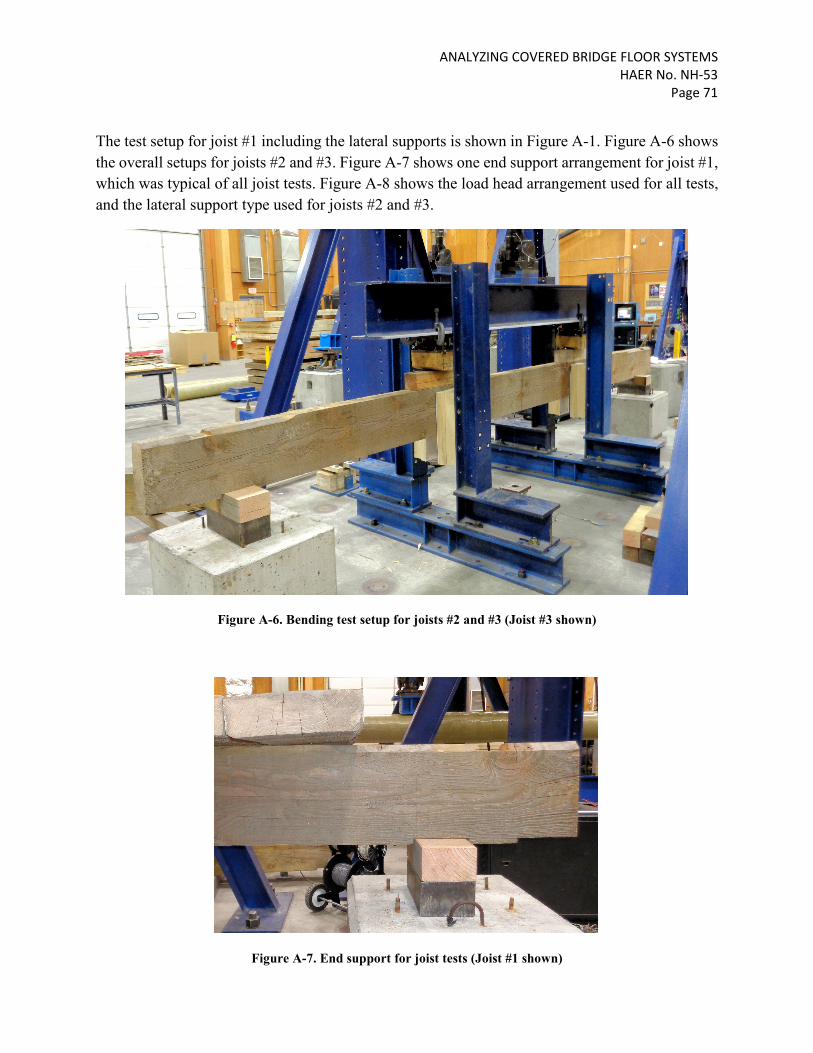
ANALYZING COVERED BRIDGE FLOOR SYSTEMS HAER No. NH-53
Page 71
The test setup for joist #1 including the lateral supports is shown in Figure A-1. Figure A-6 shows the overall setups for joists #2 and #3. Figure A-7 shows one end support arrangement for joist #1, which was typical of all joist tests. Figure A-8 shows the load head arrangement used for all tests, and the lateral support type used for joists #2 and #3.
Figure A-6. Bending test setup for joists #2 and #3 (Joist #3 shown)
Figure A-7. End support for joist tests (Joist #1 shown)
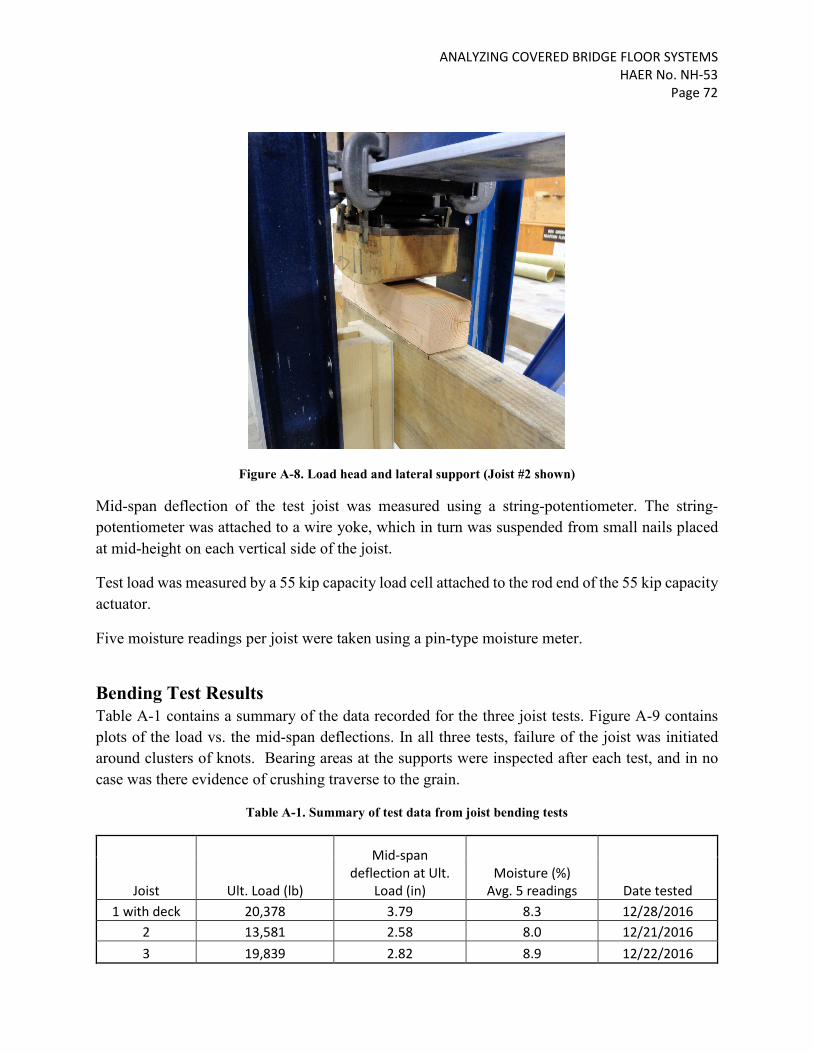
ANALYZING COVERED BRIDGE FLOOR SYSTEMS HAER No. NH-53
Page 72
Figure A-8. Load head and lateral support (Joist #2 shown)
Mid-span deflection of the test joist was measured using a string-potentiometer. The string-potentiometer was attached to a wire yoke, which in turn was suspended from small nails placed at mid-height on each vertical side of the joist.
Test load was measured by a 55 kip capacity load cell attached to the rod end of the 55 kip capacity actuator.
Five moisture readings per joist were taken using a pin-type moisture meter.
Bending Test Results Table A-1 contains a summary of the data recorded for the three joist tests. Figure A-9 contains plots of the load vs. the mid-span deflections. In all three tests, failure of the joist was initiated around clusters of knots. Bearing areas at the supports were inspected after each test, and in no case was there evidence of crushing traverse to the grain.
Table A-1. Summary of test data from joist bending tests
Joist Ult. Load (lb)
Mid-span deflection at Ult.
Load (in) Moisture (%)
Avg. 5 readings Date tested 1 with deck 20,378 3.79 8.3 12/28/2016
2 13,581 2.58 8.0 12/21/2016 3 19,839 2.82 8.9 12/22/2016
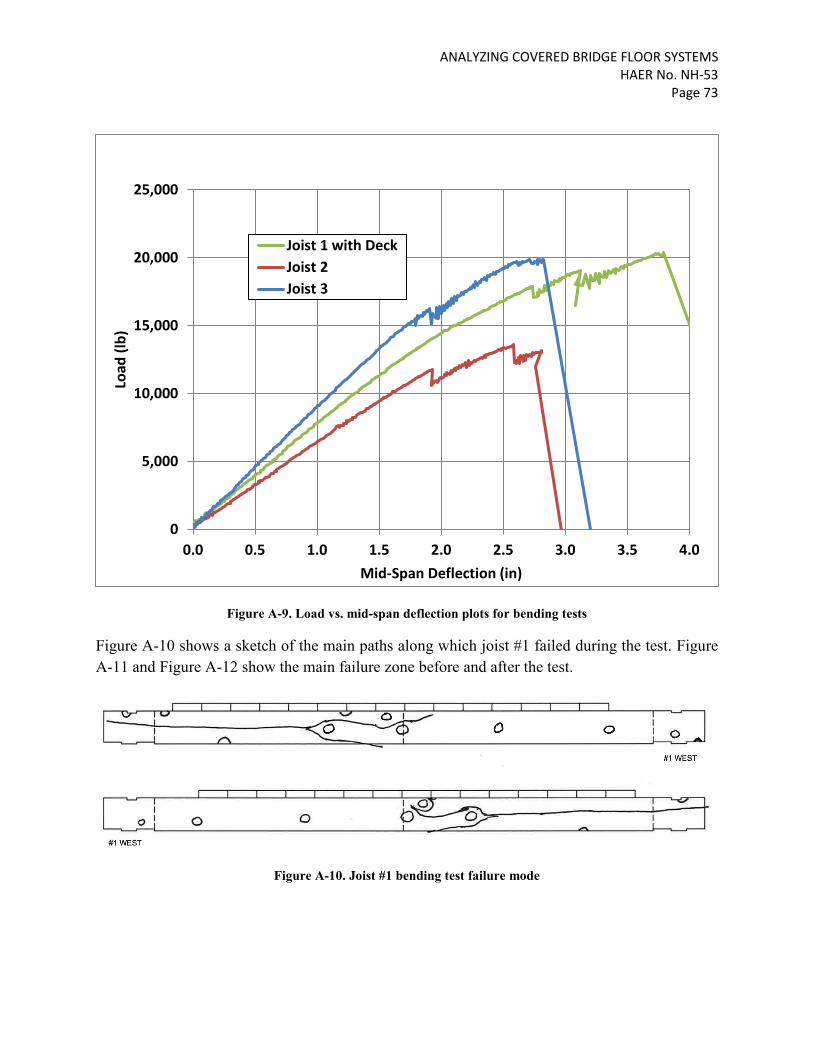
ANALYZING COVERED BRIDGE FLOOR SYSTEMS HAER No. NH-53
Page 73
Figure A-9. Load vs. mid-span deflection plots for bending tests
Figure A-10 shows a sketch of the main paths along which joist #1 failed during the test. Figure A-11 and Figure A-12 show the main failure zone before and after the test.
Figure A-10. Joist #1 bending test failure mode
0
5,000
10,000
15,000
20,000
25,000
0.0 0.5 1.0 1.5 2.0 2.5 3.0 3.5 4.0
Load
(lb)
Mid-Span Deflection (in)
Joist 1 with DeckJoist 2Joist 3
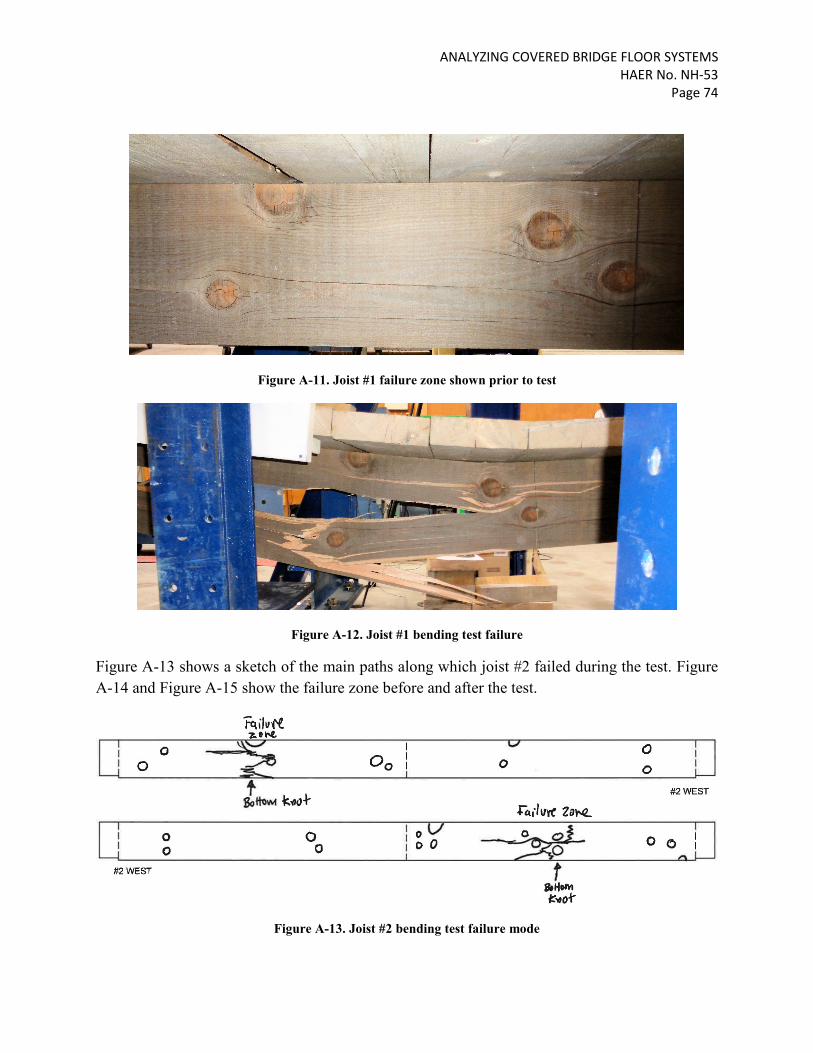
ANALYZING COVERED BRIDGE FLOOR SYSTEMS HAER No. NH-53
Page 74
Figure A-11. Joist #1 failure zone shown prior to test
Figure A-12. Joist #1 bending test failure
Figure A-13 shows a sketch of the main paths along which joist #2 failed during the test. Figure A-14 and Figure A-15 show the failure zone before and after the test.
Figure A-13. Joist #2 bending test failure mode

ANALYZING COVERED BRIDGE FLOOR SYSTEMS HAER No. NH-53
Page 75
Figure A-13. Joist #2 failure zone shown prior to test
Figure A-14. Joist #2 bending test failure
Figure A-16 shows a sketch of the main paths along which joist #3 failed during the test. Figure A-17 and Figure A-18 show the failure zone before and after the test.
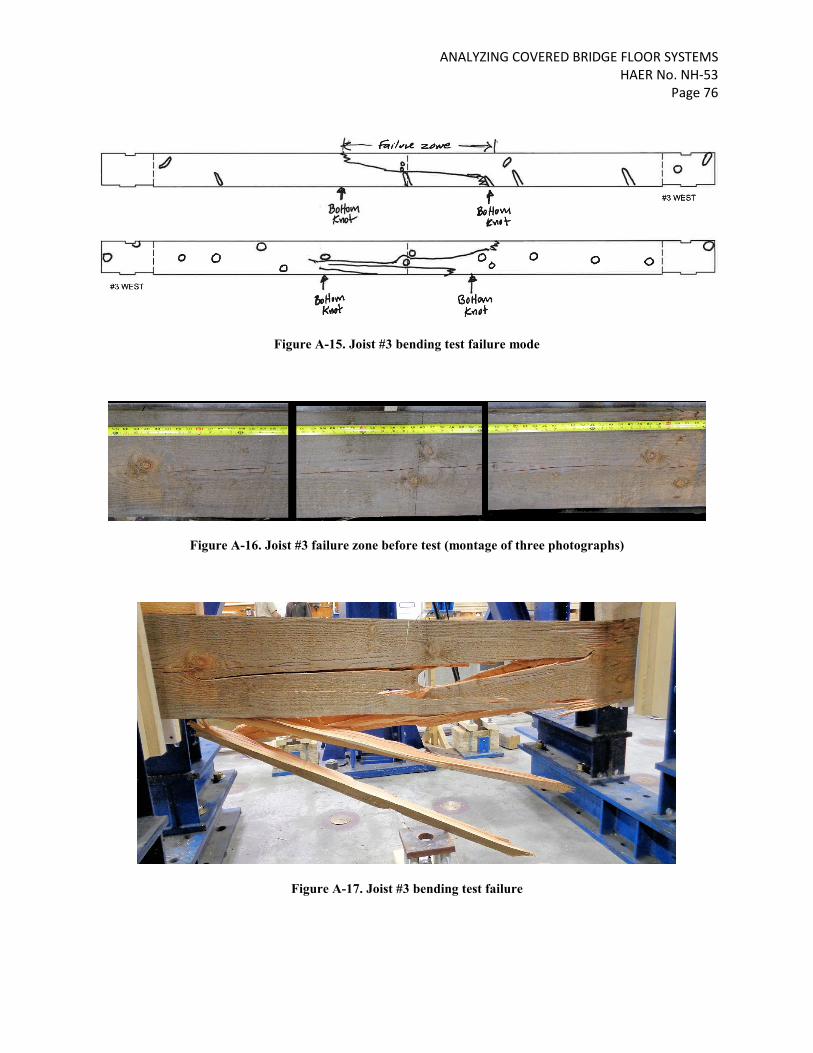
ANALYZING COVERED BRIDGE FLOOR SYSTEMS HAER No. NH-53
Page 76
Figure A-15. Joist #3 bending test failure mode
Figure A-16. Joist #3 failure zone before test (montage of three photographs)
Figure A-17. Joist #3 bending test failure
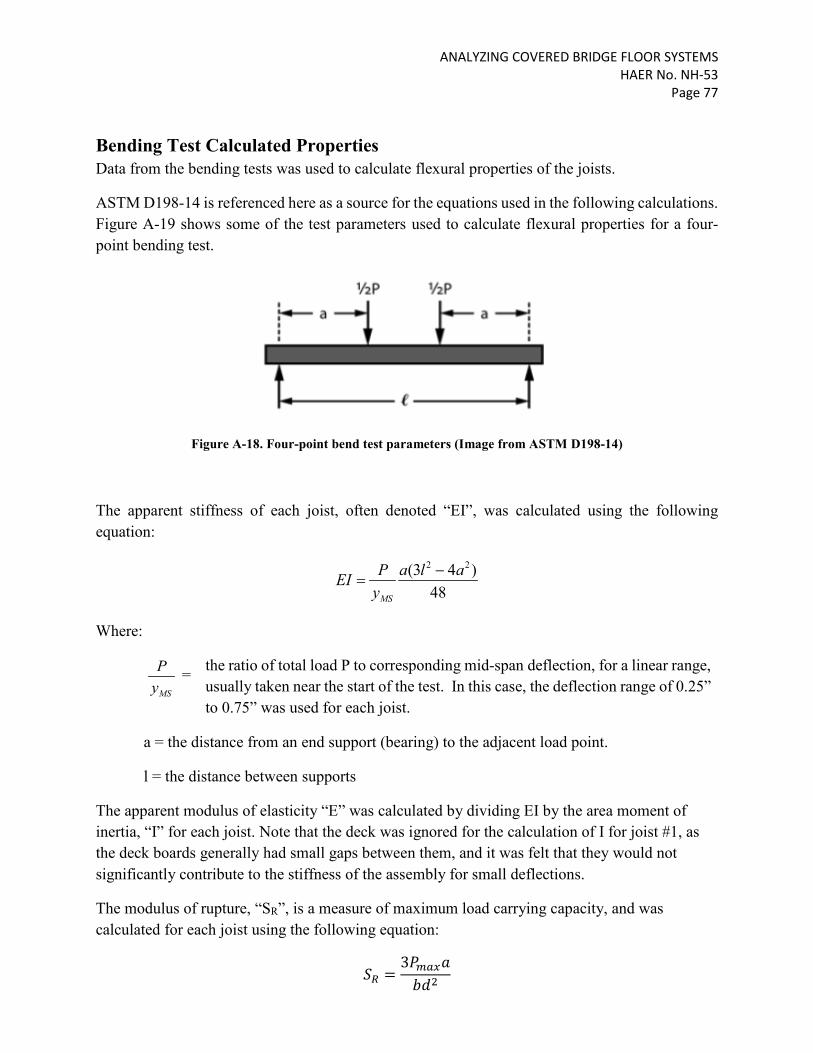
ANALYZING COVERED BRIDGE FLOOR SYSTEMS HAER No. NH-53
Page 77
Bending Test Calculated Properties Data from the bending tests was used to calculate flexural properties of the joists.
ASTM D198-14 is referenced here as a source for the equations used in the following calculations. Figure A-19 shows some of the test parameters used to calculate flexural properties for a four-point bending test.
Figure A-18. Four-point bend test parameters (Image from ASTM D198-14)
The apparent stiffness of each joist, often denoted “EI”, was calculated using the following equation:
48)43( 22 ala
yPEIMS
−=
Where:
MSyP = the ratio of total load P to corresponding mid-span deflection, for a linear range,
usually taken near the start of the test. In this case, the deflection range of 0.25” to 0.75” was used for each joist.
a = the distance from an end support (bearing) to the adjacent load point.
l = the distance between supports
The apparent modulus of elasticity “E” was calculated by dividing EI by the area moment of inertia, “I” for each joist. Note that the deck was ignored for the calculation of I for joist #1, as the deck boards generally had small gaps between them, and it was felt that they would not significantly contribute to the stiffness of the assembly for small deflections.
The modulus of rupture, “SR”, is a measure of maximum load carrying capacity, and was calculated for each joist using the following equation:
𝑆𝑆𝑅𝑅 =3𝑃𝑃𝑚𝑚𝑚𝑚𝑚𝑚𝑎𝑎𝑏𝑏𝑑𝑑2
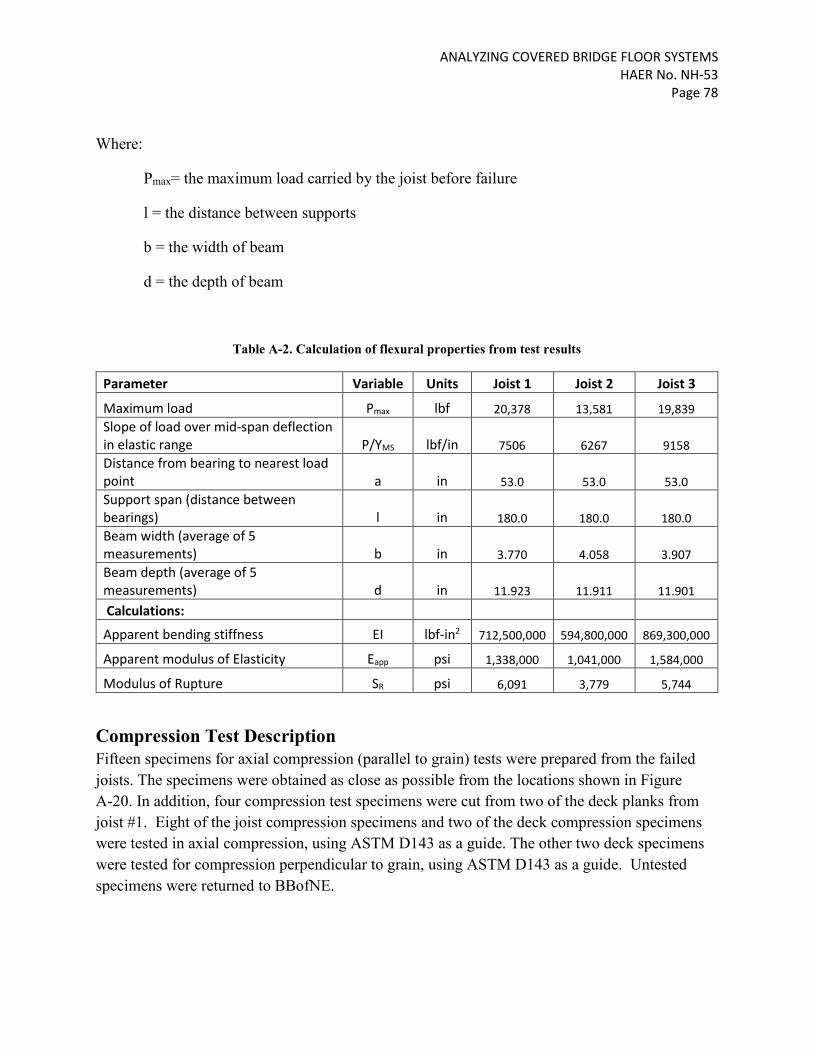
ANALYZING COVERED BRIDGE FLOOR SYSTEMS HAER No. NH-53
Page 78
Where:
Pmax= the maximum load carried by the joist before failure
l = the distance between supports
b = the width of beam
d = the depth of beam
Table A-2. Calculation of flexural properties from test results
Parameter Variable Units Joist 1 Joist 2 Joist 3
Maximum load Pmax lbf 20,378 13,581 19,839 Slope of load over mid-span deflection in elastic range P/YMS lbf/in 7506 6267 9158 Distance from bearing to nearest load point a in 53.0 53.0 53.0 Support span (distance between bearings) l in 180.0 180.0 180.0 Beam width (average of 5 measurements) b in 3.770 4.058 3.907 Beam depth (average of 5 measurements) d in 11.923 11.911 11.901 Calculations:
Apparent bending stiffness EI lbf-in2 712,500,000 594,800,000 869,300,000
Apparent modulus of Elasticity Eapp psi 1,338,000 1,041,000 1,584,000
Modulus of Rupture SR psi 6,091 3,779 5,744
Compression Test Description Fifteen specimens for axial compression (parallel to grain) tests were prepared from the failed joists. The specimens were obtained as close as possible from the locations shown in Figure A-20. In addition, four compression test specimens were cut from two of the deck planks from joist #1. Eight of the joist compression specimens and two of the deck compression specimens were tested in axial compression, using ASTM D143 as a guide. The other two deck specimens were tested for compression perpendicular to grain, using ASTM D143 as a guide. Untested specimens were returned to BBofNE.
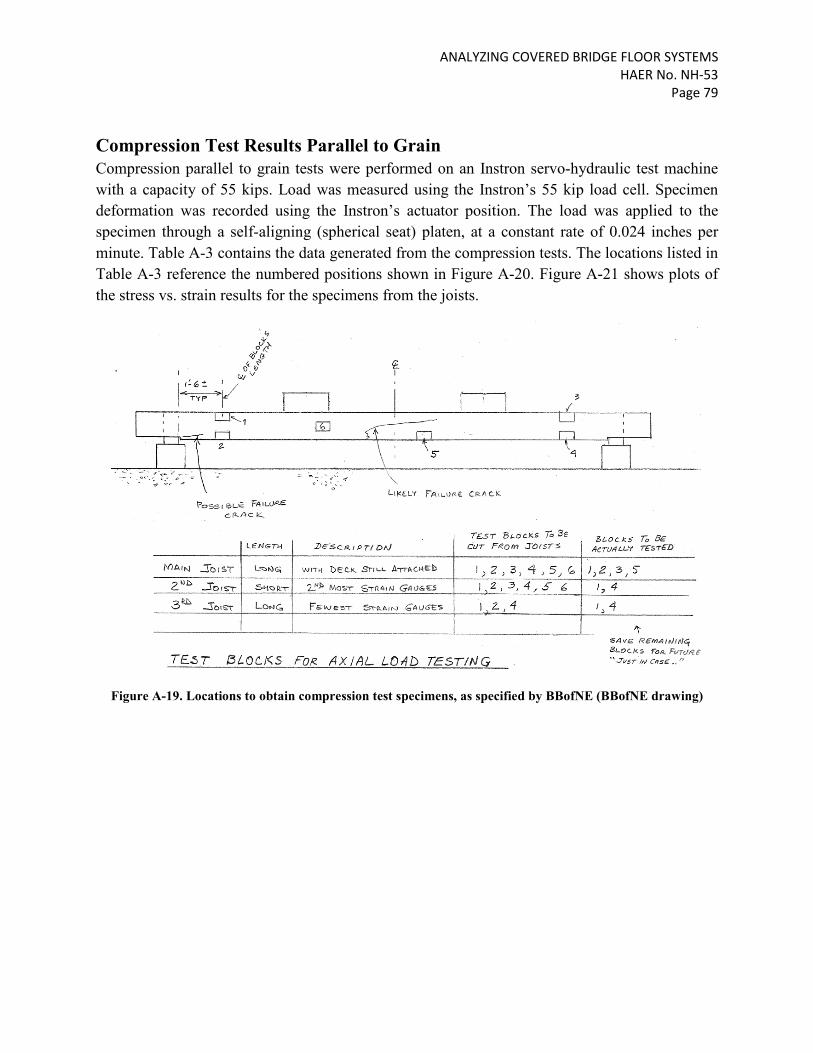
ANALYZING COVERED BRIDGE FLOOR SYSTEMS HAER No. NH-53
Page 79
Compression Test Results Parallel to Grain Compression parallel to grain tests were performed on an Instron servo-hydraulic test machine with a capacity of 55 kips. Load was measured using the Instron’s 55 kip load cell. Specimen deformation was recorded using the Instron’s actuator position. The load was applied to the specimen through a self-aligning (spherical seat) platen, at a constant rate of 0.024 inches per minute. Table A-3 contains the data generated from the compression tests. The locations listed in Table A-3 reference the numbered positions shown in Figure A-20. Figure A-21 shows plots of the stress vs. strain results for the specimens from the joists.
Figure A-19. Locations to obtain compression test specimens, as specified by BBofNE (BBofNE drawing)

ANALYZING COVERED BRIDGE FLOOR SYSTEMS HAER No. NH-53
Page 80
Table A-3. Compression test data; parallel to grain
Specimen Width 1
(in) Width 2
(in) Length
(in)
Ult. Load (lb) Failure mode Joist Location
1 1 1.991 1.995 7.952 23,376 Crushing at top 1 2 1.998 1.993 7.953 27,078 Wedge split 1 3 1.999 1.984 7.952 26,729 Wedge split at top 1 5 2.002 2.008 7.953 22,597 Crushing
2 1 1.999 1.986 7.965 21,802 Crushing (away from small knot in specimen)
2 4 2.012 1.997 7.966 21,464 Crushing 3 1 1.985 1.978 7.958 24,229 Crushing near cluster of small knots 3 4 1.990 1.989 7.965 34,964 Crushing
Deck 1 n/a 1.941 1.990 7.975 23,217 Crushing Deck 2 n/a 1.971 1.986 7.991 25,507 Crushing on end
Figure A-20. Stress vs. strain results for compression tests of joist specimens
The ultimate compressive strength for each specimen was calculated by dividing the maximum compression load borne by the specimen by the cross-section area. The modulus of elasticity in compression was determined by taking the slope of the initial straight line portion of the stress vs. strain plot for each specimen. The strain range over which the slope was determined varied from about 0.001-0.002 to 0.002-0.003 strain, depending upon the shape of the plot for each
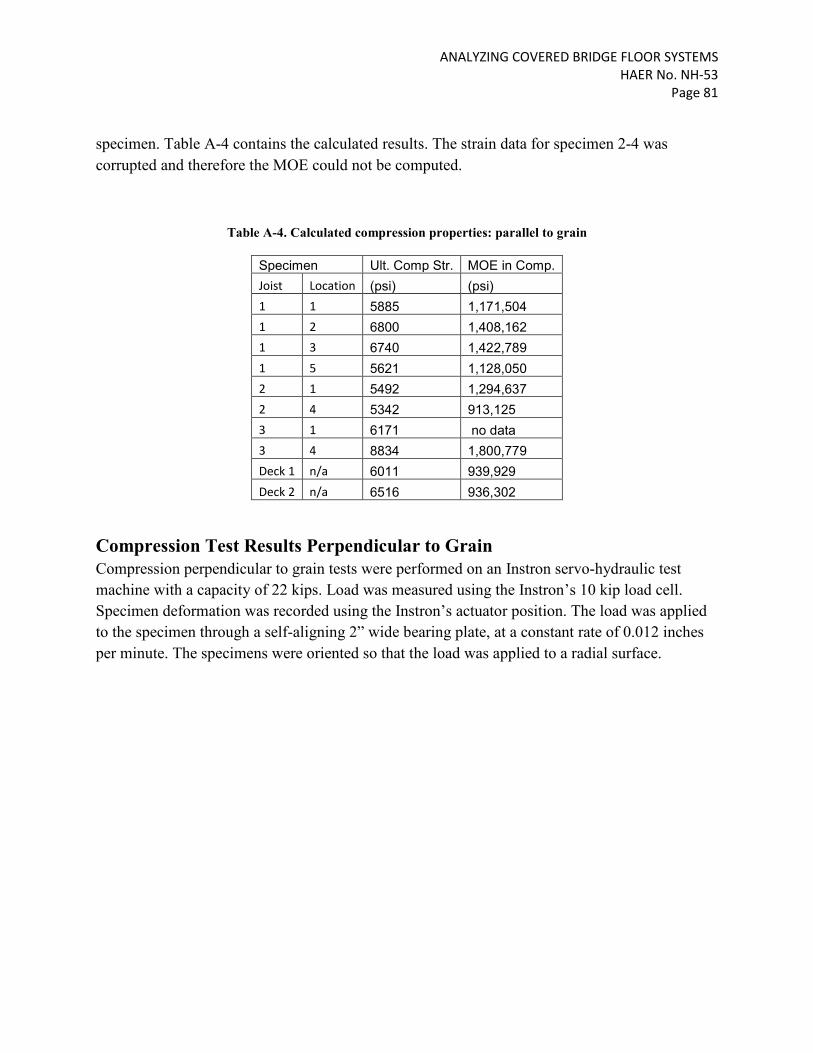
ANALYZING COVERED BRIDGE FLOOR SYSTEMS HAER No. NH-53
Page 81
specimen. Table A-4 contains the calculated results. The strain data for specimen 2-4 was corrupted and therefore the MOE could not be computed.
Table A-4. Calculated compression properties: parallel to grain
Specimen Ult. Comp Str. MOE in Comp. Joist Location (psi) (psi) 1 1 5885 1,171,504 1 2 6800 1,408,162 1 3 6740 1,422,789 1 5 5621 1,128,050 2 1 5492 1,294,637 2 4 5342 913,125 3 1 6171 no data 3 4 8834 1,800,779 Deck 1 n/a 6011 939,929 Deck 2 n/a 6516 936,302
Compression Test Results Perpendicular to Grain Compression perpendicular to grain tests were performed on an Instron servo-hydraulic test machine with a capacity of 22 kips. Load was measured using the Instron’s 10 kip load cell. Specimen deformation was recorded using the Instron’s actuator position. The load was applied to the specimen through a self-aligning 2” wide bearing plate, at a constant rate of 0.012 inches per minute. The specimens were oriented so that the load was applied to a radial surface.

ANALYZING COVERED BRIDGE FLOOR SYSTEMS HAER No. NH-53
Page 82
Figure A-21. Load vs displacement plots for compression perpendicular to grain tests on specimens cut from deck planks.
Due to the manner in which wood compresses from a perpendicular load, an ultimate strength is not reported. As per ASTM D143, the test is stopped after 0.10” compression is seen in the specimen. ASTM D143 also does not describe a calculation of the modulus of elasticity for this test. However, using the specimen initial dimensions and the test data, the stress and strain can be calculated. Figure A-23 contains plots of the stress vs. strain plots for the compression perpendicular to grain, and compression parallel to grain tests for the specimens cut from deck planks. Table A-5 contains a summary of the results from the compression perpendicular to grain tests on the specimens cut from the deck planks.
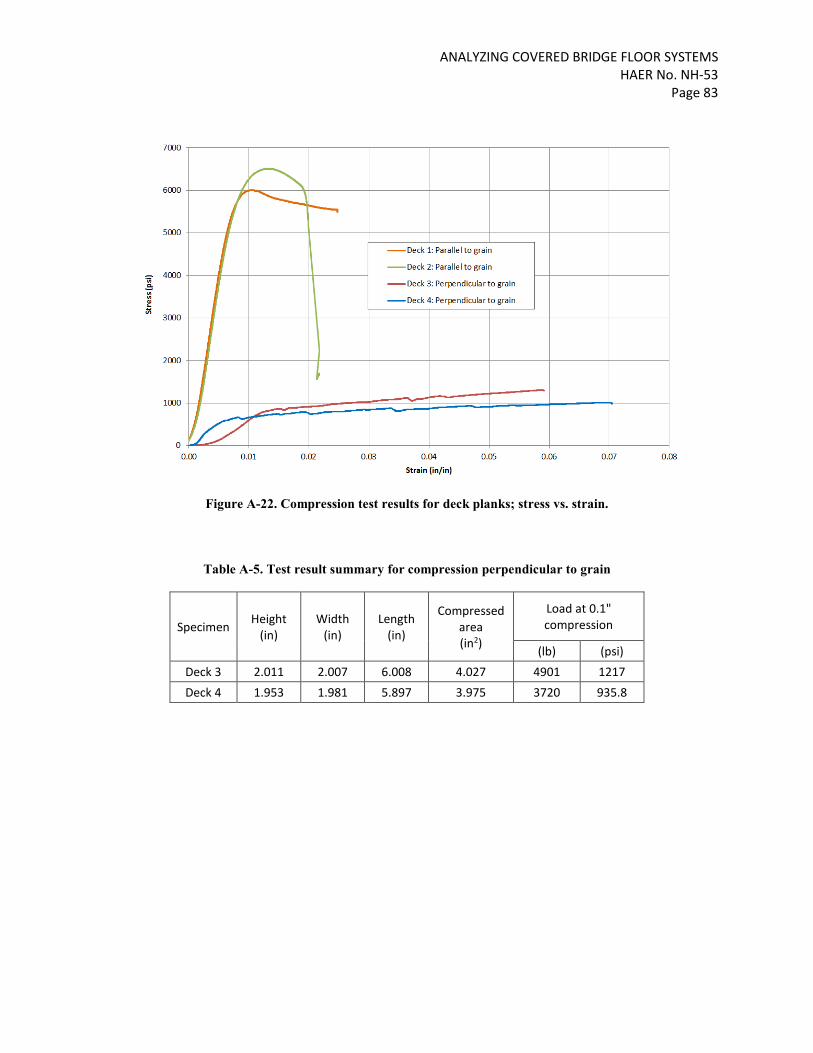
ANALYZING COVERED BRIDGE FLOOR SYSTEMS HAER No. NH-53
Page 83
Figure A-22. Compression test results for deck planks; stress vs. strain.
Table A-5. Test result summary for compression perpendicular to grain
Specimen Height (in)
Width (in)
Length (in)
Compressed area (in2)
Load at 0.1" compression
(lb) (psi) Deck 3 2.011 2.007 6.008 4.027 4901 1217 Deck 4 1.953 1.981 5.897 3.975 3720 935.8

ANALYZING COVERED BRIDGE FLOOR SYSTEMS HAER No. NH-53
Page 84
Equipment List Table A-6 contains a list of the equipment used to perform the tests for this project.
Table A-6. Equipment list
Equipment used in joist bending tests: ASCC Number 55 kip capacity actuator AS264 55 kip capacity load cell AS650 String pot - 25" AS1474 Moisture meter, Delmhorst J-2000 AS1741 Equipment used in compression tests: ASCC Number 55 kip capacity Instron test frame AS2199 55 kip capacity load cell AS2200 22 kip capacity Instron test frame AS108 10 kip capacity load cell AS610 Digital caliper - 8" AS435

ANALYZING COVERED BRIDGE FLOOR SYSTEMS HAER No. NH-53
Page 85
APPENDIX B
Covered Bridge Floor Systems Study
Literature Search Background This report describes literature reviewed as part of a research project entitled “Analyzing Covered Bridge Floor Systems.” The project is funded by the Federal Highway Administration and the National Park Service as part of the National Historic Covered Bridge Preservation Program. Traditional engineering analysis of covered bridge floors often indicates they are too weak, despite their being in service for many years without signs of distress. Excessively conservative analysis may inflate the cost of covered bridge rehabilitation while simultaneously causing needless destruction of the historic resource the rehabilitation is intended to preserve. Designers have been aware of this issue for some time; see, for example Covered Bridges – Engineering Judgment and the Practical Approach (Pierce 2005). This literature search has documented several changes in recent years relevant to this issue. The most important of these include:
1) A substantial increase in allowable stress on 4" deck planks, through the introduction of a “deck factor” to AASHTO Specifications,
2) A 95% increase in allowable shear stress for wood in the NDS®, through a correction to a previously doubly-applied factor of safety, and
3) The inclusion of load testing among AASHTO standard procedures for rating bridge load capacity.
These are discussed in more detail below. The current research of which this report is part will compare strains and deflections measured on a full-scale covered bridge under truck loading with those predicted by different analysis methods. The goal is to determine how to most accurately model real structural behavior.
ANALYZING COVERED BRIDGE FLOOR SYSTEMS HAER No. NH-53
Page 86
Design Guides and Specifications AASHTO LRFD Bridge Design Specifications are used for nearly all highway bridges in the U.S; their use is required on projects where federal funds are used. AASHTO first introduced highway design specifications in 1931; their bridge specifications are now in their 7th edition (AASHTO 2014), with annual interim revisions. The specifications originally used Allowable Stress Design (ASD) methods. Specifications using Load and Resistance Factor Design (LRFD) methods were introduced in 1994; from then until 2007 AASHTO allowed both LRFD and ASD methods. Only LRFD design is now accepted on federally funded projects. Wood deck analysis per AASHTO’s design specifications is discussed in a following section. National Design Specifications for Wood Construction (NDS®) (American Wood Council 2012) is the source for the resistance (strength) factors for wood used in the AASHTO Specifications. The NDS® allows design using either ASD or LRFD methods. Wood strength data, developed for ASD methods, are adjusted using “format conversion factors (CKF) … derived so that LRFD design will result in the same size member as the ASD specified in the NDS®” (AASHTO Specifications §C 8.4.4.2). The strength figures in the NDS® are established using ASTM’s Standard Practice for Establishing Structural Grades and Related Allowable Properties for Visually Graded Lumber (ASTM Standard D245). These lumber values are derived from tests on small, clear-grain pieces of wood. Consequently ASTM D245 relies on results from tests ASTM standards D143 (“Test Methods for Small Clear Specimens of Timber”) and D2555 (“Practice for Establishing Clear Wood Strength Values”). Manual for Bridge Evaluation, 2nd Edition (AASHTO 2011), with annual interim revisions, is the newest of a series of AASHTO publications. It is intended as the U.S. national standard for the evaluation and load rating of existing highway bridges. It includes a section on nondestructive load testing. The 1st edition of the MBE was published in 2008; it superseded the 2003 Guide Manual for Condition Evaluation and Load and Resistance Factor Rating (LRFR) for Highway Bridges (the first of these manuals to include a load testing section) and the 1998 Manual for Condition Evaluation of Bridges, 2nd Ed. (which superseded the 1994 1st Edition). This AASHTO series dates back more than 40 years to the Manual for Maintenance Inspection of Bridges. This literature search has not assessed how changing standards may have affected covered bridge deck ratings and repairs, except to note the lack of provision for load testing in these manuals prior to 2003. This may have contributed to excessively conservative load ratings for timber decks in the past. Load testing provisions were added, at least in part, due to recommendations in the 1998 report by Lichtenstein & Associates, Inc. discussed below. “Manual for Bridge Rating Through Load Testing” (Lichtenstein and Associates 1998) is the product of National Cooperative Highway Research Program (NCHRP) Project 12-28(13)A. The NCHRP project’s objective was similar (if broader) than the present study: to investigate the commonly observed phenomenon that bridges often appear in service to be stronger than conventional load rating indicates. The manual provides test methods and guidelines for integrating bridge load tests with their load rating. It discusses both diagnostic tests (using relatively low loads to confirm material properties, distribution
ANALYZING COVERED BRIDGE FLOOR SYSTEMS HAER No. NH-53
Page 87
factors, etc.) and proof load tests (to demonstrate capacity). See the “full scale testing” section below for further discussion of this report. Timber Bridges: Design, Construction, Inspection, and Maintenance (Ritter 1990) is a nearly 1,000 page report with many illustrations and step-by-step design examples. All design methodology is based on the AASHTO Specifications. It is a practical how-to guide. It does not explore technical issues or analytic uncertainties. Emphasis is on glulam and stress-laminated beams and decks. There is some discussion of sawn beams and nail-laminated decks; almost none of plank decks typical of covered bridges. Analysis per AASHTO Specifications Most provisions relevant to wooden bridge decks are found in three sections of the Specifications: Section 4 “Structural Analysis and Evaluation” (which lists over 100 references, none specific to wood structures), Section 8 “Wood Structures” (which largely mirrors the NDS®), and Subsection 9.9 “Wood Decks and Deck Systems.” Chapter 4 contains an “approximate method of analysis in which the deck is divided into strips perpendicular to the supporting components.” The method is “considered acceptable” for nearly all kinds of bridge decks, including wooden ones (§4.6.2.1.1). It seems ideally suited to plank decks, since they are literally divided into strips. This analysis method is the one traditionally used for plank decks on historic covered bridges. Chapter 4 specifications describe how to distribute wheel loads to the planks (§4.6.2.1.3). Deck strips (planks) are then “analyzed by classical beam theory” with “supporting components … assumed to be infinitely rigid” (§4.6.2.1.6). Forces in the deck are distributed to the supporting beams using tabulated distribution factors (§4.6.2.2.2). The beams, too, are analyzed using classical beam theory. Approximate methods rely on conservative simplifying assumptions, which lead to conservative results. For plank decks on covered bridges, such assumptions include that wood floor beams provide rigid support and that a single distribution factor is valid for any plank thickness (and any number of layers of planks) in a deck. Another example is that the AASHTO approximate method allows a wheel load to be modeled as a concentrated load (instead of spread over a tire contact area), which simplifies calculations but results in overestimation of forces in deck planks. In regard to wood decks AASHTO Specifications §9.9.3.1 states: “If the spacing of supporting components is less than either 36.0 inches or 6.0 times the nominal depth of the deck, the deck system, including the supporting components, shall be modeled as an orthotropic plate or an equivalent grid.” Since support spacing for historic covered bridge decks is almost always 36 inches or less, it appears the Specifications don’t allow the approximate analysis method for evaluating them. This is in spite of Chapter 4’s references to plank decks when discussing the method, and despite that method’s nearly universal use in the past.

ANALYZING COVERED BRIDGE FLOOR SYSTEMS HAER No. NH-53
Page 88
This Chapter 9 provision has been in the Specifications since the original LRFD Specifications (1994). It may be that it is meant to apply only to glue-, nail- and stress-laminated wooden decks (the overwhelming majority of modern wood decks), not to plank decks. This report’s authors contacted members of AASHTO’s Technical Committee on Timber Structures regarding this. Despite inquiries, they were unable to determine the provision’s origin. As committee chairman Tom Macioce (of PennDOT) wrote to committee member Rich Pratt (of Alaska DOT&PF), “We have looked through numerous AASHTO, TRB and NCHRP research documents and have not found any background on 9.9.3.1. We have looked through historic AASHTO Bridge Committee documentation and language of 9.9.3.1 appears to be original to the 1994 LRFD Specifications.”1 If a deck is to be modeled as an orthotropic plate, this means in practice using proprietary finite element modeling (FEM) software. There is some irony in requiring 21st century computer methods to analyze 19th century construction. Different FEM software will yield different results. Moreover, many assumptions are required to construct a FEM model (material properties, support conditions, loading conditions, etc.), whatever the software. The AASHTO Specifications §4.6.3 et seq. provide some guidance for such analysis, but leave a great deal to the judgement of the designer. Changes to AASHTO Specifications The Specifications are constantly being revised (interim revisions are issued annually). Many of these changes in the past twenty years pertain to wood decks. The most important in regards to the current project include the following. The change to LRFD methods resulted in extensive revisions to wood design specifications, many of them based on studies by Andrezj Nowak and his associates. Load and Resistance Factor Calibration for Wood Bridges (Nowak and Eamon, 2005) examined factors for sawn lumber stringers, glued-laminated girders, and various wood deck types. The authors found significant variation in reliability indices for wood bridges designed according to the AASHTO Standard (ASD) Specifications and developed load and resistance factors to provide more consistent levels of reliability. A “deck factor”’ adjustment to wood strength values was added to the Specifications when LRFD methods were introduced. For decks made of 4” nominal planks, the tabulated “deck factor” (Table 8.4.4.8-2) replaces the ‘flat-use factor’ in the NDS®. It allows an increase up to 50% over the base strength values (whereas the flat-use factor increased these values at most 15%). The new factor is a result of field testing (Nowak, Eamon and Ritter 1999) confirmed in lab testing (Nowak, Stankiewicz and
1 Thomas Macioce, email message to Richard Pratt, May 2, 2017.

ANALYZING COVERED BRIDGE FLOOR SYSTEMS HAER No. NH-53
Page 89
Ritter 1999) which demonstrated that the flat-wise use factor was overly conservative for typical plank sizes. The field testing program is further discussed below. The “deck factor” does not apply to thinner planks, for which the old ‘flat-use factor’ is still to be used. Nor does it apply to multiple-layer plank decks 4"-thick or thicker in the aggregate. No research on multiple-layer plank bridge decks has been found to date in the literature. Note: The section on Shear Design (below) discusses changes in 2001 to the National Design Specification (NDS®), which greatly increased wood shear strength values. Full-scale Bridge and Deck Load Testing Manual for Bridge Rating Through Load Testing (Lichtenstein and Associates, 1998) notes that “proof testing existing bridges has been widely used by the Ontario Ministry of Transportation and the Florida Department of Transportation. In Switzerland, every new bridge is subject to a proof test before its opening to traffic.” In general such proof tests demonstrate capacity but do not try to correlate measured behavior under load to analytic models. The manual briefly reviews 30 reports on diagnostic and proof testing on bridges in the U.S., Canada and New Zealand; most of the reports discuss results on multiple bridges. In general, testing resulted in higher load ratings than conventional analysis, in a few cases very much higher (e.g. a 7-ton rating revised by testing to 46 tons). Yet in a few cases testing resulted in lower load ratings (e.g. an 11-ton rating by analysis lowered to 9 tons by testing). The manual also notes, however, that “very few load tests have been performed on timber bridges,” adding that “proof-load testing is suggested for establishing a safe service load rating for timber bridges” (§2.6.9). Of the thirty reports described in the manual, most deal with steel structures; none were on timber bridges except one which discusses tests on two steel truss bridges with timber decks. That report was Ultimate Load Behavior of Full-Scale Highway Bridges, Summary Report (Sanders 1975). It describes service and destructive tests on two truss bridges over the Des Moines River (the bridges were to be removed in advance of the construction of a dam and reservoir). One, the Hubby Bridge, had a deck consisting of two layers of planks on timber stringers, supported on steel floor beams. Three agencies were provided with inspection data for the bridge; they calculated (with the same data set) operating load ratings for the deck of H13.1, H8.2, and H9.4. Destructive tests were performed on two deck panels, one with loads simulating a truck traveling on the bridge centerline, the other with the load near the deck’s edge. The ultimate loads sustained were equivalent to an H42 truck and an H32 truck, respectively. See also the “Distribution Factor” section below for diagnostic test results. “Structural Reliability of Plank Decks”, a paper presented at the 1999 Structures Conference, (Nowak, Eamon, and Ritter 1999) analyzed truck weigh-in-motion data from instrumented bridges with plank decks. Results indicated that both the AASHTO (1996) and AASHTO LRFD (1998) Bridge Specifications

ANALYZING COVERED BRIDGE FLOOR SYSTEMS HAER No. NH-53
Page 90
were usually overly conservative for deck planks. This was attributed to flat-use factor values in the specifications being significantly lower than that found in testing, and to “an unrealistic load distribution model, which assumes that the entire wheel load is carried by a single plank, regardless of plank width.” It builds on an earlier paper, “Reliability Analysis of Plank Decks for Bridges” (Nowak and Saraf 1996). Later changes to the AASHTO Specifications were due, at least in part, to these studies. Weaver (2003) reports on service load tests on four covered bridges which found the AASHTO S/D method to distribute floor loads to supporting beams be overly conservative. See additional discussion in the “Distribution Factor” section below. Strength Variability The relatively large variability in wood strength is likely to be a reason why the strength of plank bridge decks typically exceeds their rated capacity far more (proportionately) than decks of steel or concrete. Engineering designs are normally based on the “expected minimum” strength of materials used. Commonly this is a value that, statistically, either 95% or 98% of samples are expected to exceed (the average strength found in tests minus about 1.65 or 2.05 standard deviations, respectively, assuming normal distribution). Some materials, like steel, have relatively uniform strength, so their “expected minimum” is not much less than the average. An analysis of test results from almost 20,000 heats of A615 Grade 60 reinforcing bar, for example, found the 98% threshold for yield strength was 85% of the average (Bournonville 2004). This implies that the average piece of such rebar is about 17% stronger than its “design strength.”2 Wood strength is much more variable, even for samples from the same species and grade. Consequently the minimum expected strength used for design is much less than the average. ASTM’s Standard Practice for Establishing Structural Grades and Related Allowable Properties for Visually Graded Lumber (ASTM 2011) is based on the 95% threshhold (not 98%). Analysis of between 150 and 750 test results for each of three grades of Douglas fir and two of western hemlock found the 95% threshold for strength in bending to be between 49% and 64% of the average (Wood 1960). This implies that the “average” piece of wood of these species and grades is roughly 50% to 100% stronger than its “design strength.” This greater “excess strength” (50% to 100% for wood vs. 17% for steel in the cited studies) is true despite there being a lower factor of safety used to determine the wood design strength (95% confidence vs. 98%). This is a consequence of the large variability of wood strength compared to steel (and the miracle of statistics)!
2 Note that both ASD and LRFD design methods further reduce such strength values by an additional factor of safety so that, theoretically, materials are never stressed to their full strength.

ANALYZING COVERED BRIDGE FLOOR SYSTEMS HAER No. NH-53
Page 91
Distribution Factors The AASHTO Specifications allow a simple approximation of the extent to which wood decks spread wheel loads to the supporting beams below. The beam immediately below the load is assumed to support a fraction S/D of the total, where S is the beam spacing and D is a “distribution factor”. The Specifications list distribution factors for most general deck types. The method almost always produces conservative results for short spans (Kulick 2006). Thus this is likely to contribute to underrating the capacity of covered bridge decks. Kulick notes that the S/D method dates to AASHTO’s first highway design specifications in 1931, but that by the late 1950s a “growing amount of research showed that (the S/D formula) could be quite approximate” and as bridge girders got longer and their spacing greater the formula “became more and more unrealistic.” Consequently load distribution has been the subject of many studies in recent years. NCHRP Report 592, Simplified Live Load Distribution Factor Equations (Bridge Tech 2007) examined distribution factors in exhaustive detail. Its Literature Search section alone (Appendix B) is 78 pages long and cites over 100 sources which report on tests of hundreds of bridges. However its final sentence notes “we have a very limited amount of information” on wood beam bridges. Weaver (2003) field-tested four covered bridges in Vermont and found that floor beam analysis using the AASHTO S/D methodology appeared very conservative in all four. They measured midspan deflections of the bridges’ sawn-timber floor beams under truck live loads, and compared the results with AASHTO-calculated deflections for the same loads (assuming no end fixity for the floor beams, no T-beam effect, and handbook values for the wood’s modulus of elasticity). Three bridges had Town-lattice trusses and nail-laminated decks; measured beam deflections for these bridges were 19%, 42%, and 58% of AASHTO-predicted values. The fourth bridge had multiple kingpost trusses and a 4" thick plank deck; its measured beam deflection was 50% of the AASHTO-predicted value. Sanders (1975) reports on service tests made on two old steel truss bridges—Hubby and Chestnut Ford—which had plank decks on wood beams. They calculated equivalent ‘D’ factors from measured deflections under an H15 truck loading. They found the AASHTO ‘D’ factor was conservative on the Hubby Bridge whether the truck drove down the deck’s middle or along either edge. On the Chestnut Ford Bridge they found the AASHTO ‘D’ factor conservative when the truck drove down the center, but slightly unconservative when the truck drove close to one edge. (See Full Scale Load Testing Section above for destructive testing results in Sanders). Lindyberg (2002) reports on laboratory tests made on timber salvaged from a Town-lattice covered bridge. The report’s Part 1 concerns lattice members and is not relevant to this deck study. Part 2 concerns tests on three wood floor beams with a (non-historic) nail-laminated deck. Beams were placed on rigid supports and spaced 3.5' apart; they spanned 16'. Deflections were measured under single 2,100 pound loads placed on the deck directly over an outer beam, over the middle beam, and midway between the two, all at midspan. Deflections were also measured under twin 1,750 pound loads spaced 6' apart (i.e. a simulated axle load) centered on the deck at midspan.
ANALYZING COVERED BRIDGE FLOOR SYSTEMS HAER No. NH-53
Page 92
The study found little or no composite action between the beams and nail-laminated deck boards. The AASHTO S/D method of distributing live loads between longitudinal beams (stringers) was found accurate under the twin-load test. The S/D method was found overly conservative under the single load over the middle beam; there the load was shared equally by all three beams in the test. The report describes this as an important discovery, but recommends that additional testing be made on a deck with five or more floor beams. Unplanned Composite Action Lichtenstein and Associates (1998) note there have been “many reported examples of contributions from nonstructural components, such as noncomposite deck slabs … enhancing a structural member’s behavior at low load levels”, but warns that this unplanned composite action “may cease to participate at high load levels.” If this is the case, such composite action would lead to a stiffer deck at the lower loads, but not one with greater ultimate strength. As noted above, Lindyberg (2002) found little or no composite action between the beams and deck planks in lab tests. Witmer (1999) presents experimental results of tests on glulam deck panels on red maple glulam longitudinal beams. They found slight increases in stiffness over that of beams without deck panels, ranging from about 6% when there were gaps between the panels to as much as 15% when the panels were butted. The increased stiffness indicates partial composite action at low stresses, but as noted by Lichtenstein & Associates (above) this does not necessarily indicate greater ultimate strength. Nearly all reported tests for unplanned composite action have been on concrete or concrete and steel structures. A 1990 report, for example, compiled data from many beam-and-slab bridges, finding frequent indications of composite action, but concluding that the effect was not reliable enough to count on in design (Suetoh, et al. 1990). This literature search has not found results of testing for composite action in multiple-layer plank decks. Intuitively composite action may be most likely in such decks. Shear Design Changes to the National Design Specification (NDS®) in 2001 included a 95% increase in allowable shear stress for all species of wood. ASTM procedures had previously been doubly correcting for the possibility of shakes, splits and other imperfections. The increase in allowable stress is a consequence of removing one of the redundant safety factors. At the same time the shear strength increase factor CH was eliminated (Line 2002). The factor CH allowed for stresses to be increased by as much as a factor of two if boards or beams were individually inspected and found free of checks, splits and other defects. In practice such inspections were rarely made and the factor rarely used.

ANALYZING COVERED BRIDGE FLOOR SYSTEMS HAER No. NH-53
Page 93
The change is extremely important to engineering analysis of covered bridge floors. Past analyses commonly found floors to have inadequate shear strength. It appears such conclusions may often have been as erroneous because the data used to produce them was erroneous. The correction to the standard was not widely publicized, so some designers may have continued to use the old values for years afterwards. Incorrect allowable shear values appear in the 1983 edition of Western Woods Use Book (Western Woods Products Association 1983) so their use goes back at least that far. Not far prior to 1983, engineering manuals (e.g. Eshbach 1975) listed (higher) allowable shear stresses that varied with lumber grade within a given species. It could be that the change to the lower allowables, with a single value for all grades within a species, and the addition of the factor CH, all occurred at the same time. This literature search has not determined that, nor whether a return to different allowable shear values for different lumber grades may be warranted. Bibliography AASHTO. LRFD Bridge Design Specifications, 7th Edition. Washington, DC: American Association of State Highway & Transportation Officials, 2014. _____. Manual for Bridge Evaluation, 2nd Edition. Washington, DC: American Association of State Highway and Transportation Officials, 2011. American Institute of Timber Construction. Timber Construction Manual, 6th Edition. Hoboken, NJ: John Wiley & Sons, 2012. American Wood Council. National Design Specification for Wood Construction. Leesburg, VA: American Wood Council, 2014. _____. National Design Specification for Wood Construction. Leesburg, VA: American Wood Council, 2012. ASTM. "ASTM D245 - 06(2011)." Standard Practice for Establishing Structural Grades and Related Allowable Properties for Visually Graded Lumber. ASTM International, 2011. https://www.astm.org/Standards/D245.htm, accessed April 9, 2017. Bennett, Lola, Dorottya Makay and Justin Spivey. “Contoocook Railroad Bridge,” HAER No. NH-38. Historic American Engineering Record (HAER), National Park Service, U.S. Department of the Interior, 2003.
ANALYZING COVERED BRIDGE FLOOR SYSTEMS HAER No. NH-53
Page 94
Bournonville, Matt, Jason Dahnke and David Darwin. “Statistical Analysis of the Mechanical Properties and Weight of Reinforcing Bars.” Master's thesis, Lawrence, KS: University of Kansas Structural Engineering & Materials Laboratory, 2004. Breyer, Donald E., Kenneth Fridley, David Pollock, and Kelly Cobeen. Design of Wood Structures—ASD, 5th Ed. New York, NY: McGraw-Hill, 2003. Buonopane, Stephen, Sarah Ebright and Alex Smith. "The Timber Trusses of R.W. Smith: History, Design and Behavior." Proceedings of the Fourth International Congress on Construction History, Paris, July 3-7 2012, 599-606. Bridge Tech, Inc., et al. Simplified Live Load Distribution Factor Equations. NCHRP Report 592, Washington, DC: Transportation Research Board, 2007. Christianson, Justine and Christopher H. Marston, executive editors. Covered Bridges and the Birth of American Engineering. Washington, DC: Historic American Engineering Record, National Park Service, 2015. Conwill, Joseph D., James Garvin and Francesco Lanza. “Bath Haverhill Bridge,” HAER No. NH-33. Historic American Engineering Record (HAER), National Park Service, U.S. Department of the Interior, 2003. Eshbach, Ovid W. and Mott Saunders, eds. Handbook of Engineering Fundamentals, 3rd Ed. New York, NY: John Wiley & Sons, 1975. Gasparini, Dario, J. Bruckner and F. da Porto. "Time-dependent Behavior of Post-tensioned Wood Howe Bridges." ASCE Journal of Structural Engineering 132, no. 3 (March 2006): 418-429. Gasparini, Dario, Stacey Hursen, Gregory Willenkin and Kamil Nizamiev. “Strength of Burr-Arch Trusses,” HAER No. OH-138. Historic American Engineering Record (HAER), National Park Service, U.S. Department of the Interior, 2017. Hoadley, R. Bruce. Understanding Wood: A Craftsman’s Guide to Wood Technology. Newtown, CT: The Taunton Press, 2000. Kulick, John M. and Dennis R. Mertz. "Evolution of Vehicular Live Load Models during the Interstate Design Era and Beyond." Transportation Research Circular E-C104 (2006), 1-26. Lamar, Dylan M. and Benjamin W. Schafer. "Structural Analyses of Two Historic Covered Wooden Bridges." Journal of Bridge Engineering 9, no. 6 (2004): 623-633.
ANALYZING COVERED BRIDGE FLOOR SYSTEMS HAER No. NH-53
Page 95
Lamar, Dylan and Benjamin Schafer, “Brown Bridge,” HAER No. VT-28. Historic American Engineering Record (HAER), National Park Service, U.S. Department of the Interior, 2003. A.G. Lichtenstein and Associates, Inc. “Manual for Bridge Rating Through Load Testing.” National Cooperative Highway Research Program Research Results Digest, no. 234. Washington, DC: Transportation Research Board, 1998. Lindyberg, Robert F. Timber Evaluation Study. Reports AEWC-02-14 & AEWC-02-15, University of Maine Advanced Engineering Wood Composites Center, 2002. Line, Philip, Robert Taylor, John “Buddy” Showalter and Bradford K. Douglas. “Changes in the 2001 NDS for Wood Construction.” American Forest & Paper Association, Inc., 2002. Lwin, M. Myint. "Modern and Comprehensive Bridge Design Specifications." Transportation Research News 194 (Jan-Feb 1998): 35-36. Nowak, Andrzej S., Pawel R. Stankiewicz and Michael A. Ritter. "Bending Tests of Bridge Deck Planks." Construction and Building Materials 13, no. 4 (1999): 221-228. Nowak, Andrzej S., Chris Eamon and Michael A. Ritter. "Structural Reliability of Plank Decks." In Structural Engineering in the 21st Century: Proceedings of the 1999 Structures Conference, April 18-21, 1999, New Orleans, Louisiana (Reston, VA: American Society of Civil Engineers): 688-691. Nowak, Andrzej S. and Christopher D. Eamon. "Load and Resistance Factor Calibration for Wood Bridges." Journal of Bridge Engineering 10, no. 6 (2005): 636-642. Nowak, Andrzej S. and Vijay Saraf. "Reliability Analysis of Plank Decks for Bridges." In National Conference on Wood Transportation Structures. General Technical Report FPL-GTR-94 (Madison, WI: U.S. Department of Agriculture, Forest Service, Forest Products Laboratory, 1996): 225-231. Pierce, Phillip C., Robert L. Brungraber, Abba Lichtenstein, Scott Sabol, J.J. Morell, and S.T. Lebow. Covered Bridge Manual. Publication No. FHWA-HRT-04-098. McLean, VA: Turner- Fairbank Highway Research Center, Federal Highway Administration, April 2005. Pierce, Phillip C. "Covered Bridges – Engineering Judgment and the Practical Approach." In Proceedings of the 2005 Structures Congress and the 2005 Forensic Engineering Symposium, April 20-24, 2005, New York, NY. Reston VA: ASCE Structural Engineering Institute, 2005. Ritter, Michael A. Timber Bridges: Design, Construction, Inspection, and Maintenance. Publication EM-7800-8, Washington, DC: U.S. Department of Agriculture, Forest Service, 1990.

ANALYZING COVERED BRIDGE FLOOR SYSTEMS HAER No. NH-53
Page 96
Sanders, Jr., W.W., H.A. Elleby and F.W. Klaiber. Ultimate Load Behavior of Full-Scale Highway Bridges. Summary Report ISU-ERI-Ames-76035. Ames, IA: Engineering Research Institute, Iowa State University, 1975. Suetoh, Satriya, Edwin G. Burdette, David W Goodpasture and J. Harold Deatherage. "Unintended Composite Action in Highway Bridges." Transportation Research Record 1275 (1990): 89-94. Weaver, John, P.E. “Summary of Deflections for Floor Beam Load Determinations,” 2003. http://www.vermontbridges.com/floorbeams.htm, accessed September 2018. Western Woods Products Association. Western Woods Use Book, 3rd Edition. Portland, OR: Western Woods Product Association, 1983. Withey, M.O. and James Aston. Johnson’s Materials of Construction, 8th Edition. New York, NY: John Wiley & Sons, 1939. Witmer, R.W., H.B. Manbeck and J.J. Janowiak. "Partial Composite Action in Hardwood Glued-Laminated T-Beams." ASCE Journal of Bridge Engineering 1, no. 4 (1999): 23-29. Wood, Lyman W. Variation in Strength Properties in Woods Used for Structural Purposes. Report 1780, Madison, WI: U.S. Department of Agriculture, Forest Service, Forest Products Laboratory, 1960. Wood Handbook: Wood as an Engineering Material. General Technical Report FPL-GTR-190. Madison, WI: U.S. Department of Agriculture, Forest Service, Forest Products Laboratory, 2010. Zokaie, T., T.A. Osterkamp and R.A. Imbsen. "Distribution of Wheel Loads on Highway Bridges." Transportation Research Record 1290 (1991): 119-126.