Embed Size (px)
Citation preview

Analyze A Wireless Signal Services In New Built Hall Of Residence In NIT, Rourkela
A THESIS SUBMITTED IN PARTIAL REQUIREMENTS FOR THE DEGREE OF
BACHELOR OF TECHNOLOGY IN
ELECTRONICS & COMMUNICATION ENGINEERING BY
RAHUL WARKADEY
ROLL NO. 107EC022
UNDER THE GUIDANCE OF Prof. S.K. Patra
DEPARTMENT OF ELECTRONICS AND COMMUNICATION ENGINEERING NATIONAL INSTITUTE OF TECHNOLOGY, ROURKELA
DEPARTMENT OF ELECTRONICS AND COMMUNICATION ENGINEERING NATIONAL INSTITUTE OF TECHNOLOGY, ROURKELA
ORISSA 769008 INDIA

National Institute of Technology
Rourkela
CERTIFICATE
This is to certify that the project entitled, “Analyze a wireless signal services in new built
hall of residence in NIT, Rourkela” submitted by Rahul Warkadey is an authentic work
carried out by them under my supervision and guidance for the partial fulfillment of the
requirements for the award of Bachelor of Technology Degree in Computer Science and
Engineering at National Institute of Technology, Rourkela.
To the best of my knowledge, the matter embodied in the project has not been submitted to
any other University / Institute for the award of any Degree or Diploma.
Date: 1st July, 2011
Place: NIT Rourkela
Prof. S.K. Patra Dept. of Electronics and Communication Engineering,
National Institute of Technology, Rourkela,
Odisha-769008

ACKNOWLEDGEMENT
I have this opportunity to thank all the concern individuals whose guidance, help and timely
support made me to complete this project within the stipulated time. Unfortunately, it is not
possible to express my thanks to all of them in a single page of acknowledgement.
First and foremost I would like to express my sincere gratitude to my project supervisor Prof.
Sarat Kumar Patra, Head of the Department of Electronics and Communication Engineering,
for his great support, nice motivation, proper guidance and constant encouragement which
made this project enrich and insightful experience. His timely inputs, valuable return and
constructive criticism in many stages of this work was catalyst in understanding and
execution of this project.
I am grateful to him for assigning me the real life application based project and providing me
with various facilities of the department. His valuable suggestions and inspiring guidance was
extremely helpful.
An assemblage of this nature could never have been attempted without reference to and
inspiration from the works of others whose details are mentioned in reference section. I
acknowledge our indebtedness to all of them.
I would also like to thank all professors and lecturers, and members of the department for
their generous help in various ways for the completion of this thesis. I also extend our thanks
to our dear friends for their support and cooperation.
Date: 1st July, 2011
Place: NIT Rourkela
Rahul Warkadey Dept. of Electronics and Communication Engineering
National Institute of Technology Rourkela – 769008

CONTENTS TITLE Page No.
Abstract i
List of tables ii
List of figures iii
1. Introduction 1
1.1 Wireless Access Point 1
1.2 Common WAP applications 1
1.3 Limitations 1
1.4 Security 2
1.5 Procurve wireless access point 420 3
2. Wireless Access Point Designs 4
2.1 WLAN Architecture 4
2.1.1Traditional WLAN 4
2.1.2 IEEE 802.11a, 802.11b and 802.11g 6
2.2 Wi-Fi Based Positioning 8
2.2.1 Closest Access Point 8
2.2.2 Distance 8
3. Softwares 9
3.1 Net Stumbler 9
3.1.1 Definitions 9
3.1.2 Usage 9
3.1.3 General Requirements 10
3.2 Speed Pro Test 11
3.2.1 Definition 11
3.2.2 System requirement 11
3.3.3 Key benefits 12
4. Brief Description About Observation Sites 14
4.1 G.D. Birla Hall of Reisdence 14
4.1.1 Block – A & B 14
4.1.2 Description of access point in ground floor 15
4.1.3 Description of access point in 1st floor 15

4.1.4 Description of access point in 2nd floor 15
4.2 Dhirubhai Ambani Hall of Residence 16
4.2.1 Block – A & B 16
4.2.2 Description of access point in ground floor 16
4.2.3 Description of access point in 1st floor 17
4.2.4 Description of access point in 2nd floor 17
5. Experiment Analysis 18
5.1 G.D Birla Hall of Residence 18
5.1.1 Hall 3 AP1 18
5.1.2 Hall 3 AP2 18
5.1.3 Hall 3 AP3 19
5.1.4 Hall 3 AP4 19
5.1.5 Hall 3 AP5 20
5.1.6 Hall 3 AP6 20
5.1.7 Hall 3 AP7 21
5.1.8 Hall 3 AP8 22
5.2 Dhirubhai Ambani Hall of Residence 23
5.2.1 Hall 4 AP1 23
5.2.2 Hall 4 AP2 23
5.2.3 Hall 4 AP3 24
5.2.4 Hall 4 AP4 24
5.2.5 Hall 4 AP5 25
5.2.6 Hall 4 AP6 25
5.2.7 Hall 4 AP7 26
5.2.8 Hall 4 AP8 26
6. Conclusion 28
References 29

i
ABSTRACT
In recent years, wireless technology with its sub standard 802.11 gaining popularity in
deploying for positioning system. With development of mobile computing devices and
wireless technique, location detection system is used to determine users’ location either in
indoor or outdoor environment that relies on Wi-Fi signal strength. The aim of this project is
to analyze the wireless signal services of different position from access point based on signal
strength that broadcast by access point. Beside that this project also apply application is very
helpful to detecting the access point strength cover up the areas to provide signal strength
which is can determine the signal strength of access point where the signal is good at certain
distant . In this project, I used different software. That is very helpful for me determining the
signal strength and the detection access point and realizing the quality of the signal software
used net stumbler and peed pro test net-stumbler software is used to detecting the access
point in the area. It also provides other information of signal strength bandwidth of signal and
nearest access point speed pro test is used for Wi-Fi graphical representation of Wi-Fi
signals.
These experimental results that demonstrate the ability of Wi-Fi Positioning system to
estimate location of the devices at different measurable distances and result in application
part is shown based on highest percentage accuracy of providing signal strength.

ii
List of tables
Table No. Title Page
No.
Table 2.1 Shows the relationship between the 802.11 specifications and the Open
Systems Interconnection (OSI) reference model 6
Table 2.2 Shows the three standards that currently are widespread in use in mass
market Wi-Fi equipment. Their specifications at the physical layer are
different, and so are the capacity they can offer and the frequency band
they utilize.
6
Table 3.1 Transmission and receiving signal strength 13
Table 3.2 Wi-Fi Characteristics 13
Table 5.1 HALL 3 AP1 18
Table 5.2 HALL 3 AP 1 18
Table 5.3 HALL 3 AP 2 18
Table 5.4 HALL 3 AP 2 19
Table 5.5 HALL 3 AP 3 19
Table 5.6 HALL 3 AP 3 19
Table 5.7 HALL 3 AP 4 19
Table 5.8 HALL 3 AP 4 20
Table 5.9 HALL 3 AP 5 20
Table 5.10 HALL 3 AP 5 20
Table 5.11 HALL 3 AP 6 20
Table 5.12 HALL 3 AP 6 21
Table 5.13 HALL 3 AP 7 21
Table 5.14 HALL 3 AP 7 21
Table 5.15 HALL 3 AP 8 22
Table 5.16 HALL 3 AP 8 22
Table 5.17 HALL 4 AP 1 23
Table 5.18 HALL 4 AP 1 23
Table 5.19 HALL 4 AP 2 23
Table 5.20 HALL 4 AP 2 24
Table 5.21 HALL 4 AP 3 24

iii
Table 5.22 HALL 4 AP 3 24
Table 5.23 HALL 4 AP 4 24
Table 5.24 HALL 4 AP 4 25
Table 5.25 HALL 4 AP 5 25
Table 5.26 HALL 4 AP 5 25
Table 5.27 HALL 4 AP 6 25
Table 5.28 HALL 4 AP 6 26
Table 5.29 HALL 4 AP 7 26
Table 5.30 HALL 4 AP 7 26
Table 5.31 HALL 4 AP 8 26
Table 5.32 HALL 4 AP 8 27
List of figures
Fig. No Title Page
No
Figure 1.1 Procurve access point 420 3
Figure 2.1 1: Components in a traditional WLAN 4
Figure 2.2 Infrastructure Basic Service Set 5
Figure 2.3 A wireless mesh network. Two access points are interconnected with
wireless links and multiple paths are available to the backbone network 6
Figure 3.1 Dialog box of Netstumbler 9
Figure 3.2 Represents a access points and graphical signal strength 10
Figure 3.3 Dialog box of Speed Pro Test 11
Figure 3.4 Graphical representation of Wi-Fi signal 12
Figure 4.1 G.D BIRLA hall of residence 14
Figure 4.2 Dhirubhai ambani hall of residence 16

1
CHAPTER 1
Introduction
1.1 Wireless Access Point A wireless access point (WAP) is a device that allows wireless devices to connect to a wired
network using Wi-Fi, Bluetooth or related standards the wireless access point usually
connects to a router (via a wires network )and can relay data between the wireless devices
(such as computers or printers )and wired devices on the network.
1.2 Common WAP applications The wireless access points are managed by a WLAN controller which handles automatic
adjustments to RF power, channels authentication, and security. This saves the clients’ time
and administrators overhead because it can automatically re- associate or authenticate. The
majority of WAPs are used in home wireless networks generally have only one WAP to
connect all the computers in a home most are wireless routers that include wireless access
point a router and often an Ethernet switch many also include broadband modem in places
here most homes have their own WAP within range of the neighbors
A WAP may also act as the network arbitrator, negotiating when each nearby client device
can transmit .the vast majority of currently installed IEEE 802.11 network do not implement
this using a distributed pseudo random algorithm called CSMA/CA.
1.3 Limitations One IEEE 802.11 WAP can typically communicate with 30 clients systems located within a
radius of 100 m the actual range of communication can vary significantly, depending on such
variables as indoor or outdoor placement, height above ground, nearby obstructions, other
electronics devices that might actively interfere with the signal by broadcasting on the same

2
frequency, type of antenna, the current whether, operating radio frequency and the power
output of devices network designers can extend the range of operated over distances of
several hundred kilometers Adjacent WAP will use different frequencies(channels ) to
communicate with their clients in order to avoid interference between the two nearby systems
.wireless devices can listen for data traffic on other frequencies, can rapidly switch from one
frequency to another to achieve better reception the limited number of frequencies become
problematic in crowd downtown areas with tall building using multiple WAPs signal overlap
becomes an issue causing interference which results in digital dropage and data errors
Wireless networking lags behind wired networking in terms of increasing bandwidth and
throughput. the speed of 300MBps IEEE(802.11g) wired hardware of similar cost reaches
1000Mbit/s one impediment to increasing the speed of wireless communications comes from
WIFI use of shared communications medium, so a WAP is only able to use somewhat less
than half of the actual over the air rate for data throughout. Thus a typical 54 MBit/s wireless
connection actually carries TCP/IP data at 20 to 25 Mbit/s users of legency wired networks
expect faster speeds and people using wireless connections keenly want to see the wireless
network catch up.
1.4 Security Wireless access has special security considerations many wired networks base the security on
physical access control,trusting all the users on the local network, but if wireless access
points are connected to the network, anyone on the street or in the neighboring office could
conn most common solution is wireless traffic encryption. Modern access points come with
built in encryption.the first generation encryption scheme WEP proved easy to crack; the
second and third generation schemes WPA and WPA2 are considered secure if a strong

3
enough password or passphrase is used some WAPs support hotspot style authenication using
RADIUS and other authentication servers
1.5 Procurve wireless access point 420 The procurve wireless access point 420 is a wireless repeater that seamlessly integrates with
existing wired networks to support connectivity for mobile user or wireless workstations .this
solution offers fast, reliable wireless connectivity with considerable cost saving over wired-
LANs just install into your notebooks or install wireless adapters into your desktops and
startnetworking throughout this access point will be abbreviated as the Access point 420.
Figure 1.1: Procurve access point 420
The access point 420 has one 10/100 Base-TX RJ -45 port this port also supports Power over
Ethernet (PoE) based on the IEEE 802.3af standard. The access point supports wireless
connectivity at speed up to 54Mbps based on IEEE 802.11g standard this access point is
designed to be used primarily for connecting wireless clients to an enterprise network this
access point allows wireless clients to connect directly to each other, or to connect to other
computers or network resources located on the wired network

4
CHAPTER -2
WIRELESS ACCESS POINT DESIGNS This chapter presents general technological background for citywide wireless networks, their
architecture and common standards. The RFID technology is also presented, with the focus
on Wi-Fi RFID tags. In addition, different positioning techniques that are used in Wi-Fi based
location systems are given.
2.1 WLAN Architecture
2.1.1Traditional WLAN A Wireless Local Area Network (WLAN) can be designed and deployed with different levels
of complexity. Basically, a traditional WLAN architecture consists of four main components.
These components are depicted in Fig.
Figure 2.1: Components in a traditional WLAN
The purpose of a WLAN is to transfer information wirelessly between stations. These stations
are typically laptops or other mobile terminals that are equipped with a wireless interface.
The communication is done through a wireless medium. The stations communicate with
access points, which are connected to a wired distribution system or backbone network.
Hence, the access points perform a wireless-to-wired bridging function [13]. A group of
stations that communicate with each other is called a Basic Service Set (BSS). An access

5
point and all the stations that are able to communicate with each other within the coverage
area of the access point, is said to be in an Infrastructure Basic Service Set.
Two stations can also communicate directly with each other, without using an access point.
Several stations communicating directly together form an ad-hoc network or an Independent
Basic Service Set (IBSS). Figure 2.2 illustrates how the stations communicate with each other
in the independent and infrastructure BSSs.
Figure 2.2: Infrastructure Basic Service Set
In large WLAN deployments, such as citywide wireless networks, several access points are
often cooperating with each other to serve a certain area. In such systems, access point
controllers are used as additional components in the architecture. In these architectures, much
of the functionality is moved from the access point to the controller. Light-weight access
points communicate with the controllers using special tunneling protocols. A citywide
wireless network requires a large number of access points to cover the Entire area.
Connecting all these access points directly to the wired distribution network is costly. Thus,
wireless links are often used to interconnect access points. In such interconnections, at least
one access point is wired to the backbone network. This access point functions as a bridge for
the other access points in the interconnection. If there are multiple paths to backbone
network, the network is referred to as a wireless mesh. This is illustrated in figure 2.3. In
outdoor deployments, additional external high-gain antennas are often connected to the
access points in order to cover a larger area

6
Figure 2.3: A wireless mesh network. Two access points are interconnected with wireless links and multiple paths are available to the backbone network
2.1.2 IEEE 802.11a, 802.11b and 802.11g The 802.11 standards specify the physical layer and the Media Access Control (MAC) part of
the data link layer. The Logical Link Control (LLC) part of the data link layer is equal to the
other IEEE 802 specifications.
.Application Layer
Presentation Layer Session Layer Transport Layer Network Layer
Data Link Layer IEEE 802.11 logical link control (LLC) sublayer IEEE 802.11 medium access control (MAC) sublayer
Physical Layer Physical layer convergence procedure (PLCP) sublayer Physical medium dependent (PMD ) sublayer
Table 2.1: Shows the relationship between the 802.11 specifications and the Open Systems Interconnection (OSI) reference model
IEEE standard Max speed Frequency band Modulation
802.11a 54 Mbps 5 GHz OFDM
802.11b 11 Mbps 2.4 GHz DSSS
802.11g 54 Mbps 2.4 GHz OFDM
Table 2.2: Shows the three standards that currently are widespread in use in mass market Wi-Fi equipment. Their specifications at the physical layer are different, and so are the capacity they can offer and the frequency band they utilize.

7
The 802.11b physical layer is based on the Direct Sequence Spread Spectrum (DSSS)
modulation technique, which spreads the transmitted signal energy over a wider frequency
band by multiplying the signal by a pseudorandom noise code. This standard uses the non-
licensed 2.4 GHz frequency band, and can offer theoretical data rates up to 11 Mbps
The 2.4 GHz frequency band is heavy utilized both by 802.11 stations and other equipment.
Thus, the 802.11a is specified to operate in the 5 GHz unlicensed frequency band. 802.11a
offers theoretical data rates up to 54 Mbps and its physical layer is based on Orthogonal
Frequency Division Multiplexing (OFDM). OFDM divides the available bandwidth into
several sub channels. The signal is transmitted using these sub channels in parallel and
multiplexing data over the set of sub channels.
OFDM is more adaptable to interference than other modulation techniques because the sub
channels are selected orthogonally. Hence, OFDM is better suited for outdoor deployments
As with 802.11a, the 802.11g physical layer is based on OFDM and supports theoretical data
rates up to 54 Mbps. However, 802.11g operates in the 2.4 GHz frequency band and also
supports DSSS for backwards compatibility with 802.11b

8
2.2 Wi-Fi Based Positioning Wi-Fi RTLSs use different techniques for determining the location of a client or RFID tag.
The location can be computed using signal strength or timing information, observed at a
single or multiple access points. There are mainly four different location determination
approaches that are used in Wi-Fi networks [25]. The approaches differ in which physical
measurements they take into account, and how these are used in the location computation.
2.2.1 Closest Access Point The most basic of the four location determination techniques, is to identify the location based
on the access point that is closest to the client or RFID tag. This can be done by looking at the
association between the client and the access point or by measuring signal strength. However,
the closest access point method has a low degree of accuracy because an access point usually
has a large coverage area.
2.2.2 Distance A more advanced location determination technique is to compute the approximately distance
between the client or RFID tag and one or more access points. This technique is called
lateration. The distance can be computed based on signal strength or timing information [16].

9
CHAPTER - 3
SOFTWARES
3.1 NET STUMBLER
3.1.1 Definitions Net Stumbler is a tool for windows that facilitates detection of wireless LAN using 802.11a,
802.11a, 802.11g WLAN standards. It runs on Microsoft windows operating system
WINDOWS 2000 to WINDOWS XP.
Its updated version that will work correctly with WINDOWS VISTA AND WINDOWS 7
.
Dialog box of Netstumbler
3.1.2 USAGE This program commonly used for
War driving
Verifying network configurations
Detecting causes of wireless interference
Detecting unauthorized (“rogue “ ) access points
Aiming directional antennas for long haul WLAN links
10
Figure 3.2: Represents a access points and graphical signal strength
3.1.3 General Requirements The requirements of Net Stumbler are complex and depend on hardware, firmware
versions, driver versions and operating system. The best way to see if it works on
your system to try it. Your card must be configured in such a way that it can be seen
by the management software that came with the card
Net Stumbler is in “auto configure “mode (the default), it will occasionally disconnect
you from your network this enables it to perform it scans accurately, and is not bug .
11
3.2 SPEED PRO TEST
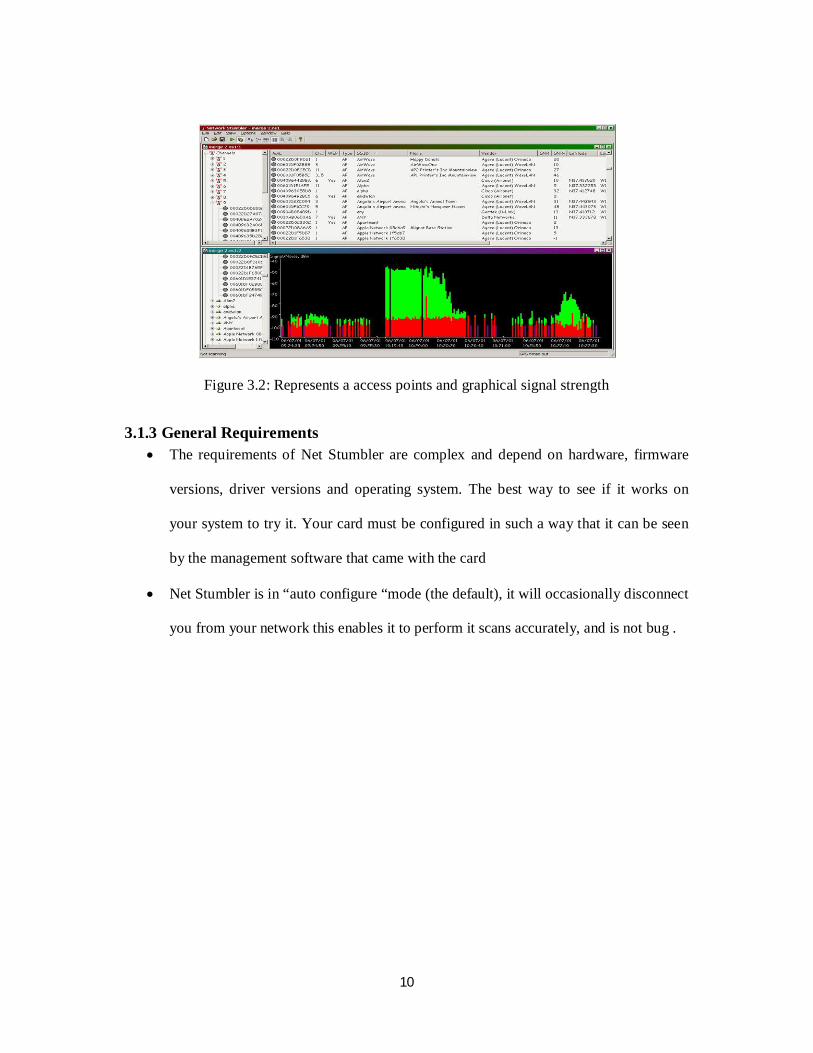
3.2.1 Definition Speed pro test is a software which is used to monitors your internet connection, website ,
CPU , memory hard drives ,WIFI , lan ,processes and much more all in real time and will
store all data recorded into an log, so it can be easily imported into almost any application.
This data can be used to help in resolving problems with your internet connection or
computer. Speed test is must for resolving connection issues. Speed test has the flexibility to
allow you to view the data in many ways to suit your need.
Figure 3.3: Dialog box of Speed Pro Test
3.2.2 SYSTEM REQUIREMENT 1. Windows 95/98/XP/Vista/win 7
2. Window NT 4.0 SP4 or later
3. Pentium 366mhz or greater
4. Minimum 32MB RAM
5. 100MB free hard drive space for logs
6. Internet connection

12
Figure 3.4: Graphical representation of Wi-Fi signal
3.3.3 KEY BENEFITS 1. Measure your actual maximum bandwidth speed by downloading from our server
2. Measure your quality of service
3. Test your own website’s speed ,connectivity ,response time and errors
4. Test your home network or LAN speed
5. You can monitor network connections as well as broadband internet connections
6. You can also monitor dial up connections using the ( local host )
7. Quick and easy viewing logs inside of graphs
8. Ping packet size up to 1k
9. Ability to ping a website to estimate connections speeds
10. Viewing your WIFI signal strength with a graph in real time
11. View memory status in graphs
12. View hard drive space in graphs
13. View system uptime in graphs
14. View battery status in graphs
15. View a processes memory usage in graphs
13
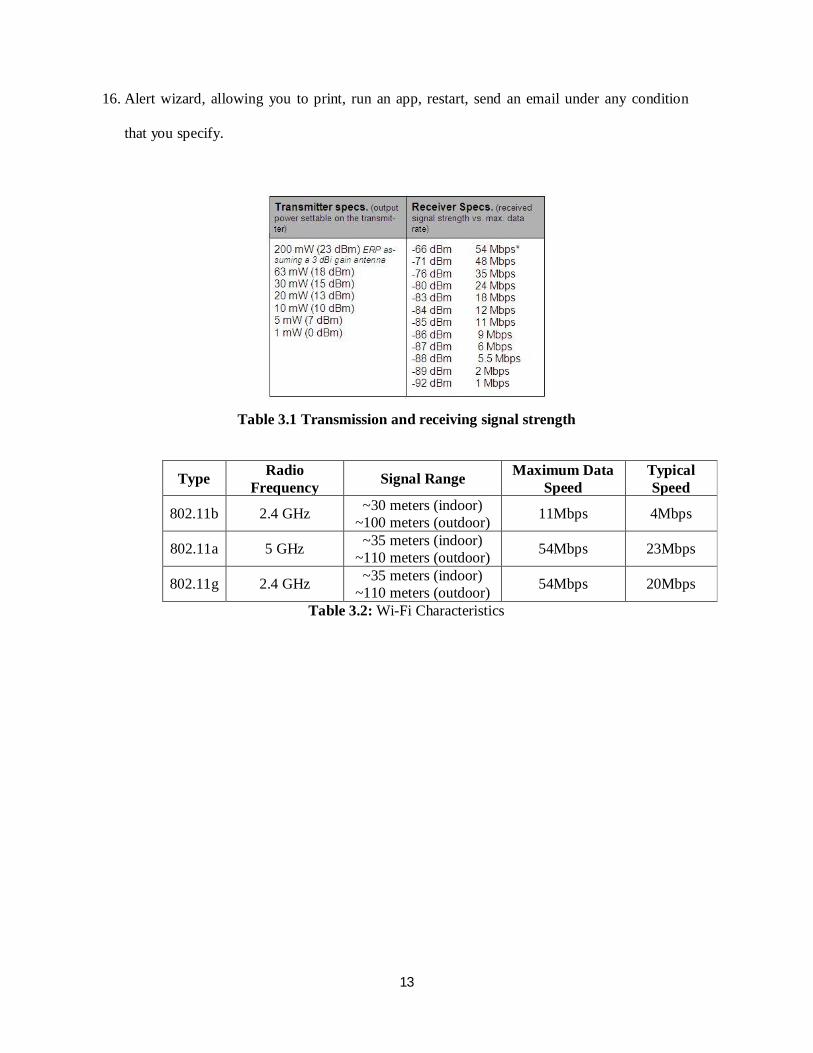
16. Alert wizard, allowing you to print, run an app, restart, send an email under any condition
that you specify.
Table 3.1 Transmission and receiving signal strength
Type Radio Frequency Signal Range Maximum Data
Speed Typical Speed
802.11b 2.4 GHz ~30 meters (indoor) ~100 meters (outdoor) 11Mbps 4Mbps
802.11a 5 GHz ~35 meters (indoor) ~110 meters (outdoor) 54Mbps 23Mbps
802.11g 2.4 GHz ~35 meters (indoor) ~110 meters (outdoor) 54Mbps 20Mbps
Table 3.2: Wi-Fi Characteristics

14
CHAPTER – 4
BRIEF DESCRIPTION ABOUT OBSERVATION SITES
4.1 G.D. BIRLA HALL OF REISDENCE The wireless access point is build up in the new extension building of hall 3 where it
almost rooms in the each block. Two blocks are there Block A and Block B
Three floors ground, 1st floor and 2nd floor.
4.1.1 Block – A & B Figure 4.1 G.D BIRLA hall of residence
In Ground floor - Room No. 1- 40
In 1st floor - Room No. 41-80
In 2nd floor - Room No. 81-120
The number of access point is located in extension building are Eight (8)
In ground floor three access points two access points are located in corners in left and right
side One is on centre near the stairs It provides the Wi-Fi services to entire building the
quality of the signal is good which is nearer to this access points.

15
4.1.2 Description of access point in ground floor - Hall 3 AP6 in right
- Hall 3 AP7 in centre
- Hall 3 AP8 in left
In 1st floor two access points both access points are located in between corner and centre at
distance of 30 meters from each others in side. It provides the Wi-Fi services to entire
building the quality of the signal is good which is nearer to this access points.
4.1.3 Description of access point in 1st floor - Hall 3 AP5 in left
- Hall 3 AP4 in right
In 2nd floor three access points two access points are located in corners in left and right side
One is on centre near the stairs It provides the Wi-Fi services to entire building the quality of
the signal is good which is nearer to this access points.
4.1.4 Description of access point in 2nd floor - Hall 3 AP1 in right
- Hall 3 AP2 in centre
- Hall 3 AP3 in left

16
4.2 DHIRUBHAI AMBANI HALL OF RESIDENCE
Figure 4.2: Dhirubhai ambani hall of residence
The wireless access point is build up in the new extension building of hall 4 where it
almost rooms in the each block. Two blocks are there Block A and Block B
Three floors ground 1st floor and 2nd floor.
4.2.1 Block – A & B In Ground floor - Room No. 1- 40
In 1st floor - Room No. 41-80
In 2nd floor - Room No. 81-120
The number of access point is located in extension building are Eight (8)
In ground floor three access points two access points are located in corners in left and right
side One is on centre near the stairs It provides the WIFI services to entire building the
quality of the signal is good which is nearer to this access points.
4.2.2 Description of access point in ground floor - Hall 4 AP6 in right
- Hall 4 AP7 in centre
- Hall 4 AP8 in left
In 1st floor two access points both access points are located in between corner and centre at
distance of 30 meters from each others in side. It provides the WIFI services to entire
building the quality of the signal is good which is nearer to this access points.

17
4.2.3 Description of access point in 1st floor - Hall 3 AP5 in left
- Hall 3 AP4 in right
In 2nd floor three access points two access points are located in corners in left and right side
One is on centre near the stairs It provides the wifi services to entire building the quality of
the signal is good which is nearer to this access points.
4.2.4 Description of access point in 2nd floor - Hall 3 AP1 in right
- Hall 3 AP2 in centre
- Hall 3 AP3 in left

18
CHAPTER – 5
EXPERIMENT ANALYSIS
5.1 G.D BIRLA HALL OF RESIDENCE 5.1.1 Hall 3 AP1
In corridor
Distance(in meters) Strength of signal(in bps) Quality 0-10 54*10^6 Excellent 11-20 4*10^5 Good 21-30 23*10^3 Good 31-40 12*10^2 Poor
Table 5.1: HALL 3 AP1
In rooms (room no- 82,89,98,105,113,119)
Room number Distance(in meters) Strength of signal(in bps) Quality 82 2 53*10^6 Excellent 89 8 45*10^6 Excellent 98 18 28*10^4 Good 105 24 15*10^3 Good 113 32 5*10^2 Poor 119 43 2*10^2 Poor
Table 5.2: HALL 3 AP 1
5.1.2 Hall 3 AP2
In corridor
Distance(in meters) Strength of signal(in bps) Quality 0-10 53*10^6 Excellent 11-20 42*10^5 Good 21-30 25*10^3 Good 31-40 11*10^2 poor
Table 5.3 : HALL 3 AP 2

19
In rooms (room no- 82, 89,98,105,113,119)
Room number Distance(in meters) Strength of signal(in bps) Quality 82 22 52*10^6 Good 89 8 46*10^6 Good 98 3 27*10^4 Excellent 105 21 13*10^3 Good 113 30 4*10^2 Poor 119 37 1.5*10^2 Poor
Table 5.4 : HALL 3 AP 2
5.1.3 Hall 3 AP3
In corridor
Distance(in meters) Strength of signal(in bps) Quality 0-10 53*10^6 Excellent 11-20 42*10^5 Good 21-30 25*10^3 Good 31-40 11*10^2 Poor
Table 5.5 : HALL 3 AP 3
In rooms (room no- 82,89,98,105,113,119)
Room number Distance(in meters) Strength of signal(in bps) Quality 82 43 52*10^6 Poor 89 32 46*10^6 Poor 98 24 27*10^4 Good 105 19 13*10^3 Good 113 8 4*10^2 Good 119 3 1.5*10^2 Excellent
Table 5.6 : HALL 3 AP 3
5.1.4 Hall 3 AP4
In corridor
Distance(in meters) Strength of signal(in bps) Quality 0-10 53*10^6 Excellent 11-20 42*10^5 Good 21-30 25*10^3 Good 31-40 11*10^2 Poor
Table 5.7: HALL 3 AP 4

20
In rooms (room no- 42,51,60,68,71,79)
Room number Distance(in meters) Strength of signal(in bps) Quality 42 2 52*10^6 Excellent 51 8 46*10^6 Excellent 60 18 27*10^4 Good 68 25 13*10^3 Good 71 32 4*10^2 Poor 79 43 1.5*10^2 Poor
Table 5.8 : HALL 3 AP 4
5.1.5 Hall 3 AP5
In corridor
Distance(in meters) Strength of signal(in bps) Quality 0-10 53*10^6 Excellent 11-20 42*10^5 Good 21-30 25*10^3 Good 31-40 11*10^2 Poor
Table 5.9 : HALL 3 AP 5
In rooms (room no- 42,51,60,68,71,79)
Room number Distance(in meters) Strength of signal(in bps) Quality 42 42 52*10^6 Excellent 51 33 46*10^6 Good 60 27 27*10^4 Good 68 19 13*10^3 Good 71 08 4*10^2 Poor 79 04 1.5*10^2 Poor
Table 5.10 HALL 3 AP5
5.1.6 Hall 3 AP6
In corridor
Distance(in meters) Strength of signal(in bps) Quality 0-10 54*10^6 Excellent 11-20 4*10^5 Good 21-30 23*10^3 Good 31-40 12*10^2 Poor
Table 5.11 : HALL 3 AP6

21
In rooms (room no-01,07,16,20,30,39)
Room number Distance(in meters) Strength of signal(in bps) Quality 01 2 53*10^6 Excellent 07 8 45*10^6 Excellent 16 18 28*10^4 Good 20 24 15*10^3 Good 30 32 5*10^2 Poor 39 43 2*10^2 Poor
Table 5.12 : HALL 3 AP6
5.1.7 Hall 3 AP7
In corridor
Distance(in meters) Strength of signal(in bps) Quality 0-10 53*10^6 Excellent 11-20 42*10^5 Good 21-30 25*10^3 Good 31-40 11*10^2 poor
Table 5.13 : HALL 3 AP 7
In rooms (room no- 01,07,16,20,30,39)
Room number Distance(in meters) Strength of signal(in bps) Quality 01 22 52*10^6 Good 07 8 46*10^6 Good 16 3 27*10^4 Excellent 20 21 13*10^3 Good 30 30 4*10^2 Poor 39 37 1.5*10^2 Poor
Table 5.14 : HALL 3 AP7

22
5.1.8 Hall 3 AP8
In corridor
Distance(in meters) Strength of signal(in bps) Quality 0-10 54*10^6 Excellent 11-20 4*10^5 Good 21-30 23*10^3 Good 31-40 12*10^2 Poor
Table 5.15 : HALL 3 AP8
In rooms (room no-01,07,16,20,30,39)
Room number Distance(in meters) Strength of signal(in bps) Quality 01 45 11*10^6 Poor 07 36 18*10^6 Poor 16 27 24*10^4 Good 20 17 28*10^3 Good 30 9 35*10^2 Excellent 39 2 44*10^2 Excellent
Table 5.16 : HALL 3 AP8

23
5.2 DHIRU BHAI AMBANI HALL OF RESIDENCE
5.2.1 Hall 4 AP1
In corridor
Table 5.17 : HALL 4 AP1
In rooms (room no- 82,89,98,105,113,119)
Room number Distance(in meters) Strength of signal(in bps) Quality 82 2 53*10^6 Excellent 89 8 45*10^6 Excellent 98 18 28*10^4 Good 105 24 15*10^3 Good 113 32 5*10^2 Poor 119 43 2*10^2 Poor
Table 5.18 : HALL 4 AP1
5.2.2 Hall 4 AP2
In corridor
Distance(in meters) Strength of signal(in bps) Quality 0-10 53*10^6 Excellent 11-20 42*10^5 Good 21-30 25*10^3 Good 31-40 11*10^2 Poor
Table 5.19 : HALL 4 AP2
Distance(in meters) Strength of signal(in bps) Quality 0-10 54*10^6 Excellent 11-20 4*10^5 Good 21-30 23*10^3 Good 31-40 12*10^2 Poor

24
In rooms (room no- 82,89,98,105,113,119)
Room number Distance(in meters) Strength of signal(in bps) Quality 82 22 52*10^6 Good 89 8 46*10^6 Good 98 3 27*10^4 Excellent 105 21 13*10^3 Good 113 30 4*10^2 Poor 119 37 1.5*10^2 Poor
Table 5.20 : HALL 4 AP2
5.2.3 Hall 4 AP3
In corridor
Distance(in meters) Strength of signal(in bps) Quality 0-10 53*10^6 Excellent 11-20 42*10^5 Good 21-30 25*10^3 Good 31-40 11*10^2 Poor
Table 5.21 : HALL 4 AP3
In rooms (room no- 82,89,98,105,113,119)
Room number Distance(in meters) Strength of signal(in bps) Quality 82 43 52*10^6 Excellent 89 32 46*10^6 Good 98 24 27*10^4 Good 105 19 13*10^3 Good 113 8 4*10^2 Poor 119 3 1.5*10^2 Poor
Table 5.22 : HALL 4 AP3
5.2.4 Hall 4 AP4
In corridor
Distance(in meters) Strength of signal(in bps) Quality 0-10 53*10^6 Excellent 11-20 42*10^5 Good 21-30 25*10^3 Good 31-40 11*10^2 Poor
Table 5.23 : HALL 4 AP4

25
In rooms (room no- 42,51,60,68,71,79)
Room number Distance(in meters) Strength of signal(in bps) Quality 42 2 52*10^6 Excellent 51 8 46*10^6 Excellent 60 18 27*10^4 Good 68 25 13*10^3 Good 71 32 4*10^2 Poor 79 43 1.5*10^2 Poor
Table 5.24 : HALL 4 AP4
5.2.5 Hall 4 AP5
In corridor
Distance(in meters) Strength of signal(in bps) Quality 0-10 53*10^6 Excellent 11-20 42*10^5 Good 21-30 25*10^3 Good 31-40 11*10^2 Poor
Table 5.25 : HALL 4 AP5
In rooms (room no- 42,51,60,68,71,79)
Room number Distance(in meters) Strength of signal(in bps) Quality 42 42 52*10^6 Excellent 51 33 46*10^6 Good 60 27 27*10^4 Good 68 19 13*10^3 Good 71 08 4*10^2 Poor 79 04 1.5*10^2 Poor
Table 5.26 : HALL 4 AP5
5.2.6 Hall 4 AP6
In corridor
Distance(in meters) Strength of signal(in bps) Quality 0-10 54*10^6 Excellent 11-20 4*10^5 Good 21-30 23*10^3 Good 31-40 12*10^2 Poor
Table 5.27 : HALL 4 AP6
26
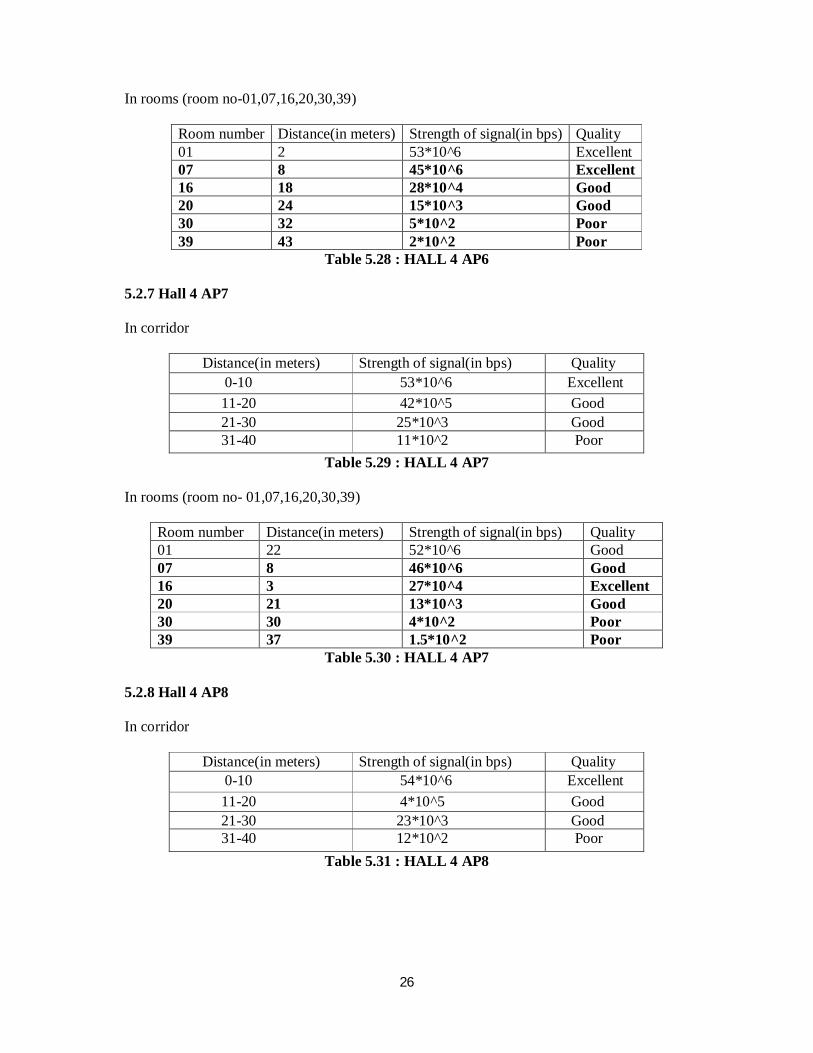
In rooms (room no-01,07,16,20,30,39)
Room number Distance(in meters) Strength of signal(in bps) Quality 01 2 53*10^6 Excellent 07 8 45*10^6 Excellent 16 18 28*10^4 Good 20 24 15*10^3 Good 30 32 5*10^2 Poor 39 43 2*10^2 Poor
Table 5.28 : HALL 4 AP6
5.2.7 Hall 4 AP7
In corridor
Distance(in meters) Strength of signal(in bps) Quality 0-10 53*10^6 Excellent 11-20 42*10^5 Good 21-30 25*10^3 Good 31-40 11*10^2 Poor
Table 5.29 : HALL 4 AP7
In rooms (room no- 01,07,16,20,30,39)
Room number Distance(in meters) Strength of signal(in bps) Quality 01 22 52*10^6 Good 07 8 46*10^6 Good 16 3 27*10^4 Excellent 20 21 13*10^3 Good 30 30 4*10^2 Poor 39 37 1.5*10^2 Poor
Table 5.30 : HALL 4 AP7
5.2.8 Hall 4 AP8
In corridor
Distance(in meters) Strength of signal(in bps) Quality 0-10 54*10^6 Excellent 11-20 4*10^5 Good 21-30 23*10^3 Good 31-40 12*10^2 Poor
Table 5.31 : HALL 4 AP8
27
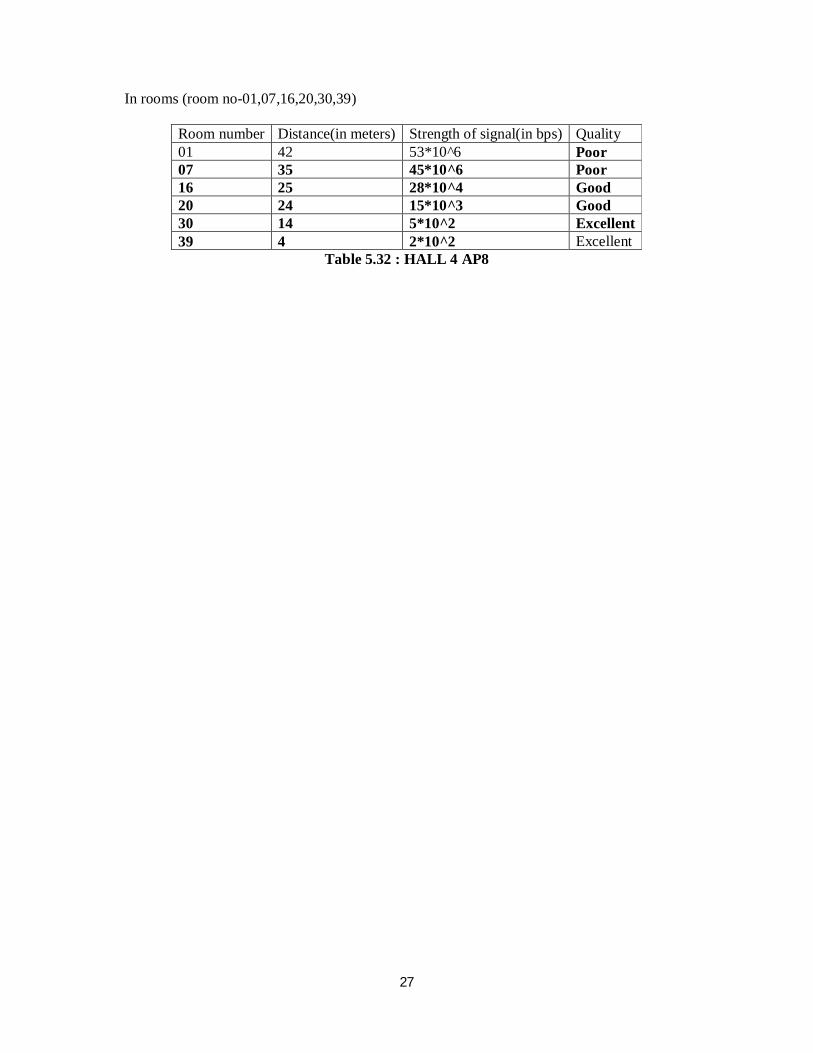
In rooms (room no-01,07,16,20,30,39)
Room number Distance(in meters) Strength of signal(in bps) Quality 01 42 53*10^6 Poor 07 35 45*10^6 Poor 16 25 28*10^4 Good 20 24 15*10^3 Good 30 14 5*10^2 Excellent 39 4 2*10^2 Excellent
Table 5.32 : HALL 4 AP8
28
CHAPTER- 6
CONCLUSION The main goal with this thesis is survey the performance of the Wi-Fi signal strength. The
project intends to utilize the popular WLAN equipments and design a location system that
would work effectively in indoor environments Wi-Fi Location System is capable of
identifying position of the device in relation to the indoor environment, using signal
information of surrounding access points.
The performance determines the potential commercial services that can utilize. The accuracy
is also influenced by the number of access points, which cover the particular area. In areas
covered by access points, accuracy less or equal to 35 meters can be achieved with a
reasonable level of precision. In areas with only one access point, the corresponding accuracy
is degraded to up to 40 meters. The results also indicate that a higher degree of accuracy is
achieved still more comprehensive testing is needed in order to verify that a particular service
currently can work well with the Wi-Fi.
29
References [1] Corporation. Whitepaper: Understanding Wi-Fi and Wimax as metroaccess
solutions, 2004.
[2] http ://en.wikipedia.org/wiki/NetStumbler
[3] http:// h50146.www5.hp.com/products/networks/procurve/pdfs/59906005_e1.pd
[4] Cisco Systems Inc. Wi-Fi location-based services - design and deployment
considerations *. White Paper. Available from http://www.cisco.com.
[5] Wireless Trondheim. The Wireless Trondheim website (online). Web Site.
Available from http://www.wirelesstrondheim.no/. Last visited May 3rd
[6] 2007.
[7] Cisco Systems Inc. Evolution of municipal wireless networks *. White Paper.
Available from http://www.cisco.com.
[8] Jeffrey Hightower and Gaetano Borriella. Location systems for ubiquitous
computing. IEEE Computer, 34(8):57–66, 2001
[9] Intel Corporation. Whitepaper: Understanding wi-fi and wimax as metroaccess
solutions, 2004
[10] Henrik Ljøgodt Moen” A Study of Wi-Fi RFID Tags in Citywide
Wireless Networks”. Norwegian University of Science and Technology
June 2007
[11] AMALINA ABDUL HALIM “WIFI POSITIONING SYSTEM” MARA
UNIVERSITY OF TEKNOLOGY SHAH ALAM MAY 2006.