Embed Size (px)
Citation preview
Webtrends Analytics Reports User’s
Guide
Fall 2010 Edition | © 2010 Webtrends Inc.

Fall 2010 Release
ii
Send Feedback
Disclaimer
This document and the software, subscription service and/or technology described in this document are
furnished under and are subject to the terms of a separate license agreement, a subscription service agreement
or a services agreement.
EXCEPT AS EXPRESSLY SET FORTH IN A LICENSE AGREEMENT, SUBSCRIPTION SERVICE AGREEMENT OR A SERVICES AGREEMENT, WEBTRENDS INC. PROVIDES THIS DOCUMENT "AS IS" WITHOUT WARRANTY OF ANY KIND, EITHER EXPRESS OR IMPLIED, INCLUDING, BUT NOT LIMITED TO, THE IMPLIED WARRANTIES OF MERCHANTABILITY OR FITNESS FOR A PARTICULAR PURPOSE. NO RIGHTS OF ANY KIND ARE GRANTED TO YOU IN THE SOFTWARE, SUBSCRIPTION SERVICE AND/OR TECHNOLOGY DESCRIBED IN THIS DOCUMENT,
UNLESS SUCH RIGHT HAS BEEN GRANTED TO YOU UNDER A SEPARATE LICENSE
AGREEMENT, SUBSCRIPTION SERVICE AGREEMENT OR SERICES AGREEMENT.
You agree that you shall not loan, sell, or otherwise transfer this document.
Except as expressly set forth in a license agreement, subscription service agreement or services agreement, you
agree that you shall not reproduce, store in a retrieval system, provide access to or transmit in any form or by
any means, electronic, mechanical, or otherwise, all or any part of this document or the software, subscription
service and/or technology described in this document. Some companies, names, and data in this document are
used for illustration purposes and do not represent real companies, individuals, or data.
This document may include technical inaccuracies or typographical errors. Webtrends Inc. may make
improvements in or changes to the software, subscription service and/or technology described in this document
at any time without notice.
© 1996-2011 Webtrends Inc. All rights reserved.
U.S. Government Restricted Rights: The software is "commercial software." If the software and documentation
are being acquired by or on behalf of the U.S. Government or by a U.S. Government prime contractor or
subcontractor (at any tier), in accordance with 48 C.F.R. 227.7202-4 (for Department of Defense (DOD)
acquisitions) and 48 C.F.R. 2.101 and 12.212 (for non-DOD acquisitions), the government's rights in the
software and documentation, including its rights to use, modify, reproduce, release, perform, display or disclose
the software or documentation, will be subject in all respects to the commercial license rights and restrictions
provided in the license agreement. Government technical data and software rights related to the service include
only those rights customarily provided to the public as defined in this Agreement. This customary commercial
license is provided in accordance with FAR 12.211 (Technical Data) and FAR 12.212 (Software) and, for
Department of Defense transactions, DFAR 252.227-7015 (Technical Data - Commercial Items) and DFAR
227.7202-3 (Rights in Commercial Computer Software or Computer Software Documentation).
Trademarks
Webtrends, Webtrends logo, Webtrends Visitor Intelligence, Webtrends Visitor Intelligence logo, Score, Score logo, Analytics, Analytics logo, Ad Director, Ad Director logo, Marketing Warehouse, Marketing
Warehouse logo, Visitor Data Mart, Visitor Data Mart logo, Explore, Explore logo, Optimize, Optimize logo,
Social Measurement, Social Measurement logo, Segments, Segments logo, and Open Exchange are trademarks
or registered trademarks of Webtrends Inc. or its subsidiaries in the United States and other jurisdictions. All
other company and product names may be trademarks or registered trademarks of their respective companies.
© 1996-2010 Webtrends Inc. All rights reserved.

Fall 2010 Release
iii
Send Feedback
Contact Information
Sales and General Support and Services Online Resources
Webtrends, Inc. 851 SW 6th Ave. Suite 1600 Portland OR 97204 Phone: 1-503-294-7025
Fax: 1-503-294-7130
US Toll Free: 1-877-Webtrends (1-
877-932-8736) Email: [email protected]
Direct Technical Support:
North America and
Caribbean: 1-503-223-3023 Central and South America: 1-
503-223-3023 Asia Pacific, Australia, New
Zealand: 1-503-223-3023 Europe, Middle East, Africa:
+44 (0) 1784-463-555
Webtrends Home Page:
http://www.Webtrends.com
Webtrends Support Center:
http://www.Webtrends.com/support Webtrends Professional Services (Consulting and Training):
http://www.Webtrends.com/
services Online Customer Center:
http://www.Webtrends.com/
resources

Fall 2010 Release
i
v Send Feedback
About This Book and the Library
This guide provides users who primarily use Webtrends Analytics Reports with the information they need to
navigate, customize, save, and export reports and report data
Intended Audience
This book provides information for Webtrends users who interact with Webtrends Analytics Reports.
Webtrends administrators can find additional information about Webtrends Analytics report configuration,
exports, and troubleshooting in the Webtrends Administration User’s Guide.
Other Information in the Library
The library provides the following information resources:
Help Provides context-sensitive information and step-by-step guidance for common tasks, as well as definitions
for each field on each window.
Webtrends Administration User's Guide This guide provides complete information for using Webtrends Administration to set up and customize core
operations such as data collection, analysis, report content and style, and visitor session tracking. It
includes conceptual and procedural information about features such as custom reports, data filtering,
scenario analysis, and Express Analysis; assistance with common administrative concerns such as job
scheduling and table limiting; and reference information such as the Webtrends Query Parameter
Reference.
Webtrends Analytics Reports User’s Guide This guide provides users who primarily use Webtrends Analytics Reports with the information they need to
navigate, customize, save, and export reports and report data.
Note
Users who only have View Reports permissions automatically use Webtrends Analytics Reports
instead of Webtrends Administration. While they can view the reports, they may not have access
to any of the other controls. We recommend distributing the Webtrends Analytics Reports User’s
Guide to these users as a introduction to navigating Webtrends reports and report data.
Webtrends Marketing Warehouse Software User's Guide
This guide includes information about using Webtrends Marketing Warehouse for ad hoc data analysis,
using Webtrends Explore to analyze web business events by segment, and using Webtrends Score to
identify qualified users based on their web site actions. Webtrends administrators can also find information
about installing, implementing and using Webtrends Marketing Warehouse.
Webtrends Visitor Data Mart On Demand User's Guide (Formerly Webtrends Marketing
Warehouse On Demand User’s Guide) This guide includes information about using Webtrends Visitor Intelligence for ad hoc data analysis, using
Webtrends Explore to analyze web business events by segment, and using Webtrends Score to identify
qualified users based on their web site actions. It also provides a detailed reference to Visitor Intelligence
report data. Webtrends administrators can also find information about implementing and using Webtrends
Marketing Warehouse.

Fall 2010 Release
v
Send Feedback
Webtrends Analytics Software Implementation and Maintenance Guide A step-by-step guide for administrators who are responsible for installing, setting up and maintaining
Webtrends Analytics Software. It includes information about licensing, JavaScript tagging, profile setup,
security, cookie implementation, performance tuning, and system backups. It also includes the Webtrends
Query Parameter Reference.
Webtrends Analytics On Demand Implementation Guide A step-by-step guide for administrators who are responsible for implementing Webtrends Analytics On
Demand. It includes information about licensing, JavaScript tagging, and profile setup. It also includes the
Webtrends Query Parameter Reference.
Webtrends SmartSource Data Collector User's Guide This guide provides instructions for installing, configuring, and maintaining Webtrends SmartSource Data
Collector, including information about client- and server-side JavaScript tags and cookie tracking.
Webtrends SmartView User’s Guide A guide to installing and using SmartView and configuring Webtrends to work effectively with SmartView
reporting.
Webtrends SmartReports User's Guide A guide to using Webtrends SmartReports with Webtrends Analytics reporting for powerful data integration
and analysis in the Microsoft Excel environment.
Webtrends Visitor Data Mart Schema Reference (formerly Webtrends Marketing Warehouse
Schema Reference) Provides an overview of the Marketing Warehouse databases for experienced database administrators. This
guide helps you understand the data in the Marketing Warehouse, giving you the foundation you need to
use the data productively. It provides instructions for populating the Marketing Warehouse databases using
Webtrends Administration and for viewing the data once it is available. It also describes how the databases
are constructed and how that affects the function of the different types of data.
Webtrends Programmer's Reference This guide provides conceptual, procedural, and referential information that allows experienced
programmers to customize Webtrends data collection and reporting. It provides instructions for using the
Webtrends ODBC Driver to query both the Marketing Warehouse and the Webtrends Analytics Report
databases. It also includes documentation for the Active X, C, and Post Plug-Ins that can communicate with
Webtrends Analytics.
Webtrends Guide to Web Analytics This guide provides an introductory conceptual overview of web analytics, supplemented with examples,
graphics, and practical worksheets to help you understand Webtrends architecture and create a strategy for
customizing Webtrends Analytics for your key business metrics. Topics covered in this guide include
collecting web activity data, understanding visitor behavior, filtering and analyzing your data, measuring
acquisition, conversion, and retention, and integrating web analytics data with other business data.
Providing Feedback
Your comments are very important to us. Please take the time to let us know about your Webtrends
experience by doing one of the following:
• Click Customer Center in the upper right corner of the Webtrends banner. Then click Contact Us and
click Submit Product Feedback in the right pane.
• From Webtrends Analytics Reports, click Help > Feedback from the upper right corner of the report.
The Feedback page of the Webtrends web site opens in a new browser window. You can use it to report a
bug, request a feature, or give general feedback about your user experience.
Fall 2010 Release
v
i Send Feedback
Documentation Center
The Webtrends Documentation Center brings together a variety of materials and references to help you learn
to use Webtrends products more effectively. To access the Documentation Center, go to webtrends.com,
click Support, then click Product Documentation (under Documentation and Downloads).
Conventions
The library uses consistent conventions to help you identify items throughout the documentation. The
following table summarizes these conventions.
Convention Use
Bold • Window and menu items
• Technical terms, when introduced
Italics • Book and CD-ROM titles
• Variable names and values
• Emphasized words
Lucida Console • File and folder names
• Commands and code examples
• Text you must type
• Text (output) displayed in the command-line
interface
Table of Contents
Chapter 1
Understanding Analytics Reports
What Is a Report? ...................................................................................................................................1
What Is a Dashboard? .....................................................................................................................1 What
Is a Performance Dashboard? ................................................................................................2
What Is a Drilldown Report? ..........................................................................................................2
Navigating Reports .............................................................................................................................................3
Selecting a Report .........................................................................................................................................4 Selecting Dates Using the Calendar .............................................................................................................4
Understanding Profiles and Templates ...............................................................................................................6
How Often Are Reports Generated? ...................................................................................................................6
Who Can View Reports? .....................................................................................................................................6
Exporting Reports ...............................................................................................................................................7
Export Formats .............................................................................................................................................7 Distributing Exported Reports ......................................................................................................................7 Exporting Report Customizations.................................................................................................................8
Fall 2010 Release
vi
i Send Feedback
One-Time Report Exports ............................................................................................................................ 8 Scheduled Exports ....................................................................................................................................... 9 Managing Scheduled Exports ...................................................................................................................... 9 Exporting Drilldown Reports ..................................................................................................................... 10 Supported Export Formats for Localized Reports ..................................................................................... 10 Exporting to Western European Languages ............................................................................................... 11 Exporting to Asian Languages ................................................................................................................... 11
Using Bookmarks ............................................................................................................................................. 11
Creating a Bookmark ................................................................................................................................. 11 Updating a Bookmark ................................................................................................................................ 12
Accessing Reports from a Direct Link ............................................................................................................. 12
Parameters Recognized by Direct Report Access ............................................................................................ 13
Using Report Queries ....................................................................................................................................... 14
Creating a Report Query ............................................................................................................................ 14 Tips for Creating Queries ........................................................................................................................... 15 Querying 2-Dimensional and Drilldown Reports ...................................................................................... 15 Query Examples ......................................................................................................................................... 17
Using Calculated Measures in Analytics Reports ............................................................................................ 18
Adding a Calculated Measure to an Existing or Bookmarked Report ............................................................. 18
Finding Related Reports ................................................................................................................................... 18
Changing Report Display Preferences ............................................................................................................. 19
Changing the Language of a Report .......................................................................................................... 19 Changing Regional Number Display ......................................................................................................... 20 Changing Graph Display ............................................................................................................................ 20 Changing Table Display ............................................................................................................................ 20 Showing and Hiding Help Cards ............................................................................................................... 21 Changing Your Start Page ......................................................................................................................... 21 “Tearing Out” a Report .............................................................................................................................. 21
Troubleshooting ............................................................................................................................................... 21
Problems Viewing Reports ........................................................................................................................ 21 Problems Viewing the Correct Reports ..................................................................................................... 21 Problems with Missing Report Data .......................................................................................................... 22 Problems Viewing Scenario Analysis Reports .......................................................................................... 22 Problems Exporting Reports ...................................................................................................................... 22
Document Revision History ............................................................................................................................. 23
Index ................................................................................................................................................................. 25

Fall 2010 Release
viii
Send Feedback
Understanding Analytics Reports
You can use this chapter to understand common concepts and tasks associated with using Webtrends
Analytics Reports.
What Is a Report?
In Analytics Reports, a report generally includes a table and one or more graphs. The tables present the
information in the form of dimension and measures.
Reports provide meaningful information about web activity data, and from these reports you can make
informed decisions. Some reports can help you determine whether your web site or a part of your web site
is meeting its objective. Other reports can pinpoint whether or not an ad campaign has succeeded in
bringing new visitors to your web site. There are many kinds of reports that can provide a variety of
meaningful information.
Types of reports include dashboards, performance dashboards, two-dimensional reports, and drilldown
reports.
• For more information about dashboards, see “What Is a Dashboard?” on page 1.
• For more information about Performance Dashboards, see “What Is a Performance Dashboard?” on
page 2.
• For more information about drilldown reports, see “What Is a Drilldown Report?” on page 2.
What Is a Dashboard?
A dashboard is a specialized report that consists of a collection of thumbnails of many different reports,
providing a visual summary of the most significant information for that template over a particular time
range. You can click the title of a thumbnail in the dashboard to view more complete information.
Each dashboard provides a quick overview of several reports that interest you, so that you don’t have to
find and open each individual report. You can look at a dashboard and easily open it.
Chapter 1

Fall 2010 Release
Send Feedback
What Is a Report?
What Is a Performance Dashboard?
A Performance Dashboard is a specialized report that allows you to evaluate your progress in meeting
marketing goals, and explore the key factors that can help you meet those goals. For example, you can use
the Key Metrics Performance Dashboard to investigate Marketing performance for your web site. With
this Performance Dashboard, you can change the selected measures on the Key Metrics tab to see
different data in the graph. You can also use the Goals tab to set goals for a time period. Use the What
If? tab to determine the effect of changes to site conversion and visitor statistics on other measures
including revenue.
What Is a Drilldown Report?
Drilldown reports show information in a hierarchy so you can navigate from a highly summarized level of
data to access specific information in depth. For example, the Campaigns drilldown report allows you to
view overview data at the level of campaign type, drill down into specific campaigns, offers, and creatives,
and isolate data at a specific level.


Understanding Analytics Reports
Fall 2010 Release
3
Send Feedback
Navigating Reports
Navigating Reports The following graphic shows the main areas of Analytics Reports:
Navigating Reports
The following table describes each numbered area.
# Description
1 Calendar
2 Table of Contents
3 Bookmarks area
4 Profiles menu
Understanding Analytics Reports
Fall 2010 Release
4
Send Feedback
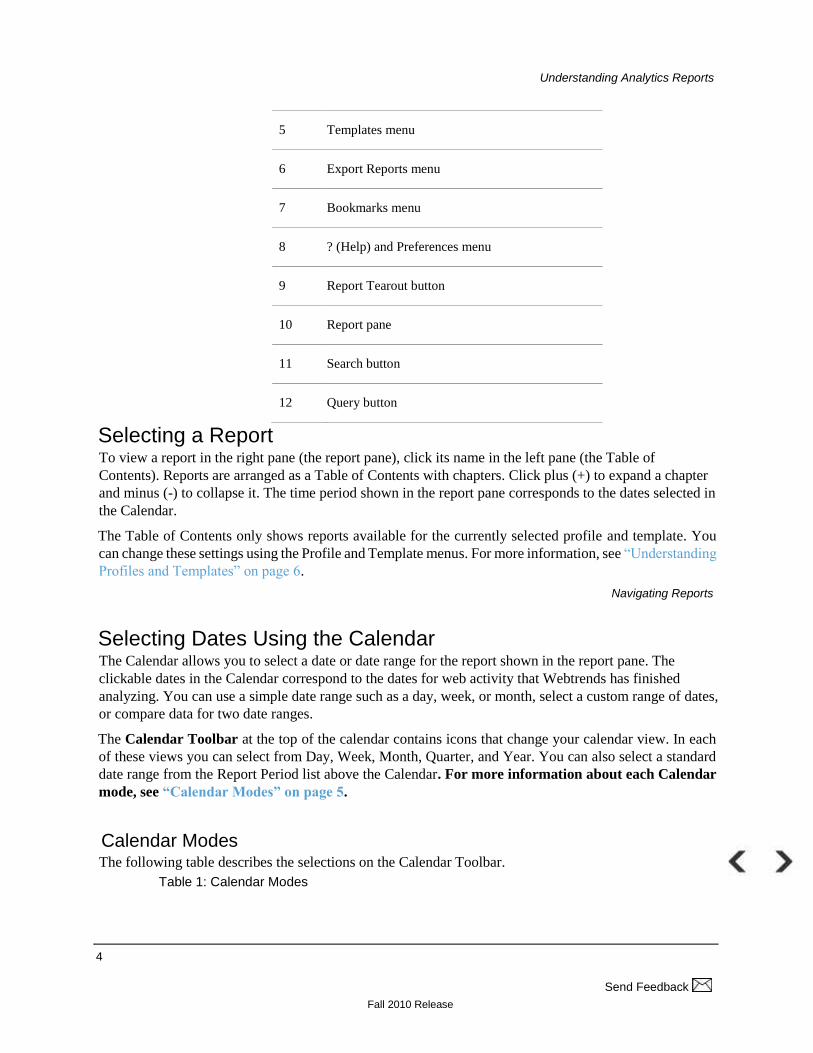
5 Templates menu
6 Export Reports menu
7 Bookmarks menu
8 ? (Help) and Preferences menu
9 Report Tearout button
10 Report pane
11 Search button
12 Query button
Selecting a Report To view a report in the right pane (the report pane), click its name in the left pane (the Table of
Contents). Reports are arranged as a Table of Contents with chapters. Click plus (+) to expand a chapter
and minus (-) to collapse it. The time period shown in the report pane corresponds to the dates selected in
the Calendar.
The Table of Contents only shows reports available for the currently selected profile and template. You
can change these settings using the Profile and Template menus. For more information, see “Understanding
Profiles and Templates” on page 6.
Navigating Reports
Selecting Dates Using the Calendar The Calendar allows you to select a date or date range for the report shown in the report pane. The
clickable dates in the Calendar correspond to the dates for web activity that Webtrends has finished
analyzing. You can use a simple date range such as a day, week, or month, select a custom range of dates,
or compare data for two date ranges.
The Calendar Toolbar at the top of the calendar contains icons that change your calendar view. In each
of these views you can select from Day, Week, Month, Quarter, and Year. You can also select a standard
date range from the Report Period list above the Calendar. For more information about each Calendar
mode, see “Calendar Modes” on page 5.
Calendar Modes The following table describes the selections on the Calendar Toolbar.
Table 1: Calendar Modes

Understanding Analytics Reports
Fall 2010 Release
5
Send Feedback
Icon Function Description
Main Calendar View Displays the current calendar for the specified profile. By
default the calendar opens highlighting the day for which
analysis was most recently completed. If analysis was
done for a week/month/quarter, then that most recent
week/month/quarter is highlighted.
Calendar Compare View
Allows you to select periods of time on two calendars, so
that you can compare the resulting data. Note that if you
adjust the range for one calendar, the range for the other
calendar adjusts automatically
Custom Calendar View
Allows you to specify time periods other than the
standard day, week, month, and year. For example,
instead of specifying the standard 7-day week, you can
specify a range of 9 days. Or you can select an extended
block of weeks from one month to the other.
Custom Calendar
Compare View Allows you to compare time periods other than the
standard day, week, month, and year. Note that if you
adjust the range for one calendar, the range for the other
calendar adjusts automatically.
Zoom Out/Zoom In
Allows you to adjust the detailed view of your calendar.
For example, you can zoom out to a quarterly or yearly
view and zoom in to a daily view.
Understanding Profiles and Templates
Table 1: Calendar Modes
Icon Function Description
Transpose Comparison In Calendar Compare or Custom Calendar Compare view,
allows you to flip the order in which the calendars are
displayed.
Calendar Limitations The calendar has the following limitations:
Understanding Analytics Reports
Fall 2010 Release
6
Send Feedback
• You cannot use comparison mode for comparing dashboards.
• You cannot compare two unequal date ranges.
Understanding Profiles and Templates Profiles and templates are definitions created in Webtrends Administration that determine the reports and
report data report users can see. A profile determines the source of web activity data for a group of
reports. A template determines the subset of reports that are accessible for a specific profile. Templates
can provide smaller, focused report sets that target specific performance areas or user needs. A single
profile can have multiple templates associated with it. You can change the profile and the template from
within Analytics Reports to access a different selection of reports and report data.
The reports that are available for your viewing have been requested by the Administrator or Report
Manager who configures the profile with the anticipated reports of interest for Report Users (such as
yourself), and assigns your user permission to view these reports.
If a particular dashboard or report is not available, it is either one that you have not been granted access to
view, or the administrator did not configure the profile to prepare the report during analysis. In either case,
you will want to contact your account administrator to desired reports.
The profiles and templates you can select are determined by your user rights in Webtrends Administration.
If you cannot see the reports, profiles, or templates you need in the Profile and Template menus, contact
your Webtrends administrator.
To see the location of the Profile and Template menus in Analytics Reports, see “Navigating Reports” on
page 3.
How Often Are Reports Generated? Reports are generated after Webtrends analyzes your web activity data. If you have just started using
Webtrends, you may have to wait up to 24 hours to view your first reports, because Webtrends typically
analyzes a day’s worth of web activity.
Analysis occurs on a schedule that is set by a Webtrends administrator. If you know that traffic has
occurred on your web site, and you cannot access reports or you do not see the data you expected, you
should contact your administrator.
Who Can View Reports?
For more information, see “Troubleshooting” on page 21.
Who Can View Reports?
Rights to Webtrends Analytics reports are set in Webtrends Administration. Webtrends administrators
can grant rights to all reports or only to specific profiles and templates.

Understanding Analytics Reports
Fall 2010 Release
7
Send Feedback
If you need to share reports with users who do not have rights to use the Analytics Reports interface, you
can export data into a different format such as a Microsoft Word file, an Excel spreadsheet, or a PDF file.
For more information, see “Exporting Reports” on page 7.
You can also send a user a direct link to a report in the Analytics Reports interface. For more information,
see “Accessing Reports from a Direct Link” on page 12. To access a report using Direct Report Access,
the user needs to have a Webtrends user account and have rights to the profile and template associated
with the report.
Exporting Reports If you need to use the data in Webtrends Analytics Reports outside the Analytics Reports interface, you
can export the data into another format. Exporting reports allows you to share report data with users who
do not have a Webtrends user account and include it in different kinds of documents and presentations.
You can export a report once to capture the current state of data, or you can schedule a recurring export
that sends updated data in a specified format to a location you specify. For more information, see “One-
Time Report Exports” on page 8 and “Scheduled Exports” on page 9.
As part of the export process, you need to install the Webtrends Report Exporter on your local computer.
The Webtrends Report Exporter converts your report to the output format you specify.
For the location of the Export Reports menu that allows you to export reports, see “Navigating Reports”
on page 3.
Export Formats You can export reports to the following formats:
• Microsoft Word
• Adobe PDF
• Comma-separated value (CSV)
• Database
Database exports are used as the basis for Webtrends SmartReports, a database-driven, dynamically
updatable report format based on Microsoft Excel technology. You cannot export dashboards to database
format. For more information, download the SmartReports User’s Guide from the Customer Center.
Distributing Exported Reports You can distribute reports by saving them to a file, sending them as an email attachment, or transferring
them using FTP.
Exporting Reports
Email is available as a distribution option for reports only when a Webtrends administrator provides
server information in Webtrends Administration. To enable this options, contact your Webtrends
administrator.

Understanding Analytics Reports
Fall 2010 Release
8
Send Feedback
Exporting Report Customizations When you export a report, the following settings are preserved as they are displayed in the report you are
exporting:
• Selected date range
• Selected report measures
• Column sorting
• Graph style
• Graph and table maximize/minimize settings
• Scenario Funnel view
• Query or search results
One-Time Report Exports You can export the report you are currently viewing in any of the supported formats for the type of report
you are viewing. One-time exports capture the current data you are viewing and allow you to save it, share
it, or incorporate it into a different presentation.
To export the report you are viewing:
1. Make sure your report includes the selections you want to export, including graph configurations,
searches, and queries. For more information, see “Exporting Report Customizations” on page 8.
2. Click the Export Reports menu and select a report export format.
3. In the Export Report dialog, provide information about the delivery method, destination, and the
number of reports and data rows you want to export. For more information, see the Help.
4. Enter the destination file name.
When saving a report export to a file, you can dynamically name files based on standard date macros. To
append the file name dynamically with the desired date indicator, add the date macro to the end of the file
name as shown below (date macros must be wrapped by %. The date macros that are available include:
−%yyyy% = {YEAR}
−%mm% = {MONTH}
−%dd% = {DAY}
−%hour% = {HOUR}
−%minute% = {MINUTE}
−%second% = {SECOND} Example:
c:\reports\TopPages_ExportedOn_%yyyy%-%mm%-%dd%-%hour%-%minute%.pdf Exporting Reports

Understanding Analytics Reports
Fall 2010 Release
9
Send Feedback
5. Click Export Now. If you are exporting a report for the first time, Analytics Reports prompts you to
download the Report Exporter.
Scheduled Exports You can create an export schedule in Analytics Reports to deliver an exported report in the format you
prefer. Scheduling exports allows you to provide updated data regularly without interacting with
Webtrends Analytics Reports. For example, you can schedule a weekly report to be saved to a public
directory or email it to one or more email addresses every week at the same time. If you scheduled data to
be exported to an MDB database, you can use Webtrends SmartReports to pull the latest data into a
presentation on demand.
The scheduled exports you create in Analytics Reports become Scheduled Reports that can be tracked
and modified in the Scheduler in Webtrends Administration. Later changes to scheduled report settings
can be made in either location. To schedule an export:
1. Make sure your report includes the selections you want to export, including graph configurations,
searches, and queries. For more information, see “Exporting Report Customizations” on page 8.
2. On the Export Reports menu, click Schedule Export.
3. In the Export Report dialog, provide information about the delivery method, destination, and the
number of reports and data rows you want to export. Click Next. For more information, see the Help.
If you need to send reports using email or FTP and those options are not available in the Delivery
Method menu, contact your Webtrends administrator.
4. In the Time Range dialog, specify whether to export a standard or comparative report and the time
range(s) for the data you want to include in the export. Not all reports support the comparative option.
Click Next.
5. In the Schedule dialog, specify when and how often you want to export the report. Click Next.
6. In the Summary dialog, review the export settings. Click Save to save the export settings or Previous
to go back and change them. Click Cancel to exit without saving your settings.
Managing Scheduled Exports If you have one or more scheduled exports assigned to you, you can view, edit, or delete them using the
Manage Scheduled Exports dialog. This dialog shows all the scheduled exports for which you have user
rights. To access the Manage Scheduled Exports dialog, click Manage Scheduled Exports on the Export
Reports menu.
If you change or delete a scheduled export using the Manage Scheduled Exports dialog, you are also
changing or deleting the scheduled report configuration in Webtrends Administration. Do not delete a
scheduled export unless you want to delete the configuration permanently.
Exporting Reports

Understanding Analytics Reports
Fall 2010 Release
1
0 Send Feedback
Exporting Drilldown Reports If you are exporting a drilldown report, be aware that Webtrends does not expand drilldown reports when
you export more than one report at a time. To export drilldown reports in expanded form, export each
drilldown report separately. Fully expanded drilldown reports can affect performance because of their large
size.
For Word, PDF, and CSV exports, you can convert all of the reports in the template or just the currently
displayed report. For SmartReports you must export one report at a time. You cannot export dashboards.
Supported Export Formats for Localized Reports You can export localized versions of Webtrends reports to other formats. The following table shows
which export formats are supported for operating systems in different languages.
Table 2: Export Formats for Localized Reports
Language/Operating System Microsoft
Word
Database (SmartReports) or CSV PDF
Western European language/ Western European language OS
Yes Yes Yes
Western European language/
Asian language OS
No No Yes
Asian language/ Western European language OS
No No Yes
Asian language/ Same Asian language OS
Yes Yes Yes
Asian language/ Different Asian language OS
No No Yes
UTF-8/Any OS Yes No Yes
Using Bookmarks
Note
If you select Use Unicode (UTF-8), you cannot export the report to a SmartReports database. SmartReports exports do not support UTF-8 encoding.

Understanding Analytics Reports
Fall 2010 Release
1
1 Send Feedback
Exporting to Western European Languages You can export Webtrends reports in any of the following Western European languages, just as you
would export English-language reports:
• French
• German
• Italian
• Spanish
Exporting to Asian Languages Exporting to Asian languages requires a language-compatible operating system and fonts. If you have
trouble exporting reports in Asian languages, contact your Webtrends administrator or see the Webtrends
Administration User’s Guide for detailed information about localization.
Using Bookmarks A bookmark is a shortcut that allows you to save commonly viewed reports with your preferred viewing
customizations. For example, you may typically view a report with certain graphs and tables expanded, or
you may use specific queries when you view a report. Bookmarks let you add the customized report to
the Table of Contents and display the latest data in the customized view with one click. You can reserve
bookmarks for your personal report viewing or share them with other users who can access the report
template.
Report bookmarks capture the following report customizations:
• The measure selected for each report column
• The sort order of each report column
• Which graphs, tables, and drilldown items are collapsed or expanded
• The style of graph(s) (for example, pie charts or bar graphs)
• Any search or query used to create the current report view
For more information about bookmarks, see “Creating a Bookmark” on page 11. For the location of the
Bookmarks area in Analytics Reports, see “Navigating Reports” on page 3.
Creating a Bookmark The following steps describe how to create a report bookmark or to update the settings in an existing
bookmark. Bookmarks are stored in your template settings. If you cannot find a saved bookmark, make
sure you are viewing the correct report template.
To create a bookmark:
1. Configure the report exactly as you wish to view it.

Understanding Analytics Reports
Fall 2010 Release
1
2 Send Feedback
2. Click Create Bookmark in the Table of Contents or click Bookmark This Report on the Bookmarks
menu.
Accessing Reports from a Direct Link
3. In the Bookmark Name text box, type a name for the bookmark. Webtrends uses this name to
identify the bookmark in the report Table of Contents and in the Managing Bookmarks dialog.
4. If you want to add the bookmarked view to the Table of Contents for other users who have user rights
to the current template, select the Share Bookmark check box.
5. If you want the bookmarked view to be available only in your own reports, clear the Share Bookmark
check box.
6. Click Save.
Updating a Bookmark To update a report bookmark with new view settings:
1. Open an existing bookmark.
2. Navigate to the exact report view you want to bookmark. For a list of settings you can save in a
bookmark, see “Using Bookmarks” on page 11.
3. Click Create Bookmark.
4. Click Update Current Bookmark.
5. If you want to add the bookmarked view to the Table of Contents for other users who have user rights
to the current template, select the Share Bookmark check box.
6. If you want the bookmarked view to be available only in your own reports, clear the Share
Bookmark check box.
7. Click Save.
For more information about bookmarks, see “Using Bookmarks” on page 11.
Accessing Reports from a Direct Link Direct Report Access (DRA) is a feature that gives you direct access to a Webtrends report without
further configuration, and without providing any navigational information. For example, you may want to
provide the link to a specific report in Calendar Compare mode through a portal. Using DRA, you can
construct a URL that sends users to the exact report page and dates you are currently viewing. Users who
access the report through your link have full access to the report set and can view the report interactively
by changing the calendar, language and template settings.
To use Direct Report Access to construct a direct access URL:
1. Navigate to the exact report you want users to see when they click the link, including the correct
calendar view and date range(s).

Understanding Analytics Reports
Fall 2010 Release
1
3 Send Feedback
2. On the ? menu, click Show DRA Parameters.
3. Construct the URL using the parameter values shown in the DRA Parameters dialog. When you
specify a parameter value, use the form parameter=value. For example, specify
startdate=2001.m03.d10.
4. If you are using Webtrends software, use the following syntax to create the URL:
http://host:port/wrc/bin/OnDemandWRCReport/profile?template?queryparameters Parameters Recognized by Direct Report Access
where: host is the name of the Webtrends User Interface server. port is the port used
by the Webtrends User Interface Server, such as 7099. profile is the file name of the
report profile, such as zedesco.wlp. query parameters are the parameter values
shown in the Direct Report Access dialog.
5. If you are using Webtrends On Demand, use the following syntax to create the URL:
http://ondemand.webtrends.com/quicklogin.asp?queryparameters
where query parameters are the specific parameter values to include.
Parameters Recognized by Direct Report Access You can use the following parameters to construct a Direct Report Access URL. If you want to specify a
custom date range, use the single-day format to specify the start and end days for the range. dra
Set the value of this parameter to 0 to hide the calendar and table of contents.
startdate
Specifies the beginning of a report period.
Format 1:
Day: YYYY.mMM.dDD Week: YYYY.wWW Month: YYYY.mMM Quarter: YYYY.qQQ Year: YYYY.y YYYY Example: 2004.m12.d14
Format 2:
Day: YYYY.mMM.dDD
Use this format to specify a custom date range.
enddate
Specifies the end of a report period.
Format:
Day: YYYY.mMM.dDD
Understanding Analytics Reports
Fall 2010 Release
1
4 Send Feedback
Use this format in conjunction with startdate to specify a custom date range such as Monday through
Friday.
comparisonstartdate
Specifies the report period for a comparison report.
Format 1: Use this format when creating standard date range comparisons.
Day: YYYY.mMM.dDD Week: YYYY.wWW Month: YYYY.mMM Quarter: YYYY.qQQ
Using Report Queries
Year: YYYY.yYYYY
Format 2:
Use this format when creating custom date range comparisons.
Day:0 YYYY.mMM.dDD
report
Specifies the unique ID of the report you want to generate.
template
Using Report Queries Report queries allow you to precisely define the report content you want to see or export. For example,
you can combine any dimensions and measures found in a report, or choose a range of report content based
on minimum or maximum values. You can bookmark report queries for quick reference or export the
results of a query to a different format.
For more information about report queries, see “Creating a Report Query” on page 14.
Creating a Report Query The following instructions describe how to query a report.
To create a report query:
1. Click Query.
2. Drag and drop dimensions, measures, and operators into the Query window to create a search
expression. Dimensions are shown in gray. Measures are shown in tan. To specify a value, drag Value
into the Query window, double-click it, and type a value in the Enter value text box. To remove an
item from a query expression, drag the item onto the trash can or drag another item directly on top of
it to replace it.
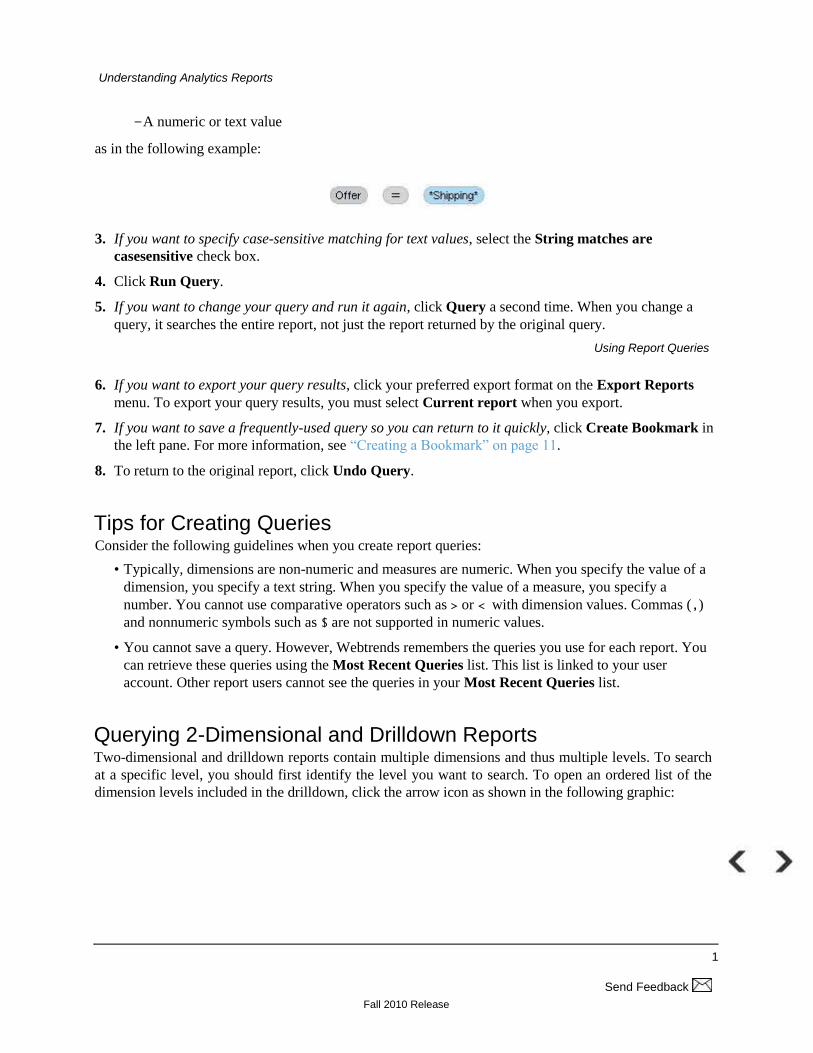
Make sure each report query consists of one or more equations. All equations include:
−A dimension or measure
−An operator such as = or >
Understanding Analytics Reports
Fall 2010 Release
1
5 Send Feedback
−A numeric or text value
as in the following example:
3. If you want to specify case-sensitive matching for text values, select the String matches are
casesensitive check box.
4. Click Run Query.
5. If you want to change your query and run it again, click Query a second time. When you change a
query, it searches the entire report, not just the report returned by the original query.
Using Report Queries
6. If you want to export your query results, click your preferred export format on the Export Reports
menu. To export your query results, you must select Current report when you export.
7. If you want to save a frequently-used query so you can return to it quickly, click Create Bookmark in
the left pane. For more information, see “Creating a Bookmark” on page 11.
8. To return to the original report, click Undo Query.
Tips for Creating Queries Consider the following guidelines when you create report queries:
• Typically, dimensions are non-numeric and measures are numeric. When you specify the value of a
dimension, you specify a text string. When you specify the value of a measure, you specify a
number. You cannot use comparative operators such as > or < with dimension values. Commas (,)
and nonnumeric symbols such as $ are not supported in numeric values.
• You cannot save a query. However, Webtrends remembers the queries you use for each report. You
can retrieve these queries using the Most Recent Queries list. This list is linked to your user
account. Other report users cannot see the queries in your Most Recent Queries list.
Querying 2-Dimensional and Drilldown Reports Two-dimensional and drilldown reports contain multiple dimensions and thus multiple levels. To search
at a specific level, you should first identify the level you want to search. To open an ordered list of the
dimension levels included in the drilldown, click the arrow icon as shown in the following graphic:

Understanding Analytics Reports
Fall 2010 Release
1
6 Send Feedback
For example, the sample Campaigns report shows Email Campaign, Portal, Advertising Partner, and
Affiliate Network at the top level. This level corresponds to Demand Channel, which is the top level
dimension in the drilldown, as well as the first dimension listed in the Dimensions and measures column
of the Query box. If you want to drill down into a specific level, you can include an expression such as
Demand Channel=Email Campaign. You can use this expression to drill down into email campaign data
by creating a query such as Demand Channel=Email Campaign AND Clickthroughs > 2000.
Using Report Queries
To search for a measure at a specific dimension level, drag a measure into the query window and
doubleclick the icon next to the measure name as shown in the following graphic:
Then select a drilldown level from the list. By default, Webtrends queries the measure at all dimension
levels. For example, if you want to see which marketing activities resulted in orders starting at a certain
dollar value, drag the Orders measure into the query window and select Marketing Program from the
list to query Orders at the Marketing Activities level as shown in the following graphic:

Understanding Analytics Reports
Fall 2010 Release
1
7 Send Feedback
Using Calculated Measures in Analytics Reports
Query Examples The following examples show how to construct report queries based on the Sample: Zedesco (with SDC
files) report. If you want to use this sample data, contact your Webtrends administrator.
Required Information Report Query
All search engines for
which the search phrase
electronics generated
more than 1000 hits
Most Recent Search Engines (All)
All cities that generated
more than 100 visits and
also generated more
than 2,000 page views
Geography
Drilldown
All marketing programs
in the Email Campaign
demand channel that
generated more than
$1,000,000 in revenue
Campaigns
All marketing activities
such as Direct Email
that resulted in more
than 150 orders
Campaigns by New and Repeat Buyers
Understanding Analytics Reports
Fall 2010 Release
1
8 Send Feedback
Using Calculated Measures in Analytics Reports In Analytics Reports, you can use calculated measures to create a formula that is shown as a column in an
analytics report table. After you define a formula in the New Calculated Measure dialog, Webtrends uses
this formula to compute values in the Calculated Measures column of any report table.
You can access the Calculated Measures dialog from existing reports and bookmarked reports in Analytics
Reports. For more information about creating a calculated measure from an existing or bookmarked report,
see “Adding a Calculated Measure to an Existing or Bookmarked Report” on page 18.
You can also add a calculated measure in new custom reports in Administration. For more information
about creating a calculated measure from a new custom report, see “Adding a Calculated Measure to a
New Custom Report” in the Webtrends Administration User’s Guide.
Adding a Calculated Measure to an Existing or Bookmarked Report
Adding a Calculated Measure to an Existing or
Bookmarked Report To create a calculated measure from existing or bookmarked reports:
1. In Analytics Reports, open an existing or bookmarked report that uses a report table.
2. In the report table, click New Custom Measure. The New Calculated Measures dialog opens.
3. Type a name for the calculated measure.
4. Select a format of currency, numeric, or percentage.
5. Select the number of decimal places for the calculated value.
6. Drag and drop a combination of measures and values to make up a formula in the right pane of the
New Calculated Measures dialog.
7. Click Apply.
Finding Related Reports Related reports navigation allows you to perform simple queries that identify similar or related data by
clicking in the report table. For example, you can narrow a report to show only rows of data equal to the
currently selected value. You can also navigate to reports with related content but a different breakdown
of information. For example, you can activate the Related Reports menu for a specific demand channel
within the Campaigns report and select Campaigns by Region to see the Campaigns by Region report
filtered to show only information for that demand channel.
To activate the Related Reports menu, click on the arrow next to a report or report dimension as shown in
the following graphic:

Understanding Analytics Reports
Fall 2010 Release
1
9 Send Feedback
Navigating through related reports is the equivalent of applying a query. To return to the original report,
click Undo Query.
Changing Report Display Preferences
Changing Report Display Preferences Webtrends Analytics Reports provides a number of settings for customizing how your reports are
displayed. For example, you can change the display language and show or hide graph, tables, and Help
card information.
Changing the Language of a Report You can change the language if your preferred language is compatible with the language specified for the
profile. Profiles can provide report data in English, French, German, Italian, Spanish, Chinese
Traditional, Chinese Simplified, Korean, or Japanese. The profile is typically configured to use a
language compatible with the encoding of your web site data. Viewing reports in each language requires
the appropriate fonts installed on your local computer.
At any time while using Analytics Reports, you can change the display language by selecting ? >
Preferences > Language from the toolbar. All items in the Analytics Reports are updated to reflect your
language choice. If your site uses the Unicode UTF-8 encoding, you can select Use Unicode (UTF-8)
from this menu.
Note
If you select Use Unicode (UTF-8), you cannot export the report to a SmartReports database.
SmartReports exports do not support UTF-8 encoding. Unicode is a character code that
defines every character in most of the speaking languages in the world.

Understanding Analytics Reports
Fall 2010 Release
2
0 Send Feedback
The default language is set in each profile’s configuration. If you have not been given rights to edit
profiles, see your Webtrends administrator. For more information, see “Troubleshooting” on page 21.
Changing Regional Number Display To change the way dates and numbers are displayed to match the conventions of a geographic region, click
Preferences > Locale on the ? menu and select a region. This setting affects how decimal numbers and
dates are displayed. The options in the Locale menu change depending on the selected report language.
Changing Report Display Preferences
Changing Graph Display You can use the Graphs selections to control how graphs are displayed in reports.
To change the graph display for your reports:
• On the ? menu, click Preferences > Graphs > Show Graphs to enable or disable graphs in reports.
Graphs in dashboards are always enabled.
• On the ? menu, click Preferences > Graphs > Minimize All Graphs to enable or disable
minimized graphs in reports. Graphs in dashboards are always maximized.
• On the ? menu, click Preferences > Graphs > Show Graph Legends to enable and disable legends
in dashboards. Legends provide a guide that explains what each graph color means. You may want
to disable legends if you need to fit more dashboard graphs on the screen.
• On the ? menu, click Preferences > Tables > Diagram Rows to set the number of paths displayed
in Path Analysis butterfly graphs.
Changing Table Display You can use the Tables preferences to control how tables are displayed in reports.
To change the table display for your reports:
• On the ? menu, click Preferences > Tables > Show Tables to enable or disable tables in reports.
• On the ? menu, click Preferences > Tables > Default Rows to set the number of first-dimension
rows in a table.
• On the ? menu, click Preferences > Tables > Default Sub-Rows to set the number of
seconddimension rows in a table for a 2-dimensional report.
• On the ? menu, click Preferences > Tables > Diagram Rows to set the number of diagram rows in
Path Analysis reports. Diagram rows show the pages users access after each entry page.
Keep in mind that displaying more rows may require more processing time.

Understanding Analytics Reports
Fall 2010 Release
2
1 Send Feedback
Showing and Hiding Help Cards The Help cards associated with each report provide information about the terms used in the report. You
can show or hide the Help cards by selecting Preferences > Show Help Cards Inline on the ? menu.
Changing Your Start Page The Start page can be customized to show a report of your choosing. To select a report as your start page,
click Set This Report As My Home Page on the Bookmarks menu. To restore the default start page,
“Home”, as your start page, click ? > Preferences > Restore Default Home Page.
If you were using a different, non-report start page that was set by a Webtrends administrator, clicking
Restore Default Home Page does not restore this start page. You can restore your original start page in
Webtrends Administration.
Troubleshooting
“Tearing Out” a Report If you want to open a report page in a separate window, if you are using more than one report and you want
to refer back to a previous report for reference, you can display the report in its own browser window
without the report Table of Contents or frame, but including any tables, graphs, and Help cards you have
enabled. The “torn out” report remains the same no matter what changes you make in the original report
window.
Troubleshooting This section describes what to do if you have problems generating, viewing, or exporting reports.
Problems Viewing Reports If you see the following message:
There are no reports available at this time.
one of the following may be true:
• If you are a Webtrends On Demand user, the SmartSource Data Collector server has not collected
enough data yet to create a report. Depending on your service agreement, data collection may take
up to 24 hours.
• Webtrends has not finished analyzing your data.
• If you are a software customer, a data source may be incorrectly configured.
Problems Viewing the Correct Reports If you were able to view reports, but you cannot see specific reports that you expected to see (such as
custom reports), try the following troubleshooting steps:

Understanding Analytics Reports
Fall 2010 Release
2
2 Send Feedback
1. Make sure the correct template is selected in the Template menu. Note that the default Complete View
template does not include all possible reports.
2. Contact your Webtrends administrator. You administrator may need to add the required reports to the
profile and template you are viewing.
Problems with Missing Report Data In certain cases you may see the reports that you expected to see, but they do not reflect the data that you
expected. This occurs because, when certain reports become very large, Webtrends Analytics limits the
number of entries in a table and rolls additional data up into summary form. For example, you may know
that certain pages on your site are receiving traffic. However, if your Pages reports have met the limit set
by your administrator, these pages may not be listed individually in the Pages report.
For more information about problems with missing data, see the Webtrends Administration User’s Guide
or contact your Webtrends administrator.
Document Revision History
Problems Viewing Scenario Analysis Reports If the funnel graph in your report (for example the Email Conversion Funnel report) is not displayed, you
may have both Java Runtime Environment v1.3 and Java Runtime Environment v1.5 installed on your
computer. If you encounter this issue, do one of the following:
• If you do not need multiple versions, uninstall all versions of the Java Runtime Environment, restart
the computer, and then reinstall the latest version. (When you first launch a Webtrends report, it will
prompt you to install the latest version of the Java Runtime Environment.)
• If you are using another application that requires Java Runtime Environment v1.3, you need to clear
the Java cache for both versions. To clear the caches, close all browsers, open the Windows Control
Panel and select each version of Java Runtime Environment to open its Java Control Panel. For Java
Runtime Environment v1.3, click the Cache tab, then click Clear JAR Cache. For Java Runtime
Environment v1.5, click Delete Files on the General tab under Temporary Internet Files.
In general, Webtrends does not recommend using Java Runtime Environment v1.3 with Webtrends
software because of its known instabilities.
Problems Exporting Reports If you have trouble exporting reports, you should check the system requirements for the Report Exporter.
If your computer meets the system requirements, you should contact a Webtrends administrator for help
with troubleshooting configuration.
Database Exports to Paths with Non-Supported Characters If you are manually exporting a report to an MDB (SmartReports) database, and the destination path
contains characters that cannot be encoded in the output character set, the startup wizard opens and you
must select the database to open. For example, this problem can occur if an English language report is
Understanding Analytics Reports
Fall 2010 Release
2
3 Send Feedback
exported on a Korean operating system to a database that contains Korean characters in the path. In this
case, the file that Microsoft Excel macros normally use to open the report automatically could not be
created, because the non-Latin characters in the path cannot be represented in the data file. In such cases,
you must manually specify the database to open, rather than have it open automatically.
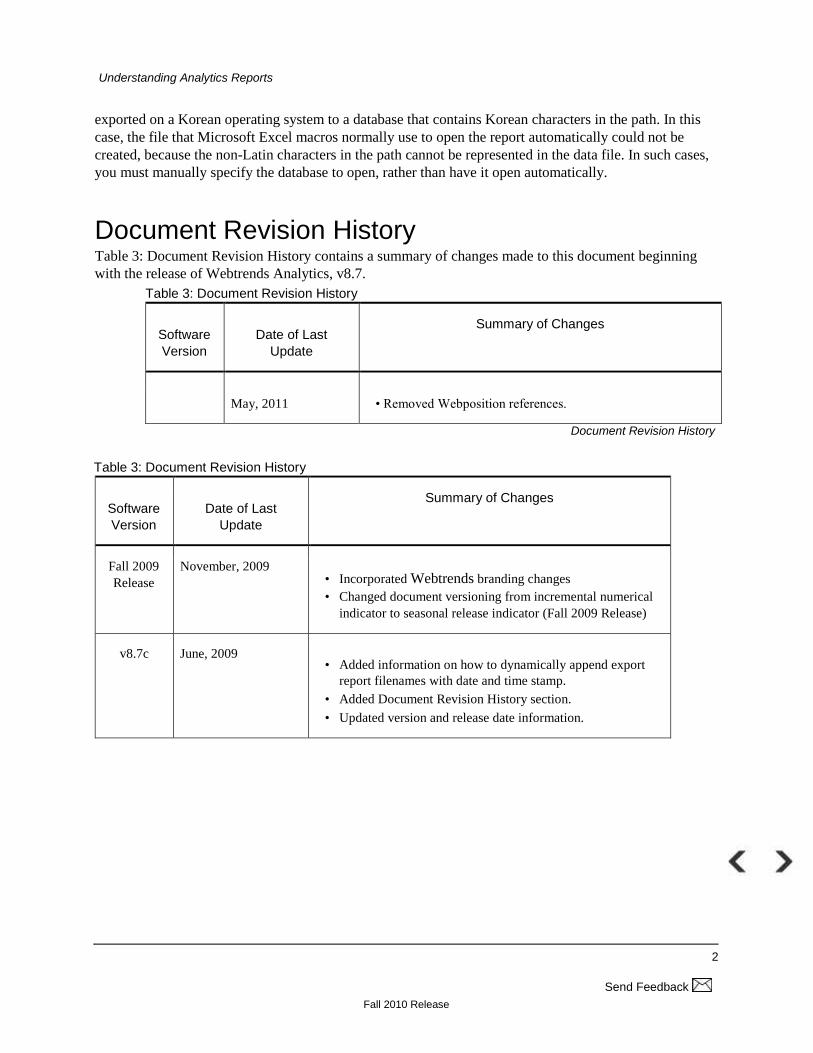
Document Revision History Table 3: Document Revision History contains a summary of changes made to this document beginning
with the release of Webtrends Analytics, v8.7.
Table 3: Document Revision History
Software
Version Date of Last
Update
Summary of Changes
May, 2011 • Removed Webposition references.
Document Revision History
Table 3: Document Revision History
Software
Version Date of Last
Update
Summary of Changes
Fall 2009
Release November, 2009
• Incorporated Webtrends branding changes
• Changed document versioning from incremental numerical
indicator to seasonal release indicator (Fall 2009 Release)
v8.7c June, 2009 • Added information on how to dynamically append export
report filenames with date and time stamp.
• Added Document Revision History section.
• Updated version and release date information.

Understanding Analytics Reports
Fall 2010 Release
2
4 Send Feedback
Document Revision History
Fall 2010 Release
Send Feedback
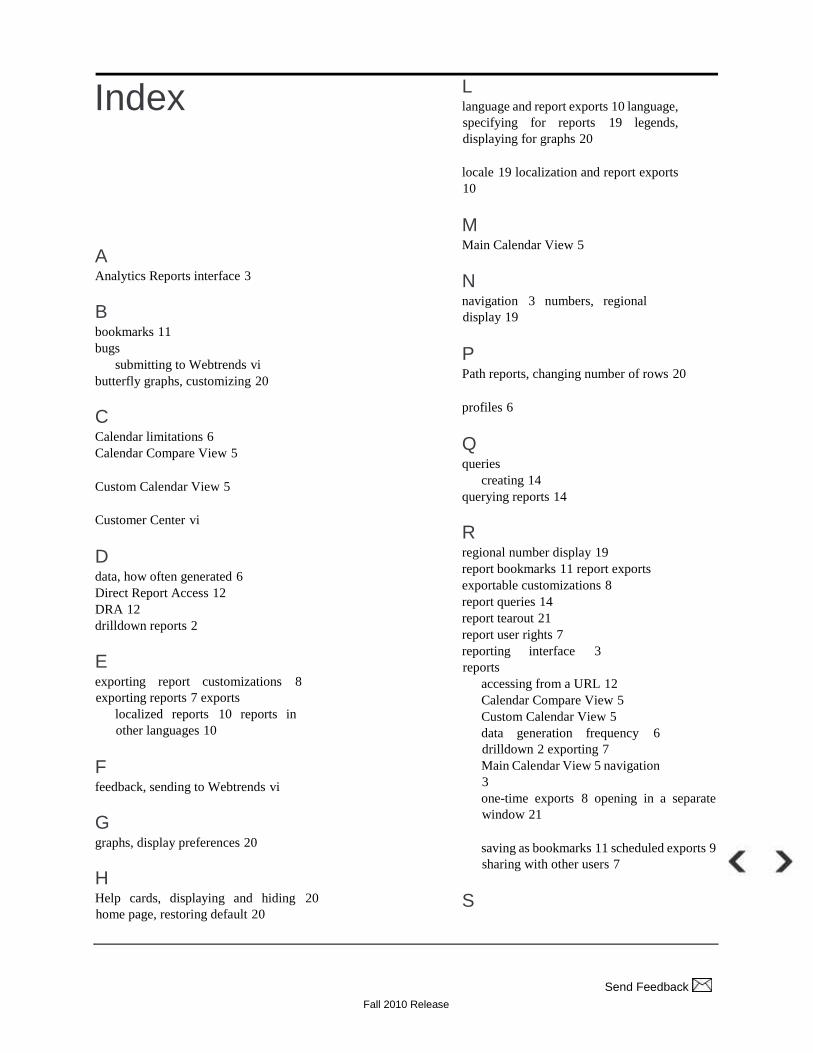
Index
A
Analytics Reports interface 3
B
bookmarks 11 bugs
submitting to Webtrends vi butterfly graphs, customizing 20
C
Calendar limitations 6 Calendar Compare View 5
Custom Calendar View 5
Customer Center vi
D
data, how often generated 6 Direct Report Access 12 DRA 12 drilldown reports 2
E
exporting report customizations 8
exporting reports 7 exports localized reports 10 reports in
other languages 10
F
feedback, sending to Webtrends vi
G
graphs, display preferences 20
H
Help cards, displaying and hiding 20
home page, restoring default 20
L
language and report exports 10 language,
specifying for reports 19 legends,
displaying for graphs 20
locale 19 localization and report exports 10
M
Main Calendar View 5
N
navigation 3 numbers, regional
display 19
P
Path reports, changing number of rows 20
profiles 6
Q
queries creating 14
querying reports 14
R
regional number display 19 report bookmarks 11 report exports exportable customizations 8 report queries 14 report tearout 21 report user rights 7 reporting interface 3
reports accessing from a URL 12 Calendar Compare View 5 Custom Calendar View 5 data generation frequency 6
drilldown 2 exporting 7 Main Calendar View 5 navigation 3 one-time exports 8 opening in a separate
window 21
saving as bookmarks 11 scheduled exports 9
sharing with other users 7
S

Fall 2010 Release
26
Send Feedback
saving modified reports 11
scheduling report exports 9 start
page, changing 20
T
tables, displaying and
hiding 20
templates 6
U
unicode 19 URLs for report
access 12 user
rights 7 UTF-8
encoding 19

Fall 2010 Release Send Feedback
27

28
Send Feedback

29
Send Feedback
Fall 2010 Release