Embed Size (px)
Citation preview

8/18/2019 Analytics Reference Adobe
http://slidepdf.com/reader/full/analytics-reference-adobe 1/332
Adobe ® Marketing Cloud
Analytics Help and Reference
8/18/2019 Analytics Reference Adobe
http://slidepdf.com/reader/full/analytics-reference-adobe 2/332
Contents
Analytics Help Home......................................................................................................15
Admin Tools....................................................................................................................17Administration API...............................................................................................................................................
ASI Slots...............................................................................................................................................................
Segment Definitions.....................................................................................................................................................................
Segment Builder Elements...........................................................................................................................................................
Billing......................................................................................................................................................................
Bot Rules...............................................................................................................................................................
Create a custom bot rule...............................................................................................................................................................
Upload bot rules...........................................................................................................................................................................
Classifications..........................................................................................................................................................
About Classifications...................................................................................................................................................................
Conversion Classifications...........................................................................................................................................................
Traffic Classifications................................ ........................ ....................... ........................ ........................ ....................... ............
Classification Hierarchies............................................................................................................................................................
Classifications Importer (Upload).................................................................................................................................................
Classification Rule Builder...........................................................................................................................................................
Numeric 2 Classifications............................................................................................................................................................
Troubleshooting Classifications............................... ....................... ........................ ........................ ....................... .......................
Co-Branding............................................................................................................................................................
Code Manager.......................................................................................................................................................
Legacy Code Manager.................................................................................................................................................................
Company Settings..................................................................................................................................................
Conversion...............................................................................................................................................................Conversion Variables (eVar)..................................................................................................................................
Edit conversion variables.............................................................................................................................................................
Cross Product Login..............................................................................................................................................
Currency Codes.....................................................................................................................................................
Analytics Help and ReferenceLast updated 6/3/2015
8/18/2019 Analytics Reference Adobe
http://slidepdf.com/reader/full/analytics-reference-adobe 3/332
Custom Report Descriptions..................................................................................................................................
Customize Calendar..............................................................................................................................................
Set up the custom calendar...........................................................................................................................................................
Data Sources.........................................................................................................................................................
Default Metrics.....................................................................................................................................................
Specify default metrics................................................................................................................................................................
Exclude By IP Address..........................................................................................................................................
Finding Methods...................................................................................................................................................
General Account Settings.......................................................................................................................................
Group Management...............................................................................................................................................
Hide Report Suites................................................................................................................................................
Internal URL Filters..............................................................................................................................................
Add internal URL filters...............................................................................................................................................................
Key Visitors...........................................................................................................................................................
Add a key visitor..........................................................................................................................................................................
Logs.........................................................................................................................................................................
Manage P3P Policy................................................................................................................................................
Marketing Channels..............................................................................................................................................
Menu Customizing................................................................................................................................................
Customize the marketing reports menu........................................................................................................................................
Locate a customized report...........................................................................................................................................................
Mobile Management..............................................................................................................................................
Name Pages...........................................................................................................................................................
Paid Search Detection...........................................................................................................................................
Configure paid search detection....................................................................................................................................................
Pending Actions.....................................................................................................................................................
Publishing Lists....................................................................................................................................................
Add a publishing list....................................................................................................................................................................
Filter the publishing lists table......................................................................................................................................................
Publishing Widget .................................................................................................................................................
Add a publishing Widget..............................................................................................................................................................
Publishing Widget Code on a Web Page.......................................................................................................................................
Analytics Help and ReferenceLast updated 6/3/2015
Contents
8/18/2019 Analytics Reference Adobe
http://slidepdf.com/reader/full/analytics-reference-adobe 4/332
Preferences Manager.............................................................................................................................................
Processing Rules...................................................................................................................................................
How Processing Rules Work........................................................................................................................................................
Dimensions Available to Processing Rules...................................................................................................................................
Processing Order..........................................................................................................................................................................
Examples of Processing Rules......................................................................................................................................................
Processing Rules Tips & Tricks....................................................................................................................................................
Managing Processing Rules..........................................................................................................................................................
Real-Time Reports Configuration..........................................................................................................................
Report Builder Reports..........................................................................................................................................
Report Suite Manager............................................................................................................................................
Individual Report Suite Settings...................................................................................................................................................
New Report Suite.........................................................................................................................................................................
Report Suite Groups.....................................................................................................................................................................
Report Suite Templates.................................................................................................................................................................
Rollup and Global Report Suites..................................................................................................................................................
Save a report suite search.............................................................................................................................................................
Scheduled Reports Queue......................................................................................................................................
Security Manager...................................................................................................................................................
Single Sign-On......................................................................................................................................................
Social Management...............................................................................................................................................Success Events......................................................................................................................................................
Configure success events.............................................................................................................................................................
About Changing the Event Type...................................................................................................................................................
Survey Settings......................................................................................................................................................
Support.....................................................................................................................................................................
Traffic Variable.....................................................................................................................................................
Enable traffic variable reports.......................................................................................................................................................
Traffic....................................................................................................................................................................
Traffic Management...............................................................................................................................................
Schedule a traffic spike.................................................................................................................................................................
Specify permanent traffic increase...............................................................................................................................................
Required Lead Time for Traffic Increases....................................................................................................................................
Analytics Help and ReferenceLast updated 6/3/2015
8/18/2019 Analytics Reference Adobe
http://slidepdf.com/reader/full/analytics-reference-adobe 5/332
Unique Visitor Variable.........................................................................................................................................
Specify the Unique Visitor variable..............................................................................................................................................
Use Case - Extracting Visitor IDs.................................................................................................................................................
User Management..................................................................................................................................................
Report Suites................................................................................................................................................................................
Users...............................................................................................................................................................................................
Groups.............................................................................................................................................................................................
New Marketing Cloud Users........................................................................................................................................................
Email users...................................................................................................................................................................................
Video Management...............................................................................................................................................
Web Services.........................................................................................................................................................
Data Collection.............................................................................................................152Data Collection in Analytics..................................................................................................................................
Current Data..........................................................................................................................................................
Data Availability Troubleshooting................................................................................................................................................
Reporting High Numbers of Unique Values (Low-Traffic)..............................................................................159
Data Availability, Security, and Recovery Whitepapers..................................................................................160
Privacy Overview..................................................................................................................................................
Variables - How They Are Used in Reporting......................................................................................................1
Data Warehouse...........................................................................................................170Data Warehouse Release Notes..............................................................................................................................
Add data warehouse user group.............................................................................................................................
Create a data warehouse request...........................................................................................................................1
Tableau data file....................... ....................... ........................ ....................... ........................ ........................ ....................... ........
Manage data warehouse requests.........................................................................................................................1
Data Warehouse Best Practices.............................................................................................................................
Developer......................................................................................................................185
Metric Descriptions......................................................................................................188Metrics Quick Reference.......................................................................................................................................
Analytics Help and ReferenceLast updated 6/3/2015
Contents
8/18/2019 Analytics Reference Adobe
http://slidepdf.com/reader/full/analytics-reference-adobe 6/332
Metric Calculations................................................................................................................................................
Average Page Depth ..............................................................................................................................................
Average Time Spent...............................................................................................................................................
Bounces...................................................................................................................................................................
Bounce Rate..........................................................................................................................................................
Calculated Metrics.................................................................................................................................................
Create a Calculated Metric...........................................................................................................................................................
Examples of Calculated Metrics...................................................................................................................................................
Campaign-Specific Metrics....................................................................................................................................
Cart Additions.......................................................................................................................................................
Cart Open..............................................................................................................................................................
Cart Removals.......................................................................................................................................................
Cart Views.............................................................................................................................................................Checkouts................................................................................................................................................................
Click-throughs.........................................................................................................................................................
Custom Metrics.....................................................................................................................................................
Daily Unique Visitors............................................................................................................................................
Entries......................................................................................................................................................................
Exits.........................................................................................................................................................................
Instances..................................................................................................................................................................Lifetime...................................................................................................................................................................
Mobile Views........................................................................................................................................................
Monthly Unique Visitors.......................................................................................................................................
New Engagements.................................................................................................................................................
Occurrences.............................................................................................................................................................
Orders......................................................................................................................................................................
Page Depth............................................................................................................................................................
Page Events...........................................................................................................................................................
Page View.............................................................................................................................................................
Participation.............................................................................................................................................................
Add Participation Metrics.............................................................................................................................................................
Analytics Help and ReferenceLast updated 6/3/2015
8/18/2019 Analytics Reference Adobe
http://slidepdf.com/reader/full/analytics-reference-adobe 7/332
Path Views............................................................................................................................................................
Product Views.......................................................................................................................................................
Quarterly Unique Visitors......................................................................................................................................
Reloads....................................................................................................................................................................
Revenue...................................................................................................................................................................
Searches...................................................................................................................................................................
Single Access........................................................................................................................................................
Time Spent............................................................................................................................................................
Time Spent - Page Calculation Example........................ ....................... ........................ ........................ ....................... .................
Time Spent - Site Sections Calculation Example................................. ....................... ........................ ....................... ..................2
Time Spent - eVar Calculation Example................. ........................ ....................... ........................ ....................... ........................
Total......................................................................................................................................................................
Unique Visitors......................................................................................................................................................Units.........................................................................................................................................................................
Visit..........................................................................................................................................................................
Visitors.....................................................................................................................................................................
Visitor Participation - Ad Hoc Analysis.................................................................................................................
Weekly Unique Visitors.........................................................................................................................................
Yearly Unique Visitors..........................................................................................................................................
Report Descriptions.....................................................................................................214Reporting Best Practices and Troubleshooting.................................................................................................214
Anomaly Detection...............................................................................................................................................
Version 14 Report Descriptions.............................................................................................................................
Report Categories..................................................................................................................................................
Ranked Reports............................................................................................................................................................................
Trended Reports.......................... ....................... ........................ ....................... ........................ ........................ ....................... ....
Totals Report......... ........................ ....................... ........................ ....................... ........................ ........................ ....................... ..
Flow Reports................................................................................................................................................................................
Bookend Pattern Report.........................................................................................................................................
Bookmark URL Length Report..............................................................................................................................
Bots Report............................................................................................................................................................
Analytics Help and ReferenceLast updated 6/3/2015
Contents
8/18/2019 Analytics Reference Adobe
http://slidepdf.com/reader/full/analytics-reference-adobe 8/332
Breakdown Reports...............................................................................................................................................
Break Down a marketing report....................................................................................................................................................
Add a Correlation Filter................................................................................................................................................................
Browser Height Report..........................................................................................................................................
Browser Types Report...........................................................................................................................................
Browser URL Length Report.................................................................................................................................
Browser Width.......................................................................................................................................................
Browsers Report....................................................................................................................................................
Campaigns Report.................................................................................................................................................
Campaign Conversion Funnel................................................................................................................................
Categories Report..................................................................................................................................................
Color Depth Report...............................................................................................................................................
Complete Path.......................................................................................................................................................Connection Types Report......................................................................................................................................
Content Types Report............................................................................................................................................
Conversion Reports...............................................................................................................................................
Conversion Funnel Reports...................................................................................................................................
Conversions and Averages Report.........................................................................................................................
Cross-Sell Report..................................................................................................................................................
Custom Events Report...........................................................................................................................................Custom Insight Report...........................................................................................................................................
Custom Links Report.............................................................................................................................................
Customer Attributes Report...................................................................................................................................
Customer Loyalty Report......................................................................................................................................
Custom Report.......................................................................................................................................................
Custom Traffic Report...........................................................................................................................................
Daily Return Visits Report....................................................................................................................................
Days Before First Purchase Report........................................................................................................................
Days Before Last Purchase Report........................................................................................................................
Daily Return Visits Report....................................................................................................................................
Designated Market Area Report............................................................................................................................
Analytics Help and ReferenceLast updated 6/3/2015
8/18/2019 Analytics Reference Adobe
http://slidepdf.com/reader/full/analytics-reference-adobe 9/332
Device Number Transit Report..............................................................................................................................
Device Types Report.............................................................................................................................................
Devices Report......................................................................................................................................................
DRM Report..........................................................................................................................................................
Entries and Exits Reports.......................................................................................................................................
Exit Links Report..................................................................................................................................................
File Downloads Report..........................................................................................................................................
Finding Methods Report........................................................................................................................................
Flow Reports.........................................................................................................................................................
Full Paths Report...................................................................................................................................................
GeoSegmentation Reports.....................................................................................................................................
Map View.....................................................................................................................................................................................
GeoSegmentation Regions and Postal Code usage by Country...........................................................................................252
Hierarchy Report...................................................................................................................................................
Image Support Report............................................................................................................................................
Information Services Report..................................................................................................................................
JavaScript Report..................................................................................................................................................
Java Version Report...............................................................................................................................................
Key Metrics Report................................................................................................................................................
Key Visitor Report.................................................................................................................................................Languages Report..................................................................................................................................................
Last 100 Visitors Report........................................................................................................................................
Links Report.........................................................................................................................................................
Longest Path Report..............................................................................................................................................
Mail URL Length Report.......................................................................................................................................
Manufacturer Report.............................................................................................................................................
Marketing Channel Overview Report....................................................................................................................
Marketing Channel Detail - First and Last Touch........................................................................................................................2
Mobile Reports......................................................................................................................................................
Mobile Carrier Report..................................................................................................................................................................
Monitor Color Depth Report..................................................................................................................................
Most Popular Pages Report....................................................................................................................................
Analytics Help and ReferenceLast updated 6/3/2015
Contents
8/18/2019 Analytics Reference Adobe
http://slidepdf.com/reader/full/analytics-reference-adobe 10/332
Most Popular Servers Report.................................................................................................................................
Most Popular Site Sections Report........................................................................................................................
Net Protocols Report.............................................................................................................................................
Next Page Report...................................................................................................................................................
Next Page Flow Report.........................................................................................................................................
Next Section Flow Report.....................................................................................................................................
Next Server Flow Report.......................................................................................................................................
Operating Systems Report.....................................................................................................................................
Operating System Types Report.............................................................................................................................
Orders Report........................................................................................................................................................
Original Referring Domains Report.......................................................................................................................
Over Time Report..................................................................................................................................................
Social Owned Property Reports.............................................................................................................................
Page Depth Report.................................................................................................................................................
Page Summary Report...........................................................................................................................................
Page Value Report.................................................................................................................................................
Page Viewed by Key Visitors Report.....................................................................................................................
Page Views Report.................................................................................................................................................
Pages Report..........................................................................................................................................................
Pages Not Found Report........................................................................................................................................Paid Search Engines Report..................................................................................................................................
Paid Search Keywords Report...............................................................................................................................
Path Length Report................................................................................................................................................
Pathing Reports.....................................................................................................................................................
Paths Reports.........................................................................................................................................................
Previous Page Report............................................................................................................................................
Previous Page Flow Report....................................................................................................................................Previous Section Flow Report................................................................................................................................
Previous Server Flow Report.................................................................................................................................
Products Report.....................................................................................................................................................
Products Conversion Funnel Report......................................................................................................................
Analytics Help and ReferenceLast updated 6/3/2015
8/18/2019 Analytics Reference Adobe
http://slidepdf.com/reader/full/analytics-reference-adobe 11/332
PTT Report...........................................................................................................................................................
Purchases Report...................................................................................................................................................
Real-Time Reports.................................................................................................................................................
Supported Real-Time Metrics and Dimensions...........................................................................................................................2
Referrer Type Report.............................................................................................................................................
Referrers Report....................................................................................................................................................
Referring Domains Report.....................................................................................................................................
Return Frequency Report.......................................................................................................................................
Return Visits Report...............................................................................................................................................
Revenue Report.....................................................................................................................................................
Screen Height Report............................................................................................................................................
Screen Size Report................................................................................................................................................
Screen Width Report..............................................................................................................................................
Search Engines Report..........................................................................................................................................
Search Keywords Report.......................................................................................................................................
Servers Report.......................................................................................................................................................
Shopping Cart Report............................................................................................................................................
Single Page Visit Report........................................................................................................................................
Site Analysis Report..............................................................................................................................................
Site Content Reports..............................................................................................................................................Site Metrics Report................................................................................................................................................
Site Overview Report............................................................................................................................................
Site Sections Report..............................................................................................................................................
Site Sections Depth Report....................................................................................................................................
Site Sections Summary Report...............................................................................................................................
Survey Report........................................................................................................................................................
Target Report..........................................................................................................................................................
Target Activities Report.........................................................................................................................................
Target Experiences Report.....................................................................................................................................
Technology Reports...............................................................................................................................................
Time Prior to Event Report....................................................................................................................................
Analytics Help and ReferenceLast updated 6/3/2015
Contents
8/18/2019 Analytics Reference Adobe
http://slidepdf.com/reader/full/analytics-reference-adobe 12/332
Time Spent on Page Report...................................................................................................................................
Time Spent on Site Section Report.........................................................................................................................
Time Spent per Visit Report..................................................................................................................................
Time Zones Report................................................................................................................................................
Top Level Domains Report....................................................................................................................................
Totals Report..........................................................................................................................................................
Tracking Codes Report..........................................................................................................................................
Traffic Reports......................................................................................................................................................
Traffic Sources Report...........................................................................................................................................
Unique Customers Report.....................................................................................................................................
Unique Visitors Report - Analytics........................................................................................................................
Units Report..........................................................................................................................................................
U.S. State..............................................................................................................................................................
Video Reports........................................................................................................................................................
Video Support Reports...........................................................................................................................................
Virtual Focus Group Report...................................................................................................................................
Visitor Detail Report..............................................................................................................................................
Visit Number Report.............................................................................................................................................
Visitor Profile Report.............................................................................................................................................
Visitor Retention....................................................................................................................................................Visitor Zip and Postal Codes Report......................................................................................................................
Visitors Report.......................................................................................................................................................
Visits Report..........................................................................................................................................................
Terms Used in Analytics...............................................................................................314Acquisition...............................................................................................................................................................
Activity....................................................................................................................................................................
Allocation................................................................................................................................................................
Anomaly...................................................................................................................................................................
Calculated Metric..................................................................................................................................................
Channel....................................................................................................................................................................
Analytics Help and ReferenceLast updated 6/3/2015
8/18/2019 Analytics Reference Adobe
http://slidepdf.com/reader/full/analytics-reference-adobe 13/332
Classification...........................................................................................................................................................
Clickstream Data Feeds.........................................................................................................................................
Conversion Variable (eVar)...................................................................................................................................
Count Repeat Instances..........................................................................................................................................
Correlation...............................................................................................................................................................
CPM.........................................................................................................................................................................
CPMM.....................................................................................................................................................................
Creative Element...................................................................................................................................................
Custom Traffic Variable (s.prop)...........................................................................................................................
Current Data..........................................................................................................................................................
Data Connectors.....................................................................................................................................................
Data Sources..........................................................................................................................................................
Decision Tree........................................................................................................................................................
Deduplication...........................................................................................................................................................
Dimensions..............................................................................................................................................................
Event Serialization................................................................................................................................................
Exit Link...............................................................................................................................................................
Expiration Trigger.................................................................................................................................................
Fallout Report........................................................................................................................................................
Gantt View.............................................................................................................................................................Gauge Reportlet.....................................................................................................................................................
Granularity...............................................................................................................................................................
Hierarchy..................................................................................................................................................................
Hit............................................................................................................................................................................
Image Request.......................................................................................................................................................
Internal Search Term..............................................................................................................................................
KPI - Key Performance Indicator..........................................................................................................................Lifetime Value.......................................................................................................................................................
List Prop................................................................................................................................................................
Login Company.....................................................................................................................................................
Marketing Cloud....................................................................................................................................................
Analytics Help and ReferenceLast updated 6/3/2015
Contents
8/18/2019 Analytics Reference Adobe
http://slidepdf.com/reader/full/analytics-reference-adobe 14/332
Master Marketing Profile.......................................................................................................................................
Metric.......................................................................................................................................................................
Multi-Suite Tagging..............................................................................................................................................
Normalization..........................................................................................................................................................
Original Referring Domain....................................................................................................................................
Pathing.....................................................................................................................................................................
Persistence...............................................................................................................................................................
Ranked Report.......................................................................................................................................................
Real Time..............................................................................................................................................................
Report......................................................................................................................................................................
Report Suite..........................................................................................................................................................
Segment Container................................................................................................................................................
Segmentation...........................................................................................................................................................
Server Call.............................................................................................................................................................
Subrelation...............................................................................................................................................................
Success Event........................................................................................................................................................
Transaction Unique Customer URL......................................................................................................................
Trended Report......................................................................................................................................................
Unique Visitors......................................................................................................................................................
Visit Depth............................................................................................................................................................VISTA Rules.........................................................................................................................................................
Documentation Updates..............................................................................................330
System Requirements..................................................................................................332
Contact and Legal Information...................................................................................333
Analytics Help and ReferenceLast updated 6/3/2015
8/18/2019 Analytics Reference Adobe
http://slidepdf.com/reader/full/analytics-reference-adobe 15/332
Analytics Help HomeThis help is intended for users and administrators of Reports & Analytics. You can browse for help on reports, metrics, datacollection, and admin tools.
Reports and Interface HelpHave a question? Visit the Adobe Analytics Community .
To view the latest Analytics videos, visitEnterprise TV , then click Analytics> Analytics Latest Videos.
• Reports & Analytics User Help
Help on the marketing reports interface.
New & Popular Topics • Ad Hoc Analysis Help
Help on advanced segmentation andmultidimensional site analysis. (formerly Discover)
• Customer Attributes Report
Run reports on CRM data uploaded to the Marketing Cloud.• Analytics Segmentation
Segments are now created, managed, and used across Analytics interfacesand across report suites.
• Data Workbench
Help on multi-channel capabilities in AdobeAnalytics Premium.
•Report Builder 5.0Includes new segment management, pathing reports, access to dashboardsand bookmarks from Reports & Analytics, and more.
• Report Builder Help
Help on report builder (for Excel).• Marketing Channels Help
Help on configuring marketing channel reports,which display how much revenue yourmarketing channels generate.
• Scheduled Reports Queue
Better queue management and advanced filtering capabilities for scheduledreports. Admin-level users can now view, manage, and filter on all reportsin their organization.
• Data Connectors
Help on importing tracking data fromthird-party applications into Adobe Analytics.
• Report/Metric Descriptions
Custom Traffic and Custom Conversion reports can now display a handy note at the top of the report explaining how the report should be used,when it was implemented, or any other information that may be helpfulto users.
• Visitor Click Map
Help on the visitor click map plug-in for InternetExplorer and Firefox.• Reporting Best Practices and Troubleshooting
Learn about common reasons why reports fail and what you can do toavoid timeouts and failures.
• Report Descriptions
Help on what you see when running reports inAnalytics.• Processing rule limits were increased from 50 to 100 per report suite, and
a new "Else" operator was added to let you take action when a conditionis not met. • Metric Descriptions
Help on metrics• Classifications are now supported by real-time reports and anomaly detection. • version 14
(Legacy) documentation for version 14.SeeDocumentation Updates to learn about recent additions to Analyticshelp.
Marketing Cloud Community ResourcesAdmin and Data Collection• Adobe Analytics Community • Admin Tools
Help for administrators of Reports & Analytics.• Marketing Cloud Release Notes• Product Documentation Home• Developer • Classifications
15Analytics Help Home
8/18/2019 Analytics Reference Adobe
http://slidepdf.com/reader/full/analytics-reference-adobe 16/332
Help on creating and importing classification data. • Idea Exchange• Adobe Training and Tutorials• Common SAINT Upload Issues
Common issues users find when attempting to upload classification files.• Featured Solutions Center
• Developer
AppMeasurement and Mobile application development.
• Implementation
Help for implementation of marketing reports & analytics.• Variables - How They Are Used in Reporting
High-level help on variables used in reporting.• Clickstream Data Feeds
Help on data feeds, which provide the stream of raw, partially-processedserver calls in a delimited data set.
• Data Sources
Help on importing data into Analytics.• Data Warehouse
Help on using unprocessed data for storage and custom reports.• Single Sign-On
Help on single sign-on for marketing reports & analytics.• Dynamic Tag Management
Dynamic tag management is an evolution of tag management, designedaround mapping user interactions to marketing technologies. Visit thedynamic tag management help to get started.
16Analytics Help Home
8/18/2019 Analytics Reference Adobe
http://slidepdf.com/reader/full/analytics-reference-adobe 17/332
Admin ToolsA help system for administrators using Admin Tools.
Analytics > Admin
Important: Do not to open multiple Admin Console tabs in the same browser. This can lead to you inadvertently saving
settings to the wrong report suite. If you need to, for example, compare rule sets and copy them to a new report suite, wesuggest that you open a new browser or take a screen shot to compare rule sets.
The Admin Tools let you configure the following Analytics features:
Administration API
Adobe's Administration API lets you change report suite and user settings without the need to use Admin Tools. This featureis useful if you have a custom reporting interface, letting you make changes to the report suite without having to log in to theinterface. There are no limitations to using this API, as compared to Admin Tools. Meaning, if a certain action can be donewithin Admin Tools, that same action can be done using the Administration API.
For additional information, see Developer Connection.Customer Care does not provide support for the Administration API. If you require assistance regarding this, refer to thedeveloper connection forums.
ASI Slots
Advanced Segment Insight (ASI) is a legacy version 14 feature that is replaced by native segmentation in analytics reports.
Note: The ASI interface is not available in marketing reports & analytics.
ASI slots are no longer processing after you upgrade to Analytics. However, most use cases should be resolved throughsegmentation. Here are a few distinctions to be aware of:
Interface
For more information on the Analytics marketing reports segment interface, see the Analytics Segmentation Guide.
Data Availability
ASI processes from a specified date forward. Creating a segment for historical data is possible but time consuming.
Marketing report segments apply to all data on the new platform, as of your upgrade date. After you create a segment, you canimmediately apply it to a report.
Processing vs. Filtering
ASI reprocesses data. This can cause some data discrepancies due to eVar persistence and similar factors. As such, VISTA rulesrunning on the ASI report suite can change the data, rather than just filter out some traffic.
Marketing report segments act as filters at the Visit, Visitor, or Hit level. Rather than re-processing data, the filters remove datathat falls outside of the criteria. As such, VISTA rules cannot change the data in a report segment. (If you need to re-processdata after upgrading, contact Engineering Services.)
Permissions
17Admin Tools
8/18/2019 Analytics Reference Adobe
http://slidepdf.com/reader/full/analytics-reference-adobe 18/332
With ASI, users can be restricted to see just one or more ASI report suites, if needed.
Segment permissions in marketing reports differ between Admin-level and non-Admin users .
Segment Definitions
The Segment Definition Builder allows you to define visitor segment filters based on visitor behavior.
You can use the Segment Definition Builder to create new segment filters or to edit an existing filter. When submitting a datawarehouse request, you can apply a segment filter to the result set to analyze your website traffic. Segments created in datawarehouse are also available in the ASI feature.
For example, the segment of visitors that purchased $300 during a sales promotion held during the past eight days is a segmentfilter.
Build segment definitions - ASI slots
Steps that describe how to build segment definitions in Admin > ASI Slots.
Note: Advanced Segment Insight (ASI) is a legacy version 14 feature that is replaced by the native segmentation in Version15. ASI slots are no longer process after youupgrade to Version 15.
1. Log in to the Suite.2. In the Suite header, clickAdmin > ASI Slots.3. On the ASI Slots page, perform one of the following tasks, depending on your needs:
This is the first ASI Slot: The ASI Slots Manager opens directly to the Create Segment page where you can create the ASIslot.
There is one or more existing ASI slot: Click Set Up next to the unconfigured ASI slot that you want to use.
To reconfigure an existing ASI slot: Click Add Data next to the ASI Slot that you want to modify.
4. In the Step 2: Choose a Segment Definition section, open the Segment Definition Builder by clickingNew .
Or
Select an existing segment definition, then clickEdit .
5. (Conditional) If you are creating a new segment definition, specify a segment name in theTitle field.6. Click theComponents or Library tab, as desired.
For more information about the Library, see Add components to the segment definition library .
7. Drag an item from either the Components or the Library tab to the Drag and Drop Here field in the Include tab.
You can also click theExclude tab and drag an item from either the Components or the Library tab to the Drag and DropHere field.
8. Click theDefine Rule icon for each element you added to the canvas (you can also click the underlined element link).9. Type a name for the canvas element in the Name field.10. Select an item from theThis Visit Must Match drop-down list.
You can choose to have the element match either all or at least one of the rules you set.
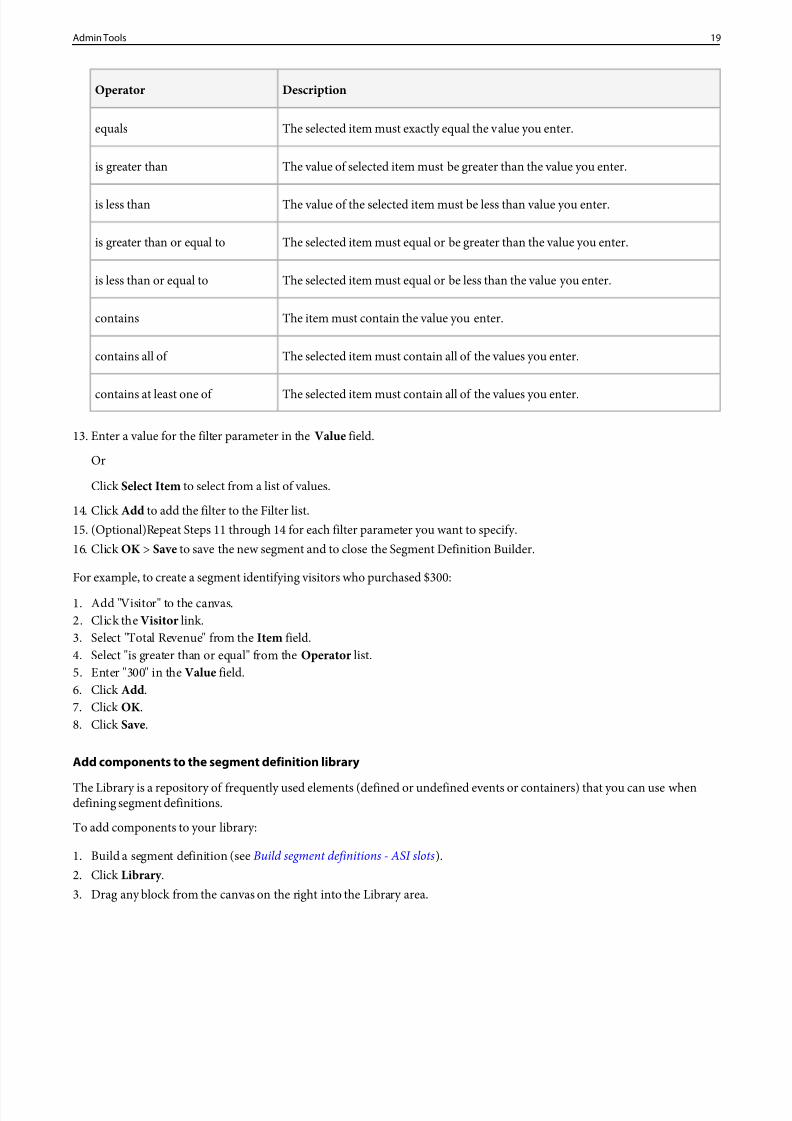
11. Select an item from the Item drop-down list.12. Select an operator value from the middle drop-down list:
18Admin Tools
8/18/2019 Analytics Reference Adobe
http://slidepdf.com/reader/full/analytics-reference-adobe 19/332
DescriptionOperator
The selected item must exactly equal the value you enter.equals
The value of selected item must be greater than the value you enter.is greater than
The value of the selected item must be less than value you enter.is less than
The selected item must equal or be greater than the value you enter.is greater than or equal to
The selected item must equal or be less than the value you enter.is less than or equal to
The item must contain the value you enter.contains
The selected item must contain all of the values you enter.contains all of
The selected item must contain all of the values you enter.contains at least one of
13. Enter a value for the filter parameter in the Value field.
Or
Click Select Item to select from a list of values.
14. ClickAdd to add the filter to the Filter list.15. (Optional)Repeat Steps 11 through 14 for each filter parameter you want to specify.16. ClickOK > Save to save the new segment and to close the Segment Definition Builder.
For example, to create a segment identifying visitors who purchased $300:
1. Add "Visitor" to the canvas.2. Click theVisitor link.3. Select "Total Revenue" from theItem field.4. Select "is greater than or equal" from theOperator list.5. Enter "300" in theValue field.6. ClickAdd.7. ClickOK.8. ClickSave.
Add components to the segment definition library
The Library is a repository of frequently used elements (defined or undefined events or containers) that you can use whendefining segment definitions.
To add components to your library:
1. Build a segment definition (seeBuild segment definitions - ASI slots).2. ClickLibrary .3. Drag any block from the canvas on the right into the Library area.
19Admin Tools
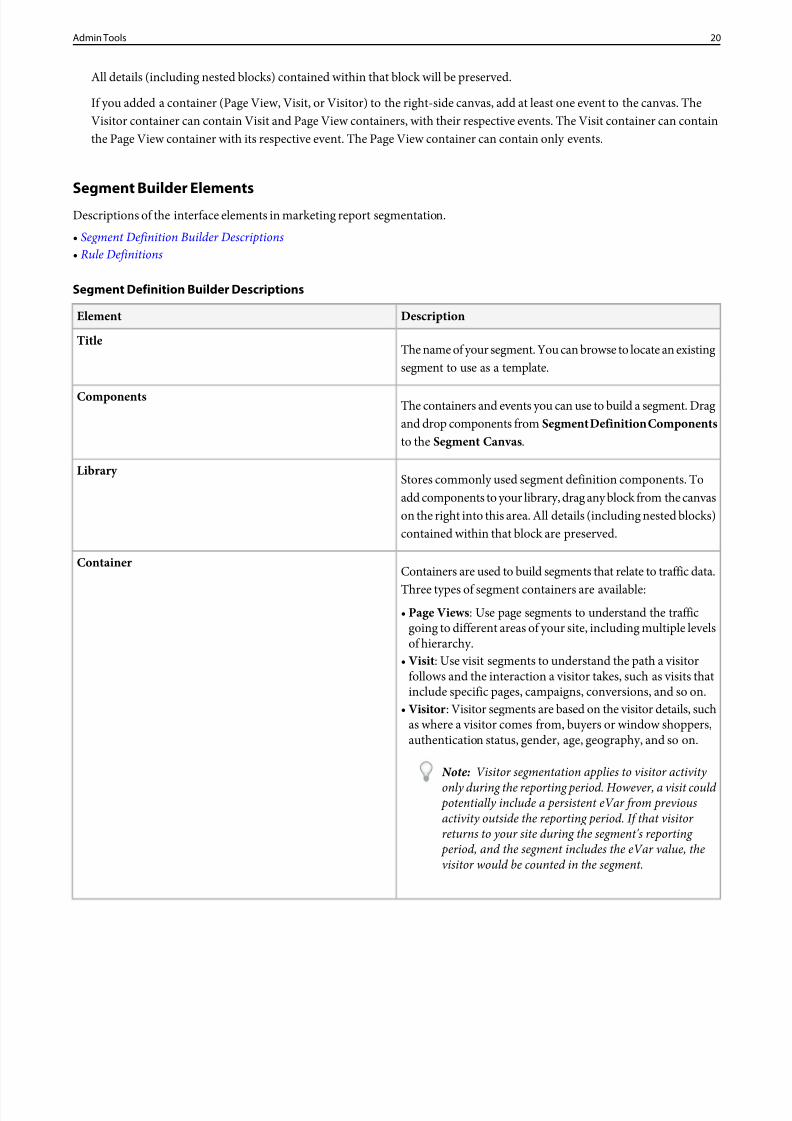
8/18/2019 Analytics Reference Adobe
http://slidepdf.com/reader/full/analytics-reference-adobe 20/332
All details (including nested blocks) contained within that block will be preserved.
If you added a container (Page View, Visit, or Visitor) to the right-side canvas, add at least one event to the canvas. TheVisitor container can contain Visit and Page View containers, with their respective events. The Visit container can containthe Page View container with its respective event. The Page View container can contain only events.
Segment Builder ElementsDescriptions of the interface elements in marketing report segmentation.• Segment Definition Builder Descriptions• Rule Definitions
Segment Definition Builder Descriptions
DescriptionElement
The name of your segment. You can browse to locate an existingsegment to use as a template.
Title
The containers and events you can use to build a segment. Dragand drop components from Segment Definition Componentsto the Segment Canvas .
Components
Stores commonly used segment definition components. Toadd components to your library, drag any block from the canvas
Library
on the right into this area. All details (including nested blocks)contained within that block are preserved.
Containers are used to build segments that relate to traffic data.
Three types of segment containers are available:
Container
• Page Views: Use page segments to understand the trafficgoing to different areas of your site, including multiple levelsof hierarchy.
• Visit : Use visit segments to understand the path a visitorfollows and the interaction a visitor takes, such as visits thatinclude specific pages, campaigns, conversions, and so on.
• Visitor : Visitor segments are based on the visitor details, suchas where a visitor comes from, buyers or window shoppers,authentication status, gender, age, geography, and so on.
Note: Visitor segmentation applies to visitor activity only during the reporting period. However, a visit could potentially include a persistent eVar from previousactivity outside the reporting period. If that visitor returns to your site during the segment's reporting period, and the segment includes the eVar value, thevisitor would be counted in the segment.
20Admin Tools
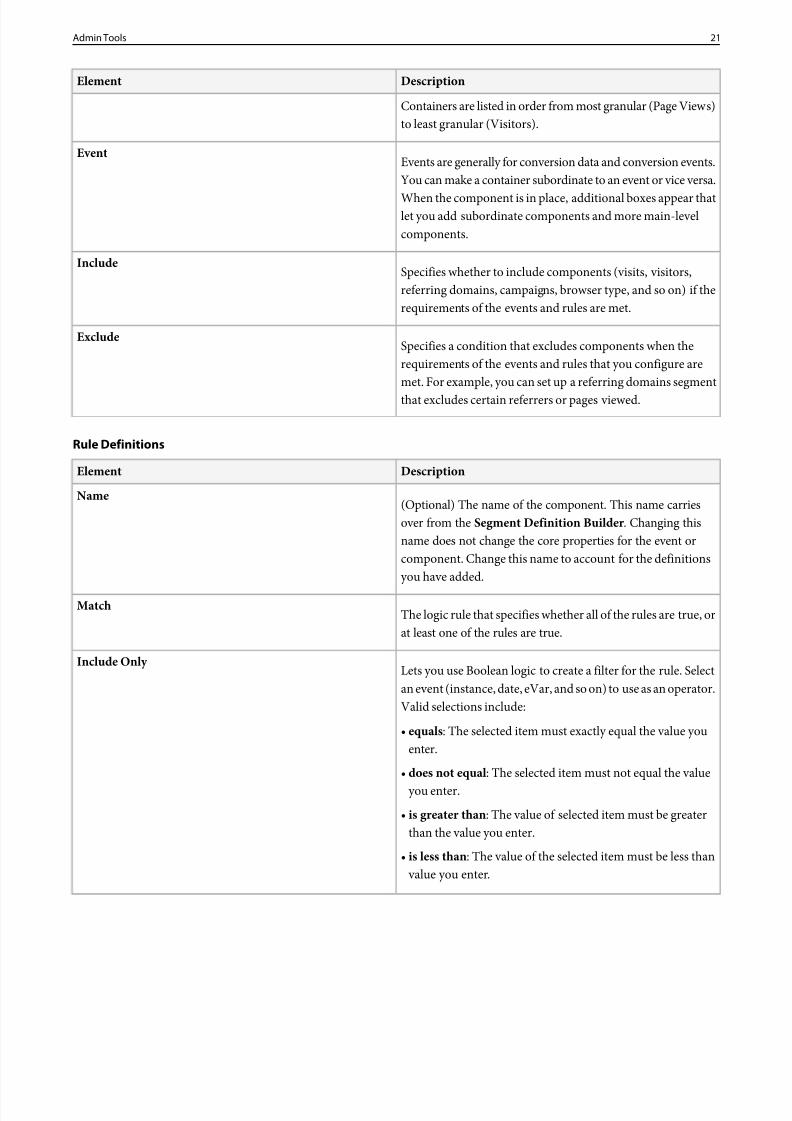
8/18/2019 Analytics Reference Adobe
http://slidepdf.com/reader/full/analytics-reference-adobe 21/332
DescriptionElement
Containers are listed in order from most granular (Page Views)to least granular (Visitors).
Events are generally for conversion data and conversion events.You can make a container subordinate to an event or vice versa.
Event
When the component is in place, additional boxes appear thatlet you add subordinate components and more main-levelcomponents.
Specifies whether to include components (visits, visitors,referring domains, campaigns, browser type, and so on) if therequirements of the events and rules are met.
Include
Specifies a condition that excludes components when therequirements of the events and rules that you configure are
Exclude
met. For example, you can set up a referring domains segmentthat excludes certain referrers or pages viewed.
Rule Definitions
DescriptionElement
(Optional) The name of the component. This name carriesover from the Segment Definition Builder . Changing this
Name
name does not change the core properties for the event orcomponent. Change this name to account for the definitionsyou have added.
The logic rule that specifies whether all of the rules are true, orat least one of the rules are true.
Match
Lets you use Boolean logic to create a filter for the rule. Selectan event (instance, date, eVar, and so on) to use as an operator.Valid selections include:
Include Only
• equals: The selected item must exactly equal the value youenter.
• does not equal : The selected item must not equal the valueyou enter.
• is greater than : The value of selected item must be greaterthan the value you enter.
• is less than : The value of the selected item must be less than value you enter.
21Admin Tools
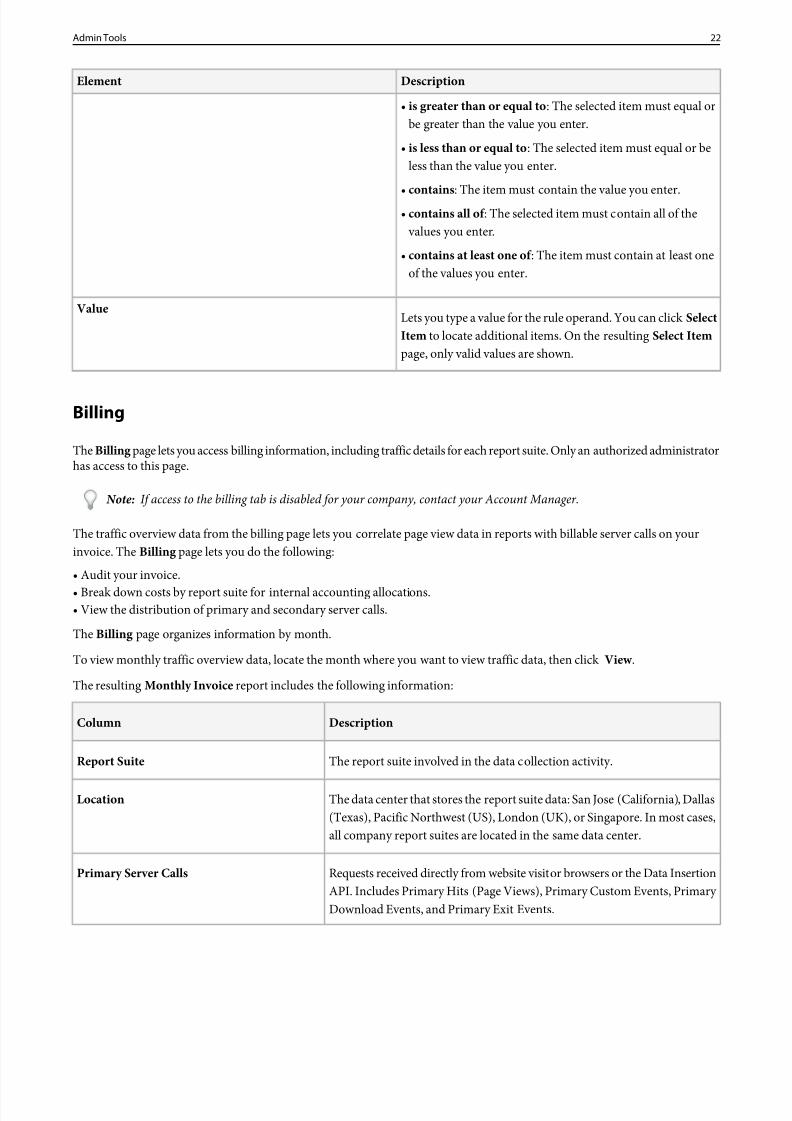
8/18/2019 Analytics Reference Adobe
http://slidepdf.com/reader/full/analytics-reference-adobe 22/332
DescriptionElement
• is greater than or equal to : The selected item must equal orbe greater than the value you enter.
• is less than or equal to : The selected item must equal or beless than the value you enter.
•contains : The item must contain the value you enter.
• contains all of : The selected item must contain all of the values you enter.
• contains at least one of : The item must contain at least oneof the values you enter.
Lets you type a value for the rule operand. You can clickSelectItem to locate additional items. On the resulting Select Itempage, only valid values are shown.
Value
Billing
The Billing page lets you access billing information, including traffic details for each report suite. Only an authorized administratorhas access to this page.
Note: If access to the billing tab is disabled for your company, contact your Account Manager.
The traffic overview data from the billing page lets you correlate page view data in reports with billable server calls on yourinvoice. The Billing page lets you do the following:
• Audit your invoice.• Break down costs by report suite for internal accounting allocations.• View the distribution of primary and secondary server calls.
The Billing page organizes information by month.
To view monthly traffic overview data, locate the month where you want to view traffic data, then clickView .
The resulting Monthly Invoice report includes the following information:
DescriptionColumn
The report suite involved in the data collection activity.Report Suite
The data center that stores the report suite data: San Jose (California), Dallas(Texas), Pacific Northwest (US), London (UK), or Singapore. In most cases,all company report suites are located in the same data center.
Location
Requests received directly from website visitor browsers or the Data InsertionAPI. Includes Primary Hits (Page Views), Primary Custom Events, Primary Download Events, and Primary Exit Events.
Primary Server Calls
22Admin Tools
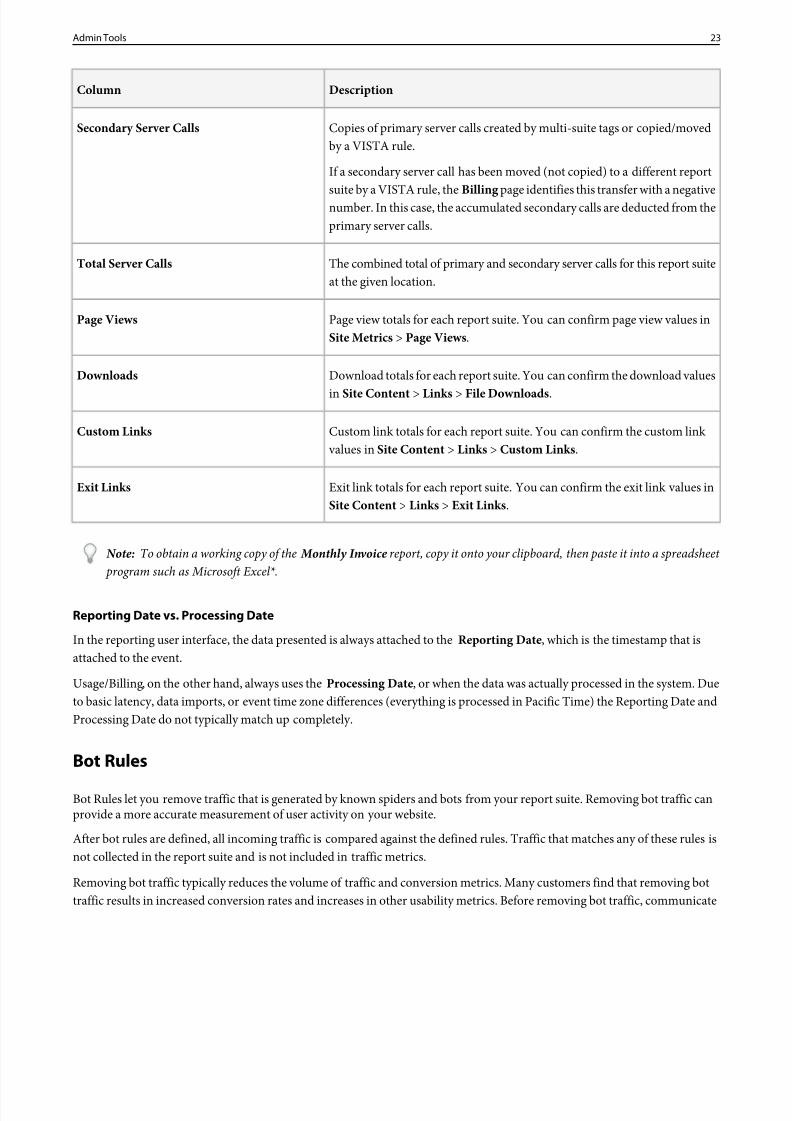
8/18/2019 Analytics Reference Adobe
http://slidepdf.com/reader/full/analytics-reference-adobe 23/332
DescriptionColumn
Copies of primary server calls created by multi-suite tags or copied/movedby a VISTA rule.
Secondary Server Calls
If a secondary server call has been moved (not copied) to a different report
suite by a VISTA rule, theBilling page identifies this transfer with a negativenumber. In this case, the accumulated secondary calls are deducted from theprimary server calls.
The combined total of primary and secondary server calls for this report suiteat the given location.
Total Server Calls
Page view totals for each report suite. You can confirm page view values inSite Metrics > Page Views.
Page Views
Download totals for each report suite. You can confirm the download values
in Site Content > Links > File Downloads .
Downloads
Custom link totals for each report suite. You can confirm the custom link values inSite Content > Links > Custom Links .
Custom Links
Exit link totals for each report suite. You can confirm the exit link values inSite Content > Links > Exit Links.
Exit Links
Note: To obtain a working copy of the Monthly Invoice report, copy it onto your clipboard, then paste it into a spreadsheet program such as Microsoft Excel*.
Reporting Date vs. Processing Date
In the reporting user interface, the data presented is always attached to the Reporting Date , which is the timestamp that isattached to the event.
Usage/Billing, on the other hand, always uses theProcessing Date , or when the data was actually processed in the system. Dueto basic latency, data imports, or event time zone differences (everything is processed in Pacific Time) the Reporting Date andProcessing Date do not typically match up completely.
Bot Rules
Bot Rules let you remove traffic that is generated by known spiders and bots from your report suite. Removing bot traffic canprovide a more accurate measurement of user activity on your website.
After bot rules are defined, all incoming traffic is compared against the defined rules. Traffic that matches any of these rules isnot collected in the report suite and is not included in traffic metrics.
Removing bot traffic typically reduces the volume of traffic and conversion metrics. Many customers find that removing bottraffic results in increased conversion rates and increases in other usability metrics. Before removing bot traffic, communicate
23Admin Tools
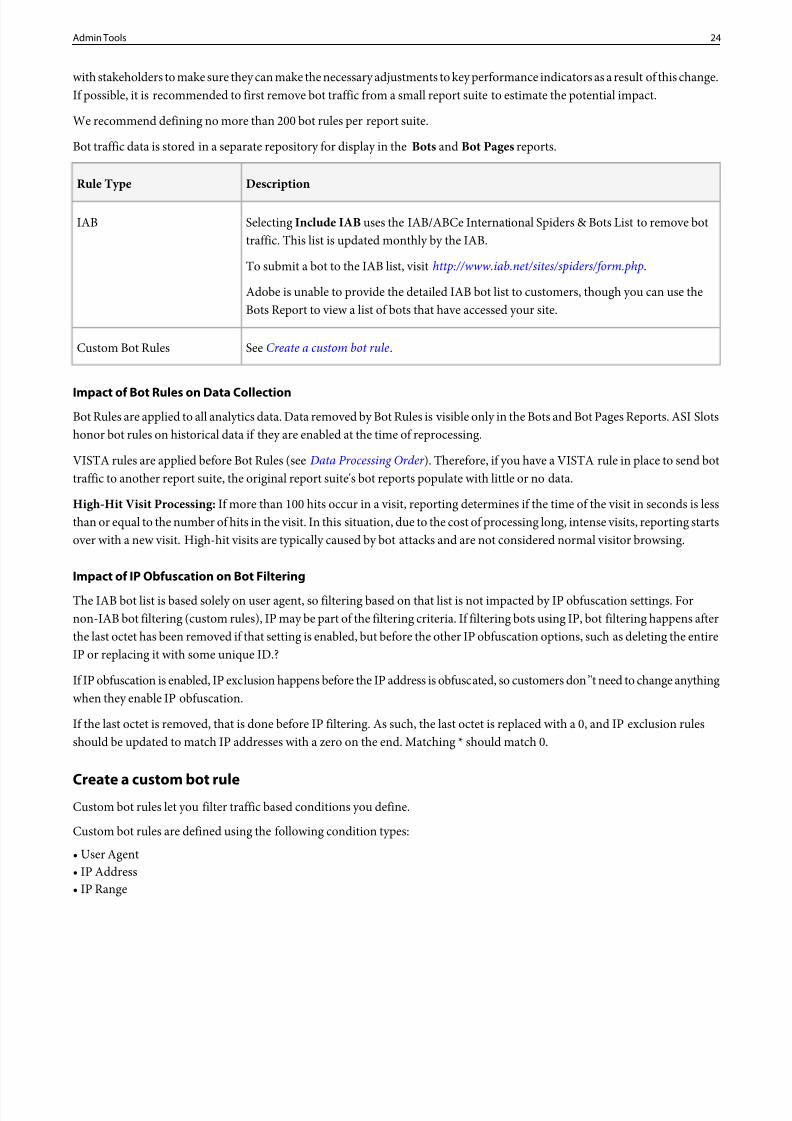
8/18/2019 Analytics Reference Adobe
http://slidepdf.com/reader/full/analytics-reference-adobe 24/332
with stakeholders to make sure they can make the necessary adjustments to key performance indicators as a result of this change.If possible, it is recommended to first remove bot traffic from a small report suite to estimate the potential impact.
We recommend defining no more than 200 bot rules per report suite.
Bot traffic data is stored in a separate repository for display in theBots and Bot Pages reports.
DescriptionRule Type
SelectingInclude IAB uses the IAB/ABCe International Spiders & Bots List to remove bottraffic. This list is updated monthly by the IAB.
IAB
To submit a bot to the IAB list, visithttp://www.iab.net/sites/spiders/form.php .
Adobe is unable to provide the detailed IAB bot list to customers, though you can use theBots Report to view a list of bots that have accessed your site.
SeeCreate a custom bot rule .Custom Bot Rules
Impact of Bot Rules on Data CollectionBot Rules are applied to all analytics data. Data removed by Bot Rules is visible only in the Bots and Bot Pages Reports. ASI Slotshonor bot rules on historical data if they are enabled at the time of reprocessing.
VISTA rules are applied before Bot Rules (seeData Processing Order ). Therefore, if you have a VISTA rule in place to send bottraffic to another report suite, the original report suite's bot reports populate with little or no data.
High-Hit Visit Processing: If more than 100 hits occur in a visit, reporting determines if the time of the visit in seconds is lessthan or equal to the number of hits in the visit. In this situation, due to the cost of processing long, intense visits, reporting startsover with a new visit. High-hit visits are typically caused by bot attacks and are not considered normal visitor browsing.
Impact of IP Obfuscation on Bot Filtering
The IAB bot list is based solely on user agent, so filtering based on that list is not impacted by IP obfuscation settings. Fornon-IAB bot filtering (custom rules), IP may be part of the filtering criteria. If filtering bots using IP, bot filtering happens afterthe last octet has been removed if that setting is enabled, but before the other IP obfuscation options, such as deleting the entireIP or replacing it with some unique ID.?
If IP obfuscation is enabled, IP exclusion happens before the IP address is obfuscated, so customers don’'t need to change anythingwhen they enable IP obfuscation.
If the last octet is removed, that is done before IP filtering. As such, the last octet is replaced with a 0, and IP exclusion rulesshould be updated to match IP addresses with a zero on the end. Matching * should match 0.
Create a custom bot ruleCustom bot rules let you filter traffic based conditions you define.
Custom bot rules are defined using the following condition types:
• User Agent• IP Address• IP Range
24Admin Tools
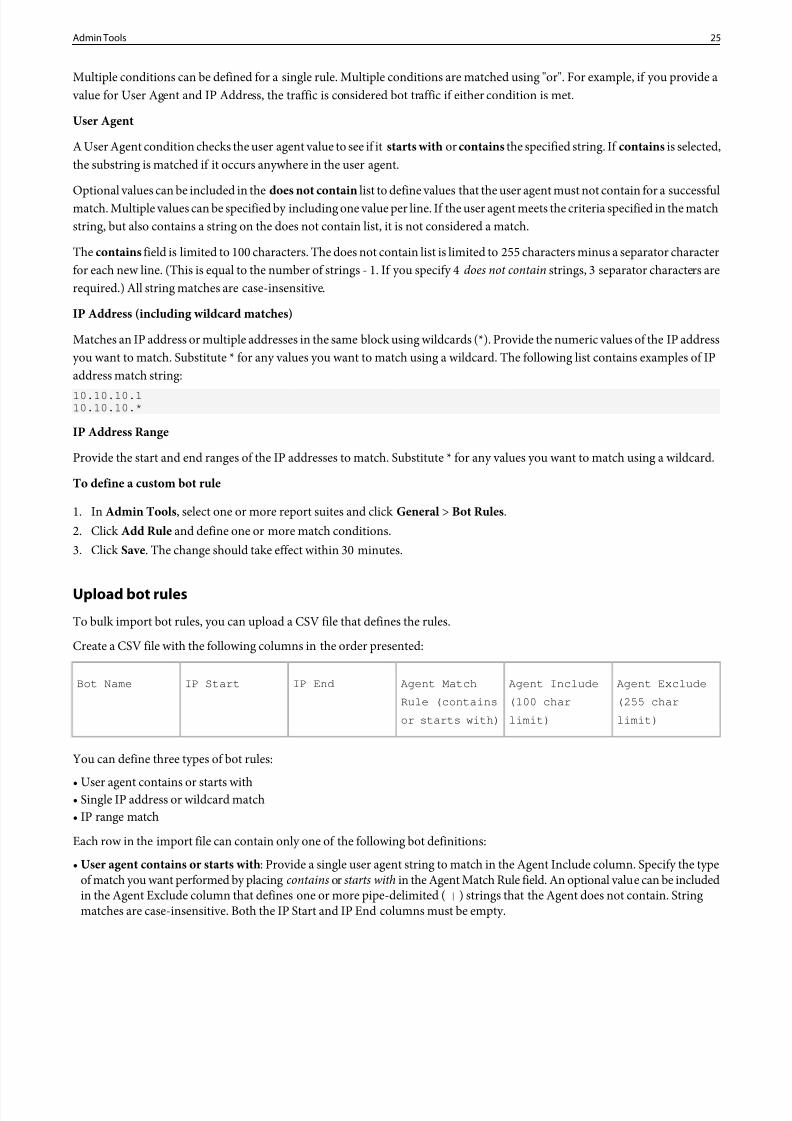
8/18/2019 Analytics Reference Adobe
http://slidepdf.com/reader/full/analytics-reference-adobe 25/332
Multiple conditions can be defined for a single rule. Multiple conditions are matched using "or". For example, if you provide a value for User Agent and IP Address, the traffic is considered bot traffic if either condition is met.
User Agent
A User Agent condition checks the user agent value to see if itstarts with or contains the specified string. Ifcontains is selected,the substring is matched if it occurs anywhere in the user agent.
Optional values can be included in the does not contain list to define values that the user agent must not contain for a successfulmatch. Multiple values can be specified by including one value per line. If the user agent meets the criteria specified in the matchstring, but also contains a string on the does not contain list, it is not considered a match.
The contains field is limited to 100 characters. The does not contain list is limited to 255 characters minus a separator characterfor each new line. (This is equal to the number of strings - 1. If you specify 4does not contain strings, 3 separator characters arerequired.) All string matches are case-insensitive.
IP Address (including wildcard matches)
Matches an IP address or multiple addresses in the same block using wildcards (*). Provide the numeric values of the IP addressyou want to match. Substitute * for any values you want to match using a wildcard. The following list contains examples of IPaddress match string:10.10.10.110.10.10.*
IP Address Range
Provide the start and end ranges of the IP addresses to match. Substitute * for any values you want to match using a wildcard.
To define a custom bot rule
1. In Admin Tools , select one or more report suites and clickGeneral > Bot Rules.2. ClickAdd Rule and define one or more match conditions.3. ClickSave. The change should take effect within 30 minutes.
Upload bot rules
To bulk import bot rules, you can upload a CSV file that defines the rules.
Create a CSV file with the following columns in the order presented:
Agent Exclude
(255 char
limit)
Agent Include
(100 char
limit)
Agent Match
Rule (contains
or starts with)
IP EndIP StartBot Name
You can define three types of bot rules:
• User agent contains or starts with• Single IP address or wildcard match• IP range match
Each row in the import file can contain only one of the following bot definitions:
• User agent contains or starts with : Provide a single user agent string to match in the Agent Include column. Specify the typeof match you want performed by placing contains or starts with in the Agent Match Rule field. An optional value can be includedin the Agent Exclude column that defines one or more pipe-delimited ( | ) strings that the Agent does not contain. Stringmatches are case-insensitive. Both the IP Start and IP End columns must be empty.
25Admin Tools
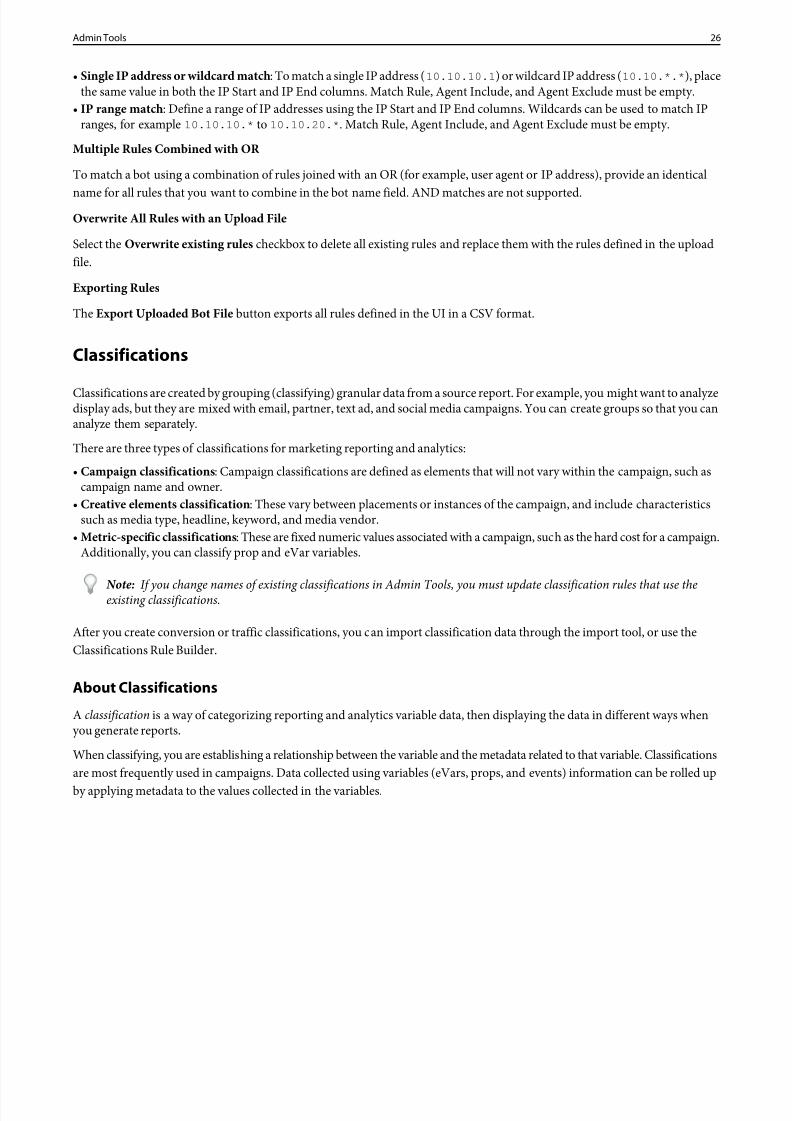
8/18/2019 Analytics Reference Adobe
http://slidepdf.com/reader/full/analytics-reference-adobe 26/332
• Single IP address or wildcard match : To match a single IP address (10.10.10.1 ) or wildcard IP address (10.10.*.* ), placethe same value in both the IP Start and IP End columns. Match Rule, Agent Include, and Agent Exclude must be empty.
• IP range match : Define a range of IP addresses using the IP Start and IP End columns. Wildcards can be used to match IPranges, for example 10.10.10.* to 10.10.20.* . Match Rule, Agent Include, and Agent Exclude must be empty.
Multiple Rules Combined with OR
To match a bot using a combination of rules joined with an OR (for example, user agent or IP address), provide an identical
name for all rules that you want to combine in the bot name field. AND matches are not supported.Overwrite All Rules with an Upload File
Select theOverwrite existing rules checkbox to delete all existing rules and replace them with the rules defined in the uploadfile.
Exporting Rules
The Export Uploaded Bot File button exports all rules defined in the UI in a CSV format.
Classifications
Classifications are created by grouping (classifying) granular data from a source report. For example, you might want to analyzedisplay ads, but they are mixed with email, partner, text ad, and social media campaigns. You can create groups so that you cananalyze them separately.
There are three types of classifications for marketing reporting and analytics:
• Campaign classifications : Campaign classifications are defined as elements that will not vary within the campaign, such ascampaign name and owner.
• Creative elements classification : These vary between placements or instances of the campaign, and include characteristicssuch as media type, headline, keyword, and media vendor.
• Metric-specific classifications : These are fixed numeric values associated with a campaign, such as the hard cost for a campaign.Additionally, you can classify prop and eVar variables.
Note: If you change names of existing classifications in Admin Tools, you must update classification rules that use theexisting classifications.
After you create conversion or traffic classifications, you can import classification data through the import tool, or use theClassifications Rule Builder.
About Classifications
A classification is a way of categorizing reporting and analytics variable data, then displaying the data in different ways whenyou generate reports.
When classifying, you are establishing a relationship between the variable and the metadata related to that variable. Classificationsare most frequently used in campaigns. Data collected using variables (eVars, props, and events) information can be rolled upby applying metadata to the values collected in the variables.
26Admin Tools
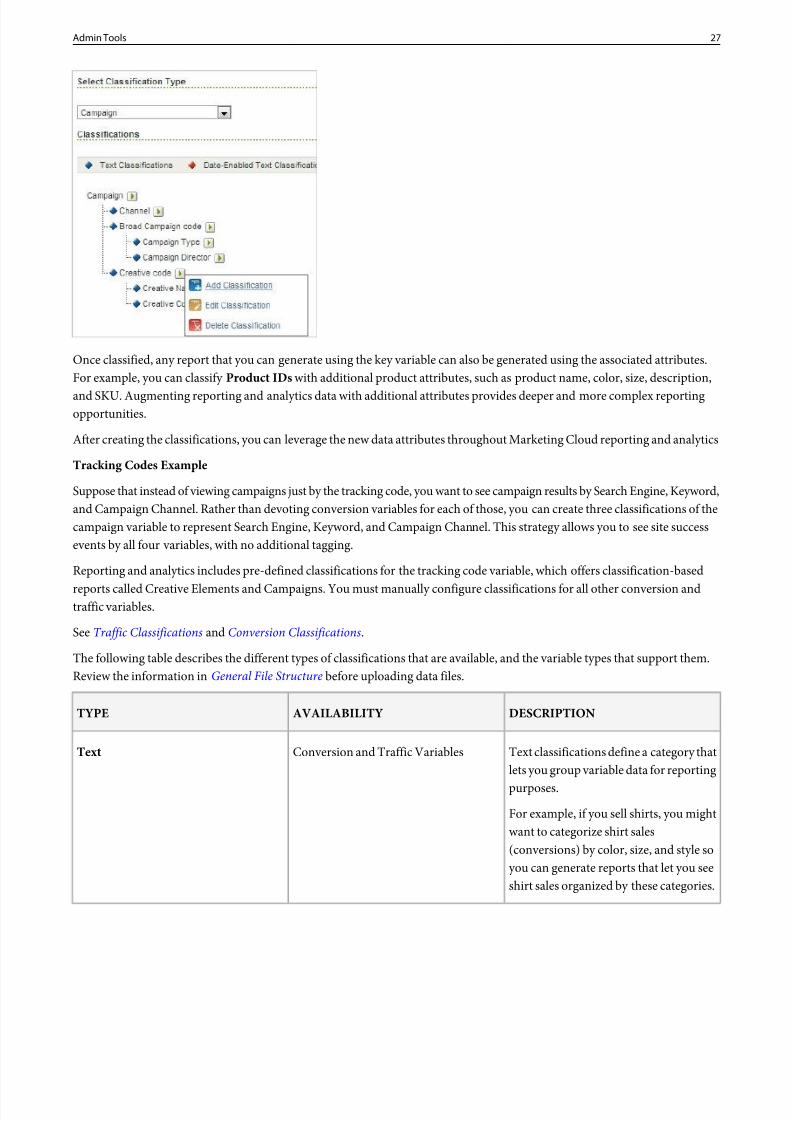
8/18/2019 Analytics Reference Adobe
http://slidepdf.com/reader/full/analytics-reference-adobe 27/332
Once classified, any report that you can generate using the key variable can also be generated using the associated attributes.For example, you can classifyProduct IDs with additional product attributes, such as product name, color, size, description,and SKU. Augmenting reporting and analytics data with additional attributes provides deeper and more complex reportingopportunities.
After creating the classifications, you can leverage the new data attributes throughout Marketing Cloud reporting and analytics
Tracking Codes Example
Suppose that instead of viewing campaigns just by the tracking code, you want to see campaign results by Search Engine, Keyword,and Campaign Channel. Rather than devoting conversion variables for each of those, you can create three classifications of thecampaign variable to represent Search Engine, Keyword, and Campaign Channel. This strategy allows you to see site successevents by all four variables, with no additional tagging.
Reporting and analytics includes pre-defined classifications for the tracking code variable, which offers classification-based
reports called Creative Elements and Campaigns. You must manually configure classifications for all other conversion andtraffic variables.
SeeTraffic Classifications and Conversion Classifications.
The following table describes the different types of classifications that are available, and the variable types that support them.Review the information in General File Structure before uploading data files.
DESCRIPTIONAVAILABILITYTYPE
Text classifications define a category thatlets you group variable data for reporting
purposes.
Conversion and Traffic VariablesText
For example, if you sell shirts, you mightwant to categorize shirt sales(conversions) by color, size, and style soyou can generate reports that let you seeshirt sales organized by these categories.
27Admin Tools
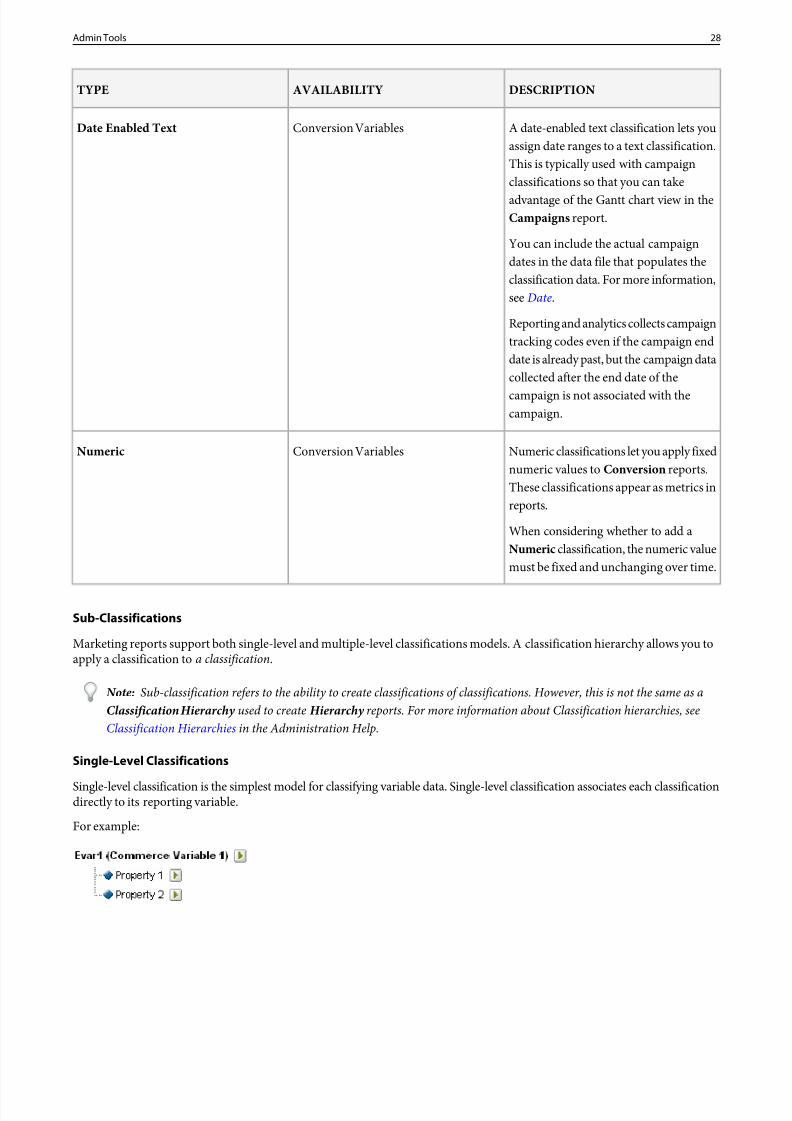
8/18/2019 Analytics Reference Adobe
http://slidepdf.com/reader/full/analytics-reference-adobe 28/332
DESCRIPTIONAVAILABILITYTYPE
A date-enabled text classification lets youassign date ranges to a text classification.
Conversion VariablesDate Enabled Text
This is typically used with campaignclassifications so that you can takeadvantage of the Gantt chart view in theCampaigns report.
You can include the actual campaigndates in the data file that populates theclassification data. For more information,see Date.
Reporting and analytics collects campaigntracking codes even if the campaign enddate is already past, but the campaign datacollected after the end date of the
campaign is not associated with thecampaign.
Numeric classifications let you apply fixednumeric values to Conversion reports.
Conversion VariablesNumeric
These classifications appear as metrics inreports.
When considering whether to add aNumeric classification, the numeric valuemust be fixed and unchanging over time.
Sub-Classifications
Marketing reports support both single-level and multiple-level classifications models. A classification hierarchy allows you toapply a classification toa classification.
Note: Sub-classification refers to the ability to create classifications of classifications. However, this is not the same as aClassification Hierarchy used to create Hierarchy reports. For more information about Classification hierarchies, seeClassification Hierarchies in the Administration Help.
Single-Level Classifications
Single-level classification is the simplest model for classifying variable data. Single-level classification associates each classificationdirectly to its reporting variable.
For example:
28Admin Tools
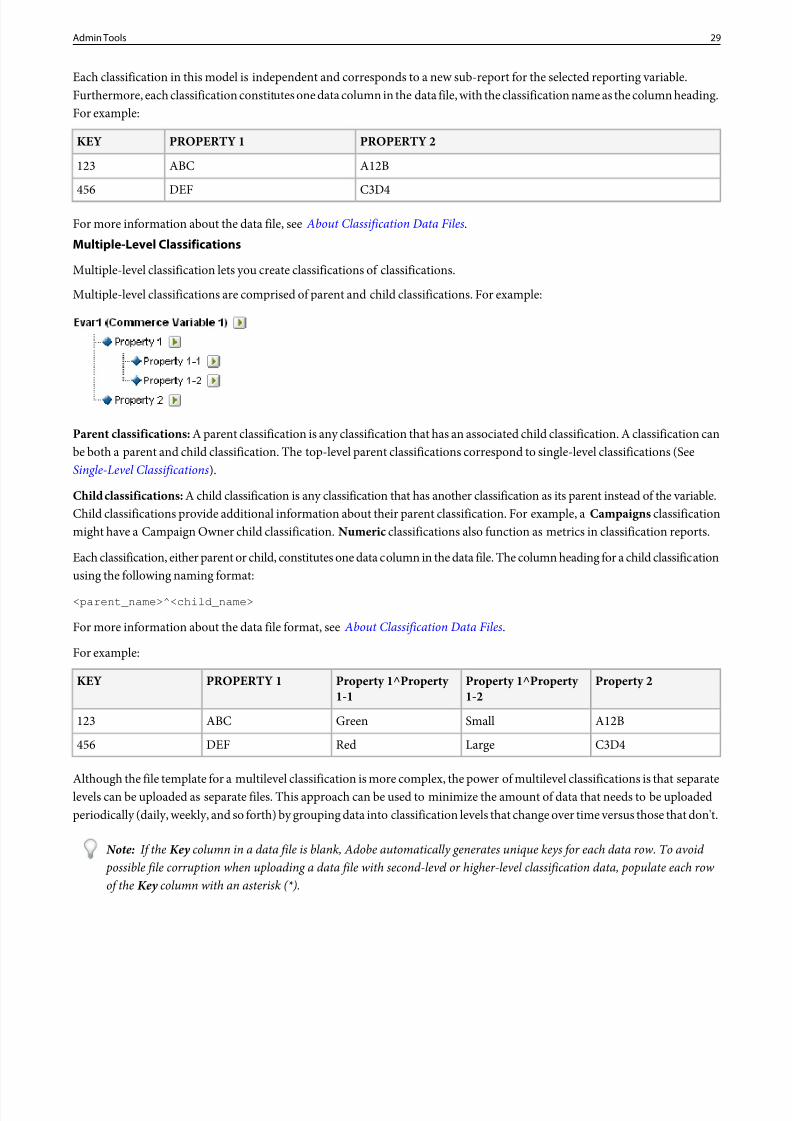
8/18/2019 Analytics Reference Adobe
http://slidepdf.com/reader/full/analytics-reference-adobe 29/332
Each classification in this model is independent and corresponds to a new sub-report for the selected reporting variable.Furthermore, each classification constitutes one data column in the data file, with the classification name as the column heading.For example:
PROPERTY 2PROPERTY 1KEY
A12BABC123
C3D4DEF456
For more information about the data file, see About Classification Data Files.Multiple-Level Classifications
Multiple-level classification lets you create classifications of classifications.
Multiple-level classifications are comprised of parent and child classifications. For example:
Parent classifications: A parent classification is any classification that has an associated child classification. A classification canbe both a parent and child classification. The top-level parent classifications correspond to single-level classifications (SeeSingle-Level Classifications).
Child classifications: A child classification is any classification that has another classification as its parent instead of the variable.Child classifications provide additional information about their parent classification. For example, aCampaigns classificationmight have a Campaign Owner child classification.Numeric classifications also function as metrics in classification reports.
Each classification, either parent or child, constitutes one data column in the data file. The column heading for a child classificationusing the following naming format:
<parent_name>^<child_name>
For more information about the data file format, see About Classification Data Files.
For example:
Property 2Property 1^Property 1-2
Property 1^Property 1-1
PROPERTY 1KEY
A12BSmallGreenABC123
C3D4LargeRedDEF456
Although the file template for a multilevel classification is more complex, the power of multilevel classifications is that separatelevels can be uploaded as separate files. This approach can be used to minimize the amount of data that needs to be uploadedperiodically (daily, weekly, and so forth) by grouping data into classification levels that change over time versus those that don't.
Note: If the Key column in a data file is blank, Adobe automatically generates unique keys for each data row. To avoid possible file corruption when uploading a data file with second-level or higher-level classification data, populate each rowof the Key column with an asterisk (*).
29Admin Tools
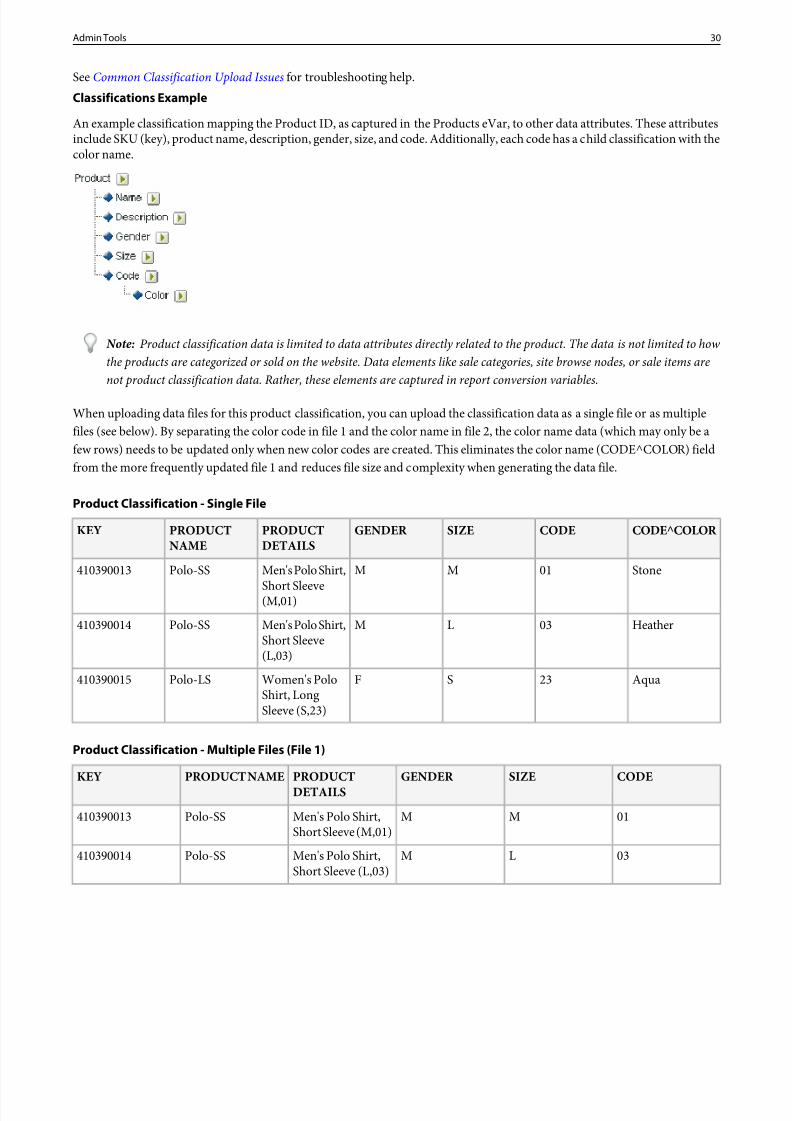
8/18/2019 Analytics Reference Adobe
http://slidepdf.com/reader/full/analytics-reference-adobe 30/332
SeeCommon Classification Upload Issues for troubleshooting help.Classifications Example
An example classification mapping the Product ID, as captured in the Products eVar, to other data attributes. These attributesinclude SKU (key), product name, description, gender, size, and code. Additionally, each code has a child classification with thecolor name.
Note: Product classification data is limited to data attributes directly related to the product. The data is not limited to howthe products are categorized or sold on the website. Data elements like sale categories, site browse nodes, or sale items arenot product classification data. Rather, these elements are captured in report conversion variables.
When uploading data files for this product classification, you can upload the classification data as a single file or as multiplefiles (see below). By separating the color code in file 1 and the color name in file 2, the color name data (which may only be afew rows) needs to be updated only when new color codes are created. This eliminates the color name (CODE^COLOR) fieldfrom the more frequently updated file 1 and reduces file size and complexity when generating the data file.
Product Classification - Single File
CODE^COLORCODESIZEGENDERPRODUCTDETAILS
PRODUCTNAME
KEY
Stone01MMMen's Polo Shirt,
Short Sleeve(M,01)
Polo-SS410390013
Heather03LMMen's Polo Shirt,Short Sleeve(L,03)
Polo-SS410390014
Aqua23SFWomen's PoloShirt, LongSleeve (S,23)
Polo-LS410390015
Product Classification - Multiple Files (File 1)
CODESIZEGENDERPRODUCTDETAILS
PRODUCT NAMEKEY
01MMMen's Polo Shirt,Short Sleeve (M,01)
Polo-SS410390013
03LMMen's Polo Shirt,Short Sleeve (L,03)
Polo-SS410390014
30Admin Tools
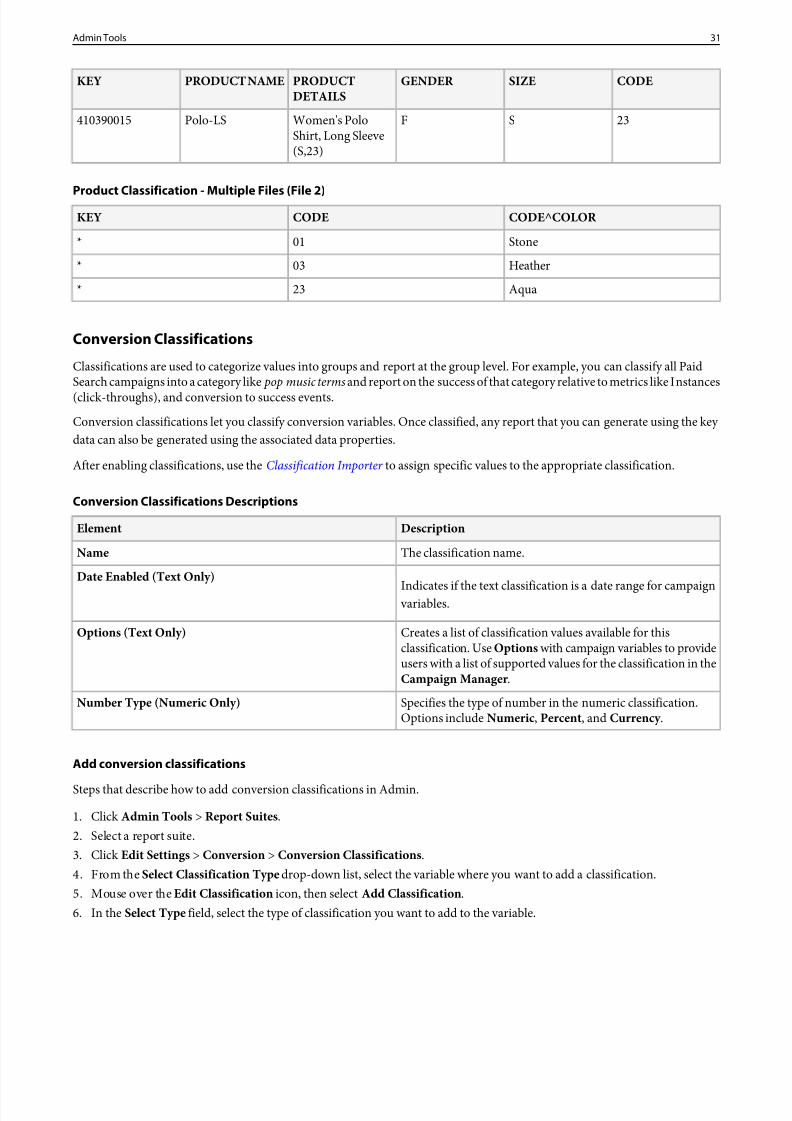
8/18/2019 Analytics Reference Adobe
http://slidepdf.com/reader/full/analytics-reference-adobe 31/332
CODESIZEGENDERPRODUCTDETAILS
PRODUCT NAMEKEY
23SFWomen's PoloShirt, Long Sleeve(S,23)
Polo-LS410390015
Product Classification - Multiple Files (File 2)CODE^COLORCODEKEY
Stone01*
Heather03*
Aqua23*
Conversion Classifications
Classifications are used to categorize values into groups and report at the group level. For example, you can classify all PaidSearch campaigns into a category like pop music terms and report on the success of that category relative to metrics like Instances(click-throughs), and conversion to success events.
Conversion classifications let you classify conversion variables. Once classified, any report that you can generate using the key data can also be generated using the associated data properties.
After enabling classifications, use theClassification Importer to assign specific values to the appropriate classification.
Conversion Classifications Descriptions
DescriptionElement
The classification name.Name
Indicates if the text classification is a date range for campaign variables.
Date Enabled (Text Only)
Creates a list of classification values available for thisclassification. UseOptions with campaign variables to provide
Options (Text Only)
users with a list of supported values for the classification in theCampaign Manager .
Specifies the type of number in the numeric classification.Options include Numeric , Percent , and Currency .
Number Type (Numeric Only)
Add conversion classifications
Steps that describe how to add conversion classifications in Admin.
1. ClickAdmin Tools > Report Suites .2. Select a report suite.3. ClickEdit Settings > Conversion > Conversion Classifications .4. From the Select Classification Type drop-down list, select the variable where you want to add a classification.5. Mouse over theEdit Classification icon, then select Add Classification .6. In the Select Type field, select the type of classification you want to add to the variable.
31Admin Tools
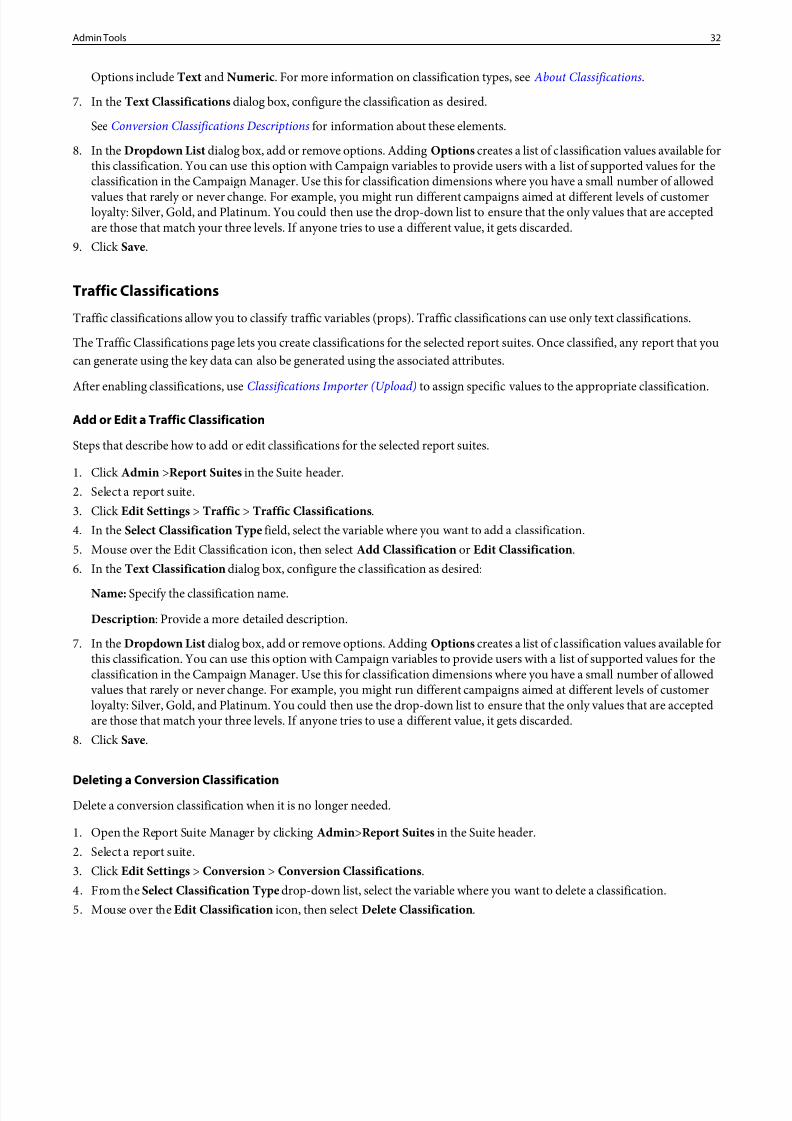
8/18/2019 Analytics Reference Adobe
http://slidepdf.com/reader/full/analytics-reference-adobe 32/332
Options include Text and Numeric . For more information on classification types, see About Classifications.
7. In the Text Classifications dialog box, configure the classification as desired.
SeeConversion Classifications Descriptions for information about these elements.
8. In the Dropdown List dialog box, add or remove options. AddingOptions creates a list of classification values available forthis classification. You can use this option with Campaign variables to provide users with a list of supported values for theclassification in the Campaign Manager. Use this for classification dimensions where you have a small number of allowed values that rarely or never change. For example, you might run different campaigns aimed at different levels of customerloyalty: Silver, Gold, and Platinum. You could then use the drop-down list to ensure that the only values that are acceptedare those that match your three levels. If anyone tries to use a different value, it gets discarded.
9. ClickSave.
Traffic Classifications
Traffic classifications allow you to classify traffic variables (props). Traffic classifications can use only text classifications.
The Traffic Classifications page lets you create classifications for the selected report suites. Once classified, any report that youcan generate using the key data can also be generated using the associated attributes.
After enabling classifications, useClassifications Importer (Upload) to assign specific values to the appropriate classification.Add or Edit a Traffic Classification
Steps that describe how to add or edit classifications for the selected report suites.
1. ClickAdmin >Report Suites in the Suite header.2. Select a report suite.3. ClickEdit Settings > Traffic > Traffic Classifications .4. In the Select Classification Type field, select the variable where you want to add a classification.5. Mouse over the Edit Classification icon, then selectAdd Classification or Edit Classification .6. In the Text Classification dialog box, configure the classification as desired:
Name: Specify the classification name.
Description : Provide a more detailed description.
7. In the Dropdown List dialog box, add or remove options. AddingOptions creates a list of classification values available forthis classification. You can use this option with Campaign variables to provide users with a list of supported values for theclassification in the Campaign Manager. Use this for classification dimensions where you have a small number of allowed values that rarely or never change. For example, you might run different campaigns aimed at different levels of customerloyalty: Silver, Gold, and Platinum. You could then use the drop-down list to ensure that the only values that are acceptedare those that match your three levels. If anyone tries to use a different value, it gets discarded.
8. ClickSave.
Deleting a Conversion ClassificationDelete a conversion classification when it is no longer needed.
1. Open the Report Suite Manager by clickingAdmin >Report Suites in the Suite header.2. Select a report suite.3. ClickEdit Settings > Conversion > Conversion Classifications .4. From the Select Classification Type drop-down list, select the variable where you want to delete a classification.5. Mouse over theEdit Classification icon, then select Delete Classification .
32Admin Tools
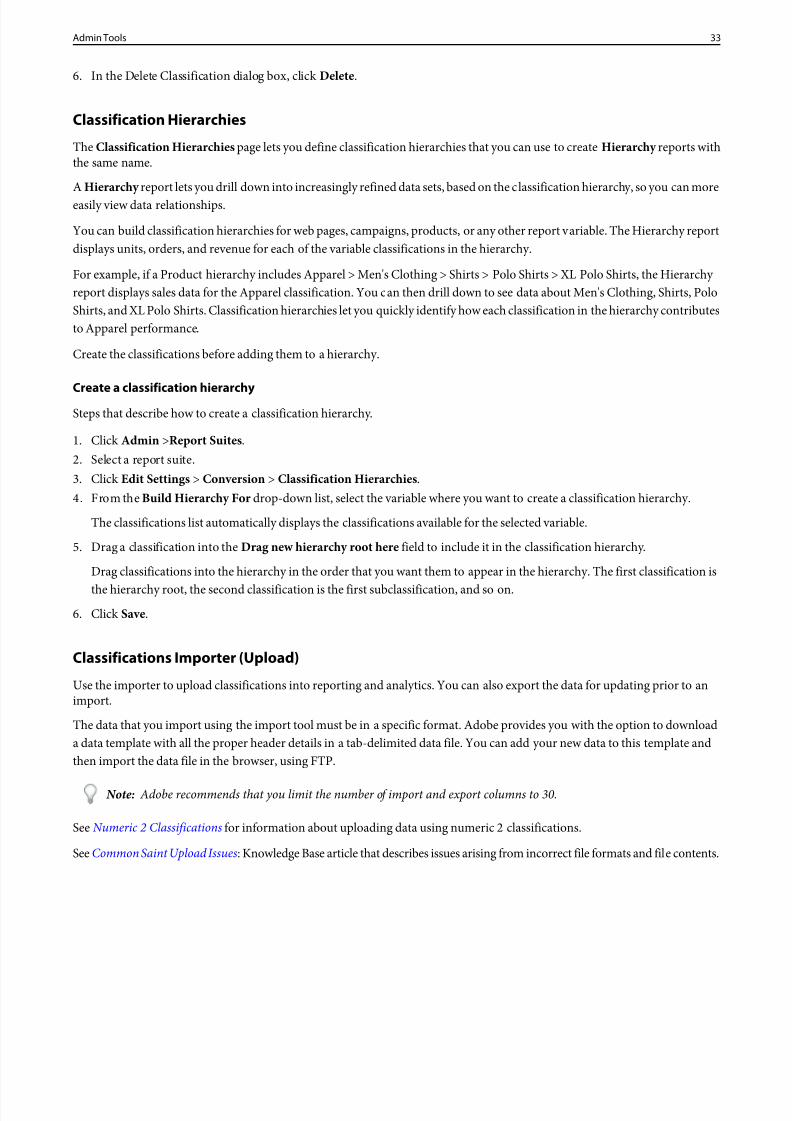
8/18/2019 Analytics Reference Adobe
http://slidepdf.com/reader/full/analytics-reference-adobe 33/332
6. In the Delete Classification dialog box, clickDelete .
Classification Hierarchies
The Classification Hierarchies page lets you define classification hierarchies that you can use to createHierarchy reports withthe same name.
A Hierarchy report lets you drill down into increasingly refined data sets, based on the classification hierarchy, so you can moreeasily view data relationships.
You can build classification hierarchies for web pages, campaigns, products, or any other report variable. The Hierarchy reportdisplays units, orders, and revenue for each of the variable classifications in the hierarchy.
For example, if a Product hierarchy includes Apparel > Men's Clothing > Shirts > Polo Shirts > XL Polo Shirts, the Hierarchy report displays sales data for the Apparel classification. You can then drill down to see data about Men's Clothing, Shirts, PoloShirts, and XL Polo Shirts. Classification hierarchies let you quickly identify how each classification in the hierarchy contributesto Apparel performance.
Create the classifications before adding them to a hierarchy.
Create a classification hierarchySteps that describe how to create a classification hierarchy.
1. ClickAdmin >Report Suites .2. Select a report suite.3. ClickEdit Settings > Conversion > Classification Hierarchies .4. From the Build Hierarchy For drop-down list, select the variable where you want to create a classification hierarchy.
The classifications list automatically displays the classifications available for the selected variable.
5. Drag a classification into theDrag new hierarchy root here field to include it in the classification hierarchy.
Drag classifications into the hierarchy in the order that you want them to appear in the hierarchy. The first classification is
the hierarchy root, the second classification is the first subclassification, and so on.6. ClickSave.
Classifications Importer (Upload)
Use the importer to upload classifications into reporting and analytics. You can also export the data for updating prior to animport.
The data that you import using the import tool must be in a specific format. Adobe provides you with the option to downloada data template with all the proper header details in a tab-delimited data file. You can add your new data to this template andthen import the data file in the browser, using FTP.
Note: Adobe recommends that you limit the number of import and export columns to 30.
SeeNumeric 2 Classifications for information about uploading data using numeric 2 classifications.
SeeCommon Saint Upload Issues: Knowledge Base article that describes issues arising from incorrect file formats and file contents.
33Admin Tools
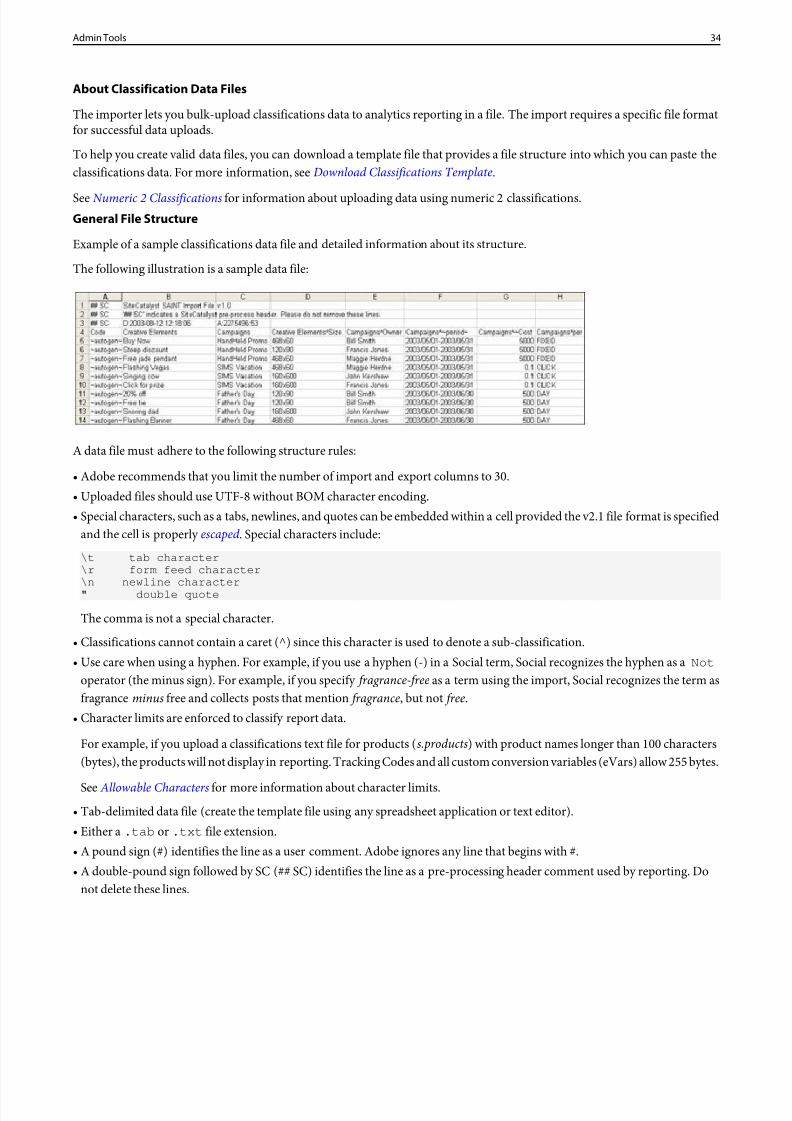
8/18/2019 Analytics Reference Adobe
http://slidepdf.com/reader/full/analytics-reference-adobe 34/332
About Classification Data Files
The importer lets you bulk-upload classifications data to analytics reporting in a file. The import requires a specific file formatfor successful data uploads.
To help you create valid data files, you can download a template file that provides a file structure into which you can paste theclassifications data. For more information, seeDownload Classifications Template.
SeeNumeric 2 Classifications for information about uploading data using numeric 2 classifications.General File Structure
Example of a sample classifications data file and detailed information about its structure.
The following illustration is a sample data file:
A data file must adhere to the following structure rules:
• Adobe recommends that you limit the number of import and export columns to 30.• Uploaded files should use UTF-8 without BOM character encoding.• Special characters, such as a tabs, newlines, and quotes can be embedded within a cell provided the v2.1 file format is specified
and the cell is properlyescaped . Special characters include:
\t tab character\r form feed character\n newline character" double quote
The comma is not a special character.
• Classifications cannot contain a caret (^) since this character is used to denote a sub-classification.• Use care when using a hyphen. For example, if you use a hyphen (-) in a Social term, Social recognizes the hyphen as aNot
operator (the minus sign). For example, if you specify fragrance-free as a term using the import, Social recognizes the term asfragrance minus free and collects posts that mention fragrance, but not free.
• Character limits are enforced to classify report data.
For example, if you upload a classifications text file for products (s.products) with product names longer than 100 characters(bytes), the products will not display in reporting. Tracking Codes and all custom conversion variables (eVars) allow 255 bytes.
See Allowable Characters for more information about character limits.• Tab-delimited data file (create the template file using any spreadsheet application or text editor).• Either a .tab or .txt file extension.• A pound sign (#) identifies the line as a user comment. Adobe ignores any line that begins with #.• A double-pound sign followed by SC (## SC) identifies the line as a pre-processing header comment used by reporting. Do
not delete these lines.
34Admin Tools
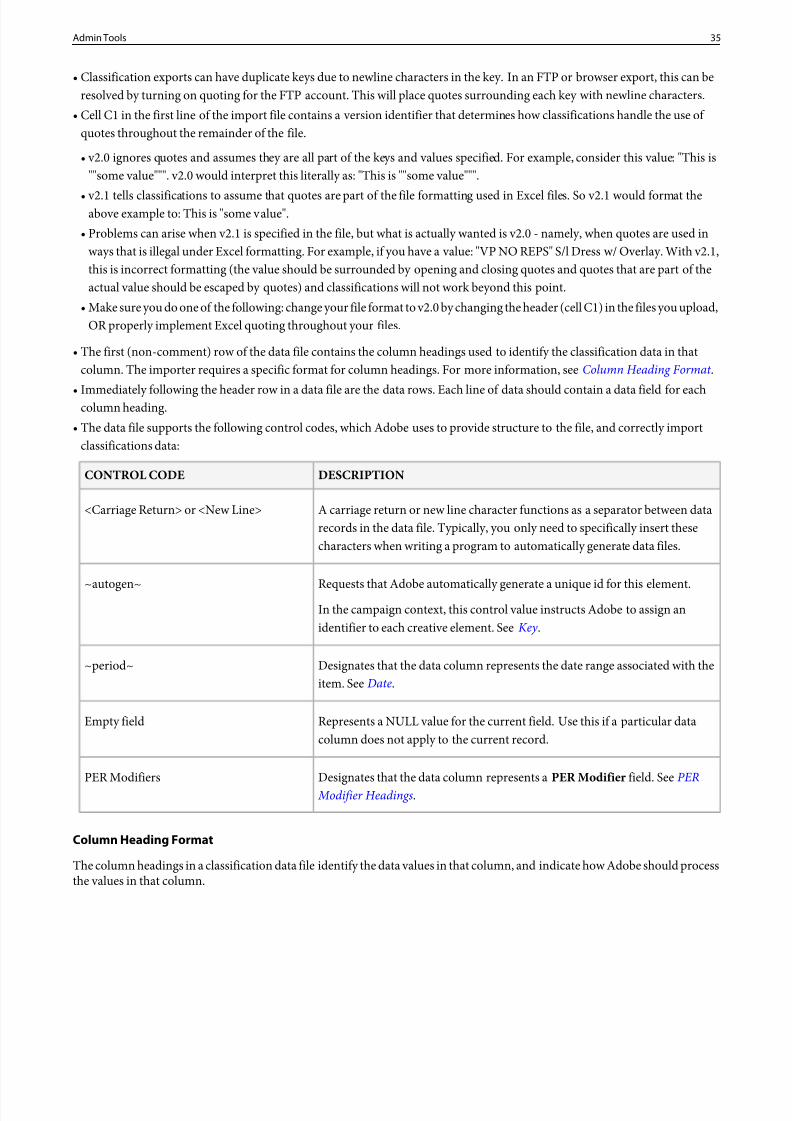
8/18/2019 Analytics Reference Adobe
http://slidepdf.com/reader/full/analytics-reference-adobe 35/332
• Classification exports can have duplicate keys due to newline characters in the key. In an FTP or browser export, this can beresolved by turning on quoting for the FTP account. This will place quotes surrounding each key with newline characters.
• Cell C1 in the first line of the import file contains a version identifier that determines how classifications handle the use of quotes throughout the remainder of the file.
• v2.0 ignores quotes and assumes they are all part of the keys and values specified. For example, consider this value: "This is""some value""". v2.0 would interpret this literally as: "This is ""some value""".
• v2.1 tells classifications to assume that quotes are part of the file formatting used in Excel files. So v2.1 would format theabove example to: This is "some value".
• Problems can arise when v2.1 is specified in the file, but what is actually wanted is v2.0 - namely, when quotes are used inways that is illegal under Excel formatting. For example, if you have a value: "VP NO REPS" S/l Dress w/ Overlay. With v2.1,this is incorrect formatting (the value should be surrounded by opening and closing quotes and quotes that are part of theactual value should be escaped by quotes) and classifications will not work beyond this point.
• Make sure you do one of the following: change your file format to v2.0 by changing the header (cell C1) in the files you upload,OR properly implement Excel quoting throughout your files.
• The first (non-comment) row of the data file contains the column headings used to identify the classification data in thatcolumn. The importer requires a specific format for column headings. For more information, see Column Heading Format .
• Immediately following the header row in a data file are the data rows. Each line of data should contain a data field for eachcolumn heading.
• The data file supports the following control codes, which Adobe uses to provide structure to the file, and correctly importclassifications data:
DESCRIPTIONCONTROL CODE
A carriage return or new line character functions as a separator between datarecords in the data file. Typically, you only need to specifically insert thesecharacters when writing a program to automatically generate data files.
<Carriage Return> or <New Line>
Requests that Adobe automatically generate a unique id for this element.~autogen~In the campaign context, this control value instructs Adobe to assign anidentifier to each creative element. SeeKey .
Designates that the data column represents the date range associated with theitem. SeeDate.
~period~
Represents a NULL value for the current field. Use this if a particular datacolumn does not apply to the current record.
Empty field
Designates that the data column represents a PER Modifier field. SeePER Modifier Headings.
PER Modifiers
Column Heading Format
The column headings in a classification data file identify the data values in that column, and indicate how Adobe should processthe values in that column.
35Admin Tools
8/18/2019 Analytics Reference Adobe
http://slidepdf.com/reader/full/analytics-reference-adobe 36/332
Note: Adobe recommends that you limit the number of import and export columns to 30.
Classification files support the following column headings:Key
A column heading of Key indicates that the column data represents a unique identifier for each data record (row).
Each value must be unique across the entire system. The value in this field corresponds to a value assigned to the Analyticss_campaign variable in your Web site’s JavaScript beacon (s_code.js ). Data in this column might include ~autogen~ orany other unique tracking code.Classification
A Classification column heading contains the classification name.
For example, reports and analytics automatically include two classifications forCampaign variables:Campaigns and CreativeElements . To add data to the Campaigns classification, the column heading in the classification data file would beCampaigns .
Note: The values in the Classifications column heading must exactly match the classification’ s naming convention, or theimport fails. For example, if the administrator changes Campaigns to Internal Campaign Names in the Campaign Set-up Manager , the file column heading must change to match.
Additionally, the data file supports the following additional heading conventions to identify sub-classifications and otherspecialized data columns:Sub-Classification HeadingTo create a sub-classification column heading, use a caret (^) character to combine the classification name with thesub-classification name.
For example,Campaigns^Owner is a column heading for the column containing Campaign Owner values. Similarly,CreativeElements^Size is a column heading for the column containing the Size sub-classification of theCreative Elements classification.Classification Metric HeadingsClassification Metrics headings are denoted by using the caret (^) and tilde (~) characters to combine the classification namewith the specific classification metric.
For example, Campaigns^~Cost refers to the Cost metric in the Campaigns classification.PER Modifier HeadingsImmediately following a classification metric column, you must have aPER Modifier column that indicates the calculation toperform with the value in the classification metric field.
Per Modifier headings are denoted by adding ~per to the classification metric heading. For example, if theMetric heading isCampaigns^~Cost , the PER modifier heading isCampaigns^~Cost~per . Adobe supports the followingPER Modifier keywords:
These characters have special meaning in a data file. Where possible, avoid using these words in attribute names and data.
FIXED: Fixed value. Do not perform any scaling.
DAY: Multiply the value by the number of days in the report.
ORDER: Multiply the value by the number of orders for the line item in the report.
CHECKOUT: Multiply the value by the number of checkouts for the line item in the report.
UNIT: Multiply the value by the number of units for the line item in the report.
REVENUE: Multiply the value by the revenue amount for the line item in the report.
SCADD: Multiply the value by the number of times theShopping Cart Add event was called per line item in the report.
36Admin Tools
8/18/2019 Analytics Reference Adobe
http://slidepdf.com/reader/full/analytics-reference-adobe 37/332
SCREMOVE: Multiply the value by the number of times theShopping Cart Remove event was called per line item in the report.
INSTANCE: Multiply the value by the number of instances for the line item in the report.
CLICK: Multiply the value by the number of clicks for the line item in the report.
EVENT: Multiply the value by the number of times the specified custom event occurred per line item of the report.
Example: If Campaign A cost $10,000, the Campaigns^~Cost column contains a value of 10000 and theCampaigns^~Cost~per
column contains FIXED. When displaying the Cost for Campaign A in the reports, you will see $10,000 as the fixed cost forCampaign A for the date range.
Example: If Campaign B that costs approximately $2 per click, theCampaigns^~Cost column contains 2 and theCampaigns^~Cost~per column contains CLICK. When displaying the Cost for Campaign B in the reports, Adobe calculates(2 * [number of clicks]) on the fly for the date range of the report. This gives you a total cost calculation based on the numberof clicks performed with Campaign B.Date
If a classification is date-enabled, the data file must include aDate column. Date headers are denoted by adding ̂ ~period~ tothe classification name. For example: Campaigns^~period~.
Campaigns dates are typically ranges (start and end dates) associated with individual campaigns. Dates should appear inYYYY/MM/DD format. For example, 2013/06/15-2013/06/30.
For more information, see Conversion Classifications.
Using dates in conjunction with classifications
SAINT can be used to assign date ranges to your campaigns or other conversion classifications, which allows more accuratecampaign measurement. After specifying a value's date range, any matching value that occurs outside the date range will not beclassified. This is useful for campaign measurement that wishes to utilize the exact dates a campaign was Live, and not all hitsmatching the campaign itself. In order to successfully classify a value with a date range, the following must be met:
• The classification must be based on a conversion variable.• The classification used must be set as Date-Enabled or Numeric 2.• The involved date range must contain a start date and (optionally) an end date.
To classify campaigns based on date range:
1. Login to Reports & Analytics and go to Admin | SAINT Classifications.2. Click theBrowser Export tab, ensure the settings to your date-enabled classification are correct, then click Export File.3. Open this file in Microsoft Excel or another spreadsheet editor you are familiar with.4. One of the columns will end with ^~period~ which is the column to enter the date range in.5. Under this column, enter each value's date range in the following format:
YYYY/MM/DD - YYYY/MM/DD . Please ensure the following:
• Leave spaces on both sides of the dash.
• Use a hyphen (-) to separate ranges, not an en-dash or an em-dash.• If the month or day is a single digit, that there is a leading zero.• There is a start date range; the end date range is optional.
6. Save the file, and upload it in the Reports & Analytics interface by going to Admin | SAINT Classifications | Import File.
Note: A specific key value cannot have more than one date range.
37Admin Tools
8/18/2019 Analytics Reference Adobe
http://slidepdf.com/reader/full/analytics-reference-adobe 38/332
Troubleshooting Classifications
Information about how to troubleshoot issues occurring when uploading classifications.• Common Saint Upload Issues: Knowledge Base article that describes issues arising from incorrect file formats and file contents.
Delete classification data
Steps that describe how to delete or remove classification data.
1. ClickAdmin Tools > Classification Importer .2. ClickBrowser Export .3. Select the report suite and data set you would like to remove classification data from.4. Adjust any optional settings to filter specific data you're looking for, then clickExport File .5. Once the file has been downloaded, open the file and replace any values you wish to delete with~empty~ .
Alternatively, use~deletekey~ . This command treats the classification as if it never occurred for the specified key. Itcompletely removes it and any column data from the lookup tables.
Caveat: You only need one column containing ~deletekey~ . The ~empty~ command works at the cell level (key andcolumn combination), so you need ~empty~ in the classification column you want to remove. However,~deletekey~
works at the row level (the key and all associated metadata), so it only needs to appear in one of the columns in the row. Thiscommand removes all metadata from the row. Adobe interprets this as though the key was never classified, and displays itin the None category.
6. Save the file, and upload it using theImport File tab.After you upload the file, the system recognizes~empty~ as a command to delete that classification value.
Properties of this Command
• ~empty~ must be lowercase without spaces. The following entries are invalid:• ~EMPTY~• ~ empty ~• ~Empty~
• You cannot delete values within the key column. This is data passed directly into reporting and is permanent.• If you are removing a classification value that has subclassifications, they are also removed. Classifications cannot exist
without a key value, and a subclassification's parent is its key value.• It is possible to remove subclassification data while leaving its parent classification intact.
Escape classification data
Steps that describe how to escape classification data in the classification file.
1. Ensure that the classification file format is v2.1.
If v2.1 is enabled, you will see a line similar to :
## SC SiteCatalyst SAINT Import File v:2.1
Note: To specify a format of v2.1, enableQuoted Output when exporting the file on the Classification Importer page( Browser Export or FTP Export ).
SeeBrowser Export .
2. Surround the field containing special characters in double quotes (").
38Admin Tools
8/18/2019 Analytics Reference Adobe
http://slidepdf.com/reader/full/analytics-reference-adobe 39/332
A double quote character can appear in an escaped cell by replacing it with two double quote characters (""). For example:
My String "of data"
Escaped would be:
"My String ""of data"""
Non-Classified KeysNon-classified keys are grouped together in classification reports as a single line item labeledNone. It can be useful to renameNone to something more descriptive.
For example, suppose your tracking codes contain information that delineates the type of mobile campaign the tracking codeis associated with. You are using classification (Mobile Campaign Type) to group these tracking codes into categories such asMobile Web, iOS Application, Android Application, and so on. Some campaigns might not be mobile campaigns and aretherefore not classified with a mobile campaign type. All non-classified tracking codes would be grouped underNone in theMobile Campaign Type report.Rename the None classification key
Steps that describe how to rename a non-classified key that displays asnone in reporting.
1. Using the importer, export classifications to a local file.2. Add a row to the file, and type~none~ in the Key column.3. In the row you added, type the more descriptive name in the appropriate classification column(s).
To follow the example in this documentation, you might type "non-mobile campaign" in a column named Mobile CampaignName .
This entry renames None to non-mobile campaign in the Mobile Campaign Type report.
4. Import the data back into the system.
Download Classifications Template
(Optional) Before importing classifications into marketing reports, you can download a template that helps you create aclassifications data file. The data file uses your desired classifications as column headings, then organizes the reporting data setunder the appropriate classification headings.
Admin Tools > Classification Importer .
DescriptionElement
Select the report suite to use in the template. The report suite and data set must match.Select Report Suite
Select the type of data for the data file. The menu includes all reports in your report suites that areconfigured for classifications.
Data Set to beClassified
You can import numeric 2 classifications into the system via the importer. Numeric 2 classifications areuseful for variables that change over time for different items, such as cost and budget values for the
Export Numeric 2
Marketing Channel report. See Numeric 2 Classifications for information about uploading data usingnumeric 2 classifications.
Select the character encoding for the data file. The default encoding format is UTF-8.Encoding
Downloads the template file.Download
39Admin Tools
8/18/2019 Analytics Reference Adobe
http://slidepdf.com/reader/full/analytics-reference-adobe 40/332
The template includes the currently defined classifications (column headings) of a specific data set without including the dataassociated with each classification.
Note: The Template method limits your classification data download to a single report suite.
For more information about the data file structure, see About Classification Data Files.Download a classifications data template (optional)
Steps describing how to download a classifications data template. The template provides the file format you must follow forclassifications.
Note: The Template method limits your data download to a single report suite.
1. ClickAdmin Tools > Classification Importer .2. On the Download Template tab, specify thedata template configuration .3. ClickDownload .4. Save the template file to your local system.
The template file is a tab-delimited data file (.tab filename extension) that most spreadsheet applications support.
Import File
After you have copied the appropriate data into the classifications template file, you can import (upload) into Adobe datacollection servers.
Note: You do not need to download (using the export feature) your existing classification data before uploading new data.You only need to upload a new file containing the new rows of data. This method improves performance.
SeeGeneral File Structure for important information about the structure and limitations of uploaded files.
SeeCommon Classification Upload Issues for troubleshooting help.
Browser Import
You can import (upload) classifications data using the browser. This method limits your classification data upload to a singlereport suite
Admin Tools > Classification Importer
Classifications Browser Import - Field Descriptions
DescriptionElement
The report suite where you want to import the classifications data. The importdata file must match the format of the data set in the report suite.
Select Report Suite
The data set to receive the classifications. The drop-down list includes all reportsin your report suites that are configured for classifications.
Data Set to be Classified
Lets you browse to locate the import data file you want to upload.Select file to Import
Note: The upload file size limit is 1 MB.
40Admin Tools
8/18/2019 Analytics Reference Adobe
http://slidepdf.com/reader/full/analytics-reference-adobe 41/332
DescriptionElement
Automatically overwrites existing data that conflicts with the imported data.Overwrite Data on Conflicts
Automatically downloads a tab-delimited file that represents the data set with thenewly uploaded classifications data. Adobe automatically generates this file foryou if the import creates any unique IDs, or if any errors occur.
Automatically Download Classification FileAfter the Import is Complete
Import classifications via the browser
Steps that describe how to upload classification data files via the web browser.
1. ClickAdmin Tools > Classification Importer .2. Click Import File .3. Configure the Browser Import fields.4. Click Import File .5. Watch the status window for processing messages.6. (Conditional) If you selectedAutomatically Download Classification File After Upload is Complete , specify where you
want to store the resulting file when processing completes.A successful import immediately displays the appropriate changes in an export. However, data changes in reports take up tofour hours when using a browser import and up to 24 hours when using an FTP import.FTP Import
Steps that describe how to upload data files via FTP.
Admin Tools > Classification Importer .
The following recommended limits are important:
• Lots of small files will result in slower processing than a few large files. This is due to the amount of queueing and prioritizingrequired for the smaller jobs.
• Please break large files into 50 MB chunks. This is not required, but is recommended because it gives better visibility intoprogress on the back end. Also, if errors occur while we are process your job, the job will be restarted; large files result in largeamounts of work redone in this scenario.
The initial setup populates the classifications database with a large set of original data, or restructures the classifications, ratherthan reclassifying a few rows or adding rows.
Following an initial upload in a report suite (for a given variable or report), Adobe recommends uploading only new and updatedrows in subsequent imports. Rows that are not being changed should be omitted from future uploads.
Each new key value you upload counts against your uniques for that variable for the month.
If you have exceeded your uniques for the month, you will not see the corresponding classifications data for the uniques exceeded values in reporting. You can see those classifications in either data warehouse or ad hoc analysis.
Note: The time required to process a classification data file varies on the size of the file and the current number of filesalready being processed by Adobe’ s servers. Processing of data files usually takes no longer than 72 hours.
Before uploading data via FTP, create an FTP account. For more information, seeCreate an FTP account .
41Admin Tools
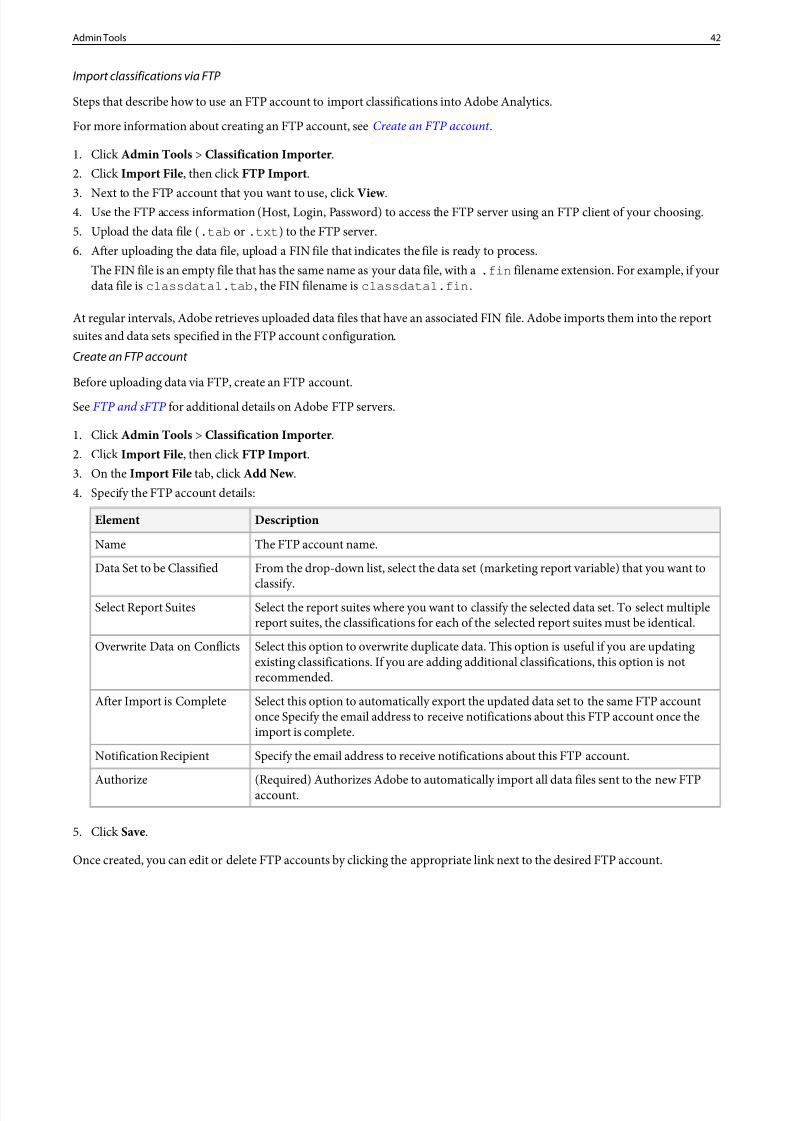
8/18/2019 Analytics Reference Adobe
http://slidepdf.com/reader/full/analytics-reference-adobe 42/332
Import classifications via FTP
Steps that describe how to use an FTP account to import classifications into Adobe Analytics.
For more information about creating an FTP account, see Create an FTP account .
1. ClickAdmin Tools > Classification Importer .2. Click Import File , then click FTP Import .
3. Next to the FTP account that you want to use, clickView .4. Use the FTP access information (Host, Login, Password) to access the FTP server using an FTP client of your choosing.5. Upload the data file (.tab or .txt ) to the FTP server.6. After uploading the data file, upload a FIN file that indicates the file is ready to process.
The FIN file is an empty file that has the same name as your data file, with a.fin filename extension. For example, if yourdata file isclassdata1.tab , the FIN filename isclassdata1.fin .
At regular intervals, Adobe retrieves uploaded data files that have an associated FIN file. Adobe imports them into the reportsuites and data sets specified in the FTP account configuration.Create an FTP account
Before uploading data via FTP, create an FTP account.
SeeFTP and sFTP for additional details on Adobe FTP servers.
1. ClickAdmin Tools > Classification Importer .2. Click Import File , then click FTP Import .3. On the Import File tab, clickAdd New .4. Specify the FTP account details:
DescriptionElement
The FTP account name.Name
From the drop-down list, select the data set (marketing report variable) that you want to
classify.
Data Set to be Classified
Select the report suites where you want to classify the selected data set. To select multiplereport suites, the classifications for each of the selected report suites must be identical.
Select Report Suites
Select this option to overwrite duplicate data. This option is useful if you are updatingexisting classifications. If you are adding additional classifications, this option is notrecommended.
Overwrite Data on Conflicts
Select this option to automatically export the updated data set to the same FTP accountonce Specify the email address to receive notifications about this FTP account once theimport is complete.
After Import is Complete
Specify the email address to receive notifications about this FTP account.Notification Recipient
(Required) Authorizes Adobe to automatically import all data files sent to the new FTPaccount.Authorize
5. ClickSave.
Once created, you can edit or delete FTP accounts by clicking the appropriate link next to the desired FTP account.
42Admin Tools
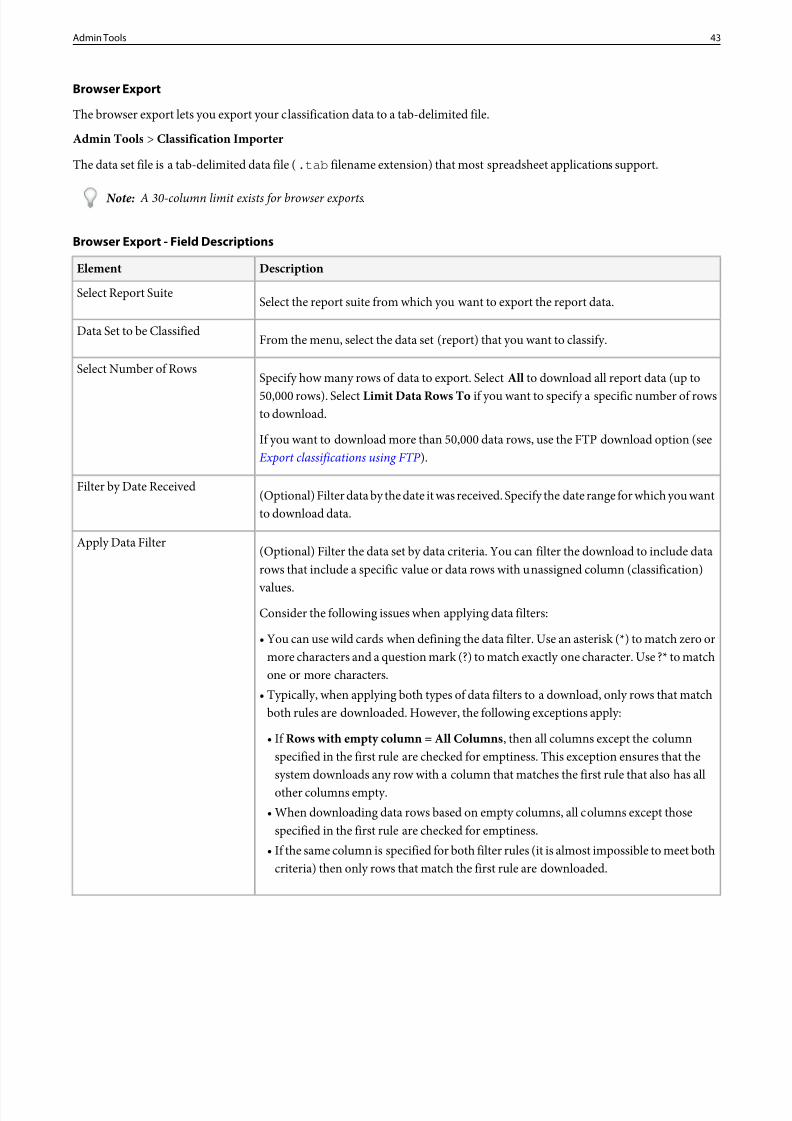
8/18/2019 Analytics Reference Adobe
http://slidepdf.com/reader/full/analytics-reference-adobe 43/332
Browser Export
The browser export lets you export your classification data to a tab-delimited file.
Admin Tools > Classification Importer
The data set file is a tab-delimited data file (.tab filename extension) that most spreadsheet applications support.
Note: A 30-column limit exists for browser exports.
Browser Export - Field Descriptions
DescriptionElement
Select the report suite from which you want to export the report data.Select Report Suite
From the menu, select the data set (report) that you want to classify.Data Set to be Classified
Specify how many rows of data to export. SelectAll to download all report data (up to50,000 rows). Select Limit Data Rows To if you want to specify a specific number of rowsto download.
Select Number of Rows
If you want to download more than 50,000 data rows, use the FTP download option (seeExport classifications using FTP ).
(Optional) Filter data by the date it was received. Specify the date range for which you wantto download data.
Filter by Date Received
(Optional) Filter the data set by data criteria. You can filter the download to include datarows that include a specific value or data rows with unassigned column (classification)
values.
Apply Data Filter
Consider the following issues when applying data filters:
• You can use wild cards when defining the data filter. Use an asterisk (*) to match zero ormore characters and a question mark (?) to match exactly one character. Use ?* to matchone or more characters.
• Typically, when applying both types of data filters to a download, only rows that matchboth rules are downloaded. However, the following exceptions apply:
• If Rows with empty column = All Columns , then all columns except the columnspecified in the first rule are checked for emptiness. This exception ensures that thesystem downloads any row with a column that matches the first rule that also has allother columns empty.
• When downloading data rows based on empty columns, all columns except thosespecified in the first rule are checked for emptiness.
• If the same column is specified for both filter rules (it is almost impossible to meet bothcriteria) then only rows that match the first rule are downloaded.
43Admin Tools
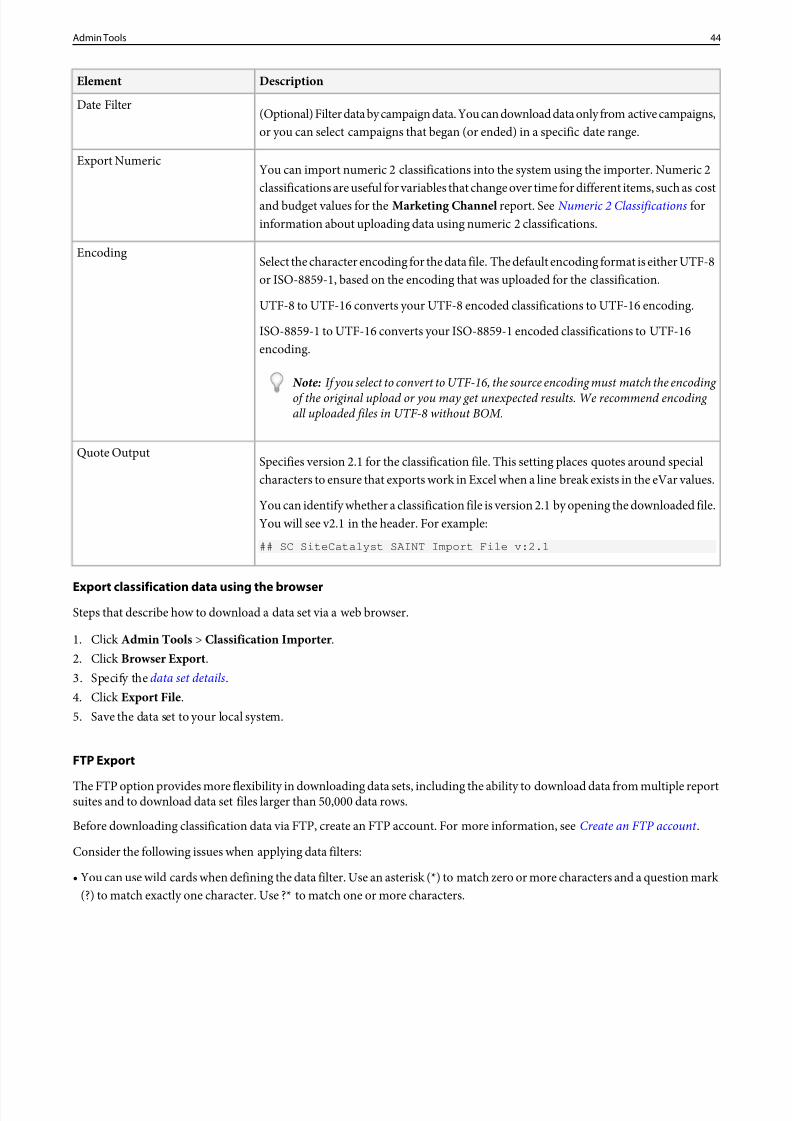
8/18/2019 Analytics Reference Adobe
http://slidepdf.com/reader/full/analytics-reference-adobe 44/332
DescriptionElement
(Optional) Filter data by campaign data. You can download data only from active campaigns,or you can select campaigns that began (or ended) in a specific date range.
Date Filter
You can import numeric 2 classifications into the system using the importer. Numeric 2classifications are useful for variables that change over time for different items, such as cost
Export Numeric
and budget values for the Marketing Channel report. See Numeric 2 Classifications forinformation about uploading data using numeric 2 classifications.
Select the character encoding for the data file. The default encoding format is either UTF-8or ISO-8859-1, based on the encoding that was uploaded for the classification.
Encoding
UTF-8 to UTF-16 converts your UTF-8 encoded classifications to UTF-16 encoding.
ISO-8859-1 to UTF-16 converts your ISO-8859-1 encoded classifications to UTF-16encoding.
Note: If you select to convert to UTF-16, the source encoding must match the encoding of the original upload or you may get unexpected results. We recommend encoding all uploaded files in UTF-8 without BOM.
Specifies version 2.1 for the classification file. This setting places quotes around specialcharacters to ensure that exports work in Excel when a line break exists in the eVar values.
Quote Output
You can identify whether a classification file is version 2.1 by opening the downloaded file.You will see v2.1 in the header. For example:
## SC SiteCatalyst SAINT Import File v:2.1
Export classification data using the browserSteps that describe how to download a data set via a web browser.
1. ClickAdmin Tools > Classification Importer .2. ClickBrowser Export .3. Specify thedata set details .4. ClickExport File .5. Save the data set to your local system.
FTP Export
The FTP option provides more flexibility in downloading data sets, including the ability to download data from multiple reportsuites and to download data set files larger than 50,000 data rows.
Before downloading classification data via FTP, create an FTP account. For more information, seeCreate an FTP account .
Consider the following issues when applying data filters:
• You can use wild cards when defining the data filter. Use an asterisk (*) to match zero or more characters and a question mark (?) to match exactly one character. Use ?* to match one or more characters.
44Admin Tools
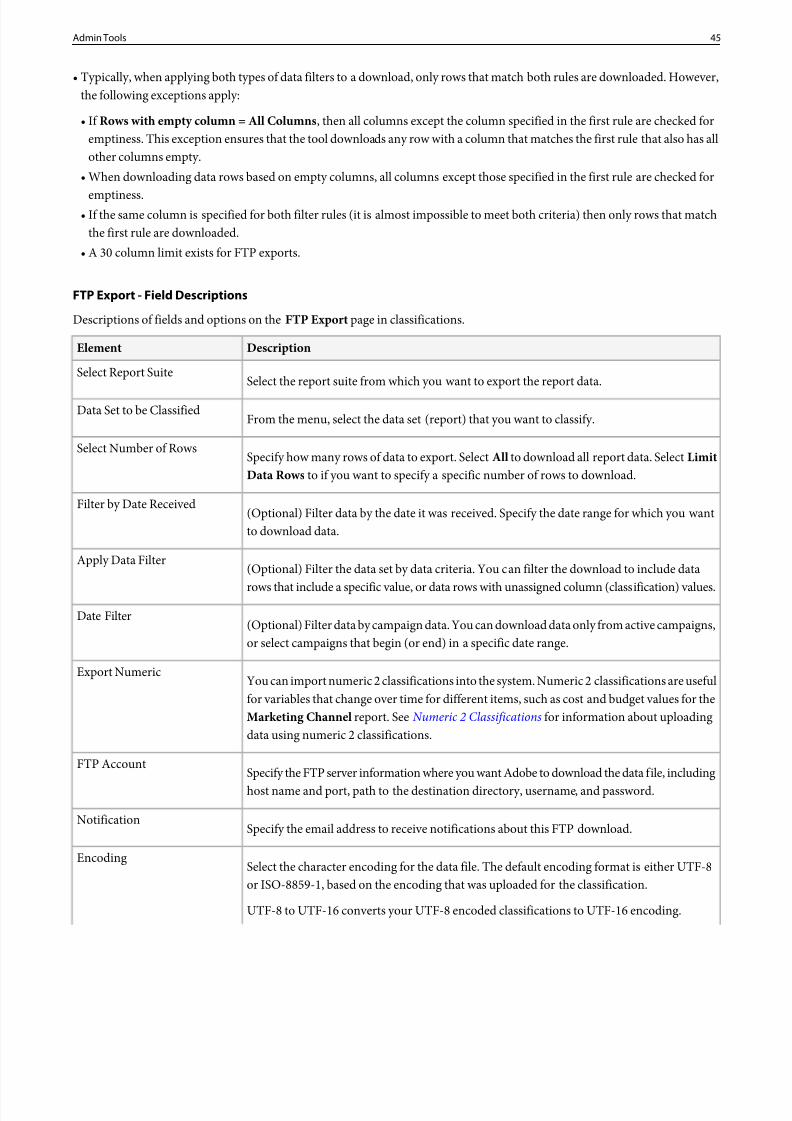
8/18/2019 Analytics Reference Adobe
http://slidepdf.com/reader/full/analytics-reference-adobe 45/332
• Typically, when applying both types of data filters to a download, only rows that match both rules are downloaded. However,the following exceptions apply:
• If Rows with empty column = All Columns , then all columns except the column specified in the first rule are checked foremptiness. This exception ensures that the tool downloads any row with a column that matches the first rule that also has allother columns empty.
• When downloading data rows based on empty columns, all columns except those specified in the first rule are checked for
emptiness.• If the same column is specified for both filter rules (it is almost impossible to meet both criteria) then only rows that match
the first rule are downloaded.• A 30 column limit exists for FTP exports.
FTP Export - Field Descriptions
Descriptions of fields and options on the FTP Export page in classifications.
DescriptionElement
Select the report suite from which you want to export the report data.Select Report Suite
From the menu, select the data set (report) that you want to classify.Data Set to be Classified
Specify how many rows of data to export. SelectAll to download all report data. Select LimitData Rows to if you want to specify a specific number of rows to download.
Select Number of Rows
(Optional) Filter data by the date it was received. Specify the date range for which you wantto download data.
Filter by Date Received
(Optional) Filter the data set by data criteria. You can filter the download to include data
rows that include a specific value, or data rows with unassigned column (classification) values.
Apply Data Filter
(Optional) Filter data by campaign data. You can download data only from active campaigns,or select campaigns that begin (or end) in a specific date range.
Date Filter
You can import numeric 2 classifications into the system. Numeric 2 classifications are usefulfor variables that change over time for different items, such as cost and budget values for the
Export Numeric
Marketing Channel report. See Numeric 2 Classifications for information about uploadingdata using numeric 2 classifications.
Specify the FTP server information where you want Adobe to download the data file, includinghost name and port, path to the destination directory, username, and password.
FTP Account
Specify the email address to receive notifications about this FTP download.Notification
Select the character encoding for the data file. The default encoding format is either UTF-8or ISO-8859-1, based on the encoding that was uploaded for the classification.
Encoding
UTF-8 to UTF-16 converts your UTF-8 encoded classifications to UTF-16 encoding.
45Admin Tools
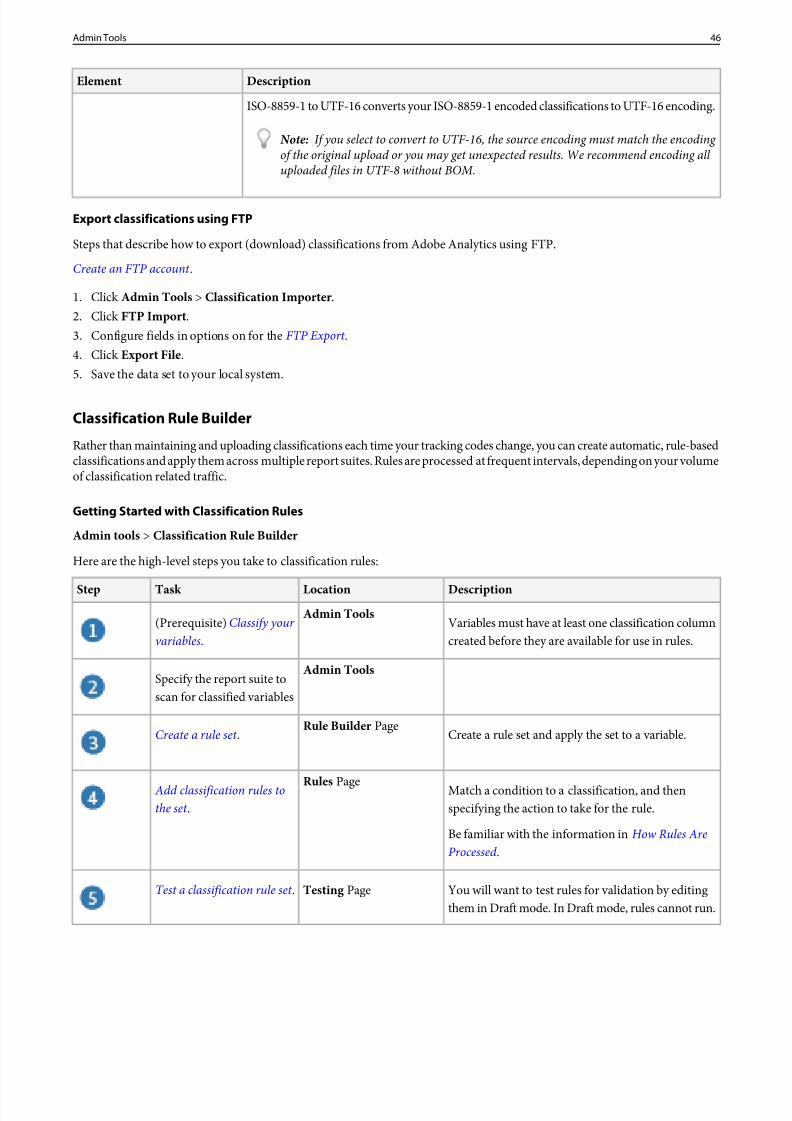
8/18/2019 Analytics Reference Adobe
http://slidepdf.com/reader/full/analytics-reference-adobe 46/332
DescriptionElement
ISO-8859-1 to UTF-16 converts your ISO-8859-1 encoded classifications to UTF-16 encoding.
Note: If you select to convert to UTF-16, the source encoding must match the encoding of the original upload or you may get unexpected results. We recommend encoding all uploaded files in UTF-8 without BOM.
Export classifications using FTP
Steps that describe how to export (download) classifications from Adobe Analytics using FTP.
Create an FTP account .
1. ClickAdmin Tools > Classification Importer .2. ClickFTP Import .3. Configure fields in options on for the FTP Export .4. ClickExport File .5. Save the data set to your local system.
Classification Rule Builder
Rather than maintaining and uploading classifications each time your tracking codes change, you can create automatic, rule-basedclassifications and apply them across multiple report suites. Rules are processed at frequent intervals, depending on your volumeof classification related traffic.
Getting Started with Classification Rules
Admin tools > Classification Rule Builder
Here are the high-level steps you take to classification rules:
DescriptionLocationTask Step
Variables must have at least one classification columncreated before they are available for use in rules.
Admin Tools(Prerequisite) Classify your variables.
Admin ToolsSpecify the report suite toscan for classified variables
Create a rule set and apply the set to a variable.Rule Builder Page
Create a rule set .
Match a condition to a classification, and thenspecifying the action to take for the rule.
Rules Page Add classification rules tothe set .
Be familiar with the information in How Rules AreProcessed .
You will want to test rules for validation by editingthem in Draft mode. In Draft mode, rules cannot run.
Testing PageTest a classification rule set .
46Admin Tools
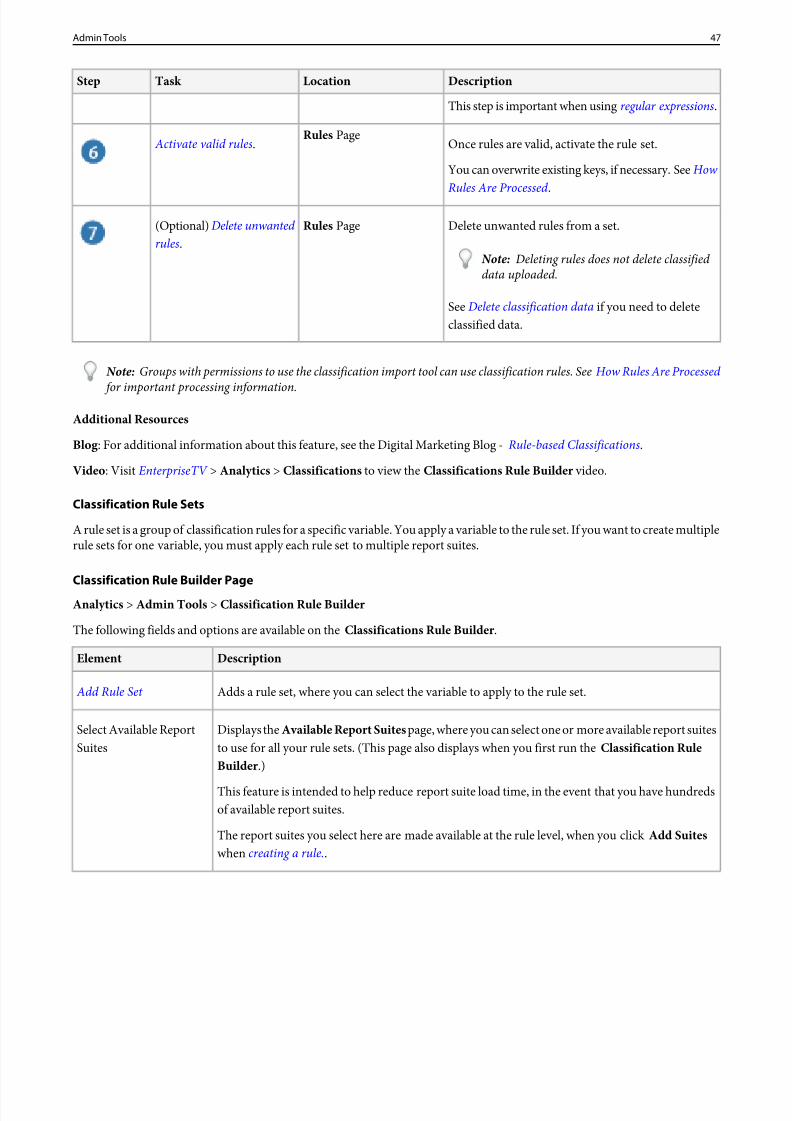
8/18/2019 Analytics Reference Adobe
http://slidepdf.com/reader/full/analytics-reference-adobe 47/332
DescriptionLocationTask Step
This step is important when using regular expressions.
Once rules are valid, activate the rule set.Rules Page
Activate valid rules.
You can overwrite existing keys, if necessary. SeeHowRules Are Processed .
Delete unwanted rules from a set.Rules Page(Optional) Delete unwanted rules.
Note: Deleting rules does not delete classified data uploaded.
SeeDelete classification data if you need to deleteclassified data.
Note: Groups with permissions to use the classification import tool can use classification rules. SeeHow Rules Are Processed
for important processing information.
Additional Resources
Blog : For additional information about this feature, see the Digital Marketing Blog -Rule-based Classifications.
Video : Visit EnterpriseTV > Analytics > Classifications to view theClassifications Rule Builder video.
Classification Rule Sets
A rule set is a group of classification rules for a specific variable. You apply a variable to the rule set. If you want to create multiplerule sets for one variable, you must apply each rule set to multiple report suites.
Classification Rule Builder Page
Analytics > Admin Tools > Classification Rule Builder
The following fields and options are available on theClassifications Rule Builder .
DescriptionElement
Adds a rule set, where you can select the variable to apply to the rule set. Add Rule Set
Displays theAvailable Report Suites page, where you can select one or more available report suitesto use for all your rule sets. (This page also displays when you first run theClassification RuleBuilder .)
Select Available ReportSuites
This feature is intended to help reduce report suite load time, in the event that you have hundredsof available report suites.
The report suites you select here are made available at the rule level, when you clickAdd Suiteswhen creating a rule..
47Admin Tools
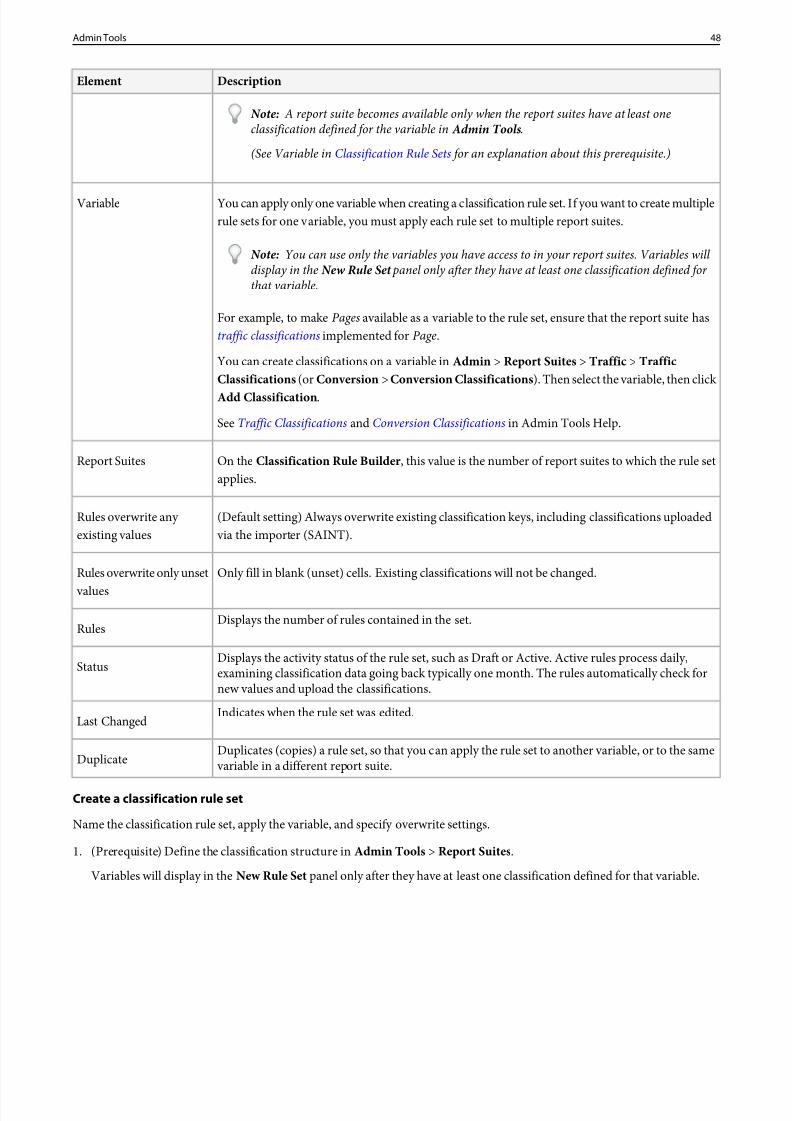
8/18/2019 Analytics Reference Adobe
http://slidepdf.com/reader/full/analytics-reference-adobe 48/332
DescriptionElement
Note: A report suite becomes available only when the report suites have at least oneclassification defined for the variable in Admin Tools .
(See Variable in Classification Rule Sets for an explanation about this prerequisite.)
You can apply only one variable when creating a classification rule set. If you want to create multiplerule sets for one variable, you must apply each rule set to multiple report suites.
Variable
Note: You can use only the variables you have access to in your report suites. Variables will display in the New Rule Set panel only after they have at least one classification defined for that variable.
For example, to make Pages available as a variable to the rule set, ensure that the report suite hastraffic classifications implemented for Page.
You can create classifications on a variable inAdmin > Report Suites > Traffic > TrafficClassifications (or Conversion >Conversion Classifications ). Then select the variable, then click Add Classification .
SeeTraffic Classifications and Conversion Classifications in Admin Tools Help.
On the Classification Rule Builder , this value is the number of report suites to which the rule setapplies.
Report Suites
(Default setting) Always overwrite existing classification keys, including classifications uploaded via the importer (SAINT).
Rules overwrite any existing values
Only fill in blank (unset) cells. Existing classifications will not be changed.Rules overwrite only unset
values
Displays the number of rules contained in the set.Rules
Displays the activity status of the rule set, such as Draft or Active. Active rules process daily,examining classification data going back typically one month. The rules automatically check fornew values and upload the classifications.
Status
Indicates when the rule set was edited.Last Changed
Duplicates (copies) a rule set, so that you can apply the rule set to another variable, or to the same variable in a different report suite.Duplicate
Create a classification rule set
Name the classification rule set, apply the variable, and specify overwrite settings.
1. (Prerequisite) Define the classification structure inAdmin Tools > Report Suites .
Variables will display in theNew Rule Set panel only after they have at least one classification defined for that variable.
48Admin Tools
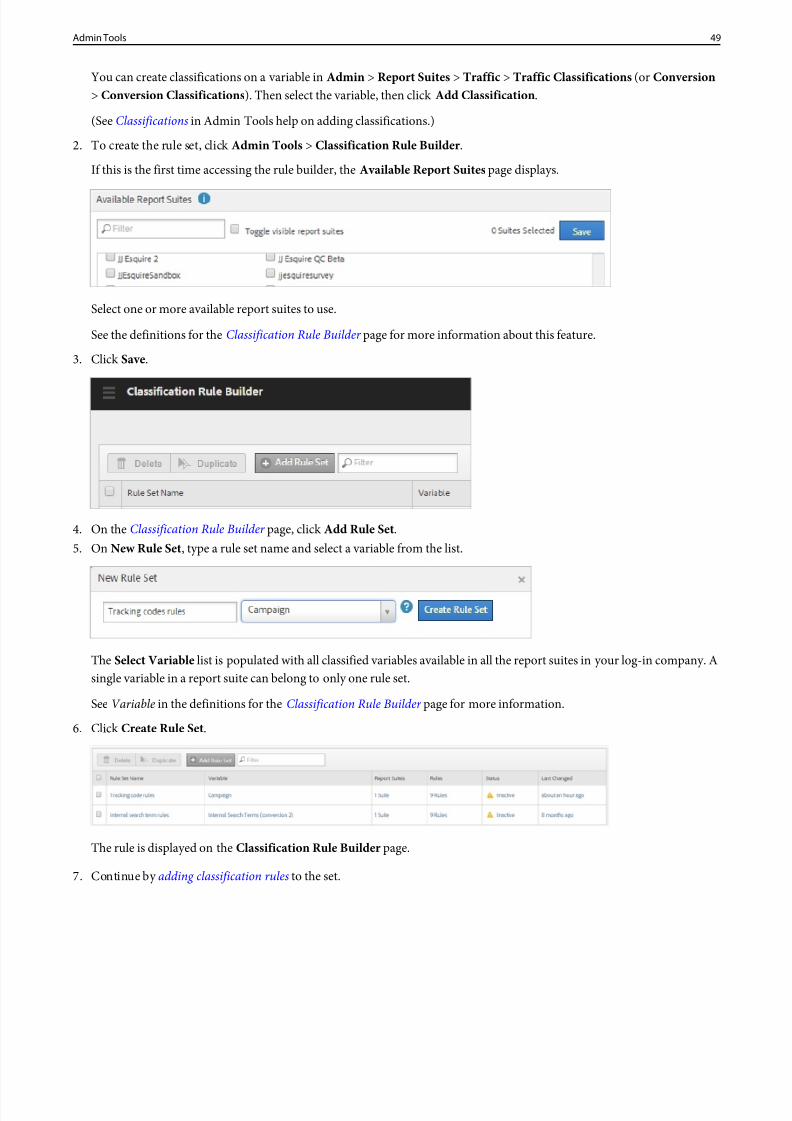
8/18/2019 Analytics Reference Adobe
http://slidepdf.com/reader/full/analytics-reference-adobe 49/332
You can create classifications on a variable inAdmin > Report Suites > Traffic > Traffic Classifications (or Conversion> Conversion Classifications ). Then select the variable, then clickAdd Classification .
(SeeClassifications in Admin Tools help on adding classifications.)
2. To create the rule set, clickAdmin Tools > Classification Rule Builder .
If this is the first time accessing the rule builder, theAvailable Report Suites page displays.
Select one or more available report suites to use.
See the definitions for the Classification Rule Builder page for more information about this feature.
3. ClickSave.
4. On the Classification Rule Builder page, clickAdd Rule Set.5. On New Rule Set, type a rule set name and select a variable from the list.
The Select Variable list is populated with all classified variables available in all the report suites in your log-in company. Asingle variable in a report suite can belong to only one rule set.
SeeVariable in the definitions for the Classification Rule Builder page for more information.
6. ClickCreate Rule Set .
The rule is displayed on theClassification Rule Builder page.
7. Continue by adding classification rules to the set.
49Admin Tools
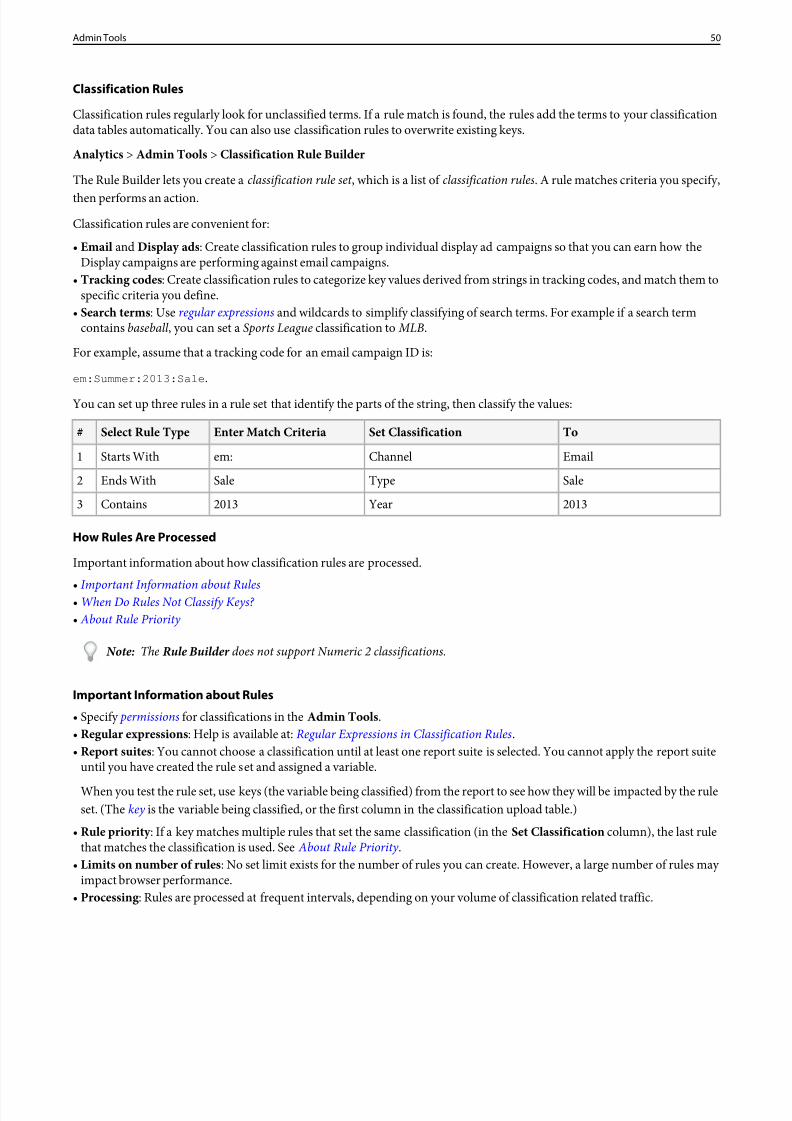
8/18/2019 Analytics Reference Adobe
http://slidepdf.com/reader/full/analytics-reference-adobe 50/332
Classification Rules
Classification rules regularly look for unclassified terms. If a rule match is found, the rules add the terms to your classificationdata tables automatically. You can also use classification rules to overwrite existing keys.
Analytics > Admin Tools > Classification Rule Builder
The Rule Builder lets you create aclassification rule set , which is a list ofclassification rules. A rule matches criteria you specify,
then performs an action.
Classification rules are convenient for:
• Email and Display ads : Create classification rules to group individual display ad campaigns so that you can earn how theDisplay campaigns are performing against email campaigns.
• Tracking codes : Create classification rules to categorize key values derived from strings in tracking codes, and match them tospecific criteria you define.
• Search terms : Use regular expressions and wildcards to simplify classifying of search terms. For example if a search termcontains baseball , you can set aSports League classification to MLB.
For example, assume that a tracking code for an email campaign ID is:
em:Summer:2013:Sale .
You can set up three rules in a rule set that identify the parts of the string, then classify the values:
ToSet ClassificationEnter Match CriteriaSelect Rule Type#
EmailChannelem:Starts With1
SaleTypeSaleEnds With2
2013Year2013Contains3
How Rules Are Processed
Important information about how classification rules are processed.
• Important Information about Rules• When Do Rules Not Classify Keys? • About Rule Priority
Note: The Rule Builder does not support Numeric 2 classifications.
Important Information about Rules
• Specify permissions for classifications in theAdmin Tools .• Regular expressions : Help is available at:Regular Expressions in Classification Rules.• Report suites : You cannot choose a classification until at least one report suite is selected. You cannot apply the report suite
until you have created the rule set and assigned a variable.
When you test the rule set, use keys (the variable being classified) from the report to see how they will be impacted by the ruleset. (The key is the variable being classified, or the first column in the classification upload table.)
• Rule priority : If a key matches multiple rules that set the same classification (in theSet Classification column), the last rulethat matches the classification is used. See About Rule Priority .
• Limits on number of rules : No set limit exists for the number of rules you can create. However, a large number of rules may impact browser performance.
• Processing : Rules are processed at frequent intervals, depending on your volume of classification related traffic.
50Admin Tools
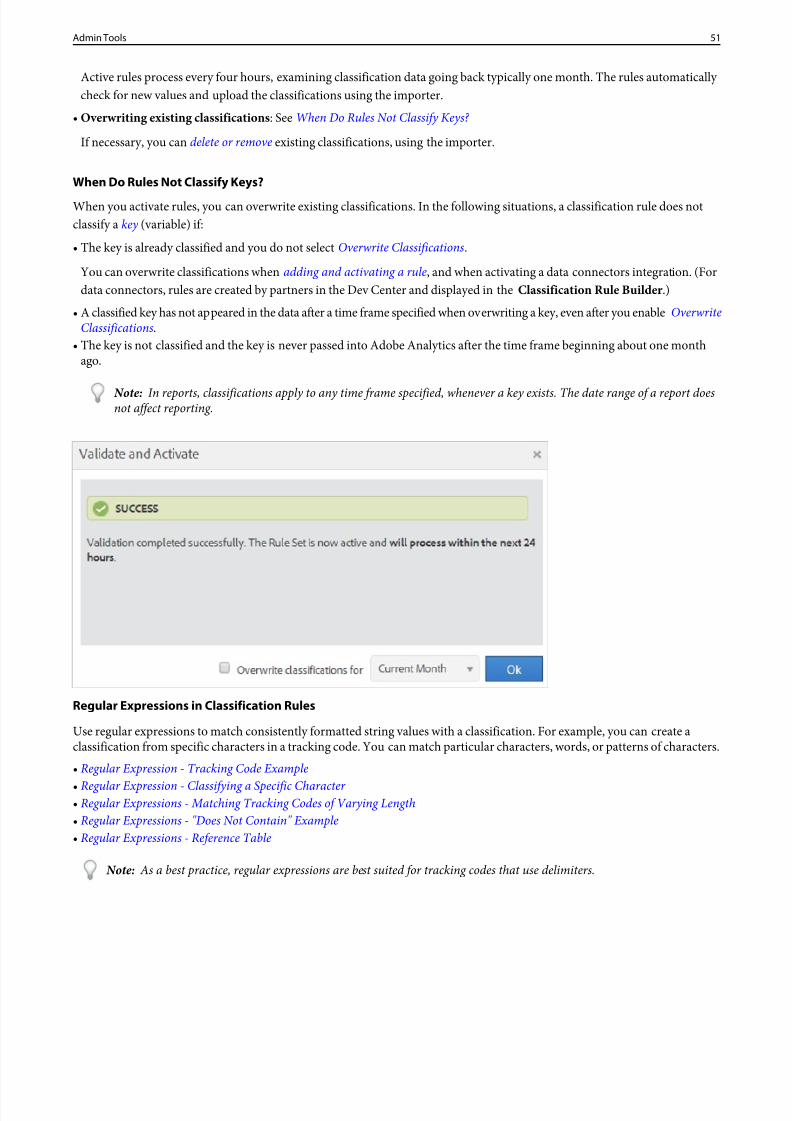
8/18/2019 Analytics Reference Adobe
http://slidepdf.com/reader/full/analytics-reference-adobe 51/332
Active rules process every four hours, examining classification data going back typically one month. The rules automatically check for new values and upload the classifications using the importer.
• Overwriting existing classifications : SeeWhen Do Rules Not Classify Keys?
If necessary, you candelete or remove existing classifications, using the importer.
When Do Rules Not Classify Keys?
When you activate rules, you can overwrite existing classifications. In the following situations, a classification rule does notclassify akey (variable) if:
• The key is already classified and you do not selectOverwrite Classifications.
You can overwrite classifications whenadding and activating a rule , and when activating a data connectors integration. (Fordata connectors, rules are created by partners in the Dev Center and displayed in the Classification Rule Builder .)
• A classified key has not appeared in the data after a time frame specified when overwriting a key, even after you enableOverwriteClassifications.
• The key is not classified and the key is never passed into Adobe Analytics after the time frame beginning about one monthago.
Note: In reports, classifications apply to any time frame specified, whenever a key exists. The date range of a report doesnot affect reporting.
Regular Expressions in Classification Rules
Use regular expressions to match consistently formatted string values with a classification. For example, you can create aclassification from specific characters in a tracking code. You can match particular characters, words, or patterns of characters.• Regular Expression - Tracking Code Example
• Regular Expression - Classifying a Specific Character • Regular Expressions - Matching Tracking Codes of Varying Length• Regular Expressions - "Does Not Contain" Example• Regular Expressions - Reference Table
Note: As a best practice, regular expressions are best suited for tracking codes that use delimiters.
51Admin Tools
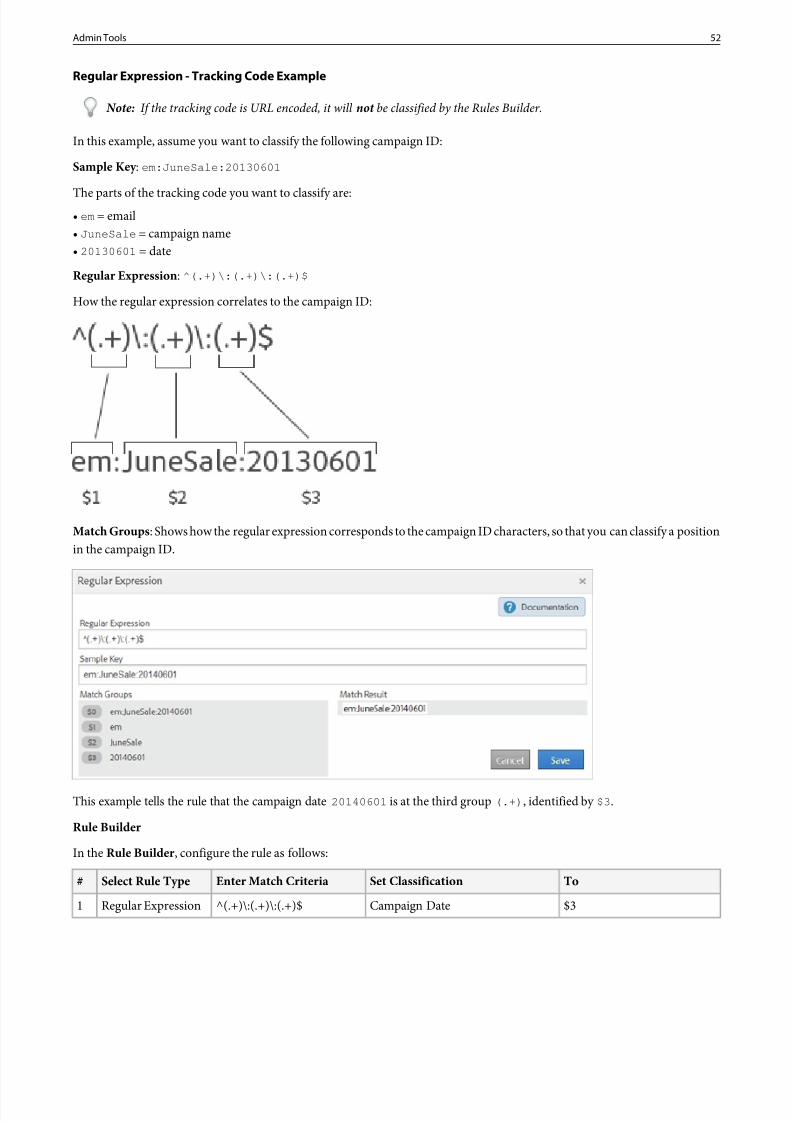
8/18/2019 Analytics Reference Adobe
http://slidepdf.com/reader/full/analytics-reference-adobe 52/332
Regular Expression - Tracking Code Example
Note: If the tracking code is URL encoded, it willnot be classified by the Rules Builder.
In this example, assume you want to classify the following campaign ID:
Sample Key : em:JuneSale:20130601
The parts of the tracking code you want to classify are:• em = email• JuneSale = campaign name• 20130601 = date
Regular Expression : ^(.+)\:(.+)\:(.+)$
How the regular expression correlates to the campaign ID:
Match Groups : Shows how the regular expression corresponds to the campaign ID characters, so that you can classify a positionin the campaign ID.
This example tells the rule that the campaign date 20140601 is at the third group (.+) , identified by $3 .
Rule Builder
In the Rule Builder , configure the rule as follows:
ToSet ClassificationEnter Match CriteriaSelect Rule Type#
$3Campaign Date^(.+)\:(.+)\:(.+)$Regular Expression1
52Admin Tools
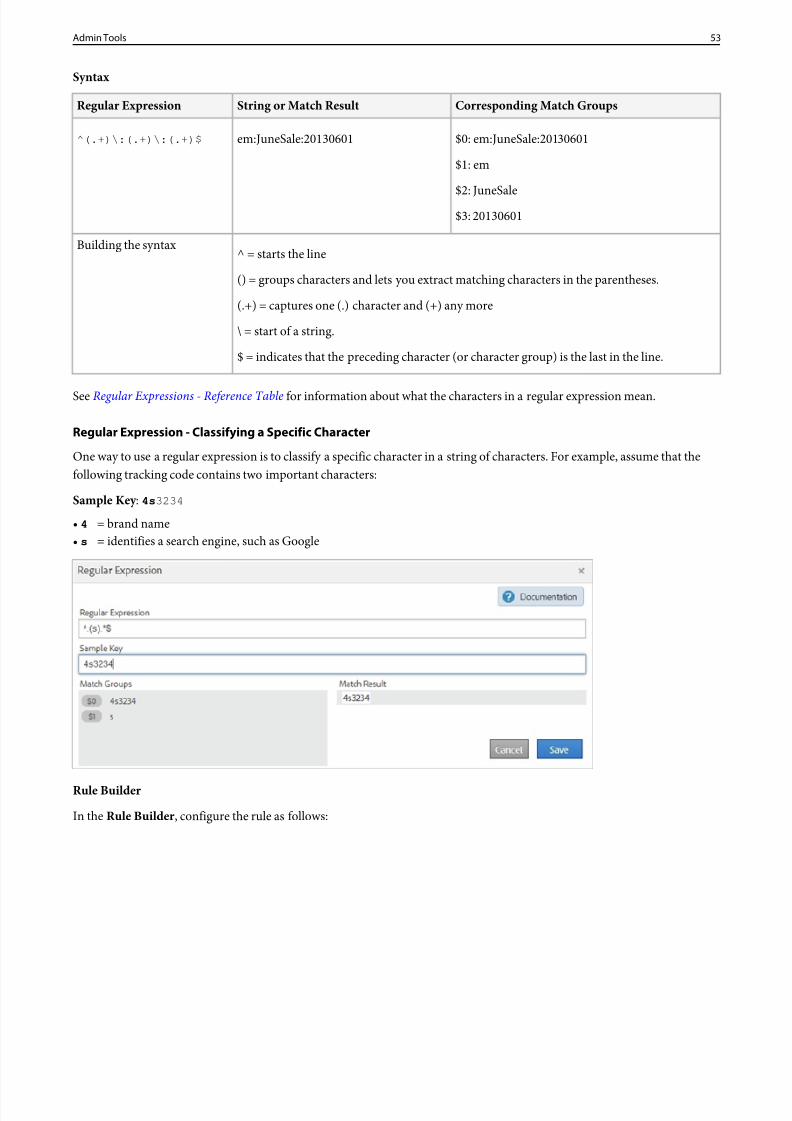
8/18/2019 Analytics Reference Adobe
http://slidepdf.com/reader/full/analytics-reference-adobe 53/332
Syntax
Corresponding Match GroupsString or Match ResultRegular Expression
$0: em:JuneSale:20130601em:JuneSale:20130601^(.+)\:(.+)\:(.+)$
$1: em
$2: JuneSale$3: 20130601
^ = starts the lineBuilding the syntax
() = groups characters and lets you extract matching characters in the parentheses.
(.+) = captures one (.) character and (+) any more
\ = start of a string.
$ = indicates that the preceding character (or character group) is the last in the line.
SeeRegular Expressions - Reference Table for information about what the characters in a regular expression mean.
Regular Expression - Classifying a Specific Character
One way to use a regular expression is to classify a specific character in a string of characters. For example, assume that thefollowing tracking code contains two important characters:
Sample Key : 4s 3234
• 4 = brand name• s = identifies a search engine, such as Google
Rule Builder
In the Rule Builder , configure the rule as follows:
53Admin Tools
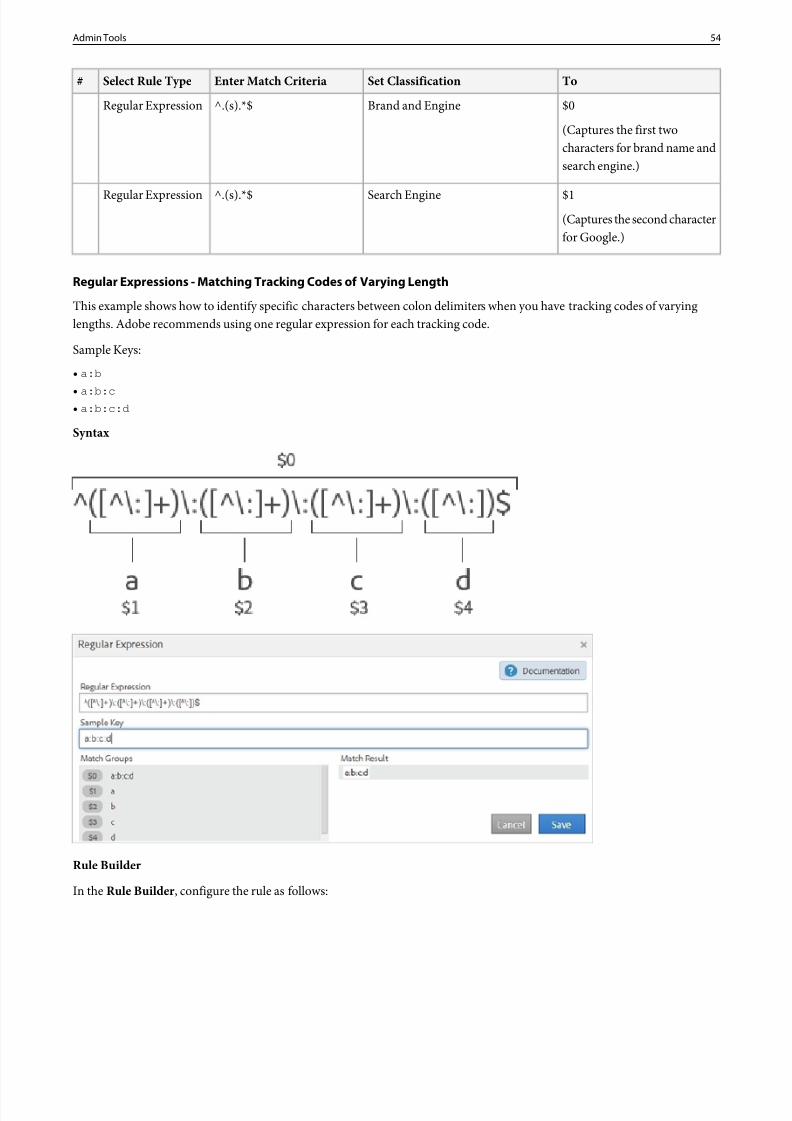
8/18/2019 Analytics Reference Adobe
http://slidepdf.com/reader/full/analytics-reference-adobe 54/332
ToSet ClassificationEnter Match CriteriaSelect Rule Type#
$0
(Captures the first twocharacters for brand name andsearch engine.)
Brand and Engine^.(s).*$Regular Expression
$1(Captures the second characterfor Google.)
Search Engine^.(s).*$Regular Expression
Regular Expressions - Matching Tracking Codes of Varying Length
This example shows how to identify specific characters between colon delimiters when you have tracking codes of varyinglengths. Adobe recommends using one regular expression for each tracking code.
Sample Keys:
• a:b
• a:b:c• a:b:c:d
Syntax
Rule Builder
In the Rule Builder , configure the rule as follows:
54Admin Tools
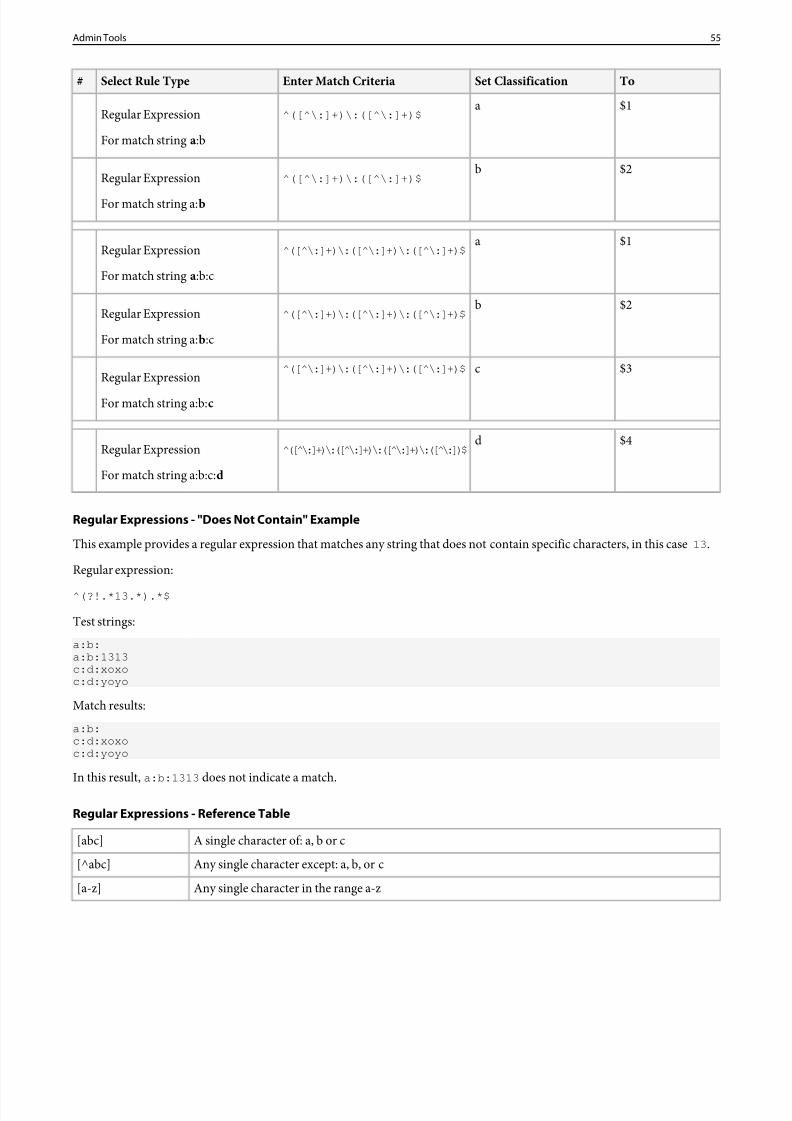
8/18/2019 Analytics Reference Adobe
http://slidepdf.com/reader/full/analytics-reference-adobe 55/332
ToSet ClassificationEnter Match CriteriaSelect Rule Type#
$1a^([^\:]+)\:([^\:]+)$Regular Expression
For match string a:b
$2b^([^\:]+)\:([^\:]+)$Regular Expression
For match string a:b
$1a(̂[̂ \:]+)\:([̂ \:]+)\:([̂ \:]+)$Regular Expression
For match string a:b:c
$2b(̂[̂ \:]+)\:([̂ \:]+)\:([̂ \:]+)$Regular Expression
For match string a:b:c
$3c(̂[̂ \:]+)\:([̂ \:]+)\:([̂ \:]+)$Regular Expression
For match string a:b:c
$4d(̂[̂\:]+)\:([̂\:]+)\:([̂\:]+)\:([̂\:])$Regular Expression
For match string a:b:c:d
Regular Expressions - "Does Not Contain" Example
This example provides a regular expression that matches any string that does not contain specific characters, in this case13 .
Regular expression:
^(?!.*13.*).*$
Test strings:
a:b:a:b:1313c:d:xoxoc:d:yoyo
Match results:
a:b:c:d:xoxoc:d:yoyo
In this result, a:b:1313 does not indicate a match.
Regular Expressions - Reference Table
A single character of: a, b or c[abc]
Any single character except: a, b, or c[^abc]
Any single character in the range a-z[a-z]
55Admin Tools
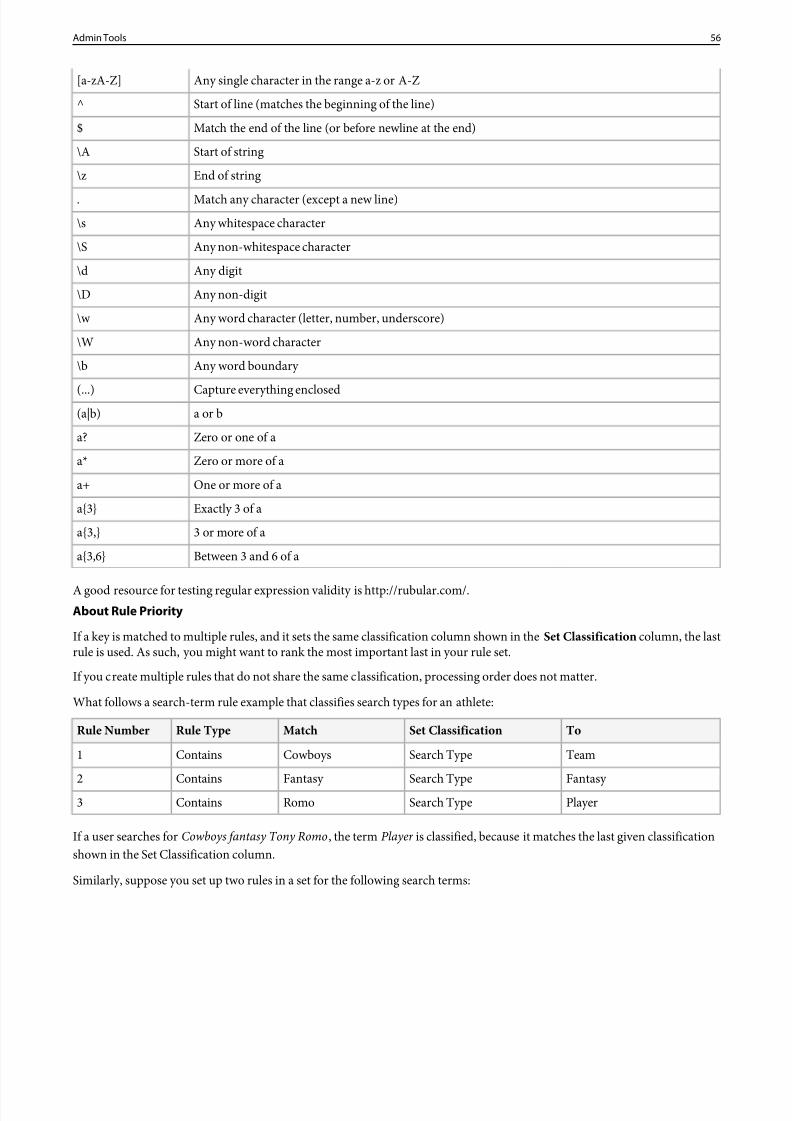
8/18/2019 Analytics Reference Adobe
http://slidepdf.com/reader/full/analytics-reference-adobe 56/332
Any single character in the range a-z or A-Z[a-zA-Z]
Start of line (matches the beginning of the line)^
Match the end of the line (or before newline at the end)$
Start of string\A
End of string\z
Match any character (except a new line).
Any whitespace character\s
Any non-whitespace character\S
Any digit\d
Any non-digit\D
Any word character (letter, number, underscore)\w
Any non-word character\W
Any word boundary \b
Capture everything enclosed(...)a or b(a|b)
Zero or one of aa?
Zero or more of aa*
One or more of aa+
Exactly 3 of aa{3}
3 or more of aa{3,}
Between 3 and 6 of aa{3,6}
A good resource for testing regular expression validity is http://rubular.com/.About Rule Priority
If a key is matched to multiple rules, and it sets the same classification column shown in theSet Classification column, the lastrule is used. As such, you might want to rank the most important last in your rule set.
If you create multiple rules that do not share the same classification, processing order does not matter.
What follows a search-term rule example that classifies search types for an athlete:
ToSet ClassificationMatchRule TypeRule Number
TeamSearch TypeCowboysContains1
Fantasy Search TypeFantasy Contains2PlayerSearch TypeRomoContains3
If a user searches forCowboys fantasy Tony Romo, the term Player is classified, because it matches the last given classificationshown in the Set Classification column.
Similarly, suppose you set up two rules in a set for the following search terms:
56Admin Tools
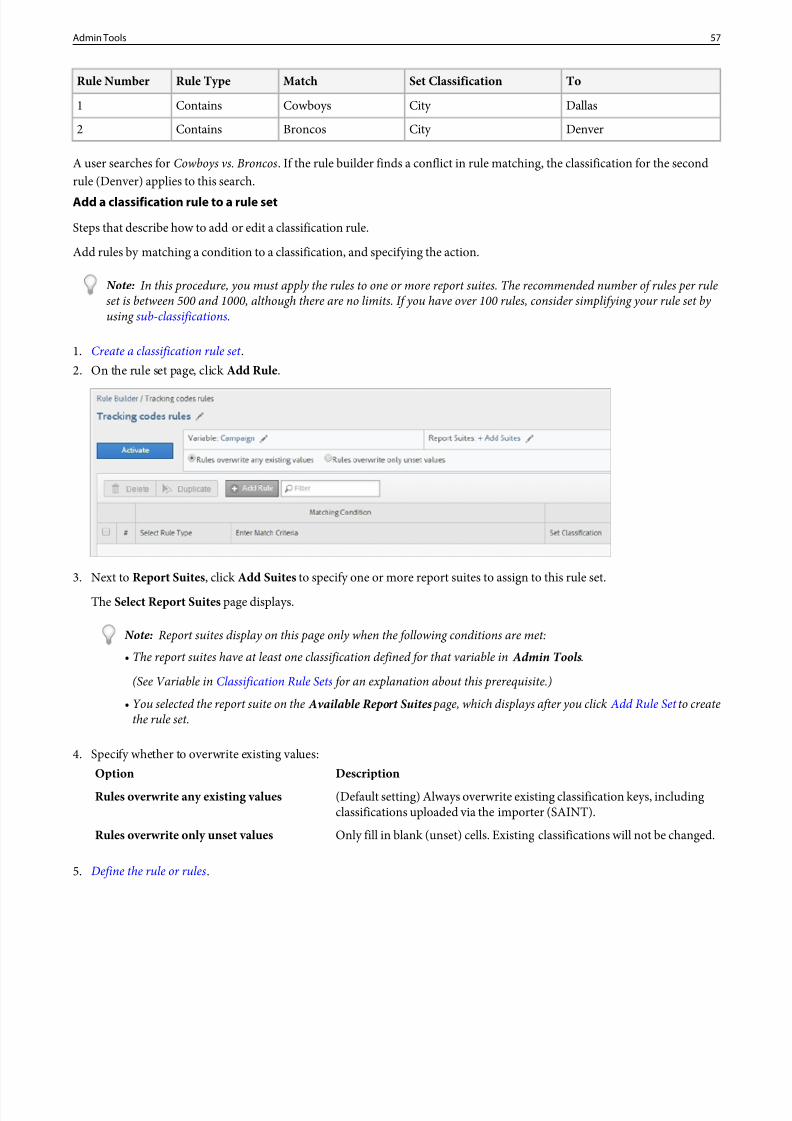
8/18/2019 Analytics Reference Adobe
http://slidepdf.com/reader/full/analytics-reference-adobe 57/332
ToSet ClassificationMatchRule TypeRule Number
DallasCity CowboysContains1
DenverCity BroncosContains2
A user searches forCowboys vs. Broncos. If the rule builder finds a conflict in rule matching, the classification for the secondrule (Denver) applies to this search.Add a classification rule to a rule set
Steps that describe how to add or edit a classification rule.
Add rules by matching a condition to a classification, and specifying the action.
Note: In this procedure, you must apply the rules to one or more report suites. The recommended number of rules per ruleset is between 500 and 1000, although there are no limits. If you have over 100 rules, consider simplifying your rule set by using sub-classifications.
1. Create a classification rule set .2. On the rule set page, clickAdd Rule .
3. Next to Report Suites , clickAdd Suites to specify one or more report suites to assign to this rule set.
The Select Report Suites page displays.
Note: Report suites display on this page only when the following conditions are met:• The report suites have at least one classification defined for that variable in Admin Tools .
(See Variable in Classification Rule Sets for an explanation about this prerequisite.)• You selected the report suite on the Available Report Suites page, which displays after you click Add Rule Set to create
the rule set.
4. Specify whether to overwrite existing values:DescriptionOption
(Default setting) Always overwrite existing classification keys, includingclassifications uploaded via the importer (SAINT).
Rules overwrite any existing values
Only fill in blank (unset) cells. Existing classifications will not be changed.Rules overwrite only unset values
5. Define the rule or rules.
57Admin Tools
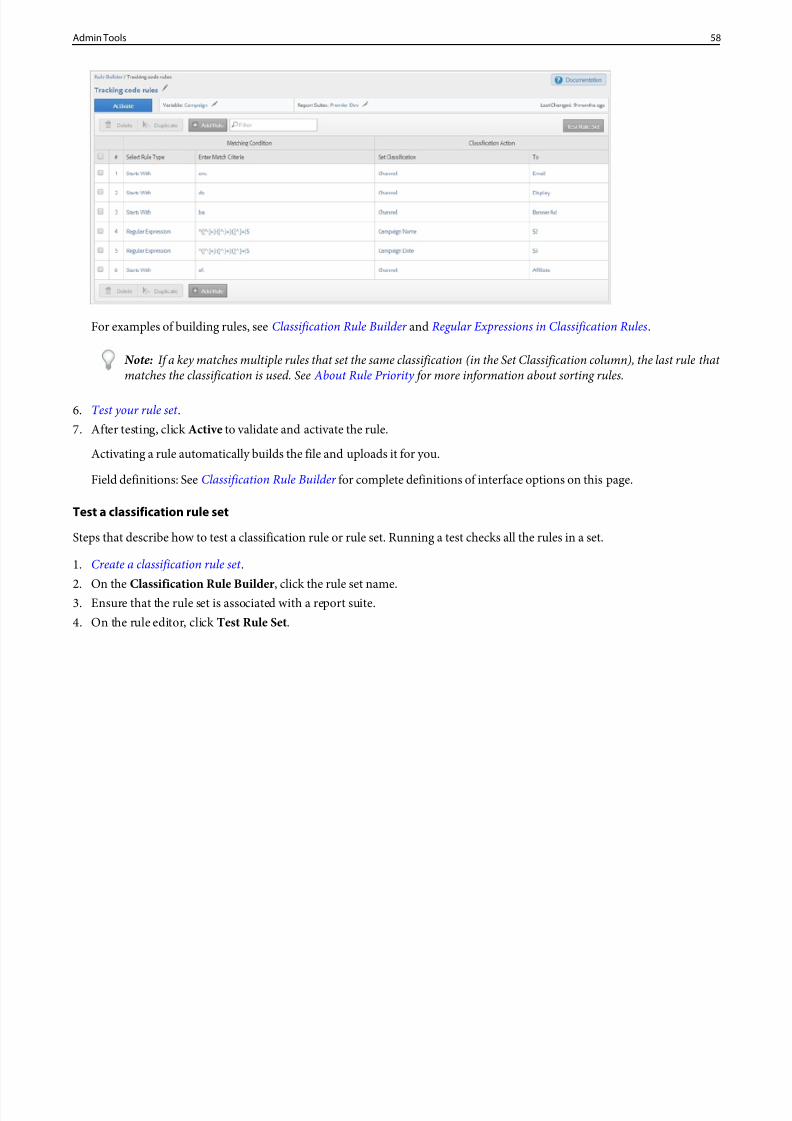
8/18/2019 Analytics Reference Adobe
http://slidepdf.com/reader/full/analytics-reference-adobe 58/332
For examples of building rules, seeClassification Rule Builder and Regular Expressions in Classification Rules.
Note: If a key matches multiple rules that set the same classification (in the Set Classification column), the last rule that matches the classification is used. See About Rule Priority for more information about sorting rules.
6. Test your rule set .7. After testing, clickActive to validate and activate the rule.
Activating a rule automatically builds the file and uploads it for you.
Field definitions: SeeClassification Rule Builder for complete definitions of interface options on this page.
Test a classification rule set
Steps that describe how to test a classification rule or rule set. Running a test checks all the rules in a set.
1. Create a classification rule set .
2. On the Classification Rule Builder , click the rule set name.3. Ensure that the rule set is associated with a report suite.4. On the rule editor, click Test Rule Set .
58Admin Tools
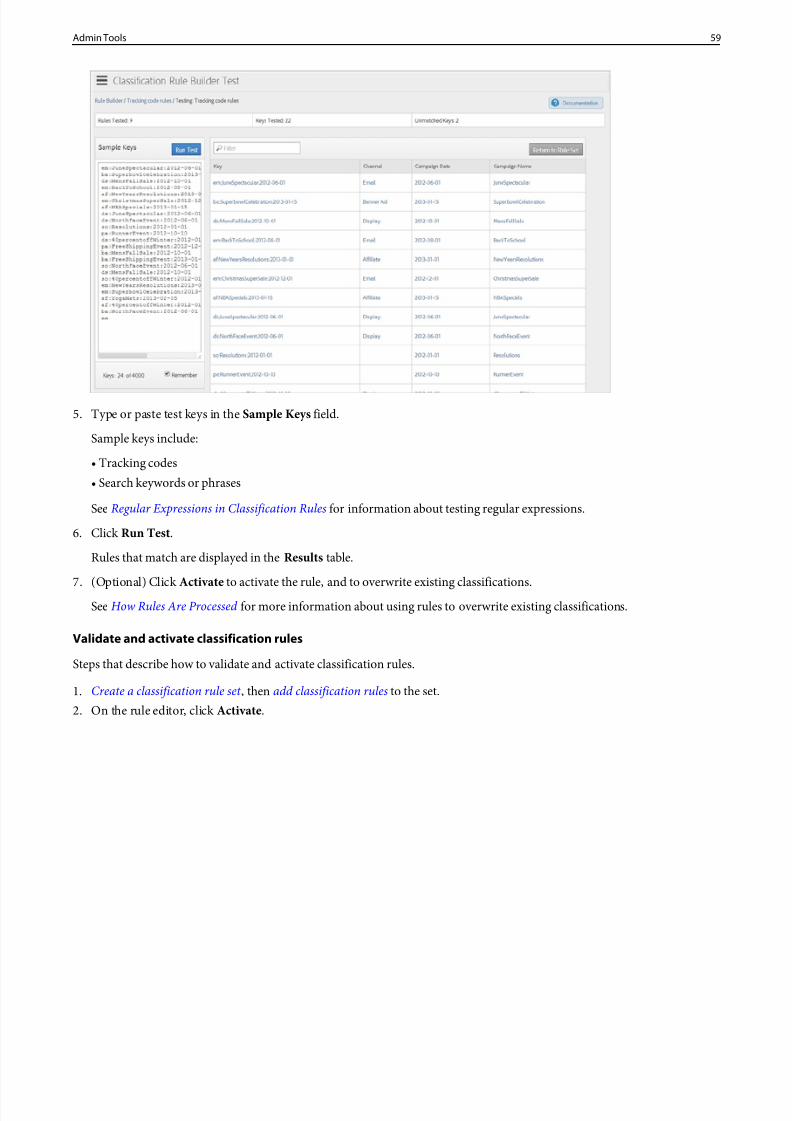
8/18/2019 Analytics Reference Adobe
http://slidepdf.com/reader/full/analytics-reference-adobe 59/332
5. Type or paste test keys in theSample Keys field.
Sample keys include:
• Tracking codes• Search keywords or phrases
SeeRegular Expressions in Classification Rules for information about testing regular expressions.
6. ClickRun Test .
Rules that match are displayed in the Results table.
7. (Optional) Click Activate to activate the rule, and to overwrite existing classifications.
SeeHow Rules Are Processed for more information about using rules to overwrite existing classifications.
Validate and activate classification rules
Steps that describe how to validate and activate classification rules.
1. Create a classification rule set , then add classification rules to the set.2. On the rule editor, click Activate.
59Admin Tools
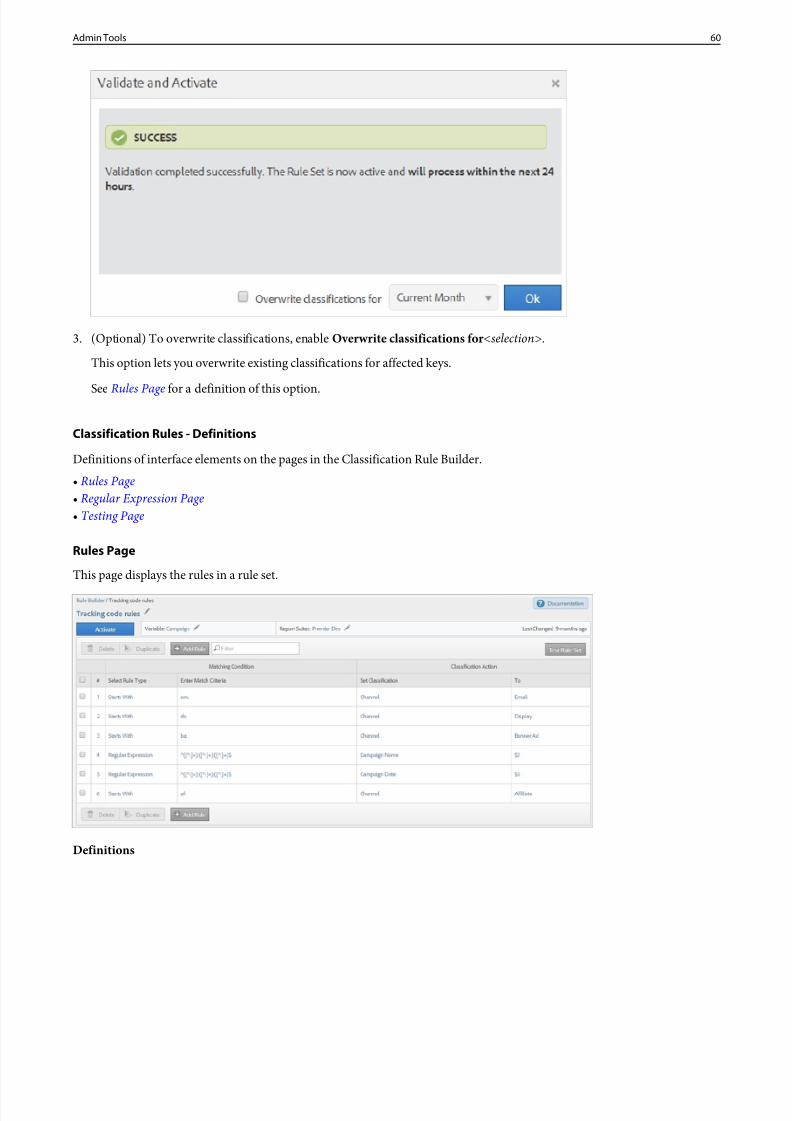
8/18/2019 Analytics Reference Adobe
http://slidepdf.com/reader/full/analytics-reference-adobe 60/332
3. (Optional) To overwrite classifications, enableOverwrite classifications for <selection>.
This option lets you overwrite existing classifications for affected keys.
SeeRules Page for a definition of this option.
Classification Rules - Definitions
Definitions of interface elements on the pages in the Classification Rule Builder.• Rules Page• Regular Expression Page• Testing Page
Rules Page
This page displays the rules in a rule set.
Definitions
60Admin Tools
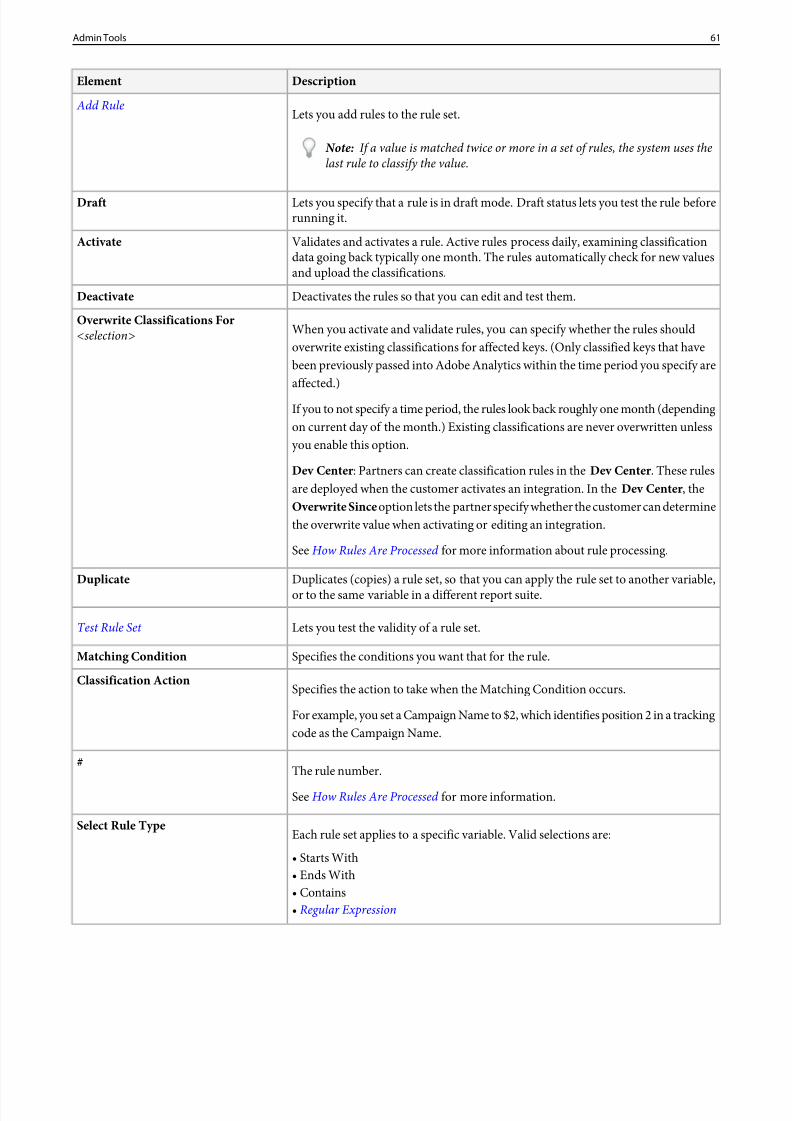
8/18/2019 Analytics Reference Adobe
http://slidepdf.com/reader/full/analytics-reference-adobe 61/332
DescriptionElement
Lets you add rules to the rule set. Add Rule
Note: If a value is matched twice or more in a set of rules, the system uses thelast rule to classify the value.
Lets you specify that a rule is in draft mode. Draft status lets you test the rule beforerunning it.
Draft
Validates and activates a rule. Active rules process daily, examining classificationdata going back typically one month. The rules automatically check for new valuesand upload the classifications.
Activate
Deactivates the rules so that you can edit and test them.Deactivate
When you activate and validate rules, you can specify whether the rules shouldoverwrite existing classifications for affected keys. (Only classified keys that have
Overwrite Classifications For<selection>
been previously passed into Adobe Analytics within the time period you specify areaffected.)
If you to not specify a time period, the rules look back roughly one month (dependingon current day of the month.) Existing classifications are never overwritten unlessyou enable this option.
Dev Center : Partners can create classification rules in theDev Center . These rulesare deployed when the customer activates an integration. In the Dev Center , theOverwrite Since option lets the partner specify whether the customer can determinethe overwrite value when activating or editing an integration.
SeeHow Rules Are Processed for more information about rule processing.
Duplicates (copies) a rule set, so that you can apply the rule set to another variable,or to the same variable in a different report suite.
Duplicate
Lets you test the validity of a rule set.Test Rule Set
Specifies the conditions you want that for the rule.Matching Condition
Specifies the action to take when the Matching Condition occurs.Classification Action
For example, you set a Campaign Name to $2, which identifies position 2 in a trackingcode as the Campaign Name.
The rule number.#
SeeHow Rules Are Processed for more information.
Each rule set applies to a specific variable. Valid selections are:Select Rule Type
• Starts With• Ends With• Contains• Regular Expression
61Admin Tools
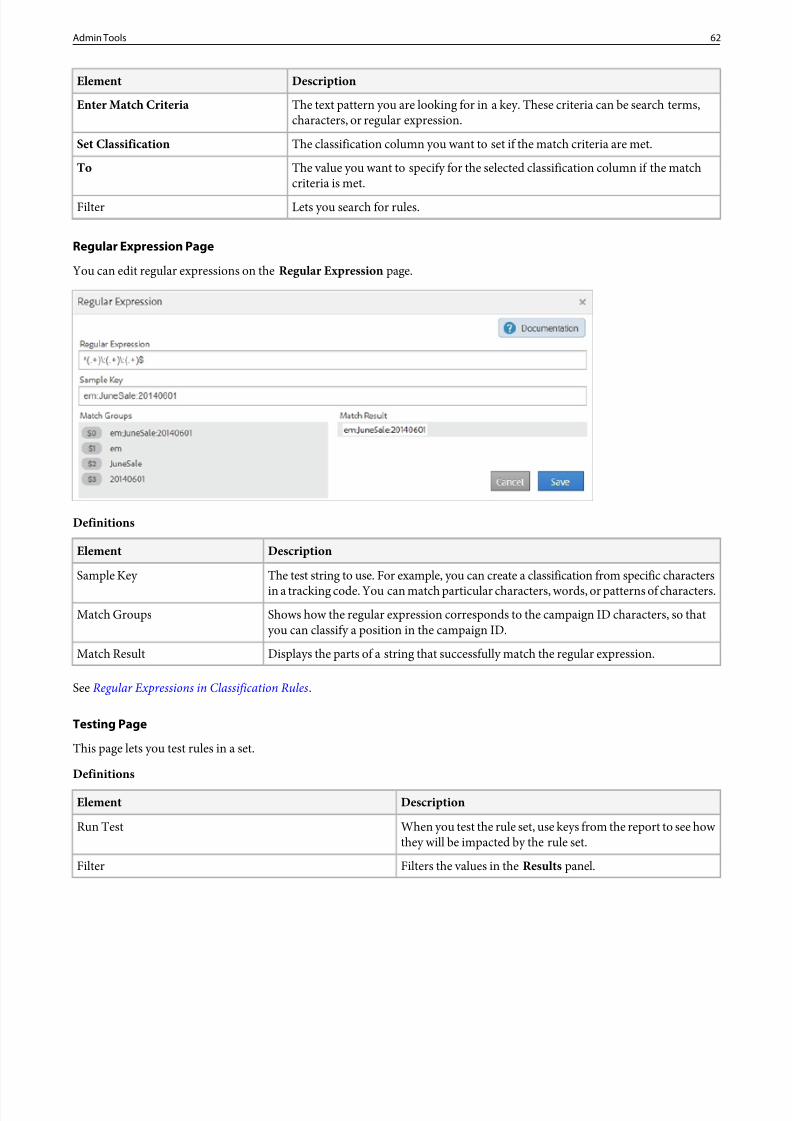
8/18/2019 Analytics Reference Adobe
http://slidepdf.com/reader/full/analytics-reference-adobe 62/332
DescriptionElement
The text pattern you are looking for in a key. These criteria can be search terms,characters, or regular expression.
Enter Match Criteria
The classification column you want to set if the match criteria are met.Set Classification
The value you want to specify for the selected classification column if the matchcriteria is met.
To
Lets you search for rules.Filter
Regular Expression Page
You can edit regular expressions on the Regular Expression page.
Definitions
DescriptionElement
The test string to use. For example, you can create a classification from specific charactersin a tracking code. You can match particular characters, words, or patterns of characters.
Sample Key
Shows how the regular expression corresponds to the campaign ID characters, so thatyou can classify a position in the campaign ID.
Match Groups
Displays the parts of a string that successfully match the regular expression.Match Result
SeeRegular Expressions in Classification Rules.
Testing Page
This page lets you test rules in a set.
Definitions
DescriptionElement
When you test the rule set, use keys from the report to see how they will be impacted by the rule set.
Run Test
Filters the values in the Results panel.Filter
62Admin Tools
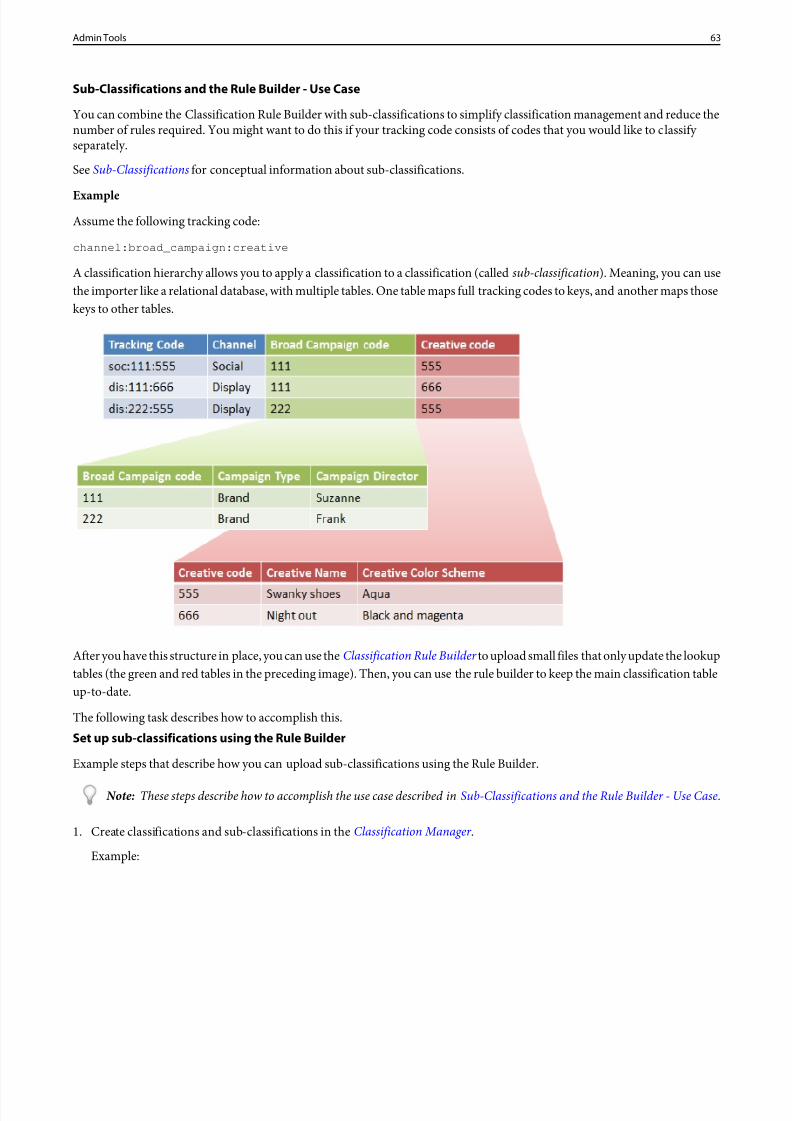
8/18/2019 Analytics Reference Adobe
http://slidepdf.com/reader/full/analytics-reference-adobe 63/332
Sub-Classifications and the Rule Builder - Use Case
You can combine the Classification Rule Builder with sub-classifications to simplify classification management and reduce thenumber of rules required. You might want to do this if your tracking code consists of codes that you would like to classify separately.
SeeSub-Classifications for conceptual information about sub-classifications.
ExampleAssume the following tracking code:
channel:broad_campaign:creative
A classification hierarchy allows you to apply a classification to a classification (calledsub-classification). Meaning, you can usethe importer like a relational database, with multiple tables. One table maps full tracking codes to keys, and another maps thosekeys to other tables.
After you have this structure in place, you can use theClassification Rule Builder to upload small files that only update the lookuptables (the green and red tables in the preceding image). Then, you can use the rule builder to keep the main classification tableup-to-date.
The following task describes how to accomplish this.Set up sub-classifications using the Rule Builder
Example steps that describe how you can upload sub-classifications using the Rule Builder.
Note: These steps describe how to accomplish the use case described inSub-Classifications and the Rule Builder - Use Case.
1. Create classifications and sub-classifications in theClassification Manager .
Example:
63Admin Tools
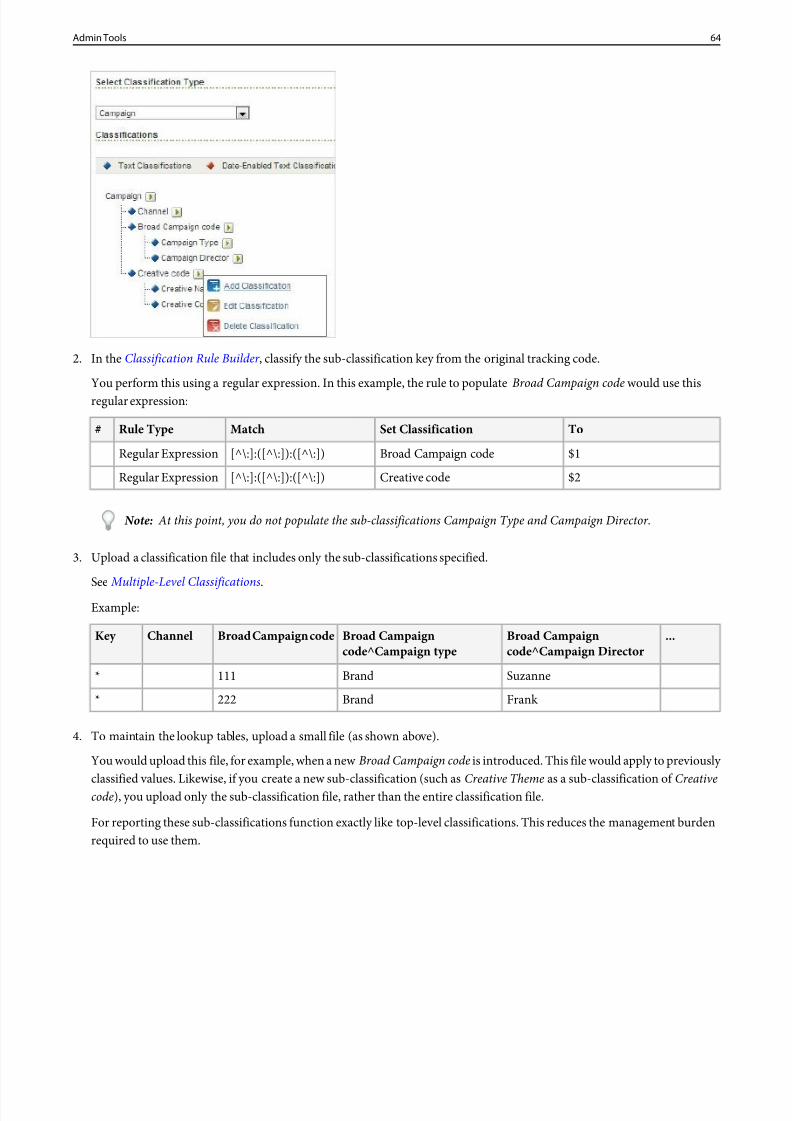
8/18/2019 Analytics Reference Adobe
http://slidepdf.com/reader/full/analytics-reference-adobe 64/332
2. In the Classification Rule Builder , classify the sub-classification key from the original tracking code.
You perform this using a regular expression. In this example, the rule to populate Broad Campaign code would use thisregular expression:
ToSet ClassificationMatchRule Type#
$1Broad Campaign code[^\:]:([^\:]):([^\:])Regular Expression
$2Creative code[^\:]:([^\:]):([^\:])Regular Expression
Note: At this point, you do not populate the sub-classifications Campaign Type and Campaign Director.
3. Upload a classification file that includes only the sub-classifications specified.
See Multiple-Level Classifications.
Example:
...Broad Campaigncode^Campaign Director
Broad Campaigncode^Campaign type
Broad Campaign codeChannelKey
SuzanneBrand111*
Frank Brand222*
4. To maintain the lookup tables, upload a small file (as shown above).
You would upload this file, for example, when a newBroad Campaign code is introduced. This file would apply to previously
classified values. Likewise, if you create a new sub-classification (such asCreative Theme as a sub-classification ofCreativecode), you upload only the sub-classification file, rather than the entire classification file.
For reporting these sub-classifications function exactly like top-level classifications. This reduces the management burdenrequired to use them.
64Admin Tools
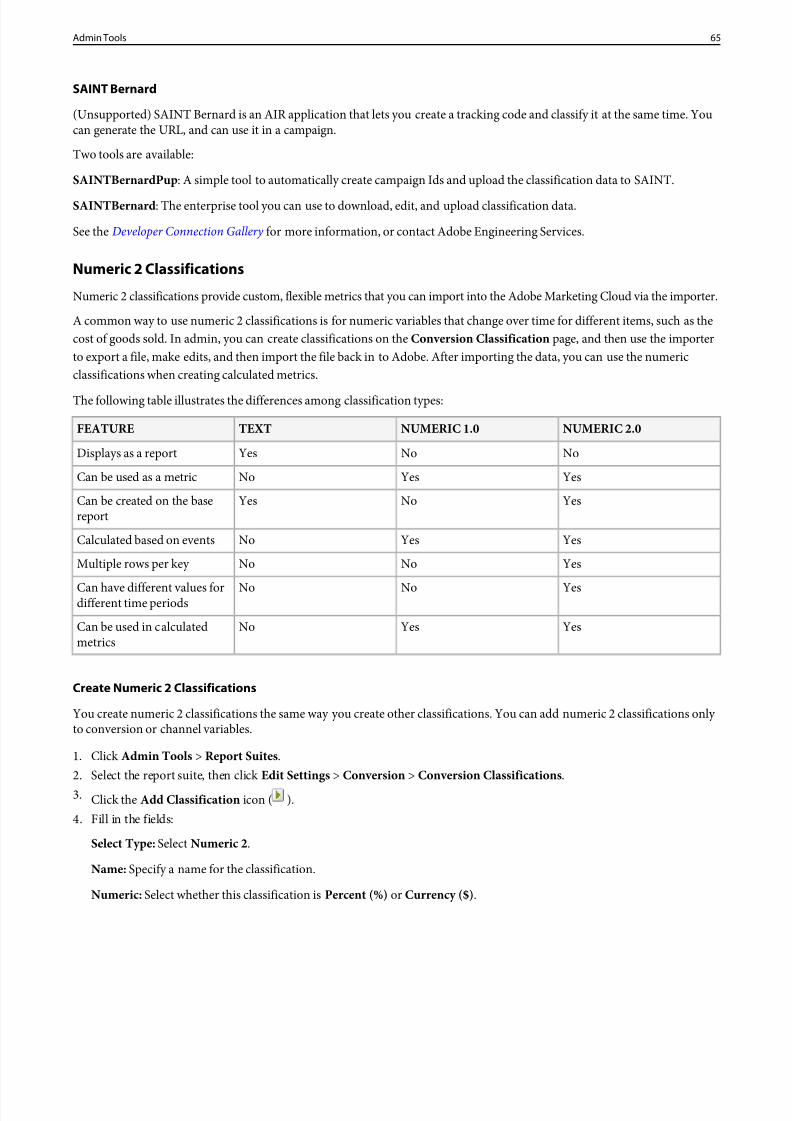
8/18/2019 Analytics Reference Adobe
http://slidepdf.com/reader/full/analytics-reference-adobe 65/332
SAINT Bernard
(Unsupported) SAINT Bernard is an AIR application that lets you create a tracking code and classify it at the same time. Youcan generate the URL, and can use it in a campaign.
Two tools are available:
SAINTBernardPup : A simple tool to automatically create campaign Ids and upload the classification data to SAINT.
SAINTBernard : The enterprise tool you can use to download, edit, and upload classification data.
See the Developer Connection Gallery for more information, or contact Adobe Engineering Services.
Numeric 2 Classifications
Numeric 2 classifications provide custom, flexible metrics that you can import into the Adobe Marketing Cloud via the importer.
A common way to use numeric 2 classifications is for numeric variables that change over time for different items, such as thecost of goods sold. In admin, you can create classifications on theConversion Classification page, and then use the importerto export a file, make edits, and then import the file back in to Adobe. After importing the data, you can use the numericclassifications when creating calculated metrics.
The following table illustrates the differences among classification types:
NUMERIC 2.0NUMERIC 1.0TEXTFEATURE
NoNoYesDisplays as a report
YesYesNoCan be used as a metric
YesNoYesCan be created on the basereport
YesYesNoCalculated based on events
YesNoNoMultiple rows per key
YesNoNoCan have different values fordifferent time periods
YesYesNoCan be used in calculatedmetrics
Create Numeric 2 Classifications
You create numeric 2 classifications the same way you create other classifications. You can add numeric 2 classifications only to conversion or channel variables.
1. ClickAdmin Tools > Report Suites .2. Select the report suite, then clickEdit Settings > Conversion > Conversion Classifications .3. Click the Add Classification icon ( ).4. Fill in the fields:
Select Type: SelectNumeric 2 .
Name: Specify a name for the classification.
Numeric: Select whether this classification isPercent (%) or Currency ($) .
65Admin Tools
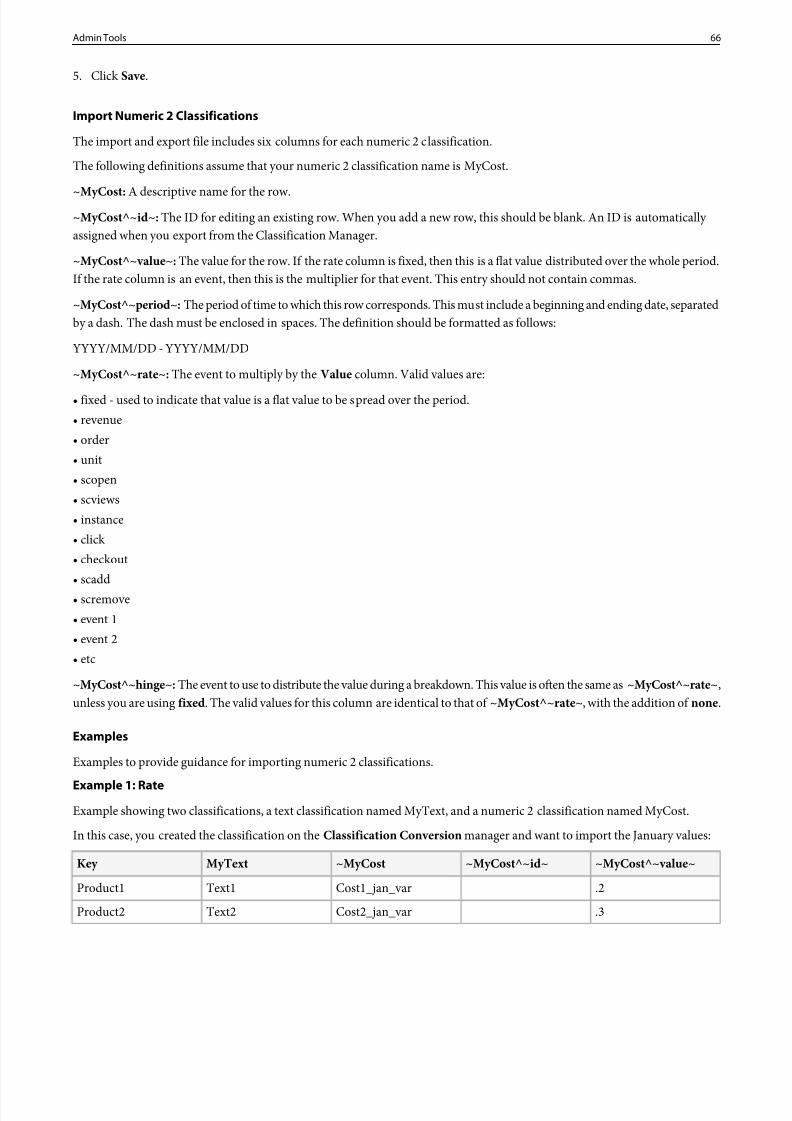
8/18/2019 Analytics Reference Adobe
http://slidepdf.com/reader/full/analytics-reference-adobe 66/332
5. ClickSave.
Import Numeric 2 Classifications
The import and export file includes six columns for each numeric 2 classification.
The following definitions assume that your numeric 2 classification name is MyCost.
~MyCost: A descriptive name for the row.~MyCost^~id~: The ID for editing an existing row. When you add a new row, this should be blank. An ID is automatically assigned when you export from the Classification Manager.
~MyCost^~value~: The value for the row. If the rate column is fixed, then this is a flat value distributed over the whole period.If the rate column is an event, then this is the multiplier for that event. This entry should not contain commas.
~MyCost^~period~: The period of time to which this row corresponds. This must include a beginning and ending date, separatedby a dash. The dash must be enclosed in spaces. The definition should be formatted as follows:
YYYY/MM/DD - YYYY/MM/DD
~MyCost^~rate~: The event to multiply by the Value column. Valid values are:
• fixed - used to indicate that value is a flat value to be spread over the period.• revenue• order• unit• scopen• scviews• instance• click • checkout• scadd• scremove• event 1• event 2• etc
~MyCost^~hinge~: The event to use to distribute the value during a breakdown. This value is often the same as~MyCost^~rate~ ,unless you are using fixed. The valid values for this column are identical to that of~MyCost^~rate~ , with the addition of none .
Examples
Examples to provide guidance for importing numeric 2 classifications.
Example 1: Rate
Example showing two classifications, a text classification named MyText, and a numeric 2 classification named MyCost.
In this case, you created the classification on theClassification Conversion manager and want to import the January values:
~MyCost^~value~~MyCost^~id~~MyCostMyTextKey
.2Cost1_jan_varText1Product1
.3Cost2_jan_varText2Product2
66Admin Tools
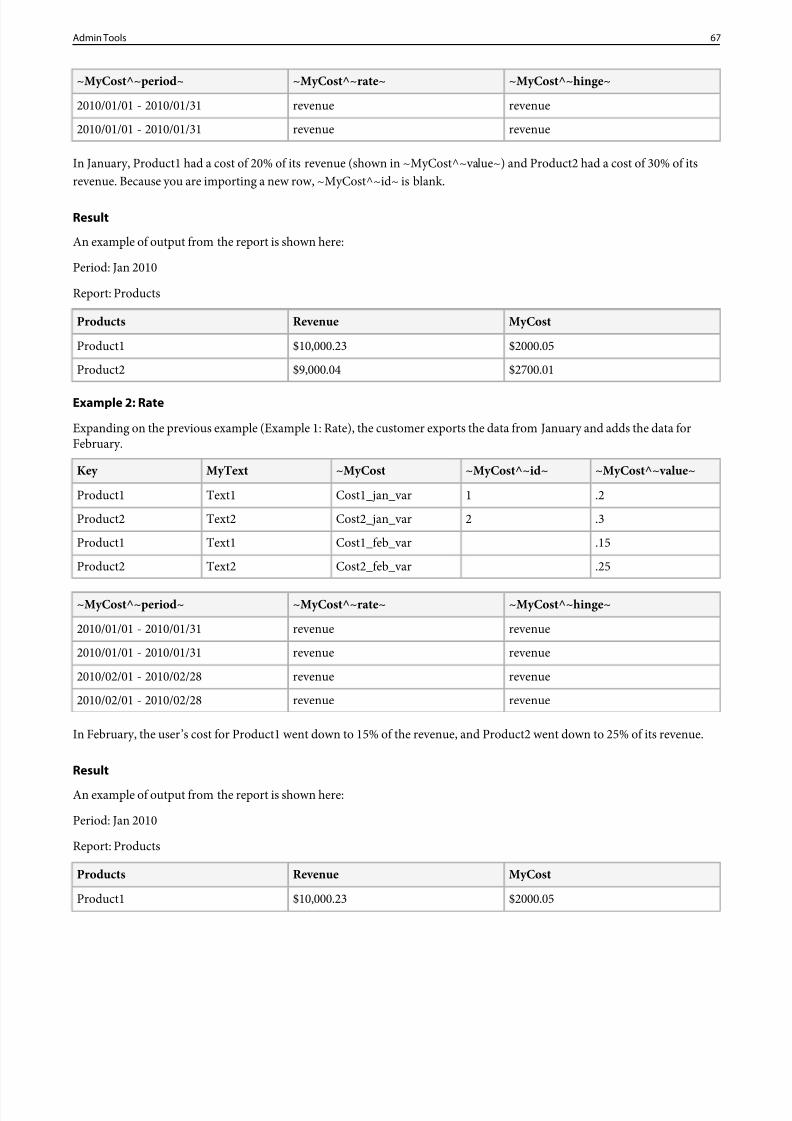
8/18/2019 Analytics Reference Adobe
http://slidepdf.com/reader/full/analytics-reference-adobe 67/332
~MyCost^~hinge~~MyCost^~rate~~MyCost^~period~
revenuerevenue2010/01/01 - 2010/01/31
revenuerevenue2010/01/01 - 2010/01/31
In January, Product1 had a cost of 20% of its revenue (shown in ~MyCost^~value~) and Product2 had a cost of 30% of itsrevenue. Because you are importing a new row, ~MyCost^~id~ is blank.
Result
An example of output from the report is shown here:
Period: Jan 2010
Report: Products
MyCostRevenueProducts
$2000.05$10,000.23Product1
$2700.01$9,000.04Product2
Example 2: Rate
Expanding on the previous example (Example 1: Rate), the customer exports the data from January and adds the data forFebruary.
~MyCost^~value~~MyCost^~id~~MyCostMyTextKey
.21Cost1_jan_varText1Product1
.32Cost2_jan_varText2Product2
.15Cost1_feb_varText1Product1
.25Cost2_feb_varText2Product2
~MyCost^~hinge~~MyCost^~rate~~MyCost^~period~
revenuerevenue2010/01/01 - 2010/01/31
revenuerevenue2010/01/01 - 2010/01/31
revenuerevenue2010/02/01 - 2010/02/28
revenuerevenue2010/02/01 - 2010/02/28
In February, the user ’s cost for Product1 went down to 15% of the revenue, and Product2 went down to 25% of its revenue.
Result
An example of output from the report is shown here:
Period: Jan 2010
Report: Products
MyCostRevenueProducts
$2000.05$10,000.23Product1
67Admin Tools
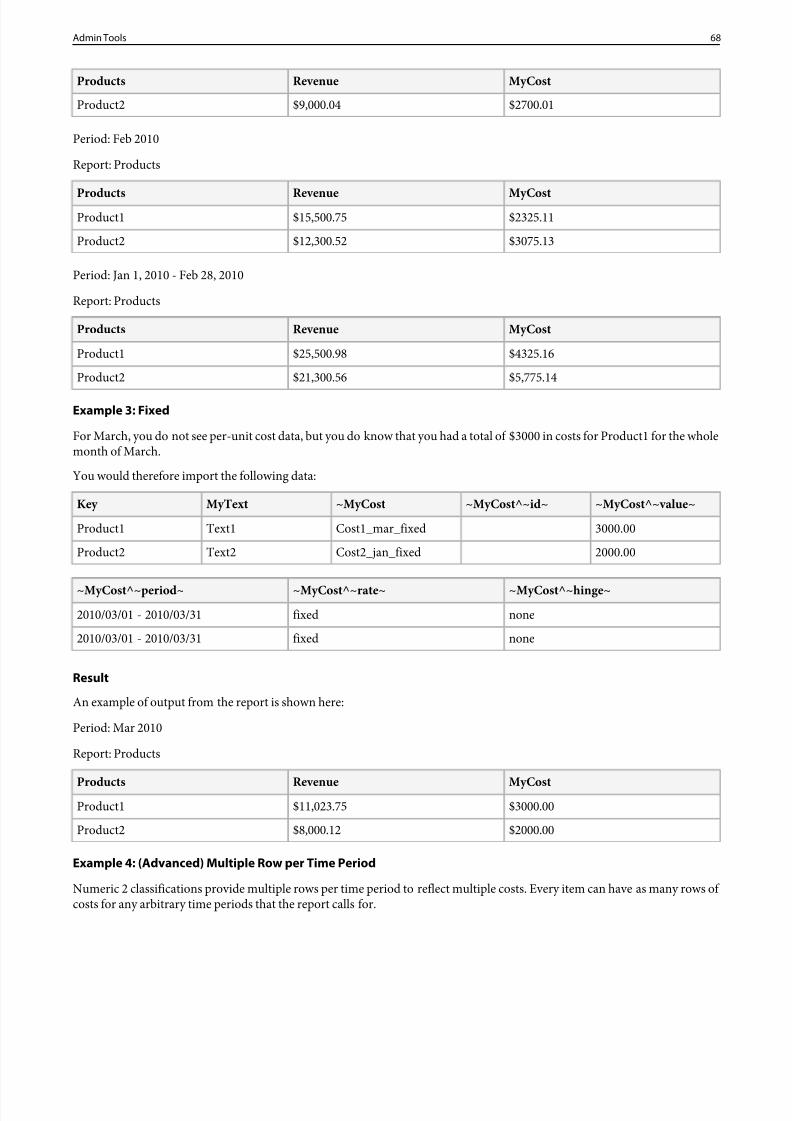
8/18/2019 Analytics Reference Adobe
http://slidepdf.com/reader/full/analytics-reference-adobe 68/332
MyCostRevenueProducts
$2700.01$9,000.04Product2
Period: Feb 2010
Report: Products
MyCostRevenueProducts$2325.11$15,500.75Product1
$3075.13$12,300.52Product2
Period: Jan 1, 2010 - Feb 28, 2010
Report: Products
MyCostRevenueProducts
$4325.16$25,500.98Product1
$5,775.14$21,300.56Product2
Example 3: Fixed
For March, you do not see per-unit cost data, but you do know that you had a total of $3000 in costs for Product1 for the wholemonth of March.
You would therefore import the following data:
~MyCost^~value~~MyCost^~id~~MyCostMyTextKey
3000.00Cost1_mar_fixedText1Product1
2000.00Cost2_jan_fixedText2Product2
~MyCost^~hinge~~MyCost^~rate~~MyCost^~period~nonefixed2010/03/01 - 2010/03/31
nonefixed2010/03/01 - 2010/03/31
Result
An example of output from the report is shown here:
Period: Mar 2010
Report: Products
MyCostRevenueProducts$3000.00$11,023.75Product1
$2000.00$8,000.12Product2
Example 4: (Advanced) Multiple Row per Time Period
Numeric 2 classifications provide multiple rows per time period to reflect multiple costs. Every item can have as many rows of costs for any arbitrary time periods that the report calls for.
68Admin Tools
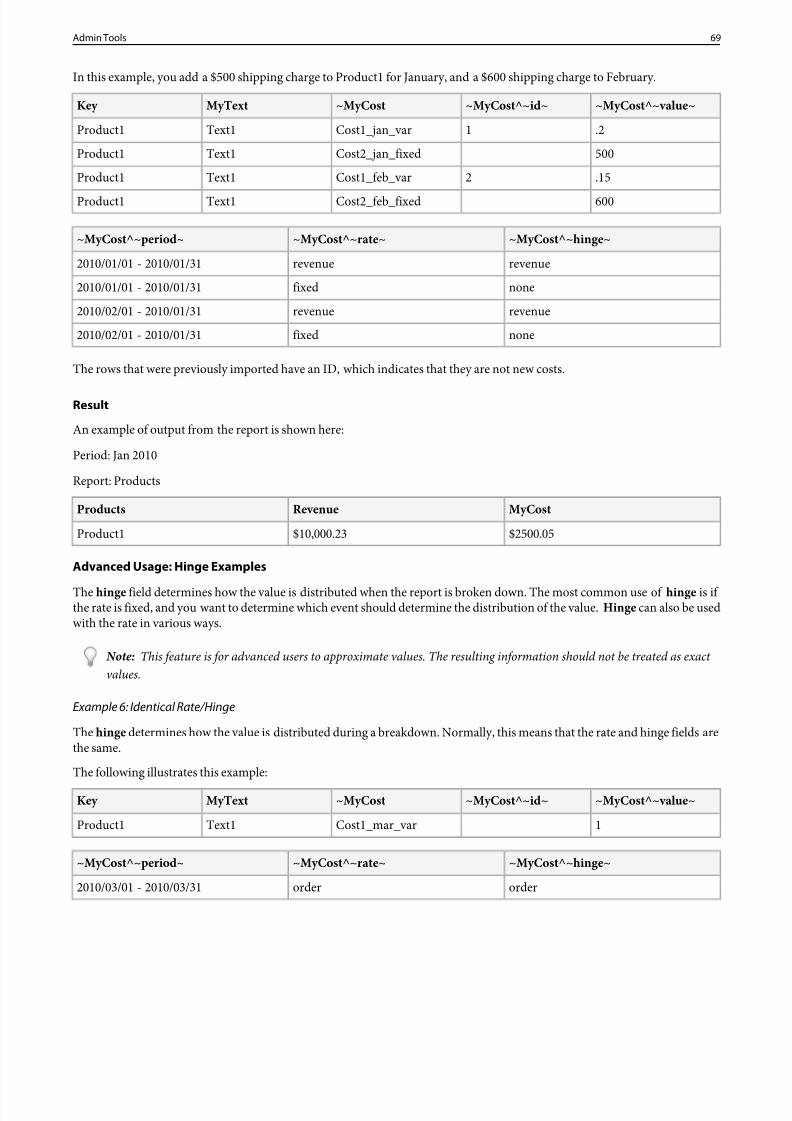
8/18/2019 Analytics Reference Adobe
http://slidepdf.com/reader/full/analytics-reference-adobe 69/332
In this example, you add a $500 shipping charge to Product1 for January, and a $600 shipping charge to February.
~MyCost^~value~~MyCost^~id~~MyCostMyTextKey
.21Cost1_jan_varText1Product1
500Cost2_jan_fixedText1Product1
.152Cost1_feb_varText1Product1
600Cost2_feb_fixedText1Product1
~MyCost^~hinge~~MyCost^~rate~~MyCost^~period~
revenuerevenue2010/01/01 - 2010/01/31
nonefixed2010/01/01 - 2010/01/31
revenuerevenue2010/02/01 - 2010/01/31
nonefixed2010/02/01 - 2010/01/31
The rows that were previously imported have an ID, which indicates that they are not new costs.
Result
An example of output from the report is shown here:
Period: Jan 2010
Report: Products
MyCostRevenueProducts
$2500.05$10,000.23Product1
Advanced Usage: Hinge Examples
The hinge field determines how the value is distributed when the report is broken down. The most common use of hinge is if the rate is fixed, and you want to determine which event should determine the distribution of the value. Hinge can also be usedwith the rate in various ways.
Note: This feature is for advanced users to approximate values. The resulting information should not be treated as exact values.
Example 6: Identical Rate/Hinge
The hinge determines how the value is distributed during a breakdown. Normally, this means that the rate and hinge fields arethe same.
The following illustrates this example:
~MyCost^~value~~MyCost^~id~~MyCostMyTextKey
1Cost1_mar_varText1Product1
~MyCost^~hinge~~MyCost^~rate~~MyCost^~period~
orderorder2010/03/01 - 2010/03/31
69Admin Tools
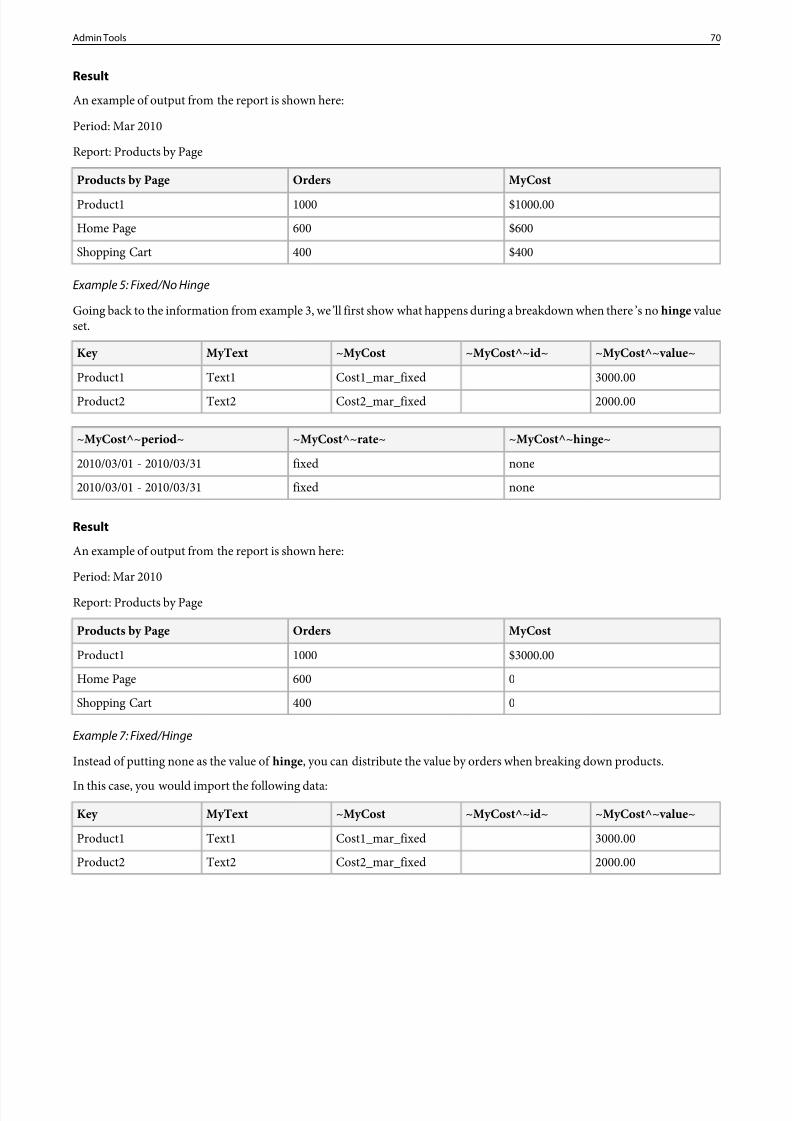
8/18/2019 Analytics Reference Adobe
http://slidepdf.com/reader/full/analytics-reference-adobe 70/332
Result
An example of output from the report is shown here:
Period: Mar 2010
Report: Products by Page
MyCostOrdersProducts by Page
$1000.001000Product1
$600600Home Page
$400400Shopping Cart
Example 5: Fixed/No Hinge
Going back to the information from example 3, we’ll first show what happens during a breakdown when there’s no hinge valueset.
~MyCost^~value~~MyCost^~id~~MyCostMyTextKey
3000.00Cost1_mar_fixedText1Product1
2000.00Cost2_mar_fixedText2Product2
~MyCost^~hinge~~MyCost^~rate~~MyCost^~period~
nonefixed2010/03/01 - 2010/03/31
nonefixed2010/03/01 - 2010/03/31
Result
An example of output from the report is shown here:
Period: Mar 2010
Report: Products by Page
MyCostOrdersProducts by Page
$3000.001000Product1
0600Home Page
0400Shopping Cart
Example 7: Fixed/Hinge
Instead of putting none as the value of hinge , you can distribute the value by orders when breaking down products.
In this case, you would import the following data:
~MyCost^~value~~MyCost^~id~~MyCostMyTextKey
3000.00Cost1_mar_fixedText1Product1
2000.00Cost2_mar_fixedText2Product2
70Admin Tools
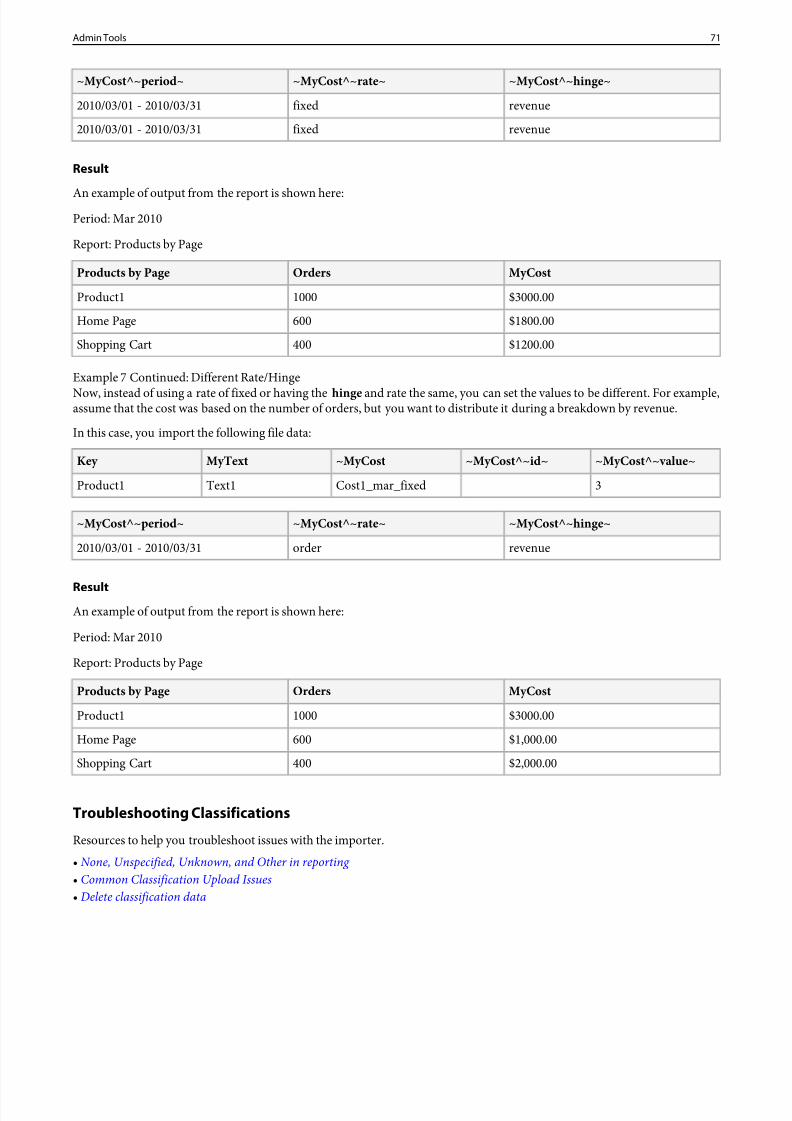
8/18/2019 Analytics Reference Adobe
http://slidepdf.com/reader/full/analytics-reference-adobe 71/332
~MyCost^~hinge~~MyCost^~rate~~MyCost^~period~
revenuefixed2010/03/01 - 2010/03/31
revenuefixed2010/03/01 - 2010/03/31
Result
An example of output from the report is shown here:Period: Mar 2010
Report: Products by Page
MyCostOrdersProducts by Page
$3000.001000Product1
$1800.00600Home Page
$1200.00400Shopping Cart
Example 7 Continued: Different Rate/Hinge
Now, instead of using a rate of fixed or having thehinge and rate the same, you can set the values to be different. For example,assume that the cost was based on the number of orders, but you want to distribute it during a breakdown by revenue.
In this case, you import the following file data:
~MyCost^~value~~MyCost^~id~~MyCostMyTextKey
3Cost1_mar_fixedText1Product1
~MyCost^~hinge~~MyCost^~rate~~MyCost^~period~
revenueorder2010/03/01 - 2010/03/31
ResultAn example of output from the report is shown here:
Period: Mar 2010
Report: Products by Page
MyCostOrdersProducts by Page
$3000.001000Product1
$1,000.00600Home Page
$2,000.00400Shopping Cart
Troubleshooting Classifications
Resources to help you troubleshoot issues with the importer.• None, Unspecified, Unknown, and Other in reporting • Common Classification Upload Issues• Delete classification data
71Admin Tools
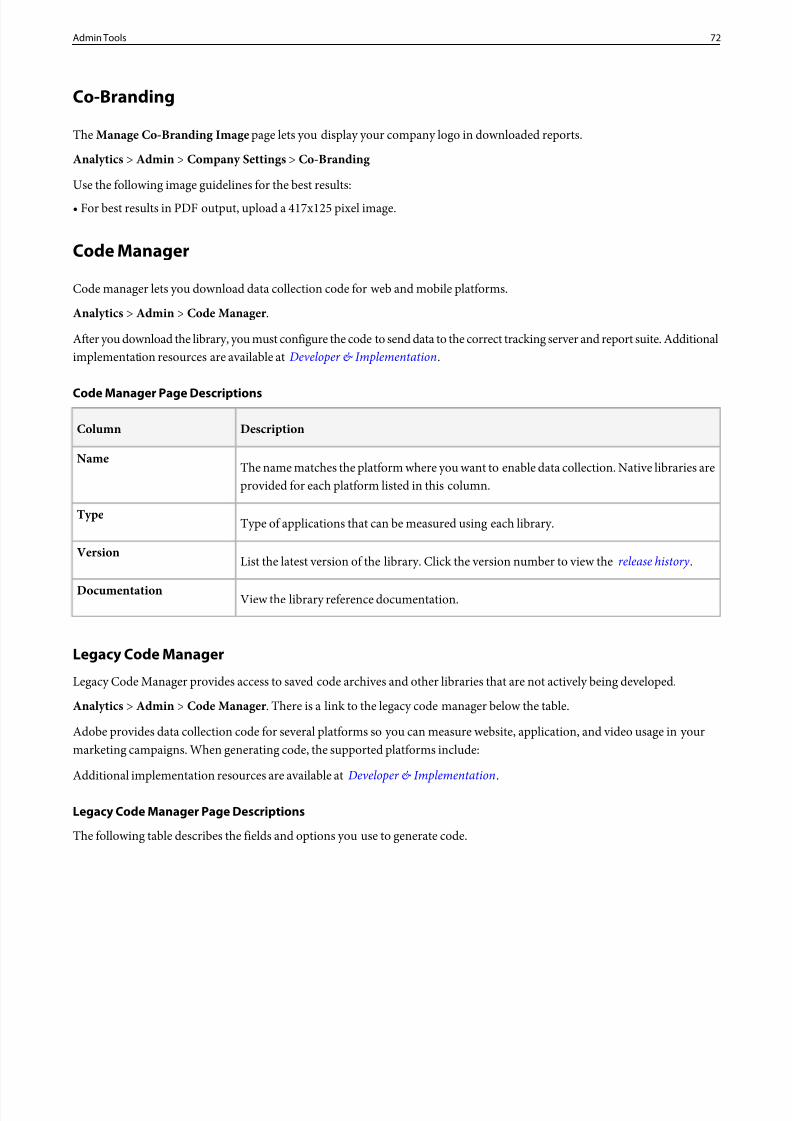
8/18/2019 Analytics Reference Adobe
http://slidepdf.com/reader/full/analytics-reference-adobe 72/332
Co-Branding
The Manage Co-Branding Image page lets you display your company logo in downloaded reports.
Analytics > Admin > Company Settings > Co-Branding
Use the following image guidelines for the best results:
• For best results in PDF output, upload a 417x125 pixel image.
Code Manager
Code manager lets you download data collection code for web and mobile platforms.
Analytics > Admin > Code Manager .
After you download the library, you must configure the code to send data to the correct tracking server and report suite. Additionalimplementation resources are available at Developer & Implementation.
Code Manager Page Descriptions
DescriptionColumn
The name matches the platform where you want to enable data collection. Native libraries areprovided for each platform listed in this column.
Name
Type of applications that can be measured using each library.Type
List the latest version of the library. Click the version number to view therelease history .Version
View the library reference documentation.Documentation
Legacy Code Manager
Legacy Code Manager provides access to saved code archives and other libraries that are not actively being developed.
Analytics > Admin > Code Manager . There is a link to the legacy code manager below the table.
Adobe provides data collection code for several platforms so you can measure website, application, and video usage in yourmarketing campaigns. When generating code, the supported platforms include:
Additional implementation resources are available at Developer & Implementation.
Legacy Code Manager Page Descriptions
The following table describes the fields and options you use to generate code.
72Admin Tools
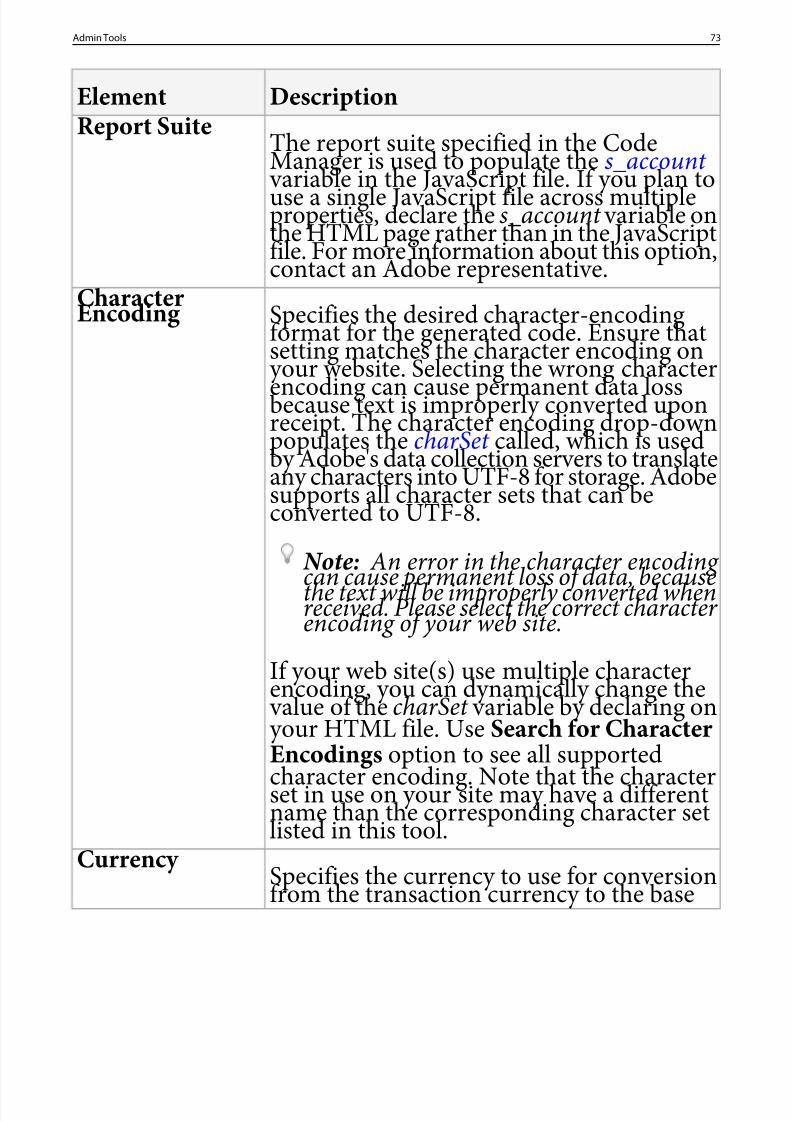
8/18/2019 Analytics Reference Adobe
http://slidepdf.com/reader/full/analytics-reference-adobe 73/332
DescriptionElement
The report suite specified in the CodeManager is used to populate the s_account
Report Suite
variable in the JavaScript file. If you plan touse a single JavaScript file across multipleproperties, declare the s_account variable onthe HTML page rather than in the JavaScriptfile. For more information about this option,contact an Adobe representative.
Specifies the desired character-encodingformat for the generated code. Ensure that
CharacterEncoding setting matches the character encoding onyour website. Selecting the wrong characterencoding can cause permanent data lossbecause text is improperly converted uponreceipt. The character encoding drop-downpopulates the charSet called, which is usedby Adobe's data collection servers to translateany characters into UTF-8 for storage. Adobesupports all character sets that can beconverted to UTF-8.
Note: An error in the character encoding can cause permanent loss of data, becausethe text will be improperly converted whenreceived. Please select the correct character encoding of your web site.
If your web site(s) use multiple characterencoding, you can dynamically change the value of thecharSet variable by declaring onyour HTML file. UseSearch for CharacterEncodings option to see all supported
character encoding. Note that the characterset in use on your site may have a differentname than the corresponding character setlisted in this tool.
Specifies the currency to use for conversionfrom the transaction currency to the base
Currency
73Admin Tools
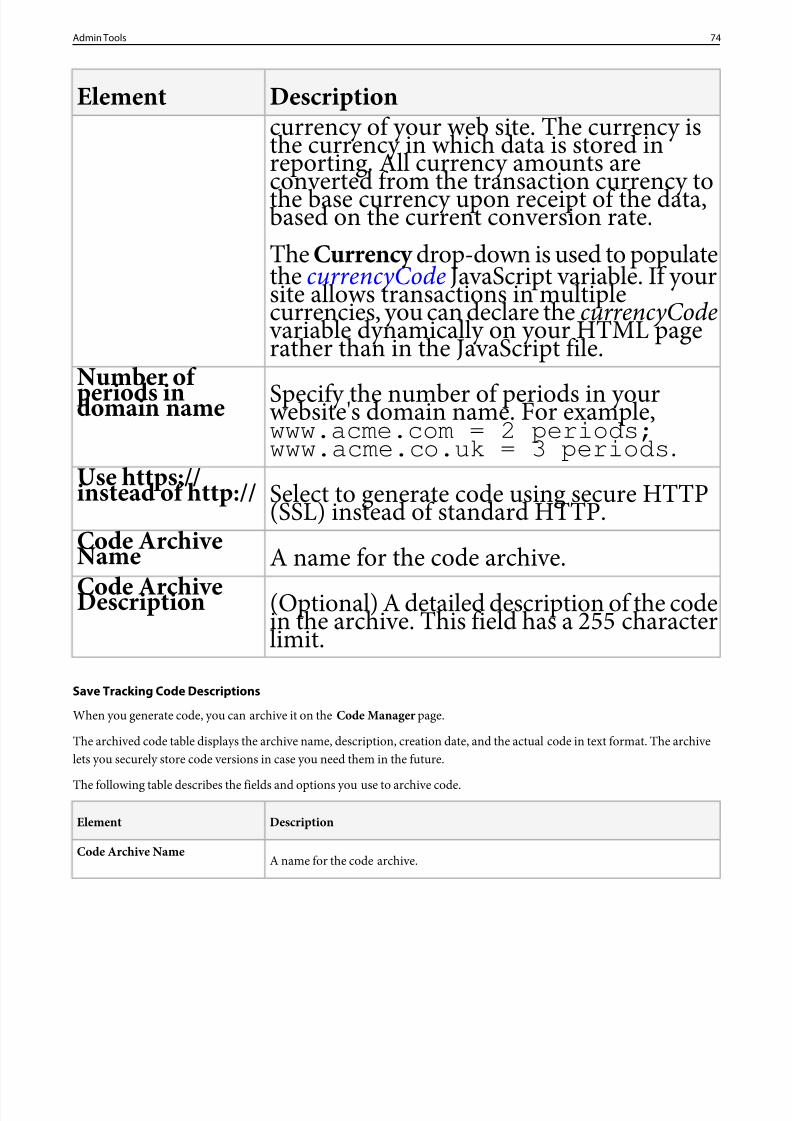
8/18/2019 Analytics Reference Adobe
http://slidepdf.com/reader/full/analytics-reference-adobe 74/332
DescriptionElementcurrency of your web site. The currency isthe currency in which data is stored inreporting. All currency amounts areconverted from the transaction currency tothe base currency upon receipt of the data,based on the current conversion rate.The Currency drop-down is used to populatethe currencyCode JavaScript variable. If yoursite allows transactions in multiplecurrencies, you can declare thecurrencyCode variable dynamically on your HTML pagerather than in the JavaScript file.
Specify the number of periods in yourwebsite's domain name. For example,Number of periods indomain name
www.acme.com = 2 periods;www.acme.co.uk = 3 periods .
Select to generate code using secure HTTP(SSL) instead of standard HTTP.
Use https;//instead of http://
A name for the code archive.Code ArchiveName
(Optional) A detailed description of the codein the archive. This field has a 255 characterlimit.
Code ArchiveDescription
Save Tracking Code Descriptions
When you generate code, you can archive it on the Code Manager page.
The archived code table displays the archive name, description, creation date, and the actual code in text format. The archivelets you securely store code versions in case you need them in the future.
The following table describes the fields and options you use to archive code.
DescriptionElement
A name for the code archive.Code Archive Name
74Admin Tools
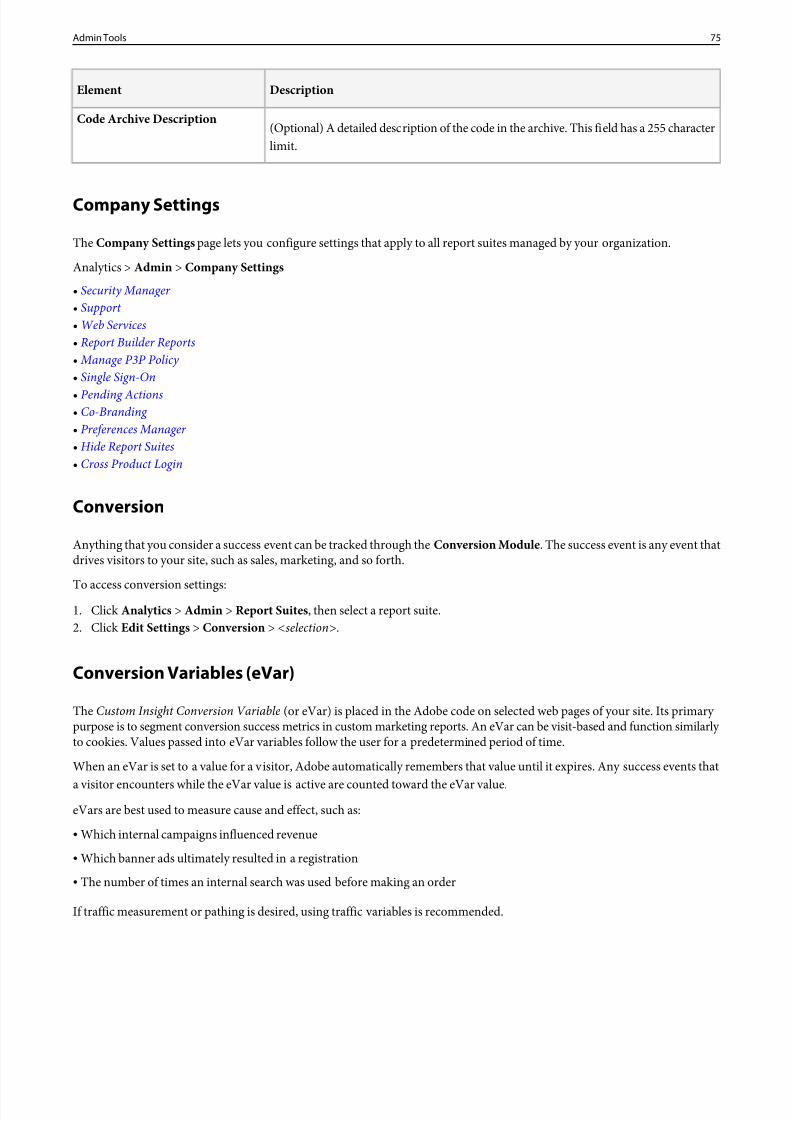
8/18/2019 Analytics Reference Adobe
http://slidepdf.com/reader/full/analytics-reference-adobe 75/332
DescriptionElement
(Optional) A detailed description of the code in the archive. This field has a 255 characterlimit.
Code Archive Description
Company Settings
The Company Settings page lets you configure settings that apply to all report suites managed by your organization.
Analytics >Admin > Company Settings
• Security Manager • Support • Web Services• Report Builder Reports• Manage P3P Policy • Single Sign-On• Pending Actions• Co-Branding • Preferences Manager • Hide Report Suites• Cross Product Login
Conversion
Anything that you consider a success event can be tracked through theConversion Module . The success event is any event thatdrives visitors to your site, such as sales, marketing, and so forth.
To access conversion settings:1. ClickAnalytics > Admin > Report Suites , then select a report suite.2. ClickEdit Settings > Conversion > <selection>.
Conversion Variables (eVar)
The Custom Insight Conversion Variable (or eVar) is placed in the Adobe code on selected web pages of your site. Its primary purpose is to segment conversion success metrics in custom marketing reports. An eVar can be visit-based and function similarly to cookies. Values passed into eVar variables follow the user for a predetermined period of time.
When an eVar is set to a value for a visitor, Adobe automatically remembers that value until it expires. Any success events that
a visitor encounters while the eVar value is active are counted toward the eVar value.eVars are best used to measure cause and effect, such as:
• Which internal campaigns influenced revenue
• Which banner ads ultimately resulted in a registration• The number of times an internal search was used before making an order
If traffic measurement or pathing is desired, using traffic variables is recommended.
75Admin Tools
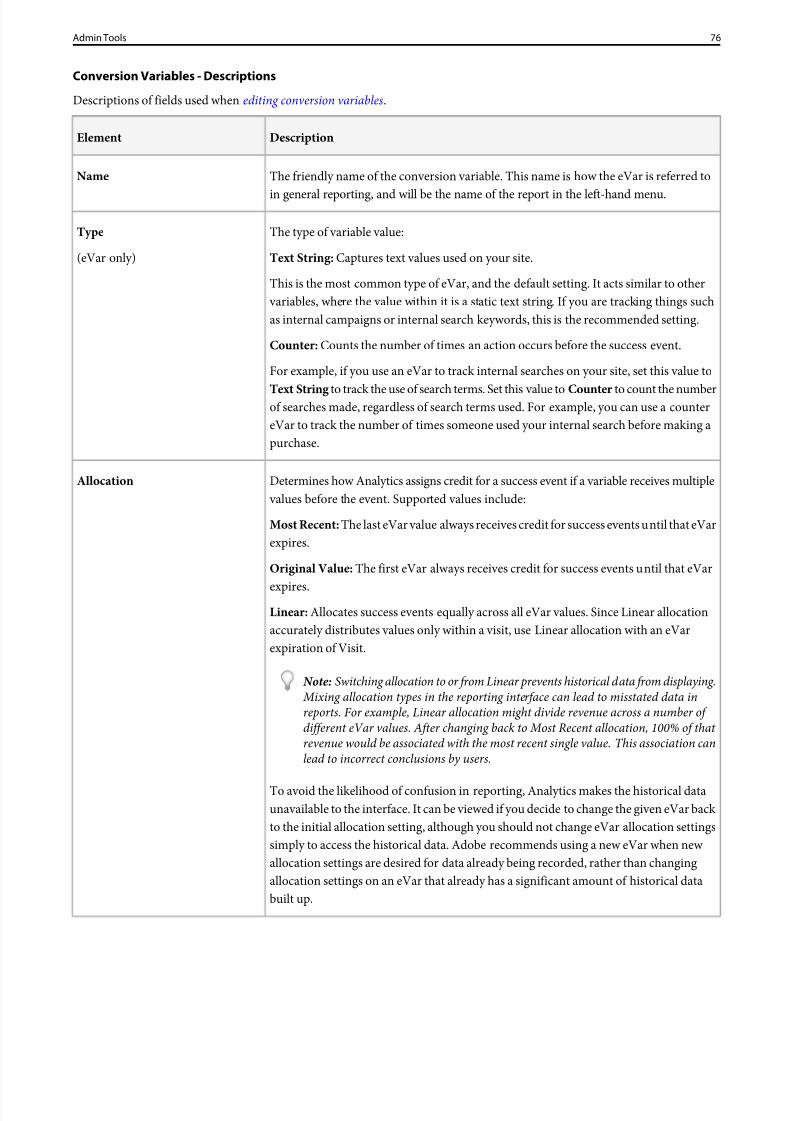
8/18/2019 Analytics Reference Adobe
http://slidepdf.com/reader/full/analytics-reference-adobe 76/332
Conversion Variables - Descriptions
Descriptions of fields used whenediting conversion variables.
DescriptionElement
The friendly name of the conversion variable. This name is how the eVar is referred to
in general reporting, and will be the name of the report in the left-hand menu.
Name
The type of variable value:Type
Text String: Captures text values used on your site.(eVar only)
This is the most common type of eVar, and the default setting. It acts similar to other variables, where the value within it is a static text string. If you are tracking things suchas internal campaigns or internal search keywords, this is the recommended setting.
Counter: Counts the number of times an action occurs before the success event.
For example, if you use an eVar to track internal searches on your site, set this value to
Text String to track the use of search terms. Set this value toCounter to count the numberof searches made, regardless of search terms used. For example, you can use a countereVar to track the number of times someone used your internal search before making apurchase.
Determines how Analytics assigns credit for a success event if a variable receives multiple values before the event. Supported values include:
Allocation
Most Recent: The last eVar value always receives credit for success events until that eVarexpires.
Original Value: The first eVar always receives credit for success events until that eVar
expires.Linear: Allocates success events equally across all eVar values. Since Linear allocationaccurately distributes values only within a visit, use Linear allocation with an eVarexpiration of Visit.
Note: Switching allocation to or from Linear prevents historical data from displaying. Mixing allocation types in the reporting interface can lead to misstated data inreports. For example, Linear allocation might divide revenue across a number of different eVar values. After changing back to Most Recent allocation, 100% of that revenue would be associated with the most recent single value. This association canlead to incorrect conclusions by users.
To avoid the likelihood of confusion in reporting, Analytics makes the historical dataunavailable to the interface. It can be viewed if you decide to change the given eVar back to the initial allocation setting, although you should not change eVar allocation settingssimply to access the historical data. Adobe recommends using a new eVar when new allocation settings are desired for data already being recorded, rather than changingallocation settings on an eVar that already has a significant amount of historical databuilt up.
76Admin Tools
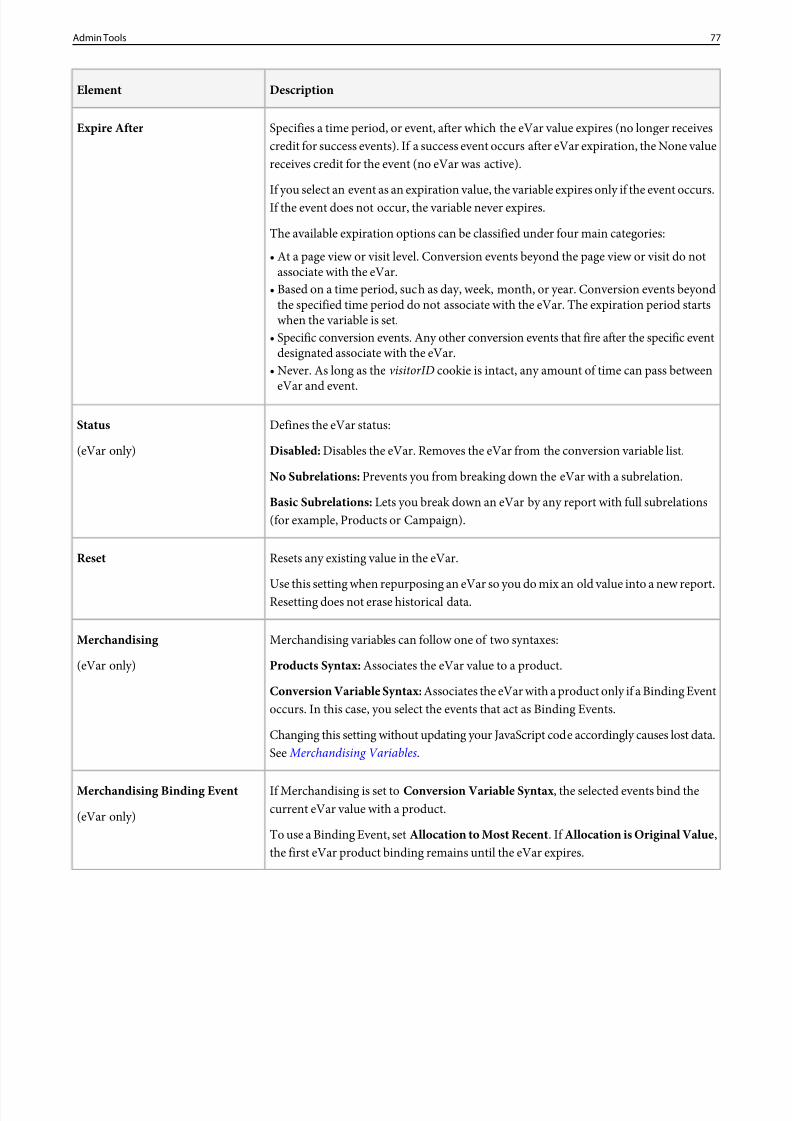
8/18/2019 Analytics Reference Adobe
http://slidepdf.com/reader/full/analytics-reference-adobe 77/332
DescriptionElement
Specifies a time period, or event, after which the eVar value expires (no longer receivescredit for success events). If a success event occurs after eVar expiration, the None valuereceives credit for the event (no eVar was active).
Expire After
If you select an event as an expiration value, the variable expires only if the event occurs.If the event does not occur, the variable never expires.
The available expiration options can be classified under four main categories:
• At a page view or visit level. Conversion events beyond the page view or visit do notassociate with the eVar.
• Based on a time period, such as day, week, month, or year. Conversion events beyondthe specified time period do not associate with the eVar. The expiration period startswhen the variable is set.
• Specific conversion events. Any other conversion events that fire after the specific eventdesignated associate with the eVar.
• Never. As long as thevisitorID cookie is intact, any amount of time can pass between
eVar and event.
Defines the eVar status:Status
Disabled: Disables the eVar. Removes the eVar from the conversion variable list.(eVar only)
No Subrelations: Prevents you from breaking down the eVar with a subrelation.
Basic Subrelations: Lets you break down an eVar by any report with full subrelations(for example, Products or Campaign).
Resets any existing value in the eVar.Reset
Use this setting when repurposing an eVar so you do mix an old value into a new report.Resetting does not erase historical data.
Merchandising variables can follow one of two syntaxes:Merchandising
Products Syntax: Associates the eVar value to a product.(eVar only)
Conversion Variable Syntax: Associates the eVar with a product only if a Binding Eventoccurs. In this case, you select the events that act as Binding Events.
Changing this setting without updating your JavaScript code accordingly causes lost data.See Merchandising Variables .
If Merchandising is set to Conversion Variable Syntax , the selected events bind thecurrent eVar value with a product.
Merchandising Binding Event
(eVar only)To use a Binding Event, setAllocation to Most Recent . IfAllocation is Original Value ,the first eVar product binding remains until the eVar expires.
77Admin Tools
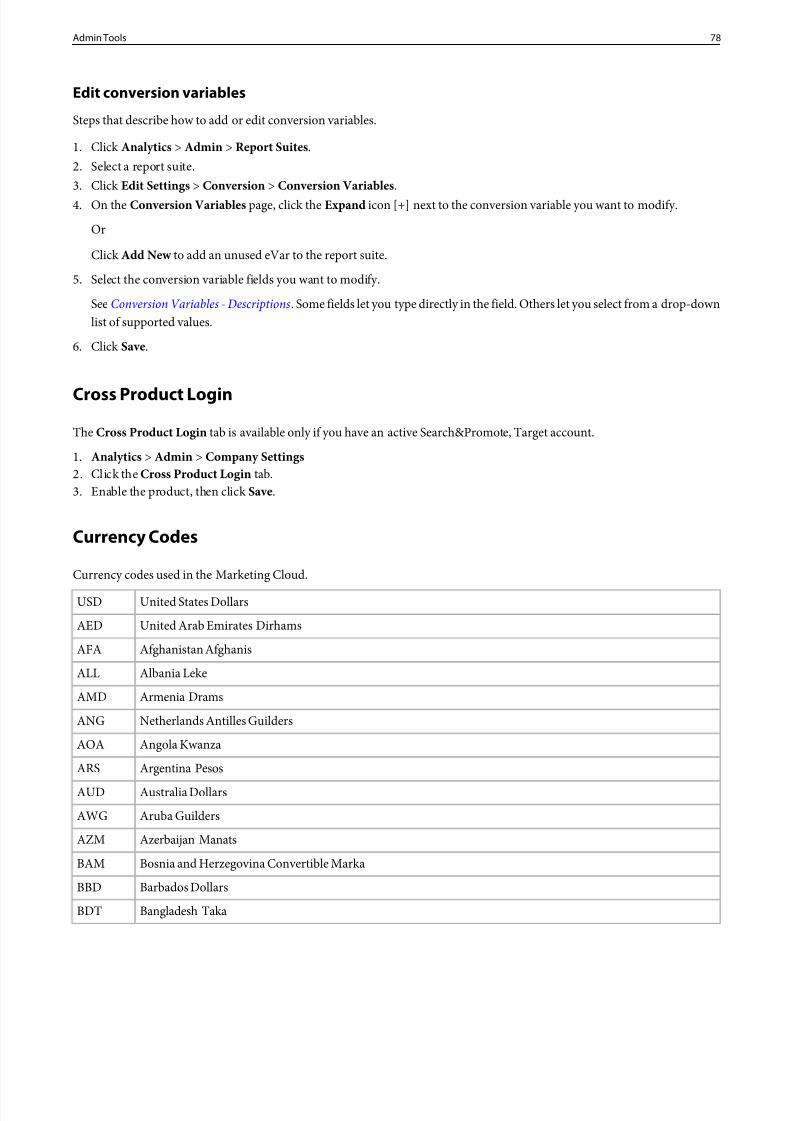
8/18/2019 Analytics Reference Adobe
http://slidepdf.com/reader/full/analytics-reference-adobe 78/332
Edit conversion variables
Steps that describe how to add or edit conversion variables.
1. ClickAnalytics > Admin > Report Suites .2. Select a report suite.3. ClickEdit Settings > Conversion > Conversion Variables .4. On the Conversion Variables page, click theExpand icon [+] next to the conversion variable you want to modify.
Or
Click Add New to add an unused eVar to the report suite.
5. Select the conversion variable fields you want to modify.
SeeConversion Variables - Descriptions. Some fields let you type directly in the field. Others let you select from a drop-downlist of supported values.
6. ClickSave.
Cross Product Login
The Cross Product Login tab is available only if you have an active Search&Promote, Target account.
1. Analytics > Admin > Company Settings2. Click theCross Product Login tab.3. Enable the product, then clickSave.
Currency Codes
Currency codes used in the Marketing Cloud.
United States DollarsUSD
United Arab Emirates DirhamsAED
Afghanistan AfghanisAFA
Albania LekeALL
Armenia DramsAMD
Netherlands Antilles GuildersANG
Angola KwanzaAOA
Argentina PesosARS
Australia DollarsAUD
Aruba GuildersAWG
Azerbaijan ManatsAZM
Bosnia and Herzegovina Convertible MarkaBAM
Barbados DollarsBBD
Bangladesh TakaBDT
78Admin Tools
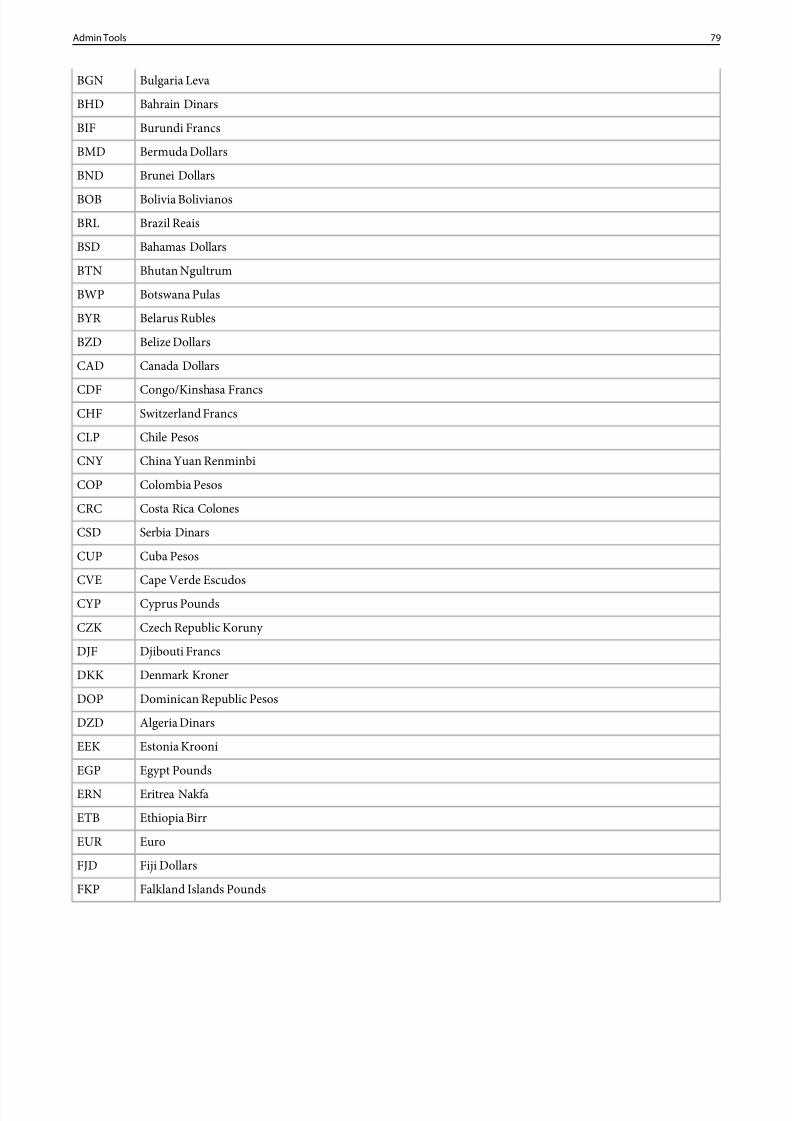
8/18/2019 Analytics Reference Adobe
http://slidepdf.com/reader/full/analytics-reference-adobe 79/332
Bulgaria LevaBGN
Bahrain DinarsBHD
Burundi FrancsBIF
Bermuda DollarsBMD
Brunei DollarsBND
Bolivia BolivianosBOB
Brazil ReaisBRL
Bahamas DollarsBSD
Bhutan NgultrumBTN
Botswana PulasBWP
Belarus RublesBYR
Belize DollarsBZD
Canada DollarsCAD
Congo/Kinshasa FrancsCDFSwitzerland FrancsCHF
Chile PesosCLP
China Yuan RenminbiCNY
Colombia PesosCOP
Costa Rica ColonesCRC
Serbia DinarsCSD
Cuba PesosCUP
Cape Verde EscudosCVE
Cyprus PoundsCYP
Czech Republic Koruny CZK
Djibouti FrancsDJF
Denmark KronerDKK
Dominican Republic PesosDOP
Algeria DinarsDZD
Estonia KrooniEEK
Egypt PoundsEGP
Eritrea NakfaERN
Ethiopia BirrETB
EuroEUR
Fiji DollarsFJD
Falkland Islands PoundsFKP
79Admin Tools
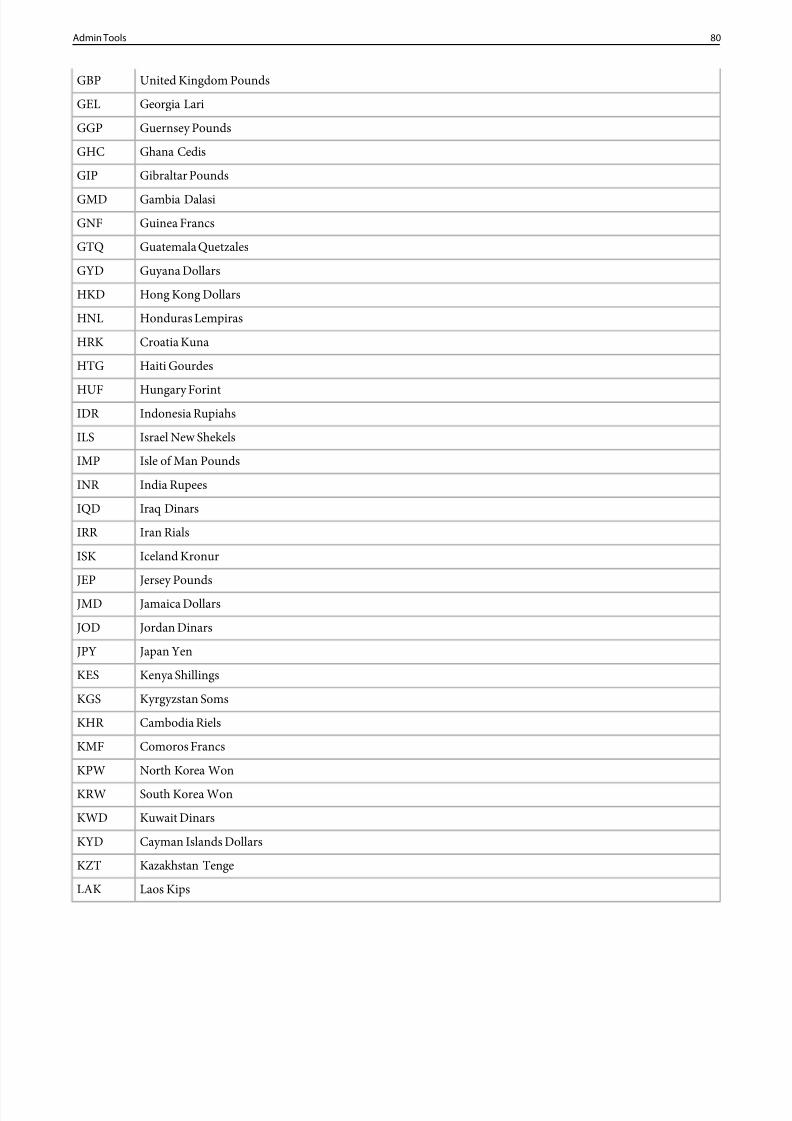
8/18/2019 Analytics Reference Adobe
http://slidepdf.com/reader/full/analytics-reference-adobe 80/332
United Kingdom PoundsGBP
Georgia LariGEL
Guernsey PoundsGGP
Ghana CedisGHC
Gibraltar PoundsGIP
Gambia DalasiGMD
Guinea FrancsGNF
Guatemala QuetzalesGTQ
Guyana DollarsGYD
Hong Kong DollarsHKD
Honduras LempirasHNL
Croatia KunaHRK
Haiti GourdesHTG
Hungary ForintHUFIndonesia RupiahsIDR
Israel New ShekelsILS
Isle of Man PoundsIMP
India RupeesINR
Iraq DinarsIQD
Iran RialsIRR
Iceland KronurISK
Jersey PoundsJEP
Jamaica DollarsJMD
Jordan DinarsJOD
Japan YenJPY
Kenya ShillingsKES
Kyrgyzstan SomsKGS
Cambodia RielsKHR
Comoros FrancsKMF
North Korea WonKPW
South Korea WonKRW
Kuwait DinarsKWD
Cayman Islands DollarsKYD
Kazakhstan TengeKZT
Laos KipsLAK
80Admin Tools
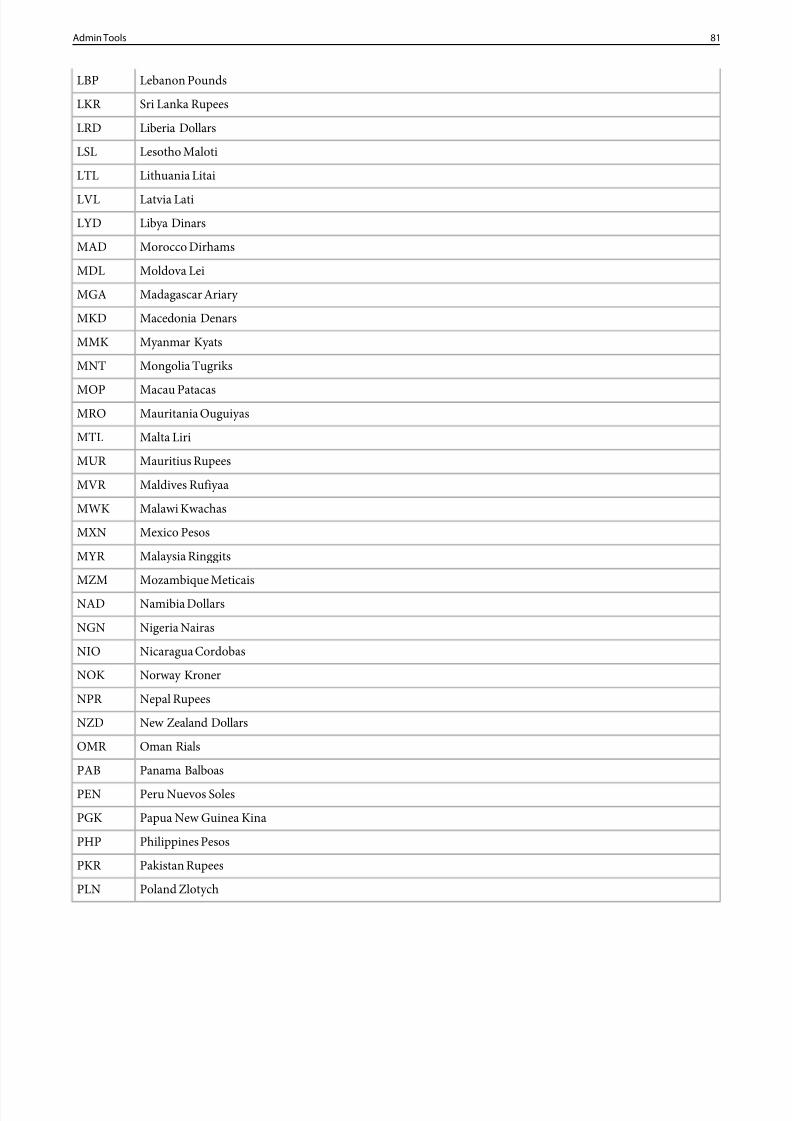
8/18/2019 Analytics Reference Adobe
http://slidepdf.com/reader/full/analytics-reference-adobe 81/332
Lebanon PoundsLBP
Sri Lanka RupeesLKR
Liberia DollarsLRD
Lesotho MalotiLSL
Lithuania LitaiLTL
Latvia LatiLVL
Libya DinarsLYD
Morocco DirhamsMAD
Moldova LeiMDL
Madagascar Ariary MGA
Macedonia DenarsMKD
Myanmar KyatsMMK
Mongolia TugriksMNT
Macau PatacasMOPMauritania OuguiyasMRO
Malta LiriMTL
Mauritius RupeesMUR
Maldives RufiyaaMVR
Malawi KwachasMWK
Mexico PesosMXN
Malaysia RinggitsMYR
Mozambique MeticaisMZM
Namibia DollarsNAD
Nigeria NairasNGN
Nicaragua CordobasNIO
Norway KronerNOK
Nepal RupeesNPR
New Zealand DollarsNZD
Oman RialsOMR
Panama BalboasPAB
Peru Nuevos SolesPEN
Papua New Guinea KinaPGK
Philippines PesosPHP
Pakistan RupeesPKR
Poland ZlotychPLN
81Admin Tools
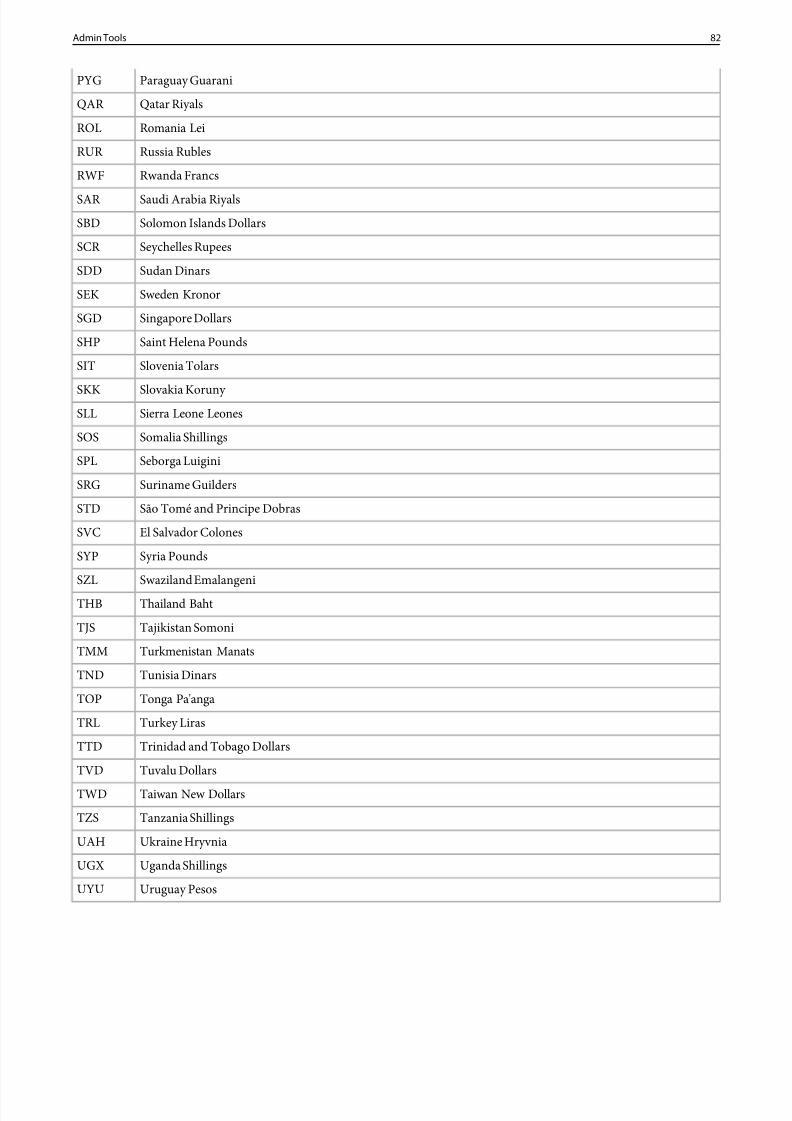
8/18/2019 Analytics Reference Adobe
http://slidepdf.com/reader/full/analytics-reference-adobe 82/332
Paraguay GuaraniPYG
Qatar RiyalsQAR
Romania LeiROL
Russia RublesRUR
Rwanda FrancsRWF
Saudi Arabia RiyalsSAR
Solomon Islands DollarsSBD
Seychelles RupeesSCR
Sudan DinarsSDD
Sweden KronorSEK
Singapore DollarsSGD
Saint Helena PoundsSHP
Slovenia TolarsSIT
Slovakia Koruny SKKSierra Leone LeonesSLL
Somalia ShillingsSOS
Seborga LuiginiSPL
Suriname GuildersSRG
São Tomé and Principe DobrasSTD
El Salvador ColonesSVC
Syria PoundsSYP
Swaziland EmalangeniSZL
Thailand BahtTHB
Tajikistan SomoniTJS
Turkmenistan ManatsTMM
Tunisia DinarsTND
Tonga Pa'angaTOP
Turkey LirasTRL
Trinidad and Tobago DollarsTTD
Tuvalu DollarsTVD
Taiwan New DollarsTWD
Tanzania ShillingsTZS
Ukraine HryvniaUAH
Uganda ShillingsUGX
Uruguay PesosUYU
82Admin Tools
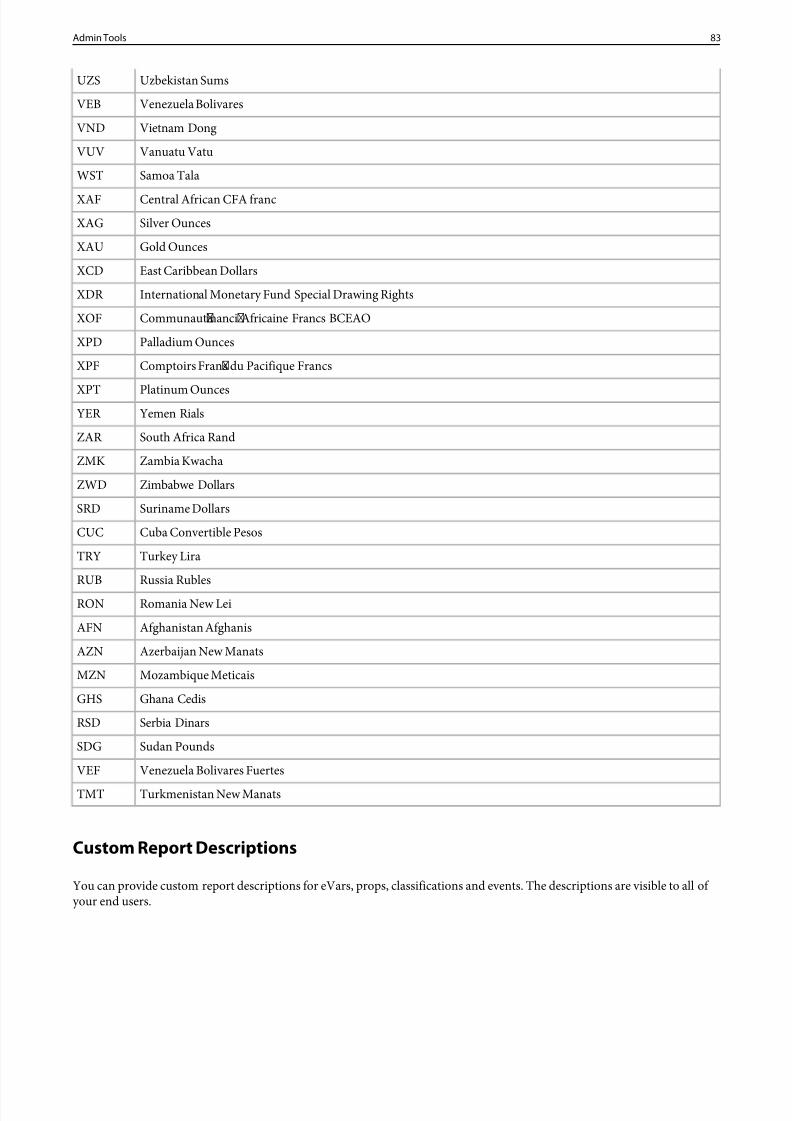
8/18/2019 Analytics Reference Adobe
http://slidepdf.com/reader/full/analytics-reference-adobe 83/332
Uzbekistan SumsUZS
Venezuela BolivaresVEB
Vietnam DongVND
Vanuatu VatuVUV
Samoa TalaWST
Central African CFA francXAF
Silver OuncesXAG
Gold OuncesXAU
East Caribbean DollarsXCD
International Monetary Fund Special Drawing RightsXDR
Communaut inanci Africaine Francs BCEAOXOF
Palladium OuncesXPD
Comptoirs Frans du Pacifique FrancsXPF
Platinum OuncesXPTYemen RialsYER
South Africa RandZAR
Zambia KwachaZMK
Zimbabwe DollarsZWD
Suriname DollarsSRD
Cuba Convertible PesosCUC
Turkey LiraTRY
Russia RublesRUB
Romania New LeiRON
Afghanistan AfghanisAFN
Azerbaijan New ManatsAZN
Mozambique MeticaisMZN
Ghana CedisGHS
Serbia DinarsRSD
Sudan PoundsSDG
Venezuela Bolivares FuertesVEF
Turkmenistan New ManatsTMT
Custom Report Descriptions
You can provide custom report descriptions for eVars, props, classifications and events. The descriptions are visible to all of your end users.
83Admin Tools
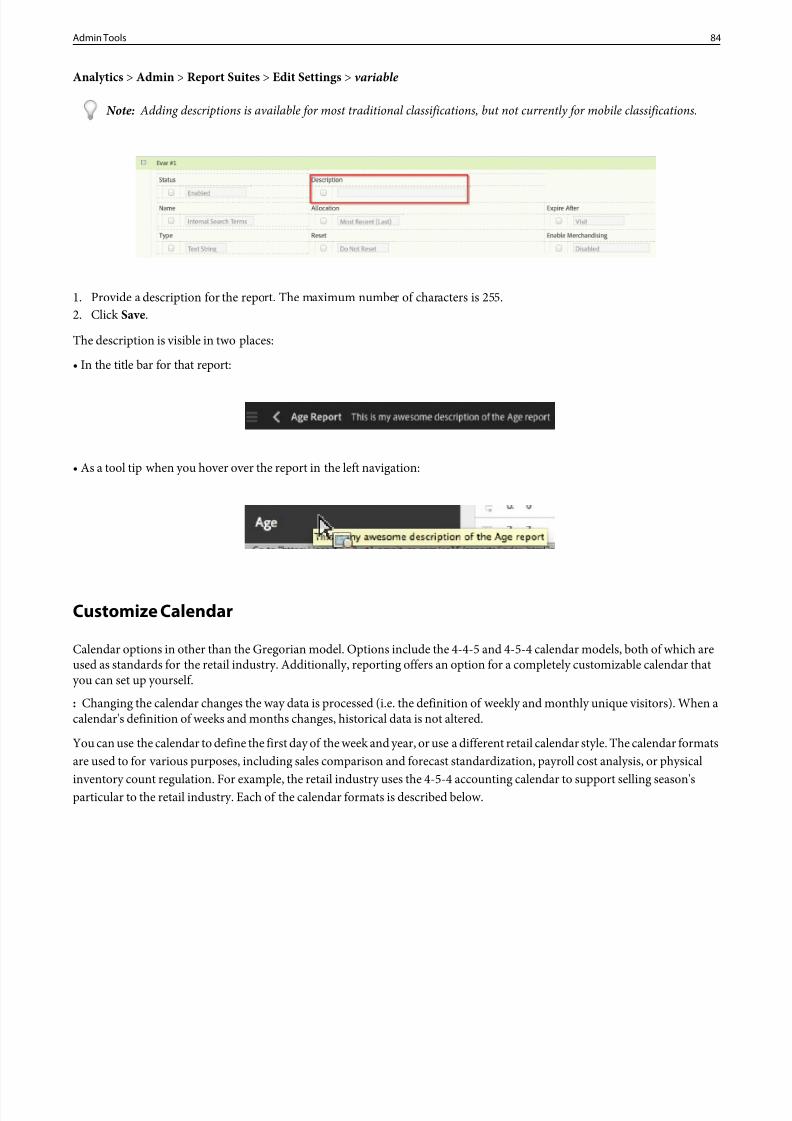
8/18/2019 Analytics Reference Adobe
http://slidepdf.com/reader/full/analytics-reference-adobe 84/332
Analytics > Admin > Report Suites > Edit Settings > variable
Note: Adding descriptions is available for most traditional classifications, but not currently for mobile classifications.
1. Provide a description for the report. The maximum number of characters is 255.2. ClickSave.
The description is visible in two places:
• In the title bar for that report:
• As a tool tip when you hover over the report in the left navigation:
Customize Calendar
Calendar options in other than the Gregorian model. Options include the 4-4-5 and 4-5-4 calendar models, both of which areused as standards for the retail industry. Additionally, reporting offers an option for a completely customizable calendar thatyou can set up yourself.
: Changing the calendar changes the way data is processed (i.e. the definition of weekly and monthly unique visitors). When acalendar's definition of weeks and months changes, historical data is not altered.
You can use the calendar to define the first day of the week and year, or use a different retail calendar style. The calendar formatsare used to for various purposes, including sales comparison and forecast standardization, payroll cost analysis, or physical
inventory count regulation. For example, the retail industry uses the 4-5-4 accounting calendar to support selling season'sparticular to the retail industry. Each of the calendar formats is described below.
84Admin Tools
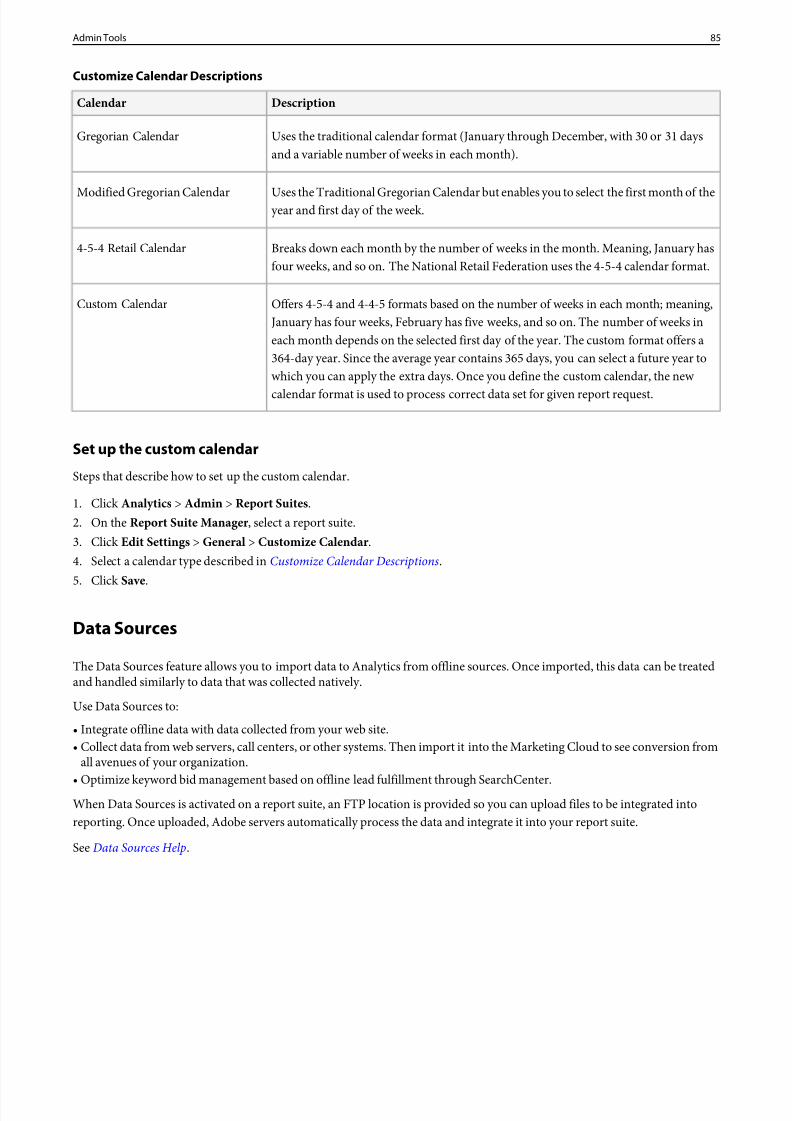
8/18/2019 Analytics Reference Adobe
http://slidepdf.com/reader/full/analytics-reference-adobe 85/332
Customize Calendar Descriptions
DescriptionCalendar
Uses the traditional calendar format (January through December, with 30 or 31 daysand a variable number of weeks in each month).
Gregorian Calendar
Uses the Traditional Gregorian Calendar but enables you to select the first month of theyear and first day of the week.Modified Gregorian Calendar
Breaks down each month by the number of weeks in the month. Meaning, January hasfour weeks, and so on. The National Retail Federation uses the 4-5-4 calendar format.
4-5-4 Retail Calendar
Offers 4-5-4 and 4-4-5 formats based on the number of weeks in each month; meaning,January has four weeks, February has five weeks, and so on. The number of weeks in
Custom Calendar
each month depends on the selected first day of the year. The custom format offers a364-day year. Since the average year contains 365 days, you can select a future year towhich you can apply the extra days. Once you define the custom calendar, the new
calendar format is used to process correct data set for given report request.
Set up the custom calendar
Steps that describe how to set up the custom calendar.
1. ClickAnalytics > Admin > Report Suites .2. On the Report Suite Manager , select a report suite.3. ClickEdit Settings > General > Customize Calendar .4. Select a calendar type described inCustomize Calendar Descriptions.5. ClickSave.
Data Sources
The Data Sources feature allows you to import data to Analytics from offline sources. Once imported, this data can be treatedand handled similarly to data that was collected natively.
Use Data Sources to:
• Integrate offline data with data collected from your web site.• Collect data from web servers, call centers, or other systems. Then import it into the Marketing Cloud to see conversion from
all avenues of your organization.•
Optimize keyword bid management based on offline lead fulfillment through SearchCenter.When Data Sources is activated on a report suite, an FTP location is provided so you can upload files to be integrated intoreporting. Once uploaded, Adobe servers automatically process the data and integrate it into your report suite.
SeeData Sources Help.
85Admin Tools
8/18/2019 Analytics Reference Adobe
http://slidepdf.com/reader/full/analytics-reference-adobe 86/332
Default Metrics
Reports and analytics displays a default set of metrics in all conversion reports, unless a user selects a custom set of metrics. Theselected metrics display for all users of the associated report suite. You can update only one report suite's default metrics at atime. These settings do not guarantee the order in which the default metrics are displayed.
Specify default metrics
Steps that describe how to select default metrics for conversion reports.
1. ClickAnalytics > Admin > Report Suites .2. Select a report suite.3. ClickEdit Settings > Individual Report Suite Settings > Default Metrics .4. Specify the desired metrics, then clickSave.
Note: If you select a currency-based metric, the value passed into currency events is converted from the page currency to thereport suite's base currency upon receipt.
Exclude By IP Address
You can eliminate data from internal website activities, such as site testing and employee usage, from your marketing reports.Excluding data improves report accuracy by excluding IP address data. Additionally, you can remove data from denial of serviceor other malicious events that can skew report data. You can configure exclusion or by using your firewall.
Admin tools > Exclude by IP
• Exclude By Cookie• Exclude by IP Address• Exclude by Firewall
Exclude By Cookie
Lets you exclude this computer from being tracked in your account. If you choose to exclude your computer, any data generatedfrom your computer is not counted.
This feature allows you and your colleagues to visit your site without skewing your traffic data. You may want to use this featureif you do not have a static IP address (such as having a dial-up Internet connection through a service provider) and would liketo exclude yourself from your account data.
DescriptionElement
Generates an opt-out link you can use to exclude your domain. For assistance, please contactyour company's Supported Users.
Add CNAME
Your traffic can be excluded from reporting in your report suites by visiting your company'sopt-out page and choosing to exclude your browser from measurement.
If your implementation is using third party cookies, your opt-out page is here.
86Admin Tools
8/18/2019 Analytics Reference Adobe
http://slidepdf.com/reader/full/analytics-reference-adobe 87/332
Note: Exclusion by computer works only if:• You access your web site from the same work station.• Your cookies are enabled in the browser you are using.• Your cookies are not deleted. If cookies are deleted, you must exclude yourself again.
Exclude by IP Address
An IP address is an Internet address. All Internet users are assigned numerical IP addresses (typically through Internet serviceproviders) that effectively act as electronic identifiers.
Page views are counted and unique page visitors are identified through IP addresses. By excluding IP addresses from beingcounted, you can prevent Adobe from tracking frequent visitors. This feature can allow you and your colleagues to visit yoursite without skewing your traffic data. You may exclude up to 50 different IP addresses.
You can use wildcard indicators (*) to exclude a range of addresses. For example,0.0.*.0 would exclude all IP addressesbetween 0.0.0.0 and 0.0.255.0 . You may exclude up to 50 different IP addresses.
Exclude by Firewall
You can also block data collection from specific IP addresses via a firewall.See the IP Addresses Used in the Marketing Cloud article.
Impact of IP Obfuscation
If IP obfuscation is enabled, IP exclusion happens before the IP address is obfuscated, so customers don't need to changeanything when they enable IP obfuscation.
If the last octet is removed, that is done before IP filtering. As such, the last octet is replaced with a 0, and IP exclusion rulesshould be updated to match IP addresses with a zero on the end. Matching * should match 0.
Finding MethodsThe Finding Methods page identifies how various finding methods reports receive credit for conversion success events on yoursite. For example, if a search engine refers a visitor to your site who makes a purchase, Finding Methods specify how the searchengine receives credit for the referral.
Analytics > Admin > Report Suites > Edit Settings > Conversion > Finding Methods .
Finding Methods Descriptions
DescriptionElement
The finding method you want to modify Name
Specifies how to apply credit for a referral. Supported allocation options include:Most Recent (Last): Gives all credit to the last referrer (default).
Allocation
Original Value: Gives all credit to the first referrer.
Linear: Divides credit among all referrers equally.
Expire After • Visit: After a specified period of inactivity; usually about 30 minutes.
87Admin Tools
8/18/2019 Analytics Reference Adobe
http://slidepdf.com/reader/full/analytics-reference-adobe 88/332
DescriptionElement
• Page View: As soon as any page on your site opens.• Minute: After 1 minute of inactivity.• Purchase: At the time of purchase.• Product View: When a visitor views a product web page.• Cart Open: When a visitor opens a new online shopping cart.
• Cart Checkout: When a visitor checks out using an online shopping cart.• Cart Add: When a visitor adds a product to an online shopping cart.• Cart Remove: When a visitor removes a product from an online shopping cart.• Cart Open: When a visitor views the contents of an online shopping cart.
Note: All Finding Methods expire when the visit ends. If you choose to Expire After a different event (for example, Cart Checkout), the Finding Method expires when Cart Checkout occurs during the visit. If a Cart Checkout does not occur during the visit, the Finding Method still expires when the visit ends.
General Account Settings
Field descriptions for report suite General Account Settings in Admin.
Analytics > Admin > Report Suites > Edit Settings > General > General Account Settings
These settings contain editing options for basic report suite functionality, such as name and time zone.
DescriptionOption
Identifies your site. Give each report suite a unique site title.Site Title
Specifies the report suite's main website. The Base URL does not affect referrer filtering. Useinternal URL filters instead.
Base URL
Determines the date and time associated with your report data.Time Zone
Changing the time zone for a live report suite creates either a spike or gap in report data. Tominimize the impact, Adobe recommends changing time zones during non-peak hours to avoidskewing data.
For example, if you change the report suite time zone from Central to Pacific at 3:00pm, the reportsuite's current time becomes 1:00pm. Because reporting has already collected data for the 1:00hour, reports show a traffic spike between 1:00pm and 3:00pm.
Alternatively, if you change the report suite time zone from Central to Eastern at 3:00pm, the
report suite's current time becomes 4:00pm. Reports display no data between 3:00pm and 4:00pmon the day of the time change.
Enables or disables e-commerce variables such as eVars and campaigns. Use theEnabled, noShopping Cart option to hide all shopping cart reports if you don't have a shopping cart on yoursite.
Conversion Level
88Admin Tools
8/18/2019 Analytics Reference Adobe
http://slidepdf.com/reader/full/analytics-reference-adobe 89/332
DescriptionOption
If your Most Popular Pages Report contains URLs rather than page names, this setting preventsmultiple URLs from representing the same page. For example, the URLshttp://mysite.com
Default Page
and http://mysite.com/index.html are typically the same page. You can remove defaultfilenames so that these two URLs would both show up ashttp://mysite.com .
If left blank, the following filenames are removed from the URLs:index.htm , index.html ,index.cgi , index.asp , default.htm , default.html , default.cgi ,default.asp , home.htm , home.html , home.cgi , and home.asp .
To disable stripping of filenames altogether, enter a value that is never present in your URLs.
Removing the last octet is done before IP filtering. As such, the last octet is replaced with a 0, andIP exclusion rules should be updated to match IP addresses with a zero on the end. Matching *should match 0.
Replace the last octet of IPaddresses with 0
Checking this option means that the IP address is altered before it is processed. For example, theIP address 134.123.567.780 gets changed to 134.123.567.0. Geosegmentation data will not be quite
as exact as when the whole IP address is used, but the effect should be minimal. Both Bot rulesand VISTA rules are affected because the entire IP address is unavailable to them. In addition,any processing rules that are IP based, including marketing channel rules and report suiteprocessing rules, are affected by this setting.
Turns IP addresses into non-recognizable strings, essentially removing them from Adobe datastores. When IP Obfuscation is enabled, the original IP addresses are permanently lost.
IP Obfuscation
Note: The IP addresses are obfuscated everywhere in Analytics, including Data Warehouse.However, the IP setting in Target is controlled separately, so this setting has no impact onTarget.
If IP obfuscation is enabled, IP exclusion happens before the IP address is obfuscated, so customersdon'’t need to change anything when they enable IP obfuscation.
Checking Disabled leaves the IP address in the data.
Checking Obfuscate IP address changes the IP to a hashed value (e.g., 234abc6493872038).
Checking Remove IP address replaces the IP address with x.x.x.x in the data, after geo-lookup.This setting is enabled by default for all customers with a report suite set in EMEA.
Note: This setting might require changes to custom bot rules or IP exclusions.
EnablesVisitor > GeoSegmentation reports.Geography Reporting
Enables you to useTransaction ID data sources.Transaction ID Storage
Indicates whether the report suite in question shows up as an available report suite in Ad HocAnalysis. Use this setting to limit which report suites show up as an option for Ad Hoc Analysis.For example, you can disable Ad Hoc Analysis for development and QA report suites.
Activate Ad Hoc Analysis
89Admin Tools
8/18/2019 Analytics Reference Adobe
http://slidepdf.com/reader/full/analytics-reference-adobe 90/332
Group Management
A group is a collection of users that you want to give a common set of access and permissions. For example, if you have 50marketing report users, but only 20 need access to ad hoc analysis, you can create a group for those 20 users.
SeeGroups in User Management for configuration information.
Hide Report Suites
Lets you hide report suites in the Adobe Analytics user interface.
If you do not want a report suite to be available to you and your users any more, you can hide it from view. Hiding a report suiteprevents it from being shown in the report suite selector drop-down menu., the Admin Console, or anywhere else that reportsuites are shown. It makes the report suite's data inaccessible via the Adobe Analytics interfaces until the report suite is unhidden.
Note: Data that is sent to a hidden report suite from your site continues to be collected, processes, and billed.
To hide the report suite, go to Analytics > Admin > Company Settings . Check the Hidden checkbox to the left of the reportsuite name.
To unhide the report suite, uncheck the Hidden checkbox.
To view only hidden report suites under Company Settings , selectView > Only Hidden Report Suites .
To view only visible report suites, selectView > Only Visible Report Suites .
The default is View > All.
Internal URL Filters
Internal URL filters identify the referrers that you consider internal to your site.
A referrer, or referring page, is typically the page from which a visitor entered your site. To avoid skewing data, you can filterout internal referrers. Reports exclude filtered referrers from the Referrers Report , the Referring Domains Report , and otherFinding Methods reports.
Add internal URL filters
Steps that describe how to add internal URL filters.
1. ClickAnalytics > Admin > Report Suites in the Suite header.2. ClickEdit Settings > General > Internal URL Filters .3. In the Internal URL Filters dialog box, type the URL to add to the filter list.4. ClickAdd.
The filter list uses string matching to determine whether to filter the site, so you are not required to specify a complete URL.When specifying the URL, consider the following:
• Exclude the protocol identifier (http:// and https:// ) and www. from the URL.• URL filters are not case-sensitive.• There is no limit to the number of filters you can include.• Include all alias domains in the filter list.
90Admin Tools
8/18/2019 Analytics Reference Adobe
http://slidepdf.com/reader/full/analytics-reference-adobe 91/332
• Word filters can exclude any URL that includes that string. For example, specifyingcar as a filter excludes any referrer withcar in its URL.
Key Visitors
(version 14 Only) You can track up to five key visitors per report suite. Key visitors can include high-profile customers, competitors,or potential investors. Analytics tracks key visitors by domain or IP address. Meaning, all visitors originating from a particulardomain or IP address are tracked in the Key Visitors category.
Add a key visitor
Steps that describe how to add a key visitor.
1. In version 14, clickAdmin > Report Suites .2. Select a report suite.3. ClickEdit Settings > Traffic > Key Visitors .4. In the Add Key Visitor field, specify the Key Visitor to track by IP address or domain name.
For example, if you want to track visitors from ABC Corp., you could specify either abccorp.com or the associated ABCCorp. IP address (for example, 100.211.2.15).
5. ClickAdd to save the entry.
Once added, you can clickDelete to delete a key visitor entry. You can also click theReport Suites link to see all reports suitesthat track this particular key visitor.
Logs
Log files to help you see activity for usage, access, report suites, and Admin changes.
Analytics > Admin > Logs
Admin Log
The admin log reports all changes made by administrators in admin tools. The log provides a gateway to user-defined reportsfrom any of the three logs. You can search for events matching your selected criteria over a specified date range.
Usage and Access Log
The Usage and Access Log lets you evaluate report usage at the user account level.
DescriptionElement
Specify a date range filter. You can enter a date manually in the format YYYY-MM-DD or click theCalendar icon to select a date.
Date Range
Filter the log by user name.Login
Filter the log by an IP address.IP
Filter the log by a specific report suite ID.Report Suite
Filter the log by an event type. Select an event type from the drop-down list.Event Type
Filter the log by a word or phrase in the event description.Event
91Admin Tools
8/18/2019 Analytics Reference Adobe
http://slidepdf.com/reader/full/analytics-reference-adobe 92/332
DescriptionElement
Exports the contents of the Usage & Access Log to a tab-delimited file.Download Report
Report Suite Change Log
The Report Suite Change log displays changes made to your report suites outside of admin.
Tools that can modify a report suite from outside the Admin Tools include:• SAINT uploads made in a web browser (SAINT uploads made via FTP are not included in the change log)• Changes made in earlier versions.• Changes made by an account representative or Customer Care using internal tools
DescriptionElement
Specify a date range filter. You can enter a date manually in the format YYYY-MM-DD or click theCalendar icon to select a date.
Date Range
Filter the log by company name.Company
Filter the log by user name.Login
Filter the log by an IP address.IPFilter the log by a word or phrase in the event description.Event
Exports the contents of the Usage & Access Log to a tab-delimited file.Download Report
Manage P3P Policy
The Manage P3P Policy page lets you upload your organization's P3P policy.
Analytics > Admin > Company Settings > P3P Policy
Web browsers use the P3P policy privacy settings when browsing your website. For more information about P3P, visit thePlatform for Privacy Preferences project website.
If you do not upload a privacy policy, Analytics uses a default policy. Your P3P policy is available from only under the followingconditions:
• The visitorNamespace variable is declared in your web beacon(s_code.js ).• Data is collected using a standard domain (2o7.net or omtrdc.net ).
If your web site's data collection does not meet these requirements, marketing reports provide a default P3P policy.
Adobe maintains a list of the collection domains for your company, so that P3P is served for the appropriate domains. To updatethis list, have your organization's supported user contact Customer Care.
DescriptionElement
The path to your organization's P3P policy file. Typically, a website's full P3P policy iscontained in an XML file (/w3c/p3p.xml ).
Upload Full Policy
The compact policy definition. Your website includes the compact policy as part of theHTTP header so Web browsers can process the policy before displaying the web page.
Enter Compact Policy
92Admin Tools
8/18/2019 Analytics Reference Adobe
http://slidepdf.com/reader/full/analytics-reference-adobe 93/332
Marketing Channels
Marketing Channels are commonly used to provide insight on how visitors arrive on your site. You can create and customizeMarketing Channel Processing Rules based on what channels you want to track, and how you want to track them.
Analytics > Admin > Report Suites > Edit Settings > Marketing Channels .
See Marketing Channels .
Menu Customizing
Menu Customization lets you modify the report menus that a user sees in marketing reports. You can show or hide specificreports, as well as move them in different folders across all users. This feature is especially useful if your organization only usescertain reports and does not wish to clutter your left hand menu with unused or irrelevant data.
The menu changes apply to all users who access the report suite. However, users can restore a menu's default configurationwhile using the report suite.
Menu Customization DescriptionsDescriptionCalendar
Adds a new folder above the currently selected item. Note that you must add atleast one report to a folder before the folder is visible.
New Folder
Lets you change the name of the currently selected item.Rename
Restores the default name of the currently selected item.Default Name
Hides (displays) the currently selected item. Hidden items appear with a gray linepattern in the Menu Customization page.
Toggle Visibility
Removes the currently selected item from the menu.Delete
Restores the menu to its original state.Restore Defaults
Customize the marketing reports menu
Steps that describe how to customize a marketing reports menu.
1. ClickAnalytics >Admin > Report Suites to open the Report Suite Manager .2. Select a report suite.3. ClickEdit Settings > General > Customize Menus .4. Locate a desired menu item.
You can reorder the menu by dragging items to a new location in the menu.
See Menu Customizing for descriptions of UI elements.
5. Use the toolbar to modify the menu as desired.
93Admin Tools
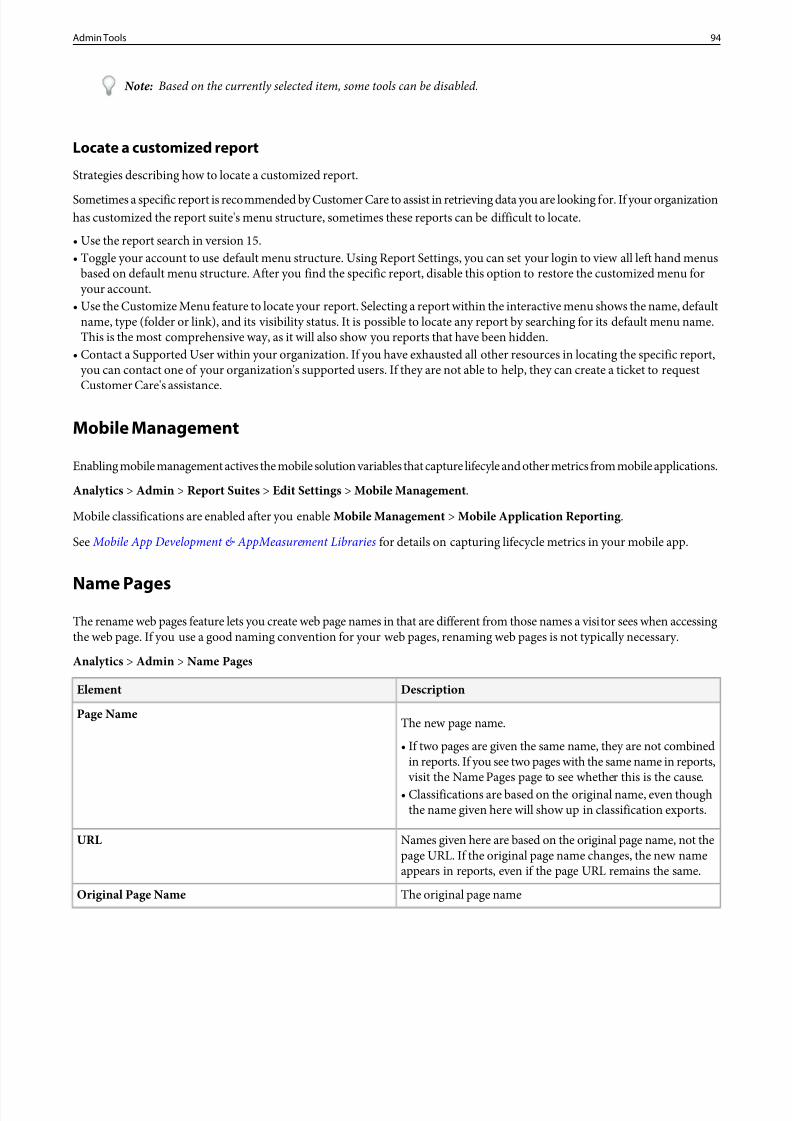
8/18/2019 Analytics Reference Adobe
http://slidepdf.com/reader/full/analytics-reference-adobe 94/332
Note: Based on the currently selected item, some tools can be disabled.
Locate a customized report
Strategies describing how to locate a customized report.
Sometimes a specific report is recommended by Customer Care to assist in retrieving data you are looking for. If your organizationhas customized the report suite's menu structure, sometimes these reports can be difficult to locate.
• Use the report search in version 15.• Toggle your account to use default menu structure. Using Report Settings, you can set your login to view all left hand menus
based on default menu structure. After you find the specific report, disable this option to restore the customized menu foryour account.
• Use the Customize Menu feature to locate your report. Selecting a report within the interactive menu shows the name, defaultname, type (folder or link), and its visibility status. It is possible to locate any report by searching for its default menu name.This is the most comprehensive way, as it will also show you reports that have been hidden.
• Contact a Supported User within your organization. If you have exhausted all other resources in locating the specific report,you can contact one of your organization's supported users. If they are not able to help, they can create a ticket to requestCustomer Care's assistance.
Mobile Management
Enabling mobile management actives the mobile solution variables that capture lifecyle and other metrics from mobile applications.
Analytics > Admin > Report Suites > Edit Settings > Mobile Management .
Mobile classifications are enabled after you enable Mobile Management > Mobile Application Reporting .
See Mobile App Development & AppMeasurement Libraries for details on capturing lifecycle metrics in your mobile app.
Name PagesThe rename web pages feature lets you create web page names in that are different from those names a visitor sees when accessingthe web page. If you use a good naming convention for your web pages, renaming web pages is not typically necessary.
Analytics > Admin > Name Pages
DescriptionElement
The new page name.Page Name
• If two pages are given the same name, they are not combinedin reports. If you see two pages with the same name in reports, visit the Name Pages page to see whether this is the cause.
• Classifications are based on the original name, even thoughthe name given here will show up in classification exports.
Names given here are based on the original page name, not thepage URL. If the original page name changes, the new nameappears in reports, even if the page URL remains the same.
URL
The original page nameOriginal Page Name
94Admin Tools
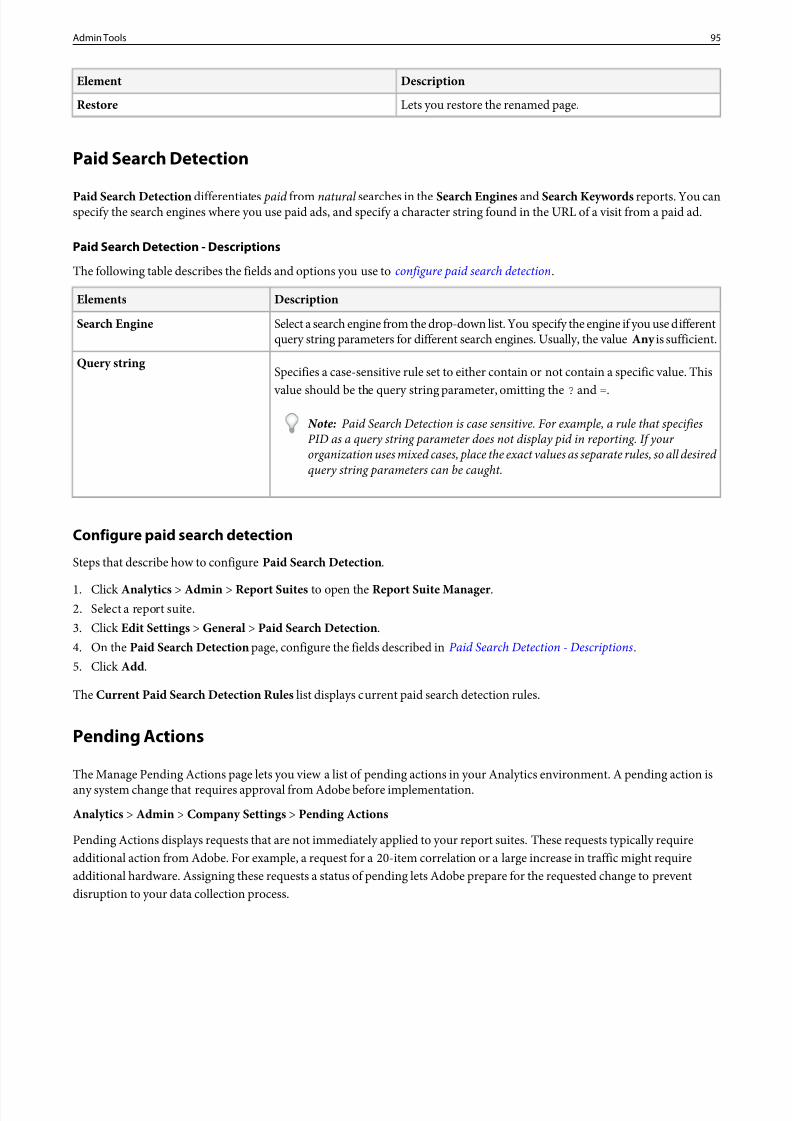
8/18/2019 Analytics Reference Adobe
http://slidepdf.com/reader/full/analytics-reference-adobe 95/332
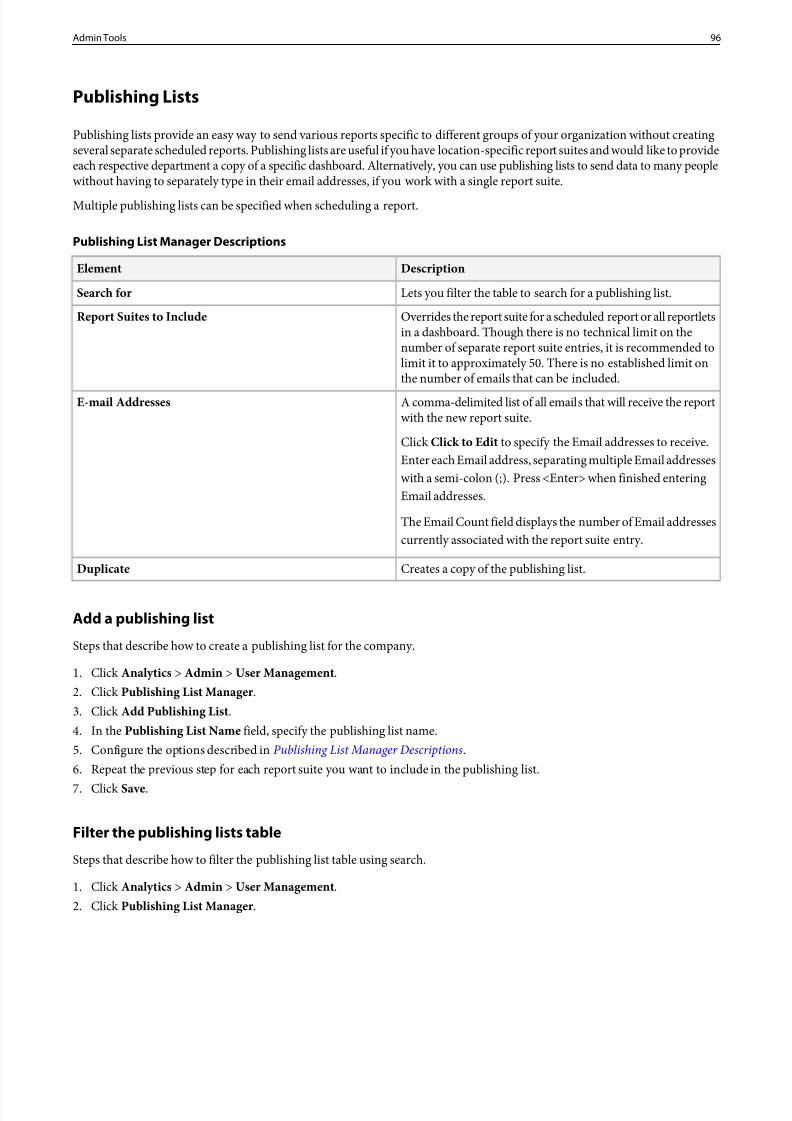
8/18/2019 Analytics Reference Adobe
http://slidepdf.com/reader/full/analytics-reference-adobe 96/332
Publishing Lists
Publishing lists provide an easy way to send various reports specific to different groups of your organization without creatingseveral separate scheduled reports. Publishing lists are useful if you have location-specific report suites and would like to provideeach respective department a copy of a specific dashboard. Alternatively, you can use publishing lists to send data to many peoplewithout having to separately type in their email addresses, if you work with a single report suite.
Multiple publishing lists can be specified when scheduling a report.
Publishing List Manager Descriptions
DescriptionElement
Lets you filter the table to search for a publishing list.Search for
Overrides the report suite for a scheduled report or all reportletsin a dashboard. Though there is no technical limit on the
Report Suites to Include
number of separate report suite entries, it is recommended tolimit it to approximately 50. There is no established limit onthe number of emails that can be included.
A comma-delimited list of all emails that will receive the reportwith the new report suite.
ClickClick to Edit to specify the Email addresses to receive.Enter each Email address, separating multiple Email addresses
E-mail Addresses
with a semi-colon (;). Press <Enter> when finished enteringEmail addresses.
The Email Count field displays the number of Email addressescurrently associated with the report suite entry.
Creates a copy of the publishing list.Duplicate
Add a publishing list
Steps that describe how to create a publishing list for the company.
1. ClickAnalytics > Admin > User Management .2. ClickPublishing List Manager .3. ClickAdd Publishing List .4. In the Publishing List Name field, specify the publishing list name.5. Configure the options described in Publishing List Manager Descriptions.6. Repeat the previous step for each report suite you want to include in the publishing list.
7. ClickSave.
Filter the publishing lists table
Steps that describe how to filter the publishing list table using search.
1. ClickAnalytics > Admin > User Management .2. ClickPublishing List Manager .
96Admin Tools
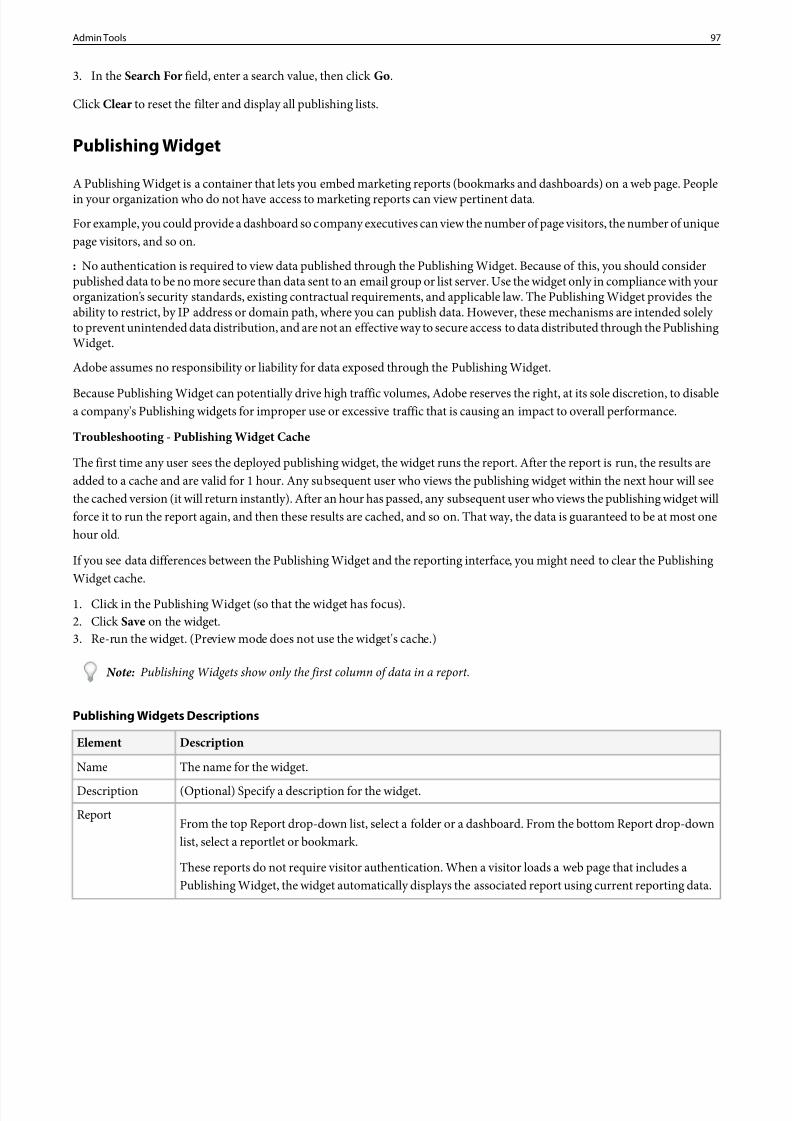
8/18/2019 Analytics Reference Adobe
http://slidepdf.com/reader/full/analytics-reference-adobe 97/332
3. In the Search For field, enter a search value, then clickGo.
Click Clear to reset the filter and display all publishing lists.
Publishing Widget
A Publishing Widget is a container that lets you embed marketing reports (bookmarks and dashboards) on a web page. Peoplein your organization who do not have access to marketing reports can view pertinent data.
For example, you could provide a dashboard so company executives can view the number of page visitors, the number of uniquepage visitors, and so on.
: No authentication is required to view data published through the Publishing Widget. Because of this, you should considerpublished data to be no more secure than data sent to an email group or list server. Use the widget only in compliance with yourorganization's security standards, existing contractual requirements, and applicable law. The Publishing Widget provides theability to restrict, by IP address or domain path, where you can publish data. However, these mechanisms are intended solely to prevent unintended data distribution, and are not an effective way to secure access to data distributed through the PublishingWidget.
Adobe assumes no responsibility or liability for data exposed through the Publishing Widget.
Because Publishing Widget can potentially drive high traffic volumes, Adobe reserves the right, at its sole discretion, to disablea company's Publishing widgets for improper use or excessive traffic that is causing an impact to overall performance.
Troubleshooting - Publishing Widget Cache
The first time any user sees the deployed publishing widget, the widget runs the report. After the report is run, the results areadded to a cache and are valid for 1 hour. Any subsequent user who views the publishing widget within the next hour will seethe cached version (it will return instantly). After an hour has passed, any subsequent user who views the publishing widget willforce it to run the report again, and then these results are cached, and so on. That way, the data is guaranteed to be at most onehour old.
If you see data differences between the Publishing Widget and the reporting interface, you might need to clear the PublishingWidget cache.
1. Click in the Publishing Widget (so that the widget has focus).2. ClickSave on the widget.3. Re-run the widget. (Preview mode does not use the widget's cache.)
Note: Publishing Widgets show only the first column of data in a report.
Publishing Widgets Descriptions
DescriptionElement
The name for the widget.Name
(Optional) Specify a description for the widget.Description
From the top Report drop-down list, select a folder or a dashboard. From the bottom Report drop-downlist, select a reportlet or bookmark.
Report
These reports do not require visitor authentication. When a visitor loads a web page that includes aPublishing Widget, the widget automatically displays the associated report using current reporting data.
97Admin Tools
8/18/2019 Analytics Reference Adobe
http://slidepdf.com/reader/full/analytics-reference-adobe 98/332
DescriptionElement
Changes to a Publishing Widget, such as changing the associated report, automatically updates the reportoutput for all web pages that use that widget, without you having to redeploy the web pages.
Specify the destination for the widget.Destination
Destinations must be in a valid URL format, including thehttp:// or https:// prefix. Publishingwidget Destinations are inclusive, meaning that the Publishing widget functions on all URLs that includethe specified Destination. For example, a Destination ofhttp://www.corp1.com/sales/ allowsPublishing widgets on all Web pages at or below the sales page on thewww.corp1.com Web site.
Add a publishing Widget
Steps that describe how to add aPublishing Widget
1. ClickAnalytics > Admin > Publishing Widgets .2. Review the warning text in theOverview section and click the help icons to review more information.
3. ClickAdd New .4. Complete the fields and options described inPublishing Widgets Descriptions5. ClickPreview to display the widget in a new browser tab.6. ClickSave.
Publishing Widget Code on a Web Page
Install a Publishing widget on a Web page by pasting the widget code into the Web page code where you want to display thereport.
If you would like additional control over the appearance of the Publishing widget, define a CSS class that can be applied to aniframe and append it to the script tag using css_class=<your_class_name> .
1. ClickAnalytics > Admin > Publishing Widgets .2. ClickGet Code .3. From the Size drop-down list, select the desired widget size:
• Small (Default)
• Medium
• Large
Note: The CSS styles for the different sizes are for your convenience. You can modify the CSS styles in the list box asdesired.
4. Copy and the code snippet and paste it into the page code where you want to display the report.
Preferences Manager
The Preferences Manager page lets you configure how to render Excel and comma-separated value (CSV) report output.
98Admin Tools
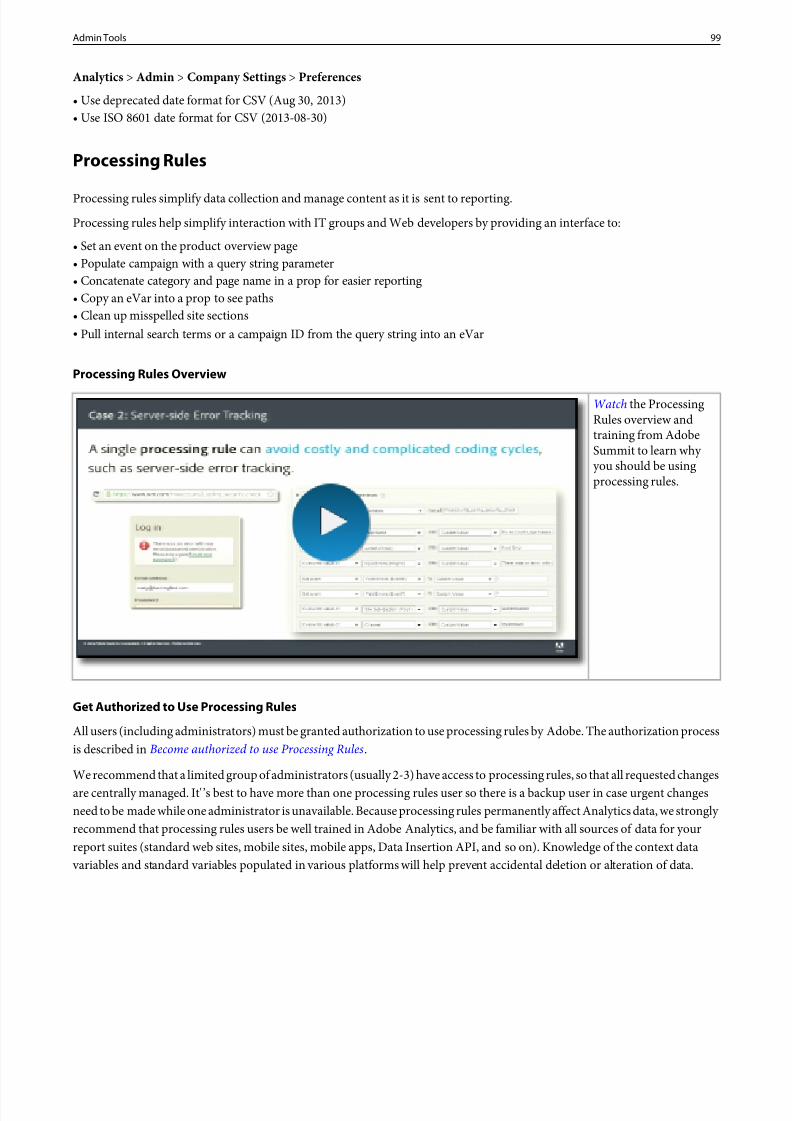
8/18/2019 Analytics Reference Adobe
http://slidepdf.com/reader/full/analytics-reference-adobe 99/332
Analytics > Admin > Company Settings > Preferences
• Use deprecated date format for CSV (Aug 30, 2013)• Use ISO 8601 date format for CSV (2013-08-30)
Processing Rules
Processing rules simplify data collection and manage content as it is sent to reporting.Processing rules help simplify interaction with IT groups and Web developers by providing an interface to:
• Set an event on the product overview page• Populate campaign with a query string parameter• Concatenate category and page name in a prop for easier reporting• Copy an eVar into a prop to see paths• Clean up misspelled site sections• Pull internal search terms or a campaign ID from the query string into an eVar
Processing Rules Overview
Watch the ProcessingRules overview andtraining from AdobeSummit to learn why you should be usingprocessing rules.
Get Authorized to Use Processing Rules
All users (including administrators) must be granted authorization to use processing rules by Adobe. The authorization processis described in Become authorized to use Processing Rules.
We recommend that a limited group of administrators (usually 2-3) have access to processing rules, so that all requested changesare centrally managed. It'’s best to have more than one processing rules user so there is a backup user in case urgent changesneed to be made while one administrator is unavailable. Because processing rules permanently affect Analytics data, we strongly recommend that processing rules users be well trained in Adobe Analytics, and be familiar with all sources of data for yourreport suites (standard web sites, mobile sites, mobile apps, Data Insertion API, and so on). Knowledge of the context data variables and standard variables populated in various platforms will help prevent accidental deletion or alteration of data.
99Admin Tools
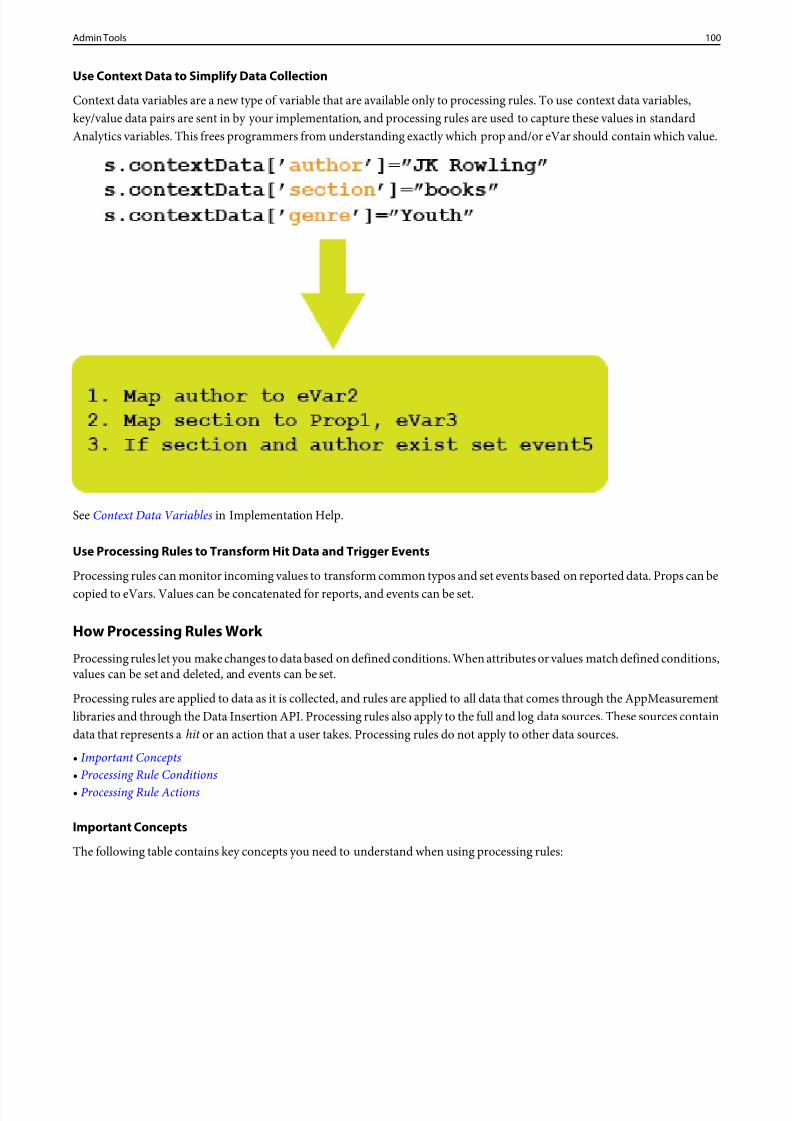
8/18/2019 Analytics Reference Adobe
http://slidepdf.com/reader/full/analytics-reference-adobe 100/332
Use Context Data to Simplify Data Collection
Context data variables are a new type of variable that are available only to processing rules. To use context data variables,key/value data pairs are sent in by your implementation, and processing rules are used to capture these values in standardAnalytics variables. This frees programmers from understanding exactly which prop and/or eVar should contain which value.
SeeContext Data Variables in Implementation Help.
Use Processing Rules to Transform Hit Data and Trigger Events
Processing rules can monitor incoming values to transform common typos and set events based on reported data. Props can becopied to eVars. Values can be concatenated for reports, and events can be set.
How Processing Rules Work
Processing rules let you make changes to data based on defined conditions. When attributes or values match defined conditions, values can be set and deleted, and events can be set.
Processing rules are applied to data as it is collected, and rules are applied to all data that comes through the AppMeasurementlibraries and through the Data Insertion API. Processing rules also apply to the full and log data sources. These sources containdata that represents a hit or an action that a user takes. Processing rules do not apply to other data sources.
• Important Concepts• Processing Rule Conditions• Processing Rule Actions
Important Concepts
The following table contains key concepts you need to understand when using processing rules:
100Admin Tools
8/18/2019 Analytics Reference Adobe
http://slidepdf.com/reader/full/analytics-reference-adobe 101/332
DetailsConcept
Copy processing rules to another report suiteRules apply to a single report suite.
If an action changes a value, subsequent conditions use the new value.
Processing rules are applied in the order listed.
Changes from processing rules should be visible in your reportsuite within minutes of saving. When testing processing rules,
Processing rules are applied immediately to the report suiteafter they are saved.
we recommend configuring Real-Time Reports in your testreport suite so you can quickly see the results of a processingrule.
Copy a Context Data Variable to an eVar Processing rules are the only way to access to context data variables.
Processing Order Processing rules are applied before VISTA rules and MarketingChannel rules.
You can use VISTA rules to exclude hits.Hits cannot be excluded.
Referrer and user agent are read-only. The product string isnot available.
The product string, referrer, and user agent cannot be changed.
The mobile device lookup occurs before processing rules, butattributes are not available in processing rules.
Mobile device attributes and classifications are not available.
Upgrade to H.25.3 or later, or read query string parametersfrom long URLs client-side and store values in Context Data variables.
Query string parameters cannot be read beyond the first 255characters of a URL if you are running JavaScriptAppMeasurement H.25.2 or earlier. JavaScriptAppMeasurement H.25.3 (released January 2013) and laterprovide the full URL including all query string parameters toprocessing rules.
This might affect multibyte characters that are passed usingquery strings.
Query string values must be encoded in Unicode or UTF-8 tobe read by processing rules.
Processing rule limits are per report suite, not per company.You are limited to 100 rules (expanded from 50 rules inFebruary 2014) with 30 conditions each for each report suite.
Processing rules are applied as server calls are sent. Valuesstored in context data variables are discarded if they are notcopied using processing rules.
Processing rules must be set up to retrieve context data variablesbefore data is sent.
Cleaning up Values in a Report .Value comparisons in the UI are case insensitive.
101Admin Tools
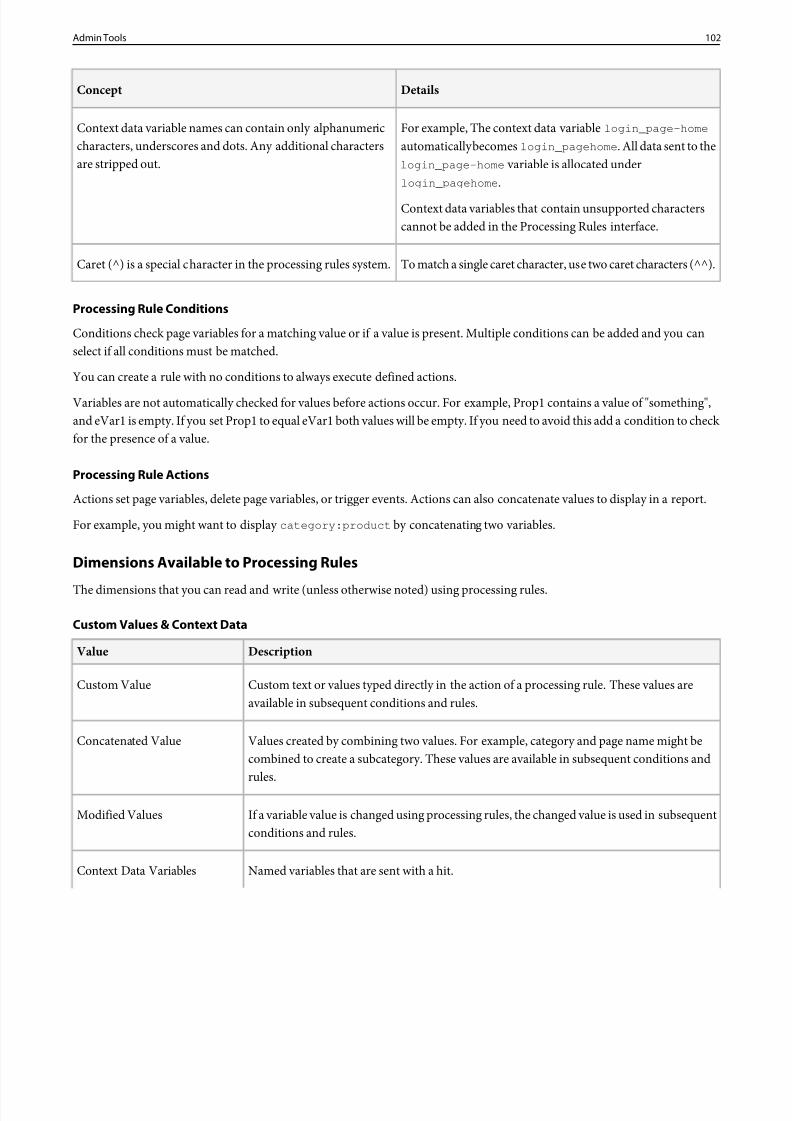
8/18/2019 Analytics Reference Adobe
http://slidepdf.com/reader/full/analytics-reference-adobe 102/332
DetailsConcept
For example, The context data variablelogin_page-home
automatically becomes login_pagehome . All data sent to theContext data variable names can contain only alphanumericcharacters, underscores and dots. Any additional charactersare stripped out. login_page-home variable is allocated under
login_pagehome .
Context data variables that contain unsupported characterscannot be added in the Processing Rules interface.
To match a single caret character, use two caret characters (^^).Caret (^) is a special character in the processing rules system.
Processing Rule Conditions
Conditions check page variables for a matching value or if a value is present. Multiple conditions can be added and you canselect if all conditions must be matched.
You can create a rule with no conditions to always execute defined actions.
Variables are not automatically checked for values before actions occur. For example, Prop1 contains a value of "something",and eVar1 is empty. If you set Prop1 to equal eVar1 both values will be empty. If you need to avoid this add a condition to check for the presence of a value.
Processing Rule Actions
Actions set page variables, delete page variables, or trigger events. Actions can also concatenate values to display in a report.
For example, you might want to displaycategory:product by concatenating two variables.
Dimensions Available to Processing Rules
The dimensions that you can read and write (unless otherwise noted) using processing rules.
Custom Values & Context Data
DescriptionValue
Custom text or values typed directly in the action of a processing rule. These values areavailable in subsequent conditions and rules.
Custom Value
Values created by combining two values. For example, category and page name might becombined to create a subcategory. These values are available in subsequent conditions andrules.
Concatenated Value
If a variable value is changed using processing rules, the changed value is used in subsequentconditions and rules.
Modified Values
Named variables that are sent with a hit.Context Data Variables
102Admin Tools
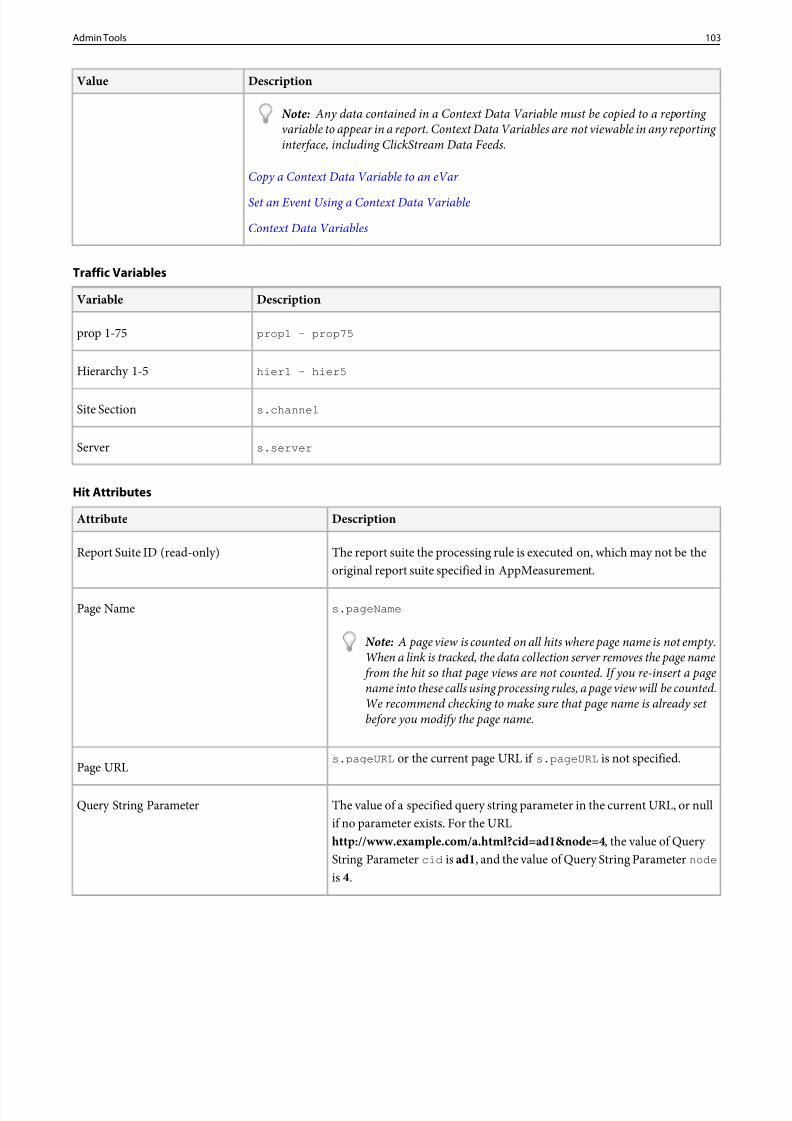
8/18/2019 Analytics Reference Adobe
http://slidepdf.com/reader/full/analytics-reference-adobe 103/332
DescriptionValue
Note: Any data contained in a Context Data Variable must be copied to a reporting variable to appear in a report. Context Data Variables are not viewable in any reporting interface, including ClickStream Data Feeds.
Copy a Context Data Variable to an eVar
Set an Event Using a Context Data Variable
Context Data Variables
Traffic Variables
DescriptionVariable
prop1 - prop75prop 1-75
hier1 - hier5Hierarchy 1-5
s.channelSite Section
s.serverServer
Hit Attributes
DescriptionAttribute
The report suite the processing rule is executed on, which may not be theoriginal report suite specified in AppMeasurement.
Report Suite ID (read-only)
s.pageNamePage Name
Note: A page view is counted on all hits where page name is not empty.When a link is tracked, the data collection server removes the page name from the hit so that page views are not counted. If you re-insert a pagename into these calls using processing rules, a page view will be counted.We recommend checking to make sure that page name is already set before you modify the page name.
s.pageURL or the current page URL if s.pageURL is not specified.Page URL
The value of a specified query string parameter in the current URL, or nullif no parameter exists. For the URL
Query String Parameter
http://www.example.com/a.html?cid=ad1&node=4 , the value of Query String Parameter cid isad1, and the value of Query String Parameternode
is 4.
103Admin Tools
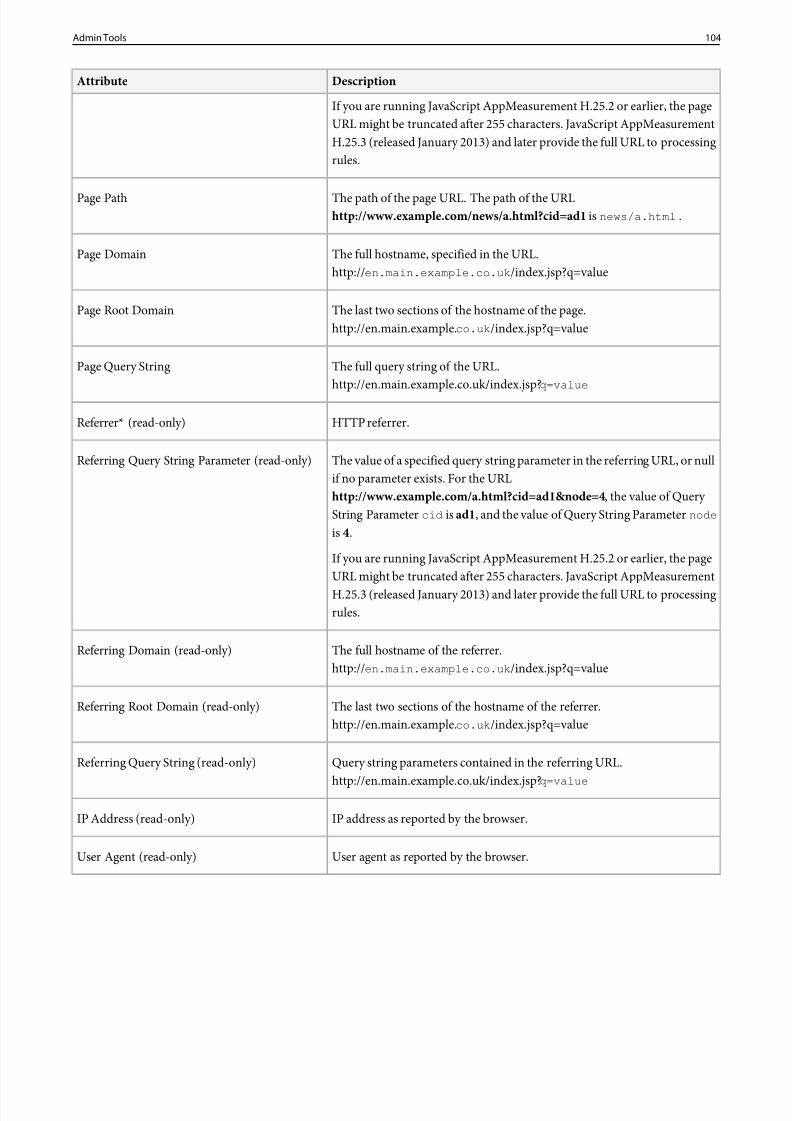
8/18/2019 Analytics Reference Adobe
http://slidepdf.com/reader/full/analytics-reference-adobe 104/332
DescriptionAttribute
If you are running JavaScript AppMeasurement H.25.2 or earlier, the pageURL might be truncated after 255 characters. JavaScript AppMeasurementH.25.3 (released January 2013) and later provide the full URL to processingrules.
The path of the page URL. The path of the URLhttp://www.example.com/news/a.html?cid=ad1 is news/a.html .
Page Path
The full hostname, specified in the URL.http:// en.main.example.co.uk /index.jsp?q=value
Page Domain
The last two sections of the hostname of the page.http://en.main.example.co.uk /index.jsp?q=value
Page Root Domain
The full query string of the URL.http://en.main.example.co.uk/index.jsp?q=value
Page Query String
HTTP referrer.Referrer* (read-only)
The value of a specified query string parameter in the referring URL, or nullif no parameter exists. For the URL
Referring Query String Parameter (read-only)
http://www.example.com/a.html?cid=ad1&node=4 , the value of Query String Parameter cid isad1, and the value of Query String Parameternode
is 4.
If you are running JavaScript AppMeasurement H.25.2 or earlier, the pageURL might be truncated after 255 characters. JavaScript AppMeasurementH.25.3 (released January 2013) and later provide the full URL to processingrules.
The full hostname of the referrer.http:// en.main.example.co.uk /index.jsp?q=value
Referring Domain (read-only)
The last two sections of the hostname of the referrer.http://en.main.example.co.uk /index.jsp?q=value
Referring Root Domain (read-only)
Query string parameters contained in the referring URL.
http://en.main.example.co.uk/index.jsp?q=value
Referring Query String (read-only)
IP address as reported by the browser.IP Address (read-only)
User agent as reported by the browser.User Agent (read-only)
104Admin Tools
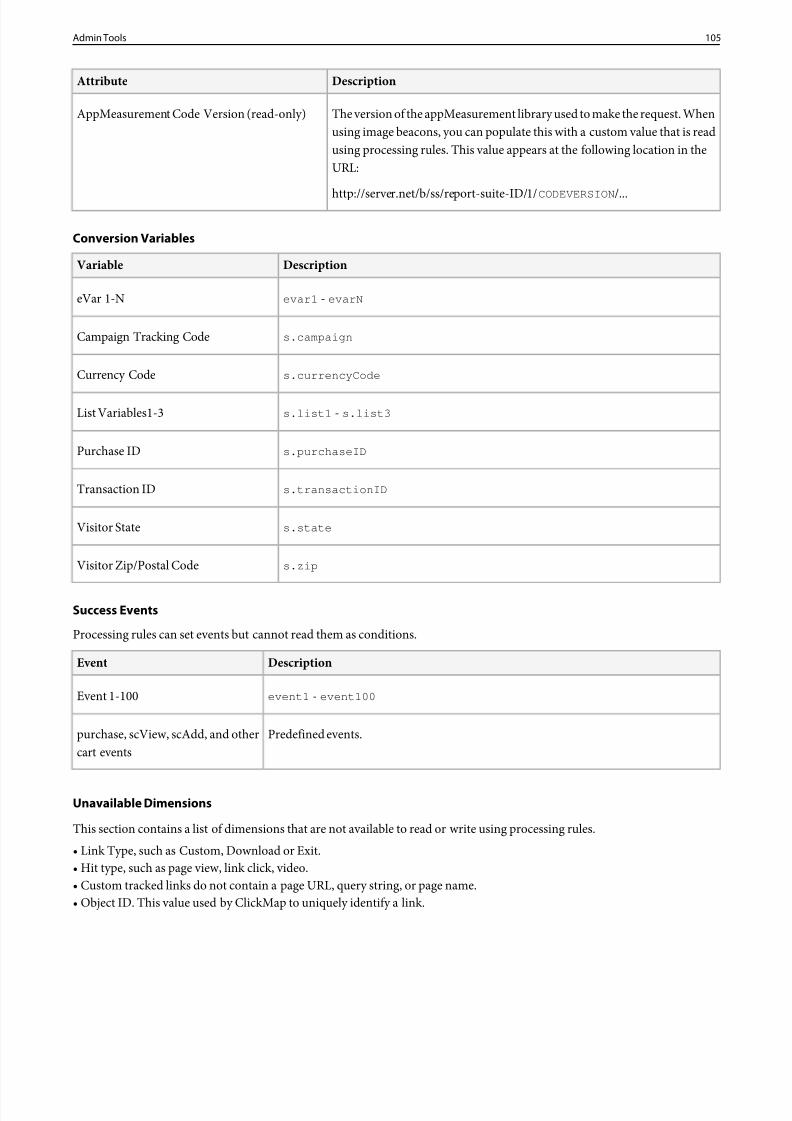
8/18/2019 Analytics Reference Adobe
http://slidepdf.com/reader/full/analytics-reference-adobe 105/332
DescriptionAttribute
The version of the appMeasurement library used to make the request. Whenusing image beacons, you can populate this with a custom value that is read
AppMeasurement Code Version (read-only)
using processing rules. This value appears at the following location in theURL:
http://server.net/b/ss/report-suite-ID/1/ CODEVERSION /...
Conversion Variables
DescriptionVariable
evar1 - evarNeVar 1-N
s.campaignCampaign Tracking Code
s.currencyCodeCurrency Code
s.list1 - s.list3List Variables1-3
s.purchaseIDPurchase ID
s.transactionIDTransaction ID
s.stateVisitor State
s.zipVisitor Zip/Postal Code
Success Events
Processing rules can set events but cannot read them as conditions.
DescriptionEvent
event1 - event100Event 1-100
Predefined events.purchase, scView, scAdd, and othercart events
Unavailable Dimensions
This section contains a list of dimensions that are not available to read or write using processing rules.• Link Type, such as Custom, Download or Exit.• Hit type, such as page view, link click, video.• Custom tracked links do not contain a page URL, query string, or page name.• Object ID. This value used by ClickMap to uniquely identify a link.
105Admin Tools
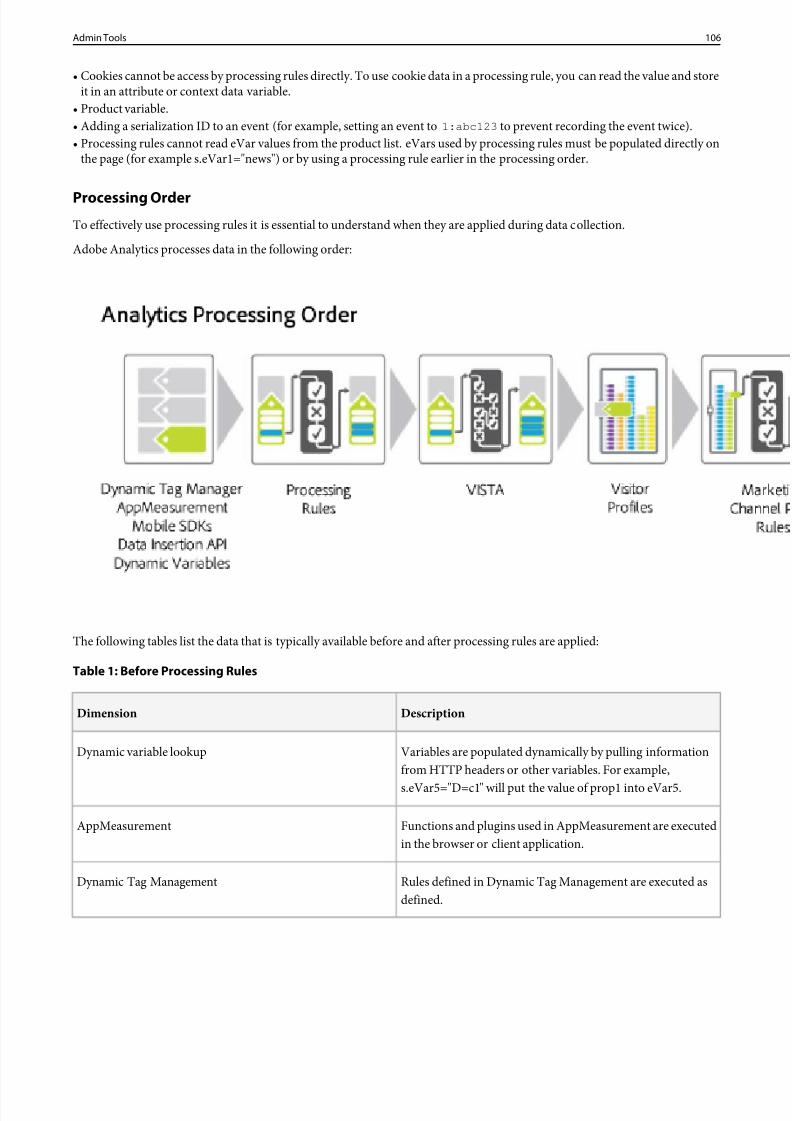
8/18/2019 Analytics Reference Adobe
http://slidepdf.com/reader/full/analytics-reference-adobe 106/332
• Cookies cannot be access by processing rules directly. To use cookie data in a processing rule, you can read the value and storeit in an attribute or context data variable.
• Product variable.• Adding a serialization ID to an event (for example, setting an event to1:abc123 to prevent recording the event twice).• Processing rules cannot read eVar values from the product list. eVars used by processing rules must be populated directly on
the page (for example s.eVar1="news") or by using a processing rule earlier in the processing order.
Processing OrderTo effectively use processing rules it is essential to understand when they are applied during data collection.
Adobe Analytics processes data in the following order:
The following tables list the data that is typically available before and after processing rules are applied:
Table 1: Before Processing Rules
DescriptionDimension
Variables are populated dynamically by pulling informationfrom HTTP headers or other variables. For example,
s.eVar5="D=c1" will put the value of prop1 into eVar5.
Dynamic variable lookup
Functions and plugins used in AppMeasurement are executedin the browser or client application.
AppMeasurement
Rules defined in Dynamic Tag Management are executed asdefined.
Dynamic Tag Management
106Admin Tools
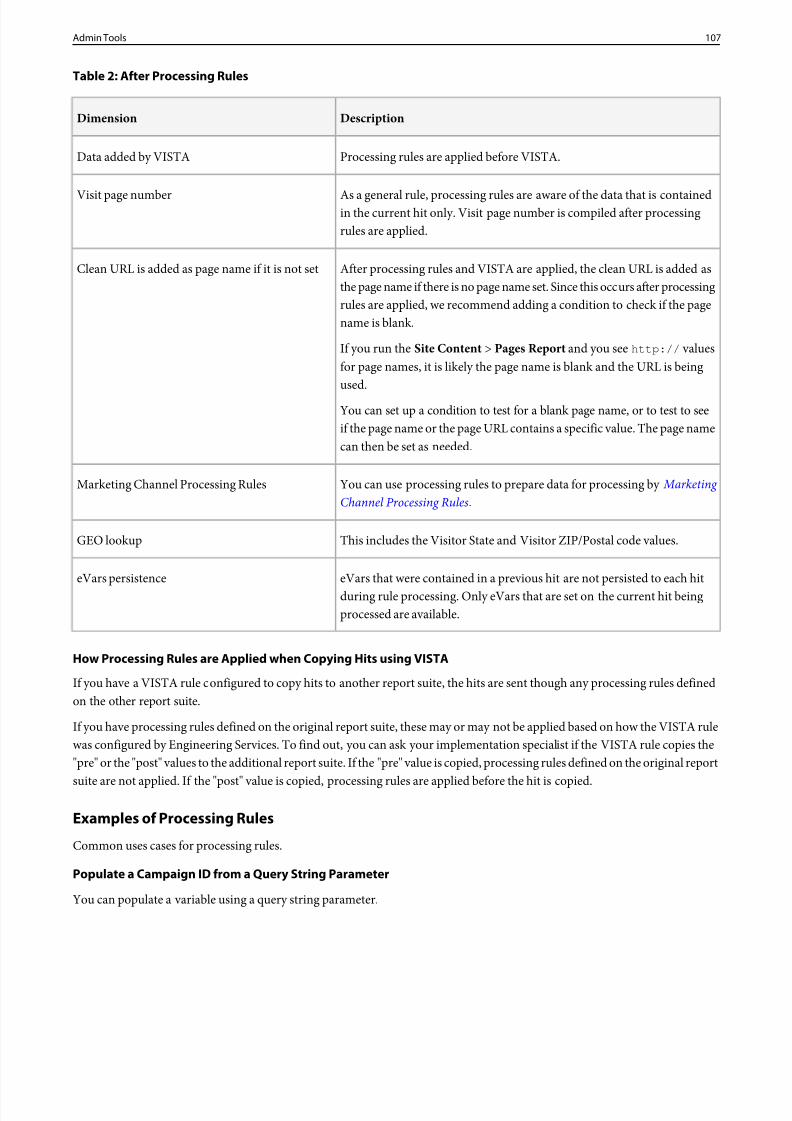
8/18/2019 Analytics Reference Adobe
http://slidepdf.com/reader/full/analytics-reference-adobe 107/332
Table 2: After Processing Rules
DescriptionDimension
Processing rules are applied before VISTA.Data added by VISTA
As a general rule, processing rules are aware of the data that is containedin the current hit only. Visit page number is compiled after processingrules are applied.
Visit page number
After processing rules and VISTA are applied, the clean URL is added asthe page name if there is no page name set. Since this occurs after processing
Clean URL is added as page name if it is not set
rules are applied, we recommend adding a condition to check if the pagename is blank.
If you run the Site Content > Pages Report and you see http:// valuesfor page names, it is likely the page name is blank and the URL is beingused.
You can set up a condition to test for a blank page name, or to test to seeif the page name or the page URL contains a specific value. The page namecan then be set as needed.
You can use processing rules to prepare data for processing by Marketing Channel Processing Rules.
Marketing Channel Processing Rules
This includes the Visitor State and Visitor ZIP/Postal code values.GEO lookup
eVars that were contained in a previous hit are not persisted to each hitduring rule processing. Only eVars that are set on the current hit beingprocessed are available.
eVars persistence
How Processing Rules are Applied when Copying Hits using VISTA
If you have a VISTA rule configured to copy hits to another report suite, the hits are sent though any processing rules definedon the other report suite.
If you have processing rules defined on the original report suite, these may or may not be applied based on how the VISTA rulewas configured by Engineering Services. To find out, you can ask your implementation specialist if the VISTA rule copies the"pre" or the "post" values to the additional report suite. If the "pre" value is copied, processing rules defined on the original report
suite are not applied. If the "post" value is copied, processing rules are applied before the hit is copied.
Examples of Processing Rules
Common uses cases for processing rules.
Populate a Campaign ID from a Query String Parameter
You can populate a variable using a query string parameter.
107Admin Tools
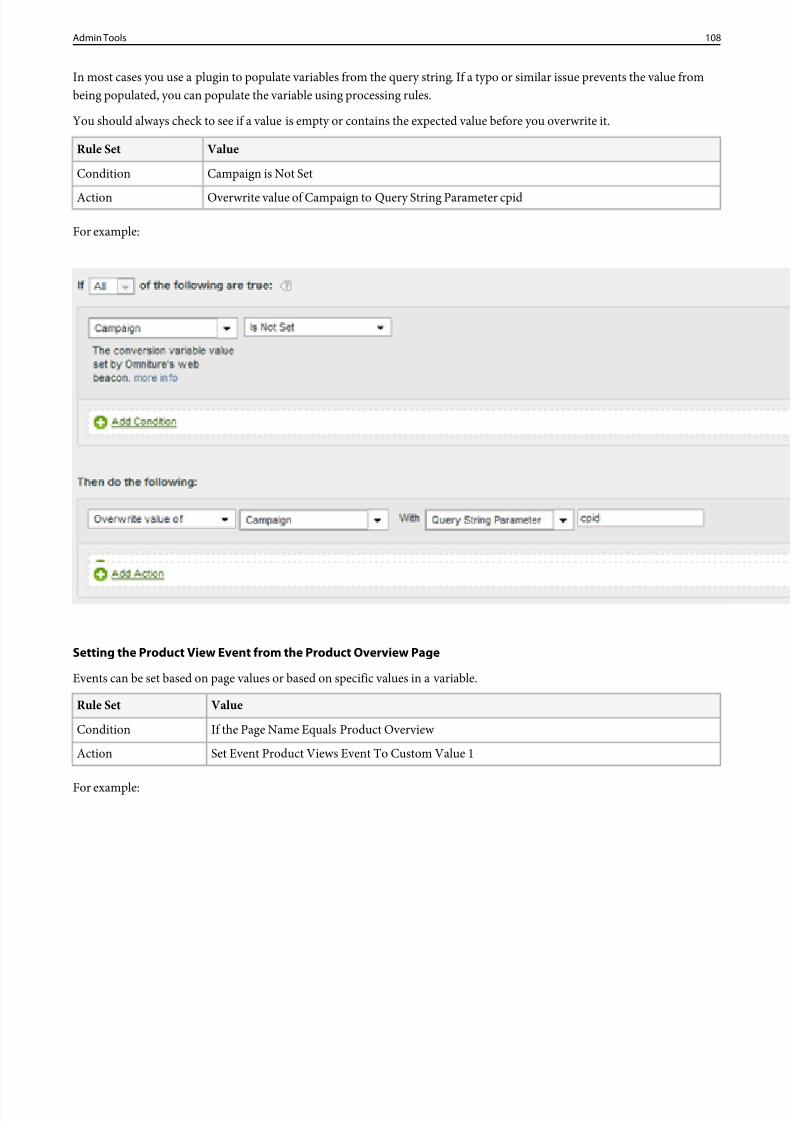
8/18/2019 Analytics Reference Adobe
http://slidepdf.com/reader/full/analytics-reference-adobe 108/332
In most cases you use a plugin to populate variables from the query string. If a typo or similar issue prevents the value frombeing populated, you can populate the variable using processing rules.
You should always check to see if a value is empty or contains the expected value before you overwrite it.
ValueRule Set
Campaign is Not SetCondition
Overwrite value of Campaign to Query String Parameter cpidAction
For example:
Setting the Product View Event from the Product Overview Page
Events can be set based on page values or based on specific values in a variable.
ValueRule Set
If the Page Name Equals Product Overview Condition
Set Event Product Views Event To Custom Value 1Action
For example:
108Admin Tools
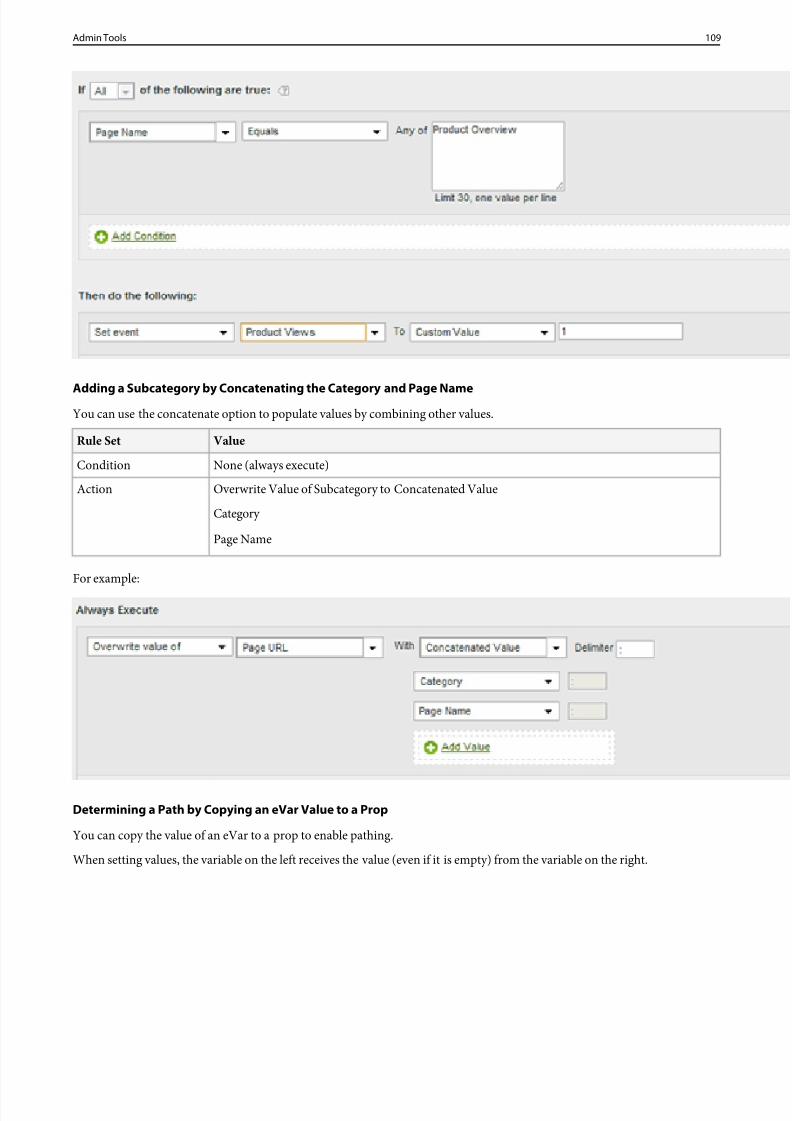
8/18/2019 Analytics Reference Adobe
http://slidepdf.com/reader/full/analytics-reference-adobe 109/332
Adding a Subcategory by Concatenating the Category and Page NameYou can use the concatenate option to populate values by combining other values.
ValueRule Set
None (always execute)Condition
Overwrite Value of Subcategory to Concatenated Value
Category
Action
Page Name
For example:
Determining a Path by Copying an eVar Value to a Prop
You can copy the value of an eVar to a prop to enable pathing.
When setting values, the variable on the left receives the value (even if it is empty) from the variable on the right.
109Admin Tools
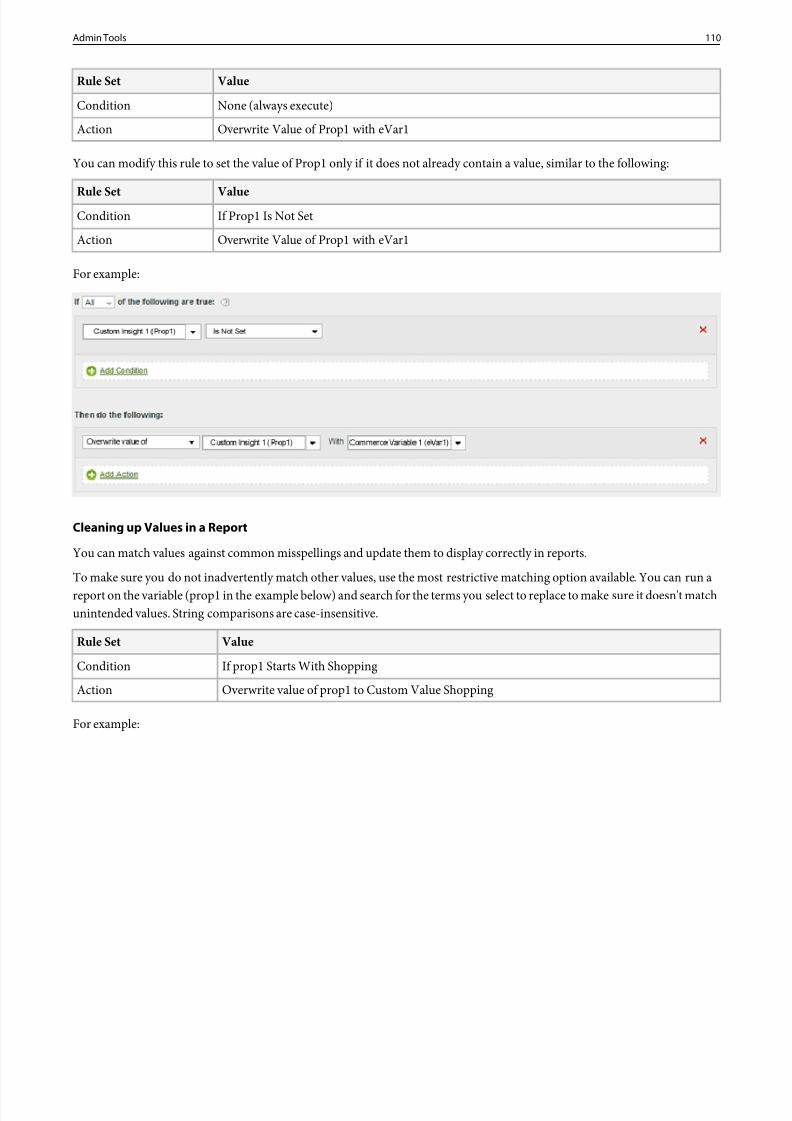
8/18/2019 Analytics Reference Adobe
http://slidepdf.com/reader/full/analytics-reference-adobe 110/332
ValueRule Set
None (always execute)Condition
Overwrite Value of Prop1 with eVar1Action
You can modify this rule to set the value of Prop1 only if it does not already contain a value, similar to the following:
ValueRule SetIf Prop1 Is Not SetCondition
Overwrite Value of Prop1 with eVar1Action
For example:
Cleaning up Values in a Report
You can match values against common misspellings and update them to display correctly in reports.
To make sure you do not inadvertently match other values, use the most restrictive matching option available. You can run areport on the variable (prop1 in the example below) and search for the terms you select to replace to make sure it doesn't matchunintended values. String comparisons are case-insensitive.
ValueRule Set
If prop1 Starts With ShoppingCondition
Overwrite value of prop1 to Custom Value ShoppingAction
For example:
110Admin Tools
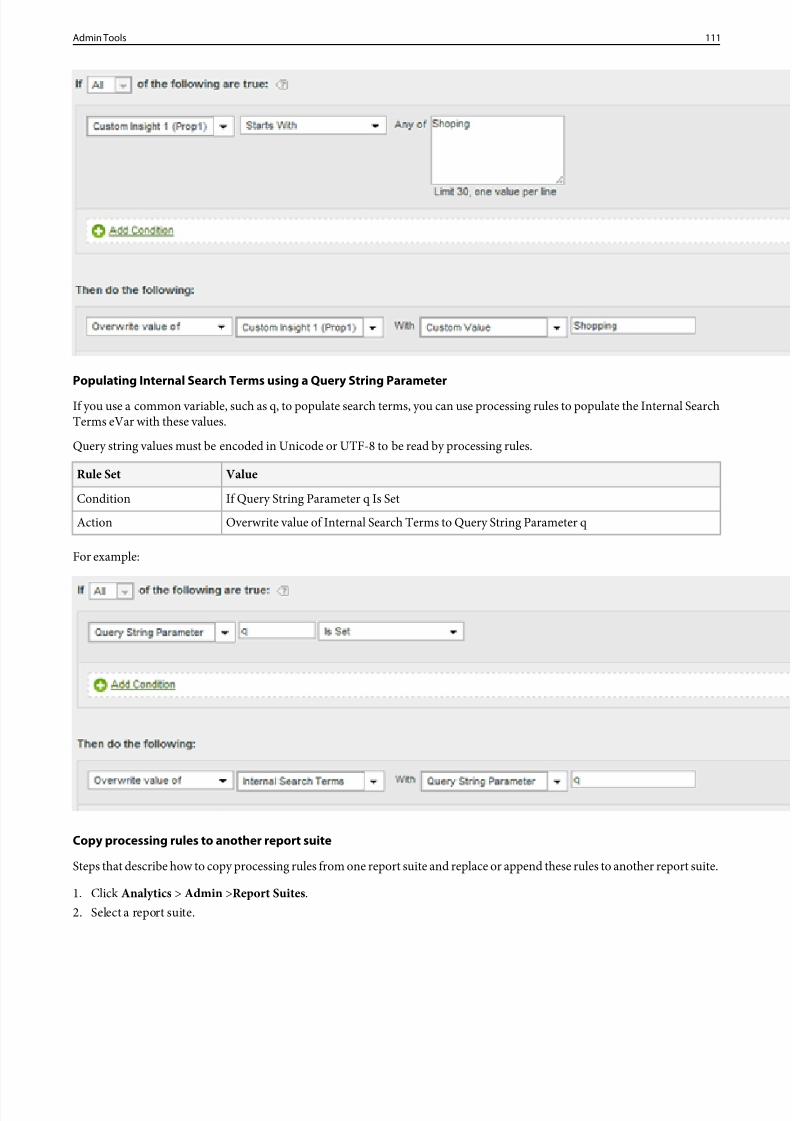
8/18/2019 Analytics Reference Adobe
http://slidepdf.com/reader/full/analytics-reference-adobe 111/332
Populating Internal Search Terms using a Query String Parameter
If you use a common variable, such as q, to populate search terms, you can use processing rules to populate the Internal SearchTerms eVar with these values.
Query string values must be encoded in Unicode or UTF-8 to be read by processing rules.
ValueRule Set
If Query String Parameter q Is SetCondition
Overwrite value of Internal Search Terms to Query String Parameter qAction
For example:
Copy processing rules to another report suite
Steps that describe how to copy processing rules from one report suite and replace or append these rules to another report suite.
1. ClickAnalytics > Admin >Report Suites .2. Select a report suite.
111Admin Tools
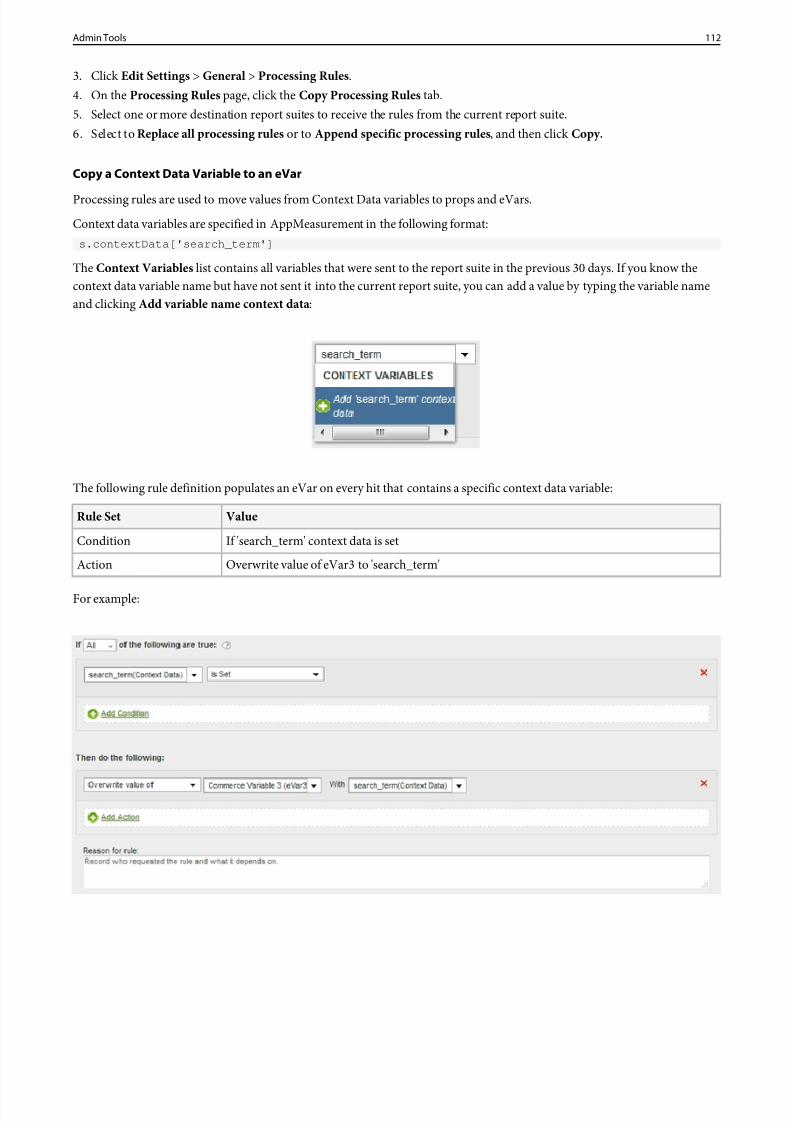
8/18/2019 Analytics Reference Adobe
http://slidepdf.com/reader/full/analytics-reference-adobe 112/332
3. ClickEdit Settings > General > Processing Rules .4. On the Processing Rules page, click theCopy Processing Rules tab.5. Select one or more destination report suites to receive the rules from the current report suite.6. Select toReplace all processing rules or to Append specific processing rules , and then click Copy.
Copy a Context Data Variable to an eVar
Processing rules are used to move values from Context Data variables to props and eVars.
Context data variables are specified in AppMeasurement in the following format: s.contextData['search_term']
The Context Variables list contains all variables that were sent to the report suite in the previous 30 days. If you know thecontext data variable name but have not sent it into the current report suite, you can add a value by typing the variable nameand clicking Add variable name context data :
The following rule definition populates an eVar on every hit that contains a specific context data variable:
ValueRule Set
If 'search_term' context data is setCondition
Overwrite value of eVar3 to 'search_term'Action
For example:
112Admin Tools
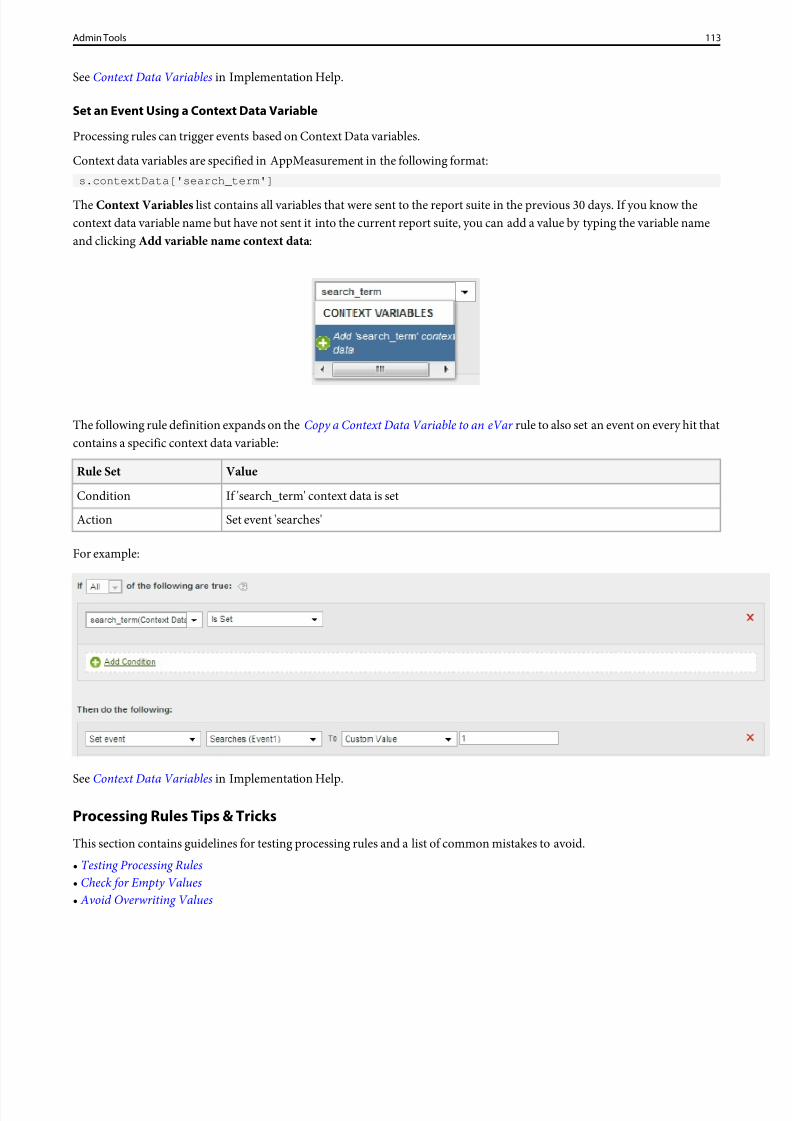
8/18/2019 Analytics Reference Adobe
http://slidepdf.com/reader/full/analytics-reference-adobe 113/332
SeeContext Data Variables in Implementation Help.
Set an Event Using a Context Data Variable
Processing rules can trigger events based on Context Data variables.
Context data variables are specified in AppMeasurement in the following format: s.contextData['search_term']
The Context Variables list contains all variables that were sent to the report suite in the previous 30 days. If you know thecontext data variable name but have not sent it into the current report suite, you can add a value by typing the variable nameand clicking Add variable name context data :
The following rule definition expands on the Copy a Context Data Variable to an eVar rule to also set an event on every hit thatcontains a specific context data variable:
ValueRule Set
If 'search_term' context data is setCondition
Set event 'searches'Action
For example:
SeeContext Data Variables in Implementation Help.
Processing Rules Tips & Tricks
This section contains guidelines for testing processing rules and a list of common mistakes to avoid.• Testing Processing Rules• Check for Empty Values• Avoid Overwriting Values
113Admin Tools
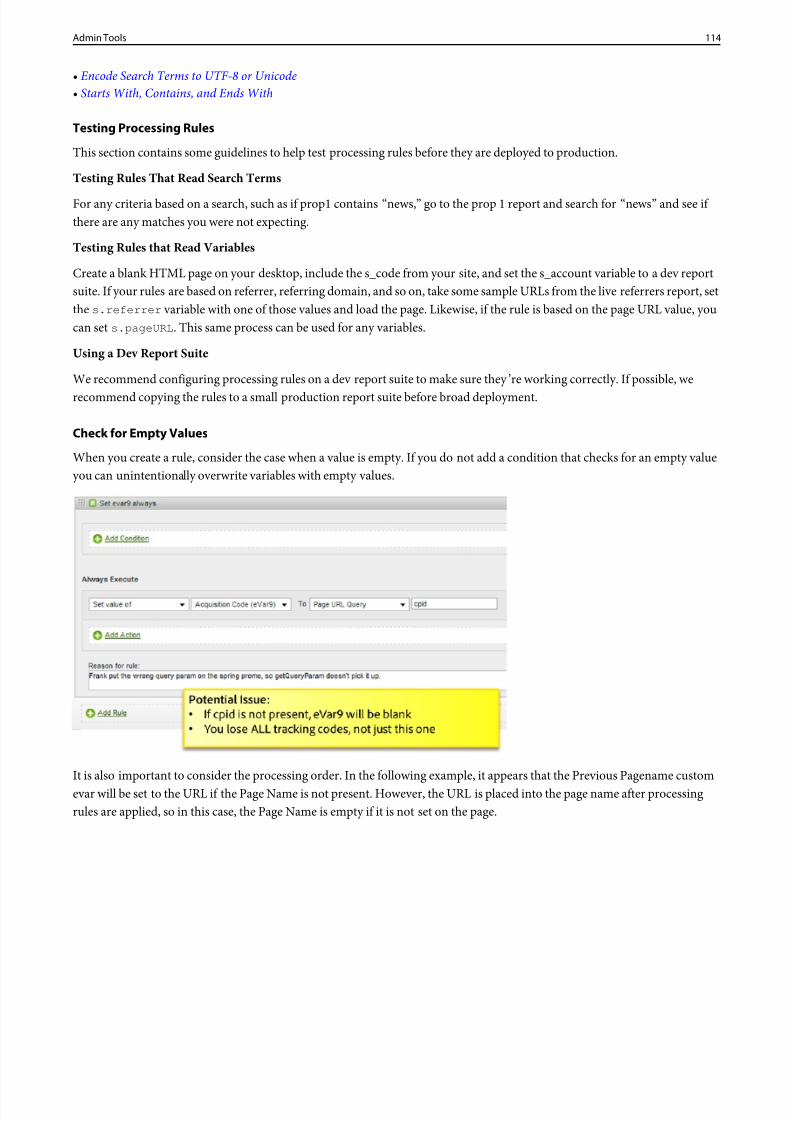
8/18/2019 Analytics Reference Adobe
http://slidepdf.com/reader/full/analytics-reference-adobe 114/332
• Encode Search Terms to UTF-8 or Unicode• Starts With, Contains, and Ends With
Testing Processing Rules
This section contains some guidelines to help test processing rules before they are deployed to production.
Testing Rules That Read Search Terms
For any criteria based on a search, such as if prop1 contains“news,” go to the prop 1 report and search for “news” and see if there are any matches you were not expecting.
Testing Rules that Read Variables
Create a blank HTML page on your desktop, include the s_code from your site, and set the s_account variable to a dev reportsuite. If your rules are based on referrer, referring domain, and so on, take some sample URLs from the live referrers report, setthe s.referrer variable with one of those values and load the page. Likewise, if the rule is based on the page URL value, youcan set s.pageURL . This same process can be used for any variables.
Using a Dev Report Suite
We recommend configuring processing rules on a dev report suite to make sure they ’re working correctly. If possible, werecommend copying the rules to a small production report suite before broad deployment.
Check for Empty Values
When you create a rule, consider the case when a value is empty. If you do not add a condition that checks for an empty valueyou can unintentionally overwrite variables with empty values.
It is also important to consider the processing order. In the following example, it appears that the Previous Pagename customevar will be set to the URL if the Page Name is not present. However, the URL is placed into the page name after processingrules are applied, so in this case, the Page Name is empty if it is not set on the page.
114Admin Tools
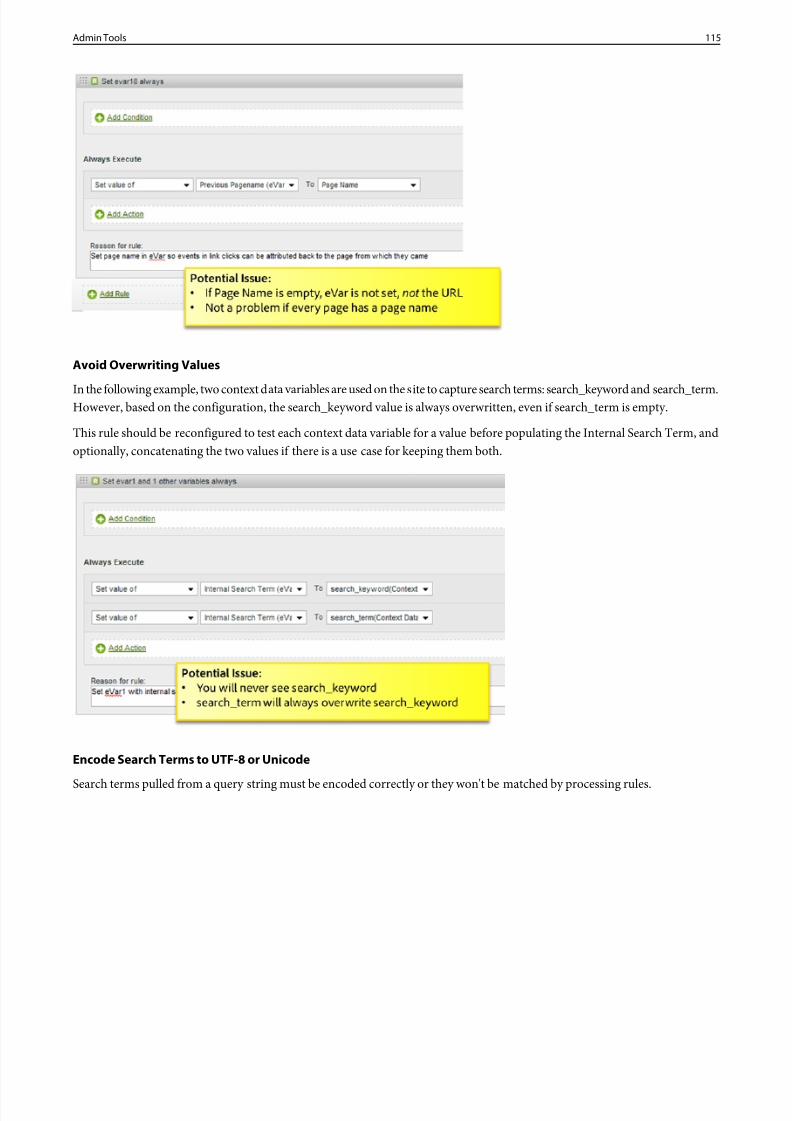
8/18/2019 Analytics Reference Adobe
http://slidepdf.com/reader/full/analytics-reference-adobe 115/332
Avoid Overwriting Values
In the following example, two context data variables are used on the site to capture search terms: search_keyword and search_term.However, based on the configuration, the search_keyword value is always overwritten, even if search_term is empty.
This rule should be reconfigured to test each context data variable for a value before populating the Internal Search Term, andoptionally, concatenating the two values if there is a use case for keeping them both.
Encode Search Terms to UTF-8 or Unicode
Search terms pulled from a query string must be encoded correctly or they won't be matched by processing rules.
115Admin Tools
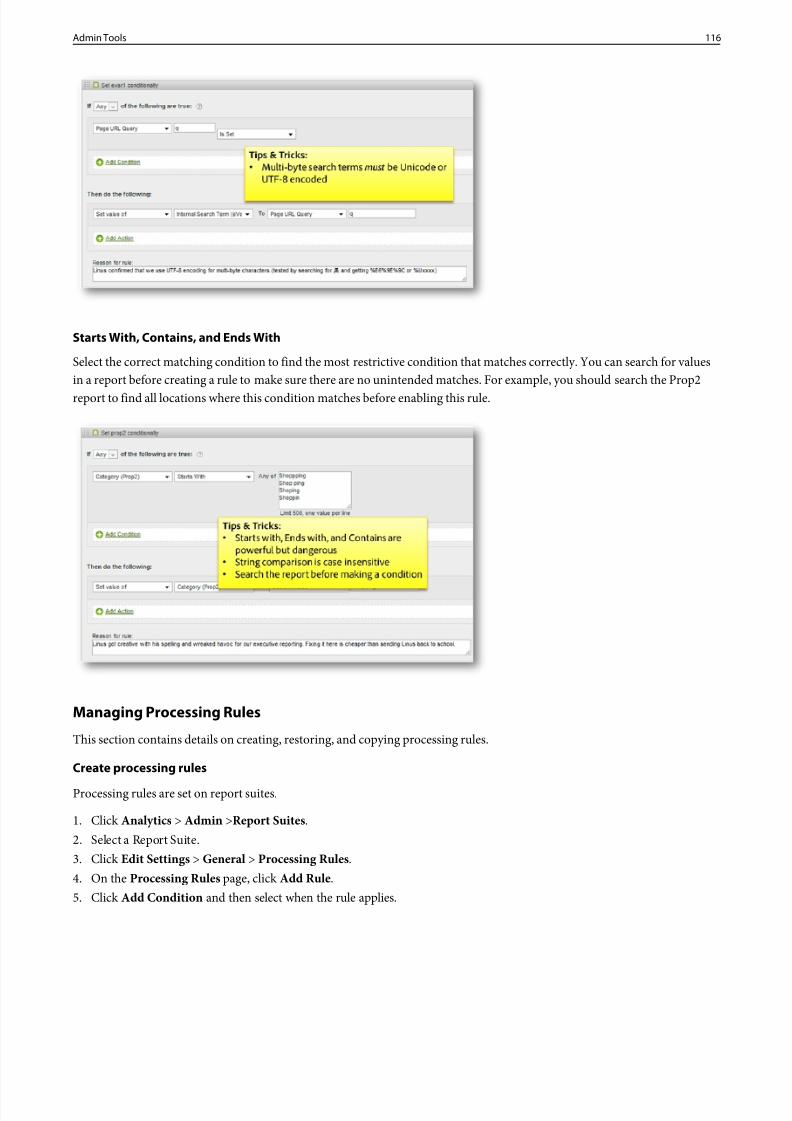
8/18/2019 Analytics Reference Adobe
http://slidepdf.com/reader/full/analytics-reference-adobe 116/332
Starts With, Contains, and Ends With
Select the correct matching condition to find the most restrictive condition that matches correctly. You can search for valuesin a report before creating a rule to make sure there are no unintended matches. For example, you should search the Prop2report to find all locations where this condition matches before enabling this rule.
Managing Processing Rules
This section contains details on creating, restoring, and copying processing rules.
Create processing rules
Processing rules are set on report suites.
1. ClickAnalytics > Admin >Report Suites .2. Select a Report Suite.3. ClickEdit Settings > General > Processing Rules .4. On the Processing Rules page, clickAdd Rule.5. ClickAdd Condition and then select when the rule applies.
116Admin Tools
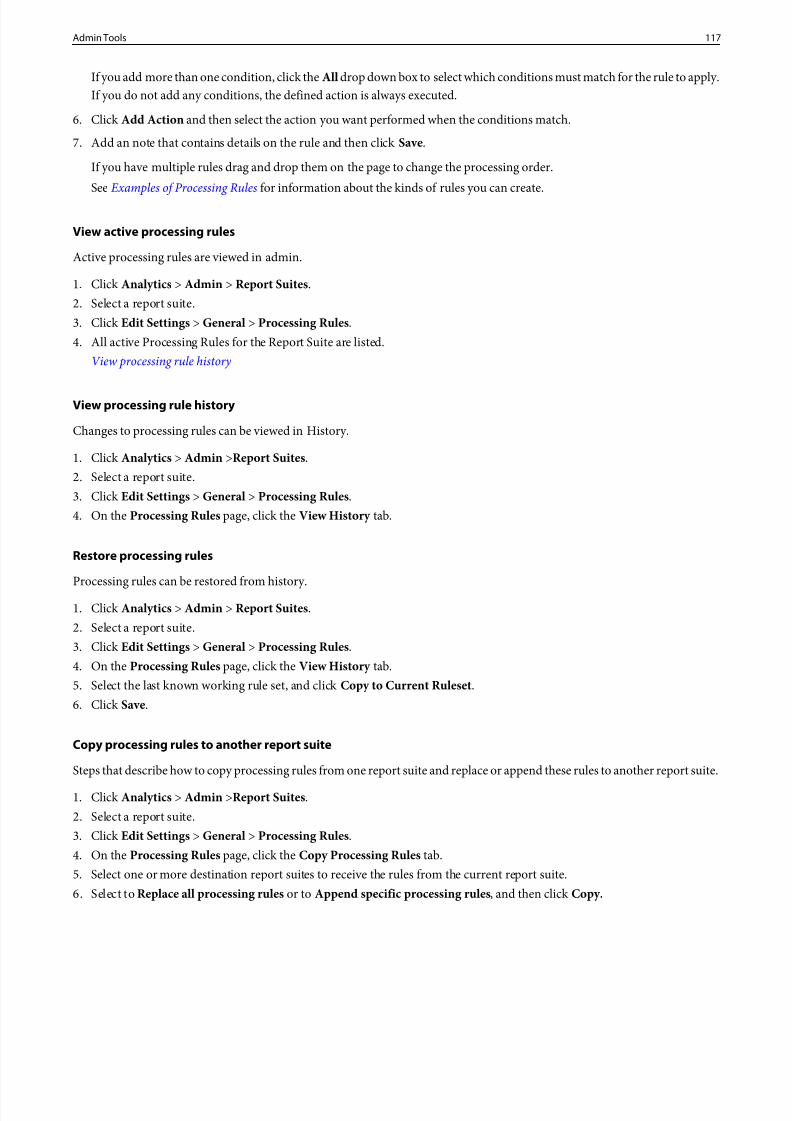
8/18/2019 Analytics Reference Adobe
http://slidepdf.com/reader/full/analytics-reference-adobe 117/332
If you add more than one condition, click the All drop down box to select which conditions must match for the rule to apply.If you do not add any conditions, the defined action is always executed.
6. ClickAdd Action and then select the action you want performed when the conditions match.
7. Add an note that contains details on the rule and then click Save.
If you have multiple rules drag and drop them on the page to change the processing order.SeeExamples of Processing Rules for information about the kinds of rules you can create.
View active processing rules
Active processing rules are viewed in admin.
1. ClickAnalytics > Admin > Report Suites .2. Select a report suite.3. ClickEdit Settings > General > Processing Rules .4. All active Processing Rules for the Report Suite are listed.
View processing rule history
View processing rule history
Changes to processing rules can be viewed in History.
1. ClickAnalytics > Admin >Report Suites .2. Select a report suite.3. ClickEdit Settings > General > Processing Rules .4. On the Processing Rules page, click theView History tab.
Restore processing rules
Processing rules can be restored from history.
1. ClickAnalytics > Admin > Report Suites .2. Select a report suite.3. ClickEdit Settings > General > Processing Rules .4. On the Processing Rules page, click theView History tab.5. Select the last known working rule set, and clickCopy to Current Ruleset .6. ClickSave.
Copy processing rules to another report suite
Steps that describe how to copy processing rules from one report suite and replace or append these rules to another report suite.
1. ClickAnalytics > Admin >Report Suites .2. Select a report suite.3. ClickEdit Settings > General > Processing Rules .4. On the Processing Rules page, click theCopy Processing Rules tab.5. Select one or more destination report suites to receive the rules from the current report suite.6. Select toReplace all processing rules or to Append specific processing rules , and then click Copy.
117Admin Tools
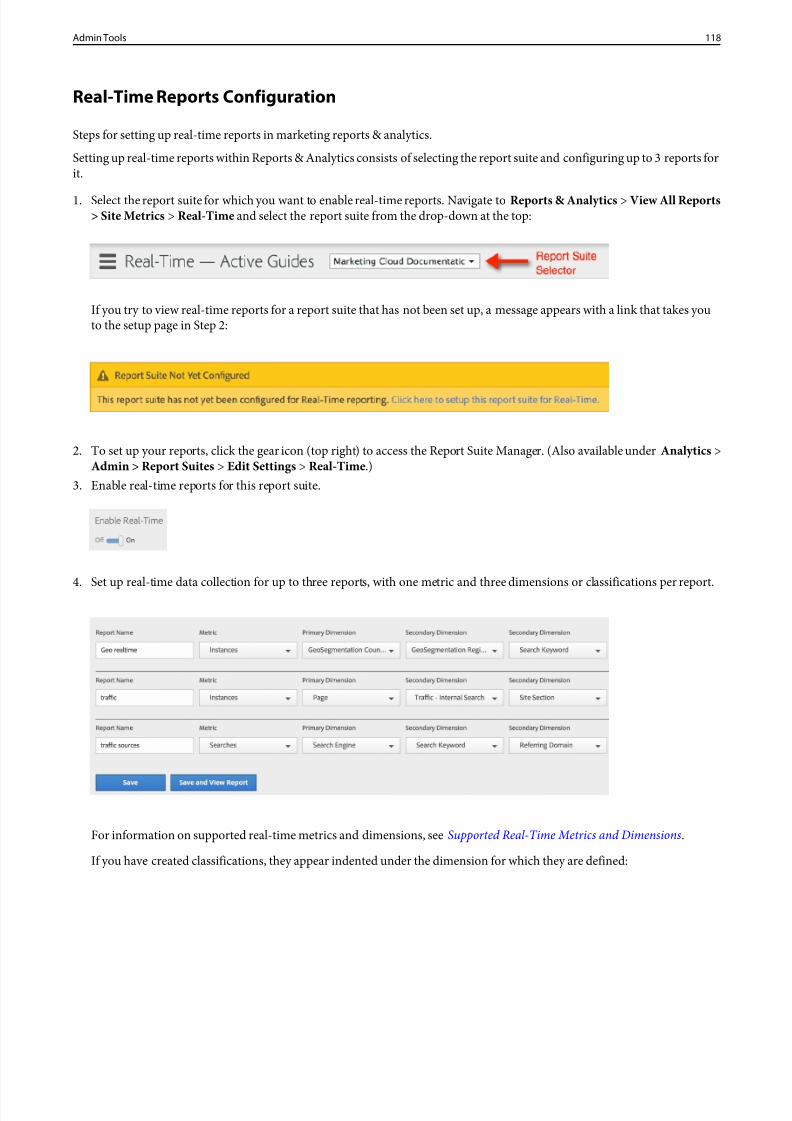
8/18/2019 Analytics Reference Adobe
http://slidepdf.com/reader/full/analytics-reference-adobe 118/332
Real-Time Reports Configuration
Steps for setting up real-time reports in marketing reports & analytics.
Setting up real-time reports within Reports & Analytics consists of selecting the report suite and configuring up to 3 reports forit.
1. Select the report suite for which you want to enable real-time reports. Navigate toReports & Analytics > View All Reports> Site Metrics > Real-Time and select the report suite from the drop-down at the top:
If you try to view real-time reports for a report suite that has not been set up, a message appears with a link that takes youto the setup page in Step 2:
2. To set up your reports, click the gear icon (top right) to access the Report Suite Manager. (Also available underAnalytics >Admin > Report Suites > Edit Settings > Real-Time .)
3. Enable real-time reports for this report suite.
4. Set up real-time data collection for up to three reports, with one metric and three dimensions or classifications per report.
For information on supported real-time metrics and dimensions, see Supported Real-Time Metrics and Dimensions.
If you have created classifications, they appear indented under the dimension for which they are defined:
118Admin Tools
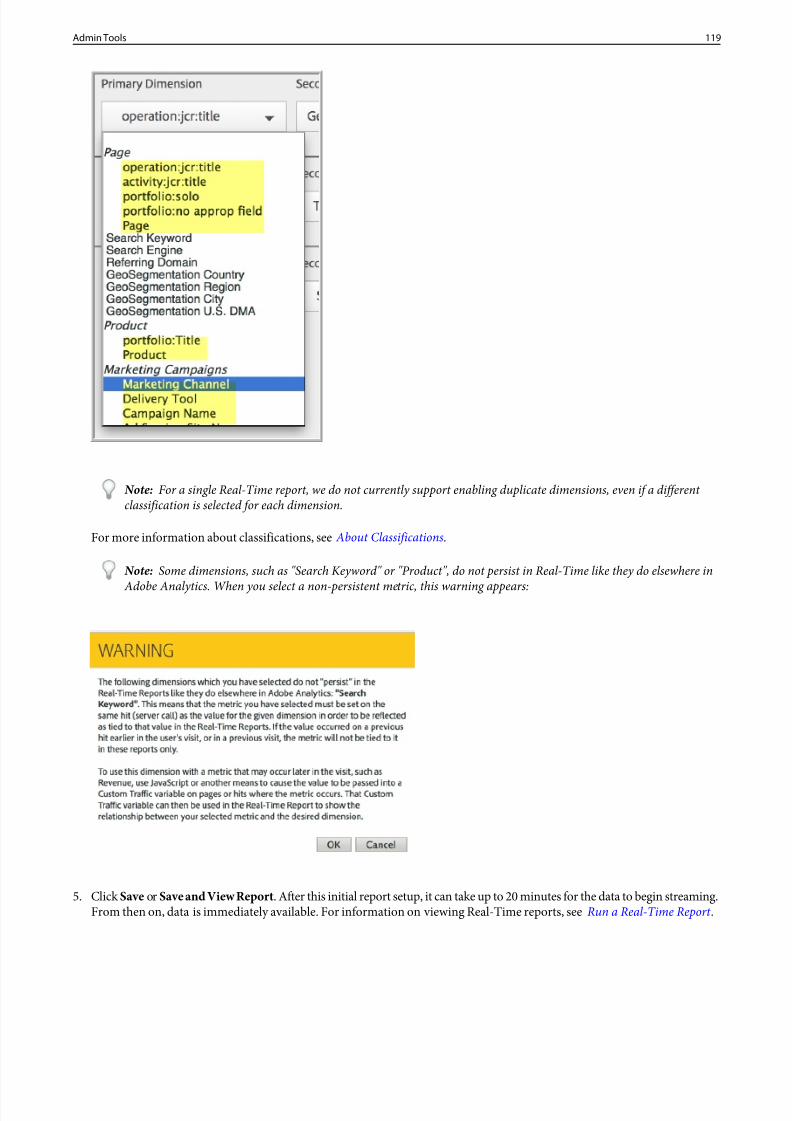
8/18/2019 Analytics Reference Adobe
http://slidepdf.com/reader/full/analytics-reference-adobe 119/332
Note: For a single Real-Time report, we do not currently support enabling duplicate dimensions, even if a different classification is selected for each dimension.
For more information about classifications, see About Classifications.
Note: Some dimensions, such as "Search Keyword" or "Product", do not persist in Real-Time like they do elsewhere in
Adobe Analytics. When you select a non-persistent metric, this warning appears:
5. ClickSave or Save and View Report . After this initial report setup, it can take up to 20 minutes for the data to begin streaming.From then on, data is immediately available. For information on viewing Real-Time reports, seeRun a Real-Time Report .
119Admin Tools
8/18/2019 Analytics Reference Adobe
http://slidepdf.com/reader/full/analytics-reference-adobe 120/332
6. By default, all users have access to Real-Time reports. To remove access,manage access to metrics and reports and removeaccess toAdvanced Reporting > Real-Time .
Report Builder Reports
Manage license assigned to report builder users.
Every report builder license assigned to a user is automatically allocated ten scheduled tasks. This number of tasks can be adjustedand reallocated. Scheduled tasks cannot exceed the number of available tasks for each user. Any over-scheduled tasks do notrun.
You can grant report builder access to any Analytics user by adding them to the report builder access group (User Management> Groups ).
The Scheduled Task Usage information table displays all users with report builder access privileges.
SeeGroups.
Report Suite Manager
A report suite defines the complete, independent reporting on a chosen website, set of websites, or subset of web pages. Usually,a report suite is one website, but it can be a global segment where you have combined several sites' numbers to get totals. Whenyou log in to the marketing reports, ad hoc analysis, and report builder, you select one report suite to use (except when you useroll-ups that combine report suites). Also, a report suite can be smaller than a website, if want to run reports for a portion of your site. Analytics solutions aggregate and report on these data stores. The adminReport Suite Manager lets you define therules that govern how data is processed in a report suite.
Analytics > Admin > Report Suites
Report Suite Manager Descriptions
The following table describes elements on theReport Suite Manager page.
DescriptionElement
The Report Suite Manager highlights a selected report suite.You can select multiple report suites with Ctrl+click orShift+click .
Select Report Suite
A selected report suite remains selected until you select anotherreport suite.
Generates an Excel spreadsheet of all settings for the currently selected report suites.
Download
Lets you locate a specific report suite in the Report Suite List.The search tool includes both basic name-based search and anadvanced search page for in-depth searches.
Search
Lets you organize your report suites into custom groups. Youcan quickly access multiple report suites that share similarsettings or that you commonly edit together.
Groups
120Admin Tools
8/18/2019 Analytics Reference Adobe
http://slidepdf.com/reader/full/analytics-reference-adobe 121/332
DescriptionElement
A dynamic group that uses the Advanced Search feature todefine a set of criteria that determines its members. As you add
Saved Searches
or modify report suites in the Report Suite Manager , the SavedSearch automatically adds those report suites that match itscriteria.
A rollup is single report suite that combines the tracking dataof several other report suites.
Rollups
SeeRollup and Global Report Suites.
When you edit a report suite, the edits are applied to all selectedreport suites.
Edit Settings
SeeNew Report Suite.Create New
Lets you choose columns to add to theReport Suite Manager .Customize Columns
SeeNew Report Suite.Report Suite ID
Identifies report suites in Admin Tools, and in the report suitedrop-down list in the marketing report header.
Site Title
SeeNew Report Suite.
Defines the base domain for the report suite.Base URL
SeeNew Report Suite.
Individual Report Suite Settings
The Individual Report Suite Settings let you change the default settings of your report suites. Tools include a way to removerecords for unwanted or obsolete pages, set default metrics, and configure report suite segments.
To access Individual Report Suite Settings :
1. ClickAdmin , then click Report Suites .2. Select a report suite.3. ClickEdit Settings > Individual Report Suite Settings > <selection>.
Download report suite settings
Steps that describe how to generate an Excel spreadsheet containing all the settings for the selected report suite.
1. ClickAdmin > Report Suites .2. Select a report suite from theReport Suite table.3. ClickDownload .
You can open the spreadsheet file directly, or save it for viewing.
121Admin Tools
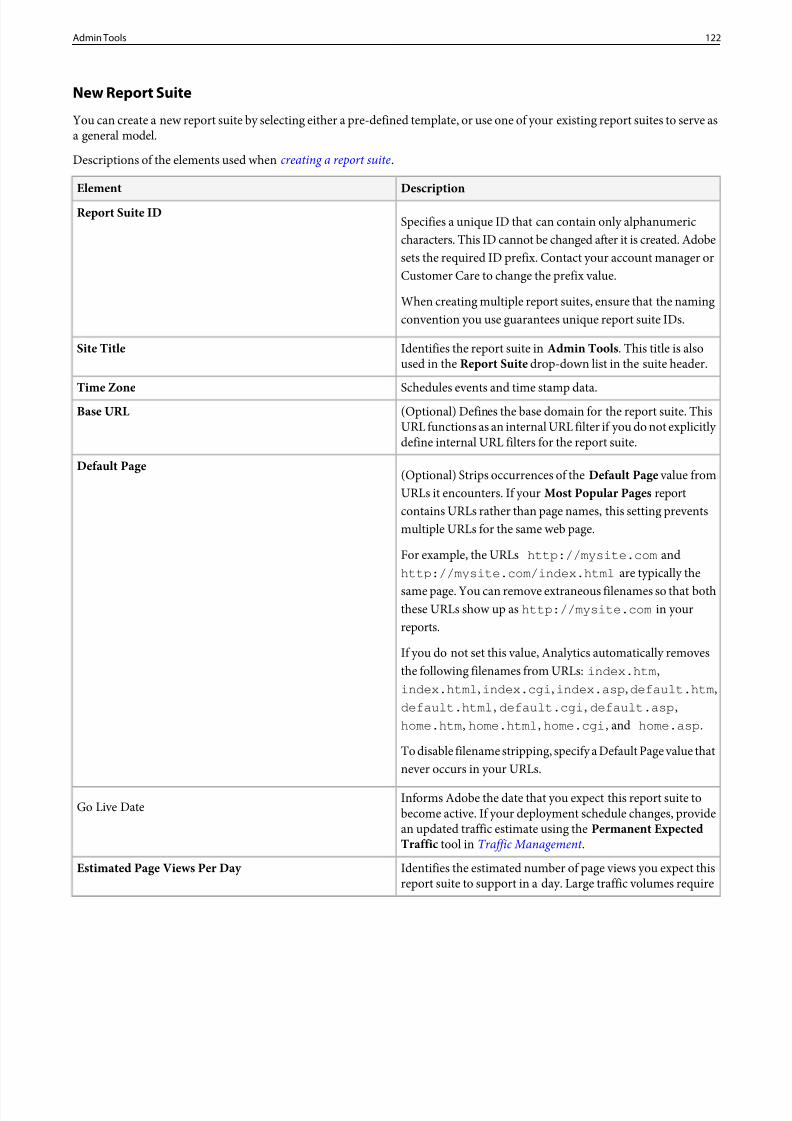
8/18/2019 Analytics Reference Adobe
http://slidepdf.com/reader/full/analytics-reference-adobe 122/332
New Report Suite
You can create a new report suite by selecting either a pre-defined template, or use one of your existing report suites to serve asa general model.
Descriptions of the elements used when creating a report suite .
DescriptionElement
Specifies a unique ID that can contain only alphanumericcharacters. This ID cannot be changed after it is created. Adobe
Report Suite ID
sets the required ID prefix. Contact your account manager orCustomer Care to change the prefix value.
When creating multiple report suites, ensure that the namingconvention you use guarantees unique report suite IDs.
Identifies the report suite in Admin Tools . This title is alsoused in the Report Suite drop-down list in the suite header.
Site Title
Schedules events and time stamp data.Time Zone(Optional) Defines the base domain for the report suite. ThisURL functions as an internal URL filter if you do not explicitly define internal URL filters for the report suite.
Base URL
(Optional) Strips occurrences of the Default Page value fromURLs it encounters. If yourMost Popular Pages report
Default Page
contains URLs rather than page names, this setting preventsmultiple URLs for the same web page.
For example, the URLs http://mysite.com andhttp://mysite.com/index.html are typically the
same page. You can remove extraneous filenames so that boththese URLs show up ashttp://mysite.com in yourreports.
If you do not set this value, Analytics automatically removesthe following filenames from URLs:index.htm ,index.html , index.cgi , index.asp , default.htm ,default.html , default.cgi , default.asp ,home.htm , home.html , home.cgi , and home.asp .
To disable filename stripping, specify a Default Page value thatnever occurs in your URLs.
Informs Adobe the date that you expect this report suite tobecome active. If your deployment schedule changes, provideGo Live Date
an updated traffic estimate using the Permanent ExpectedTraffic tool in Traffic Management .
Identifies the estimated number of page views you expect thisreport suite to support in a day. Large traffic volumes require
Estimated Page Views Per Day
122Admin Tools
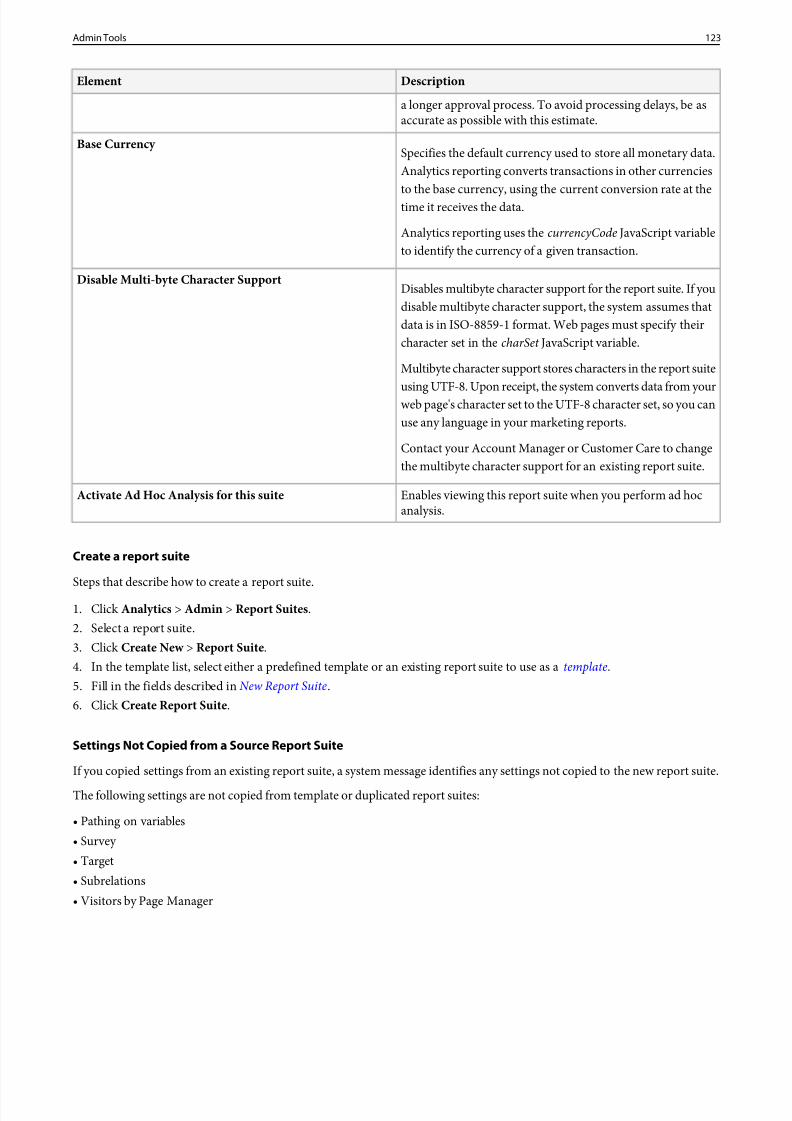
8/18/2019 Analytics Reference Adobe
http://slidepdf.com/reader/full/analytics-reference-adobe 123/332
DescriptionElement
a longer approval process. To avoid processing delays, be asaccurate as possible with this estimate.
Specifies the default currency used to store all monetary data.Analytics reporting converts transactions in other currencies
Base Currency
to the base currency, using the current conversion rate at thetime it receives the data.
Analytics reporting uses the currencyCode JavaScript variableto identify the currency of a given transaction.
Disables multibyte character support for the report suite. If youdisable multibyte character support, the system assumes that
Disable Multi-byte Character Support
data is in ISO-8859-1 format. Web pages must specify theircharacter set in the charSet JavaScript variable.
Multibyte character support stores characters in the report suite
using UTF-8. Upon receipt, the system converts data from yourweb page's character set to the UTF-8 character set, so you canuse any language in your marketing reports.
Contact your Account Manager or Customer Care to changethe multibyte character support for an existing report suite.
Enables viewing this report suite when you perform ad hocanalysis.
Activate Ad Hoc Analysis for this suite
Create a report suite
Steps that describe how to create a report suite.
1. ClickAnalytics > Admin > Report Suites .2. Select a report suite.3. ClickCreate New > Report Suite .4. In the template list, select either a predefined template or an existing report suite to use as atemplate.5. Fill in the fields described inNew Report Suite.6. ClickCreate Report Suite .
Settings Not Copied from a Source Report Suite
If you copied settings from an existing report suite, a system message identifies any settings not copied to the new report suite.
The following settings are not copied from template or duplicated report suites:
• Pathing on variables• Survey • Target• Subrelations• Visitors by Page Manager
123Admin Tools
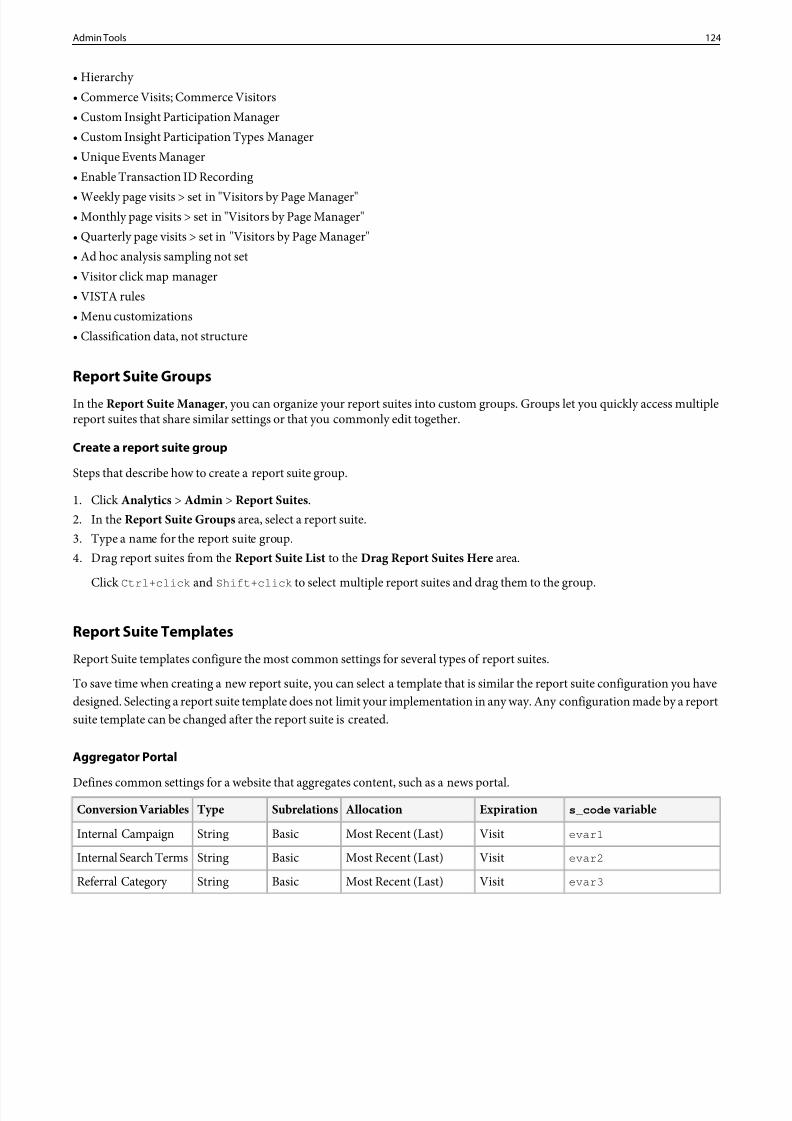
8/18/2019 Analytics Reference Adobe
http://slidepdf.com/reader/full/analytics-reference-adobe 124/332
• Hierarchy • Commerce Visits; Commerce Visitors• Custom Insight Participation Manager• Custom Insight Participation Types Manager• Unique Events Manager• Enable Transaction ID Recording
• Weekly page visits > set in "Visitors by Page Manager"• Monthly page visits > set in "Visitors by Page Manager"• Quarterly page visits > set in "Visitors by Page Manager"• Ad hoc analysis sampling not set• Visitor click map manager• VISTA rules• Menu customizations• Classification data, not structure
Report Suite Groups
In the Report Suite Manager , you can organize your report suites into custom groups. Groups let you quickly access multiplereport suites that share similar settings or that you commonly edit together.
Create a report suite group
Steps that describe how to create a report suite group.
1. ClickAnalytics > Admin > Report Suites .2. In the Report Suite Groups area, select a report suite.3. Type a name for the report suite group.4. Drag report suites from the Report Suite List to the Drag Report Suites Here area.
ClickCtrl+click
andShift+click
to select multiple report suites and drag them to the group.
Report Suite Templates
Report Suite templates configure the most common settings for several types of report suites.
To save time when creating a new report suite, you can select a template that is similar the report suite configuration you havedesigned. Selecting a report suite template does not limit your implementation in any way. Any configuration made by a reportsuite template can be changed after the report suite is created.
Aggregator Portal
Defines common settings for a website that aggregates content, such as a news portal.s_code variableExpirationAllocationSubrelationsTypeConversion Variables
evar1VisitMost Recent (Last)BasicStringInternal Campaign
evar2VisitMost Recent (Last)BasicStringInternal Search Terms
evar3VisitMost Recent (Last)BasicStringReferral Category
124Admin Tools
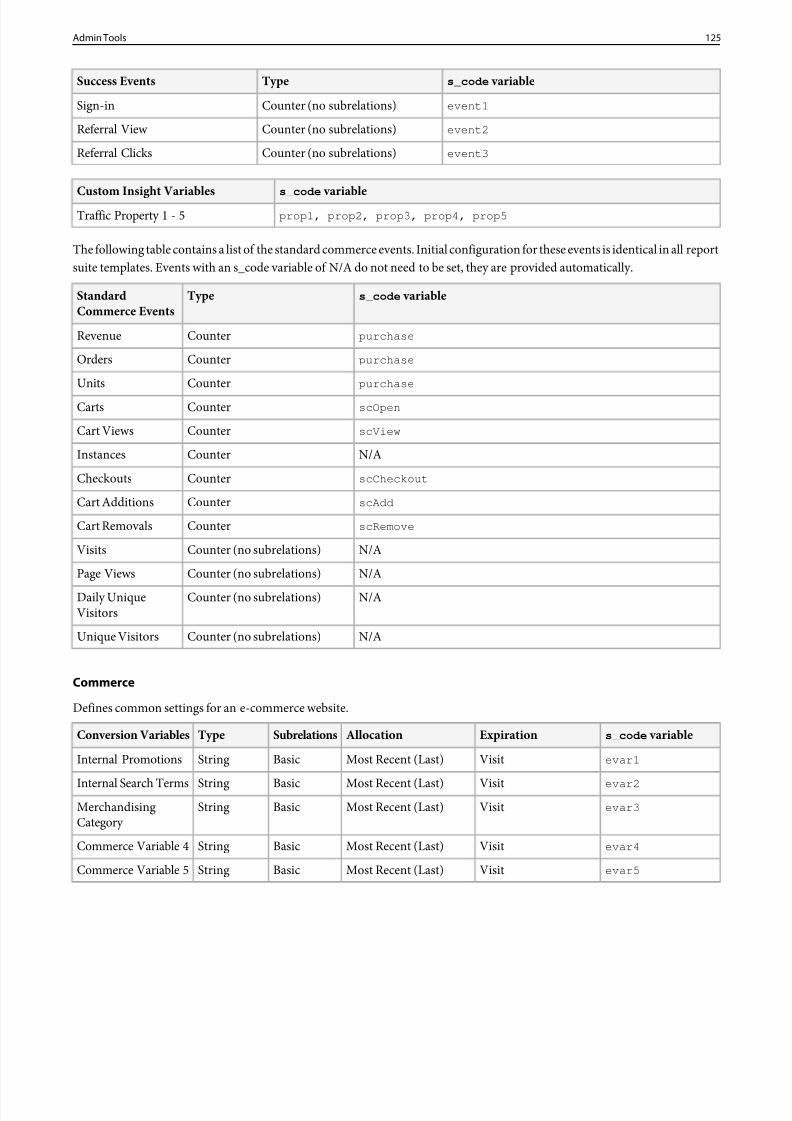
8/18/2019 Analytics Reference Adobe
http://slidepdf.com/reader/full/analytics-reference-adobe 125/332
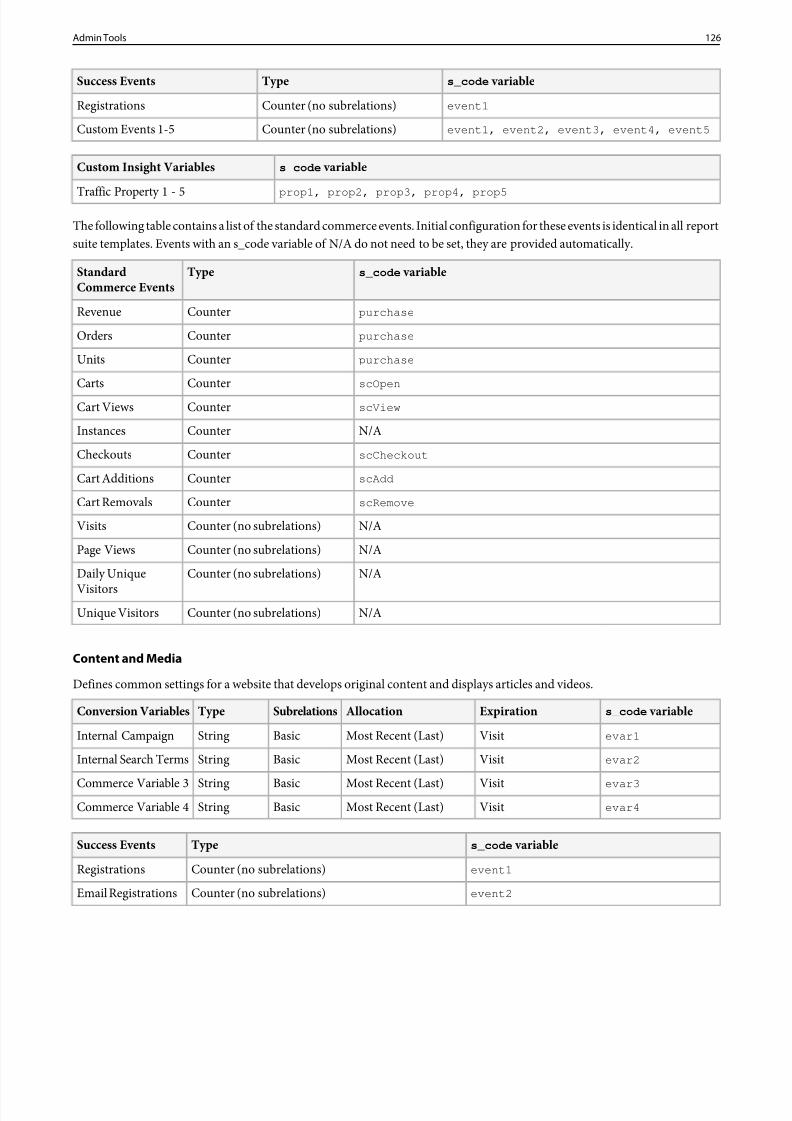
8/18/2019 Analytics Reference Adobe
http://slidepdf.com/reader/full/analytics-reference-adobe 126/332
s_code variableTypeSuccess Events
event1Counter (no subrelations)Registrations
event1, event2, event3, event4, event5Counter (no subrelations)Custom Events 1-5
s_code variableCustom Insight Variables
prop1, prop2, prop3, prop4, prop5Traffic Property 1 - 5
The following table contains a list of the standard commerce events. Initial configuration for these events is identical in all reportsuite templates. Events with an s_code variable of N/A do not need to be set, they are provided automatically.
s_code variableTypeStandardCommerce Events
purchaseCounterRevenue
purchaseCounterOrders
purchaseCounterUnits
scOpenCounterCarts
scViewCounterCart Views
N/ACounterInstances
scCheckoutCounterCheckouts
scAddCounterCart Additions
scRemoveCounterCart Removals
N/ACounter (no subrelations)Visits
N/ACounter (no subrelations)Page Views
N/ACounter (no subrelations)Daily Unique
VisitorsN/ACounter (no subrelations)Unique Visitors
Content and Media
Defines common settings for a website that develops original content and displays articles and videos.
s_code variableExpirationAllocationSubrelationsTypeConversion Variables
evar1VisitMost Recent (Last)BasicStringInternal Campaign
evar2VisitMost Recent (Last)BasicStringInternal Search Terms
evar3VisitMost Recent (Last)BasicStringCommerce Variable 3evar4VisitMost Recent (Last)BasicStringCommerce Variable 4
s_code variableTypeSuccess Events
event1Counter (no subrelations)Registrations
event2Counter (no subrelations)Email Registrations
126Admin Tools
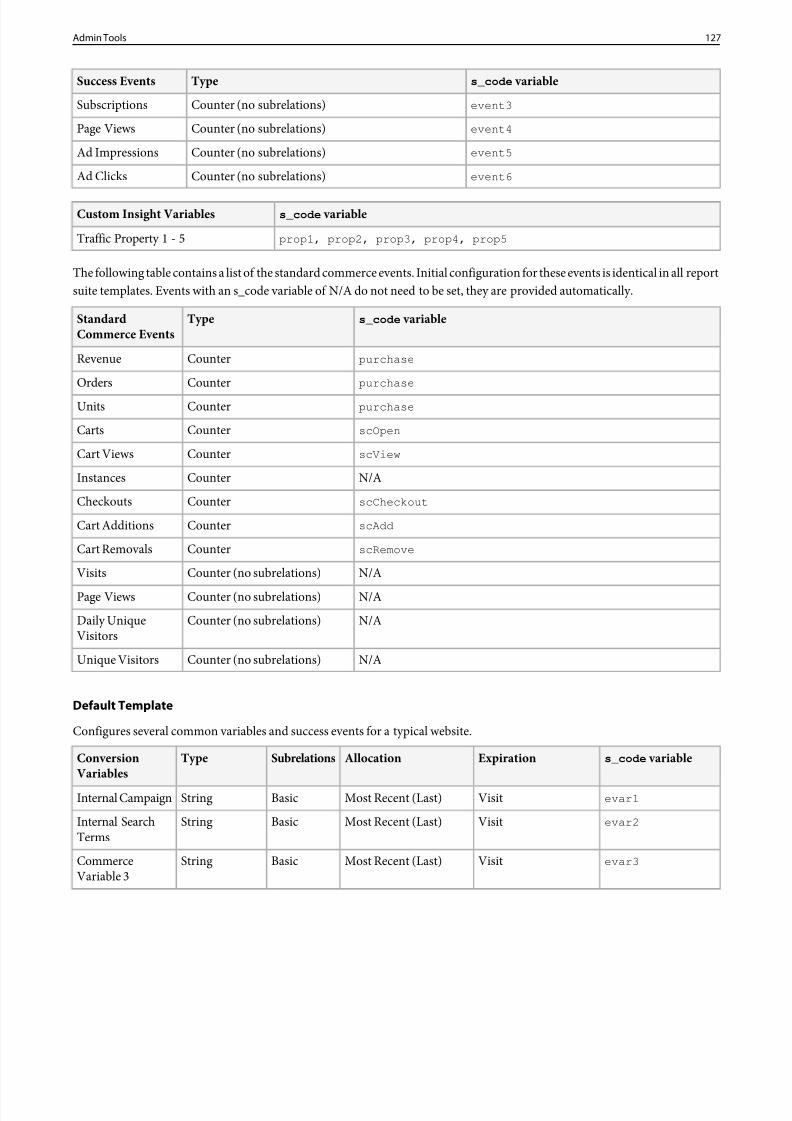
8/18/2019 Analytics Reference Adobe
http://slidepdf.com/reader/full/analytics-reference-adobe 127/332
s_code variableTypeSuccess Events
event3Counter (no subrelations)Subscriptions
event4Counter (no subrelations)Page Views
event5Counter (no subrelations)Ad Impressions
event6Counter (no subrelations)Ad Clicks
s_code variableCustom Insight Variables
prop1, prop2, prop3, prop4, prop5Traffic Property 1 - 5
The following table contains a list of the standard commerce events. Initial configuration for these events is identical in all reportsuite templates. Events with an s_code variable of N/A do not need to be set, they are provided automatically.
s_code variableTypeStandardCommerce Events
purchaseCounterRevenue
purchaseCounterOrders
purchaseCounterUnits
scOpenCounterCarts
scViewCounterCart Views
N/ACounterInstances
scCheckoutCounterCheckouts
scAddCounterCart Additions
scRemoveCounterCart Removals
N/ACounter (no subrelations)Visits
N/ACounter (no subrelations)Page Views
N/ACounter (no subrelations)Daily UniqueVisitors
N/ACounter (no subrelations)Unique Visitors
Default Template
Configures several common variables and success events for a typical website.
s_code variableExpirationAllocationSubrelationsTypeConversionVariables
evar1VisitMost Recent (Last)BasicStringInternal Campaign
evar2VisitMost Recent (Last)BasicStringInternal SearchTerms
evar3VisitMost Recent (Last)BasicStringCommerceVariable 3
127Admin Tools
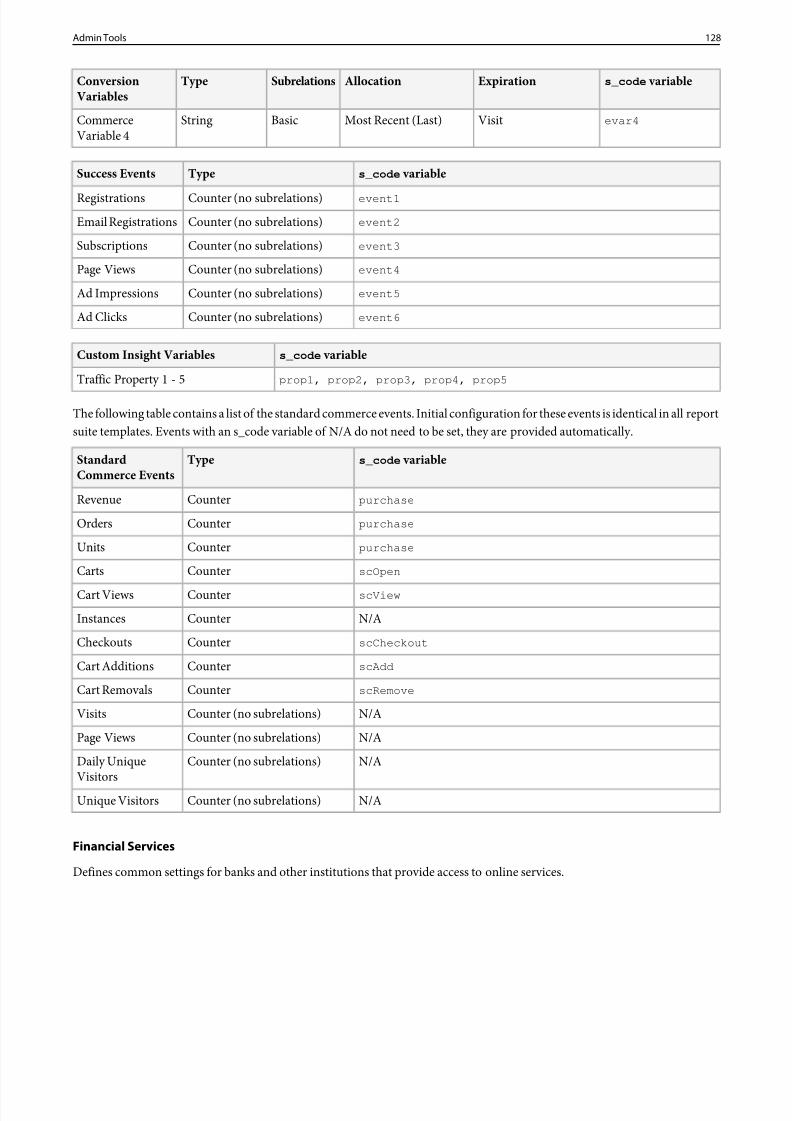
8/18/2019 Analytics Reference Adobe
http://slidepdf.com/reader/full/analytics-reference-adobe 128/332
s_code variableExpirationAllocationSubrelationsTypeConversionVariables
evar4VisitMost Recent (Last)BasicStringCommerceVariable 4
s_code variableTypeSuccess Events
event1Counter (no subrelations)Registrationsevent2Counter (no subrelations)Email Registrations
event3Counter (no subrelations)Subscriptions
event4Counter (no subrelations)Page Views
event5Counter (no subrelations)Ad Impressions
event6Counter (no subrelations)Ad Clicks
s_code variableCustom Insight Variables
prop1, prop2, prop3, prop4, prop5Traffic Property 1 - 5
The following table contains a list of the standard commerce events. Initial configuration for these events is identical in all reportsuite templates. Events with an s_code variable of N/A do not need to be set, they are provided automatically.
s_code variableTypeStandardCommerce Events
purchaseCounterRevenue
purchaseCounterOrders
purchaseCounterUnits
scOpenCounterCarts
scViewCounterCart Views
N/ACounterInstances
scCheckoutCounterCheckouts
scAddCounterCart Additions
scRemoveCounterCart Removals
N/ACounter (no subrelations)Visits
N/ACounter (no subrelations)Page Views
N/ACounter (no subrelations)Daily UniqueVisitors
N/ACounter (no subrelations)Unique Visitors
Financial Services
Defines common settings for banks and other institutions that provide access to online services.
128Admin Tools
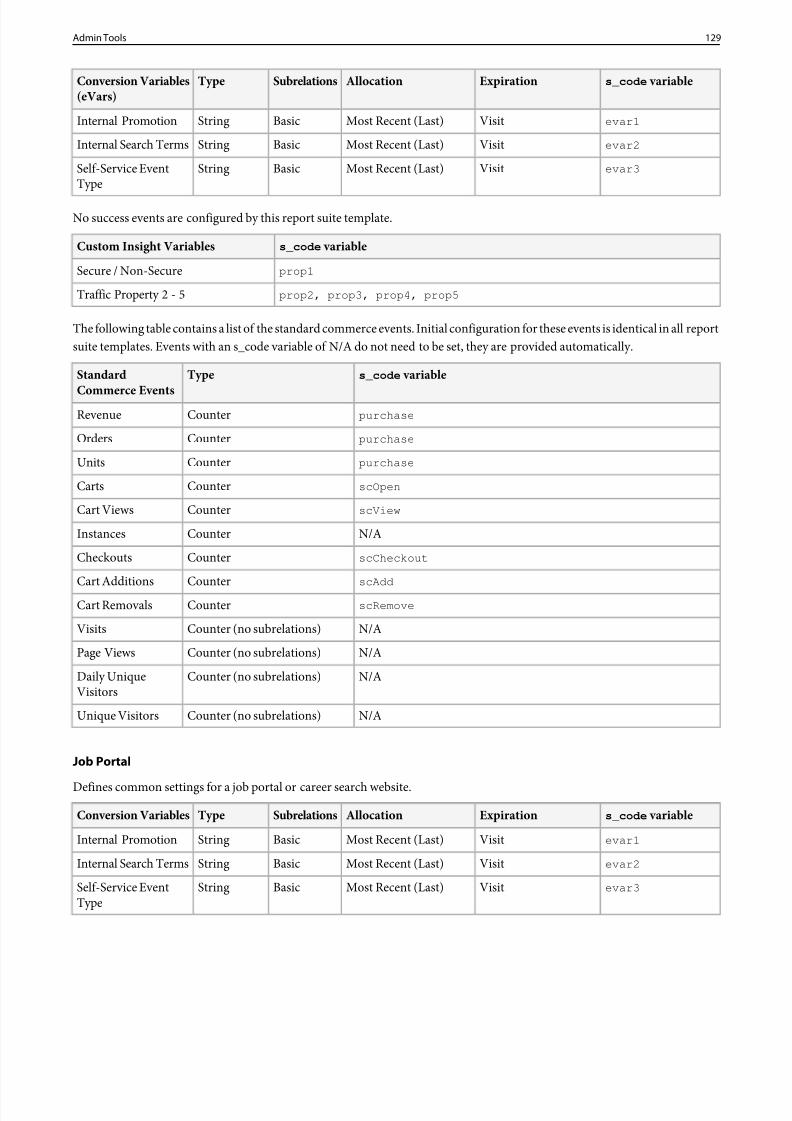
8/18/2019 Analytics Reference Adobe
http://slidepdf.com/reader/full/analytics-reference-adobe 129/332
s_code variableExpirationAllocationSubrelationsTypeConversion Variables(eVars)
evar1VisitMost Recent (Last)BasicStringInternal Promotion
evar2VisitMost Recent (Last)BasicStringInternal Search Terms
evar3VisitMost Recent (Last)BasicStringSelf-Service EventType
No success events are configured by this report suite template.
s_code variableCustom Insight Variables
prop1Secure / Non-Secure
prop2, prop3, prop4, prop5Traffic Property 2 - 5
The following table contains a list of the standard commerce events. Initial configuration for these events is identical in all reportsuite templates. Events with an s_code variable of N/A do not need to be set, they are provided automatically.
s_code variableTypeStandard
Commerce EventspurchaseCounterRevenue
purchaseCounterOrders
purchaseCounterUnits
scOpenCounterCarts
scViewCounterCart Views
N/ACounterInstances
scCheckoutCounterCheckouts
scAddCounterCart Additions
scRemoveCounterCart Removals
N/ACounter (no subrelations)Visits
N/ACounter (no subrelations)Page Views
N/ACounter (no subrelations)Daily UniqueVisitors
N/ACounter (no subrelations)Unique Visitors
Job Portal
Defines common settings for a job portal or career search website.
s_code variableExpirationAllocationSubrelationsTypeConversion Variables
evar1VisitMost Recent (Last)BasicStringInternal Promotion
evar2VisitMost Recent (Last)BasicStringInternal Search Terms
evar3VisitMost Recent (Last)BasicStringSelf-Service EventType
129Admin Tools
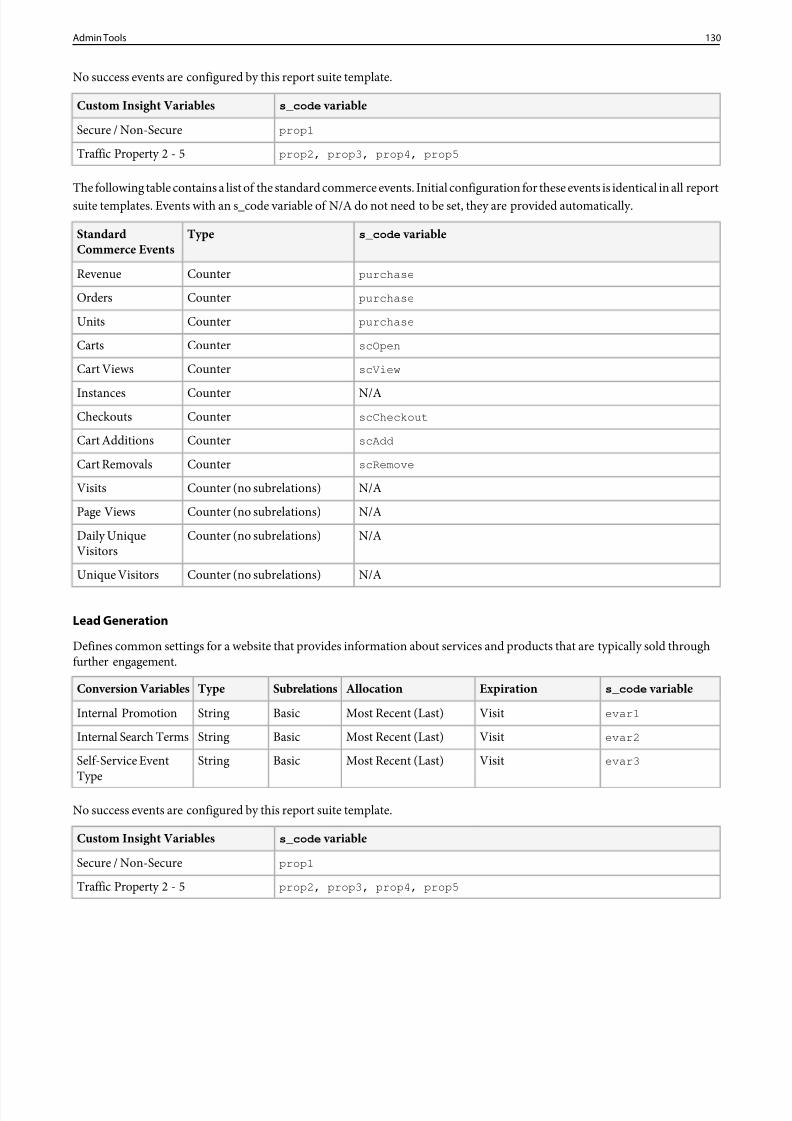
8/18/2019 Analytics Reference Adobe
http://slidepdf.com/reader/full/analytics-reference-adobe 130/332
No success events are configured by this report suite template.
s_code variableCustom Insight Variables
prop1Secure / Non-Secure
prop2, prop3, prop4, prop5Traffic Property 2 - 5
The following table contains a list of the standard commerce events. Initial configuration for these events is identical in all reportsuite templates. Events with an s_code variable of N/A do not need to be set, they are provided automatically.
s_code variableTypeStandardCommerce Events
purchaseCounterRevenue
purchaseCounterOrders
purchaseCounterUnits
scOpenCounterCarts
scViewCounterCart Views
N/ACounterInstancesscCheckoutCounterCheckouts
scAddCounterCart Additions
scRemoveCounterCart Removals
N/ACounter (no subrelations)Visits
N/ACounter (no subrelations)Page Views
N/ACounter (no subrelations)Daily UniqueVisitors
N/ACounter (no subrelations)Unique Visitors
Lead Generation
Defines common settings for a website that provides information about services and products that are typically sold throughfurther engagement.
s_code variableExpirationAllocationSubrelationsTypeConversion Variables
evar1VisitMost Recent (Last)BasicStringInternal Promotion
evar2VisitMost Recent (Last)BasicStringInternal Search Terms
evar3VisitMost Recent (Last)BasicStringSelf-Service EventType
No success events are configured by this report suite template.
s_code variableCustom Insight Variables
prop1Secure / Non-Secure
prop2, prop3, prop4, prop5Traffic Property 2 - 5
130Admin Tools
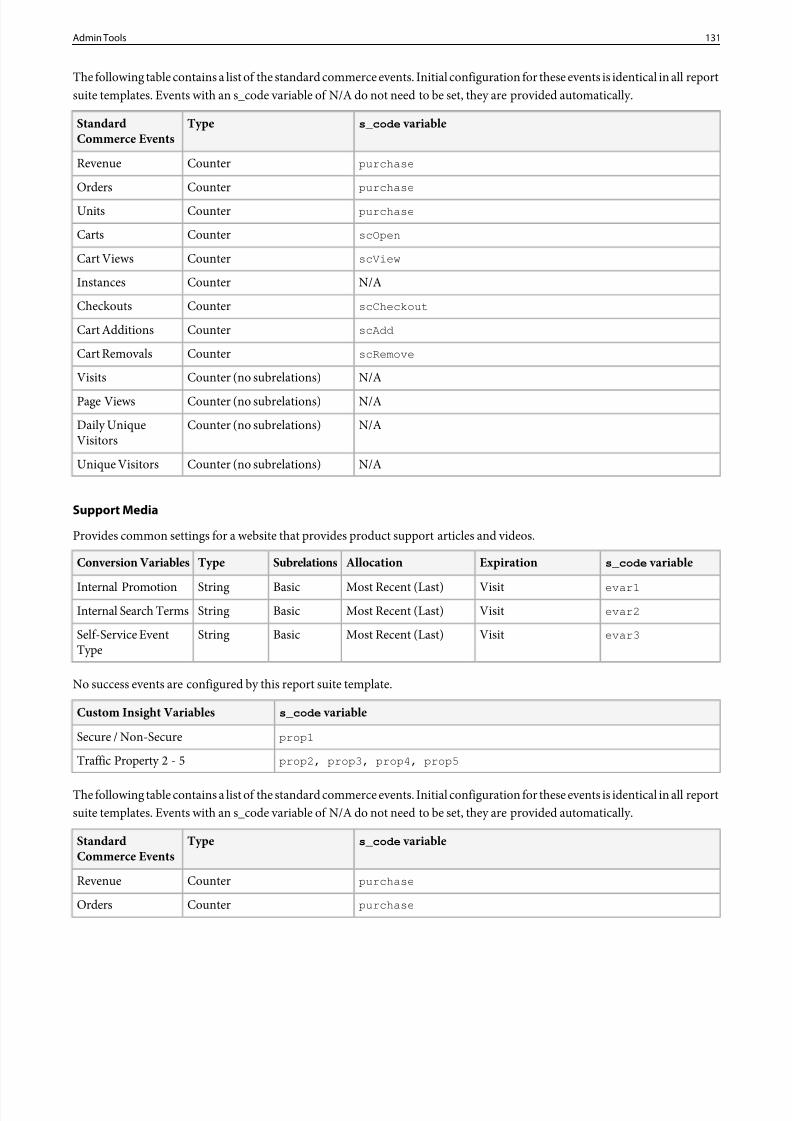
8/18/2019 Analytics Reference Adobe
http://slidepdf.com/reader/full/analytics-reference-adobe 131/332
The following table contains a list of the standard commerce events. Initial configuration for these events is identical in all reportsuite templates. Events with an s_code variable of N/A do not need to be set, they are provided automatically.
s_code variableTypeStandardCommerce Events
purchaseCounterRevenue
purchaseCounterOrders
purchaseCounterUnits
scOpenCounterCarts
scViewCounterCart Views
N/ACounterInstances
scCheckoutCounterCheckouts
scAddCounterCart Additions
scRemoveCounterCart Removals
N/ACounter (no subrelations)Visits
N/ACounter (no subrelations)Page Views
N/ACounter (no subrelations)Daily UniqueVisitors
N/ACounter (no subrelations)Unique Visitors
Support Media
Provides common settings for a website that provides product support articles and videos.
s_code variableExpirationAllocationSubrelationsTypeConversion Variables
evar1VisitMost Recent (Last)BasicStringInternal Promotionevar2VisitMost Recent (Last)BasicStringInternal Search Terms
evar3VisitMost Recent (Last)BasicStringSelf-Service EventType
No success events are configured by this report suite template.
s_code variableCustom Insight Variables
prop1Secure / Non-Secure
prop2, prop3, prop4, prop5Traffic Property 2 - 5
The following table contains a list of the standard commerce events. Initial configuration for these events is identical in all reportsuite templates. Events with an s_code variable of N/A do not need to be set, they are provided automatically.
s_code variableTypeStandardCommerce Events
purchaseCounterRevenue
purchaseCounterOrders
131Admin Tools
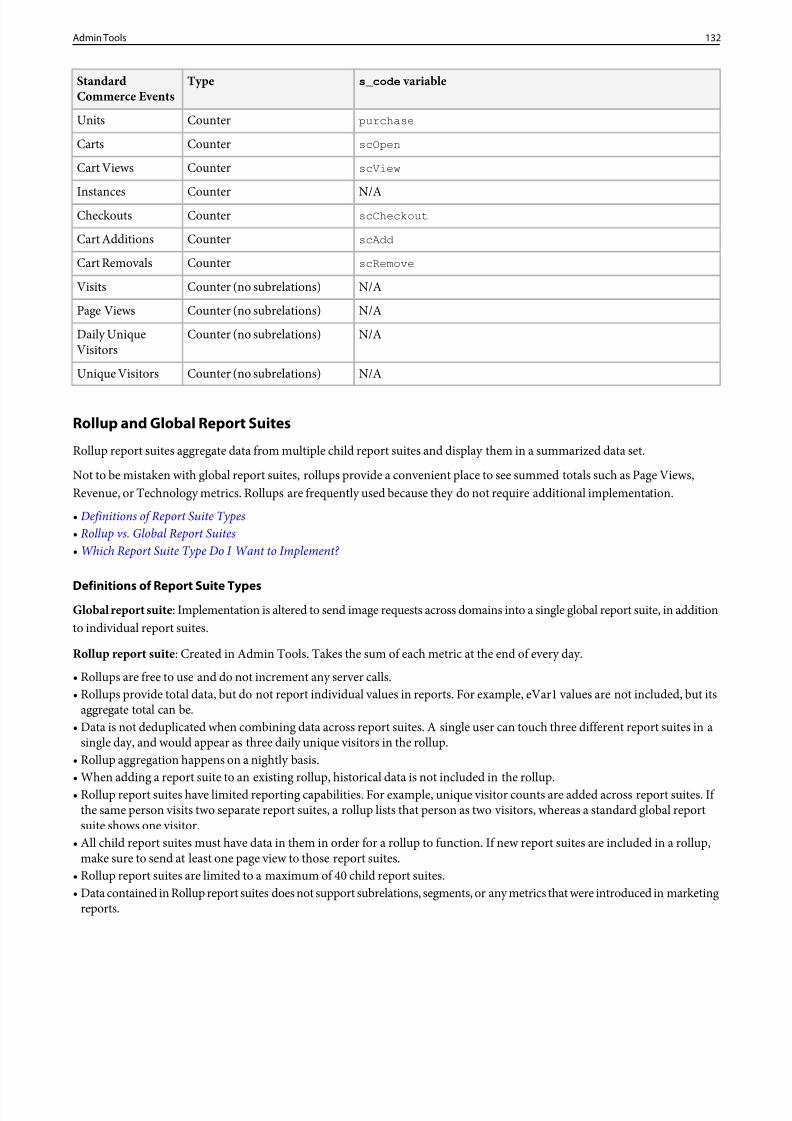
8/18/2019 Analytics Reference Adobe
http://slidepdf.com/reader/full/analytics-reference-adobe 132/332
s_code variableTypeStandardCommerce Events
purchaseCounterUnits
scOpenCounterCarts
scViewCounterCart Views
N/ACounterInstancesscCheckoutCounterCheckouts
scAddCounterCart Additions
scRemoveCounterCart Removals
N/ACounter (no subrelations)Visits
N/ACounter (no subrelations)Page Views
N/ACounter (no subrelations)Daily UniqueVisitors
N/ACounter (no subrelations)Unique Visitors
Rollup and Global Report Suites
Rollup report suites aggregate data from multiple child report suites and display them in a summarized data set.
Not to be mistaken with global report suites, rollups provide a convenient place to see summed totals such as Page Views,Revenue, or Technology metrics. Rollups are frequently used because they do not require additional implementation.
• Definitions of Report Suite Types• Rollup vs. Global Report Suites• Which Report Suite Type Do I Want to Implement?
Definitions of Report Suite TypesGlobal report suite : Implementation is altered to send image requests across domains into a single global report suite, in additionto individual report suites.
Rollup report suite : Created in Admin Tools. Takes the sum of each metric at the end of every day.
• Rollups are free to use and do not increment any server calls.• Rollups provide total data, but do not report individual values in reports. For example, eVar1 values are not included, but its
aggregate total can be.• Data is not deduplicated when combining data across report suites. A single user can touch three different report suites in a
single day, and would appear as three daily unique visitors in the rollup.• Rollup aggregation happens on a nightly basis.• When adding a report suite to an existing rollup, historical data is not included in the rollup.• Rollup report suites have limited reporting capabilities. For example, unique visitor counts are added across report suites. If
the same person visits two separate report suites, a rollup lists that person as two visitors, whereas a standard global reportsuite shows one visitor.
• All child report suites must have data in them in order for a rollup to function. If new report suites are included in a rollup,make sure to send at least one page view to those report suites.
• Rollup report suites are limited to a maximum of 40 child report suites.• Data contained in Rollup report suites does not support subrelations, segments, or any metrics that were introduced in marketing
reports.
132Admin Tools
8/18/2019 Analytics Reference Adobe
http://slidepdf.com/reader/full/analytics-reference-adobe 133/332
Rollup vs. Global Report Suites
Server calls: Global report suites increment secondary server calls, while rollups do not make any server calls whatsoever.
Implementation changes : Rollups do not require any implementation changes, while global report suites require an additionalreport suite ID be placed in the s_code.js file.
Duplication : Global report suites deduplicate unique visitors, while rollups do not. For example, if a user visits three of yourdomains in the same day, rollups would count three daily unique visitors. Global report suites would record one unique visitor.
Time frame : Rollups are only processed at midnight each night, while global report suites report data with standard latency.
Breadth : Global report suites can attribute credit to conversion variables between report suites, as well as provide pathing acrossreport suites. Rollups have no way to communicate between report suites.
Historical data : Rollups can aggregate historical data, while global report suites only report data from the point they wereimplemented.
Reports : Global report suites provide additional information on ALL reports implemented; rollups provide aggregate data ononly high-level reports.
Supported products : Rollups are not supported in data warehouse or ad hoc analysis. Marketing reports are limited to 40 child
report suites. Global report suites can be used across all products, and can have an unlimited number of child report suites.
Which Report Suite Type Do I Want to Implement?
When choosing whether to use rollups or global report suites, consider the following:
• Is the number of server calls critical to my organization? If keeping server calls limited is important, consider using rollups.Global report suites almost double the number of server calls made.
• Does reporting a high-level total of traffic across all suites suffice? If deduplicated visitors are a requirement, considerimplementing a global report suite.
• Are pathing and conversion/success events across domains important? If cross-site campaigns are heavily used, considerimplementing a global report suite.
• Is viewing total site data time-sensitive? Individual report suites still report near real time. If seeing report suite totals the next
day is adequate, rollups are recommended.• Is there a large amount of actionable historical data? Global report suites cannot report retroactively - rollups are recommendedif historical data is important.
• Is data warehouse and ad hoc analysis essential to supplement reporting? If so, a global report suite is recommended.
Neither choice affects individual report suites. Carefully consider the pros and cons before determining which your organizationprefers.
Create a rollup report suite
Steps that describe how to create a rollup report suite.
1. ClickAnalytics > Admin > Report Suites .
2. In Report Suite Groups , clickAdd next to the Rollups heading.3. In the Create a New Rollup dialog box, provide the following information:
Report Suite ID: The rollup's report suite ID.
Report Suite Title: The report suite title that appears in the Site menu.
Time Zone: The time zone where data is reported.
4. ClickCreate Rollup .
133Admin Tools
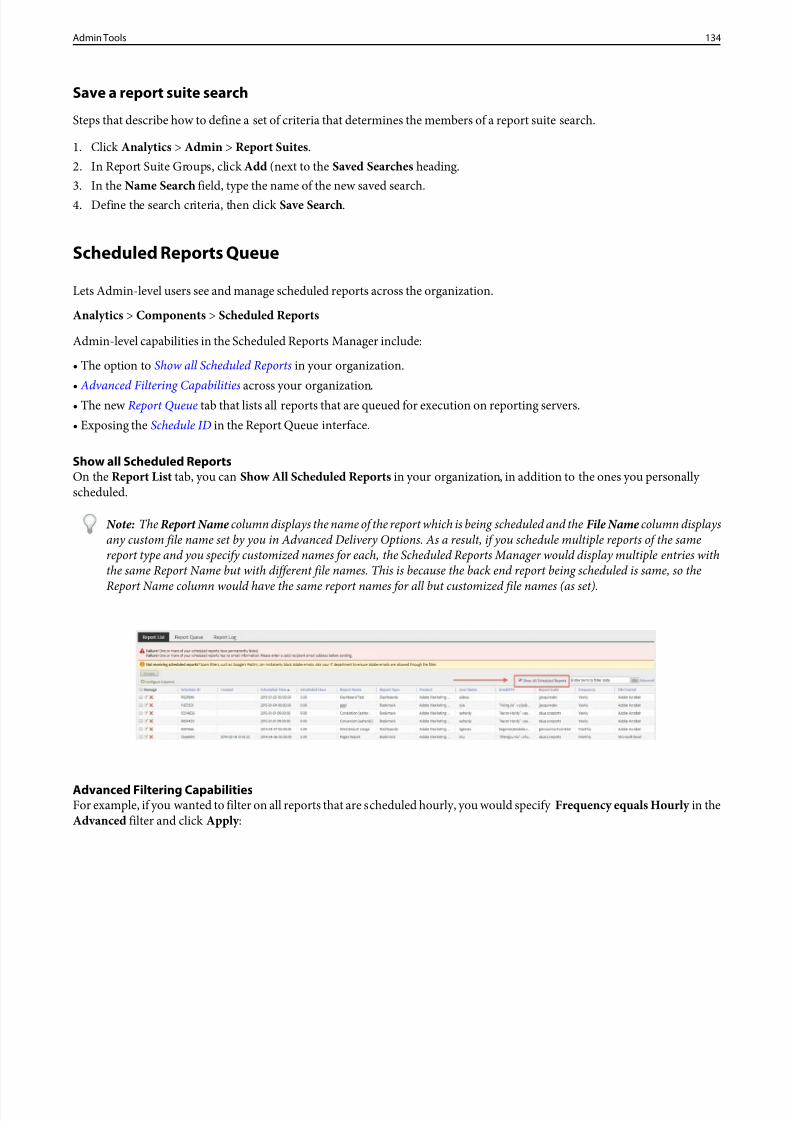
8/18/2019 Analytics Reference Adobe
http://slidepdf.com/reader/full/analytics-reference-adobe 134/332
Save a report suite search
Steps that describe how to define a set of criteria that determines the members of a report suite search.
1. ClickAnalytics > Admin > Report Suites .2. In Report Suite Groups, clickAdd (next to the Saved Searches heading.3. In the Name Search field, type the name of the new saved search.4. Define the search criteria, then clickSave Search.
Scheduled Reports Queue
Lets Admin-level users see and manage scheduled reports across the organization.
Analytics > Components > Scheduled Reports
Admin-level capabilities in the Scheduled Reports Manager include:
• The option to Show all Scheduled Reports in your organization.• Advanced Filtering Capabilities across your organization.• The new Report Queue tab that lists all reports that are queued for execution on reporting servers.• Exposing the Schedule ID in the Report Queue interface.
Show all Scheduled ReportsOn the Report List tab, you can Show All Scheduled Reports in your organization, in addition to the ones you personally scheduled.
Note: The Report Name column displays the name of the report which is being scheduled and the File Name column displaysany custom file name set by you in Advanced Delivery Options. As a result, if you schedule multiple reports of the samereport type and you specify customized names for each, the Scheduled Reports Manager would display multiple entries withthe same Report Name but with different file names. This is because the back end report being scheduled is same, so the
Report Name column would have the same report names for all but customized file names (as set).
Advanced Filtering CapabilitiesFor example, if you wanted to filter on all reports that are scheduled hourly, you would specifyFrequency equals Hourly in theAdvanced filter and clickApply :
134Admin Tools
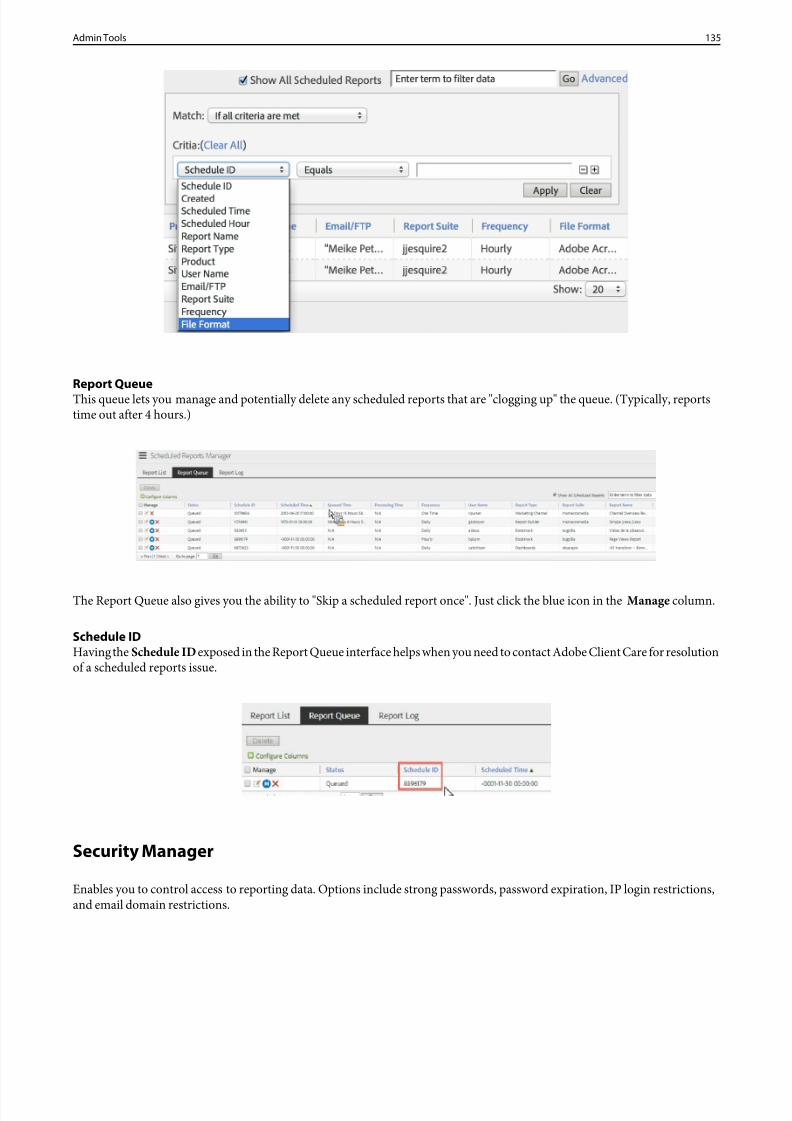
8/18/2019 Analytics Reference Adobe
http://slidepdf.com/reader/full/analytics-reference-adobe 135/332
Report QueueThis queue lets you manage and potentially delete any scheduled reports that are "clogging up" the queue. (Typically, reportstime out after 4 hours.)
The Report Queue also gives you the ability to "Skip a scheduled report once". Just click the blue icon in theManage column.
Schedule IDHaving the Schedule ID exposed in the Report Queue interface helps when you need to contact Adobe Client Care for resolutionof a scheduled reports issue.
Security Manager
Enables you to control access to reporting data. Options include strong passwords, password expiration, IP login restrictions,and email domain restrictions.
135Admin Tools
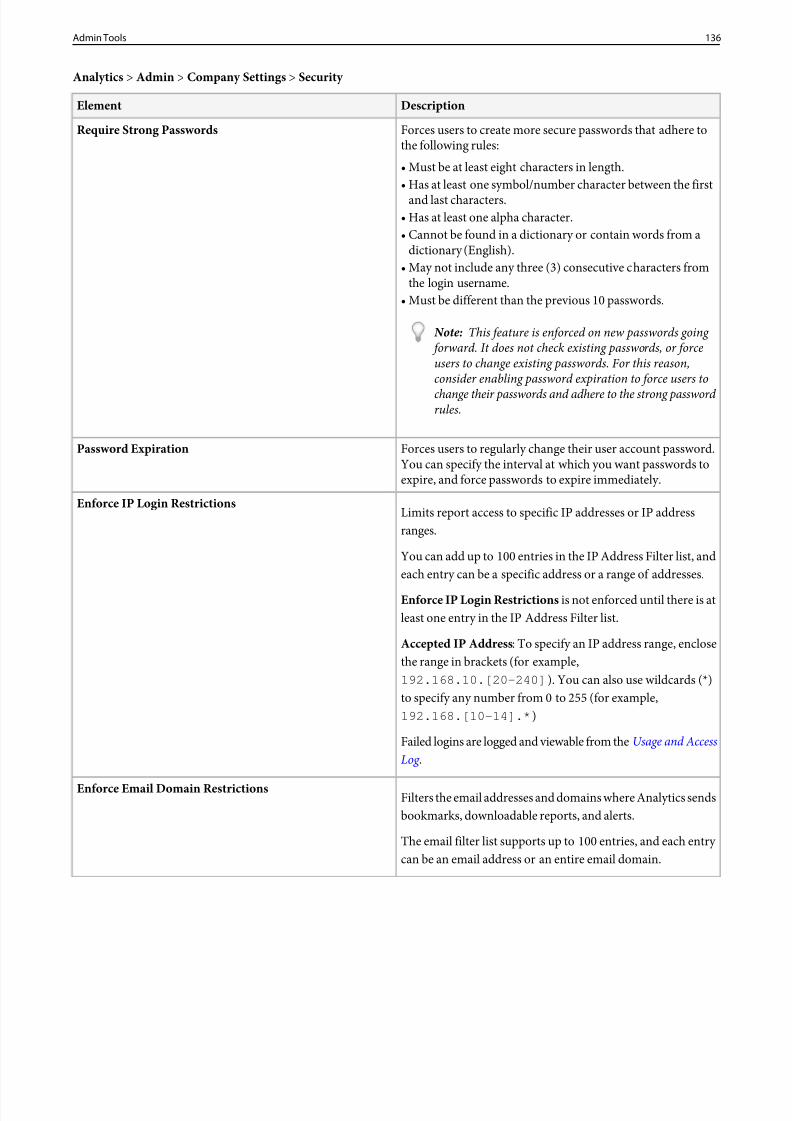
8/18/2019 Analytics Reference Adobe
http://slidepdf.com/reader/full/analytics-reference-adobe 136/332
Analytics > Admin > Company Settings > Security
DescriptionElement
Forces users to create more secure passwords that adhere tothe following rules:
Require Strong Passwords
• Must be at least eight characters in length.• Has at least one symbol/number character between the first
and last characters.• Has at least one alpha character.• Cannot be found in a dictionary or contain words from a
dictionary (English).• May not include any three (3) consecutive characters from
the login username.• Must be different than the previous 10 passwords.
Note: This feature is enforced on new passwords going forward. It does not check existing passwords, or forceusers to change existing passwords. For this reason,consider enabling password expiration to force users tochange their passwords and adhere to the strong password rules.
Forces users to regularly change their user account password.You can specify the interval at which you want passwords toexpire, and force passwords to expire immediately.
Password Expiration
Limits report access to specific IP addresses or IP addressranges.
Enforce IP Login Restrictions
You can add up to 100 entries in the IP Address Filter list, andeach entry can be a specific address or a range of addresses.
Enforce IP Login Restrictions is not enforced until there is atleast one entry in the IP Address Filter list.
Accepted IP Address : To specify an IP address range, enclosethe range in brackets (for example,192.168.10.[20-240] ). You can also use wildcards (*)to specify any number from 0 to 255 (for example,192.168.[10-14].* )
Failed logins are logged and viewable from the Usage and AccessLog .
Filters the email addresses and domains where Analytics sendsbookmarks, downloadable reports, and alerts.
Enforce Email Domain Restrictions
The email filter list supports up to 100 entries, and each entry can be an email address or an entire email domain.
136Admin Tools
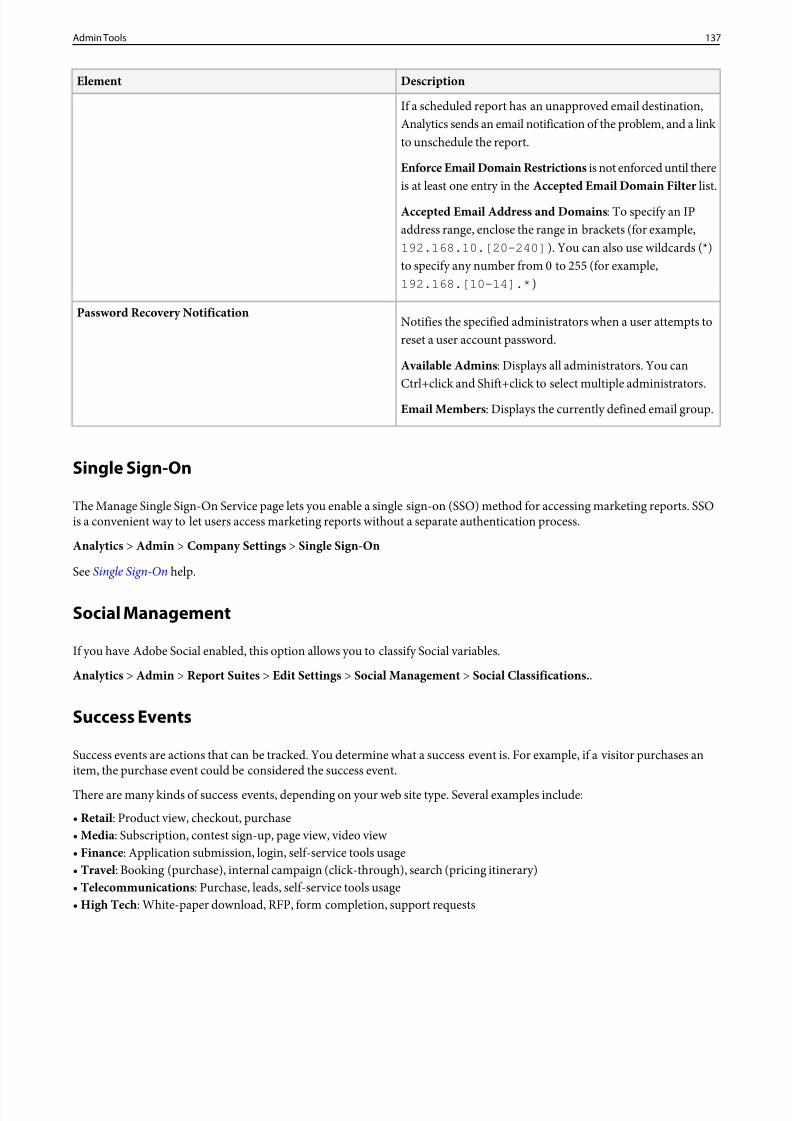
8/18/2019 Analytics Reference Adobe
http://slidepdf.com/reader/full/analytics-reference-adobe 137/332
DescriptionElement
If a scheduled report has an unapproved email destination,Analytics sends an email notification of the problem, and a link to unschedule the report.
Enforce Email Domain Restrictions is not enforced until thereis at least one entry in the Accepted Email Domain Filter list.
Accepted Email Address and Domains : To specify an IPaddress range, enclose the range in brackets (for example,192.168.10.[20-240] ). You can also use wildcards (*)to specify any number from 0 to 255 (for example,192.168.[10-14].* )
Notifies the specified administrators when a user attempts toreset a user account password.
Password Recovery Notification
Available Admins : Displays all administrators. You canCtrl+click and Shift+click to select multiple administrators.
Email Members : Displays the currently defined email group.
Single Sign-On
The Manage Single Sign-On Service page lets you enable a single sign-on (SSO) method for accessing marketing reports. SSOis a convenient way to let users access marketing reports without a separate authentication process.
Analytics > Admin > Company Settings > Single Sign-On
SeeSingle Sign-On help.
Social Management
If you have Adobe Social enabled, this option allows you to classify Social variables.
Analytics > Admin > Report Suites > Edit Settings > Social Management > Social Classifications. .
Success Events
Success events are actions that can be tracked. You determine what a success event is. For example, if a visitor purchases anitem, the purchase event could be considered the success event.
There are many kinds of success events, depending on your web site type. Several examples include:
• Retail: Product view, checkout, purchase• Media: Subscription, contest sign-up, page view, video view • Finance : Application submission, login, self-service tools usage• Travel : Booking (purchase), internal campaign (click-through), search (pricing itinerary)• Telecommunications : Purchase, leads, self-service tools usage• High Tech : White-paper download, RFP, form completion, support requests
137Admin Tools
8/18/2019 Analytics Reference Adobe
http://slidepdf.com/reader/full/analytics-reference-adobe 138/332
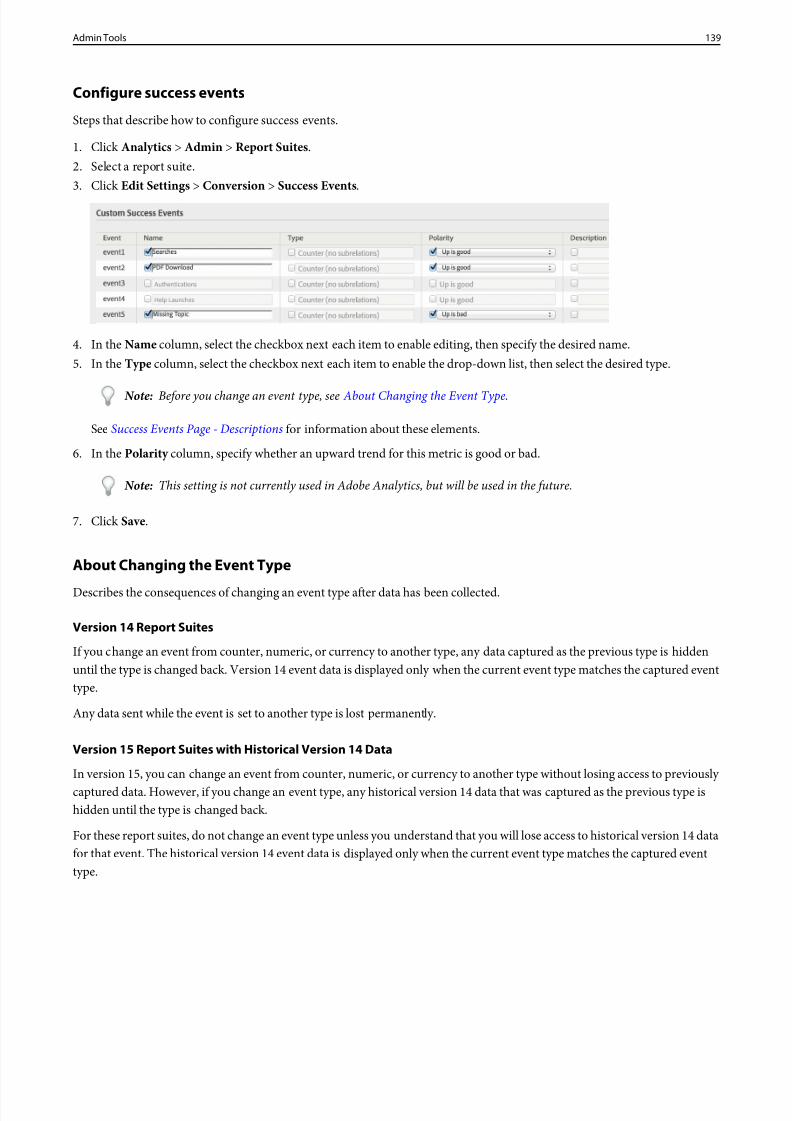
8/18/2019 Analytics Reference Adobe
http://slidepdf.com/reader/full/analytics-reference-adobe 139/332
Configure success events
Steps that describe how to configure success events.
1. ClickAnalytics > Admin > Report Suites .2. Select a report suite.3. ClickEdit Settings > Conversion > Success Events.
4. In the Name column, select the checkbox next each item to enable editing, then specify the desired name.5. In the Type column, select the checkbox next each item to enable the drop-down list, then select the desired type.
Note: Before you change an event type, see About Changing the Event Type.
SeeSuccess Events Page - Descriptions for information about these elements.
6. In the Polarity column, specify whether an upward trend for this metric is good or bad.
Note: This setting is not currently used in Adobe Analytics, but will be used in the future.
7. ClickSave.
About Changing the Event Type
Describes the consequences of changing an event type after data has been collected.
Version 14 Report Suites
If you change an event from counter, numeric, or currency to another type, any data captured as the previous type is hiddenuntil the type is changed back. Version 14 event data is displayed only when the current event type matches the captured eventtype.
Any data sent while the event is set to another type is lost permanently.
Version 15 Report Suites with Historical Version 14 Data
In version 15, you can change an event from counter, numeric, or currency to another type without losing access to previously captured data. However, if you change an event type, any historical version 14 data that was captured as the previous type ishidden until the type is changed back.
For these report suites, do not change an event type unless you understand that you will lose access to historical version 14 datafor that event. The historical version 14 event data is displayed only when the current event type matches the captured eventtype.
139Admin Tools
8/18/2019 Analytics Reference Adobe
http://slidepdf.com/reader/full/analytics-reference-adobe 140/332
8/18/2019 Analytics Reference Adobe
http://slidepdf.com/reader/full/analytics-reference-adobe 141/332
Enable traffic variable reports
Steps that describe how to add and enable traffic variable reports.
1. ClickAnalytics > Admin > Report Suites , then select a report suite.2. ClickEdit Settings > Traffic > Traffic Variables .3. ClickAdd New , then name the report.4. ClickEnable, then click Save.
Traffic
The Traffic Management page lets you specify expected traffic volume changes. These settings let Adobe allocate the appropriateresources to ensure that your traffic can be tracked and processed in a timely manner.
To access traffic settings:
1. ClickAnalytics > Admin > Report Suites , then select a report suite.2. ClickEdit Settings > Traffic > <selection>.
SeeTraffic Classifications.
Traffic Management
The Traffic Management page lets you specify expected traffic volume changes. These settings let Adobe allocate the appropriateresources to ensure that your traffic can be tracked and processed in a timely manner.
To access Traffic Management :
1. ClickAnalytics > Admin > Report Suites , then select a report suite.2. ClickEdit Settings > Traffic Management > <selection>.
Schedule a traffic spike
The Schedule Spike section lets you alert Adobe of temporary traffic spikes so that appropriate resources can be allocated tohandle them.
Please read the information about Required Lead Time for Traffic Increases before you schedule a traffic spike.
1. ClickAnalytics > Admin > Report Suites .2. Select a report suite.3. ClickEdit Settings > Traffic Management > Schedule Spike.4. In the Spike Start Date field, specify the date when you expect the traffic spike to start.5. In the Spike End Date field, specify the date when you expect the traffic spike to end.6. In the Expected Daily Page Views During Spike field, specify the total expected daily page views during the traffic spike
period, then click Submit .
Make sure to specify the total expected page views, not just the additional page views.
Note: To schedule a traffic spike, include a phone number in your user contact information so that Adobe can contact you with questions, if needed.
141Admin Tools
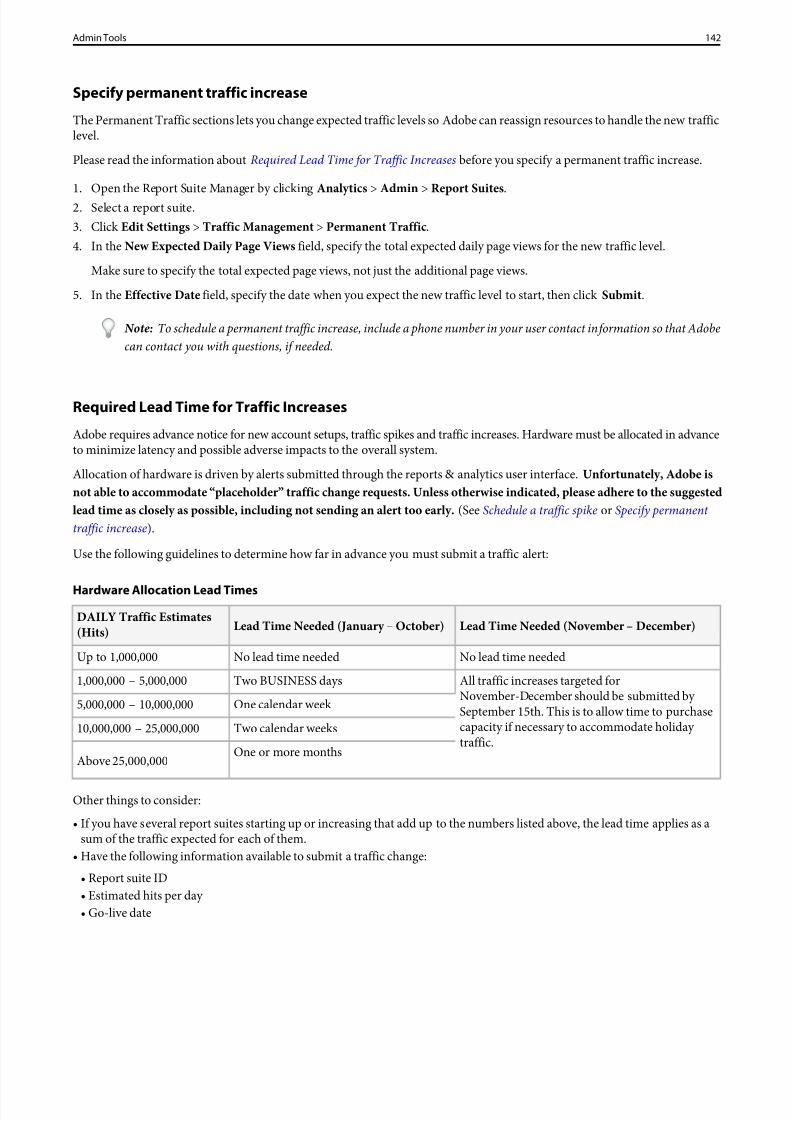
8/18/2019 Analytics Reference Adobe
http://slidepdf.com/reader/full/analytics-reference-adobe 142/332
Specify permanent traffic increase
The Permanent Traffic sections lets you change expected traffic levels so Adobe can reassign resources to handle the new trafficlevel.
Please read the information about Required Lead Time for Traffic Increases before you specify a permanent traffic increase.
1. Open the Report Suite Manager by clickingAnalytics > Admin > Report Suites .2. Select a report suite.3. ClickEdit Settings > Traffic Management > Permanent Traffic .4. In the New Expected Daily Page Views field, specify the total expected daily page views for the new traffic level.
Make sure to specify the total expected page views, not just the additional page views.
5. In the Effective Date field, specify the date when you expect the new traffic level to start, then clickSubmit .
Note: To schedule a permanent traffic increase, include a phone number in your user contact information so that Adobecan contact you with questions, if needed.
Required Lead Time for Traffic Increases
Adobe requires advance notice for new account setups, traffic spikes and traffic increases. Hardware must be allocated in advanceto minimize latency and possible adverse impacts to the overall system.
Allocation of hardware is driven by alerts submitted through the reports & analytics user interface.Unfortunately, Adobe isnot able to accommodate “ placeholder ” traffic change requests. Unless otherwise indicated, please adhere to the suggestedlead time as closely as possible, including not sending an alert too early. (SeeSchedule a traffic spike or Specify permanent traffic increase).
Use the following guidelines to determine how far in advance you must submit a traffic alert:
Hardware Allocation Lead Times
Lead Time Needed (November – December)Lead Time Needed (January – October)DAILY Traffic Estimates(Hits)
No lead time neededNo lead time neededUp to 1,000,000
All traffic increases targeted forNovember-December should be submitted by
Two BUSINESS days1,000,000– 5,000,000
One calendar week 5,000,000– 10,000,000 September 15th. This is to allow time to purchaseTwo calendar weeks10,000,000– 25,000,000 capacity if necessary to accommodate holiday
traffic.One or more months
Above 25,000,000
Other things to consider:
• If you have several report suites starting up or increasing that add up to the numbers listed above, the lead time applies as asum of the traffic expected for each of them.
• Have the following information available to submit a traffic change:• Report suite ID• Estimated hits per day • Go-live date
142Admin Tools
8/18/2019 Analytics Reference Adobe
http://slidepdf.com/reader/full/analytics-reference-adobe 143/332
• Client Alerts are also needed when traffic decreases are or a report suite is deprecated.
Hardware De-Allocation Due to Unrealized Traffic
Hardware for new accounts, traffic spikes and traffic increases will be de-allocated if the projected traffic in the client alert doesnot materialize within 4 weeks of the“Go live date”. If the traffic is still anticipated, a new client alert must be generated as atraffic increase.
Unique Visitor Variable
Designates an eVar to contain your unique visitor identifier. This variable lets you report on customer activity using your ownunique identifier.
Specify the Unique Visitor variable
Steps that describe how to designate which eVar contains your visitor identifier.
1. ClickAnalytics > Admin > Report Suites .2. Select a report suite.
3. ClickEdit Settings > Conversion > Unique Visitor Variable .4. Select theAvailable eVars checkbox to enable the drop-down list.5. Select an eVar from the drop-down list, then click Save.
Use Case - Extracting Visitor IDs
Data warehouse provides a feature that allows you to extract a list of visitor IDs. These IDs are not cookie IDs, but IDs that youcapture in one of your conversion variables. Although there are other ways to get at this information, the following example isa shortcut to generating a data warehouse request.
For example, assume that your business sends marketing e-mails to customers and prospects. Each of these e-mail recipientshas a unique ID in your e-mail system (such asEMAIL Contact ID). You set up your e-mails so that when contacts receive ane-mail and click one of its links, the visitor arrives at your website with a campaign ID and a unique EMAIL Contact ID. Forexample, your e-mail link may resolve to:http://www.test.com/?cid=springmailblast&mid=1363660158
Setting these in conversion variables (eVars) allows you to see how each e-mail performed (through the campaign ID) and how often each e-mail recipient visited the site (through the EMAIL Contact ID).
Assume you are capturing these IDs. Most marketers want to segment their website behavior and then see if they can re-marketto those who meet certain criteria. For example, you may want to send a re-marketing e-mail to all e-mail recipients who cameto your site from the e-mail and viewed (or completed) a website form. To do this, find a way to identify the EMAIL ContactIDs of those completing the specific form.
One way to do this is to use a Conversion Subrelation report to break down the Form ID eVar value by the EMAIL Contact IDeVar. However, a pre-built feature is available to do this using Data Warehouse. This feature allows you to tell which eVar storesyour Unique User IDs (EMAIL Contact ID in this case) and allows you to easily extract those IDs using data warehouse. By using this feature, you can automatically create a data warehouse request that pulls the Unique Visitor IDs for which you areinterested.
143Admin Tools
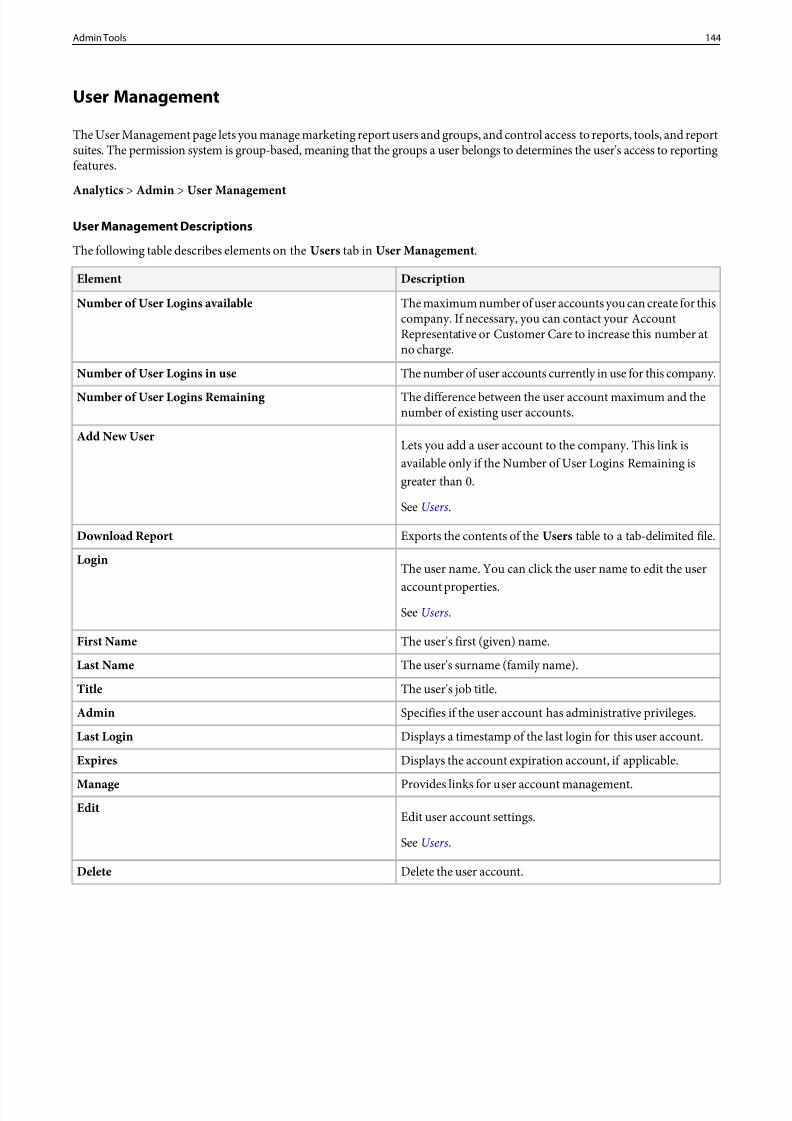
8/18/2019 Analytics Reference Adobe
http://slidepdf.com/reader/full/analytics-reference-adobe 144/332
User Management
The User Management page lets you manage marketing report users and groups, and control access to reports, tools, and reportsuites. The permission system is group-based, meaning that the groups a user belongs to determines the user's access to reportingfeatures.
Analytics > Admin > User Management
User Management Descriptions
The following table describes elements on theUsers tab in User Management .
DescriptionElement
The maximum number of user accounts you can create for thiscompany. If necessary, you can contact your Account
Number of User Logins available
Representative or Customer Care to increase this number atno charge.
The number of user accounts currently in use for this company.Number of User Logins in use
The difference between the user account maximum and thenumber of existing user accounts.
Number of User Logins Remaining
Lets you add a user account to the company. This link isavailable only if the Number of User Logins Remaining isgreater than 0.
Add New User
SeeUsers.
Exports the contents of the Users table to a tab-delimited file.Download Report
The user name. You can click the user name to edit the user
account properties.
Login
SeeUsers.
The user's first (given) name.First Name
The user's surname (family name).Last Name
The user's job title.Title
Specifies if the user account has administrative privileges.Admin
Displays a timestamp of the last login for this user account.Last Login
Displays the account expiration account, if applicable.Expires
Provides links for user account management.Manage
Edit user account settings.Edit
SeeUsers.
Delete the user account.Delete
144Admin Tools
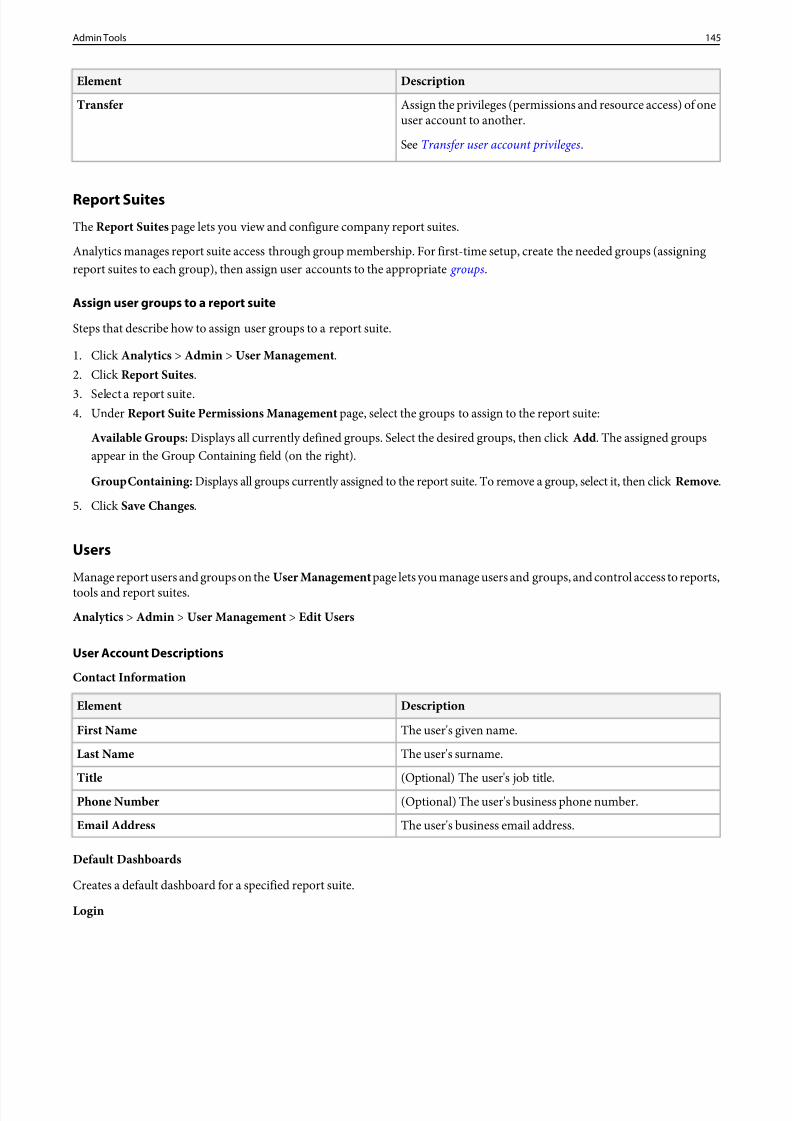
8/18/2019 Analytics Reference Adobe
http://slidepdf.com/reader/full/analytics-reference-adobe 145/332
DescriptionElement
Assign the privileges (permissions and resource access) of oneuser account to another.
SeeTransfer user account privileges.
Transfer
Report Suites
The Report Suites page lets you view and configure company report suites.
Analytics manages report suite access through group membership. For first-time setup, create the needed groups (assigningreport suites to each group), then assign user accounts to the appropriate groups.
Assign user groups to a report suite
Steps that describe how to assign user groups to a report suite.
1. ClickAnalytics > Admin > User Management .2. ClickReport Suites .
3. Select a report suite.4. Under Report Suite Permissions Management page, select the groups to assign to the report suite:
Available Groups: Displays all currently defined groups. Select the desired groups, then clickAdd. The assigned groupsappear in the Group Containing field (on the right).
Group Containing: Displays all groups currently assigned to the report suite. To remove a group, select it, then clickRemove.
5. ClickSave Changes.
Users
Manage report users and groups on the User Management page lets you manage users and groups, and control access to reports,tools and report suites.
Analytics > Admin > User Management > Edit Users
User Account Descriptions
Contact Information
DescriptionElement
The user's given name.First Name
The user's surname.Last Name
(Optional) The user's job title.Title
(Optional) The user's business phone number.Phone Number
The user's business email address.Email Address
Default Dashboards
Creates a default dashboard for a specified report suite.
Login
145Admin Tools
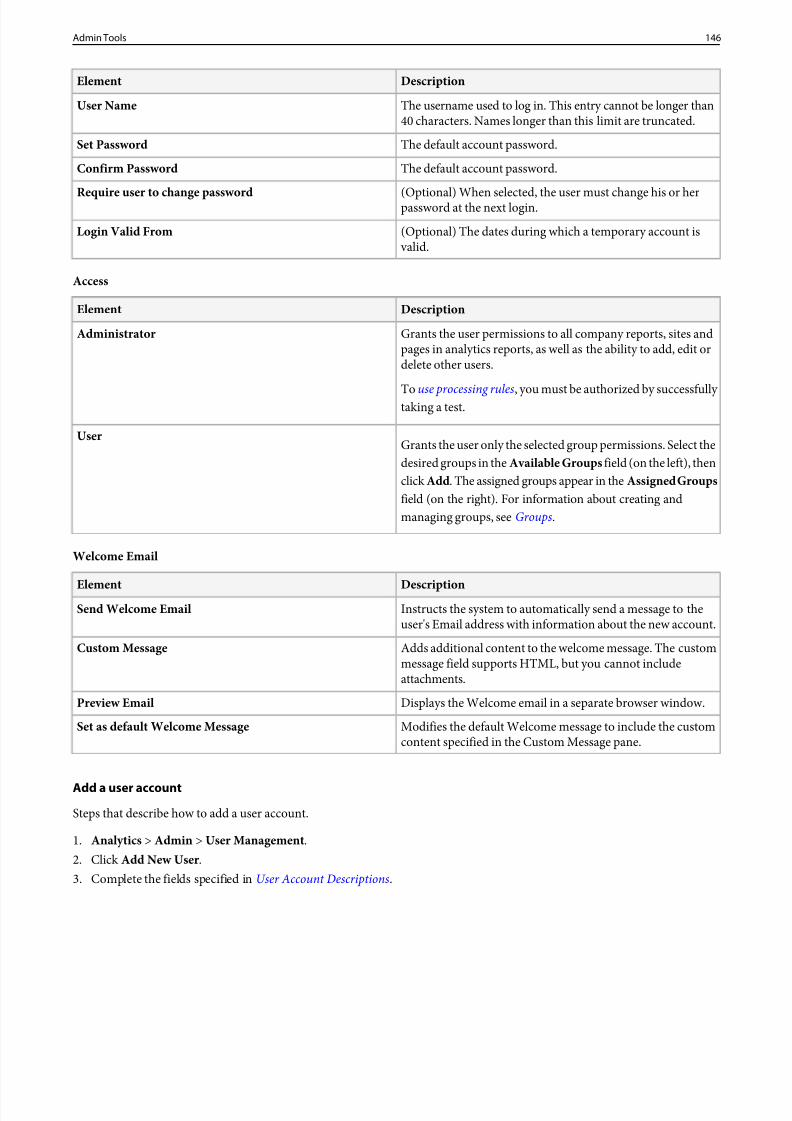
8/18/2019 Analytics Reference Adobe
http://slidepdf.com/reader/full/analytics-reference-adobe 146/332
DescriptionElement
The username used to log in. This entry cannot be longer than40 characters. Names longer than this limit are truncated.
User Name
The default account password.Set Password
The default account password.Confirm Password
(Optional) When selected, the user must change his or herpassword at the next login.Require user to change password
(Optional) The dates during which a temporary account is valid.
Login Valid From
Access
DescriptionElement
Grants the user permissions to all company reports, sites andpages in analytics reports, as well as the ability to add, edit ordelete other users.
To use processing rules, you must be authorized by successfully taking a test.
Administrator
Grants the user only the selected group permissions. Select thedesired groups in the Available Groups field (on the left), then
User
clickAdd. The assigned groups appear in theAssigned Groupsfield (on the right). For information about creating andmanaging groups, see Groups.
Welcome Email
DescriptionElementInstructs the system to automatically send a message to theuser's Email address with information about the new account.
Send Welcome Email
Adds additional content to the welcome message. The custommessage field supports HTML, but you cannot includeattachments.
Custom Message
Displays the Welcome email in a separate browser window.Preview Email
Modifies the default Welcome message to include the customcontent specified in the Custom Message pane.
Set as default Welcome Message
Add a user account
Steps that describe how to add a user account.
1. Analytics > Admin > User Management .2. ClickAdd New User.3. Complete the fields specified inUser Account Descriptions.
146Admin Tools
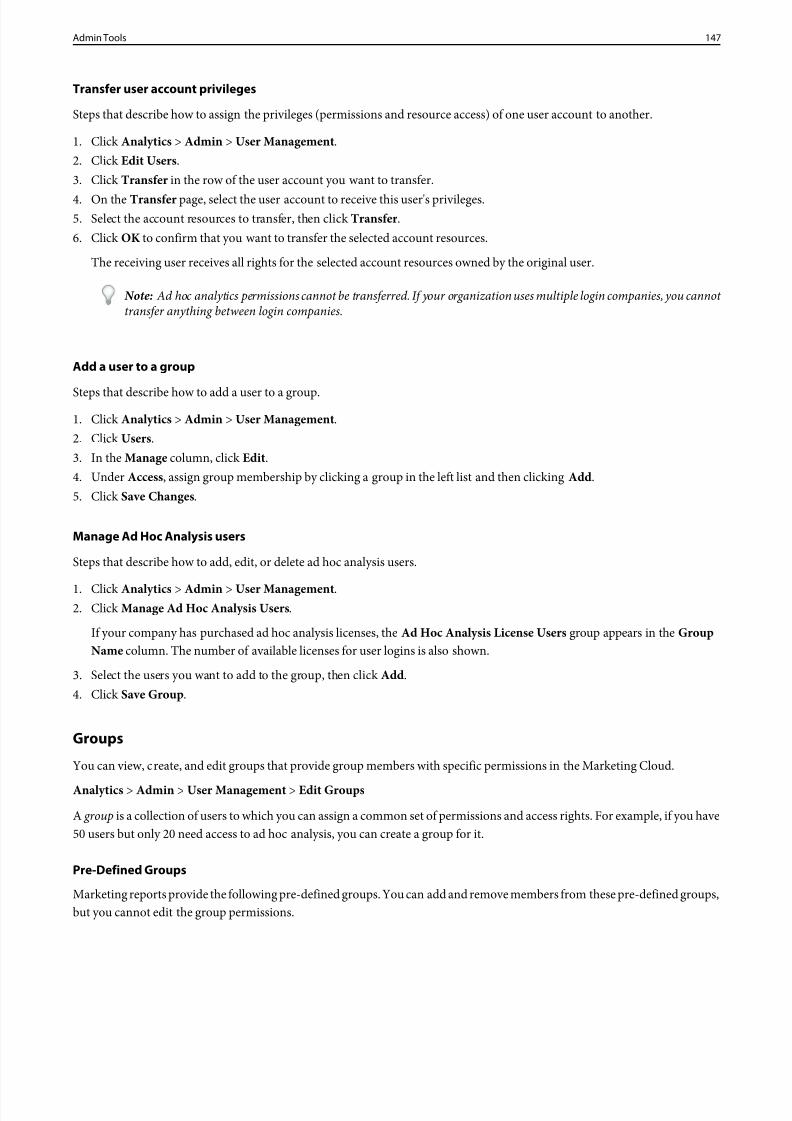
8/18/2019 Analytics Reference Adobe
http://slidepdf.com/reader/full/analytics-reference-adobe 147/332
Transfer user account privileges
Steps that describe how to assign the privileges (permissions and resource access) of one user account to another.
1. ClickAnalytics > Admin > User Management .2. ClickEdit Users .3. ClickTransfer in the row of the user account you want to transfer.
4. On the Transfer page, select the user account to receive this user's privileges.5. Select the account resources to transfer, then clickTransfer .6. ClickOK to confirm that you want to transfer the selected account resources.
The receiving user receives all rights for the selected account resources owned by the original user.
Note: Ad hoc analytics permissions cannot be transferred. If your organization uses multiple login companies, you cannot transfer anything between login companies.
Add a user to a group
Steps that describe how to add a user to a group.1. ClickAnalytics > Admin > User Management .2. ClickUsers.3. In the Manage column, clickEdit .4. Under Access, assign group membership by clicking a group in the left list and then clickingAdd.5. ClickSave Changes.
Manage Ad Hoc Analysis users
Steps that describe how to add, edit, or delete ad hoc analysis users.
1. ClickAnalytics > Admin > User Management .2. ClickManage Ad Hoc Analysis Users .
If your company has purchased ad hoc analysis licenses, theAd Hoc Analysis License Users group appears in the GroupName column. The number of available licenses for user logins is also shown.
3. Select the users you want to add to the group, then clickAdd.4. ClickSave Group.
Groups
You can view, create, and edit groups that provide group members with specific permissions in the Marketing Cloud.
Analytics > Admin > User Management > Edit Groups
A group is a collection of users to which you can assign a common set of permissions and access rights. For example, if you have50 users but only 20 need access to ad hoc analysis, you can create a group for it.
Pre-Defined Groups
Marketing reports provide the following pre-defined groups. You can add and remove members from these pre-defined groups,but you cannot edit the group permissions.
147Admin Tools
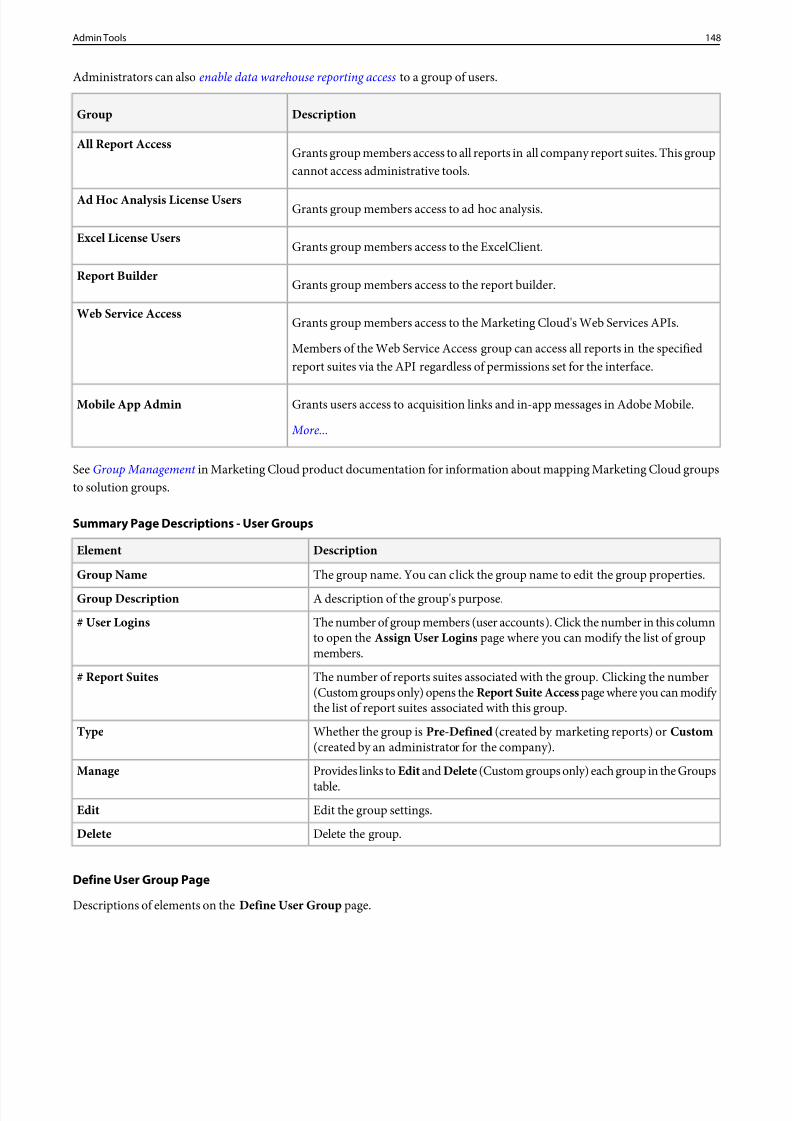
8/18/2019 Analytics Reference Adobe
http://slidepdf.com/reader/full/analytics-reference-adobe 148/332
Administrators can also enable data warehouse reporting access to a group of users.
DescriptionGroup
Grants group members access to all reports in all company report suites. This groupcannot access administrative tools.
All Report Access
Grants group members access to ad hoc analysis.Ad Hoc Analysis License Users
Grants group members access to the ExcelClient.Excel License Users
Grants group members access to the report builder.Report Builder
Grants group members access to the Marketing Cloud's Web Services APIs.Web Service Access
Members of the Web Service Access group can access all reports in the specifiedreport suites via the API regardless of permissions set for the interface.
Grants users access to acquisition links and in-app messages in Adobe Mobile.Mobile App Admin
More...
SeeGroup Management in Marketing Cloud product documentation for information about mapping Marketing Cloud groupsto solution groups.
Summary Page Descriptions - User Groups
DescriptionElement
The group name. You can click the group name to edit the group properties.Group Name
A description of the group's purpose.Group Description
The number of group members (user accounts). Click the number in this columnto open the Assign User Logins page where you can modify the list of groupmembers.
# User Logins
The number of reports suites associated with the group. Clicking the number(Custom groups only) opens the Report Suite Access page where you can modify the list of report suites associated with this group.
# Report Suites
Whether the group is Pre-Defined (created by marketing reports) or Custom(created by an administrator for the company).
Type
Provides links toEdit and Delete (Custom groups only) each group in the Groupstable.
Manage
Edit the group settings.Edit
Delete the group.Delete
Define User Group Page
Descriptions of elements on the Define User Group page.
148Admin Tools
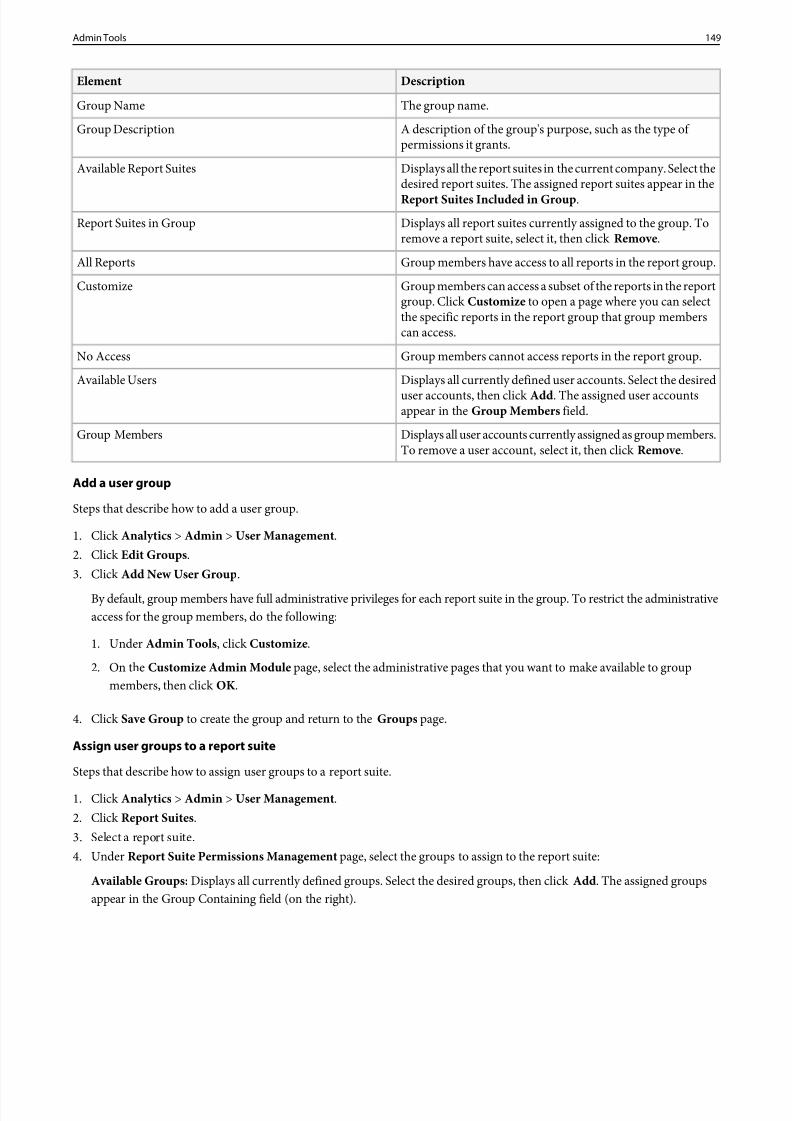
8/18/2019 Analytics Reference Adobe
http://slidepdf.com/reader/full/analytics-reference-adobe 149/332
8/18/2019 Analytics Reference Adobe
http://slidepdf.com/reader/full/analytics-reference-adobe 150/332
Group Containing: Displays all groups currently assigned to the report suite. To remove a group, select it, then clickRemove.
5. ClickSave Changes.
Manage access to metrics and reports
Steps that let you hide metrics and reports based on user accounts.
For example, if your company uses a calculated metric in place of a standard metric, you can disable access to the Standard
metric using Report Access.
1. ClickAdmin Tools > User Management .2. ClickGroups .3. Click a group name.4. Under Report Access page, clickCustomize .5. On Define Report Access, enable the metrics and reports that members of this group can access.6. ClickOK.7. ClickSave Group.
New Marketing Cloud UsersWhen a new Analytics user is created in the Marketing Cloud (marketing.adobe.com), he or she is automatically added to theNew Marketing Cloud Users group. The New Marketing Cloud Users group has no privileges. After account creation, you mustmove users from this group to another Analytics group according to the privilege level you want assigned.
If a user attempts to launch marketing reports & analytics before he or she is added to a different group, an "Access for thisaccount is unavailable" error is displayed.
To provision these users, see Add a user to a group . After you add these users to a different group, we recommend removingthese users from the New Marketing Cloud Users groups. This helps you keep track of which users have additional group accessand which users still need to be provisioned.
Email usersSteps that describe how to send an email message to all users in your company.
1. ClickAnalytics > Admin > User Management .2. ClickEmail Users .3. Select theAdministrators Only check box to restrict email to administrators only.
By default, messages are sent to all users within your company.
4. Complete the following fields:
From: This field is automatically populated with your email address.
Subject: Specify the text that will appear in the email message's subject line.
Body: Type the text that will appear in the email message's body.
5. ClickSend Message Now .
Video Management
You can designate a set of Custom Conversion Variables (eVars) and Custom Events for use in tracking and reporting on video.
150Admin Tools
8/18/2019 Analytics Reference Adobe
http://slidepdf.com/reader/full/analytics-reference-adobe 151/332
Analytics > Admin > Report Suites > Edit Settings > Video Management .
See Measuring Video in Analytics.
Web Services
The Web Services APIs provide programmatic access to marketing reports and other Suite services that let you duplicate andaugment functionality available through the Analytics interface.Analytics > Admin > Company Settings > Web Services
DescriptionElement
In User Management > Groups you can update the Web Service Access group to include thoseusers that need access to the Web Services APIs.
Manage Web Services
WSDL: Download the Web Services API WSDL for Web services developers.
Developer Connection: Visit the Developer Connection (http://developer.omniture.com), whichprovides documentation, sample code, and forums related to the Web Services APIs. Click Web
Services APIs Overview for more information.When using SOAP, if your XML parser has trouble with illegal or invalid characters in responsesto Web Services API calls, select one or both of the following options to have Analytics
Filtering Options
automatically filter the response output. Typically, this is an issue only with double-byte languages(Japanese, Chinese, Korean).
View Web Services access information by user. This table includes the Web Services Usernameand Shared Secret, which users must use as part of the authentication process when making WebServices calls.
API Access Information
View information about the number of Web Services tokens used by your company during thecurrent calendar month.
Token Usage
151Admin Tools
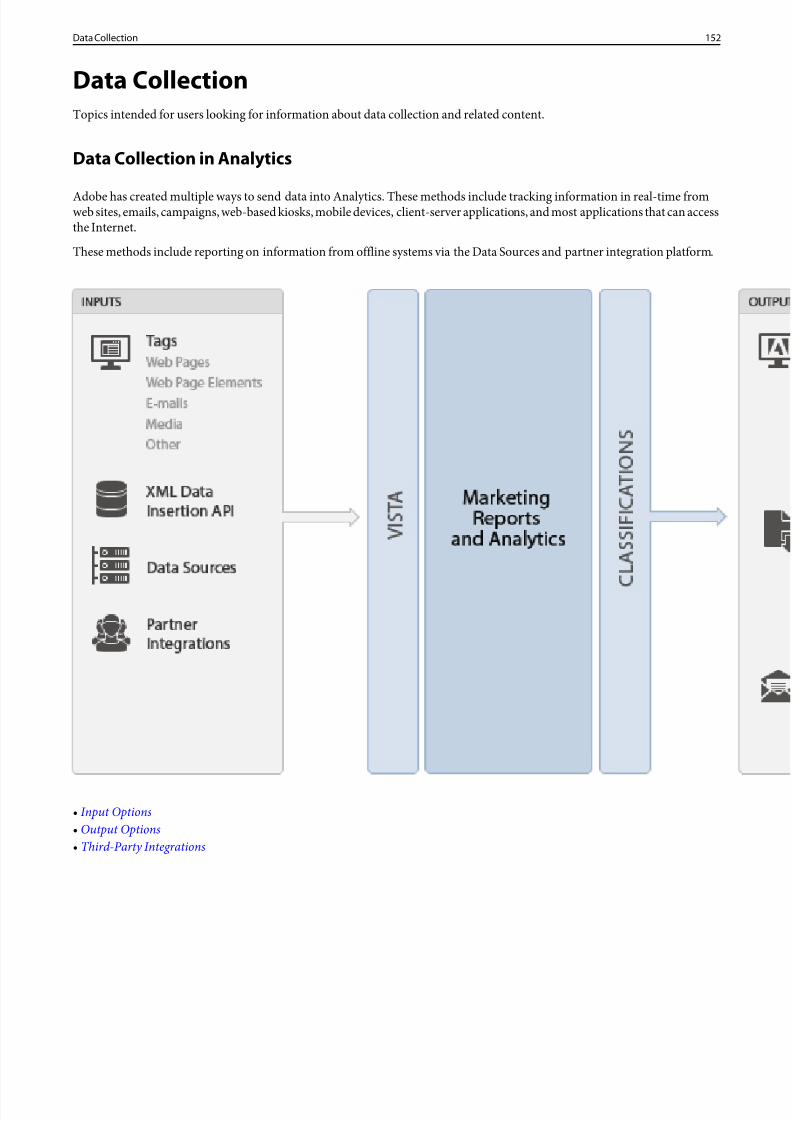
8/18/2019 Analytics Reference Adobe
http://slidepdf.com/reader/full/analytics-reference-adobe 152/332
8/18/2019 Analytics Reference Adobe
http://slidepdf.com/reader/full/analytics-reference-adobe 153/332
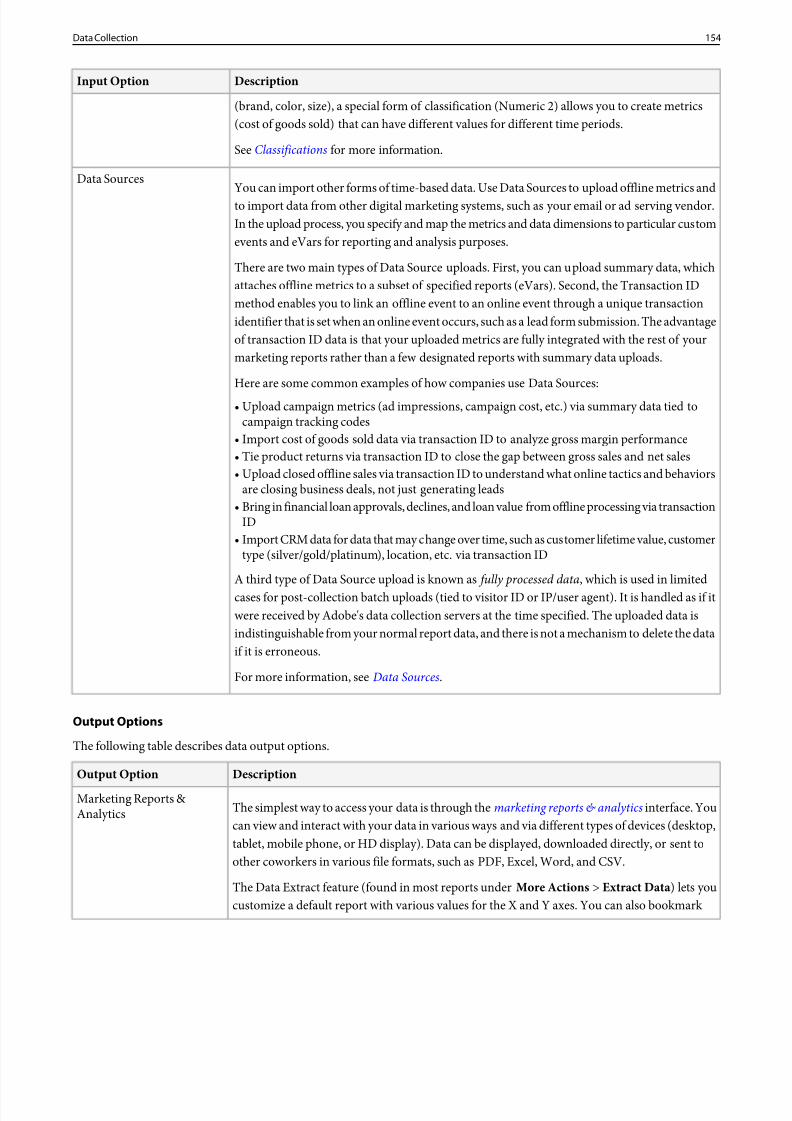
8/18/2019 Analytics Reference Adobe
http://slidepdf.com/reader/full/analytics-reference-adobe 154/332
DescriptionInput Option
(brand, color, size), a special form of classification (Numeric 2) allows you to create metrics(cost of goods sold) that can have different values for different time periods.
SeeClassifications for more information.
You can import other forms of time-based data. Use Data Sources to upload offline metrics andto import data from other digital marketing systems, such as your email or ad serving vendor.
Data Sources
In the upload process, you specify and map the metrics and data dimensions to particular customevents and eVars for reporting and analysis purposes.
There are two main types of Data Source uploads. First, you can upload summary data, whichattaches offline metrics to a subset of specified reports (eVars). Second, the Transaction IDmethod enables you to link an offline event to an online event through a unique transactionidentifier that is set when an online event occurs, such as a lead form submission. The advantageof transaction ID data is that your uploaded metrics are fully integrated with the rest of yourmarketing reports rather than a few designated reports with summary data uploads.
Here are some common examples of how companies use Data Sources:
• Upload campaign metrics (ad impressions, campaign cost, etc.) via summary data tied tocampaign tracking codes
• Import cost of goods sold data via transaction ID to analyze gross margin performance• Tie product returns via transaction ID to close the gap between gross sales and net sales• Upload closed offline sales via transaction ID to understand what online tactics and behaviors
are closing business deals, not just generating leads• Bring in financial loan approvals, declines, and loan value from offline processing via transaction
ID• Import CRM data for data that may change over time, such as customer lifetime value, customer
type (silver/gold/platinum), location, etc. via transaction ID
A third type of Data Source upload is known as fully processed data, which is used in limitedcases for post-collection batch uploads (tied to visitor ID or IP/user agent). It is handled as if itwere received by Adobe's data collection servers at the time specified. The uploaded data isindistinguishable from your normal report data, and there is not a mechanism to delete the dataif it is erroneous.
For more information, see Data Sources.
Output Options
The following table describes data output options.
DescriptionOutput Option
The simplest way to access your data is through themarketing reports & analytics interface. Youcan view and interact with your data in various ways and via different types of devices (desktop,
Marketing Reports & Analytics
tablet, mobile phone, or HD display). Data can be displayed, downloaded directly, or sent toother coworkers in various file formats, such as PDF, Excel, Word, and CSV.
The Data Extract feature (found in most reports under More Actions > Extract Data ) lets youcustomize a default report with various values for the X and Y axes. You can also bookmark
154Data Collection
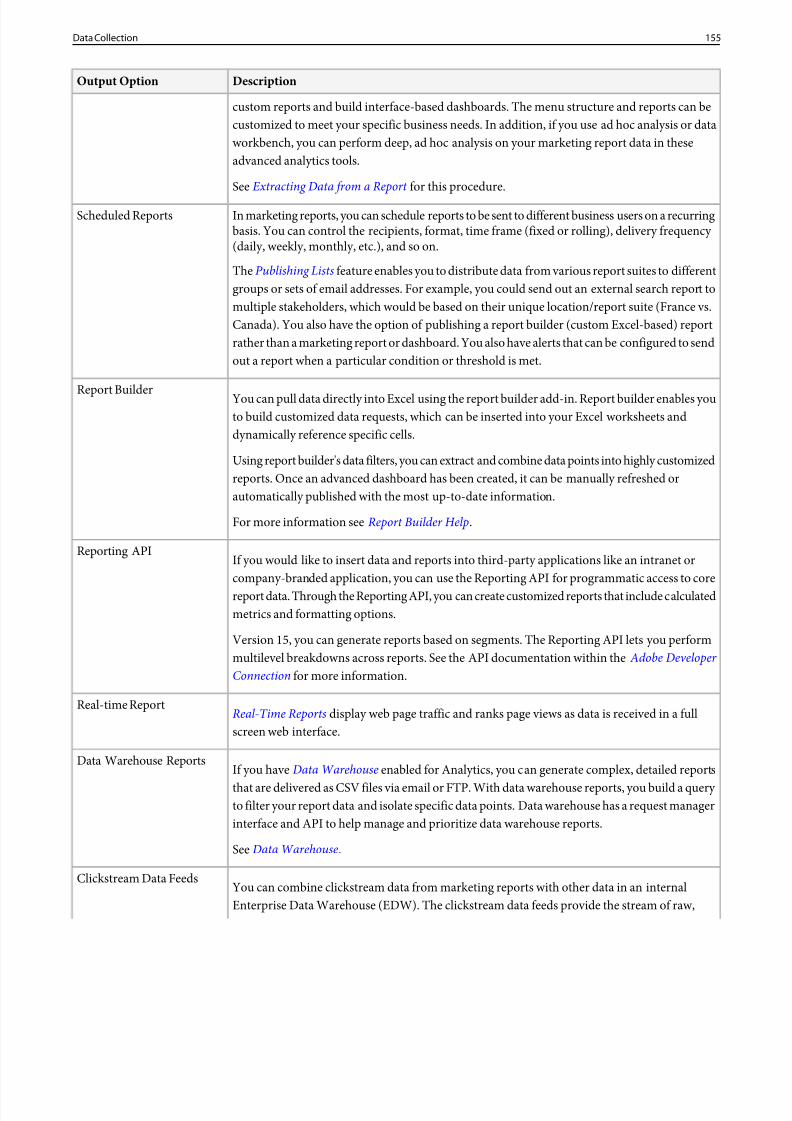
8/18/2019 Analytics Reference Adobe
http://slidepdf.com/reader/full/analytics-reference-adobe 155/332
DescriptionOutput Option
custom reports and build interface-based dashboards. The menu structure and reports can becustomized to meet your specific business needs. In addition, if you use ad hoc analysis or dataworkbench, you can perform deep, ad hoc analysis on your marketing report data in theseadvanced analytics tools.
SeeExtracting Data from a Report for this procedure.
In marketing reports, you can schedule reports to be sent to different business users on a recurringbasis. You can control the recipients, format, time frame (fixed or rolling), delivery frequency (daily, weekly, monthly, etc.), and so on.
The Publishing Lists feature enables you to distribute data from various report suites to differentgroups or sets of email addresses. For example, you could send out an external search report to
Scheduled Reports
multiple stakeholders, which would be based on their unique location/report suite (France vs.Canada). You also have the option of publishing a report builder (custom Excel-based) reportrather than a marketing report or dashboard. You also have alerts that can be configured to sendout a report when a particular condition or threshold is met.
You can pull data directly into Excel using the report builder add-in. Report builder enables youto build customized data requests, which can be inserted into your Excel worksheets anddynamically reference specific cells.
Report Builder
Using report builder's data filters, you can extract and combine data points into highly customizedreports. Once an advanced dashboard has been created, it can be manually refreshed orautomatically published with the most up-to-date information.
For more information see Report Builder Help.
If you would like to insert data and reports into third-party applications like an intranet orcompany-branded application, you can use the Reporting API for programmatic access to core
Reporting API
report data. Through the Reporting API, you can create customized reports that include calculatedmetrics and formatting options.
Version 15, you can generate reports based on segments. The Reporting API lets you performmultilevel breakdowns across reports. See the API documentation within the Adobe Developer Connection for more information.
Real-Time Reports display web page traffic and ranks page views as data is received in a fullscreen web interface.
Real-time Report
If you haveData Warehouse enabled for Analytics, you can generate complex, detailed reports
that are delivered as CSV files via email or FTP. With data warehouse reports, you build a query
Data Warehouse Reports
to filter your report data and isolate specific data points. Data warehouse has a request managerinterface and API to help manage and prioritize data warehouse reports.
SeeData Warehouse .
You can combine clickstream data from marketing reports with other data in an internalEnterprise Data Warehouse (EDW). The clickstream data feeds provide the stream of raw,
Clickstream Data Feeds
155Data Collection
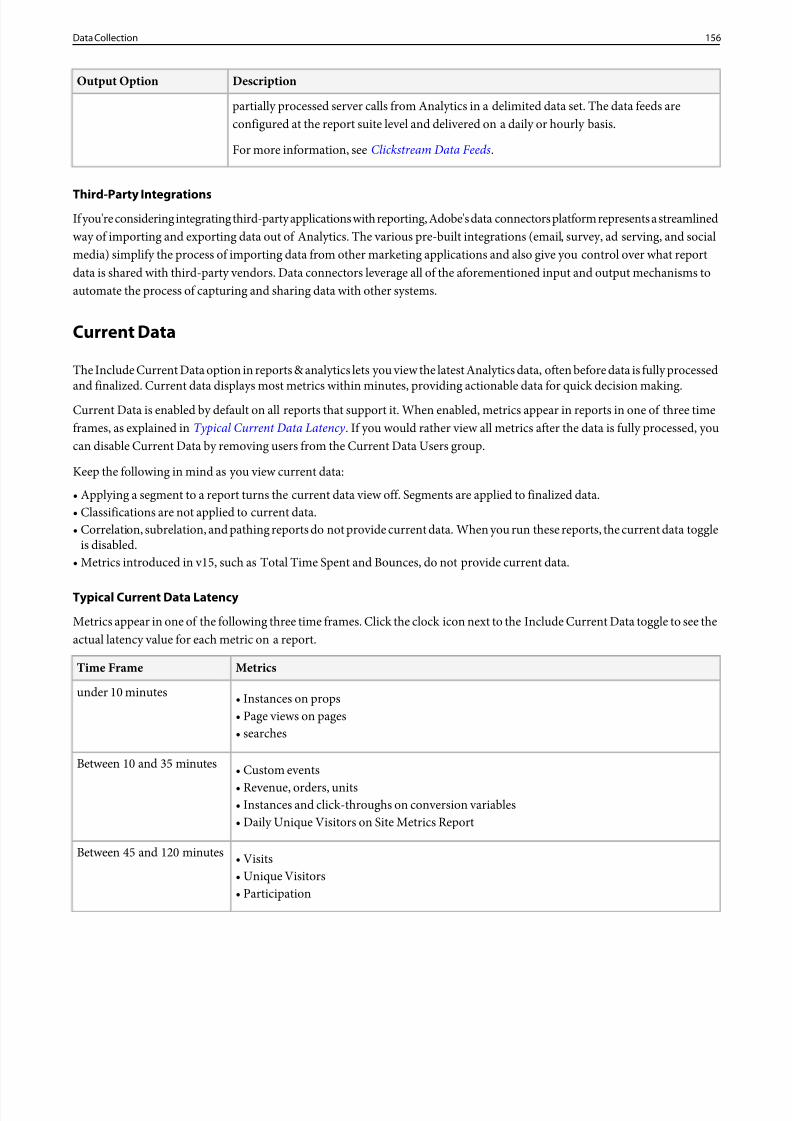
8/18/2019 Analytics Reference Adobe
http://slidepdf.com/reader/full/analytics-reference-adobe 156/332
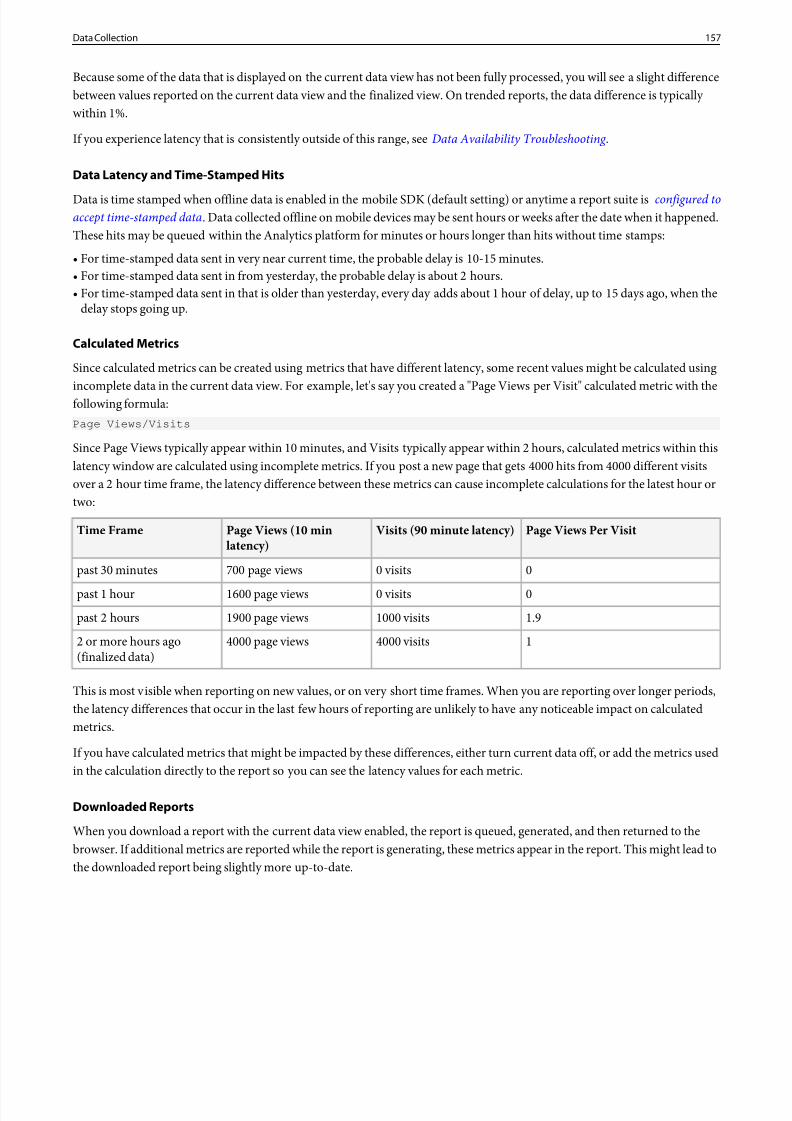
8/18/2019 Analytics Reference Adobe
http://slidepdf.com/reader/full/analytics-reference-adobe 157/332
Because some of the data that is displayed on the current data view has not been fully processed, you will see a slight differencebetween values reported on the current data view and the finalized view. On trended reports, the data difference is typically within 1%.
If you experience latency that is consistently outside of this range, seeData Availability Troubleshooting .
Data Latency and Time-Stamped Hits
Data is time stamped when offline data is enabled in the mobile SDK (default setting) or anytime a report suite isconfigured toaccept time-stamped data . Data collected offline on mobile devices may be sent hours or weeks after the date when it happened.These hits may be queued within the Analytics platform for minutes or hours longer than hits without time stamps:
• For time-stamped data sent in very near current time, the probable delay is 10-15 minutes.• For time-stamped data sent in from yesterday, the probable delay is about 2 hours.• For time-stamped data sent in that is older than yesterday, every day adds about 1 hour of delay, up to 15 days ago, when the
delay stops going up.
Calculated Metrics
Since calculated metrics can be created using metrics that have different latency, some recent values might be calculated using
incomplete data in the current data view. For example, let's say you created a "Page Views per Visit" calculated metric with thefollowing formula:Page Views/Visits
Since Page Views typically appear within 10 minutes, and Visits typically appear within 2 hours, calculated metrics within thislatency window are calculated using incomplete metrics. If you post a new page that gets 4000 hits from 4000 different visitsover a 2 hour time frame, the latency difference between these metrics can cause incomplete calculations for the latest hour ortwo:
Page Views Per VisitVisits (90 minute latency)Page Views (10 minlatency)
Time Frame
00 visits700 page viewspast 30 minutes
00 visits1600 page viewspast 1 hour
1.91000 visits1900 page viewspast 2 hours
14000 visits4000 page views2 or more hours ago(finalized data)
This is most visible when reporting on new values, or on very short time frames. When you are reporting over longer periods,the latency differences that occur in the last few hours of reporting are unlikely to have any noticeable impact on calculatedmetrics.
If you have calculated metrics that might be impacted by these differences, either turn current data off, or add the metrics usedin the calculation directly to the report so you can see the latency values for each metric.
Downloaded Reports
When you download a report with the current data view enabled, the report is queued, generated, and then returned to thebrowser. If additional metrics are reported while the report is generating, these metrics appear in the report. This might lead tothe downloaded report being slightly more up-to-date.
157Data Collection
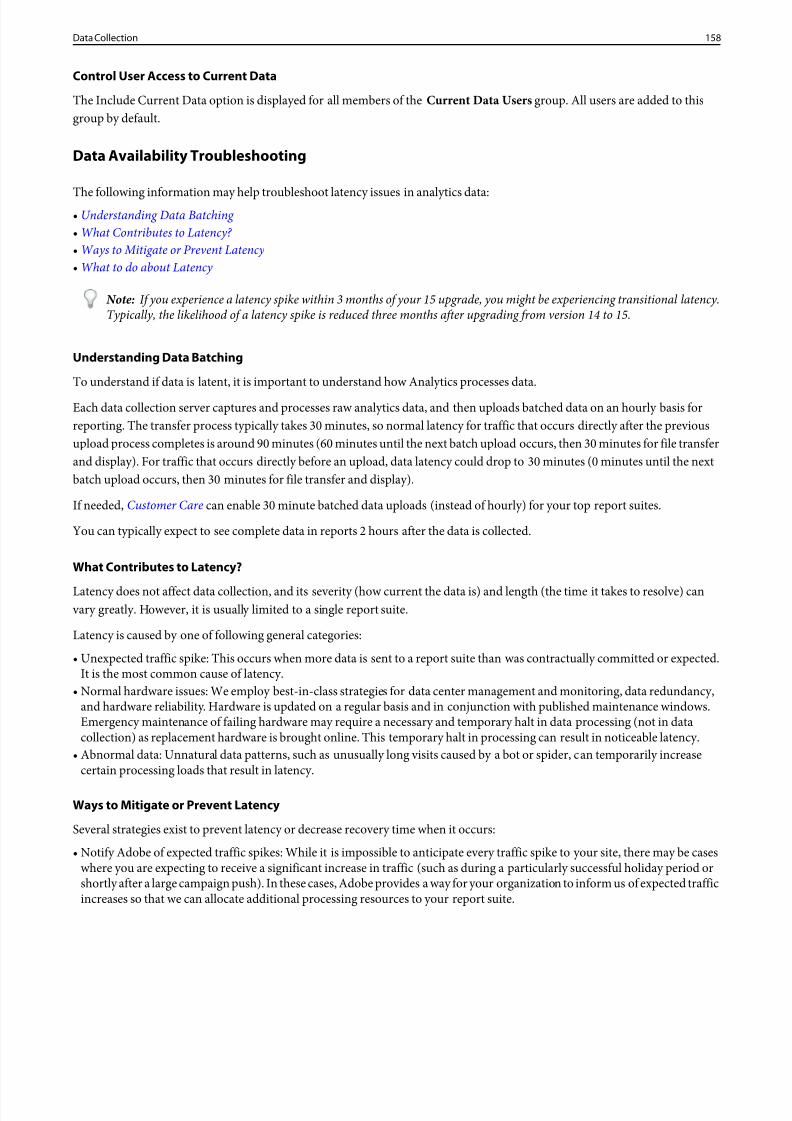
8/18/2019 Analytics Reference Adobe
http://slidepdf.com/reader/full/analytics-reference-adobe 158/332
Control User Access to Current Data
The Include Current Data option is displayed for all members of the Current Data Users group. All users are added to thisgroup by default.
Data Availability Troubleshooting
The following information may help troubleshoot latency issues in analytics data:• Understanding Data Batching • What Contributes to Latency? • Ways to Mitigate or Prevent Latency • What to do about Latency
Note: If you experience a latency spike within 3 months of your 15 upgrade, you might be experiencing transitional latency.Typically, the likelihood of a latency spike is reduced three months after upgrading from version 14 to 15.
Understanding Data Batching
To understand if data is latent, it is important to understand how Analytics processes data.
Each data collection server captures and processes raw analytics data, and then uploads batched data on an hourly basis forreporting. The transfer process typically takes 30 minutes, so normal latency for traffic that occurs directly after the previousupload process completes is around 90 minutes (60 minutes until the next batch upload occurs, then 30 minutes for file transferand display). For traffic that occurs directly before an upload, data latency could drop to 30 minutes (0 minutes until the nextbatch upload occurs, then 30 minutes for file transfer and display).
If needed, Customer Care can enable 30 minute batched data uploads (instead of hourly) for your top report suites.
You can typically expect to see complete data in reports 2 hours after the data is collected.
What Contributes to Latency?
Latency does not affect data collection, and its severity (how current the data is) and length (the time it takes to resolve) can vary greatly. However, it is usually limited to a single report suite.
Latency is caused by one of following general categories:
• Unexpected traffic spike: This occurs when more data is sent to a report suite than was contractually committed or expected.It is the most common cause of latency.
• Normal hardware issues: We employ best-in-class strategies for data center management and monitoring, data redundancy,and hardware reliability. Hardware is updated on a regular basis and in conjunction with published maintenance windows.Emergency maintenance of failing hardware may require a necessary and temporary halt in data processing (not in datacollection) as replacement hardware is brought online. This temporary halt in processing can result in noticeable latency.
• Abnormal data: Unnatural data patterns, such as unusually long visits caused by a bot or spider, can temporarily increasecertain processing loads that result in latency.
Ways to Mitigate or Prevent Latency
Several strategies exist to prevent latency or decrease recovery time when it occurs:
• Notify Adobe of expected traffic spikes: While it is impossible to anticipate every traffic spike to your site, there may be caseswhere you are expecting to receive a significant increase in traffic (such as during a particularly successful holiday period orshortly after a large campaign push). In these cases, Adobe provides a way for your organization to inform us of expected trafficincreases so that we can allocate additional processing resources to your report suite.
158Data Collection
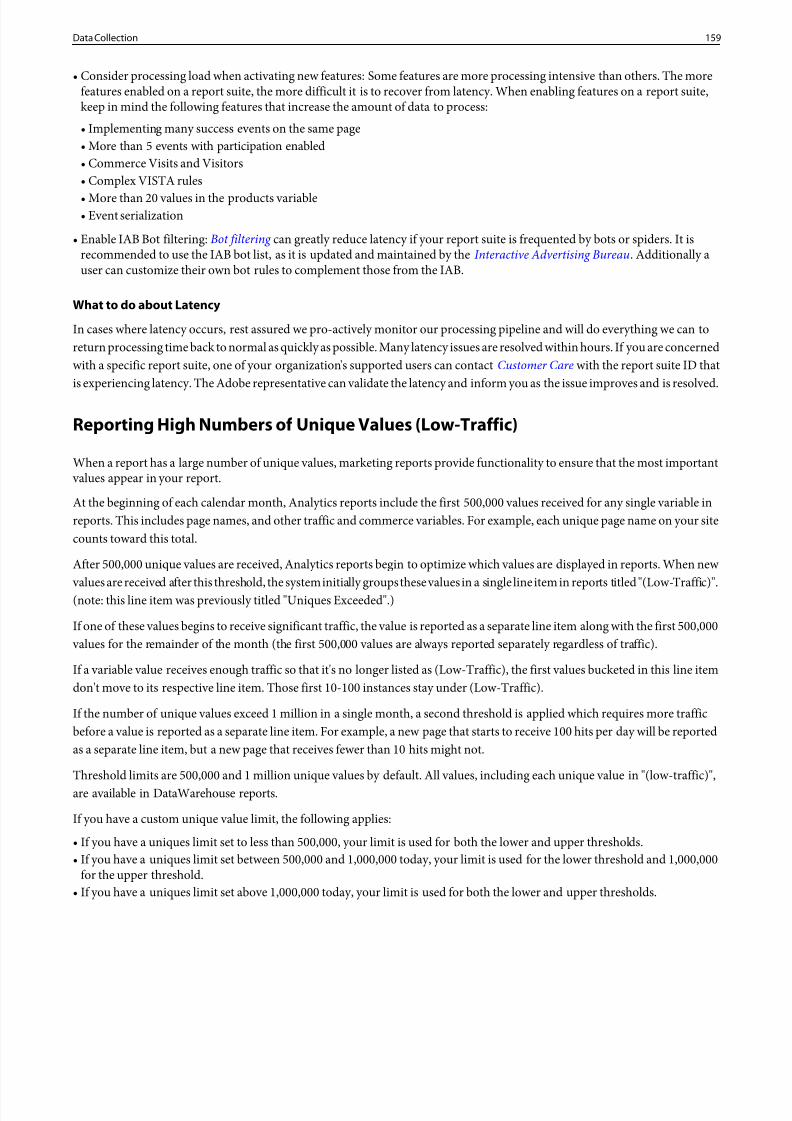
8/18/2019 Analytics Reference Adobe
http://slidepdf.com/reader/full/analytics-reference-adobe 159/332
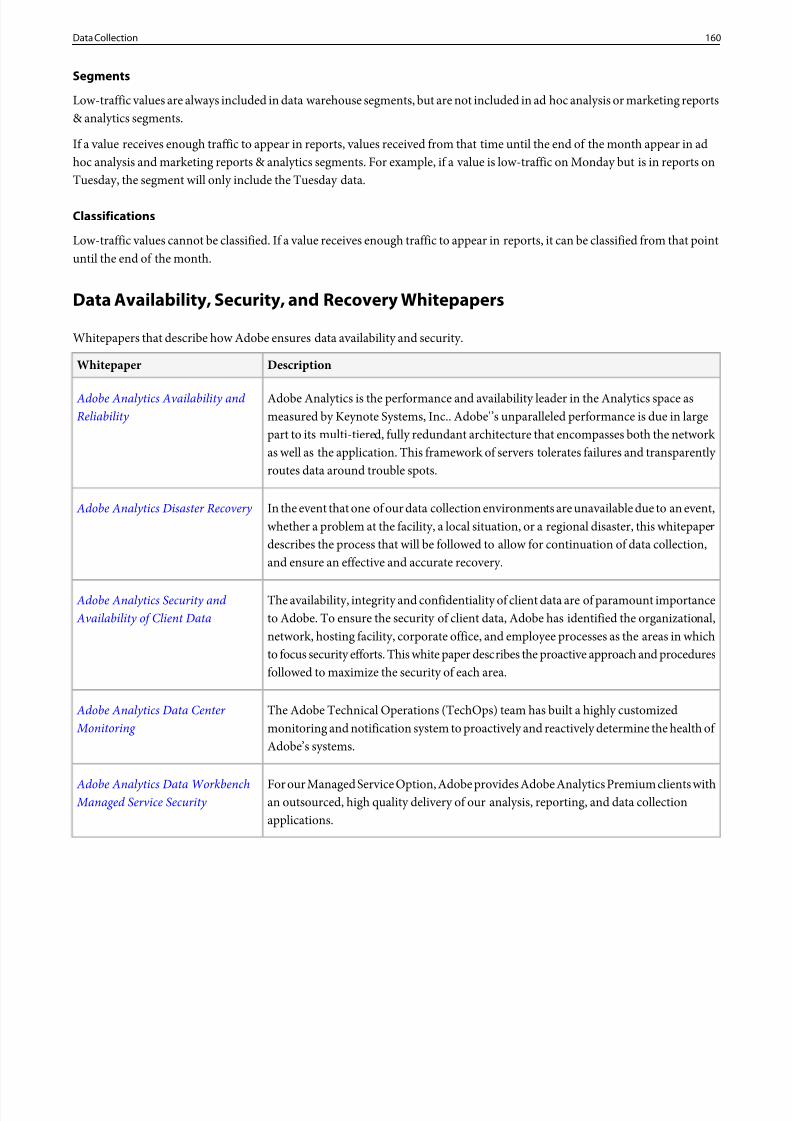
8/18/2019 Analytics Reference Adobe
http://slidepdf.com/reader/full/analytics-reference-adobe 160/332
Segments
Low-traffic values are always included in data warehouse segments, but are not included in ad hoc analysis or marketing reports& analytics segments.
If a value receives enough traffic to appear in reports, values received from that time until the end of the month appear in adhoc analysis and marketing reports & analytics segments. For example, if a value is low-traffic on Monday but is in reports onTuesday, the segment will only include the Tuesday data.
Classifications
Low-traffic values cannot be classified. If a value receives enough traffic to appear in reports, it can be classified from that pointuntil the end of the month.
Data Availability, Security, and Recovery Whitepapers
Whitepapers that describe how Adobe ensures data availability and security.
DescriptionWhitepaper
Adobe Analytics is the performance and availability leader in the Analytics space asmeasured by Keynote Systems, Inc.. Adobe'’s unparalleled performance is due in large
Adobe Analytics Availability and Reliability
part to its multi-tiered, fully redundant architecture that encompasses both the network as well as the application. This framework of servers tolerates failures and transparently routes data around trouble spots.
In the event that one of our data collection environments are unavailable due to an event,whether a problem at the facility, a local situation, or a regional disaster, this whitepaper
Adobe Analytics Disaster Recovery
describes the process that will be followed to allow for continuation of data collection,and ensure an effective and accurate recovery.
The availability, integrity and confidentiality of client data are of paramount importanceto Adobe. To ensure the security of client data, Adobe has identified the organizational,
Adobe Analytics Security and Availability of Client Data
network, hosting facility, corporate office, and employee processes as the areas in whichto focus security efforts. This white paper describes the proactive approach and proceduresfollowed to maximize the security of each area.
The Adobe Technical Operations (TechOps) team has built a highly customizedmonitoring and notification system to proactively and reactively determine the health of Adobe’s systems.
Adobe Analytics Data Center Monitoring
For our Managed Service Option, Adobe provides Adobe Analytics Premium clients withan outsourced, high quality delivery of our analysis, reporting, and data collectionapplications.
Adobe Analytics Data Workbench Managed Service Security
160Data Collection
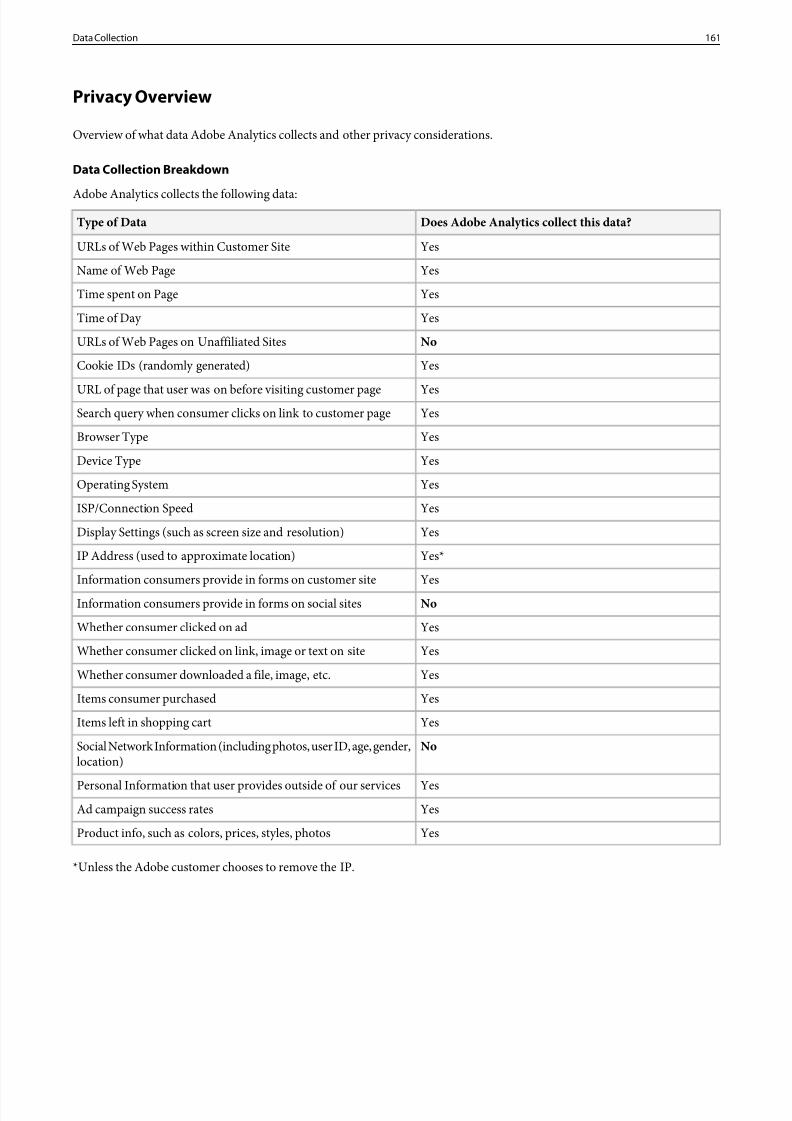
8/18/2019 Analytics Reference Adobe
http://slidepdf.com/reader/full/analytics-reference-adobe 161/332
Privacy Overview
Overview of what data Adobe Analytics collects and other privacy considerations.
Data Collection Breakdown
Adobe Analytics collects the following data:Does Adobe Analytics collect this data?Type of Data
YesURLs of Web Pages within Customer Site
YesName of Web Page
YesTime spent on Page
YesTime of Day
NoURLs of Web Pages on Unaffiliated Sites
YesCookie IDs (randomly generated)
YesURL of page that user was on before visiting customer pageYesSearch query when consumer clicks on link to customer page
YesBrowser Type
YesDevice Type
YesOperating System
YesISP/Connection Speed
YesDisplay Settings (such as screen size and resolution)
Yes*IP Address (used to approximate location)
YesInformation consumers provide in forms on customer site
NoInformation consumers provide in forms on social sites
YesWhether consumer clicked on ad
YesWhether consumer clicked on link, image or text on site
YesWhether consumer downloaded a file, image, etc.
YesItems consumer purchased
YesItems left in shopping cart
NoSocial Network Information (including photos, user ID, age, gender,location)
YesPersonal Information that user provides outside of our servicesYesAd campaign success rates
YesProduct info, such as colors, prices, styles, photos
*Unless the Adobe customer chooses to remove the IP.
161Data Collection
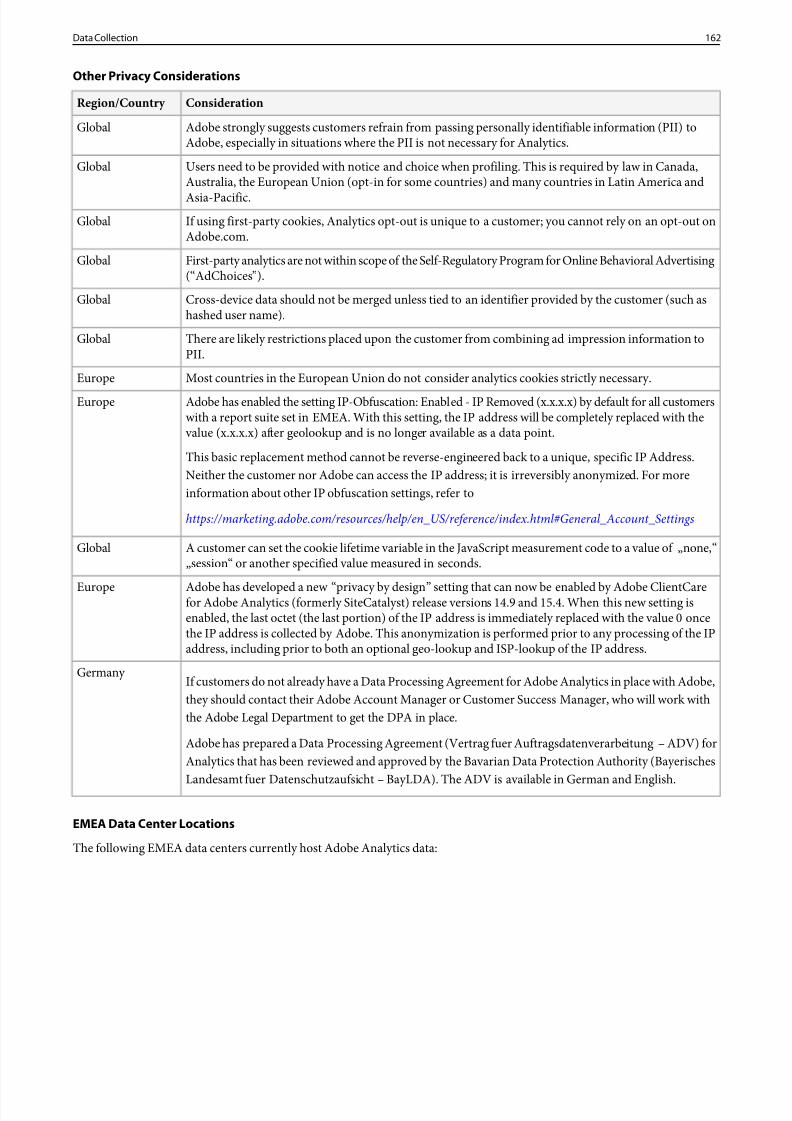
8/18/2019 Analytics Reference Adobe
http://slidepdf.com/reader/full/analytics-reference-adobe 162/332
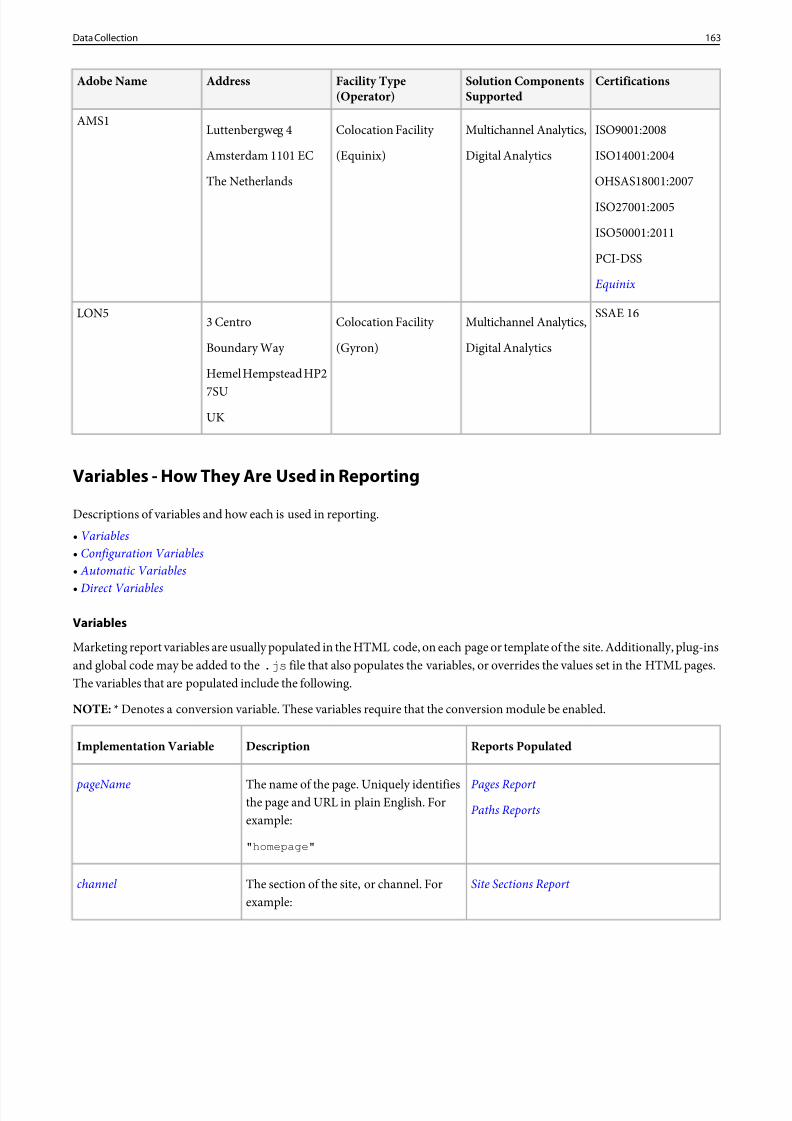
8/18/2019 Analytics Reference Adobe
http://slidepdf.com/reader/full/analytics-reference-adobe 163/332
CertificationsSolution ComponentsSupported
Facility Type(Operator)
AddressAdobe Name
ISO9001:2008Multichannel Analytics,Colocation Facility Luttenbergweg 4AMS1
ISO14001:2004Digital Analytics(Equinix)Amsterdam 1101 EC
The Netherlands OHSAS18001:2007
ISO27001:2005
ISO50001:2011
PCI-DSS
Equinix
SSAE 16Multichannel Analytics,Colocation Facility 3 Centro
LON5
Digital Analytics(Gyron)Boundary Way
Hemel Hempstead HP2
7SUUK
Variables - How They Are Used in Reporting
Descriptions of variables and how each is used in reporting.• Variables• Configuration Variables• Automatic Variables
• Direct Variables
Variables
Marketing report variables are usually populated in the HTML code, on each page or template of the site. Additionally, plug-insand global code may be added to the .js file that also populates the variables, or overrides the values set in the HTML pages.The variables that are populated include the following.
NOTE: * Denotes a conversion variable. These variables require that the conversion module be enabled.
Reports PopulatedDescriptionImplementation Variable
Pages Report The name of the page. Uniquely identifiesthe page and URL in plain English. Forexample:
pageNamePaths Reports
"homepage"
Site Sections Report The section of the site, or channel. Forexample:
channel
163Data Collection
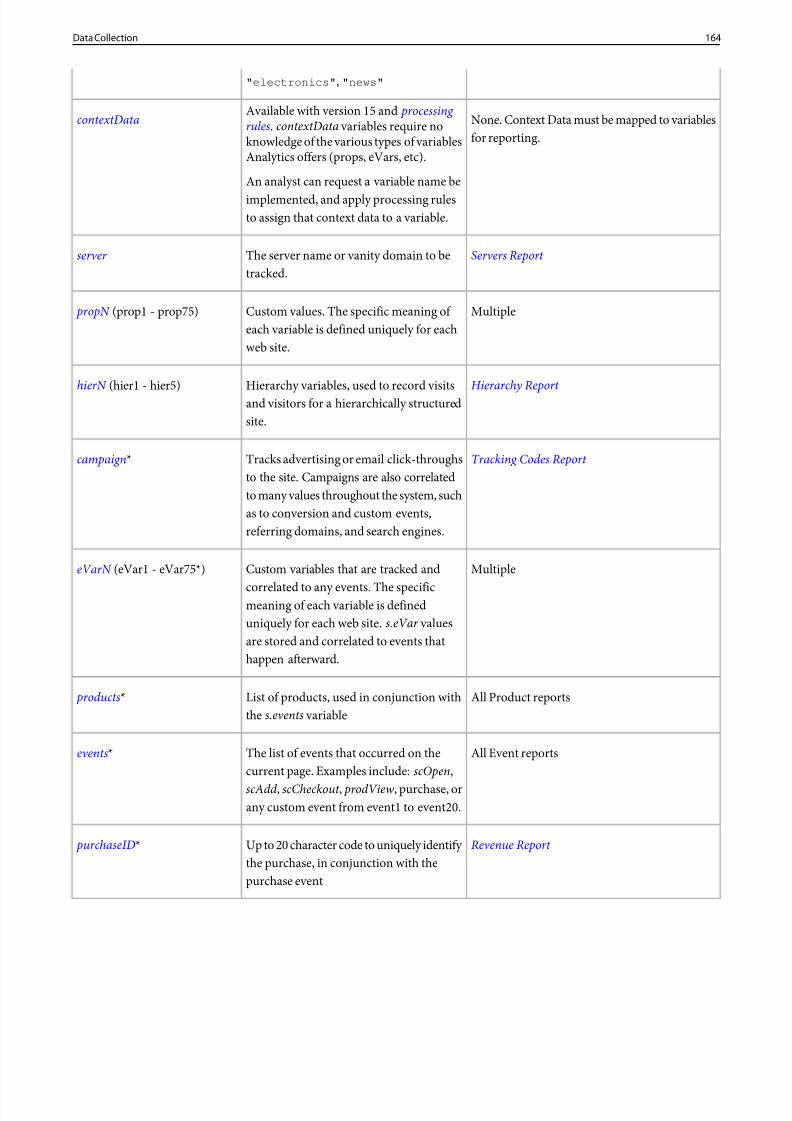
8/18/2019 Analytics Reference Adobe
http://slidepdf.com/reader/full/analytics-reference-adobe 164/332
"electronics" , "news"
None. Context Data must be mapped to variablesfor reporting.
Available with version 15 and processing rules. contextData variables require noknowledge of the various types of variablesAnalytics offers (props, eVars, etc).
An analyst can request a variable name beimplemented, and apply processing rulesto assign that context data to a variable.
contextData
Servers Report The server name or vanity domain to betracked.
server
MultipleCustom values. The specific meaning of each variable is defined uniquely for eachweb site.
propN (prop1 - prop75)
Hierarchy Report Hierarchy variables, used to record visitsand visitors for a hierarchically structuredsite.
hierN (hier1 - hier5)
Tracking Codes Report Tracks advertising or email click-throughsto the site. Campaigns are also correlated
campaign*
to many values throughout the system, suchas to conversion and custom events,referring domains, and search engines.
MultipleCustom variables that are tracked and
correlated to any events. The specific
eVarN (eVar1 - eVar75*)
meaning of each variable is defineduniquely for each web site.s.eVar valuesare stored and correlated to events thathappen afterward.
All Product reportsList of products, used in conjunction withthe s.events variable
products*
All Event reportsThe list of events that occurred on thecurrent page. Examples include:scOpen,
events*
scAdd , scCheckout , prodView, purchase, orany custom event from event1 to event20.
Revenue Report Up to 20 character code to uniquely identify the purchase, in conjunction with thepurchase event
purchaseID*
164Data Collection
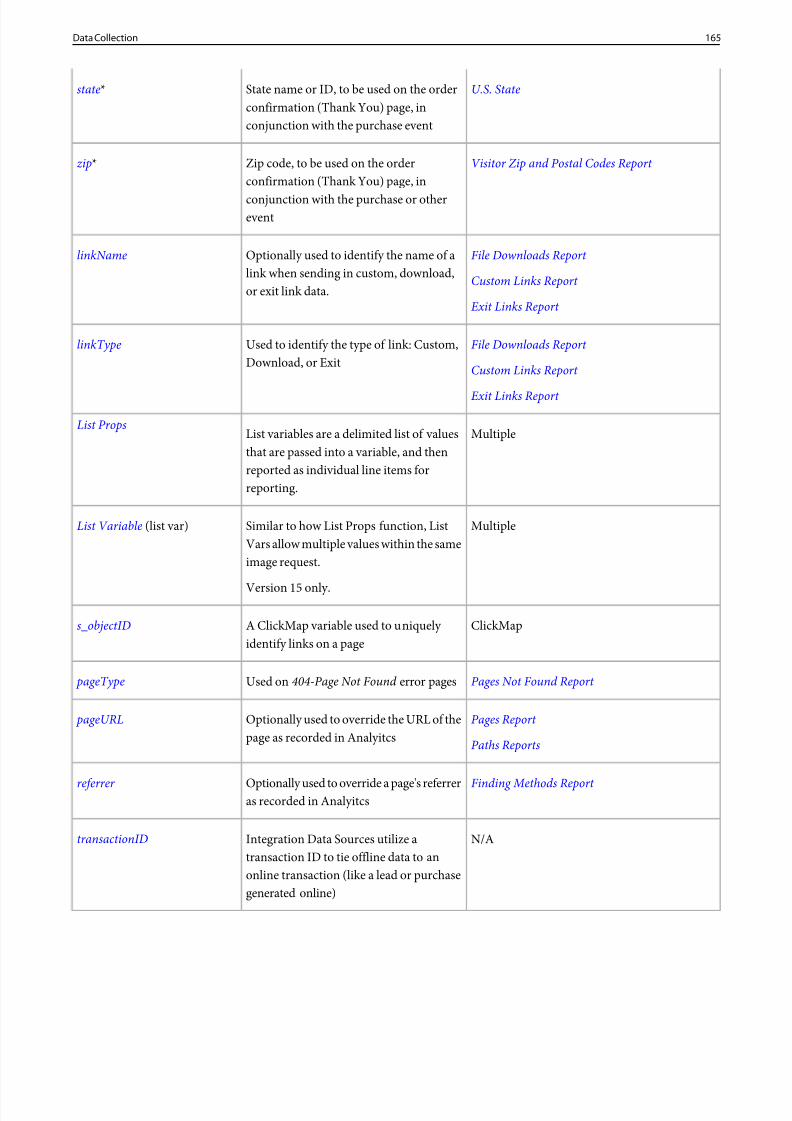
8/18/2019 Analytics Reference Adobe
http://slidepdf.com/reader/full/analytics-reference-adobe 165/332
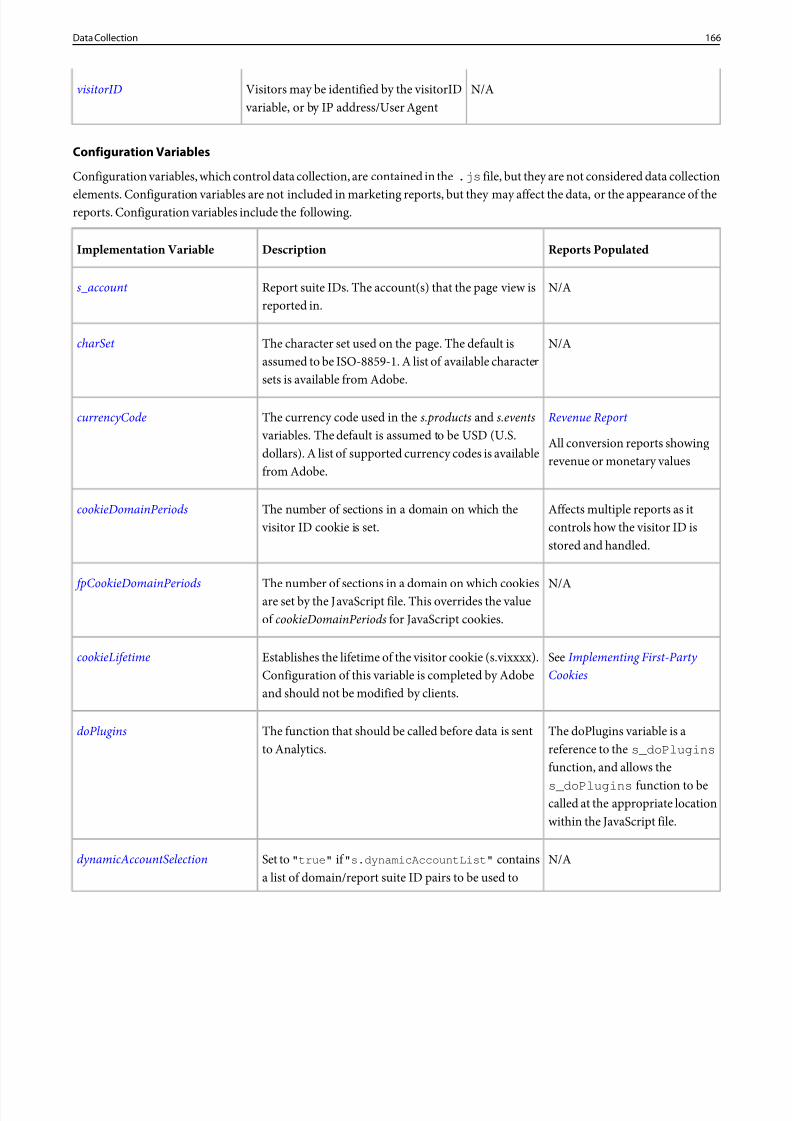
8/18/2019 Analytics Reference Adobe
http://slidepdf.com/reader/full/analytics-reference-adobe 166/332
N/AVisitors may be identified by the visitorID variable, or by IP address/User Agent
visitorID
Configuration Variables
Configuration variables, which control data collection, are contained in the .js file, but they are not considered data collection
elements. Configuration variables are not included in marketing reports, but they may affect the data, or the appearance of thereports. Configuration variables include the following.
Reports PopulatedDescriptionImplementation Variable
N/AReport suite IDs. The account(s) that the page view isreported in.
s_account
N/AThe character set used on the page. The default isassumed to be ISO-8859-1. A list of available charactersets is available from Adobe.
charSet
Revenue Report The currency code used in the s.products and s.events variables. The default is assumed to be USD (U.S.
currencyCode
All conversion reports showingrevenue or monetary valuesdollars). A list of supported currency codes is available
from Adobe.
Affects multiple reports as itcontrols how the visitor ID isstored and handled.
The number of sections in a domain on which the visitor ID cookie is set.
cookieDomainPeriods
N/AThe number of sections in a domain on which cookiesare set by the JavaScript file. This overrides the valueof cookieDomainPeriods for JavaScript cookies.
fpCookieDomainPeriods
See Implementing First-Party Cookies
Establishes the lifetime of the visitor cookie (s.vixxxx).Configuration of this variable is completed by Adobeand should not be modified by clients.
cookieLifetime
The doPlugins variable is areference to the s_doPlugins
The function that should be called before data is sentto Analytics.
doPlugins
function, and allows the
s_doPlugins function to becalled at the appropriate locationwithin the JavaScript file.
N/ASet to"true" if"s.dynamicAccountList" containsa list of domain/report suite ID pairs to be used to
dynamicAccountSelection
166Data Collection
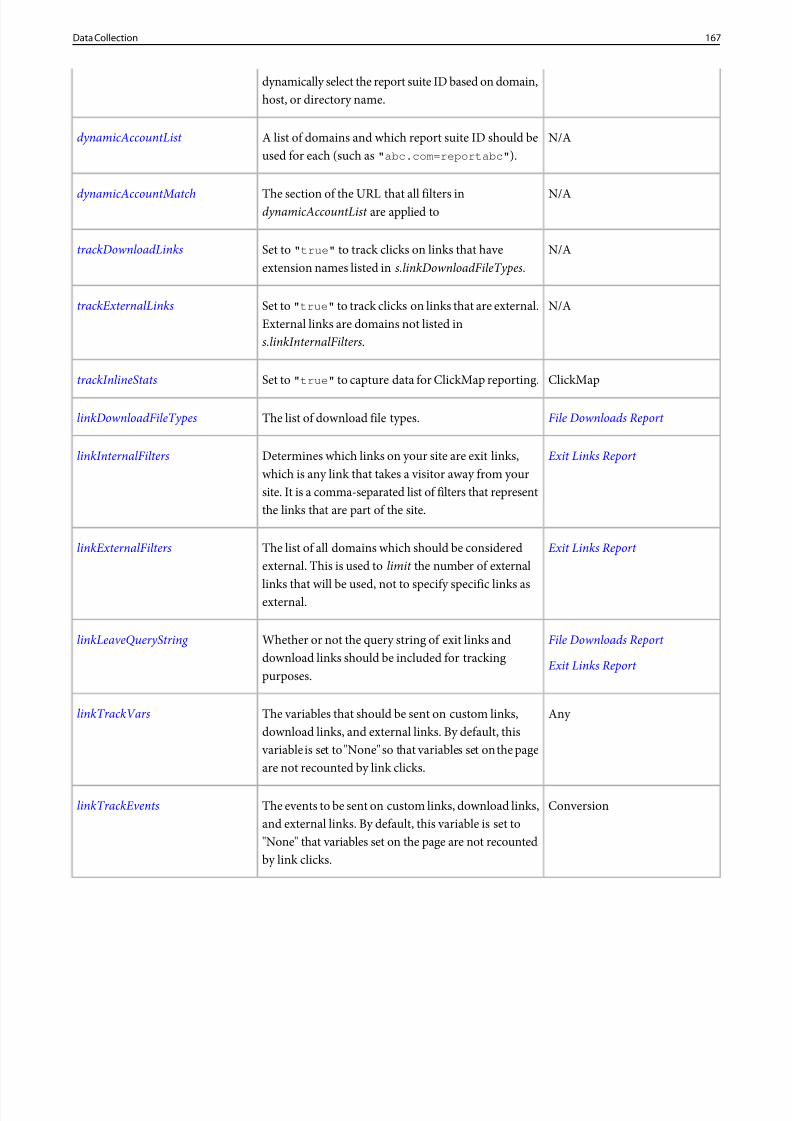
8/18/2019 Analytics Reference Adobe
http://slidepdf.com/reader/full/analytics-reference-adobe 167/332
dynamically select the report suite ID based on domain,host, or directory name.
N/AA list of domains and which report suite ID should beused for each (such as "abc.com=reportabc" ).
dynamicAccountList
N/AThe section of the URL that all filters indynamicAccountList are applied to
dynamicAccountMatch
N/ASet to "true" to track clicks on links that haveextension names listed in s.linkDownloadFileTypes.
trackDownloadLinks
N/ASet to "true" to track clicks on links that are external.External links are domains not listed ins.linkInternalFilters .
trackExternalLinks
ClickMapSet to "true" to capture data for ClickMap reporting.trackInlineStats
File Downloads Report The list of download file types.linkDownloadFileTypes
Exit Links Report Determines which links on your site are exit links,which is any link that takes a visitor away from your
linkInternalFilters
site. It is a comma-separated list of filters that representthe links that are part of the site.
Exit Links Report The list of all domains which should be consideredexternal. This is used to limit the number of external
linkExternalFilters
links that will be used, not to specify specific links asexternal.
File Downloads Report Whether or not the query string of exit links anddownload links should be included for trackingpurposes.
linkLeaveQueryString
Exit Links Report
Any The variables that should be sent on custom links,download links, and external links. By default, this
linkTrackVars
variable is set to "None" so that variables set on the pageare not recounted by link clicks.
ConversionThe events to be sent on custom links, download links,and external links. By default, this variable is set to
linkTrackEvents
"None" that variables set on the page are not recountedby link clicks.
167Data Collection
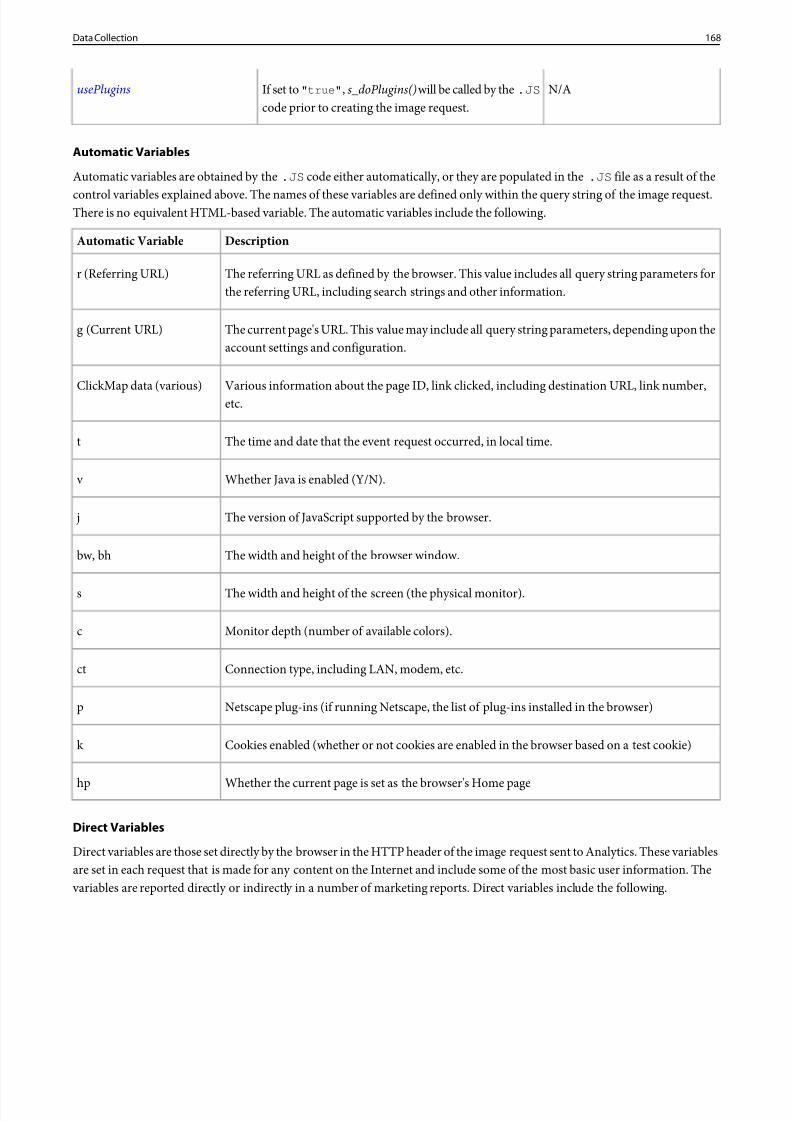
8/18/2019 Analytics Reference Adobe
http://slidepdf.com/reader/full/analytics-reference-adobe 168/332
N/AIf set to"true" , s_doPlugins() will be called by the.JS
code prior to creating the image request.usePlugins
Automatic Variables
Automatic variables are obtained by the .JS code either automatically, or they are populated in the .JS file as a result of the
control variables explained above. The names of these variables are defined only within the query string of the image request.There is no equivalent HTML-based variable. The automatic variables include the following.
DescriptionAutomatic Variable
The referring URL as defined by the browser. This value includes all query string parameters forthe referring URL, including search strings and other information.
r (Referring URL)
The current page's URL. This value may include all query string parameters, depending upon theaccount settings and configuration.
g (Current URL)
Various information about the page ID, link clicked, including destination URL, link number,etc.ClickMap data (various)
The time and date that the event request occurred, in local time.t
Whether Java is enabled (Y/N). v
The version of JavaScript supported by the browser. j
The width and height of the browser window.bw, bh
The width and height of the screen (the physical monitor).s
Monitor depth (number of available colors).c
Connection type, including LAN, modem, etc.ct
Netscape plug-ins (if running Netscape, the list of plug-ins installed in the browser)p
Cookies enabled (whether or not cookies are enabled in the browser based on a test cookie)k
Whether the current page is set as the browser's Home pagehp
Direct Variables
Direct variables are those set directly by the browser in the HTTP header of the image request sent to Analytics. These variablesare set in each request that is made for any content on the Internet and include some of the most basic user information. The variables are reported directly or indirectly in a number of marketing reports. Direct variables include the following.
168Data Collection
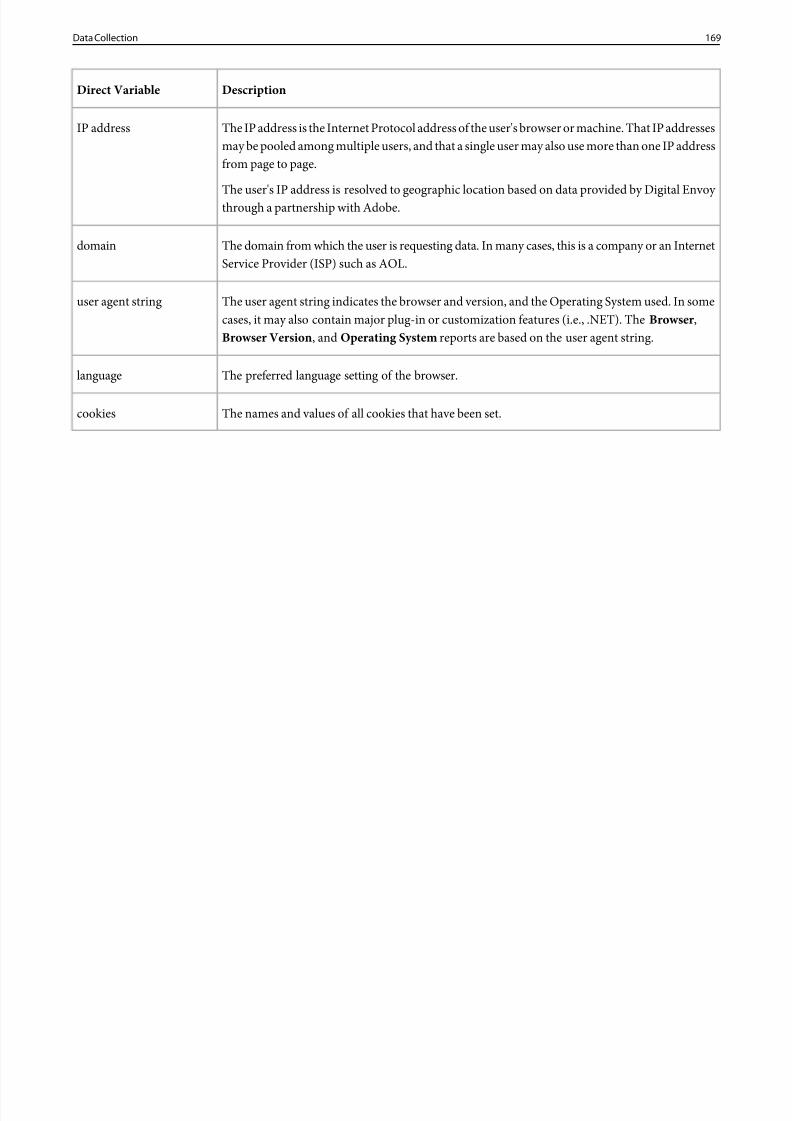
8/18/2019 Analytics Reference Adobe
http://slidepdf.com/reader/full/analytics-reference-adobe 169/332
DescriptionDirect Variable
The IP address is the Internet Protocol address of the user's browser or machine. That IP addressesmay be pooled among multiple users, and that a single user may also use more than one IP addressfrom page to page.
IP address
The user's IP address is resolved to geographic location based on data provided by Digital Envoy through a partnership with Adobe.
The domain from which the user is requesting data. In many cases, this is a company or an InternetService Provider (ISP) such as AOL.
domain
The user agent string indicates the browser and version, and the Operating System used. In somecases, it may also contain major plug-in or customization features (i.e., .NET). TheBrowser,Browser Version , and Operating System reports are based on the user agent string.
user agent string
The preferred language setting of the browser.language
The names and values of all cookies that have been set.cookies
169Data Collection
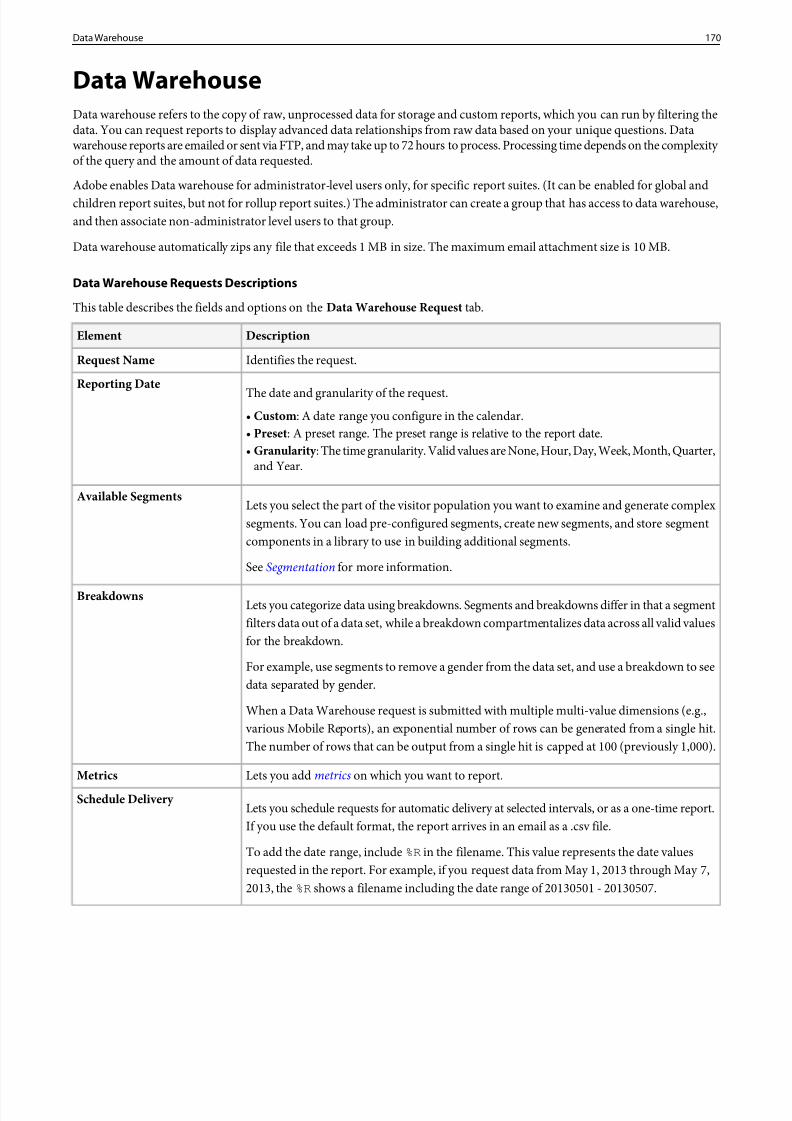
8/18/2019 Analytics Reference Adobe
http://slidepdf.com/reader/full/analytics-reference-adobe 170/332
Data WarehouseData warehouse refers to the copy of raw, unprocessed data for storage and custom reports, which you can run by filtering thedata. You can request reports to display advanced data relationships from raw data based on your unique questions. Datawarehouse reports are emailed or sent via FTP, and may take up to 72 hours to process. Processing time depends on the complexity of the query and the amount of data requested.
Adobe enables Data warehouse for administrator-level users only, for specific report suites. (It can be enabled for global andchildren report suites, but not for rollup report suites.) The administrator can create a group that has access to data warehouse,and then associate non-administrator level users to that group.
Data warehouse automatically zips any file that exceeds 1 MB in size. The maximum email attachment size is 10 MB.
Data Warehouse Requests Descriptions
This table describes the fields and options on theData Warehouse Request tab.
DescriptionElement
Identifies the request.Request Name
The date and granularity of the request.Reporting Date
• Custom : A date range you configure in the calendar.• Preset : A preset range. The preset range is relative to the report date.• Granularity : The time granularity. Valid values are None, Hour, Day, Week, Month, Quarter,
and Year.
Lets you select the part of the visitor population you want to examine and generate complexsegments. You can load pre-configured segments, create new segments, and store segmentcomponents in a library to use in building additional segments.
Available Segments
SeeSegmentation for more information.
Lets you categorize data using breakdowns. Segments and breakdowns differ in that a segmentfilters data out of a data set, while a breakdown compartmentalizes data across all valid valuesfor the breakdown.
Breakdowns
For example, use segments to remove a gender from the data set, and use a breakdown to seedata separated by gender.
When a Data Warehouse request is submitted with multiple multi-value dimensions (e.g., various Mobile Reports), an exponential number of rows can be generated from a single hit.The number of rows that can be output from a single hit is capped at 100 (previously 1,000).
Lets you addmetrics on which you want to report.Metrics
Lets you schedule requests for automatic delivery at selected intervals, or as a one-time report.If you use the default format, the report arrives in an email as a .csv file.
Schedule Delivery
To add the date range, include %R in the filename. This value represents the date valuesrequested in the report. For example, if you request data from May 1, 2013 through May 7,2013, the %R shows a filename including the date range of 20130501 - 20130507.
170Data Warehouse
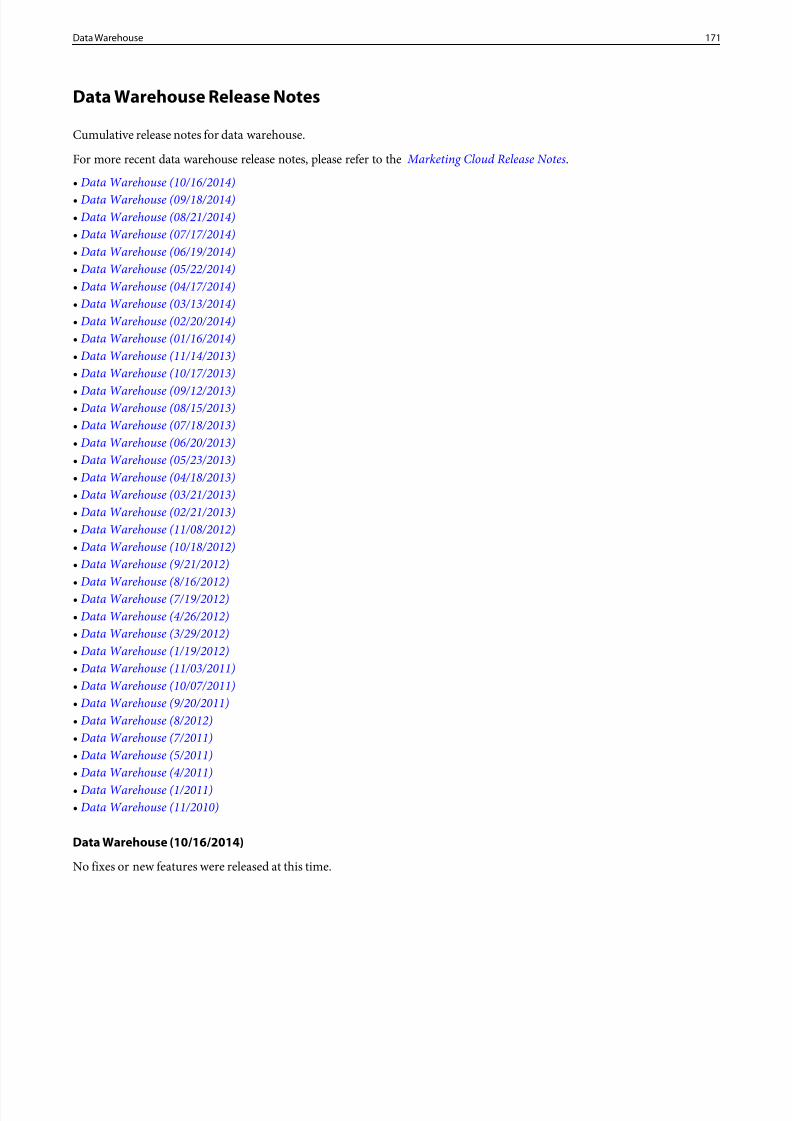
8/18/2019 Analytics Reference Adobe
http://slidepdf.com/reader/full/analytics-reference-adobe 171/332
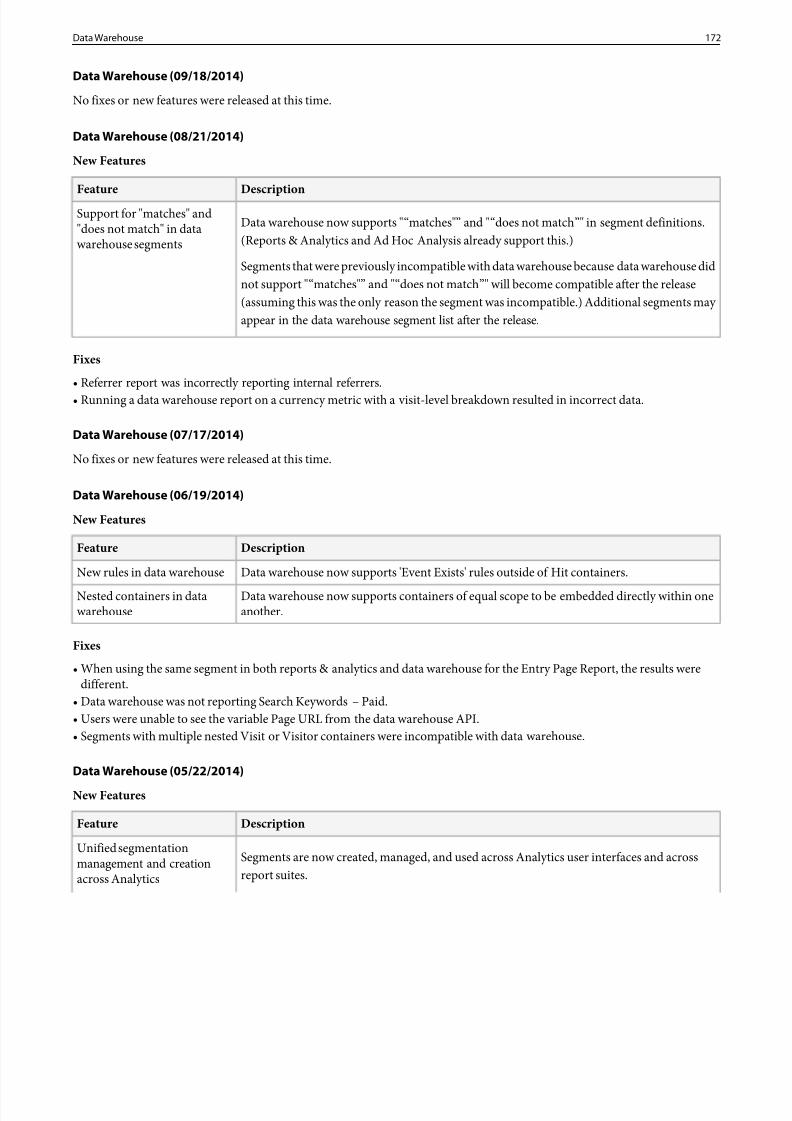
8/18/2019 Analytics Reference Adobe
http://slidepdf.com/reader/full/analytics-reference-adobe 172/332
Data Warehouse (09/18/2014)
No fixes or new features were released at this time.
Data Warehouse (08/21/2014)
New Features
DescriptionFeature
Data warehouse now supports "“matches"” and "“does not match”" in segment definitions.(Reports & Analytics and Ad Hoc Analysis already support this.)
Support for "matches" and"does not match" in datawarehouse segments
Segments that were previously incompatible with data warehouse because data warehouse didnot support "“matches"” and "“does not match”" will become compatible after the release(assuming this was the only reason the segment was incompatible.) Additional segments may appear in the data warehouse segment list after the release.
Fixes
• Referrer report was incorrectly reporting internal referrers.• Running a data warehouse report on a currency metric with a visit-level breakdown resulted in incorrect data.
Data Warehouse (07/17/2014)
No fixes or new features were released at this time.
Data Warehouse (06/19/2014)
New Features
DescriptionFeature
Data warehouse now supports 'Event Exists' rules outside of Hit containers.New rules in data warehouse
Data warehouse now supports containers of equal scope to be embedded directly within oneanother.
Nested containers in datawarehouse
Fixes
• When using the same segment in both reports & analytics and data warehouse for the Entry Page Report, the results weredifferent.
• Data warehouse was not reporting Search Keywords– Paid.• Users were unable to see the variable Page URL from the data warehouse API.• Segments with multiple nested Visit or Visitor containers were incompatible with data warehouse.
Data Warehouse (05/22/2014)
New Features
DescriptionFeature
Segments are now created, managed, and used across Analytics user interfaces and acrossreport suites.
Unified segmentationmanagement and creationacross Analytics
172Data Warehouse
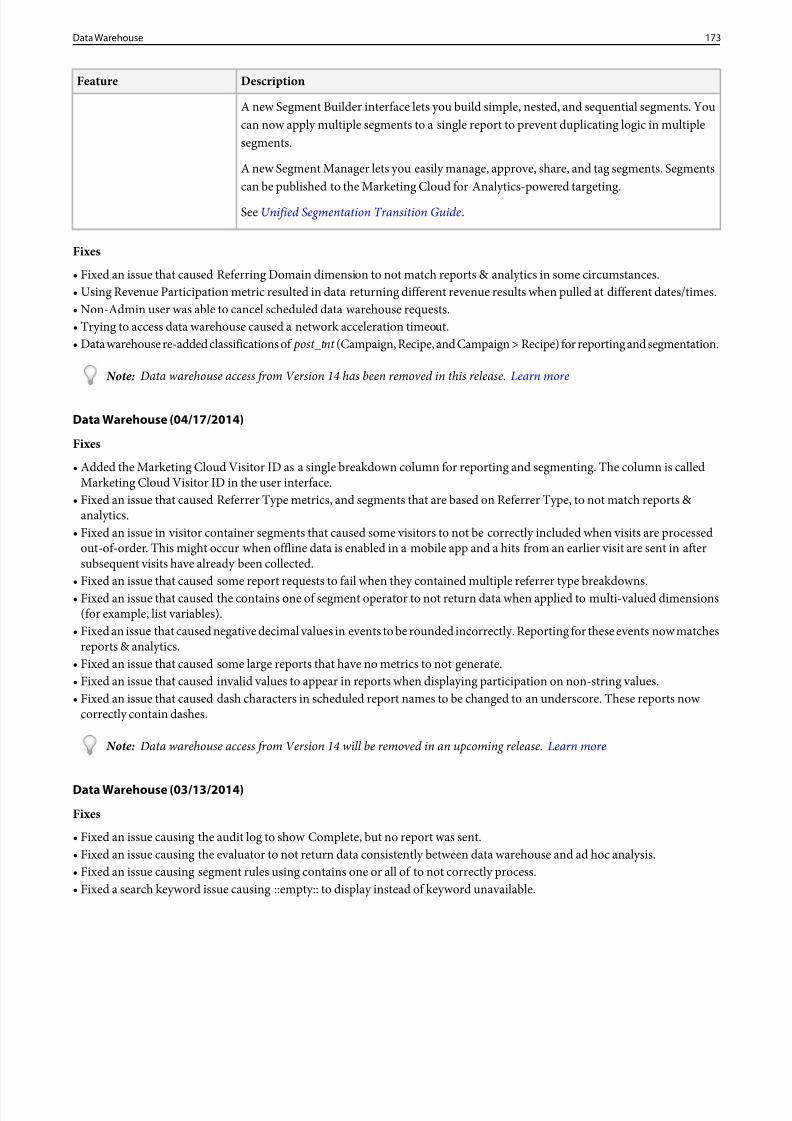
8/18/2019 Analytics Reference Adobe
http://slidepdf.com/reader/full/analytics-reference-adobe 173/332
DescriptionFeature
A new Segment Builder interface lets you build simple, nested, and sequential segments. Youcan now apply multiple segments to a single report to prevent duplicating logic in multiplesegments.
A new Segment Manager lets you easily manage, approve, share, and tag segments. Segmentscan be published to the Marketing Cloud for Analytics-powered targeting.
See Unified Segmentation Transition Guide .
Fixes
• Fixed an issue that caused Referring Domain dimension to not match reports & analytics in some circumstances.• Using Revenue Participation metric resulted in data returning different revenue results when pulled at different dates/times.• Non-Admin user was able to cancel scheduled data warehouse requests.• Trying to access data warehouse caused a network acceleration timeout.• Data warehouse re-added classifications of post_tnt (Campaign, Recipe, and Campaign > Recipe) for reporting and segmentation.
Note: Data warehouse access from Version 14 has been removed in this release. Learn more
Data Warehouse (04/17/2014)
Fixes
• Added the Marketing Cloud Visitor ID as a single breakdown column for reporting and segmenting. The column is calledMarketing Cloud Visitor ID in the user interface.
• Fixed an issue that caused Referrer Type metrics, and segments that are based on Referrer Type, to not match reports & analytics.
• Fixed an issue in visitor container segments that caused some visitors to not be correctly included when visits are processedout-of-order. This might occur when offline data is enabled in a mobile app and a hits from an earlier visit are sent in aftersubsequent visits have already been collected.
• Fixed an issue that caused some report requests to fail when they contained multiple referrer type breakdowns.• Fixed an issue that caused the contains one of segment operator to not return data when applied to multi-valued dimensions
(for example, list variables).• Fixed an issue that caused negative decimal values in events to be rounded incorrectly. Reporting for these events now matches
reports & analytics.• Fixed an issue that caused some large reports that have no metrics to not generate.• Fixed an issue that caused invalid values to appear in reports when displaying participation on non-string values.• Fixed an issue that caused dash characters in scheduled report names to be changed to an underscore. These reports now
correctly contain dashes.
Note: Data warehouse access from Version 14 will be removed in an upcoming release.Learn more
Data Warehouse (03/13/2014)
Fixes
• Fixed an issue causing the audit log to show Complete, but no report was sent.• Fixed an issue causing the evaluator to not return data consistently between data warehouse and ad hoc analysis.• Fixed an issue causing segment rules using contains one or all of to not correctly process.• Fixed a search keyword issue causing ::empty:: to display instead of keyword unavailable.
173Data Warehouse
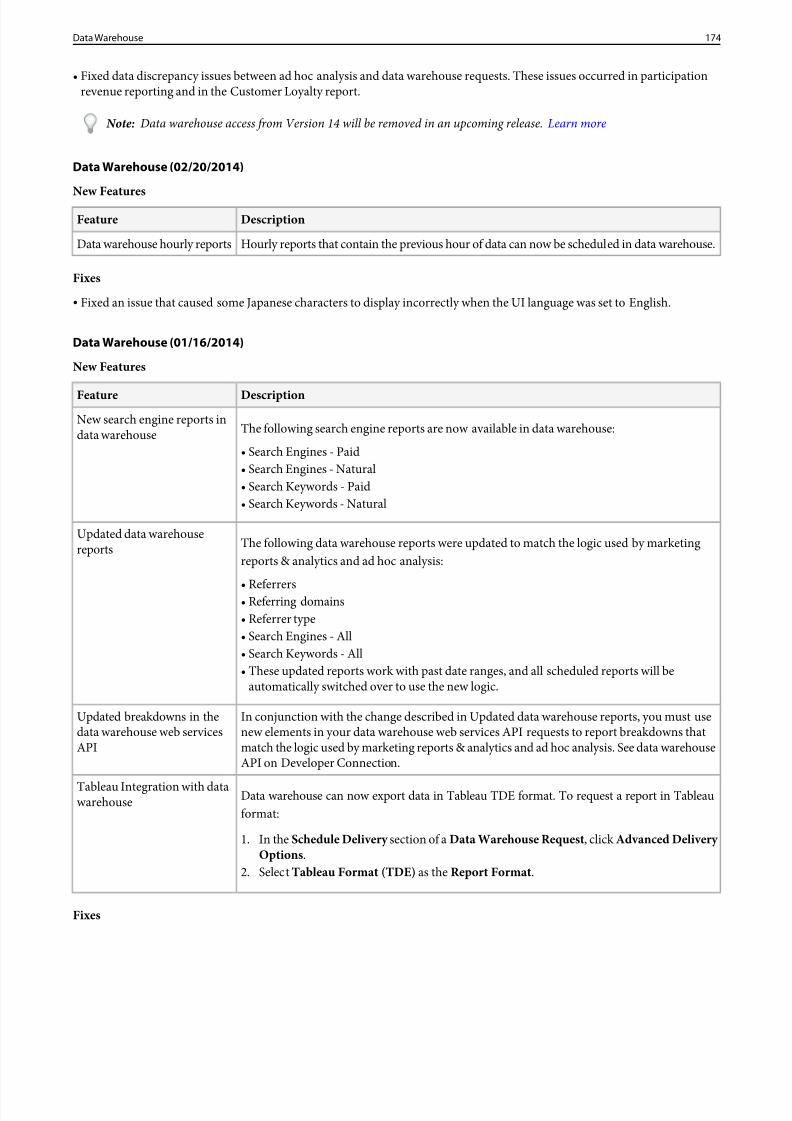
8/18/2019 Analytics Reference Adobe
http://slidepdf.com/reader/full/analytics-reference-adobe 174/332
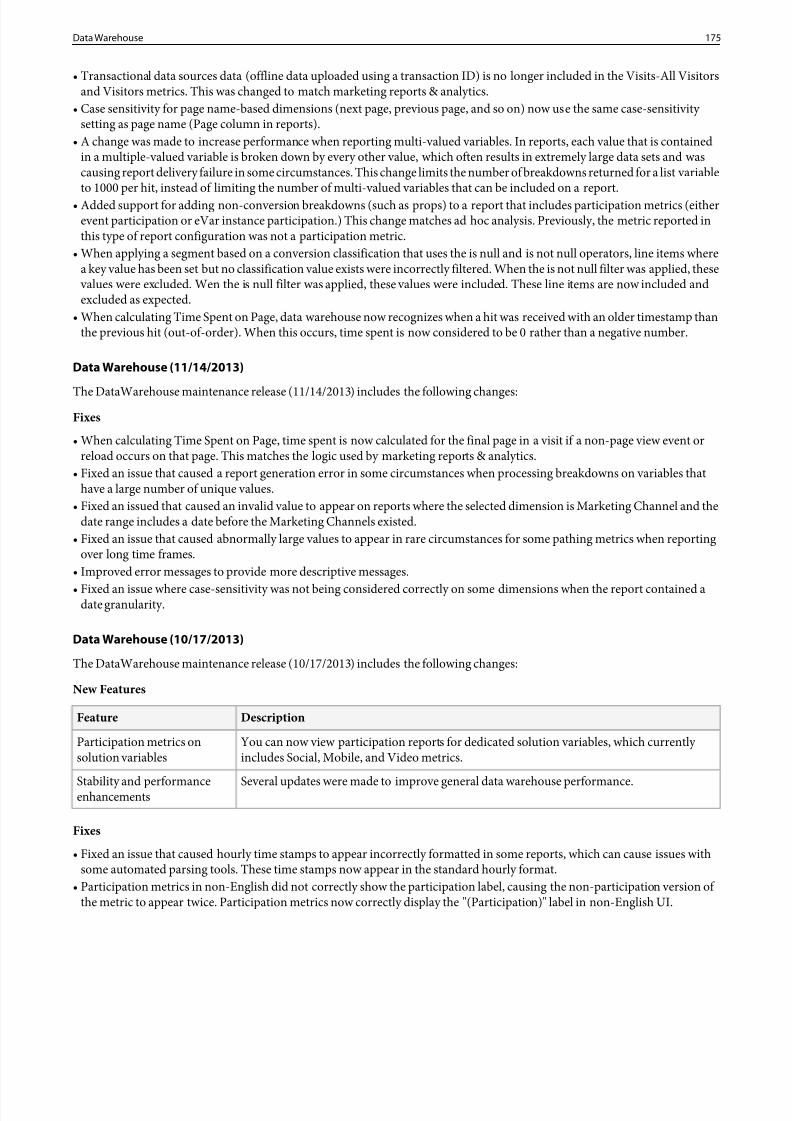
8/18/2019 Analytics Reference Adobe
http://slidepdf.com/reader/full/analytics-reference-adobe 175/332
• Transactional data sources data (offline data uploaded using a transaction ID) is no longer included in the Visits-All Visitorsand Visitors metrics. This was changed to match marketing reports & analytics.
• Case sensitivity for page name-based dimensions (next page, previous page, and so on) now use the same case-sensitivity setting as page name (Page column in reports).
• A change was made to increase performance when reporting multi-valued variables. In reports, each value that is containedin a multiple-valued variable is broken down by every other value, which often results in extremely large data sets and wascausing report delivery failure in some circumstances. This change limits the number of breakdowns returned for a list variableto 1000 per hit, instead of limiting the number of multi-valued variables that can be included on a report.
• Added support for adding non-conversion breakdowns (such as props) to a report that includes participation metrics (eitherevent participation or eVar instance participation.) This change matches ad hoc analysis. Previously, the metric reported inthis type of report configuration was not a participation metric.
• When applying a segment based on a conversion classification that uses the is null and is not null operators, line items wherea key value has been set but no classification value exists were incorrectly filtered. When the is not null filter was applied, these values were excluded. Wen the is null filter was applied, these values were included. These line items are now included andexcluded as expected.
• When calculating Time Spent on Page, data warehouse now recognizes when a hit was received with an older timestamp thanthe previous hit (out-of-order). When this occurs, time spent is now considered to be 0 rather than a negative number.
Data Warehouse (11/14/2013)
The DataWarehouse maintenance release (11/14/2013) includes the following changes:Fixes
• When calculating Time Spent on Page, time spent is now calculated for the final page in a visit if a non-page view event orreload occurs on that page. This matches the logic used by marketing reports & analytics.
• Fixed an issue that caused a report generation error in some circumstances when processing breakdowns on variables thathave a large number of unique values.
• Fixed an issued that caused an invalid value to appear on reports where the selected dimension is Marketing Channel and thedate range includes a date before the Marketing Channels existed.
• Fixed an issue that caused abnormally large values to appear in rare circumstances for some pathing metrics when reportingover long time frames.
• Improved error messages to provide more descriptive messages.
• Fixed an issue where case-sensitivity was not being considered correctly on some dimensions when the report contained adate granularity.
Data Warehouse (10/17/2013)
The DataWarehouse maintenance release (10/17/2013) includes the following changes:
New Features
DescriptionFeature
You can now view participation reports for dedicated solution variables, which currently includes Social, Mobile, and Video metrics.
Participation metrics onsolution variables
Several updates were made to improve general data warehouse performance.Stability and performanceenhancements
Fixes
• Fixed an issue that caused hourly time stamps to appear incorrectly formatted in some reports, which can cause issues withsome automated parsing tools. These time stamps now appear in the standard hourly format.
• Participation metrics in non-English did not correctly show the participation label, causing the non-participation version of the metric to appear twice. Participation metrics now correctly display the "(Participation)" label in non-English UI.
175Data Warehouse
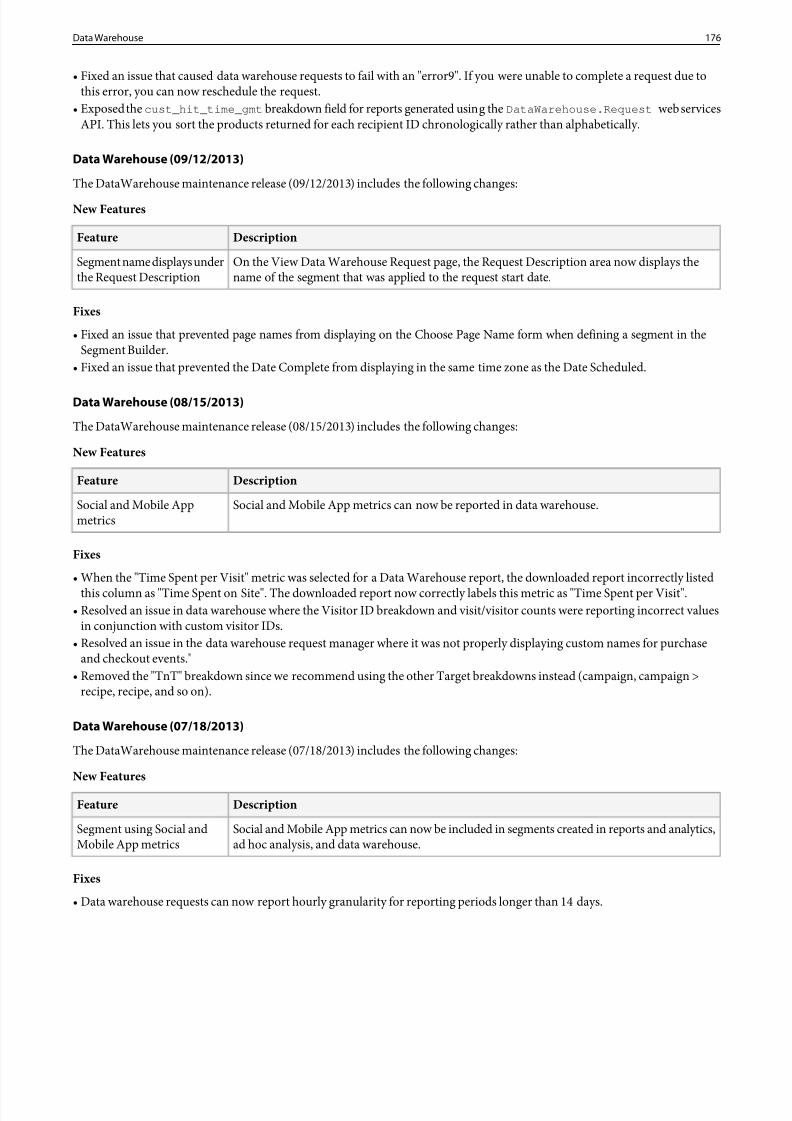
8/18/2019 Analytics Reference Adobe
http://slidepdf.com/reader/full/analytics-reference-adobe 176/332
• Fixed an issue that caused data warehouse requests to fail with an "error9". If you were unable to complete a request due tothis error, you can now reschedule the request.
• Exposed thecust_hit_time_gmt breakdown field for reports generated using the DataWarehouse.Request web servicesAPI. This lets you sort the products returned for each recipient ID chronologically rather than alphabetically.
Data Warehouse (09/12/2013)
The DataWarehouse maintenance release (09/12/2013) includes the following changes:
New Features
DescriptionFeature
On the View Data Warehouse Request page, the Request Description area now displays thename of the segment that was applied to the request start date.
Segment name displays underthe Request Description
Fixes
• Fixed an issue that prevented page names from displaying on the Choose Page Name form when defining a segment in theSegment Builder.
• Fixed an issue that prevented the Date Complete from displaying in the same time zone as the Date Scheduled.
Data Warehouse (08/15/2013)
The DataWarehouse maintenance release (08/15/2013) includes the following changes:
New Features
DescriptionFeature
Social and Mobile App metrics can now be reported in data warehouse.Social and Mobile Appmetrics
Fixes
• When the "Time Spent per Visit" metric was selected for a Data Warehouse report, the downloaded report incorrectly listedthis column as "Time Spent on Site". The downloaded report now correctly labels this metric as "Time Spent per Visit".
• Resolved an issue in data warehouse where the Visitor ID breakdown and visit/visitor counts were reporting incorrect valuesin conjunction with custom visitor IDs.
• Resolved an issue in the data warehouse request manager where it was not properly displaying custom names for purchaseand checkout events."
• Removed the "TnT" breakdown since we recommend using the other Target breakdowns instead (campaign, campaign >recipe, recipe, and so on).
Data Warehouse (07/18/2013)
The DataWarehouse maintenance release (07/18/2013) includes the following changes:
New Features
DescriptionFeature
Social and Mobile App metrics can now be included in segments created in reports and analytics,ad hoc analysis, and data warehouse.
Segment using Social andMobile App metrics
Fixes
• Data warehouse requests can now report hourly granularity for reporting periods longer than 14 days.
176Data Warehouse
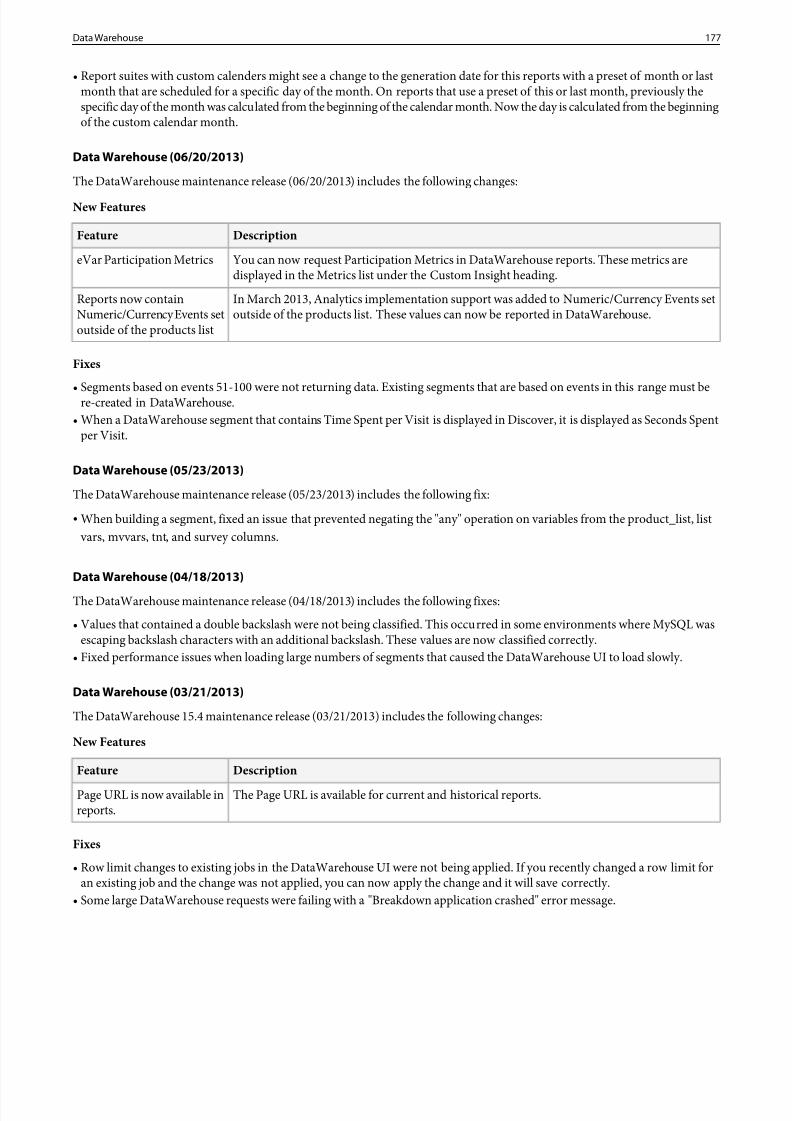
8/18/2019 Analytics Reference Adobe
http://slidepdf.com/reader/full/analytics-reference-adobe 177/332
• Report suites with custom calenders might see a change to the generation date for this reports with a preset of month or lastmonth that are scheduled for a specific day of the month. On reports that use a preset of this or last month, previously thespecific day of the month was calculated from the beginning of the calendar month. Now the day is calculated from the beginningof the custom calendar month.
Data Warehouse (06/20/2013)
The DataWarehouse maintenance release (06/20/2013) includes the following changes:
New Features
DescriptionFeature
You can now request Participation Metrics in DataWarehouse reports. These metrics aredisplayed in the Metrics list under the Custom Insight heading.
eVar Participation Metrics
In March 2013, Analytics implementation support was added to Numeric/Currency Events setoutside of the products list. These values can now be reported in DataWarehouse.
Reports now containNumeric/Currency Events setoutside of the products list
Fixes
•Segments based on events 51-100 were not returning data. Existing segments that are based on events in this range must bere-created in DataWarehouse.
• When a DataWarehouse segment that contains Time Spent per Visit is displayed in Discover, it is displayed as Seconds Spentper Visit.
Data Warehouse (05/23/2013)
The DataWarehouse maintenance release (05/23/2013) includes the following fix:
• When building a segment, fixed an issue that prevented negating the "any" operation on variables from the product_list, list vars, mvvars, tnt, and survey columns.
Data Warehouse (04/18/2013)
The DataWarehouse maintenance release (04/18/2013) includes the following fixes:
• Values that contained a double backslash were not being classified. This occurred in some environments where MySQL wasescaping backslash characters with an additional backslash. These values are now classified correctly.
• Fixed performance issues when loading large numbers of segments that caused the DataWarehouse UI to load slowly.
Data Warehouse (03/21/2013)
The DataWarehouse 15.4 maintenance release (03/21/2013) includes the following changes:
New Features
DescriptionFeature
The Page URL is available for current and historical reports.Page URL is now available inreports.
Fixes
• Row limit changes to existing jobs in the DataWarehouse UI were not being applied. If you recently changed a row limit foran existing job and the change was not applied, you can now apply the change and it will save correctly.
• Some large DataWarehouse requests were failing with a "Breakdown application crashed" error message.
177Data Warehouse
8/18/2019 Analytics Reference Adobe
http://slidepdf.com/reader/full/analytics-reference-adobe 178/332
• Now replace "&" with "&" in segment rules.
Data Warehouse (02/21/2013)
The DataWarehouse maintenance release (02/21/2013) includes the following changes:
• Fixed an issue in Geo Location Reports that caused the U.S. state of Connecticut to be improperly classified as AustralianCapital Territory. This caused reports to not return data for Connecticut, and to return extra data for the Australian Capital
Territory.
Data Warehouse (11/08/2012)
The DataWarehouse maintenance release (11/08/2012) includes the following enhancements and fixes:
• Corrected an issue with the JavaScript breakdown. In the past, the dimension values for this breakdown were numerical values.Now the dimension values are enabled or disabled as they are in SiteCatalyst.
Data Warehouse (10/18/2012)
The data warehouse maintenance release (10/18/12) includes the following enhancements and fixes:
• Improved Browser Type reporting in data warehouse to more closely match SiteCatalyst. Uncommon browsers will be reportedas "Other" and cases where no browser was detected will be reported as an empty string (null).• Corrected inconsistencies between data warehouse and SiteCatalyst related to case sensitivity and traffic variables. Unless
traffic variables are configured to ignore case, data warehouse now treats the following variables as case-sensitive: page, channel,server, custom link, download link, exit link.
Data Warehouse (9/21/2012)
The following fixes and enhancements are available for data warehouse:
• Resolved an issue where requests were being limited to 50 rows by default.• Resolved a number of issues related to how data warehouse handles the following situations in the product list. Data warehouse
matches marketing report rules for these situations:
• Ignores empty products, such as a comma "," with no additional data.• Ignores product entities that are a single dash ("-").• Properly parses product events that contain tabs or newline characters.• Ignores instances of event "0", but continues parsing the product list rather than terminating the parse.• Skips situations with event values where an equal sign is missing. Parsing now continues rather than terminating.• Trims only spaces rather than all whitespace characters.• No longer trims spaces if the space is preceded by a backslash.
• Resolved an issue where using a classification as a segment criteria was not working properly if the classification was for amerchandising eVar. Specifically, segment criteria such aswhere classification is not null was not working formerchandising eVars.
• Resolved an issue where using a classification as a segment criteria was not working properly, if the classification was for certain
visit-reporting dimensions (such as Entry Page, Exit Page, and so on).• Resolved an issue occurring when using multiple segment containers in a segment. The containers were not being connectedcorrectly byOR conditions.
Data Warehouse (8/16/2012)
• Fixed an issue with the SiteCatalyst to Insight feed that can cause the Insight work node to crash when the data set containsinvalid data.
178Data Warehouse
8/18/2019 Analytics Reference Adobe
http://slidepdf.com/reader/full/analytics-reference-adobe 179/332
Data Warehouse (7/19/2012)
The data warehouse release (07/19/12) includes the following enhancements and fixes:
Mobile Carrier Report
Added support in data warehouse for the new Mobile Carrier Report .
Updated Connection Type Report
Updated the Data warehouse Connection Type Report to match the new business logic of the Connection Type report.
Conversion Variable Instances
Added support in data warehouse for conversion variable Instances metrics (i.e. evar1 Instances, eVar2 Instances, etc.).
Fixes:
• When running the Entry Pages Report , data warehouse now reports the actual entry page for visits that start prior to thereport date range and end within the report date range (i.e. visits that cross the start date boundary.) In the past, data warehousewould report the first page encountered during the report date range, not the actual entry page.
• Resolved an issue in data warehouse where theReferring Domains Report would sometimes include values that wereURL-encoded strings that were not actual referring domains.
• Resolved an issue in data warehouse where theis not null operator in the segment builder was not functioning properly withmulti-value variables (e.g. the Products variable.)
• Resolved an issue in data warehouse where theless than ! operation in the segment builder was not functioning properly whenapplied to a classification.
• Resolved an issue where theIs NULL operator in the segment builder was not functioning properly when applied to aclassification.
• Data warehouse now supports publishing lists for emailing data warehouse reports.• Resolved an issue with the advanced scheduler in data warehouse. The advanced scheduler now supports limiting the number
of rows returned in a data warehouse request. To retrieve all rows, enter 0 (this is the default setting).
Data Warehouse (4/26/2012)
The data warehouse maintenance release (04/26/2012) includes the following enhancements and fixes:
• A new lookup file calledcolumn_headers.tsv will be included in the files delivered as part of all raw clickstream datafeeds. This new lookup file contains a single row comprising the list of column names for the data found inhit_data.tsv .
Data Warehouse (3/29/2012)
The data warehouse maintenance release (03/29/2012) includes the following enhancements and fixes:
• Beginning April 26 2012, a new lookup file calledcolumn_headers.tsv will be included in the files delivered as part of all raw clickstream data feeds. This new lookup file contains a single row comprising the list of column names for the datafound in hit_data.tsv.
• Fixed ASI issue where, under some circumstances, ecommerce data would be zeroed. This issue caused data discrepanciesbetween ASI segments and other identical Marketing Cloud segments.
• Numeric and Currency events now report with 2 digit precision rather than truncating at the integer.
Data Warehouse (1/19/2012)
The following data warehouse fixes are included in this release:
• Resolved an issue where orders added to a merchandising eVar were not being de-duplicated properly.• Resolved an issue where linefeed characters were sometimes improperly inserted in the middle of rows.• Resolved an issue with ASI processing, where historical data loads were sometimes omitting part of the data (manifested most
frequently when the historical data has few rows.)
179Data Warehouse
8/18/2019 Analytics Reference Adobe
http://slidepdf.com/reader/full/analytics-reference-adobe 180/332
Data Warehouse (11/03/2011)
Added the ability for administrators to edit the schedule for data warehouse requests created by other users.
Data Warehouse (10/07/2011)
The following fixes apply to this maintenance release:
• Added Visitor ID as a breakdown. The Visitor ID breakdown is retroactively available and can be requested for dates earlierthan this release (10/07/2011).
• Added Total Time Spent as a metric.• Added Mobile Device Type as a breakdown.• Fixed an issue where certain long-running data warehouse requests were not getting delivered.• Resolved an issue where data warehouse was not handling custom calendars correctly.• Resolved an issue where date presets such as "last week" were using incorrect date ranges when scheduled on the first day of
the period.
Data Warehouse (9/20/2011)
• Added is null and is not null as new operators in the data warehouse segment builder.• Data warehouse now supports compression of files over 2GB. Most file compression software handles files of this size. If you
experience problems, you might need to update your file compression software.
Data Warehouse (8/2012)
• Fixed an issue in which thestarts with and does not start with operators in the segment builder were not always workingcorrectly.
• Fixed an issue in which segments based on classifications of values in the product list worked incorrectly in some cases.• Fixed an issue where segments based on Exit Page were not always functioning correctly.• Added support in ASI for hits with user-defined timestamps.• Fixed an issue in which the currency exchange rate was not being taken into account for revenue reporting under certain
circumstances.• Fixed an issue in which custom links, download links, and exit links were not calculated correctly.•
Added support in data warehouse for reporting and segmentation based on mobile device attributes.
Data Warehouse (7/2011)
• Resolved an issue with the data warehouse API, where erroneous UTF8 byte order marks were included in SOAP/JSON RPCrequests.
• Resolved an issue with the data warehouse API, where requesting fields such as?browser would return ID numbers rather thanthe string values of the field.
• Resolved an issue with the data warehouse API, where theCheckRequestStatus function would fail if the delivery methodspecified was FTP or email.
• Added an option in the data warehouse API WSDL that allows you to create a segment via the API but not display the segmentin the data warehouse interface.
• Resolved an issue where thecontains at least one of and contains all of segment operators in data warehouse were not workingproperly in certain situations.
• Resolved an issue where data warehouse breakdowns on classifications reported incorrectly when applying a visit-basedsegment.
• Resolved an issue where data warehouse requests that include both a list property and a classification of that list property werefailing.
• Resolved an issue where custom links, download links, and exit links were not reporting correctly in data warehouse.
180Data Warehouse
8/18/2019 Analytics Reference Adobe
http://slidepdf.com/reader/full/analytics-reference-adobe 181/332
• Resolved an issue where theDays Before First Purchase breakdown in data warehouse reported spurious data in certainsituations.
• Resolved an issue where duplicate rows of data were sometimes showing up in data warehouse reports.• Resolved an issue where visit-based segments on classifications of product and category were not working.• Resolved an issue where eVar fields were reporting incorrect data in certain data feeds created by Engineering Services.• Improved the information shown in the Status Description field displayed in theData Warehouse Request Detail pane in
the data warehouse interface.• Improved scheduling algorithms. The result is that many data warehouse jobs will start processing earlier after midnight.• Resolved an issue where VISTA processing on the product list variable was not functioning properly.• Resolved an issue where certain complex data warehouse requests with a high number of unique value combinations and many
columns would fail.
Data Warehouse (5/2011)
• Made a change to the contents of the .fin file for data feeds. A fourth line of text in the.fin file now provides an MD5checksum for the data feed file, providing customers a way to validate the file.
• Fixed an issue with the Data Warehouse Campaign Name Report (last touch detail) that caused the campaign name to beblank.
• Fixed an issue where the Site Title and Company values were swapped in the e-mail that accompanies data warehouse reports.
Data Warehouse (4/2011)
• Resolved an issue in theDays Since Last Visit report where Group A results were being incorrectly included in Group H.• Resolved an issue where selectingSend Digital Files under Advanced Delivery Options caused data warehouse reports to
fail.• Added support for Adobe Target reports.• Added support for the SiteCatalystSurvey reports.
Data Warehouse (1/2011)
• Fixed an issue with the time stamps used in scheduled data warehouse reports.• The logic behind the Referring Domains breakdown has been updated so that it exactly matches the data reported in SiteCatalyst.• Fixed an issue where the "Last 53 Weeks" preset date range was not working properly.• Fixed an issue where data warehouse sometimes displayed incorrect dates in the "From" and "To" fields of a DW report.• Fixed an issue where data warehouse sometimes counted custom event metrics incorrectly with Search Engine Keyword
Reports.• Fixed an issue where data warehouse sometimes calculated custom event metrics incorrectly for merchandising eVars.• Fixed an issue where data warehouse sometimes calculated custom event metrics incorrectly when segmenting based on a
merchandising eVar.• Fixed an issue where data warehouse sometimes calculated visits and/or visitors incorrectly when multiple products are present
in the product string.• Fixed an issue where SearchCenter classifications were not available in data warehouse.• Fixed an issue where time zones were given the wrong sign in data warehouse.• Added support for time zones with a 30-minute offset.• Fixed a bug where data warehouse would not process requests that included a classification without data in SiteCatalyst yet.
181Data Warehouse
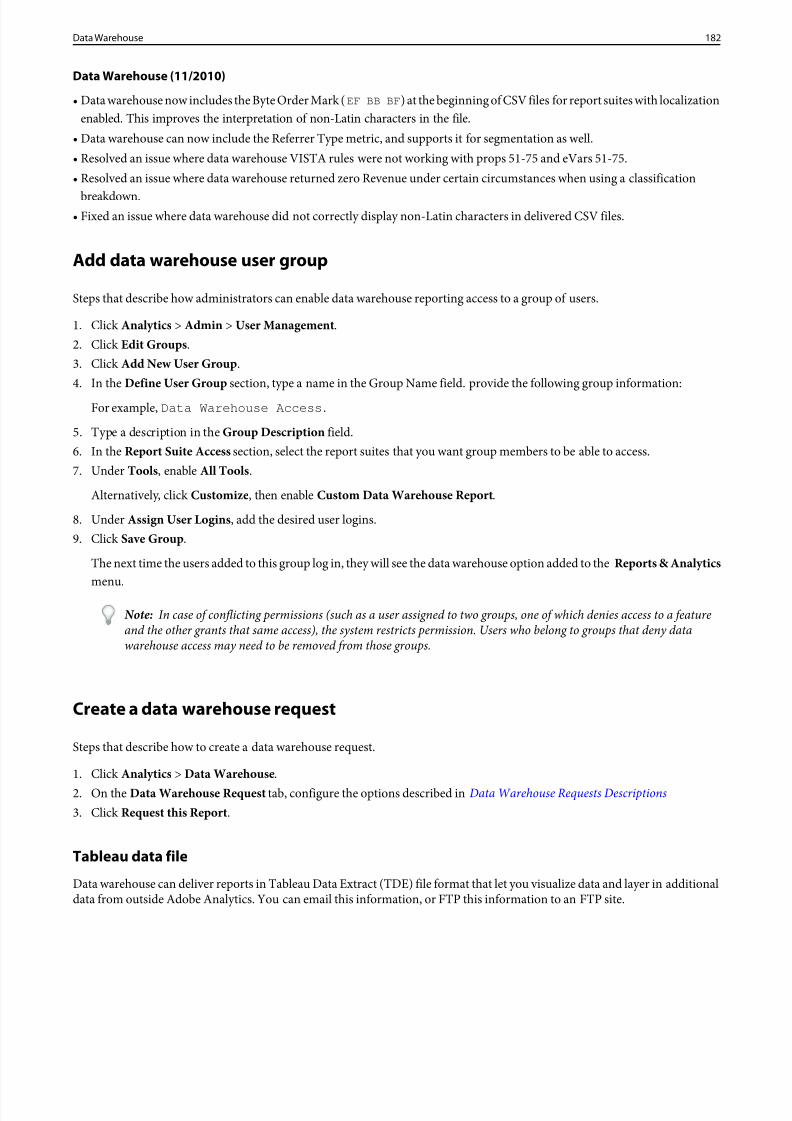
8/18/2019 Analytics Reference Adobe
http://slidepdf.com/reader/full/analytics-reference-adobe 182/332
Data Warehouse (11/2010)
• Data warehouse now includes the Byte Order Mark (EF BB BF ) at the beginning of CSV files for report suites with localizationenabled. This improves the interpretation of non-Latin characters in the file.
• Data warehouse can now include the Referrer Type metric, and supports it for segmentation as well.• Resolved an issue where data warehouse VISTA rules were not working with props 51-75 and eVars 51-75.• Resolved an issue where data warehouse returned zero Revenue under certain circumstances when using a classification
breakdown.• Fixed an issue where data warehouse did not correctly display non-Latin characters in delivered CSV files.
Add data warehouse user group
Steps that describe how administrators can enable data warehouse reporting access to a group of users.
1. ClickAnalytics > Admin > User Management .2. ClickEdit Groups .3. ClickAdd New User Group .4. In the Define User Group section, type a name in the Group Name field. provide the following group information:
For example, Data Warehouse Access .
5. Type a description in the Group Description field.6. In the Report Suite Access section, select the report suites that you want group members to be able to access.7. Under Tools , enable All Tools .
Alternatively, clickCustomize , then enable Custom Data Warehouse Report .
8. Under Assign User Logins, add the desired user logins.9. ClickSave Group.
The next time the users added to this group log in, they will see the data warehouse option added to theReports & Analyticsmenu.
Note: In case of conflicting permissions (such as a user assigned to two groups, one of which denies access to a featureand the other grants that same access), the system restricts permission. Users who belong to groups that deny datawarehouse access may need to be removed from those groups.
Create a data warehouse request
Steps that describe how to create a data warehouse request.
1. ClickAnalytics > Data Warehouse .2. On the Data Warehouse Request tab, configure the options described in Data Warehouse Requests Descriptions3. ClickRequest this Report .
Tableau data file
Data warehouse can deliver reports in Tableau Data Extract (TDE) file format that let you visualize data and layer in additionaldata from outside Adobe Analytics. You can email this information, or FTP this information to an FTP site.
182Data Warehouse
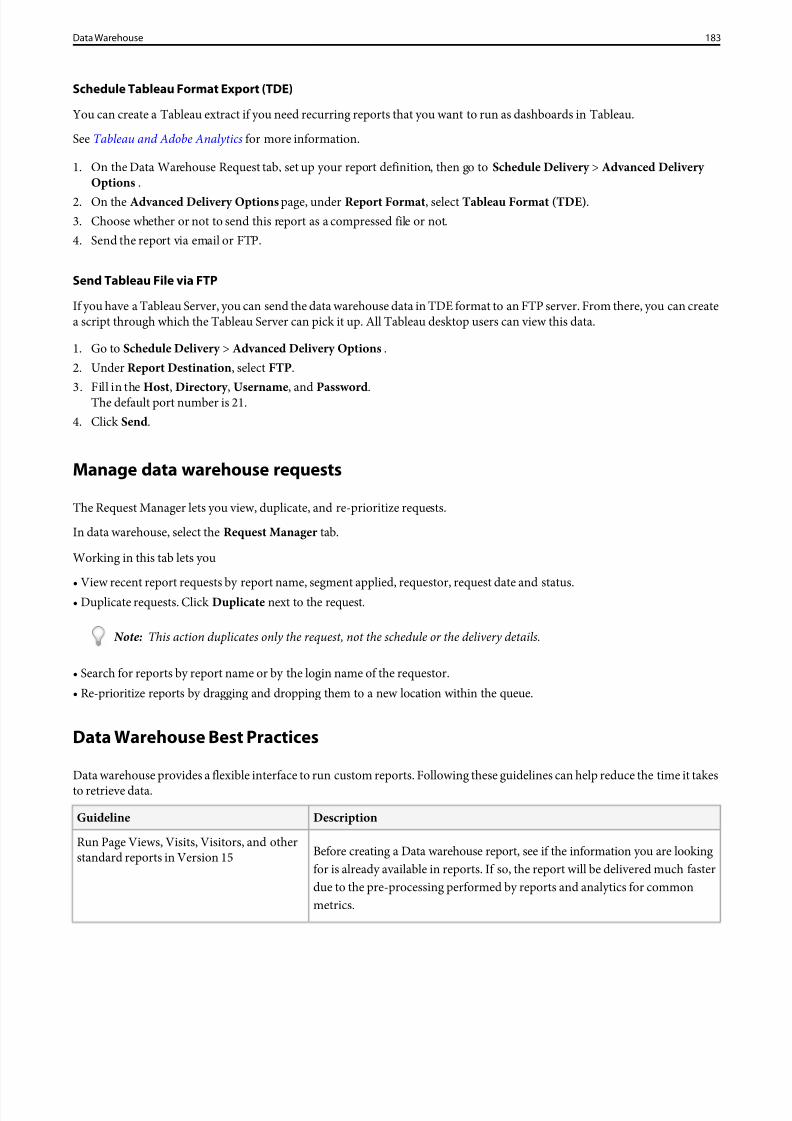
8/18/2019 Analytics Reference Adobe
http://slidepdf.com/reader/full/analytics-reference-adobe 183/332
Schedule Tableau Format Export (TDE)
You can create a Tableau extract if you need recurring reports that you want to run as dashboards in Tableau.
SeeTableau and Adobe Analytics for more information.
1. On the Data Warehouse Request tab, set up your report definition, then go to Schedule Delivery > Advanced Delivery Options .
2. On the Advanced Delivery Options page, under Report Format , selectTableau Format (TDE) .3. Choose whether or not to send this report as a compressed file or not.4. Send the report via email or FTP.
Send Tableau File via FTP
If you have a Tableau Server, you can send the data warehouse data in TDE format to an FTP server. From there, you can createa script through which the Tableau Server can pick it up. All Tableau desktop users can view this data.
1. Go to Schedule Delivery > Advanced Delivery Options .2. Under Report Destination , selectFTP.
3. Fill in theHost , Directory , Username , and Password .The default port number is 21.4. ClickSend.
Manage data warehouse requests
The Request Manager lets you view, duplicate, and re-prioritize requests.
In data warehouse, select the Request Manager tab.
Working in this tab lets you
•View recent report requests by report name, segment applied, requestor, request date and status.• Duplicate requests. ClickDuplicate next to the request.
Note: This action duplicates only the request, not the schedule or the delivery details.
• Search for reports by report name or by the login name of the requestor.• Re-prioritize reports by dragging and dropping them to a new location within the queue.
Data Warehouse Best Practices
Data warehouse provides a flexible interface to run custom reports. Following these guidelines can help reduce the time it takesto retrieve data.
DescriptionGuideline
Before creating a Data warehouse report, see if the information you are lookingfor is already available in reports. If so, the report will be delivered much faster
Run Page Views, Visits, Visitors, and otherstandard reports in Version 15
due to the pre-processing performed by reports and analytics for commonmetrics.
183Data Warehouse
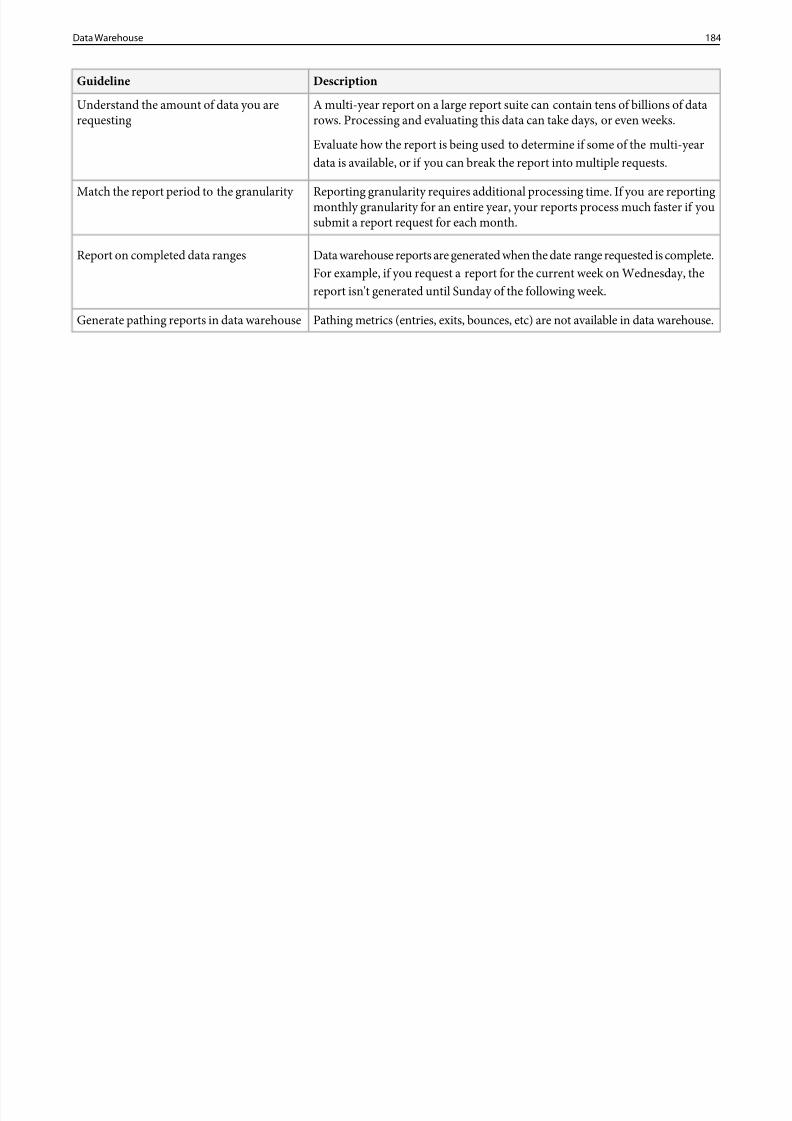
8/18/2019 Analytics Reference Adobe
http://slidepdf.com/reader/full/analytics-reference-adobe 184/332
DescriptionGuideline
A multi-year report on a large report suite can contain tens of billions of datarows. Processing and evaluating this data can take days, or even weeks.
Evaluate how the report is being used to determine if some of the multi-yeardata is available, or if you can break the report into multiple requests.
Understand the amount of data you arerequesting
Reporting granularity requires additional processing time. If you are reportingmonthly granularity for an entire year, your reports process much faster if yousubmit a report request for each month.
Match the report period to the granularity
Data warehouse reports are generated when the date range requested is complete.For example, if you request a report for the current week on Wednesday, thereport isn't generated until Sunday of the following week.
Report on completed data ranges
Pathing metrics (entries, exits, bounces, etc) are not available in data warehouse.Generate pathing reports in data warehouse
184Data Warehouse
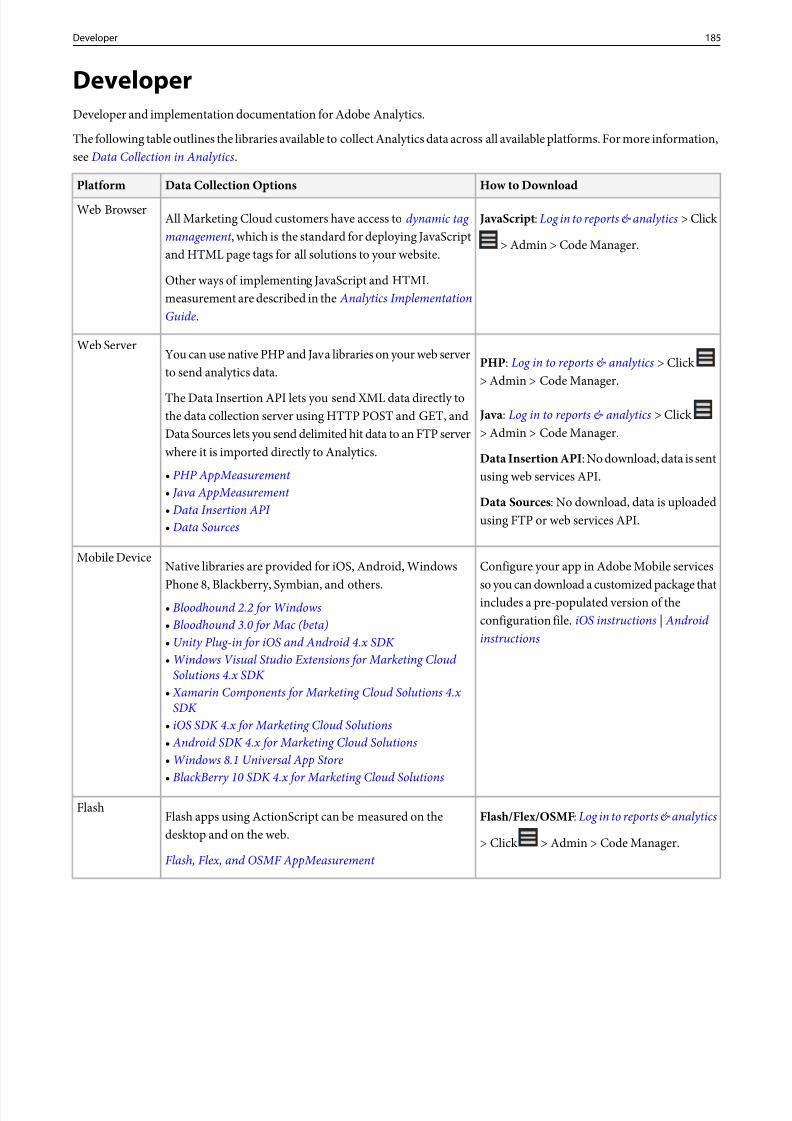
8/18/2019 Analytics Reference Adobe
http://slidepdf.com/reader/full/analytics-reference-adobe 185/332
DeveloperDeveloper and implementation documentation for Adobe Analytics.
The following table outlines the libraries available to collect Analytics data across all available platforms. For more information,see Data Collection in Analytics.
How to DownloadData Collection OptionsPlatform
JavaScript: Log in to reports & analytics > Click
> Admin > Code Manager.
All Marketing Cloud customers have access todynamic tag management , which is the standard for deploying JavaScriptand HTML page tags for all solutions to your website.
Web Browser
Other ways of implementing JavaScript and HTMLmeasurement are described in the Analytics ImplementationGuide.
PHP : Log in to reports & analytics > Click> Admin > Code Manager.
You can use native PHP and Java libraries on your web serverto send analytics data.
The Data Insertion API lets you send XML data directly tothe data collection server using HTTP POST and GET, and
Web Server
Java: Log in to reports & analytics > Click> Admin > Code Manager.Data Sources lets you send delimited hit data to an FTP server
where it is imported directly to Analytics. Data Insertion API : No download, data is sentusing web services API.• PHP AppMeasurement
• Java AppMeasurement Data Sources : No download, data is uploadedusing FTP or web services API.
• Data Insertion API • Data Sources
Configure your app in Adobe Mobile services
so you can download a customized package that
Native libraries are provided for iOS, Android, Windows
Phone 8, Blackberry, Symbian, and others.
Mobile Device
includes a pre-populated version of the• Bloodhound 2.2 for Windowsconfiguration file. iOS instructions | Android instructions
• Bloodhound 3.0 for Mac (beta)• Unity Plug-in for iOS and Android 4.x SDK • Windows Visual Studio Extensions for Marketing Cloud
Solutions 4.x SDK • Xamarin Components for Marketing Cloud Solutions 4.x
SDK • iOS SDK 4.x for Marketing Cloud Solutions• Android SDK 4.x for Marketing Cloud Solutions• Windows 8.1 Universal App Store• BlackBerry 10 SDK 4.x for Marketing Cloud Solutions
Flash/Flex/OSMF:Log in to reports & analytics
> Click > Admin > Code Manager.
Flash apps using ActionScript can be measured on thedesktop and on the web.
Flash, Flex, and OSMF AppMeasurement
Flash
185Developer
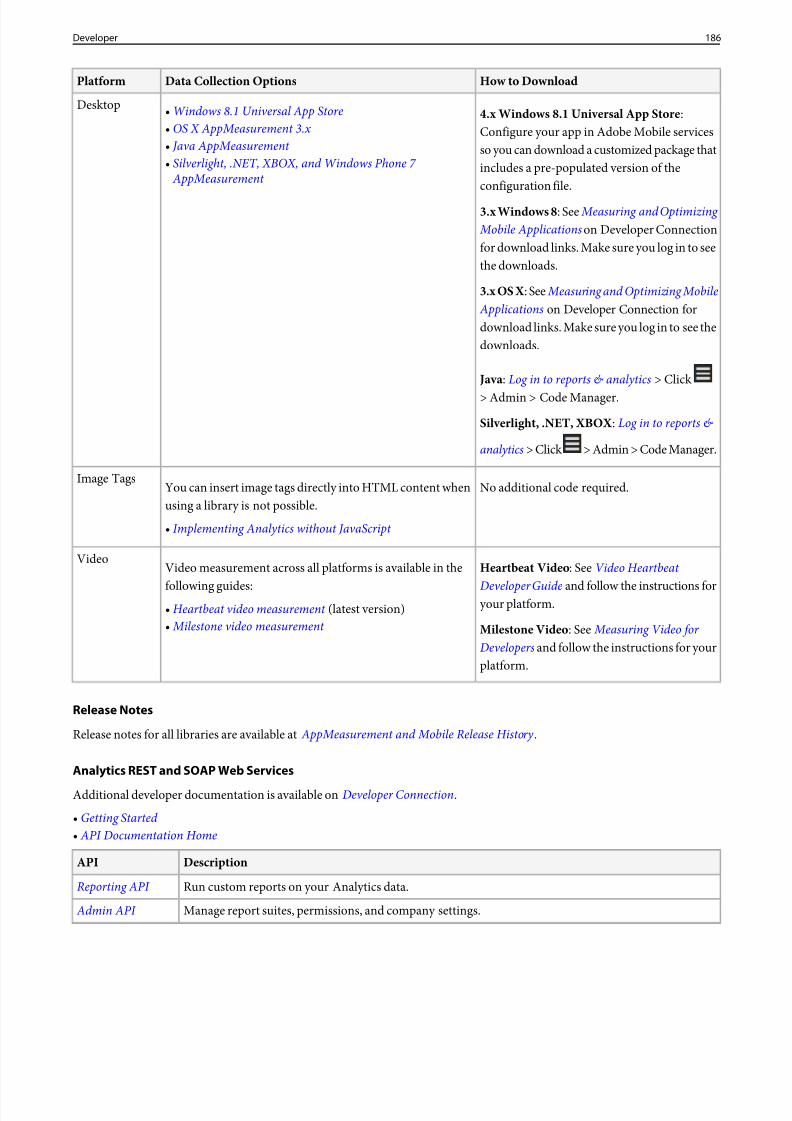
8/18/2019 Analytics Reference Adobe
http://slidepdf.com/reader/full/analytics-reference-adobe 186/332
How to DownloadData Collection OptionsPlatform
4.x Windows 8.1 Universal App Store :Configure your app in Adobe Mobile services
Desktop • Windows 8.1 Universal App Store• OS X AppMeasurement 3.x • Java AppMeasurement so you can download a customized package that• Silverlight, .NET, XBOX, and Windows Phone 7 AppMeasurement
includes a pre-populated version of theconfiguration file.
3.x Windows 8 : See Measuring and Optimizing Mobile Applications on Developer Connectionfor download links. Make sure you log in to seethe downloads.
3.x OS X : See Measuring and Optimizing Mobile Applications on Developer Connection fordownload links. Make sure you log in to see thedownloads.
Java: Log in to reports & analytics > Click> Admin > Code Manager.
Silverlight, .NET, XBOX : Log in to reports &
analytics > Click > Admin > Code Manager.
No additional code required.You can insert image tags directly into HTML content whenusing a library is not possible.
Image Tags
• Implementing Analytics without JavaScript
Heartbeat Video : SeeVideo Heartbeat
Developer Guide and follow the instructions foryour platform.
Video measurement across all platforms is available in the
following guides:
Video
• Heartbeat video measurement (latest version)Milestone Video : See Measuring Video for Developers and follow the instructions for yourplatform.
• Milestone video measurement
Release Notes
Release notes for all libraries are available at AppMeasurement and Mobile Release History .
Analytics REST and SOAP Web Services
Additional developer documentation is available on Developer Connection.
• Getting Started • API Documentation Home
DescriptionAPI
Run custom reports on your Analytics data.Reporting API
Manage report suites, permissions, and company settings. Admin API
186Developer
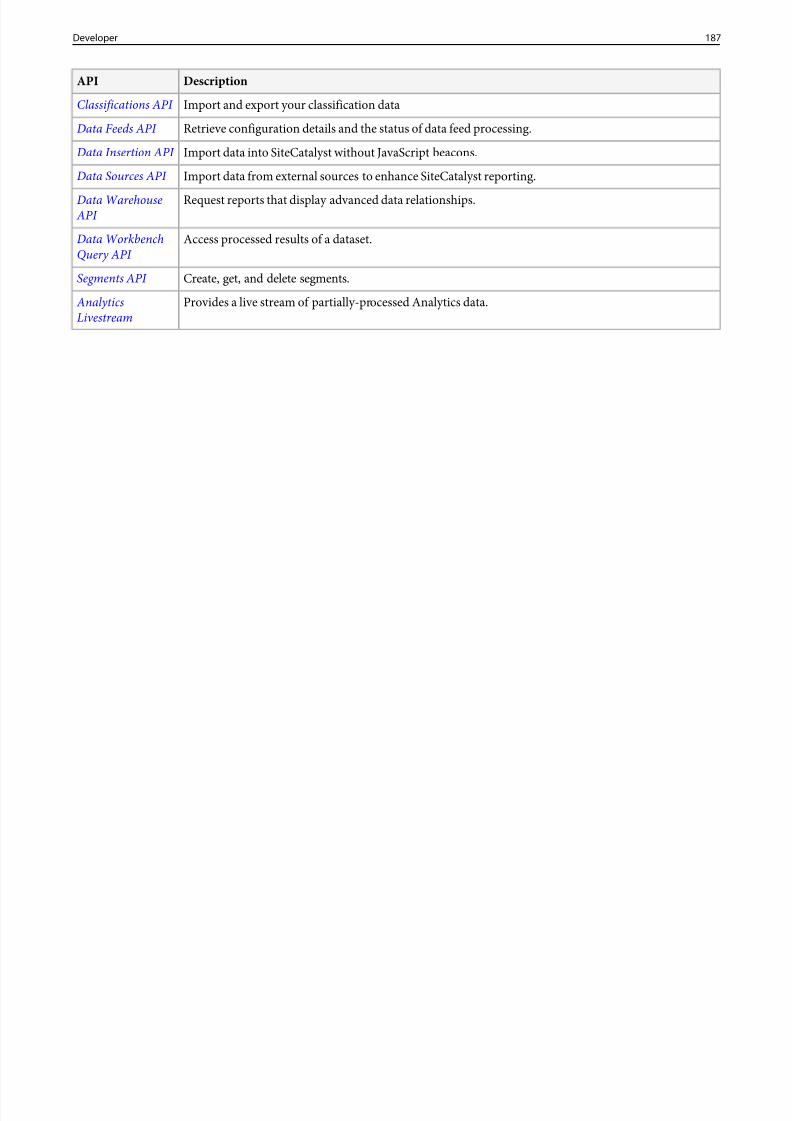
8/18/2019 Analytics Reference Adobe
http://slidepdf.com/reader/full/analytics-reference-adobe 187/332
DescriptionAPI
Import and export your classification dataClassifications API
Retrieve configuration details and the status of data feed processing.Data Feeds API
Import data into SiteCatalyst without JavaScript beacons.Data Insertion API
Import data from external sources to enhance SiteCatalyst reporting.Data Sources API
Request reports that display advanced data relationships.Data Warehouse API
Access processed results of a dataset.Data WorkbenchQuery API
Create, get, and delete segments.Segments API
Provides a live stream of partially-processed Analytics data. AnalyticsLivestream
187Developer
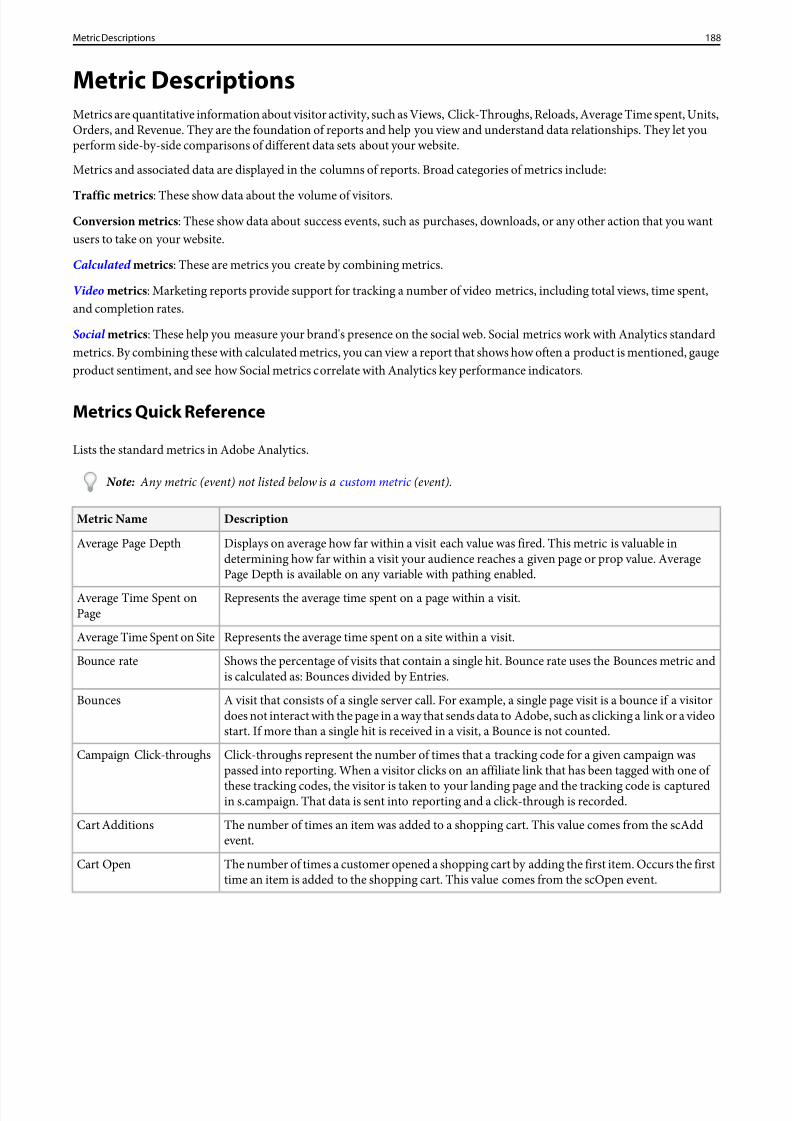
8/18/2019 Analytics Reference Adobe
http://slidepdf.com/reader/full/analytics-reference-adobe 188/332
Metric DescriptionsMetrics are quantitative information about visitor activity, such as Views, Click-Throughs, Reloads, Average Time spent, Units,Orders, and Revenue. They are the foundation of reports and help you view and understand data relationships. They let youperform side-by-side comparisons of different data sets about your website.
Metrics and associated data are displayed in the columns of reports. Broad categories of metrics include:
Traffic metrics : These show data about the volume of visitors.Conversion metrics : These show data about success events, such as purchases, downloads, or any other action that you wantusers to take on your website.
Calculated metrics : These are metrics you create by combining metrics.
Video metrics : Marketing reports provide support for tracking a number of video metrics, including total views, time spent,and completion rates.
Social metrics : These help you measure your brand's presence on the social web. Social metrics work with Analytics standardmetrics. By combining these with calculated metrics, you can view a report that shows how often a product is mentioned, gaugeproduct sentiment, and see how Social metrics correlate with Analytics key performance indicators.
Metrics Quick Reference
Lists the standard metrics in Adobe Analytics.
Note: Any metric (event) not listed below is a custom metric (event).
DescriptionMetric Name
Displays on average how far within a visit each value was fired. This metric is valuable indetermining how far within a visit your audience reaches a given page or prop value. AveragePage Depth is available on any variable with pathing enabled.
Average Page Depth
Represents the average time spent on a page within a visit.Average Time Spent onPage
Represents the average time spent on a site within a visit.Average Time Spent on Site
Shows the percentage of visits that contain a single hit. Bounce rate uses the Bounces metric andis calculated as: Bounces divided by Entries.
Bounce rate
A visit that consists of a single server call. For example, a single page visit is a bounce if a visitordoes not interact with the page in a way that sends data to Adobe, such as clicking a link or a videostart. If more than a single hit is received in a visit, a Bounce is not counted.
Bounces
Click-throughs represent the number of times that a tracking code for a given campaign waspassed into reporting. When a visitor clicks on an affiliate link that has been tagged with one of
Campaign Click-throughs
these tracking codes, the visitor is taken to your landing page and the tracking code is capturedin s.campaign. That data is sent into reporting and a click-through is recorded.
The number of times an item was added to a shopping cart. This value comes from the scAddevent.
Cart Additions
The number of times a customer opened a shopping cart by adding the first item. Occurs the firsttime an item is added to the shopping cart. This value comes from the scOpen event.
Cart Open
188Metric Descriptions
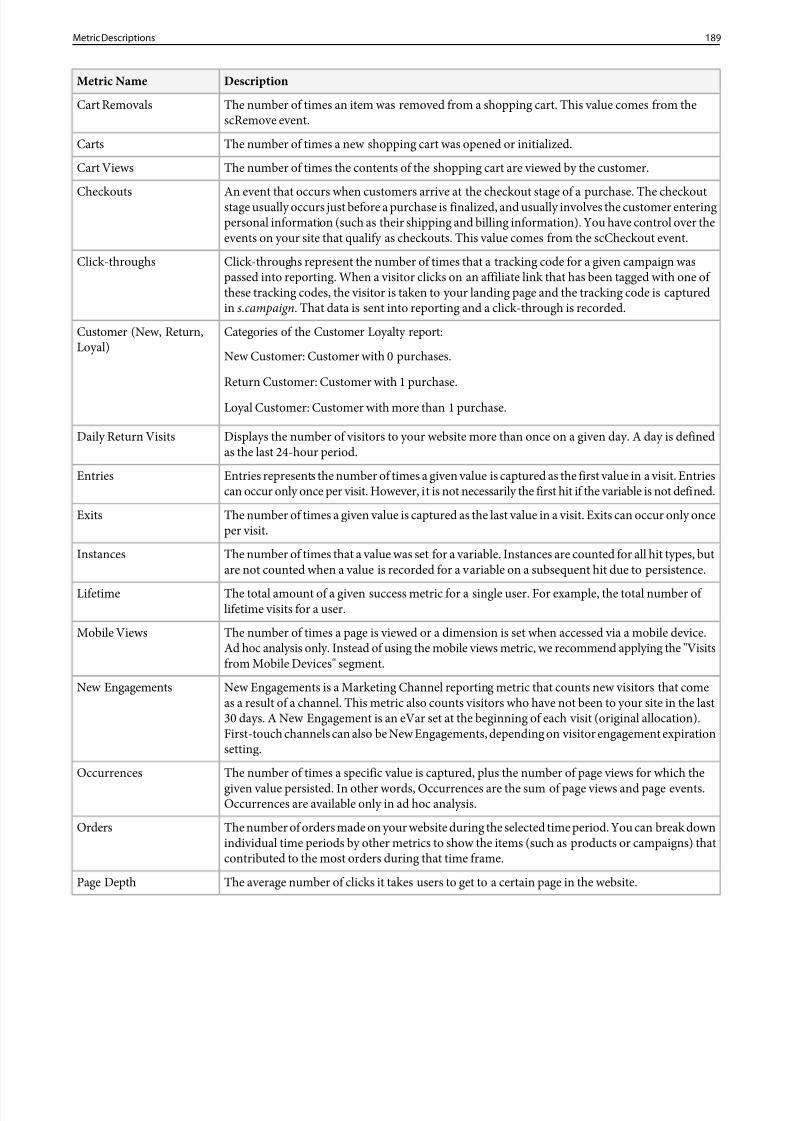
8/18/2019 Analytics Reference Adobe
http://slidepdf.com/reader/full/analytics-reference-adobe 189/332
8/18/2019 Analytics Reference Adobe
http://slidepdf.com/reader/full/analytics-reference-adobe 190/332
DescriptionMetric Name
Page events consist of image request data from non-standard image requests. Sources of non-standard image requests are download links, exit links, and custom link tracking.
Page Events
A Page View is counted for each server call that is sent. This metric represents total instances of Page View. TrackLink calls are not counted as page views and do not increment the Page Viewsmetric.
Page Views
The Path Views metric is based on pathing data, which is tracked for all users who accept persistentcookies.
Path Views
The term Path View is used to indicate the number of times a page was viewed, given the constraintsof the displayed path(s). This metric reports the number of page views for the given page thatoccurred within the selected path. This metric is available on the Paths report. Path Views showsyou how many times a particular sequence of pages were viewed.
Instance of the Product View being set. Occurs when the product detail page is viewed. This valuecomes from the prodView event.
Product Views
Counted when the same page name is loaded twice in a row. This typically indicates that the page
was refreshed. Note that visiting the same page twice in the same visit does not count as a reloadunless both visits occurred in-a-row.
Reloads
Shows the number of visits where visit number is greater than 1. Return Visits includes non-cookied visitors.
Return Visits
Revenue is captured on the purchase event, and is defined as the total dollar amount for the sumof the order for each product. This value comes from the purchase event.
Revenue
Searches is not a default metric - it is always a custom metric.Searches
It's the recommended default metric for search engines and keywords. This metric representsinstances of a click-through, and shows the page that is associated with a specific engine or keyword.Searches metric data can be reported retroactively to the beginning of the data set.
Single Access is defined by the number of visits to your site that contained a single unique PageName value. If a user comes to your site and clicks a tracked link, triggers an event (such as a
Single Access
video view), or reloads the page, the visit is still considered a Single Access visit. As long as valuefor the pageName variable does not change, any number of requests can be sent and the visit isstill considered a Single Access.
Metrics that report on the amount of time visitors spend on a page, site, or per visit.Time Spent
Total metrics report the value of all report line items for a reported period. If a filter is currently selected, the total might represent the filtered total instead of the report suite total. If no filter isselected total represents the report suite total.
Total
(Hourly, Daily, Weekly, Monthly, Quarterly, Yearly)
Unique Customer
A Unique Customer is counted once for that time frame but cannot be counted again, no matterhow many times the visitor returns to make a purchase. A Unique Visitor is counted once for thefirst visit in a specified period and not counted again until the period expires. After the periodexpires, the Unique Visitor is counted again. Unique Customers are always counted as UniqueVisitors because they must visit the site in order to make the purchase.
190Metric Descriptions
8/18/2019 Analytics Reference Adobe
http://slidepdf.com/reader/full/analytics-reference-adobe 191/332
DescriptionMetric Name
Shows the total number of unique visitors for the reporting period (can be configured to daily,weekly, monthly, quarterly, yearly).
Unique Visitors
The total units that were ordered for the selected time period. Because you have many unitspurchased per order, Units is a vital metric that reveals general inventory movement.
Units
The number of unique visitors to your site for a selected hour, day, week, month, quarter, or year.Visitors
A sequence of page views in a sitting. The visits metric is commonly used in reports that display the number of user sessions within the selected time period.
Visits
The visit metric is always associated with a time period, so you know whether to count a new visitif the same visitor returns to your site.
Metric Calculations
Metrics are calculated usingstandard , participation , recent , and linear allocation methods. Each method calculates values
differently based on formulas.DescriptionMetric Calculation
Full credit is given to the first variable value associated with the success event.Original
Full credit is given to the last variable value associated with the success event.Recent
When linear allocation is selected, success events are evenly divided across all variable valuesseen in the visit. For numeric and currency events such as Revenue, the monetary amount is
Linear
divided. For counter events such asOrders, a fraction of the event is awarded to each variable value in the visit. These fractions in reporting are summed, then rounded to the nearestinteger in reporting.
For example, in a visit where four pages are visited prior to a success event, each page wouldreceive credit for 25% of the event. If, in the same visit,campaign had two values, eachcampaign value would receive 50% of the credit for the event.
Assigns full credit to each variable value that contributed to a success event within a visit.This calculation can also apply across visitor sessions, if you use cross-visit participationmetrics.
Participation
SeeParticipation for more information.
Example - Metric Calculation
Assume your site has an internal search that is tracked using a conversion variable (eVar). The visitor performs several internalsearches before making a $100 purchase:
Pet > Feline > Cat > Kitten > $100 purchase
In reporting, credit allocation is as follows:
191Metric Descriptions
8/18/2019 Analytics Reference Adobe
http://slidepdf.com/reader/full/analytics-reference-adobe 192/332
ParticipationLinearLastFirsteVar Value
$100$25$0$100Pet
$100$25$0$0Feline
$100$25$0$0Cat
$100$25$100$0Kitten
Average Page Depth
Displays on average how far within a visit each value was fired. This metric is valuable in determining how far within a visityour audience reaches a given page or prop value.Average Page Depth is available on any variable withpathing enabled.
For example, if a visit contains the following path: Page A > Page B > Page C > Page D > Page E > Page F, the depth is an indexof where the page is. For example, "Page A" has a depth of 0, while "Page F." has a depth of five. The average is based on acombination of all visits. A page depth with a value of less than one (such as 0.9) is the mean value of all pages visited prior tothe page in question.
Page Depth helps you understand where a given page typically falls in a user path, regardless of previous or next pages in thispath. As such, it helps to provide insight into how the page fits into the overall picture of the user's experience on your site. Thisinsight can be best seen on a Pages report.
DescriptionUses
The calculation of page events and pages viewed divided by visits, showing the averageclick number of a page. Consider the same visit path:
Traffic
A > B > B > C > D > BThe click number is calculated for every page and page event, including reloads when"Count Repeat Instances" option is enabled (this is on by default in Ad hoc analysis, andis always on in Marketing Reports and Analytics). In this visit, page A receives the click number of 0. For page B, the click numbers would be 1, 2, and 5. The calculation for theaverage would be [(1+2+5) / 3] for a 2.67 Average Page Depth for page B.
When the "Count Repeat Instances" option is disabled, page B receives 1 and 4. Thesecond will not be counted. The calculation would be [(1+4) / 2 = 2.5].
N/AConversion
Average Time Spent
Represents the average time per sequence of a given value within a visit.
SeeTime Spent for information about this metric series.
192Metric Descriptions
8/18/2019 Analytics Reference Adobe
http://slidepdf.com/reader/full/analytics-reference-adobe 193/332
Bounces
A visit that consists of a single server call. For example, a single page visit is a bounce if a visitor does not interact with the pagein a way that sends data to Adobe, such as clicking a link or a video start. If more than a single hit is received in a visit, a Bounceis not counted.
Bounce Rate
Shows the percentage of visits that contain a single hit.
Bounce rate uses the Bounces metric and is calculated as:
Bounces divided by Entries
Bounce Rate does not include visits where multiple actions occurred on a single page. For example, a visit with a video view ona single page is a Single Access but not a Bounce.
Note: Existing implementations can sometimes contain a calculated metric that differs from the Analytics default metric.
Check the calculated metric definition to make sure there are no differences.
See thisKnowledgebase article for more information.
Calculated Metrics
Calculated metrics enable you to combine metrics to create mathematical operations that are used as new metrics. These metricscan be created for a report to which you add metrics. Administrators can create calculated metrics for all users of a report suite.
For example, you can create a metric that subtracts the Keyword Cost and the Cost of Goods from Revenue. This calculatedmetric lets you see the net revenue. You could then divide this value by Total Orders to see the average net revenue per order.
You can share a calculated metric through dashboards or bookmarks. When a user accesses a report that contains dashboardsor bookmarks with a calculated metric, reporting prompts the user to import the calculated metrics from the report, and tooptionally rename the metric. After the calculated metric is imported, it appears in the list of calculated metrics.
DescriptionUses
Value created from a calculation of standard metrics, such as,page views, divided by visits.
Traffic
Value created from a calculation of standard metrics, such as orders , divided by revenue.
Conversion
Value created from a calculation of standard metrics, such as orders , divided by revenue.
Ad Hoc Analysis
Note: As to the validity of the calculated metric, Adobe Analytics checks only whether the formula is mathematically valid.
Create a Calculated Metric
Steps that describe how to create calculated metrics.
1. Create or open a report that lets you add metrics, such as Site Content > Pages.
193Metric Descriptions
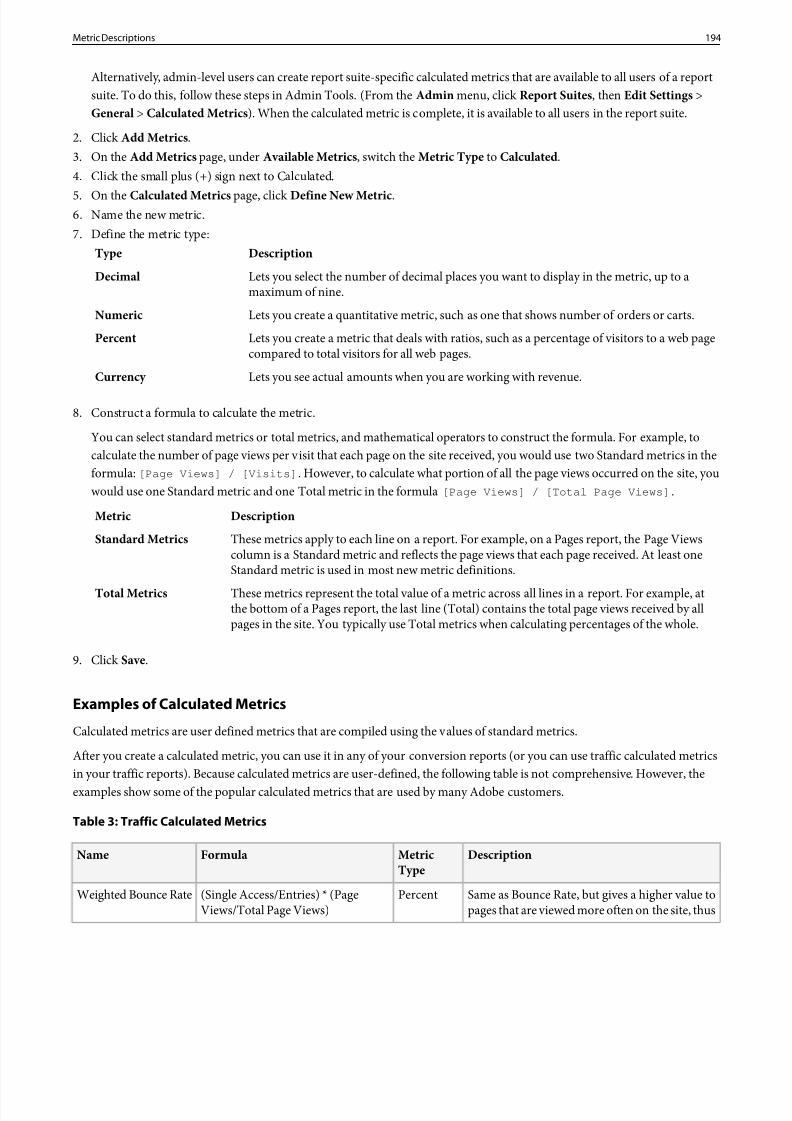
8/18/2019 Analytics Reference Adobe
http://slidepdf.com/reader/full/analytics-reference-adobe 194/332
Alternatively, admin-level users can create report suite-specific calculated metrics that are available to all users of a reportsuite. To do this, follow these steps in Admin Tools. (From theAdmin menu, click Report Suites , then Edit Settings >General > Calculated Metrics ). When the calculated metric is complete, it is available to all users in the report suite.
2. ClickAdd Metrics .3. On the Add Metrics page, under Available Metrics , switch the Metric Type to Calculated .4. Click the small plus (+) sign next to Calculated.
5. On the Calculated Metrics page, clickDefine New Metric .6. Name the new metric.7. Define the metric type:
DescriptionType
Lets you select the number of decimal places you want to display in the metric, up to amaximum of nine.
Decimal
Lets you create a quantitative metric, such as one that shows number of orders or carts.Numeric
Lets you create a metric that deals with ratios, such as a percentage of visitors to a web pagecompared to total visitors for all web pages.
Percent
Lets you see actual amounts when you are working with revenue.Currency
8. Construct a formula to calculate the metric.
You can select standard metrics or total metrics, and mathematical operators to construct the formula. For example, tocalculate the number of page views per visit that each page on the site received, you would use two Standard metrics in theformula: [Page Views] / [Visits] . However, to calculate what portion of all the page views occurred on the site, youwould use one Standard metric and one Total metric in the formula [Page Views] / [Total Page Views] .
DescriptionMetric
These metrics apply to each line on a report. For example, on a Pages report, the Page Viewscolumn is a Standard metric and reflects the page views that each page received. At least oneStandard metric is used in most new metric definitions.
Standard Metrics
These metrics represent the total value of a metric across all lines in a report. For example, atthe bottom of a Pages report, the last line (Total) contains the total page views received by allpages in the site. You typically use Total metrics when calculating percentages of the whole.
Total Metrics
9. ClickSave.
Examples of Calculated Metrics
Calculated metrics are user defined metrics that are compiled using the values of standard metrics.
After you create a calculated metric, you can use it in any of your conversion reports (or you can use traffic calculated metricsin your traffic reports). Because calculated metrics are user-defined, the following table is not comprehensive. However, theexamples show some of the popular calculated metrics that are used by many Adobe customers.
Table 3: Traffic Calculated Metrics
DescriptionMetricType
FormulaName
Same as Bounce Rate, but gives a higher value topages that are viewed more often on the site, thus
Percent(Single Access/Entries) * (PageViews/Total Page Views)
Weighted Bounce Rate
194Metric Descriptions
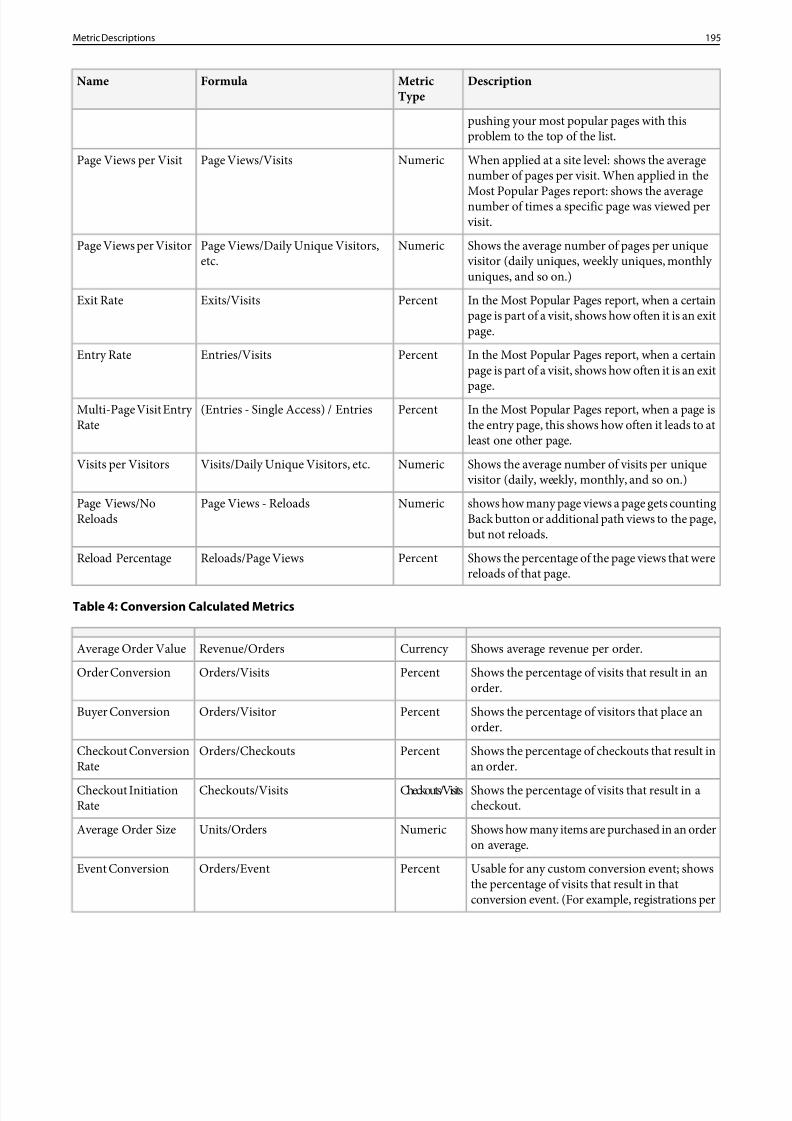
8/18/2019 Analytics Reference Adobe
http://slidepdf.com/reader/full/analytics-reference-adobe 195/332
DescriptionMetricType
FormulaName
pushing your most popular pages with thisproblem to the top of the list.
When applied at a site level: shows the averagenumber of pages per visit. When applied in the
NumericPage Views/VisitsPage Views per Visit
Most Popular Pages report: shows the averagenumber of times a specific page was viewed per visit.
Shows the average number of pages per unique visitor (daily uniques, weekly uniques, monthly uniques, and so on.)
NumericPage Views/Daily Unique Visitors,etc.
Page Views per Visitor
In the Most Popular Pages report, when a certainpage is part of a visit, shows how often it is an exitpage.
PercentExits/VisitsExit Rate
In the Most Popular Pages report, when a certainpage is part of a visit, shows how often it is an exit
page.
PercentEntries/VisitsEntry Rate
In the Most Popular Pages report, when a page isthe entry page, this shows how often it leads to atleast one other page.
Percent(Entries - Single Access) / EntriesMulti-Page Visit Entry Rate
Shows the average number of visits per unique visitor (daily, weekly, monthly, and so on.)
NumericVisits/Daily Unique Visitors, etc.Visits per Visitors
shows how many page views a page gets countingBack button or additional path views to the page,but not reloads.
NumericPage Views - ReloadsPage Views/NoReloads
Shows the percentage of the page views that werereloads of that page.
PercentReloads/Page ViewsReload Percentage
Table 4: Conversion Calculated Metrics
Shows average revenue per order.Currency Revenue/OrdersAverage Order Value
Shows the percentage of visits that result in anorder.
PercentOrders/VisitsOrder Conversion
Shows the percentage of visitors that place anorder.
PercentOrders/VisitorBuyer Conversion
Shows the percentage of checkouts that result inan order.
PercentOrders/CheckoutsCheckout ConversionRate
Shows the percentage of visits that result in acheckout.
Checkouts/VisitsCheckouts/VisitsCheckout InitiationRate
Shows how many items are purchased in an orderon average.
NumericUnits/OrdersAverage Order Size
Usable for any custom conversion event; showsthe percentage of visits that result in that
PercentOrders/EventEvent Conversion
conversion event. (For example, registrations per
195Metric Descriptions
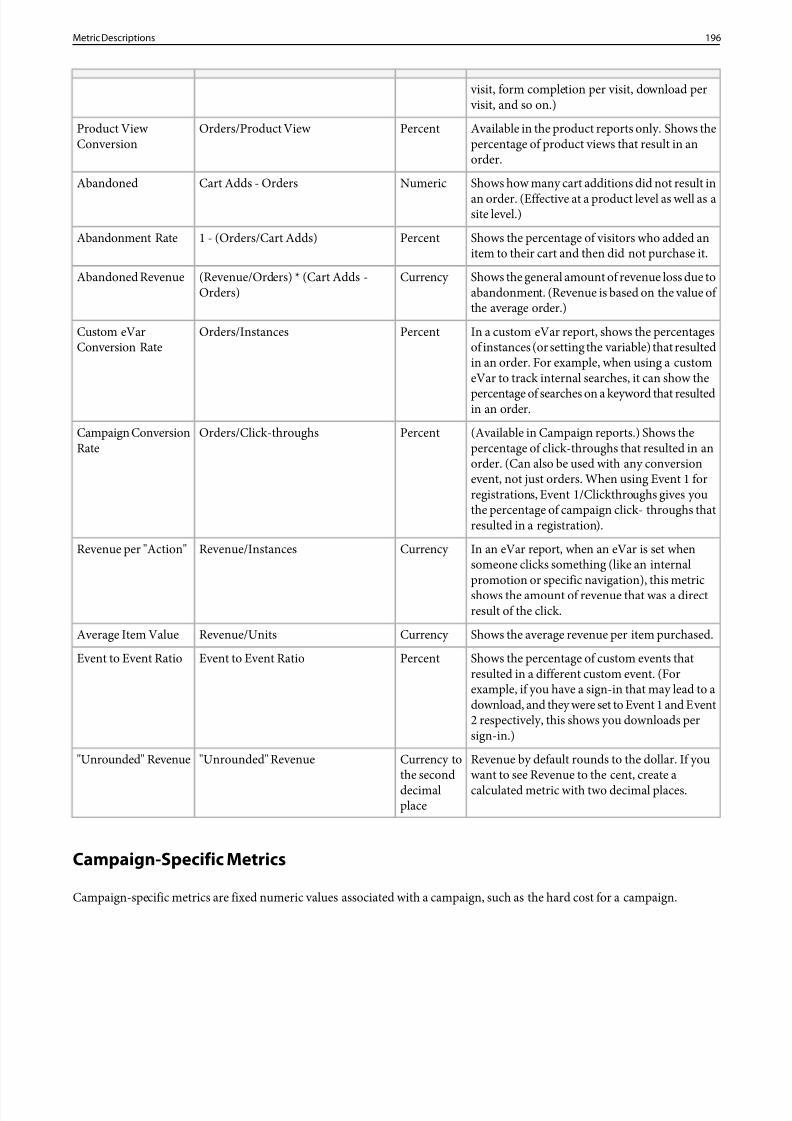
8/18/2019 Analytics Reference Adobe
http://slidepdf.com/reader/full/analytics-reference-adobe 196/332
visit, form completion per visit, download per visit, and so on.)
Available in the product reports only. Shows thepercentage of product views that result in anorder.
PercentOrders/Product View Product View Conversion
Shows how many cart additions did not result inan order. (Effective at a product level as well as asite level.)
NumericCart Adds - OrdersAbandoned
Shows the percentage of visitors who added anitem to their cart and then did not purchase it.
Percent1 - (Orders/Cart Adds)Abandonment Rate
Shows the general amount of revenue loss due toabandonment. (Revenue is based on the value of the average order.)
Currency (Revenue/Orders) * (Cart Adds -Orders)
Abandoned Revenue
In a custom eVar report, shows the percentagesof instances (or setting the variable) that resulted
PercentOrders/InstancesCustom eVarConversion Rate
in an order. For example, when using a customeVar to track internal searches, it can show thepercentage of searches on a keyword that resultedin an order.
(Available in Campaign reports.) Shows thepercentage of click-throughs that resulted in an
PercentOrders/Click-throughsCampaign ConversionRate
order. (Can also be used with any conversionevent, not just orders. When using Event 1 forregistrations, Event 1/Clickthroughs gives youthe percentage of campaign click- throughs thatresulted in a registration).
In an eVar report, when an eVar is set whensomeone clicks something (like an internal
Currency Revenue/InstancesRevenue per "Action"
promotion or specific navigation), this metricshows the amount of revenue that was a directresult of the click.
Shows the average revenue per item purchased.Currency Revenue/UnitsAverage Item Value
Shows the percentage of custom events thatresulted in a different custom event. (For
PercentEvent to Event RatioEvent to Event Ratio
example, if you have a sign-in that may lead to adownload, and they were set to Event 1 and Event2 respectively, this shows you downloads persign-in.)
Revenue by default rounds to the dollar. If youwant to see Revenue to the cent, create acalculated metric with two decimal places.
Currency tothe seconddecimalplace
"Unrounded" Revenue"Unrounded" Revenue
Campaign-Specific Metrics
Campaign-specific metrics are fixed numeric values associated with a campaign, such as the hard cost for a campaign.
196Metric Descriptions
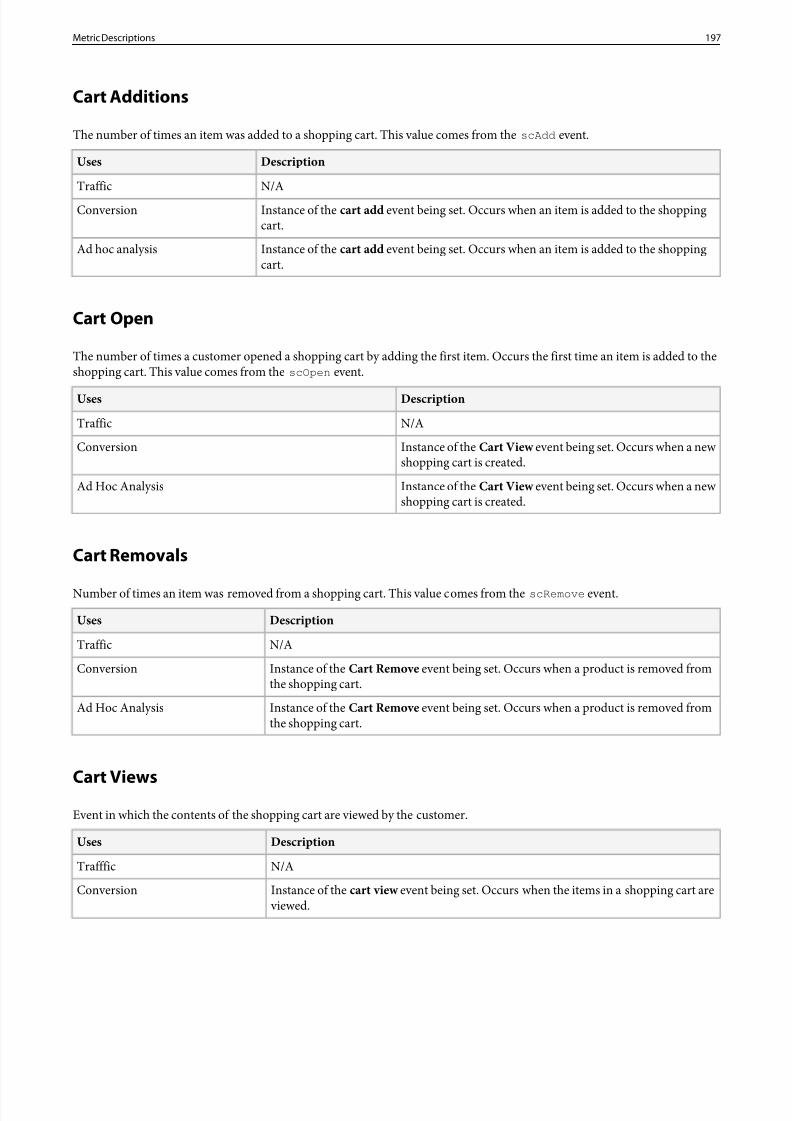
8/18/2019 Analytics Reference Adobe
http://slidepdf.com/reader/full/analytics-reference-adobe 197/332
Cart Additions
The number of times an item was added to a shopping cart. This value comes from thescAdd event.
DescriptionUses
N/ATraffic
Instance of the cart add event being set. Occurs when an item is added to the shoppingcart.
Conversion
Instance of the cart add event being set. Occurs when an item is added to the shoppingcart.
Ad hoc analysis
Cart Open
The number of times a customer opened a shopping cart by adding the first item. Occurs the first time an item is added to theshopping cart. This value comes from the scOpen event.
DescriptionUses
N/ATraffic
Instance of the Cart View event being set. Occurs when a new shopping cart is created.
Conversion
Instance of the Cart View event being set. Occurs when a new shopping cart is created.
Ad Hoc Analysis
Cart Removals
Number of times an item was removed from a shopping cart. This value comes from thescRemove event.
DescriptionUses
N/ATraffic
Instance of the Cart Remove event being set. Occurs when a product is removed fromthe shopping cart.
Conversion
Instance of the Cart Remove event being set. Occurs when a product is removed fromthe shopping cart.
Ad Hoc Analysis
Cart ViewsEvent in which the contents of the shopping cart are viewed by the customer.
DescriptionUses
N/ATrafffic
Instance of the cart view event being set. Occurs when the items in a shopping cart are viewed.
Conversion
197Metric Descriptions
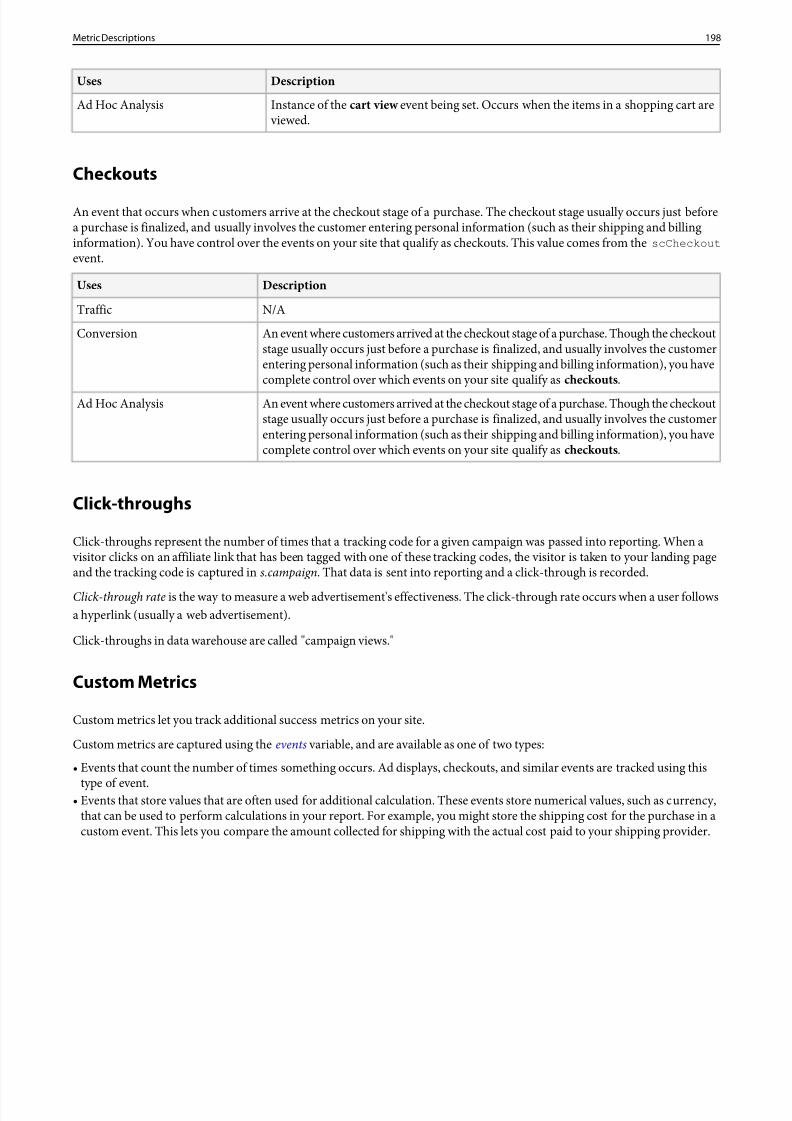
8/18/2019 Analytics Reference Adobe
http://slidepdf.com/reader/full/analytics-reference-adobe 198/332
DescriptionUses
Instance of the cart view event being set. Occurs when the items in a shopping cart are viewed.
Ad Hoc Analysis
Checkouts
An event that occurs when customers arrive at the checkout stage of a purchase. The checkout stage usually occurs just beforea purchase is finalized, and usually involves the customer entering personal information (such as their shipping and billinginformation). You have control over the events on your site that qualify as checkouts. This value comes from thescCheckout
event.
DescriptionUses
N/ATraffic
An event where customers arrived at the checkout stage of a purchase. Though the checkoutstage usually occurs just before a purchase is finalized, and usually involves the customer
Conversion
entering personal information (such as their shipping and billing information), you havecomplete control over which events on your site qualify ascheckouts .
An event where customers arrived at the checkout stage of a purchase. Though the checkoutstage usually occurs just before a purchase is finalized, and usually involves the customer
Ad Hoc Analysis
entering personal information (such as their shipping and billing information), you havecomplete control over which events on your site qualify ascheckouts .
Click-throughs
Click-throughs represent the number of times that a tracking code for a given campaign was passed into reporting. When a visitor clicks on an affiliate link that has been tagged with one of these tracking codes, the visitor is taken to your landing pageand the tracking code is captured in s.campaign. That data is sent into reporting and a click-through is recorded.
Click-through rate is the way to measure a web advertisement's effectiveness. The click-through rate occurs when a user followsa hyperlink (usually a web advertisement).
Click-throughs in data warehouse are called "campaign views."
Custom Metrics
Custom metrics let you track additional success metrics on your site.
Custom metrics are captured using the events variable, and are available as one of two types:
• Events that count the number of times something occurs. Ad displays, checkouts, and similar events are tracked using this
type of event.• Events that store values that are often used for additional calculation. These events store numerical values, such as currency,
that can be used to perform calculations in your report. For example, you might store the shipping cost for the purchase in acustom event. This lets you compare the amount collected for shipping with the actual cost paid to your shipping provider.
198Metric Descriptions
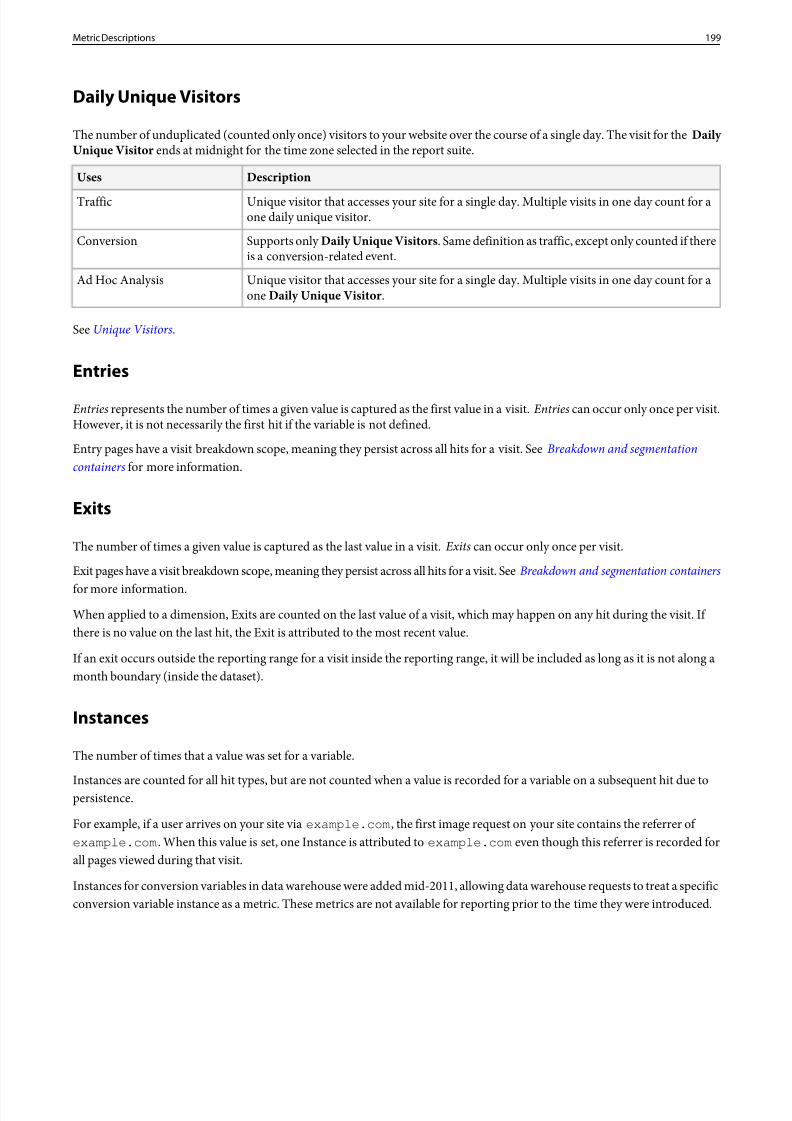
8/18/2019 Analytics Reference Adobe
http://slidepdf.com/reader/full/analytics-reference-adobe 199/332
Daily Unique Visitors
The number of unduplicated (counted only once) visitors to your website over the course of a single day. The visit for theDaily Unique Visitor ends at midnight for the time zone selected in the report suite.
DescriptionUses
Unique visitor that accesses your site for a single day. Multiple visits in one day count for aone daily unique visitor.
Traffic
Supports only Daily Unique Visitors . Same definition as traffic, except only counted if thereis a conversion-related event.
Conversion
Unique visitor that accesses your site for a single day. Multiple visits in one day count for aone Daily Unique Visitor .
Ad Hoc Analysis
SeeUnique Visitors.
Entries
Entries represents the number of times a given value is captured as the first value in a visit.Entries can occur only once per visit.However, it is not necessarily the first hit if the variable is not defined.
Entry pages have a visit breakdown scope, meaning they persist across all hits for a visit. SeeBreakdown and segmentationcontainers for more information.
Exits
The number of times a given value is captured as the last value in a visit.Exits can occur only once per visit.
Exit pages have a visit breakdown scope, meaning they persist across all hits for a visit. SeeBreakdown and segmentation containers
for more information.When applied to a dimension, Exits are counted on the last value of a visit, which may happen on any hit during the visit. If there is no value on the last hit, the Exit is attributed to the most recent value.
If an exit occurs outside the reporting range for a visit inside the reporting range, it will be included as long as it is not along amonth boundary (inside the dataset).
Instances
The number of times that a value was set for a variable.
Instances are counted for all hit types, but are not counted when a value is recorded for a variable on a subsequent hit due topersistence.
For example, if a user arrives on your site viaexample.com , the first image request on your site contains the referrer of example.com . When this value is set, one Instance is attributed to example.com even though this referrer is recorded forall pages viewed during that visit.
Instances for conversion variables in data warehouse were added mid-2011, allowing data warehouse requests to treat a specificconversion variable instance as a metric. These metrics are not available for reporting prior to the time they were introduced.
199Metric Descriptions
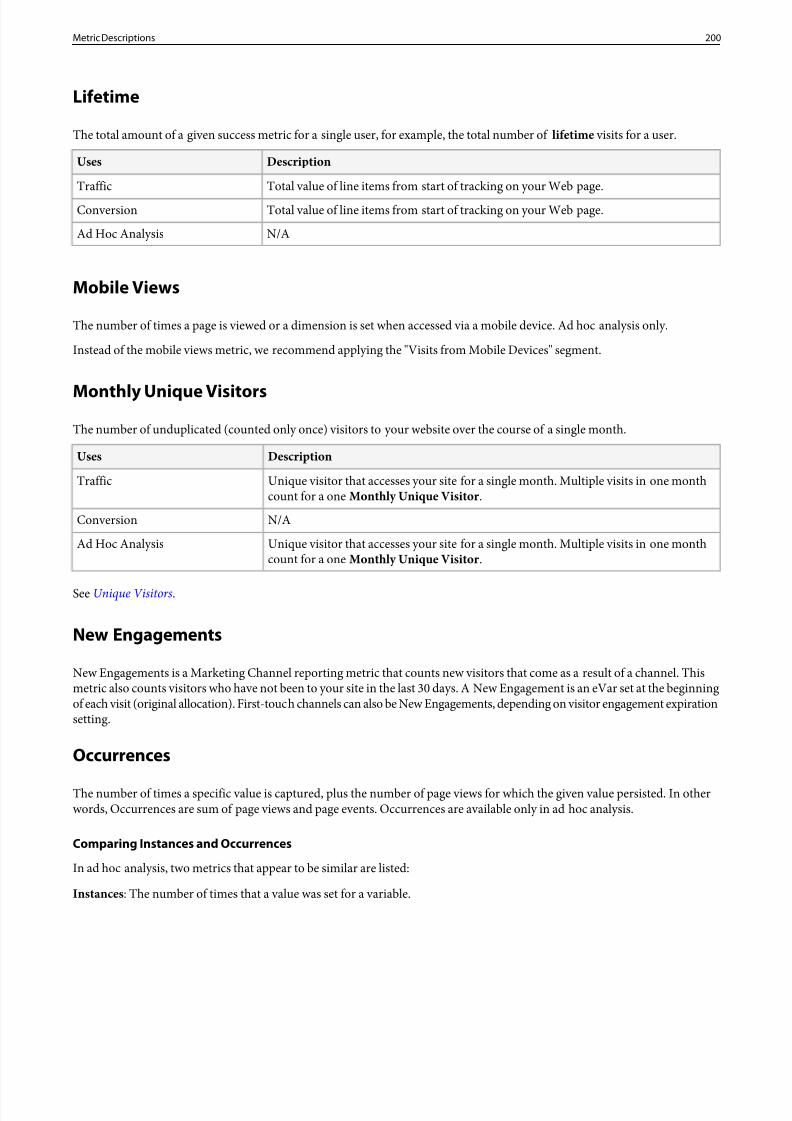
8/18/2019 Analytics Reference Adobe
http://slidepdf.com/reader/full/analytics-reference-adobe 200/332
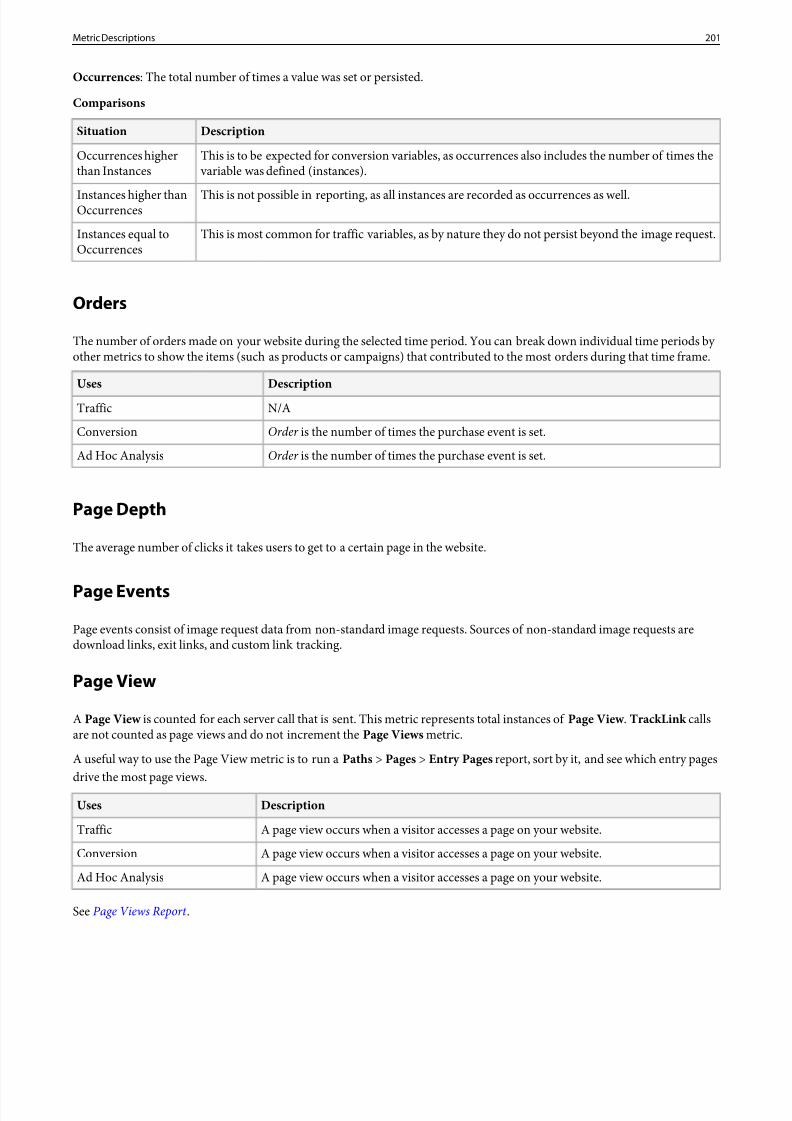
8/18/2019 Analytics Reference Adobe
http://slidepdf.com/reader/full/analytics-reference-adobe 201/332
Occurrences : The total number of times a value was set or persisted.
Comparisons
DescriptionSituation
This is to be expected for conversion variables, as occurrences also includes the number of times the variable was defined (instances).
Occurrences higherthan Instances
This is not possible in reporting, as all instances are recorded as occurrences as well.Instances higher thanOccurrences
This is most common for traffic variables, as by nature they do not persist beyond the image request.Instances equal toOccurrences
Orders
The number of orders made on your website during the selected time period. You can break down individual time periods by other metrics to show the items (such as products or campaigns) that contributed to the most orders during that time frame.
DescriptionUses
N/ATraffic
Order is the number of times the purchase event is set.Conversion
Order is the number of times the purchase event is set.Ad Hoc Analysis
Page Depth
The average number of clicks it takes users to get to a certain page in the website.
Page Events
Page events consist of image request data from non-standard image requests. Sources of non-standard image requests aredownload links, exit links, and custom link tracking.
Page View
A Page View is counted for each server call that is sent. This metric represents total instances ofPage View . TrackLink callsare not counted as page views and do not increment the Page Views metric.
A useful way to use the Page View metric is to run aPaths > Pages > Entry Pages report, sort by it, and see which entry pagesdrive the most page views.
DescriptionUses
A page view occurs when a visitor accesses a page on your website.Traffic
A page view occurs when a visitor accesses a page on your website.Conversion
A page view occurs when a visitor accesses a page on your website.Ad Hoc Analysis
SeePage Views Report .
201Metric Descriptions
8/18/2019 Analytics Reference Adobe
http://slidepdf.com/reader/full/analytics-reference-adobe 202/332
Participation
Participation metrics assign full credit from success events to all values of an eVar that were passed during a visit. Participationmetrics are useful to determine which pages, campaigns, or other custom variable values are contributing most to the successof your site. Participation is visit based. All eVar values in a visit prior to and including the hit when an event occurs receiveparticipation credit regardless of the expiration setting.
SeeVisitor Participation - Ad Hoc Analysis for more information about how ad hoc analysis uses participation.
Participation metrics have three settings per conversion event:
• Disabled : The default state of each conversion event. Participation data will not be gathered for this event.• Enabled : Participation data is collected for this event.
Once enabled, participation metrics are automatically available in all conversion reports. However, participation metrics alsocan be viewed in specific traffic reports at your request. You can optionally request participation metrics be available in certaincustom traffic reports.
Revenue Participation Example
Assume the following sequence:
1. A user navigates to your site and searches for "shoes".2. The user then searches for "tennis shoes".3. The user clicks a links to the product page, adds the item to the cart, and makes a $120 purchase.
When displaying Revenue in the Internal Search Terms Report, you would see the following based on the selected allocation:
• First : "shoes" would get credit for the $120. "tennis shoes" would get $0.• Last: "tennis shoes" would get credit for the $120. "shoes" would get $0.• Linear : Each campaign would get $60 credit.
Participation is similar to linear allocation, except full credit is given to all values. If you use Revenue (Participation) as the
metric, allocation is disregarded. Revenue (Participation) in this example would report $120 for both search terms.
Add Participation Metrics
Steps that describe how to add participation metrics.
1. Log in and navigate to any conversion report or traffic report on which you requested participation metrics.2. ClickAdd Metrics .3. Under the Metric Type menu, select Participation .4. Drag the desired participation metrics to the columns canvas, then clickOK.
The resulting report displays participation metrics with a percentage and a number in parenthesis.
• Percentage : The proportion of conversion events in which each value participated.• Number in parenthesis : The actual number of times this value participated prior to the conversion event.
Path Views
The Path Views metric is based on pathing data, which is tracked for all users who accept persistent cookies.
202Metric Descriptions
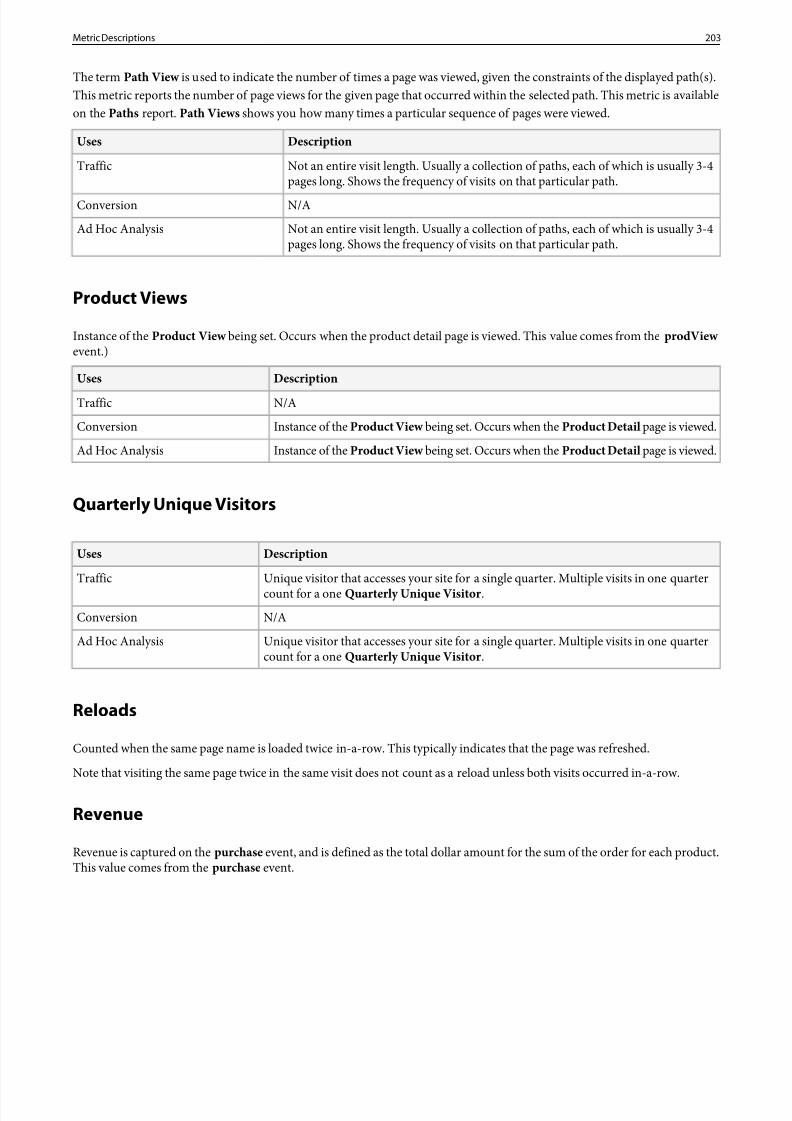
8/18/2019 Analytics Reference Adobe
http://slidepdf.com/reader/full/analytics-reference-adobe 203/332
The term Path View is used to indicate the number of times a page was viewed, given the constraints of the displayed path(s).This metric reports the number of page views for the given page that occurred within the selected path. This metric is availableon the Paths report. Path Views shows you how many times a particular sequence of pages were viewed.
DescriptionUses
Not an entire visit length. Usually a collection of paths, each of which is usually 3-4pages long. Shows the frequency of visits on that particular path.
Traffic
N/AConversion
Not an entire visit length. Usually a collection of paths, each of which is usually 3-4pages long. Shows the frequency of visits on that particular path.
Ad Hoc Analysis
Product Views
Instance of the Product View being set. Occurs when the product detail page is viewed. This value comes from theprodView event.)
DescriptionUses
N/ATraffic
Instance of the Product View being set. Occurs when theProduct Detail page is viewed.Conversion
Instance of the Product View being set. Occurs when theProduct Detail page is viewed.Ad Hoc Analysis
Quarterly Unique Visitors
DescriptionUses
Unique visitor that accesses your site for a single quarter. Multiple visits in one quartercount for a one Quarterly Unique Visitor .
Traffic
N/AConversion
Unique visitor that accesses your site for a single quarter. Multiple visits in one quartercount for a one Quarterly Unique Visitor .
Ad Hoc Analysis
Reloads
Counted when the same page name is loaded twice in-a-row. This typically indicates that the page was refreshed.
Note that visiting the same page twice in the same visit does not count as a reload unless both visits occurred in-a-row.
Revenue
Revenue is captured on the purchase event, and is defined as the total dollar amount for the sum of the order for each product.This value comes from the purchase event.
203Metric Descriptions
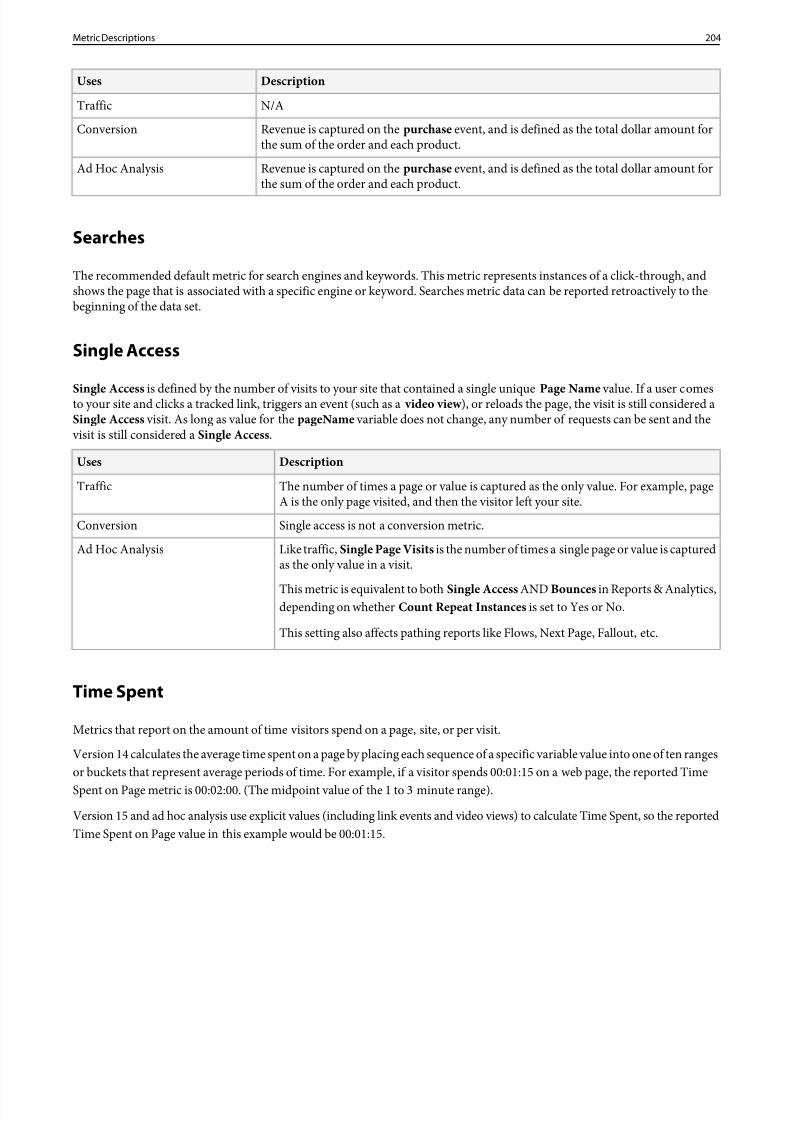
8/18/2019 Analytics Reference Adobe
http://slidepdf.com/reader/full/analytics-reference-adobe 204/332
DescriptionUses
N/ATraffic
Revenue is captured on the purchase event, and is defined as the total dollar amount forthe sum of the order and each product.
Conversion
Revenue is captured on the purchase event, and is defined as the total dollar amount forthe sum of the order and each product.
Ad Hoc Analysis
Searches
The recommended default metric for search engines and keywords. This metric represents instances of a click-through, andshows the page that is associated with a specific engine or keyword. Searches metric data can be reported retroactively to thebeginning of the data set.
Single Access
Single Access is defined by the number of visits to your site that contained a single uniquePage Name value. If a user comesto your site and clicks a tracked link, triggers an event (such as a video view ), or reloads the page, the visit is still considered aSingle Access visit. As long as value for thepageName variable does not change, any number of requests can be sent and the visit is still considered aSingle Access.
DescriptionUses
The number of times a page or value is captured as the only value. For example, pageA is the only page visited, and then the visitor left your site.
Traffic
Single access is not a conversion metric.Conversion
Like traffic,Single Page Visits is the number of times a single page or value is capturedas the only value in a visit.
This metric is equivalent to both Single Access AND Bounces in Reports & Analytics,depending on whether Count Repeat Instances is set to Yes or No.
Ad Hoc Analysis
This setting also affects pathing reports like Flows, Next Page, Fallout, etc.
Time Spent
Metrics that report on the amount of time visitors spend on a page, site, or per visit.
Version 14 calculates the average time spent on a page by placing each sequence of a specific variable value into one of ten rangesor buckets that represent average periods of time. For example, if a visitor spends 00:01:15 on a web page, the reported TimeSpent on Page metric is 00:02:00. (The midpoint value of the 1 to 3 minute range).
Version 15 and ad hoc analysis use explicit values (including link events and video views) to calculate Time Spent, so the reportedTime Spent on Page value in this example would be 00:01:15.
204Metric Descriptions
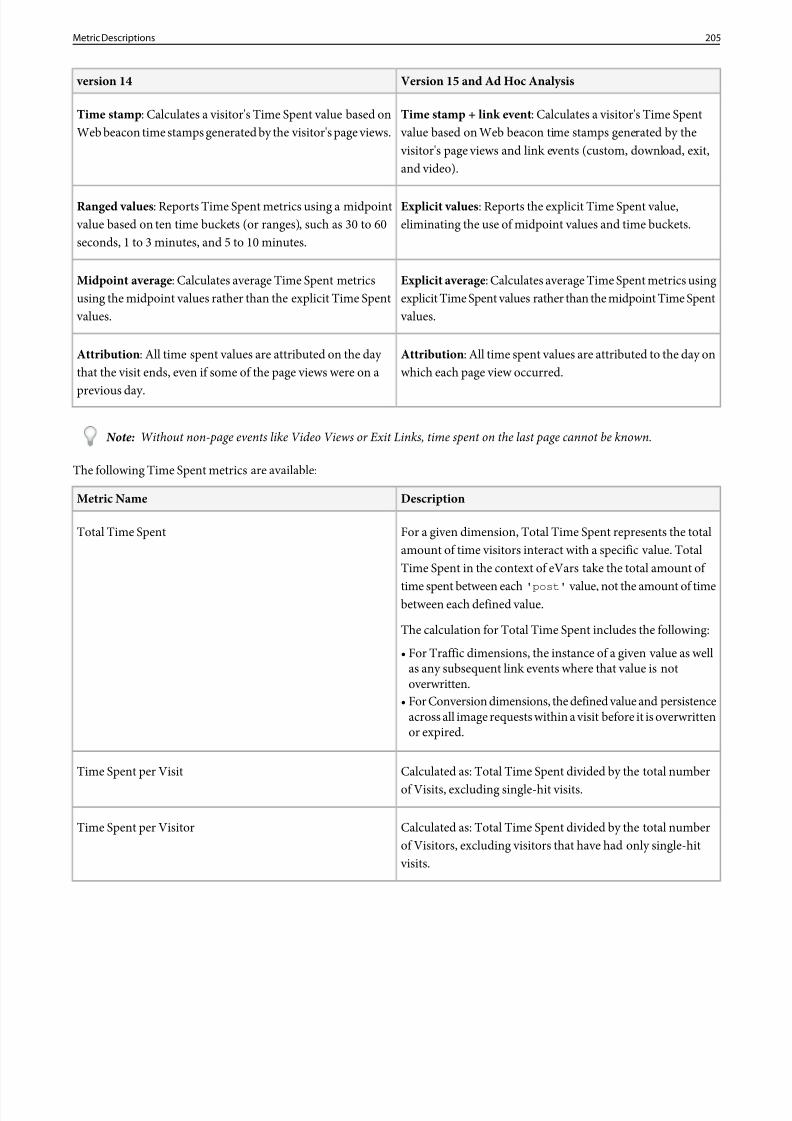
8/18/2019 Analytics Reference Adobe
http://slidepdf.com/reader/full/analytics-reference-adobe 205/332
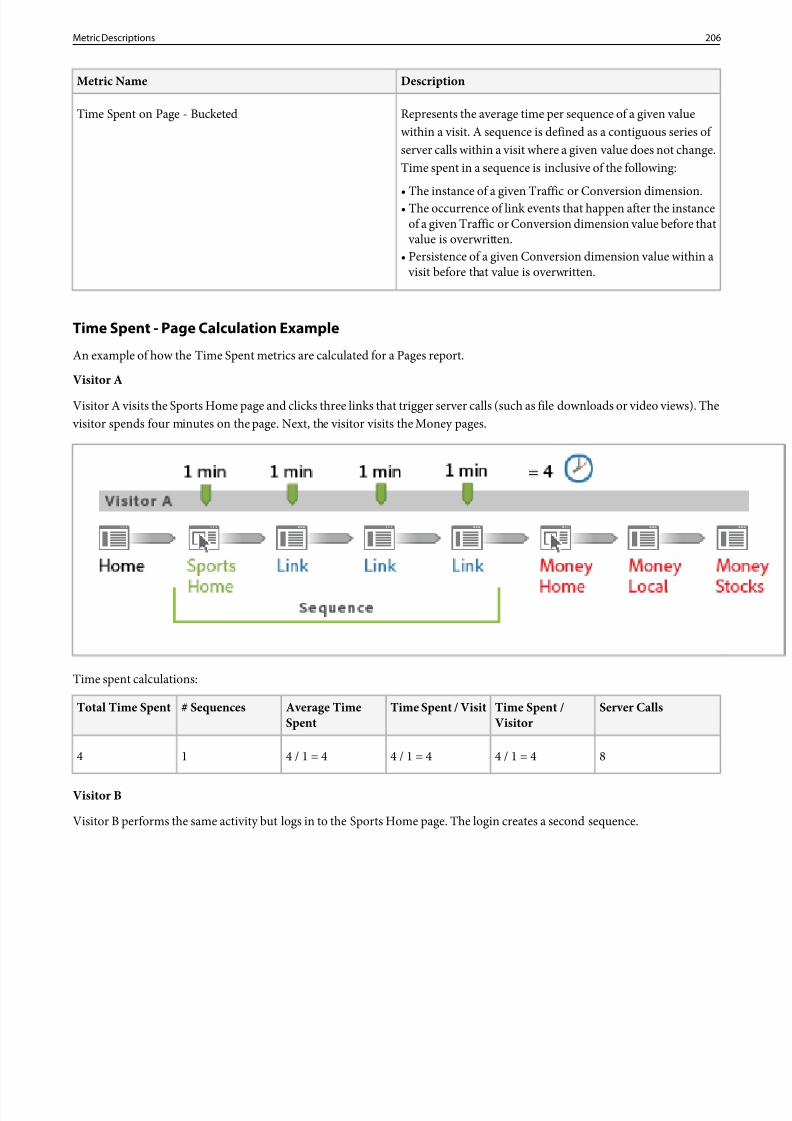
8/18/2019 Analytics Reference Adobe
http://slidepdf.com/reader/full/analytics-reference-adobe 206/332
DescriptionMetric Name
Represents the average time per sequence of a given valuewithin a visit. A sequence is defined as a contiguous series of
Time Spent on Page - Bucketed
server calls within a visit where a given value does not change.Time spent in a sequence is inclusive of the following:
• The instance of a given Traffic or Conversion dimension.• The occurrence of link events that happen after the instanceof a given Traffic or Conversion dimension value before that value is overwritten.
• Persistence of a given Conversion dimension value within a visit before that value is overwritten.
Time Spent - Page Calculation Example
An example of how the Time Spent metrics are calculated for a Pages report.
Visitor A
Visitor A visits the Sports Home page and clicks three links that trigger server calls (such as file downloads or video views). The visitor spends four minutes on the page. Next, the visitor visits the Money pages.
Time spent calculations:
Server CallsTime Spent /Visitor
Time Spent / VisitAverage TimeSpent
# SequencesTotal Time Spent
84 / 1 = 44 / 1 = 44 / 1 = 414
Visitor B
Visitor B performs the same activity but logs in to the Sports Home page. The login creates a second sequence.
206Metric Descriptions
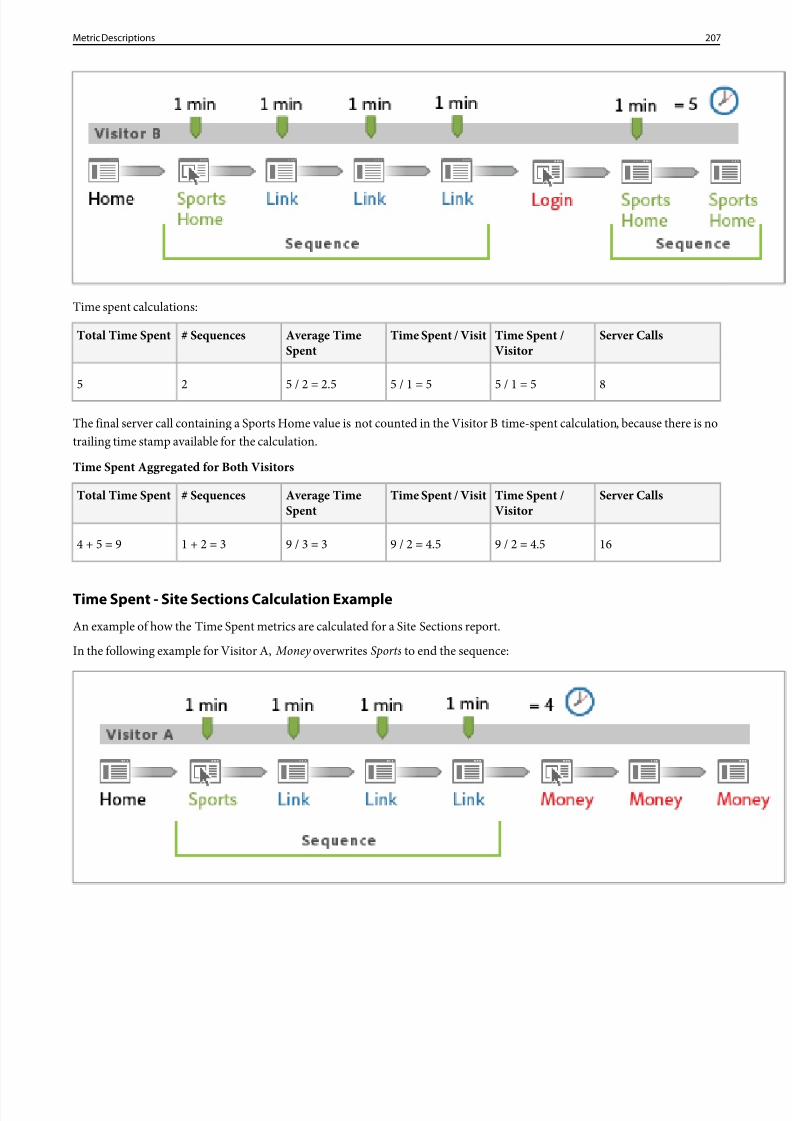
8/18/2019 Analytics Reference Adobe
http://slidepdf.com/reader/full/analytics-reference-adobe 207/332
Time spent calculations:
Server CallsTime Spent /Visitor
Time Spent / VisitAverage TimeSpent
# SequencesTotal Time Spent
85 / 1 = 55 / 1 = 55 / 2 = 2.525
The final server call containing a Sports Home value is not counted in the Visitor B time-spent calculation, because there is notrailing time stamp available for the calculation.
Time Spent Aggregated for Both Visitors
Server CallsTime Spent /Visitor
Time Spent / VisitAverage TimeSpent
# SequencesTotal Time Spent
169 / 2 = 4.59 / 2 = 4.59 / 3 = 31 + 2 = 34 + 5 = 9
Time Spent - Site Sections Calculation Example
An example of how the Time Spent metrics are calculated for a Site Sections report.
In the following example for Visitor A, Money overwrites Sports to end the sequence:
207Metric Descriptions
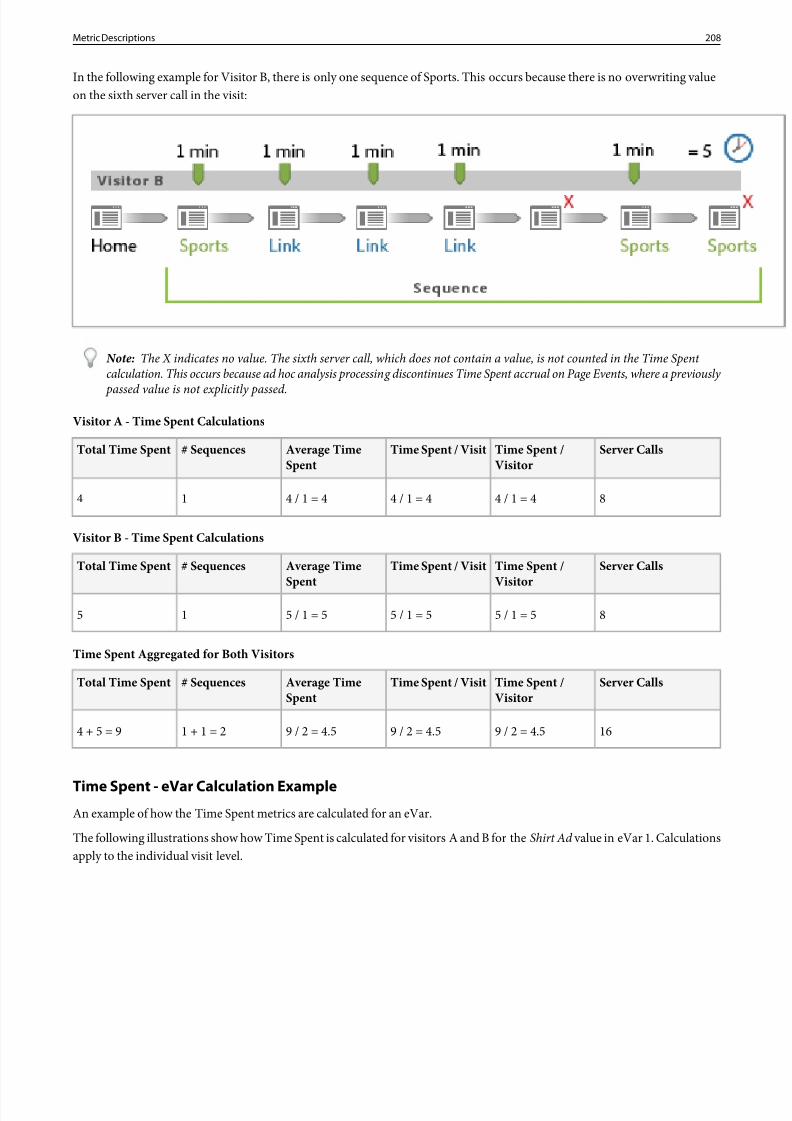
8/18/2019 Analytics Reference Adobe
http://slidepdf.com/reader/full/analytics-reference-adobe 208/332
In the following example for Visitor B, there is only one sequence of Sports. This occurs because there is no overwriting valueon the sixth server call in the visit:
Note: The X indicates no value. The sixth server call, which does not contain a value, is not counted in the Time Spent calculation. This occurs because ad hoc analysis processing discontinues Time Spent accrual on Page Events, where a previously
passed value is not explicitly passed.
Visitor A - Time Spent Calculations
Server CallsTime Spent /Visitor
Time Spent / VisitAverage TimeSpent
# SequencesTotal Time Spent
84 / 1 = 44 / 1 = 44 / 1 = 414
Visitor B - Time Spent Calculations
Server CallsTime Spent /Visitor
Time Spent / VisitAverage TimeSpent
# SequencesTotal Time Spent
85 / 1 = 55 / 1 = 55 / 1 = 515
Time Spent Aggregated for Both Visitors
Server CallsTime Spent /Visitor
Time Spent / VisitAverage TimeSpent
# SequencesTotal Time Spent
169 / 2 = 4.59 / 2 = 4.59 / 2 = 4.51 + 1 = 24 + 5 = 9
Time Spent - eVar Calculation ExampleAn example of how the Time Spent metrics are calculated for an eVar.
The following illustrations show how Time Spent is calculated for visitors A and B for theShirt Ad value in eVar 1. Calculationsapply to the individual visit level.
208Metric Descriptions
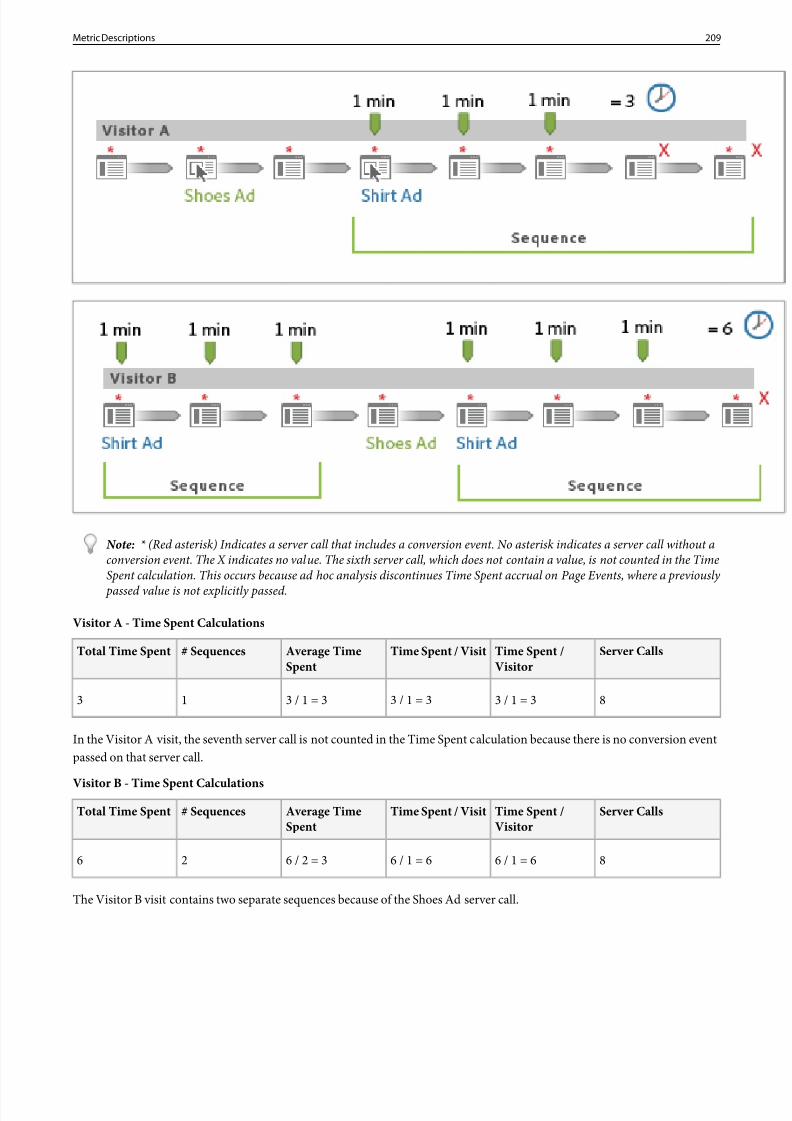
8/18/2019 Analytics Reference Adobe
http://slidepdf.com/reader/full/analytics-reference-adobe 209/332
Note: * (Red asterisk) Indicates a server call that includes a conversion event. No asterisk indicates a server call without aconversion event. The X indicates no value. The sixth server call, which does not contain a value, is not counted in the TimeSpent calculation. This occurs because ad hoc analysis discontinues Time Spent accrual on Page Events, where a previously passed value is not explicitly passed.
Visitor A - Time Spent Calculations
Server CallsTime Spent /Visitor
Time Spent / VisitAverage TimeSpent
# SequencesTotal Time Spent
83 / 1 = 33 / 1 = 33 / 1 = 313
In the Visitor A visit, the seventh server call is not counted in the Time Spent calculation because there is no conversion eventpassed on that server call.
Visitor B - Time Spent CalculationsServer CallsTime Spent /
VisitorTime Spent / VisitAverage Time
Spent# SequencesTotal Time Spent
86 / 1 = 66 / 1 = 66 / 2 = 326
The Visitor B visit contains two separate sequences because of the Shoes Ad server call.
209Metric Descriptions
8/18/2019 Analytics Reference Adobe
http://slidepdf.com/reader/full/analytics-reference-adobe 210/332
Time Spent Aggregated for Both Visitors
Server CallsTime Spent /Visitor
Time Spent / VisitAverage TimeSpent
# SequencesTotal Time Spent
169 / 2 = 4.59 / 2 = 4.59 / 3 = 31 + 2 = 33 + 6 = 9
In the Visitor A and Visitor B visits, the final server call is not counted in the Time Spent calculation because there is no trailingtime stamp to use for calculation.
Total
The value of all report line items for a reported period. If a filter is currently selected, the total might represent the filtered totalinstead of the report suite total. If no filter is selected total represents the report suite total.
DescriptionUses
The value of all report line items for a reported period.Traffic
The value of all report line items for a reported period.Conversion
N/AAd Hoc Analysis
Unique Visitors
In version 14, a unique visitor refers to a visitor who visits a site for the first time within a specified time period. For example,the unique visitor can visit a site ten times in a week, but if the time period is week, a single unique visitor is counted only oncefor that week. After that week is ended, that unique visitor can be counted again for a different time period.
Differences between version 14 and 15
version 14 does not remove duplicateVisits and Unique Visitors metrics from classifications-based reports. For example, if two video clips shared the same classification, a single visitor that viewed both clips generated twoVisits and Unique Visitorsin the classification-based report.
Version 15 removes duplicate Visits and Unique Visitors from the classification-based report. This is a more accurate measureof Visits and Visitors , but typically results in a decrease in yourVisits and Unique Visitors metrics for classification-basedreports, when compared to data collected prior to upgrade.
DescriptionUses
A visitor is a person that comes to your website. Does not require a persistent cookie.Traffic
A visitor is a person that comes to your website. Is counted when a conversion-related eventor action occurs.
Conversion
A visitor is a person that comes to your website. Does not require a persistent cookie.Ad Hoc Analysis
SeeUnique Visitors Report - Analytics.
210Metric Descriptions
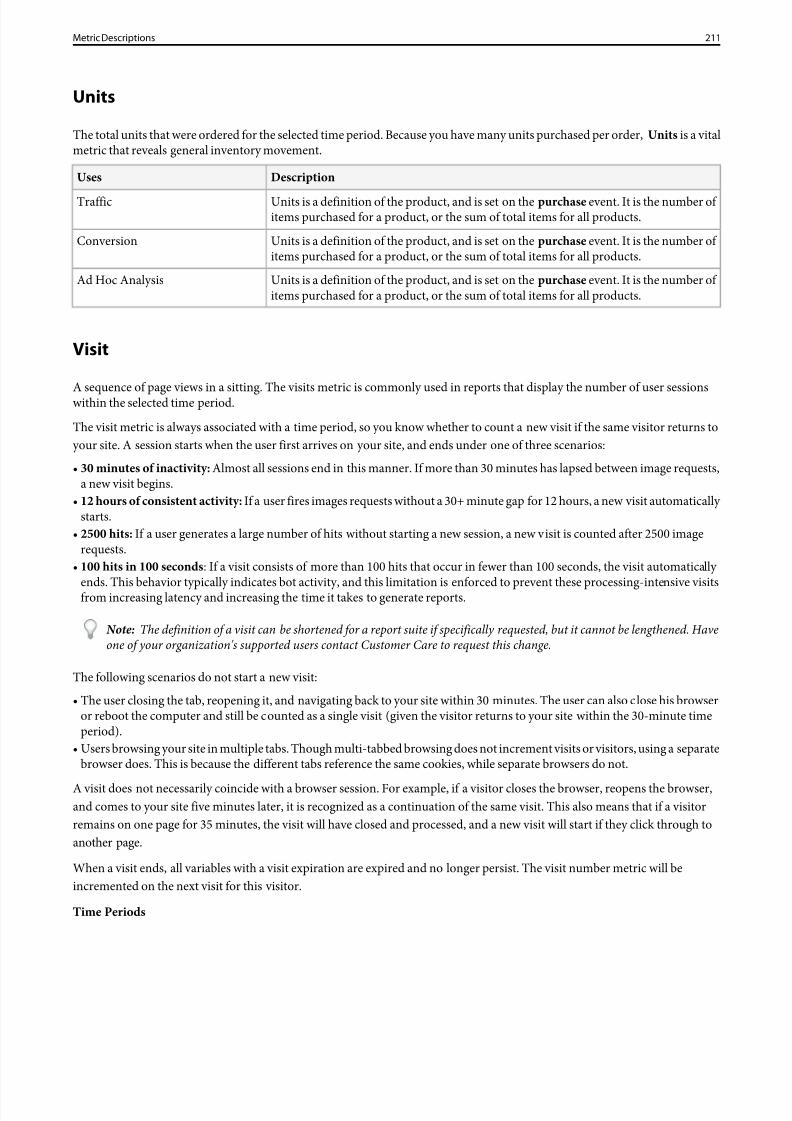
8/18/2019 Analytics Reference Adobe
http://slidepdf.com/reader/full/analytics-reference-adobe 211/332
Units
The total units that were ordered for the selected time period. Because you have many units purchased per order, Units is a vitalmetric that reveals general inventory movement.
DescriptionUses
Units is a definition of the product, and is set on the purchase event. It is the number of items purchased for a product, or the sum of total items for all products.
Traffic
Units is a definition of the product, and is set on the purchase event. It is the number of items purchased for a product, or the sum of total items for all products.
Conversion
Units is a definition of the product, and is set on the purchase event. It is the number of items purchased for a product, or the sum of total items for all products.
Ad Hoc Analysis
Visit
A sequence of page views in a sitting. The visits metric is commonly used in reports that display the number of user sessionswithin the selected time period.
The visit metric is always associated with a time period, so you know whether to count a new visit if the same visitor returns toyour site. A session starts when the user first arrives on your site, and ends under one of three scenarios:
• 30 minutes of inactivity: Almost all sessions end in this manner. If more than 30 minutes has lapsed between image requests,a new visit begins.
• 12 hours of consistent activity: If a user fires images requests without a 30+ minute gap for 12 hours, a new visit automatically starts.
• 2500 hits: If a user generates a large number of hits without starting a new session, a new visit is counted after 2500 imagerequests.
• 100 hits in 100 seconds : If a visit consists of more than 100 hits that occur in fewer than 100 seconds, the visit automatically
ends. This behavior typically indicates bot activity, and this limitation is enforced to prevent these processing-intensive visitsfrom increasing latency and increasing the time it takes to generate reports.
Note: The definition of a visit can be shortened for a report suite if specifically requested, but it cannot be lengthened. Haveone of your organization's supported users contact Customer Care to request this change.
The following scenarios do not start a new visit:
• The user closing the tab, reopening it, and navigating back to your site within 30 minutes. The user can also close his browseror reboot the computer and still be counted as a single visit (given the visitor returns to your site within the 30-minute timeperiod).
• Users browsing your site in multiple tabs. Though multi-tabbed browsing does not increment visits or visitors, using a separatebrowser does. This is because the different tabs reference the same cookies, while separate browsers do not.
A visit does not necessarily coincide with a browser session. For example, if a visitor closes the browser, reopens the browser,and comes to your site five minutes later, it is recognized as a continuation of the same visit. This also means that if a visitorremains on one page for 35 minutes, the visit will have closed and processed, and a new visit will start if they click through toanother page.
When a visit ends, all variables with a visit expiration are expired and no longer persist. The visit number metric will beincremented on the next visit for this visitor.
Time Periods
211Metric Descriptions
8/18/2019 Analytics Reference Adobe
http://slidepdf.com/reader/full/analytics-reference-adobe 212/332
A visit is reported in each time period in which activity occurred. For example, suppose that a visit begins at 11:45 p.m. onDecember 1st, and continues until 12:30 a.m. on December 2nd. The visit is counted on December 1st and December 2. Thisreporting applies to other time periods, including weekly, monthly, quarterly, and yearly.
Visitors
The number of unique visitors to your site for a selected hour, day, week, month, quarter, or year.DescriptionUses
A visitor is a person that comes to your website. Does notrequire a persistent cookie.
Traffic
A visitor is a person that comes to your website. Is countedwhen a conversion-related event or action occurs.
Conversion
A visitor is a person that comes to your website. Does notrequire a persistent cookie.
Ad hoc analysis
Visitor Participation - Ad Hoc Analysis
Visitor Participation is a metric series that lets you view participation across visitor sessions in marketing channels, campaigns,revenue, and so on. For example, purchase and revenue credit can be attributed back to other marketing touch-points thatoccurred before the visit in which the order took place. Ad hoc analysis provides visitor participation across visits.
Revenue (Participation) : Spreads conversion credit across all of the pages in a single visit that led to the conversion, up to theconversion page.
Revenue (Visitor Participation) : Spreads conversion credit across all the pages and across visits, based on a time frame youspecify.
Example - Cross-Visit Revenue Participation
A visitor has two visits to your site. The conversion event occurs during the second visit, on Page D, for $60 of revenue:
In reporting, the conversion allocation is as follows:
• Revenue: Allocated to the page.• Revenue (Participation) : Allocated to the second visit.•
Revenue (Visitor Participation) : Allocated across both visits.Revenue (VisitorParticipation)
Revenue (Participation)RevenuePage
$60$600A
$60$600B
212Metric Descriptions
8/18/2019 Analytics Reference Adobe
http://slidepdf.com/reader/full/analytics-reference-adobe 213/332
8/18/2019 Analytics Reference Adobe
http://slidepdf.com/reader/full/analytics-reference-adobe 214/332
Report DescriptionsDefinitions of the reports available in Adobe Analytics.
Analytics > Reports & Analytics > View All Reports
Reporting Best Practices and Troubleshooting
Adobe Analytics provides a flexible reporting interface that lets you generate a variety of complex reports. While most reportsgenerate very quickly, you might encounter reports that timeout or fail to generate successfully. To help avoid report generationfailures, this section explains many factors that impact report generation speed. Understanding this information can help youstructure reports so they are more likely to generate successfully.
Note that these recommendations apply to reports & analytics, ad hoc analysis, and report builder. They do not apply to datawarehouse, which provides a separate list ofbest practices. An additional set of best practices is available for the Adobe AnalyticsReporting API.
Report Timeouts and Request Queue
Timeouts
A single report is broken into multiple requests (one per breakdown), and each request is subject to an individual timeout.Scheduled reports are granted longer timeout periods and are more likely to succeed than reports that are generated directly ina user interface.
Report Suite Queue
Each report suite maintains a separate queue of requests. If many reports are requested simultaneously, even from separateusers, a small number of reports are generated simultaneously. As reports complete, remaining reports are generated in theorder in which they were received. As a result, if a large number of complex reports are already in the report suite queue, a reportthat typically generates quickly might time out.
Factors that Affect Report SpeedThe following factors contribute to longer report generation times. Increasing one of these factors might not result in a timeoutfor that report, but it might delay other reports in the report suite queue and cause a subsequent report to timeout.
Report Time Range
The largest factor that affects report generation time is the number of months requested. Reducing the number of months fromthree to one decreases generation time significantly, but reducing the time range from one month to one week does not have alarge impact on report generation time.
Number of metrics
As the number of metrics increases, the report run time increases. Removing metrics often improves report generation time.
Number of breakdowns
Within a report, each breakdown represents a separate request. While individual requests may complete quickly, runningthousands of breakdowns in a single report can significantly slow down report generation time and affect the report suite queue.
Segment complexity
Segments that consider many dimensions or have many (24+) rules increase the processing impact and increase the reportgeneration time.
214Report Descriptions
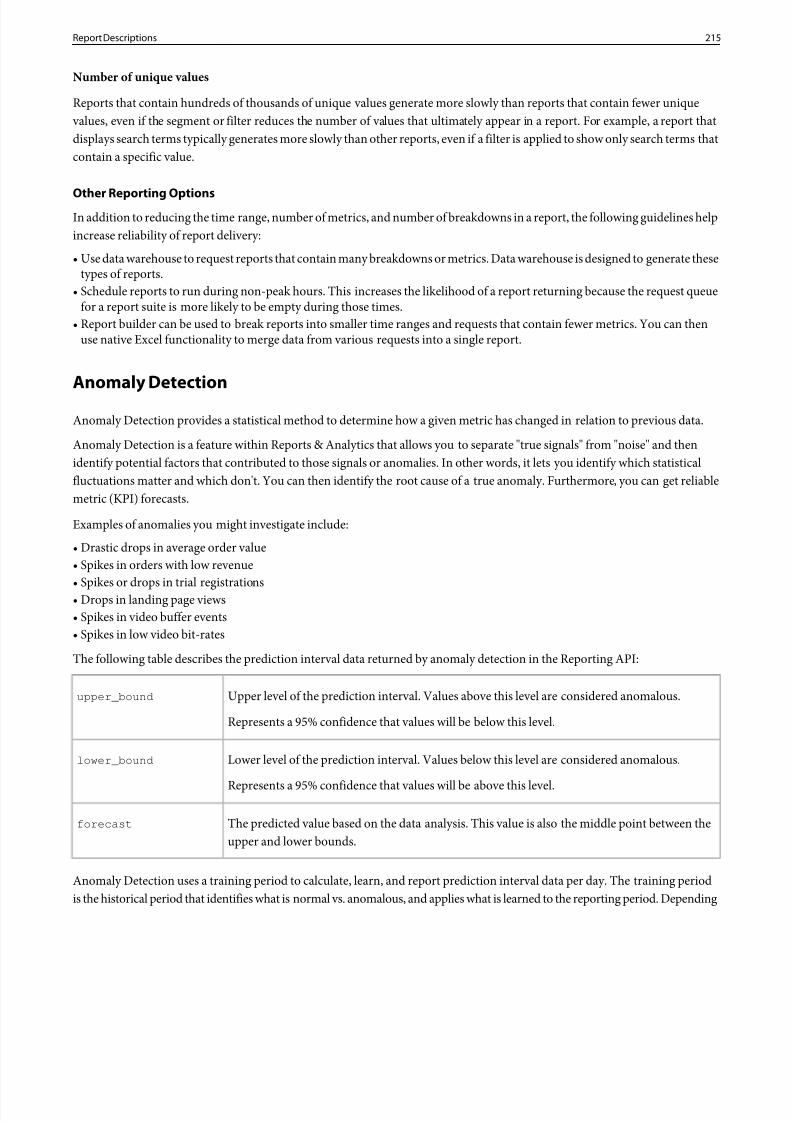
8/18/2019 Analytics Reference Adobe
http://slidepdf.com/reader/full/analytics-reference-adobe 215/332
Number of unique values
Reports that contain hundreds of thousands of unique values generate more slowly than reports that contain fewer unique values, even if the segment or filter reduces the number of values that ultimately appear in a report. For example, a report thatdisplays search terms typically generates more slowly than other reports, even if a filter is applied to show only search terms thatcontain a specific value.
Other Reporting OptionsIn addition to reducing the time range, number of metrics, and number of breakdowns in a report, the following guidelines helpincrease reliability of report delivery:
• Use data warehouse to request reports that contain many breakdowns or metrics. Data warehouse is designed to generate thesetypes of reports.
• Schedule reports to run during non-peak hours. This increases the likelihood of a report returning because the request queuefor a report suite is more likely to be empty during those times.
• Report builder can be used to break reports into smaller time ranges and requests that contain fewer metrics. You can thenuse native Excel functionality to merge data from various requests into a single report.
Anomaly Detection
Anomaly Detection provides a statistical method to determine how a given metric has changed in relation to previous data.
Anomaly Detection is a feature within Reports & Analytics that allows you to separate "true signals" from "noise" and thenidentify potential factors that contributed to those signals or anomalies. In other words, it lets you identify which statisticalfluctuations matter and which don't. You can then identify the root cause of a true anomaly. Furthermore, you can get reliablemetric (KPI) forecasts.
Examples of anomalies you might investigate include:
• Drastic drops in average order value• Spikes in orders with low revenue•
Spikes or drops in trial registrations• Drops in landing page views• Spikes in video buffer events• Spikes in low video bit-rates
The following table describes the prediction interval data returned by anomaly detection in the Reporting API:
Upper level of the prediction interval. Values above this level are considered anomalous.upper_bound
Represents a 95% confidence that values will be below this level.
Lower level of the prediction interval. Values below this level are considered anomalous.lower_bound
Represents a 95% confidence that values will be above this level.
The predicted value based on the data analysis. This value is also the middle point between theupper and lower bounds.
forecast
Anomaly Detection uses a training period to calculate, learn, and report prediction interval data per day. The training periodis the historical period that identifies what is normal vs. anomalous, and applies what is learned to the reporting period. Depending
215Report Descriptions
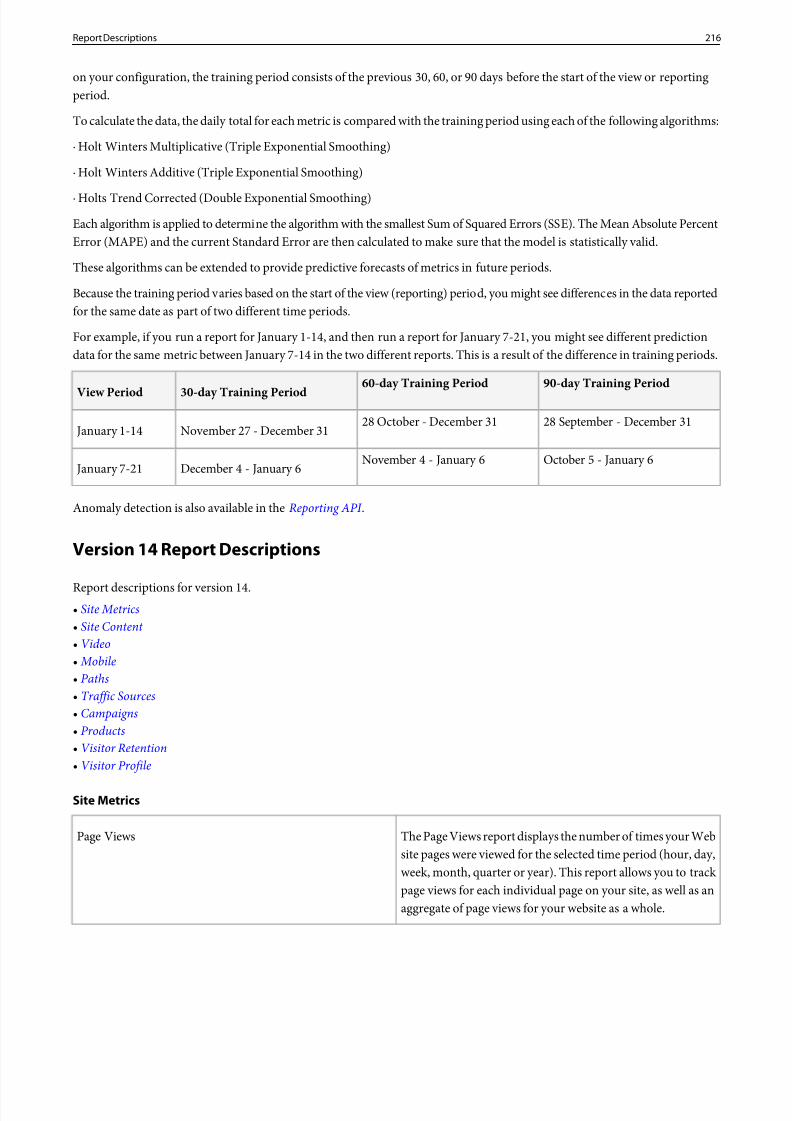
8/18/2019 Analytics Reference Adobe
http://slidepdf.com/reader/full/analytics-reference-adobe 216/332
on your configuration, the training period consists of the previous 30, 60, or 90 days before the start of the view or reportingperiod.
To calculate the data, the daily total for each metric is compared with the training period using each of the following algorithms:
· Holt Winters Multiplicative (Triple Exponential Smoothing)
· Holt Winters Additive (Triple Exponential Smoothing)
· Holts Trend Corrected (Double Exponential Smoothing)
Each algorithm is applied to determine the algorithm with the smallest Sum of Squared Errors (SSE). The Mean Absolute PercentError (MAPE) and the current Standard Error are then calculated to make sure that the model is statistically valid.
These algorithms can be extended to provide predictive forecasts of metrics in future periods.
Because the training period varies based on the start of the view (reporting) period, you might see differences in the data reportedfor the same date as part of two different time periods.
For example, if you run a report for January 1-14, and then run a report for January 7-21, you might see different predictiondata for the same metric between January 7-14 in the two different reports. This is a result of the difference in training periods.
90-day Training Period60-day Training Period30-day Training PeriodView Period
28 September - December 3128 October - December 31November 27 - December 31January 1-14
October 5 - January 6November 4 - January 6December 4 - January 6January 7-21
Anomaly detection is also available in theReporting API .
Version 14 Report Descriptions
Report descriptions for version 14.• Site Metrics• Site Content • Video• Mobile• Paths• Traffic Sources• Campaigns• Products• Visitor Retention• Visitor Profile
Site Metrics
The Page Views report displays the number of times your Website pages were viewed for the selected time period (hour, day,
Page Views
week, month, quarter or year). This report allows you to track page views for each individual page on your site, as well as anaggregate of page views for your website as a whole.
216Report Descriptions
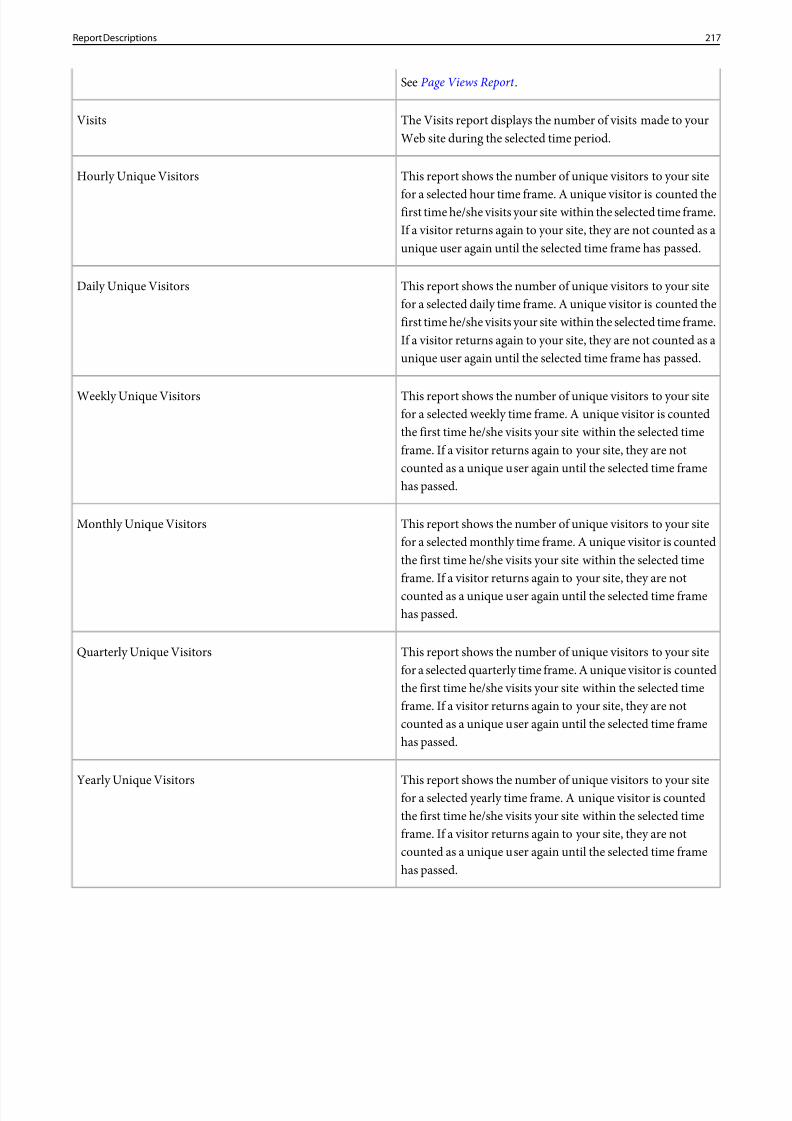
8/18/2019 Analytics Reference Adobe
http://slidepdf.com/reader/full/analytics-reference-adobe 217/332
SeePage Views Report .
The Visits report displays the number of visits made to yourWeb site during the selected time period.
Visits
This report shows the number of unique visitors to your site
for a selected hour time frame. A unique visitor is counted the
Hourly Unique Visitors
first time he/she visits your site within the selected time frame.If a visitor returns again to your site, they are not counted as aunique user again until the selected time frame has passed.
This report shows the number of unique visitors to your sitefor a selected daily time frame. A unique visitor is counted the
Daily Unique Visitors
first time he/she visits your site within the selected time frame.If a visitor returns again to your site, they are not counted as aunique user again until the selected time frame has passed.
This report shows the number of unique visitors to your sitefor a selected weekly time frame. A unique visitor is counted
Weekly Unique Visitors
the first time he/she visits your site within the selected timeframe. If a visitor returns again to your site, they are notcounted as a unique user again until the selected time framehas passed.
This report shows the number of unique visitors to your sitefor a selected monthly time frame. A unique visitor is counted
Monthly Unique Visitors
the first time he/she visits your site within the selected timeframe. If a visitor returns again to your site, they are notcounted as a unique user again until the selected time framehas passed.
This report shows the number of unique visitors to your sitefor a selected quarterly time frame. A unique visitor is counted
Quarterly Unique Visitors
the first time he/she visits your site within the selected timeframe. If a visitor returns again to your site, they are notcounted as a unique user again until the selected time framehas passed.
This report shows the number of unique visitors to your sitefor a selected yearly time frame. A unique visitor is countedYearly Unique Visitors
the first time he/she visits your site within the selected timeframe. If a visitor returns again to your site, they are notcounted as a unique user again until the selected time framehas passed.
217Report Descriptions
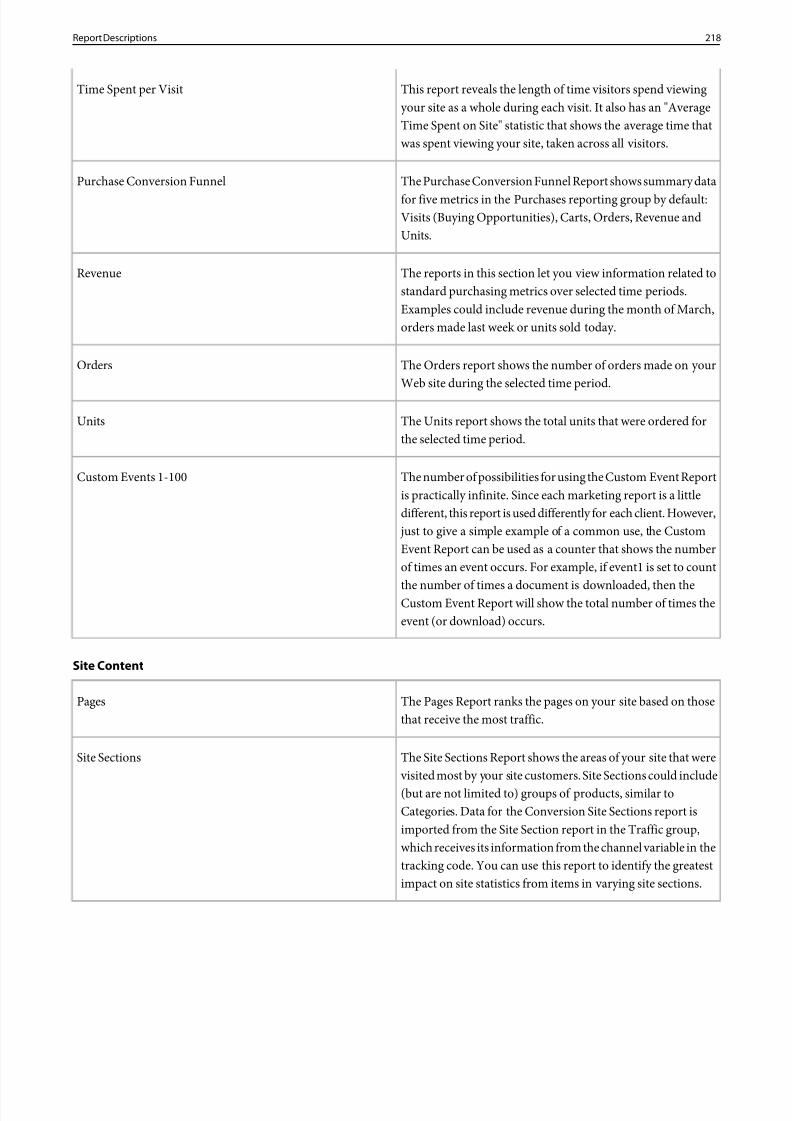
8/18/2019 Analytics Reference Adobe
http://slidepdf.com/reader/full/analytics-reference-adobe 218/332
This report reveals the length of time visitors spend viewingyour site as a whole during each visit. It also has an "Average
Time Spent per Visit
Time Spent on Site" statistic that shows the average time thatwas spent viewing your site, taken across all visitors.
The Purchase Conversion Funnel Report shows summary datafor five metrics in the Purchases reporting group by default:
Purchase Conversion Funnel
Visits (Buying Opportunities), Carts, Orders, Revenue andUnits.
The reports in this section let you view information related tostandard purchasing metrics over selected time periods.
Revenue
Examples could include revenue during the month of March,orders made last week or units sold today.
The Orders report shows the number of orders made on yourWeb site during the selected time period.
Orders
The Units report shows the total units that were ordered forthe selected time period.
Units
The number of possibilities for using the Custom Event Reportis practically infinite. Since each marketing report is a little
Custom Events 1-100
different, this report is used differently for each client. However, just to give a simple example of a common use, the CustomEvent Report can be used as a counter that shows the numberof times an event occurs. For example, if event1 is set to count
the number of times a document is downloaded, then theCustom Event Report will show the total number of times theevent (or download) occurs.
Site Content
The Pages Report ranks the pages on your site based on thosethat receive the most traffic.
Pages
The Site Sections Report shows the areas of your site that were visited most by your site customers. Site Sections could include
Site Sections
(but are not limited to) groups of products, similar toCategories. Data for the Conversion Site Sections report isimported from the Site Section report in the Traffic group,which receives its information from the channel variable in thetracking code. You can use this report to identify the greatestimpact on site statistics from items in varying site sections.
218Report Descriptions
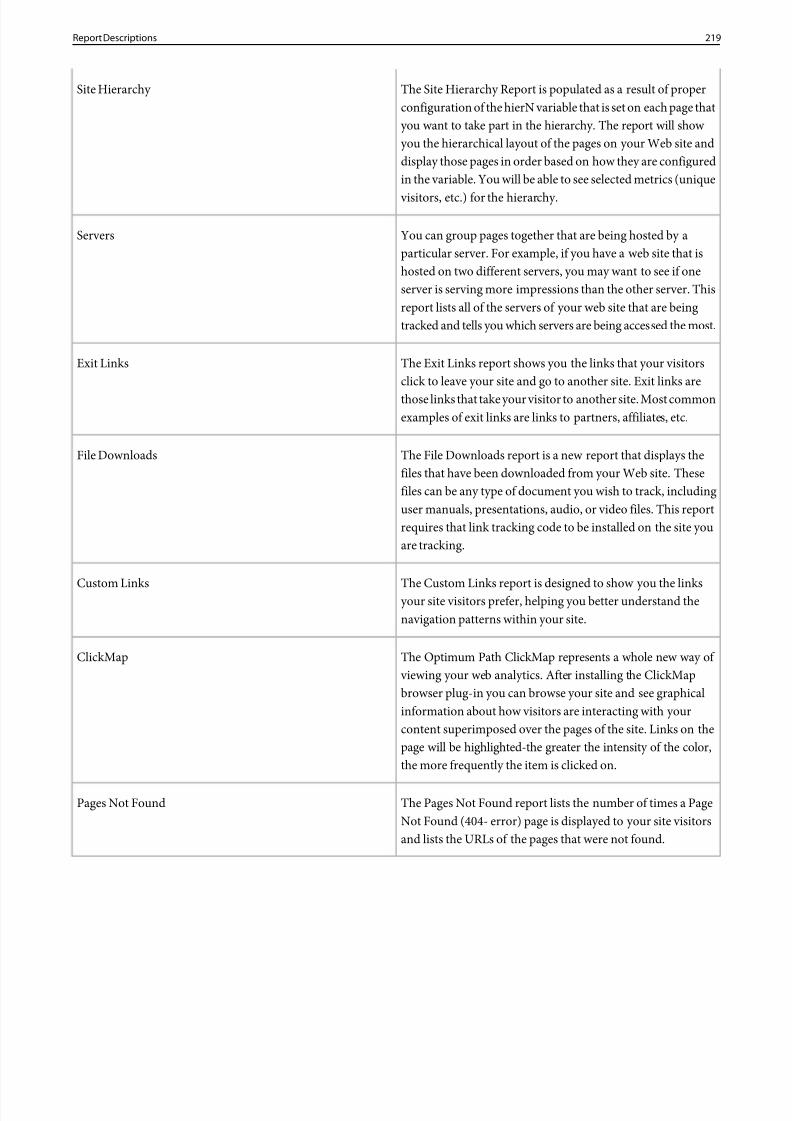
8/18/2019 Analytics Reference Adobe
http://slidepdf.com/reader/full/analytics-reference-adobe 219/332
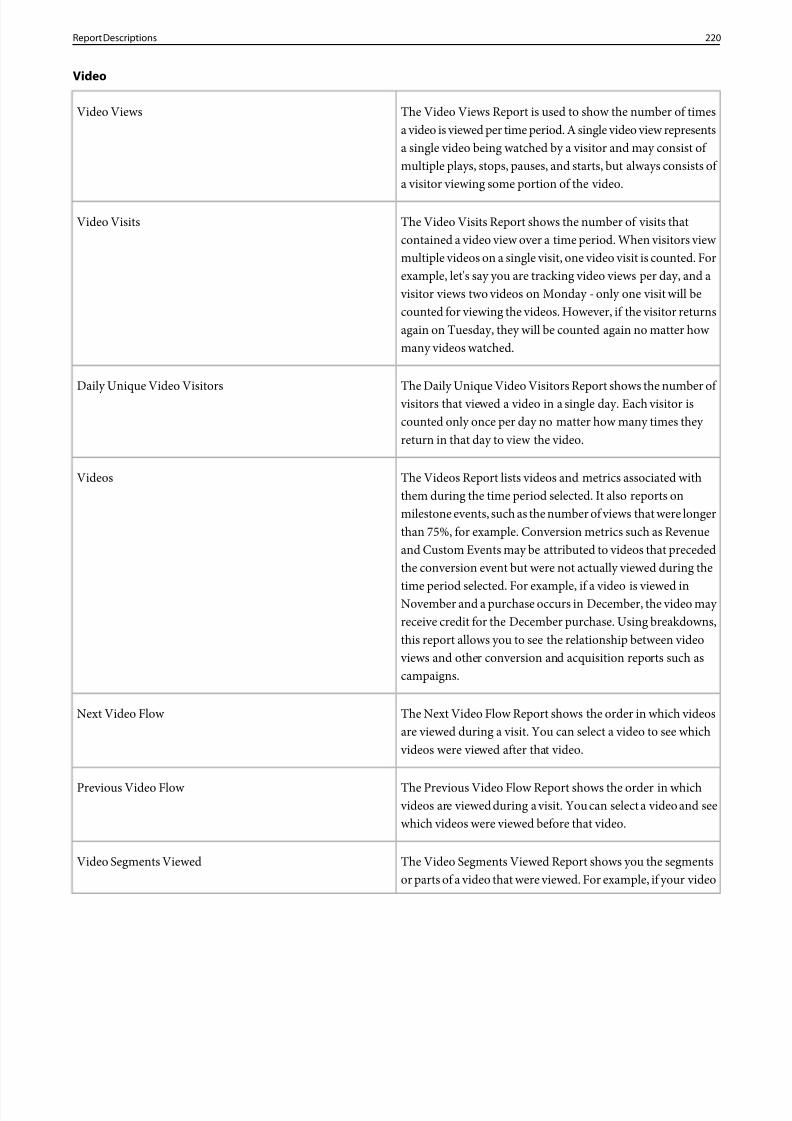
8/18/2019 Analytics Reference Adobe
http://slidepdf.com/reader/full/analytics-reference-adobe 220/332
Video
The Video Views Report is used to show the number of timesa video is viewed per time period. A single video view represents
Video Views
a single video being watched by a visitor and may consist of multiple plays, stops, pauses, and starts, but always consists of a visitor viewing some portion of the video.
The Video Visits Report shows the number of visits thatcontained a video view over a time period. When visitors view
Video Visits
multiple videos on a single visit, one video visit is counted. Forexample, let's say you are tracking video views per day, and a visitor views two videos on Monday - only one visit will becounted for viewing the videos. However, if the visitor returnsagain on Tuesday, they will be counted again no matter how many videos watched.
The Daily Unique Video Visitors Report shows the number of visitors that viewed a video in a single day. Each visitor isDaily Unique Video Visitors
counted only once per day no matter how many times they return in that day to view the video.
The Videos Report lists videos and metrics associated withthem during the time period selected. It also reports on
Videos
milestone events, such as the number of views that were longerthan 75%, for example. Conversion metrics such as Revenueand Custom Events may be attributed to videos that precededthe conversion event but were not actually viewed during the
time period selected. For example, if a video is viewed inNovember and a purchase occurs in December, the video may receive credit for the December purchase. Using breakdowns,this report allows you to see the relationship between video views and other conversion and acquisition reports such ascampaigns.
The Next Video Flow Report shows the order in which videosare viewed during a visit. You can select a video to see which videos were viewed after that video.
Next Video Flow
The Previous Video Flow Report shows the order in which videos are viewed during a visit. You can select a video and seewhich videos were viewed before that video.
Previous Video Flow
The Video Segments Viewed Report shows you the segmentsor parts of a video that were viewed. For example, if your video
Video Segments Viewed
220Report Descriptions
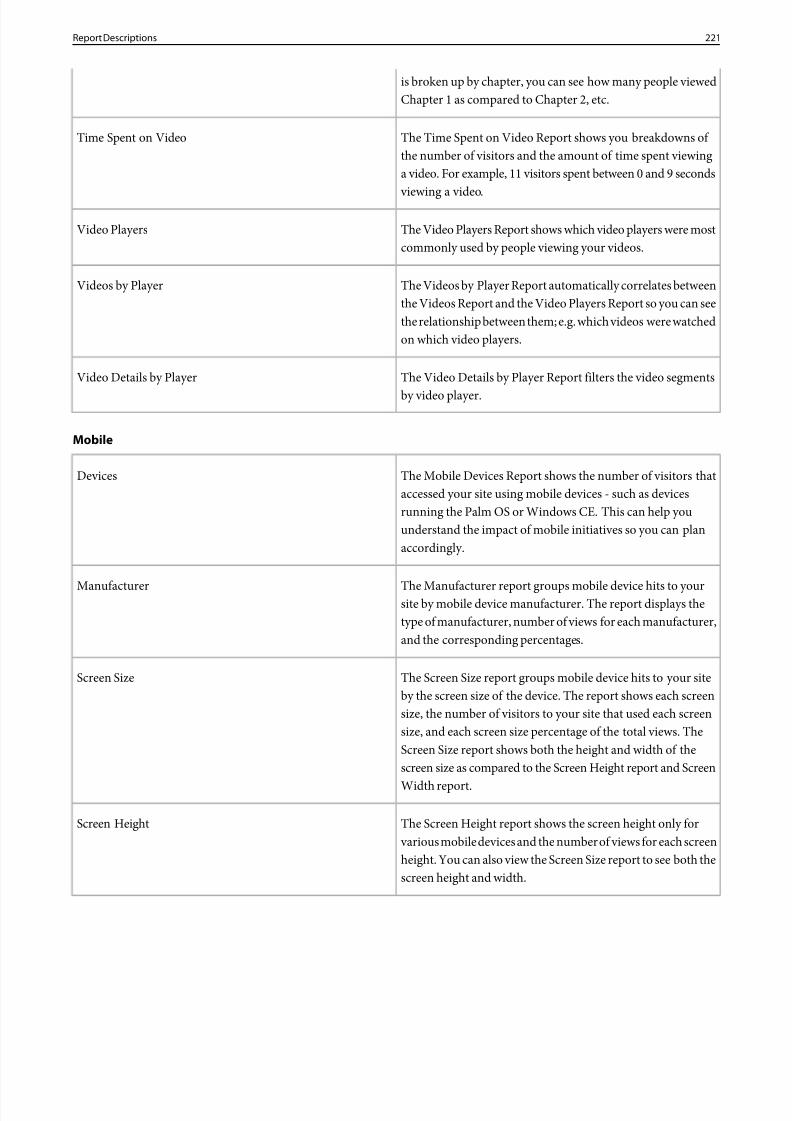
8/18/2019 Analytics Reference Adobe
http://slidepdf.com/reader/full/analytics-reference-adobe 221/332
is broken up by chapter, you can see how many people viewedChapter 1 as compared to Chapter 2, etc.
The Time Spent on Video Report shows you breakdowns of the number of visitors and the amount of time spent viewing
Time Spent on Video
a video. For example, 11 visitors spent between 0 and 9 seconds
viewing a video.
The Video Players Report shows which video players were mostcommonly used by people viewing your videos.
Video Players
The Videos by Player Report automatically correlates betweenthe Videos Report and the Video Players Report so you can see
Videos by Player
the relationship between them; e.g. which videos were watchedon which video players.
The Video Details by Player Report filters the video segments
by video player.
Video Details by Player
Mobile
The Mobile Devices Report shows the number of visitors thataccessed your site using mobile devices - such as devices
Devices
running the Palm OS or Windows CE. This can help youunderstand the impact of mobile initiatives so you can planaccordingly.
The Manufacturer report groups mobile device hits to yoursite by mobile device manufacturer. The report displays the
Manufacturer
type of manufacturer, number of views for each manufacturer,and the corresponding percentages.
The Screen Size report groups mobile device hits to your siteby the screen size of the device. The report shows each screen
Screen Size
size, the number of visitors to your site that used each screensize, and each screen size percentage of the total views. TheScreen Size report shows both the height and width of thescreen size as compared to the Screen Height report and Screen
Width report.
The Screen Height report shows the screen height only for various mobile devices and the number of views for each screen
Screen Height
height. You can also view the Screen Size report to see both thescreen height and width.
221Report Descriptions
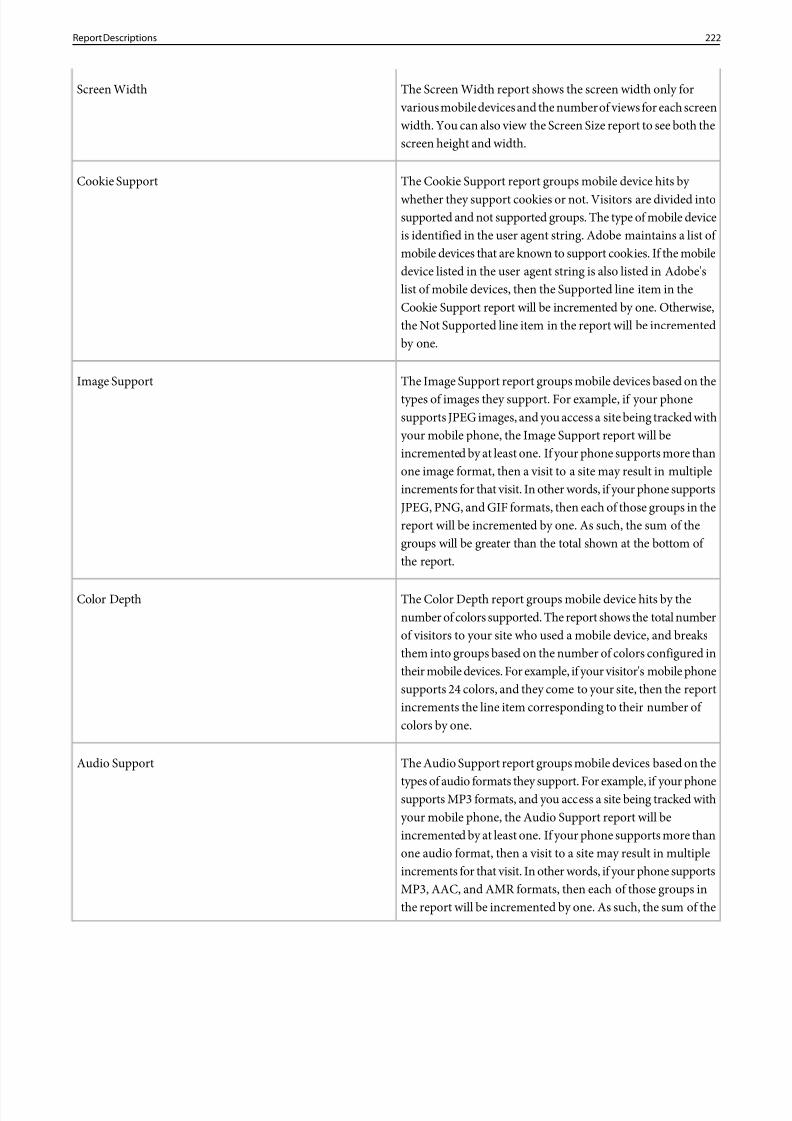
8/18/2019 Analytics Reference Adobe
http://slidepdf.com/reader/full/analytics-reference-adobe 222/332
The Screen Width report shows the screen width only for various mobile devices and the number of views for each screen
Screen Width
width. You can also view the Screen Size report to see both thescreen height and width.
The Cookie Support report groups mobile device hits by whether they support cookies or not. Visitors are divided into
Cookie Support
supported and not supported groups. The type of mobile deviceis identified in the user agent string. Adobe maintains a list of mobile devices that are known to support cookies. If the mobiledevice listed in the user agent string is also listed in Adobe'slist of mobile devices, then the Supported line item in theCookie Support report will be incremented by one. Otherwise,the Not Supported line item in the report will be incrementedby one.
The Image Support report groups mobile devices based on thetypes of images they support. For example, if your phone
Image Support
supports JPEG images, and you access a site being tracked withyour mobile phone, the Image Support report will beincremented by at least one. If your phone supports more thanone image format, then a visit to a site may result in multipleincrements for that visit. In other words, if your phone supportsJPEG, PNG, and GIF formats, then each of those groups in thereport will be incremented by one. As such, the sum of thegroups will be greater than the total shown at the bottom of the report.
The Color Depth report groups mobile device hits by thenumber of colors supported. The report shows the total number
Color Depth
of visitors to your site who used a mobile device, and breaksthem into groups based on the number of colors configured intheir mobile devices. For example, if your visitor's mobile phonesupports 24 colors, and they come to your site, then the reportincrements the line item corresponding to their number of colors by one.
The Audio Support report groups mobile devices based on the
types of audio formats they support. For example, if your phone
Audio Support
supports MP3 formats, and you access a site being tracked withyour mobile phone, the Audio Support report will beincremented by at least one. If your phone supports more thanone audio format, then a visit to a site may result in multipleincrements for that visit. In other words, if your phone supportsMP3, AAC, and AMR formats, then each of those groups inthe report will be incremented by one. As such, the sum of the
222Report Descriptions
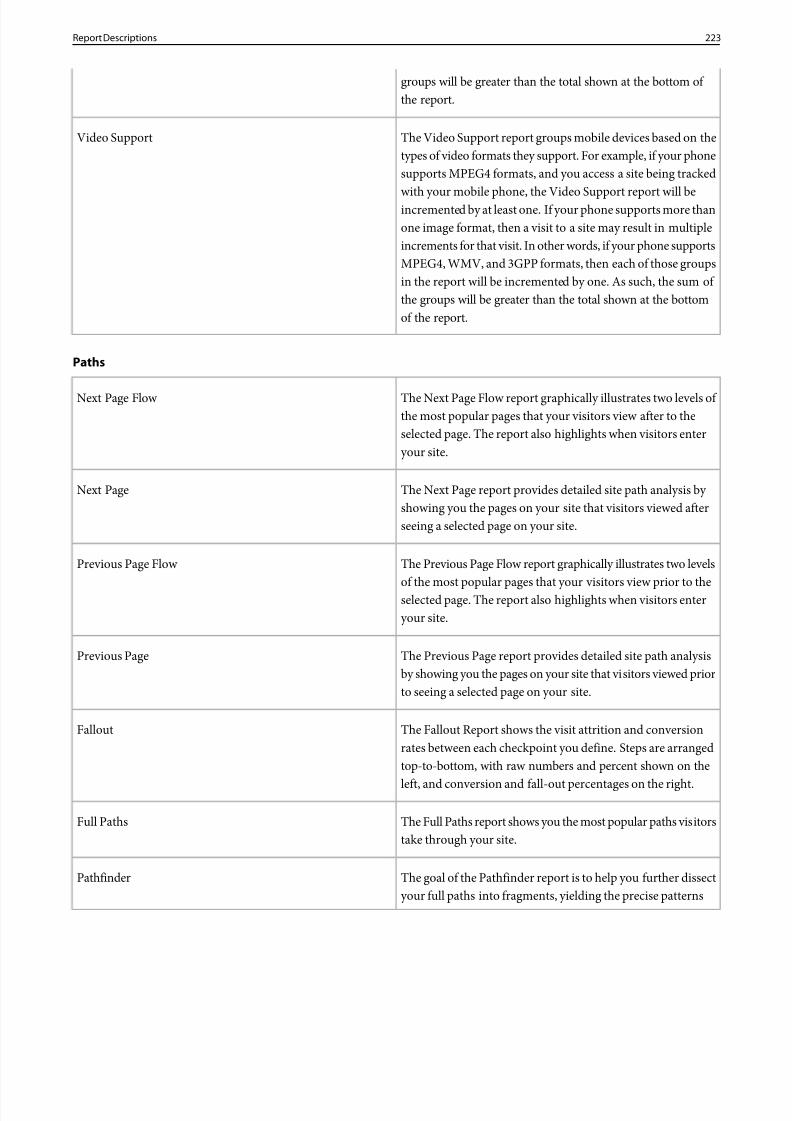
8/18/2019 Analytics Reference Adobe
http://slidepdf.com/reader/full/analytics-reference-adobe 223/332
groups will be greater than the total shown at the bottom of the report.
The Video Support report groups mobile devices based on thetypes of video formats they support. For example, if your phone
Video Support
supports MPEG4 formats, and you access a site being tracked
with your mobile phone, the Video Support report will beincremented by at least one. If your phone supports more thanone image format, then a visit to a site may result in multipleincrements for that visit. In other words, if your phone supportsMPEG4, WMV, and 3GPP formats, then each of those groupsin the report will be incremented by one. As such, the sum of the groups will be greater than the total shown at the bottomof the report.
Paths
The Next Page Flow report graphically illustrates two levels of the most popular pages that your visitors view after to the
Next Page Flow
selected page. The report also highlights when visitors enteryour site.
The Next Page report provides detailed site path analysis by showing you the pages on your site that visitors viewed afterseeing a selected page on your site.
Next Page
The Previous Page Flow report graphically illustrates two levelsof the most popular pages that your visitors view prior to the
Previous Page Flow
selected page. The report also highlights when visitors enteryour site.
The Previous Page report provides detailed site path analysisby showing you the pages on your site that visitors viewed priorto seeing a selected page on your site.
Previous Page
The Fallout Report shows the visit attrition and conversionrates between each checkpoint you define. Steps are arranged
Fallout
top-to-bottom, with raw numbers and percent shown on the
left, and conversion and fall-out percentages on the right.
The Full Paths report shows you the most popular paths visitorstake through your site.
Full Paths
The goal of the Pathfinder report is to help you further dissectyour full paths into fragments, yielding the precise patterns
Pathfinder
223Report Descriptions
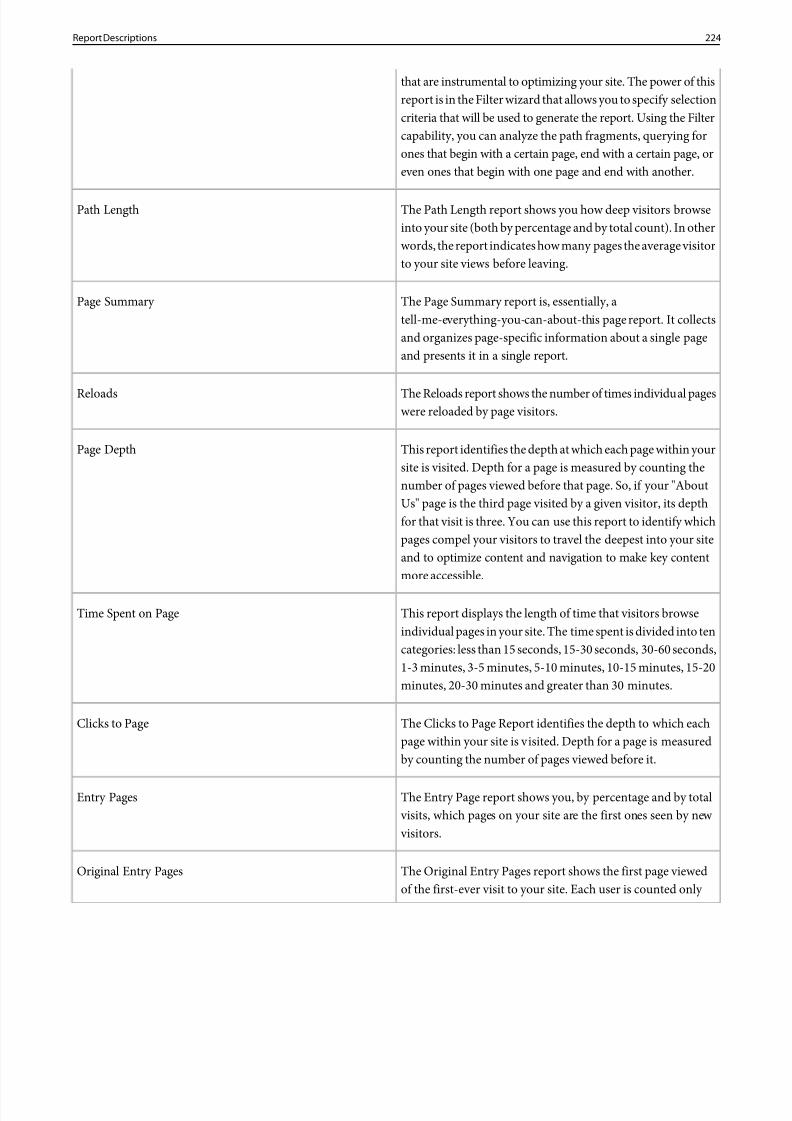
8/18/2019 Analytics Reference Adobe
http://slidepdf.com/reader/full/analytics-reference-adobe 224/332
that are instrumental to optimizing your site. The power of thisreport is in the Filter wizard that allows you to specify selectioncriteria that will be used to generate the report. Using the Filtercapability, you can analyze the path fragments, querying forones that begin with a certain page, end with a certain page, oreven ones that begin with one page and end with another.
The Path Length report shows you how deep visitors browseinto your site (both by percentage and by total count). In other
Path Length
words, the report indicates how many pages the average visitorto your site views before leaving.
The Page Summary report is, essentially, atell-me-everything-you-can-about-this page report. It collects
Page Summary
and organizes page-specific information about a single pageand presents it in a single report.
The Reloads report shows the number of times individual pageswere reloaded by page visitors.
Reloads
This report identifies the depth at which each page within yoursite is visited. Depth for a page is measured by counting the
Page Depth
number of pages viewed before that page. So, if your "AboutUs" page is the third page visited by a given visitor, its depthfor that visit is three. You can use this report to identify whichpages compel your visitors to travel the deepest into your siteand to optimize content and navigation to make key contentmore accessible.
This report displays the length of time that visitors browseindividual pages in your site. The time spent is divided into ten
Time Spent on Page
categories: less than 15 seconds, 15-30 seconds, 30-60 seconds,1-3 minutes, 3-5 minutes, 5-10 minutes, 10-15 minutes, 15-20minutes, 20-30 minutes and greater than 30 minutes.
The Clicks to Page Report identifies the depth to which eachpage within your site is visited. Depth for a page is measuredby counting the number of pages viewed before it.
Clicks to Page
The Entry Page report shows you, by percentage and by total visits, which pages on your site are the first ones seen by new visitors.
Entry Pages
The Original Entry Pages report shows the first page viewedof the first-ever visit to your site. Each user is counted only
Original Entry Pages
224Report Descriptions
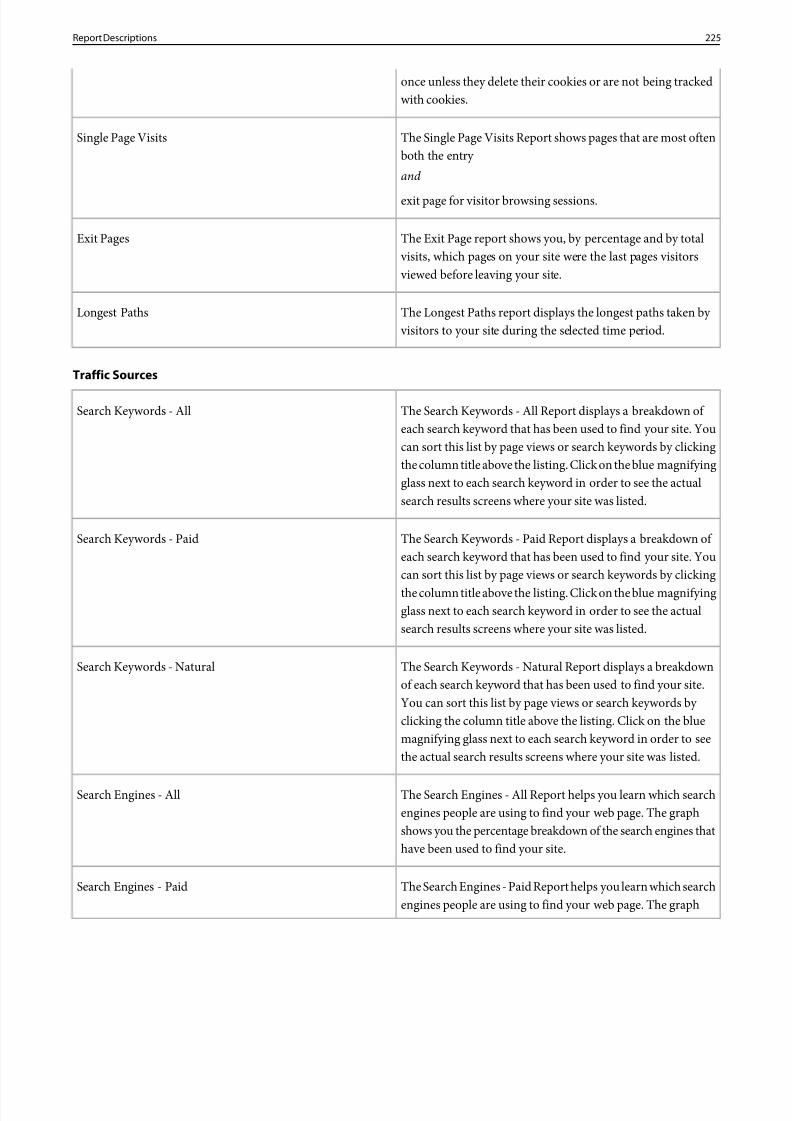
8/18/2019 Analytics Reference Adobe
http://slidepdf.com/reader/full/analytics-reference-adobe 225/332
once unless they delete their cookies or are not being trackedwith cookies.
The Single Page Visits Report shows pages that are most oftenboth the entry
Single Page Visits
and
exit page for visitor browsing sessions.
The Exit Page report shows you, by percentage and by total visits, which pages on your site were the last pages visitors viewed before leaving your site.
Exit Pages
The Longest Paths report displays the longest paths taken by visitors to your site during the selected time period.
Longest Paths
Traffic Sources
The Search Keywords - All Report displays a breakdown of each search keyword that has been used to find your site. You
Search Keywords - All
can sort this list by page views or search keywords by clickingthe column title above the listing. Click on the blue magnifyingglass next to each search keyword in order to see the actualsearch results screens where your site was listed.
The Search Keywords - Paid Report displays a breakdown of each search keyword that has been used to find your site. You
Search Keywords - Paid
can sort this list by page views or search keywords by clickingthe column title above the listing. Click on the blue magnifyingglass next to each search keyword in order to see the actualsearch results screens where your site was listed.
The Search Keywords - Natural Report displays a breakdownof each search keyword that has been used to find your site.
Search Keywords - Natural
You can sort this list by page views or search keywords by clicking the column title above the listing. Click on the bluemagnifying glass next to each search keyword in order to seethe actual search results screens where your site was listed.
The Search Engines - All Report helps you learn which searchengines people are using to find your web page. The graph
Search Engines - All
shows you the percentage breakdown of the search engines thathave been used to find your site.
The Search Engines - Paid Report helps you learn which searchengines people are using to find your web page. The graph
Search Engines - Paid
225Report Descriptions
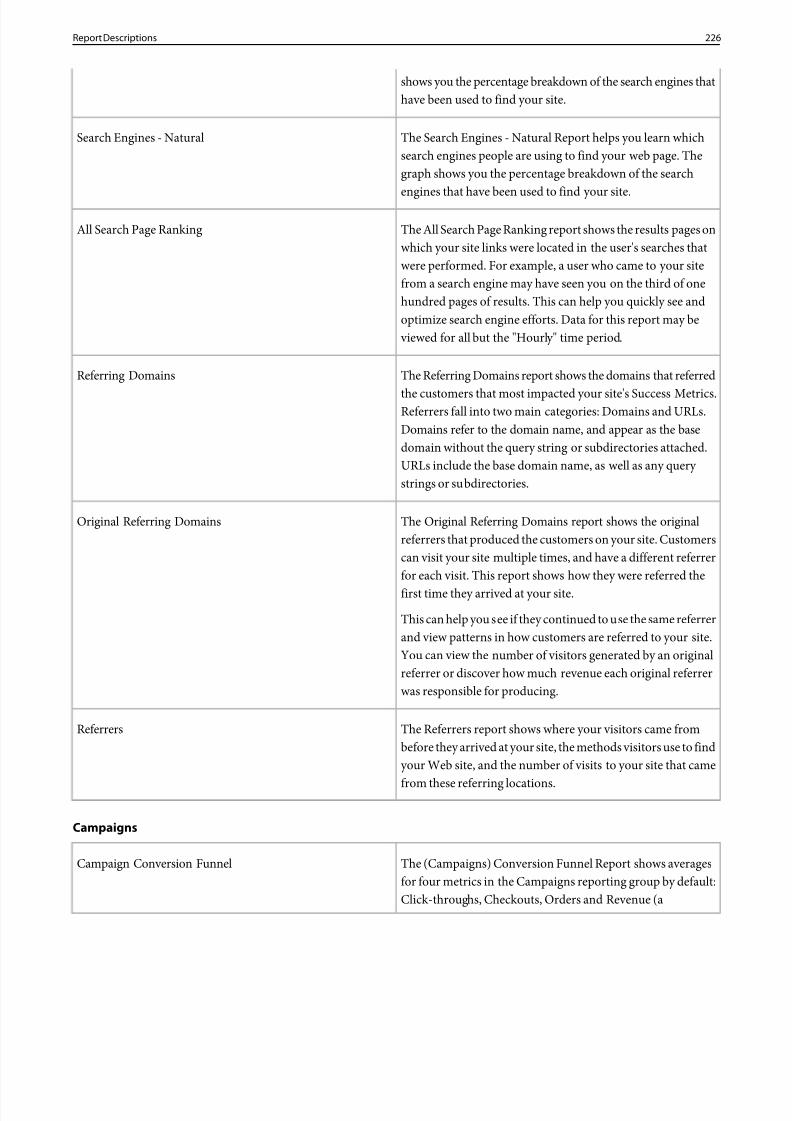
8/18/2019 Analytics Reference Adobe
http://slidepdf.com/reader/full/analytics-reference-adobe 226/332
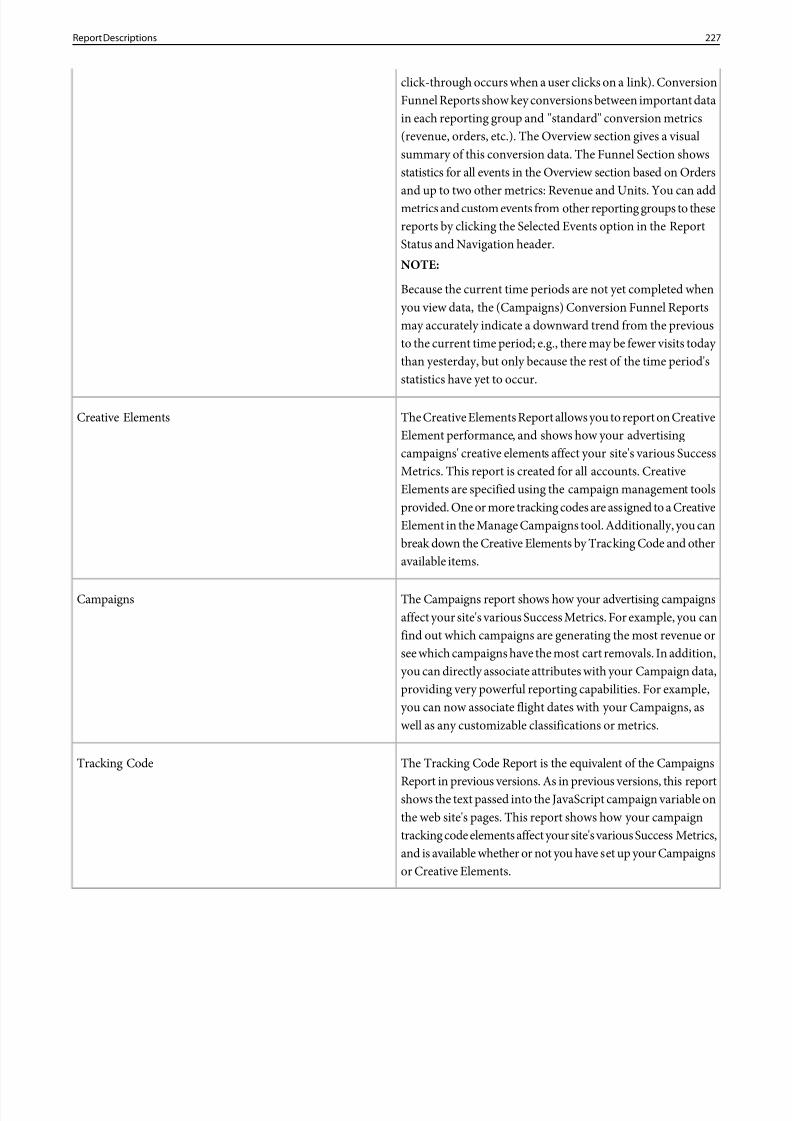
8/18/2019 Analytics Reference Adobe
http://slidepdf.com/reader/full/analytics-reference-adobe 227/332
click-through occurs when a user clicks on a link). ConversionFunnel Reports show key conversions between important datain each reporting group and "standard" conversion metrics(revenue, orders, etc.). The Overview section gives a visualsummary of this conversion data. The Funnel Section showsstatistics for all events in the Overview section based on Orders
and up to two other metrics: Revenue and Units. You can addmetrics and custom events from other reporting groups to thesereports by clicking the Selected Events option in the ReportStatus and Navigation header.NOTE:
Because the current time periods are not yet completed whenyou view data, the (Campaigns) Conversion Funnel Reportsmay accurately indicate a downward trend from the previousto the current time period; e.g., there may be fewer visits today than yesterday, but only because the rest of the time period'sstatistics have yet to occur.
The Creative Elements Report allows you to report on CreativeElement performance, and shows how your advertising
Creative Elements
campaigns' creative elements affect your site's various SuccessMetrics. This report is created for all accounts. CreativeElements are specified using the campaign management toolsprovided. One or more tracking codes are assigned to a CreativeElement in the Manage Campaigns tool. Additionally, you canbreak down the Creative Elements by Tracking Code and otheravailable items.
The Campaigns report shows how your advertising campaignsaffect your site's various Success Metrics. For example, you can
Campaigns
find out which campaigns are generating the most revenue orsee which campaigns have the most cart removals. In addition,you can directly associate attributes with your Campaign data,providing very powerful reporting capabilities. For example,you can now associate flight dates with your Campaigns, aswell as any customizable classifications or metrics.
The Tracking Code Report is the equivalent of the Campaigns
Report in previous versions. As in previous versions, this report
Tracking Code
shows the text passed into the JavaScript campaign variable onthe web site's pages. This report shows how your campaigntracking code elements affect your site's various Success Metrics,and is available whether or not you have set up your Campaignsor Creative Elements.
227Report Descriptions
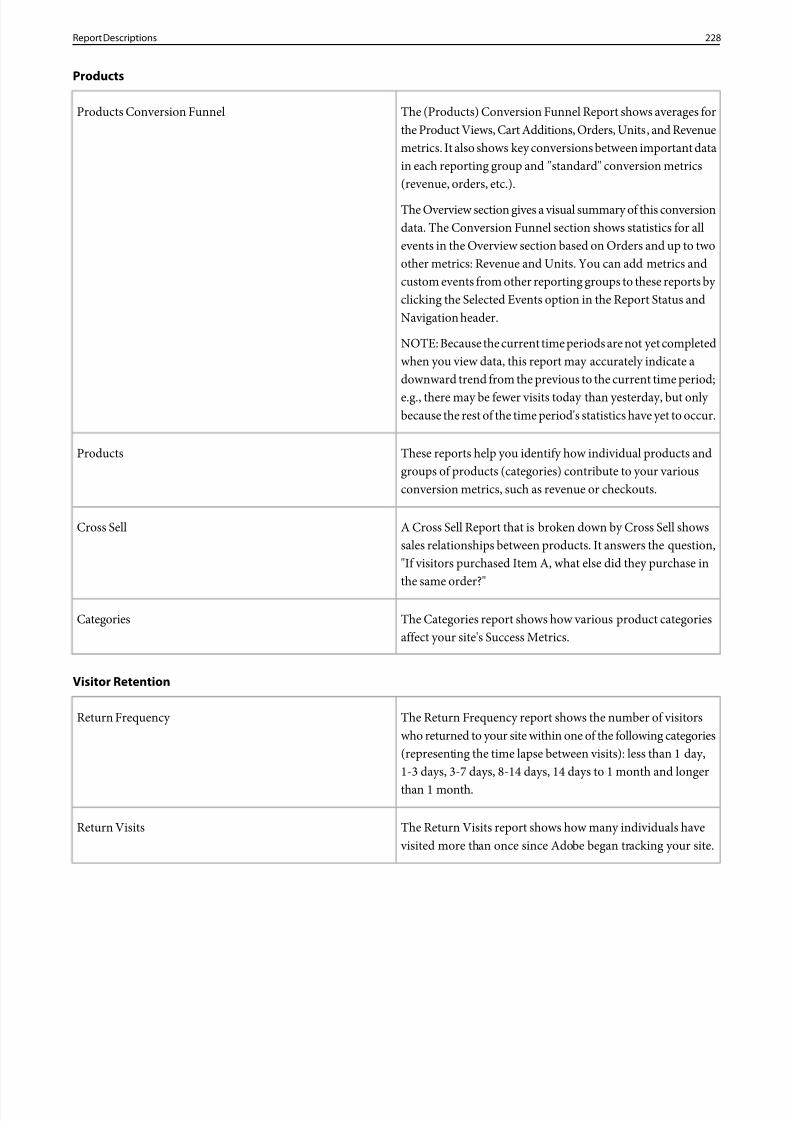
8/18/2019 Analytics Reference Adobe
http://slidepdf.com/reader/full/analytics-reference-adobe 228/332
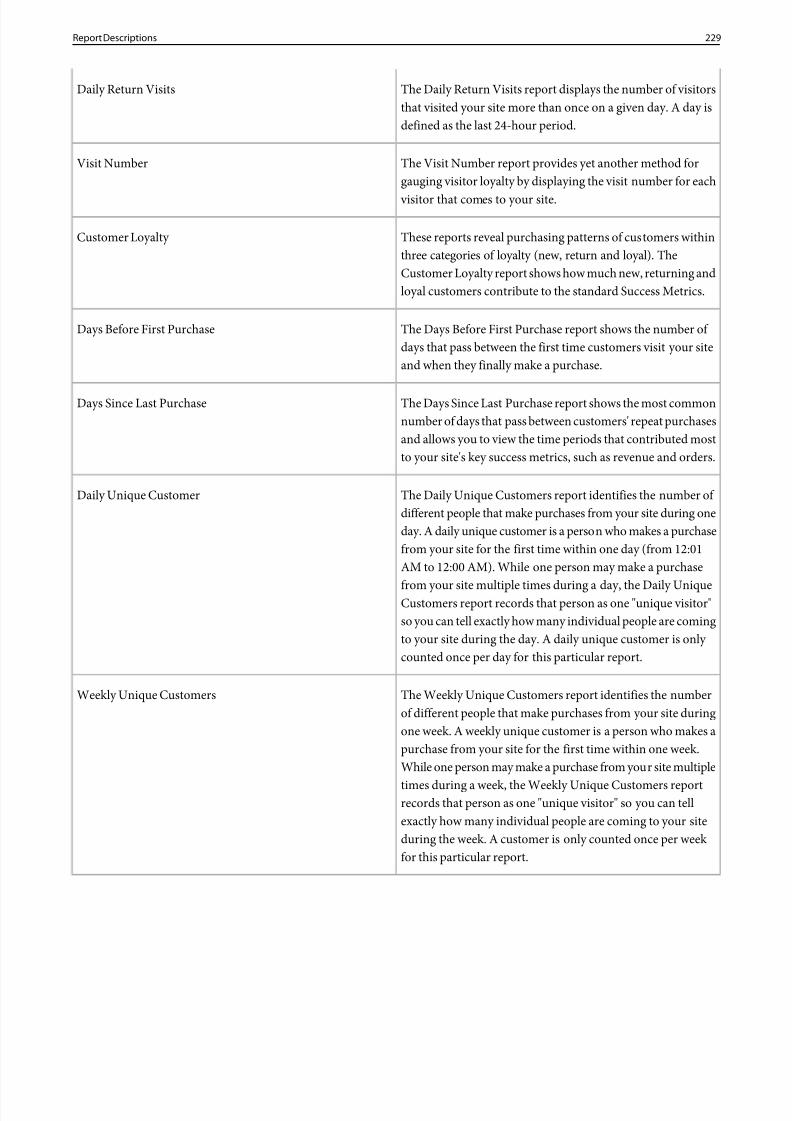
8/18/2019 Analytics Reference Adobe
http://slidepdf.com/reader/full/analytics-reference-adobe 229/332
The Daily Return Visits report displays the number of visitorsthat visited your site more than once on a given day. A day isdefined as the last 24-hour period.
Daily Return Visits
The Visit Number report provides yet another method forgauging visitor loyalty by displaying the visit number for each visitor that comes to your site.
Visit Number
These reports reveal purchasing patterns of customers withinthree categories of loyalty (new, return and loyal). The
Customer Loyalty
Customer Loyalty report shows how much new, returning andloyal customers contribute to the standard Success Metrics.
The Days Before First Purchase report shows the number of days that pass between the first time customers visit your siteand when they finally make a purchase.
Days Before First Purchase
The Days Since Last Purchase report shows the most commonnumber of days that pass between customers' repeat purchases
Days Since Last Purchase
and allows you to view the time periods that contributed mostto your site's key success metrics, such as revenue and orders.
The Daily Unique Customers report identifies the number of different people that make purchases from your site during one
Daily Unique Customer
day. A daily unique customer is a person who makes a purchasefrom your site for the first time within one day (from 12:01AM to 12:00 AM). While one person may make a purchase
from your site multiple times during a day, the Daily UniqueCustomers report records that person as one "unique visitor"so you can tell exactly how many individual people are comingto your site during the day. A daily unique customer is only counted once per day for this particular report.
The Weekly Unique Customers report identifies the numberof different people that make purchases from your site during
Weekly Unique Customers
one week. A weekly unique customer is a person who makes apurchase from your site for the first time within one week.While one person may make a purchase from your site multiple
times during a week, the Weekly Unique Customers reportrecords that person as one "unique visitor" so you can tellexactly how many individual people are coming to your siteduring the week. A customer is only counted once per week for this particular report.
229Report Descriptions
8/18/2019 Analytics Reference Adobe
http://slidepdf.com/reader/full/analytics-reference-adobe 230/332
The Monthly Unique Customers report identifies the numberof different people that make purchases from your site during
Monthly Unique Customers
one day. A monthly unique customer is a person who makesa purchase from your site for the first time within one month.While one person may make a purchase from your site multipletimes during a month, the Monthly Unique Customers report
records that person as one "unique visitor" so you can tellexactly how many individual people are coming to your siteduring the month. A customer can be counted only once permonth for this particular report.
The Quarterly Unique Customers report identifies the numberof different people that make purchases from your site during
Quarterly Unique Customers
one quarter. A quarterly unique customer is a person whomakes a purchase from your site for the first time within onequarter. While one person may make a purchase from yoursite multiple times during a quarter, the Quarterly UniqueCustomers report records that person as one "unique visitor"so you can tell exactly how many individual people are comingto your site during the quarter. A customer can only be countedonce per quarter for this particular report.
The Yearly Unique Customers report identifies the number of different people that make purchases from your site during one
Yearly Unique Customers
year. A yearly unique customer is a person who makes apurchase from your site for the first time within one year. Whileone person may make a purchase from your site multiple timesduring a year, the Yearly Unique Customers report recordsthat person as one "unique visitor" so you can tell exactly how many individual people are coming to your site during the year.A customer is only counted once per year for this particularreport.
Visitor Profile
The Countries Report shows you the countries from which visitors are accessing your site. In addition to the standard
Countries
"Ranked" and "Trended" views available on most reports, there
is also a "Map" view that color-codes the countries accordingto their relative contribution to your total traffic-the moreintense the color the greater the number of daily unique visitorsfrom that country that are visiting your site.
The Regions Report shows you the regions from which visitorsare accessing your site. To the right of each region shown, the
Regions
230Report Descriptions
8/18/2019 Analytics Reference Adobe
http://slidepdf.com/reader/full/analytics-reference-adobe 231/332
country of the region is also shown in parentheses. Clickingthe magnifying glass icon to the left of the region will open theline item in the Cities Report. With this report, you can seehow a selected region performed compared to another on yourweb site.
The Cities Report shows you the U.S. cities from which visitorsare accessing your site.Cities
The U.S. States Report shows you the U.S. states from which visitors are accessing your site.
U.S. States
The DMA (Designated Market Area) Report shows you themarketing areas within the United States from which visitors
U.S. DMA
are accessing your site. By clicking the link next to State in theReport Status header, you may optionally restrict the report toshowing only marketing areas within a particular state. This
data is provided via a partnership between Adobe and NielsenMedia Research, Inc.
By clicking the Visitors Per Capita link next to Display in theReport Status header, you can adjust the data by the relativepopulation of each marketing area. Enabling this option showsboth the number of daily unique site visitors per 10,000 peopleliving in the market area as well as the percent above or below the national average value. You can also generate a Correlationreport by clicking the Correlation icon next to one of the marketareas and selecting the item with which you want to correlatethe data.
The Visitor Home Page Report is used as another method forgauging visitor loyalty and assessing the perceived value your
Visitor Home Page
visitors place on your Web site's content. The report showshow often your visitors mark a page on your Web site as their"Home Page" in their browser.
The Languages report displays your visitors' preferredlanguages. The Languages Report captures the default browserlanguage and displays those most used by visitors to your site.
Languages
The Time Zones report displays the time zones your visitorsare located in when they view your site. This report
Time Zones
superimposes a bar graph (indicating the number of visitors)on a map of the world so you can quickly see what part of theworld your visitors are from.
231Report Descriptions
8/18/2019 Analytics Reference Adobe
http://slidepdf.com/reader/full/analytics-reference-adobe 232/332
The Domains report lists the organizations and ISPs your visitors use to browse your site. This report differs from the
Domains
Full Domains report in that the Full Domains report registersthe full ISP domain, whereas this report lists the secondary domain.
The Top Level Domains report identifies world regions that visitors come from, based on their originating domain
Top Level Domains
extension, and shows how many visitors come from thesecountries. Domains ending in Commercial (.com), Network (.net), Education (.edu), Government (.gov) and Organization(.org) are usually based in the United States, and are listedseparately from the rest of the domains.
The Browsers report identifies the types and versions of browsers that are used by each of your visitors.
Browsers
The Browser Types Report classifies the browsers visiting yoursite into their major families.
Browser Types
The Mobile Devices Report shows the number of visitors thataccessed your site using mobile devices - such as devicesrunning the Palm OS or Windows CE.
Mobile Devices
The Browser Width report shows you the most common widthsor heights of the browsers (in pixels) your visitors use to view your site.
Browser Width
The Browser Height report shows you the most common widthsor heights of the browsers (in pixels) your visitors use to view your site.
Browser Height
The Operating Systems report shows you which operatingsystems are being used by your site visitors.
Operating Systems
The Monitor Color Depth report shows your visitors' mostpopular color-depth settings as configured on their computer.
Monitor Color Depth
Color-depth refers to the number of colors that can be displayedon the screen.
The Monitor Resolution report shows the screen resolutions visitors to your Web site most commonly use, as configuredon their computers.
Monitor Resolutions
232Report Descriptions
8/18/2019 Analytics Reference Adobe
http://slidepdf.com/reader/full/analytics-reference-adobe 233/332
The Netscape Plug-Ins report displays the plug-ins that your visitors have enabled while they view your site.
Netscape Plug-ins
The Java Report shows you the percentage of visitors to yoursite that make use of Java or have JavaScript turned on or off.
Java
The JavaScript report shows you the percentage of visitors toyour site that make use of Java or have JavaScript turned on oroff.
JavaScript
The JavaScript Version report displays the versions of JavaScriptyour visitors' browsers use while viewing your site.
JavaScript Version
The Cookies report shows you the percentage of your visitorsthat prefer to use cookies while browsing.
Cookies
The Connection Types Report displays the percentage of yoursite's visitors that utilize high-speed Internet connections versusslower dial-up connections.
Connection Types
The Key Visitors report allows you to single out and monitorup to five different visitor groups that visit your Web site.
Key Visitors
The Pages Viewed by Key Visitors Report lists all of your sitepages that have been visited by the key visitors you havespecified, in order of popularity.
Pages Viewed by Key Visitors
The Last 100 Visitors report shows information for the last 100 visitors to your site. Information is presented in a table that
Last 100 Visitors
displays the date and time of the visit, and the visitors' domainsand IP addresses.
The Visitor Snapshot Report, by default, shows visitorinformation for the last visitors to your site. Each visitor is
Visitor Snapshot
defined by IP address. Information collected for each visitor ispresented in an easy to read table with detail for five visitorslisted on each page.
The Visitor State Report shows which states produced thosecustomers who had the greatest effect on success metrics suchas revenue, orders, checkouts, cart additions, etc.
Visitor State
The Visitor ZIP/Postal Codes report shows the zip and postalcodes that produced the customers that had the greatest effecton purchase success metrics.
Visitor Zip/Postal Code
233Report Descriptions
8/18/2019 Analytics Reference Adobe
http://slidepdf.com/reader/full/analytics-reference-adobe 234/332
Report Categories
Descriptions of report categories used in the Marketing Cloud.
Ranked Reports
Displays a table with ranked items, using numbers and percentages in metrics. For example, aPages Report ranks the pages onyour site based on traffic, and the detail table shows percentages and numbers for metrics like Page Views and Revenue. Ahorizontal bar chart is the default graph type. Graphs display a color for each metric. Ranked reports can display multiple metricsin a report.
Ranked graphs default to five items, but you can graph up to thirty items in the chart options.
Trended Reports
Lets you examine how conversions and events trend over a selected time granularity (Hour, Day, Week, Month, Quarter, orYear) during a reporting period.
In the graph, the vertical axis displays the tracked items. The horizontal axis displays the time granularity. In the table, you can
trend from a specific cell, and launch a full report from the cell. The date or time used is based the cell's value.You can also select multiple cells and launch a trended report, based on a selected granularity. When you trend from multiplecells, the report columns display data for the entire reporting period.
AProducts Report is an example of a trended report. You can see how much revenue a product made during the selected period.If your reporting period is a week, you can see how much revenue that product generated for each day of the time period, youcan show a trend graph for a specific product on that day, or open a separate trended report for the selection.
Totals Report
An executive-level report that shows bottom-line figures. It contains data for total revenue, page views, and orders. You cansegment the report and add additional metrics to view additional data.
Flow Reports
Flow reports show the most common paths users take across pages, site sections, and servers.
Next Flow
The Next Flow report group has three reports: Next Page Flow, Next Section Flow, and Next Server Flow. The reports in thisgroup show you the most common pages, site sections, and servers that a visitor accessed after accessing the page, site section,or server you specify. These reports show you the most common paths taken through your website.
Previous Flow
Previous Flow reports are similar to Next Flow reports, except rather than seeing where visitors when after a selected peg, yousee where visitors were before visiting a specified page. The controls for using the report are identical to the controls for theNext Flow reports.
Bookend Pattern Report
Lets you analyze what happens before and after a selected page.
234Report Descriptions
8/18/2019 Analytics Reference Adobe
http://slidepdf.com/reader/full/analytics-reference-adobe 235/332
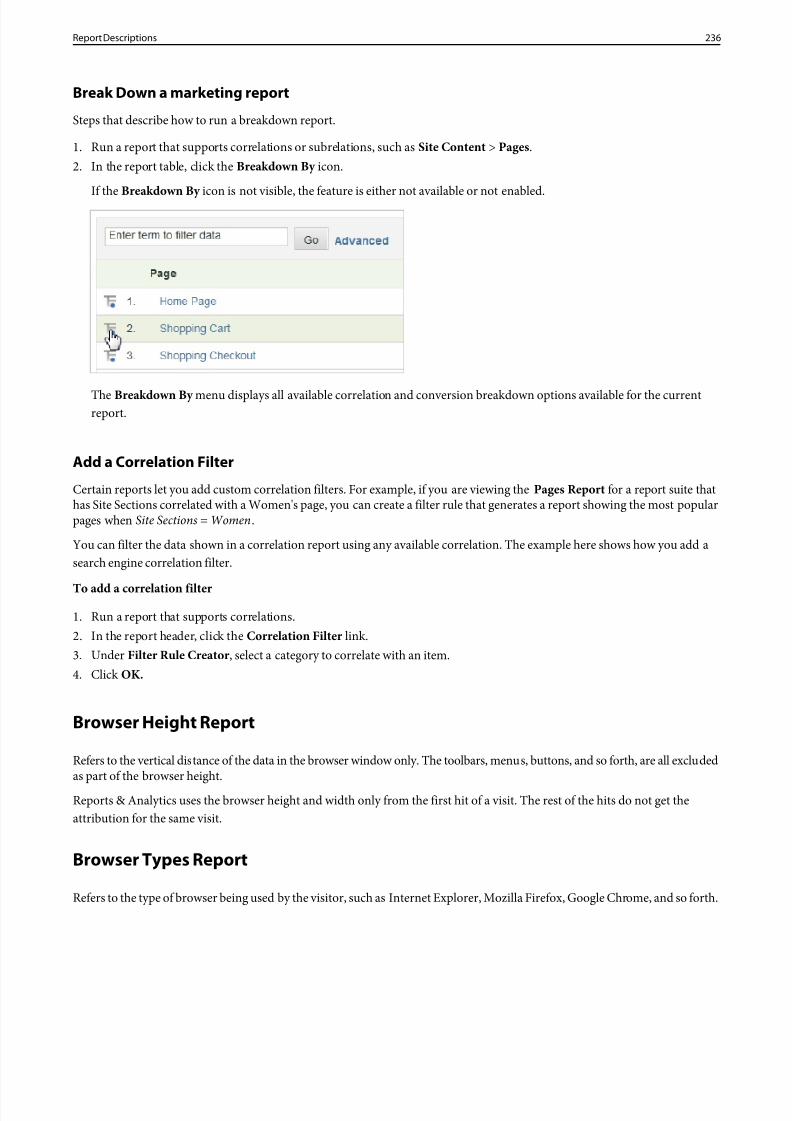
8/18/2019 Analytics Reference Adobe
http://slidepdf.com/reader/full/analytics-reference-adobe 236/332
Break Down a marketing report
Steps that describe how to run a breakdown report.
1. Run a report that supports correlations or subrelations, such as Site Content > Pages.2. In the report table, click the Breakdown By icon.
If the Breakdown By icon is not visible, the feature is either not available or not enabled.
The Breakdown By menu displays all available correlation and conversion breakdown options available for the currentreport.
Add a Correlation Filter
Certain reports let you add custom correlation filters. For example, if you are viewing thePages Report for a report suite thathas Site Sections correlated with a Women's page, you can create a filter rule that generates a report showing the most popularpages when Site Sections = Women.
You can filter the data shown in a correlation report using any available correlation. The example here shows how you add asearch engine correlation filter.
To add a correlation filter
1. Run a report that supports correlations.2. In the report header, click the Correlation Filter link.3. Under Filter Rule Creator , select a category to correlate with an item.4. ClickOK.
Browser Height Report
Refers to the vertical distance of the data in the browser window only. The toolbars, menus, buttons, and so forth, are all excludedas part of the browser height.
Reports & Analytics uses the browser height and width only from the first hit of a visit. The rest of the hits do not get theattribution for the same visit.
Browser Types Report
Refers to the type of browser being used by the visitor, such as Internet Explorer, Mozilla Firefox, Google Chrome, and so forth.
236Report Descriptions
8/18/2019 Analytics Reference Adobe
http://slidepdf.com/reader/full/analytics-reference-adobe 237/332
Browser types that are not yet identified appear as "unspecified".
For example:
Mozilla
Microsoft
Apple
Opera
Unspecified
BlackBerry
UC Web
Other
Nokia
Changes
ChangeDate
Mobile web browsers were added to the Browser Types Report. Before this date, mobile web browsers werenot included on this report.
November 18,2013
Browser URL Length Report
Groups mobile devices based on the maximum supported length, in characters, of a Web browser URL.
Browser WidthMetric that refers to the horizontal distance of the data in the browser window only.
Reports & Analytics uses the browser height and width only from the first hit of a visit. The rest of the hits do not get theattribution for the same visit.
Browsers Report
Lists the browser versions used to visit your site as identified by the user agent string.
For example:
Google Chrome 30.0
Mozilla Firefox 25.0
Google Chrome 31.0
Mozilla Firefox 24.0
Microsoft Internet Explorer 8
237Report Descriptions
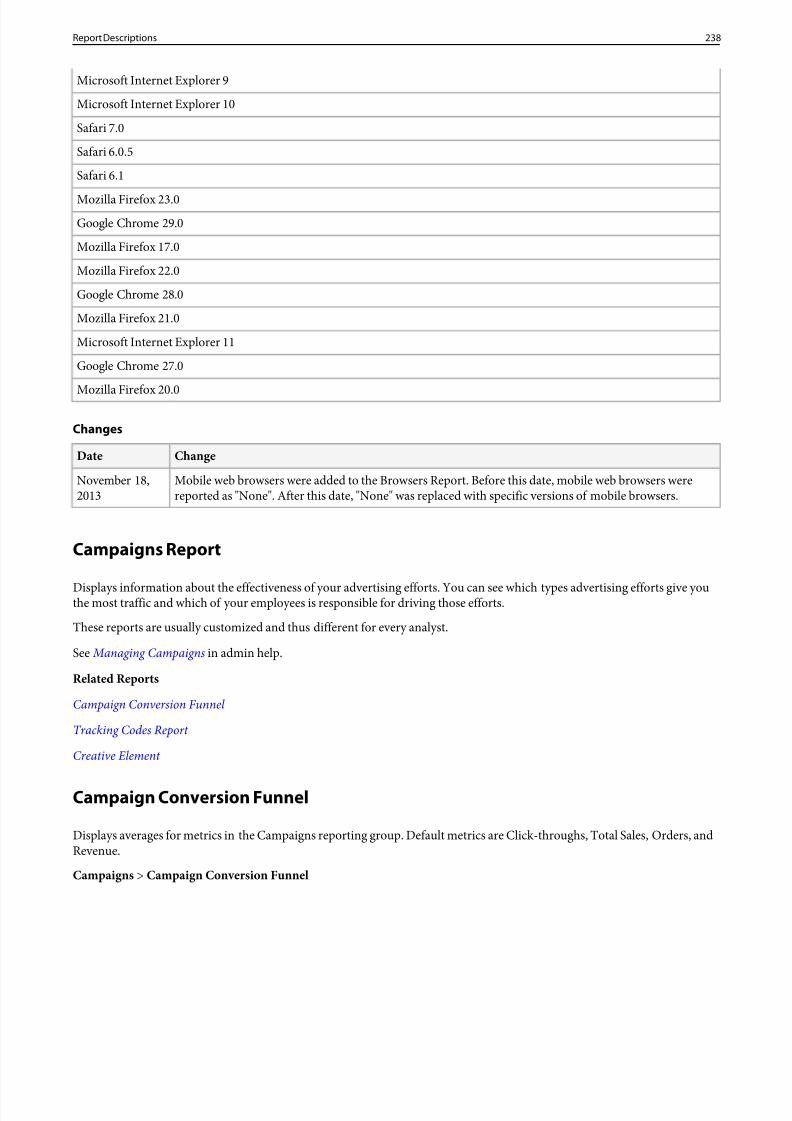
8/18/2019 Analytics Reference Adobe
http://slidepdf.com/reader/full/analytics-reference-adobe 238/332
Microsoft Internet Explorer 9
Microsoft Internet Explorer 10
Safari 7.0
Safari 6.0.5
Safari 6.1
Mozilla Firefox 23.0
Google Chrome 29.0
Mozilla Firefox 17.0
Mozilla Firefox 22.0
Google Chrome 28.0
Mozilla Firefox 21.0
Microsoft Internet Explorer 11
Google Chrome 27.0
Mozilla Firefox 20.0
Changes
ChangeDate
Mobile web browsers were added to the Browsers Report. Before this date, mobile web browsers werereported as "None". After this date, "None" was replaced with specific versions of mobile browsers.
November 18,2013
Campaigns Report
Displays information about the effectiveness of your advertising efforts. You can see which types advertising efforts give youthe most traffic and which of your employees is responsible for driving those efforts.
These reports are usually customized and thus different for every analyst.
See Managing Campaigns in admin help.
Related Reports
Campaign Conversion Funnel
Tracking Codes Report
Creative Element
Campaign Conversion Funnel
Displays averages for metrics in the Campaigns reporting group. Default metrics are Click-throughs, Total Sales, Orders, andRevenue.
Campaigns > Campaign Conversion Funnel
238Report Descriptions
8/18/2019 Analytics Reference Adobe
http://slidepdf.com/reader/full/analytics-reference-adobe 239/332
8/18/2019 Analytics Reference Adobe
http://slidepdf.com/reader/full/analytics-reference-adobe 240/332
Content Types Report
Displays metric data for content types, including video, product, articles, and so on.
Conversion Reports
Provide comprehensive, accurate, and detailed analysis of customer activity. Metrics such as campaign management, sales cycle,customer fallout, and customer conversion let you measure e-commerce transactions, sources of sales, advertising effectiveness,customer loyalty, and more.
For example, if you want to see what type of internal campaigns on your home page might result in purchases, you first mustcapture the internal tracking codes and set persistence to a period of one visit for the s.eVar that captures internal campaigns.When a success event is completed (like purchase), the credit for that success is given to any Conversion Variables that arepersistent on the visitor, such as Internal Campaign ID. By running the Internal Campaign Report , you can see which campaigngenerated the most onsite conversion.
Some out-of-the-box reports contain both Traffic and Conversion metrics (such as the Search Engine reports). However, Traffic
and Conversion reports are unique to your organization and are displayed in the Traffic and Conversion menus.Report Properties
• Custom Conversion reports are based on eVars (conversion variables).• Conversion variables can persist beyond the page view and be associated with metrics within its specified expiration.• The reports' default metrics are revenue. To change default metrics, seeSelecting Default Report Metrics.• View these reports in both trended and ranked formats.• You can use SAINT Classifications in these reports, to rename and consolidate line items.• These reports can be broken down by the following if basic subrelations are enabled:
• Campaigns and Products, with all related classifications• Customer Loyalty • All fully-subrelated eVars
• Additional reports are available to break down when full subrelations are enabled:• Time Spent per Visit• Pages and Site Sections, with all related classifications• Entry Pages• Almost all Traffic Sources reports• Visit Number• Many Visitor Profile and Technology reports• All other eVars• Marketing Channels First and Last Touch
• The following events can be used as metrics:• Instances, the number of times the eVar was defined• All standard eCommerce metrics: Revenue, Orders, Units, Carts, Cart Views, Checkouts, Cart Additions, Cart Removals.• All custom events: Events 1-80, and Events 81-100 if on H22 code or higher• Visits and Visitors: Available depending on organization and report suite. Contact your Account Manager for additional
details
• The location of each Custom Conversion report varies depending on the eVar's numeric assigned value. Generally they canbe found under Conversion >Custom Evars in version 13.5 or theCustom Conversion folder in version 14 and 15 (providedthe menu is not customized).
240Report Descriptions
8/18/2019 Analytics Reference Adobe
http://slidepdf.com/reader/full/analytics-reference-adobe 241/332
Conversion Funnel Reports
Conversion ratios usually measure conversion between the starting, ending, and milestone events or points of a conversionprocess. After you code the success events onto your site, the report creates the ratios between these different success events andshow them in a Conversion Funnel Report .
The following funnel reports available:• Purchase Conversion Funnel : Shows Visits (Report-Specific), Carts, Orders, Units, and Revenue.• Cart Conversion Funnel : Displays Visits (Report-Specific), Carts, Checkouts, Orders, and Revenue.• Custom Event Funnel : Displays custom events on your site. It shows custom events 1-5 by default.• Campaign Conversion Funnel : Shows Click-Throughs, Checkouts, Orders, and Revenue.
This report is also customizable so that you can add Custom Conversion Events to the Conversion Funnel to see if visitors toyour site make it from one step to the next. Success events are good candidates for this type of analysis if they almost alwaysoccur in a specific order. For example, on a retail site, success events generally occur in this order:
1. Product Views
2. Cart Additions
3. Checkouts
4. Purchases
The report table shows statistics for average sales per click-through, and average units sold per click-through. You can addmetrics and custom events from other reporting groups to these reports. These funnels have many similarities but are based ondifferent variables and events. You can use these reports to see what percentages and general trends of users fire specific eventsyou specify. You can see where users are not following through to events, which provides insight to that specific point in theconversion process.
Conversions and Averages Report
Displays revenue based on specified events, and shows drop-out average from event to event.
Cross-Sell Report
Displays the relationship between products in the same product string. For example, if a visitor purchased Item A, what otherproducts were also in the cart at the time of purchase.
Custom Events Report
The conversion actions on your site that you want visitors to complete. These actions might be a registration, a subscription, alead form completion, a chat initiation, a purchase, a booking, or a finished survey.
Because each report suite differs, this set of reports is used differently for each client. A Custom Event report can be used as acounter that shows the number of times an event occurs. For example, ifevent1 is set to count the number of times a documentis downloaded, then the Custom Event report for Event 1 shows the total number of times the event (or download) occurs. Youcan have multiple custom event reports.
241Report Descriptions
8/18/2019 Analytics Reference Adobe
http://slidepdf.com/reader/full/analytics-reference-adobe 242/332
Custom Insight Report
The set of reports that are related to the group of custom traffic variables (prop variables). Each prop report is a separate custominsight report.
Custom Links Report
Displays the links visitors to your site prefer. For example, the home page for your site likely has multiple links that display thesame page. Perhaps there is both a graphic and text link that both link to the same page. This report shows what percentage of visitors used the graphic link versus the text link.
The specific links that you would like to be tracked must be modified with special tags, seeLink Tracking .
You can use the Custom Links Report to:
• Optimize your site design by knowing which types of links your visitors prefer• Validate the need for redundant links to single pages
Mobile SDK Link Names
The mobile SDKs use custom links to track actions and lifecycle metrics. In report suites that are used to measure mobile apps,you might see the following link names set by the SDK:
Sent by the lifecycle call in the 4.x SDKs.ADBINTERNAL:Lifecycle
Sent by the trackAction() method in the 4.x SDKs, where action name is the name setwhen the method was called.
AMACTION:[action name]
Sent by the lifecycle call in the 3.x SDKs.ADMS BP Event
Customer Attributes Report
An Analytics FAQ for customer attributes, and how to run the Customer Attributes report.
Visitor Profile > Customer Attributes
If you capture enterprise customer data in a customer relationship management (CRM) database, you can upload the data intoa customer attribute data source in the Marketing Cloud. After the data is uploaded, you can run the Customer Attributes reportin reports & analytics.
• Customer Attributes and Reporting Metrics in Analytics• FAQ - Customer Attributes in Analytics
SeeCustomer Attributes in Marketing Cloud help for information about uploading customer attribute data.
Customer Attributes and Reporting Metrics in Analytics
After you upload customer attributes and validate the schema (in the Marketing Cloud), the system creates metrics based onthe friendly names (likeage or gender ) that you map to the attribute strings and integers. These metrics appear in Visitor Profile> Customer Attributes reports.
For example:
Visitor Profile > Customer Attributes > Age
242Report Descriptions
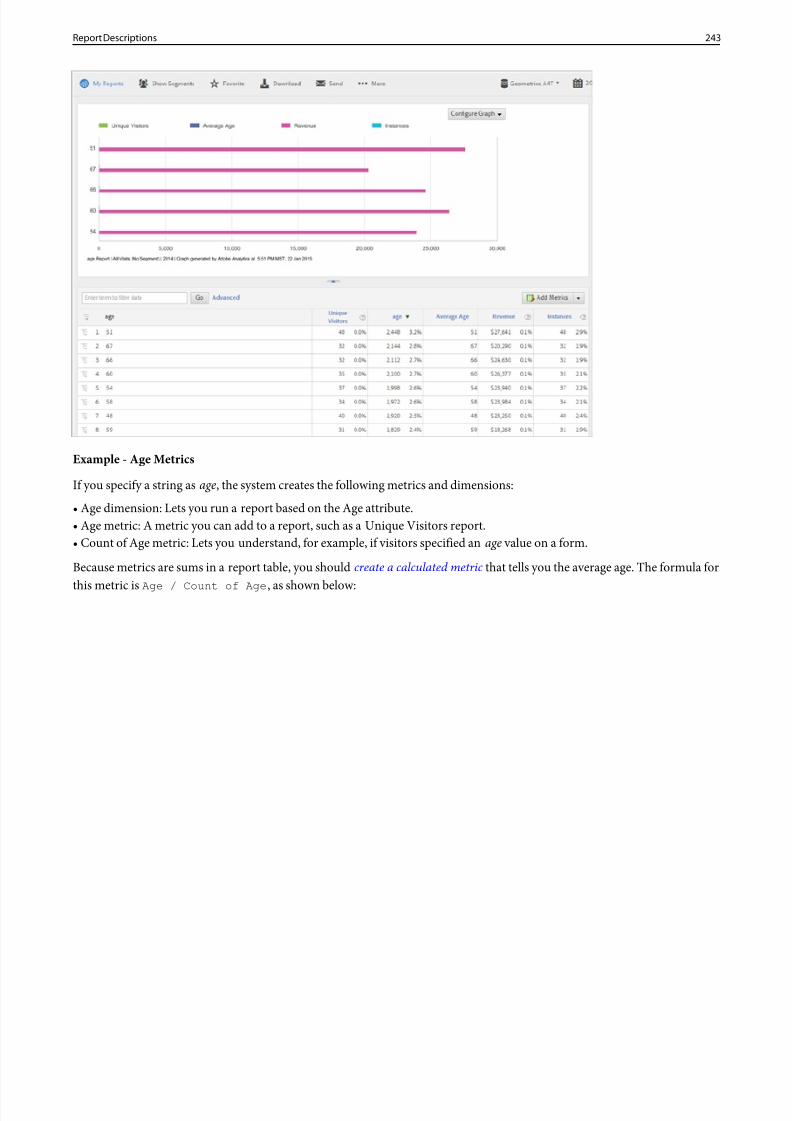
8/18/2019 Analytics Reference Adobe
http://slidepdf.com/reader/full/analytics-reference-adobe 243/332
Example - Age Metrics
If you specify a string asage, the system creates the following metrics and dimensions:
• Age dimension: Lets you run a report based on the Age attribute.• Age metric: A metric you can add to a report, such as a Unique Visitors report.• Count of Age metric: Lets you understand, for example, if visitors specified anage value on a form.
Because metrics are sums in a report table, you shouldcreate a calculated metric that tells you the average age. The formula for
this metric is Age / Count of Age , as shown below:
243Report Descriptions
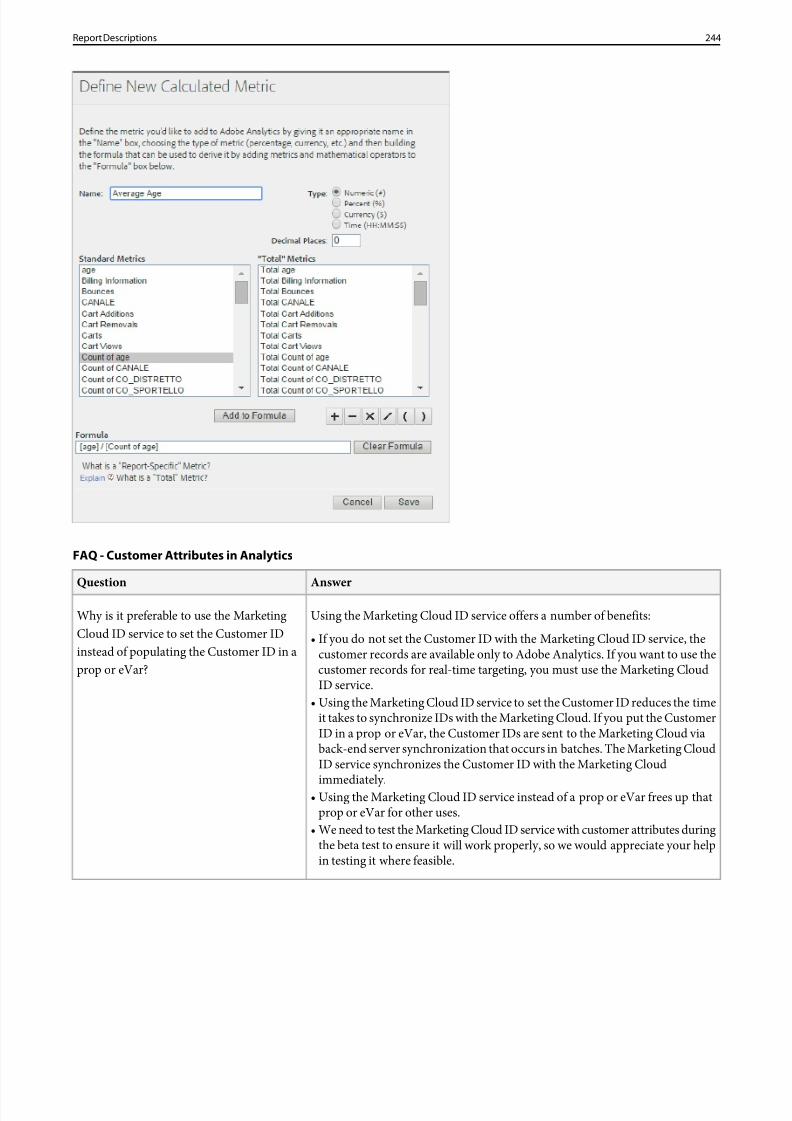
8/18/2019 Analytics Reference Adobe
http://slidepdf.com/reader/full/analytics-reference-adobe 244/332
FAQ - Customer Attributes in Analytics
AnswerQuestion
Using the Marketing Cloud ID service offers a number of benefits:Why is it preferable to use the MarketingCloud ID service to set the Customer ID • If you do not set the Customer ID with the Marketing Cloud ID service, the
customer records are available only to Adobe Analytics. If you want to use theinstead of populating the Customer ID in aprop or eVar? customer records for real-time targeting, you must use the Marketing Cloud
ID service.• Using the Marketing Cloud ID service to set the Customer ID reduces the time
it takes to synchronize IDs with the Marketing Cloud. If you put the CustomerID in a prop or eVar, the Customer IDs are sent to the Marketing Cloud viaback-end server synchronization that occurs in batches. The Marketing CloudID service synchronizes the Customer ID with the Marketing Cloud
immediately.• Using the Marketing Cloud ID service instead of a prop or eVar frees up thatprop or eVar for other uses.
• We need to test the Marketing Cloud ID service with customer attributes duringthe beta test to ensure it will work properly, so we would appreciate your helpin testing it where feasible.
244Report Descriptions
8/18/2019 Analytics Reference Adobe
http://slidepdf.com/reader/full/analytics-reference-adobe 245/332
8/18/2019 Analytics Reference Adobe
http://slidepdf.com/reader/full/analytics-reference-adobe 246/332
The loyalty state changes immediately following the purchase event within the same visit. For example, a New Customer (1purchase) makes a purchase and then registers for a newsletter after that purchase within the same visit. The newsletter registrationevent is considered a Return Customer interaction, because the visitor's customer loyalty state changed immediately after thepurchase occurred.
Custom Report
Administrators can configure a report with specific metrics and a specific date range, and then save it to the report menus foreveryone to use.
Custom reports can bring increased value to you as an analyst. If you see reports in your SiteCatalyst interface that don't matchsomeone else's (such as in Training), your administrator may have set up some of these custom reports.
Additionally, you can save reports that are important to you. These reports are called bookmarks. You can also put severalreports onto one canvas to get a quick look at your most important reports. These are called dashboards and are also user-specific.The interface displays a bar above the graph listing your bookmarks and dashboards.
SeeBookmarks and Dashboards and Reportlets for more information.
Custom Traffic Report
Custom Traffic reports allow each organization to report on additional dimensions that are not implemented by default. CustomTraffic reports can be used in several ways, most commonly to measure traffic and pathing.
Properties of Custom Traffic Reports
• Custom Traffic reports are based solely off of props (traffic variables).• The reports' default metric is page views (or instances in version 15). version 14 page views and version 15 instances are
identical, in that they count the total number of times that variable was defined. Version 15 page views only count the numberof s.t() image requests (excludings.tl() requests).
• Only page views are available as metrics by default in version 14. Visits can be enabled by an Adobe representative if requested.• Pathing can be enabled if it is included in your organization's contract and is requested by a supported user. When pathing is
enabled for a traffic variable, the following metrics are available:• Average Page Depth•
• Average Time Spent• Entries• Exits• Reloads• Single Access• Visits
• You can use participation metrics in traffic reports. This usage must be requested and included in your organization's contract.• If your organization is on version 14, Daily, Weekly, Monthly and Quarterly unique visitors can also be enabled as metrics by
request depending on contract. These are enabled by default if your organization is on Version 15.• These reports can be viewed in both trended and ranked formats.• Search filters can be used to locate specific line items.• Classifications can be used in these reports, allowing you to rename and consolidate line items.• Correlations can be enabled for any of these reports, allowing you to see relationships between other traffic variables.• The location of each Custom Traffic report varies depending on the prop's numeric assigned value. Generally they can be
found under Traffic or Custom Traffic folder).
246Report Descriptions
8/18/2019 Analytics Reference Adobe
http://slidepdf.com/reader/full/analytics-reference-adobe 247/332
Daily Return Visits Report
Report that displays the number of visitors to your website more than once on a given day. A day is defined as the last 24-hourperiod.
Days Before First Purchase ReportDisplays the number of days that pass between the first time customers visit your site and when they finally make a purchase.
For example, if a visitor purchases one day after first visiting, then any visit or event will display on the1 day line item in thereport, for the remainder of the visitor's cookie life.
Days Before Last Purchase Report
Displayd the most common number of days that pass between customers' repeat purchases and allows you to view the timeperiods that contributed most to your site's key success metrics, such as revenue and orders.
Daily Return Visits Report
Report that displays the number of visitors to your website more than once on a given day. A day is defined as the last 24-hourperiod.
Designated Market Area Report
DMA. Segregates the United States into marketing areas. Internet Service Providers (ISPs) in each market area supply theAmerican Registry of Internet Names (ARIN) with the IP addresses they use. Adobe partners with Digital Envoy to receive geo-segmentation data that matches the IP address a website visitor uses with the geographic city, state, zip code, and DMA for thatIP address.
Device Number Transit Report
Groups mobile devices based on whether Device Number Transmit is supported. The report also includes an Unknown groupfor those devices where Device Number Transmit support cannot be determined.
Device Types Report
Groups mobile devices into mobile phones, tablets, ereaders, gaming consoles, televisions, set-top boxes, media players andother high-level categories to let you see the distribution between mobile device types.
This dimension is also useful to define segments for phone and tablet users by segmenting where Mobile Device Type equals"device type".
Dynamic Device Data
This report uses dynamic device data that is continually being updated as new devices are released and identified. For example,a new tablet that is released during the current month might be misidentified since it doesn't yet exist in the device database.
247Report Descriptions
8/18/2019 Analytics Reference Adobe
http://slidepdf.com/reader/full/analytics-reference-adobe 248/332
When the device database is updated with the new device, any changes as a result are applied to all reporting dates. Therefore,you might see slight variations on this report for historical dates over time. As a general rule, the most current report will havethe most accurate data for any reporting period.
Devices Report
Displays a detailed list of the mobile devices used to access your site.Non-mobile traffic is listed on this report so you can quickly compare the percentage of traffic from mobile and non-mobiledevices.
You can use this dimension to create segments for mobile and non-mobile traffic by including hits where Mobile Device exists(all mobile traffic) or does not exist (all non-mobile traffic).
Dynamic Device Data
This report uses dynamic device data that is continually being updated as new devices are released and identified. For example,a new tablet that is released during the current month might be misidentified since it doesn't yet exist in the device database.When the device database is updated with the new device, any changes as a result are applied to all reporting dates. Therefore,you might see slight variations on this report for historical dates over time. As a general rule, the most current report will havethe most accurate data for any reporting period.
DRM Report
Groups mobile devices based on the type of Digital Rights Management (DRM) they support. DRM groups includeForward Lock, Combined Delivery , Separate Delivery , and Unknown.
Entries and Exits Reports
The Entry Page report shows you, by percentage and by total visits, which pages on your site are the first ones seen by new visits.
You can view:
• Entry Pages (or sections): Displays, by percentage and by total visits, which pages on your site are the first pages seen by a new visit. You can use this report to identify which of your web pages are the most frequent points of entry, optimize the primary entry points on your site, and drive entry traffic to your key messages.
A useful way to use the Page View metric is to run aPaths > Pages > Pages Entry report, sort by it, and see which entry pagesdrive the most page views.
• Original Entry Pages : Shows the first page viewed for first-time visitors to your site. Each user is counted only once unlessthey delete their cookies or are not being tracked with cookies.
• Single Page Visits : Shows pages that are most often both the entry and exit pages for visitor browsing sessions.• Exit Pages: Displays, by percentage and by total visits, the pages on your site that were the last pages visitors viewed before
leaving your site. Exit pages have a visit breakdown scope, meaning they persist across all hits for a visit.Metrics on an Entry Pages Report
• Entries : same as instances or occurrences, how many times the specified page is the entry page for a visit.• Visits : how many visits was this page the entry page, this metric should equal entries.• Exits: Number of times an Exit occurred where the Entry page was the one specified. If you want to see the number of times
the entry page was also the exit page, use the Bounces metric instead of exits.
Segmentation in an Entry Pages Report
248Report Descriptions
8/18/2019 Analytics Reference Adobe
http://slidepdf.com/reader/full/analytics-reference-adobe 249/332
Running an Entry Pages Report only reports on entry pages, even if you apply segment to a non-entry page.
For example, assume a visit sequence is as follows:
Page A > Page B > Page C
If Page B and Page C are used in a segment, only Page A is reported in anEntry Pages Report , because Page A is the entry page.
Exit Links Report
Shows the most common links people are clicking on that lead to places outside your site. These links typically point to partneror affiliate sites. However, they can be any location where you have implemented an external link. You can use this report to view the most popular affiliate links, or to assist in validating the number of referrals that your partners' state you provide.
There are several requirements that must be met in order for this page to populate correctly:
• If using manual custom link tracking, an s.tl() request must be fired with the middle parameter set to e.• If using automatic custom link tracking, all requirements must be met:• s.trackExternalLinks must be set to true .•
• The link the user clicked on must not match any values within the s.linkInternalFilters variable.
• If s.linkInternalFilters is implemented, the external link must match at least one of the values set in this variable.• If any of the above requirements are not met, the hit will not populate this report.
•
• As with all custom link tracking hits, thes.pageName variable is stripped from the image request to prevent page-view inflation.• You can view this report in trended and ranked formats.• This report can use a search filter to locate specific line items.• You can create correlations with any other traffic variable via Admin Tools.• Instances are the only metrics available by default within this report, counting the number of times the exit link fired.• Daily, weekly, monthly and quarterly visitors can be enabled for this report. However, only an Adobe representative can enable
these, at an additional cost. Enabling unique visitors for any custom link tracking variables greatly increases latency for thereport suite.
File Downloads Report
The File Downloads Report helps you understand how often your visitors download files from your site. Examples of filedownloads may be word processor documents, spreadsheets, audio files, movie files, user manuals, and so on. This includesboth files being saved and opened directly from the browser, as well as files saved to the user's computer. The report shows thename of the file being downloaded, including the complete URL required to access the file.
Navigation
Site Content > Links > File Downloads
If this report is not available in the default location, please check with your administrators, who may have changed the defaultmenu structure to better serve your organization's unique needs.
Use this report to:
• Determine the files that are downloaded most frequently from your site.• Understand if certain files are downloaded more often during specific time periods.• Validate that all formats for a given document are required.
249Report Descriptions
8/18/2019 Analytics Reference Adobe
http://slidepdf.com/reader/full/analytics-reference-adobe 250/332
For example, perhaps you are currently translating your user manuals into twelve languages and making them available viayour Web site. With file download reporting, you can know how often each user manual version is downloaded and can assessthe value of continuing to translate the user manual into all twelve languages.
Troubleshooting
Marketing reports capture information on files downloaded from any page of your site that contains JavaScript code. However,certain variables must be present and set correctly so that file download information can be reported. If this report is notdisplaying data, or does not show the expected values, follow the steps below to validate your implementation.
1. On your site, locate the global JavaScript file. This is frequently nameds_code.js , but may have been renamed. If it hasbeen renamed, you can search the JavaScript files on your site for the values_account , which is a part of the JavaScript code.
2. In the file, locate thes.trackDownloadLinks variable. Ensure that it is set totrue3. Locate the s.linkDownloadFileTypes variable. Ensure that all of the desired file extensions are present in this list. If necessary,
add missing extensions like .zip , .pdf , and so on.)
If these variables appear to be configured correctly, but theFile Downloads Report still is not receiving data, your organization'ssupported users should contact Customer Care.
Finding Methods Report
Reports that receive credit for conversion success events. For example, if a search engine refers a visitor to your site who makesa purchase, Finding Methods specify how the search engine receives credit for the referral.
SeeFinding Methods for configuration information.
Flow Reports
Flow reports show the most common paths users take across pages, site sections, and servers.
Next Flow
The Next Flow report group has three reports: Next Page Flow, Next Section Flow, and Next Server Flow. The reports in thisgroup show you the most common pages, site sections, and servers that a visitor accessed after accessing the page, site section,or server you specify. These reports show you the most common paths taken through your website.
Previous Flow
Previous Flow reports are similar to Next Flow reports, except rather than seeing where visitors when after a selected peg, yousee where visitors were before visiting a specified page. The controls for using the report are identical to the controls for theNext Flow reports.
Full Paths Report
Displays the entire visit path through a web site that visitors most commonly take.
GeoSegmentation Reports
Displays data about visitor location. GeoSegmentation reports include Countries, Regions, Cities, U.S. States, and U.S. DMA(digital marketing area).
250Report Descriptions
8/18/2019 Analytics Reference Adobe
http://slidepdf.com/reader/full/analytics-reference-adobe 251/332
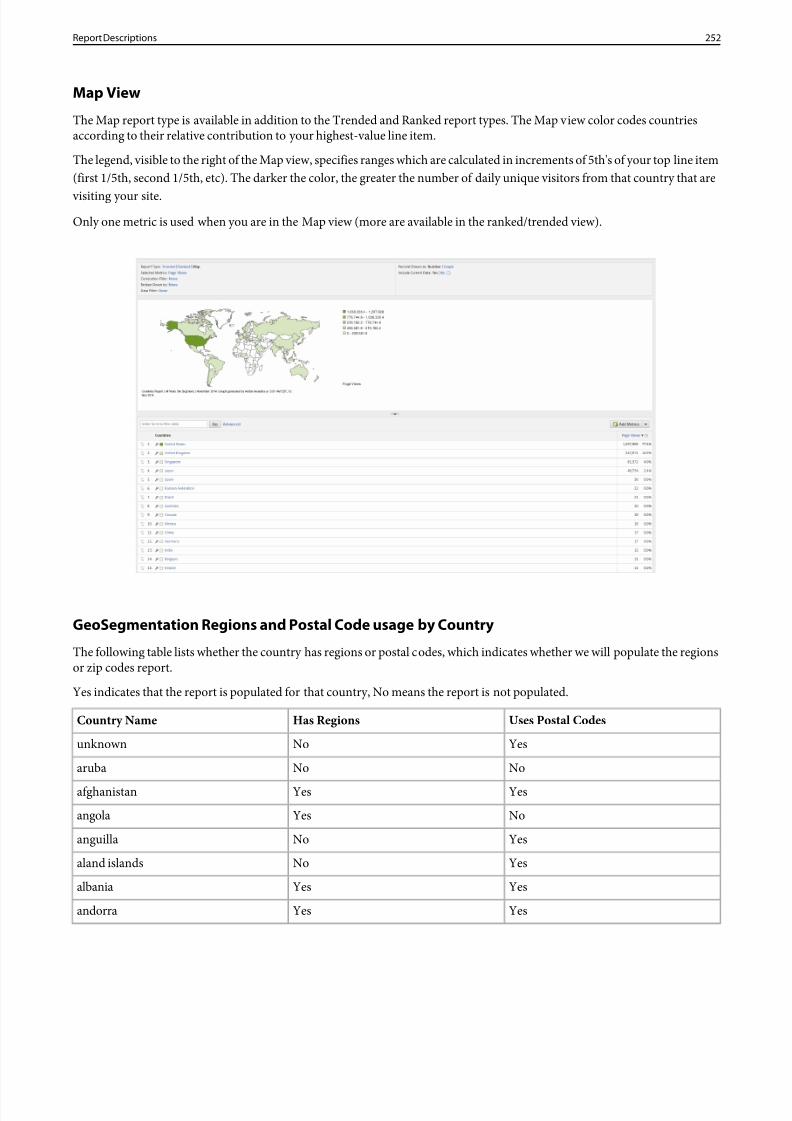
8/18/2019 Analytics Reference Adobe
http://slidepdf.com/reader/full/analytics-reference-adobe 252/332
Map View
The Map report type is available in addition to the Trended and Ranked report types. The Map view color codes countriesaccording to their relative contribution to your highest-value line item.
The legend, visible to the right of the Map view, specifies ranges which are calculated in increments of 5th's of your top line item(first 1/5th, second 1/5th, etc). The darker the color, the greater the number of daily unique visitors from that country that are
visiting your site.Only one metric is used when you are in the Map view (more are available in the ranked/trended view).
GeoSegmentation Regions and Postal Code usage by Country
The following table lists whether the country has regions or postal codes, which indicates whether we will populate the regionsor zip codes report.
Yes indicates that the report is populated for that country, No means the report is not populated.
Uses Postal CodesHas RegionsCountry Name
YesNounknown
NoNoaruba
YesYesafghanistan
NoYesangola
YesNoanguilla
YesNoaland islands
YesYesalbania
YesYesandorra
252Report Descriptions
8/18/2019 Analytics Reference Adobe
http://slidepdf.com/reader/full/analytics-reference-adobe 253/332
NoNonetherlands antilles
NoYesunited arab emirates
YesYesargentina
YesYesarmenia
YesNoasia (unknown country)
YesNoamerican samoa
YesNoantarctica
YesNofrench southern territories
NoYesantigua and barbuda
YesYesaustralia
YesYesaustria
YesYesazerbaijan
NoYesburundi
YesYesbelgiumNoYesbenin
YesYesbonaire/sint eustatius/saba
NoYesburkina faso
YesYesbangladesh
YesYesbulgaria
NoYesbahrain
NoYesbahamas
YesYesbosnia and herzegowina
YesNosaint barthelemy
YesYesbelarus
NoYesbelize
YesNobermuda
NoYesbolivia
YesYesbrazil
YesYesbarbados
YesYesbrunei darussalam
NoYesbhutan
YesNobouvet island
NoYesbotswana
NoYescentral african republic
YesYescanada
253Report Descriptions
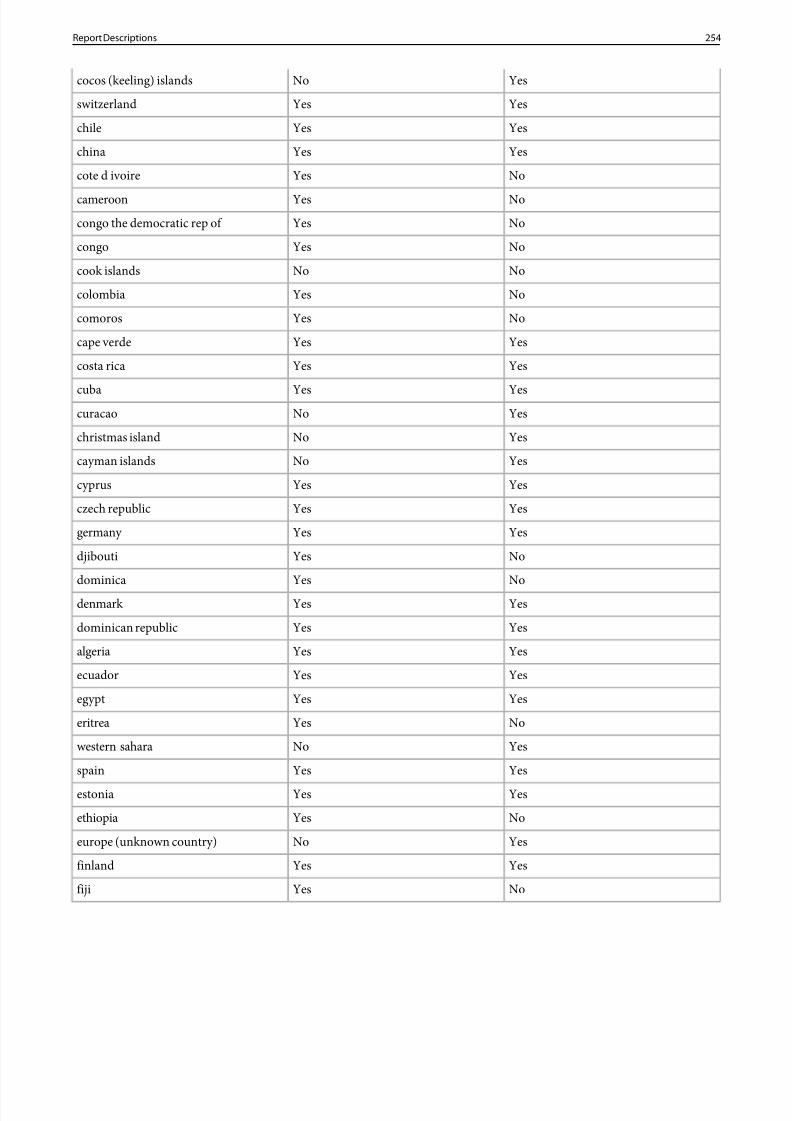
8/18/2019 Analytics Reference Adobe
http://slidepdf.com/reader/full/analytics-reference-adobe 254/332
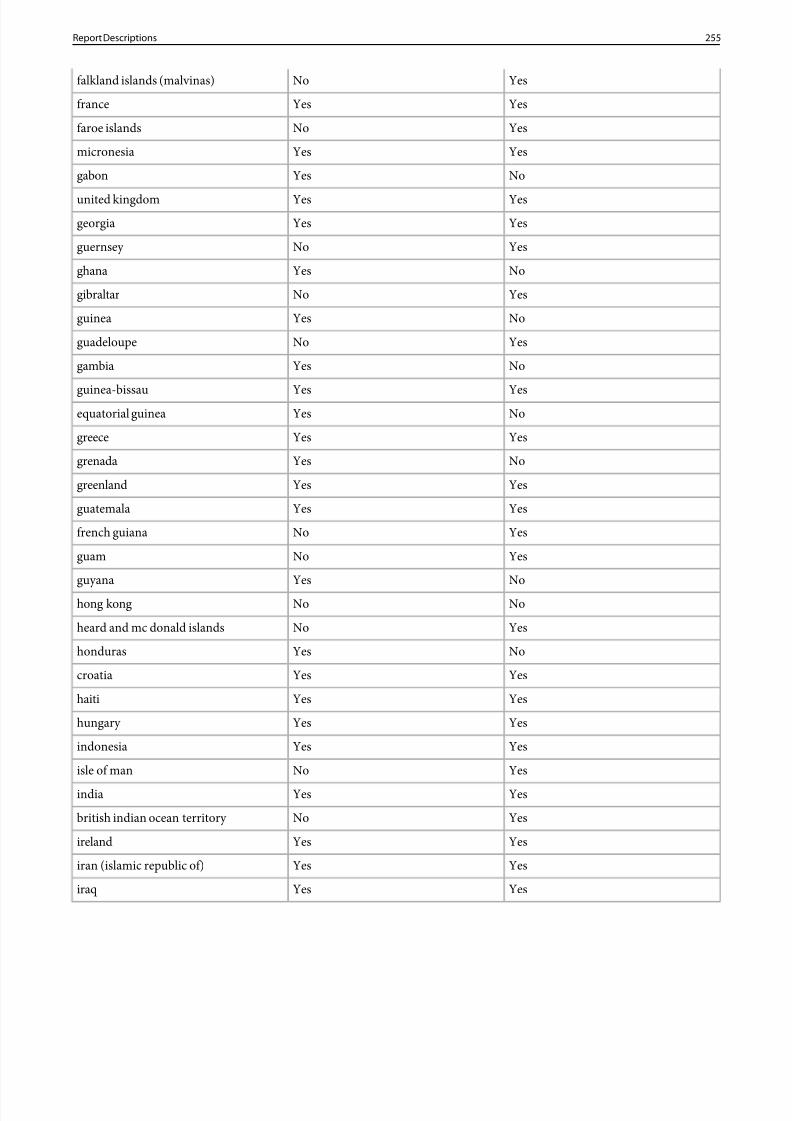
8/18/2019 Analytics Reference Adobe
http://slidepdf.com/reader/full/analytics-reference-adobe 255/332
YesNofalkland islands (malvinas)
YesYesfrance
YesNofaroe islands
YesYesmicronesia
NoYesgabon
YesYesunited kingdom
YesYesgeorgia
YesNoguernsey
NoYesghana
YesNogibraltar
NoYesguinea
YesNoguadeloupe
NoYesgambia
YesYesguinea-bissauNoYesequatorial guinea
YesYesgreece
NoYesgrenada
YesYesgreenland
YesYesguatemala
YesNofrench guiana
YesNoguam
NoYesguyana
NoNohong kong
YesNoheard and mc donald islands
NoYeshonduras
YesYescroatia
YesYeshaiti
YesYeshungary
YesYesindonesia
YesNoisle of man
YesYesindia
YesNobritish indian ocean territory
YesYesireland
YesYesiran (islamic republic of)
YesYesiraq
255Report Descriptions
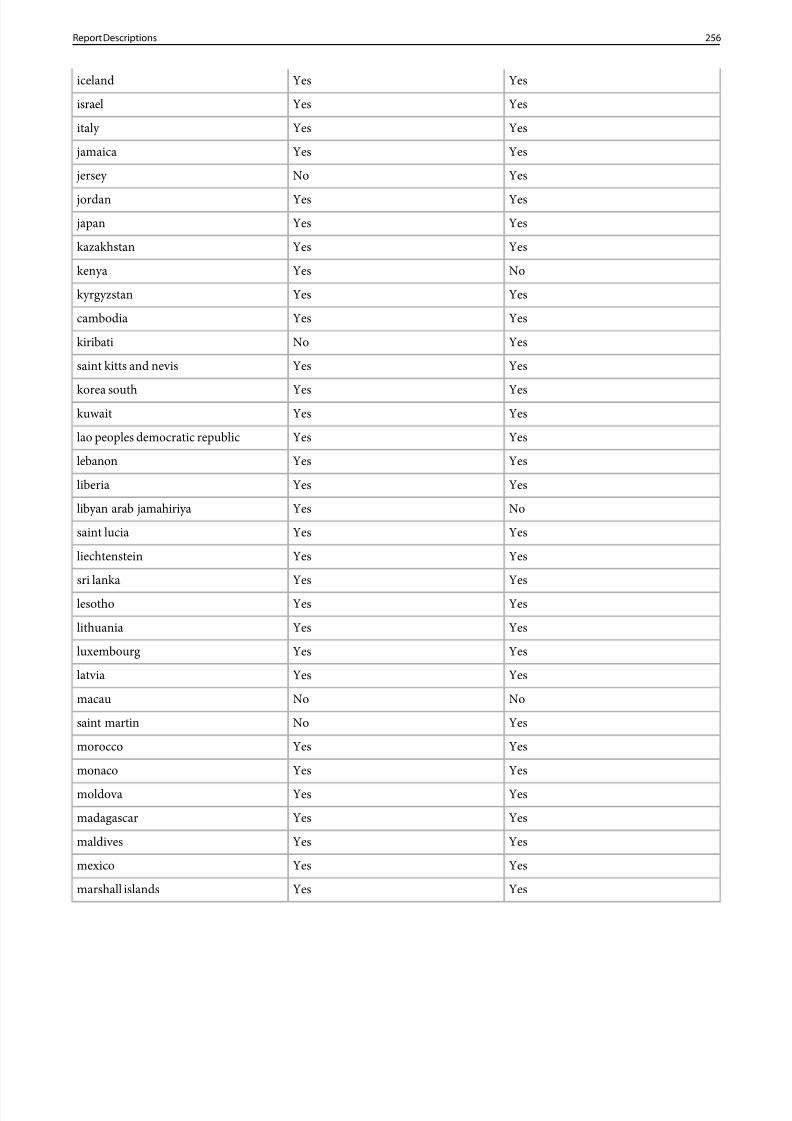
8/18/2019 Analytics Reference Adobe
http://slidepdf.com/reader/full/analytics-reference-adobe 256/332
YesYesiceland
YesYesisrael
YesYesitaly
YesYes jamaica
YesNo jersey
YesYes jordan
YesYes japan
YesYeskazakhstan
NoYeskenya
YesYeskyrgyzstan
YesYescambodia
YesNokiribati
YesYessaint kitts and nevis
YesYeskorea southYesYeskuwait
YesYeslao peoples democratic republic
YesYeslebanon
YesYesliberia
NoYeslibyan arab jamahiriya
YesYessaint lucia
YesYesliechtenstein
YesYessri lanka
YesYeslesotho
YesYeslithuania
YesYesluxembourg
YesYeslatvia
NoNomacau
YesNosaint martin
YesYesmorocco
YesYesmonaco
YesYesmoldova
YesYesmadagascar
YesYesmaldives
YesYesmexico
YesYesmarshall islands
256Report Descriptions
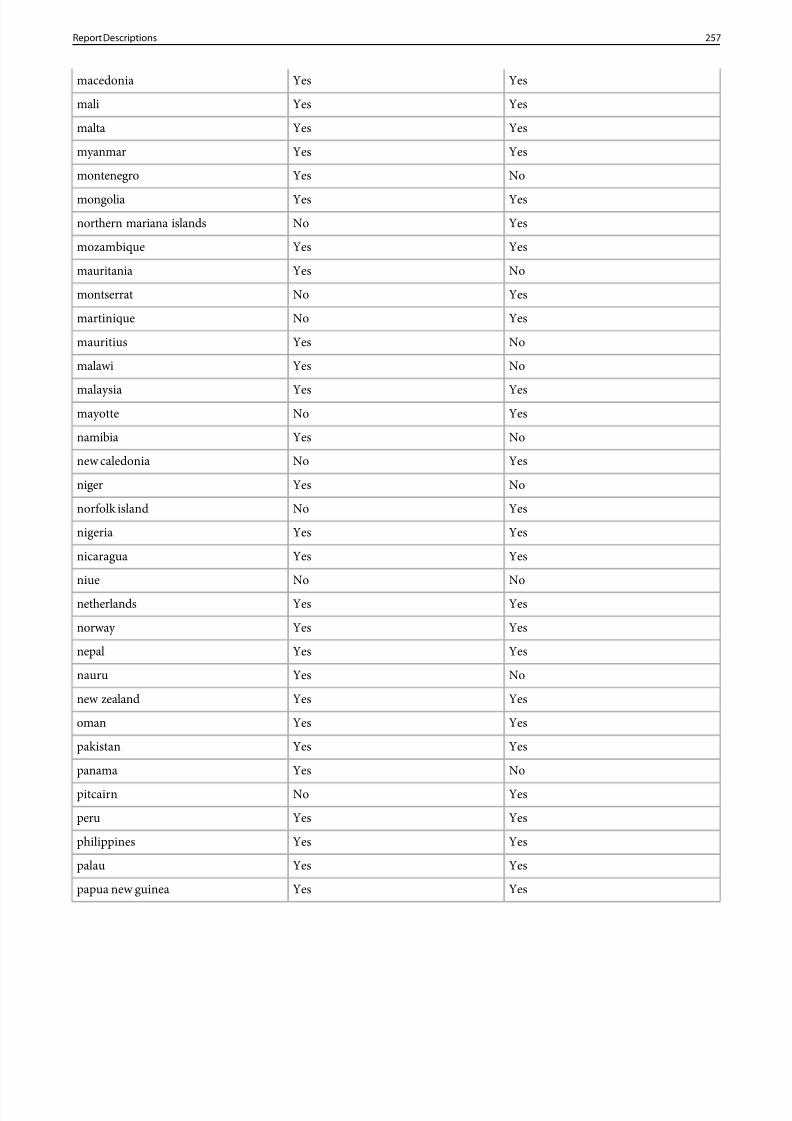
8/18/2019 Analytics Reference Adobe
http://slidepdf.com/reader/full/analytics-reference-adobe 257/332
YesYesmacedonia
YesYesmali
YesYesmalta
YesYesmyanmar
NoYesmontenegro
YesYesmongolia
YesNonorthern mariana islands
YesYesmozambique
NoYesmauritania
YesNomontserrat
YesNomartinique
NoYesmauritius
NoYesmalawi
YesYesmalaysiaYesNomayotte
NoYesnamibia
YesNonew caledonia
NoYesniger
YesNonorfolk island
YesYesnigeria
YesYesnicaragua
NoNoniue
YesYesnetherlands
YesYesnorway
YesYesnepal
NoYesnauru
YesYesnew zealand
YesYesoman
YesYespakistan
NoYespanama
YesNopitcairn
YesYesperu
YesYesphilippines
YesYespalau
YesYespapua new guinea
257Report Descriptions
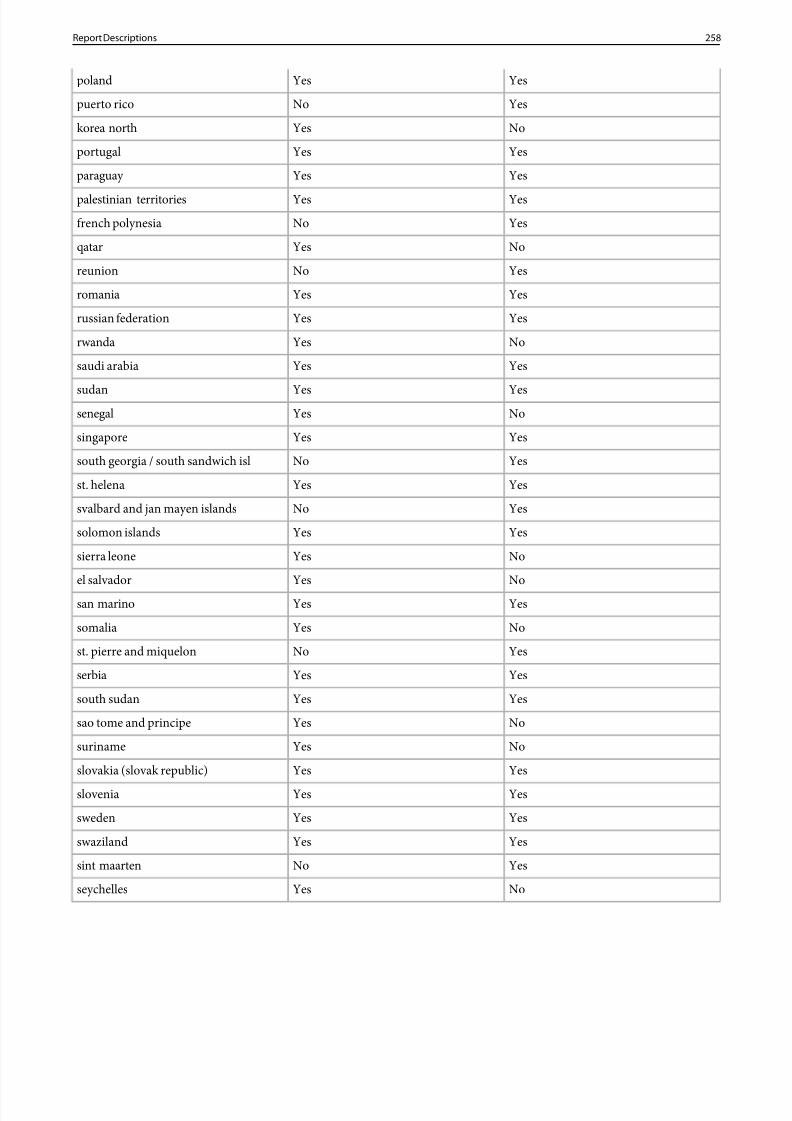
8/18/2019 Analytics Reference Adobe
http://slidepdf.com/reader/full/analytics-reference-adobe 258/332
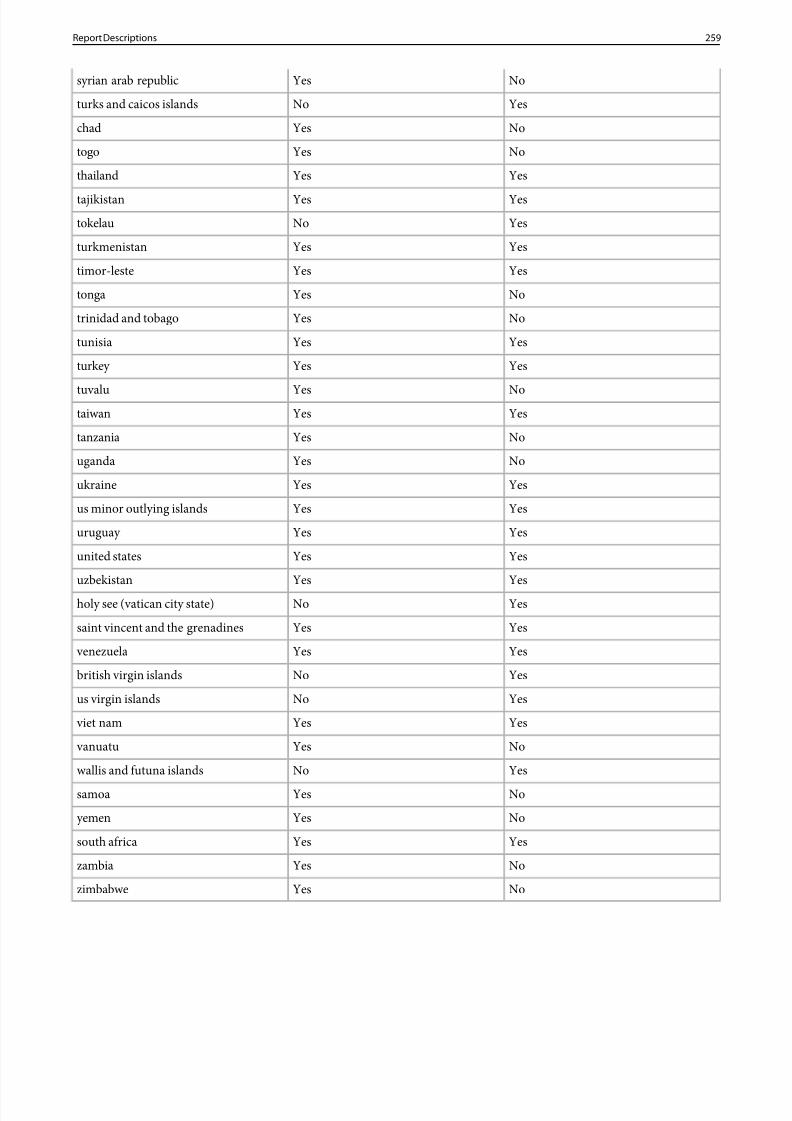
8/18/2019 Analytics Reference Adobe
http://slidepdf.com/reader/full/analytics-reference-adobe 259/332
NoYessyrian arab republic
YesNoturks and caicos islands
NoYeschad
NoYestogo
YesYesthailand
YesYestajikistan
YesNotokelau
YesYesturkmenistan
YesYestimor-leste
NoYestonga
NoYestrinidad and tobago
YesYestunisia
YesYesturkey
NoYestuvaluYesYestaiwan
NoYestanzania
NoYesuganda
YesYesukraine
YesYesus minor outlying islands
YesYesuruguay
YesYesunited states
YesYesuzbekistan
YesNoholy see (vatican city state)
YesYessaint vincent and the grenadines
YesYes venezuela
YesNobritish virgin islands
YesNous virgin islands
YesYes viet nam
NoYes vanuatu
YesNowallis and futuna islands
NoYessamoa
NoYesyemen
YesYessouth africa
NoYeszambia
NoYeszimbabwe
259Report Descriptions
8/18/2019 Analytics Reference Adobe
http://slidepdf.com/reader/full/analytics-reference-adobe 260/332
Hierarchy Report
Displays the hierarchical layout of the pages on your website and displays those pages in order based on how they are configuredin the hierN variable. This report is populated using proper variable configuration that you set for each page that you want totake part in the hierarchy. This report lets you see selected metrics (such as Unique Visitors) for the hierarchy.
By specifying the hierarchy depth (the default is 10 levels), you can view the overall hierarchy, as well as the position and datafor specific pages in the selected hierarchy. You can specify names for your hierarchies and, depending on the service level youhave purchased, view hierarchies according to Page Views, Visits, or Visitors.
Image Support Report
Groups mobile devices based on the types of images they support. For example, if a visitor's phone that supports.jpg images,accesses a site, the Image Support report is incremented by at least one. If the phone supports more than one image format, thena visit to a site might result in multiple increments for that visit. In other words, if your phone supports .jpg , .png , and .gifformats, then each of those groups in the report is incremented. As such, the sum of the groups might be greater than the totalshown at the bottom of the report.
Information Services Report
Groups mobile devices based on the news services (Channel I/B, EZ News Flash, W+INFO, and so on.) that they support. Whena visitor uses a mobile device with news service support to access your site, the Information Services report increments by atleast one. If the phone supports multiple news services, each of those groups in the report increments. Because of this, the sumof the groups might be greater than the total shown at the bottom of the report.
JavaScript Report
Shows metrics based on whether the device has JavaScript enabled, disabled, or whether it is counted as "unidentified".
Note: Mobile devices are always listed as disabled/unidentified, even if they support JavaScript.
Java Version Report
Groups mobile devices based on the Java version that they support. The Java Version report identifies the Java version by theJava Specification Request (JSR) supported by the device. The report also includes an Unknown group for unidentified mobileoperating systems.
You can find out more about a given JSR at the Java Community Process website.
Key Metrics Report
The Key Metrics Report lets you compare metrics to see whether they trend together. For example, as your page views increase,does your visitor count increase?
260Report Descriptions
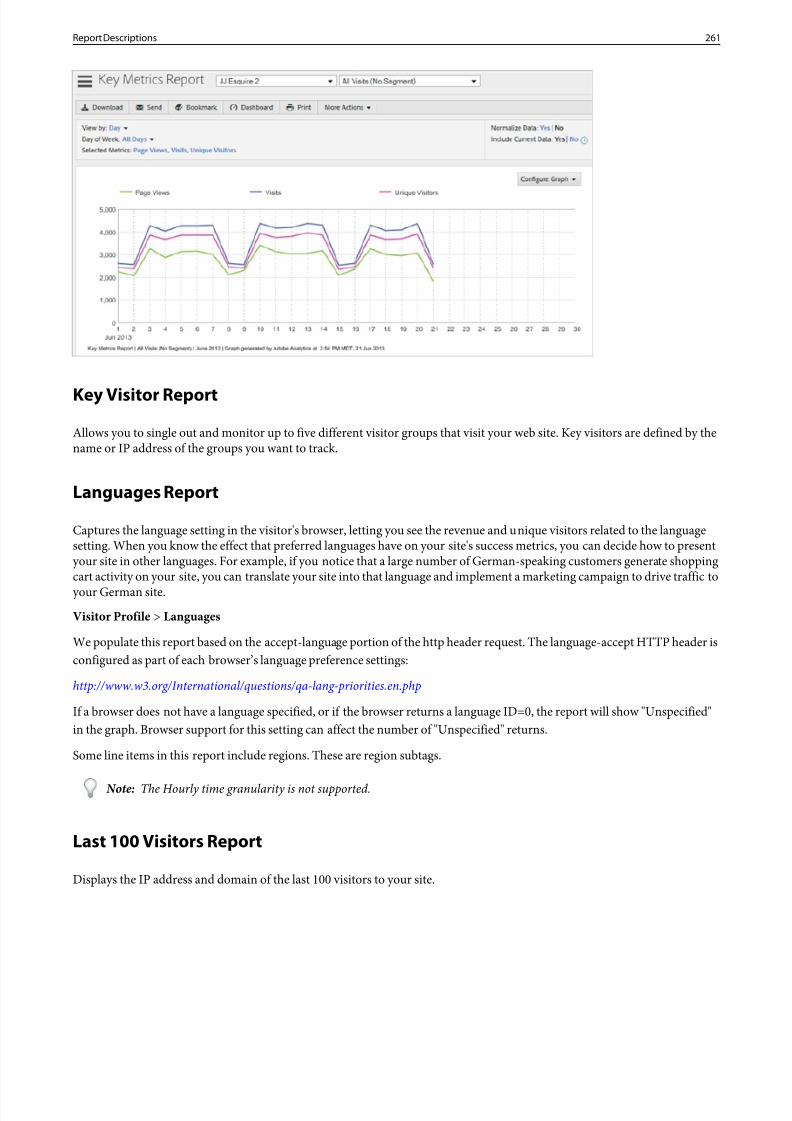
8/18/2019 Analytics Reference Adobe
http://slidepdf.com/reader/full/analytics-reference-adobe 261/332
Key Visitor Report
Allows you to single out and monitor up to five different visitor groups that visit your web site. Key visitors are defined by thename or IP address of the groups you want to track.
Languages Report
Captures the language setting in the visitor's browser, letting you see the revenue and unique visitors related to the languagesetting. When you know the effect that preferred languages have on your site's success metrics, you can decide how to presentyour site in other languages. For example, if you notice that a large number of German-speaking customers generate shoppingcart activity on your site, you can translate your site into that language and implement a marketing campaign to drive traffic toyour German site.
Visitor Profile > Languages
We populate this report based on the accept-language portion of the http header request. The language-accept HTTP header isconfigured as part of each browser’s language preference settings:
http://www.w3.org/International/questions/qa-lang-priorities.en.php
If a browser does not have a language specified, or if the browser returns a language ID=0, the report will show "Unspecified"in the graph. Browser support for this setting can affect the number of "Unspecified" returns.
Some line items in this report include regions. These are region subtags.
Note: The Hourly time granularity is not supported.
Last 100 Visitors Report
Displays the IP address and domain of the last 100 visitors to your site.
261Report Descriptions
8/18/2019 Analytics Reference Adobe
http://slidepdf.com/reader/full/analytics-reference-adobe 262/332
8/18/2019 Analytics Reference Adobe
http://slidepdf.com/reader/full/analytics-reference-adobe 263/332
• A small trend line can be seen at the end of the last column. This trend line can cycle between active metrics.• In addition to various channels collected by standard methods, you can use offline data sources.• SAINT Classifications can be used, allowing you to rename and consolidate line items.• The following metrics can be used in this report (depending on organization and report suite settings):
• Click-throughs : the number of times the s.campaign variable is defined.• New Engagements: the number of visitors who have received a new First Touch Channel.• All standard eCommerce metrics: Revenue, Orders, Units, Carts, Cart Views, Checkouts, Cart Additions, Cart Removals.• All custom events: Events 1-80, and Events 81-100 if on H22 code or higher.• Visits and Visitors : requires Commerce Visits and Visitors, which is dependent on organization and report suite. Contact
your Account Manager for additional details.• Budget and Cost : metrics specific to Marketing Channels. SeeCosts and Budgets.
Product-Specific Properties
Version 13.5
Not available.
Version 14 and 15
This report can be accessed by going toMarketing Channels >Channel Overview Report (provided the menu is not customized).
Segmentation is not available in this report. Use the First- or Last-Touch Channel or First- or Last-Touch Details reportsinstead.
Ad Hoc Analysis
Though the Marketing Channel Overview Report is not available, Marketing Channel reports can be accessed with metricsusing different allocation. This allows you to effectively recreate a very similar report.
This report can leverage multiple advanced segments.
Marketing Channel Detail - First and Last Touch
These reports provide insight on the specific campaigns or keywords are most effective on your site. You can use this report toallocate success metrics and revenue to various channel details, without regard to the overall channel they are in. For example,you can see how a certain Paid Search Keyword is comparing against a certain email campaign. As opposed to theMarketing Channel Overview Report , this report resembles a standard marketing report.
Report Properties
• This report runs on rules defined in marketing channels. See Channels and Rules.
Specifically, the report uses theSet the channel's value to part of each rule. Changing these rules or the how the channel's value is set changes how data in this report is calculated. See the Marketing Channel processing rulesFAQfor more information.
• Differences betweenFirst and Last Touch can be located in About Marketing Channel Reports .• The order of processing rules is crucial to how Marketing Channels work. Each hit checks criteria at the top of your processing
rules first, then filters down from there.• This report can be viewed in trended and ranked formats.• This report can use a search filter to locate specific line items.• In addition to various channels collected by standard methods, offline data sources can be used.• You can use SAINT Classifications in this report, allowing you to rename and consolidate line items. Details specific to
Marketing Channels can be found here.• This report can be broken down by all other Marketing Channel reports.
263Report Descriptions
8/18/2019 Analytics Reference Adobe
http://slidepdf.com/reader/full/analytics-reference-adobe 264/332
• You can enable additional breakdowns for this report using custom subrelations. For additional information, please have oneof your organization's supported users contact Customer Care to request specific variables be enabled.
• The following metrics can be used in this report (depending on organization and report suite settings):• Click-throughs: the number of times the s.campaign variable is defined.•
• New Engagements: the number of visitors who have received a new First Touch Channel.• All standard eCommerce metrics: Revenue, Orders, Units, Carts, Cart Views, Checkouts, Cart Additions, Cart Removals.• All custom events: Events 1-80, and Events 81-100 if on H22 code or higher.
• Visits and Visitors: availability is dependent on organization and report suite. Contact your Account Manager for additionaldetails.
See Metrics in Marketing Channel Help.
Note: Marketing Channel reporting is not available in version 13.5.
Mobile Reports
Displays information about web sites access from a mobile device. Mobile reports improve visitor identification by collectingdata about mobile devices used to view your site. Mobile reports can identify a device's manufacturer and capabilities, such asscreen sizes, video, audio, and cookie support, and other metrics. Mobile reports are available for all report suites.
Note: The Mobile Reports display mobile web traffic only. Mobile app data collected using the native iOS, Android, and other SDKs appear in the Mobile App Reports, and are displayed only when enabled in Admin Tools.
The following mobile reports are available:
DescriptionReport
Displays the number of visitors that accessed your site using mobile devices, such as devices runningthe iOS or Android. This report can help you understand the impact of mobile initiatives so you canplan accordingly. You can use this report to:
Devices
• Develop strategies that address mobile users
• Identify your audience's preferences
• Track the emergence of wireless and mobile users
Groups mobile device hits to your site by mobile device manufacturer. The report displays the typeof manufacturer, number of views for each manufacturer, and the corresponding percentages.
Manufacturer
Groups mobile device hits to your site by the screen size of the device. The report shows each screensize, the number of visitors to your site that used each screen size, and each screen size as a percentage
Screen Size
of the total views. The Screen Size report shows both the height and width of the screen size as
compared to the Screen Height report and Screen Width report.The mobile screen size report is currently static per device. Regardless of screen orientation, eachdevice has a fixed screen resolution in the report. You can see this by breaking down Screen Size by Mobile Device.
264Report Descriptions
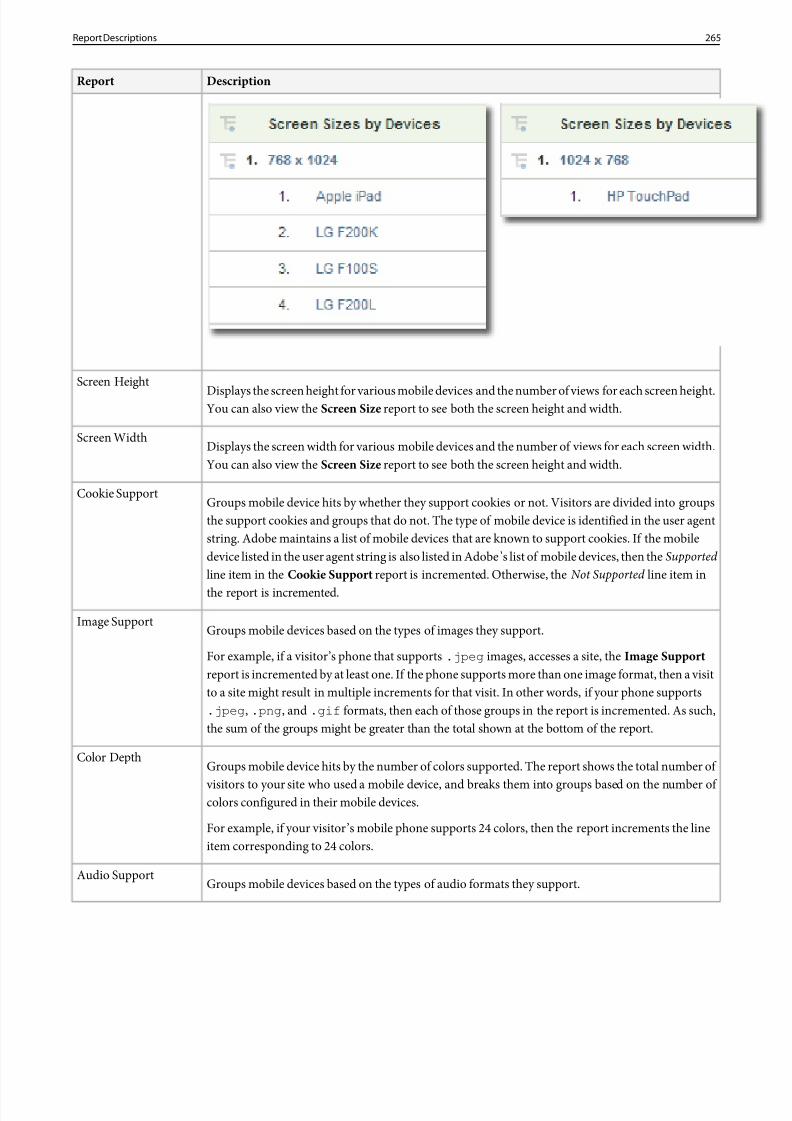
8/18/2019 Analytics Reference Adobe
http://slidepdf.com/reader/full/analytics-reference-adobe 265/332
DescriptionReport
Displays the screen height for various mobile devices and the number of views for each screen height.You can also view theScreen Size report to see both the screen height and width.
Screen Height
Displays the screen width for various mobile devices and the number of views for each screen width.You can also view theScreen Size report to see both the screen height and width.
Screen Width
Groups mobile device hits by whether they support cookies or not. Visitors are divided into groupsthe support cookies and groups that do not. The type of mobile device is identified in the user agent
Cookie Support
string. Adobe maintains a list of mobile devices that are known to support cookies. If the mobiledevice listed in the user agent string is also listed in Adobe’s list of mobile devices, then theSupported line item in the Cookie Support report is incremented. Otherwise, the Not Supported line item inthe report is incremented.
Groups mobile devices based on the types of images they support.Image Support
For example, if a visitor’s phone that supports .jpeg images, accesses a site, theImage Supportreport is incremented by at least one. If the phone supports more than one image format, then a visitto a site might result in multiple increments for that visit. In other words, if your phone supports.jpeg , .png , and .gif formats, then each of those groups in the report is incremented. As such,the sum of the groups might be greater than the total shown at the bottom of the report.
Groups mobile device hits by the number of colors supported. The report shows the total number of
visitors to your site who used a mobile device, and breaks them into groups based on the number of colors configured in their mobile devices.
Color Depth
For example, if your visitor’s mobile phone supports 24 colors, then the report increments the lineitem corresponding to 24 colors.
Groups mobile devices based on the types of audio formats they support.Audio Support
265Report Descriptions
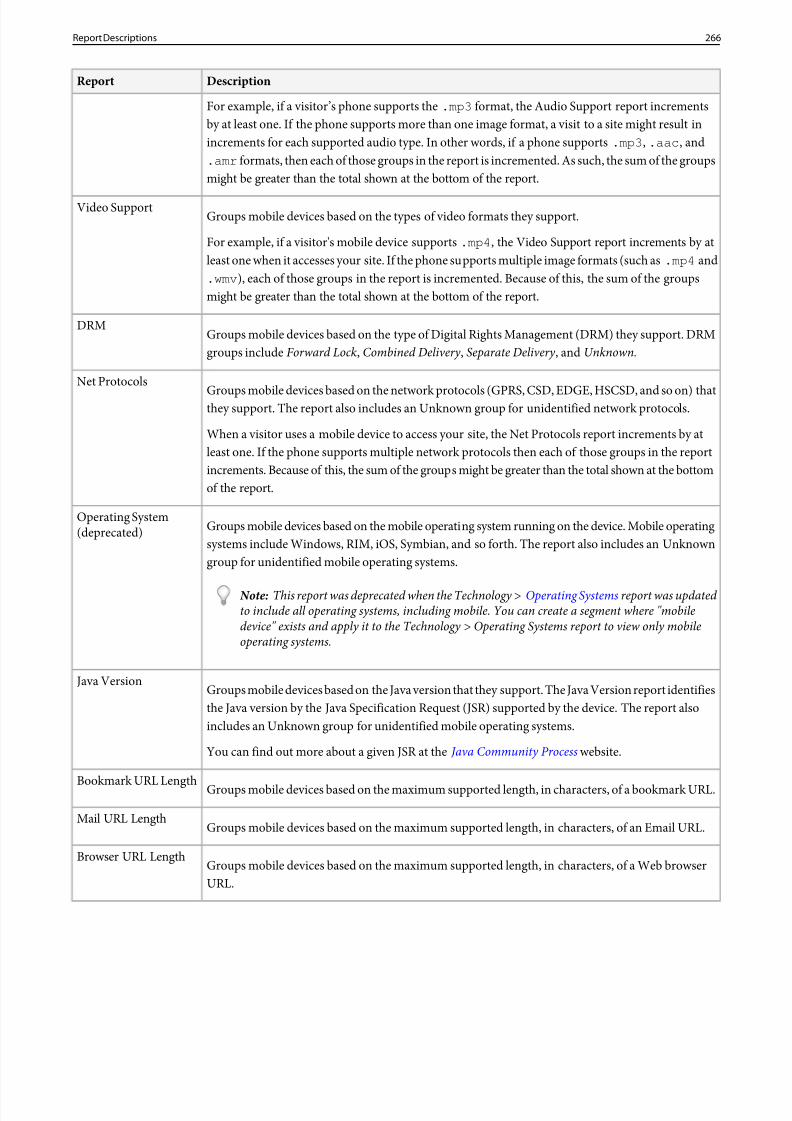
8/18/2019 Analytics Reference Adobe
http://slidepdf.com/reader/full/analytics-reference-adobe 266/332
DescriptionReport
For example, if a visitor’s phone supports the .mp3 format, the Audio Support report incrementsby at least one. If the phone supports more than one image format, a visit to a site might result inincrements for each supported audio type. In other words, if a phone supports .mp3 , .aac , and.amr formats, then each of those groups in the report is incremented. As such, the sum of the groupsmight be greater than the total shown at the bottom of the report.
Groups mobile devices based on the types of video formats they support.Video Support
For example, if a visitor's mobile device supports.mp4 , the Video Support report increments by atleast one when it accesses your site. If the phone supports multiple image formats (such as.mp4 and.wmv ), each of those groups in the report is incremented. Because of this, the sum of the groupsmight be greater than the total shown at the bottom of the report.
Groups mobile devices based on the type of Digital Rights Management (DRM) they support. DRMgroups include Forward Lock, Combined Delivery , Separate Delivery , and Unknown.
DRM
Groups mobile devices based on the network protocols (GPRS, CSD, EDGE, HSCSD, and so on) thatthey support. The report also includes an Unknown group for unidentified network protocols.
Net Protocols
When a visitor uses a mobile device to access your site, the Net Protocols report increments by atleast one. If the phone supports multiple network protocols then each of those groups in the reportincrements. Because of this, the sum of the groups might be greater than the total shown at the bottomof the report.
Groups mobile devices based on the mobile operating system running on the device. Mobile operatingsystems include Windows, RIM, iOS, Symbian, and so forth. The report also includes an Unknowngroup for unidentified mobile operating systems.
Operating System(deprecated)
Note: This report was deprecated when the Technology > Operating Systems report was updated to include all operating systems, including mobile. You can create a segment where "mobiledevice" exists and apply it to the Technology > Operating Systems report to view only mobileoperating systems.
Groups mobile devices based on the Java version that they support. The Java Version report identifiesthe Java version by the Java Specification Request (JSR) supported by the device. The report alsoincludes an Unknown group for unidentified mobile operating systems.
Java Version
You can find out more about a given JSR at the Java Community Process website.
Groups mobile devices based on the maximum supported length, in characters, of a bookmark URL.Bookmark URL Length
Groups mobile devices based on the maximum supported length, in characters, of an Email URL.Mail URL Length
Groups mobile devices based on the maximum supported length, in characters, of a Web browserURL.
Browser URL Length
266Report Descriptions
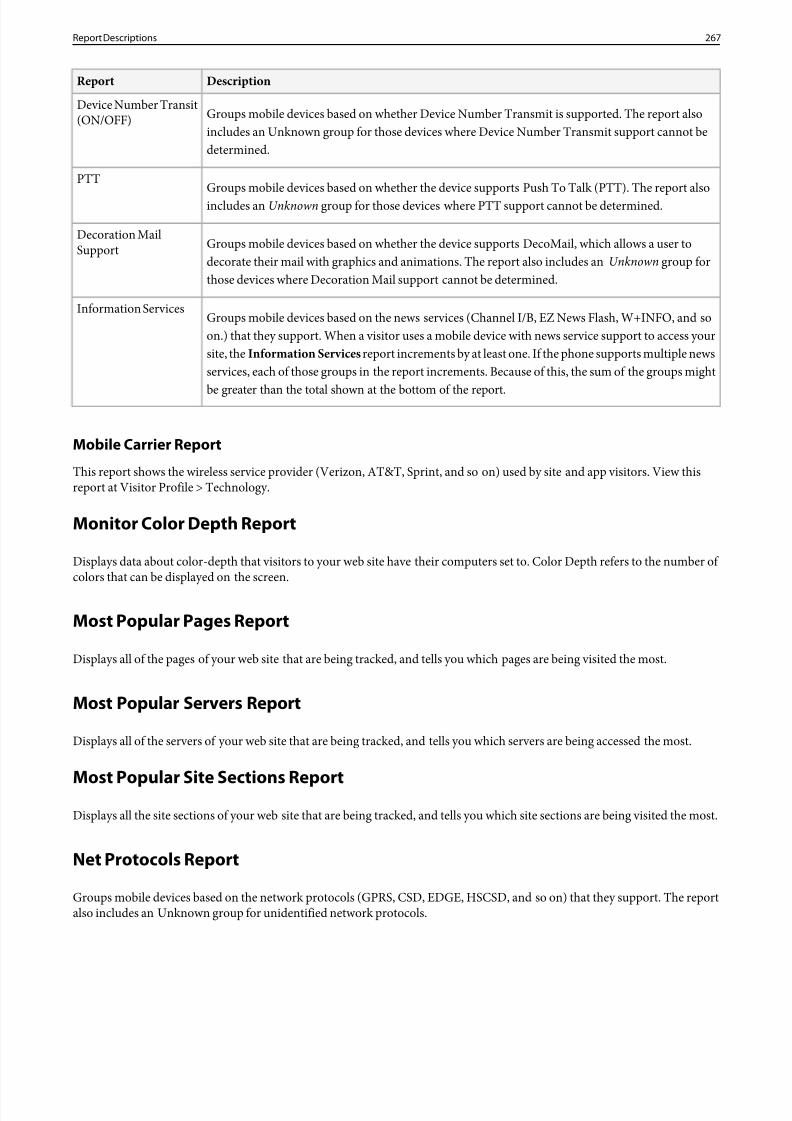
8/18/2019 Analytics Reference Adobe
http://slidepdf.com/reader/full/analytics-reference-adobe 267/332
DescriptionReport
Groups mobile devices based on whether Device Number Transmit is supported. The report alsoincludes an Unknown group for those devices where Device Number Transmit support cannot bedetermined.
Device Number Transit(ON/OFF)
Groups mobile devices based on whether the device supports Push To Talk (PTT). The report alsoincludes an Unknown group for those devices where PTT support cannot be determined.
PTT
Groups mobile devices based on whether the device supports DecoMail, which allows a user todecorate their mail with graphics and animations. The report also includes an Unknown group forthose devices where Decoration Mail support cannot be determined.
Decoration MailSupport
Groups mobile devices based on the news services (Channel I/B, EZ News Flash, W+INFO, and soon.) that they support. When a visitor uses a mobile device with news service support to access your
Information Services
site, the Information Services report increments by at least one. If the phone supports multiple newsservices, each of those groups in the report increments. Because of this, the sum of the groups might
be greater than the total shown at the bottom of the report.
Mobile Carrier Report
This report shows the wireless service provider (Verizon, AT&T, Sprint, and so on) used by site and app visitors. View thisreport at Visitor Profile > Technology.
Monitor Color Depth Report
Displays data about color-depth that visitors to your web site have their computers set to. Color Depth refers to the number of colors that can be displayed on the screen.
Most Popular Pages Report
Displays all of the pages of your web site that are being tracked, and tells you which pages are being visited the most.
Most Popular Servers Report
Displays all of the servers of your web site that are being tracked, and tells you which servers are being accessed the most.
Most Popular Site Sections ReportDisplays all the site sections of your web site that are being tracked, and tells you which site sections are being visited the most.
Net Protocols Report
Groups mobile devices based on the network protocols (GPRS, CSD, EDGE, HSCSD, and so on) that they support. The reportalso includes an Unknown group for unidentified network protocols.
267Report Descriptions
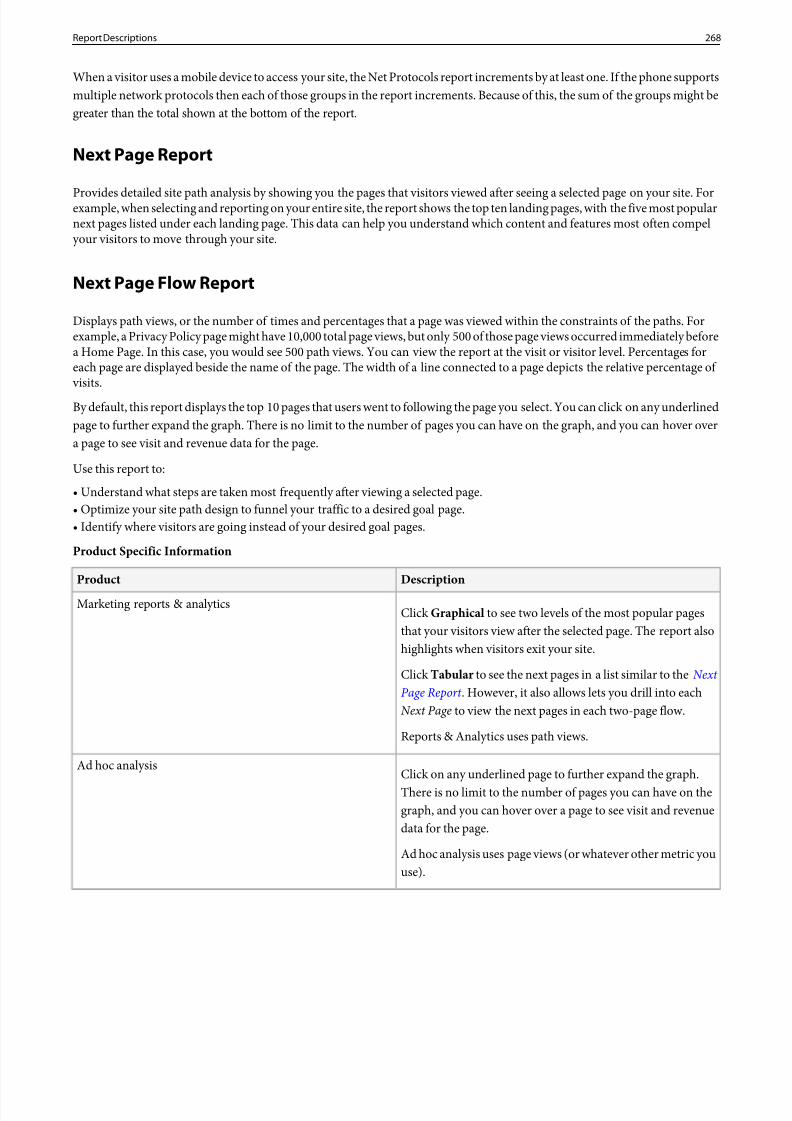
8/18/2019 Analytics Reference Adobe
http://slidepdf.com/reader/full/analytics-reference-adobe 268/332
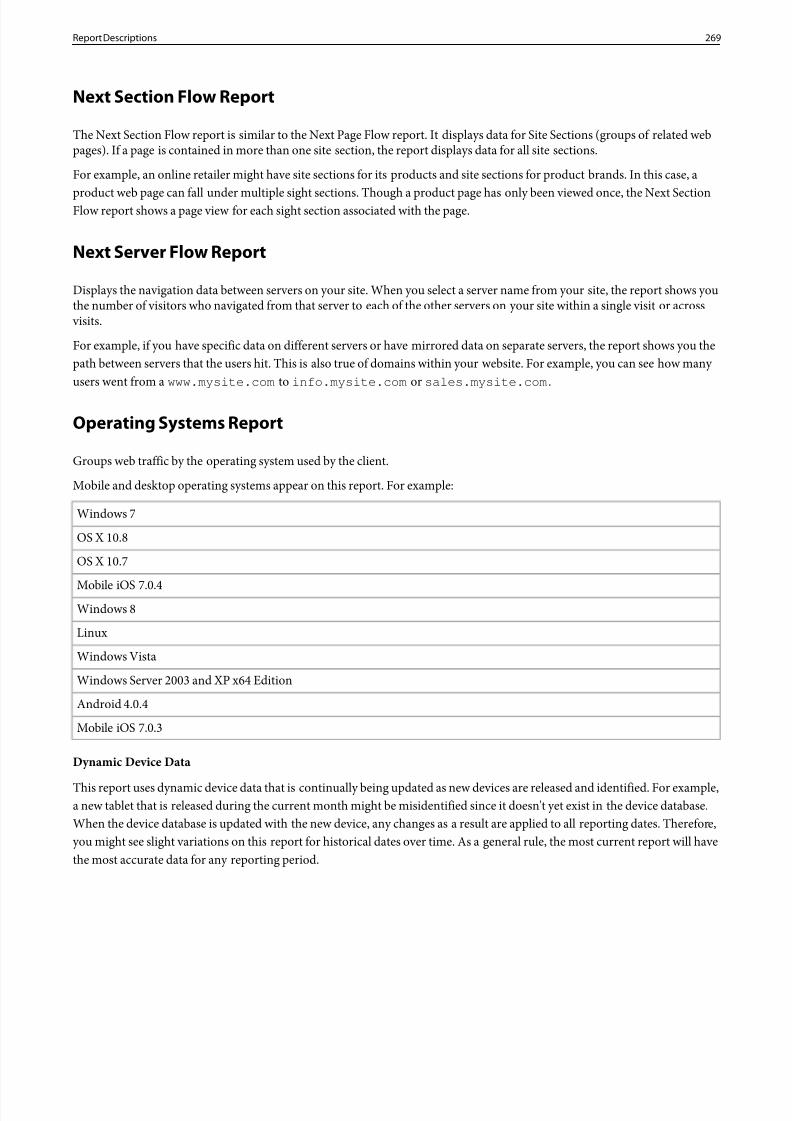
8/18/2019 Analytics Reference Adobe
http://slidepdf.com/reader/full/analytics-reference-adobe 269/332
8/18/2019 Analytics Reference Adobe
http://slidepdf.com/reader/full/analytics-reference-adobe 270/332
Changes
ChangeDate
Macintosh was separated into specific OS versions on this report. These OSs now report as [major version].[minor version].[update], for example: 10.9.2.
Before April 17
April 17, 2014
•All Apple Macintosh computers are reported as Macintosh.
After April 17
• OS X 10 = version 0S X 10.0 -10.7• OS X 10.8• OS X 10.9• Macintosh no longer appears in reports after April 17
Mobile operating systems were added to the Operating Systems Report. Before this date, mobile operatingsystems were reported as "Not Specified". After this date, "Not Specified" was replaced with specific versionsof mobile operating systems.
November 18,2013
Operating System Types Report
Rolls up the specific versions from the Operating Systems report in the Operating Systems Report into major operating systemtypes for simplified reporting and segmentation.
For example:
Microsoft Windows
Apple Macintosh
Apple iOS
Google AndroidGNU/Linux
Dynamic Device Data
This report uses dynamic device data that is continually being updated as new devices are released and identified. For example,a new tablet that is released during the current month might be misidentified since it doesn't yet exist in the device database.When the device database is updated with the new device, any changes as a result are applied to all reporting dates. Therefore,you might see slight variations on this report for historical dates over time. As a general rule, the most current report will havethe most accurate data for any reporting period.
Changes
ChangeDate
This report was added in marketing reports & analytics. Historical data is available before this date sincethis report is based on existing data in the Operating Systems report.
May 22, 2014
270Report Descriptions
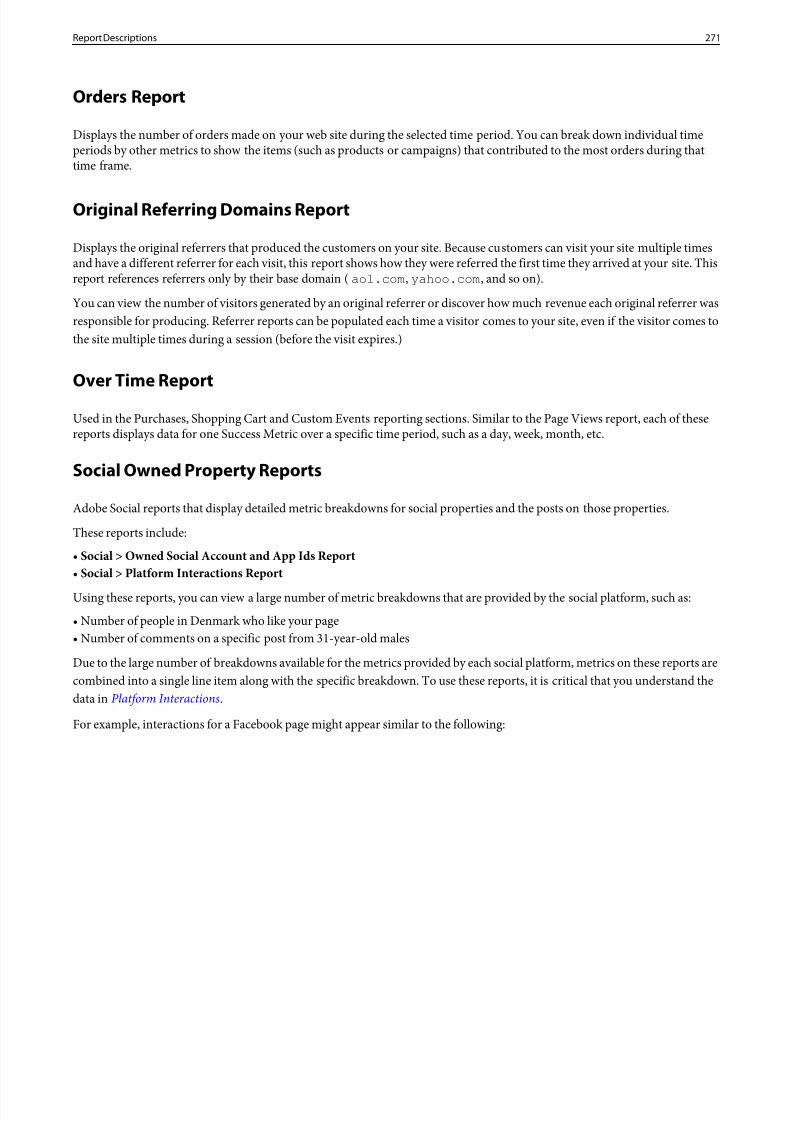
8/18/2019 Analytics Reference Adobe
http://slidepdf.com/reader/full/analytics-reference-adobe 271/332
Orders Report
Displays the number of orders made on your web site during the selected time period. You can break down individual timeperiods by other metrics to show the items (such as products or campaigns) that contributed to the most orders during thattime frame.
Original Referring Domains Report
Displays the original referrers that produced the customers on your site. Because customers can visit your site multiple timesand have a different referrer for each visit, this report shows how they were referred the first time they arrived at your site. Thisreport references referrers only by their base domain (aol.com , yahoo.com , and so on).
You can view the number of visitors generated by an original referrer or discover how much revenue each original referrer wasresponsible for producing. Referrer reports can be populated each time a visitor comes to your site, even if the visitor comes tothe site multiple times during a session (before the visit expires.)
Over Time Report
Used in the Purchases, Shopping Cart and Custom Events reporting sections. Similar to the Page Views report, each of thesereports displays data for one Success Metric over a specific time period, such as a day, week, month, etc.
Social Owned Property Reports
Adobe Social reports that display detailed metric breakdowns for social properties and the posts on those properties.
These reports include:
• Social > Owned Social Account and App Ids Report• Social > Platform Interactions Report
Using these reports, you can view a large number of metric breakdowns that are provided by the social platform, such as:
• Number of people in Denmark who like your page• Number of comments on a specific post from 31-year-old males
Due to the large number of breakdowns available for the metrics provided by each social platform, metrics on these reports arecombined into a single line item along with the specific breakdown. To use these reports, it is critical that you understand thedata in Platform Interactions .
For example, interactions for a Facebook page might appear similar to the following:
271Report Descriptions
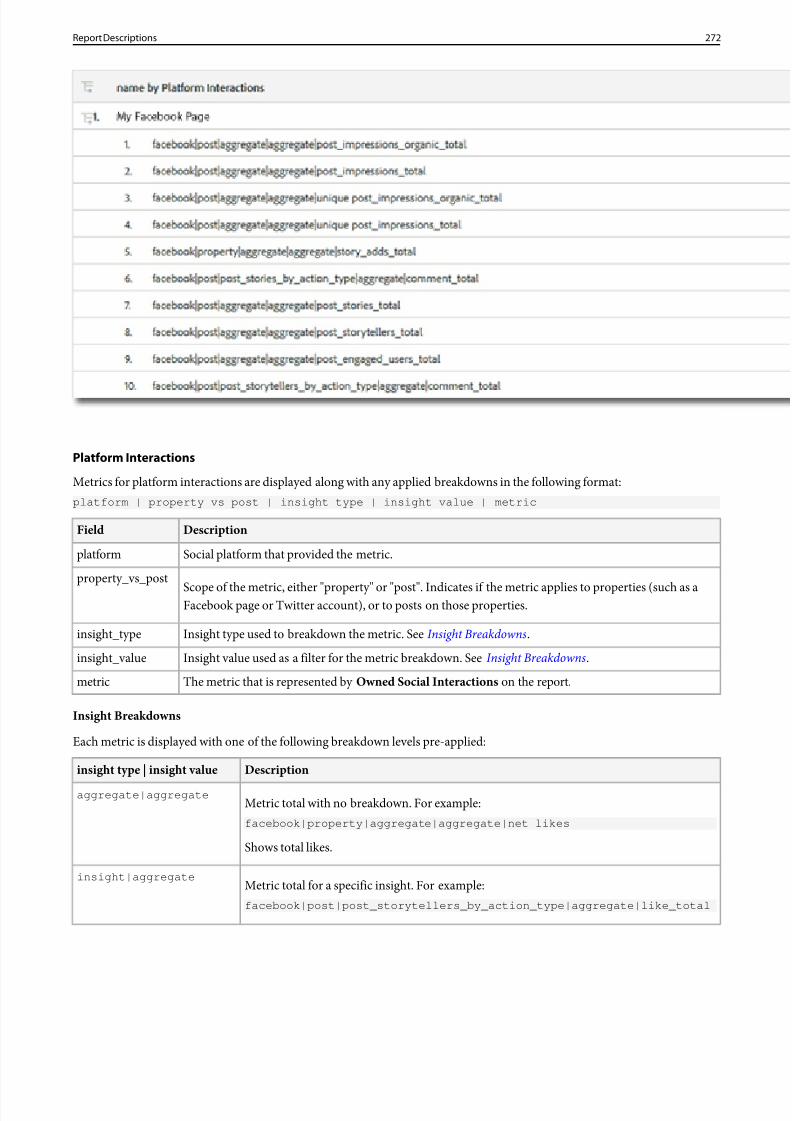
8/18/2019 Analytics Reference Adobe
http://slidepdf.com/reader/full/analytics-reference-adobe 272/332
Platform Interactions
Metrics for platform interactions are displayed along with any applied breakdowns in the following format:platform | property vs post | insight type | insight value | metric
DescriptionField
Social platform that provided the metric.platform
Scope of the metric, either "property" or "post". Indicates if the metric applies to properties (such as aFacebook page or Twitter account), or to posts on those properties.
property_vs_post
Insight type used to breakdown the metric. SeeInsight Breakdowns.insight_type
Insight value used as a filter for the metric breakdown. SeeInsight Breakdowns.insight_value
The metric that is represented by Owned Social Interactions on the report.metric
Insight Breakdowns
Each metric is displayed with one of the following breakdown levels pre-applied:
Descriptioninsight type | insight value
Metric total with no breakdown. For example:facebook|property|aggregate|aggregate|net likes
aggregate|aggregate
Shows total likes.
Metric total for a specific insight. For example:facebook|post|post_storytellers_by_action_type|aggregate|like_total
insight|aggregate
272Report Descriptions
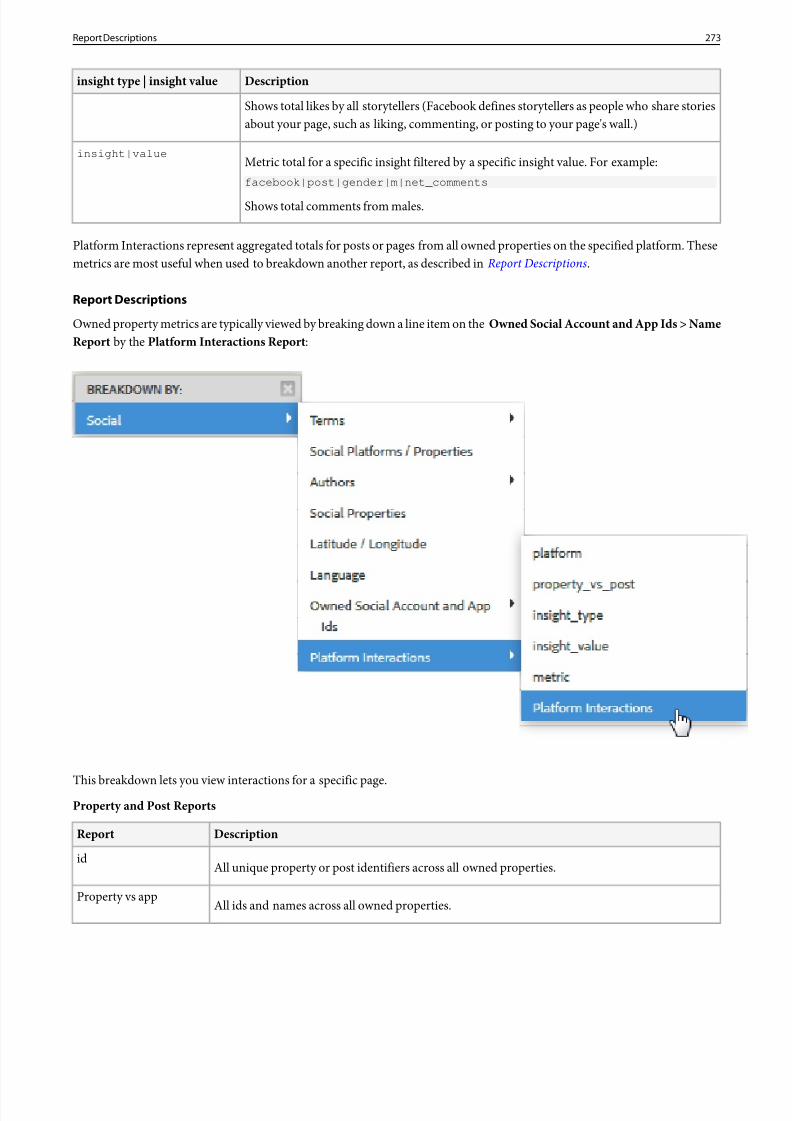
8/18/2019 Analytics Reference Adobe
http://slidepdf.com/reader/full/analytics-reference-adobe 273/332
Descriptioninsight type | insight value
Shows total likes by all storytellers (Facebook defines storytellers as people who share storiesabout your page, such as liking, commenting, or posting to your page's wall.)
Metric total for a specific insight filtered by a specific insight value. For example:facebook|post|gender|m|net_comments
insight|value
Shows total comments from males.
Platform Interactions represent aggregated totals for posts or pages from all owned properties on the specified platform. Thesemetrics are most useful when used to breakdown another report, as described in Report Descriptions.
Report Descriptions
Owned property metrics are typically viewed by breaking down a line item on theOwned Social Account and App Ids > NameReport by the Platform Interactions Report :
This breakdown lets you view interactions for a specific page.Property and Post Reports
DescriptionReport
All unique property or post identifiers across all owned properties.id
All ids and names across all owned properties.Property vs app
273Report Descriptions
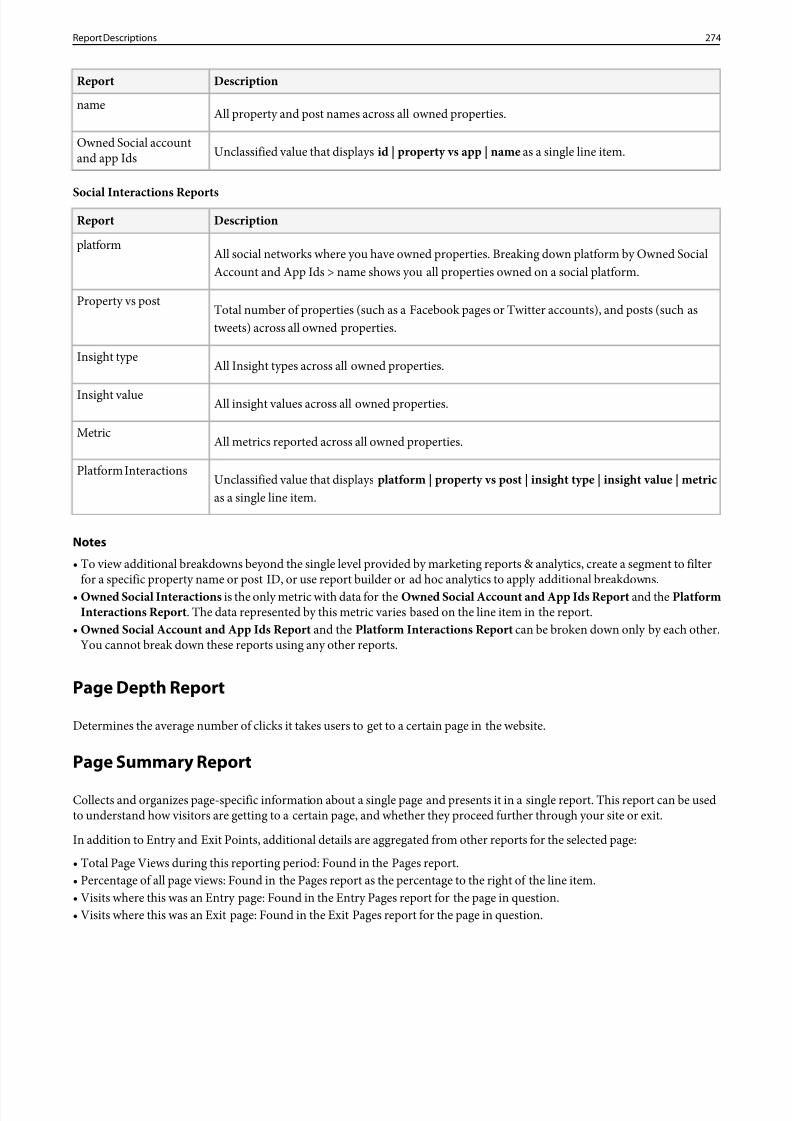
8/18/2019 Analytics Reference Adobe
http://slidepdf.com/reader/full/analytics-reference-adobe 274/332
DescriptionReport
All property and post names across all owned properties.name
Unclassified value that displaysid | property vs app | name as a single line item.Owned Social accountand app Ids
Social Interactions ReportsDescriptionReport
All social networks where you have owned properties. Breaking down platform by Owned SocialAccount and App Ids > name shows you all properties owned on a social platform.
platform
Total number of properties (such as a Facebook pages or Twitter accounts), and posts (such astweets) across all owned properties.
Property vs post
All Insight types across all owned properties.Insight type
All insight values across all owned properties.Insight value
All metrics reported across all owned properties.Metric
Unclassified value that displaysplatform | property vs post | insight type | insight value | metricas a single line item.
Platform Interactions
Notes
• To view additional breakdowns beyond the single level provided by marketing reports & analytics, create a segment to filterfor a specific property name or post ID, or use report builder or ad hoc analytics to apply additional breakdowns.
• Owned Social Interactions is the only metric with data for theOwned Social Account and App Ids Report and the PlatformInteractions Report . The data represented by this metric varies based on the line item in the report.
• Owned Social Account and App Ids Report and the Platform Interactions Report can be broken down only by each other.You cannot break down these reports using any other reports.
Page Depth Report
Determines the average number of clicks it takes users to get to a certain page in the website.
Page Summary Report
Collects and organizes page-specific information about a single page and presents it in a single report. This report can be usedto understand how visitors are getting to a certain page, and whether they proceed further through your site or exit.
In addition to Entry and Exit Points, additional details are aggregated from other reports for the selected page:
• Total Page Views during this reporting period: Found in the Pages report.• Percentage of all page views: Found in the Pages report as the percentage to the right of the line item.• Visits where this was an Entry page: Found in the Entry Pages report for the page in question.• Visits where this was an Exit page: Found in the Exit Pages report for the page in question.
274Report Descriptions
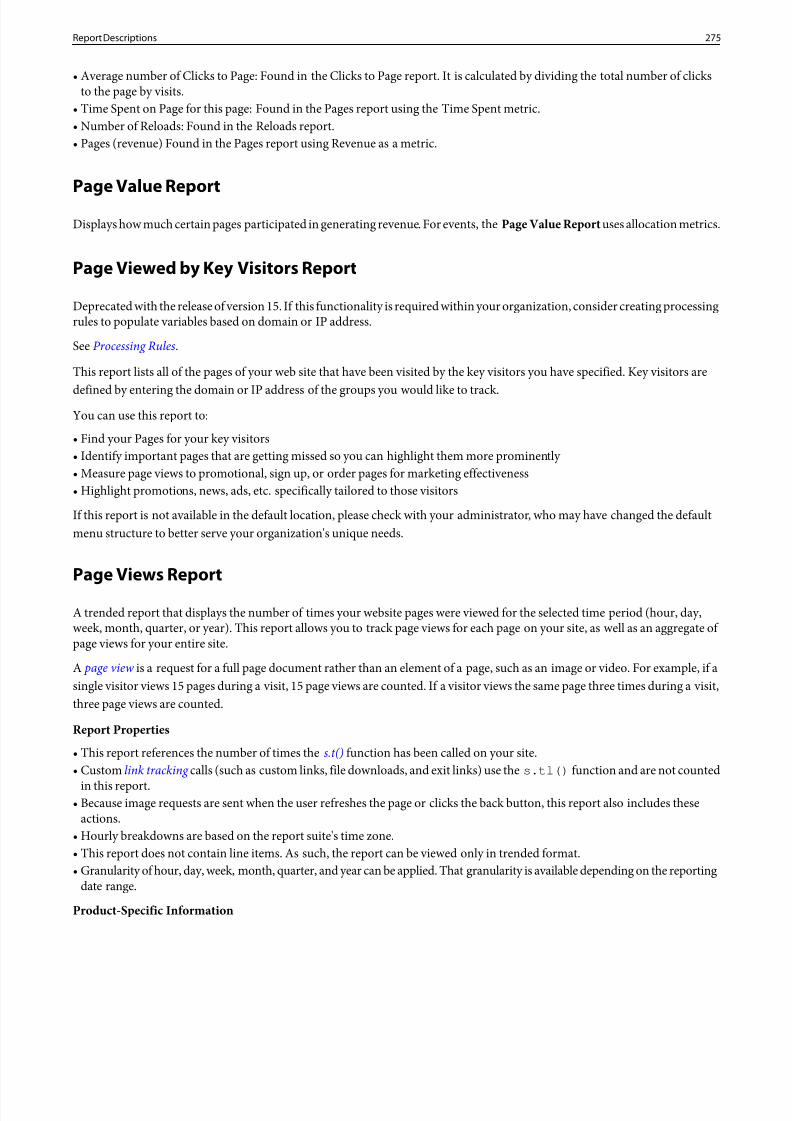
8/18/2019 Analytics Reference Adobe
http://slidepdf.com/reader/full/analytics-reference-adobe 275/332
• Average number of Clicks to Page: Found in the Clicks to Page report. It is calculated by dividing the total number of clicksto the page by visits.
• Time Spent on Page for this page: Found in the Pages report using the Time Spent metric.• Number of Reloads: Found in the Reloads report.• Pages (revenue) Found in the Pages report using Revenue as a metric.
Page Value Report
Displays how much certain pages participated in generating revenue. For events, thePage Value Report uses allocation metrics.
Page Viewed by Key Visitors Report
Deprecated with the release of version 15. If this functionality is required within your organization, consider creating processingrules to populate variables based on domain or IP address.
SeeProcessing Rules.
This report lists all of the pages of your web site that have been visited by the key visitors you have specified. Key visitors are
defined by entering the domain or IP address of the groups you would like to track.You can use this report to:
• Find your Pages for your key visitors• Identify important pages that are getting missed so you can highlight them more prominently • Measure page views to promotional, sign up, or order pages for marketing effectiveness• Highlight promotions, news, ads, etc. specifically tailored to those visitors
If this report is not available in the default location, please check with your administrator, who may have changed the defaultmenu structure to better serve your organization's unique needs.
Page Views Report
A trended report that displays the number of times your website pages were viewed for the selected time period (hour, day,week, month, quarter, or year). This report allows you to track page views for each page on your site, as well as an aggregate of page views for your entire site.
A page view is a request for a full page document rather than an element of a page, such as an image or video. For example, if asingle visitor views 15 pages during a visit, 15 page views are counted. If a visitor views the same page three times during a visit,three page views are counted.
Report Properties
• This report references the number of times the s.t() function has been called on your site.• Custom link tracking calls (such as custom links, file downloads, and exit links) use thes.tl() function and are not counted
in this report.• Because image requests are sent when the user refreshes the page or clicks the back button, this report also includes these
actions.• Hourly breakdowns are based on the report suite's time zone.• This report does not contain line items. As such, the report can be viewed only in trended format.• Granularity of hour, day, week, month, quarter, and year can be applied. That granularity is available depending on the reporting
date range.
Product-Specific Information
275Report Descriptions
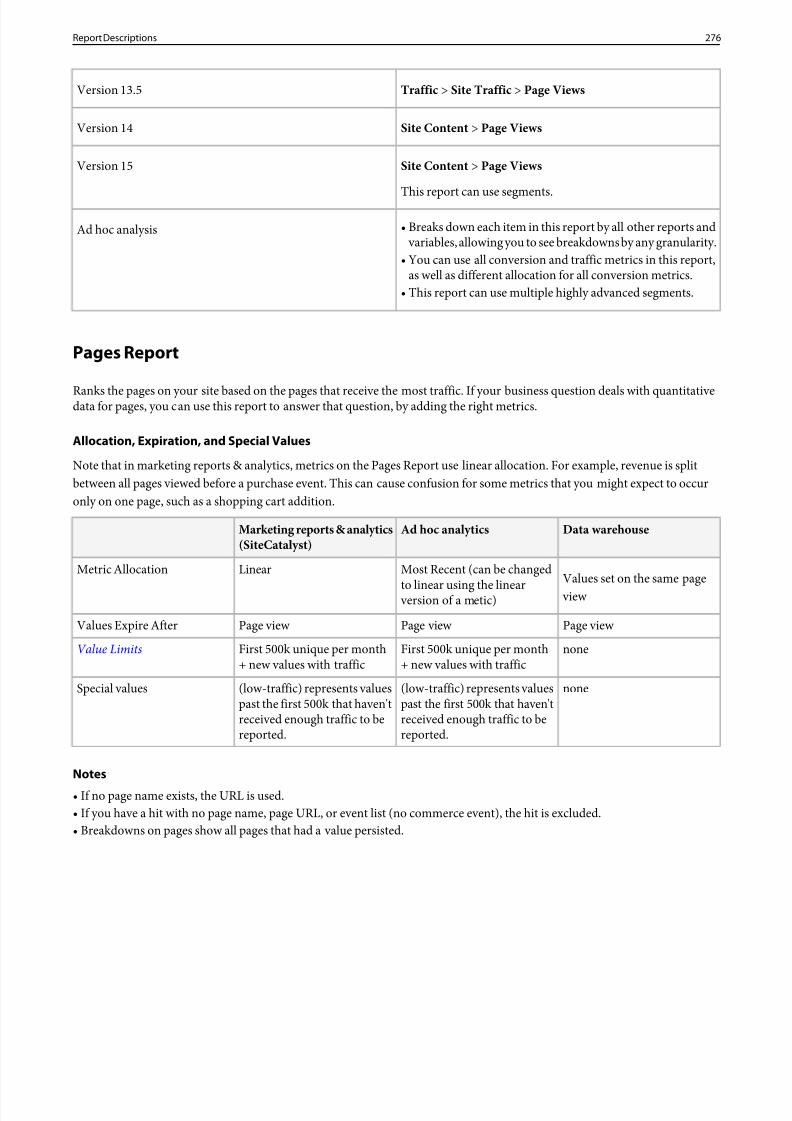
8/18/2019 Analytics Reference Adobe
http://slidepdf.com/reader/full/analytics-reference-adobe 276/332
Traffic > Site Traffic > Page ViewsVersion 13.5
Site Content > Page ViewsVersion 14
Site Content > Page ViewsVersion 15
This report can use segments.
Ad hoc analysis • Breaks down each item in this report by all other reports and variables, allowing you to see breakdowns by any granularity.
• You can use all conversion and traffic metrics in this report,as well as different allocation for all conversion metrics.
• This report can use multiple highly advanced segments.
Pages Report
Ranks the pages on your site based on the pages that receive the most traffic. If your business question deals with quantitativedata for pages, you can use this report to answer that question, by adding the right metrics.
Allocation, Expiration, and Special Values
Note that in marketing reports & analytics, metrics on the Pages Report use linear allocation. For example, revenue is splitbetween all pages viewed before a purchase event. This can cause confusion for some metrics that you might expect to occuronly on one page, such as a shopping cart addition.
Data warehouseAd hoc analyticsMarketing reports & analytics(SiteCatalyst)
Values set on the same page view
Most Recent (can be changed
to linear using the linear version of a metic)
LinearMetric Allocation
Page view Page view Page view Values Expire After
noneFirst 500k unique per month+ new values with traffic
First 500k unique per month+ new values with traffic
Value Limits
none(low-traffic) represents valuespast the first 500k that haven't
(low-traffic) represents valuespast the first 500k that haven't
Special values
received enough traffic to bereported.
received enough traffic to bereported.
Notes
• If no page name exists, the URL is used.• If you have a hit with no page name, page URL, or event list (no commerce event), the hit is excluded.• Breakdowns on pages show all pages that had a value persisted.
276Report Descriptions
8/18/2019 Analytics Reference Adobe
http://slidepdf.com/reader/full/analytics-reference-adobe 277/332
Pages Not Found Report
Helps you identify pages that contain broken links and to measure traffic to pages that do not exist. These pages are commonly referred to as 404 Pages. You can use this report to see where visitors are accessing these broken pages, as well as how often.
Properties
• This report references data directly from the pageType variable implemented on your website.• This report can be viewed in both trended and ranked formats.• Clicking the magnifying glass icon shows you the top referrers to that specific page.
Paid Search Engines Report
Displays which search engines visitors use for paid searches.
Paid Search Keywords Report
Displays a breakdown of each paid search keyword that is used to find your site. You can sort this list by page views or searchkeywords by clicking the column title above the listing. Click the magnifying glass next to a search keyword to see the searchresults for your site.
Path Length Report
Displays, by percentage and by total count, the depth of each visit to your site. In other words, the report indicates how many pages the average visitor to your site views before leaving.
Custom links (s.tl calls) do not add to the path length for pages. However, they do count in path length for props (traffic variables.)
Multiple instances of the same value (reloads) do not increase path length. Examples:
Page A > Page B > Custom link > Page B = Path length of 2. (Notice that the custom link and the reload of page B do notcount toward the path length.)
Prop A > Custom Link pass Prop B > Prop C = Path length of 3. (Notice that the custom link for Prop B does count towardthe path length.)
Pathing Reports
A group of reports based on path analysis. Technically, pathing means to move from one page name to another (from one valueto another).
If you need to know the order in which values are collected, then you need to enable pathing for the variable collecting those
values. Pathing is enabled by default for pages. Pathing is not enabled for any props by default, because it is only appropriate incertain cases. Contact Customer Care to enable pathing on a prop.
Note: In Ad Hoc Analysis, when you enable classifications on a prop, pathing metrics become available for all the classificationsset up for the enabled prop.
Example - Pathing on Site Sections
Enabling pathing for the s.channel variable allows you to track how site visitors move between Site Sections (as the value changes).
277Report Descriptions
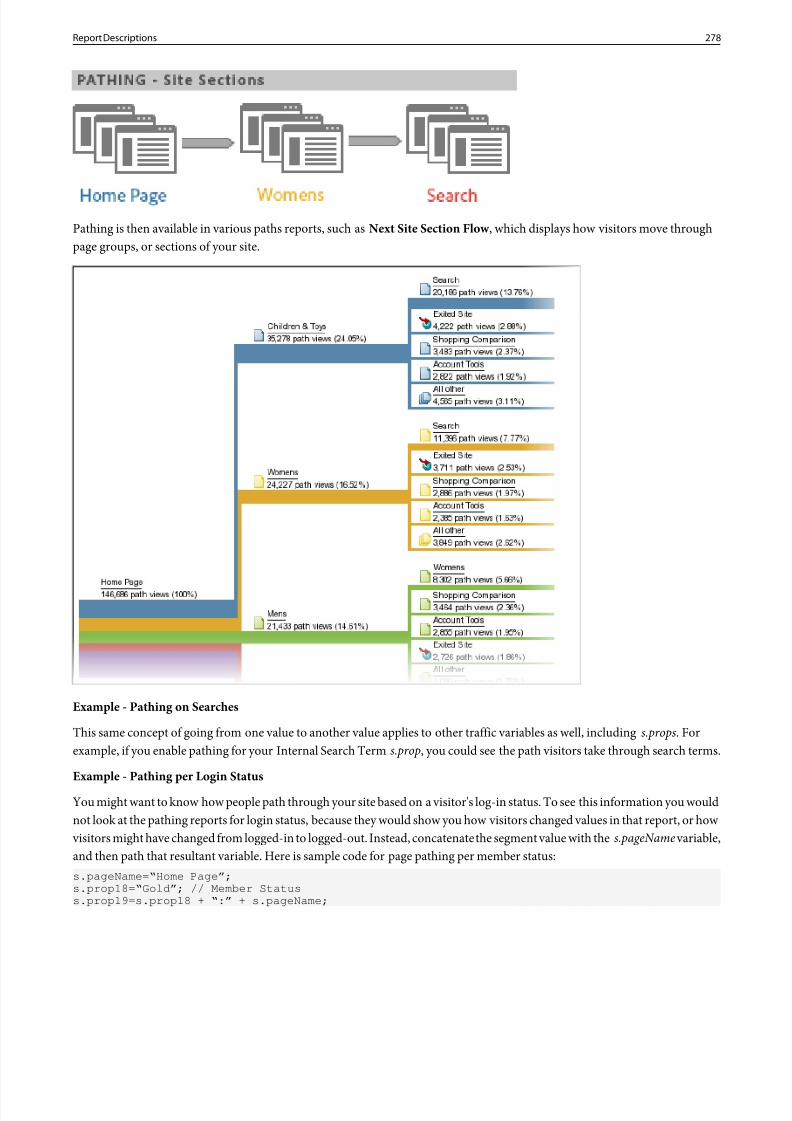
8/18/2019 Analytics Reference Adobe
http://slidepdf.com/reader/full/analytics-reference-adobe 278/332
Pathing is then available in various paths reports, such asNext Site Section Flow , which displays how visitors move throughpage groups, or sections of your site.
Example - Pathing on Searches
This same concept of going from one value to another value applies to other traffic variables as well, includings.props. Forexample, if you enable pathing for your Internal Search Terms.prop, you could see the path visitors take through search terms.
Example - Pathing per Login Status
You might want to know how people path through your site based on a visitor's log-in status. To see this information you wouldnot look at the pathing reports for login status, because they would show you how visitors changed values in that report, or how visitors might have changed from logged-in to logged-out. Instead, concatenate the segment value with thes.pageName variable,and then path that resultant variable. Here is sample code for page pathing per member status:s.pageName=“Home Page”;s.prop18=“Gold”; // Member Statuss.prop19=s.prop18 + “:” + s.pageName;
278Report Descriptions
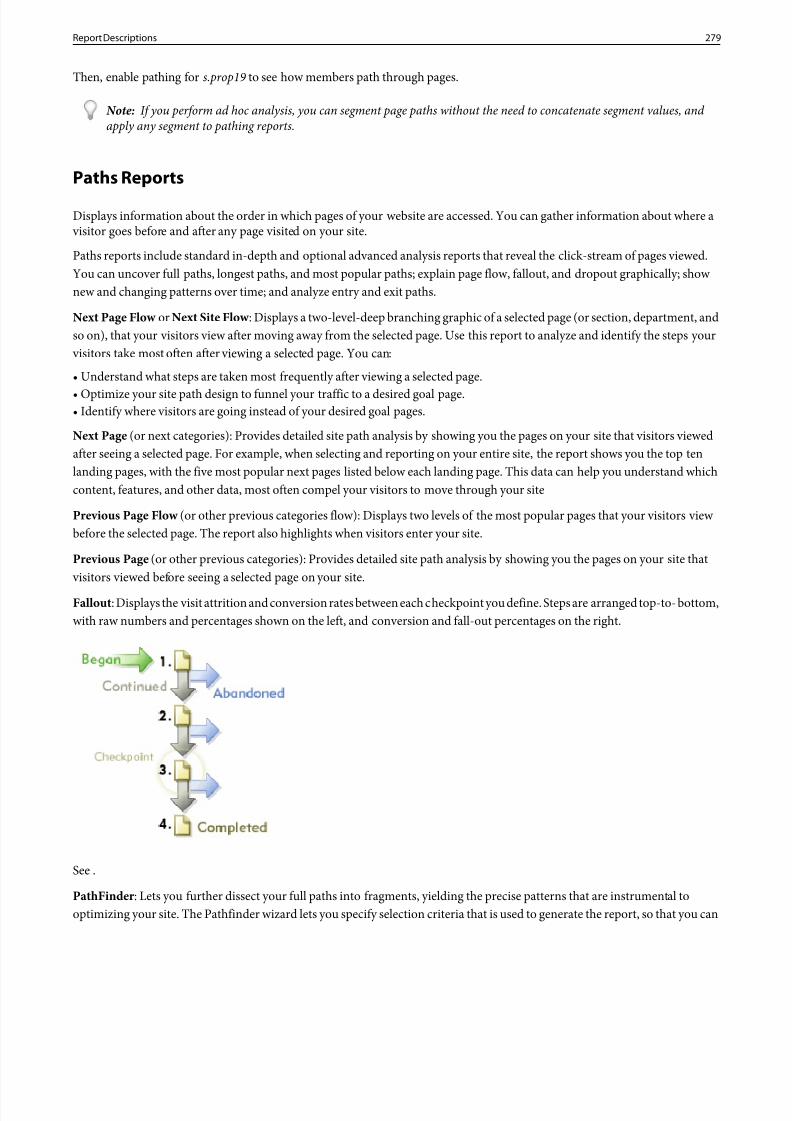
8/18/2019 Analytics Reference Adobe
http://slidepdf.com/reader/full/analytics-reference-adobe 279/332
Then, enable pathing for s.prop19 to see how members path through pages.
Note: If you perform ad hoc analysis, you can segment page paths without the need to concatenate segment values, and apply any segment to pathing reports.
Paths Reports
Displays information about the order in which pages of your website are accessed. You can gather information about where a visitor goes before and after any page visited on your site.
Paths reports include standard in-depth and optional advanced analysis reports that reveal the click-stream of pages viewed.You can uncover full paths, longest paths, and most popular paths; explain page flow, fallout, and dropout graphically; show new and changing patterns over time; and analyze entry and exit paths.
Next Page Flow or Next Site Flow : Displays a two-level-deep branching graphic of a selected page (or section, department, andso on), that your visitors view after moving away from the selected page. Use this report to analyze and identify the steps your visitors take most often after viewing a selected page. You can:
• Understand what steps are taken most frequently after viewing a selected page.• Optimize your site path design to funnel your traffic to a desired goal page.• Identify where visitors are going instead of your desired goal pages.
Next Page (or next categories): Provides detailed site path analysis by showing you the pages on your site that visitors viewedafter seeing a selected page. For example, when selecting and reporting on your entire site, the report shows you the top tenlanding pages, with the five most popular next pages listed below each landing page. This data can help you understand whichcontent, features, and other data, most often compel your visitors to move through your site
Previous Page Flow (or other previous categories flow): Displays two levels of the most popular pages that your visitors view before the selected page. The report also highlights when visitors enter your site.
Previous Page (or other previous categories): Provides detailed site path analysis by showing you the pages on your site that visitors viewed before seeing a selected page on your site.
Fallout : Displays the visit attrition and conversion rates between each checkpoint you define. Steps are arranged top-to- bottom,with raw numbers and percentages shown on the left, and conversion and fall-out percentages on the right.
See .
PathFinder : Lets you further dissect your full paths into fragments, yielding the precise patterns that are instrumental tooptimizing your site. The Pathfinder wizard lets you specify selection criteria that is used to generate the report, so that you can
279Report Descriptions
8/18/2019 Analytics Reference Adobe
http://slidepdf.com/reader/full/analytics-reference-adobe 280/332
analyze the path fragments and query for ones that begin with a certain page, end with a certain page, or even ones that beginwith one page and end with another.
Path Length : Shows how deep visitors browse into your site (both by percentage and by total count). In other words, the reportindicates how many pages the average visitor to your site views before leaving.
Page Analysis: Contains a subset of reports that let you analyze the following:
• Page Summary / Site Category Summary : Tells you everything you need to know about the page report. It collects andorganizes page-specific information about a single page and presents it in a single report.
• Reloads: Shows the number of times individual pages were reloaded by visitors.• Time Spent on Page / Site Category : Displays the length of time that visitors browse individual pages in your site. The time
spent is divided into ten categories: less than 15 seconds, 15-30 seconds, 30-60 seconds, 1-3 minutes, 3-5 minutes, 5-10 minutes,10-15 minutes, 15-20 minutes, 20-30 minutes and greater than 30 minutes.
• Clicks to Page: Identifies the number of clicks visitors used to access each page in your site. Depth for a page is measured by counting the number of pages viewed before it.
Entries & Exits: The Entry Page report shows you, by percentage and by total visits, which pages on your site are the first onesseen by new visitors. You can view:
• Entry Pages (or sections): Displays, by percentage and by total visits, which pages on your site are the first pages seen by a new visitor. You can use this report to identify which of your web pages are the most frequent points of entry, optimize the primary entry points on your site, and drive entry traffic to your key messages.
• Original Entry Pages : Shows the first page viewed for first-time visitors to your site. Each user is counted only once unlessthey delete their cookies or are not being tracked with cookies.
• Single Page Visits : Shows pages that are most often both the entry and exit pages for visitor browsing sessions.• Exit Pages: Displays, by percentage and by total visits, the pages on your site that were the last pages visitors viewed before
leaving your site.
Previous Page Report
A path report that provides detailed site path analysis by showing you the pages on your site that visitors viewed prior to seeinga selected page on your site.
For example, you may want to know from where the people that viewed Home Page came. In the table, you can do a search forHome Page or scroll until you find it listed in bold. The pages that were viewed beforeHome Page are listed underneath.
DescriptionProduct
Paths > Pages > Previous PageMarketing Reports
Shows where visitors to each page come from. For example if you have a Features page, this report shows the top five pagesyour visitors came from to get to your Features page. Thisreport:
• Identifies the route a visitor takes when entering a page onyour site.• Lets you determine which pages feed visitors to important
pages on your site.• Lets you analyze a sign-up page, for example, to understand
which of your site pages is most effectively driving your visitors to subscribe to your services.
280Report Descriptions
8/18/2019 Analytics Reference Adobe
http://slidepdf.com/reader/full/analytics-reference-adobe 281/332
DescriptionProduct
A Flow report. You can specify the direction in the interface,and run the report at across visits or at the visit level.
Ad Hoc Analysis
Previous Page Flow Report
The Previous Page Flow report shows multiple levels of the most popular pages that your visitors view before the selected page.The report also highlights pages from which visitors enter your site.
Previous Section Flow Report
The Previous Section Flow report is similar to the Previous Page Flow report. It displays data for Site Sections (groups of relatedweb pages). If a page is contained in more than one site section, then the report displays data for all site sections.
For example, an online retailer might have site sections for its products and site sections for product brands. In this case, aproduct web page can fall under multiple sight sections. Though a product page has only been viewed once, the Previous SectionFlow report shows a page view for each sight section associated with the page.
Previous Server Flow Report
This report shows you navigation data between servers on your site. When you select a server name from your site, the reportshows you the number of visitors who navigated to that server from each of the other servers on your site within a single visitor across visits.
For example, if you have specific data on different servers or have mirrored data on separate servers, the report shows you thepath between servers that the users hit. This is also true of domains within your website. For example, you can see how many users went from a www.mysite.com to info.mysite.com or sales.mysite.com .
Products Report
Identifies how individual products and groups of products (categories) contribute to your various conversion metrics, such asRevenue or Checkouts.
DescriptionReport
Shows averages for the Product Views, Cart Additions, Orders, Units, and Revenuemetrics. It also shows key conversions between important data in each reporting
Products Conversion Funnel
group and standard conversion metrics (Orders, Units, and Revenue). The top(overview) of the funnel provides a visual summary of conversion data. The funnel
section shows statistics for all events in the overview section based on Orders andup to two other metrics, such as Revenue and Units.
To add metrics and custom events from other reporting groups, click a SelectedEvents link in the report header.
Because the current time periods are not yet completed when you view data, thisreport can indicate a downward trend from the previous to the current time period.
281Report Descriptions
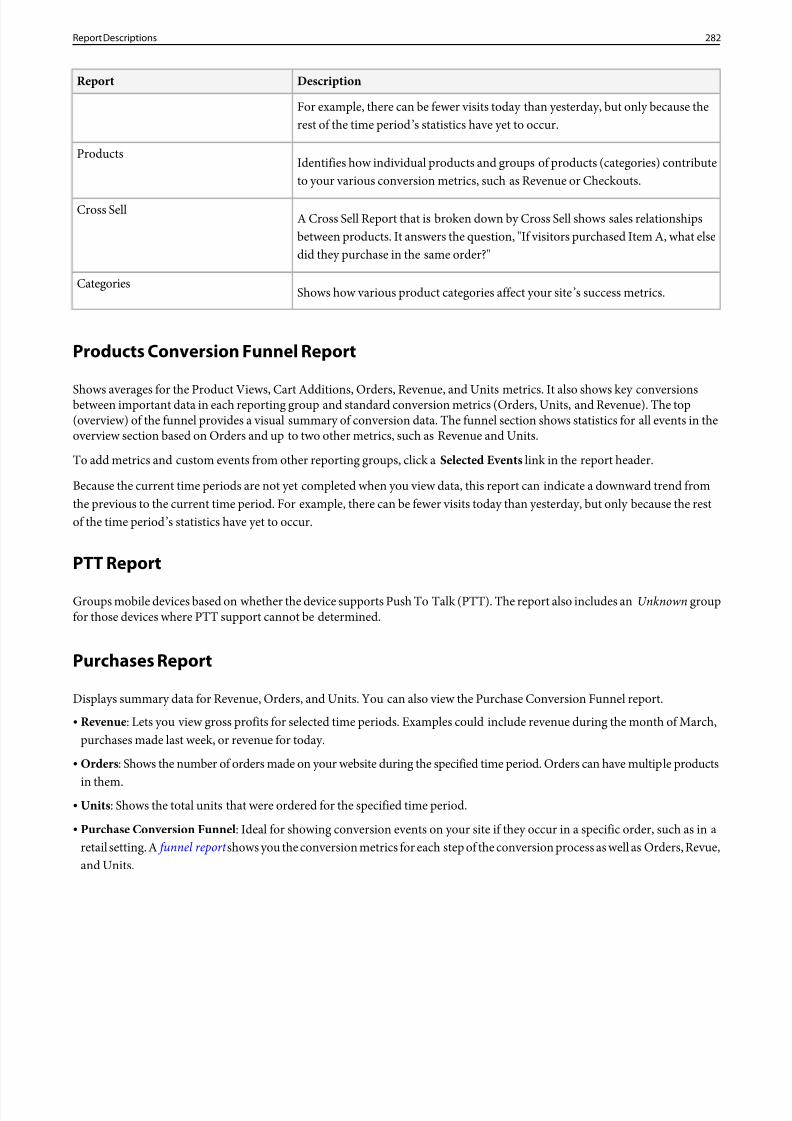
8/18/2019 Analytics Reference Adobe
http://slidepdf.com/reader/full/analytics-reference-adobe 282/332
DescriptionReport
For example, there can be fewer visits today than yesterday, but only because therest of the time period’s statistics have yet to occur.
Identifies how individual products and groups of products (categories) contributeto your various conversion metrics, such as Revenue or Checkouts.
Products
A Cross Sell Report that is broken down by Cross Sell shows sales relationshipsbetween products. It answers the question, "If visitors purchased Item A, what elsedid they purchase in the same order?"
Cross Sell
Shows how various product categories affect your site’s success metrics.Categories
Products Conversion Funnel Report
Shows averages for the Product Views, Cart Additions, Orders, Revenue, and Units metrics. It also shows key conversionsbetween important data in each reporting group and standard conversion metrics (Orders, Units, and Revenue). The top(overview) of the funnel provides a visual summary of conversion data. The funnel section shows statistics for all events in theoverview section based on Orders and up to two other metrics, such as Revenue and Units.
To add metrics and custom events from other reporting groups, click a Selected Events link in the report header.
Because the current time periods are not yet completed when you view data, this report can indicate a downward trend fromthe previous to the current time period. For example, there can be fewer visits today than yesterday, but only because the restof the time period’s statistics have yet to occur.
PTT Report
Groups mobile devices based on whether the device supports Push To Talk (PTT). The report also includes anUnknown groupfor those devices where PTT support cannot be determined.
Purchases Report
Displays summary data for Revenue, Orders, and Units. You can also view the Purchase Conversion Funnel report.• Revenue: Lets you view gross profits for selected time periods. Examples could include revenue during the month of March,
purchases made last week, or revenue for today.• Orders : Shows the number of orders made on your website during the specified time period. Orders can have multiple products
in them.• Units : Shows the total units that were ordered for the specified time period.
• Purchase Conversion Funnel : Ideal for showing conversion events on your site if they occur in a specific order, such as in aretail setting. A funnel report shows you the conversion metrics for each step of the conversion process as well as Orders, Revue,and Units.
282Report Descriptions
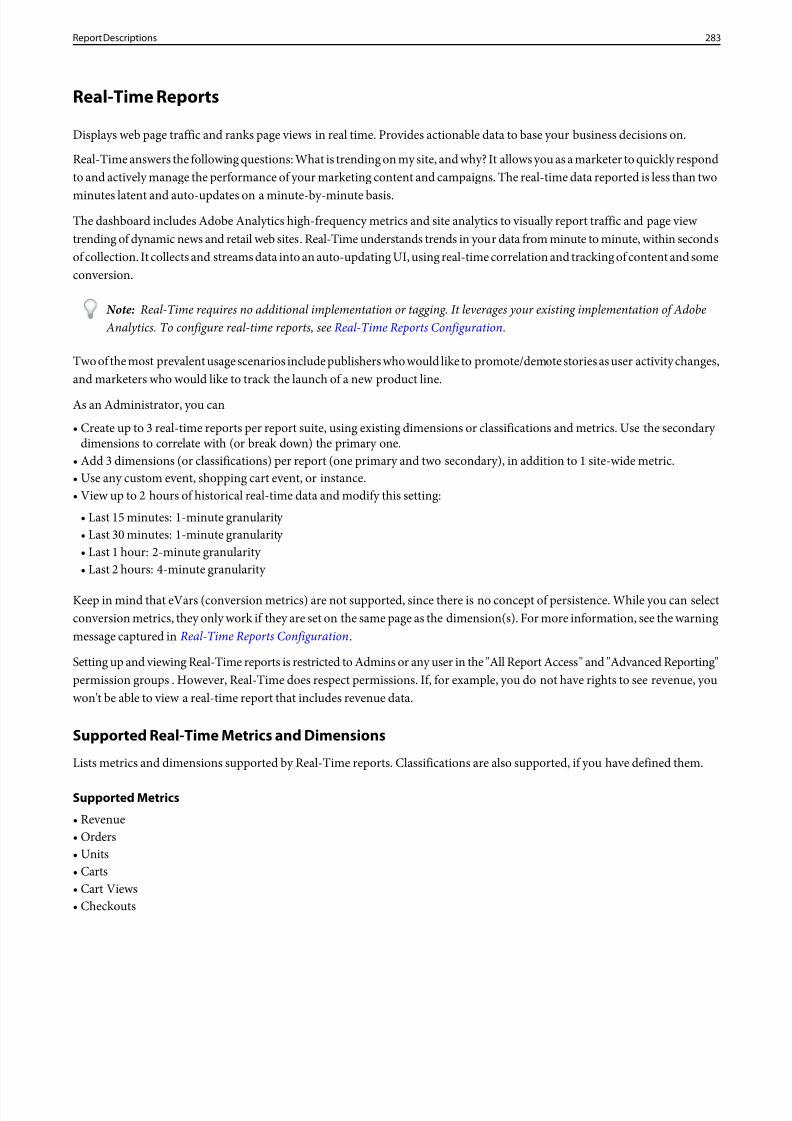
8/18/2019 Analytics Reference Adobe
http://slidepdf.com/reader/full/analytics-reference-adobe 283/332
Real-Time Reports
Displays web page traffic and ranks page views in real time. Provides actionable data to base your business decisions on.
Real-Time answers the following questions: What is trending on my site, and why? It allows you as a marketer to quickly respondto and actively manage the performance of your marketing content and campaigns. The real-time data reported is less than two
minutes latent and auto-updates on a minute-by-minute basis.The dashboard includes Adobe Analytics high-frequency metrics and site analytics to visually report traffic and page view trending of dynamic news and retail web sites. Real-Time understands trends in your data from minute to minute, within secondsof collection. It collects and streams data into an auto-updating UI, using real-time correlation and tracking of content and someconversion.
Note: Real-Time requires no additional implementation or tagging. It leverages your existing implementation of Adobe Analytics. To configure real-time reports, seeReal-Time Reports Configuration.
Two of the most prevalent usage scenarios include publishers who would like to promote/demote stories as user activity changes,and marketers who would like to track the launch of a new product line.
As an Administrator, you can
• Create up to 3 real-time reports per report suite, using existing dimensions or classifications and metrics. Use the secondary dimensions to correlate with (or break down) the primary one.
• Add 3 dimensions (or classifications) per report (one primary and two secondary), in addition to 1 site-wide metric.• Use any custom event, shopping cart event, or instance.• View up to 2 hours of historical real-time data and modify this setting:
• Last 15 minutes: 1-minute granularity • Last 30 minutes: 1-minute granularity • Last 1 hour: 2-minute granularity • Last 2 hours: 4-minute granularity
Keep in mind that eVars (conversion metrics) are not supported, since there is no concept of persistence. While you can selectconversion metrics, they only work if they are set on the same page as the dimension(s). For more information, see the warningmessage captured in Real-Time Reports Configuration.
Setting up and viewing Real-Time reports is restricted to Admins or any user in the "All Report Access" and "Advanced Reporting"permission groups . However, Real-Time does respect permissions. If, for example, you do not have rights to see revenue, youwon't be able to view a real-time report that includes revenue data.
Supported Real-Time Metrics and Dimensions
Lists metrics and dimensions supported by Real-Time reports. Classifications are also supported, if you have defined them.
Supported Metrics
• Revenue• Orders• Units• Carts• Cart Views• Checkouts
283Report Descriptions
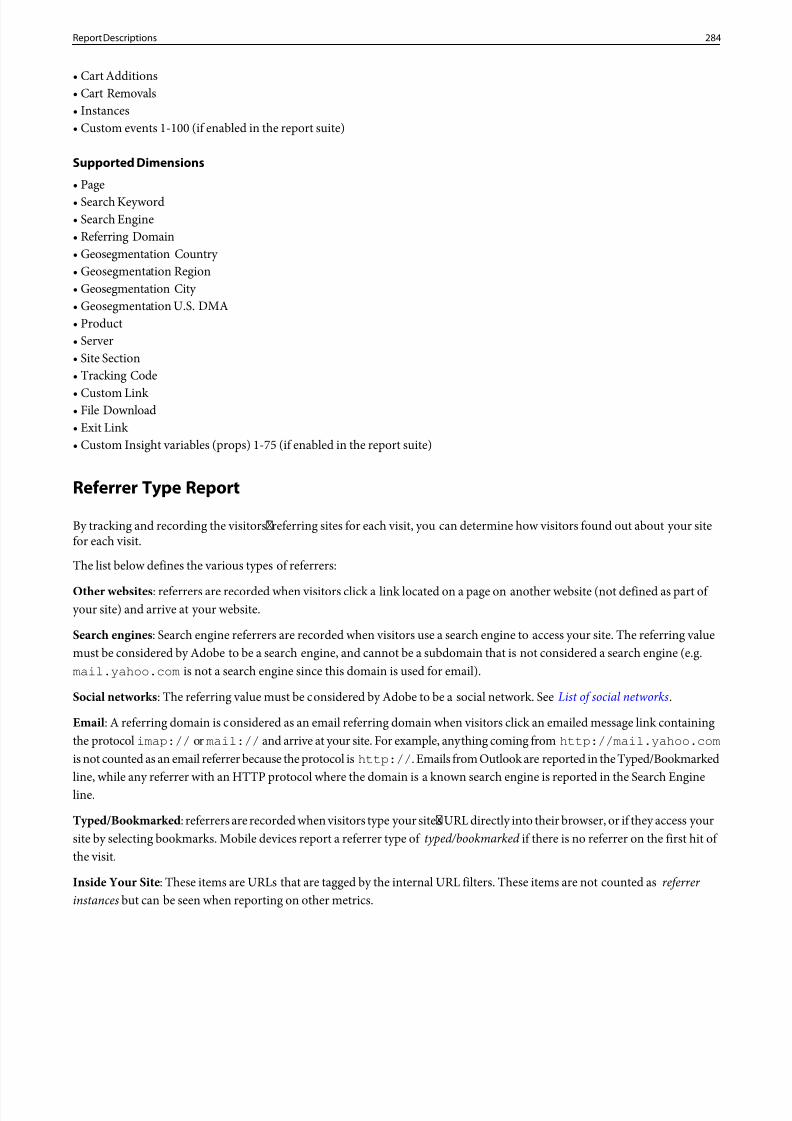
8/18/2019 Analytics Reference Adobe
http://slidepdf.com/reader/full/analytics-reference-adobe 284/332
• Cart Additions• Cart Removals• Instances• Custom events 1-100 (if enabled in the report suite)
Supported Dimensions
• Page• Search Keyword• Search Engine• Referring Domain• Geosegmentation Country • Geosegmentation Region• Geosegmentation City • Geosegmentation U.S. DMA• Product• Server• Site Section• Tracking Code
• Custom Link • File Download• Exit Link • Custom Insight variables (props) 1-75 (if enabled in the report suite)
Referrer Type Report
By tracking and recording the visitors' referring sites for each visit, you can determine how visitors found out about your sitefor each visit.
The list below defines the various types of referrers:
Other websites : referrers are recorded when visitors click a link located on a page on another website (not defined as part of your site) and arrive at your website.
Search engines : Search engine referrers are recorded when visitors use a search engine to access your site. The referring valuemust be considered by Adobe to be a search engine, and cannot be a subdomain that is not considered a search engine (e.g.mail.yahoo.com is not a search engine since this domain is used for email).
Social networks : The referring value must be considered by Adobe to be a social network. SeeList of social networks.
Email: A referring domain is considered as an email referring domain when visitors click an emailed message link containingthe protocol imap:// or mail:// and arrive at your site. For example, anything coming fromhttp://mail.yahoo.com
is not counted as an email referrer because the protocol is http:// . Emails from Outlook are reported in the Typed/Bookmarkedline, while any referrer with an HTTP protocol where the domain is a known search engine is reported in the Search Engineline.
Typed/Bookmarked : referrers are recorded when visitors type your sites URL directly into their browser, or if they access yoursite by selecting bookmarks. Mobile devices report a referrer type oftyped/bookmarked if there is no referrer on the first hit of the visit.
Inside Your Site : These items are URLs that are tagged by the internal URL filters. These items are not counted asreferrer instances but can be seen when reporting on other metrics.
284Report Descriptions
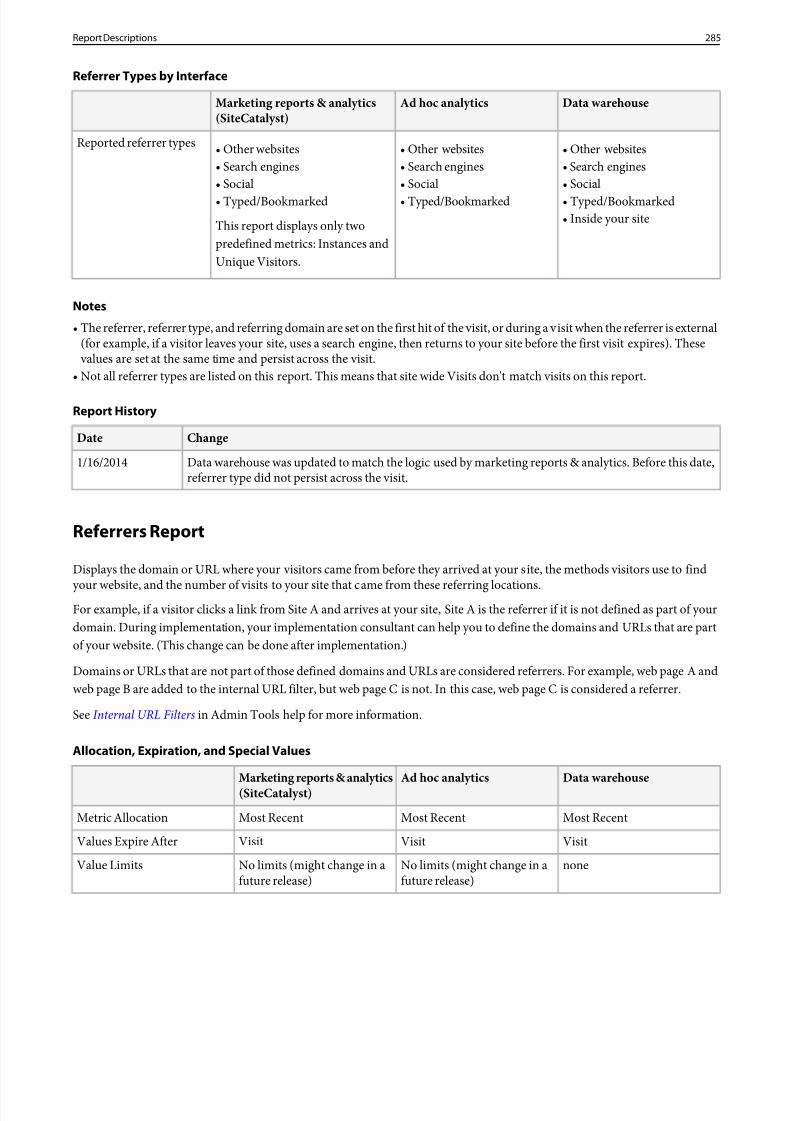
8/18/2019 Analytics Reference Adobe
http://slidepdf.com/reader/full/analytics-reference-adobe 285/332
Referrer Types by Interface
Data warehouseAd hoc analyticsMarketing reports & analytics(SiteCatalyst)
Reported referrer types • Other websites• Other websites• Other websites• ••Search engines Search enginesSearch engines
•• •SocialSocial Social••• Typed/BookmarkedTyped/BookmarkedTyped/Bookmarked
This report displays only twopredefined metrics: Instances andUnique Visitors.
• Inside your site
Notes
• The referrer, referrer type, and referring domain are set on the first hit of the visit, or during a visit when the referrer is external(for example, if a visitor leaves your site, uses a search engine, then returns to your site before the first visit expires). These values are set at the same time and persist across the visit.
• Not all referrer types are listed on this report. This means that site wide Visits don't match visits on this report.
Report History
ChangeDate
Data warehouse was updated to match the logic used by marketing reports & analytics. Before this date,referrer type did not persist across the visit.
1/16/2014
Referrers Report
Displays the domain or URL where your visitors came from before they arrived at your site, the methods visitors use to find
your website, and the number of visits to your site that came from these referring locations.For example, if a visitor clicks a link from Site A and arrives at your site, Site A is the referrer if it is not defined as part of yourdomain. During implementation, your implementation consultant can help you to define the domains and URLs that are partof your website. (This change can be done after implementation.)
Domains or URLs that are not part of those defined domains and URLs are considered referrers. For example, web page A andweb page B are added to the internal URL filter, but web page C is not. In this case, web page C is considered a referrer.
SeeInternal URL Filters in Admin Tools help for more information.
Allocation, Expiration, and Special Values
Data warehouseAd hoc analyticsMarketing reports & analytics(SiteCatalyst)
Most RecentMost RecentMost RecentMetric Allocation
VisitVisitVisitValues Expire After
noneNo limits (might change in afuture release)
No limits (might change in afuture release)
Value Limits
285Report Descriptions
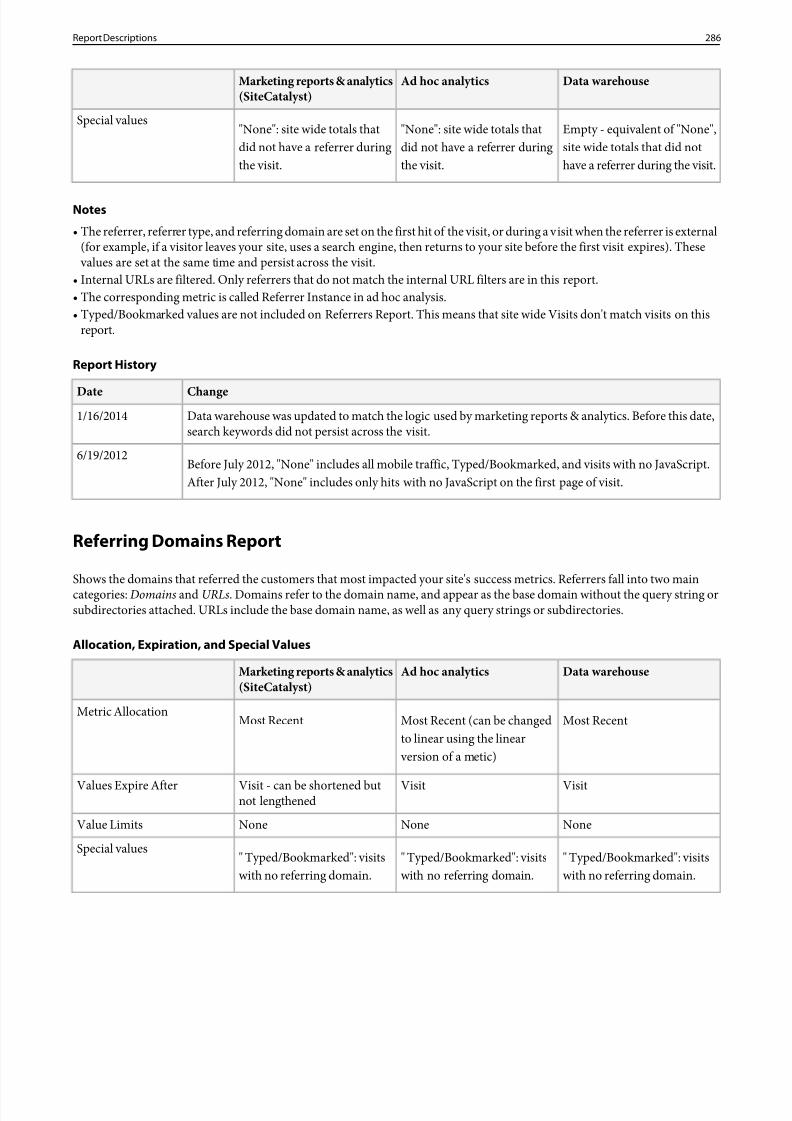
8/18/2019 Analytics Reference Adobe
http://slidepdf.com/reader/full/analytics-reference-adobe 286/332
Data warehouseAd hoc analyticsMarketing reports & analytics(SiteCatalyst)
Empty - equivalent of "None",site wide totals that did nothave a referrer during the visit.
"None": site wide totals thatdid not have a referrer duringthe visit.
"None": site wide totals thatdid not have a referrer duringthe visit.
Special values
Notes
• The referrer, referrer type, and referring domain are set on the first hit of the visit, or during a visit when the referrer is external(for example, if a visitor leaves your site, uses a search engine, then returns to your site before the first visit expires). These values are set at the same time and persist across the visit.
• Internal URLs are filtered. Only referrers that do not match the internal URL filters are in this report.• The corresponding metric is called Referrer Instance in ad hoc analysis.• Typed/Bookmarked values are not included on Referrers Report. This means that site wide Visits don't match visits on this
report.
Report History
ChangeDateData warehouse was updated to match the logic used by marketing reports & analytics. Before this date,search keywords did not persist across the visit.
1/16/2014
Before July 2012, "None" includes all mobile traffic, Typed/Bookmarked, and visits with no JavaScript.After July 2012, "None" includes only hits with no JavaScript on the first page of visit.
6/19/2012
Referring Domains Report
Shows the domains that referred the customers that most impacted your site's success metrics. Referrers fall into two maincategories:Domains and URLs. Domains refer to the domain name, and appear as the base domain without the query string orsubdirectories attached. URLs include the base domain name, as well as any query strings or subdirectories.
Allocation, Expiration, and Special Values
Data warehouseAd hoc analyticsMarketing reports & analytics(SiteCatalyst)
Most RecentMost Recent (can be changedto linear using the linear version of a metic)
Most RecentMetric Allocation
VisitVisitVisit - can be shortened butnot lengthened
Values Expire After
NoneNoneNoneValue Limits
" Typed/Bookmarked": visitswith no referring domain.
" Typed/Bookmarked": visitswith no referring domain.
" Typed/Bookmarked": visitswith no referring domain.
Special values
286Report Descriptions
8/18/2019 Analytics Reference Adobe
http://slidepdf.com/reader/full/analytics-reference-adobe 287/332
Notes
• The referrer, referrer type, and referring domain are set on the first hit of the visit, or during a visit when the referrer is external(for example, if a visitor leaves your site, uses a search engine, then returns to your site before the first visit expires). These values are set at the same time and persist across the visit.
• The Typed/bookmarked line item does not include other referrer types such as no Javascript or inside your site. Therefore theline items won't match the total because of these omissions.
• Before July 2012, mobile traffic did not appear in this report.
• In Data Extract and Excel Client, when All Referring Domains is requested, v14 does NOT include Typed/Bookmarked in thetotal. v15 does include Typed/Bookmarked.
Report History
ChangeDate
Data warehouse was updated to match the logic used by marketing reports & analytics. Before this date,referring domains did not persist across the visit.
1/16/2014
Return Frequency Report
Shows the length of time that passes between visits from returning visitors, and the number of visits that fall into each timelength category. Use the report to see the average amount of time that repeat visitors go without visiting your site, and the trendsin repeat customers.
Use this information to market effectively to visitors who have gone a certain period of time without visiting your site.
You can:
• Identify the number of return visitors and the frequency of their return visits.• Evaluate your website's appeal and relevance to visitors over time.• Know how sticky your site is to visitors and how often they feel compelled to return for further interaction or updates.• Identify the impact of your website's content and promotions on your visitors.
By default, this report has the following time lengths:• Less than one day • One to three days• Three to seven days• Seven to fourteen days• Fourteen days to one month• Longer than one month
Notes
• This report does not record any first-time visitors, as there is no prior visit to compare against.• The date range in this report uses the time in which the visit occurred. For example, a visitor comes to your site in April, then
comes back twice in the same day in October. Pulling a Return Frequency report for the month of October would show one visit under “longer than 1 month ”, and one visit under "less than 1 day".
Return Visits Report
A report showing the number of visits where visit number is greater than 1. The Return Visits Report includes non-cookied visitors.
287Report Descriptions
8/18/2019 Analytics Reference Adobe
http://slidepdf.com/reader/full/analytics-reference-adobe 288/332
Revenue Report
The Revenue report measures the amount of income generated through all of your products over a specific time period.
You can use this report to view the general success and trend of your site in revenue. You can also use the report to single outperiods where your site was particularly successful, to find the source, and use that for future campaigns.
General Properties of Report
• There are requirements that must be met in order for this report to successfully collect data. The following must occur withinthe same image request:• A purchase event must fire in the s.events variable.• The products variable must be defined with a number in the price field.• For example, this would pass $35.99 into the revenue report:
s.products="Mens;Shoes;1;35.99"
s.events="purchase"
• When more than one product is present in the s.products variable, all count towards the revenue report. For example,s.products="Mens;Socks;1;4.50,Womens;Socks;1;4.50" would pass $9 in revenue to reporting.
Note: Revenue is not multiplied if quantity is increased in a single product. For example,s.products="Womens;Socks;5;4.50" does not pass $22.50 into reporting, it passes $4.50. Make sure your implementation passes the total revenue for the quantity listed ( s.products="Womens;Socks;5;22.50" ).
• The Revenue report rounds the total amount for a time period to the nearest currency value. It does not round each individualproduct or hit.
• Because marketing reports round each day to the nearest whole currency, comparing the sum of each day to the monthly totalis off by a very small amount. This is because the monthly total is not the sum of each rounded day, it is the absolute sumrounded to the nearest whole currency.
• You can create a report that does not round revenue to the nearest whole currency by using a calculated metric.• Unless using the purchaseID variable, users refreshing the page may inflate revenue as it sends this data to Adobe multiple
times.• Hourly breakdowns are based on the report suite's time zone.• This report does not contain line items. It can only be viewed in trended format.• Granularity of hour, day, week, month, quarter, and year can be applied. These granularities are available depending on the
reporting date range.• This report can be broken down by the following reports (depending on organization and report suite settings):
• Time Spent per Visit report.• Pages and Site Sections report.• Videos report.• Page Depth and Entry Pages report.• Most Traffic Sources reports, including Search Keywords, Search Engines , and Referring Domains reports.• Tracking Code report and all associated classifications reports.• Products variable report and all associated classifications reports. AlsoCategories reports.• Almost all Visitor Profile reports, excluding GeoSegmentation reports.• AllCustom Conversion variables reports with basic subrelations.
• Breakdowns are not available by hour.
288Report Descriptions
8/18/2019 Analytics Reference Adobe
http://slidepdf.com/reader/full/analytics-reference-adobe 289/332
Product-Specific Properties
Version 13.5
• This report can be accessed by going toConversion > Purchases > Revenue.• Traffic Sources breakdowns can be found under Finding Methods .
version 14
• This report can be accessed by going toSite Metrics > Purchases > Revenue.• In addition to all previously listed breakdowns,First and Last Touch Marketing Channel breakdowns are available.
Version 15
• This report can also be accessed by going toSite Metrics > Purchases > Revenue.• In addition to the previously mentioned breakdowns, List variables and the current Video variables can be used.• This report can utilize segments.
Ad Hoc Analysis
• You can break down each item in this report by all other reports and variables, allowing you to see breakdowns by any granularity
that you'd like.• You can use allconversion and traffic metrics alongsideRevenue. You can use different allocation for allconversion metrics.• This report can utilize multiple highly advanced segments.
If this report is not available in the specified location, check with your administrator. They may have changed the default nameor menu structure to better serve your organization's unique needs.
Screen Height Report
Shows the screen height for various mobile devices and the number of views for each screen height. You can also view the ScreenSize report to see both the screen height and width.
Screen Size Report
Groups mobile device hits to your site by the screen size of the device. The report shows each screen size, the number of visitorsto your site that used each screen size, and each screen size as a percentage of the total views. The Screen Size report shows boththe height and width of the screen size as compared to the Screen Height report and Screen Width report.
The reported screen size does not indicate the orientation of the device. Regardless of screen orientation, each device has a fixedscreen resolution in the report. This size is based on research that determines which orientation is more likely. This means youmight see sizes such as 768x1024 and 1024x768 in the same report with each size representing one or more different devices.
Screen Width Report
Shows the screen width for various mobile devices and the number of views for each screen width. You can also view the ScreenSize report to see both the screen height and width.
Search Engines Report
Displays which search engines visitors use for All, Paid, and Natural searches.
289Report Descriptions
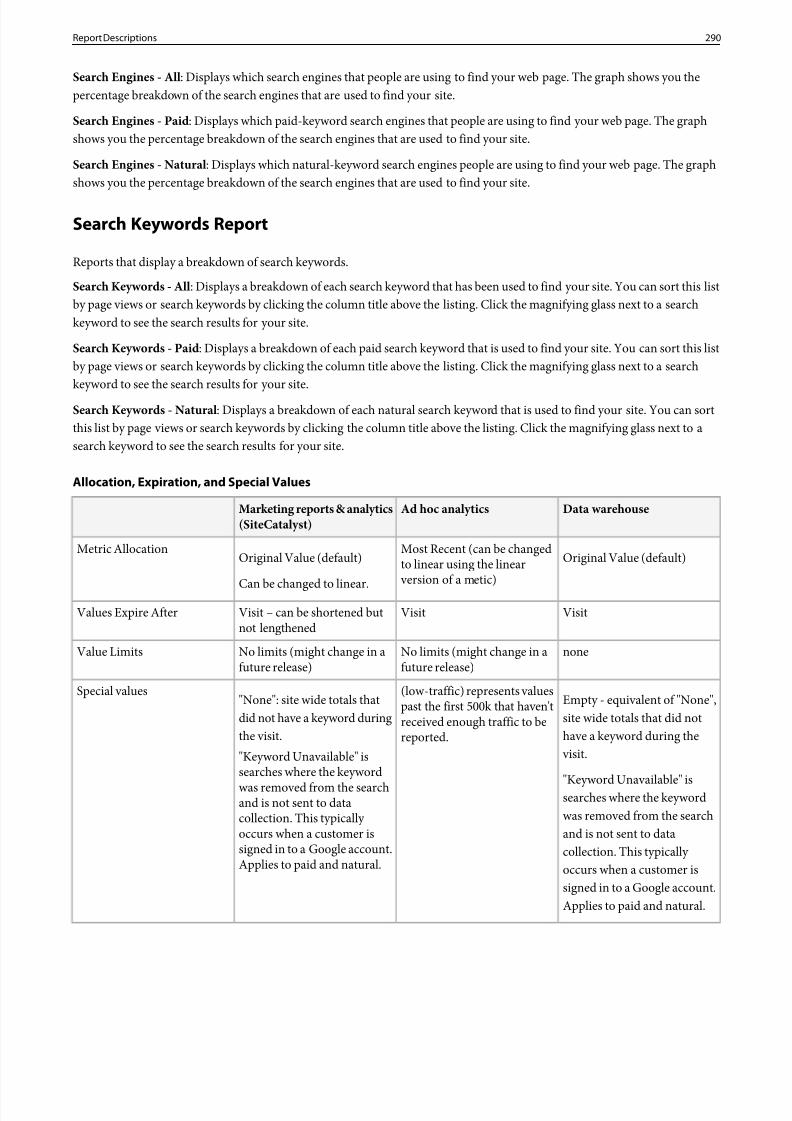
8/18/2019 Analytics Reference Adobe
http://slidepdf.com/reader/full/analytics-reference-adobe 290/332
Search Engines - All: Displays which search engines that people are using to find your web page. The graph shows you thepercentage breakdown of the search engines that are used to find your site.
Search Engines - Paid : Displays which paid-keyword search engines that people are using to find your web page. The graphshows you the percentage breakdown of the search engines that are used to find your site.
Search Engines - Natural : Displays which natural-keyword search engines people are using to find your web page. The graphshows you the percentage breakdown of the search engines that are used to find your site.
Search Keywords Report
Reports that display a breakdown of search keywords.
Search Keywords - All: Displays a breakdown of each search keyword that has been used to find your site. You can sort this listby page views or search keywords by clicking the column title above the listing. Click the magnifying glass next to a searchkeyword to see the search results for your site.
Search Keywords - Paid : Displays a breakdown of each paid search keyword that is used to find your site. You can sort this listby page views or search keywords by clicking the column title above the listing. Click the magnifying glass next to a searchkeyword to see the search results for your site.
Search Keywords - Natural : Displays a breakdown of each natural search keyword that is used to find your site. You can sortthis list by page views or search keywords by clicking the column title above the listing. Click the magnifying glass next to asearch keyword to see the search results for your site.
Allocation, Expiration, and Special Values
Data warehouseAd hoc analyticsMarketing reports & analytics(SiteCatalyst)
Original Value (default)Most Recent (can be changedto linear using the linear version of a metic)
Original Value (default)
Can be changed to linear.
Metric Allocation
VisitVisitVisit – can be shortened butnot lengthened
Values Expire After
noneNo limits (might change in afuture release)
No limits (might change in afuture release)
Value Limits
Empty - equivalent of "None",site wide totals that did not
(low-traffic) represents valuespast the first 500k that haven'treceived enough traffic to bereported.
"None": site wide totals thatdid not have a keyword duringthe visit.
Special values
have a keyword during the visit."Keyword Unavailable" is
searches where the keyword"Keyword Unavailable" issearches where the keywordwas removed from the search
and is not sent to datawas removed from the searchcollection. This typically and is not sent to dataoccurs when a customer is
signed in to a Google account.Applies to paid and natural.
collection. This typically occurs when a customer issigned in to a Google account.Applies to paid and natural.
290Report Descriptions
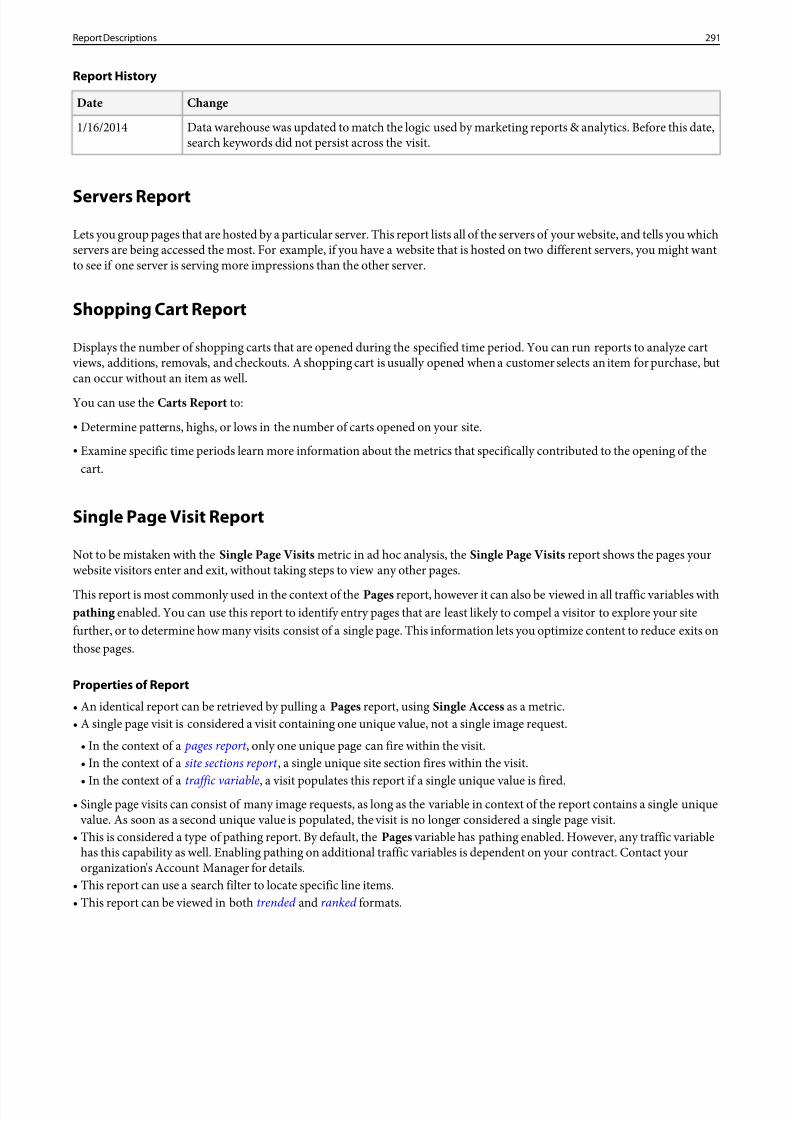
8/18/2019 Analytics Reference Adobe
http://slidepdf.com/reader/full/analytics-reference-adobe 291/332
Report History
ChangeDate
Data warehouse was updated to match the logic used by marketing reports & analytics. Before this date,search keywords did not persist across the visit.
1/16/2014
Servers Report
Lets you group pages that are hosted by a particular server. This report lists all of the servers of your website, and tells you whichservers are being accessed the most. For example, if you have a website that is hosted on two different servers, you might wantto see if one server is serving more impressions than the other server.
Shopping Cart Report
Displays the number of shopping carts that are opened during the specified time period. You can run reports to analyze cart views, additions, removals, and checkouts. A shopping cart is usually opened when a customer selects an item for purchase, butcan occur without an item as well.
You can use the Carts Report to:
• Determine patterns, highs, or lows in the number of carts opened on your site.• Examine specific time periods learn more information about the metrics that specifically contributed to the opening of the
cart.
Single Page Visit Report
Not to be mistaken with the Single Page Visits metric in ad hoc analysis, theSingle Page Visits report shows the pages yourwebsite visitors enter and exit, without taking steps to view any other pages.
This report is most commonly used in the context of the Pages report, however it can also be viewed in all traffic variables withpathing enabled. You can use this report to identify entry pages that are least likely to compel a visitor to explore your sitefurther, or to determine how many visits consist of a single page. This information lets you optimize content to reduce exits onthose pages.
Properties of Report
• An identical report can be retrieved by pulling a Pages report, using Single Access as a metric.• A single page visit is considered a visit containing one unique value, not a single image request.
• In the context of a pages report , only one unique page can fire within the visit.• In the context of a site sections report , a single unique site section fires within the visit.
• In the context of a traffic variable, a visit populates this report if a single unique value is fired.• Single page visits can consist of many image requests, as long as the variable in context of the report contains a single unique value. As soon as a second unique value is populated, the visit is no longer considered a single page visit.
• This is considered a type of pathing report. By default, thePages variable has pathing enabled. However, any traffic variablehas this capability as well. Enabling pathing on additional traffic variables is dependent on your contract. Contact yourorganization's Account Manager for details.
• This report can use a search filter to locate specific line items.• This report can be viewed in both trended and ranked formats.
291Report Descriptions
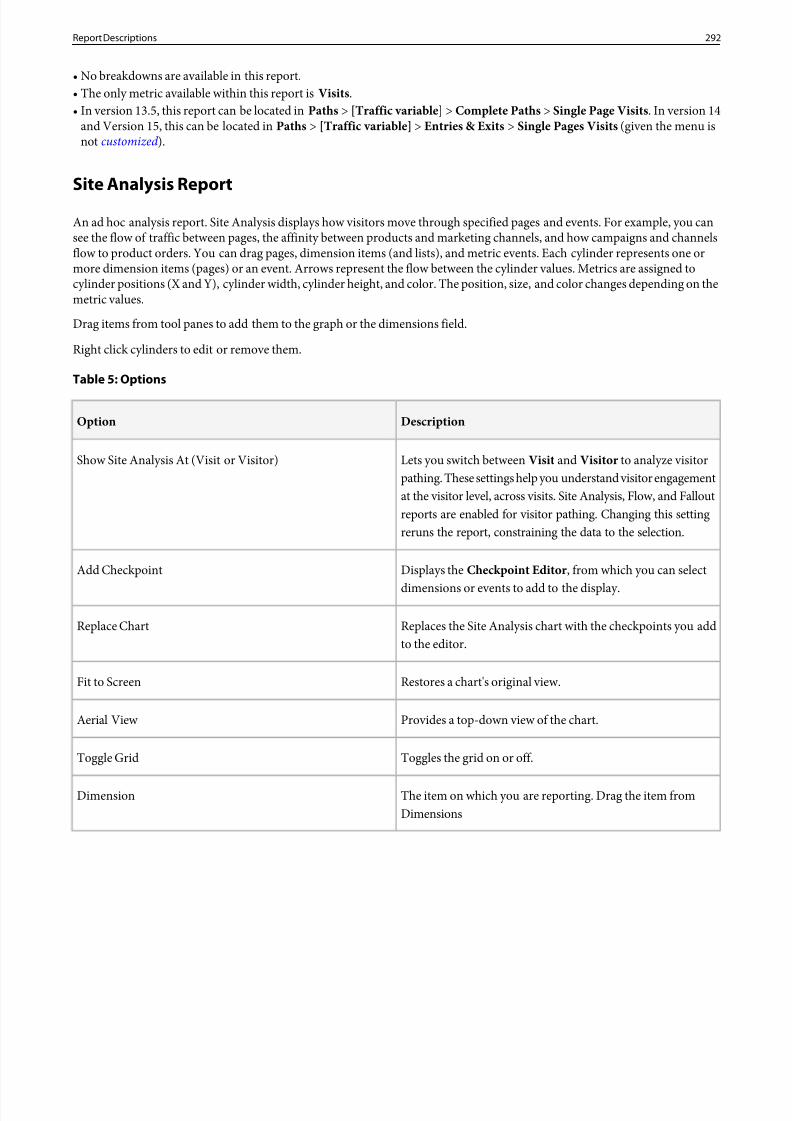
8/18/2019 Analytics Reference Adobe
http://slidepdf.com/reader/full/analytics-reference-adobe 292/332
• No breakdowns are available in this report.• The only metric available within this report is Visits .• In version 13.5, this report can be located in Paths > [Traffic variable] > Complete Paths > Single Page Visits . In version 14
and Version 15, this can be located in Paths > [Traffic variable] > Entries & Exits > Single Pages Visits (given the menu isnot customized ).
Site Analysis Report
An ad hoc analysis report. Site Analysis displays how visitors move through specified pages and events. For example, you cansee the flow of traffic between pages, the affinity between products and marketing channels, and how campaigns and channelsflow to product orders. You can drag pages, dimension items (and lists), and metric events. Each cylinder represents one ormore dimension items (pages) or an event. Arrows represent the flow between the cylinder values. Metrics are assigned tocylinder positions (X and Y), cylinder width, cylinder height, and color. The position, size, and color changes depending on themetric values.
Drag items from tool panes to add them to the graph or the dimensions field.
Right click cylinders to edit or remove them.
Table 5: Options
DescriptionOption
Lets you switch betweenVisit and Visitor to analyze visitorpathing. These settings help you understand visitor engagement
Show Site Analysis At (Visit or Visitor)
at the visitor level, across visits. Site Analysis, Flow, and Falloutreports are enabled for visitor pathing. Changing this settingreruns the report, constraining the data to the selection.
Displays the Checkpoint Editor , from which you can select
dimensions or events to add to the display.
Add Checkpoint
Replaces the Site Analysis chart with the checkpoints you addto the editor.
Replace Chart
Restores a chart's original view.Fit to Screen
Provides a top-down view of the chart.Aerial View
Toggles the grid on or off.Toggle Grid
The item on which you are reporting. Drag the item fromDimensions
Dimension
292Report Descriptions
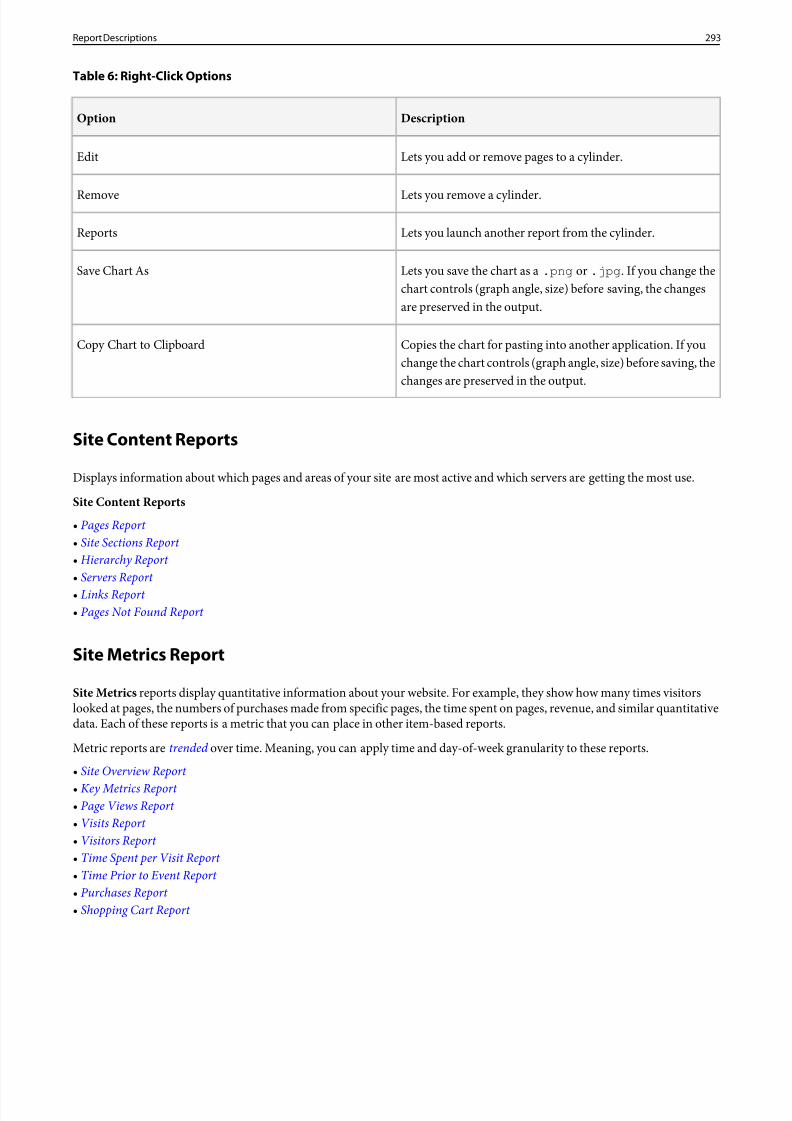
8/18/2019 Analytics Reference Adobe
http://slidepdf.com/reader/full/analytics-reference-adobe 293/332
Table 6: Right-Click Options
DescriptionOption
Lets you add or remove pages to a cylinder.Edit
Lets you remove a cylinder.Remove
Lets you launch another report from the cylinder.Reports
Lets you save the chart as a.png or .jpg . If you change thechart controls (graph angle, size) before saving, the changesare preserved in the output.
Save Chart As
Copies the chart for pasting into another application. If youchange the chart controls (graph angle, size) before saving, thechanges are preserved in the output.
Copy Chart to Clipboard
Site Content Reports
Displays information about which pages and areas of your site are most active and which servers are getting the most use.
Site Content Reports
• Pages Report • Site Sections Report • Hierarchy Report • Servers Report • Links Report • Pages Not Found Report
Site Metrics Report
Site Metrics reports display quantitative information about your website. For example, they show how many times visitorslooked at pages, the numbers of purchases made from specific pages, the time spent on pages, revenue, and similar quantitativedata. Each of these reports is a metric that you can place in other item-based reports.
Metric reports are trended over time. Meaning, you can apply time and day-of-week granularity to these reports.
• Site Overview Report • Key Metrics Report • Page Views Report • Visits Report • Visitors Report • Time Spent per Visit Report • Time Prior to Event Report • Purchases Report • Shopping Cart Report
293Report Descriptions
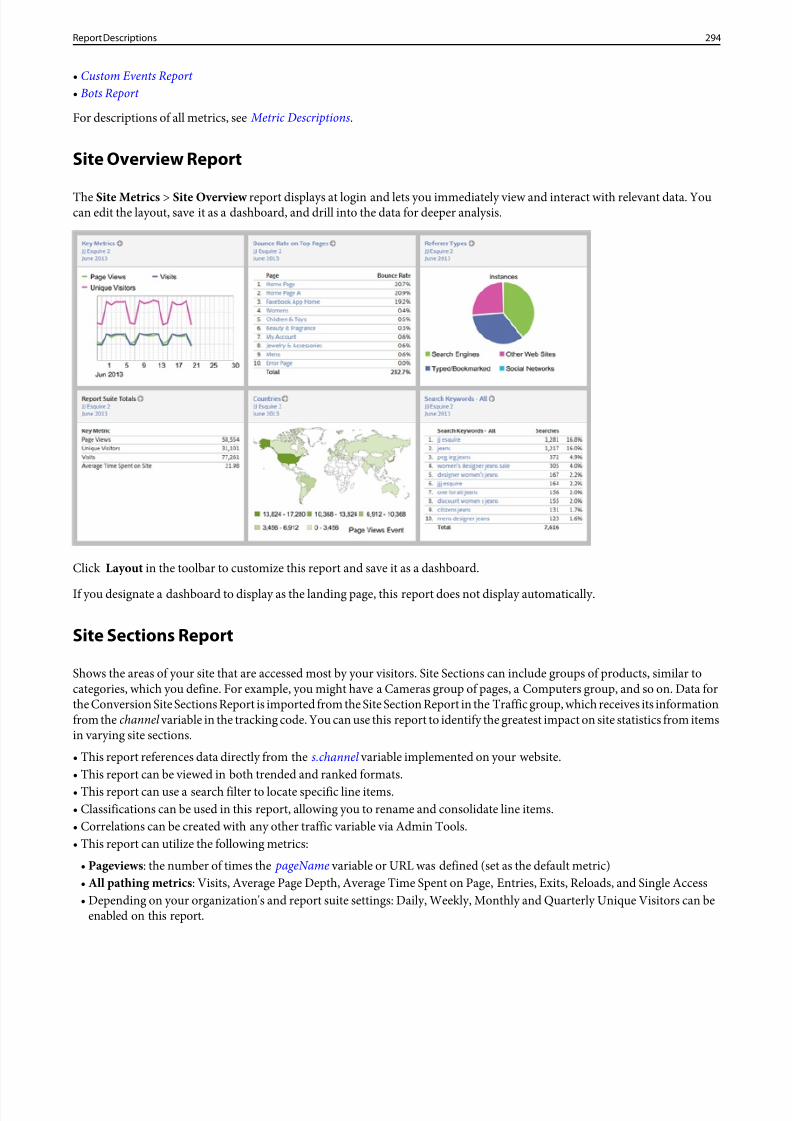
8/18/2019 Analytics Reference Adobe
http://slidepdf.com/reader/full/analytics-reference-adobe 294/332
• Custom Events Report • Bots Report
For descriptions of all metrics, see Metric Descriptions.
Site Overview Report
The Site Metrics > Site Overview report displays at login and lets you immediately view and interact with relevant data. Youcan edit the layout, save it as a dashboard, and drill into the data for deeper analysis.
Click Layout in the toolbar to customize this report and save it as a dashboard.
If you designate a dashboard to display as the landing page, this report does not display automatically.
Site Sections Report
Shows the areas of your site that are accessed most by your visitors. Site Sections can include groups of products, similar tocategories, which you define. For example, you might have a Cameras group of pages, a Computers group, and so on. Data forthe Conversion Site Sections Report is imported from the Site Section Report in the Traffic group, which receives its informationfrom the channel variable in the tracking code. You can use this report to identify the greatest impact on site statistics from itemsin varying site sections.• This report references data directly from the s.channel variable implemented on your website.• This report can be viewed in both trended and ranked formats.• This report can use a search filter to locate specific line items.• Classifications can be used in this report, allowing you to rename and consolidate line items.• Correlations can be created with any other traffic variable via Admin Tools.• This report can utilize the following metrics:
• Pageviews: the number of times the pageName variable or URL was defined (set as the default metric)• All pathing metrics : Visits, Average Page Depth, Average Time Spent on Page, Entries, Exits, Reloads, and Single Access• Depending on your organization's and report suite settings: Daily, Weekly, Monthly and Quarterly Unique Visitors can be
enabled on this report.
294Report Descriptions
8/18/2019 Analytics Reference Adobe
http://slidepdf.com/reader/full/analytics-reference-adobe 295/332
• All standard eCommerce metrics : Revenue, Orders, Units, Carts, Cart Views, Checkouts, Cart Additions, and Cart Removals• All custom events : Events 1-80, and Events 81-100 if on H22 code or higher.
All conversion events in the Site Sections Report use last allocation. You will see conversion divided across pages that do notcontain success events within your implementation. This is different than the Pages Report , which uses linear allocation.
Product Specific Information
DescriptionInterface
Site Content > Site SectionsVersion 15
In addition to correlations, this report can utilize the following breakdowns:
• Any classified reports based on this report•
• Tracking Codes Report• Products and Categories reports• Customer Loyalty Report• Any fully-subrelated conversion variables• Marketing Channels First and Last Touch• Target > Campaigns report (if enabled)• Time Spent per visit• SiteSections• Entry Pages• Most Traffic Sources reports• Visit Number• Many Visitor Profile Reports• All conversion variables and list variables• Visits as well as Daily, Weekly, Monthly, Quarterly, and Arbitrary Unique Visitors are available.•
This report can utilize segments.
Ad hoc analysis • Ad hoc analysis can break down the Site Sections report by essentially all other reports within themarketing report interface.
• In addition to all previously mentioned events, can utilize all conversion and traffic metrics, as wellas use different allocation for all conversion metrics.
• This report can utilize multiple highly advanced segments.
Site Content > Site SectionsVersion 14
In addition to correlations, this report can utilize the following breakdowns:
• Any classified reports based on this report• Tracking Codes Report• Products and Categories reports• Customer Loyalty Report• Any fully-subrelated conversion variables• Marketing Channels First and Last Touch• Target > Campaigns report (if enabled)
295Report Descriptions
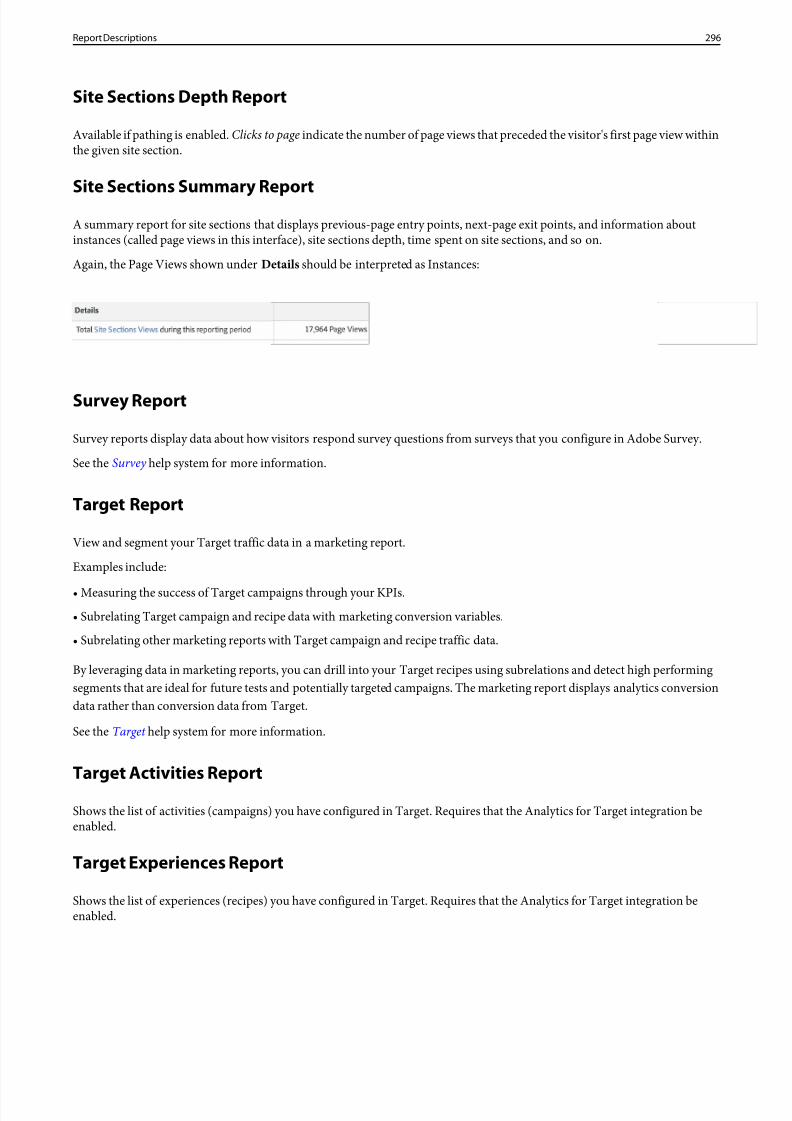
8/18/2019 Analytics Reference Adobe
http://slidepdf.com/reader/full/analytics-reference-adobe 296/332
Site Sections Depth Report
Available if pathing is enabled.Clicks to page indicate the number of page views that preceded the visitor's first page view withinthe given site section.
Site Sections Summary Report
A summary report for site sections that displays previous-page entry points, next-page exit points, and information aboutinstances (called page views in this interface), site sections depth, time spent on site sections, and so on.
Again, the Page Views shown underDetails should be interpreted as Instances:
Survey Report
Survey reports display data about how visitors respond survey questions from surveys that you configure in Adobe Survey.
See the Survey help system for more information.
Target Report
View and segment your Target traffic data in a marketing report.
Examples include:
• Measuring the success of Target campaigns through your KPIs.• Subrelating Target campaign and recipe data with marketing conversion variables.
• Subrelating other marketing reports with Target campaign and recipe traffic data.
By leveraging data in marketing reports, you can drill into your Target recipes using subrelations and detect high performingsegments that are ideal for future tests and potentially targeted campaigns. The marketing report displays analytics conversiondata rather than conversion data from Target.
See the Target help system for more information.
Target Activities Report
Shows the list of activities (campaigns) you have configured in Target. Requires that the Analytics for Target integration beenabled.
Target Experiences Report
Shows the list of experiences (recipes) you have configured in Target. Requires that the Analytics for Target integration beenabled.
296Report Descriptions
8/18/2019 Analytics Reference Adobe
http://slidepdf.com/reader/full/analytics-reference-adobe 297/332
An experience, sometimes called a recipe, defines the content that displays in an mbox in Adobe Target.
Technology Reports
These reports display information about browsers, operating systems, monitor resolutions, and so on, that visitors use.
DescriptionReport
Identifies the types and versions of browsers that visitors use. This data gives you an understandingof your audience's Web sophistication level and can justify optimizing your site for particularbrowser features.
Browsers
You can use this report to design pages to meet your visitors' needs, identify audience preferences,and test pages in popular browsers.
Classifies the browsers visiting your site into their major families, such as Microsoft and Google.Browser Types
For example, aBrowsers Report that shows 100 daily unique visitors using Microsoft Explorer8.0 and 200 using Microsoft Explorer 6.0, would 300 visitors using Microsoft in theBrowser TypesReport .
Displays the most common widths of the browsers (in pixels) your visitors use to view your site.Browser Width
Displays the most common heights of the browsers (in pixels) your visitors use to view your site.Browser Height
Displays the operating systems visitors use.Operating Systems
Displays your visitors’ most popular color-depth settings as configured on their computer.Color-depth refers to the number of colors that can be displayed on the screen.
Monitor Color Depths
Displays the screen resolutions visitors most commonly use, as configured on their computers.Monitor Resolutions
Displays the percentage of visitors that use Java.Java
Displays the percentage of visitors that have JavaScript turned on or off.JavaScript
Displays the versions of JavaScript your visitors’ browsers use while viewing your site.JavaScript Version
Displays the percentage of your visitors that prefer to use cookies while browsing.Cookies
Displays the percentage of visitors that use high-speed Internet connections versus slower dial-upconnections.
Connection Types
This report shows the wireless service provider (Verizon, AT&T, Sprint, and so on) used by siteand app visitors.
Mobile Carrier
297Report Descriptions
8/18/2019 Analytics Reference Adobe
http://slidepdf.com/reader/full/analytics-reference-adobe 298/332
Time Prior to Event Report
Displays the amount of time that passes before a selected conversion event occurs in a visit. You can see the time differencebetween an image request that starts a visit and an image request that fires the specific conversion event. This report is usefulto determine the amount of time people are taking from arriving on your site to hitting a success event, such as a form submissionor placing an order.
In ad hoc analysis, this report is found under Paths > General > Time Prior to Event .
In marketing reports, it is found under Site Metrics > Time Prior to Event .
Time Spent on Page Report
Displays the amount of time visitors spend on the page
SeeTime Spent for metric information for more information.
Time Spent on Site Section Report
Displays the amount of time visitors spend on site sections.
SeeTime Spent - Site Sections Calculation Example for more information.
Time Spent per Visit Report
Displays the amount of time that visitors spend on your entire site during each visit. You can use this report to gauge how longpeople are staying on your site, identify what site content or promotions are engaging visitor interest, and to find out why youhave high traffic but short visits.
Note: SeeTime Spent for metric calculation examples.
General Properties of the Report
• This report is automatically populated based on the timestamp of the first and last image request of a visit.• This report requires at least two image requests per visit in order to populate data. Visits with a single image request are not
included in this report. Meaning, this report will not match the visits report for the same time period.• Only nine line items can be displayed in this report:• Less than 1 minute•
• 1-5 minutes• 5-10 minutes
• 10-30 minutes• 30-60 minutes• 1-2 hours• 2-5 hours• 5-10 hours• 10-15 hours• There cannot be buckets higher than this, because a visit expires after 12 hours of activity.
298Report Descriptions
8/18/2019 Analytics Reference Adobe
http://slidepdf.com/reader/full/analytics-reference-adobe 299/332
• The following metrics can be used in this report (depending on organization and report suite settings):• Visits (Report Specific)•
• All standard eCommerce metrics: Revenue, Orders, Units, Carts, Cart Views, Checkouts, Cart Additions, Cart Removals.• All custom events: Events 1-80, and Events 81-100 if on H22 code or higher
• This report can be viewed in trended and ranked formats.
Product-Specific Properties
Version 13.5
• This report can be accessed by going to
Paths > Pages > Complete Paths > Time Spent per Visit.
• A pie graph is displayed instead of bars when in ranked format.
Version 14
• Site Metrics > Time Spent per Visit (provided the menu is not customized).• This report can be broken down by the following reports when in ranked format:
• Tracking Codes report and classifications•• Products and Categories reports• Customer Loyalty report• All fully-subrelated eVars
Version 15
• This report can also be accessed by going to
Site Metrics | TimeSpentperVisit
.
• Visits (Report Specific) are replaced by Instances.• In addition to all the breakdowns listed in version 14, this report can also be broken down by the following:• Pages and Site Sections, and all associated classifications•
• Entry Pages• Most Traffic Sources reports• Visit Number• Many Visitor Profile Reports• All conversion variables and list variables• Target report• Marketing Channels First and Last Touch
• Visits, Daily Unique Visitors, and Unique Visitors are available as metrics.• This report can utilize segments.
Ad Hoc Analysis
• You can break down the Time Spent per Visit report by essentially all other reports in the marketing report interface.• In addition to all previously mentioned events, you can use all conversion and traffic metrics, as well as different allocation
for all conversion metrics.
299Report Descriptions
8/18/2019 Analytics Reference Adobe
http://slidepdf.com/reader/full/analytics-reference-adobe 300/332
• This report can use multiple highly advanced segments.
Time Zones Report
Displays the time zones from which your visitors are coming. The graph shows a map of the world. If you received visitors froma particular time zone, a colored column appears in that time zone, reflecting the number of visitors you received in the given
time period. All time zones are present in Greenwich Mean Time (GMT), which is the international time standard.This report You can use this report to:
• See what part of the world generates most of your traffic• Know which time zones are giving you the most traffic. This will help you accommodate or customize your content for those
areas
If this report is not available in the default location, please check with your administrator, who may have changed the defaultmenu structure.
How Roll-up Report Suites Display Time Zones
Roll-up report suites roll up data for child report suites with different time zones. The roll-up report suite is set for a single timezone, and transposes the relative corresponding time zones for each child report suite. For example, if the roll-up report suiteshows 7:00 p.m., and three child report suites were included, each set to Eastern Standard Time (EST), Mountain Standard Time(MST), and Pacific Standard Time (PST), the roll-up would show page views that occurred at 7:00 p.m. in the respective timezones.
Top Level Domains Report
Displays how customers from different countries impacted your success metrics. This report identifies world regions that visitorscome from based on their originating domain extension.
The originating domain refers to the domain through which the user is browsing the web (meaning, the ISP), rather than thereferring domain that brought the user to your site. Domains ending in Commercial (.com), Network (.net), Education (.edu),
Government (.gov) and Organization (.org) are usually based in the United States, and are listed separately from the rest of thecountries.
All other countries have specific domain extensions, such as Brazil (.br) and the United Kingdom (.gb). Marketing reportsrecognize all country extensions. You can use this report to help you to tailor content on your site to people from the countriesthat generate the majority of your revenue and to decide if you need to create different instances of your entire site.
Totals Report
An executive-level report that shows bottom-line figures. It contains data for total revenue, page views, and orders. You cansegment the report and add additional metrics to view additional data.
Tracking Codes Report
Measures how various advertising tracking codes affect different conversion events on your site. This report can be used tomeasure what specific campaigns are performing better for different success events, or to see how campaigns are helping orhindering your site's initiatives, such as which campaigns are generating the most revenue.
General Properties
300Report Descriptions
8/18/2019 Analytics Reference Adobe
http://slidepdf.com/reader/full/analytics-reference-adobe 301/332
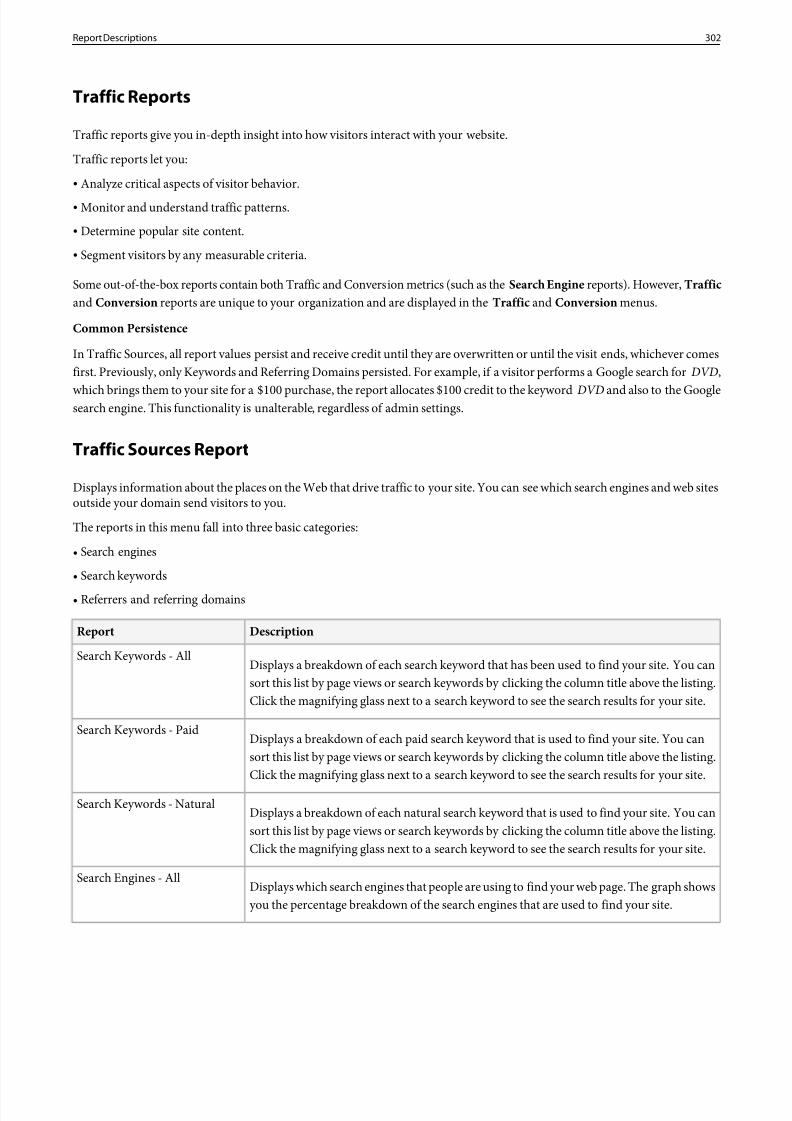
8/18/2019 Analytics Reference Adobe
http://slidepdf.com/reader/full/analytics-reference-adobe 302/332
Traffic Reports
Traffic reports give you in-depth insight into how visitors interact with your website.
Traffic reports let you:
• Analyze critical aspects of visitor behavior.• Monitor and understand traffic patterns.• Determine popular site content.
• Segment visitors by any measurable criteria.
Some out-of-the-box reports contain both Traffic and Conversion metrics (such as the Search Engine reports). However, Trafficand Conversion reports are unique to your organization and are displayed in the Traffic and Conversion menus.
Common Persistence
In Traffic Sources, all report values persist and receive credit until they are overwritten or until the visit ends, whichever comesfirst. Previously, only Keywords and Referring Domains persisted. For example, if a visitor performs a Google search forDVD,
which brings them to your site for a $100 purchase, the report allocates $100 credit to the keywordDVD and also to the Googlesearch engine. This functionality is unalterable, regardless of admin settings.
Traffic Sources Report
Displays information about the places on the Web that drive traffic to your site. You can see which search engines and web sitesoutside your domain send visitors to you.
The reports in this menu fall into three basic categories:
• Search engines
• Search keywords
• Referrers and referring domains
DescriptionReport
Displays a breakdown of each search keyword that has been used to find your site. You cansort this list by page views or search keywords by clicking the column title above the listing.Click the magnifying glass next to a search keyword to see the search results for your site.
Search Keywords - All
Displays a breakdown of each paid search keyword that is used to find your site. You cansort this list by page views or search keywords by clicking the column title above the listing.Click the magnifying glass next to a search keyword to see the search results for your site.
Search Keywords - Paid
Displays a breakdown of each natural search keyword that is used to find your site. You cansort this list by page views or search keywords by clicking the column title above the listing.Click the magnifying glass next to a search keyword to see the search results for your site.
Search Keywords - Natural
Displays which search engines that people are using to find your web page. The graph showsyou the percentage breakdown of the search engines that are used to find your site.
Search Engines - All
302Report Descriptions
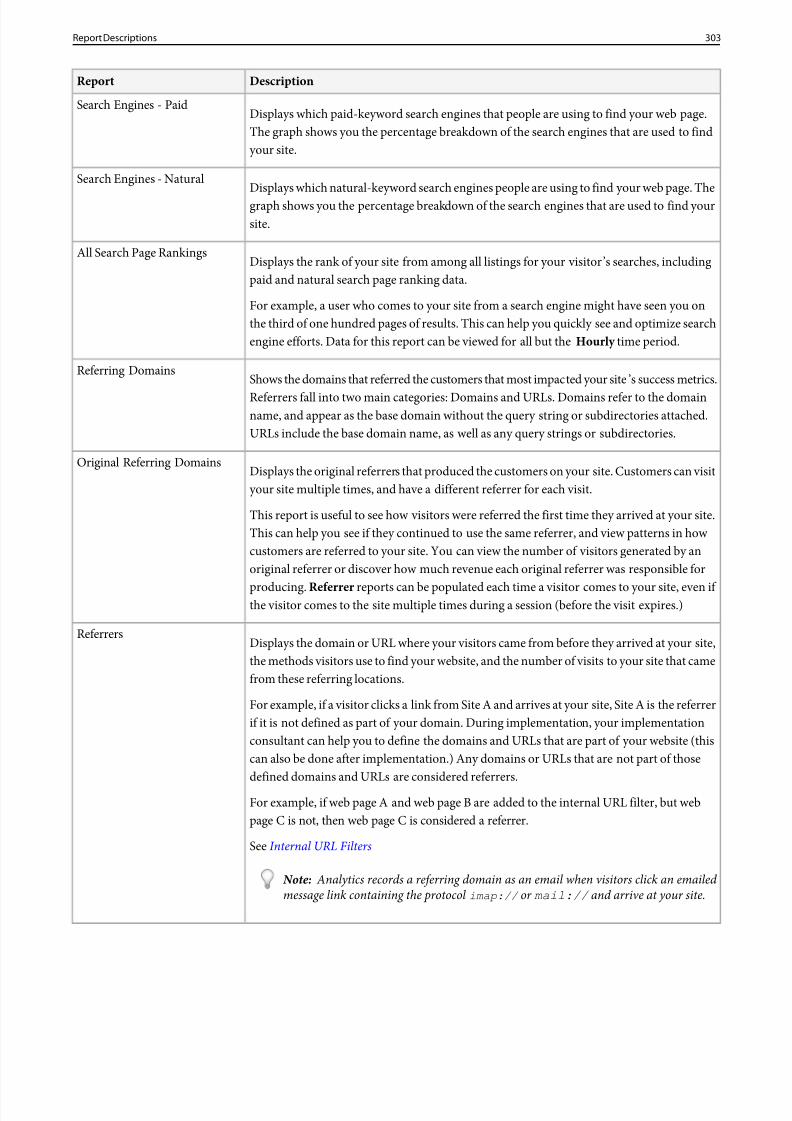
8/18/2019 Analytics Reference Adobe
http://slidepdf.com/reader/full/analytics-reference-adobe 303/332
DescriptionReport
Displays which paid-keyword search engines that people are using to find your web page.The graph shows you the percentage breakdown of the search engines that are used to findyour site.
Search Engines - Paid
Displays which natural-keyword search engines people are using to find your web page. Thegraph shows you the percentage breakdown of the search engines that are used to find yoursite.
Search Engines - Natural
Displays the rank of your site from among all listings for your visitor’s searches, includingpaid and natural search page ranking data.
All Search Page Rankings
For example, a user who comes to your site from a search engine might have seen you onthe third of one hundred pages of results. This can help you quickly see and optimize searchengine efforts. Data for this report can be viewed for all but theHourly time period.
Shows the domains that referred the customers that most impacted your site ’s success metrics.Referrers fall into two main categories: Domains and URLs. Domains refer to the domain
Referring Domains
name, and appear as the base domain without the query string or subdirectories attached.URLs include the base domain name, as well as any query strings or subdirectories.
Displays the original referrers that produced the customers on your site. Customers can visityour site multiple times, and have a different referrer for each visit.
Original Referring Domains
This report is useful to see how visitors were referred the first time they arrived at your site.This can help you see if they continued to use the same referrer, and view patterns in how customers are referred to your site. You can view the number of visitors generated by anoriginal referrer or discover how much revenue each original referrer was responsible for
producing. Referrer reports can be populated each time a visitor comes to your site, even if the visitor comes to the site multiple times during a session (before the visit expires.)
Displays the domain or URL where your visitors came from before they arrived at your site,the methods visitors use to find your website, and the number of visits to your site that camefrom these referring locations.
Referrers
For example, if a visitor clicks a link from Site A and arrives at your site, Site A is the referrerif it is not defined as part of your domain. During implementation, your implementationconsultant can help you to define the domains and URLs that are part of your website (thiscan also be done after implementation.) Any domains or URLs that are not part of thosedefined domains and URLs are considered referrers.
For example, if web page A and web page B are added to the internal URL filter, but webpage C is not, then web page C is considered a referrer.
SeeInternal URL Filters
Note: Analytics records a referring domain as an email when visitors click an emailed message link containing the protocol imap:// or mail:// and arrive at your site.
303Report Descriptions
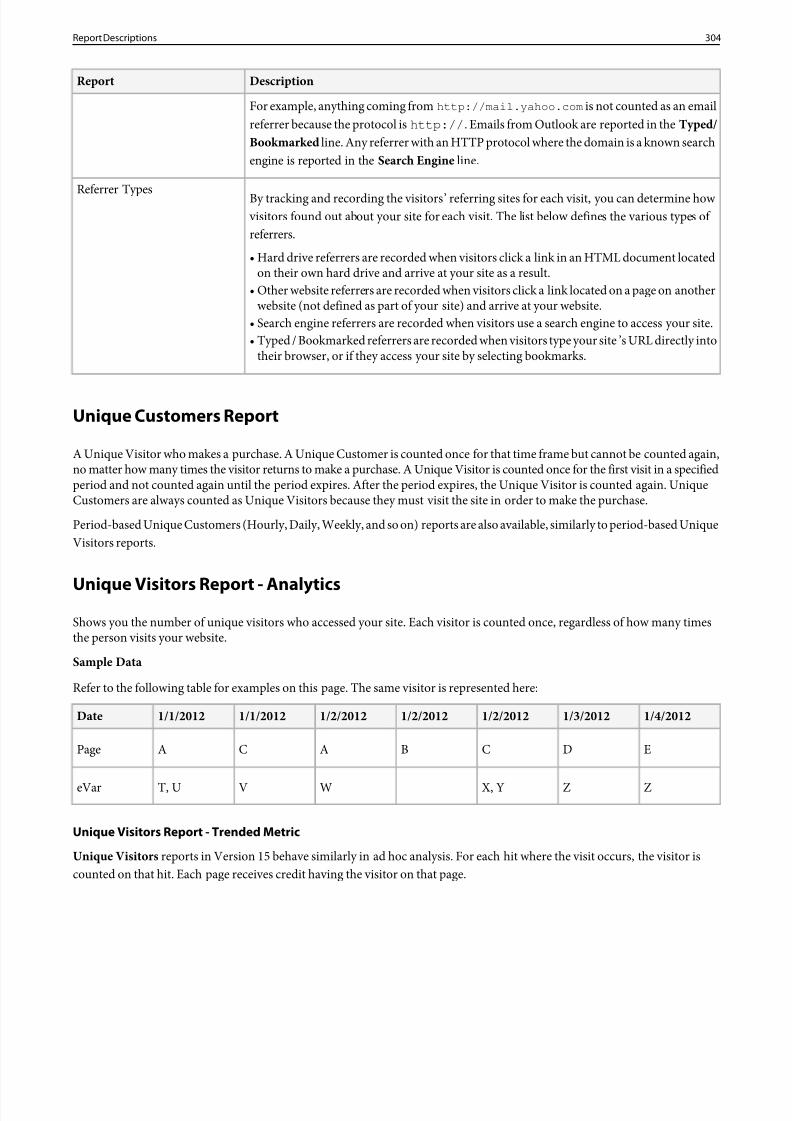
8/18/2019 Analytics Reference Adobe
http://slidepdf.com/reader/full/analytics-reference-adobe 304/332
DescriptionReport
For example, anything coming from http://mail.yahoo.com is not counted as an emailreferrer because the protocol is http:// . Emails from Outlook are reported in the Typed/Bookmarked line. Any referrer with an HTTP protocol where the domain is a known searchengine is reported in the Search Engine line.
By tracking and recording the visitors’ referring sites for each visit, you can determine how visitors found out about your site for each visit. The list below defines the various types of referrers.
Referrer Types
• Hard drive referrers are recorded when visitors click a link in an HTML document locatedon their own hard drive and arrive at your site as a result.
• Other website referrers are recorded when visitors click a link located on a page on anotherwebsite (not defined as part of your site) and arrive at your website.
• Search engine referrers are recorded when visitors use a search engine to access your site.• Typed / Bookmarked referrers are recorded when visitors type your site’s URL directly into
their browser, or if they access your site by selecting bookmarks.
Unique Customers Report
A Unique Visitor who makes a purchase. A Unique Customer is counted once for that time frame but cannot be counted again,no matter how many times the visitor returns to make a purchase. A Unique Visitor is counted once for the first visit in a specifiedperiod and not counted again until the period expires. After the period expires, the Unique Visitor is counted again. UniqueCustomers are always counted as Unique Visitors because they must visit the site in order to make the purchase.
Period-based Unique Customers (Hourly, Daily, Weekly, and so on) reports are also available, similarly to period-based UniqueVisitors reports.
Unique Visitors Report - AnalyticsShows you the number of unique visitors who accessed your site. Each visitor is counted once, regardless of how many timesthe person visits your website.
Sample Data
Refer to the following table for examples on this page. The same visitor is represented here:
1/4/20121/3/20121/2/20121/2/20121/2/20121/1/20121/1/2012Date
EDCBACAPage
ZZX, YWVT, UeVar
Unique Visitors Report - Trended Metric
Unique Visitors reports in Version 15 behave similarly in ad hoc analysis. For each hit where the visit occurs, the visitor iscounted on that hit. Each page receives credit having the visitor on that page.
304Report Descriptions
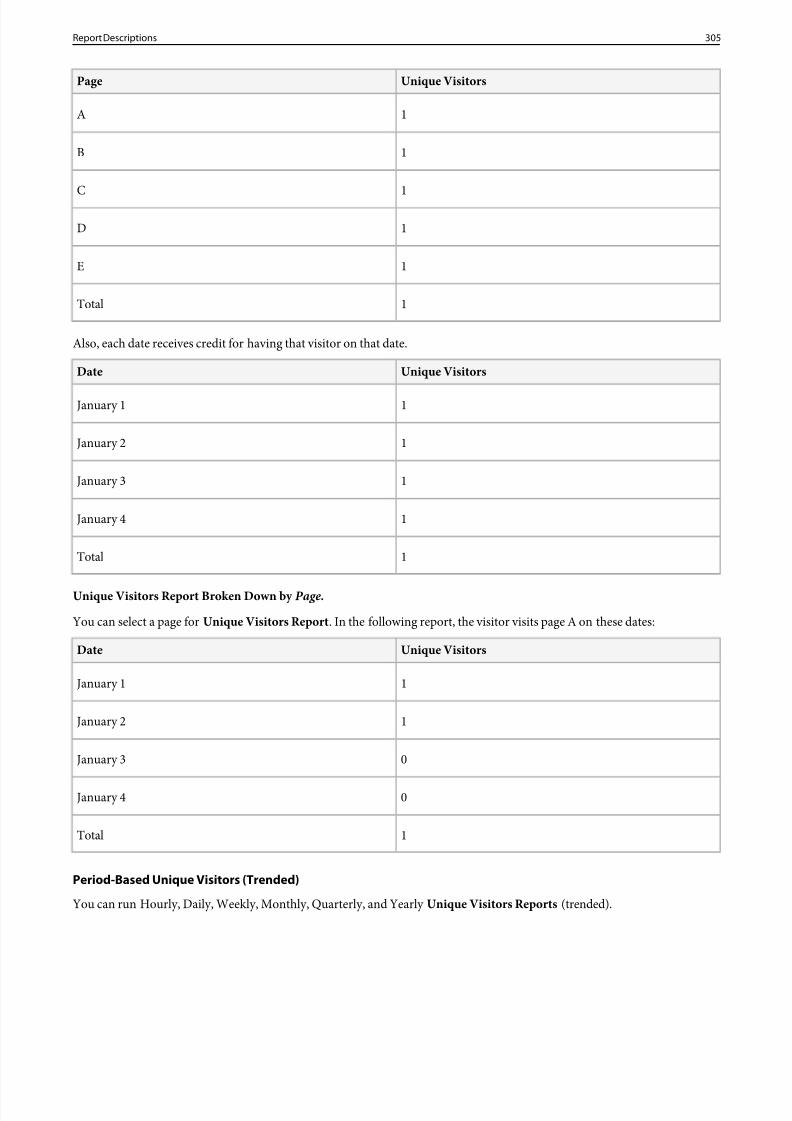
8/18/2019 Analytics Reference Adobe
http://slidepdf.com/reader/full/analytics-reference-adobe 305/332
Unique VisitorsPage
1A
1B
1C
1D
1E
1Total
Also, each date receives credit for having that visitor on that date.
Unique VisitorsDate
1January 1
1January 2
1January 3
1January 4
1Total
Unique Visitors Report Broken Down by Page .
You can select a page forUnique Visitors Report . In the following report, the visitor visits page A on these dates:
Unique VisitorsDate
1January 1
1January 2
0January 3
0January 4
1Total
Period-Based Unique Visitors (Trended)
You can run Hourly, Daily, Weekly, Monthly, Quarterly, and Yearly Unique Visitors Reports (trended).
305Report Descriptions
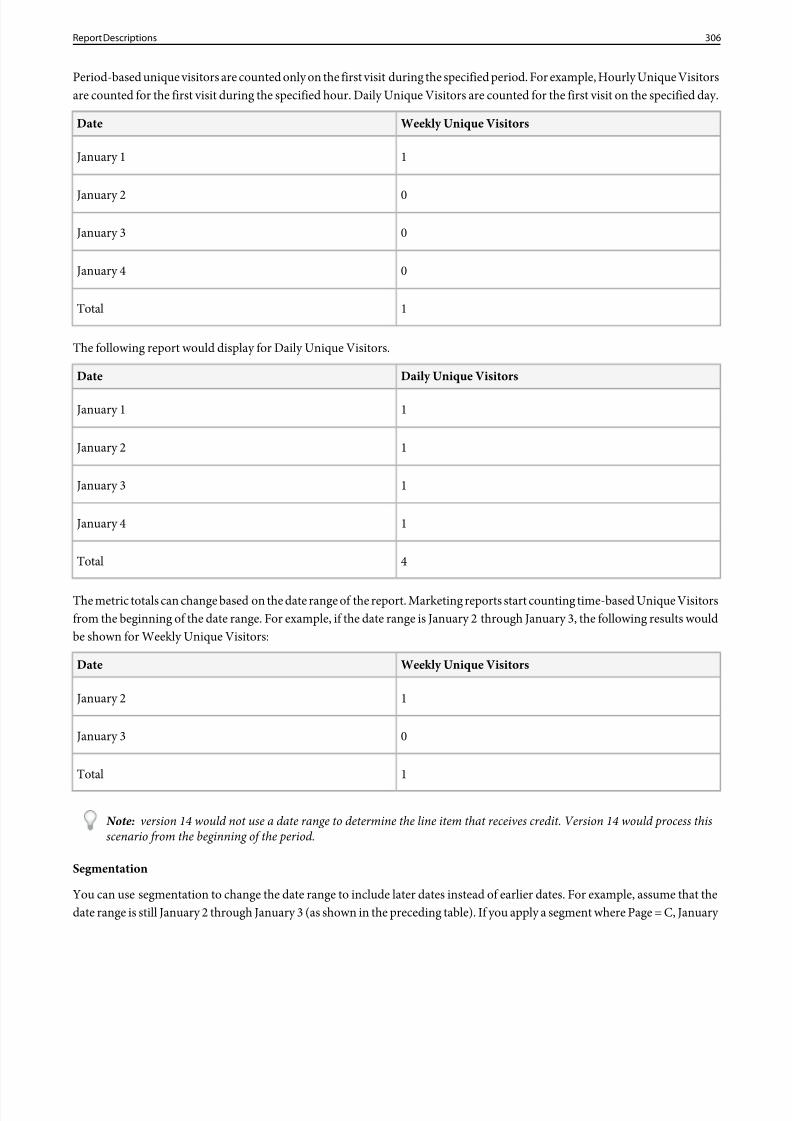
8/18/2019 Analytics Reference Adobe
http://slidepdf.com/reader/full/analytics-reference-adobe 306/332
Period-based unique visitors are counted only on the first visit during the specified period. For example, Hourly Unique Visitorsare counted for the first visit during the specified hour. Daily Unique Visitors are counted for the first visit on the specified day.
Weekly Unique VisitorsDate
1January 1
0January 2
0January 3
0January 4
1Total
The following report would display for Daily Unique Visitors.
Daily Unique VisitorsDate
1January 1
1January 2
1January 3
1January 4
4Total
The metric totals can change based on the date range of the report. Marketing reports start counting time-based Unique Visitorsfrom the beginning of the date range. For example, if the date range is January 2 through January 3, the following results wouldbe shown for Weekly Unique Visitors:
Weekly Unique VisitorsDate
1January 2
0January 3
1Total
Note: version 14 would not use a date range to determine the line item that receives credit. Version 14 would process thisscenario from the beginning of the period.
Segmentation
You can use segmentation to change the date range to include later dates instead of earlier dates. For example, assume that thedate range is still January 2 through January 3 (as shown in the preceding table). If you apply a segment where Page = C, January
306Report Descriptions
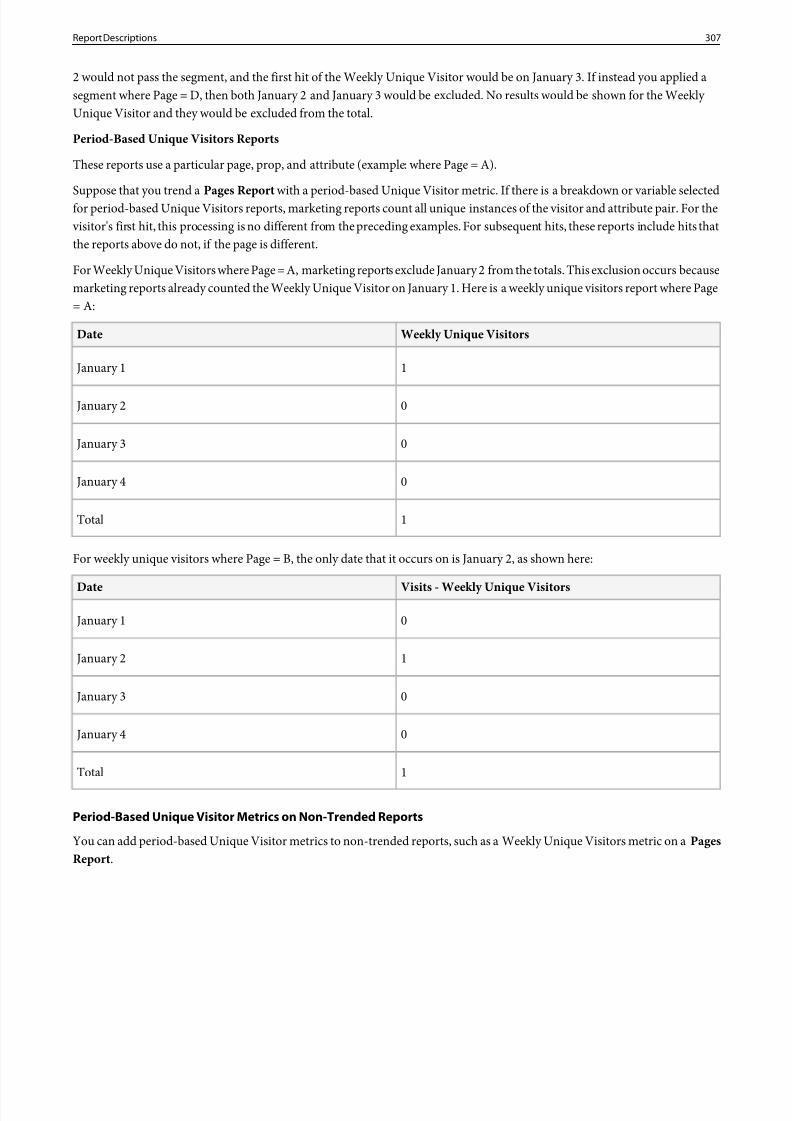
8/18/2019 Analytics Reference Adobe
http://slidepdf.com/reader/full/analytics-reference-adobe 307/332
2 would not pass the segment, and the first hit of the Weekly Unique Visitor would be on January 3. If instead you applied asegment where Page = D, then both January 2 and January 3 would be excluded. No results would be shown for the Weekly Unique Visitor and they would be excluded from the total.
Period-Based Unique Visitors Reports
These reports use a particular page, prop, and attribute (example: where Page = A).
Suppose that you trend a Pages Report with a period-based Unique Visitor metric. If there is a breakdown or variable selectedfor period-based Unique Visitors reports, marketing reports count all unique instances of the visitor and attribute pair. For the visitor's first hit, this processing is no different from the preceding examples. For subsequent hits, these reports include hits thatthe reports above do not, if the page is different.
For Weekly Unique Visitors where Page = A, marketing reports exclude January 2 from the totals. This exclusion occurs becausemarketing reports already counted the Weekly Unique Visitor on January 1. Here is a weekly unique visitors report where Page= A:
Weekly Unique VisitorsDate
1January 1
0January 2
0January 3
0January 4
1Total
For weekly unique visitors where Page = B, the only date that it occurs on is January 2, as shown here:
Visits - Weekly Unique VisitorsDate
0January 1
1January 2
0January 3
0January 4
1Total
Period-Based Unique Visitor Metrics on Non-Trended Reports
You can add period-based Unique Visitor metrics to non-trended reports, such as a Weekly Unique Visitors metric on a PagesReport .
307Report Descriptions
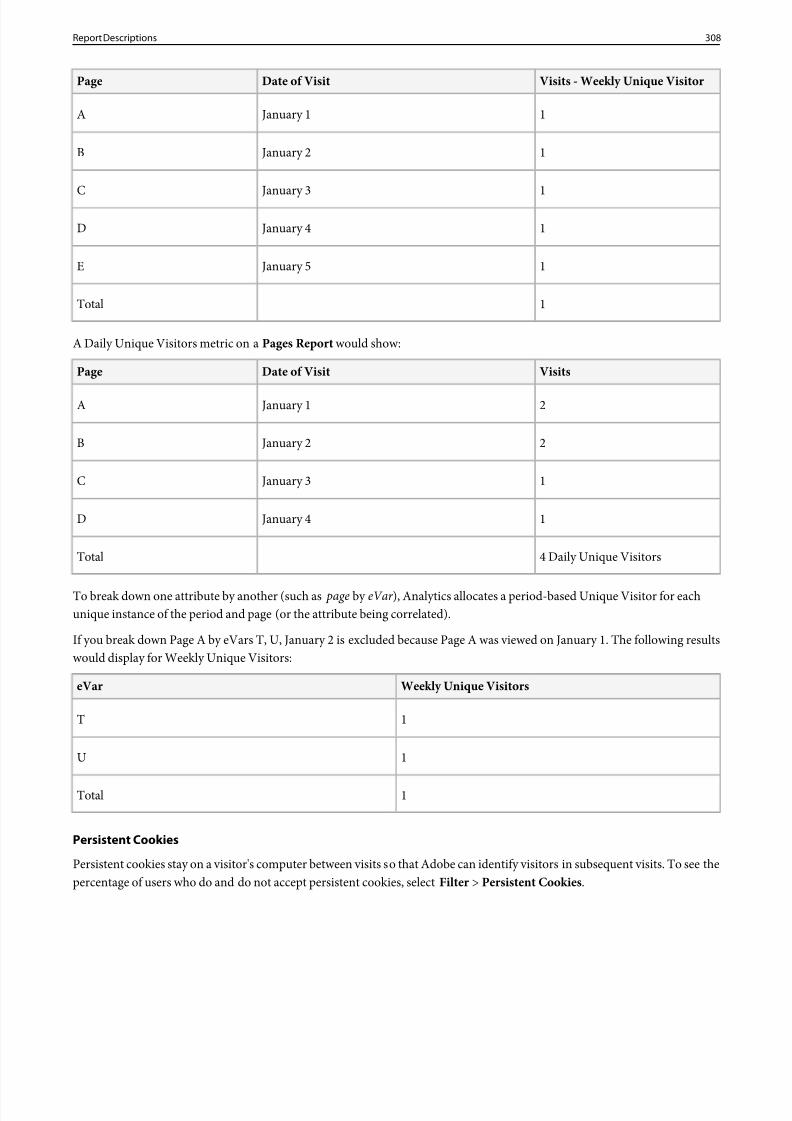
8/18/2019 Analytics Reference Adobe
http://slidepdf.com/reader/full/analytics-reference-adobe 308/332
Visits - Weekly Unique VisitorDate of VisitPage
1January 1A
1January 2B
1January 3C
1January 4D
1January 5E
1Total
A Daily Unique Visitors metric on a Pages Report would show:
VisitsDate of VisitPage
2January 1A
2January 2B
1January 3C
1January 4D
4 Daily Unique VisitorsTotal
To break down one attribute by another (such as page by eVar ), Analytics allocates a period-based Unique Visitor for eachunique instance of the period and page (or the attribute being correlated).
If you break down Page A by eVars T, U, January 2 is excluded because Page A was viewed on January 1. The following resultswould display for Weekly Unique Visitors:
Weekly Unique VisitorseVar
1T
1U
1Total
Persistent Cookies
Persistent cookies stay on a visitor's computer between visits so that Adobe can identify visitors in subsequent visits. To see thepercentage of users who do and do not accept persistent cookies, selectFilter > Persistent Cookies .
308Report Descriptions
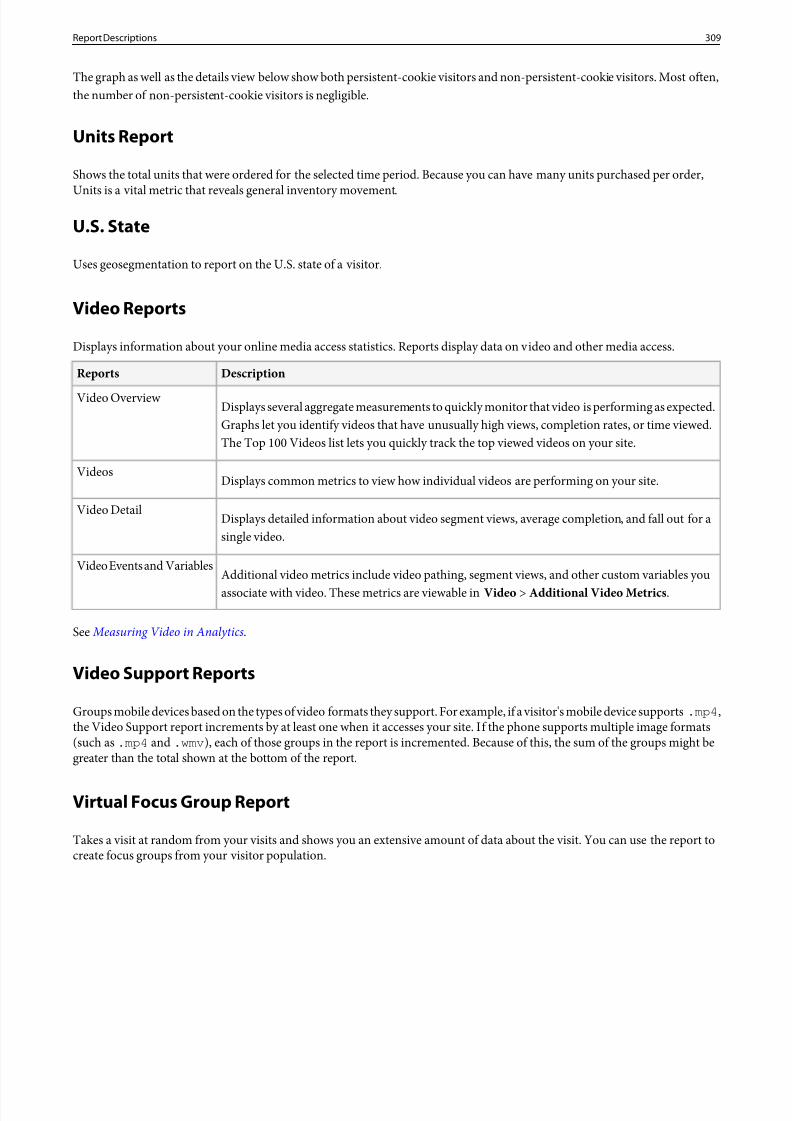
8/18/2019 Analytics Reference Adobe
http://slidepdf.com/reader/full/analytics-reference-adobe 309/332
The graph as well as the details view below show both persistent-cookie visitors and non-persistent-cookie visitors. Most often,the number of non-persistent-cookie visitors is negligible.
Units Report
Shows the total units that were ordered for the selected time period. Because you can have many units purchased per order,
Units is a vital metric that reveals general inventory movement.
U.S. State
Uses geosegmentation to report on the U.S. state of a visitor.
Video Reports
Displays information about your online media access statistics. Reports display data on video and other media access.
DescriptionReports
Displays several aggregate measurements to quickly monitor that video is performing as expected.Graphs let you identify videos that have unusually high views, completion rates, or time viewed.The Top 100 Videos list lets you quickly track the top viewed videos on your site.
Video Overview
Displays common metrics to view how individual videos are performing on your site.Videos
Displays detailed information about video segment views, average completion, and fall out for asingle video.
Video Detail
Additional video metrics include video pathing, segment views, and other custom variables youassociate with video. These metrics are viewable inVideo > Additional Video Metrics .
Video Events and Variables
See Measuring Video in Analytics.
Video Support Reports
Groups mobile devices based on the types of video formats they support. For example, if a visitor's mobile device supports.mp4 ,the Video Support report increments by at least one when it accesses your site. If the phone supports multiple image formats(such as .mp4 and .wmv ), each of those groups in the report is incremented. Because of this, the sum of the groups might begreater than the total shown at the bottom of the report.
Virtual Focus Group Report
Takes a visit at random from your visits and shows you an extensive amount of data about the visit. You can use the report tocreate focus groups from your visitor population.
309Report Descriptions
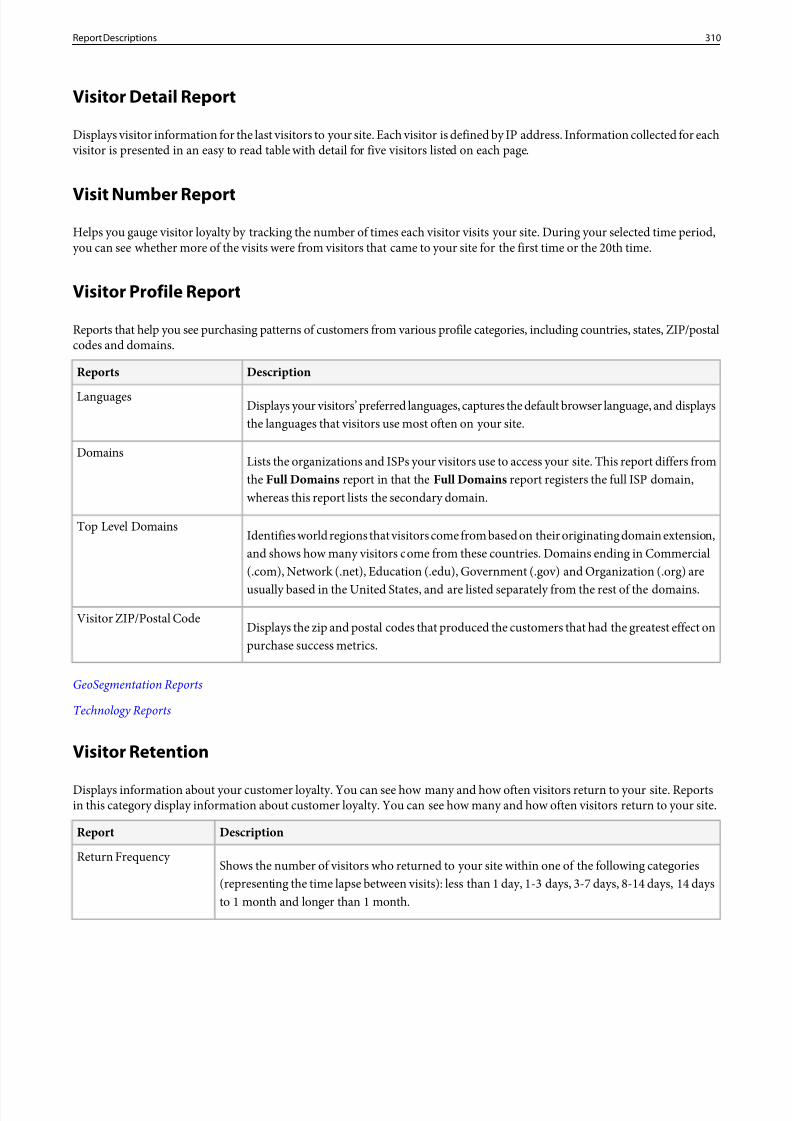
8/18/2019 Analytics Reference Adobe
http://slidepdf.com/reader/full/analytics-reference-adobe 310/332
Visitor Detail Report
Displays visitor information for the last visitors to your site. Each visitor is defined by IP address. Information collected for each visitor is presented in an easy to read table with detail for five visitors listed on each page.
Visit Number ReportHelps you gauge visitor loyalty by tracking the number of times each visitor visits your site. During your selected time period,you can see whether more of the visits were from visitors that came to your site for the first time or the 20th time.
Visitor Profile Report
Reports that help you see purchasing patterns of customers from various profile categories, including countries, states, ZIP/postalcodes and domains.
DescriptionReports
Displays your visitors’ preferred languages, captures the default browser language, and displaysthe languages that visitors use most often on your site.
Languages
Lists the organizations and ISPs your visitors use to access your site. This report differs fromthe Full Domains report in that the Full Domains report registers the full ISP domain,whereas this report lists the secondary domain.
Domains
Identifies world regions that visitors come from based on their originating domain extension,and shows how many visitors come from these countries. Domains ending in Commercial
Top Level Domains
(.com), Network (.net), Education (.edu), Government (.gov) and Organization (.org) are
usually based in the United States, and are listed separately from the rest of the domains.
Displays the zip and postal codes that produced the customers that had the greatest effect onpurchase success metrics.
Visitor ZIP/Postal Code
GeoSegmentation Reports
Technology Reports
Visitor Retention
Displays information about your customer loyalty. You can see how many and how often visitors return to your site. Reportsin this category display information about customer loyalty. You can see how many and how often visitors return to your site.
DescriptionReport
Shows the number of visitors who returned to your site within one of the following categories(representing the time lapse between visits): less than 1 day, 1-3 days, 3-7 days, 8-14 days, 14 daysto 1 month and longer than 1 month.
Return Frequency
310Report Descriptions
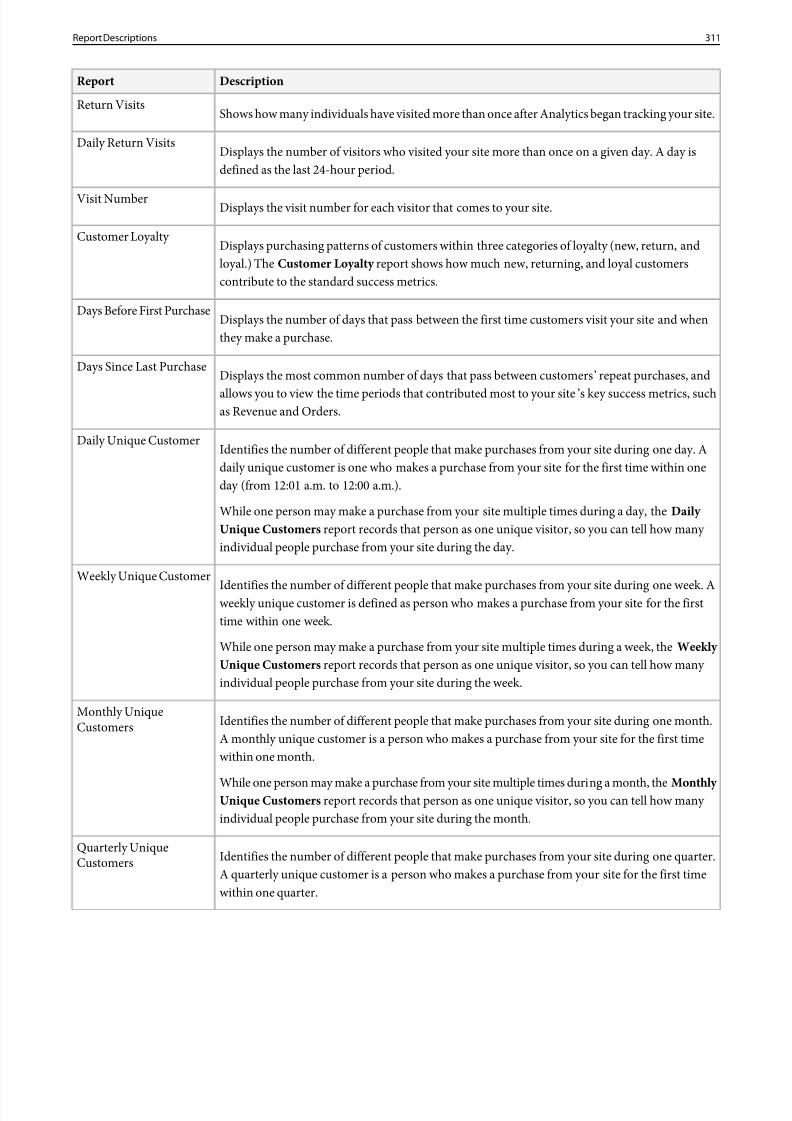
8/18/2019 Analytics Reference Adobe
http://slidepdf.com/reader/full/analytics-reference-adobe 311/332
DescriptionReport
Shows how many individuals have visited more than once after Analytics began tracking your site.Return Visits
Displays the number of visitors who visited your site more than once on a given day. A day isdefined as the last 24-hour period.
Daily Return Visits
Displays the visit number for each visitor that comes to your site.Visit Number
Displays purchasing patterns of customers within three categories of loyalty (new, return, andloyal.) TheCustomer Loyalty report shows how much new, returning, and loyal customerscontribute to the standard success metrics.
Customer Loyalty
Displays the number of days that pass between the first time customers visit your site and whenthey make a purchase.
Days Before First Purchase
Displays the most common number of days that pass between customers’ repeat purchases, and
allows you to view the time periods that contributed most to your site’s key success metrics, suchas Revenue and Orders.
Days Since Last Purchase
Identifies the number of different people that make purchases from your site during one day. Adaily unique customer is one who makes a purchase from your site for the first time within oneday (from 12:01 a.m. to 12:00 a.m.).
Daily Unique Customer
While one person may make a purchase from your site multiple times during a day, the Daily Unique Customers report records that person as one unique visitor, so you can tell how many individual people purchase from your site during the day.
Identifies the number of different people that make purchases from your site during one week. Aweekly unique customer is defined as person who makes a purchase from your site for the firsttime within one week.
Weekly Unique Customer
While one person may make a purchase from your site multiple times during a week, theWeekly Unique Customers report records that person as one unique visitor, so you can tell how many individual people purchase from your site during the week.
Identifies the number of different people that make purchases from your site during one month.A monthly unique customer is a person who makes a purchase from your site for the first timewithin one month.
Monthly UniqueCustomers
While one person may make a purchase from your site multiple times during a month, the Monthly Unique Customers report records that person as one unique visitor, so you can tell how many individual people purchase from your site during the month.
Identifies the number of different people that make purchases from your site during one quarter.A quarterly unique customer is a person who makes a purchase from your site for the first timewithin one quarter.
Quarterly UniqueCustomers
311Report Descriptions
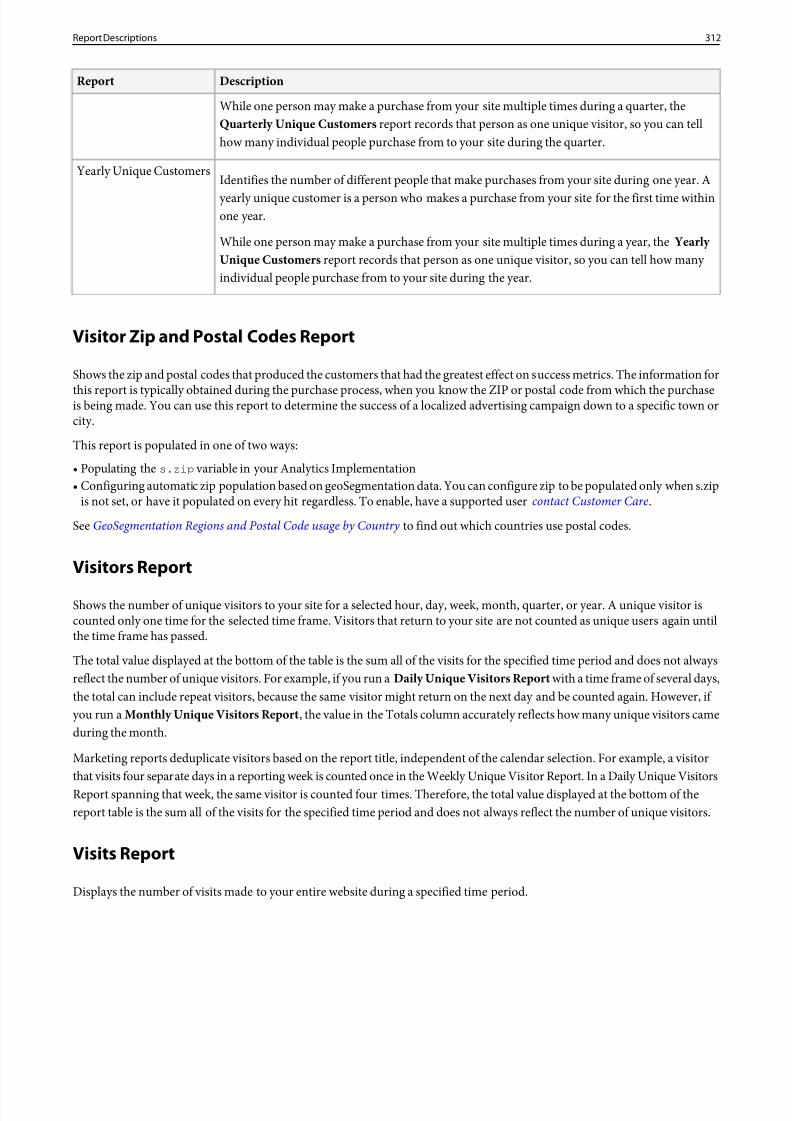
8/18/2019 Analytics Reference Adobe
http://slidepdf.com/reader/full/analytics-reference-adobe 312/332
DescriptionReport
While one person may make a purchase from your site multiple times during a quarter, theQuarterly Unique Customers report records that person as one unique visitor, so you can tellhow many individual people purchase from to your site during the quarter.
Identifies the number of different people that make purchases from your site during one year. A
yearly unique customer is a person who makes a purchase from your site for the first time withinone year.
Yearly Unique Customers
While one person may make a purchase from your site multiple times during a year, the Yearly Unique Customers report records that person as one unique visitor, so you can tell how many individual people purchase from to your site during the year.
Visitor Zip and Postal Codes Report
Shows the zip and postal codes that produced the customers that had the greatest effect on success metrics. The information for
this report is typically obtained during the purchase process, when you know the ZIP or postal code from which the purchaseis being made. You can use this report to determine the success of a localized advertising campaign down to a specific town orcity.
This report is populated in one of two ways:
• Populating the s.zip variable in your Analytics Implementation• Configuring automatic zip population based on geoSegmentation data. You can configure zip to be populated only when s.zip
is not set, or have it populated on every hit regardless. To enable, have a supported usercontact Customer Care .
SeeGeoSegmentation Regions and Postal Code usage by Country to find out which countries use postal codes.
Visitors Report
Shows the number of unique visitors to your site for a selected hour, day, week, month, quarter, or year. A unique visitor iscounted only one time for the selected time frame. Visitors that return to your site are not counted as unique users again untilthe time frame has passed.
The total value displayed at the bottom of the table is the sum all of the visits for the specified time period and does not alwaysreflect the number of unique visitors. For example, if you run aDaily Unique Visitors Report with a time frame of several days,the total can include repeat visitors, because the same visitor might return on the next day and be counted again. However, if you run a Monthly Unique Visitors Report , the value in the Totals column accurately reflects how many unique visitors cameduring the month.
Marketing reports deduplicate visitors based on the report title, independent of the calendar selection. For example, a visitorthat visits four separate days in a reporting week is counted once in the Weekly Unique Visitor Report. In a Daily Unique VisitorsReport spanning that week, the same visitor is counted four times. Therefore, the total value displayed at the bottom of thereport table is the sum all of the visits for the specified time period and does not always reflect the number of unique visitors.
Visits Report
Displays the number of visits made to your entire website during a specified time period.
312Report Descriptions
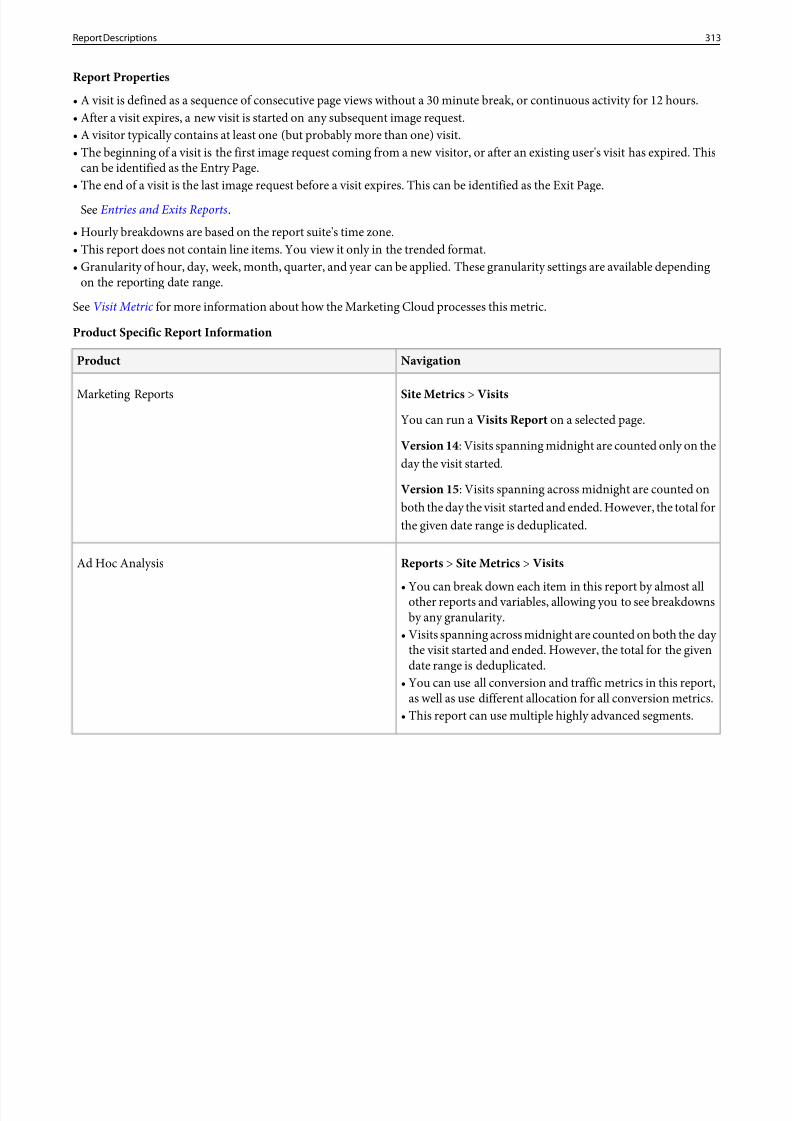
8/18/2019 Analytics Reference Adobe
http://slidepdf.com/reader/full/analytics-reference-adobe 313/332
Report Properties
• A visit is defined as a sequence of consecutive page views without a 30 minute break, or continuous activity for 12 hours.• After a visit expires, a new visit is started on any subsequent image request.• A visitor typically contains at least one (but probably more than one) visit.• The beginning of a visit is the first image request coming from a new visitor, or after an existing user's visit has expired. This
can be identified as the Entry Page.• The end of a visit is the last image request before a visit expires. This can be identified as the Exit Page.
SeeEntries and Exits Reports.• Hourly breakdowns are based on the report suite's time zone.• This report does not contain line items. You view it only in the trended format.• Granularity of hour, day, week, month, quarter, and year can be applied. These granularity settings are available depending
on the reporting date range.
SeeVisit Metric for more information about how the Marketing Cloud processes this metric.
Product Specific Report Information
NavigationProduct
Site Metrics > VisitsMarketing Reports
You can run a Visits Report on a selected page.
Version 14 : Visits spanning midnight are counted only on theday the visit started.
Version 15 : Visits spanning across midnight are counted onboth the day the visit started and ended. However, the total forthe given date range is deduplicated.
Reports > Site Metrics > VisitsAd Hoc Analysis
• You can break down each item in this report by almost allother reports and variables, allowing you to see breakdownsby any granularity.
• Visits spanning across midnight are counted on both the day the visit started and ended. However, the total for the givendate range is deduplicated.
• You can use all conversion and traffic metrics in this report,as well as use different allocation for all conversion metrics.
• This report can use multiple highly advanced segments.
313Report Descriptions
8/18/2019 Analytics Reference Adobe
http://slidepdf.com/reader/full/analytics-reference-adobe 314/332
Terms Used in AnalyticsDefinitions of the terms used in the Marketing Cloud.
Acquisition
The attraction, enticement, gain, or addition of new visitors to your web site. You can create a calculated metric to determinethe cost required to acquire each new visitor.
Activity
Marketing activity as part of a campaign. In Adobe Target, activity is your means of controlling what content to show to whom,and when to show it.
Allocation
Conversion variables (eVars) allow Adobe Analytics to attribute success events to specific variable values. Sometimes, variables
encounter more than one value before hitting a success event. For these cases, allocation determines which variable value getscredit for the event.• Original Value (First) : The first value seen gets full credit, no matter what subsequent values for that variable are.• Most Recent (Last) : The last seen value gets full credit for the success event, no matter what variables were fired before it.• Linear : All variable values within the visit of the success event receive equal divided credit. If the success event was a currency
amount, the currency is split. If it is a counter event, each conversion variable value receives a fraction of the single instance.These fractions are summed then rounded in reporting.
Allocation in Ad Hoc Analysis
Ad Hoc Analysis has the unique ability to report different allocations for conversion variables: the default allocation, lastallocation, and linear allocation. If Ad Hoc Analysis is your organization's primary reporting tool, having all conversion variables
set to first allocation gives you all available allocation values.
Allocation in Data Warehouse
Data Warehouse uses the same allocation settings as reports & analytics.
Anomaly
An anomaly is detected using statistical modeling to automatically find unexpected trends in your data. The model analyzesmetrics and determines a lower bound, upper bound, and expected range of values. When an unexpected spike or drop occurs,the system alerts you to the anomaly in the report.
Calculated Metric
Calculated metrics enable you to combine metrics to create mathematical operations that are used as new metrics. These metricscan be created for a report to which you add metrics. Administrators can create calculated metrics for all users of a report suite.
For example, you can create a metric that subtracts the Keyword Cost and the Cost of Goods from Revenue. This calculatedmetric lets you see the net revenue. You could then divide this value by Total Orders to see the average net revenue per order.
314 Terms Used in Analytics
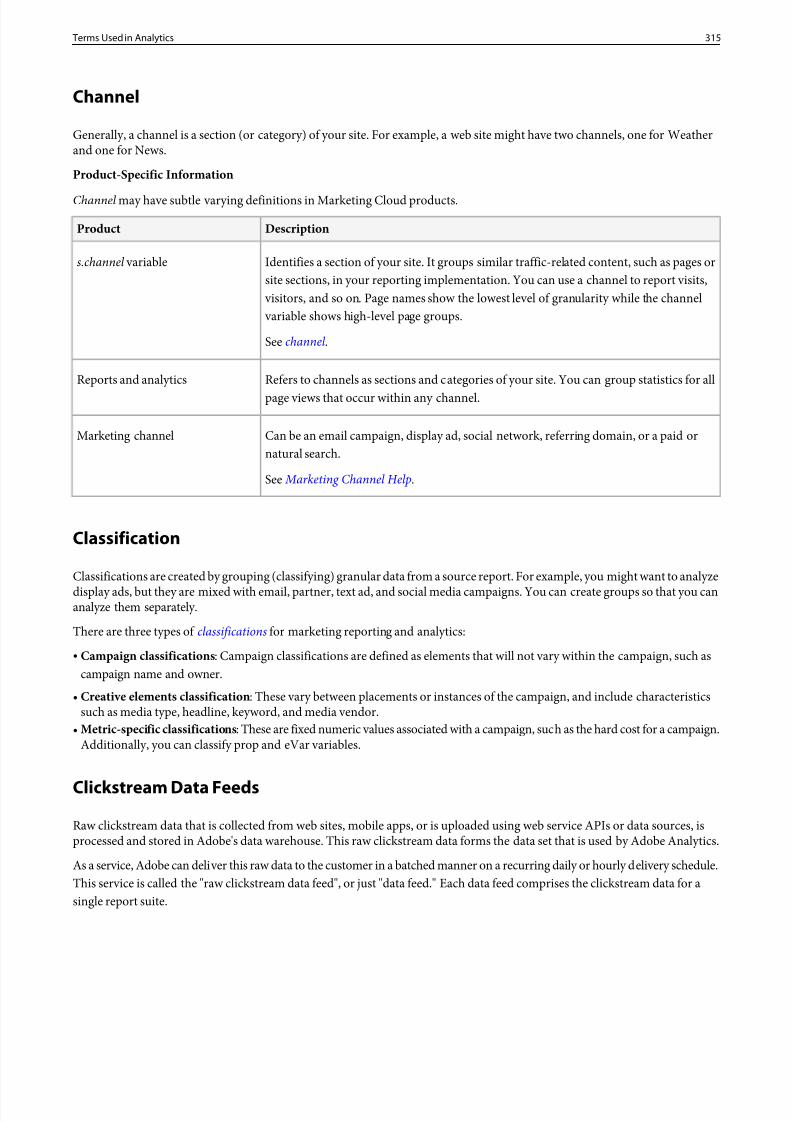
8/18/2019 Analytics Reference Adobe
http://slidepdf.com/reader/full/analytics-reference-adobe 315/332
Channel
Generally, a channel is a section (or category) of your site. For example, a web site might have two channels, one for Weatherand one for News.
Product-Specific Information
Channel may have subtle varying definitions in Marketing Cloud products.
DescriptionProduct
Identifies a section of your site. It groups similar traffic-related content, such as pages orsite sections, in your reporting implementation. You can use a channel to report visits,
s.channel variable
visitors, and so on. Page names show the lowest level of granularity while the channel variable shows high-level page groups.
Seechannel .
Refers to channels as sections and categories of your site. You can group statistics for allpage views that occur within any channel.
Reports and analytics
Can be an email campaign, display ad, social network, referring domain, or a paid ornatural search.
Marketing channel
See Marketing Channel Help .
Classification
Classifications are created by grouping (classifying) granular data from a source report. For example, you might want to analyzedisplay ads, but they are mixed with email, partner, text ad, and social media campaigns. You can create groups so that you cananalyze them separately.
There are three types of classifications for marketing reporting and analytics:
• Campaign classifications : Campaign classifications are defined as elements that will not vary within the campaign, such ascampaign name and owner.
• Creative elements classification : These vary between placements or instances of the campaign, and include characteristicssuch as media type, headline, keyword, and media vendor.
• Metric-specific classifications : These are fixed numeric values associated with a campaign, such as the hard cost for a campaign.Additionally, you can classify prop and eVar variables.
Clickstream Data Feeds
Raw clickstream data that is collected from web sites, mobile apps, or is uploaded using web service APIs or data sources, isprocessed and stored in Adobe's data warehouse. This raw clickstream data forms the data set that is used by Adobe Analytics.
As a service, Adobe can deliver this raw data to the customer in a batched manner on a recurring daily or hourly delivery schedule.This service is called the "raw clickstream data feed", or just "data feed." Each data feed comprises the clickstream data for asingle report suite.
315 Terms Used in Analytics
8/18/2019 Analytics Reference Adobe
http://slidepdf.com/reader/full/analytics-reference-adobe 316/332
Conversion Variable (eVar)
The Custom Insight Conversion Variable (eVar) is placed in the Adobe code on selected web pages of your site. Its primary purpose is to segment conversion success metrics in custom marketing reports. eVar variables can be visit-based and can functionsimilarly to cookies on the site. Values passed into eVar variables follow the user for a predetermined period of time, based onconfigurations made on the Settings tab.
Count Repeat Instances
Specifies in ad hoc analysis whether instances are counted in reports. Meaning, if you have multiple sequential values for thesame variable you can count them either as one or multiple instances of the variable.
For example, you might see repeat page reloads, which are the number of times that pages on your website are reloaded orrefreshed during a single visit. This option lets you specify whether multiple hits on the same page are counted as one, or asmultiple page views.
The metric Single Page Visits is equivalent to both Single Access AND Bounces in Reports & Analytics, depending on whetherCount Repeat Instances is set to Yes or No.
SeeSettings Tab - Descriptions in Ad Hoc Analysis Help.
Correlation
The relationship between two Traffic reports in a report suite. You can run correlation reports by breaking down report data.For example, you can run a correlation breakdown report that shows visitor age group correlated with the type of search enginethe visitors use.
Correlations are particularly useful for understanding the relationships between two or more Traffic Custom Insight variables,or other system variables. Correlations come in three sizes (2, 5, and 20), based on the number of items that are correlatedtogether at the same time.
Marketing reports: see Breakdown Reports.
Ad hoc: seeBreak Down Table Data .
CPM
Cost per Thousand. Pertains to instances in which the code on the client ’s web page generates a server call to Adobe, for example,an image request.
CPMM
Cost per Million. Pertains to instances in which the code on the client’s web page generates a server call to Adobe, for example,an image request.
Creative Element
Creative elements are characteristics that vary between placements or instances of the campaign, and include characteristicssuch as media type, headline, keyword, and media vendor.
316 Terms Used in Analytics
8/18/2019 Analytics Reference Adobe
http://slidepdf.com/reader/full/analytics-reference-adobe 317/332
Custom Traffic Variable (s.prop)
Custom traffic variables, also called props (s.prop) or property variables, are counters that count the number of times each valueis sent into Analytics.
Props also let you correlate custom data with specific traffic-related events. These variables are embedded in the Analytics code
on each page of your website. Through s.prop variables, Analytics lets you create custom reports, unique to your organization,industry, and business objectives.
For example, if you are an automobile manufacturer, you may be interested in seeing "Most Popular Car Model" to complementyour "Pages" report. You can accomplish this by allocating one of your traffic properties to represent car model. Then implementyour code to pass in car model on the appropriate pages.
Note: Analytics supports up to 75 s.prop variables.
You can enable and name these variables in Admin Tools under Analytics > Admin > Report Suites > Edit Settings > Traffic> Traffic Variables .
Current Data
The Include Current Data option on reports lets you view the latest Analytics data, often before data is fully processed andfinalized. Current data displays most metrics within minutes, providing actionable data for quick decision making. CurrentData is enabled by default on all reports that support it.
Data Connectors
Adobe Data Connectors provide a complete development ecosystem to help Data Connectors partners integrate their productsand services into the Adobe Marketing Cloud.
Adobe provides a well-defined process for creating a Data Connectors integration.
Data Sources
You can use Analytics to create and manage FTP-based Data Sources, which leverages FTP file transfer to import offline orhistorical data into the Marketing Cloud. After creating a Data Sources instance, the tool provides an FTP location that you canuse to upload Data Sources files. Once uploaded, Data Sources automatically locates and processes them. After the files areprocessed, the data is available for Analytics reporting.
Decision Tree
In data workbench, decision trees are a predictive analytics visualization used to evaluate visitor characteristics and relationships.The Decision Tree Builder generates a decision tree visualization based on a specified positive case and a set of inputs.
A Decision Tree is a binary classifier with a set of rules (or filters) identifying visitors who satisfy specific rules based on a positivecase. A decision tree sets rules to classify visitors who satisfy (or do not satisfy) this positive case. These rules generate a treemap to provide a level of confidence to meet these positive case results.
317 Terms Used in Analytics
8/18/2019 Analytics Reference Adobe
http://slidepdf.com/reader/full/analytics-reference-adobe 318/332
Deduplication
The removing of duplicate events and visits from reporting.
Dimensions
Descriptions or characteristics of metric data that can be viewed, broken down, and compared in a report. They are non-numeric values and dates that correlate, sub-relate, or are a classification of the original report type metric.
Examples of dimensions include:
• Page, page names• Products• Gender• Month• Age• Day, week, month, etc.• Loyalty • Monitor resolution• Custom eVars and s.prop values
Ad Hoc Analysis
When performing ad hoc analysis, you can base reports on any dimension item. You can break down dimensions by otherdimensions to analyse and compare nearly anything. For example, you can view trends across other continuous dimensions likePage Depth. Then you could visualize a metric like Revenue Participation to see how revenue is influenced as a visitor travelsdeeper into your site.
In the Dimensions pane, you can search for dimensions and drag them to the Table Builder or the report table. You can sortthem based on the following categories:
• Traffic• Conversion
• Time
• Props
• Evars
• Hierarchy
Data Workbench
In the data workbench, dimensions are set of elements, all of which are of a similar type from the user's perspective. The elementsdefine a set of categories into which data can be grouped. For example, the elements Monday, Tuesday, Wednesday, Thursday,Friday, Saturday, and Sunday make up a Weekday dimension.
The following dimension types exist:
Countable : A dimension type in which the number of elements in the dimension can be counted by the system. Countabledimensions must be derived from other Countable dimensions. Countable dimensions can be parents of other dimensions orchildren of other countable dimensions.
318 Terms Used in Analytics

8/18/2019 Analytics Reference Adobe
http://slidepdf.com/reader/full/analytics-reference-adobe 319/332
Examples: Visitor, Session, Page View, Booking, and Order.
Simple: A dimension that has a one-to-many relationship with a parent countable dimension. A simple dimension can bethought of as representing a property of elements of its parent dimension.
Example: Visitor Referrer is a simple dimension with a parent of the Visitor dimension. Each Visitor can have only one VisitorReferrer (their first HTTP referrer), but many Visitors might have the same Visitor Referrer. Therefore the Visitor Referrer isone-to-many with the Visitor dimension.
Numeric : A dimension that has ordered, numerical values and a one-to-many relationship with a parent countable dimension.A numeric dimension can be thought of as representing a numeric property of elements of its parent dimension. Numericdimensions are often used to define sum metrics.
Example: The numeric dimension Session Revenue defines the revenue, in dollars, for each Session. Each Session has a singleamount of revenue, but any number of Sessions might have the same revenue, so Session Revenue is one-to-many with Session.A metric revenue might be defined as sum(Session_Revenue , Session ), giving the total amount of revenue for theselected Sessions.
Many-to-Many : A dimension that has a many-to-many relationship with a parent countable dimension. A many-to-many dimension can be thought of as representing a set of values for each element of its parent dimension. A many-to-many dimension
is equivalent to an (anonymous) countable dimension with its parent and a Simple dimension with a parent of the anonymouscountable dimension.
Example: The many-to-many dimension Search Phrase has a parent of Session. Each Session can use zero or more Search Phrases,and a Search Phrase can be used in any number of Sessions.
Denormal : A dimension that has a one-to-one relationship with a parent Countable dimension. The element names of thedenormal dimension can carry information about the corresponding elements of the parent dimension. A denormal dimensioncan be thought of as storing an arbitrary string value for each element of the parent. Denormal dimensions can be used with thedata workbench server's segment export capability to output details about a subset or segment of a countable dimension. Inaddition, denormal dimensions can be referenced in metric formulas and worksheet visualizations and can be used (with certainrestrictions) to define filters.
Example: The denormal dimension EMail Address has a parent of Visitor. Each Visitor has an EMail Address, and each elementof the EMail Address dimension is associated with a single Visitor. Even if two visitors have the same e-mail address, theiraddresses will be different elements of the EMail Address dimension. A Segment Export can reference the EMail Addressdimension to output the EMail Address of each visitor in a Segment.
Time : A dimension that enables you to create a set of periodic or absolute local time dimensions (such as Day, Day of Week,Hour, Hour of Day, and so on) based on a timestamp field that you specify. When defining time dimensions, you also can choosea day other than Monday to be used as the start of a week by specifying the Week Start Day parameter.
Example: The time dimension Session Time has parent of Session. Therefore, the dimension defines a set of time dimensions(Day, Day of Week, Hour, Hour of Day, Month, and Week) whose elements correspond to the times at which visitors' sessionson the site began.
Derived : Derived dimensions, rather than being defined in the dataset configuration based on the data being processed, aredefined in the profile based on other dimensions or metrics. Many derived dimensions are created automatically to drive differenttypes of visualizations. For example, when a user builds a site or process map, the data workbench server silently creates a Prefixdimension. Others, such as the reporting time dimensions, are defined by files in the Dimensions directory of a profile.
See the Data Workbench Metrics, Dimensions, and Filters guide for more information.
319 Terms Used in Analytics
8/18/2019 Analytics Reference Adobe
http://slidepdf.com/reader/full/analytics-reference-adobe 320/332
Event Serialization
The process of implementing measures to prevent duplicate events from entering Analytics reporting. Duplicate events canoccur when a user refreshes a page multiple times, navigates to a certain page multiple times, or saves the web page to theirmachine (i.e. some users may save the purchase confirmation page to their computer). Every time they viewed the page, ordersand revenue would be counted again if event serialization was not in place.
Exit Link
Any link that takes a visitor away from your site.
Related definitions:
Exit Page: The page that contains the exit link.
Exit Point : The page from which a visitor leaves your site.
Exit Site Sections: The site section from which a visitor leaves your site.
Expiration Trigger
Sets the lifetime of a variable value by letting you tell the system when to expire the variable’s value. Expiration triggers can bedates, time periods, or conversion events. It's the event or action that occurs that expires the value of a variable. A campaign variable could be set to expire on purchase. An internal search term can be set to expire with a visit.
Fallout Report
The Fallout Report shows where visitors leave (fallout) and continue through (fallthrough) a pre-specified sequence of pages.It displays conversion and fallout rates between each step. For example, you can track a visitor's fallout points during a buyingprocess. You select a beginning point and a conclusion point, and add intermediate points to create a website navigation path.
Gantt View
The Gantt view provides a quick view of when your site campaigns began and when they ended, and how they affected yoursite's success metrics. You can see the day each campaign began as well as the day the campaign ended.
Gauge Reportlet
Gauge reportlets show the performance of a specific metric according to a custom-defined scale. You have the option to selecta dial, bar, or bulb visualization type, set the scale (thresholds) you wish to use, and define other report details.
Granularity
The level of period-based detail at which you are viewing your report data. Granularity can be daily, weekly, monthly, and soon.
Learn how to specify report granularity in marketing reports.
320 Terms Used in Analytics
8/18/2019 Analytics Reference Adobe
http://slidepdf.com/reader/full/analytics-reference-adobe 321/332
Hierarchy
The hierarchy variable is used to determine the location of a page in your site’s hierarchy or page structure. Hierarchies reflectthe natural organization of the site. The hierarchy variable is most useful for sites that have many levels in the site structure. Forexample, a media site may have four levels to the Sports section: Sports, Local Sports, Baseball, Red Sox. If someone visits theBaseball page, then Sports, Local Sports and Baseball reflect that visit.
Hit
A single image request to Adobe servers, generated when a user requests a resource on a website. A request can result in an erroror a successful transmission of any data type. Each Track and Track Link calk generates a hit.
About Hits and Visitor Data
When a user first visits your site, Adobe servers place a cookie containing avisitor ID value on the user's computer. Each imagerequest that a user sends into Adobe's servers passes this visitor ID value back to Adobe. Because this value stays the same fromhit to hit and from visit to visit (unless the user clears cookies), a series of hits containing the same visitor ID values can beconstrued to be a single visitor.
Using the time stamps of the hits recorded from each user, analytics can determine when the user made the first image request,and also when the user's inactivity on your site reached 30 minutes, which ends the visit. This process allows Adobe's servers todetermine how many visits have been made by a single visitor ID value. The timestamp of each hit also allows reports tosequentialize the hits within a visit, making pathing data possible in reports.
Image Request
An image request is used to send data to Adobe data collection servers. It is also known as a web beacon and is a transparentgraphic image no larger than 1x1 pixel. It is placed on a web site or in an email to track visitor behavior. Data collection parametersare attached to the source of the image and read by the data collection server.
Internal Search Term
Search terms typed when visitors are on your website.
KPI - Key Performance Indicator
Key performance indicators simplify web analysis data reporting so that only relevant information is presented in aneasily-understood and actionable format.
Lifetime Value
The total amount of a given success metric for a single user, for example, the total number of lifetime visits for a user.
List Prop
A list prop is a traffic variable that can accept multiple values at once. A delimited list of values is passed into the variable, thenreported as individual line items. List props are most commonly implemented on pages that contain user-selectable values, such
321 Terms Used in Analytics
8/18/2019 Analytics Reference Adobe
http://slidepdf.com/reader/full/analytics-reference-adobe 322/332
as listed items with check boxes or radio buttons. They are useful in any circumstance where you want to define multiple valuesin a variable without sending multiple image requests.
Login Company
A login company is a collection of report suites used by your organization. Some organizations have multiple login companiesthat apply to different parts of the organization. This is especially useful for large organizations that deal with different businessunits where many report suites are not applicable to others in the company.Refer to this article to find out more about setting up multiple login companies.
Marketing Cloud
The Marketing Cloud is an integrated family of digital marketing solutions, as well as an intuitive interface for new resourcesand capabilities, called core services, for your business. Solutions include: Reports & Analytics, Ad Hoc Analysis, Data Workbench,Data Warehouse, Visitor Click Map, and Adobe Report Builder.
The Marketing Cloud Exchange is a single destination where you can search, browse, select, pay, and download digital marketingextensions via apps. Partners can submit their applications to the Exchange Marketplace with their description, images, videos
and documentation.
Master Marketing Profile
The Master Marketing Profile provides the ability for Adobe Marketing Cloud solutions to communicate and share informationabout website visitors so the same data can be used by each solution. The Master Marketing Profile eliminates the need forcustomers to use their visitors and their visitor web sessions as the integration point between the solutions by moving theintegration point to the Adobe Marketing Cloud.
Metric
Metrics are quantitative information about visitor activity, such as Views, Click-Throughs, Reloads, Average Time spent, Units,Orders, and Revenue. They are the foundation of reports and help you view and understand data relationships. They let youperform side-by-side comparisons of different data sets about your website.
Metrics and associated data are displayed in the columns of reports. Broad categories of metrics include:
Traffic metrics : These show data about the volume of visitors.
Conversion metrics : These show data about success events, such as purchases, downloads, or any other action that you wantusers to take on your website.
Calculated metrics : These are metrics you create by combining metrics. For example, you can create a metric that subtracts theKeyword Cost and the Cost of Goods from Revenue. This calculated metric lets you see the net revenue. You could then dividethis value by Total Orders to see the average net revenue per order.
Video metrics : Marketing reports provide support for tracking a number of video metrics, including total views, time spent,and completion rates.
Social metrics : These help you measure your brand's presence on the social web. Social metrics work with Analytics standardmetrics. By combining these with calculated metrics, you can view a report that shows how often a product is mentioned, gaugeproduct sentiment, and see how Social metrics correlate with Analytics key performance indicators.
322 Terms Used in Analytics
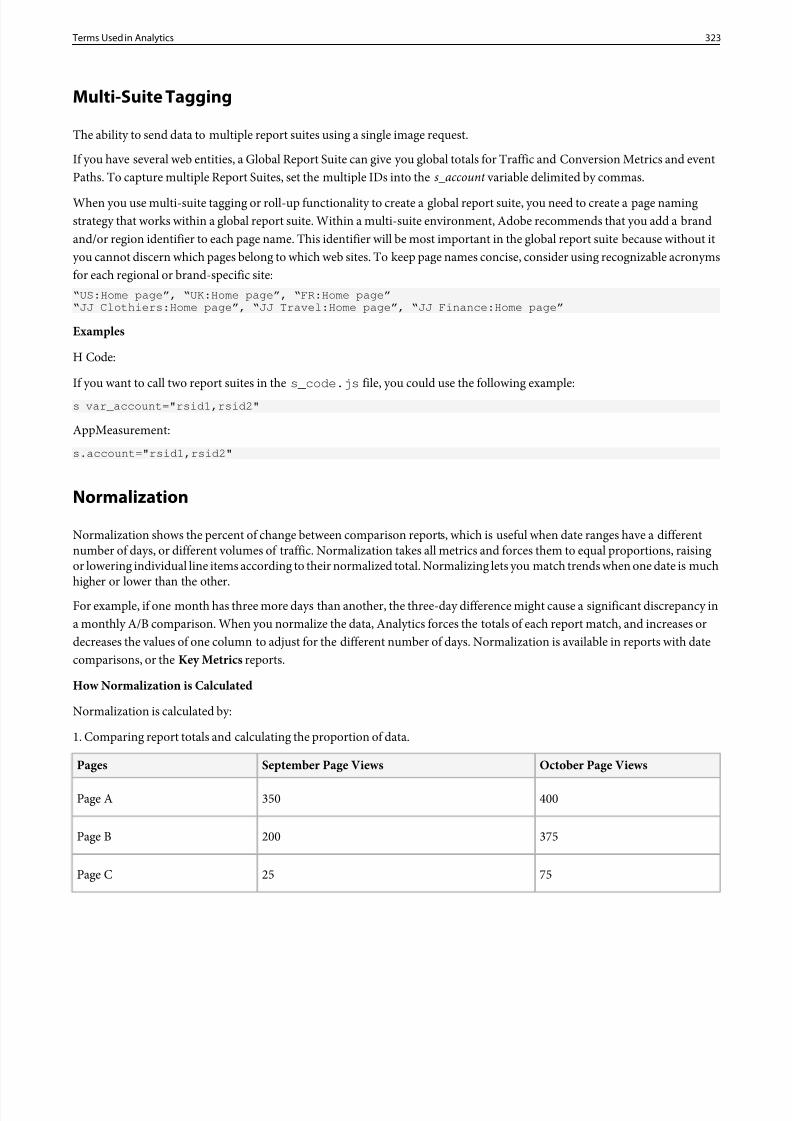
8/18/2019 Analytics Reference Adobe
http://slidepdf.com/reader/full/analytics-reference-adobe 323/332
Multi-Suite Tagging
The ability to send data to multiple report suites using a single image request.
If you have several web entities, a Global Report Suite can give you global totals for Traffic and Conversion Metrics and eventPaths. To capture multiple Report Suites, set the multiple IDs into the s_account variable delimited by commas.
When you use multi-suite tagging or roll-up functionality to create a global report suite, you need to create a page namingstrategy that works within a global report suite. Within a multi-suite environment, Adobe recommends that you add a brandand/or region identifier to each page name. This identifier will be most important in the global report suite because without ityou cannot discern which pages belong to which web sites. To keep page names concise, consider using recognizable acronymsfor each regional or brand-specific site:“US:Home page”, “UK:Home page”, “FR:Home page”“JJ Clothiers:Home page”, “JJ Travel:Home page”, “JJ Finance:Home page”
Examples
H Code:
If you want to call two report suites in the s_code.js file, you could use the following example:
s var_account="rsid1,rsid2"
AppMeasurement:
s.account="rsid1,rsid2"
Normalization
Normalization shows the percent of change between comparison reports, which is useful when date ranges have a differentnumber of days, or different volumes of traffic. Normalization takes all metrics and forces them to equal proportions, raisingor lowering individual line items according to their normalized total. Normalizing lets you match trends when one date is muchhigher or lower than the other.
For example, if one month has three more days than another, the three-day difference might cause a significant discrepancy ina monthly A/B comparison. When you normalize the data, Analytics forces the totals of each report match, and increases ordecreases the values of one column to adjust for the different number of days. Normalization is available in reports with datecomparisons, or the Key Metrics reports.
How Normalization is Calculated
Normalization is calculated by:
1. Comparing report totals and calculating the proportion of data.
October Page ViewsSeptember Page ViewsPages
400350Page A
375200Page B
7525Page C
323 Terms Used in Analytics
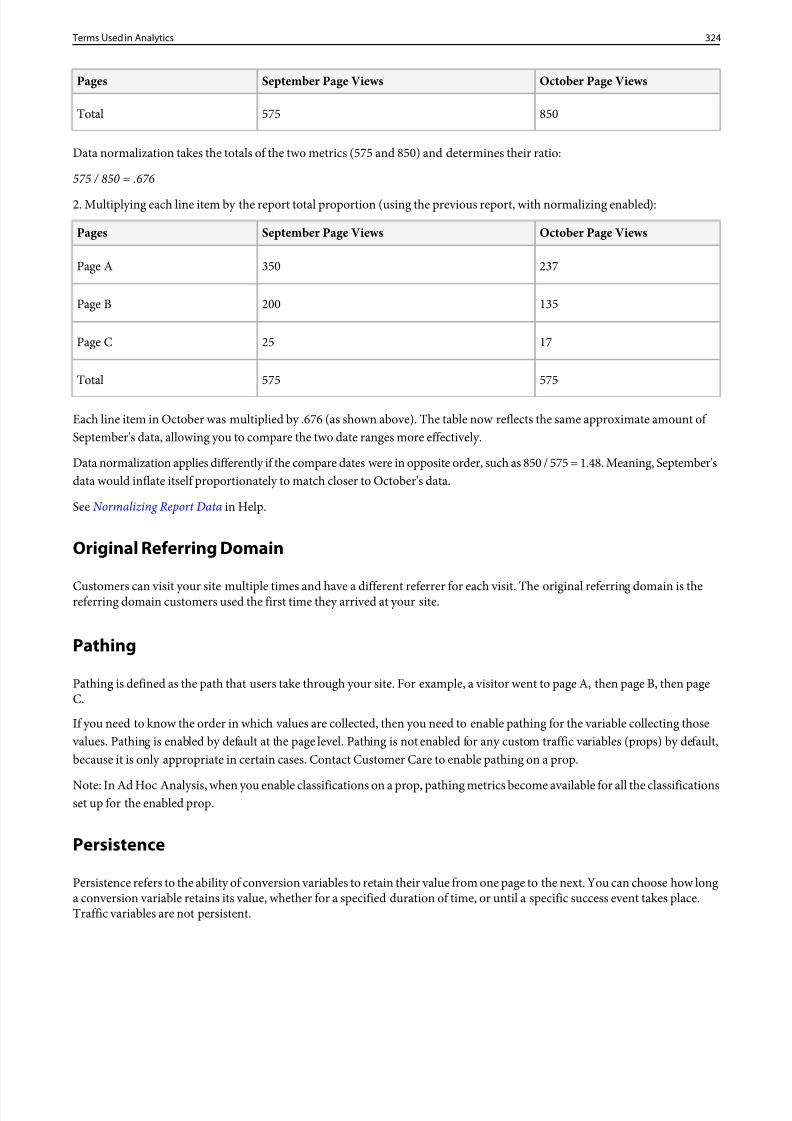
8/18/2019 Analytics Reference Adobe
http://slidepdf.com/reader/full/analytics-reference-adobe 324/332
8/18/2019 Analytics Reference Adobe
http://slidepdf.com/reader/full/analytics-reference-adobe 325/332
Ranked Report
Displays a table with ranked items, using numbers and percentages in metrics. For example, a Pages Report ranks the pages onyour site based on traffic, and the detail table shows percentages and numbers for metrics like Page Views and Revenue. Ahorizontal bar chart is the default graph type. Graphs display a color for each metric. Ranked reports can display multiple metricsin a report.
Ranked graphs default to five items, but you can graph up to thirty items in the chart options.
Real Time
Real-time reports display web page traffic and rank page views in real time, so that you can more quickly understand what istrending on your site.
For real-time reporting, Analytics uses high-frequency metrics and site analytics to visually report traffic and page view trendingof dynamic news and retail web sites. Real-time understands trends in your data from minute to minute, within seconds of collection. It collects and streams data to the interface, using real-time correlation and tracking of content and some conversion.
Report
Standard reports display data for website and visitor activity, traffic patterns, referral data, advertising campaigns, visitor retention,product data, and more. You can run reports and then access tools to configure segments, metrics, and report comparisons.
You can gather custom data to create reports specific to your website. For example, if you have a search feature on your website,you can track the search terms submitted and create a report that shows these terms and the results of the searches.
The standard report set covers topics common to every website. Reports include (but are not limited to):
• Website data• Visitor data• Traffic patterns• Referral data• Advertising campaigns• Visitor retention• Product information
Analytics categorizes reports based on the following types:
• Summary Reports include reports such as the Totals Report, which shows data designed for quick overviews. These areintended for executives who want a general overview of the data.
• Conversion Reports provide comprehensive, accurate, and detailed analysis of customer activity. Metrics such as campaignmanagement, sales cycle, customer fallout, and customer conversion let you measure e-commerce transactions, sources of sales, advertising effectiveness, customer loyalty, and more.
•Traffic reports give you in-depth insight into how visitors interact with your website. They let you analyze critical aspects of visitor behavior, monitor and understand traffic patterns, determine popular site content, and segment visitors by any measurablecriteria.
Report Suite
A report suite defines the complete, independent reporting on a chosen website, set of websites, or subset of web pages. Usually,a report suite is one website, but it can be a global segment where you have combined several sites' numbers to get totals. When
325 Terms Used in Analytics
8/18/2019 Analytics Reference Adobe
http://slidepdf.com/reader/full/analytics-reference-adobe 326/332
you log in to the marketing reports, ad hoc analysis, and report builder, you select one report suite to use (except when you useroll-ups that combine report suites).
A report suite can be smaller than a website, if want to run reports for a portion of your site. Analytics solutions aggregate andreport on these data stores. Analytics > Admin > Report Suites (Report Suite Manager) lets you define the rules that governhow data is processed in a report suite.
Global report suite : Your implementation is altered to send image requests across domains into a single global report suite in
addition to individual report suites.Rollup report suite : Created in the Admin Console. Takes the sum of each metric at the end of every day.
SeeRollup and Global Report Suites for information about the differences between these report suite types.
Segment Container
The Segment Builder utilizes a container architecture that lets you determine what to include in a segment. The Visitor containeris the outermost container and includes overarching data specific to the visitor across visits and page views. A nested Visitcontainer lets you set rules to break down the visitor's data based on visits, and a nested Hit container lets you break down visitorinformation based on individual page views. Each container lets you report across a visitor's history, interactions broken down
by visits, or break down individual hits.Refer to the Segmentation Guide for more information.
Segmentation
Segments are custom subsets of data, or data filtered by rules that you create. Segments are based on hits, visits, and visitors.For example, you can run a Pages Report and then apply a Visitors from Mobile Devices segment.
Unified Analytics segmentation lets you build, manage, share, and apply powerful, focused audience segments to your reportsusing Analytics capabilities, the Adobe Marketing Cloud, Adobe Target, and other integrated Adobe products.
Analytics segmentation includes the Segment Builder to construct segments and run a pre-test, and the Segment Manager tocollect, tag, approve, set security, and share segments across your organization.
Target
Target uses segment filters, which are groups of visitors who share a specific characteristic or set of characteristics. For example, visitors who arrive at your page from a certain search engine might be one segment. Other segments might be based on gender,age, location, registration status, purchase history, or just about any other detail you can collect about your visitors. Use segmentfilters to divide visitor traffic, and compare experience performance for each traffic segment.
SeeSegment Filters in Help.
Data Workbench
You can create a segment of the elements of any countable dimension and then output data for that segment on a batch orongoing real-time basis into a tab-delimited file. Each time that you export a segment, you output metric or dimension data forall of the dimension elements included in that segment. You can control how the output data is formatted so that other systemscan easily load the data.
SeeConfiguring Interface and Analysis Features in the Data Workbench User Guide
326 Terms Used in Analytics
8/18/2019 Analytics Reference Adobe
http://slidepdf.com/reader/full/analytics-reference-adobe 327/332
Audience Management
A segment (or audience) defines a set of users who share similar attributes. In audience management, segments help you classify people into related subgroups based on server-side rules you create in Segment Builder .
For example, segment rules can evaluate people based on customer type (casual browser vs. serious purchaser), geography,demographics, and many other characteristics. Segmentation is useful when you need to target products and services to specificgroups with similar interests and behavior.
Server Call
A server call, also known as a "hit" or an "image request", is an instance in which data is sent to Adobe servers to process. Themost common type of server call is a page view. A page view is where a visitor views a page on your website and a server call isgenerated to Adobe, where information is collected, processed, and then included in your report metrics. There are other typesof server calls, including exit links and file downloads, where data is sent to Adobe to process, but is not recorded as a new page view. Even "excluded" page views (excluded from your reports by an IP address range you configure, for example) are servercalls because they are received and processed by Adobe but never show up in your reports.
Subrelation
The ability to break down conversion reports by other conversion reports. Subrelation is synonymous with conversion report breakdown.
Functionally, subrelations are also similar to traffic report breakdowns, calledcorrelations. Both breakdown types are accessedthe same way: by clicking on the green magnifying glass to the left of the line item in the report table.
eVars can have three different settings relating to subrelations:
• No Subrelations : The variable cannot be broken down by any other variable.• Basic Subrelations : The variable can be broken down by Tracking codes and several other conversion variables, but no other
custom conversion variables.• Full Subrelations : The variable can be broken down by all conversion variables, including custom conversion. Version 15 and
ad hoc analysis have full subrelations enabled by default.See the Subrelations Knowledge Base article for additional information.
Success Event
Success events are actions that can be tracked. You determine what a success event is. For example, if a visitor purchases anitem, the purchase event could be considered the success event. Other examples include media subscriptions, self-service toolusage, searches, downloads, checkouts, etc.
Transaction Unique Customer URL
Any process set by the web site owner that begins with an order variable and ends with a success variable. This could mean aproduct purchase, newsletter sign-up or e-mail request for information after going through a preset process. A unique customeris registered when a person makes a purchase from your site for the first time within a specified period of time. In other words,while one person may buy from your site three times, this person would be recorded as one unique customer. You can tell exactly how many individual people are purchasing from your site.
There are five different time frames marketing reports use to define unique customers: daily, weekly, monthly, quarterly andyearly. A daily unique customer may purchase from your site twice on February 7th, and then again on February 8th. Thiscustomer registers as two daily unique customers, because only the first purchase on the 7th and the purchase on the 8th would
327 Terms Used in Analytics
8/18/2019 Analytics Reference Adobe
http://slidepdf.com/reader/full/analytics-reference-adobe 328/332
count as unique purchases for their respective days. This same standard determines monthly and yearly unique customers fortheir respective time frames. It can be helpful to ask the following question to see how reports determine who is a uniquecustomer: "How many different people purchased from my site during this time period?"
The sum of all daily unique customers is not equal to the total monthly unique customers for that month. This is because acustomer who purchases twice in a given month counts as two daily unique customers: one for each day they purchased, butonly as a single monthly unique customer. The same relationship is true for monthly unique customers and yearly unique
customers.The method used to give an address to documents and other resources on the web. The first part of a URL indicates what protocolto use. The second part specifies the IP address or the domain name where the resource is located. For example, the first sectionof http://www.adobe.com specifies that the web page should be fetched using the HTTP protocol. The second sectiondirects the main page in the Adobe domain to be retrieved.
Trended Report
A report view that lets you view trends over a given time period, so that you can identify data patterns.
For example, looking at a trended Products report shows you how many page views each featured product has garnered over
the specified time period. (You can change the granularity and the reporting period at any time.)
Unique Visitors
Unique visitors represent the number of de-duplicated (counted only once) visitors to your website over the course of a specifiedtime period. A unique visitor is determined with cookies. Unique visitors are calculated based on the selected reporting period.Any visitor during that reporting period will be counted only once.
SeeUnique Visitors in Metrics.
See the Unique Visitors in v14 white paper.
Visit Depth
The depth to which customers to your site browse. For example, if a customer views three pages on your site before making apurchase, that visit depth would be three.
VISTA Rules
Visitor Identification, Segmentation and Transformation Architecture (VISTA) is a server-side approach to populating report variables. VISTA uses visitor segmentation rules to create real-time segmentation of all online data. These rules enable you toalter or segment data in nearly any way that you choose, without the need for implementing complex logic on your site. Anunlimited number of visitor segmentation rules can be defined with VISTA.
For example, suppose you want to segment traffic whereeVar1 = "News" to Report Suite A, and send all other traffic to ReportSuite B. VISTA can perform this logic automatically for all server calls received.
VISTA processing occurs after data is collected but before it displays in marketing reports, data warehouse, ASI, or ad hocanalysis. Server-side data manipulation is done as the data comes in through the image request.
328 Terms Used in Analytics
8/18/2019 Analytics Reference Adobe
http://slidepdf.com/reader/full/analytics-reference-adobe 329/332
Note: VISTA rules are not retroactive in marketing reports and cannot reprocess historical data to apply logic to existing reports. However, you can apply VISTA rules to ASI slots so that this logic is applied to key segments. ASI also allows youto apply segments to historical data, so in effect it is possible to use ASI to apply VISTA rules to historical data.
VISTA rules can act on data in the HTTP header as well as any data element sent in the code. Your implementation consultantworks with you to define VISTA rules and to create a specification from which the rule is programmed and tested.
VISTA UsesVISTA can be used to perform the following.
• Segment data into separate report suites by domain names, URL patterns, or directories.• Segment data based on user-related data, such as the value of a cookie (if the cookie value is passed in a variable), IP address,
operating system, browser type or version, or the value of any variable populated via implementation.• Separate or copy data into multiple report suites.• Use JavaScript variable values as a lookup value in a database (referred to as adatabase VISTA rule ) to dynamically apply
changes to data based on values passed into Analytics.
Implementing server-side VISTA rules within the reporting architecture is perfect for websites that cannot implement complexlogic within their own web architectures. VISTA rules are programmed and stored in one central location, so updates can bemade quickly and easily. This is perfect for large, distributed sites and companies with various subsidiary divisions where rollingout site changes and new processing rules is often laborious and time-consuming.
Common VISTA Rules
• Grabber : VISTA grabs a value from the URL, the HTTP header or a variable, and sets it into another variable or manipulatesit and sets it into a variable.
• Exploder : VISTA takes an incoming value from a variable, and breaks it out into several different variables. This rule is helpfulwhen you have a long string of concatenated values that you want to push into different reports.
• Concatenator : VISTA takes any number of values from variables, the URL, or the HTTP header and concatenates them intoone variable. This rule is helpful when the separate variables are dynamic and could come into reports in many differentcombinations.
• Traffic Cop : Acting as a filter, VISTA looks for specific values in the HTTP header, variables, or URL and segments that data.You can use Traffic Cop to allow only certain values into a report, to watch for IP ranges, or watch for specific page namesand then populate appropriate events.
• Database Lookup : Securely push values into props, eVars, and metrics into events through a lookup of proprietary data onyour servers, such as Cost of Goods Sold.
Deploying and updating VISTA rules is done by Adobe's Engineering Services, which works with you to understand yourbusiness needs and to craft a rule that addresses these needs. Adobe charges an additional fee to implement VISTA rules. Todiscuss the many possibilities that VISTA offers, contact your Adobe Account Manager.
329 Terms Used in Analytics
8/18/2019 Analytics Reference Adobe
http://slidepdf.com/reader/full/analytics-reference-adobe 330/332
Documentation UpdatesInformation about updates to Analytics Reference help.
DescriptionLocationDate
Added information about the Mobile App Admin
group and Group Management in MarketingCloud.
Updated Groups.3/20/2015
Added feature information about how classificationrules can now overwrite existing classification values.
Classification Rule Sets02/19/2015
Added a recommendation of 30 column limit forimports and exports of classification files.
Column Heading Format 09/04/2014
Various reports in the Adobe Marketing Cloud canshow None, Unspecified, Other, or Unknown,
Added links to the article None, Unspecified,Unknown, and Other in reporting .
07/29/2014
depending on the specific report viewed. Generally,this breakdown means that the variable was notdefined or otherwise unavailable.
To increase access to the article, links were addedto Classifications Troubleshooting and DataCollection sections.
Learn about common reasons why reports fail andwhat you can do to avoid timeouts and failures.
Reporting Best Practices and Troubleshooting 04/30/2014
Added information about the Select AvailableReport Suites feature.
Classification Rule Sets03/14/2014
This button displays the Available Report Suitespage, where you can select one or more availablereport suites to use for all your rule sets. (This pagealso displays when you first run theClassificationRule Builder .)
This feature is intended to help reduce report suiteload time, in the event that you have hundreds of
available report suites.
Added special character info here (near the top of the bullet list).
General File Structure
Escape classification data
02/26/2014
Added steps describing how to escape data inclassifications.
330Documentation Updates
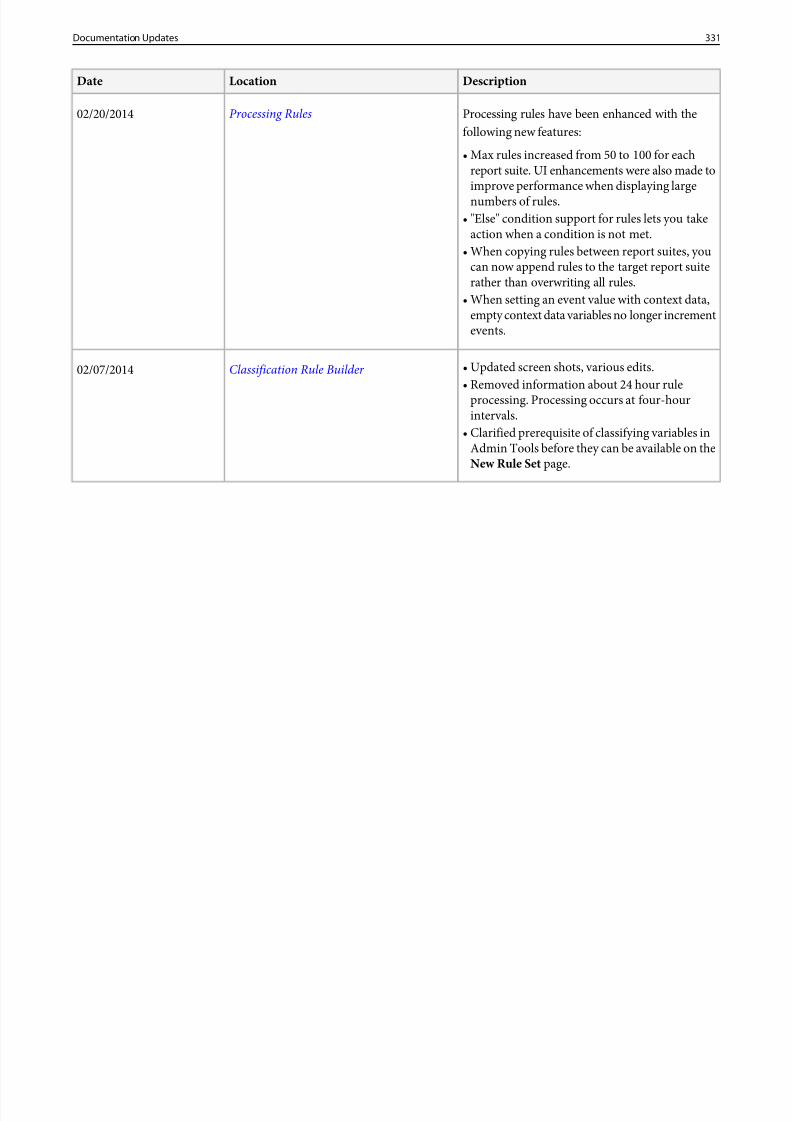
8/18/2019 Analytics Reference Adobe
http://slidepdf.com/reader/full/analytics-reference-adobe 331/332
DescriptionLocationDate
Processing rules have been enhanced with thefollowing new features:
Processing Rules02/20/2014
• Max rules increased from 50 to 100 for eachreport suite. UI enhancements were also made toimprove performance when displaying largenumbers of rules.
• "Else" condition support for rules lets you takeaction when a condition is not met.
• When copying rules between report suites, youcan now append rules to the target report suiterather than overwriting all rules.
• When setting an event value with context data,empty context data variables no longer incrementevents.
Classification Rule Builder 02/07/2014 • Updated screen shots, various edits.• Removed information about 24 hour rule
processing. Processing occurs at four-hourintervals.
• Clarified prerequisite of classifying variables inAdmin Tools before they can be available on theNew Rule Set page.
331Documentation Updates

8/18/2019 Analytics Reference Adobe
http://slidepdf.com/reader/full/analytics-reference-adobe 332/332
System RequirementsThis topic provides details on the system requirements for each Adobe Analytics user interface.• Report Builder • Ad Hoc Analysis• Data Workbench
332System Requirements
![Adobe® Analytics Quick-Reference Guide: Market Reports …ptgmedia.pearsoncmg.com/images/9780321926944/samplepages/... · marketing reports and analytics [Formerly SiteCatalyst]](https://img.pdfslide.us/doc/110x75/5ac23bbd7f8b9a213f8e0ee5/adobe-analytics-quick-reference-guide-market-reports-reports-and-analytics.jpg)