Embed Size (px)
Citation preview
Analytical titration curves of glycosyl hydrolaseCel45 by combined isoelectric focusing ±electrophoresis
The electrical charge of endocellulase Cel45-core has been determined by combinedisoelectric focusing-electrophoresis in the range of pH 3±9. In order to transform elec-trophoretic mobility to absolute electrical charge value, several corrections wereapplied: the frictional coefficient theoretically calculated from the molecular dimensionsdepends on porous gel structure and on the ionic strength of the solution. By compar-ing the curve calculated according to the Linderström-Lang equation, the number ofcharged electrical groups exposed to the solvent and their apparent ionization con-stants, pKo
i, can be determined. Furthermore, the macromolecule structure can beassumed not to change in this pH range. This finding is necessary to understand thestructure and the electrical properties of the entire Cel45 molecule.
Keywords: Endoglucanase / Electrophoretic titraton curves EL 3435
Francesco Attanasio1
Maurizio Bruschi1
Giovanni Candiano2
Roberto Galletto1
Luca Musante2
Martin Schülein3
Giovanni Rialdi1
1Istituto di Studi ChimicoFisici di MacromolecoleSintetiche e Naturali, CNR,Genova, Italy
2Istituto G. Gaslini,Dipartimento di Nefrologia,Genova, Italy
3Novo Nordisk a/s,Bagsvaerd, Denmark
1 Introduction
Endoglucanase V (EG V) is a fungal endocellulase fromHumicola insolens (Mr = 43 000), cloned and purifiedaccording to Schülein [1]. The hydrolysis mechanism ofthis enzyme as well as of other cellulases has alreadybeen discussed in detail [2]. The EG V cellulase belongsto the glycosyl hydrolase family 45 [3] and will from nowon be called Humicola insolens Cel45, according to arecent renaming of cellulose enzyme families [4]. TheCel45 molecule contains a catalytic core (Cel45-core;Mr 22 865) linked to a cellulose binding domain through aflexible peptide segment. The catalytic domain was alsoprepared by genetic engineering and purified as reportedin previous work [1]. Its structure was determined byX-ray analysis and its spheroid shape is known, with anapproximate size of 42 ´ 42 ´ 22 � [5, 6]. Cel45-core cel-lulolytic activity follows the behavior of total Cel45, with aconstant pH value ranging between 7.5 and 9. However,at pH 4.5, this activity drops to zero [4].
In this study, the crystallographic structure and size deter-mined by X-ray has been assumed to remain constant inthe solution. The calculations reported for other standardglobular proteins can be applied to this part of the cellu-lase molecule. The electrical charge of a protein in solu-
tion is an important aspect of its physicochemical proper-ties, indicating preparation purity: it is related to thecharged amino acid composition at a given pH and totheir exposure to the solvent for a defined protein struc-ture. With the macromolecule amino acid composition,the Linderström-Lang equation [7] makes it possible tocalculate the theoretical electrical charge in a large pHrange, correcting the pK values of ionization for a polye-lectrolyte structure. This theoretical curve is then compar-ed with experimental curves that are usually obtainedfrom the following procedures: potentiometric titration [8±12], and calorimetric titration [13±17]. In this study wedetermined the experimental electrical charge from pro-tein electrophoretic migration with a single bidimensionalisoelectric focusing-electrophoresis titration curve. Theuse of electrophoretic migration values at different pH isone of the most sensitive tests for homogeneity, allowingus to separate macromolecules with different electricalcharge for investigations, without wasting a large amountof products. With a single titration curve, obtained by iso-electric focusing ± electrophoretic experiment [18], theelectrophoretic mobility of more than one component canbe verified in a large pH range. This mobility depends onthe charge of the macromolecules and is stronglydependent on the frictional coefficient in the electropho-retic environment. Therefore, several corrections are nec-essary in order to adjust the experimental mobility to afree solution, when no support of a gel with a given poros-ity is provided [19±25]. By comparing the experimentalresults, after the reported corrections, with a calculatedtheoretical curve, some light will be shed on the exposureof the charged groups, in solution, on frictional parame-ters and interactions with the solvent at different pH val-ues.
Correspondence: Prof. Giovanni Rialdi, Istituto di Studi ChimicoFisici di Macromolecole Sintetiche e Naturali, CNR, Via De Marini6, 16149 Genova, ItalyE-mail: [email protected]: +39-010-6475880
Abbreviations: CBD, cellulose binding domain; Cel45-core, cat-alytic core of Cel45; EGV, endoglucanase V
Electrophoresis 1999, 20, 1403±1411 1403
� WILEY-VCH Verlag GmbH, 69451 Weinheim, 1999 0173-0835/99/0707-1403 $17.50+.50/0
Gen
eral
2 Materials and methods
The Cel45 full-length enzyme and its catalytic core wereproduced by cloning the gene and transforming it intoAspergillus oryzae using a plasmid with the gene insertedbetween the gene coding for fungal amylase promoterand the gene coding for the AMG terminator from A. niger[26].
2.1 Purification of Cel45 with cellulose-bindingdomain (CBD)
The enzyme was purified by exploiting the binding to Avi-cel. Extracellular fluid was then separated from the pro-duction organism. The cellulase was purified to a highdegree using affinity chromatography. Avicel (150 g) in aslurry with 20 mM sodium phosphate at pH 7.5 was mixedwith the crude spent medium containing about 1 g of pro-tein in total. After incubation at 4oC for 20 min, the Avicel-bound enzyme was packed into a 400 mL column. Thecolumn was washed with 200 mL buffer, then with 0.5 M
NaCl in the same buffer until no more protein was eluted,and then washed with 500 mL buffer (20 mM Tris, pH 8.5).Finally, the pure full-length enzyme was eluted with 1%triethylamine (pH 11.8. The Cel45 cellulase was fully sta-ble at this high pH. The eluted enzyme solution wasadjusted to pH 8 and concentrated using an Amicon cellunit with a 20 kDa cut-off membrane (polypropyleneDOW GR61PP) to 5 mg/L protein. The purified enzymegave a single band on SDS-PAGE.
2.1.1 Purification of the Cel45 catalytic corewithout CBD
The core cellulase was separated from the Aspergillusproteins by cation exchange chromatography on theextracellular proteins as follows: the spent medium wasadjusted to pH 3.5 and filtered to remove the precipitatingproteins. Proteins were then subjected to ultrafiltration(concentrated and washed with water) on a DOWGR81PP membrane with a 6 kD cut-off, until eluate con-ductivity was below 1000 mS/cm. The sample was finallyapplied to an S-Sepharose column equilibrated with a20 mM citrate buffer, pH 3.5. The enzyme will bind to theS-Sepharose at this low pH and it is eluted as a singlepeak using an NaCl gradient from 0 to 500 mM. The pureeluted enzyme was concentrated on an Amicon cell witha DOW GR81PP membrane. The cellulase was stable atpH 3.5.
2.2 Reagents
Acrylamide and Ampholine were from Pharmacia(Uppsala, Sweden); N,N¢-methylenebisacrylamide (Bis),sodium dodecyl sulfate (SDS), and N,N,N¢,N¢-tetramethyl-
ethylenediamine (TEMED) were from Bio-Rad Laborato-ries (Hercules, CA, USA); isoelectric focusing and electro-phoresis calibration standard proteins were fromPharmacia and Bio-Rad. All other chemicals, of analyticaland electrophoretic grade, were purchased from BDH(Poole, UK). Solutions were prepared fresh using Milli-Qwater.
2.3 SDS-polyacrylamide gel electrophoresis
Electrophoresis was carried out according to Laemmli[27], using SDS-polyacrylamide gel casting of a stackinggel (3%T, 2.6%C; size 10 ´ 165 ´ 1 mm) and separatinggradient gel (8±18%T, 2.6%C; size 175 ´ 165 ´ 1 mm) ina vertical flat-bed electrophoresis apparatus (Bio-RadProtean II electrophoresis system). Electrophoresis wascarried out for 16 h at 12oC with a constant current of12 mA per gel using a running buffer of 25 mM Tris-gly-cine, pH 8.3, containing 0.1% SDS. After electrophoresis,the gel was stained overnight with 0.1% Coomassie Bril-liant Blue R-250 in 50% methanol containing 0.1% aceticacid.
2.4 Isoelectric focusing
IEF was performed on an ultrathin polyacrylamide slabgel (420 mm) according to Righetti [28], made of 4%T,4%C, containing 2% w/v Ampholine pH 4±6. The gel wasrun at 10oC for 12 h with 1500 V at equilibrium, in a 2117Multiphor II chamber (LKB, Bromma, Sweden). The elec-trode solution was 0.5 M of NaOH at the cathode and0.5 M H3PO4 at the anode. The solutions were appliedwith appropriate electrode papers. For fixing and staining,Coomassie Brilliant Blue R-250 was employed accordingto Görg [29].
2.5 Vertical PAGE gradient under nativecondition
Running and gel buffers (50 mM Tris-HCl, pH 8.0) wereemployed in the vertical apparatus (Protean II Bio-Rad).The gradient gel (4±30%T and 2.7%C) was run at 160 Vconstant and 15oC. The Cel45-core (30 mg) of each singlesample was loaded at various intervals: t = 0, 3, 5 and 8 hfor a total test time of 23 h. Each sample mobility was cali-brated utilizing the migration of three standard Mr pro-teins: bovine serum albumin (Mr 66 200), trypsin inhibitor(Mr 20 095), and ovalbumin (Mr 43 000) [30, 31]. After therun, the gel was stained in CBB R-250 [29].
2.6 Transversal PAGE gradient under nativecondition
Polyacrylamide gel electrophoresis in a nondenaturingbuffer system Tris-HCl (50 mM, pH 8.0) was performed
1404 F. Attanasio et al. Electrophoresis 1999, 20, 1403±1411
according to Hedrick [19]. The linear gradient gel (3.5±33%T, 2.7%C; size 150 ´ 150 ´ 1.5 mm) was polymer-ized on a fabric polyester-activated sheet. The slab wascast with a narrow trough in the middle of the gel(130 mm long, 1.2 mm deep, 1 mm wide), which could befilled with 100 mg of protein. Electrophoresis was carriedout at 170 V for 18 h and 15oC in a 2117 Multiphor II elec-trophoresis apparatus. Gel staining was by SDS-PAGE.The value of %T was calculated in correspondence tothe trough (initial 4%T, end 30%T). Migration distancewas correlated with bovine albumin and trypsin inhibitormobility.
2.7 Cylindrical PAGE electrophoresis
Pyrex gel tubes of 5.5 mm ID, 8 mm OD and 180 mmlength were used. Each tube contained gel at constant%T, 2.7%C of polyacrylamide (details given in the captionof related figure). The gel electrophoresis apparatus wasa Model 175 Tube Cell (Bio-Rad); the run was performedat 160 V and 15oC, for 17 h. The running and gel bufferswere 50 mM Tris-HCl, pH 8.0. Migration distance to thefront edge of the zones (their denoted region) was meas-ured with calipers.
2.8 Titration curves
The general methodology was performed according toRighetti [18]. Square gel slabs (145 ´ 145 ´ 1.5 mm)were cast to contain acrylamide (5.02%T, 1.96%C) and2.5% w/v carrier ampholytes, pH 3±10. The first-dimen-sional separation was run at constant 400 V, until the pHgradient was fully developed and the system reached asteady state (usually 100 min at equilibrium). Then theelectrode gel layers were cut away, the gel was turned90o, the trench was filled with the sample (200 mg of pro-tein), new electrode strips were overlaid onto the gel, andelectrophoresis was performed perpendicular to the firstdimension at 200, 300, and 400 V for 5, 10, and 55 min,respectively, at 17.5oC. Electrolytes of 0.25 M NaOH at
the cathode and 0.25 M H3PO4 at the anode wereemployed. At the end of the experiment, the pH gradientwas measured into 29 gel slices, each 0.5 cm wide, per-pendicular to the central trough, eluted with 5 mL of10 mM KCl, and read with a digital pH meter. The gel withthe protein pattern was stained with Coomassie BrilliantBlue R-250. An LKB UltraScan XL laser densitometerwas used for scanning densitometry. Mobility was calcu-lated as migration distance divided by migration time (s)divided by the field strength (V/m).
3 Results
3.1 Theoretical titration curve of Cel45-core
Net charge estimation, z, was calculated according to Lin-derström-Lang (Eq. 1) [7] with a pH ranging between 2and 10, assuming that the protein remains compact andimpenetrable to solvent structure, the protonable groupsare all exposed to the solvent and no structural changesoccur throughout the pH range. The amino acid composi-tion reported in a previous work [17] suggests dividingthem into seven titrable groups with different pKo
i values(see Table 1)
where ni is the number of groups of ionized type i out of atotal of no
i, pKoi is the intrinsic pK of this group of side
chains, R is the gas constant, T is the temperature, w isan electrostatic factor depending on the solution ionicstrength and on the size and shape of the protein mole-cule, and z is the charge of the molecule at a given pH; wcan be estimated with the Debye-Hückel theory [7] for aprotein of Stoke©s radius Rs = 1.70 � 0.15 nm and an ionexclusion radius a = Rs + 0.2 nm
Electrophoresis 1999, 20, 1403±1411 Titration curve of cellulase Cel45-core 1405
Table 1. Ionization parameters of Cel45-core calculated according to Eq. (1).
Groups Curve a Curve bno pK w no pK w
a-COOH 1 3.5 � 0.2 0.16 � 0.02 1 3.4 � 0.3 0.16 � 0.03r-COOH 21 3.85 � 0.02 0.159 � 0.002 21 3.85 � 0.03 0.157 � 0.003Imidazole 1 6.98 � 0.01 0.180 � 0.001 1 6.99 � 0.01 0.180 � 0.001a-Amino 1 7.80 � 0.02 0.186 � 0.002 1 7.79 � 0.03 0.184 � 0.003Phenolic 5 10.2 � 0.3 5 10.1 � 0.5e-Amino 8 10.4 � 0.3 7 10.3 � 0.4Guanidyl 11 > 12 11 > 12
pI 5.12 � 0.01 4.95 � 0.01
where e is the electron elementary charge, D = 81.30 isthe dielectric constant at T = 17.5oC [32], k is the Boltz-mann constant and k is the Debye-Hückel parameterwhich depends on the solution ionic strength. In order tocompare this calculated z charge with the experimentalresults reported in Section 3.5 above, the ionic strength ofa focused carrier ampholyte must be estimated. The clas-sical Lewis and Randall equation [7] cannot be applied,but according to Righetti [28] the following equation mustbe applied:
where Camph = 3.57 ´ 10±2 mol/L is the molarity offocused carrier ampholytes and CH (or COH) the molarityof protons (oxydryl ions) at a given pH. Therefore
The calculated value of w is 0.17 � 0.02.
3.2 Estimation of frictional coefficient frommolecular dimensions
The frictional coefficient, f, depends on the size andshape of the molecule: the molecular dimension obtainedfrom X-ray analysis indicates that the enzyme has a flat-tened spheroidal shape with a rough size of 4.2 ´ 4.2 ´2.2 nm and can be considered to have an oblate ellipsoi-dal structure [5, 6]. The theoretical frictional coefficient forsuch a structure is calculated from the following equation[7, 33, 34]:
where h = 1.0620 ´ 10±3 Nsm±2 is the medium dynamicviscosity [32], a and b are the major and minor axes, re-spectively, of the molecule, and Ro = (a2 b)1/3 is the radiusof the sphere of equal volume.
3.3 Electrophoretic characterization of Cel45-core macromolecule
3.3.1 SDS-PAGE
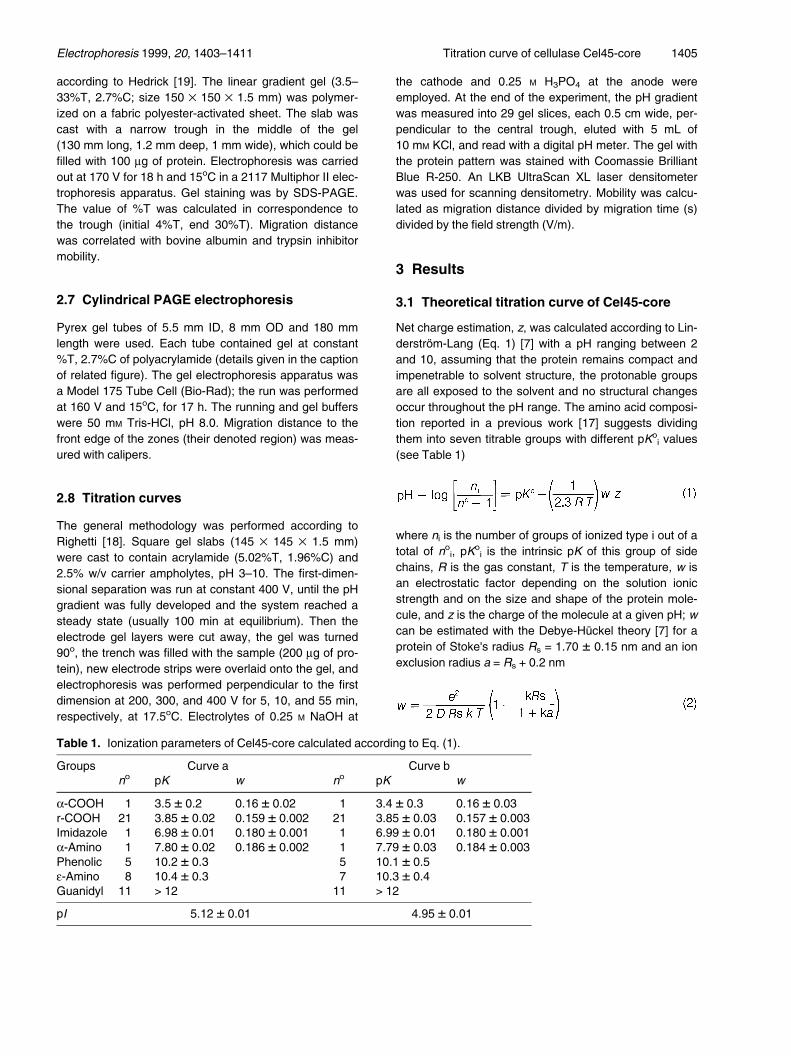
The SDS-PAGE patterns of the Cel45-core present in thepreparations are reported in Fig. 1. Cel45-core prepara-tions show a single component at Mr 25 000 � 2000.
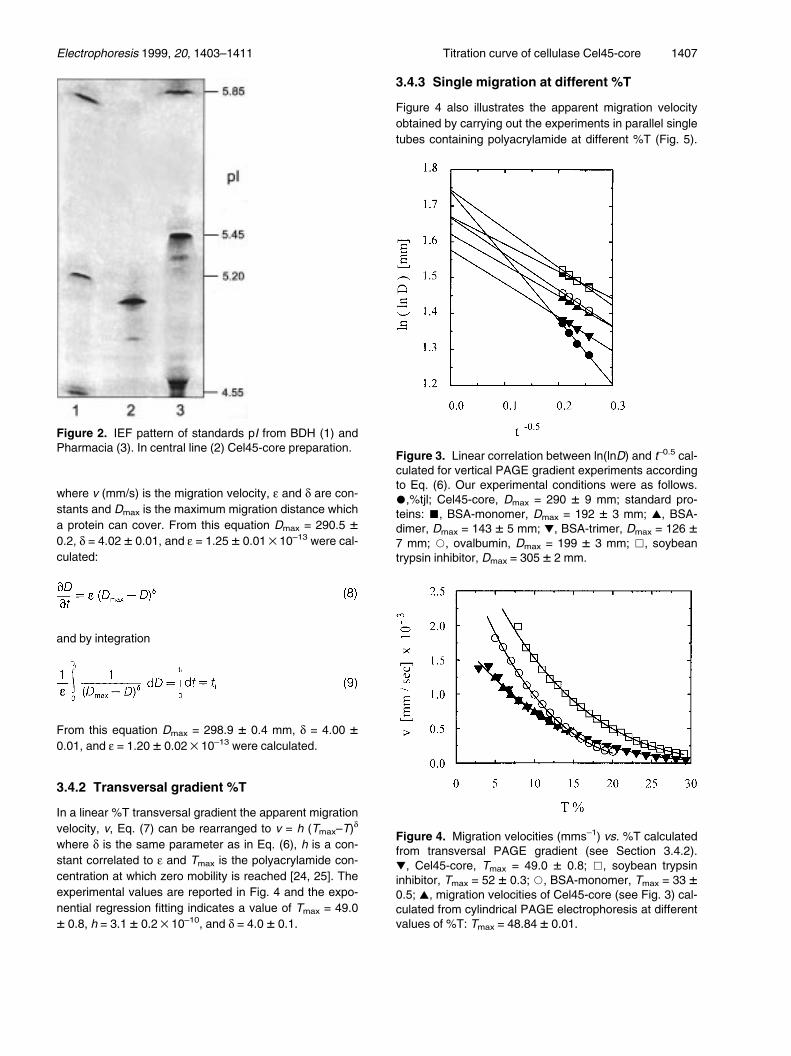
3.3.2 Isoelectric focusing
Figure 2 shows the presence of two components in theCel45-core preparations with pI 5.093 � 0.003 and 4.939� 0.003, respectively. The first accounts for approxi-mately 95.5% of the total amount of protein for the threeanalyzed lots.
3.4 Influence of %T on frictional coefficient
3.4.1 %T vertical gradient
The experimental migration of a macromolecule in a lin-ear vertical %T gradient allows us to calculate Dmax,namely the maximum migration distance [19±25], accord-ing to the equation
were D is the migration distance, and a and b are parame-ters from the linear fitting. From the extrapolation to infin-ite t, i.e., H
±±±t ±1 = 0, ln (ln (D)) = ln (ln (Dmax)) = b. A graphi-
cal representation of Eq. (6) is reported in Fig. 3 for theCel45-core macromolecule, as well as for other standardproteins. The calculated Dmax = 290 � 9. From the sameexperiment, the following equation can also be written:
v = e (Dmax±D)d (7)
1406 F. Attanasio et al. Electrophoresis 1999, 20, 1403±1411
Figure 1. SDS-PAGE patterns of Cel45-core (lanes 2, 3)and standard Pharmacia low Mr markers (lanes 1, 4).
where v (mm/s) is the migration velocity, e and d are con-stants and Dmax is the maximum migration distance whicha protein can cover. From this equation Dmax = 290.5 �0.2, d = 4.02 � 0.01, and e = 1.25 � 0.01 ´ 10±13 were cal-culated:
and by integration
From this equation Dmax = 298.9 � 0.4 mm, d = 4.00 �0.01, and e = 1.20 � 0.02 ´ 10±13 were calculated.
3.4.2 Transversal gradient %T
In a linear %T transversal gradient the apparent migrationvelocity, v, Eq. (7) can be rearranged to v = h (Tmax±T)d
where d is the same parameter as in Eq. (6), h is a con-stant correlated to e and Tmax is the polyacrylamide con-centration at which zero mobility is reached [24, 25]. Theexperimental values are reported in Fig. 4 and the expo-nential regression fitting indicates a value of Tmax = 49.0� 0.8, h = 3.1 � 0.2 ´ 10±10, and d = 4.0 � 0.1.
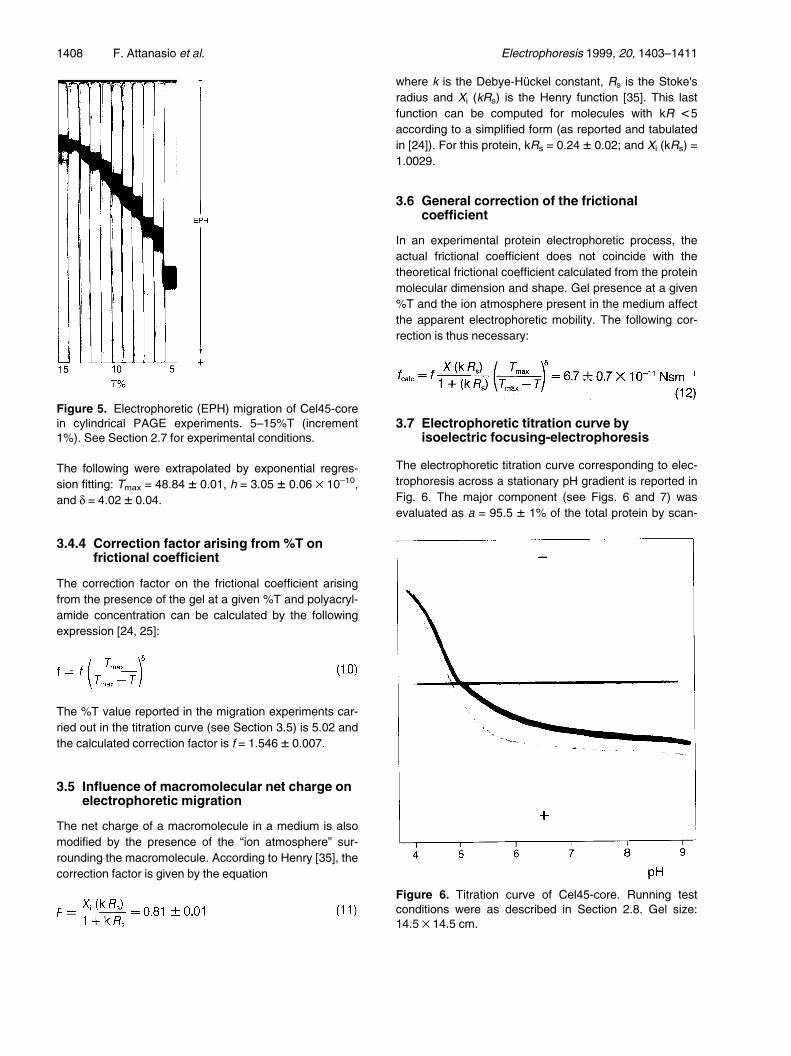
3.4.3 Single migration at different %T
Figure 4 also illustrates the apparent migration velocityobtained by carrying out the experiments in parallel singletubes containing polyacrylamide at different %T (Fig. 5).
Electrophoresis 1999, 20, 1403±1411 Titration curve of cellulase Cel45-core 1407
Figure 2. IEF pattern of standards pI from BDH (1) andPharmacia (3). In central line (2) Cel45-core preparation.
Figure 3. Linear correlation between ln(lnD) and t±0.5 cal-culated for vertical PAGE gradient experiments accordingto Eq. (6). Our experimental conditions were as follows.*,%tjl; Cel45-core, Dmax = 290 � 9 mm; standard pro-teins: &, BSA-monomer, Dmax = 192 � 3 mm; ~, BSA-dimer, Dmax = 143 � 5 mm; !, BSA-trimer, Dmax = 126 �7 mm; *, ovalbumin, Dmax = 199 � 3 mm; &, soybeantrypsin inhibitor, Dmax = 305 � 2 mm.
Figure 4. Migration velocities (mms±1) vs. %T calculatedfrom transversal PAGE gradient (see Section 3.4.2).!, Cel45-core, Tmax = 49.0 � 0.8; &, soybean trypsininhibitor, Tmax = 52 � 0.3; *, BSA-monomer, Tmax = 33 �0.5; ~, migration velocities of Cel45-core (see Fig. 3) cal-culated from cylindrical PAGE electrophoresis at differentvalues of %T: Tmax = 48.84 � 0.01.
The following were extrapolated by exponential regres-sion fitting: Tmax = 48.84 � 0.01, h = 3.05 � 0.06 ´ 10±10,and d = 4.02 � 0.04.
3.4.4 Correction factor arising from %T onfrictional coefficient
The correction factor on the frictional coefficient arisingfrom the presence of the gel at a given %T and polyacryl-amide concentration can be calculated by the followingexpression [24, 25]:
The %T value reported in the migration experiments car-ried out in the titration curve (see Section 3.5) is 5.02 andthe calculated correction factor is f = 1.546 � 0.007.
3.5 Influence of macromolecular net charge onelectrophoretic migration
The net charge of a macromolecule in a medium is alsomodified by the presence of the ªion atmosphereº sur-rounding the macromolecule. According to Henry [35], thecorrection factor is given by the equation
where k is the Debye-Hückel constant, Rs is the Stoke©sradius and Xi (kRs) is the Henry function [35]. This lastfunction can be computed for molecules with kR <5according to a simplified form (as reported and tabulatedin [24]). For this protein, kRs = 0.24 � 0.02; and Xi (kRs) =1.0029.
3.6 General correction of the frictionalcoefficient
In an experimental protein electrophoretic process, theactual frictional coefficient does not coincide with thetheoretical frictional coefficient calculated from the proteinmolecular dimension and shape. Gel presence at a given%T and the ion atmosphere present in the medium affectthe apparent electrophoretic mobility. The following cor-rection is thus necessary:
3.7 Electrophoretic titration curve byisoelectric focusing-electrophoresis
The electrophoretic titration curve corresponding to elec-trophoresis across a stationary pH gradient is reported inFig. 6. The major component (see Figs. 6 and 7) wasevaluated as a = 95.5 � 1% of the total protein by scan-
1408 F. Attanasio et al. Electrophoresis 1999, 20, 1403±1411
Figure 5. Electrophoretic (EPH) migration of Cel45-corein cylindrical PAGE experiments. 5±15%T (increment1%). See Section 2.7 for experimental conditions.
Figure 6. Titration curve of Cel45-core. Running testconditions were as described in Section 2.8. Gel size:14.5 ´ 14.5 cm.
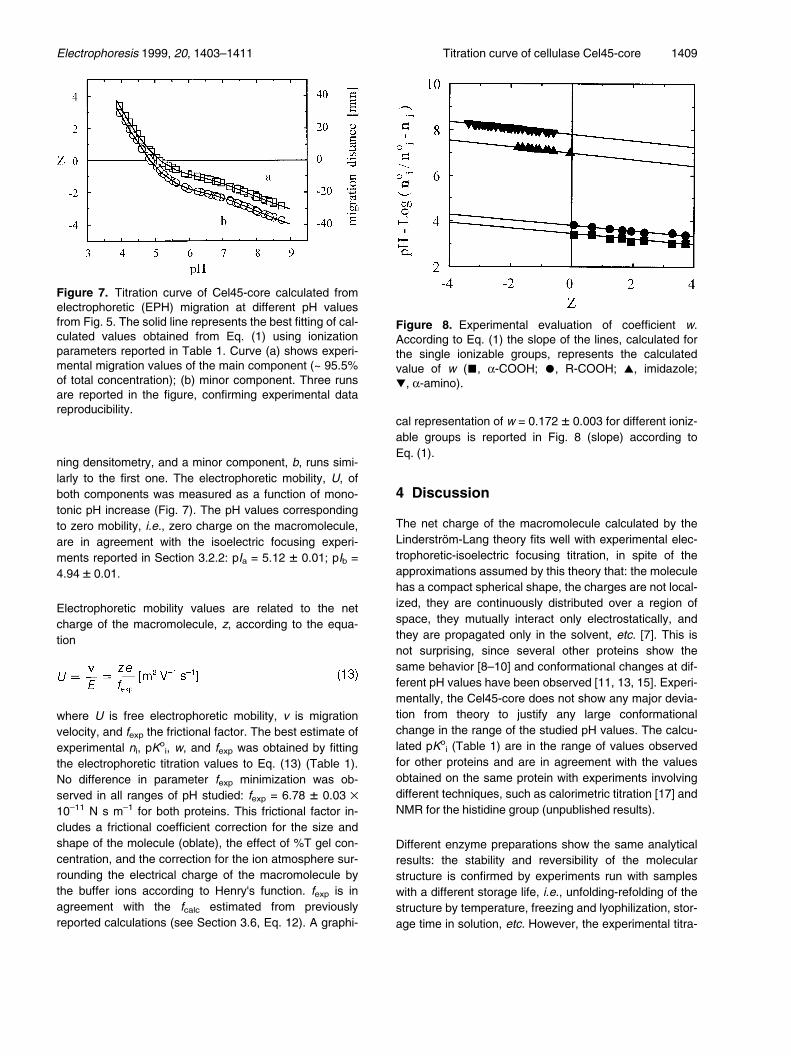
ning densitometry, and a minor component, b, runs simi-larly to the first one. The electrophoretic mobility, U, ofboth components was measured as a function of mono-tonic pH increase (Fig. 7). The pH values correspondingto zero mobility, i.e., zero charge on the macromolecule,are in agreement with the isoelectric focusing experi-ments reported in Section 3.2.2: pIa = 5.12 � 0.01; pIb =4.94 � 0.01.
Electrophoretic mobility values are related to the netcharge of the macromolecule, z, according to the equa-tion
where U is free electrophoretic mobility, v is migrationvelocity, and fexp the frictional factor. The best estimate ofexperimental ni, pKo
i, w, and fexp was obtained by fittingthe electrophoretic titration values to Eq. (13) (Table 1).No difference in parameter fexp minimization was ob-served in all ranges of pH studied: fexp = 6.78 � 0.03 ´10±11 N s m±1 for both proteins. This frictional factor in-cludes a frictional coefficient correction for the size andshape of the molecule (oblate), the effect of %T gel con-centration, and the correction for the ion atmosphere sur-rounding the electrical charge of the macromolecule bythe buffer ions according to Henry©s function. fexp is inagreement with the fcalc estimated from previouslyreported calculations (see Section 3.6, Eq. 12). A graphi-
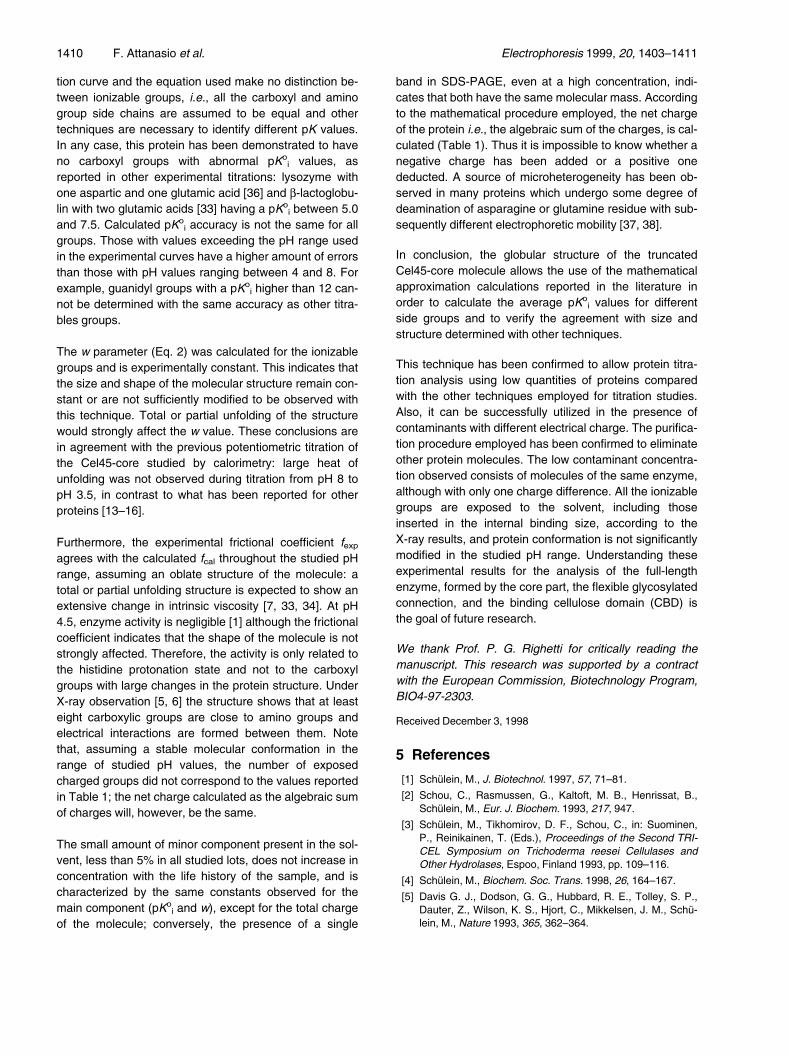
cal representation of w = 0.172 � 0.003 for different ioniz-able groups is reported in Fig. 8 (slope) according toEq. (1).
4 Discussion
The net charge of the macromolecule calculated by theLinderström-Lang theory fits well with experimental elec-trophoretic-isoelectric focusing titration, in spite of theapproximations assumed by this theory that: the moleculehas a compact spherical shape, the charges are not local-ized, they are continuously distributed over a region ofspace, they mutually interact only electrostatically, andthey are propagated only in the solvent, etc. [7]. This isnot surprising, since several other proteins show thesame behavior [8±10] and conformational changes at dif-ferent pH values have been observed [11, 13, 15]. Experi-mentally, the Cel45-core does not show any major devia-tion from theory to justify any large conformationalchange in the range of the studied pH values. The calcu-lated pKo
i (Table 1) are in the range of values observedfor other proteins and are in agreement with the valuesobtained on the same protein with experiments involvingdifferent techniques, such as calorimetric titration [17] andNMR for the histidine group (unpublished results).
Different enzyme preparations show the same analyticalresults: the stability and reversibility of the molecularstructure is confirmed by experiments run with sampleswith a different storage life, i.e., unfolding-refolding of thestructure by temperature, freezing and lyophilization, stor-age time in solution, etc. However, the experimental titra-
Electrophoresis 1999, 20, 1403±1411 Titration curve of cellulase Cel45-core 1409
Figure 7. Titration curve of Cel45-core calculated fromelectrophoretic (EPH) migration at different pH valuesfrom Fig. 5. The solid line represents the best fitting of cal-culated values obtained from Eq. (1) using ionizationparameters reported in Table 1. Curve (a) shows experi-mental migration values of the main component (~ 95.5%of total concentration); (b) minor component. Three runsare reported in the figure, confirming experimental datareproducibility.
Figure 8. Experimental evaluation of coefficient w.According to Eq. (1) the slope of the lines, calculated forthe single ionizable groups, represents the calculatedvalue of w (&, a-COOH; *, R-COOH; ~, imidazole;!, a-amino).
tion curve and the equation used make no distinction be-tween ionizable groups, i.e., all the carboxyl and aminogroup side chains are assumed to be equal and othertechniques are necessary to identify different pK values.In any case, this protein has been demonstrated to haveno carboxyl groups with abnormal pKo
i values, asreported in other experimental titrations: lysozyme withone aspartic and one glutamic acid [36] and b-lactoglobu-lin with two glutamic acids [33] having a pKo
i between 5.0and 7.5. Calculated pKo
i accuracy is not the same for allgroups. Those with values exceeding the pH range usedin the experimental curves have a higher amount of errorsthan those with pH values ranging between 4 and 8. Forexample, guanidyl groups with a pKo
i higher than 12 can-not be determined with the same accuracy as other titra-bles groups.
The w parameter (Eq. 2) was calculated for the ionizablegroups and is experimentally constant. This indicates thatthe size and shape of the molecular structure remain con-stant or are not sufficiently modified to be observed withthis technique. Total or partial unfolding of the structurewould strongly affect the w value. These conclusions arein agreement with the previous potentiometric titration ofthe Cel45-core studied by calorimetry: large heat ofunfolding was not observed during titration from pH 8 topH 3.5, in contrast to what has been reported for otherproteins [13±16].
Furthermore, the experimental frictional coefficient fexp
agrees with the calculated fcal throughout the studied pHrange, assuming an oblate structure of the molecule: atotal or partial unfolding structure is expected to show anextensive change in intrinsic viscosity [7, 33, 34]. At pH4.5, enzyme activity is negligible [1] although the frictionalcoefficient indicates that the shape of the molecule is notstrongly affected. Therefore, the activity is only related tothe histidine protonation state and not to the carboxylgroups with large changes in the protein structure. UnderX-ray observation [5, 6] the structure shows that at leasteight carboxylic groups are close to amino groups andelectrical interactions are formed between them. Notethat, assuming a stable molecular conformation in therange of studied pH values, the number of exposedcharged groups did not correspond to the values reportedin Table 1; the net charge calculated as the algebraic sumof charges will, however, be the same.
The small amount of minor component present in the sol-vent, less than 5% in all studied lots, does not increase inconcentration with the life history of the sample, and ischaracterized by the same constants observed for themain component (pKo
i and w), except for the total chargeof the molecule; conversely, the presence of a single
band in SDS-PAGE, even at a high concentration, indi-cates that both have the same molecular mass. Accordingto the mathematical procedure employed, the net chargeof the protein i.e., the algebraic sum of the charges, is cal-culated (Table 1). Thus it is impossible to know whether anegative charge has been added or a positive onededucted. A source of microheterogeneity has been ob-served in many proteins which undergo some degree ofdeamination of asparagine or glutamine residue with sub-sequently different electrophoretic mobility [37, 38].
In conclusion, the globular structure of the truncatedCel45-core molecule allows the use of the mathematicalapproximation calculations reported in the literature inorder to calculate the average pKo
i values for differentside groups and to verify the agreement with size andstructure determined with other techniques.
This technique has been confirmed to allow protein titra-tion analysis using low quantities of proteins comparedwith the other techniques employed for titration studies.Also, it can be successfully utilized in the presence ofcontaminants with different electrical charge. The purifica-tion procedure employed has been confirmed to eliminateother protein molecules. The low contaminant concentra-tion observed consists of molecules of the same enzyme,although with only one charge difference. All the ionizablegroups are exposed to the solvent, including thoseinserted in the internal binding size, according to theX-ray results, and protein conformation is not significantlymodified in the studied pH range. Understanding theseexperimental results for the analysis of the full-lengthenzyme, formed by the core part, the flexible glycosylatedconnection, and the binding cellulose domain (CBD) isthe goal of future research.
We thank Prof. P. G. Righetti for critically reading themanuscript. This research was supported by a contractwith the European Commission, Biotechnology Program,BIO4-97-2303.
Received December 3, 1998
5 References
[1] Schülein, M., J. Biotechnol. 1997, 57, 71±81.
[2] Schou, C., Rasmussen, G., Kaltoft, M. B., Henrissat, B.,Schülein, M., Eur. J. Biochem. 1993, 217, 947.
[3] Schülein, M., Tikhomirov, D. F., Schou, C., in: Suominen,P., Reinikainen, T. (Eds.), Proceedings of the Second TRI-CEL Symposium on Trichoderma reesei Cellulases andOther Hydrolases, Espoo, Finland 1993, pp. 109±116.
[4] Schülein, M., Biochem. Soc. Trans. 1998, 26, 164±167.
[5] Davis G. J., Dodson, G. G., Hubbard, R. E., Tolley, S. P.,Dauter, Z., Wilson, K. S., Hjort, C., Mikkelsen, J. M., Schü-lein, M., Nature 1993, 365, 362±364.
1410 F. Attanasio et al. Electrophoresis 1999, 20, 1403±1411
[6] Davis, G. J., Tolley, S. P., Henrissat, B., Hjortand, C., Schü-lein, M., Biochemistry 1995, 34, 16210±16220.
[7] Tanford, C., Physical Chemistry of Macromolecoles, J.Wiley & Son, New York 1961, pp. 317±586.
[8] Tanford, C., Wagner, M. L., J. Am. Chem. Soc. 1954, 76,3331±3336.
[9] Tanford, C., Swanson, S. A., Shore, W. S., J. Am. Chem.Soc. 1955, 77, 6414.
[10] Tanford, C., Hanenstein, J. D., J. Chem. Soc. 1956, 78,5287.
[11] Breslow, E., Gurd, F. R. N., J. Biol. Chem. 1962, 237,371±381.
[12] Yao, M., Bolen, D. W., Biochemistry 1995, 34, 3771±3781.
[13] Hermans Jr., J., Rialdi, G., Biochemistry 1965, 4, 1277±1281.
[14] Marini, M. A., Martin, C. J., Methods Enzymol. 1973, 27,590±616.
[15] Shiao, D. D., Sturtevant, J. M., Biopolymers 1976, 15,1201±1211.
[16] Marini, M. A., Martin, C. J., Anal. Chem. 1979, 8, 221±286.
[17] Galletto, R., Attanasio, F., Dossi, E., Schülein, M., Rialdi,G., Thermochim. Acta 1998, 321, 17±21.
[18] Righetti, P. G., Krishnamoorthy, R., Giannazza, E. Labie,D., J. Chromatogr. 1978, 166, 455±460.
[19] Hedrick, J. L., Smith, A. J., Arch. Biochem. Biophys. 1968,126, 155±164.
[20] Margolis, J., Kenrich, K. G., Anal. Biochem. 1968, 25,347±362.
[21] Rothe, G. M., Maurer, W. D., in: Dunn, M. J. (Ed.), Gel Elec-trophoresis of Proteins, Wright, Bristol 1986, pp. 37±140.
[22] Rothe, G. M., Bohrman, R., in: Radola, B. J. (Ed.), Electro-phorese Forum ©86, Technische Universität München 1986,pp. 342±350.
[23] Rothe, G. M., in: Wagner, H., Blasius, E. (Eds.), Praxis derelektrophoretischen Trennmethoden, Springer-Verlag, Ber-lin, Heidelberg 1989, pp. 21±92.
[24] Rothe, G. M., Adv. Electrophor. 1991, 4, 251±358.
[25] Rothe, G. M., in: Rothe, G. M. (Ed.), Electrophoresis ofEnzymes Laboratory Methods, Springer-Verlag, Berlin1994, pp. 71±124.
[26] Christensen, T., Wöldike, H., Boel, E., Mortensen, S. B.,Hjortshoj, K., Thim, L., Hansen, M. T., Biotechnology 1988,4, 1419±1422.
[27] Laemmli, U. K., Nature 1970, 227, 680±685.
[28] Righetti, P. G., Isoelectric Focusing: Theory, Methodologyand Applications, Elsevier Biomedical Press, Amsterdam1983, pp. 1±86.
[29] Görg, A., Postel, W., Westermeier, R., Anal. Biochem.1978, 89, 60±70.
[30] Lambin, P., Anal. Biochem. 1978, 85, 114±125.
[31] Lambin, P., Fine, J. M., Anal. Biochem. 1979, 98, 160±168.
[32] Lide, D. R. (Ed.), Handbook of Chemistry and Physics, 74thEd., CRC Press, Boca Raton, 1993±1994, pp. 6,20±6,27.
[33] Cantor, C. R., Schimmel, P. R., Biophysical Chemistry,W. H. Freeman, San Francisco 1980, pp. 539±589.
[34] Van Holden, K. E., in: Hager, L., Wold, F., (Eds.), PhysicalBiochemistry, Prentice-Hall, Englewood Cliffs, NJ 1971, pp.122±157.
[35] Henry, D. C., Proc. Roy. Soc. A 1931, 133, 106±140.
[36] Bjurulf, C., Eur. J. Biochem. 1972, 30, 33±36.
[37] Clarke, S., Stephenson, R. C., Lowenson, J. D., in: Ahern,T. J., Manning, M. C. (Eds.), Stability of Protein Pharma-ceuticals, Plenum Press, New York 1992, pp. 1±29.
[38] Liu, D. T., Trends Biotechnol. 1992, 10, 364±368.
Electrophoresis 1999, 20, 1403±1411 Titration curve of cellulase Cel45-core 1411


![CALCULATION OF ISOELECTRIC POINTS. · 808 Calculation of Isoelectric Points Except in the special case where the isoelectric point is at the “neutral” point of water [H+] does](https://img.pdfslide.us/doc/110x75/5f0a52187e708231d42b1422/calculation-of-isoelectric-808-calculation-of-isoelectric-points-except-in-the.jpg)


![[Group 5] electrochemistry, electrophoresis, isoelectric focusing](https://img.pdfslide.us/doc/110x75/55c5bdefbb61eb5a3b8b458a/group-5-electrochemistry-electrophoresis-isoelectric-focusing.jpg)