Embed Size (px)
Citation preview

Analytical Review of Bangladesh's
Macroeconomic Performance in
FY2010-11 and
Early Signals of FY2011-12
CH
AP
TE
R
1

State of the Bangladesh Economy in FY2010-11 3
CH
AP
TE
R
1
1.1INTRODUCTION
The present chapter seeks to trace the emerging trends in the Bangladesh economy in the
fiscal year 2011-12 (FY2011-12). To this end, the study first establishes the benchmark
conditions of the current fiscal year by sketching a consolidated picture of FY2010-11 with
an analysis of the year-closing data. The chapter then attempts to analyse the early signals
of the current fiscal year.
With a view to highlight the major challenges facing the Bangladesh economy in the
FY2011-12, the paper focuses on four critical issues. These are the followings:
a. Implications of the new wave of global economic crisis;
b. Deepening stresses in public finance management;
c. Unabated price inflation; and
d. Increasing pressure on the balance of payments (BOP).
The chapter rounds up by drawing lessons from the foregoing analyses and by putting
forward a number of policy suggestions to deal with the identified macroeconomic concerns.
The attempt of the present study has been structured around its key objectives. It builds
on the Centre for Policy Dialogue's (CPD) earlier works on the subject, and uses the most
recent information available from official sources to provide an up-to-date analysis of the
current state of Bangladesh economy.
This is the first reading of the state of Bangladesh economy in FY2011-12 prepared under
CPD's programme on Independent Review of Bangladesh's Development (IRBD). It is
planned to be followed up by two other assessments before the announcement of the
national budget for FY2012-13.
1.2ESTABLISHING THE BENCHMARK: AN EVALUATION OF THE FISCAL YEAR
2010-11
1.2.1 Growth Performance
A notable turnaround of the manufacturing sector (backed up by the export-oriented
enterprises), strong performance of the crops sector, and anticipated momentum in public
investment contributed to a high projection of 6.7 per cent of gross domestic product
(GDP) growth by the Bangladesh Bureau of Statistics (BBS) for FY2010-11. A recovering
global economy with attendant prospects of robust performance by the country's export
and linked sectors was also a reason that informed this optimistic scenario. Indeed, if this
turns out to be actually the case, the estimated GDP growth rate for FY2010-11 would be
the highest ever achieved in post-independence Bangladesh. What is also remarkable is

Independent Review of Bangladesh's Development4
CH
AP
TE
R
1
GDP Growth and Sectoral Share(in Per cent)
Table 1.1
Source: Bangladesh Bureau of Statistics (BBS).
Note: *Provisional estimates.
Sector Share Growth Incremental Share
FY2010 FY2011 FY2010 FY2011* FY2010 FY2011
Agriculture 19.6 19.3 5.2 5.0 17.1 14.6
of which Crops 11.0 10.9 6.1 5.0 11.1 8.3
Industry 28.9 29.3 6.5 8.2 30.8 35.4
of which Manufacturing 17.3 17.8 6.5 9.5 18.5 24.8
Services 48.1 48.1 6.5 6.6 51.1 47.9
Import Duty 3.4 3.3 1.8 4.2 1.0 2.1
Total 100.0 100.0 6.1 6.7 100.0 100.0
that, this high growth rate would have been
achieved over the relatively high
benchmark of 6.1 per cent in FY2009-10
(Table 1.1).
The impressive GDP estimates, however,
are provisional and are likely to be revised.
Actual growth performance would hinge on
two critical factors: (a) robustness of
investment projections, particularly of
public investment, based on the Revised
Annual Development Programme (RADP)
when the GDP estimates for FY2010-11
were prepared; and (b) estimates of growth
of the manufacturing sector which, in view of information on the actual performance over
the first six months, appeared to be rather optimistic. As is known, even the reduced RADP
could be implemented only to the tune of 91.5 per cent. However, it appears that growth
in the manufacturing sector gained some momentum in the second half of FY2010-11.
Driven by an upbeat export sector that posted a high 41.5 per cent growth, medium and
large-scale manufacturing sectors posted a record 17.7 per cent growth in terms of
quantum index of production (QIP). The QIP of small industries also marked 3.3 per cent
growth, a significant upturn in view of the negative growth ((-) 6.1 per cent) in the first
half of the fiscal year. Whether, in the end, the final GDP growth estimate for FY2010-11
manages to reach the record high growth projection of 6.7 per cent, is to be seen when
BBS comes out with the final figures in a few months time.
1.2.2 Three Major Achievements
Export was Robust
Exports showed remarkable turnaround in FY2010-11 having experienced the adverse
consequences of the global economic slowdown in FY2009-10. Bangladesh's global export
in FY2010-11 posted a high growth of 41.5 per cent against only 4.1 per cent growth in
FY2009-10, with both readymade garments (RMG) and non-RMG products registering
significant growth rates of 43.4 per cent and 35.1 per cent respectively. Robust export
performance helped maintain a foreign exchange reserve of USD 10,911.6 million at the
end of FY2010-11, which matched the corresponding reserve levels at the close of
FY2009-10 (USD 10,749.7 million). However, the attained growth was achieved over a low
benchmark growth of FY2009-10, and could prove difficult to sustain in FY2011-12.
An important aspect of the impressive export performance in FY2010-11 was that along
with growth in the volume of exports, average prices in the global market also appeared
to have posted some rise. For example, growth rates in terms of export volume for knit
and woven RMG were 19 per cent and 20 per cent respectively in FY2010-11, which would
imply that price indices have also seen significant rise. However, rise in prices also
reflected a significant increase in cost of production, particularly in view of high cotton
prices in FY2010-11.
Collection of Tax Revenue Strengthened
In continuation of its commendable efforts in the recent past, the National Board of
Revenue (NBR) has achieved a significant 27.2 per cent revenue growth in FY2010-11, far
outpacing the targeted growth rate of 16.8 per cent (by Tk. 6,502 crore). Impressive
growth rates were achieved for most of the components, particularly in case of income tax

112.5 per cent in June 2011.
State of the Bangladesh Economy in FY2010-11 5
CH
AP
TE
R
1component (32.4 per cent). In the non-NBR tax component as well, an impressive 17.7 per
cent growth was recorded in FY2010-11. Although this was lower than the annual target of
25.8 per cent, this is a significant improvement in view of the low growth of 3.4 per cent
achieved in FY2009-10.
Turnaround in Manpower Export
Significant slowdown in the outward migration had emerged as a major concern for
Bangladesh in FY2009-10. The adverse impact of this was quite obvious, particularly from
the perspective of foreign exchange earnings, domestic employment situation, poverty
alleviation efforts and foreign exchange reserve situation. As may be recalled, the number
of people going abroad for jobs declined from about 0.65 million in FY2008-09 to 0.43
million in FY2009-10. It was somewhat of a relief that the decline appears to have been
arrested in FY2010-11; as a matter of fact, the number of migrant workers leaving the
country marginally increased to reach 0.44 million in this year. However, growth in
remittance earnings further slowed to single digit (6 per cent) in FY2010-11 from the
robust 13.4 per cent recorded in the previous year.
In spite of some of the positive achievements relating to a number of important
macroeconomic performance indicators, several disquieting fault lines began to appear in
the economy as FY2010-11 approached its finishing line. Inflationary momentum
continued to sustain, overall BOP position went into a negative terrain, burden of
subsidies started to pick up significantly, particularly in the backdrop of operationalisation
of (quick) rental plants, and bank borrowings were rising as a consequence of lower
utilisation of foreign aid and higher unplanned public expenditure. Sustained moderately
high growth with macroeconomic stability, which was the hallmark of Bangladesh's
economic performance during the last decade, came under serious threat as the economy
moved towards FY2011-12.
1.2.3 Pressure Points of Macroeconomic Situation
Despite the high GDP growth in FY2010-11 and the success in terms of high export
earnings, remittance flow and revenue collection, a number of pressure points developed
in the overall macroeconomic scenario of the country. These worrying developments
transmitted a cautionary signal with regard to the country's macroeconomic
management in the near-term. A number of these developments were new, whilst some
of the others were carried from the past only to have had aggravated in the process with
the passage of time.
Prices Continued to Soar
Contrary to what one would have expected from the impressive growth in the crops
sector, as noted earlier, food prices continued to soar and drove up the overall inflation
rate in FY2010-11. Moving average inflation rate for the fiscal year stood at 8.8 per cent,
higher than the set target of 7 per cent. Point-to-point inflation in June 2011 was 10.2 per
cent compared to 8.7 per cent in June 2010. Food inflation rate was higher1 than the
general inflation rate. It appears that trends in food prices have become somewhat
de-linked from the food production and availability situation. With no major production
shocks in recent times, food price hike appears to reflect a transmission of the high global
prices to the domestic market. As Table 1.2 would evince, in FY2010-11 production was
better, import had increased, public foodstock was higher, and offtakes under Vulnerable
Group Development (VGD), Vulnerable Group Feeding (VGF), Food for Work (FFW) and

2World Bank (2011).
3No change has been mentioned on this in the January-June MPS of FY2010-11.
4Cash Reserve Ratio (CRR) and Statutory Liquidity Ratio (SLR) were raised twice, and Repo and Reverse Repo rates were increased
thrice during FY2010-11.
Independent Review of Bangladesh's Development6
CH
AP
TE
R
1
Food Situation(Lakh MT)
Table 1.2
Source: Bangladesh Bank.
Note: *After 12 per cent deduction for FY2009-10, and 10 per cent for FY2010-11 for seed, feed, waste, etc.
Year Actual Net Foodgrains Import Public Public Foodgrains
Production Production* Government Private Total Procurement Distribution Stock
(Gross) and (End June)
Food Aid
FY2009-10 332.3 292.4 5.6 29.0 34.6 8.1 19.6 5.3
FY2010-11 345.1 321.5 22.0 31.1 53.1 4.6 22.9 8.9
Open Market Sales (OMS) were more than the previous year. Yet, prices continued to
rise, in tandem with the rising world prices. In this connection, one may recall World
Bank estimates which indicate a contemporaneous correlation between rice prices of
Kolkata-Dhaka and Thailand-Dhaka to be 0.9 and 0.8 respectively, implying that they tend
to move closely together.2
In its attempt to control the inflationary pressure, the Central Bank resorted to intervening
in the money market and bringing down the credit growth. The Monetary Policy
Statement (MPS) (for July-December 2010 or the first half of FY2010-11)3 of the
Bangladesh Bank targeted to significantly reduce the growth in money and credit supply.
However, reining in the credit growth proved to be difficult in the face of higher credit
demand from both public and private sectors: total outstanding domestic credit increased
by 27.4 per cent, while net credit to the government and to the private sector posted 34.9
per cent and 25.8 per cent growth respectively, in FY2010-11. Disbursement of term loan
increased by 24.3 per cent, while that of agricultural credit increased by 9.6 per cent.
Broad money (M2) supply also recorded a significant increase of 21.3 per cent over the
last year. In response, Bangladesh Bank resorted to multiple increases in the policy rates.4
At the same time, higher demand for trade financing originated from significant import
growth of 41.8 per cent in FY2010-11. Growing investment demand, and more
importantly, the bubble in the capital market also wiped out a large part of the excess
liquidity in the system. This resulted in a decline in the level of the excess liquidity which
stood at Tk. 20,660 crore at the end of January 2011. This was the lowest amount of
excess liquidity in two years. The bust in the capital market, following the boom, however,
helped ease the liquidity pressure on scheduled banks.
Subsidy Pressure Intensified
As a strategy to combat food price hike, the government decided to focus more on food
import rather than domestic procurement, through increased public as well as private
channels. Higher imports and more extensive distribution of foodgrains led to significant
rise in food subsidy requirement. Initial subsidy allocation of about Tk. 1,200 crore was
later revised upwards to about Tk. 1,650 crore. However, it was the fuel subsidy
requirement that emerged as the critical issue. This was underwritten not as much by the
rise in international prices than the fact of the growing demand for petroleum products in
the backdrop of rising fuel needs to service the newly installed fuel-fired quick rental and
rental power plants (RPPs). Loss of Bangladesh Petroleum Corporation (BPC), the sole
importer of petroleum products, was to the tune of Tk. 2,300 crore in FY2009-10. In
FY2010-11 BPC had incurred a loss of about Tk. 7,200 crore. This was way over the subsidy
allocation of Tk. 4,000 crore kept for the BPC in the revised budget of FY2010-11.

5Original target for revenue growth in FY2010-11 was set at 22 per cent, which was raised to 25.2 per cent in the revised budget.
State of the Bangladesh Economy in FY2010-11 7
CH
AP
TE
R
1ADP: Business as Usual
The implementation of Annual Development Programme (ADP) stood at Tk. 32,830 crore
during FY2010-11, which was Tk. 5,670 crore less than the original target, implying an
implementation rate of 85.3 per cent (of the original budget). This was about the same
level of the last year (85 per cent). However, in Taka terms the implemented ADP was 26.7
per cent higher. As a result, ADP-GDP ratio in FY2010-11 was higher at 4.2 per cent, an
improvement from the 3.7 per cent of the previous year. An added concern regarding the
ADP had been the higher share of local financing in the absence of envisaged foreign
financing. Of the implemented ADP of FY2010-11, about 70.6 per cent had to be financed
from local sources; this was in the range of 60-65 per cent in the previous years. This led
to a higher government borrowing from the banking system, putting pressure on credit
availability for the private sector.
Non-Tax Sources of Revenue Remained as Low Performers
In continuation of the commendable performance of recent years, overall revenue
collection increased by 20.3 per cent in FY2010-11.5 However, this growth was singularly
shouldered by NBR since non-tax component, constituting almost one-fifth of the total
revenue target of FY2010-11, declined by 12.3 per cent compared to FY2009-10 (against
the targeted growth of 25.2 per cent).
Low Offtake of Foreign Aid, Budget Deficit Squeezed
Budget deficit amounted to Tk. 31,013.2 crore (3.3 per cent of GDP against 5 per cent
envisaged in the budget) in FY2010-11. However, one could argue that although the deficit
remained under control, it was in part due to the wrong reason, i.e. the low level of ADP
implementation. A major nagging concern in FY2010-11 was the low disbursement of
foreign aid. In the backdrop of the expected project aid not having been materialised,
government went on to finance a significantly larger proportion of the deficit through
domestic borrowing, more specifically through bank borrowing. Against a negative net
bank borrowing of (-) Tk. 2,092.5 crore in FY2009-10, the amount borrowed in FY2010-11
was Tk. 25,210.2 crore. As financing opportunities by way of both non-bank borrowing and
foreign borrowing was low, as much as 81.3 per cent of the deficit needed to be financed
from bank borrowing. To compare, in FY2009-10, about 27.6 per cent of the financing was
made from foreign borrowing and 82 per cent from non-bank borrowing; indeed
contribution from the banking sources experienced a decline (by (-) 9.6 per cent).
Collapse of the Capital Market
As was mentioned, excess liquidity of the scheduled banks declined quite dramatically and
reached its nadir during December-January period of FY2010-11. This was accompanied by
a significantly rising trend in market capitalisation in the share market. While excess
liquidity declined by over 28 per cent between June 2010 and December 2010, market
capitalisation increased by over 24 per cent during the same period. Evidence suggests
that a large part of industrial, consumer and other credit money were diverted to the
capital market. This contributed to drying up of liquidity in the banking system, contrary to
the liquidity requirement ratios set by the Bangladesh Bank. When CRR was raised by
Bangladesh Bank in December 2010, this led to forced selling of shares by the over-
exposed banks to comply with the new requirement. This had a knock-on effect on the
capital market which experienced a sharp downturn. However, as a consequence, liquidity
situation improved also because Bangladesh Bank complemented this by injecting money

6UNDESA (2011).
Independent Review of Bangladesh's Development8
CH
AP
TE
R
1into the market through the use of Repo auctions. Undermining of the nexus between
banking sector and capital market has significantly weakened the management of
monetary sector. Lack of prudential management by the Central Bank, particularly in the
early stages of capital market boom, contributed to this and stability in the capital market
was not restored till the close of the fiscal year in end-June 2011.
Balance of Payments under Pressure
BOP situation came under increasing pressure in FY2010-11. Current account balance
experienced significant deterioration mainly because of the negative trade balance
component with a deficit of USD 2.2 billion, and imports outpaced the robust export.
Trade balance stood at negative (-) USD 7,328 million as against a negative balance of
(-) USD 5,155 million in FY2009-10. Financial account also recorded significant deficit of
(-) USD 1,584 million against a deficit of (-) USD 651 million in FY2009-10. This was driven
by lower foreign direct investment (FDI) inflow (USD 768 million as against USD 913
million in FY2009-10), and reduction in net aid flow (USD 312 million against USD 902
million in FY2009-10). As a result, a deficit to the tune of (-) USD 635 million was recorded
in the overall balance, deteriorating from a surplus of USD 2,865 million recorded in
FY2009-10. The emergent BOP situation further necessitated the need to improve
remittance flow and secure foreign financing to meet the rising investment demand.
1.3FOUR CRITICAL CONCERNS FOR FISCAL YEAR 2011-12
1.3.1 Adverse Spillovers from Global Economic Situation
Uncertain Global Prospect
Nearly three years after the downturn observed in 2009, the developed countries in the
North America, Europe and Asia still continue to grapple with an uncertain future and
markets are agitated by trepidations of new setbacks, defaults and the possibility of a
'double-dip' recession. A number of factors are behind the current situation, including
the high unemployment rate in the USA, the sovereign debt crisis in Europe, and decision
by credit rating agencies to downgrade the ratings of some of the developed countries.
Also, the tsunami and earthquake in Japan had transmitted shocks to the global
economy. The fact that the European Union (EU) debt rescue package is in a vulnerable
position due to the Greek referendum announcement, has further heightened the
likelihood of a recession.
Uneven Recovery of Output
The growth of the world economy is expected to increase by 3.3 per cent in 2011, and in
2012 the rate may reach 3.6 per cent6 - marginally higher than that was predicted earlier.
For EU, the growth rate may remain stagnant in 2011 and 2012, at level lower than the
pre-crisis benchmark. According to the latest forecast, USA is expected to grow in 2012 at
a rate lower than that of 2011 (details in Table 1.3).

State of the Bangladesh Economy in FY2010-11 9
CH
AP
TE
R
1
Growth of World Output and Trade (Annual Percentage Change): 2005-2012
Table 1.3
Source: UNDESA (2011) and UNDESA (2011a).
Note: *2011 and 2012 figures were later updated; available in UNDESA (2011a).
Region 2005-2008 2009 2010 2011 2012 2011* 2012*
(Average)
World 3.3 -2.1 3.9 3.3 3.6 3.5 3.7
USA 1.9 -2.6 2.9 1.6 2.5 3.0 2.8
European Union 2.2 -4.2 1.8 1.7 1.9 1.8 1.8
South Asia 7.5 5.7 7.1 6.9 7.0 6.8 6.8
China 11.3 9.1 10.3 9.1 8.9 8.9 9.0
Least developed countries (LDCs) 7.7 4.1 4.7 5.6 5.8 5.5 5.7
World trade in goods and services 7.1 -11.1 11.9 7.1 6.8 7.6 7.1
The Federal Reserve has cut the GDP growth forecast for USA to 1.6 per cent in 2011,
down from an earlier forecast of 2.9 per cent. The Reserve also predicted that the US
economy would grow at 2.5 per cent in 2012 and by 3.5 per cent in 2013 (FOMC 2011).
Thus, the world economy continues to experience a faltering recovery. Moreover, the
process is uneven as China, India, Brazil and other emerging economies are demonstrating
impressive growth and fuelling the engine of global recovery, while developed countries
are lagging behind.
Slowdown in Global Trade
Recent global trade expansion was mostly led by the Asian economies. World trade in
goods and services expanded by about 12 per cent in 2010, more than what was
previously estimated, after the steep decline of (-) 11 per cent in 2009. Yet growth of
global trade is expected to fall, as per latest estimates, to 7.6 per cent in 2011, and further
down to 7.1 per cent in 2012 (UNDESA 2011a).
Inflationary Trend
It needs to be further noted that the covariate shocks in Japan have undermined the world
financial market, whereas unrest in Western Asia and North Africa have contributed to
further increase in oil prices. Sustained high prices of foodgrains along with other
commodities also pose a threat to the process of economic recovery. Soaring headline
inflation is corroding real income of the common people across the world. This has
compelled governments to safeguard consumers' interests through subsidies and cash
transfer programmes, which in turn, is putting further pressure on the fiscal situation.
However, a weak Dollar is expected to help take some of the heat off the mounting oil and
food prices in the world market. In addition, better harvests are expected to moderate
food prices in the near-term. Nevertheless, all projections indicate that there is hardly any
possibilities of food prices going back to their pre-2007 levels, although they may have
come down somewhat.
Capital Flow
Net private capital flows to developing countries have increased as investors are shifting
parts of their portfolios to emerging markets, mostly in developing economies, in the form
of short-term equity investments and FDI. This trend has put upward pressure on the
foreign exchange rate of the currencies of developing countries, putting pressure to
undertake sterilisation measures to offset the risks allied with the influx of capital inflows.

7UNDESA (2011).
8From a peak of 8.9 per cent in 2007 to 6.3 per cent in 2009.
Independent Review of Bangladesh's Development10
CH
AP
TE
R
1Aid Prospects
In the backdrop of fiscal consolidation taking place in developed economies, and given the
ongoing Eurozone debt crisis, the outlook for generous aid appears to be rather bleak;
prospects of adequate financial support for implementation of the Millennium
Development Goal (MDG)-related investments in the low-income countries also appears
to be uninspiring.
Scope for Another Stimulus
Many of the developed countries had to prematurely discontinue their stimulus packages
as a consequence of deteriorating fiscal situation. Thus, the scope for a second round of
stimulus package appears to be bleak. High inflationary trend has also made pursuance of
counter-cyclical policy difficult.
In sum, as the world economy braces for a possible second cycle of economic recession,
opportunities to deploy counter-acting policy measures have reduced significantly. The
developed economies have much less economic flexibility at present; to make a bad thing
worse, new risks have appeared in the mean time. Indeed, the evolving adverse trends in
the global economy are going to have cross-border spillover effects, affecting particularly
the developing countries to various extent and degrees.
Outlook for South Asia
Dual Track
South Asia has been able to absorb the impacts of the global financial shocks rather well.
The reason for this can be primarily attributed to the stellar economic performance of
countries such as India and Sri Lanka. The South Asian economy is projected to grow at 7
per cent and 7.2 per cent in 2011 and 2012 respectively. Again, India is expected to be the
major driver of this growth. The country with a population of 1.2 billion is expected to
achieve GDP growths rates of 8.6 per cent and 9.1 per cent in 2011 and 2012. Sri Lanka is
projected to grow at a slightly higher than the South Asian average growth rate of 7.8 per
cent and 7.4 per cent over the next two years.
However, countries such as Nepal (4.3 per cent and 4.6 per cent) and Pakistan (3.8 per
cent and 4.2 per cent) are estimated to grow at a much slower pace. This is likely to be the
story in the near future for South Asia - India will continue to grow with dynamism whilst
the other South Asian countries will have mixed fortunes.7
South Asian Resilience
The slowdown in the regional GDP growth rates by nearly 3 percentage points8 was the
least pronounced among the developing regions. The adverse effects were nevertheless
significant - large negative output shocks, job, income and wealth losses, erosion of
confidence, stock market declines, indirect contagion effects propagated by domestic
financial markets, losses in exports and tourism, and pressure on the already-weak fiscal,
BOP, reserves and exchange rates. However, these extents of the damage were
eventually contained.
The macro impacts of the crisis were most severe on countries with weaker
macroeconomic fundamentals and higher external vulnerabilities. These included in
Maldives, Pakistan and Sri Lanka. The crisis also affected India because of the contagion

State of the Bangladesh Economy in FY2010-11 11
CH
AP
TE
R
1impact in terms of spending; there was limited negative impact in other countries
including Bangladesh, Bhutan and Nepal.
Some key factors insulated South Asia's growth during the crisis and have helped its strong
recovery performance. Sources of this resilience included remittance inflow, export
expansion, good agriculture production, and strong policy responses.
Decline in External Demand and Weakened Macroeconomic Fundamentals
Continued recession in the developed markets is affecting external sectors of the South
Asian economies. Exports from South Asia are slowing in most recent months, including
key exports such as garments. Remittances, thus far a key strength, is showing some signs
of slowing down as well. The number of returning workers is rising further accelerated by
recent Middle East unrest, as in the case for Bangladesh and Nepal.
Inflation, fuelled by the surging commodity prices (particularly oil prices), is volatile which
poses special challenges for South Asia as a largely import-dependent region. Central
banks of several countries such as Bangladesh, Pakistan and India responded by tightening
monetary policy further. However, if this continues, it is likely to weaken domestic
demand and economic growth in the near future.
It may be difficult for the individual countries in the region to come up with response
mechanisms as they did at the time of previous economic crisis because of the
following reasons:
� Limited fiscal space, most of the countries have already implemented
austerity measures;
� High levels of public debt compared to the pre-crisis level;
� Inflationary pressure have resulted in central banks in the region to rise the interest
rates; and
� Weakening of the United States Dollar (USD) would mean that regional currencies
would not undergo significant devaluation against the USD.
The impact of a possible double-dip recession will also be felt differently by the different
South Asian countries because of their varying sources of resilience and vulnerability. Thus
there is a need for the governments of these countries to design and implement policies
relevant to their country's needs and susceptibility.
Challenges for Bangladesh
All economic risks are cross-bordered, and are by and large inter-dependent. Thus,
Bangladesh is no less threatened from the global risks and uncertainties. Despite having
an estimated growth rate of 6.7 per cent in FY2010-11, several growing downside risks
arising from external economic environment are exerting added pressure on
her economy.
The transmission channels of the implications of global economic downturn for the
Bangladesh economy are primarily mediated through trade, remittances, foreign aid and FDI.
European countries account for 50 per cent of Bangladesh's export basket. Major export
destinations in EU-27 are - Germany, United Kingdom (UK), France, Spain, Italy, Belgium
and Netherlands. Thus the current Euro debt crisis is likely to have adverse implications for
Bangladesh's exports in general, and exports of apparels in particular, in the EU. First signs
of this are already there. In view of this, Bangladesh will need to focus on extra-EU
markets, particularly markets in the developing countries.

9Bhattacharya and Dasgupta (2011).
Independent Review of Bangladesh's Development12
CH
AP
TE
R
1
Source: Ministry of Finance (MoF).
Note: *B denotes Budget.
Fiscal Deficit as Per cent of GDP
Figure 1.1
3.0 2.8
5.1
3.6
4.7
3.3
5.0
0.0
1.0
2.0
3.0
4.0
5.0
6.0
FY
06
FY
07
FY
08
FY
09
FY
10
FY
11
FY
12
(B
)*
Pe
r ce
nt
The knock-on effect on remittances may not be very high since about two-third of the
remittance flow originates from the Middle East. However, the spectre of double-dip crisis
in the developed world and the after-effects of the turmoil in the Middle East are likely to
weaken remittance flow in the coming months.
Bilateral aid from the European countries (and Japan) may get constricted as the
governments of these countries opt for austerity measures. However, a number of
countries (e.g. UK) promised to stick to their pledge to expand the volume of official
development assistance (ODA), which is good news for Bangladesh.
Crisis on Hand
In the event of another cycle of global economic crisis, it will be difficult for Bangladesh to
come up with response mechanisms as she did in 2008, due to weakened macroeconomic
fundamentals informed by surging non-development expenditures, pressure on BOP and
high level of prices. These factors have eroded the fiscal and monetary space. On the
other hand, Bangladesh should also be prepared to take advantage of the opportunities
that may emerge. In the backdrop of current global situation and global demand, prices of
key commodities in the international market, including that of fuel and key intermediates,
could come down. This could help Bangladesh's macroeconomic balance. Demand
switching could help some types of garments exports. Thus, there is a need to remain alert
to such possibilities.
The global financial crisis that started in the US and Europe in 2008 had a lagged impact on
the economy of Bangladesh resulting, by some estimates, in a 0.6 per cent loss of
GDP growth.9 It will be a challenge for the government to manage the economy in the
current fiscal year in view of the emergent pressure points, whilst at the same time
addressing the negative spillovers of the recent developments in the global economy.
1.3.2 Deepening Stresses in Public Finance Management
Managing Fiscal Deficit
Over the last few years, barring FY2007-08, fiscal deficit remained below 5 per cent of
GDP. This has happened largely because of underutilisation of development funds
underwritten by foreign (project) aid. In the
budget for FY2011-12 a deficit of 5 per cent
of GDP has been projected; total volume of
the deficit being Tk. 45,204 crore. The
projected deficit, in Taka terms, is 40.6 per
cent higher than the actual deficit of the
previous year. However, this proposed
deficit figure remains within the trend
(Figure 1.1).
However, a major structural change has
been envisaged in the financing plan of the
budget deficit for FY2011-12 in comparison
to the realised figures for FY2010-11.
Concretely, 32.4 per cent and 67.6 per cent
of budget deficit are to be financed

State of the Bangladesh Economy in FY2010-11 13
CH
AP
TE
R
1
Deficit Financing in FY2010-11 and FY2011-12(Crore Tk.)
Table 1.4
Source: Ministry of Finance (MoF).
Note: Figures in parentheses indicate share in total financing.
Source of Budget Actual Difference Budget
Financing FY2011 FY2011 (Actual and FY2012
Budget FY2011)
Foreign 10834.4 2232.5 -8601.9 13058.0
Borrowing (Net) (31.4) (7.2) (32.4)
Foreign 15968.0 7659.7 -8308.3 18685.0
Borrowing (46.3) (24.7) (46.4)
Amortisation -5133.6 -5427.3 -293.7 -5626.7
(-14.9) (-17.5) (-14.0)
Domestic 23679.6 28780.8 5101.2 27208.0
Borrowing (68.6) (92.8) (67.6)
Bank Borrowing 15680.0 25210.2 9530.2 18957.0
(Net) (45.4) (81.3) (47.1)
Non-Bank 7999.6 3570.6 -4429.0 8250.8
Borrowing (Net) (22.2) (11.5) (20.5)
Total Financing 34513.9 31013.2 -3500.7 40266.0
(100.0) (100.0) (100.0)
Source: Ministry of Finance (MoF).
Sources of Financing
Figure 1.2
0
10
20
30
40
50
60
70
80
90
100
FY
01
FY
02
FY
03
FY
04
FY
05
FY
06
FY
07
FY
08
FY
09
FY
10
FY
11
FY
12
(B
)
Pe
r ce
nt
of
Sh
are
Net Foreign Borrowing Net Domestic Borrowing
respectively from foreign and domestic
sources in FY2011-12 (Table 1.4). The
comparable actual figures for the previous
year were 7.2 per cent and 92.8 per cent
respectively. This means the government, in
the current fiscal year, will have to secure
foreign financing of almost six times more
than the amount received in FY2010-11.
The structural change programmed in the
financing plan of the budget deficit relates
to composition of the domestic sources of
borrowing. If bank borrowing accounted for
87.6 per cent of the domestic sources of
finance in FY2010-11, the comparable
figures in the current fiscal year has been
fixed at 69.7 per cent.
Early figures for FY2011-12 suggest that
both these programmed compositional
changes are far from being on track.
Indeed, inability to maintain these changes epitomise the current fault lines of fiscal
management in Bangladesh economy. A closer look at these two critical variables will
reveal the underlying entrenched problems of macroeconomic situation of the country.
Marginalisation of Foreign Aid Inflow
Foreign aid inflow to Bangladesh economy has more or less steadily fallen during the
current decade. This has led to an apparent fall in aid dependence of the country.
However, development financing continued to remain critically dependent on foreign
sources, particularly in the areas of social and physical infrastructure.
In FY2000-01, share of foreign sources accounted for about 40 per cent of the financing of
fiscal deficit, which a decade later in FY2010-11, was only a little above 7 per cent of the
same (Figure 1.2). The occasional rise in the
share of foreign aid has been largely related
to flow of humanitarian assistance during
various natural disasters. This drop has very
little to do with fall in aid commitment, as
more than USD 13 billion remaining in the
pipeline. Rather, it has mostly to do with
the inability of government to keep up with
the disbursement timeline due to failure in
undertaking collateral preparations.
Arguably, low absorption capacity of the
economy is partly responsible for the
emerging situation. The direct fall out of
such a negative trend had been low
utilisation of project aid, leading to low
delivery of ADP. In some cases, it has led to
substitution of foreign financing by
domestic resources.
During July-September 2011, Bangladesh received USD 246.2 million in aid, while
amortisation accounted for USD 171.8 million resulting in net flow of only USD 74.4

Independent Review of Bangladesh's Development14
CH
AP
TE
R
1million. This figure happens to be USD 98.6 million (57 per cent) less than the comparable
figure for the preceding year.
Recent developments in Bangladesh government's relationship with the major
development partners indicate that this trend may not improve readily. For example, large
part of the programmed foreign aid inflow was attributable to release of early trenches of
the foreign fund earmarked for the Padma Multipurpose Bridge which is currently facing a
standoff. Postponement of the meeting of the Bangladesh Development Forum (BDF)
signals the complexity currently afflicting the government's relationship with its
international development partners. It may be safely underscored that without substantial
increase in foreign aid flow, macroeconomic stability will remain under serious threats.
What are the options for the government in this regard? First, the government should put
its best foot forward to get the committed foreign funds disbursed for the ongoing
projects. Indeed, this will require project-by-project intensive monitoring jointly with the
partners. A number of useful operational suggestions are available in this regard which
only need to be acted upon with utmost urgency and sincerity.
Second, the government may intensify its effort to get budgetary support from the
international and regional financial institutions. However, with the Padma Bridge
impasse, World Bank will be hardly forthcoming to provide a budget support. The
planned visit of the International Monetary Fund (IMF) Mission in December may decide
on a programme loan. However, the fiscal and other conditionalities usually associated
with such loans call for caution. One would suspect, given the dire state of public
exchequer, the government will have little flexibility to cautiously consider the
conditionalities associated with such loans.
Third, the government may be prompted to go to the global market to secure high cost
commercial loan by issuing Sovereign Bonds. Getting loans from foreign private sources to
finance fiscal deficits, brought about by high level subsidy offtake, will not be prudent.
Indeed, this type of loans, carrying high foreign exchange risk, is not at all acceptable
under the growing pressure on the BOP.
Beyond these above mentioned three avenues, Bangladesh can also improve her non-debt
creating foreign sources such as export revenue, remittance flow and FDI. Whatsoever,
without higher level of access to foreign financing in FY2011-12, Bangladesh economy is
going to undermine not only its growth prospect, but also weaken further its
macroeconomic stability.
Heavy Bank Borrowing
The second important destabilising factor for public finance in the current fiscal year is
likely to be the high bank borrowing by the government. In fact, as mentioned in the
earlier section of the review, this issue did emerge as a significant problem for
macroeconomic management in FY2010-11; as high as 81.3 per cent of the fiscal deficit of
FY2010-11 was financed through bank borrowing. If mitigating steps are not taken, this
trend is apprehended to be heightened further in the current fiscal year.
The budget for FY2011-12 targets to finance 47.1 per cent (Tk. 18,957 crore) of the
projected deficit through bank borrowing (Tk. 6,253.2 crore less than the actual borrowing
in FY2010-11). However, there is every likelihood that this target will be missed by a
significant margin. According to Bangladesh Bank, the government has already borrowed
Tk. 9,470 crore till 10 October 2011, which is about 50 per cent of its total allocation for

State of the Bangladesh Economy in FY2010-11 15
CH
AP
TE
R
1the year. In other words, the government has borrowed about Tk. 100 crore everyday to
run its business.
Considerable rise in subsidy demand is likely to push up financing requirement. At the
same time, existing high interest rates of the commercial banks undermines the potentials
of mobilising fund from non-bank sources. If so happens, in this time of high inflation and
high interests on credit along with weakened Taka against other currencies, further
substantial rise in government borrowing from the banking system could lead to
deterioration in all these indicators along with a crowding out effect for the private sector
from their access to credit.
What are the options for the government in this regard? First, the government has to
rein-in its financing requirement, particularly by downsizing its subsidy demand
(discussed later). Second, the government may augment offtake from the untapped
domestic resources. Non-tax revenue sources constitute a potential source in this regard
(discussed later). Third, the government may seek to meet its incremental borrowing
need from non-banking sources by increasing the sale of national saving instruments
through increasing their yield rates. If all these are not enough, it may have to cut down
its development expenditures.
Enhancement of Non-Tax Revenue Collection
While the overall revenue collection has been impressive in recent times, non-tax revenue
collection has remained depressed. It may be recalled that in FY2010-11 non-tax revenue
collection declined over that of FY2009-10 by (-) 12.3 per cent. In FY2011-12, this source is
programmed to contribute more than 19 per cent of the total revenue collection. Against
a target of almost doubling its collection (92.1 per cent target growth), actual intake
during the first month (July 2011) had been (-) 12.3 per cent less compared to that of the
first month of FY2010-11.
However, collection of license renewal and spectrum fees from the mobile network
operators had already started to flow in, and the government is likely to get some relief in
securing non-tax revenue from such fees this year. A total of Tk. 3,746 crore is to be paid by
four telecom operators by 10 November 2011. Total revenue over the next one and half
years, from these sources, is estimated at Tk. 8,000 crore, with the remaining to be paid.
As the NBR continued to deliver, achieving the overall revenue target for FY2011-12 will
critically depend on improved non-tax revenue mobilisation and to a lesser extent on
non-NBR taxes (accounting for about 5 per cent of the total intake).
Can the fiscal balance be strengthened given the realistic prospects of augmenting foreign
aid flow, decreasing domestic borrowing requirement and fuller collection of revenue
targets? Possibly not. One would possibly need to streamline elements of public
expenditures to achieve the balance. Indeed, some of the adverse financing requirements
are associated with the current public expenditure profiles, e.g. domestic borrowing and
subsidy payments.
Rising Revenue Expenditure
A significantly high growth of 20.5 per cent in revenue expenditure has been envisaged in
the budget for FY2011-12. Besides Block Allocation, high expenditure growth is to take
place in case of Subsidies and Transfer (23.8 per cent), Interest Payments (20.4 per cent),
and Goods and Services (19.7 per cent). In the first month of the current fiscal year higher

Independent Review of Bangladesh's Development16
CH
AP
TE
R
1
Revenue Expenditures(Crore Tk.)
Table 1.5
Source: Ministry of Finance (MoF).
Note: Figures in parentheses are shares of total non-development revenue expenditure.
Expenditure Category Budget Actual Budget Difference Actual Target Actual
FY2011 FY2011 FY2012 Actual Growth Growth Growth
FY2011 and FY2011 FY2012 (July FY2012)
Budget FY2011 (%) (%) (%)
Pay and Allowances 20374.6 19764.9 21640.0 -609.7 23.2 9.5 19.6
(26.5) (27.1) (24.6)
Pay of officers 1908.9 2071.4 2190.0 162.5 19.1 5.7 8.6
(2.5) (2.8) (2.5)
Pay of establishment 8656.4 8649.6 9154.0 -6.8 14.7 5.8 4.5
(11.3) (11.9) (10.4)
Allowances 9809.3 9043.9 10296.0 -765.4 33.6 13.8 54.4
(12.8) (12.4) (11.7)
Goods and Services 10413.3 9837.2 11772.0 -576.1 11.2 19.7 97.1
(13.6) (13.5) (13.4)
Supplies and services 7522.2 6842.7 8610.0 -679.5 11.0 25.8 99.0
(9.8) (9.4) (9.8)
Repairs, maintenance and 2891.1 2994.5 3162.0 103.4 11.5 5.6 25.0
rehabilitation (3.8) (4.1) (3.6)
Interest Payments 14708.8 14942.5 17997.0 233.7 0.5 20.4 21.7
(19.2) (20.5) (20.5)
Domestic 13270.7 13519.6 16519.0 248.9 0.2 22.2 21.7
(17.3) (18.6) (18.8)
Foreign 1438.1 1422.9 1478.0 -15.2 3.8 3.9 -
(1.9) (2.0) (1.7)
Subsidies and Current 29793.3 27972.2 34642.0 -1821.1 3.7 23.8 7.0
Transfers (38.8) (38.4) (39.4)
Subsidies 7661.2 7933.7 9286.0 272.5 5.7 17.0 -
(10.0) (10.9) (10.6)
Grants in aid 17951.8 14500.3 20290.0 -3451.5 -3.2 39.9 8.1
(23.4) (19.9) (23.1)
Contributions to international 86.4 28.0 91.0 -58.4 -63.8 225.0 -
organisation (0.1) (0.0) (0.1)
Pensions/gratuities/write-off 4093.9 5510.3 4975.0 1416.4 25.4 -9.8 5.3
of loans/advances (5.3) (7.6) (5.7)
Block Allocation 1472.5 362.5 1800.2 -1110.0 29.8 396.6 -133.3
(1.9) (0.5) (2.0)
Unexpected 1000.0 80.2 1100.0 -919.8 33.0 1271.6 -
(1.3) (0.1) (1.3)
Others 472.5 282.3 700.1 -4443.0 29.0 2382.3 -133.3
(0.6) (0.4) (0.8)
Non-Development Revenue 76762.5 72879.3 87851.2 -3883.2 8.8 20.5 17.6
Expenditure (not adjusted (100.0) (100.0) (100.0)
for recoveries)
offtake in case of a number of important expenditure items is evident, e.g. Pay and
Allowances (19.6 per cent) and Interest Payments (21.7 per cent) (Table 1.5).
What will be of crucial importance from revenue expenditure perspective in the coming
months, is the developments in subsidy requirements. Economic classification of
revenue expenditure, as reflected in Table 1.5, however shows low growth in subsidies.
But this Subsidies and Transfers does not include subsidy sources such as BPC,
Bangladesh Power Development Board (BPDB), agricultural and others in which major
upturn in demand is noticeable.
Upsurge in Subsidy Demand
Total subsidy demand for the current fiscal year was initially estimated at about Tk. 22,500
crore, which is now anticipated to rise to about Tk. 47,400 crore, if no price adjustments

10Subsidy for agriculture sector include subsidy for fertiliser as well as for diesel and electricity used for irrigation.
11In its recent proposal for power price revision placed to the Bangladesh Energy Regulatory Commission (BERC), BPDB projected
that the subsidy demand may reach over Tk. 7,340 crore, if no price adjustments are made.
State of the Bangladesh Economy in FY2010-11 17
CH
AP
TE
R
1
Subsidy Requirements in FY2011-12(Crore Tk.)
Table 1.6
Source: Based on the Ministry of Finance (MoF) (various sources).
Sector Revised Budget Budget Revised Share of Total
FY2011 FY2012 Requirement Subsidy (Revised
FY2012 Requirement)
(%)
BPC 4000 3500 28014 59.1
Agriculture 5700 4500 6835 14.4
BPDB 4000 5200 5200 11.0
Export 2000 2200 2200 4.6
Food 1653 1677 1736 3.7
SoEs 358 3400 3400 7.2
Total 17711 20477 47385 100.0
Per cent of 13.3 12.5 29.0 -
Budget
Per cent of GDP 2.2 2.3 5.3 -
are made. If that be the case, share of subsidy expenditures may increase to 29 per cent
instead of 12.5 per cent of the revenue budget for FY2011-12. It would imply that subsidy
payments will be equivalent to 5.3 per cent of GDP instead of 2.3 per cent as foreseen in
the budget for FY2011-12. This will be a remarkable increase from 2.2 per cent of GDP in
FY2010-11 (revised budget). In other words, about half of what is collected as revenue will
go for paying subsidy.
Bulk of this subsidy originates from BPC, the soul merchandiser of petroleum products in
the country. While the budget for FY2011-12 kept only Tk. 3,500 crore for BPC, it is now
apprehended that BPC alone might require
over Tk. 28,000 crore in subsidy (Table 1.6).
During FY2010-11, a whoopping 69.7 per
cent growth in total petroleum import was
recorded. BPC report shows substantial
increase in imports of furnace oil and diesel
during FY2010-11, compared to FY2009-10.
In volume terms, refined petroleum
products (mostly diesel) contributed 55.5
per cent in the total petroleum import
growth (incremental contribution) in
FY2010-11. Another 20.5 per cent of the
incremental growth came from import of
furnace oil. In value terms as well,
substantial part of the growth in FY2010-11
came from diesel (70.6 per cent) and
furnace oil (9.6 per cent). To a large part,
this growth structure reveals the additional
demand originating from the rental and quick rental power plants. Starting from
FY2009-10, 14 (quick) RPPs became operational till October 2011, adding 1,320 mega
watts (MW) of power to the national grid. According to the original plan, a total of 24
rental plants are to be set up. Therefore, more liquid fuel demand will be adding up in
near future, pushing the subsidy demand further up.
It is pertinent to mention here that fertiliser subsidy is also on the rise due to over 100 per
cent increase in international price. Besides, agriculture sector as a whole might require
Tk. 6,835 crore in FY2011-12, i.e. an additional Tk. 2,300 crore more in subsidy than the
original projection.10
On the other hand, BPDB placed a subsidy demand of Tk. 5,200 crore to the Ministry of
Finance (MoF) for the current fiscal year11 in line with the budget allocation for FY2011-12.
Similarly, Tk. 2,200 crore will be necessary for payment of various export incentives,
Tk. 1,736 crore for food operations, and Tk. 3,400 crore for the state-owned
enterprises (SoEs).
What are the options for the government to deal with this unsustainable subsidy
payment situation? The government will not be able to underwrite this mounting
expenditure by incremental revenue collection. It is also not a sustainable proposition to
resort to more domestic borrowing - either from bank or non-bank sources - to pay the
subsidy bills. Thus, the government, as such, is left with no other viable policy choices to
adjust fuel and power prices upward in a phased manner. The government may consider
bringing up diesel, octane, kerosene and furnace oil prices in line with the prices in India

Independent Review of Bangladesh's Development18
CH
AP
TE
R
1
Share of Interest Payments in Total Revenue Budget(in Per cent)
Table 1.7
Source: Ministry of Finance (MoF).
Interest Payments FY2006 FY2007 FY2008 FY2009 FY2010 FY2011 FY2012 (B)
Total Interest Payments 14.3 14.0 15.0 15.7 14.6 12.1 11.0
Domestic 12.1 12.0 13.4 14.2 13.3 10.9 10.1
Foreign 2.3 2.0 1.5 1.5 1.3 1.2 0.9
(also to pre-empt smuggling out). Currently prices in India of these products are higher
than those in Bangladesh, by on average, more than Tk. 10 per litre. However, such price
enhancement may further aggravate the prevailing spiralling price situation. It is hoped
that part of it will be off-set by reduced government borrowing, and better access of the
private sector to bank credits for productive purposes, as well as stable agriculture
production. However, in order to protect the farmers, subsidy on diesel and electricity
may be supplied through designated cards.
Only bulk and rental price adjustment of energy products alone will not do the trick.
Concerns also emerge from the fact that the government is planning to phase out the
rental plants not before 2014. This will require new public plants to take over the
production deficit. Although there are plans for new public plants, no visible progress in
this regard is evident. In fact, power generation from public plants (other than rental,
quick rental and independent power producer (IPP)) has declined by about 518 MW over
the last one year. If the plan for new public plants does not materialise, then the heavy toll
that the rental plants have had so far on the petroleum budget and will continue to have
over the next few years, will all go in vain.
It needs to be emphasised here that there is a serious lack of information on both subsidy
allocation and expenditure by the government. The Budget Documents do not provide any
comprehensive subsidy estimate, other than some scattered information on agricultural
subsidy allocation. Actual subsidy expenditure is also not published. Given the fact that
subsidy expenditure has emerged as the core destabilising feature of the economy,
greater transparency is required in this area for the citizens to appreciate the problem.
Check on Interest Payments and Public Debt
Both domestic and foreign interest payments, as share of revenue budget, declined during
the last two fiscal years (FY2009-10 and FY2010-11) (Table 1.7). This happened largely
because interest rates were low for domestic loans during this period. The budget for
FY2011-12, however, projects significant rise in interest payments (by 20.4 per cent). In
the first month of FY2011-12, significant increase (21.7 per cent) in domestic interest
payments has been recorded. Heightened bank borrowing that was made in FY2010-11,
and is likely to be made again in the current fiscal year, could lead to an increase in the
share of domestic interest payments in the coming years.
On the other hand, in the backdrop of much diminished flow of foreign aid, interest
payments on foreign loans is eating up bulk of the inflow. For example, in FY2010-11 it
was as high as 63.7 per cent of gross annual foreign aid.
While remaining concerned with the flow figures, one should not fail to look at the stock
figures regarding foreign and domestic borrowings. Total public debt as a share of GDP
from the recent peak of 53.7 per cent in FY2001-02 has come down to 38.7 per cent in
FY2010-11. This encouraging trend is essentially underpinned by steady decline in
Bangladesh's foreign debt. In contrast, domestic debt as a share of GDP is showing
increasing trend. The concerned figure was 19.9 per cent of GDP in FY2010-11, up from
18.9 per cent of GDP in FY2009-10.

State of the Bangladesh Economy in FY2010-11 19
CH
AP
TE
R
1
Aid Utilisation by the Top 10 Recipient Ministries/Divisions during
FY2011-12 (July-September)(Crore Tk.)
Table 1.8
Source: Implementation Monitoring and Evaluation Division (IMED).
Ministry/Division Allocation of Expenditure of Rate of Aid
Aid Aid Utilisation
(%)
Bridges Division 3452 6 0.2
Roads Division 1461 14 1.0
Ministry of Water Resources 820 12 1.4
Energy and Mineral Resources 679 14 2.0
Division
Local Government Division 5461 142 2.6
Power Division 2727 104 3.8
Ministry of Education 1503 90 6.0
Ministry of Primary and Mass 650 53 8.2
Education
Railway Division 1245 141 11.4
Ministry of Health and Family 61 17 27.8
Welfare
Total (Top 10 Recipients) 18059 594 3.3
Share in Total ADP (%) 39.3 3.2 -
NBR Revenue Collection(in Per cent)
Table 1.9
Source: National Board of Revenue (NBR).
Category Actual Growth Target Growth Growth
FY2011 FY2012 FY2012
(Jul-Sep)
Import Duty 22.8 8.8 18.7
VAT (Import) 19.9 11.1 0.3
SD (Import) 28.4 10.5 26.3
VAT (Local) 28.9 15.7 11.4
SD (Local) 27.8 21.5 16.0
Income Tax 32.4 21.4 24.9
Others 25.9 25.0 21.5
Grand Total (NBR) 27.2 16.2 15.2
Given the recent experience with public debt stock, particularly in the developed
countries, Bangladesh government will be well-advised not to lose the comfortable
space in macroeconomic management which it currently enjoys regarding the public
debt situation.
Delivering ADP
ADP expenditure has increased during the initial months of FY2011-12, owing to certain
improvement in its implementation rate, from 9 per cent in the first quarter of FY2010-11
to 11 per cent during the same period in FY2011-12. Expenditure on account of project
aid declined further during the first quarter of FY2011-12 to only 4 per cent from 5 per
cent recorded in the corresponding period of the previous year. Accordingly, the
incremental part of the implementation improvement, albeit marginally, was
underwritten by domestic resources, adding to the government's borrowing requirement
from the banking system.
In spite of the heightened importance of
ensuring project aid flow in the current
fiscal year, a further deterioration in the
situation is evident. Table 1.8 bears this out
clearly, reflecting the low implementation
of aid component by the largest 10
recipients of ADP allocation. On the other
hand, 15 per cent (Tk. 4,011 crore) of the
Taka component has been utilised so far,
which was 11 per cent (Tk. 2,518 crore)
during the first quarter of the
previous fiscal.
Sustaining NBR Revenue Earnings
As was mentioned earlier, NBR continued
with its robust performance in FY2010-11
(Table 1.9). For FY2011-12, a 16.2 per cent
growth target has been set for the NBR.
What is of concern is that during the first
quarter (July-September) of the current
fiscal year, some slowdown in NBR revenue
collection is evident. This is particularly true
for revenue collection at the local level,
especially for VAT and supplementary duty
(SD) collection, which could imply a
slowdown in the domestic economy.
Income tax collection, however, sustained
its impressive trend.
While NBR tax collection at the import
stage has been quite impressive so far, this
growth may suffer in the coming months as
can be predicted from the recent
slowdown in imports. As against 41.8 per
cent growth in imports in FY2010-11, only
16.5 per cent growth has been recorded during the first two months of FY2011-12 over
the corresponding period of the previous fiscal. Thus, it will be a matter of great interest

Independent Review of Bangladesh's Development20
CH
AP
TE
R
1
Source: Bangladesh Bureau of Statistics (BBS).
Point-to-Point Inflation Rate of Bangladesh
Figure 1.3
0
2
4
6
8
10
12
14
16
Jan
-07
Ma
r-0
7M
ay
-07
Jul-
07
Se
p-0
7N
ov-0
7Ja
n-0
8M
ar-
08
Ma
y-0
8Ju
l-0
8S
ep
-08
No
v-0
8Ja
n-0
9M
ar-
09
Ma
y-0
9Ju
l-0
9S
ep
-09
No
v-0
9Ja
n-1
0M
ar-
10
Ma
y-1
0Ju
l-1
0S
ep
-10
No
v-1
0Ja
n-1
1M
ar-
11
Ma
y-1
1Ju
l-1
1S
ep
-11
Pe
r ce
nt
General Food Non-Food
to observe whether NBR continues to provide additional revenue to underwrite the
government's increasing expenditure needs.
In fine, streamlining of public finance management has become an immediate priority so
as to protect the medium-term growth prospect.
1.3.3 Unabated Price Inflation
Inflationary Trends
Inflation appears to have emerged as a permanent phenomenon in the economic
landscape of Bangladesh over the recent past. It has started to increase since the second
quarter of FY2009-10, and continued to rise throughout FY2009-10 and FY2010-11. During
the first three months of FY2011-12 there has not been any change in the direction of
inflationary movements. The 12-month point-to-point Consumer Price Index (CPI) inflation
has reached as high as 11.97 per cent in
September 2011 compared to 7.61 per cent
in September 2010. This is the highest
inflation in last one decade. As in most
years, food inflation was higher than
general inflation. Food inflation reached to
13.75 per cent in September 2011 as
opposed to 9.72 per cent in September
2010 (Figure 1.3). High food inflation had a
knock-on effect on non-food inflation as
well, pushing it upward to settle at 8.77 per
cent in September 2011 from as low as 3.69
per cent in September 2010. This reflects
that prices of food and non-food items tend
to move along the same direction, though
at a different pace. Another feature of
recent inflation in Bangladesh is that rural
food inflation has been closer to urban food
inflation which was not the case in
Bangladesh till August 2010. The likely
causes for high rural inflation could be
increasing demand due to higher
purchasing power of the rural population through rising agricultural production, higher
labour wages, expanded social safety net programme, and inflow of remittances. If
compared with other South Asian countries Bangladesh stands second, next to Pakistan, in
terms of the record of inflation rate in the region. Despite higher food price in the
international market, India has been able to keep its food price index down through higher
production of major crops and by ensuring adequate supply in the domestic market.
Pakistan epitomises the case of a conflict economy with a high inflation rate and a very
low growth rate.
Underlying Causes of High Inflation
A widely discussed plausible cause of high inflation in Bangladesh is the impact of global
price hike. As a food and petroleum-importing country, Bangladesh has to bear the brunt
of global price hike of these items. Since the beginning of the current decade and up to
2008, global prices of fuel and food followed an increasing trend which got transmitted
into the country's domestic economy. There has been some respite from high inflationary
pressure towards the end of 2008 and 2009 due to the global meltdown and the resultant

State of the Bangladesh Economy in FY2010-11 21
CH
AP
TE
R
1
Contribution of Food and Non-Food Items to General CPI Inflation(in Per cent)
Table 1.10
Source: Based on the Bangladesh Bank data.
Note: Base: 1995-96=100. Weight: General=100; Food=58.84; Rice=0.1; Non-Food=41.16; Contribution of food/rice/non-food is calculated as the share (weight) of
food/rice/non-food in general CPI, multiplied by food/rice/non-food inflation, divided by overall inflation rate.
*Up to September 2011.
Year General Inflation Food Inflation Non-Food Food Rice Non-Food
Inflation Contribution in Contribution in Contribution in
Inflation Inflation Inflation
FY2000-01 1.94 1.38 3.04 41.86 14.30 58.14
FY2001-02 2.79 1.63 4.61 34.38 11.74 65.62
FY2002-03 4.38 3.46 5.66 46.48 15.88 53.52
FY2003-04 5.83 6.93 4.37 69.94 23.89 30.06
FY2004-05 6.49 7.90 4.33 71.62 24.47 28.38
FY2005-06 7.16 7.76 6.40 63.77 21.78 36.23
FY2006-07 7.20 8.11 5.90 66.28 22.64 33.72
FY2007-08 9.94 12.28 6.32 72.69 24.83 27.31
FY2008-09 6.66 7.19 5.91 63.52 21.70 36.48
FY2009-10 7.31 8.53 5.45 68.66 23.45 31.34
FY2010-11 8.79 11.33 4.15 75.85 25.91 24.15
FY2011-12* 11.41 13.28 8.00 68.52 23.41 31.48
Source: Bangladesh Bureau of Statistics (BBS) and Bangladesh Bank.
Growth of Money Supply, Credit to Private Sector, Consumption and
Inflation
Figure 1.4
0
5
10
15
20
25
30
FY
02
FY
03
FY
04
FY
05
FY
06
FY
07
FY
08
FY
09
FY
10
FY
11
Pe
r ce
nt
Growth of Domestic Credit to Private Sector Growth of M2
Growth of Consumption Inflation
price fall of major commodities in the global market. With the turn around of the global
economy from the recession towards the end of 2009 and beginning of 2010, inflation
started to shoot up. This trend was also observed in Bangladesh.
The other major source of high inflation in Bangladesh is high food inflation. The reason
behind this assumption is that food carries a large weight in the CPI of Bangladesh. The
weight of food items in the CPI commodity basket of Bangladesh is as high as 58.8 per
cent, of which the share of rice is 20.1 per cent. Hence the rise in food inflation affects the
overall inflation significantly. Based on the BBS data, it has been estimated that the
contribution of rice inflation to the overall inflation was 23.41 per cent during September
of FY2011-12 (Table 1.10).
Growth in money supply is considered to be
another contributing factor of high inflation
in Bangladesh. An examination of the
trends of these factors during the last 10
years reveals that the relationship between
growth in money supply and inflation has
not been unidirectional all along. Though
they moved along the same direction over
the major part of the period between 2001
and 2011, no causal relationship could be
established between growth of money
supply and inflation in the short-run (Figure
1.4). However, in the long-run, a positive
relationship is observed between these two
variables (CPD 2011). The other two
possible sources of high inflation could be
growth in credit to the private sector and
growth in consumption. As in the case of
money supply these two factors do not
follow the same growth path as inflation in
the short period.

Independent Review of Bangladesh's Development22
CH
AP
TE
R
1
Monetary Policy Stances of Bangladesh Bank
Table 1.11
Period
January-June 2009
July-December 2009
January-June 2010
July-December 2010
January-June 2011
July-December 2011
Monetary Policy Stance
Accommodative; priority is given to providing credit support
for creation and expansion of output capacities rather than for
stoking of demand pressures
Accommodative; greater directional emphasis on the credit
needs of sectors like agriculture and small and medium
enterprise (SME) that are typically underserved by the market
Accommodative; special attention to programmes pursuing
fuller financial inclusion of the economic activity segments
(including agriculture and SMEs) and population segments that
are underserved by the markets, towards fostering
inclusiveness of economic growth
Accommodative; special attention to financial inclusion of
agriculture, SMEs, renewable energy, and ecological footprint
minimising technology sectors
Accommodative; in support of the government's goals of
faster inclusive economic growth and poverty reduction
besides maintaining monetary and price stability
Restraining; in the context of unfolding near-term
development and ensuring adequate credit flows to the
productive sectors
Source: Monetary Policy Statements, Bangladesh Bank.
Food Scenario: Production, Procurement and Prices
Food production during FY2011-12 is projected to increase by 3.5 per cent, of which the
growth of rice will be 3.6 per cent. This year procurement of Boro rice by the government
reached 8.12 lakh metric tonnes (MT) (during 5 June to 29 October 2011) exceeding the
target of 6 lakh MT. Till 29 October 2011, storage of foodgrains was 15.18 lakh MT which is
97 per cent higher than that of the last year. There was a focus on public import of
foodgrains instead of relying solely on private import. In FY2010-11, the share of
foodgrains import by the government was approximately 41 per cent.
Prices of essential commodities have been on the rise since 2008 and the rice market in
Bangladesh continues to remain volatile. However, the retail price of coarse rice in local
market has shown a declining trend, and has reached Tk. 30-32/kg at present compared to
Tk. 35.3/kg in January 2011, and Tk. 34.57/kg in April 2008. However, this is still higher
than that of the recent past. In fact, since November 2009, rice prices started to decline
and reached the lowest level at Tk. 20.42/kg in April 2010. Between July-May of FY2007-08
and July-May of FY2010-11 rice price increased by 23 per cent in the local market.
However, prices crossed Tk. 30/kg again in July 2010 and the trend has persisted till now.
Policy Initiatives
Monetary Measures
In its MPS for the period of July-December FY2010-11, Bangladesh Bank targeted for an
inflation rate of 7 per cent by the end of FY2010-11 primarily through discouraging credit
flow to unproductive sectors (Table 1.11).
At the time of the announcement of the
MPS, monetary aggregates were already on
increasing trends. In a move to control
diversions and unproductive use of funds,
Bangladesh Bank has been using its
monetary policy tools more frequently in
recent times than before. As was
mentioned earlier, the CRR and SLR were
increased twice, and rates of Repo and
Reverse Repo have been raised thrice in the
last fiscal year. To discourage loans to
unproductive sectors and to control
inflation, Bangladesh Bank has also
withdrawn the lending cap for most sectors.
These moves were not immediately
effective in controlling liquidity expansion
due to delayed response on the part of the
Central Bank. However, there has been a
moderate decline of M2 and credit to the
private sector in September 2011 as a result
of restraining monetary policy stance of
Bangladesh Bank. The growth of credit to
the public sector has, however, been
significantly high between September 2010 and September 2011 (Table 1.12). Increased
borrowing by the government from domestic sources has contributed to continuing high
inflationary trend notwithstanding reduction in money supply.

State of the Bangladesh Economy in FY2010-11 23
CH
AP
TE
R
1
Food Security Budget as a Percentage of Total Safety Net Budget(Crore Tk.)
Table 1.13
Source: Ministry of Finance (MoF).
Component Budget Budget Budget
FY2010 FY2011 FY2012
Food security budget 5877.81 5726.25 7102.57
Total safety net budget 17327.33 19496.99 22556.05
Food security as share of 34.00 29.00 31.00
total safety net (%)
Fiscal Measures
Major fiscal policy of the government towards addressing the high inflation rate and
ensuring food security has been the reduction of import duty on rice and wheat, provision
of credit to food importers at subsidised rates, cash transfer, allocation of funds to
increase supply, and expansion of the operation of Public Food Distribution System (PFDS).
Total distribution under PFDS has increased due to the higher level of distribution under
priced channels, even though distribution under non-priced channels has decreased
sharply. Distribution through priced channels has observed a significant rise due to
government's intensive OMS and fair price drives. The government is also distributing
foodgrains among the fourth-class government employees since February 2011.
Foodgrains distribution is taking place among the Fair Price Card-holders across the
country through which each cardholder can purchase up to 20 kg of foodgrains at a
cheaper rate. During the period July to 20
October 2011, distribution of foodgrains
amounted to 4.2 lakh MT which is
reportedly an increase by 30 per cent
compared to what was in the last year
during the same period. During the last
three fiscal years about 30 per cent of the
total budget for social safety net
programmes has been allocated for food
security (Table 1.13).
There is no denying that PFDS has eased the pressure of high inflation on the low-
income households. However, given the large number of people living below the poverty
line and the limited nature of effort by the government, which is concentrated mostly
within the periphery of urban centres, it is likely that significant number of poor people
remains outside the coverage of PFDS. While efforts are needed to expand programmes
to ensure food security, pre-emptive and decisive monetary policy should also be in
place to rein the high inflation in. In view of the slower growth of money supply in the
recent period compared to the last fiscal, the effectiveness of the contractionary
monetary policy adopted by the Central Bank has been proved. This, however, is not a
panacea to contain inflation, particularly in the medium-term, as the demand for
domestic investment by the private sector remains high, and constraints to access credit
will further affect the investment scenario which in turn will have adverse consequences
for the overall growth of the economy. Monetary policy will also have to be coordinated
with effective fiscal management (details in Section 1.3.2) if Bangladesh is to reduce the
current inflationary pressure.
Selected Monetary Indicators(Crore Tk.)
Table 1.12
Source: Bangladesh Bank.
Indicator FY2011 FY2012 Change between Change between
(Sep 2010) (Sep 2011) September September
2010 and 2009 and
September September
2011 (%) 2010 (%)
Domestic Credit 356498.70 449930.10 26.21 20.33
Credit to Public Sector 69256.10 99555.10 43.75 -0.28
Credit to Private Sector 287242.60 350375.00 21.98 26.65
M2 379095.60 453397.60 19.60 21.48
Reserve Money 82422.00 97013.90 17.70 10.48

Independent Review of Bangladesh's Development24
12During the first three months of FY2010-11, total export posted a 30 per cent growth.
13This was 31 per cent during the first quarter of FY2010-11.
14During the first quarter of FY2011-12, total export to Japan increased by 72.1 per cent, India by 55.5 per cent, Australia by 56.6
per cent, and China by 94 per cent.15
Export to Ireland and Portugal also increased by 16.6 per cent and 17.6 per cent respectively in the first quarter of FY2011-12.
However, export to Greece, the country in most fragile situation, declined by (-) 0.6 per cent.16
In 2010, India enhanced the duty-free TRQ from 8 million pieces to 10 million pieces for Bangladesh.
CH
AP
TE
R
1
Export Performance(in Per cent)
Table 1.14
Source: Estimated from the Export Promotion Bureau (EPB) data.
Product Growth Growth in Growth in Required
Target for FY2012 FY2011 Growth for
FY2012 (Jul-Sep) (Jul-Sep) Rest of the
Year to
Attain Export
Target
RMG 13.7 21.2 31.0 11.5
Knitwear 13.9 18.3 31.9 12.6
Woven wear 13.4 24.8 30.0 10.3
Non-RMG 22.5 27.6 26.1 21.1
Raw Jute 30.0 18.7 53.8 32.1
Leather 10.0 20.0 42.2 7.2
Total 15.6 22.6 30.0 13.6
1.3.4 Increasing Pressures on the External Balance
Signs of Strains in Traditional Dependable Export Destinations
The extraordinary high export growth observed in FY2010-11 had started to slow down in
the first quarter of FY2011-12, though the pace of growth is ahead of the target set for the
current fiscal year. During the first three
months of FY2011-12, total export earnings
registered a 22.6 per cent growth (Table
1.14), which was impressive considering
that this growth was attained over the
aforesaid high benchmark.12 A
decomposition of export performance for
the first quarter of FY2011-12 reveals that
export growth of the dominant RMG sector
was outpaced by that of non-RMG sector:
RMG export increased by 21.2 per cent13
while for non-RMG export the rate of
growth was 27.6 per cent.
In the first quarter of FY2011-12, some
progress was observed in case of export
market diversification. Export earnings from
new markets (other than US, EU and Canada) increased significantly14, by 36 per cent over
the corresponding figure for last year. Over the same period, export to EU and Canada
increased by 28.8 per cent and 16.4 per cent respectively. Germany, UK, France, Spain,
Italy, Belgium and Netherlands remained the major export destinations in EU-27. In spite
of the crisis engulfing the Eurozone, significant export growth was attained in such crisis-
impacted economies as Spain (48.3 per cent) and Italy (47.4 per cent).15 The revised Rules
of Origin (RoO) under the EU-GSP (Generalized System of Preferences) scheme may have
contributed to this export boost in the EU, particularly favouring export of woven wear.
Significant rise in exports to India, from USD 92 million to USD 143.1 million, may have
originated from effective utilisation of the tariff rate quota (TRQ) of 10 million pieces.16
Recently, India has downsized her sensitive list for least developed countries (LDCs) under
the South Asian Free Trade Area (SAFTA), granting duty-free import of 46 items of which
45 are RMG. Bangladesh's global export of these 45 products accounted for 87.5 per cent
of her total RMG export and 68.5 per cent of the total export. Hence, given Bangladesh's
competitiveness in export of these 45 items globally, Bangladesh may be able to harness
benefit by exporting these items to India.
On the other hand, in 2010, Turkey imposed a countervailing duty of 17 per cent on
imports from LDCs. During the first quarter of FY2011-12, Bangladesh's export to Turkey
decreased by (-) 0.4 per cent. Given the fact that Turkey is the fourth largest export
destination for Bangladeshi products, there is a need for renewed attention to this
particularly important export destination. It is important to note that, export to US, the
second largest export destination for Bangladeshi products, decreased by (-) 1.7 per cent

17Export of knitwear declined by (-) 16.8 per cent and export of woven wear increased by 6 per cent.
18Despite the fact that growth of global RMG import by US in the current year is somewhat lower than that of the previous year,
other competitors of Bangladesh in the US market have performed much better in knitwear export. Total RMG import by US
increased by 9.2 per cent during July-August, FY2011-12 (Annex Table 1.1), which was 17.8 per cent during the same period of
the previous year. During July-August 2011, Bangladesh's growth in knitwear export was 0.6 per cent, whereas Cambodia and
Sri Lanka attained 20.8 per cent and 30.5 per cent growth in the same period. Even China, India, Pakistan and Vietnam managed
to attain significant growths. However, regarding export of woven wear, Bangladesh has performed much better than other
exporters in the US market.19
Total export to US declined by (-) 15 per cent.20
International price of cotton is declining since March 2011. In the last six months, it declined by 49.1 per cent.21
Recently, according to a plea made by Pakistan, EU proposed for waiving tariff on 75 products originating from Pakistan. Eight
out of these 75 items will be subjected to TRQ for two years; the rest 67 items were proposed to be exempted from any customs
duty. A number of countries including India and Peru lodged official objections at the World Trade Organization (WTO) against
the EU, opposing the waiver proposal. If Bangladesh's export to EU for those 75 products is considered, only two out of the top
10 are found to be protected by the TRQ. In view of this, Bangladesh proposed another list of eight tariff lines for exclusion from
the EU-proposed list for Pakistan, or at least considering quota limits. Subsequently, EU proposed to add five more items in
addition to the already included eight tariff lines to the list of products under TRQ. This newly proposed list of 13 tariff lines under
TRQ now covers six of the proposed eight Bangladeshi export items.22
As of 20 October 2011, Bangladesh had imported 0.37 million MT of rice, 92 per cent by the government.
State of the Bangladesh Economy in FY2010-11 25
CH
AP
TE
R
1
Bangladesh's Export Growth: FY2011-12(in Per cent)
Table 1.15
Source: Estimated from the Export Promotion Bureau (EPB) data.
Note: Q1 refers to the first quarter (July-September period) of the corresponding fiscal year.
Product World US EU Rest of the World
Q1 Sep Q1 Sep Q1 Sep Q1 Sep
FY12 FY12 FY12 FY12 FY12 FY12 FY12 FY12
Total Export 22.6 2.4 -1.7 -15.0 29.8 2.8 32.4 17.5
RMG 21.2 -6.6 -0.8 -17.0 30.0 -0.9 30.7 -5.9
Knitwear 18.3 -12.3 -16.8 -37.4 25.7 -4.1 20.3 -21.1
Woven wear 24.8 0.5 6.0 -8.4 39.2 6.4 42.8 14.0
Non-RMG 27.6 30.1 -12.4 6.6 28.2 24.6 34.1 35.8
during the first three months of FY2011-12, when export of RMG declined by (-) 0.8 per
cent17 and that of non-RMG declined by (-) 12.4 per cent.18
However, it is notable that the export performance of September is transmitting some
disquieting signals. Month-on-month analysis shows that in September FY2011-12, RMG
export declined by (-) 6.6 per cent; indeed,
export of knitwear decreased by (-) 12.3 per
cent (Table 1.15). As a result, growth of
export earnings in September 2011 was a
mere 2.4 per cent. RMG export to US was
particularly bad in September 2011,
declining by (-) 17 per cent; export of
knitwear declined by (-) 37.4 per cent.19 As
a matter of fact, Bangladesh's global export
of knitwear for the month of September
2011 had declined in EU, her traditional
market, as well as to the rest of the world.
Such gloomy situation in RMG export
(particularly knitwear) might have originated from lower price of cotton20, which has
reduced the price of garment products (particularly knitwear) in all important markets.
RMG export shock came at a time when uncertainty is looming as regards any speedy
recovery of the global economy. At the same time, new threats also evolved as India and
Peru moved away from their position against Pakistan's claim for duty-free access to the
EU under special consideration as part of the EU-GSP scheme.21 Bangladesh needs to
analyse the impacts of these developments taking place at the global level and formulate
appropriate strategies to deal with attendant concerns.
High Growth of Import Payments Inevitable
While the export earnings started to peak, demand for raw materials, capital machineries
and fuel rose dramatically resulting in higher growth of import (41.9 per cent) in
FY2010-11. The high import growth overshadowed the robust export sector performance
resulting in a deterioration of the trade balance. This also put the BOP situation under
pressure. However, during the first two months of FY2011-12, import growth somewhat
slowed down to 16.5 per cent while imports of foodgrains, petroleum products and raw
cotton saw a decrease (Annex Table 1.2). Major share of the foodgrains import was
carried out by the government.22 With public foodgrains procurement running well, in line

23As of 20 October 2011, 0.8 million MT of Boro rice had been procured and another 0.81 million MT contracted. The achieved
procurement represents 97.8 per cent of the target, compared to a 46.9 per cent achievement of the target last year at the
same time.24
Opening of import L/Cs for foodgrains declined by 62.7 per cent during the first three months of FY2011-12.25
International price of urea increased by 60 per cent between September 2010 and September 2011.26
Interview with concerned officials hinted that at present a number of vessels with imported petroleum are ready to offload.27
BPC projected that oil import bill for FY2011-12 may reach to USD 6.3 billion.28
New relaxed RoO in EU-GSP partially explains higher demand of imported yarn.29
In Bangladeshi Taka (BDT) terms, the growth of remittances is higher at 20.3 per cent, thanks to the accelerated depreciation of
BDT against USD.
Independent Review of Bangladesh's Development26
CH
AP
TE
R
1
Source: Estimated from the Bureau of Manpower, Employment and Training (BMET) and the
Bangladesh Bank data.
Growth of Migration and Remittance in FY2011-12 over FY2010-11
Figure 1.5
77.5
18.5
46.1
14.3
82.8
2.1
12.5
68.0
12.0
0.0
25.0
50.0
75.0
100.0
Migration Remittance
Pe
r ce
nt
July August September October Total
with the target23 and promising outlook for the foodgrains production, it may be assumed
that in the coming months, import of foodgrains is not likely to see a sharp upturn.
Opening of import L/Cs (letters of credit) for foodgrains also shows similar pattern.24
Import of fertiliser increased by 76.5 per cent; however, this growth was mainly driven by
higher international price of fertiliser.25 On the other hand, declining import growth of
petroleum products is likely to increase in future as L/Cs opening for petroleum increased
by 107.3 per cent in the first quarter of FY2011-12.26 It also needs to be noted that four
liquid fuel-based (quick) RPPs come into production in the course of the current fiscal
year, which is likely to increase the demand for imported petroleum significantly.27
Import of capital machineries increased by 36.4 per cent during the first two months of
FY2011-12 mostly due to higher demand from new power plants. Nevertheless, import
L/Cs opened for capital machineries decreased by (-) 37.3 per cent in the first quarter of
FY2011-12, indicating a possible stagnation of the investment sector in the coming
months. Import of intermediate goods such as yarn and textiles and articles thereof also
increased over the same period of FY2011-12.28
To maintain import growth within the target of 14 per cent for FY2011-12, growth of
import in the next 10 months of fiscal year needs to slow down further to 13.5 per cent. As
it stands, it will be difficult to contain import growth within the target set for FY2011-12.
Overseas Employment Picks Up but Remittance Slows Down
Remittance inflow during the first four months of the current fiscal stood at about USD 4
billion (Tk. 30,064 crore) which was 12 per cent higher than that of the comparable period
of the previous fiscal (Figure 1.5).29 Average
monthly flow of remittances during the
second half of FY2010-11 was USD 1 billion,
which was maintained in the current fiscal
year. In October, remittance inflow
increased by 12.5 per cent. Growth of
remittance inflow in the coming eight
months of the fiscal year will need to be
maintained over robust performance
achieved during the second half of
FY2010-11. To achieve the projected target
of USD 12.7 billion for the current fiscal,
inward remittances will need to register an
average growth of 7.7 per cent during the
remaining eight months of FY2011-12.
The number of migrant workers going
abroad during the first quarter of
FY2011-12 was about 0.15 million, which
was about 68 per cent higher than that of
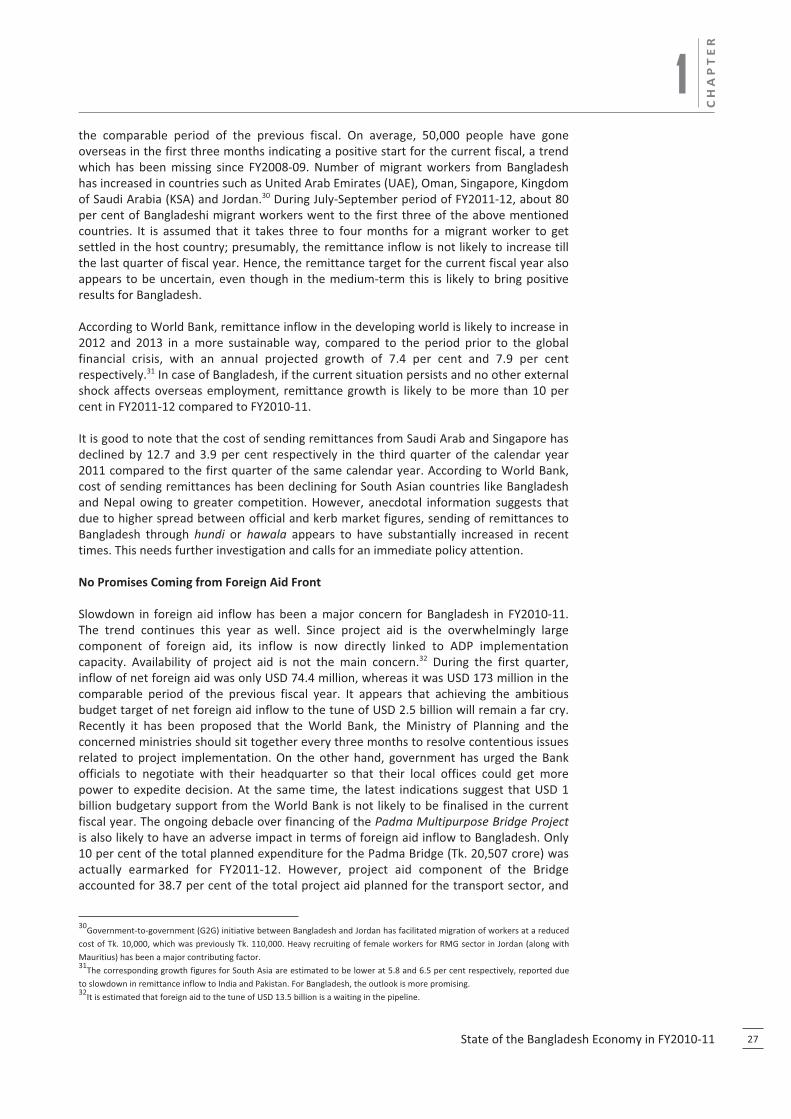
30Government-to-government (G2G) initiative between Bangladesh and Jordan has facilitated migration of workers at a reduced
cost of Tk. 10,000, which was previously Tk. 110,000. Heavy recruiting of female workers for RMG sector in Jordan (along with
Mauritius) has been a major contributing factor.31
The corresponding growth figures for South Asia are estimated to be lower at 5.8 and 6.5 per cent respectively, reported due
to slowdown in remittance inflow to India and Pakistan. For Bangladesh, the outlook is more promising.32
It is estimated that foreign aid to the tune of USD 13.5 billion is a waiting in the pipeline.
State of the Bangladesh Economy in FY2010-11 27
CH
AP
TE
R
1the comparable period of the previous fiscal. On average, 50,000 people have gone
overseas in the first three months indicating a positive start for the current fiscal, a trend
which has been missing since FY2008-09. Number of migrant workers from Bangladesh
has increased in countries such as United Arab Emirates (UAE), Oman, Singapore, Kingdom
of Saudi Arabia (KSA) and Jordan.30 During July-September period of FY2011-12, about 80
per cent of Bangladeshi migrant workers went to the first three of the above mentioned
countries. It is assumed that it takes three to four months for a migrant worker to get
settled in the host country; presumably, the remittance inflow is not likely to increase till
the last quarter of fiscal year. Hence, the remittance target for the current fiscal year also
appears to be uncertain, even though in the medium-term this is likely to bring positive
results for Bangladesh.
According to World Bank, remittance inflow in the developing world is likely to increase in
2012 and 2013 in a more sustainable way, compared to the period prior to the global
financial crisis, with an annual projected growth of 7.4 per cent and 7.9 per cent
respectively.31 In case of Bangladesh, if the current situation persists and no other external
shock affects overseas employment, remittance growth is likely to be more than 10 per
cent in FY2011-12 compared to FY2010-11.
It is good to note that the cost of sending remittances from Saudi Arab and Singapore has
declined by 12.7 and 3.9 per cent respectively in the third quarter of the calendar year
2011 compared to the first quarter of the same calendar year. According to World Bank,
cost of sending remittances has been declining for South Asian countries like Bangladesh
and Nepal owing to greater competition. However, anecdotal information suggests that
due to higher spread between official and kerb market figures, sending of remittances to
Bangladesh through hundi or hawala appears to have substantially increased in recent
times. This needs further investigation and calls for an immediate policy attention.
No Promises Coming from Foreign Aid Front
Slowdown in foreign aid inflow has been a major concern for Bangladesh in FY2010-11.
The trend continues this year as well. Since project aid is the overwhelmingly large
component of foreign aid, its inflow is now directly linked to ADP implementation
capacity. Availability of project aid is not the main concern.32 During the first quarter,
inflow of net foreign aid was only USD 74.4 million, whereas it was USD 173 million in the
comparable period of the previous fiscal year. It appears that achieving the ambitious
budget target of net foreign aid inflow to the tune of USD 2.5 billion will remain a far cry.
Recently it has been proposed that the World Bank, the Ministry of Planning and the
concerned ministries should sit together every three months to resolve contentious issues
related to project implementation. On the other hand, government has urged the Bank
officials to negotiate with their headquarter so that their local offices could get more
power to expedite decision. At the same time, the latest indications suggest that USD 1
billion budgetary support from the World Bank is not likely to be finalised in the current
fiscal year. The ongoing debacle over financing of the Padma Multipurpose Bridge Project
is also likely to have an adverse impact in terms of foreign aid inflow to Bangladesh. Only
10 per cent of the total planned expenditure for the Padma Bridge (Tk. 20,507 crore) was
actually earmarked for FY2011-12. However, project aid component of the Bridge
accounted for 38.7 per cent of the total project aid planned for the transport sector, and

33SFYP projected a trade balance of (-) USD 9,699.9 million and current account balance of (-) USD 192.1 million. The SFYP
however looks forward to improve the BOP position by reducing deficit in trade balance through slashing dependence on imports
and promoting export along with higher inflow of remittances.34
During July-August period of FY2011-12, net FDI inflow increased to USD 188 million, which was USD 113 million in the
corresponding period of the previous fiscal year.35
Government is expected to ask for a Mission from the Fund to discuss the credit agreements soon. One may recall that the
previous credit was tagged with a number of conditionalities by IMF including rationalisation of petroleum price. A number of
these are already implemented by Bangladesh.36
On 26 October 2011, the EU leaders agreed to make a 50 per cent cut on the Greek debt. They also agreed to boost the
European rescue fund (the European Financial Stability Facility - EFSF) from 440 billion Euro to 1 trillion Euro. The measures also
included recapitalisation of European banks and IMF agreement to deploy its next instalment of 2.2 billion Euro for Greece's
original bailout.37
During the last four months (between end of June to end of October), BDT lost its value vis-à-vis USD by 2.8 per cent, Euro by
0.8 per cent, GBP by 3.2 per cent and Canadian Dollar (CAD) by 0.5 per cent.
Independent Review of Bangladesh's Development28
CH
AP
TE
R
19.1 per cent of total project aid in ADP for FY2011-12. With uncertainty looming over the
project's future, one may speculate that foreign aid inflow for the Padma Bridge project
may not be realised any time soon. Overall, it can be expected that the BOP situation is
not likely to get any respite with the help of its foreign aid component in FY2011-12.
Pressure on Balance of Payments Likely to Sustain
FY2010-11 ended with a negative overall balance and it was apprehended that this
pressure would continue during FY2011-12. Monetary Policy Statement (July-December,
2011) of Bangladesh Bank projected even a wider deficit of trade balance for FY2011-12
coupled with low remittance growth. As a result, the Statement projected deficits in the
current account balance and also overall balance (of (-) USD 884 million and (-) USD 439
million respectively). To contrast, the Sixth Five-Year Plan (SFYP) prepared earlier, had
forecasted a strong surplus in the overall BOP (USD 902.3 million) anticipating higher
inflow of FDI and foreign aid.33
In FY2011-12 (July-August), a low import growth had restrained, the trade balance at
(-) USD 409 million. This, along with the increasing pace of remittance inflow helped to
attain a current account balance surplus of USD 1,194 million (which was USD 625 million
during the comparable months of FY2010-11). Negative balance in financial account
continued, owing to a large extent, to the lower net inflow of foreign aid. Net FDI inflow
registered promising growth of 66.4 per cent during the first two months of FY2011-12,
but its volume was inadequate to restrain the deterioration of financial account balance.34
Overall balance managed to maintain positive scale, for now, at USD 89 million. The
government has once again sought for faster realisation of proposed IMF support to the
tune of USD 1 billion for three years under the Extended Credit Facility (ECF) to tackle the
apprehended uncomfortable BOP situation.35 However, without acceleration in foreign aid
utilisation, improvement in BOP situation can hardly be expected at this moment.
Weakened BDT may Fall Further
Growing BOP pressure got transmitted into depreciating exchange rate during the last
fiscal year. The exchange rate of BDT against USD has been going down further and at a
faster rate in recent months. Additionally, exchange rate management has become more
difficult due to volatility in international exchange rate markets. BDT was appreciating
against Euro between July-September 2011 period. However, in view of Euro's
strengthening, BDT experienced marginal depreciation in October 2011. With a more
acceptable agreement on debt crisis by EU leaders36, the value of Euro has become more
stable at the end of October 2011. As of October-end 2011, BDT depreciated against all
major currencies37 (USD, Euro, British Pound (GBP) and Chinese Yuan (CNY)), except for

38Between end of June to end of October, BDT appreciated against INR by 6.6 per cent.
39China is the single largest source of imported capital machinery for Bangladesh.
40In Bangladesh, rice is generally imported from India. Prices of rice have also stabilised in international market in recent months.
State of the Bangladesh Economy in FY2010-11 29
CH
AP
TE
R
1Indian Rupee (INR).38 Depreciation of BDT would imply that export to US and EU will be
benefited. However, greater depreciation against CNY would also mean costlier
intermediate and capital goods imported from China.39 Ceteris paribus, exporters may
switch to importing raw materials from India (particularly for export of RMG products).
Falling value of BDT put some pressure on prices of most of the imported consumer goods
other than rice.40 Accordingly, it may also create further strain on domestic price levels in
the coming months. Currently, foreign exchange reserve is maintained at around USD 10
billion, which is equivalent to 3.6 months of import payments. Hence, there is hardly any
room to use this reserve to contain BDT's value. The volatility in international foreign
exchange market made foreign exchange policy making only harder.
Higher Utilisation of Foreign Aid Holds the Key
In the backdrop of falling growth of exports and remittances in September and lower
levels of foreign aid disbursement in the first quarter, along with projected higher impacts
in the coming months, the BOP is expected to remain under pressure in the coming
months of FY2011-12. In this backdrop, BDT may witness further depreciation towards the
end of FY2011-12. In the short-term, it appears that higher utilisation of foreign aid will be
the key to maintaining balance in the external sector.
1.4GROWTH PROSPECT AND CURRENT CHALLENGES
The current fiscal year kicked off on a relatively strong growth platform, although a
number of tensions were becoming evident in the economy since the second half of the
elapsed year. In its pre-budget analysis of the economy in June 2011, CPD identified a
number of risks that loomed in the horizon as the country approached towards
FY2011-12. The four risks that CPD pointed at, were: (i) financing risk; (ii) macroeconomic
balance risk; (iii) institutional risk; and (iv) political risk. Our above observations validate
that these risks are becoming stronger as the economy is moving forward in FY2011-12.
Analyses presented in the foregoing sections of this chapter suggest that Bangladesh
economy from the initial months in FY2011-12 has increasingly come under a complex set
of stresses and strains emanating from multiple sources. Some of these growing pressures
are manifestation of the structural problems of the economy, often aggravated by the
nature of macroeconomic management; while some of the other pressure points are
underpinned by adverse developments in the global economic environment. Under the
circumstances, keeping the economy on a sustainable and inclusive growth trajectory and
maintaining consolidated macroeconomic stability will be a very challenging task. Indeed,
for Bangladesh economy, FY2011-12 will be, on many counts, one of the relatively difficult
years in the recent past.
How does the economic growth prospect for the year look like, based on the performance
indicators of the first quarter of FY2011-12? Early signals are not necessarily adequate
predictors for overall economic growth for the full year. However, as the final GDP
estimates for FY2011-11 are awaited, a number of reasonable assumptions lead us to
suggest that attaining the target growth rate of 7 per cent in FY2011-12 will be quite

Independent Review of Bangladesh's Development30
CH
AP
TE
R
1difficult. Indeed, a number of international financial institutions have expressed similar
view. The World Bank has maintained that it is 'uncertain' that the target GDP growth rate
for FY2011-12 will be achieved, while the IMF has projected it to be 6.3 per cent.
Nonetheless, it should not be missed that a 6 per cent plus growth rate is a pretty
respectable figure given all the visible risks afflicting the Bangladesh economy.
What message does the present review send to the top policymakers of the country?
Indeed, the first and foremost message is that the policymakers have to take into
cognisance that the economy has entered a difficult period from the perspective of
economic management. A denial syndrome will not help. This entails drawing up a
transitional work programme and taking hard decisions. Given the electoral cycle, the
government has little time in the margin to make mends before the next general election.
To operationalise the transitional work programme, the government would need to revisit
at the earliest its targets for the current fiscal year relating to public finance. In fact, it
should not wait till mid-year to produce the revised budget. Such a review of the public
finance programme should identify a number of priorities, beyond the obvious ones.
While revising the budget, the government has to take note of the evolving trends in
global economic recovery. Indeed, if a second dip actually takes place, the government has
to be ready with a response plan. Admittedly, the government has much less fiscal space
at this moment to finance counter-cyclical policies. This has been made more difficult by
the prevailing high inflationary trend.
One of the overriding priorities should be to undertake all out efforts to increase the
disbursement of the committed foreign aid, particularly for the ongoing projects. Such an
approach will have multiple objectives including maintaining the growth momentum,
reducing pressure on domestic borrowing, and alleviating pressure off the BOP situation.
Budgetary support or BOP support may be negotiated with the international financing
institutions at reasonable terms. Foreign financing on commercial terms, even for high
profile national projects, may be avoided for the time being.
The other equally high priority should be to reduce the demands on subsidy payments. In
fact, the country's subsidy basket needs to be scrutinised closely from the perspectives of
both efficiency and distributive justice. Whatsoever, the government needs to adjust
upward, in a transparent phased manner, the prices of all types of liquid fuels. Same
applies to electricity prices. To support the poorer sections of the population, including
the farmers, the government may pursue targeted approach in a manner which is efficient
and effective. As the subsidy burden has become fiscally unsustainable, rationalisation of
prices of energy products will help strengthen the fiscal balance. The consequent cost
escalation-driven possible inflation will be partly offset by reduced government borrowing
from the banks; banks will then have more resources to finance productive investment.
The government's claim on funds in the banking system has to be moderated and kept
within the programmed target. Given the very low level of sales of national saving
instruments, the government should consider revising their yield rates, and thus borrow
from non-banking sources.
With a view to augment revenue intake, the government must concentrate on collections
from non-tax sources as well as from non-NBR tax heads. The government also needs to
remain vigilant regarding maintaining the robust performance of the NBR, particularly on
the income tax front.
It has been mentioned by CPD on an earlier occasion that there is no 'magic bullet' for
combating inflation. It may be expected that currently imposed restraints on credit

State of the Bangladesh Economy in FY2010-11 31
CH
AP
TE
R
1growth, particularly on credit to government, may eventually have some sobering impact
on the overall price situation. However, government will have to continue with public
procurement of foodgrains, maintain adequate food stock, undertake open market
operations when necessary, and broaden the safety net programmes to keep the food
(rice) market stable. Nonetheless, inflation, particularly food inflation will continue to
remain high in the remaining part of the current fiscal year. The creeping upward trend in
non-food inflation may also gain momentum in the near-term.
As the export growth rate decelerates, efforts to diversify markets have to be intensified
including by taking advantage of the recently announced trade concessions in the Indian
market. Exploiting the new RoO in the EU, Bangladesh should also try to diversify her
export basket.
In view of the slowdown of remittance growth, the government needs to take additional
measures for market development and reduction of cost of migration. The BOP situation
may get some relief due to slowdown of imports. Higher disbursement of foreign aid,
greater inflow of export revenue and remittance income by expatriate workers could
alleviate the situation further.
The government will need to keep under watch two other issues (not discussed in the
report), namely - (i) the situation in the capital market, and (ii) issuance of new
bank licences.
Regarding the first, it needs to be pointed out that the current attempts to rejuvenate the
market are based on a misperceived 'liquidity approach.' The recent attempts to inject
money into the market through launch of the 'Bangladesh Fund' and 'Stabilisation Fund' are
going to yield little results. Indeed, such attempts and decisions like delayed adjustment of
single borrower's exposure limit are only going to further complicate the interface between
the banking sector and the capital market. Although, there had been, in the recent times,
some initiatives to reform the market regulation and management, none of these touched
upon the basic issues relating to transparency and accountability including strengthening of
the surveillance capacity of the body responsible for oversight, i.e. the Securities and
Exchange Commission (SEC). In this regard, the demand for implementation of the
recommendations of the Probe Committee has now become a far cry.
The other subject of issuance of new bank licences is also a debatable proposition.
Arguably, there is hardly any need for new banks - what the banking sector needs is
strengthened oversight relating to compliance of Basel III, and possibly improvement of
efficiency through competition and scaling up. Bangladesh Bank has drawn up a sound set
of eligibility criteria for any new banks. If new licence(s) has/have to be awarded it should
not be based on 'political consideration,' but on rigorous fulfilment of the eligibility
criteria. In view of the revealed attempts to relax those criteria, particularly the
requirement relating to Tk. 400 crore tax paid sponsors' fund, the Central Bank should
remain committed to the criteria that itself has set. Under all circumstances there should
be full disclosure regarding the applications and the award, as and when made.
Under the fiscal transparency requirements, the Finance Minister in FY2009-10 started the
quarterly practice of reporting on the state of the economy to the parliament. Curiously,
the Minister has not introduced such reports to the parliament during the last three
quarters (two, if the Budget Speech is excluded). One may expect that the Minister will
use his next reporting opportunity to deliberate on the package of measures that he
thinks necessary to reboot the economic management for FY2011-12.

Independent Review of Bangladesh's Development32
CH
AP
TE
R
1REFERENCES
Bhattacharya, D. and Dasgupta, S. 2011. Assessing the Impact of the Global Economic and Financial Crisis on
Bangladesh: An Intervention Analysis. Dhaka: Centre for Policy Dialogue (CPD). Mimeo.
CPD. 2011. State of the Bangladesh Economy in 2009-10 and Outlook for 2010-11. Dhaka: Centre for Policy
Dialogue (CPD).
FOMC. 2011. Economic Projections of Federal Reserve FOMC, November 2011. Available at: http://www.fed
eralreserve.gov/monetarypolicy/files/fomcprojtabl20111102.pdf
UNDESA. 2011. World Economic Situation and Prospects 2011: Update as of Mid-2011. New York: United Nations
Department of Economic and Social Affairs (UNDESA). Available at: http://www.un.org/en/development/
desa/policy/wesp/wesp_current/2011wespupdate.pdf
UNDESA. 2011a. World Economic Situation and Prospects 2011 (Updated Forecast). New York: United Nations
Department of Economic and Social Affairs (UNDESA). Available at: http://www.un.org/en/development/
desa/policy/wesp/wesp_current/2012wesp.pdf
World Bank. 2011. Bangladesh Economic Update. Available at: http://siteresources.worldbank.org/BANGLADESHE
XTN/Resources/295759-1312851106827/BangladeshEconUpdateNewOct2011.pdf

State of the Bangladesh Economy in FY2010-11 33
CH
AP
TE
R
1
RMG Import Growth of US in FY2011-12 (July-August)(in Per cent)
Annex Table 1.1
Source: Estimated from the United States International Trade Commission (USITC) data.
Exporter Knitwear Woven Wear Total RMG
World 10.5 7.5 9.2
Bangladesh 0.6 26.4 18.5
Cambodia 20.8 4.8 15.8
China 9.4 0.1 4.8
India 8.7 11.5 10.2
Pakistan 11.0 11.1 11.0
Sri Lanka 30.5 4.2 15.4
Vietnam 10.3 11.8 11.0
Import Growth of Selected Commodities(in Per cent)
Annex Table 1.2
Source: Estimated from the Bangladesh Bank data.
Item FY2011 FY2012
(July- August) (July- August)
A. Foodgrains 317.4 -19.0
Rice 7020.0 13.7
Wheat 104.9 -55.0
B. Other Food Items 104.3 34.8
C. Consumer and Intermediate Goods 90.9 6.1
Crude petroleum - -30.1
Petroleum and other liquids (POL) 16.8 -5.9
Fertiliser 539.4 76.5
Raw cotton 67.6 -21.8
Yarn 89.9 25.7
Textile and articles thereof 50.5 11.1
D. Capital Goods and Others 0.6 43.1
Capital machinery 21.8 36.4
E. Others n.i.e. 2435.6 9.1
Total (A+B+C+D+E) 132.5 17.0
F. Import by Export Processing Zone (EPZ) 78.0 7.6
Grand Total (A+B+C+D+E+F) 128.8 16.5
ANNEX TABLES