Embed Size (px)
Citation preview

19
Analytical Instrumentation
By James F. Tatera
Topic HighlightsSample Point SelectionInstrument SelectionSample Conditioning SystemsProcess Analytical System InstallationMaintenanceUtilization of Results
2.1 Introduction
Process analytical instruments are a unique category of process control instruments. They are a special class of sensors that enable the control engineer to control and/or monitor process and product char-acteristics in significantly more complex and varying ways than traditional physical sensors—such as pressure, temperature and flow—allow.
Today’s safety and environmental requirements, time sensitive production processes, inventory reduc-tion efforts, cost reduction efforts, and process automation schemes have made process analysis a requirement for many processes’ control strategies. Most process analyzers are providing real-time information to the control scheme that many years ago would have been the type of feedback the pro-duction process would have received from a plant’s quality assurance laboratory. Most processes require faster feedback to control the process, rather than just being advised that their process was or wasn’t in control at the time the lab sample was taken, and/or the sample was or wasn’t in specifica-tion.
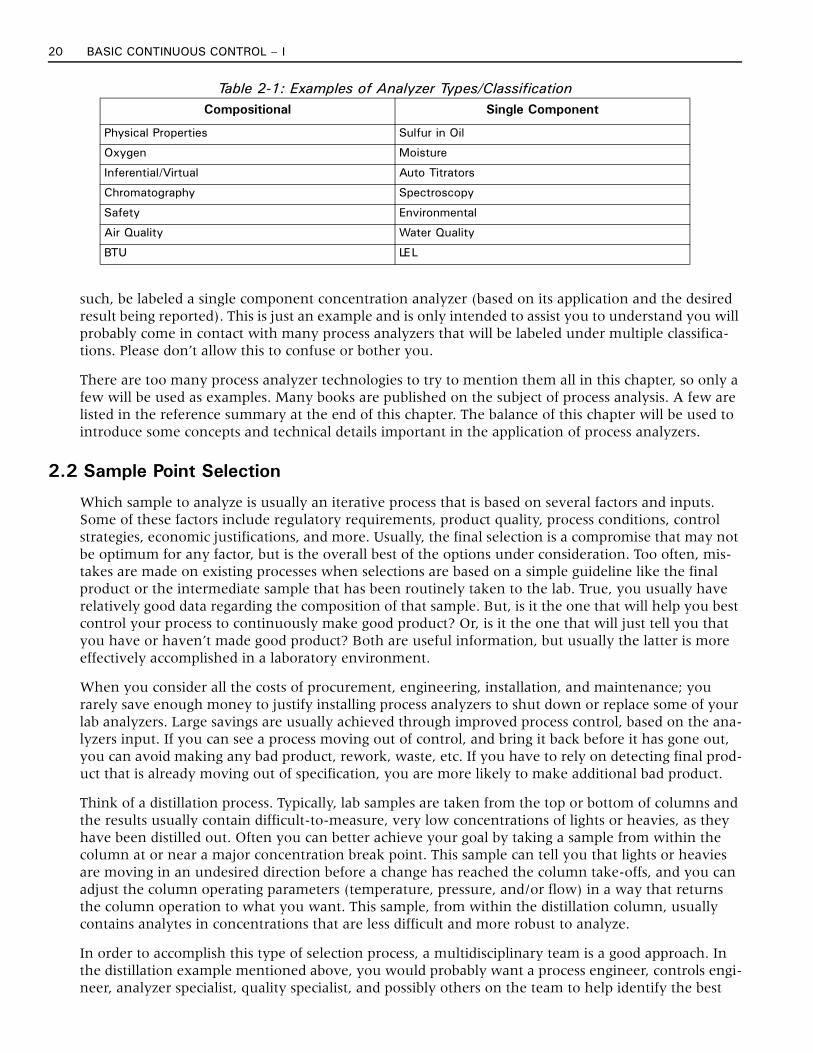
Different individuals have made several attempts to categorize the large variety of monitors typically called process analyzers. None of these classification schemes has been widely accepted; the result is there are a number of simultaneous categorization schemes in use. Most of these schemes are based on either the analytical technology being utilized by the monitor, the application to which the monitor is being applied, or the sample type. There are no hard and fast definitions for analyzer types. Conse-quently, most analytical instruments are classed under multiple and different groupings. Table 2-1 depicts a few of the analyzer type labels commonly used.
An example of how a single analyzer can be classed under many types would be a pH analyzer. This analyzer is designed to measure the pH (an electrochemical property of a solution—usually water-based). As such it can be used to report the pH of the solution and may be labeled as a pH analyzer or electrochemical analyzer (its analytical technology label). It may be used to monitor plant’s water out-fall and, as such, may be called an Environmental or Water Quality Analyzer (based on its application and sample type). It may be used to monitor the acid or base concentration of a process stream and, as
20 BASIC CONTINUOUS CONTROL – I
Table 2-1: Examples of Analyzer Types/Classification
such, be labeled a single component concentration analyzer (based on its application and the desired result being reported). This is just an example and is only intended to assist you to understand you will probably come in contact with many process analyzers that will be labeled under multiple classifica-tions. Please don’t allow this to confuse or bother you.
There are too many process analyzer technologies to try to mention them all in this chapter, so only a few will be used as examples. Many books are published on the subject of process analysis. A few are listed in the reference summary at the end of this chapter. The balance of this chapter will be used to introduce some concepts and technical details important in the application of process analyzers.
2.2 Sample Point Selection
Which sample to analyze is usually an iterative process that is based on several factors and inputs. Some of these factors include regulatory requirements, product quality, process conditions, control strategies, economic justifications, and more. Usually, the final selection is a compromise that may not be optimum for any factor, but is the overall best of the options under consideration. Too often, mis-takes are made on existing processes when selections are based on a simple guideline like the final product or the intermediate sample that has been routinely taken to the lab. True, you usually have relatively good data regarding the composition of that sample. But, is it the one that will help you best control your process to continuously make good product? Or, is it the one that will just tell you that you have or haven’t made good product? Both are useful information, but usually the latter is more effectively accomplished in a laboratory environment.
When you consider all the costs of procurement, engineering, installation, and maintenance; you rarely save enough money to justify installing process analyzers to shut down or replace some of your lab analyzers. Large savings are usually achieved through improved process control, based on the ana-lyzers input. If you can see a process moving out of control, and bring it back before it has gone out, you can avoid making any bad product, rework, waste, etc. If you have to rely on detecting final prod-uct that is already moving out of specification, you are more likely to make additional bad product.
Think of a distillation process. Typically, lab samples are taken from the top or bottom of columns and the results usually contain difficult-to-measure, very low concentrations of lights or heavies, as they have been distilled out. Often you can better achieve your goal by taking a sample from within the column at or near a major concentration break point. This sample can tell you that lights or heavies are moving in an undesired direction before a change has reached the column take-offs, and you can adjust the column operating parameters (temperature, pressure, and/or flow) in a way that returns the column operation to what you want. This sample, from within the distillation column, usually contains analytes in concentrations that are less difficult and more robust to analyze.
In order to accomplish this type of selection process, a multidisciplinary team is a good approach. In the distillation example mentioned above, you would probably want a process engineer, controls engi-neer, analyzer specialist, quality specialist, and possibly others on the team to help identify the best
Compositional Single Component
Physical Properties Sulfur in Oil
Oxygen Moisture
Inferential/Virtual Auto Titrators
Chromatography Spectroscopy
Safety Environmental
Air Quality Water Quality
BTU LEL

Chapter 2: Analytical Instrumentation 21
sampling point. If you have the luxury of an appropriate pilot plant, it is often the best place to start. You do not have to risk interfering with production as you possibly experiment with different sample points and control strategies. Pilot plants are also often allowed to intentionally make bad product and demonstrate undesirable operating conditions.
Another tool that is often used to help identify desirable sample points and control strategies is multi-ple Temporary Relocatable Process Analyzers (TURPAs). With an appropriate selection of these instru-ments, you can do a great job modeling the process and evaluating different control strategies. Once you have identified the sample point and desired measurement, you are ready to begin the instrument selection phase of the process.
2.3 Instrument Selection
Process analyzer selection is also typically best accomplished through a multidisciplinary team. This team’s members often include the process analytical specialist, quality assurance and/or research lab analysts, process analyzer maintenance personnel, process engineers, instrument engineers, and possi-bly others. The list should include all the appropriate individuals who have a stake in the project. Of these job categories, the ones most often not contacted until the selection has been made—and the ones probably most important to its long-term success—are the maintenance personnel. Everyone relies on them having confidence in it and keeping it working over the long term.
At this point, you have identified the sample to be measured (concentration range to be monitored under normal and upset operating conditions, required measurement precision and accuracy, speed of analysis required to support the identified control strategy, etc.). You also should have identified other components/materials that could be present under normal and abnormal conditions. These other components/materials are used in the method selection process to ensure they will not interfere with the selected method/technology.
You are now identifying possible technology candidates and trying to select the best for your total sit-uation. If you have a current lab analytical method for this or a similar sample, you should not ignore it, but more often than not, it is not selected as the best technology for the process analysis. It is often too slow, complex, fragile, expensive, or has other issues, to successfully pass the final cut. Lastly, if you have more than one good candidate, consider the sites’ experience maintaining these technolo-gies. Are they something with which maintenance has experience and training? Does the site have existing spare parts and compatible data communications systems? If not, what are the spare parts supply and maintenance support issues?
All of these items and more maintenance concerns should be brought up by the maintenance repre-sentative on your selection team and need to be taken seriously in the selection process. The greatest measurement in the world that cannot be maintained and kept performing in a manner consistent with your processes operations will not meet your long-term needs.
At this point, your selection team needs to review its options and select the analytical technology that you believe will best serve your needs over the long term. The analytical technology selected does not need to be the one that will yield the most accurate and precise measurement. It needs to be the one that will provide the measurement that you require in a timely, reliable and cost effective manner over the long term.
2.4 Sample Conditioning Systems
Sample conditioning sounds simple. You simply take the sample that the process provides and condi-tion/modify it in ways that allow the selected analyzer to accept it. In spite of this relatively simple sounding mission, most process analyzer specialists attribute 50 to 80% of process analyzer failures to sample conditioning issues. Recall that the system has to deliver acceptable sample to the analyzer
22 BASIC CONTINUOUS CONTROL – I
under a variety of normal, upset, start up, shut down, and other process conditions. Usually the sam-pling system not only has to consider the interface requirements of getting an acceptable sample from the process to the analyzer, but it usually has to dispose of that sample in a reliable and cost effective manner. Disposing the sample often involves returning it to the process and sometimes conditioning it to make it appropriate for the return journey.
What is considered an acceptable sample for the analyzer? Usually, this is defined as one that is “repre-sentative” of the process stream and compatible with the analyzer’s sample introduction requirements. In this case “representative” can be a confusing term. It usually doesn’t have to represent the process stream in a physical sense. Typical sample conditioning systems usually change the process sample’s temperature, pressure and some other parameters in order to make the process sample compatible with the selected process analyzer. In many cases, conditioning goes beyond the simple temperature and pressure issues and includes things that actually change the composition of the sample—things like filters, demisters, bubblers, scrubbers, membrane separators, and more. These are things that actu-ally change the sample composition. However, as long as the resulting sample is compatible with the analyzer and the resulting analysis is correlatable/representative of the process it is considered a good job of sample conditioning.
Some sampling systems also provide stream switching and/or auto calibration capabilities. Since the process/calibration samples often begin at different conditions and to reduce the possibility of cross contamination, most of these include multiple process sampling systems with stream selection capabil-ities (often double block and bleed valving) just before the analyzer.
Figure 2-1 depicts a typical boxed sample conditioning system. A total sampling system would nor-mally also include the sample extraction approach (possibly a tee, probe, vaporizer, etc.,) transport lines, return lines, fast loop, slow loop, sample return, etc. In the figure you can see an assortment of filters, flow controllers, valves, etc. Figure 2-2 depicts an in situ analyzer installation that has required very little sample conditioning and is essentially installed in the process loop.
Most analyzers are designed to work on clean, dry, non-corrosive samples in a given temperature and pressure range. The sample system should accomplish the process sample’s conversion to the ana-lyzer’s sample requirements in a timely, “representative,” accurate, and usable form. A well-designed, operating, and maintained sampling system is necessary for the success of the process analyzer project. Sampling is a crucial art and science for successful process analysis projects. It is a topic that is too large to more than touch on in this chapter. For more information on sampling, refer to some of the refer-ences listed.
2.5 Process Analytical System Installation
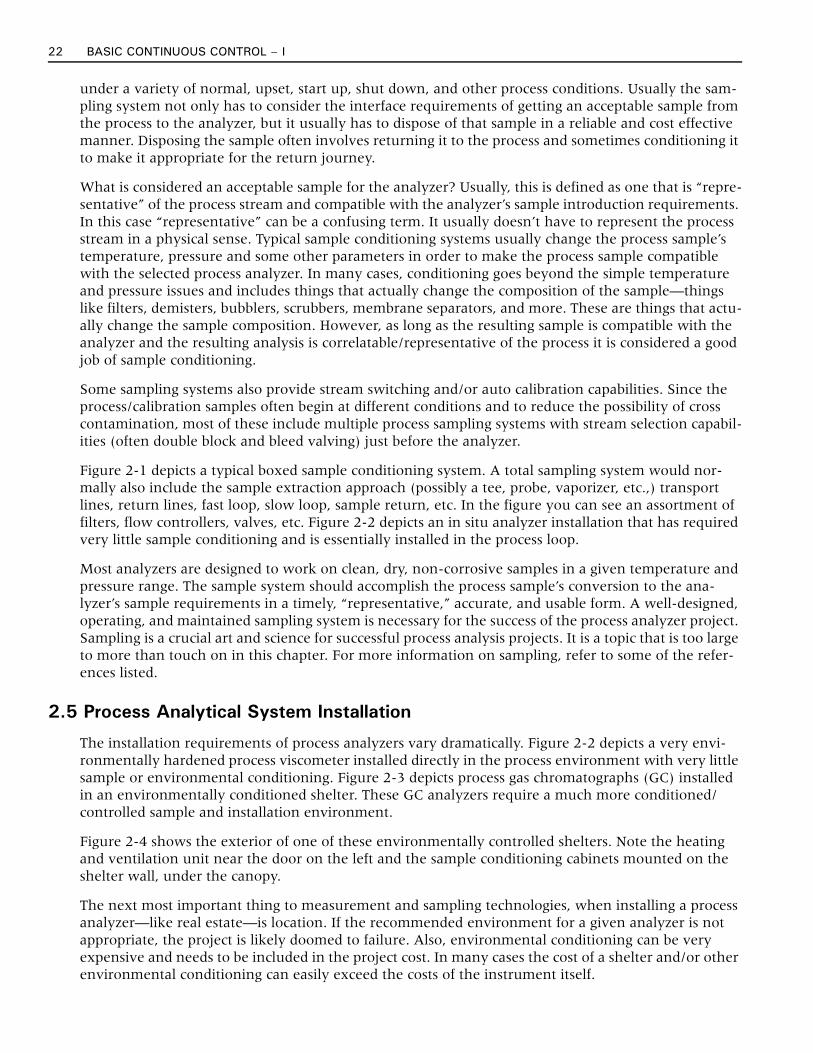
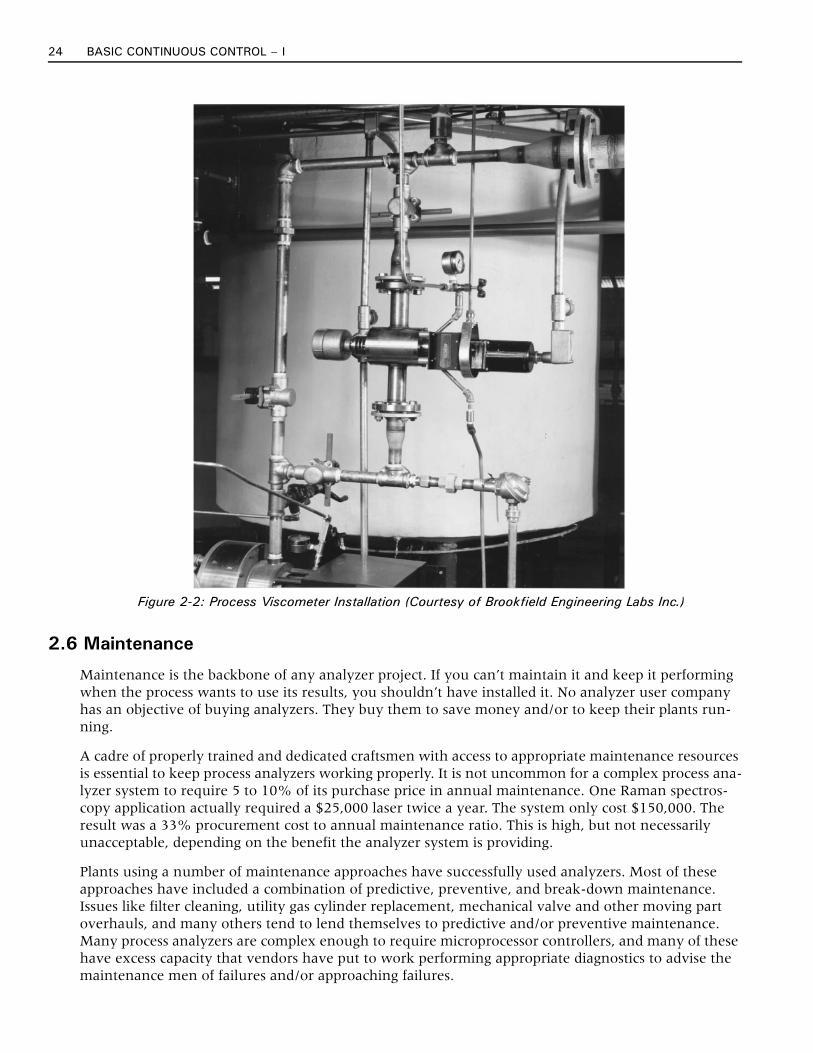
The installation requirements of process analyzers vary dramatically. Figure 2-2 depicts a very envi-ronmentally hardened process viscometer installed directly in the process environment with very little sample or environmental conditioning. Figure 2-3 depicts process gas chromatographs (GC) installed in an environmentally conditioned shelter. These GC analyzers require a much more conditioned/controlled sample and installation environment.
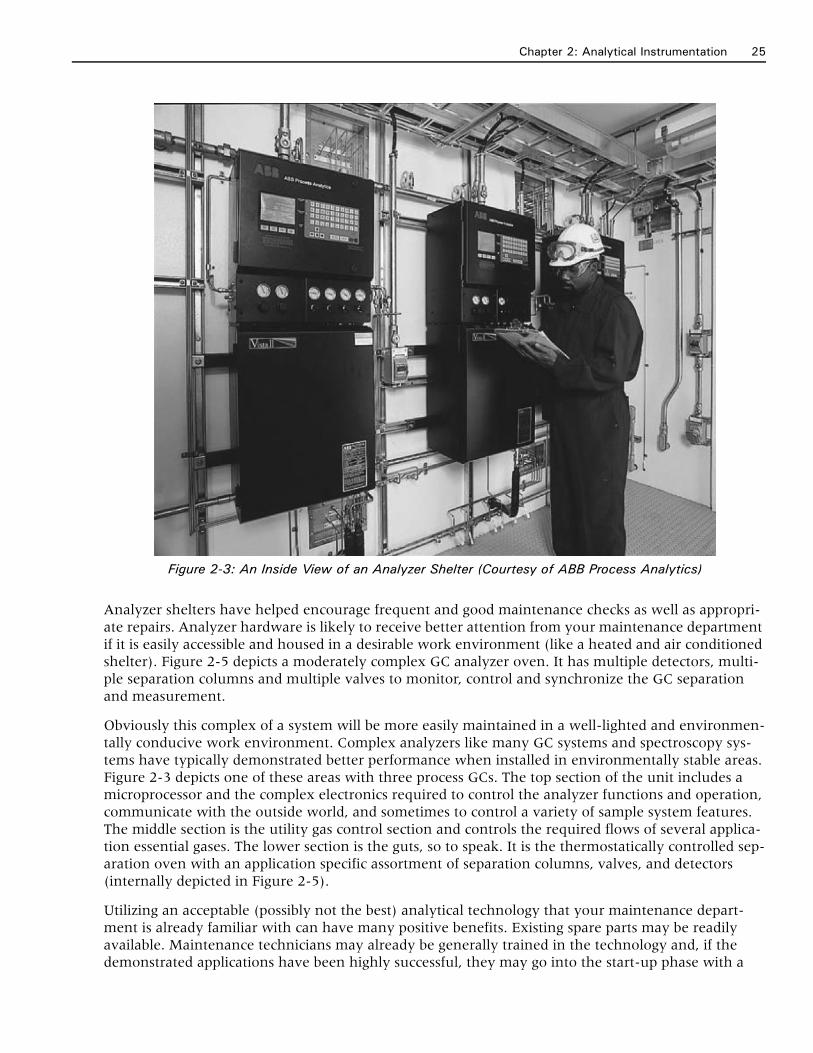
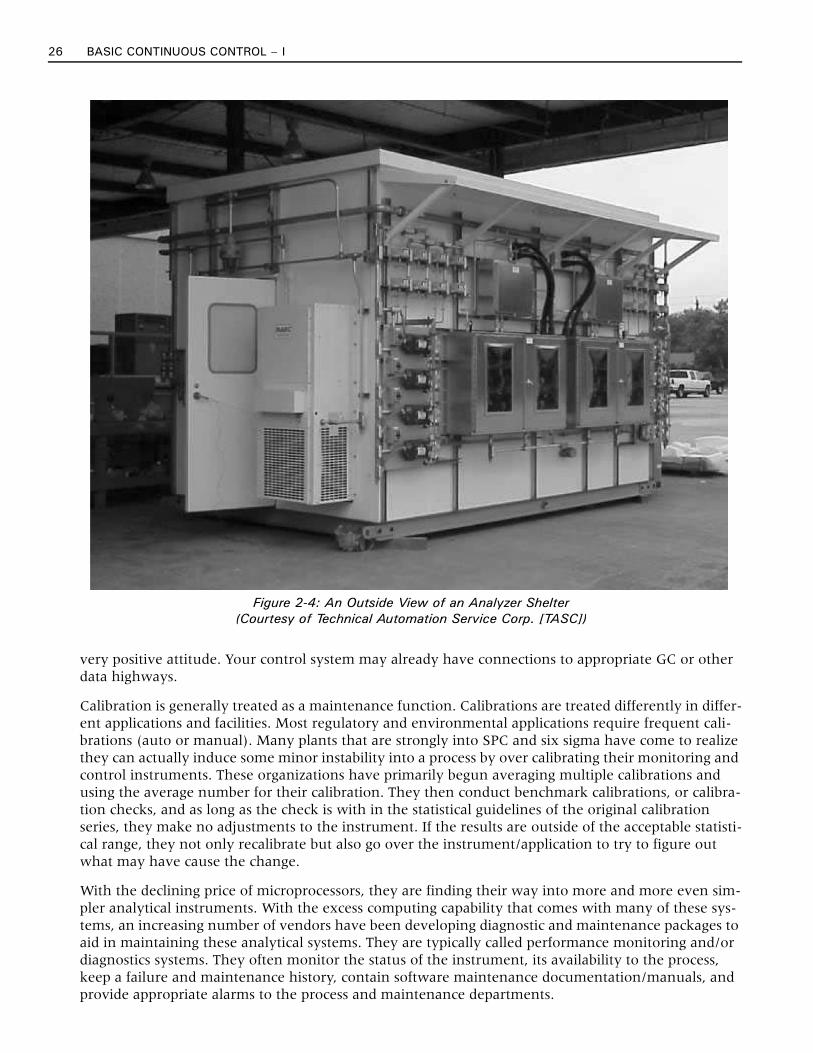
Figure 2-4 shows the exterior of one of these environmentally controlled shelters. Note the heating and ventilation unit near the door on the left and the sample conditioning cabinets mounted on the shelter wall, under the canopy.
The next most important thing to measurement and sampling technologies, when installing a process analyzer—like real estate—is location. If the recommended environment for a given analyzer is not appropriate, the project is likely doomed to failure. Also, environmental conditioning can be very expensive and needs to be included in the project cost. In many cases the cost of a shelter and/or other environmental conditioning can easily exceed the costs of the instrument itself.

Chapter 2: Analytical Instrumentation 23
Some analyzers can operate with a moderate amount of process-induced vibration, sample condition variation, and ambient environmental fluctuations. Others require highly stable environments (almost a lab type environment). Some analyzers are suitable for installation in various hazardous process environments, while others may not be. This all needs to be taken into consideration in the earlier technology selection processes. To obtain the best choice for the situation, you need to consider sam-pling issues, such as how far you will have to transport a sample to install the analyzer in a suitable location.
Typical installation issues, for example, include the process sample area’s hazardous rating, as com-pared to the process analyzers hazardous area certification. Are there a number of large pumps and compressors that may cause a lot of vibration and require special or distant analyzer installation tech-niques? Each analyzer comes with detailed installation requirements. These should be reviewed prior to purchasing. Generalized guidelines for various analyzer types are mentioned in some of the refer-ences cited at the end of this chapter.
Figure 2-1: Example of a Boxed Sampling System (Courtesy of Technical Automation Service Corp. [TASC])
24 BASIC CONTINUOUS CONTROL – I
2.6 Maintenance
Maintenance is the backbone of any analyzer project. If you can’t maintain it and keep it performing when the process wants to use its results, you shouldn’t have installed it. No analyzer user company has an objective of buying analyzers. They buy them to save money and/or to keep their plants run-ning.
A cadre of properly trained and dedicated craftsmen with access to appropriate maintenance resources is essential to keep process analyzers working properly. It is not uncommon for a complex process ana-lyzer system to require 5 to 10% of its purchase price in annual maintenance. One Raman spectros-copy application actually required a $25,000 laser twice a year. The system only cost $150,000. The result was a 33% procurement cost to annual maintenance ratio. This is high, but not necessarily unacceptable, depending on the benefit the analyzer system is providing.
Plants using a number of maintenance approaches have successfully used analyzers. Most of these approaches have included a combination of predictive, preventive, and break-down maintenance. Issues like filter cleaning, utility gas cylinder replacement, mechanical valve and other moving part overhauls, and many others tend to lend themselves to predictive and/or preventive maintenance. Many process analyzers are complex enough to require microprocessor controllers, and many of these have excess capacity that vendors have put to work performing appropriate diagnostics to advise the maintenance men of failures and/or approaching failures.
Figure 2-2: Process Viscometer Installation (Courtesy of Brookfield Engineering Labs Inc.)
Chapter 2: Analytical Instrumentation 25
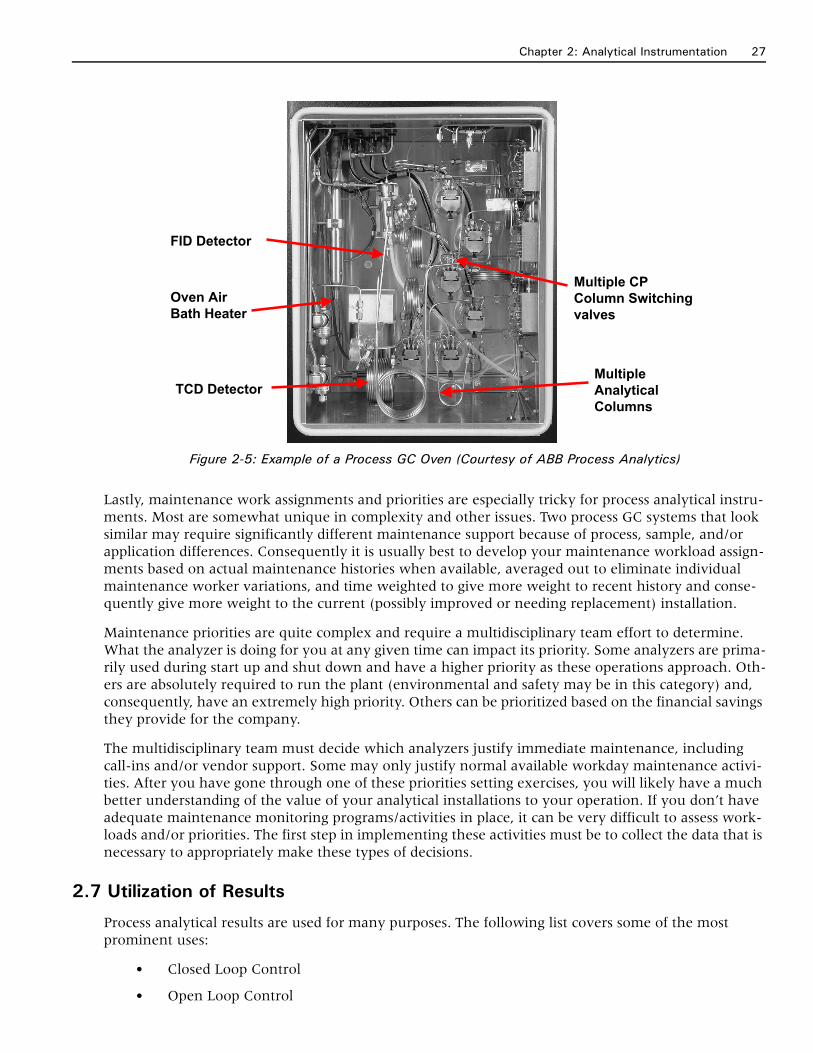
Analyzer shelters have helped encourage frequent and good maintenance checks as well as appropri-ate repairs. Analyzer hardware is likely to receive better attention from your maintenance department if it is easily accessible and housed in a desirable work environment (like a heated and air conditioned shelter). Figure 2-5 depicts a moderately complex GC analyzer oven. It has multiple detectors, multi-ple separation columns and multiple valves to monitor, control and synchronize the GC separation and measurement.
Obviously this complex of a system will be more easily maintained in a well-lighted and environmen-tally conducive work environment. Complex analyzers like many GC systems and spectroscopy sys-tems have typically demonstrated better performance when installed in environmentally stable areas. Figure 2-3 depicts one of these areas with three process GCs. The top section of the unit includes a microprocessor and the complex electronics required to control the analyzer functions and operation, communicate with the outside world, and sometimes to control a variety of sample system features. The middle section is the utility gas control section and controls the required flows of several applica-tion essential gases. The lower section is the guts, so to speak. It is the thermostatically controlled sep-aration oven with an application specific assortment of separation columns, valves, and detectors (internally depicted in Figure 2-5).
Utilizing an acceptable (possibly not the best) analytical technology that your maintenance depart-ment is already familiar with can have many positive benefits. Existing spare parts may be readily available. Maintenance technicians may already be generally trained in the technology and, if the demonstrated applications have been highly successful, they may go into the start-up phase with a
Figure 2-3: An Inside View of an Analyzer Shelter (Courtesy of ABB Process Analytics)
26 BASIC CONTINUOUS CONTROL – I
very positive attitude. Your control system may already have connections to appropriate GC or other data highways.
Calibration is generally treated as a maintenance function. Calibrations are treated differently in differ-ent applications and facilities. Most regulatory and environmental applications require frequent cali-brations (auto or manual). Many plants that are strongly into SPC and six sigma have come to realize they can actually induce some minor instability into a process by over calibrating their monitoring and control instruments. These organizations have primarily begun averaging multiple calibrations and using the average number for their calibration. They then conduct benchmark calibrations, or calibra-tion checks, and as long as the check is with in the statistical guidelines of the original calibration series, they make no adjustments to the instrument. If the results are outside of the acceptable statisti-cal range, they not only recalibrate but also go over the instrument/application to try to figure out what may have cause the change.
With the declining price of microprocessors, they are finding their way into more and more even sim-pler analytical instruments. With the excess computing capability that comes with many of these sys-tems, an increasing number of vendors have been developing diagnostic and maintenance packages to aid in maintaining these analytical systems. They are typically called performance monitoring and/or diagnostics systems. They often monitor the status of the instrument, its availability to the process, keep a failure and maintenance history, contain software maintenance documentation/manuals, and provide appropriate alarms to the process and maintenance departments.
Figure 2-4: An Outside View of an Analyzer Shelter (Courtesy of Technical Automation Service Corp. [TASC])
Chapter 2: Analytical Instrumentation 27
Lastly, maintenance work assignments and priorities are especially tricky for process analytical instru-ments. Most are somewhat unique in complexity and other issues. Two process GC systems that look similar may require significantly different maintenance support because of process, sample, and/or application differences. Consequently it is usually best to develop your maintenance workload assign-ments based on actual maintenance histories when available, averaged out to eliminate individual maintenance worker variations, and time weighted to give more weight to recent history and conse-quently give more weight to the current (possibly improved or needing replacement) installation.
Maintenance priorities are quite complex and require a multidisciplinary team effort to determine. What the analyzer is doing for you at any given time can impact its priority. Some analyzers are prima-rily used during start up and shut down and have a higher priority as these operations approach. Oth-ers are absolutely required to run the plant (environmental and safety may be in this category) and, consequently, have an extremely high priority. Others can be prioritized based on the financial savings they provide for the company.
The multidisciplinary team must decide which analyzers justify immediate maintenance, including call-ins and/or vendor support. Some may only justify normal available workday maintenance activi-ties. After you have gone through one of these priorities setting exercises, you will likely have a much better understanding of the value of your analytical installations to your operation. If you don’t have adequate maintenance monitoring programs/activities in place, it can be very difficult to assess work-loads and/or priorities. The first step in implementing these activities must be to collect the data that is necessary to appropriately make these types of decisions.
2.7 Utilization of Results
Process analytical results are used for many purposes. The following list covers some of the most prominent uses:
• Closed Loop Control
• Open Loop Control
Figure 2-5: Example of a Process GC Oven (Courtesy of ABB Process Analytics)
FID Detector
Multiple CP
Column Switching
valves
Oven Air
Bath Heater
Multiple
Analytical
Columns
TCD Detector

28 BASIC CONTINUOUS CONTROL – I
• Process Monitoring
• Product Quality Monitoring
• Environmental Monitoring
• Safety Monitoring
With the large installed data communications base that exists in most modern plants, the process anal-ysis results/outputs are used by most major systems including process control systems, laboratory information management systems, plant information systems, maintenance systems, safety systems, enterprise systems, and regulatory reporting systems (like environmental reports to the EPA). How these results are used by the various groups have been alluded to in several of the previous sections and is more completely discussed in some of the cited references.
2.8 References
Carr-Brion, K. G. and J. R. P. Clarke. Sampling Systems For Process Analysers. Second Edition. Butter-worth–Heinemann, 1996.
Houser, E. A. Principles of Sample Handling and Sampling Systems Design For Process Analysis. ISA, 1972.
Lipták, B. G., Editor-in-Chief. Instrument Engineers’ Handbook–Process Measurement and Analysis (Volume 1). Fourth Edition. CRC Press and ISA, 2003.
Sherman, R. E., editor, and L. J. Rhodes. Analytical Instrumentation. Practical Guides for Measurement and Control Series. ISA, 1996.
Sherman, R. E. Process Analyzer Sample-Conditioning System Technology. Wiley Series in Chemical Engi-neering. John Wiley and Sons Inc., 2002.
About the Author
James F. (Jim) Tatera is a Senior Process Analysis Consultant with Tatera & Associates Inc. For sev-eral years, he has provided process analytical consulting/contracting services to user, vendor and aca-demic organizations. His 32-plus year career has included over 27 years of working with process analyzers for Dow Corning, including both U.S. and international assignments in analytical research, process engineering, project engineering, production management, and maintenance management. He is an ISA Fellow, is one of the original Certified Specialists in Analytical Technology (CSAT), is active in U.S. and IEC process analysis standards activities, and has received several awards for his work in the process analysis field. He is the ANSI USNC Technical Advisor to IEC SC65D (Analyzing Equipment in Industrial Process Measurement and Control) and has served as the ISA SP76 (Compo-sitional Analyzers) committee chairman and member.