Embed Size (px)
Citation preview
D o s s i e rSecond and Third Generation Biofuels: Towards Sustainability and Competitiveness
Seconde et troisième génération de biocarburants : développement durable et compétitivité
Analytical Estimation of Water-Oil Relative
Permeabilities through Fractures
Hadi Saboorian-Jooybari
Reservoir Studies Division, Department of Petroleum Engineering, Main Office Building,National Iranian South Oil Company (NISOC), P.O. Box 61735-1333, Ahvaz - Iran
e-mail: [email protected]
Abstract — Modeling multiphase flow through fractures is a key issue for understanding flow mechanismand performance prediction of fractured petroleum reservoirs, geothermal reservoirs, undergroundaquifers and carbon-dioxide sequestration. One of the most challenging subjects in modeling offractured petroleum reservoirs is quantifying fluids competition for flow in fracture network (relativepermeability curves). Unfortunately, there is no standard technique for experimental measurement ofrelative permeabilities through fractures and the existing methods are very expensive, time consumingand erroneous. Although, several formulations were presented to calculate fracture relative permeabilitycurves in the form of linear and power functions of flowing fluids saturation, it is still unclear what formof relative permeability curves must be used for proper modeling of flow through fractures andconsequently accurate reservoir simulation. Basically, the classic linear relative permeability (X-type)curves are used in almost all of reservoir simulators. In this work, basic fluid flow equations arecombined to develop a new simple analytical model for water-oil two phase flow in a single fracture.The model gives rise to simple analytic formulations for fracture relative permeabilities. The modelexplicitly proves that water-oil relative permeabilities in fracture network are functions of fluidssaturation, viscosity ratio, fluids density, inclination of fracture plane from horizon, pressure gradientalong fracture and rock matrix wettability, however they were considered to be only functions ofsaturations in the classic X-type and power (Corey [35] and Honarpour et al. [28, 29]) models.Eventually, validity of the proposed formulations is checked against literature experimental data. Theproposed fracture relative permeability functions have several advantages over the existing ones. Firstly,they are explicit functions of the parameters which are known for each of simulation computational cellsor easy to measure in laboratory. It is also the first model that takes gravity effects and wettability offracture walls into consideration and individually developed for water and oil-wet systems. Furthermore,the newly developed formulations are simple, efficient and accurate. Thus, they are recommended forimplementation in dual and multiple continuum commercial reservoir simulators.
Résumé — Estimation analytique des perméabilités relatives de l’eau et de l’huile d’un réseau defractures— La modélisation de l’écoulement multiphasique à travers des fractures est un sujet-clé pourmieux modéliser les écoulements au sein des réservoirs pétroliers/géothermiques, des aquifèressouterrains ou lors de la séquestration de dioxyde de carbone. Cette étape est essentielle pour évaluerla production d’un réservoir, la capacité de stockage ou prédire les productions futures. Un des sujetsles plus difficiles dans la modélisation des réservoirs pétroliers fracturés est de quantifier l’interactionde différents fluides lorsqu’ils s’écoulent dans le réseau de fractures (courbes de la perméabilitérelative). Malheureusement, il n’existe pas de technique expérimentale standard pour mesurer laperméabilité relative à travers des fractures et les méthodes existantes sont trop coûteuses,
Oil & Gas Science and Technology – Rev. IFP Energies nouvelles (2016) 71, 31� H. Saboorian-Jooybari, published by IFP Energies nouvelles, 2015DOI: 10.2516/ogst/2014054
This is an Open Access article distributed under the terms of the Creative Commons Attribution License (http://creativecommons.org/licenses/by/4.0),which permits unrestricted use, distribution, and reproduction in any medium, provided the original work is properly cited.
chronophages et incertaines. Toutefois, plusieurs formulations ont déjà été proposées pour calculer lescourbes de perméabilité relative rendant compte de l’écoulement de fluides dans des fractures. Cesformulations sont des fonctions linéaires ou puissances de saturation des fluides. Cependant, la formedes courbes de perméabilité relative permettant de modéliser correctement l’écoulement à travers desfractures et par conséquent de simuler précisément le réservoir reste sujet à débat. En fait, lescourbes classiques de perméabilité relative (type-X) sont utilisées dans presque tous les simulateursde réservoir. Dans cette étude, les équations de l’écoulement des fluides sont combinées afin dedévelopper un modèle simple et analytique pour le cas de l’écoulement diphasique eau/huile dansune seule fracture. Ce modèle fournit une formulation simple et analytique des perméabilitésrelatives de fractures. Ce modèle prouve explicitement que les perméabilités relatives eau/huiledans un réseau fracturé sont fonctions de la saturation des fluides, du rapport de viscosité, desdensités des fluides, de l’inclination des fractures, du gradient de pression et de la mouillabilité dematrice (roche saine). Il est intéressant de noter que dans les précédents modèles, de type-X oupuissance (Corey [35] and Honarpour et al. [28, 29]), seule une dépendance aux saturations étaitconsidérée. Finalement, la validité des formulations proposées est vérifiée par comparaisons à desdonnées expérimentales fournies dans la littérature. Les fonctions de perméabilité relative proposéesoffrent plusieurs avantages par rapport des celles déjà existantes. Premièrement, elles sont desfonctions explicites de paramètres qui sont soit connus pour chacune des cellules de simulation, ousoit simples à mesurer en laboratoire. Ce modèle est aussi le premier à considérer les effetsgravitationnels et une mouillabilité variable de fracture et il a été mis au point pour des systèmeseau/huile. De plus, ces nouvelles formulations développées sont simples, efficaces et précises. Leursutilisations sont donc recommandées dans les simulateurs de réservoirs commerciaux double oumultiples continuum.
NOMENCLATURE
A Cross-sectional area to flow (m)
b Fracture aperture (m)bo Mean value of fracture half-aperture (m)c1, c2 Constant of integrationg Acceleration of gravity (9.81 m/s2)
h Height, thickness (m)HD Ratio of gravity to capillary force (dimensionless)k Absolute permeability (m2)kr Relative permeability (fraction)
kr* End-point relative permeability (fraction)n ExponentP Pressure (Pa)q Volumetric flow rate (cm3/s)
S Saturation (fraction)u Velocity (m/s)u Average velocity (m/s)W Fracture width (m)
GREEK
D DifferenceU Flow potential (Pa)
r Interfacial tension (N/m)
l Viscosity (cp)s Shear stress (Pa)q Density (kg/m3)c Specific weight (Pa/m)
h Inclination degree of fracture plates from horizon,contact angle
@ Partial differential operator
SUBSCRIPTS AND SUPERSCRIPTS
* Normalizedc Connate
eff Effectiveg Gasi Phase namel Liquid
m Mean (average)nw Non-wetting phaseo Oilr Residualw Water, wetting phase
x x-direction (m)z z-direction (m)
Page 2 of 17 Oil & Gas Science and Technology – Rev. IFP Energies nouvelles (2016) 71, 31
INTRODUCTION
Naturally fractured reservoirs contain more than 50% of theknown oil and gas reserve worldwide and supply a signifi-cant portion of daily oil and gas demands [1]. North Seachalks, Texas carbonates and Asmari limestone in Iran andIraq are examples of naturally fractured reservoirs. Despitetheir significant importance in supplying increasing oildemands, this type of reservoirs exhibits relatively lowlevels of oil recovery compared to conventional reservoirs.This is mainly attributed to the complex nature of thesereservoirs due to presence of two distinct porosity systems(matrix blocks and fractures) that aggravates reservoir hetero-geneity and makes reservoir characterization, modeling andsimulation a complicated and erroneous task. Furthermore, theoil-wetness tendency of rocks is another cause of very lowrecovery efficiency in such reservoirs [2]. Multiphase flowin fractured formations is of particular importance forunderstanding the performance of groundwater hydrology,geothermal reservoirs and disposal of hazardous wastes intounderground water. Hydrocarbon reservoirs produce fluidsunder a combination of mechanisms including capillary,gravity and viscous displacement as well as pore compac-tion and fluids expansion. The displacement process in afractured reservoir takes place when gas or water movesrapidly in high permeable fractures and surrounds oil satu-rated matrix blocks partially or totally. On the other hand,invasion of matrix blocks by gas or water and expulsionof oil into the fracture network begins by the combinationof capillary and gravity forces once the matrix block isbesieged. This process is called imbibition when the dis-placing fluid is water, and gravity drainage when the dis-placing fluid is water. Depending on the flowing phasespresent in the fractured reservoir, either the capillary orthe gravity force becomes dominant [3]. These forces canwork in tandem or can oppose each other [4].
A number of researches [5-12] were conducted to shedadditional light on production mechanisms of the fracturedreservoirs. Reservoir simulation is the most effective andpractical method for studying multiphase flow problems inheterogeneous porous media. Numerical modeling of frac-tured reservoirs can be conducted with several existing tech-niques [13-18]:1) dual porosity,2) dual permeability,3) Multiple INteracting Continua (MINC),4) subdomain,5) Discrete Fracture Network (DFN).
The first four are referred to as multiple continuum tech-niques in which the reservoir is discretized into a series ofhigh storage capacity matrix blocks and high permeabilityfracture systems. These approaches have very little differ-ences with each other. In dual porosity models, fluid flow
only takes place through fracture systems and matrix blocksact as source and sink. In dual porosity models, matrixblocks are assumed to be connected to each other onlythrough a fracture network, whereas in dual permeabilityconcept the communication can occur between the adjacentblocks, as well as within the fractures. Dual permeabilitymodels allow the wells to be completed in both matrixblocks and fractures, but all flow to the wells in dual porositymodels takes place through fractures. MINC models gener-ate secondary nested gridding of the matrix blocks basedon the initial estimated solution. The subdomain allows userto refine matrix blocks in vertical direction for increasing theaccuracy of calculations. The DFN approach generates themodel of reservoir spatial distribution of fracture networkand detailed knowledge of the fracture intrinsic properties.Although DFN is a very rigorous technique for modelingnaturally fractured reservoirs, its application is limited dueto lack of the detailed input data required. Therefore, multi-ple continuum techniques are the most frequently used meth-ods for simulation of fractured porous media. In all ofmultiple continuum approaches including dual porositymodels, the basic governing fluid flow equations are writtenseparately for matrix blocks and fracture systems and thencoupled together. Therefore, simulation of fractured reser-voirs requires separate sets of relative permeability curvesfor the two comprising media [19-22].
Rock matrix relative permeabilities are easily measuredusing a standard experimental procedure on representativeplug samples during Special Core Analysis (SCAL). Twotechniques are commonly used in the industry for measure-ments of relative permeabilities: steady-state and unsteady-state methods. In the steady-state technique, two fluids aresimultaneously injected at a fixed ratio until saturation andpressure equilibriums are established. Relative permeabili-ties are directly calculated from the pressure drop and flowrate data. Then, the fluids ratio is adjusted to obtain the rel-ative permeabilities at other saturations. In the unsteady statemethod, the core plug is saturated with one fluid and theother fluid is injected into the sample either at constant rateor constant pressure while measuring the rate, pressure dropand the volume of the produced fluids. Relative permeabili-ties are then determined by one of the proposed mathemati-cal methods [23-27]. Detailed descriptions of theexperimental procedures of such measurements, mathemati-cal calculation, their advantages and drawbacks and existingempirical correlations can be found in a number of works[28, 29]. Unfortunately, there is no standard technique forexperimental measurement of relative permeabilitiesthrough fractures. Furthermore, the existing methods arevery expensive, time consuming and sometimes fail to mea-sure fracture properties correctly. For these reasons, develop-ment of analytical formulations for relative permeabilitiesthrough fractures is of great importance. Although, several
Oil & Gas Science and Technology – Rev. IFP Energies nouvelles (2016) 71, 31 Page 3 of 17
formulations are presented to calculate fracture relative per-meabilities in the form of linear and power functions of sat-uration, it is still unclear what form of relative permeabilitycurves must be used for proper modeling of multiphase flowthrough fractures and consequently for accurate reservoirsimulation. Upon this review, the necessity of the analyticaldevelopment of relative permeability functions for fluid flowthrough fracture network is revealed.
1 LITERATURE REVIEW
The ability of a medium to conduct a single phase fluid isknown as absolute permeability of that medium. A numberof researchers [30-34] have studied absolute permeabilityof fractures with parallel planar plates and all have reachedto the following expression for absolute permeability in sin-gle phase, isothermal, laminar and steady-state flow:
k ¼ b2
12ð1Þ
where b is the fracture aperture. In petroleum reservoirs,however, the rock pore spaces are usually occupied by two(or more) phases. In these cases, pores occupied by onephase are unavailable for flow by other phases and the con-cept of relative permeability is used to describe the compe-tency of phases for flow:
kri ¼ keff ;ik
ð2Þ
In this relation, kri is the relative permeability to phase i, k isthe absolute permeability of the porous medium and keff ;i isthe effective permeability to phase i. When two or more flu-ids flow at the same time, the relative permeability is themeasure of the conductance of the medium to each fluidphase. Indeed, the effective permeability of each fluid isthe permeability of the porous medium to the fluid whenthe saturation of that fluid is less than 100% and the relativepermeability of the fluid is the ratio of the effective perme-ability at a specific saturation of the fluid to the absolute per-meability of the medium. On the other hand, when a mediumis completely saturated with phase i, the effective and rela-tive permeabilities of the phase are, respectively, equal tothe absolute permeability of the medium and unity(keff ;i ¼ k and kri ¼ 1). For the phase i (considering immis-cible flow), the generalized Darcy’s law can be used todescribe flow rates as:
qi ¼ �Akkrili
� dUi
dxð3Þ
where qi is the volumetric flow rate of the phase, A is thecross-sectional area to flow, k is the absolute permeability,
kri is the effective permeability, li is viscosity of phase i,Ui is flow potential of phase i and x is direction of flow.
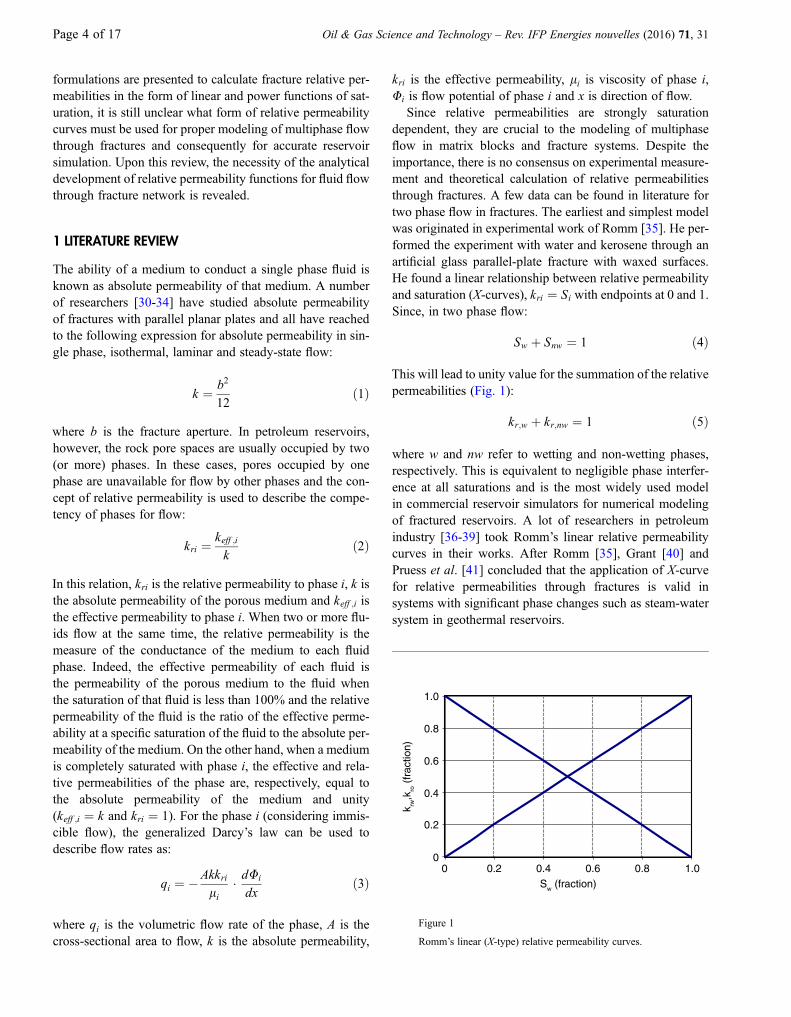
Since relative permeabilities are strongly saturationdependent, they are crucial to the modeling of multiphaseflow in matrix blocks and fracture systems. Despite theimportance, there is no consensus on experimental measure-ment and theoretical calculation of relative permeabilitiesthrough fractures. A few data can be found in literature fortwo phase flow in fractures. The earliest and simplest modelwas originated in experimental work of Romm [35]. He per-formed the experiment with water and kerosene through anartificial glass parallel-plate fracture with waxed surfaces.He found a linear relationship between relative permeabilityand saturation (X-curves), kri ¼ Si with endpoints at 0 and 1.Since, in two phase flow:
Sw þ Snw ¼ 1 ð4Þ
This will lead to unity value for the summation of the relativepermeabilities (Fig. 1):
kr;w þ kr;nw ¼ 1 ð5Þ
where w and nw refer to wetting and non-wetting phases,respectively. This is equivalent to negligible phase interfer-ence at all saturations and is the most widely used modelin commercial reservoir simulators for numerical modelingof fractured reservoirs. A lot of researchers in petroleumindustry [36-39] took Romm’s linear relative permeabilitycurves in their works. After Romm [35], Grant [40] andPruess et al. [41] concluded that the application of X-curvefor relative permeabilities through fractures is valid insystems with significant phase changes such as steam-watersystem in geothermal reservoirs.
0
0.2
0.4
0.6
0.8
1.0
0 0.2 0.4 0.6 0.8 1.0
k rw,k
ro (
frac
tion)
Sw (fraction)
Figure 1
Romm’s linear (X-type) relative permeability curves.
Page 4 of 17 Oil & Gas Science and Technology – Rev. IFP Energies nouvelles (2016) 71, 31
Among limited experimentally measured data available inthe literature only a few works observed Romm’s X-typemodel for relative permeabilities in fractures. Indeed, mostof the data indicate considerable departure from straight linebehavior. Romm’s experiment with water and oil was dupli-cated by Merrill [42] in glass parallel-plates fracture and innatural porous media split along the length by sawing with-out using waxed paper strips as spacers. Since most of thedata in his experiments scattered over a narrow range ofwater saturation (around a value of 71%), attempts failedto correlate relative permeability with saturation. However,the limited data indicated considerable deviation from theX-curve. A number of other analytical [43] and numerical[44] works for two phase flow in rough-walled and variableaperture fractures showed existence of considerable interfer-ence between phases and consequently kr;w þ kr;nw << 1.Apart from oil-water system, other researchers [45-48] con-ducted experiments with air and water and observed failureof the X-curve to model fracture relative permeabilities.
A number of experimental studies found that two phaseflow in fractures is better described using straight line rela-tive permeabilities with slope less than one. Pan et al. [49]suggested that the slope of 0.6 for air and 0.7 for water rel-ative permeability functions give rise to better match toexperimental data. While, Rangel-German et al. [50]obtained the slope of 0.6 for both air and water relative per-meabilities. Replacement of the unity slope of the X-curvemodel by smaller slopes in these works is an indication ofoccurrence of higher flow resistance in fractures becauseof strong interference between the flowing phases.
Some researchers [51-54] concluded that experimentallymeasured relative permeability curves are better matchedwith porous media approach (Corey model [55]) as:
kr;l ¼ S�4 ð6Þ
kr;g ¼ 1� S�2� �
1� S�ð Þ2 ð7Þ
where S� is normalized liquid saturation defined as:
S� ¼ Sl � Slr1� Slr � Sgr
ð8Þ
and Sg and Sl are gas and liquid saturations, respectively.Meanwhile, the subscript r refers to residual saturations ofthe phases. In contrary to the above works, experimentalstudies of Persoff et al. [45] and Persoff and Pruess [46] con-cluded that fracture relative permeability cannot be well fit-ted neither by straight-line nor by Corey model.
The other model known as pipe flow model treated flowthrough fractures as flow through a system of pipes to con-struct fracture relative permeability curves [47, 48]. In this
approach, a phase can be carried by the other phase as bub-bles, mist, slug and other structures without need of estab-lishing a continuous flow path. The models that weredeveloped on the basis of pipe flow approach can be catego-rized in two classes:– viscous coupling,– equivalent homogeneous single-phase models.
The viscous coupling model was firstly introduced byFourar et al. [56] for the simple case of lubricated film flowin a pipe equivalent to fracture as:
kr;l ¼ Sl2
2ð3� SlÞ ð9Þ
and
kr;g ¼ 1� Slð Þ3 þ 3
2� lgll
� Sl 1� Slð Þ 2� Slð Þ ð10Þ
In 2010, Shad and Gates [57] extended the viscous couplingmodel to more than one phase systems. In another pipe flowmodel, which is known as equivalent homogeneous single-phase model, Fourar et al. [47] considered the two phaseflow to be equivalent to single phase flow of a homogenousphase through a system of pipes. The average density andviscosity of the equivalent homogenous phase are calculatedby weighting properties of each phases by the correspondingvolumetric flow rates as:
qm ¼ q1q1 þ q2q2q1 þ q2
ð11Þ
lm ¼ l1q1 þ l2q2q1 þ q2
ð12Þ
where the subscript m refers to average value.As it was here mentioned above, despite its essential
importance, only a few experimental, numerical andanalytical attempts have been made to clear the physics ofmultiphase flow and characteristic of relative permeabilitiesin fractures. Therefore, the extremely important question ofproper form of relative permeability curves through fracturesis still unanswered. This paper is an attempt to develop anew simple analytical model for description of char-acteristic behavior of water-oil relative permeabilities infractures.
2 MATHEMATICAL FORMULATION
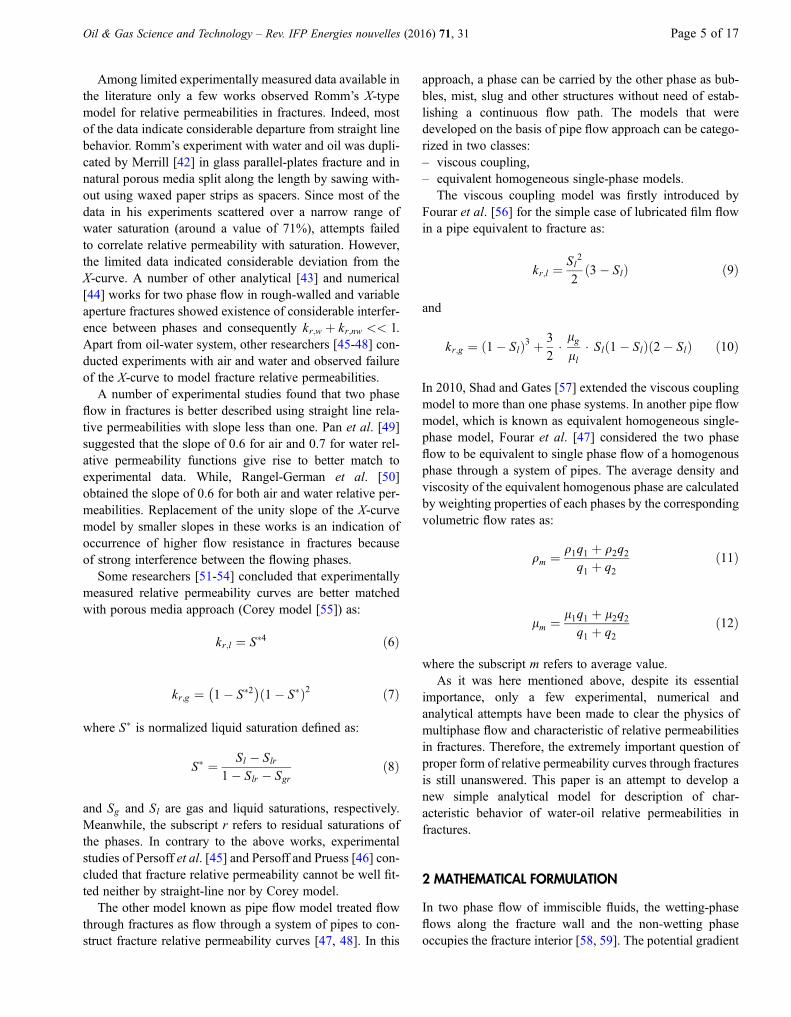
In two phase flow of immiscible fluids, the wetting-phaseflows along the fracture wall and the non-wetting phaseoccupies the fracture interior [58, 59]. The potential gradient
Oil & Gas Science and Technology – Rev. IFP Energies nouvelles (2016) 71, 31 Page 5 of 17
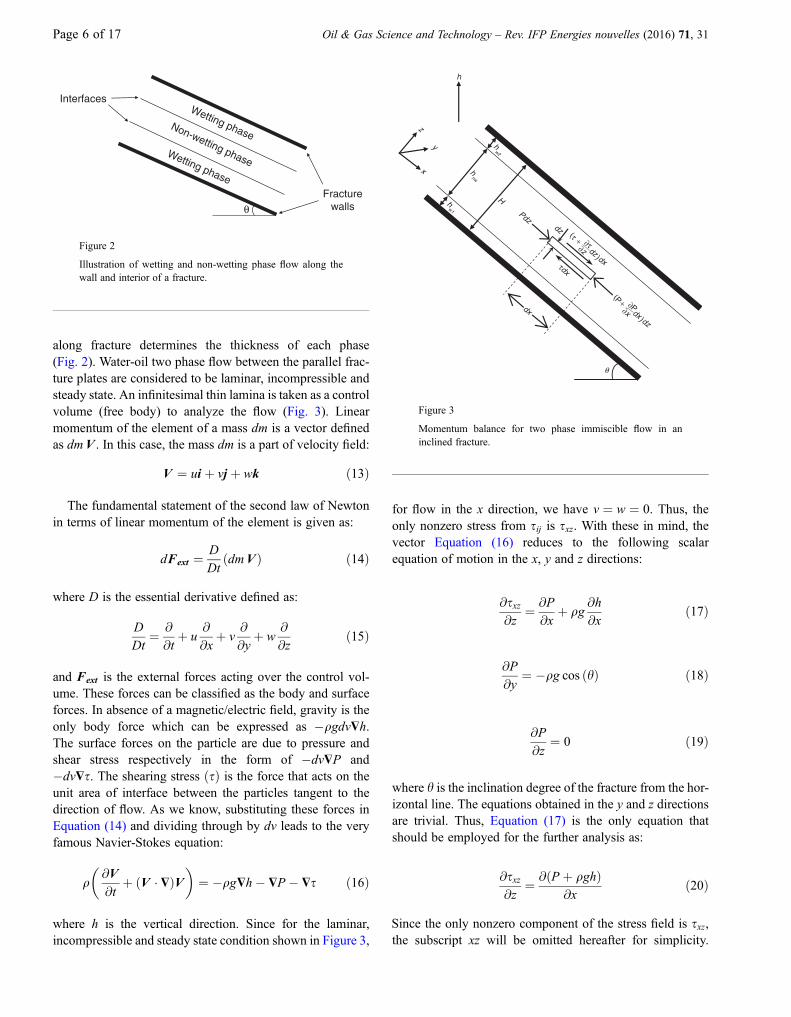
along fracture determines the thickness of each phase(Fig. 2). Water-oil two phase flow between the parallel frac-ture plates are considered to be laminar, incompressible andsteady state. An infinitesimal thin lamina is taken as a controlvolume (free body) to analyze the flow (Fig. 3). Linearmomentum of the element of a mass dm is a vector definedas dmV . In this case, the mass dm is a part of velocity field:
V ¼ ui þ vj þ wk ð13Þ
The fundamental statement of the second law of Newtonin terms of linear momentum of the element is given as:
dFext ¼ D
DtðdmV Þ ð14Þ
where D is the essential derivative defined as:
D
Dt¼ @
@tþ u
@
@xþ v
@
@yþ w
@
@zð15Þ
and Fext is the external forces acting over the control vol-ume. These forces can be classified as the body and surfaceforces. In absence of a magnetic/electric field, gravity is theonly body force which can be expressed as �qgdv$h.The surface forces on the particle are due to pressure andshear stress respectively in the form of �dv$P and�dv$s. The shearing stress sð Þ is the force that acts on theunit area of interface between the particles tangent to thedirection of flow. As we know, substituting these forces inEquation (14) and dividing through by dv leads to the veryfamous Navier-Stokes equation:
q
�@V@t
þ ðV � $ÞV�
¼ �qg$h� $P � $s ð16Þ
where h is the vertical direction. Since for the laminar,incompressible and steady state condition shown in Figure 3,
for flow in the x direction, we have v ¼ w ¼ 0. Thus, theonly nonzero stress from sij is sxz. With these in mind, thevector Equation (16) reduces to the following scalarequation of motion in the x, y and z directions:
@sxz@z
¼ @P
@xþ qg
@h
@xð17Þ
@P
@y¼ �qg cos hð Þ ð18Þ
@P
@z¼ 0 ð19Þ
where h is the inclination degree of the fracture from the hor-izontal line. The equations obtained in the y and z directionsare trivial. Thus, Equation (17) is the only equation thatshould be employed for the further analysis as:
@sxz@z
¼ @ðP þ qghÞ@x
ð20Þ
Since the only nonzero component of the stress field is sxz,the subscript xz will be omitted hereafter for simplicity.
Fracturewalls
Wetting phase
Wetting phase
Non-wetting phase
Interfaces
θ
Figure 2
Illustration of wetting and non-wetting phase flow along thewall and interior of a fracture.
h
Pdz
H
hw2
hw1
hnw
x
y
z
θ
dx
dz
dzdx
)
(τ
τdx
∂z∂τ+
dxdz
)
(P
∂x∂P+
Figure 3
Momentum balance for two phase immiscible flow in aninclined fracture.
Page 6 of 17 Oil & Gas Science and Technology – Rev. IFP Energies nouvelles (2016) 71, 31

As we know, P þ qgh is called flow potential. Therefore,Equation (20) can be rewritten as:
@s@z
¼ @U@x
ð21Þ
Since s and U are only functions of z and x, respectively:
dsdz
¼ dUdx
ð22Þ
Integration of this equation with respect to z gives:
s ¼ dUdx
� zþ c1 ð23Þ
This equation is valid for the three streams in Figure 2:
sw1 ¼dUw1
dx� zþ cw1
1 ð24Þ
snw ¼ dUnw
dx� zþ cnw1 ð25Þ
sw2 ¼dUw2
dx� zþ cw2
1 ð26Þ
In which cw11 , cnw1 and cw2
1 are constants of integration.In order to make the formulations simpler, thickness of thetwo regions of wetting phase at the top and bottom wallsof the fracture is assumed to be equal (hw1 ¼ hw2 ¼ hw).Because of symmetry of the system in Figure 3:
dUw1
dx¼ dUw2
dx¼ dUw
dxð27Þ
And flow potential gradient of the wetting and non-wettingphases are related as:
dUnw
dx¼ dUw
dxþ qw � qnwð Þg sin hð Þ ð28Þ
To evaluate Equations (24) through (26), the continuity offluid mechanics properties at interface between three flowregions in Figures 2 and 3 necessitates:
z ¼ 0; sw1 ¼ snw ð29Þ
z ¼ hnw; snw ¼ sw2 ð30Þ
Substituting these boundary conditions in Equations (24)through (26) yields:
cw11 ¼ cnw1 ¼ cw2
1 ¼ c1 ð31Þ
Equations (24) through (26) can be combined withNewton’s law of viscosity to get the following equations,respectively:
lwduw1
dz¼ dUw
dx� zþ c1 ð32Þ
lnwdunwdz
¼ dUnw
dx� zþ c1 ð33Þ
lwduw2
dz¼ dUw
dx� zþ c1 ð34Þ
Integration of these equations with respect to zleads to velocity profiles in the three flow regions as follows:
uw1 ¼1
lw
dUw
dx� z
2
2þ c1 � z
� �þ cw1
2 ð35Þ
unw ¼ 1
lnw
dUnw
dx� z
2
2þ c1 � z
� �þ cnw2 ð36Þ
uw2 ¼1
lw
dUw
dx� z
2
2þ c1 � z
� �þ cw2
2 ð37Þ
Determination of the integration constants (c1, cw12 , c
nw2 and
cw22 ) needs the following boundary conditions (Streeteret al. [60]):
z ¼ �hw; uw1 ¼ 0 ð38Þ
z ¼ 0; uw1 ¼ unw ð39Þ
z ¼ hnw; unw ¼ uw2 ð40Þ
z ¼ hnw þ hw; uw2 ¼ 0 ð41Þ
Substitution of the boundary conditions in Equations (35)through (37) yields:
cw12 ¼ � 1
lw
dUw
dx� h
2w
2� c1 � hw
� �ð42Þ
cw12 ¼ cnw2 ð43Þ
Oil & Gas Science and Technology – Rev. IFP Energies nouvelles (2016) 71, 31 Page 7 of 17
cw22 ¼ cnw2 þ 1
lnw
dUnw
dx� h
2nw
2þ c1 � hnw
� �
� 1
lw
dUw
dx� h
2nw
2þ c1 � hnw
� � ð44Þ
cw22 ¼ � 1
lw
dUw
dx� hnw þ hwð Þ2
2þ c1 � hnw þ hwð Þ
" #
ð45Þ
Solving the system of four equations (Eqs. 42 through 45)and four unknowns (c1, c
w12 , cnw2 and cw2
2 ) results in thefollowing solutions:
c1 ¼ �hwhnwlw
� dUw
dxþ h2nw2lnw
� dUnw
dx2hwlw
þ hnwlnw
ð46Þ
cw12 ¼ cnw2 ¼ � 1
lw
� h2w2
� dUw
dxþh2whnwlw
� dUw
dxþ h2nwhw
2lnw� dUnw
dx2hwlw
þ hnwlnw
2664
3775 ð47Þ
cw22 ¼ � 1
lw� hw þ hnwð Þ2
2� dUw
dx
"
� hw þ hnwð Þhwhnwlw
� dUw
dxþ h2nw2lnw
� dUnw
dx2hwlw
þ hnwlnw
#
ð48Þ
Substituting the integration constants in Equations (35) to(37) yields the velocity profiles in the three flow regions.Knowing the velocity profiles, it is simple to calculate aver-age velocity for each of the flowing streams:
uw1 ¼R 0�hw
uwdzR 0�hw
dz¼ 1
lw
dUw
dx� h
2w
6� c1 � hw
2
� �þ cw1
2
ð49Þ
unw ¼R hnw0 uwdzR hnw0 dz
¼ 1
lnw
dUnw
dx� h
2nw
6þ c1 � hnw
2
� �þ cnw2
ð50Þ
uw2 ¼R hnwþhwhnw
uw2dzR hnwþhwhnw
dz
¼ 1
lwhw
"dUw
dx� hnw þ hwð Þ3
6� h3nw
6
!
þ c1 � hnw þ hwð Þ22
� h2nw2
!#þ cw2
2 hw ð51Þ
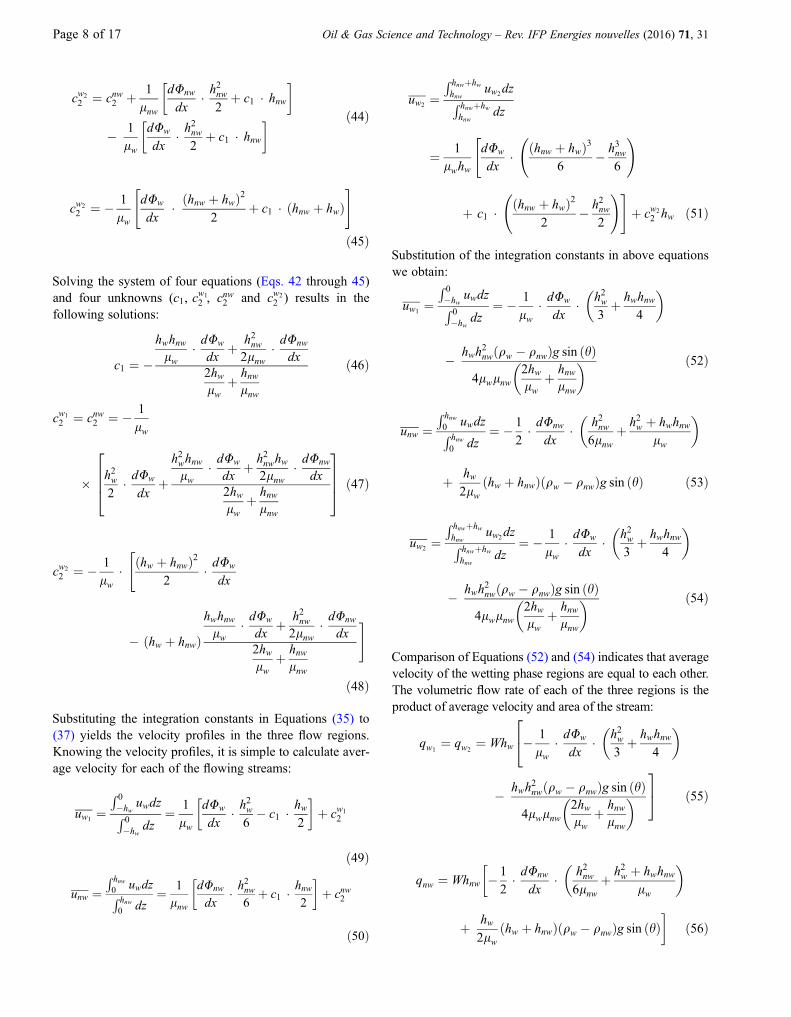
Substitution of the integration constants in above equationswe obtain:
uw1 ¼R 0�hw
uwdzR 0�hw
dz¼ � 1
lw� dUw
dx� h2w
3þ hwhnw
4
� �
� hwh2nw qw � qnwð Þg sin hð Þ
4lwlnw2hwlw
þ hnwlnw
� � ð52Þ
unw ¼R hnw0 uwdzR hnw0 dz
¼ � 1
2� dUnw
dx� h2nw
6lnwþ h2w þ hwhnw
lw
� �
þ hw2lw
hw þ hnwð Þ qw � qnwð Þg sin hð Þ ð53Þ
uw2 ¼R hnwþhwhnw
uw2dzR hnwþhwhnw
dz¼ � 1
lw� dUw
dx� h2w
3þ hwhnw
4
� �
� hwh2nw qw � qnwð Þg sin hð Þ
4lwlnw2hwlw
þ hnwlnw
� � ð54Þ
Comparison of Equations (52) and (54) indicates that averagevelocity of the wetting phase regions are equal to each other.The volumetric flow rate of each of the three regions is theproduct of average velocity and area of the stream:
qw1¼ qw2
¼ Whw � 1
lw� dUw
dx� h2w
3þ hwhnw
4
� �24
� hwh2nw qw � qnwð Þg sin hð Þ
4lwlnw2hwlw
þ hnwlnw
� �35 ð55Þ
qnw ¼ Whnw � 1
2� dUnw
dx� h2nw
6lnwþ h2w þ hwhnw
lw
� ��
þ hw2lw
hw þ hnwð Þ qw � qnwð Þg sin hð Þ�
ð56Þ
Page 8 of 17 Oil & Gas Science and Technology – Rev. IFP Energies nouvelles (2016) 71, 31
Therefore, total flow rate of the wetting phase would be:
qw ¼ 2Whw � 1
lw� dUw
dx� h2w
3þ hwhnw
4
� �24
� hwh2nw qw � qnwð Þg sin hð Þ4lwlnw
2hwlw
þ hnwlnw
� 35 ð57Þ
For flow through the fracture, the volumetric flow rate alsocan be obtained from Darcy’s law:
qw ¼ � kkrwW 2hw þ hnwð Þlw
� dUw
dxð58Þ
qnw ¼ � kkrnwW 2hw þ hnwð Þlnw
� dUnw
dxð59Þ
where k is absolute permeability of the fracture that is calcu-lated using Equation (1) as:
k ¼ 2hw þ hnwð Þ212
ð60Þ
Substituting Equations (58) and (59) in Equations (57) and(56) yields the following expressions for wetting and non-wetting phase relative permeabilities, respectively:
krw ¼ 24hw
2hw þ hnwð Þ3
� h2w3þ hwhnw
4
� �þ hwh
2nw qw � qnwð Þg sin hð Þ4lnw
2hwlw
þ hnwlnw
� dUwdx
24
35 ð61Þ
krnw ¼ 12lnwhnw2hw þ hnwð Þ3
"1
2
h2nw6lnw
þ h2w þ hwhnwlw
� �
� hw2lw
hw þ hnwð Þ qw � qnwð Þg sin hð ÞdUnwdx
#ð62Þ
In order to define relative permeabilities in terms of saturations,wetting and non-wetting phase saturations are defined as:
Sw ¼ 2hw2hw þ hnw
ð63Þ
Snw ¼ hnw2hw þ hnw
ð64Þ
Eventually, simple rearrangement of Equations (61) and (62)followed by substitution of Equations (63) and (64) givesrise to the following analytical expressions to estimate rela-tive permeabilities in an inclined fracture:
krw ¼ 12SwS2w12
þ SwSnw8
� �24
þ S2nw qw � qnwð Þg sin hð Þ8 1
lrþ Snw
Sw
� �dPdx � qwg sin hð Þ
35 ð65Þ
krnw ¼ 12Snw
"1
2
S2nw6
þ S2w þ 2SwSnw4lr
� �
� Sw4lr
Sw2
þ Snw
� �qw � qnwð Þg sin hð ÞdPdx � qnw g sin hð Þ
#ð66Þ
where dP=dx is the pressure gradient along the fracture andlr is viscosity ratio which is the wetting to non-wettingphase viscosity ratio (lw=lnw). The newly developed rela-tive permeability formulas in Equations (65) and (66) areexplicit functions of phase saturations, viscosity ratio, fluidsdensity, inclination of fracture from horizon, pressure gradi-ent along fracture and rock matrix wettability. On the otherhand, the newly developed relative permeability curves inEquations (65) and (66) are explicit functions of the param-eters which are known for each of simulation computationalcells or easy to measure in laboratory. Moreover, it is also thefirst relative permeability model that takes the gravity andwettability effects into account.
3 EFFECTS OF WETTABILITY AND VISCOSITY RATIO
3.1 Fracture Surface Wettability
In the previous section, general formulations of relative perme-ability curves were proposed for two-phase flow through frac-tures. In this section, it is intended to apply them to water-oilsystemswith strongwater- and oil-wetness of the fracturewallsand investigate the effects of wettability on the relative perme-abilities. In the case of strongly water wet reservoir rock,Equations (65) and (66) take the following forms:
krw ¼ 12SwS2w12
þ Sw 1� Swð Þ8
� �24
þ 1� Swð Þ2 qw � qoð Þg sin hð Þ8 1
lrþ 1�Sw
Sw
� �dPdx � qw g sin hð Þ
35 ð67Þ
Oil & Gas Science and Technology – Rev. IFP Energies nouvelles (2016) 71, 31 Page 9 of 17

kro ¼ 12 1� Swð Þ"1
2
1� Swð Þ26
þ S2w þ 2Sw 1� Swð Þ4lr
!
� Sw4lr
1� Sw2
� �qw � qoð Þg sin hð ÞdPdx � qo g sin hð Þ
#ð68Þ
and for strong oil-wetness of the fracture walls:
krw ¼ 12Sw1
2
S2w6
þ 1� Swð Þ2 þ 2Sw 1� Swð Þ4lr
!24
� 1� Swð Þ4lr
1þ Sw2
� �qo � qwð Þg sin hð ÞdPdx � qw g sin hð Þ
35 ð69Þ
kro ¼ 12 1� Swð Þ 1� Swð Þ212
þ Sw 1� Swð Þ8
!24
þ S2w qo � qwð Þg sin hð Þ8 1
lrþ Sw
1�Sw
� �dPdx � qo g sin hð Þ
35 ð70Þ
where the subscripts w and o stand for water and oil phases,respectively. Figure 4 shows a comparison between the relativepermeabilities for strongly water and oil-wet fractures usingEquations (67) to (70) for the rock and fluids properties ofTable1. Thisfigure clearly indicates strongdependenceof frac-ture relative permeability curves to the wettability of the walls.Theother important point that can be inferred from thisfigure isthat the value of oil relative permeability in the water-wet
system exceeds unity over a limited range of saturation forthe data of Table 1 (lr ¼ 1). The reason for observing suchbehavior is described in the following section.
Equations (67) through (70) can be used for analyticalestimation of oil and water relative permeability curvesthrough an inclined fracture as long as the flowing phasesconfiguration is as depicted in Figures 2 and 3. In two-phaseflow of water and heavy oils, the aqueous phase is under-ridden by the more viscous oleic phase regardless of wetta-bility of the fracture walls (Fig. 5). Following the same pro-cedure as here presented above leads to the followingexpressions for this kind of stratified flow pattern:
krw ¼ S2wSw 1� lrð Þ þ lr
�"S2w þ 4lrSw 1� Swð Þ þ 3lr 1� Swð Þ2
� 1þ qo � qwð Þg sin hð ÞdPdx � qw g sin hð Þ
!#ð71Þ
0
0.2
0.4
0.6
0.8
1.0
1.2
0
0.2
0.4
0.6
0.8
1.0
1.2
0 0.2 0.4 0.6 0.8 1.0
k ro
k rw
Sw (fraction)
Strongly water wetSrongly oil wet
Figure 4
Comparison between relative permeabilities for strongly waterand oil wet fractures for the rock and fluids properties ofTable 1 (lr ¼ 1).
TABLE 1
Summary of the rock and fluids properties used to plot Figure 4
Parameters Value
Inclination (deg) 45
dP/dx (kPa/m) �2.26
Oil density (kg⁄m3) 862
Water density (kg⁄m3) 1 115
Oil viscosity (cp) 1.5
Water viscosity (cp) 1.5
Fracturewalls
InterfaceAqueous phaseOleic phase
θ
Figure 5
Illustration of wetting and non-wetting phase flow in stratifiedflow of oil along the bottom and water along the top walls of afracture.
Page 10 of 17 Oil & Gas Science and Technology – Rev. IFP Energies nouvelles (2016) 71, 31
kro ¼ 1� Swð Þ21� Swð Þ lr � 1ð Þ þ 1
�"lr 1� Swð Þ2 þ 4Sw 1� Swð Þ
þ 3S2w 1� qo � qwð Þg sin hð ÞdPdx � qog sin hð Þ
!#ð72Þ
where lr ¼ lw=lo in Equations (71) and (72). It should beoveremphasized here that the wetting tendency of the fracturewalls plays no rule in two phase flow ofwater and heavy oil. Inotherwords, themore viscous oil phase flows along the bottomwall, while water wets the top wall (Fig. 5). Therefore, theseexpressions are recommended for estimation of water andheavyoil relativepermeabilitieswhen the viscosity ratio is verysmall (e.g. lr < 0:1). Otherwise, Equations (67) to (70)should be used in water and typical oil two phase flowdepending on different rock matrix wetting preferences.
3.2 Viscosity Ratio
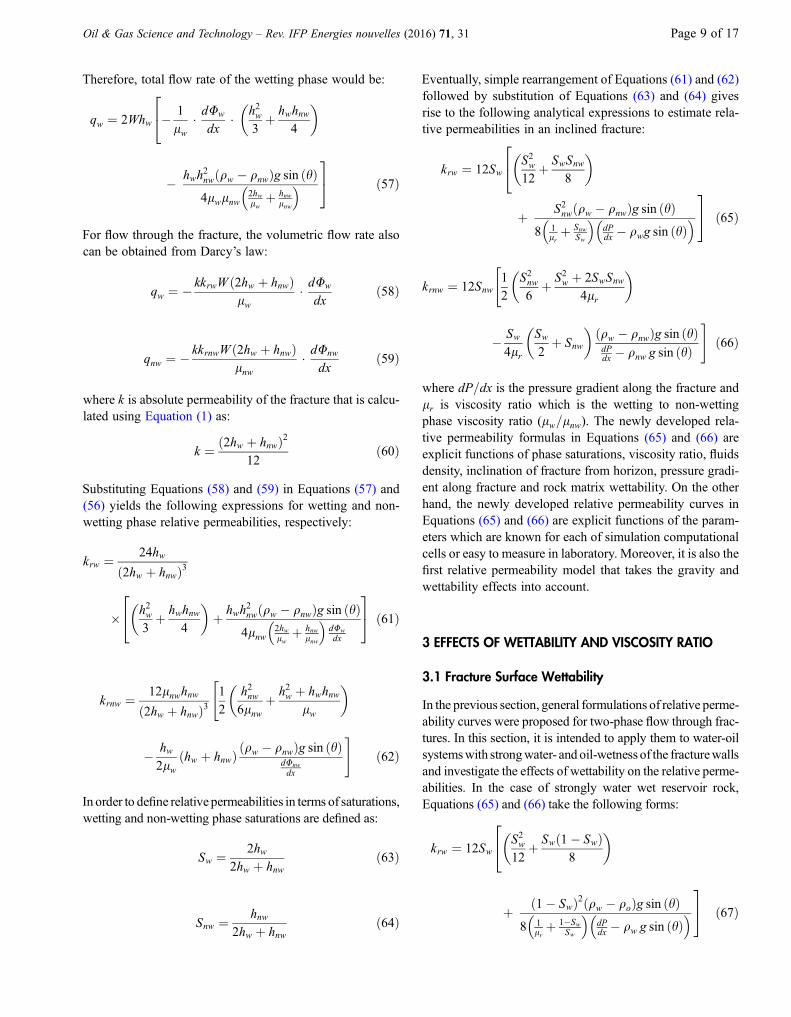
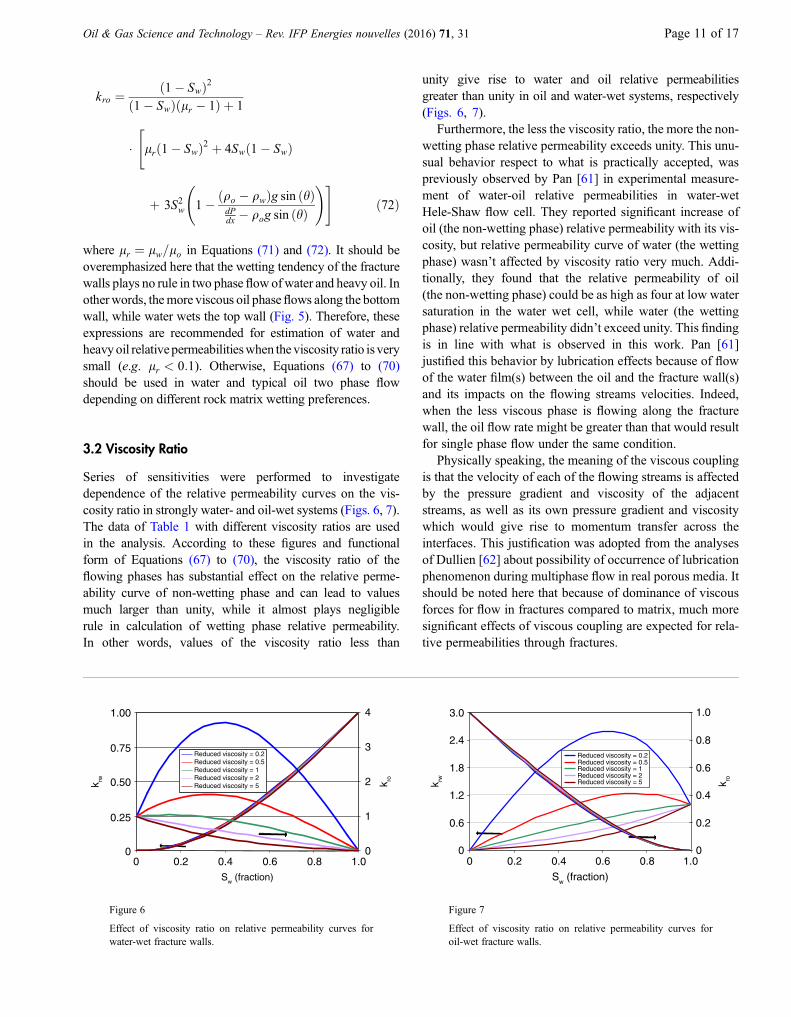
Series of sensitivities were performed to investigatedependence of the relative permeability curves on the vis-cosity ratio in strongly water- and oil-wet systems (Figs. 6, 7).The data of Table 1 with different viscosity ratios are usedin the analysis. According to these figures and functionalform of Equations (67) to (70), the viscosity ratio of theflowing phases has substantial effect on the relative perme-ability curve of non-wetting phase and can lead to valuesmuch larger than unity, while it almost plays negligiblerule in calculation of wetting phase relative permeability.In other words, values of the viscosity ratio less than
unity give rise to water and oil relative permeabilitiesgreater than unity in oil and water-wet systems, respectively(Figs. 6, 7).
Furthermore, the less the viscosity ratio, the more the non-wetting phase relative permeability exceeds unity. This unu-sual behavior respect to what is practically accepted, waspreviously observed by Pan [61] in experimental measure-ment of water-oil relative permeabilities in water-wetHele-Shaw flow cell. They reported significant increase ofoil (the non-wetting phase) relative permeability with its vis-cosity, but relative permeability curve of water (the wettingphase) wasn’t affected by viscosity ratio very much. Addi-tionally, they found that the relative permeability of oil(the non-wetting phase) could be as high as four at low watersaturation in the water wet cell, while water (the wettingphase) relative permeability didn’t exceed unity. This findingis in line with what is observed in this work. Pan [61]justified this behavior by lubrication effects because of flowof the water film(s) between the oil and the fracture wall(s)and its impacts on the flowing streams velocities. Indeed,when the less viscous phase is flowing along the fracturewall, the oil flow rate might be greater than that would resultfor single phase flow under the same condition.
Physically speaking, the meaning of the viscous couplingis that the velocity of each of the flowing streams is affectedby the pressure gradient and viscosity of the adjacentstreams, as well as its own pressure gradient and viscositywhich would give rise to momentum transfer across theinterfaces. This justification was adopted from the analysesof Dullien [62] about possibility of occurrence of lubricationphenomenon during multiphase flow in real porous media. Itshould be noted here that because of dominance of viscousforces for flow in fractures compared to matrix, much moresignificant effects of viscous coupling are expected for rela-tive permeabilities through fractures.
0
1
2
3
4
0
0.25
0.50
0.75
1.00
0 0.2 0.4 0.6 0.8 1.0
k rok rw
Sw (fraction)
Reduced viscosity = 0.2Reduced viscosity = 0.5Reduced viscosity = 1Reduced viscosity = 2Reduced viscosity = 5
Figure 6
Effect of viscosity ratio on relative permeability curves forwater-wet fracture walls.
0
0.6
1.2
1.8
2.4
3.0
0 0.2 0.4 0.6 0.8 1.0
Sw (fraction)
k rw
0
0.2
0.4
0.6
0.8
1.0k ro
Reduced viscosity = 0.2Reduced viscosity = 0.5Reduced viscosity = 1Reduced viscosity = 2Reduced viscosity = 5
Figure 7
Effect of viscosity ratio on relative permeability curves foroil-wet fracture walls.
Oil & Gas Science and Technology – Rev. IFP Energies nouvelles (2016) 71, 31 Page 11 of 17
In summary, the proposed analytical formulations demon-strate that relative permeabilities through fractures are func-tions of several rock and fluids properties including phasesaturations, viscosity ratio, fluids density, inclination of frac-ture plate from the horizontal position, pressure gradient alongfracture and rock matrix wettability. On the other hand, thenewly developed relative permeability expressions are explicitfunctions of the parameters that are known for each of simula-tion computational cells or easy to measure in laboratory. It isalso the first relative permeability model that takes the gravityterms into consideration. The other advantage of these formu-lations for applying in reservoir simulators is that it wouldn’trequire import of fracture relative permeabilities in tabularform. Therefore, these formulations are simple, efficient andaccurate for implementation in dual-, multiple continuumand DFN commercial reservoir simulators.
4 VALIDATION WITH EXPERIMENT
Our extensive survey in the literature indicates that limitednumber of experimental works have been done to examinetwo phase flow in a single fracture. But, the majority of themused gas (nitrogen) and water in their experiments. On theother hand, among experimentally measured data of relativepermeability curves in fractures only a few works have beendone with oil and water as the flowing phases to be used forconfirming the validity of the proposed formulations. Unfor-tunately, fracture orientation was horizontal in almost all ofthese experiments. Therefore, none of the existing relativepermeabilities in the literature can be used to evaluate thevalidity of the gravity effects in the newly proposed model.Anyway, the validity of the proposed models is checkedagainst the experimental data of Pan [61]. He measured oiland water relative permeabilities in a horizontally orientedcell of impermeable parallel fracture plates (the so-calledHele-Shaw cell). He developed three parallel-plates modelswhich differ from each other in the injection method andexperimental design. It was analyzed that the design of theirthird model can better mimic the basic physics of fluid flowin fractured reservoirs. It is because the fluids entered thefracture through a porous medium (sintered metal) insteadof individual tubes in their first two models. This modelwas constructed with Plexiglas plates 38 mm thick. Theadjustable aperture of the fracture could be changed fromzero to 0.5 mm. Three pairs of differential pressure transduc-ers were installed on the bottom plate to measure the pres-sure gradient along the fracture. The plates were placedhorizontally with a width and length of 100 and 550 mm.The cells developed above analytical formulations are usedto calculate the measured fracture relative permeabilitiesfor water of viscosity 1.012 cp and different oils (viscositiesof 10.2, 66 and 106 cp) which correspond to viscosity ratios
of 0.1, 0.015, 0.0096, respectively. The fracture averageapertures in these tests were 106, 112 and 125 lm. Mean-while, the range of the pressure gradients along the fractureswere 16-130, 5-932 and 25-462 kPa=m for the viscosity ratioof 0.1, 0.015, 0.0096, respectively.
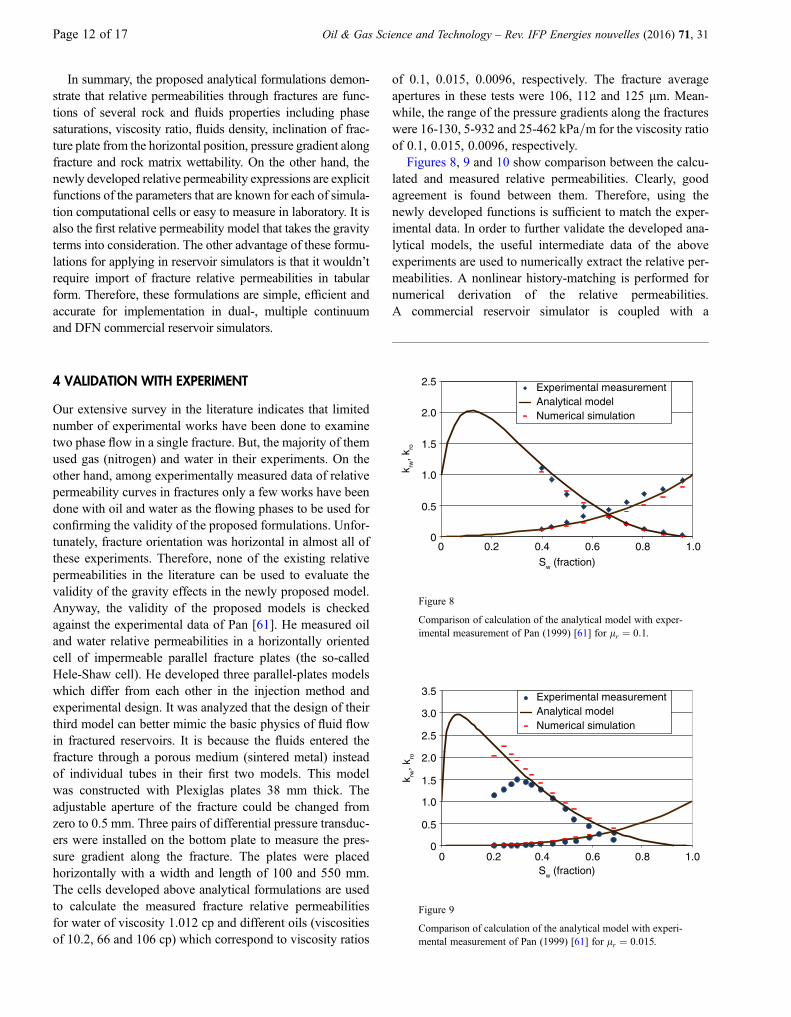
Figures 8, 9 and 10 show comparison between the calcu-lated and measured relative permeabilities. Clearly, goodagreement is found between them. Therefore, using thenewly developed functions is sufficient to match the exper-imental data. In order to further validate the developed ana-lytical models, the useful intermediate data of the aboveexperiments are used to numerically extract the relative per-meabilities. A nonlinear history-matching is performed fornumerical derivation of the relative permeabilities.A commercial reservoir simulator is coupled with a
0
0.5
1.0
1.5
2.0
2.5
0 0.2 0.4 0.6 0.8 1.0
k rw, k
ro
Sw (fraction)
Experimental measurementAnalytical modelNumerical simulation
Figure 8
Comparison of calculation of the analytical model with exper-imental measurement of Pan (1999) [61] for lr ¼ 0:1.
0
0.5
1.0
1.5
2.0
2.5
3.0
3.5
0 0.2 0.4 0.6 0.8 1.0
k rw, k
ro
Sw (fraction)
Experimental measurementAnalytical modelNumerical simulation
Figure 9
Comparison of calculation of the analytical model with experi-mental measurement of Pan (1999) [61] for lr ¼ 0:015.
Page 12 of 17 Oil & Gas Science and Technology – Rev. IFP Energies nouvelles (2016) 71, 31
MATLAB-based optimization code to minimize the follow-ing objective function:
XNi¼1
dP
dx
� �experiment
i
� dP
dx
� �simulationmodel
i
!2
ð73Þ
where dPdx
� �iare pressure gradients for injection of the fluids
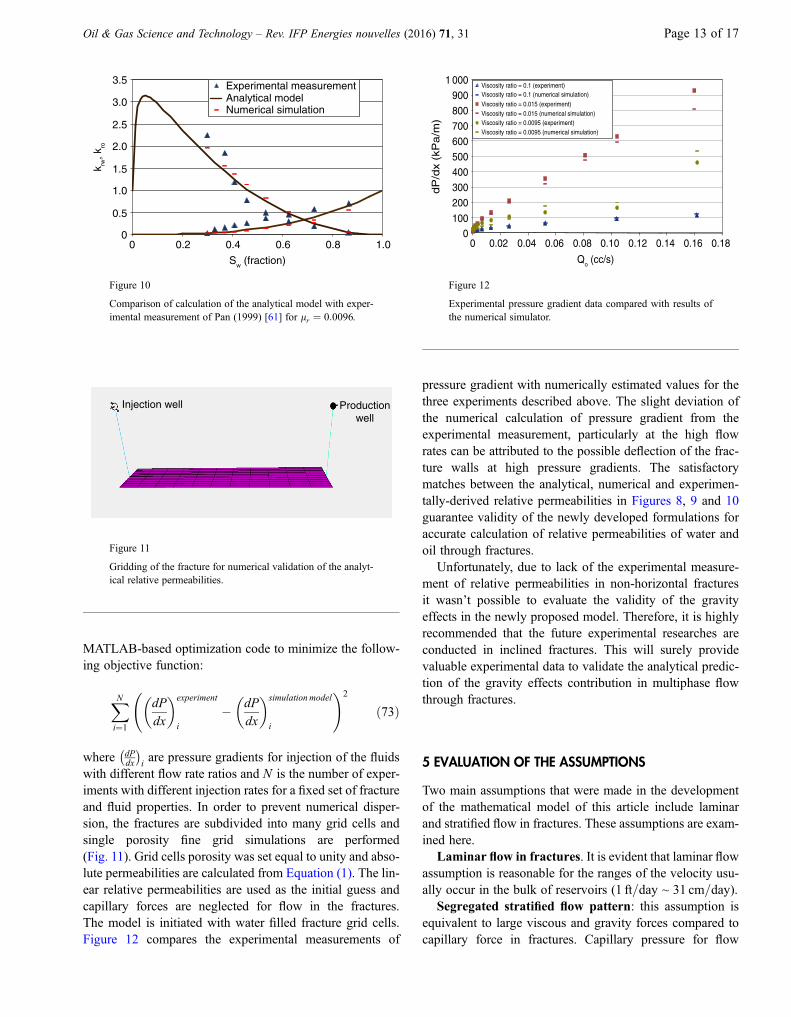
with different flow rate ratios and N is the number of exper-iments with different injection rates for a fixed set of fractureand fluid properties. In order to prevent numerical disper-sion, the fractures are subdivided into many grid cells andsingle porosity fine grid simulations are performed(Fig. 11). Grid cells porosity was set equal to unity and abso-lute permeabilities are calculated from Equation (1). The lin-ear relative permeabilities are used as the initial guess andcapillary forces are neglected for flow in the fractures.The model is initiated with water filled fracture grid cells.Figure 12 compares the experimental measurements of
pressure gradient with numerically estimated values for thethree experiments described above. The slight deviation ofthe numerical calculation of pressure gradient from theexperimental measurement, particularly at the high flowrates can be attributed to the possible deflection of the frac-ture walls at high pressure gradients. The satisfactorymatches between the analytical, numerical and experimen-tally-derived relative permeabilities in Figures 8, 9 and 10guarantee validity of the newly developed formulations foraccurate calculation of relative permeabilities of water andoil through fractures.
Unfortunately, due to lack of the experimental measure-ment of relative permeabilities in non-horizontal fracturesit wasn’t possible to evaluate the validity of the gravityeffects in the newly proposed model. Therefore, it is highlyrecommended that the future experimental researches areconducted in inclined fractures. This will surely providevaluable experimental data to validate the analytical predic-tion of the gravity effects contribution in multiphase flowthrough fractures.
5 EVALUATION OF THE ASSUMPTIONS
Two main assumptions that were made in the developmentof the mathematical model of this article include laminarand stratified flow in fractures. These assumptions are exam-ined here.
Laminar flow in fractures. It is evident that laminar flowassumption is reasonable for the ranges of the velocity usu-ally occur in the bulk of reservoirs (1 ft=day ~ 31 cm=day).
Segregated stratified flow pattern: this assumption isequivalent to large viscous and gravity forces compared tocapillary force in fractures. Capillary pressure for flow
0
0.5
1.0
1.5
2.0
2.5
3.0
3.5
0 0.2 0.4 0.6 0.8 1.0
k rw, k
ro
Sw (fraction)
Experimental measurementAnalytical modelNumerical simulation
Figure 10
Comparison of calculation of the analytical model with exper-imental measurement of Pan (1999) [61] for lr ¼ 0:0096.
Injection well Productionwell
Figure 11
Gridding of the fracture for numerical validation of the analyt-ical relative permeabilities.
0100
200300400500600700800900
1 000
0 0.02 0.04 0.06 0.08 0.10 0.12 0.14 0.16 0.18
dP
/dx
(kP
a/m
)
Qo (cc/s)
Viscosity ratio = 0.1 (experiment)Viscosity ratio = 0.1 (numerical simulation)
Viscosity ratio = 0.015 (experiment)Viscosity ratio = 0.015 (numerical simulation)Viscosity ratio = 0.0095 (experiment)Viscosity ratio = 0.0095 (numerical simulation)
Figure 12
Experimental pressure gradient data compared with results ofthe numerical simulator.
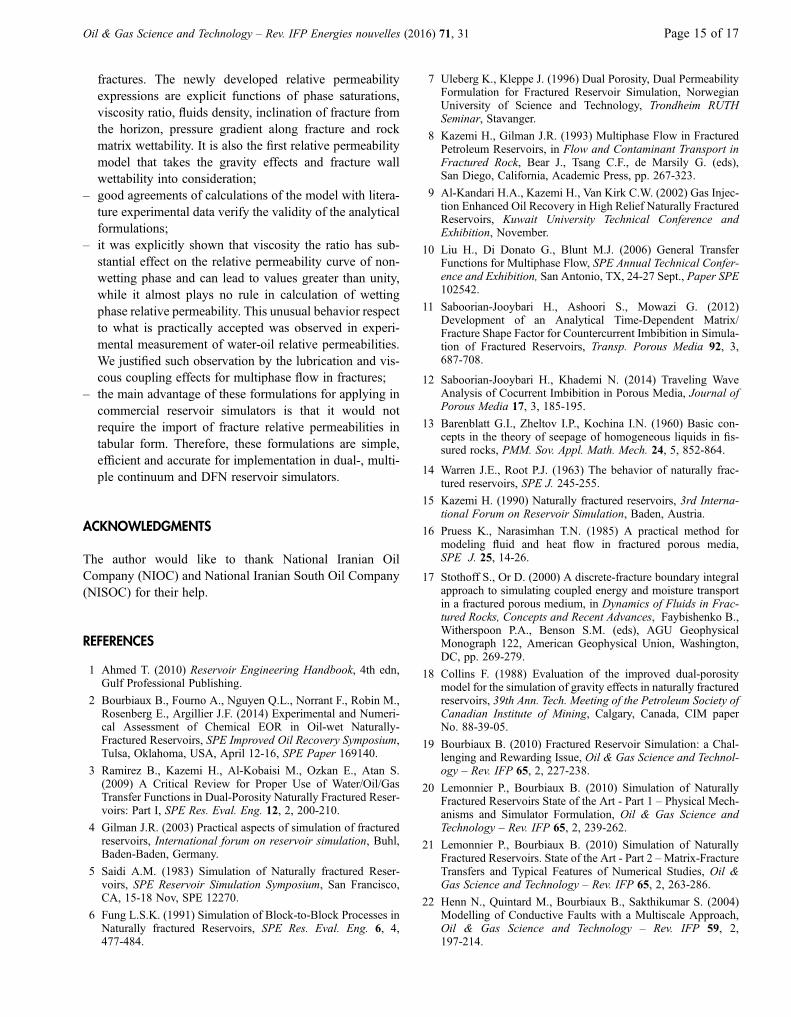
Oil & Gas Science and Technology – Rev. IFP Energies nouvelles (2016) 71, 31 Page 13 of 17
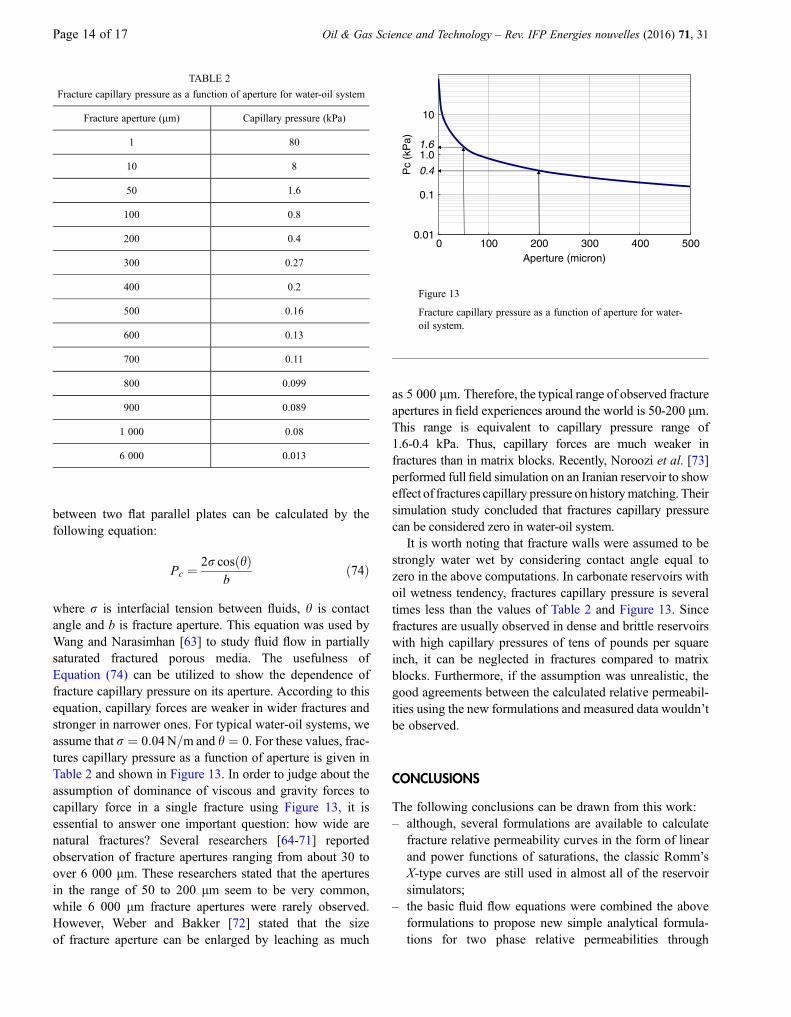
between two flat parallel plates can be calculated by thefollowing equation:
Pc ¼ 2r cosðhÞb
ð74Þ
where r is interfacial tension between fluids, h is contactangle and b is fracture aperture. This equation was used byWang and Narasimhan [63] to study fluid flow in partiallysaturated fractured porous media. The usefulness ofEquation (74) can be utilized to show the dependence offracture capillary pressure on its aperture. According to thisequation, capillary forces are weaker in wider fractures andstronger in narrower ones. For typical water-oil systems, weassume that r ¼ 0:04N=m and h ¼ 0. For these values, frac-tures capillary pressure as a function of aperture is given inTable 2 and shown in Figure 13. In order to judge about theassumption of dominance of viscous and gravity forces tocapillary force in a single fracture using Figure 13, it isessential to answer one important question: how wide arenatural fractures? Several researchers [64-71] reportedobservation of fracture apertures ranging from about 30 toover 6 000 lm. These researchers stated that the aperturesin the range of 50 to 200 lm seem to be very common,while 6 000 lm fracture apertures were rarely observed.However, Weber and Bakker [72] stated that the sizeof fracture aperture can be enlarged by leaching as much
as 5 000 lm. Therefore, the typical range of observed fractureapertures in field experiences around the world is 50-200 lm.This range is equivalent to capillary pressure range of1.6-0.4 kPa. Thus, capillary forces are much weaker infractures than in matrix blocks. Recently, Noroozi et al. [73]performed full field simulation on an Iranian reservoir to showeffect of fractures capillary pressure on historymatching. Theirsimulation study concluded that fractures capillary pressurecan be considered zero in water-oil system.
It is worth noting that fracture walls were assumed to bestrongly water wet by considering contact angle equal tozero in the above computations. In carbonate reservoirs withoil wetness tendency, fractures capillary pressure is severaltimes less than the values of Table 2 and Figure 13. Sincefractures are usually observed in dense and brittle reservoirswith high capillary pressures of tens of pounds per squareinch, it can be neglected in fractures compared to matrixblocks. Furthermore, if the assumption was unrealistic, thegood agreements between the calculated relative permeabil-ities using the new formulations and measured data wouldn’tbe observed.
CONCLUSIONS
The following conclusions can be drawn from this work:– although, several formulations are available to calculate
fracture relative permeability curves in the form of linearand power functions of saturations, the classic Romm’sX-type curves are still used in almost all of the reservoirsimulators;
– the basic fluid flow equations were combined the aboveformulations to propose new simple analytical formula-tions for two phase relative permeabilities through
0.01
0.1
1.0
10
0 100 200 300 400 500
Pc
(kP
a)
Aperture (micron)
1.6
0.4
Figure 13
Fracture capillary pressure as a function of aperture for water-oil system.
TABLE 2
Fracture capillary pressure as a function of aperture for water-oil system
Fracture aperture (lm) Capillary pressure (kPa)
1 80
10 8
50 1.6
100 0.8
200 0.4
300 0.27
400 0.2
500 0.16
600 0.13
700 0.11
800 0.099
900 0.089
1 000 0.08
6 000 0.013
Page 14 of 17 Oil & Gas Science and Technology – Rev. IFP Energies nouvelles (2016) 71, 31
fractures. The newly developed relative permeabilityexpressions are explicit functions of phase saturations,viscosity ratio, fluids density, inclination of fracture fromthe horizon, pressure gradient along fracture and rockmatrix wettability. It is also the first relative permeabilitymodel that takes the gravity effects and fracture wallwettability into consideration;
– good agreements of calculations of the model with litera-ture experimental data verify the validity of the analyticalformulations;
– it was explicitly shown that viscosity the ratio has sub-stantial effect on the relative permeability curve of non-wetting phase and can lead to values greater than unity,while it almost plays no rule in calculation of wettingphase relative permeability. This unusual behavior respectto what is practically accepted was observed in experi-mental measurement of water-oil relative permeabilities.We justified such observation by the lubrication and vis-cous coupling effects for multiphase flow in fractures;
– the main advantage of these formulations for applying incommercial reservoir simulators is that it would notrequire the import of fracture relative permeabilities intabular form. Therefore, these formulations are simple,efficient and accurate for implementation in dual-, multi-ple continuum and DFN reservoir simulators.
ACKNOWLEDGMENTS
The author would like to thank National Iranian OilCompany (NIOC) and National Iranian South Oil Company(NISOC) for their help.
REFERENCES
1 Ahmed T. (2010) Reservoir Engineering Handbook, 4th edn,Gulf Professional Publishing.
2 Bourbiaux B., Fourno A., Nguyen Q.L., Norrant F., Robin M.,Rosenberg E., Argillier J.F. (2014) Experimental and Numeri-cal Assessment of Chemical EOR in Oil-wet Naturally-Fractured Reservoirs, SPE Improved Oil Recovery Symposium,Tulsa, Oklahoma, USA, April 12-16, SPE Paper 169140.
3 Ramirez B., Kazemi H., Al-Kobaisi M., Ozkan E., Atan S.(2009) A Critical Review for Proper Use of Water/Oil/GasTransfer Functions in Dual-Porosity Naturally Fractured Reser-voirs: Part I, SPE Res. Eval. Eng. 12, 2, 200-210.
4 Gilman J.R. (2003) Practical aspects of simulation of fracturedreservoirs, International forum on reservoir simulation, Buhl,Baden-Baden, Germany.
5 Saidi A.M. (1983) Simulation of Naturally fractured Reser-voirs, SPE Reservoir Simulation Symposium, San Francisco,CA, 15-18 Nov, SPE 12270.
6 Fung L.S.K. (1991) Simulation of Block-to-Block Processes inNaturally fractured Reservoirs, SPE Res. Eval. Eng. 6, 4,477-484.
7 Uleberg K., Kleppe J. (1996) Dual Porosity, Dual PermeabilityFormulation for Fractured Reservoir Simulation, NorwegianUniversity of Science and Technology, Trondheim RUTHSeminar, Stavanger.
8 Kazemi H., Gilman J.R. (1993) Multiphase Flow in FracturedPetroleum Reservoirs, in Flow and Contaminant Transport inFractured Rock, Bear J., Tsang C.F., de Marsily G. (eds),San Diego, California, Academic Press, pp. 267-323.
9 Al-Kandari H.A., Kazemi H., Van Kirk C.W. (2002) Gas Injec-tion Enhanced Oil Recovery in High Relief Naturally FracturedReservoirs, Kuwait University Technical Conference andExhibition, November.
10 Liu H., Di Donato G., Blunt M.J. (2006) General TransferFunctions for Multiphase Flow, SPE Annual Technical Confer-ence and Exhibition, San Antonio, TX, 24-27 Sept., Paper SPE102542.
11 Saboorian-Jooybari H., Ashoori S., Mowazi G. (2012)Development of an Analytical Time-Dependent Matrix/Fracture Shape Factor for Countercurrent Imbibition in Simula-tion of Fractured Reservoirs, Transp. Porous Media 92, 3,687-708.
12 Saboorian-Jooybari H., Khademi N. (2014) Traveling WaveAnalysis of Cocurrent Imbibition in Porous Media, Journal ofPorous Media 17, 3, 185-195.
13 Barenblatt G.I., Zheltov I.P., Kochina I.N. (1960) Basic con-cepts in the theory of seepage of homogeneous liquids in fis-sured rocks, PMM. Sov. Appl. Math. Mech. 24, 5, 852-864.
14 Warren J.E., Root P.J. (1963) The behavior of naturally frac-tured reservoirs, SPE J. 245-255.
15 Kazemi H. (1990) Naturally fractured reservoirs, 3rd Interna-tional Forum on Reservoir Simulation, Baden, Austria.
16 Pruess K., Narasimhan T.N. (1985) A practical method formodeling fluid and heat flow in fractured porous media,SPE J. 25, 14-26.
17 Stothoff S., Or D. (2000) A discrete-fracture boundary integralapproach to simulating coupled energy and moisture transportin a fractured porous medium, in Dynamics of Fluids in Frac-tured Rocks, Concepts and Recent Advances, Faybishenko B.,Witherspoon P.A., Benson S.M. (eds), AGU GeophysicalMonograph 122, American Geophysical Union, Washington,DC, pp. 269-279.
18 Collins F. (1988) Evaluation of the improved dual-porositymodel for the simulation of gravity effects in naturally fracturedreservoirs, 39th Ann. Tech. Meeting of the Petroleum Society ofCanadian Institute of Mining, Calgary, Canada, CIM paperNo. 88-39-05.
19 Bourbiaux B. (2010) Fractured Reservoir Simulation: a Chal-lenging and Rewarding Issue, Oil & Gas Science and Technol-ogy – Rev. IFP 65, 2, 227-238.
20 Lemonnier P., Bourbiaux B. (2010) Simulation of NaturallyFractured Reservoirs State of the Art - Part 1 – Physical Mech-anisms and Simulator Formulation, Oil & Gas Science andTechnology – Rev. IFP 65, 2, 239-262.
21 Lemonnier P., Bourbiaux B. (2010) Simulation of NaturallyFractured Reservoirs. State of the Art - Part 2 –Matrix-FractureTransfers and Typical Features of Numerical Studies, Oil &Gas Science and Technology – Rev. IFP 65, 2, 263-286.
22 Henn N., Quintard M., Bourbiaux B., Sakthikumar S. (2004)Modelling of Conductive Faults with a Multiscale Approach,Oil & Gas Science and Technology – Rev. IFP 59, 2,197-214.
Oil & Gas Science and Technology – Rev. IFP Energies nouvelles (2016) 71, 31 Page 15 of 17
23 Johnson E.F., Bossler D.P., Naumann V.O. (1959) Calculationof relative permeability from displacement experiments, Trans.AIME 216, 370.
24 Saraf D.N., McCaffery F.G. (1982) Two- and Three-Phase Rel-ative Permeabilities: a Review, Petroleum Recovery InstituteReport #81-8, Calgary, Alberta, Canada.
25 Jones S.C., Roszelle W.O. (1978) Graphical techniques fordetermining relative permeability from displacement experi-ments, J. Pet. Technol. 5, 807.
26 Sarem A.M. (1959) Significance of water-oil relative perme-ability data calculated from displacement tests, Conference ofTheory of Fluid Flow in Porous Media, University ofOklahoma, Norman, 189.
27 Archer J.S., Wong S.W. (1973) Use of a reservoir simulator tointerpret laboratory waterflood data, SPE Journal 13,343-347.
28 Honarpour M., Koederitz L., Harvey H. (1986) RelativePermeability of Petroleum Reservoirs, Boca Raton, FL, CRCPress.
29 Honarpour M., Mahmood S.M. (1988) Relative-permeabilitymeasurements-an overview, Journal of Petroleum Technology40, 963-966.
30 Lomize G.M. (1951) Flow in Fractured Rocks (in Russian),Gosenergoizdat, Moscow 127 pp.
31 Snow D.T. (1965) Anisotropic permeability of fractured media,Water Resour. Res. 5, 6, 1273-1289.
32 Louis C.A. (1969) A study of groundwater flow in jointed rockand its influence on the stability of rock masses, Rock Mech.Res. Rep. 10, Imperial College, London, 90 pp.
33 Bear J. (1972) Dynamics of Fluids in Porous Media, Elsevier,New York, p. 764.
34 Witherspoon P.A., Wang J.S.Y., Iwai K., Gale J.E. (1980)Validity of cubic law for fluid flow in deformable rock fracture,Water Resour. Res. 16, 6, 1016-1024.
35 Romm E.S. (1966) Fluid Flow in Fractured Rocks (in Russian),Nedra Publishing House, Moscow.
36 Van Golf-Racht T. (1982) Fundamentals of Fractured Reser-voir Engineering, Elsevier Scientific, New York.
37 Thomas L.K., Dixon T.N., Pierson R.G. (1983) Fractured reser-voir simulation, SPE J. 23, 1, 42-54.
38 Gilman J.R., Kazemi H. (1983) Improvements in simulation ofnaturally fractured reservoirs, SPE J. 23, 4, 695-707.
39 Kazemi H., Gilman J.R. (1989) Multiphase flow in fracturedpetroleum reservoirs, Advanced Workshop on Heat and MassTransport in Fractured Rocks, Lab. Nac. Eng. Civ. (LNEC),Lisbon, June.
40 Grant M.A. (1977) Permeability reduction factors at Wairakei,AIChE-ASME Heat Transfer Conference, Am. Inst. of Chem.Eng. and Am. Soc. of Mech. Eng., Salt Lake City, Utah.
41 Pruess K., Bodvarsson G.S., Stefansson V., Eliasson E.T.(1984) The Krafla geothermal field, Iceland, 4, History matchand prediction of individual well performance, Water Resour.Res. 20, 11, 1561-1584.
42 Merrill L.S. (1975) Two phase flow in fractures, PhD Thesis,University of Denver.
43 Pruess K., Tsang Y.W. (1990) On two-phase relative permeabil-ity and capillary pressure of rough-walled rock fractures,WaterResour. Res. 26, 9, 1915-1926.
44 RossenW.R., Kumar A.T.A. (1992) Single- and two-phase flowin natural fractures, 67th Annual Technical Conference of theSociety of Petroleum Engineers, Washington, DC, 4-7 Oct.,SPE Paper 24195.
45 Persoff P.K., Pruess K., Myer L. (1991) Two-Phase Flow Visu-alization and Relative Permeability Measurement in Transpar-ent Replicas of Rough-Walled Rock Fractures, 16thWorkshop on Geothermal Reservoir Engineering, Stanford,California, 23-25 Jan.
46 Persoff P., Pruess K. (1995) Two-Phase Flow Visualization andRelative Permeability Measurement in Natural Rough-WalledRock Fractures, Water Resources Research 31, 5, 1175-1186.
47 Fourar M., Bories S., Lenormand R., Persoff P. (1993) Two-Phase Flow in Smooth and Rough Fractures: Measurementand Correlation by Porous-Medium and Pipe Flow Models,Water Resources Research 29, 11, 3699-3708.
48 Fourar M., Bories S. (1995) Experimental Study of Air-WaterTwo-Phase Flow through a Fracture (Narrow Channel), Int. J.Multiphase Flow 21, 4, 621-637.
49 Pan X., Wong R.C., Maini B.B. (1996) Steady State Two-PhaseFlow in a Smooth Parallel Fracture, Presented at the 47thAnnual Technical Meeting of the Petroleum Society in Calgary,Alberta, Canada, June 10-12.
50 Rangel-German E., Akin S., Castanier L. (1999) Multiphase-Flow Properties of Fractured Porous Media, SPE WesternRegional Meeting, Anchorage, AK, SPE Paper 54591.
51 Pieters D.A., Graves R.M. (1994) Fracture Relative Permeabil-ity: Linear or Non-Linear Function of Saturation, SPE Interna-tional Petroleum Conference & Exhibition of Mexico, Veracruz,Mexico, 10-13 Oct, SPE Paper 28701.
52 Horne R.H., Satik C., Mahiya G., Li K., AmbussoW., Tovar R.,Wang C., Nassori H. (2000) Steam-Water Relative Permeabil-ity, World Geothermal Congress, Kyushu-Tohoku, Japan,28 May - 10 June.
53 Diomampo G.P. (2001) Relative Permeability Through Frac-tures, Report SGP-TR-170 prepared under DOE contract No.DE-FG07-95ID13370, August.
54 Chen A. (2005) Liquid-Gas Relative Pemeabilities in Fractures:Effects of Flow Structures, Phase Transformation and SurfaceRoughness, PhD Thesis, Stanford University.
55 Corey A.T. (1954) The interrelationship between gas and oilrelative permeabilities, Prod. Mon. 19, 38-41.
56 Fourar M., de Nancy E., Lenormand R. (1998) AViscous Cou-pling Model for Relative Permeabilities in Fractures, SPEAnnual Technical Conference and Exhibition, New Orleans,LA, USA, SPE Paper 49006.
57 Shad S., Gates I.D. (2010) Multiphase Flow in Fractures: Co-current and Counter-Current Flow in a Fracture, Journal ofCanadian Petroleum Technology 49, 2, 48-55.
58 Brown S.R., Scholz C.H. (1985) Broad Bandwidth Study of theTopography of Natural Rock Surfaces, J. Geophys. Res. 90,12575-12582.
59 Toledo P.G., Nvoy A.R., Davis H.T. (1990) Hydraulic Conduc-tivity of Porous Media at Low Water Content, Soil Science ofAmerica J. 54, 3, 673.
60 Streeter V.L.,Wylie E.B., BedfordK.W. (1997)FluidMechanics,9th edn, McGraw-Hill publishing company.
61 Pan X. (1999) Immiscible Two-Phase Flow in a Fracture, PhDThesis, University of Calgary, Calgary, Alberta, Canada.
Page 16 of 17 Oil & Gas Science and Technology – Rev. IFP Energies nouvelles (2016) 71, 31
62 Dullien A.L. (1993) Physical interpretation of hydrodynamiccoupling in a steady-state two phase flow, 13th Annual Hydrol-ogy Meeting of American Geophysical Union, Colorado StateUniversity, Fort Collins, Colorado, pp. 363-377.
63 Wang J.S.Y., Narasimhan T.N. (1985) Hydrologic MechanismsGoverning Fluid Flow in a Partially Saturated, Fractured,Porous Medium, Water Resource Research 21, 12, 1861-1874.
64 Banward S.E., Gustafsson M., Laaksoharju E.L.T., Wallin B.(1994) Large Scale intrusion of shallow water into a verticalfracture zone in crystalline bedrock: Initial hydrochemical per-turbation during tunnel construction at the Äspö Hard RockLaboratory, southeastern Sweden, Water Resources Research30, 6, 1747-1763.
65 Folger P.F., Poeter E., Wanty R.B., Frishman D., DayW. (1996)Controls on 222Rn variations in a fractured crystalline rockaquifer evaluated using aquifer tests and geophysical logging,Groundwater 34, 2, 250-261.
66 Himmelsbach T., Hbtzl H., Maloszewski P. (1998) SoluteTransport Processes in a Highly Permeable Fault Zone of Lin-dau Fractured Rock Test Site (Germany), Groundwater 36, 5,792-800.
67 Kumar A.T.A., Majors P.D., Rossen W.R. (1997) Measurementof Aperture and Multiphase Flow in Fractures using NMRImaging, SPE Formation Evaluation 12, 2, 101-108.
68 Schrauf T.W., Evans D.D. (1986) Laboratory Studies of GasFlow through a Single Natural Fracture, Water ResourcesResearch 22, 7, 1038-1050.
69 Shapiro A.M., Nicholas J.R. (1989) Assessing the validity ofthe channel model of fracture aperture under field conditions,Water Resources Research 25, 5, 817-828.
70 Novakowski K.S., Lapcevic P.A. (1994) Field measurement ofradial solute transport in fractured rock, Water ResourcesResearch 30, 1, 37-44.
71 Hensel W. (1987) A Perspective Look at Fracture Porosity, 62ndAnnual Technical Conference and Exhibition of the Society ofPetroleumEngineers,Dallas,TX, 27-30Sept.,SPEPaper 16806.
72 Weber K.J., Bakker M. (1981) Fracture and Vuggy Porosity,SPE Annual Technical Conference and Exhibition, 4-7 Oct.,San Antonio, Texas, Paper SPE 10332
73 Noroozi M.M., Moradi B., Bashiri G. (2010) Effects of FractureProperties on Numerical Simulation of a Naturally FracturedReservoir, Trinidad and Tobago Energy Resources Conference,Port of Spain, Trinidad, 27-30 June, SPE Paper 132838.
Manuscript submitted in August 2013
Manuscript accepted in November 2014
Published online in April 2015
Cite this article as: H. Saboorian-Jooybari (2016). Analytical Estimation of Water-Oil Relative Permeabilities through Fractures,Oil Gas Sci. Technol 71, 31.
Oil & Gas Science and Technology – Rev. IFP Energies nouvelles (2016) 71, 31 Page 17 of 17