Embed Size (px)
Citation preview
Copyright © 2013 Tech Science Press SL, vol.10, no.2, pp.71-84, 2013
A Study of Relation Between Permeabilities and PoreSpace Based on Dilation Operation
Li Daolun1, Lu Detang1 and Liu Cong1
Abstract: CO2 or acidic material injection into oil reservoirs or Alkaline-surfactant-polymer (ASP) flooding induces reactivity between CO2, acid, ASP, pore-watersand minerals, which results in modification of porosities and permeabilities. Weuse dilation operation to simulate the modification of the porosities and study thevariation of permeabilities. Firstly we get digital images from CT experiment ofa real rock core. Secondly the pore space of digital cores is expanded by dilationoperation which is one of basic mathematical morphologies. Thirdly, the distribu-tion of pore bodies and pore throats are obtained from the pore network modelingextracted by maximal ball method. Finally, the relation between network modelingparameters and permeabilities is analyzed.The result is that the throat change influences the permeability exponentially andthat permeabilities are significantly influenced by the big throats.
Keywords: permeability, modification of pore space, dilation operation, pore net-work model, microscopic percolation.
1 Introduction
Concerns over greenhouse gas emissions are leading to the investigation and real-ization of carbon storage in recent years. The capture and geological storage of co2is a viable strategy to reduce the release of greenhouses gases to the atmosphere.
CO2 injection into oil reservoirs has been widely accepted as an effective tech-nique for enhanced oil recovery (EOR), and has been used by the oil industry forover many years [Jessen, Kovscek and Orr (2005)]. The injection of co2 into thedeep oil reservoirs will result in chemical disequilibria and the initiation of variouschemical reactions [Czernichowski-Lauriol, Rochelle, Gaus, Azaroual, Pearce andDurst (2006)]. All the mineralogical reactions are highly complex. They result in
1 Department of Modern Mechanics, Key Laboratory of Software in Computing and Communicationof Anhui Province, University of Science and Technology of China, Hefei 230027, China.

72 Copyright © 2013 Tech Science Press SL, vol.10, no.2, pp.71-84, 2013
modification of porosities and permeabilities, which influence the actual injectionand migration of co2.
To improve oil recovery in the old reservoirs after flooded by water, alkaline-surfactant-polymer (ASP) is injected into oil reservoir as an instead of water. Manychemical reactions exit during ASP flooding, which lead to retention and changesthe pore spaces. The retention mechanisms is complex, for an example, Polymerretention depends on many factors such as polymer type, molecular weight, rockcomposition, brine salinity flow rate [Mantilla and Srinivasan (2011)]. The reten-tion also results in modification of porosities and permeabilities.
Although the length-scale of an oil field is measured in kilometers, the ultimatesuccess of an oil recovery scheme is the result of countless displacement eventsat a micron-sized scale. The advances in micro-imaging of natural rocks, com-bined with advances in pore-network modeling, allow researchers to gain a betterunderstanding of pore-level displacement mechanisms.
In this paper we are not involved in the mechanism of these reactions, while inves-tigate the relationship between modification of pore spaces and the permeabilitiesand how the modification of pore space to influence the flow ability from the porelevel.
Microscopic percolation flow is research of porosity media on pore-scale mainlyby experimental simulation and numerical simulation [Guang et al. (1990); Bakke(1997); Blunt, Jackson, Piri et al. (2002); Blunt and King (1990); Liang, Fernandes,Magnani and Philippi (1998); Lindquist, Lee, Coker, Jones and Spanne (1996); Al-Kharusi and Blunt (2007); Dong and Blunt (2009); Silin and Patzek (2006)]. Byusing CT experiment of real core with X-ray, the three-dimensional volume dataof rock are acquired with the micron resolution. The microscopic structure of thepore space can be obtained using the algorithm of pore-network modeling from thevolume data. In the pore network model, pore bodies represent the spacious partof pore space and throats represent the long-narrow part of pore space. Variouscharacteristics can be predicted during flow of fluids based on the pore networkmodel [Dixit, McDougall and Sorbie (1998); Hazlett (1997); Blunt, Jackson, Piriand Valvatne (2002); ∅ren and Bakke (2002)].
There are many methods to reconstruct the pore network. The major methods in-clude the medial axis based method and maximal ball method. Medial axis methoduse image processing to subtract the medical axis to represent the topological skele-ton of pore space [Liang, Fernandes, Magnani and Philippi (1998); Lindquist, Lee,Coker, Jones and Spanne (1996)]. The maximal ball [Al-Kharusi and Blunt (2007);Dong and Blunt (2009); Silin and Patzek (2006)] method finds the largest spherescentered on each voxel in the pore space. Maximal method first is proposed by
A Study of Relation Between Permeabilities and Pore Space 73
Silin et al, then extended by Donghu and Blunt. The method of the pore networkmodeling used in this paper is also extended from maximal ball method the detailof which is in another paper1. Apart from the direct method to get 3D volumedata, there are many indirect ways to generate the pore space, such as the statisticalmodel[Strebelle (2002); Okabe and Blunt (2005); Zhang, Li, Lu and Yang (2010) ]and process stimulating method [∅ren and Bakke (2002)].
In this article, we first do CT experiment of nature core and get 118 slices of digitalimages with the 10-micron resolution. Dilation operation, one of basic mathemat-ical morphologies, is used to simulate the increasing of porosity when acidic fluidis injected into oil reservoir. At last, we calculate the permeability of every digitalcore by Lattice-Boltzman and analyze on the relationship between model parame-ters and the permeabilities.
2 Core’s CT experiment and image processing
2.1 The principle and device of CT experiment
CT experiment is based on the interaction between ray and sample. Different sub-stance in the sample has different absorption coefficient. When ray passes throughsome substance, its intensity can be expressed by:
I = I0e−∑uiDi (1)
Where ui is decline coefficient of different substance, Di is thickness of substance.Because the different absorption coefficient of pore and frame in porous media, wecan get the inner structure of core by CT experiment.
We get projection drawing of different angle, the projection data of different anglecan be expressed by:
pφ (xr) =∫L
u(x,y)dl = ln(I0φ (xr)/Iφ (xr)) (2)
Where φ is projection angle, Xr is coordinates of ray, L is path of ray’s pass throughsample. The projection data can be calculated by formula (2), then use CT recon-struction algorithm to calculate u(x,y).
In this paper, our experiment utilizes the CT experiment device in Beijing Syn-chrotron Radiation Facility (BSRF). The light source is X-ray, scanner system getsone projection image every one degree. The image collection system uses CCDwhose resolution is 10um.The experimental sample is a cylindrical sandstone corewhose diameter is 3mm.
1 Will be published in “Petroleum Science and Technology”

74 Copyright © 2013 Tech Science Press SL, vol.10, no.2, pp.71-84, 2013
2.2 Image processing
The original images obtained from CT experiment are grayscale image and needto image processing. After noise removal, image enhancement and image segmen-tation, the grayscale images is turned into binary images, in which each voxel isrepresented by a single bit, being 1 for pore and 0 for solid (see Figure 1).
(a) a original data image (b) image processed data
Figure 1: Image Processing.
It is either costly or unavailable to obtain the experimental data of a rock before andafter flooding by CO2, ASP or acidic fluid at the millimeter-sized scale. Thereforethe digital image processing technique is used to approximately simulate the changeof pore space caused by the chemical reaction.
2.3 Basic morphological operations: erosion and dilation
The basic morphological operations, erosion and dilation, can change the size ofobjects when applied to either grayscale or binary images. Erosion shrinks imageobjects while dilation expands them.
The characteristics of erosion are that erosion generally decreases the sizes of ob-jects and removes small anomalies by subtracting objects with a radius smallerthan the structuring element. So erosion is used to stimulate the decrease of thepore space.
On the contrary, the characteristic of dilation is that dilation generally increases thesizes of objects. With binary images, dilation adds pixels to the perimeter of eachimage object. So erosion is used to stimulate the increase of the pore space.
The number of pixels added or removed from the objects in an image dependson the size and shape of the structuring element used to process the image. A
A Study of Relation Between Permeabilities and Pore Space 75
structuring element is a matrix consisting of only 0’s and 1’s that can have anyarbitrary shape and size.
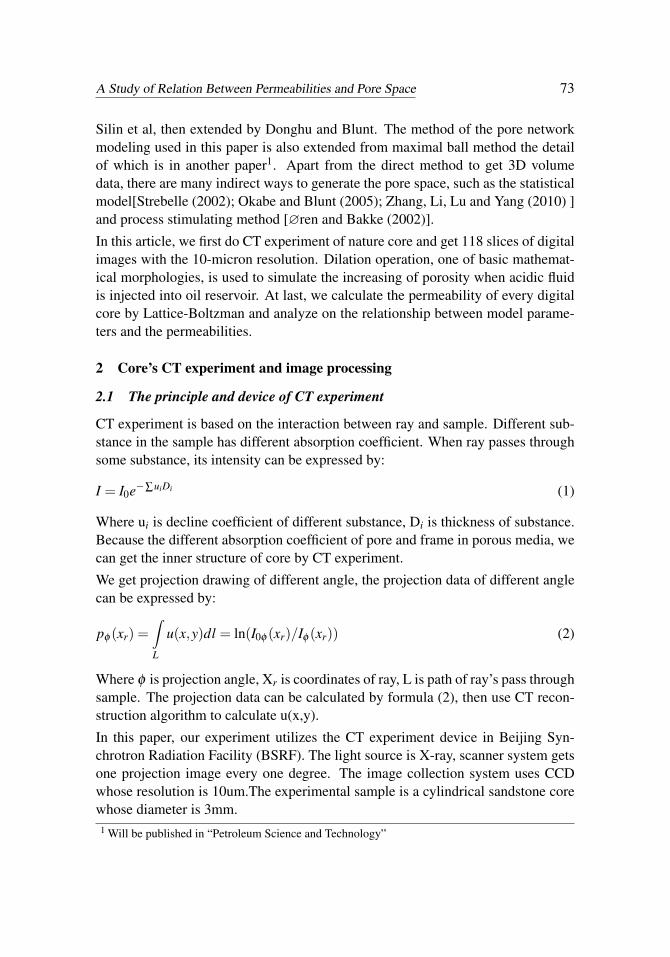
Two-dimensional structuring elements are typically much smaller than the imagebeing processed. A square structuring element used in this paper is a 2×2 matrix:
P =
[1 11 1
]Figure 2 shows the original image (see figure 2 b), the corresponding eroded image(see figure 2 a) and corresponding dilated image (see figure 2 c)
(a) a eroded image (b) a original image (c) dilated image
Figure 2: eroded and dilated images, white color represents pore space.
2.4 Three digital cores generated by erosion operation
Erosion shrinks image objects while dilation expands them. In this sense, erosionis contrary to the dilation. So we just use dilation to simulate the modification ofpore space.
The whole digital core consists of a huge number of voxels. A simulation withso many voxels based on Lattice-Boltzman would be a challenge for a computer.Therefore only 80 serial binary images of pore space and the 80×80×80 pixels arecombined in a computer to a 3D matrix of voxels represented by single bits.
Three other types of digital cores are generated by the dilation operation based onthe original 80×80×80 digital core. The first type is that the previous 20 serialbinary images are dilated while other sixty images are not, which is marked as“20d”. The second type is that only previous 40 serial binary images are dilatedand marked as “40d”. The third type is that only 60 serial binary images are dilatedand marked as “60d”. The original image is marked as “0d”.
Intuitively we can know that the porosities and permeabilities increase graduallyfrom “0d” digital cores, “20d” digital cores, “40d” digital cores to “60d” digital
76 Copyright © 2013 Tech Science Press SL, vol.10, no.2, pp.71-84, 2013
cores. Therefore the process of acidic fluid interact with the solid is approximatelysimulated.
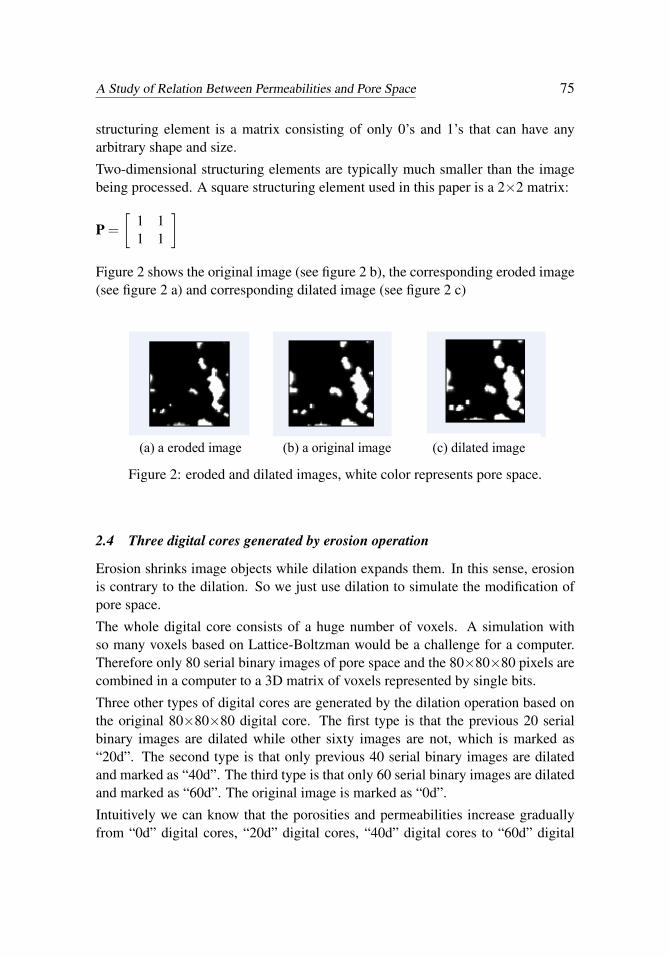
Table1 gives the porosity of 4 types of digital cores. It shows that the porosityincrease linearly from 0.1705 to 0.2050, which is also shown in Figure 5.
Table 1: Distribution of radius of pore body
Sample No 0d 20d 40d 60dporosity 0.1705 0.1803 0.1915 0.2050
3 Pore network modeling reconstruction method
The pore space of porous media is complex, localized disordered and not a simplegeometric body. For simplification the pore space is always replaced by some kindof simple objects. By the same way in this article, we consider the pore body assphere and the throat as cylinder to construct the pore network modeling.
There are many pore network modeling methods to distinguish between the porebodies and pore throats, and establishes their respective volume and connectivity.The main idea of the algorithm is introduced below.
In the discrete space the concept of sphere is a little different from the concept ofsphere in the continuous space. Figure 3 gives the circle with radius of 1 to radius3.
Figure 3: plane view of pore body with different radius (from left to right, r=1, r=2,r=3)
A Study of Relation Between Permeabilities and Pore Space 77
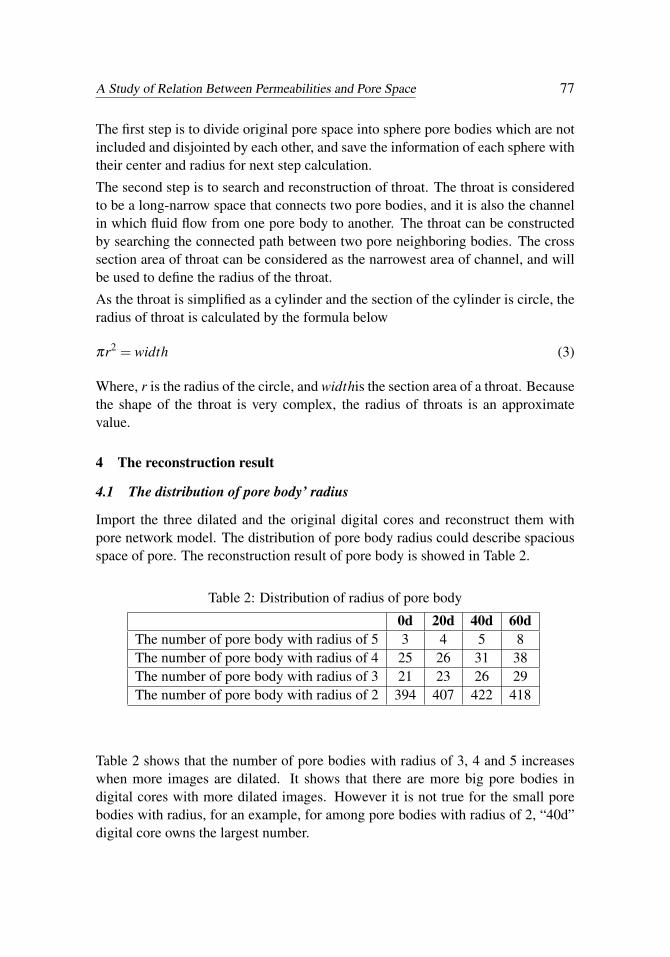
The first step is to divide original pore space into sphere pore bodies which are notincluded and disjointed by each other, and save the information of each sphere withtheir center and radius for next step calculation.
The second step is to search and reconstruction of throat. The throat is consideredto be a long-narrow space that connects two pore bodies, and it is also the channelin which fluid flow from one pore body to another. The throat can be constructedby searching the connected path between two pore neighboring bodies. The crosssection area of throat can be considered as the narrowest area of channel, and willbe used to define the radius of the throat.
As the throat is simplified as a cylinder and the section of the cylinder is circle, theradius of throat is calculated by the formula below
πr2 = width (3)
Where, r is the radius of the circle, and widthis the section area of a throat. Becausethe shape of the throat is very complex, the radius of throats is an approximatevalue.
4 The reconstruction result
4.1 The distribution of pore body’ radius
Import the three dilated and the original digital cores and reconstruct them withpore network model. The distribution of pore body radius could describe spaciousspace of pore. The reconstruction result of pore body is showed in Table 2.
Table 2: Distribution of radius of pore body
0d 20d 40d 60dThe number of pore body with radius of 5 3 4 5 8The number of pore body with radius of 4 25 26 31 38The number of pore body with radius of 3 21 23 26 29The number of pore body with radius of 2 394 407 422 418
Table 2 shows that the number of pore bodies with radius of 3, 4 and 5 increaseswhen more images are dilated. It shows that there are more big pore bodies indigital cores with more dilated images. However it is not true for the small porebodies with radius, for an example, for among pore bodies with radius of 2, “40d”digital core owns the largest number.
78 Copyright © 2013 Tech Science Press SL, vol.10, no.2, pp.71-84, 2013
The columns of Table 2 show that as the radius of sphere increases the number ofsphere pore body decreases dramatically. It shows that most of the space is smallpore particle in porous media.
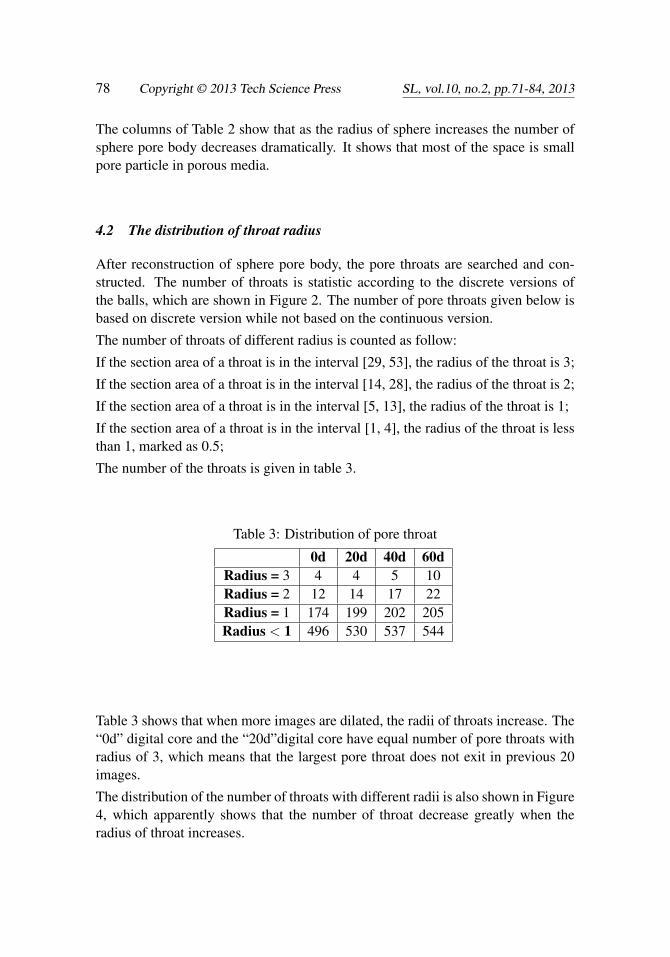
4.2 The distribution of throat radius
After reconstruction of sphere pore body, the pore throats are searched and con-structed. The number of throats is statistic according to the discrete versions ofthe balls, which are shown in Figure 2. The number of pore throats given below isbased on discrete version while not based on the continuous version.
The number of throats of different radius is counted as follow:
If the section area of a throat is in the interval [29, 53], the radius of the throat is 3;
If the section area of a throat is in the interval [14, 28], the radius of the throat is 2;
If the section area of a throat is in the interval [5, 13], the radius of the throat is 1;
If the section area of a throat is in the interval [1, 4], the radius of the throat is lessthan 1, marked as 0.5;
The number of the throats is given in table 3.
Table 3: Distribution of pore throat
0d 20d 40d 60dRadius = 3 4 4 5 10Radius = 2 12 14 17 22Radius = 1 174 199 202 205Radius < 1 496 530 537 544
Table 3 shows that when more images are dilated, the radii of throats increase. The“0d” digital core and the “20d”digital core have equal number of pore throats withradius of 3, which means that the largest pore throat does not exit in previous 20images.
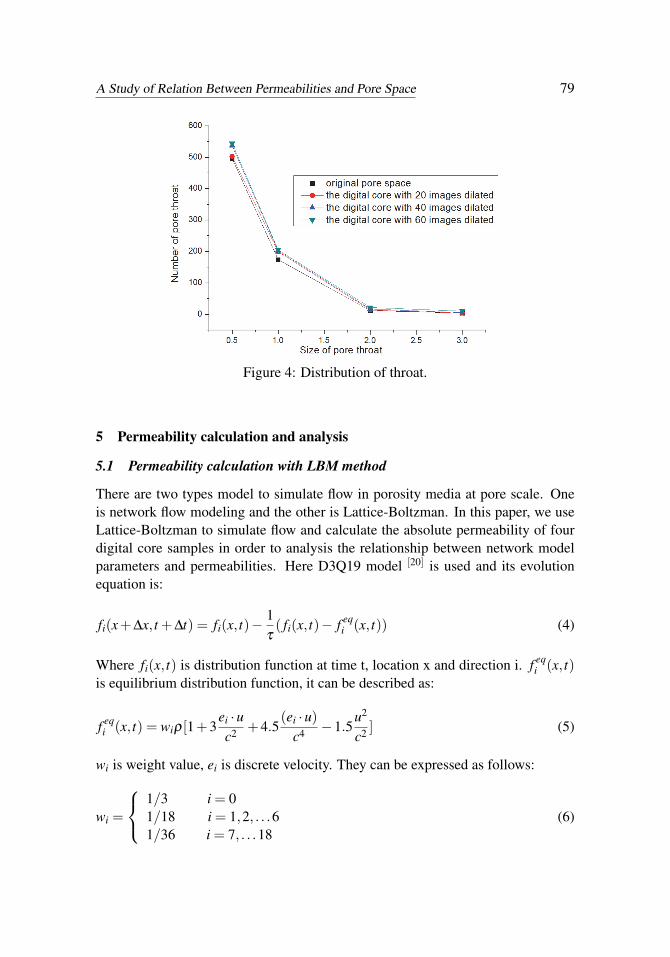
The distribution of the number of throats with different radii is also shown in Figure4, which apparently shows that the number of throat decrease greatly when theradius of throat increases.
A Study of Relation Between Permeabilities and Pore Space 79
Figure 4: Distribution of throat.
5 Permeability calculation and analysis
5.1 Permeability calculation with LBM method
There are two types model to simulate flow in porosity media at pore scale. Oneis network flow modeling and the other is Lattice-Boltzman. In this paper, we useLattice-Boltzman to simulate flow and calculate the absolute permeability of fourdigital core samples in order to analysis the relationship between network modelparameters and permeabilities. Here D3Q19 model [20] is used and its evolutionequation is:
fi(x+∆x, t +∆t) = fi(x, t)−1τ( fi(x, t)− f eq
i (x, t)) (4)
Where fi(x, t) is distribution function at time t, location x and direction i. f eqi (x, t)
is equilibrium distribution function, it can be described as:
f eqi (x, t) = wiρ[1+3
ei ·uc2 +4.5
(ei ·u)c4 −1.5
u2
c2 ] (5)
wi is weight value, ei is discrete velocity. They can be expressed as follows:
wi =
1/31/181/36
i = 0i = 1,2, . . .6i = 7, . . .18
(6)

80 Copyright © 2013 Tech Science Press SL, vol.10, no.2, pp.71-84, 2013
ei =
(0,0,0)(±1,0,0) ,(0,±1,0) ,(0,0,±1)(±1,±1,0) ,(±1,0,±1) ,(0,±1,±1) ,
i = 0i = 1,2, . . .6i = 7, . . .18
(7)
The density and momentum of fluid can be expressed by:
ρ = ∑ fi(x, t) (8)
ρu = ∑ fi(x, t)ei (9)
5.2 The relationship between permeabilities and other porous media parame-ters
There are many porosity media parameters such as porosity, coordination number,the distribution of pore body and throat. The coordination number of a pore bodyis the number of pore throats connecting it to other pore bodies. It is one of im-portant parameters of pore space because the connections of pore throat controlthe flow properties. Since the four types of the digital core almost have the samemorphologies, the analysis of coordination number is neglected.
As definition of pore network model, a complete flow channel consists of two el-ements, pore body and throat. Pore throats are the narrow gateways that connectthe pore bodies and determine the rock permeabilities. The pore body is spaciouspore space for storing fluid. Generally, pore bodies determine the rock porosity.Therefore the analysis of the relation between permeabilities and pore bodies isomitted.
5.3 The relationship between permeabilities and porosities
The permeability is calculated by above mentioned LBM method. In order to ob-serve the effect of porosity to permeability, we sort the four samples according totheir porosity from low to high. The order is “0d” digital core, “20d” digital core,“40d” digital core, “60d” digital core, shown as Figure 5.
As is showed in Figure 5, permeabilities go up as porosities increase. Although theincreasing trend is same, the increasing rates have a big difference. The porosityincreases linearly while the permeability increases exponentially. It shows that theporosity is not the main influencing factors to the permeability.
5.4 The distribution of throat radius
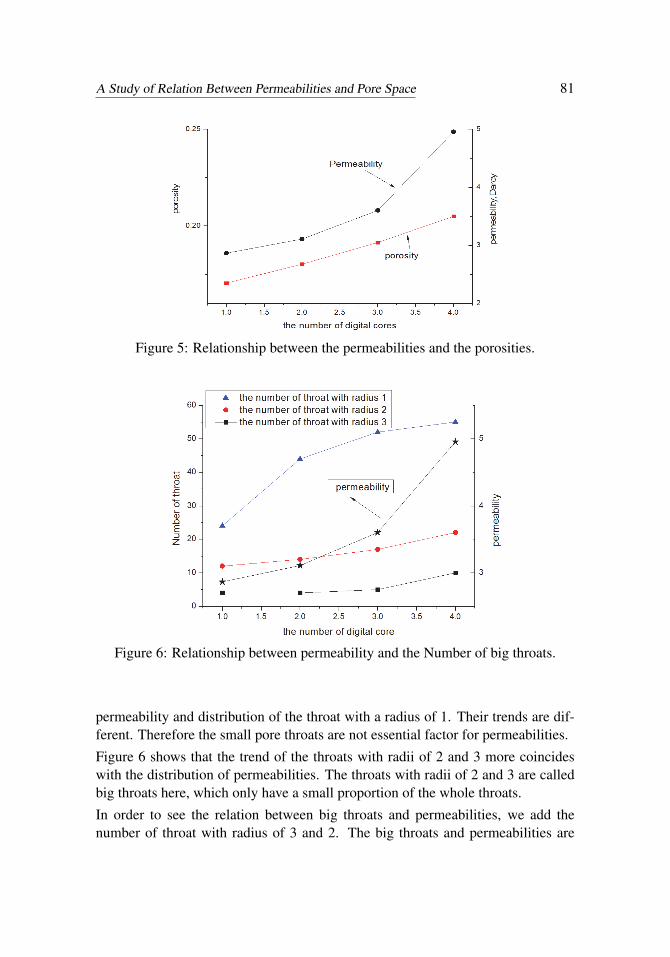
The permeabilities and the number of throats for all samples are shown in Figure6, where the number of throats with radius of 1 is minus 150 for displaying con-veniently. It is easy to see that there is big difference between distribution of the
A Study of Relation Between Permeabilities and Pore Space 81
Figure 5: Relationship between the permeabilities and the porosities.
Figure 6: Relationship between permeability and the Number of big throats.
permeability and distribution of the throat with a radius of 1. Their trends are dif-ferent. Therefore the small pore throats are not essential factor for permeabilities.
Figure 6 shows that the trend of the throats with radii of 2 and 3 more coincideswith the distribution of permeabilities. The throats with radii of 2 and 3 are calledbig throats here, which only have a small proportion of the whole throats.
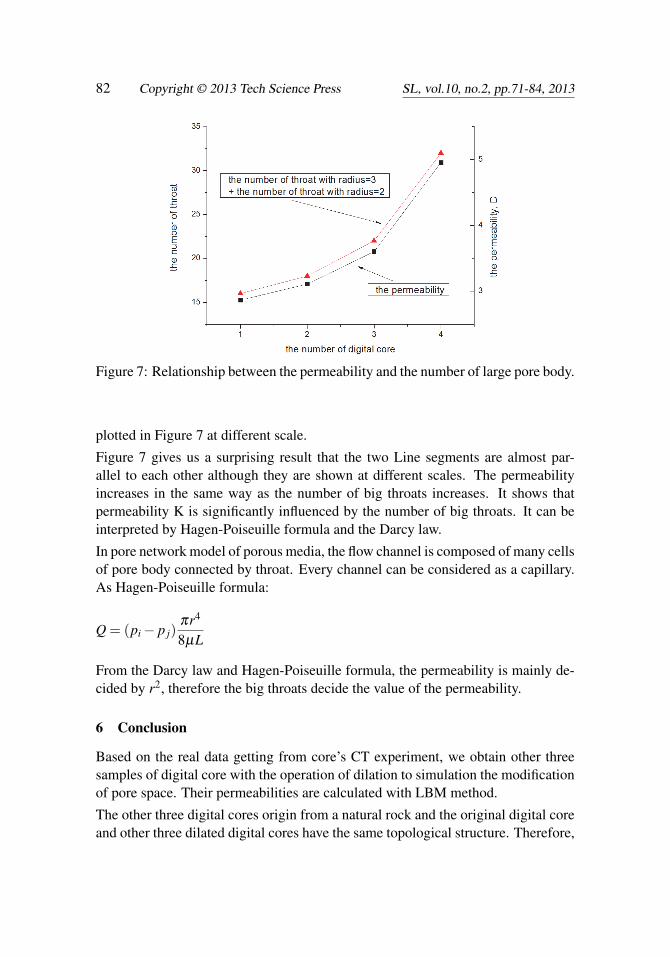
In order to see the relation between big throats and permeabilities, we add thenumber of throat with radius of 3 and 2. The big throats and permeabilities are
82 Copyright © 2013 Tech Science Press SL, vol.10, no.2, pp.71-84, 2013
Figure 7: Relationship between the permeability and the number of large pore body.
plotted in Figure 7 at different scale.
Figure 7 gives us a surprising result that the two Line segments are almost par-allel to each other although they are shown at different scales. The permeabilityincreases in the same way as the number of big throats increases. It shows thatpermeability K is significantly influenced by the number of big throats. It can beinterpreted by Hagen-Poiseuille formula and the Darcy law.
In pore network model of porous media, the flow channel is composed of many cellsof pore body connected by throat. Every channel can be considered as a capillary.As Hagen-Poiseuille formula:
Q = (pi − p j)πr4
8µL
From the Darcy law and Hagen-Poiseuille formula, the permeability is mainly de-cided by r2, therefore the big throats decide the value of the permeability.
6 Conclusion
Based on the real data getting from core’s CT experiment, we obtain other threesamples of digital core with the operation of dilation to simulation the modificationof pore space. Their permeabilities are calculated with LBM method.
The other three digital cores origin from a natural rock and the original digital coreand other three dilated digital cores have the same topological structure. Therefore,
A Study of Relation Between Permeabilities and Pore Space 83
they have the same distribution of cooperation number and pore bodies. Apartfrom the influence of the different topological structure, the relation among thepermeabilities, porosities and pore throats can be more exactly analyzed.
The result is that the modification of throat changes permeability greatly and thatpermeability is significantly influenced by the number of big throat. The perme-ability increases in the same way as the number of big throats increases, althoughthe curves are shown at different scales.
When CO2, ASP or acid fluid is injected into oil reservoir, the permeability of therocks will apparently change. From the microstructure of rock, it is interesting thathow the velocity, concentration and other factors influence the size of the throats.
Reference
Al-Kharusi, A. S.; Blunt, M. J. (2007): Network extraction from sandstone andcarbonate pore space images.
Bakke, A.; ∅∅∅ren, P. E. (1997): 3-d pore-scale modeling of sandstones and flowsimulations in the pore networks. SPE 35479, 1997.
Blunt, M. J.; Jackson, M. D.; Piri, M. et al. (2002): Detailed physics, predictivecapabilities and macroscopic consequences for pore-network models of multiphaseflow. Adv Water Res, vol. 25, pp. 1069-1089.
Blunt, M.; King, P. (1990): Macroscopic parameters from simulations of porescale flow. Physical Review A, vol. 42, no. 8, pp. 4780-4787.
Blunt, M. J.; Jackson, M. D.; Piri, M.; Valvatne, P. H. (2002): Detailed physicspredictive capabilities and macroscopic consequences for pore-network models ofmultiphase flow. Advances in Water Resources, vol. 25, no. 1, pp. 1069-1089.
Czernichowski-Lauriol, I.; Rochelle, C.; Gaus, I.; Azaroual, M.; Pearce, J.;Durst, P. (2006): Geochemical interactions between CO2, pore-waters and reser-voir rocks. Earth and Environmental Sciences, vol. 65, PART III, pp. 157-174.
Dixit, A. B.; McDougall, S. R. (1998): Sorbie K S.A pore-level investigation ofrelative-permeability hysteresis in water-wet systems. SPE J., vol. 3, no. 2, pp.115-123.
Dong, H.; Blunt, M. J. (2009): Pore-network extraction from micro-computerized-tomography images. Physical Review E, vol. 80, pp. 036307.
Guang, S. et al. (1990): The physical and chemistry mechanism of microcosmicpercolation flow. Beijing: Science Press,1990, pp. 6-18.
Hazlett, R. D. Statistical characterization and stochastic modeling of pore networksin relation to fluid flow. Mathematical Geology, vol. 29, no. 4, pp. 801-822.
84 Copyright © 2013 Tech Science Press SL, vol.10, no.2, pp.71-84, 2013
Jessen, K.; Kovscek, A. R.; Orr, F. M. (2005): Increasing CO2 storage in oilrecovery. Energy Conversion and Management, vol. 46, no. 2, pp. 293-311.
Liang, Z. R.; Fernandes, C. P.; Magnani, F. S.; Philippi, P. C. (1998): A re-construction technique for three-dimensional porous media using image analysisand Fourier transforms. Journal of Petroleum Science and Engineering,vol. 21, pp.273.
Lindquist, W. B.; Lee, S. M.; Coker, D.; Jones, K.; Spanne, P. (1996): Medialaxis analysis of void structure in three-dimensional tomographic images of porousmedia. J. Geophys. Res., vol. 101B, pp. 8297-8310.
Mantilla, C.; Srinivasan, S. (2011): Feedback Control of Polymer Flooding Pro-cess Considering Geologic Uncertainty, spe 141962, 2011.
Okabe, H.; Blunt, M. J. (2005): Pore space reconstruction using multiple-pointstatistics. Journal of Petroleum Science and Engineering, vol. 46, pp. 121– 137.
∅∅∅ren, P. E.; Bakke, S. (2002): Process based reconstruction of sandstones andpredictions of transport properties. Transport in Porous Media, vol. 46, no. 2, pp.311-343.
Robert, S. M.; Robert, S. B.; Daryl, W. G. (1996): Boundary conditions for thelattice boltzmann method. Phys Fluids, vol. 8, no. 7, pp. 1788—1800.
Silin, D. B.; Patzek, T. W. (2006): Pore space morphology analysis using maximalinscribed spheres. Physica A, vol. 371, pp. 336–360.
Strebelle, S. (2002): Conditional simulation of complex geological structures usingmultiple-point statistics. Mathematical Geology, vol. 34, no. 1, pp. 1-21.
Zhang, T.; Li, D.; Lu, D.; Yang, J. (2010): Research on the reconstruction methodof porous media using multiple-point geostatistics. Science in China Series G:Physics, Mechanics & Astronomy, vol. 53, no. 1, pp. 122-134.


![Changes in gas permeability and pore structure of wood ... … · 11/11/2019 · solid woo[12,13]. ˙e purpose of this study is to estimate the relation-ships between pore characteristics](https://img.pdfslide.us/doc/110x75/5f7dc34babc8e9187d2c0d48/changes-in-gas-permeability-and-pore-structure-of-wood-11112019-solid.jpg)