Embed Size (px)
Citation preview
This article was downloaded by: [University of Wisconsin-Milwaukee]On: 07 October 2014, At: 09:43Publisher: RoutledgeInforma Ltd Registered in England and Wales Registered Number: 1072954 Registered office:Mortimer House, 37-41 Mortimer Street, London W1T 3JH, UK
World ArchaeologyPublication details, including instructions for authors and subscriptioninformation:http://www.tandfonline.com/loi/rwar20
Analytical applications of fine-scaleterrestrial lidar at the imperial Inca site ofCaranqui, northern highland EcuadorBoleslo E. Romeroa & Tamara L. Brayb
a University of California, Santa Barbarab Wayne State UniversityPublished online: 20 Mar 2014.
To cite this article: Boleslo E. Romero & Tamara L. Bray (2014) Analytical applications of fine-scaleterrestrial lidar at the imperial Inca site of Caranqui, northern highland Ecuador, World Archaeology, 46:1,25-42, DOI: 10.1080/00438243.2014.890910
To link to this article: http://dx.doi.org/10.1080/00438243.2014.890910
PLEASE SCROLL DOWN FOR ARTICLE
Taylor & Francis makes every effort to ensure the accuracy of all the information (the “Content”)contained in the publications on our platform. However, Taylor & Francis, our agents, and ourlicensors make no representations or warranties whatsoever as to the accuracy, completeness, orsuitability for any purpose of the Content. Any opinions and views expressed in this publicationare the opinions and views of the authors, and are not the views of or endorsed by Taylor &Francis. The accuracy of the Content should not be relied upon and should be independentlyverified with primary sources of information. Taylor and Francis shall not be liable for anylosses, actions, claims, proceedings, demands, costs, expenses, damages, and other liabilitieswhatsoever or howsoever caused arising directly or indirectly in connection with, in relation to orarising out of the use of the Content.
This article may be used for research, teaching, and private study purposes. Any substantialor systematic reproduction, redistribution, reselling, loan, sub-licensing, systematic supply, ordistribution in any form to anyone is expressly forbidden. Terms & Conditions of access and usecan be found at http://www.tandfonline.com/page/terms-and-conditions
Analytical applications of fine-scaleterrestrial lidar at the imperial Inca siteof Caranqui, northern highland Ecuador
Boleslo E. Romero and Tamara L. Bray
Abstract
The relatively recent availability of terrestrial lidar for mapping archaeological subjects has allowed forgreat advances in representation and reconstruction but the analytic potential of this technology remainsunder-developed in archaeology. This paper provides an overview of the analytical directions we are takingwith point cloud data generated through ground-based laser scanning at the imperial Inca site of Caranquiin northern Ecuador. Our approach to data analysis employs insights and ideas from the domains ofGIScience, remote sensing, cartography, computer vision and hydrology. While creating a comprehensivevisual record of the site was an important project goal, we also sought to develop improved methods offeature extraction and surface calibration to better understand water manipulation and flows at the site.Here we highlight some of the preliminary results of our analyses as well as the challenges and benefits ofemploying terrestrial lidar to investigate a mid-sized archaeological site.
Keywords
Terrestrial lidar; feature extraction; surface calibration; water flow analysis; Inca-Caranqui.
Introduction
The use of lidar in archaeology has increased exponentially over the past ten years as a result ofincreased accessibility and familiarity. One of an assortment of new digital data collectiontechniques, lidar uses the time-of-flight of a laser pulse to estimate distances and thereforelocations of points on reflectant surfaces. The resulting high-speed, sub-centimetre samplingcapabilities provide abundant data for highly accurate interpolated surfaces of landscapes,archaeological sites, structures and artefacts. In archaeology, the earliest and still most commonapplications have involved the use of aerial lidar for regional and landscape studies aimed at thedetection of features and sites as well as the efficient, if coarse-grained, mapping of these (see,
World Archaeology Vol. 46(1): 25–42 Digital Imaging© 2014 Taylor & Francis ISSN 0043-8243 print/1470-1375 online
http://dx.doi.org/10.1080/00438243.2014.890910
Dow
nloa
ded
by [
Uni
vers
ity o
f W
isco
nsin
-Milw
auke
e] a
t 09:
43 0
7 O
ctob
er 2
014
for instance, Bewley, Crutchley, and Shell 2005; Chase et al. 2011; Devereux et al. 2005;Harmon et al. 2006). At the opposite end of the spectrum, there has been growing use of laserscanning in archaeological, cultural heritage and museum contexts for the three-dimensional(3D) imaging and documentation of smaller-sized artefacts, artworks and objects (Evans,Maxwell, and Cruikshanks 2013; Grosman, Smikt, and Smilansky 2008; Hallett et al. 2008;Remondino 2008; Stanco, Battiato, and Gallo 2011).
Intermediate between regional and object-level applications is the use of terrestrial or ground-based lidar for work at the site level, which is typically the primary unit of archaeologicalinvestigation and analysis. While the accuracy and comprehensiveness of the models that can beproduced through ground-based laser scanning has quickly made this technology the goldstandard for site documentation and reconstruction (see for instance, Lambers et al. 2007;Lerma et al. 2010; García Puchol et al. 2013), its utility as a tool for archaeological analysisis still in the discovery phase. This is reflected in the relatively limited number of publicationsthat treat the use of terrestrial lidar beyond discussions of mapping and visual representation(though see Entwistle, McCaffrey, and Abrahams 2009; Fux et al. 2009, for some recentexceptions).
In this article, we provide an overview of the analytical directions we are taking with pointcloud data generated through ground-based laser scanning at the imperial Inca site of Caranquiin northern highland Ecuador. Our approach to data analysis employs insights and ideas fromthe domains of GIScience, remote sensing, cartography, computer vision and hydrology. Whileattaining an accurate and detailed visual representation of the site was, of course, one of theproject goals, we also sought to develop methods of feature extraction and improve surfacecalibration for purposes of interpreting water flows and manipulation at Caranqui and enablinginter-site comparisons of architectural elements and activity areas. Here we highlight some ofthe preliminary results of our analyses as well as the challenges and benefits of employingterrestrial lidar to investigate the complexities of a mid-sized archaeological site in the contextof an early empire. In the following sections, we provide a brief introduction to the site of Inca-Caranqui, an overview of the data collection procedures, our approach to feature extraction andsurface generation and the results of a preliminary hydrological analysis of water flows at thesite.
Inca-Caranqui: history and context
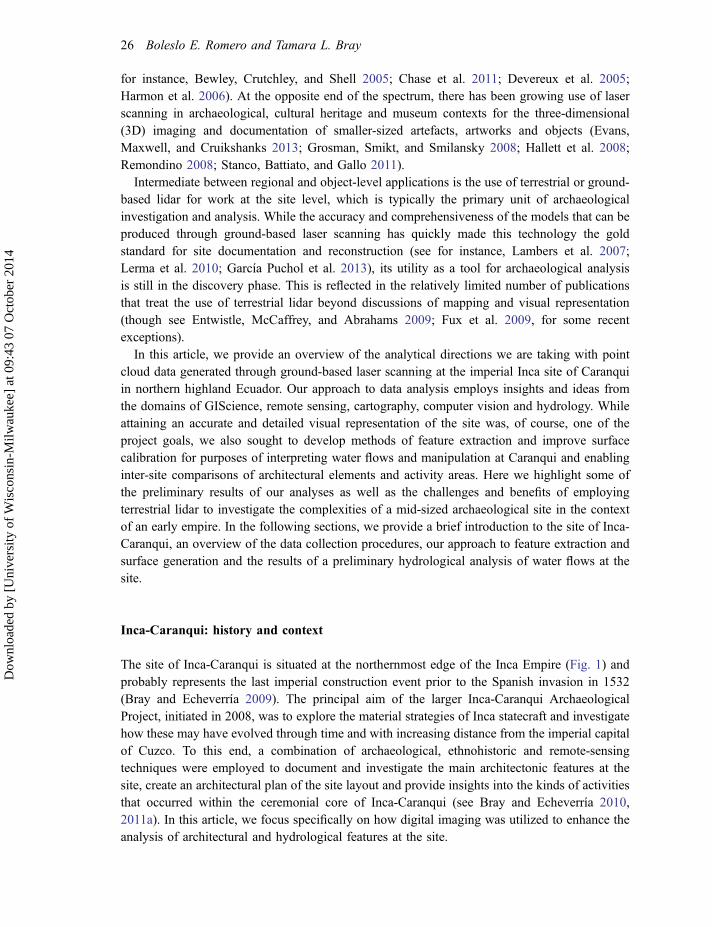
The site of Inca-Caranqui is situated at the northernmost edge of the Inca Empire (Fig. 1) andprobably represents the last imperial construction event prior to the Spanish invasion in 1532(Bray and Echeverría 2009). The principal aim of the larger Inca-Caranqui ArchaeologicalProject, initiated in 2008, was to explore the material strategies of Inca statecraft and investigatehow these may have evolved through time and with increasing distance from the imperial capitalof Cuzco. To this end, a combination of archaeological, ethnohistoric and remote-sensingtechniques were employed to document and investigate the main architectonic features at thesite, create an architectural plan of the site layout and provide insights into the kinds of activitiesthat occurred within the ceremonial core of Inca-Caranqui (see Bray and Echeverría 2010,2011a). In this article, we focus specifically on how digital imaging was utilized to enhance theanalysis of architectural and hydrological features at the site.
26 Boleslo E. Romero and Tamara L. Bray
Dow
nloa
ded
by [
Uni
vers
ity o
f W
isco
nsin
-Milw
auke
e] a
t 09:
43 0
7 O
ctob
er 2
014
The site of Inca-Caranqui is situated adjacent to what was most likely a principal settlementof the proto-historic Caranqui population. The Caranqui were one of several semi-autonomouspolities found in the region that today comprises the modern Ecuadorian provinces of Imbaburaand northern Pichincha. The other principal polities in this territory included the Otavalo, theCayambe and the Cochasquí (Espinosa Soriano 1983; Larrain 1980). The late pre-Columbianperiod inhabitants of this region shared a lingua franca, a common artistic tradition and similarlevels of technological expertise. They also engaged in the construction of monumental earth-works known as tolas that served as platform mounds for elite residences and burials. Thenumerous large mound sites that dot the landscape of the former Caranqui territory suggest alevel of socio-political organization on the order of chiefdoms (Athens 1980; Bray 2008).Ethnohistoric and archaeological data indicate that in the early sixteenth century these politiesjoined forces to confront the Inca incursion and successfully resisted imperial subjugation for adecade or more (Bray 2003; Plaza Schuller 1976). When the Inca did finally prevail, probablysometime between AD 1515 and AD 1520, they established their imperial administrative centre atthe site of Caranqui (Bray and Echeverría forthcoming).
The modern village of Caranqui is situated on the northern slopes of Mt. Imbabura just a fewkilometres south of the city of Ibarra. The fact that there was an Inca presence here has long beenknown due to the fortunate preservation of two large, standing, niched walls on private property nearthe village centre (Bedoya 1979). These walls comprise part of an Inca great hall that was at least
Figure 1 Map of Ecuador indicating the location of the imperial site of Inca-Caranqui.Source: ESRI and DeLorme 2012.
Analytical applications of fine-scale terrestrial lidar 27
Dow
nloa
ded
by [
Uni
vers
ity o
f W
isco
nsin
-Milw
auke
e] a
t 09:
43 0
7 O
ctob
er 2
014
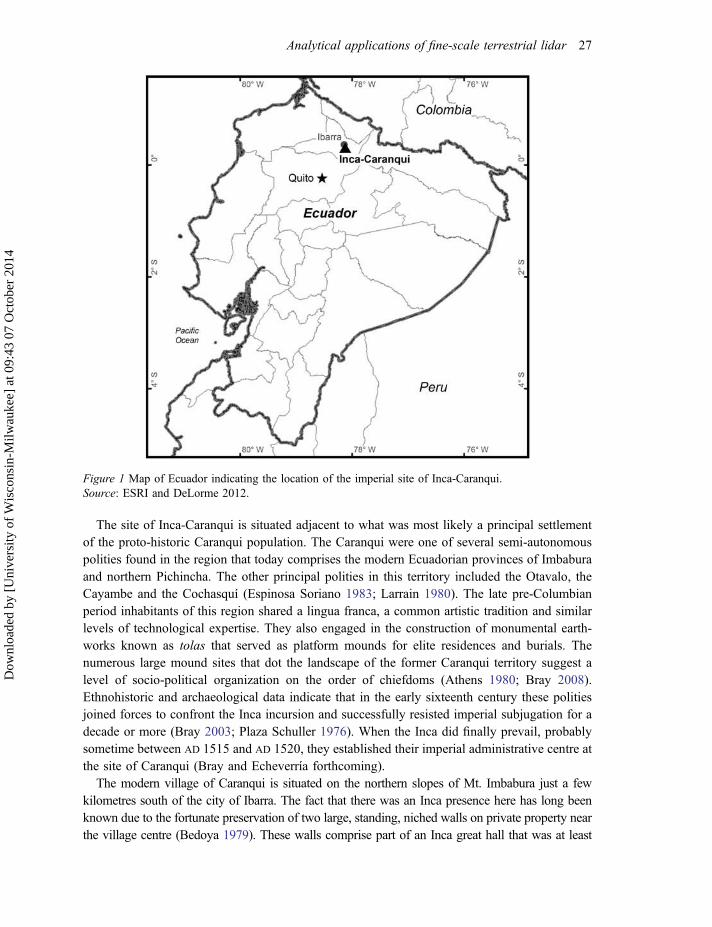
40 × 60m in size. In 2006, during exploratory investigations on the lot immediately north-east of theInca great hall, an elegant semi-subterranean structure measuring 10 × 16m in size, which has sincebeen interpreted as a water temple, was uncovered (Bray and Echeverría 2009, 2011a, 2011b; Bray2013). Subsequent excavations over the past several years have revealed a series of additional Incastructures, foundations, stone-lined canals and enclosure walls associatedwith these principal features.These architectural elements comprise the core of the site of Inca-Caranqui, which, we estimate,covered approximately 10 hectares (ha) in total. The core area of the site, encompassing roughly 2ha,was the primary focus of the analyses reported upon here (Fig. 2).
Data collection
As noted, an important component of our investigations at Inca-Caranqui involved the efficientand precise documentation of architectural elements and features at the site. For this purpose,laser scanning and 3D object modelling using terrestrial lidar were deemed most appropriate. Asour work proceeded and the variation in feature types became more apparent, we also decided toexplore the analytical potential of terrestrial lidar. Initially we used lidar scans to obtain data onboth local landscape and archaeological features. Focus then shifted to the more detailedscanning of specific features such as floors, walls, steps, canals, tanks and fountains. Anoverview of the datasets, instrumentation and work flow is presented in the next section.
Figure 2 Map of core area of the site of Inca-Caranqui showing primary features.
28 Boleslo E. Romero and Tamara L. Bray
Dow
nloa
ded
by [
Uni
vers
ity o
f W
isco
nsin
-Milw
auke
e] a
t 09:
43 0
7 O
ctob
er 2
014
Instrumentation and datasets
Topographic data collection was performed at Inca-Caranqui over three field seasons (2008–10)during which time both terrestrial lidar and total station survey points were obtained. Optech36D laser scanners (serial numbers 10147 and 010297) were used for terrestrial lidar datacollection and a Leica TPS Series TC400 total station was used for collecting conventionalsurvey points. Three site benchmarks served as horizontal and vertical control points for bothtypes of data. For this paper, we utilized portions of the 2008 and the 2009 lidar scans togetherwith the 2010 survey points in our analyses.
The main focus of our investigations during the seasons in which lidar was employed was thenorth-east quadrant of the core site area, which measured approximately 115 × 45m in size. Thissector was first scanned at a relatively low resolution to establish the spatial configuration of thefeatures. Thereafter, higher resolutions were obtained for particular features of interest, includ-ing but not limited to the semi-subterranean temple, a posited water settling tank and numerouscanals, spouts, fountains and drains. Since the scanner collects data radially from a single pointthere is typically a finer sampling resolution of surfaces near the scanner and coarser resolutionaway from the scanner. A radial step-angle can be set for a specific sampling resolution at aparticular distance. For the 2008 lidar data discussed in this article, the core site scans weregenerally set to have a precision of 50.3mm at 40m distance. For features of interest, such as thesemi-subterranean temple and the water-related features, the 2008 high-resolution scans weregenerally set to have a precision of 14.9mm at 40m distance, or 1.3mm at 3.5m distance.
Such fine-scale scanning resolved the worked surfaces of water features having cross-sectionaldimensions of a few centimetres. It is worth noting that sampling resolution can be increased evenfurther to obtain fine details at larger distances, as was done in the subsequent year. It is alsoimportant to note that, when multiple scans with different positions and orientations are combined,the terrestrial lidar point cloud has a highly variable sampling point density. Though this variabledensity creates challenging situations for surface generation, like determining appropriate inter-polation parameters to apply to the entire dataset, features of interest can often still be resolved bycollecting abundant data. Ways to handle variable point density include, but are not limited to,thinning the point cloud, which can result in a more consistent point density, or calibrating localsurface-generation parameters for patches of the surface with different point densities.
The purpose of collecting terrestrial lidar data was to provide a detailed and relativelycontinuous model of visible surfaces at the site. For example, instead of taking just a fewconventional survey observations of the water temple, millions of lidar points were collected tobetter represent the surfaces of this structure. With conventional survey data, it was possible toobtain only rough dimensions of the water temple, and canals were represented by relatively fewdata points and simplified centrelines. On the other hand, with the abundant lidar data collectedat the resolutions mentioned above, and by combining the numerous scan perspectives, nuancedconstruction aspects were revealed, such as meandering water canals and subtle flow linesassociated with the draining and filling of canals and floors.
General lidar data workflow
To develop 3D polygonal models (i.e. continuous surface representations) of the site, theInnovMetric commercial software package PolyWorks, version 11 (InnovMetric 2012), was used.
Analytical applications of fine-scale terrestrial lidar 29
Dow
nloa
ded
by [
Uni
vers
ity o
f W
isco
nsin
-Milw
auke
e] a
t 09:
43 0
7 O
ctob
er 2
014
Processes from several modules in this software can generate a polygonal model from a point cloudthat includes multiple individual lidar scans. The typical workflow begins with parsing the raw lidardata to a desired format with software provided by the instrument manufacturer, Optech. Afterpreparing the data, they are imported into PolyWorks. This process includes a data-filtering step toretain only points within specified ranges of distances and orientations to the scanner. The importprocess finally converts the point data into a temporary surface with a specified spatial resolutioncalled an interpolated grid. As grids, several imported scans can then be combined by aligning themwith both manual and statistical best-fit processes. At this point, the scans can also be georeferencedwith ground control survey benchmarks. To ease computational workload and achieve a moreuniform distribution of point samples, an overlap reduction process is often performed at this stage.After the grids are aligned and overlap is reduced, the points represented by the grids are subjected toa merging process to generate a polygonal model of the site surfaces (see Romero 2012).
Data analyses performed
The analyses we present in this article begin with georeferenced data points prior to the overlap-reduction and surface-generation steps. As noted previously, lidar-related data provide detailed3D information for site documentation, archival purposes and digital cultural heritage preserva-tion. Visual analysis is typically the first step towards site reconstruction and building inferencesabout the types and functions of features found. These common applications are brieflydiscussed in the context of Inca-Caranqui in the first part of this section.
Beyond visual representation, our intent was to explore other ways lidar could help us understandthe cultural significance of the features found at the site. Of particular interest were the water-relatedfeatures, including the two basic types of water channels (stone-lined and carved-stone), theassociated fountains, spouts and drains, the settling tank and the water temple. These hydraulicfeatures are interwoven throughout the site tying together various structures and elements of thelandscape. To better understand the kinds of cultural activities that occurred at this site, it is importantto know how water was directed, collected and used. The preliminary hydrological analysis wepresent below is helpful in revealing possible interactions betweenwater and people at Inca-Caranqui.
Prior to undertaking the hydrological study, however, two preliminary steps were necessarythat are generally useful for working with lidar data from archaeological sites. First, since theamount of lidar generated data usually exceeds that of a traditional topographic survey, it iscommon to encounter the challenge of increased computational processing (Pfeifer andMandlburger 2009). Surface-generation processes are particularly costly in this regard. Oneway to reduce the workload is to process only a subset of the data. For instance, we did not needto include extraneous vegetation in our surface models. For this reason, before conducting thehydrology study, we developed a feature extraction process for subsetting the lidar data forarchaeological features of interest. After the feature extraction, we still needed to generateaccurate surfaces. Since the water-related features have scales ranging from tens of metres tojust a few centimetres, generating surfaces for such diverse and complex phenomena presentedanother challenge. To address this issue, the second preliminary step involved ascertainingwhich procedural parameter values provided the best surface models of water-related features.
In the following sections, we first discuss site documentation, visual analysis and digital recon-struction. Next we present an overview of the feature extraction processes used for subsetting the
30 Boleslo E. Romero and Tamara L. Bray
Dow
nloa
ded
by [
Uni
vers
ity o
f W
isco
nsin
-Milw
auke
e] a
t 09:
43 0
7 O
ctob
er 2
014
lidar data. Following this, we discuss how surface-generation parameters were tested and calibrated.Finally, we offer a preliminary hydrological analysis to better understand how the manipulation ofwater resources articulated with other activities at the site. We hope that discussion of the challengesand benefits involved in the various types and stages of analyses performed might stimulate newresearch into the information potential afforded by lidar data for archaeology.
Site documentation, visual analysis, digital reconstruction
Given the speed and accuracy of lidar, which is capable of scanning approximately 100,000points per minute, it was possible to quickly document site alterations and directly samplevisible surfaces, thus reducing errors due to manual operations associated with conventionalsurvey techniques. Along with the location information, lidar intensity values also augmentedinformation about surface properties and orientation (Petrie and Toth 2009). Colour values fromother sensors were fused with the point data to further improve the recording of site character-istics at Inca-Caranqui.
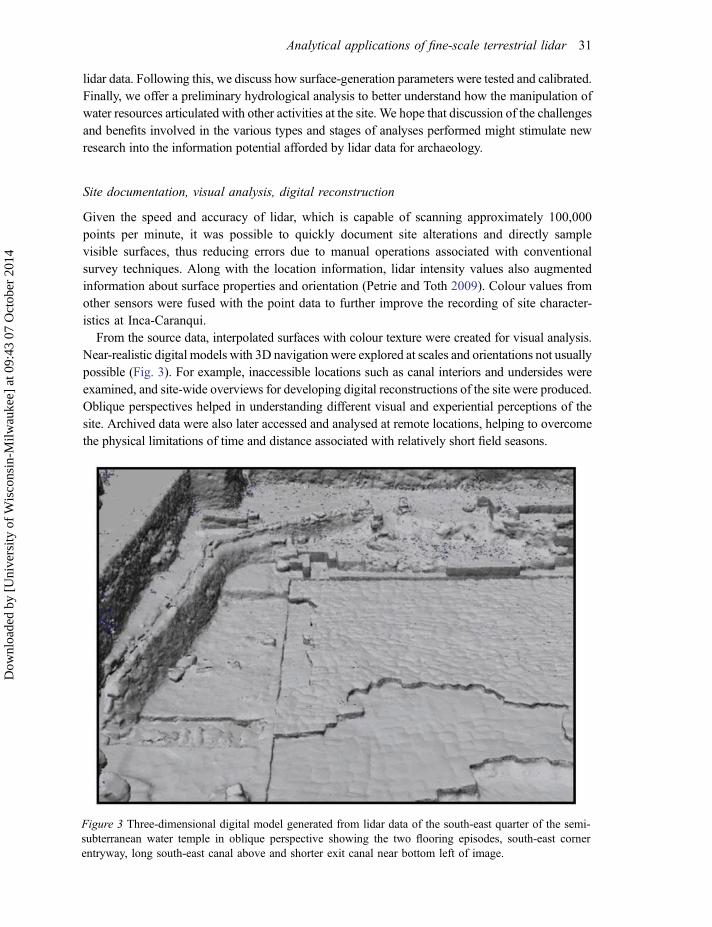
From the source data, interpolated surfaces with colour texture were created for visual analysis.Near-realistic digital models with 3D navigation were explored at scales and orientations not usuallypossible (Fig. 3). For example, inaccessible locations such as canal interiors and undersides wereexamined, and site-wide overviews for developing digital reconstructions of the site were produced.Oblique perspectives helped in understanding different visual and experiential perceptions of thesite. Archived data were also later accessed and analysed at remote locations, helping to overcomethe physical limitations of time and distance associated with relatively short field seasons.
Figure 3 Three-dimensional digital model generated from lidar data of the south-east quarter of the semi-subterranean water temple in oblique perspective showing the two flooring episodes, south-east cornerentryway, long south-east canal above and shorter exit canal near bottom left of image.
Analytical applications of fine-scale terrestrial lidar 31
Dow
nloa
ded
by [
Uni
vers
ity o
f W
isco
nsin
-Milw
auke
e] a
t 09:
43 0
7 O
ctob
er 2
014
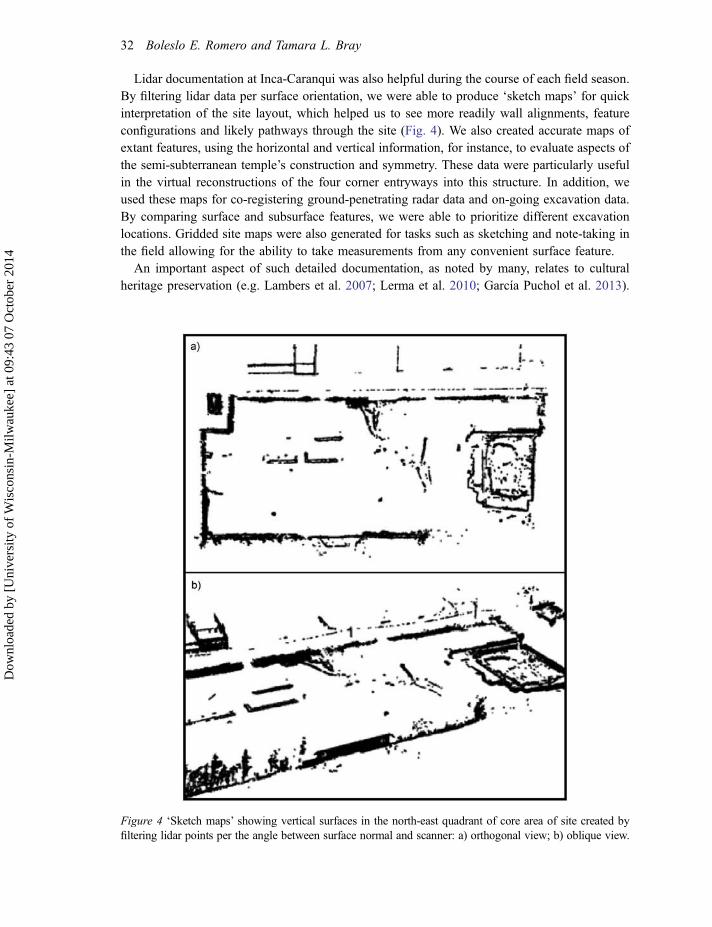
Lidar documentation at Inca-Caranqui was also helpful during the course of each field season.By filtering lidar data per surface orientation, we were able to produce ‘sketch maps’ for quickinterpretation of the site layout, which helped us to see more readily wall alignments, featureconfigurations and likely pathways through the site (Fig. 4). We also created accurate maps ofextant features, using the horizontal and vertical information, for instance, to evaluate aspects ofthe semi-subterranean temple’s construction and symmetry. These data were particularly usefulin the virtual reconstructions of the four corner entryways into this structure. In addition, weused these maps for co-registering ground-penetrating radar data and on-going excavation data.By comparing surface and subsurface features, we were able to prioritize different excavationlocations. Gridded site maps were also generated for tasks such as sketching and note-taking inthe field allowing for the ability to take measurements from any convenient surface feature.
An important aspect of such detailed documentation, as noted by many, relates to culturalheritage preservation (e.g. Lambers et al. 2007; Lerma et al. 2010; García Puchol et al. 2013).
Figure 4 ‘Sketch maps’ showing vertical surfaces in the north-east quadrant of core area of site created byfiltering lidar points per the angle between surface normal and scanner: a) orthogonal view; b) oblique view.
32 Boleslo E. Romero and Tamara L. Bray
Dow
nloa
ded
by [
Uni
vers
ity o
f W
isco
nsin
-Milw
auke
e] a
t 09:
43 0
7 O
ctob
er 2
014
Over the course of time, alterations to archaeological sites due to weathering, vandalism orongoing scientific investigation can drastically reduce interpretative potential. Lidar documenta-tion of key features at Inca-Caranqui has already proved invaluable due to problems of theft anddeterioration at the site. In addition to providing local municipal authorities with the processed3D data for planning and monitoring purposes, we intend to develop digital exhibits with thescanned data for local museums and schools to boost public awareness and hopefully lead toincreased preservation efforts.
Feature extraction
While documentation of site surfaces using lidar is quick and comprehensive, it is also the casethat much unnecessary data is often captured inadvertently. Common unwanted elements caninclude miscellaneous objects within or moving through the site (e.g. people or tools), moderninfrastructure, vegetation or graded earthworks. Since surface-generation processes are compu-tationally expensive, it is worth processing only specific data of interest.
For Inca-Caranqui, feature extraction processes were created to isolate particular subsets ofdata of archaeological interest. More specifically, we sought to label lidar points as belonging todiscrete groups representing features or parts thereof. This required ontological consideration ofhow lidar data, along with their characteristics and relationships, represent archaeologicalfeatures. The process involved the use of quantitative values of spatial location, spatial relation-ship and fused spectral data. Spatial location, represented by the 3D coordinates, was used togroup points close to one another. A spatial relationship value was then developed to capture the3D relationship of each point to its neighbours. This value could group points with similarneighbourhood characteristics, such as points belonging to planar regions, edges or corners.Spectral values, tested with three different colour spaces, were used to further differentiateamong nearby points having similar spatial relationship values. Using the spectral values, it waspossible, for example, to subset lidar points representing a worked stone, bare ground andvegetation, all in close vicinity and with the same planar orientation, into three separate groups.
To segment the lidar data, the mean shift cluster detection method was used (Comaniciu andMeer 2002). A major benefit of this method is that any number of groups can be found, instead ofthe specified number of anticipated groups required by alternative clustering methods. The mainparameter is a numerical ‘bandwidth’ distance, or search radius, for finding a local, multidimen-sional mean of nearby points around each datum. By iteratively finding the local mean aroundeach datum, moving the centre of analysis to that location and repeating, the process convergesnear a cluster centre, thereby associating each multidimensional point with a particular cluster orgroup. Since results vary depending on different bandwidth distances, we modified an existingsegmentation accuracy assessment technique developed by Hoover et al. (1996; also Foody 2002;Ortiz and Oliver 2006) for our study to obtain both quantitative and qualitative metrics forevaluating segmentation results (Romero 2010; Romero and Shortridge 2012).
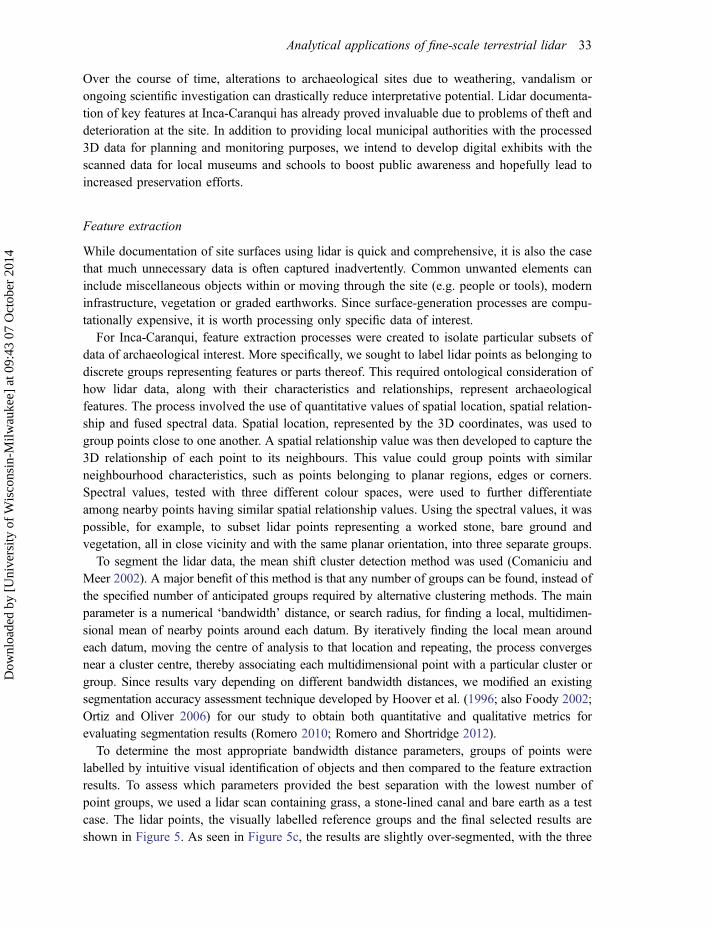
To determine the most appropriate bandwidth distance parameters, groups of points werelabelled by intuitive visual identification of objects and then compared to the feature extractionresults. To assess which parameters provided the best separation with the lowest number ofpoint groups, we used a lidar scan containing grass, a stone-lined canal and bare earth as a testcase. The lidar points, the visually labelled reference groups and the final selected results areshown in Figure 5. As seen in Figure 5c, the results are slightly over-segmented, with the three
Analytical applications of fine-scale terrestrial lidar 33
Dow
nloa
ded
by [
Uni
vers
ity o
f W
isco
nsin
-Milw
auke
e] a
t 09:
43 0
7 O
ctob
er 2
014
features of interest partitioning into multiple groups. However, there is little confusion betweenthe groups; in other words, their boundaries generally match the intuitively labelled groups (seeRomero 2010 for further discussion).
The feature-extraction process employed here resulted in subsets of archaeological featuresthat could then be used in subsequent stages of analysis. The process is not fully automated,however, and still requires the supervision and input of a knowledgeable analyst. With addi-tional research into the spatial and spectral relationships between particular features andcharacteristics, it may eventually prove possible to further streamline this process. For instance,with regard to spatial values, being able to distinguish between planar surfaces with different 3Dorientations as well as handling transitions of curved surfaces could prove helpful. Concerningspectral values, although some of the tested colour spaces were selected to remove the effects ofshadows, there are still reflectance issues arising from combining scans with colours fromdifferent times or perspectives. Focusing on these and other issues should eventually lead to arefinement of the feature-extraction processes necessary for detailed archaeological analyses.
Surface calibration
Once archaeological feature data were selected, surface-generation procedures were calibrated toachieve more accurate representations. Of particular interest to us were the hydrological featuresmentioned above. Given the varying sizes of these features, the calibration tests performed wereaimed at finding a balance between representing adequate surface detail and avoiding excessiveprocessing.
We learned during the importing and merging of data in the workflow process that five parametersgreatly affected the quality of the final surface representations (Romero 2012). During the importstage in which the interpolated grid was created, the parameters of greatest concern were: maximumangle,maximum edge length and interpolation step. Maximum angle refers to the angle between thelaser scanner and the surface normal. This angle can be specified to filter the lidar points and reducethe amount of bridging that occurs near feature edges caused by the interpolation of foreground andbackground surfaces. Maximum edge length refers to the length of the edges of the temporarytriangles created between lidar points. The interpolation step sets the distance at which the trianglesare sampled to create the interpolated grid. During the surface-merging stage leading to the creationof the final polygonal model, two additional parameters of concern were:maximum distance and thesurface sampling step. Maximum distance sets the distance at which interpolated grids are merged
Figure 5 Feature extraction from lidar data: (a) original lidar points fused with colour values; (b) threereference groups for accuracy assessment; (c) a selection of feature extraction results with point groupsrepresented by different tones (or different colours in the digital version of the article). Though slightlyover-segmented, combining particular groups in 5(c) can result in boundaries that nearly match those of thereference groups in 5(b).
34 Boleslo E. Romero and Tamara L. Bray
Dow
nloa
ded
by [
Uni
vers
ity o
f W
isco
nsin
-Milw
auke
e] a
t 09:
43 0
7 O
ctob
er 2
014
together. The surface-sampling step defines the distance used to sample the interpolated gridresulting in the final polygonal model. Other than the maximum angle, these parameter values arebasically scale dependent and relate to the sizes of the archaeological features involved.
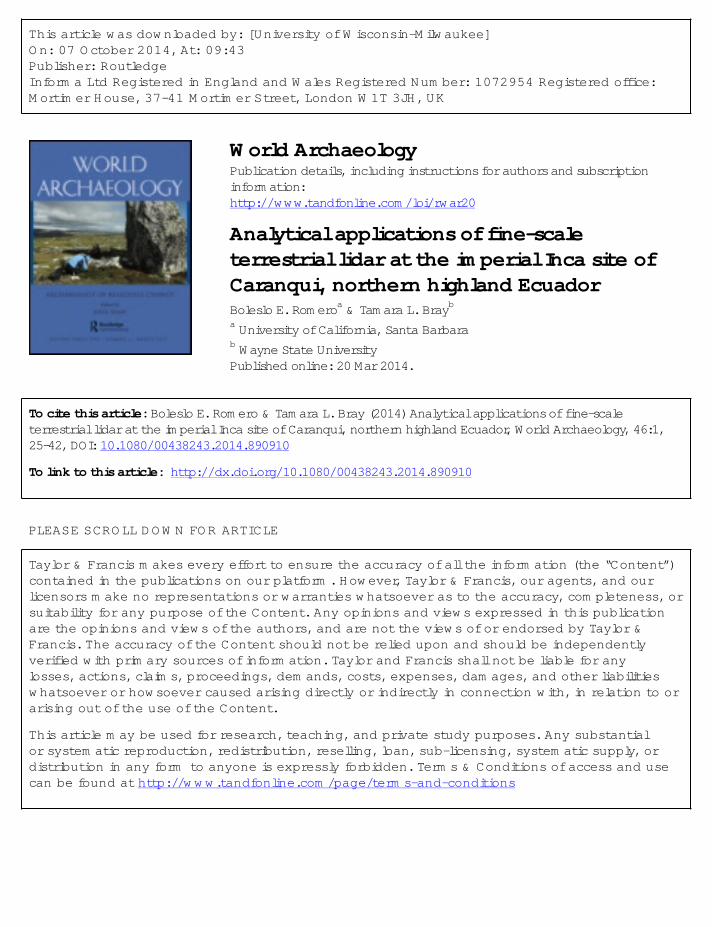
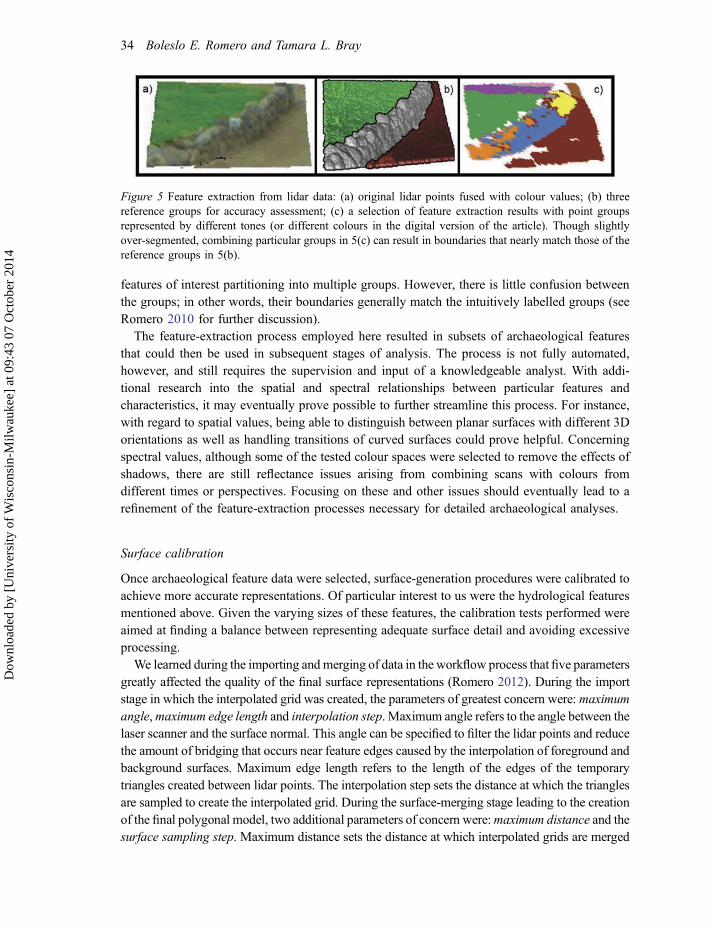
Three test values for each of these parameters were selected based on preliminary results. Allpermutations of parameter values were tested for each stage, though the best results from theimport stage were used to create data for the merging stage. Since no reference dataset of higherquality existed for an absolute accuracy assessment, selection of highest-quality results wasbased upon visual analysis of images exported from each stage. An image-sorting software,ImageSorter, version 4.3 (pixolution GmbH 2011), was used to more easily remove poor resultsbefore final comparisons were made. The results of the surface calibration tests are shown inFigure 6. Though they are not perfect representations, they provided enough coverage and sub-centimetre details for us to proceed with our analysis. Many of the worked stone surfaces, and
Figure 6 Surface calibration results for two water-related features associated with the semi-subterraneantemple at Inca-Caranqui. Photographs (top row) and final polygonal models (bottom row) for: a) stone-lined and capped Drain Canal (horizontally oriented) and stone-lined Southeast Canal (vertically oriented);b) carved-stone fountain in south-west stairway access.
Analytical applications of fine-scale terrestrial lidar 35
Dow
nloa
ded
by [
Uni
vers
ity o
f W
isco
nsin
-Milw
auke
e] a
t 09:
43 0
7 O
ctob
er 2
014
even some of their seams, were represented. Occluded areas and other gaps were filled withminor editing for visual purposes. These missing areas could have been filled automatically byassigning larger distance values to surface generation parameters. However, that would havedecreased the overall accuracy of the surface model. We deemed it more important to generatesurfaces as close as possible to the original lidar points while achieving broad enough coverageacross the site to undertake the hydrological study.
Hydrological analysis
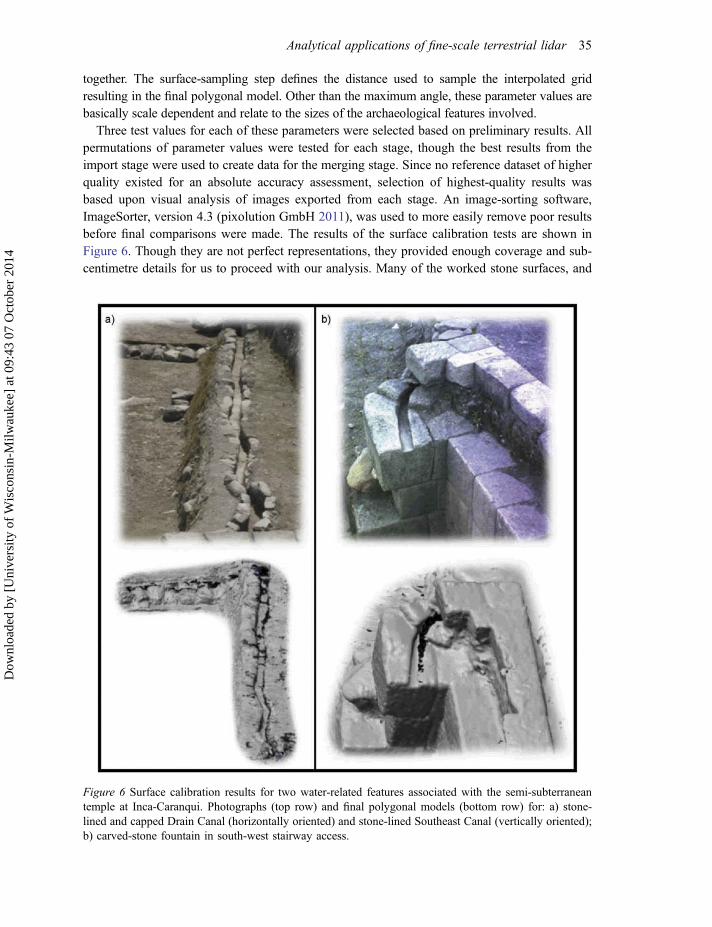
With the surfaces derived from the lidar datasets, one of our aims was to model water flowaround the central sector of Inca-Caranqui. Each of the activities discussed above providedrelevant information towards that goal. Flow directions were determined through measurementsof elevation and slope between points. Another beneficial aspect of the lidar scanning for ourhydrological analysis related to canal construction and the instrument’s ability to help usmeasure physically inaccessible locations. For instance, we were able to model some flowlines by scanning the interior bottom and sides of canals through small surface openings alongtheir course or through larger openings at their exposed ends. A good example of this usage canbe seen in the scan of a canal associated with the settling tank (Fig. 7).
Our preliminary map of hydraulic features and flow directions at Inca-Caranqui is shown inFigure 8. Though some flow directions were easily identified at the site, others were difficult todetermine due to shallow slopes or the deceptive effects of previous grading. Such difficultiesare exemplified by the central canal, which visually appears to be higher in the northern portionof the site and lower in the south. Our lidar scans and georeferencing, however, revealed that the
Figure 7 Canal exiting the west side of the settling tank: a) image showing lidar data with fused colourvalues from perspective of scanner; b) tilted view showing lidar data collected from interior floor and sidesof canal in darker, shadowed colours, which illustrates surface data collected in a location that was difficultto reach.
36 Boleslo E. Romero and Tamara L. Bray
Dow
nloa
ded
by [
Uni
vers
ity o
f W
isco
nsin
-Milw
auke
e] a
t 09:
43 0
7 O
ctob
er 2
014
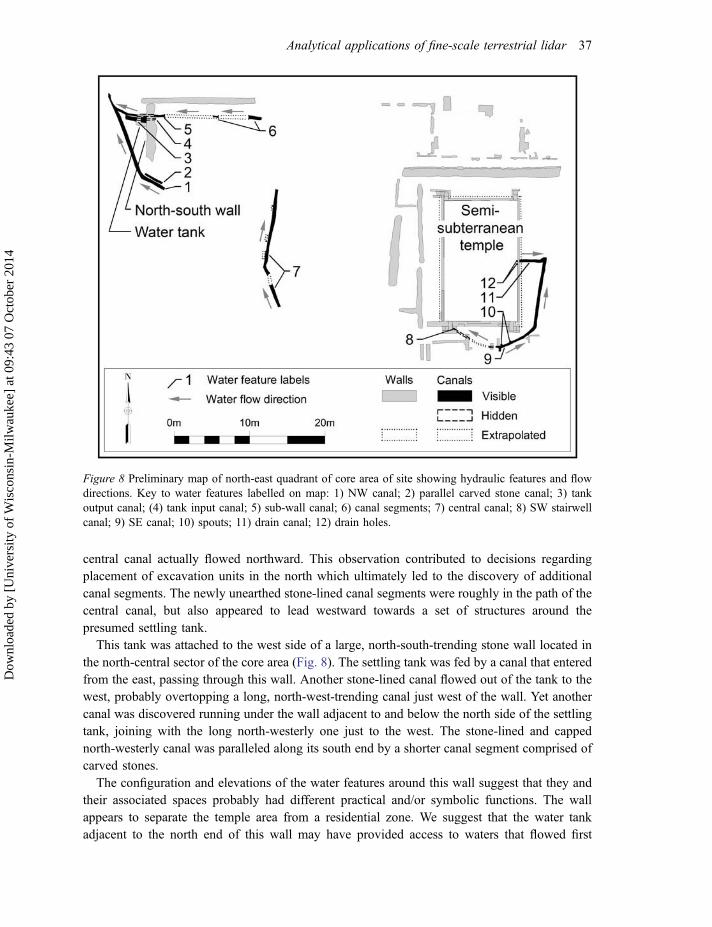
central canal actually flowed northward. This observation contributed to decisions regardingplacement of excavation units in the north which ultimately led to the discovery of additionalcanal segments. The newly unearthed stone-lined canal segments were roughly in the path of thecentral canal, but also appeared to lead westward towards a set of structures around thepresumed settling tank.
This tank was attached to the west side of a large, north-south-trending stone wall located inthe north-central sector of the core area (Fig. 8). The settling tank was fed by a canal that enteredfrom the east, passing through this wall. Another stone-lined canal flowed out of the tank to thewest, probably overtopping a long, north-west-trending canal just west of the wall. Yet anothercanal was discovered running under the wall adjacent to and below the north side of the settlingtank, joining with the long north-westerly one just to the west. The stone-lined and cappednorth-westerly canal was paralleled along its south end by a shorter canal segment comprised ofcarved stones.
The configuration and elevations of the water features around this wall suggest that they andtheir associated spaces probably had different practical and/or symbolic functions. The wallappears to separate the temple area from a residential zone. We suggest that the water tankadjacent to the north end of this wall may have provided access to waters that flowed first
Figure 8 Preliminary map of north-east quadrant of core area of site showing hydraulic features and flowdirections. Key to water features labelled on map: 1) NW canal; 2) parallel carved stone canal; 3) tankoutput canal; (4) tank input canal; 5) sub-wall canal; 6) canal segments; 7) central canal; 8) SW stairwellcanal; 9) SE canal; 10) spouts; 11) drain canal; 12) drain holes.
Analytical applications of fine-scale terrestrial lidar 37
Dow
nloa
ded
by [
Uni
vers
ity o
f W
isco
nsin
-Milw
auke
e] a
t 09:
43 0
7 O
ctob
er 2
014
through the temple sector to those in the residential zone. We determined that the canals thatfilled and drained the tank were separate from the two that unite just to the west of it. In additionto the fact that the water supplying the two sets of canals most likely derived from differentsources, it is also apparent that these canals flowed to different sectors of the site, suggestingthat they may have served different purposes or populations. With respect to the deeper set ofcanals associated with but not connected to the water tank, we posit that the two feeders mayhave supplied the north-westerly canal below the junction at alternate times.
We also leveraged the complementary aspects of manual observations, survey points and lidardata for our analysis. An example involved the canal located on the east side of the semi-subterranean temple associated with two carved holes in the stone floor. The flow direction ofthis canal was difficult to ascertain due to the fact that it was almost completely capped withstones. We were thus uncertain as to whether it was used for filling or draining the semi-subterranean structure. In addition to collecting total station points at both ends of this canal, wewere able to take non-destructive – and much easier to perform – manual flow line measure-ments inside the canal to tie to previously scanned surfaces. These data indicate that the canalwas nearly level, suggesting that it could have supported bi-directional flow. A measurementthrough the northern carved hole, however, revealed that the base of the canal was 40.5cmbelow the top surface of the temple floor. The depth of the canal relative to the floor, togetherwith the likelihood that it emptied into an historical acequia located immediately east, suggeststhat drainage may have been its primary function.
The mapped patterns of flow at the site indicate that water moved from source canals located tothe south-east of the semi-subterranean temple. The water carried by these canals was introducedinto the temple via the south side of the structure. Though the architecture in this area was not wellpreserved, we do have evidence that a junction divided and directed the flow to the east and westsides of the temple. The eastern branch was channelled into the long, stone-lined and cappedSoutheast Canal containing two spouts near its southern end. To the west, only minimal vestigesof the canal that would have carried the flow were present. However, it is clear that this wouldhave led to the still extant carved-stone fountain that poured into the access stairway in the south-west corner. All four corners of the semi-subterranean temple were supplied with access stairs,with the south-west corner being the best preserved. The lidar data helped us to ascertain that theinterior of the temple exhibited symmetry across the north-south axis. We thus posit that the south-east corner access stairs may have also originally been provided with a carved stone fountain thatcould have been fed by the spouts at the south end of the Southeast Canal.
The preliminary analysis of the Inca-Caranqui lidar scans discussed here provides thefoundation for a more comprehensive investigation and reconstruction of site structures andhydraulic flows in the future. The next phase of our study will involve measurement of canalcross-sections and volumes to better understand capacities, flow rates and pressures of thehydraulic system. These data will allow for more detailed and comprehensive comparisons withother imperial Inca sites where the manipulation of water was clearly important.
Conclusions
In this paper, our main aim was to explore the analytical potential of lidar data for site-levelarchaeological subjects using the imperial centre of Inca-Caranqui as our case study. Given the
38 Boleslo E. Romero and Tamara L. Bray
Dow
nloa
ded
by [
Uni
vers
ity o
f W
isco
nsin
-Milw
auke
e] a
t 09:
43 0
7 O
ctob
er 2
014
significance of water-related features at the site, we wanted to explore the utility of lidar forinvestigating water manipulation and flows. This led to a consideration of important issues relatingto archaeological feature extraction and surface generation. Utilizing both spatial and visual infor-mation, we developed 3D point cloud segmentation methods for extracting relevant feature data atthe site. With point groups representing particular features of interest, we addressed the challenge ofgenerating detailed surface models. Though our hydrological analysis is still preliminary, we wereable to ascertain flow directions, sequencing of flows and potentially segregated usages.
Since we were able to derive sufficient coverage and accuracy for our hydrological analysisvia the procedures described, we suggest that similar approaches may benefit other archaeolo-gical studies. We recognize, however, that appropriate parameters for selecting and modellinglidar data are feature dependent. Additional information that could benefit the future analysis ofsurface properties could include lidar intensity values, which might shed light on componentelements or physical processes at a given site (see, for instance, Bellian, Kerans, and Jennette2005; Brennan and Webster 2006). The rich spatial data generated by lidar can also supportanalysis of the semantic characteristics and relationships among features and site activities (see,for instance, Lorenzini 2009). To enhance the analytic utility of lidar within archaeology,developing general guidelines for the treatment of surface characteristics of archaeologicalobjects should be an important goal. This will require an integrated and collaborative approachon the part of people working with this technology.
Acknowledgements
Research at the site of Inca-Caranqui was conducted in collaboration with José Echeverría, andwith grants from the National Endowment for the Humanities, the Wenner-Gren Foundation, theNational Geographic Society and Dumbarton Oaks, whose support we gratefully acknowledge.We also greatly appreciate the cooperation and support of Dr Timothy Wawrzyzniec and JedFrechette, MS, for their guidance concerning terrestrial lidar data collection and processing, aswell as the University of New Mexico Lidar Lab, for generously providing the lidar equipment.
Funding
This work was supported by the National Endowment for the Humanities under Grant No. RZ-51107-09, the Wenner-Gren Foundation under Grant No. ICRG-86, the National GeographicSociety under Grant No. 8678–09, and a 2008 Dumbarton Oaks Project Grant. Any views,findings, conclusions or recommendations expressed in this article do not necessarily representthose of the National Endowment for the Humanities.
Boleslo E. RomeroUniversity of California, Santa Barbara
Tamara L. BrayWayne State University
Analytical applications of fine-scale terrestrial lidar 39
Dow
nloa
ded
by [
Uni
vers
ity o
f W
isco
nsin
-Milw
auke
e] a
t 09:
43 0
7 O
ctob
er 2
014
References
Athens, J. S. 1980. El proceso evolutivo de las sociedades complejas y la ocupación del período tardío-cara en los andes septentrionales del ecuador. Otavalo: Instituto Otavaleño de Antropología.
Bedoya, Á. 1979. “Ruinas arqueológicas en caranqui.” Boletín histórico 9–10: 152–57.
Bellian, J. A., C. Kerans, and D. C. Jennette 2005. “Digital Outcrop Models: Applications of TerrestrialScanning Lidar Technology in Stratigraphic Modeling.” Journal of Sedimentary Research 75 (2): 166–76.doi:10.2110/jsr.2005.013.
Bewley, R. H., S. P. Crutchley, and C. A. Shell 2005. “New Light on an Ancient Landscape: Lidar Surveyin the Stonehenge World Heritage Site.” Antiquity 79: 636–47.
Bray, T. L. 2003. Los efectos del imperio incaico en la frontera septentrional: Una investigaciónarqueológica. Quito: Abya-Yala Press.
Bray, T. L. 2008. “Chiefdoms of the Ecuadorian Highlands.” In Handbook of South AmericanArchaeology, edited by H. Silverman and W. H. Isbell, 527–43. New York: Kluwer Academic Publishers.
Bray, T. L. 2013. “Water, Ritual and Power in the Inca Empire.” Latin American Antiquity 24 (2): 164–90.doi:10.7183/1045-6635.24.2.164.
Bray, T. L., and J. Echeverría. 2009. “Saving the Palace of Atahualpa: The Late Imperial Site of Inca-Caranqui, Ecuador.” Accessed February 26, 2014. http://doaks.org/research/pre-columbian/pre-columbian-project-grant-reports-1/doaks-pco-project-grant-report-2008
Bray, T. L., and J. Echeverría. 2010. Informe anual para el proyecto “La arquitectura de poder:Investigaciones al sitio imperial tardío de Inca-Caranqui, Ibarra, Ecuador, Fase 2 (2009)”. NationalInstitute of Cultural Patrimony, Quito, Ecuador.
Bray, T. L., and J. Echeverría. 2011a. Informe anual para el proyecto “La arquitectura de poder:Investigaciones al sitio imperial tardío de Inca-Caranqui, Ibarra, Ecuador, Fase 3 (2010)”. NationalInstitute of Cultural Patrimony, Quito, Ecuador.
Bray, T. L., and J. Echeverría. 2011b. “Imperial Inca statecraft on the northern frontier: Recent investiga-tions at Inca-Caranqui.” Paper presented at the 76th annual meeting for the Society for AmericanArchaeology, Sacramento, CA, March 30–April 2.
Bray, T. L., and J. Echeverría. Forthcoming. “The Late Imperial Site of Inca-Caranqui, Northern HighlandEcuador: At the End of Empire.” Nawpa Pacha.
Brennan, R., and T. L. Webster 2006. “Object-Oriented Land Cover Classification of Lidar-DerivedSurfaces.” Canadian Journal of Remote Sensing 32 (2): 162–72. doi:10.5589/m06-015.
Chase, A. F., D. Z. Chase, J. F. Weishampel, J. B. Drake, R. L. Shrestha, K. Clint Slatton, J. J. Awe, and W.E. Carter 2011. “Airborne LiDAR, Archaeology, and the Ancient Maya Landscape at Caracol, Belize.”Journal of Archaeological Science 38: 387–98. doi:10.1016/j.jas.2010.09.018.
Comaniciu, D., and P. Meer 2002. “Mean Shift: A Robust Approach Toward Feature Space Analysis.”IEEE Transactions on Pattern Analysis and Machine Intelligence 24 (5): 603–19. doi:10.1109/34.1000236.
Devereux, B. J., G. S. Amable, P. Crow, and A. D. Cliff 2005. “The Potential of Airborne Lidar forDetection of Archaeological Features Under Woodland Canopies.” Antiquity 79: 648–60.
Entwistle, J. A., K. J. W. McCaffrey, and P. W. Abrahams 2009. “Three-Dimensional (3d) Visualisation:The Application of Terrestrial Laser Scanning in the Investigation of Historical Scottish FarmingTownships.” Journal of Archaeological Science 36 (3): 860–66. doi:10.1016/j.jas.2008.11.018.
Environmental Systems Research Institute (ESRI), and DeLorme 2012. ArcGIS Desktop, version 10.1, mapdata for World Countries, World Administrative Units, and World Latitude and Longitude Grids.
40 Boleslo E. Romero and Tamara L. Bray
Dow
nloa
ded
by [
Uni
vers
ity o
f W
isco
nsin
-Milw
auke
e] a
t 09:
43 0
7 O
ctob
er 2
014
Espinosa Soriano, W. 1983. Los caranquis y los cayambes: Siglos XV-XVI y el testimonio de la etnohis-toria. Otavalo: Instituto Otavaleño de Antropología.
Evans, A., M. L. Maxwell, and G. L. Cruikshanks 2013. “From Lidar to LSCM: Micro-Topographies ofArchaeological Finds.” In Interpreting Archaeological Topography, edited by R. S. Opitz and D. C.Cowley, 125–35. Oxford: Oxbow Books.
Foody, G. M. 2002. “Status of Land Cover Classification Accuracy Assessment.” Remote Sensing ofEnvironment 80: 185–201. doi:10.1016/S0034-4257(01)00295-4.
Fux, P., M. Sauerbier, T. Kersten, M. Lindstaedt, and H. Eisenbeiss 2009. “Perspectives and Contrasts:Documentation and Interpretation of the Petroglyphs of Chichictara Using Terrestrial Laser Scanning andImage-Based 3d Modeling.” In New Technologies for Archaeology: Multidisciplinary Investigations inPalpa and Nasca, Peru, edited by M. Reindel and G. A. Wagner, 359–78. Berlin: Springer-Verlag.
García Puchol, O., S. B. McClure, J. B. Senabre, F. Cotino Villa, and V. Porcelli 2013. “IncreasingContextual Information by Merging Existing Archaeological Data with State of the Art Laser Scanning inthe Prehistoric Funerary Deposit of Pastora Cave, Eastern Spain.” Journal of Archaeological Science 40(3): 1593–1601. doi:10.1016/j.jas.2012.10.015.
Grosman, L., O. Smikt, and U. Smilansky 2008. “On the Application of 3-d Scanning Technology for theDocumentation and Typology of Lithic Artifacts.” Journal of Archaeological Science 35 (12): 3101–10.doi:10.1016/j.jas.2008.06.011.
Hallett, K., Z. Roberts, S. Julien-Lees, and A. Geary 2008. “The de maiano roundels: An Analytical 3dDocumentation and Visualisation Study.” In Lasers in the Conservation of Art Works, edited by M.Castillejo, P. Moreno, M. Oujja, R. Radvan, and J. Ruiz, 413–8. London: CRC Press.
Harmon, J. M., M. P. Leone, S. D. Prince, and M. Snyder 2006. “Lidar for Archaeological LandscapeAnalysis: A Case Study of Two Eighteenth-Century Maryland Plantation Sites.” American Antiquity 71(4): 649–70. doi:10.2307/40035883.
Hoover, A., G. Jean-Baptiste, X. Jiang, P. J. Flynn, H. Bunke, D. B. Goldgof, K. Bowyer, D. W. Eggert, A.Fitzgibbon, and R. B. Fisher 1996. “An Experimental Comparison of Range Image SegmentationAlgorithms.” IEEE Transactions on Pattern Analysis and Machine Intelligence 18 (7): 673–89.doi:10.1109/34.506791.
InnovMetric. 2012. PolyWorks Software, Version 11. Accessed February 26, 2014. http://www.innov-metric.com/polyworks/3D-scanners/home.aspx?lang=en
Lambers, K., H. Eisenbeiss, M. Sauerbier, D. Kupferschmidt, T. Gaisecker, S. Sotoodeh, and T. Hanusch2007. “Combining Photogrammetry and Laser Scanning for the Recording and Modelling of the LateIntermediate Period Site of Pinchango Alto, Palpa, Peru.” Journal of Archaeological Science 34: 1702–12.doi:10.1016/j.jas.2006.12.008.
Larrain, H. 1980. Demografía y asentamientos indígenas en la sierra norte del ecuador en el siglo XVI.Otavalo: Instituto Otavaleño de Antropología.
Lerma, J. L., S. Navarro, M. Cabrelles, and V. Villaverde 2010. “Terrestrial Laser Scanning and CloseRange Photogrammetry for 3D Archaeological Documentation: The Upper Palaeolithic Cave of Parpalló asa Case Study.” Journal of Archaeological Science 37 (3): 499–507. doi:10.1016/j.jas.2009.10.011.
Lorenzini, M. 2009. “Semantic Approach to 3D Historical Reconstruction.” In 3D Virtual Reconstruction andVisualization of Complex Architectures, edited by F. Remondino, S. El-Hakim, and L. Gonzo. InternationalArchives of Photogrammetry, Remote Sensing and Spatial Information Sciences 38-5/W1, WG V/4. Trento,February 25–28. http://www.isprs.org/proceedings/XXXVIII/5-W1/pdf/lorenzini.pdf
Ortiz, A., and G. Oliver 2006. “On the Use of the Overlapping Area Matrix for Image SegmentationEvaluation: A Survey and new Performance Measures.” Pattern Recognition Letters 27: 1916–26.doi:10.1016/j.patrec.2006.05.002.
Analytical applications of fine-scale terrestrial lidar 41
Dow
nloa
ded
by [
Uni
vers
ity o
f W
isco
nsin
-Milw
auke
e] a
t 09:
43 0
7 O
ctob
er 2
014
Petrie, G., and C. K. Toth 2009. “Terrestrial Laser Scanners.” In Topographic Laser Ranging andScanning, edited by J. Shan and C. K. Toth, 87–128. Boca Raton, FL: CRC Press.
Pfeifer, N., and G. Mandlburger 2009. “LiDAR Data Filtering and DTM Generation.” In TopographicLaser Ranging and Scanning, edited by J. Shan and C. K. Toth, 307–34. Boca Raton, FL: CRC Press.
pixolution GmbH, and Kai-Uwe Barthel. 2011. ImageSorter Software, Version 4.3. Accessed February 26,2014. http://www.pixolution.de/index.php?id=18
Plaza Schuller, F. 1976. La incursion inca en el septentrion andino ecuatoriano. Otavalo: InstitutoOtavaleño de Antropología.
Remondino, F. 2008. “Digital Preservation, Documentation and Analysis of Heritage with Active andPassive Sensors.” In Lasers in the Conservation of Art Works, edited by M. Castillejo, P. Moreno, M.Oujja, R. Radvan, and J. Ruiz, 387–92. London: CRC Press.
Romero, B. 2010. “Toward the Detection of Landscape Features-Clustering 3D Points using Spatial andThematic Characteristics.” MS Thesis, Michigan State University.
Romero, B. 2012. “3D Modeling of an Inca Site with Fine-scale Terrestrial LiDAR.” Paper presented at theCartography and Geographical Information Science AutoCarto conference, Columbus, OH, September 16–18.
Romero, B., and A. Shortridge. 2012. “Geographical Feature Detection: Accuracy Assessment, Metrics,and Visual Analytics.” Poster presented at the seventh international conference for Geographic InformationScience, Columbus, OH, September 18–21.
Stanco, F., S. Battiato, and G. Gallo. 2011. Digital Imaging for Cultural Heritage Preservation: Analysis,Restoration, and Reconstruction of Ancient Artworks. London: CRC Press.
Boleslo Romero is a Ph.D. candidate in Geography at the University of California, SantaBarbara. His research focuses on geographic information science, spatial analysis, geographicaluncertainty, terrain modelling, remote sensing and geovisualization.
Tamara Bray is a professor of anthropology at Wayne State University in Detroit, Michigan.Her research focuses on the Inca Empire and archaeology of the Northern Andes
42 Boleslo E. Romero and Tamara L. Bray
Dow
nloa
ded
by [
Uni
vers
ity o
f W
isco
nsin
-Milw
auke
e] a
t 09:
43 0
7 O
ctob
er 2
014