Embed Size (px)
Citation preview

September 1977 NASA-CR-145234
N78-16102(NASA-CR-145234) ANALYTICAL AND EXPERIMENTAL STUDIES OF GRAPHITE-EPOXY AND BOROI-EPOXY ANGLE PLY LAMINATES IN
UnclasCOMPRESSION (Technion - Israel Inst of CSCL 11D G324 03308Tech) 66 p BC AOMF A01
Analytical and Experimental Studies
of Graphite-Epoxy and Boron-Epoxy
Angle Ply Laminates in Compression
by
T Weller
Prepared under Grant NSG-7083
for
Langley Research Center
National Aeronautics and Space Administration
httpsntrsnasagovsearchjspR=19780008159 2018-07-30T140652+0000Z
September 1977
Page No
Inside Cover
1
2
8
9
10
12
13
16
18
19
20
21
22
23
24
25
26
28
30
32
ERRATA NASA-CR-145234
line no
BARON to BORON remove period after 1977t
3finelasic to inelastic
21low to flaw
lunresonable to unreasonable 20
analytic-l to analytical 23
stiffer to stiff 28
stiffely to stiffly 2
expeienced to experienced 20
reffering to referring 22
11of to as 253 to 253x106 13
27correlations to correlation
regards to regard 3
wimilarly to similarly 29
1187 to I87xi06 15
invesrigated to investigated 10 niether to neither 20
Baron to Boron 1
Sen to Sept 3
1lxpoxy to Epoxy - Sep to Sept
11 145232 to 145231
-studies to Studies 1
inputs to input S alegorithms to algorithms 11
Provided to provided 1
uniformally to uniformly 3 Ibegining to beginning 22 adjecant to adjacent 22
remove three marks
-LE APA IA to TABLE APA A
l] to [8]
[14] to [13]
NASA-CR-145234
ANALYTICAL AND EXPERIMENTAL STUDIES OF GRAPHITE-EPOXY
AND BORON-EPOXY ANGLE-PLY LAMINATES IN COMPRESSION
by
T Weller
SEPTEMBER 1977
Prepared Under Grant NSG-7083
by
TECHNION-ISRAEL INSTITUTE OF TECHNOLOGY
DEPARTMENT OF AERONAUTICAL ENGINEERING
HAIFA 32000 - ISRAEL
for
LANGLEY RESEARCH CENTER
NATIONAL AERONAUTICS AND SPACE ADMINISTRATION
I
ABSTRACT
This report presents a study aimed at evaluating the applicability
and adequacy of the inelastic analyses of RDS[1] Sq5E8] N0NLIN [i0]amp[lI]
and N0LIN [1i] in predicting satisfactorily the nonlinearinelastic
response of angle ply laminates The analytical predictions are
correlated with the results of a test program on the inelastic response
under axial compression of a large variety of 3M SP-286T3 Graphite-
Epoxy and AVCO 550556 Boron-Epoxy angle ply laminates carried out
at NASA Langley Research Center [1] These comparison studies indicate
that neither of the abovementioned analyses can satisfactorily predict
either the mode of response or the ultimate stress value corresponding
to a particular angle ply laminateconfiguration Consequently also
the simple failure mechanisms assumed in the analytical models were
not verified
II
TABLE OF CONTENTS
I
TABLE OF CONTENTS II
LIST OF SYMBOLS IV
LIST OF FIGURES VI
Part 1 INTRODUCTION 1
Part 2 NUMERICAL STUDIES 2
Chapter 21 COMPUTER CODES 2
ABSTRACT
211 RDS-ULTIMATE [5] 2
212 SQS [8] 2
213 N0NLIN[10] 8 [11] 3
214 N0LIN [13] 3
Part 3 RESULTS AND DISCUiSION 4
Chapter 31 GRAPHITE-EPOXY LAMINATES (3M SP 286T3) 5
311 Unidirectional [00] Laminates 5 312 [ 150 Laminates 6 312 [ 50] Laminates 7
314 [ 450 ] Laminates 7
315 [ 600] Laminates 8
deg316 [ 75 J Laminates 9
317 900] Laminates 10
318 [790] Laminates 11
319 [O 45900] Laminates 10
Chapter 32 BORON-EPOXY LAMINATES (AVCO 550556 MIL
DIA) 12
deg 321 Unidirectional [O ] Laminates 12
322 [150] Laminates 13
323 [ 300] Laminates 14
324 [ 450] Laminates 15
325 [ 600] Laminates 16
326 [750] Laminates
327 [9001 Laminates 18
328 [ 090deg] Laminates 19
329 [ 0plusmn450900] Laminates 20
20Part 4 CONCLUSIONS
REFERENCES 22
24APPENDIX A
APPENDIX B 26
29
TABLE lA 28
TABLE 1B
30TABLE APA-IA
TABLE APA-iB 31
32 TABLE APA 2
AR
b I
Eli
E22
Ex
C12
EPSTO
EPST90
EPSCO
EPSC90
EPS45
SIGTO
SIGT90
SIGCO
SIGC90
SIG4S
TNUI2
CNU12
x y
U v 6
SULTI1 5ULT22
EULT12
Cx y a x yULTl1
0ULT22 aULT2
Vp2
x Vyx
IV
LIST OF SYMBOLS
Stress field aspect ratio
Coupdh stress field dimensions Fig APB 1
Lamina Young Modulus in the 11 fiber direction
Lamina Young Modulus in the transverse 22 direction
Laminate Young Modulus
Lamina Shear Modulus
[00] Lamina strain in tension
[90] Lamina strain in tension
[0] Lamina strain in compression
[900] Lamina strain in compression
[00] Lamina inplane strain in shear
[0deg] Lamina stress in tension
[9001 Lamina stress in tension
[0] Lamina stress in compression
[900] Lamina stress in compression
[00] Lamina inplane shear stress
Tension Poisson Ratio
Compression Poisson Ratio
Axial andtransverse coordinates respectively Fig APB 1
Displacements Fig APB 1
Axial end displacement Fig APB 1
Lamina ultimate strain in the 11 fiber direction
Lamina ultimate strain in the tranverse 22 direction
Lamina ultimate inplane shear strain
Laminate strains
Laminate stresses Laminalbngitudinal strength
Lamina transverse strength Lamina inplane shear stress
Lamina major Poisson Ratio
Laminate Poisson Ratio
-v
Note All Figures Are Read As Follows
A -A
RDS Prediction [5] RDS Predicted Ultimate Stress
V
TN0LIN
N0NLIN Prediction [10]amp[11
riber Failure
o N0LIN Prediction [13 - Q Max Stress Fail
Max Strain-Fail
UQuadratic Interaction Fail
Empirical Response of [1]
Tubes Nom Thick -Corresponding to tubes - Stress calculations based on laminate nominal thickness (number of plies times nominal ply thickness )
Tubes T Thick - Corresponding to tubes - stress calculations based on laminate true measured thickness
VI
LIST OF FIGURES
1A Youngs Modulus of 3M SP-286T3 Graphite-Epoxy Laminates As A Function Of Laminate Configuration
1B Youngs Modulus of AVCO 550556 Mil Dia Boron-Epoxy Laminates As A Function of Laminate Configuration
2A Ultimate Stress of 3M SP-286T3 Graphite-Epoxy Laminates As A Function of Laminate Configuration
2B Ultimate Stress of AVCO 550556 Mil Dia Boron-Epoxy Laminates As A Function of Laminate Configuration
3 Compression Response of [00] 3M SP-286T3 Graphite-Epoxy Laminates
4 Compression-Response of [plusmn150] 3M SP-286T3 Graphite Epoxy Laminates
5 Compression Response of [plusmn300] 3M SP-286T3 Graphite-Epoxy Laminates
6 Compression Response of [plusmn450] 3M SP-286T3 Graphite-Epoxy Laminates
7 Compression Response of [plusmn60] 3M SP-286T3 Graphite-Epoxy Laminates
8 Compression Response of [plusmn750] 3M SP-286T3 Graphite-Epoxy Laminates
9 Compression Response of [900] 3M SP-286T3 Graphite-Epoxy Laminates
10 Compression Response of [00900] 3M SP-286T3 Graphite-Epoxy Laminates
11 Compression Response of [00plusmn450900] 3M SP-286T3 Graphite-Epoxy Laminates
12 Compression Response of [00] AVCO 550556 Mil Dia Boron-Epoxy Laminates
13 Compression Response of [plusmn150] AVCO 550556 Mil Dia Boron-Epoxy Laminates
14A Compression Response of [plusmn300] AVCO550556 Mil Dia Boron-Epoxy Laminates (Batch I)
14B Compression Response of [plusmn300]AVCO 550556 Mil Dia Boron-Epoxy Laminates (Batch II)
15 Compression Response of [plusmn450] AVCO 550556 Mil Dia Boron-Epoxy Laminates
VII
16 Compression Response of [plusmn600] AVCO 550556 Mii Dia Boron-Epoxy Laminates
17 Compression Response of [plusmn750] AVCO 550556 Mil Dia Boron-Epoxy Laminates
18 Compression Response of [900] AVCO 550556 Mil Dia Boron-Epoxy Laminates
19 Compression Response of [009001 AVCO 550556 Mil Dia Boron-Epoxy Laminates
20 Compression Response of [0plusmn4590] AVCO 550556 Mil Dia Boron-Epoxy Laminates
APB I Coupon Under Uniform Axial Compression
APB 2 Min AR For Best Stress Distribution Along the Center Line of the Coupon
1 INTRODUCTION
The experimental results of an intensive test program carried
out at NASA Langley Research Center and aimed at studying the nonlinear
inelasic compression response of Graphite-Epoxy and Boron-Epoxy
laminates were reported in [1]
Advanced composites are increasingly being introduced into
the design of primary structural components of advanced aircraft and
space vehicles due to their high moduli and strength to density ratio
and particularly because of their tailoring capability to match
and resist any type of load introduction into the structure These
characteristics propose them as an excellent if not the number one
candidate for advanced optimized structures [2]
In spite of their outstanding performances the satisfactory
and advantageous application of composite materials is limited unless
there exist reliable analytical tools to predict and provide the
response and design allowables of any tailored laminate with full
confidence ie verified by ample experimental evidence
Theoretical studies include assumptions which can only be
postulated when they are based on sound experimental evidence and then
have to be verified experimentally As a matter of fact theoretical
studies were derived [3] through [13] but allof them lacked the
experimental background to justify both the assumptions made in their
derivation and their adequacy to predict the response of laminated
materials
In the present report the experimental studies of [i] are
correlated with the predictions of [s] [8] [lo] [lI] and [13]
and the adequacy for satisfactory application of these analytical
tools to generate and predict the response as well as strength
allowables of different laminate configurations is evaluated Some
of these analyses for example [5] [8] and [13] consider and account
for simplified failure criteria such as Max Stress Or Strain and
Quadratic Interaction Failure for the laminate and hence in the case
of good agreement with the empirical investigation of [1] might
2
allow for a better physical insight into failure mechanismr and
critical stress combinations which trigger failure of the laminate
Abrief description of the computer codes of [5] Es] [10] [11] and [13]
follows in the next section
2 NUMERICAL STUDIES
In the present numerical studies four computer codes were utilized to predict analytically the stress-strain response of the
variety of laminates tested and reported in El] These codes are
known as RD5 or ULTIMATE SQ5 N0NLIN and N0LIN and they are based on
the analyses of [S] [8] [I0][Ii] and [13] respectively The main
features of these programs follow
21 COMPUTER CODES
211 RDS - ULTIMATE[5]
Predicts the stress-strain response to ultimate failure for
a plane unisotropic laminate with mid-plane symmetry consisting of
orthotropic laminae with nonlinear stress-strain responses This
analysis assumes that any degradation occurring due to lamina yielding
or failure is restricted to that lamina and has no influence on the
adjacent laminae The technique of analysis requires the stressshy
strain responses of the individual unidirectional lamina This
information in conjuction with a generalized Hooks low provides the
laminate response In addition to the response the program furnishes
for each stage of loading the instantaneous stiffnesses and Poisson
ratios
212 SQS[8]
Provides the stress allowables for a particular laminate
based upon the maximum strain theory of failure It is based on a
coupled inplane and bending-point stress analysis of the laminate
The laminate constitutive equations are derived-from the laminae
constitutive relations Then it is used to determine the mid-plane
strains and curvatures arising from the inplane stress and moment
resultants These are then applied to determine the stresses and
strains in each layer of the laminate
3
213 N0NLIN[10]1[II]
This is a micromacro analysis utilizing the discrete finite
element method (DEM) to determine the nonlinear response of a laminate
subjected to inplane loading The inelastic effective properties of a
unidirectional rectangular and square arrays of elastic fibers
introduced into an inelastic matrix are generated with the aid of
the DEM method The obtained properties are then used on the macro
level in conjuction with an inelasticlaminate analysis The analysis
is based on an incremental plasticity theory and consequently is very
complicated relative to the other analyses The analysis does not
include any type of built-in failure mechanisms
214 N0LIN[13]
Generates the nonlinear stress-strain response of a symmetric laminate-under inplane loading by relating its behavior to the nonlinear
responses of the unidirectional laminae The nonlinear response of
the individual lamina is defined by a Ramberg-Osgood type of
representation and materialnoniinearities are represented by deformation
type theory As a starting point for its application the analysis
requires the input of the nonlineartransverse and inplane shear
responses of the bullunidirectional laminae Then the appropriate Ramberg-
Osgood parameters ate calculated to formulate an interaction expression
for simultaneous application of transverse and inplane shear stresses
The analysis predicts ultimate stress values corresponding to Max Stress Max Strain and Quadratic Interaction Fail oV-an individual lamina
Hence it assumes that lamina faiiure precipitates overall failure of
the laminate
The codes of [5] [8] and [13] require the existence of lamina
unidirectional stress-strain responses asvital informatioi for their
application Such information can be generated on a micro level
but is usually obtained experimentally In Appendix A the stressshy
strain responses corresponding to the unidirectional laminae of
3M SP-286T3 Graphite-Epoxy and AVCO 550556 Mil Dia Boron-Epoxy
which were the prepreged materials used to fabricate the specimens
of [1] are presented The tension responses were generated by SWRI
4
the manufacturer of the test specimens of [1] The compression and
shear responses were reproduced from the experimental responses yielded
by the [00] and [900] unidirectional laminates otf1] and [14]
3 RESULTS AND DISCUSSION
In Tables IA and lB experimental values of the ultimate stresses and
moduli incompression corresponding tothe laminates tested and reported
in [i] arerepresented together with the predicted values of the
analyses of [5] [8] [10] [il] and [13] (No values are given in
Table IA for N0NLIN [101ll1] because of lack of information both on
the fiber andmatrix material of 3M SP-286T3 This information is
required as data input for the application of this computer code)
In Fig IA the moduli observed for the Graphite-Epoxy laminates
(coupons) are correlated-with the predicted moduli by [8] and [13]
A similar comparison is shown in Fig 1B for the Boron-Epoxy laminates
(includingthe modulipredictedby Eo] liI]) Tables IA and 1B reveal thatthe
analyses of [81 and [is] yield identical moduli values whereas the analysis of
[5-predicts slightly but insignificantly different modulivalues
Consequently the comparisonspresented in Figs IA and IB also apply
to the analysis pf [5]
Tables 1A and lB reveal considerable differences among the
ultimate compression stresses predicted by the different analyses
The calculated ultimate strength values are compared with the empirical
ones of [1] in Fig 2A for the Graphite-Epoxy laminates and in-F ig
2B for the Boron-Epoxy ones Each of these figures consists of two
sub-figures one correlating the test results of [11with the analyses
of [S and [8] and the second with the predictions of [13] The
figures are presented in such a manner as to allow for better distinction
of the predicted ultimate values of [13] where three different such
values are yielded for each laminate corresponding to Max Stress
Max Strain and Quadratic Interaction modes of failure of the laminate
The results presented in Tables 1A and IB and Figs 1A IB
2A-and 2B will be discussed individually for each material and laminate
configuration when a particular laminate is being considered in the
following discussions and evaluations of analytical predictions vs
observed test results
5
Before proceeding with the discussion the following remarks
and comments on the presentation of Figs3 to 20 of this report
should be noted each figure consists of the test results reproduced
from [1] and the analytical predictions of RD515 N0NLIN [10][i11 (only
for Boron-Epoxy laminates) and N0LIN[13] The reproduced test results
include the response experienced by the coupons and two plots
corresponding to the tubes one when nominal thickness is considered
and designated Tubes Nom Thick in the figures and the second when
true measured thickness is accounted for and designated Tubes T
Thick in the figures
31 GRAPHITE-EPOXY LAMINATES (3M SP-286T3)
311 Unidirectional [00] Laminates
The experimental response of [1 ispresented together with
the predicted ones by RDS[5] and N0LIN[13] in Fig 3 As already
mentioned earlier the analyses of [5] and [13] require the unidirectional
[001 and [90O] lamina responses in tension compression and shear
as data input or rather data library for application of their computei
codes This type of information for the compression response was
extracted from the experimental compression response of the [00)
compression coupons of [1] Hence Fig 3 assists in evaluating the
capability of the computer codes RDS[5] and N0LIN[13] to reproduce the
stress-strain response of the [00] unidirectional lamina This of
course might affect the predicted responses of the angle ply laminates
and their correlation with the empirical responses of [i) It is shy
observed from Fig 3 that RDS reproduces excellently the compression
branch of the lamina whereas reproduction of the tension branch is
very good in the range of low stress-strain levels and becomes poorer
with increase in stress values displaying less nonlinearity than
that experienced by the coupons This nature of behavior depends
very much upon reproduction of the unidirectional [900] lamina response
in tension by RDS Fig 3 also reveals that the NJ0LIN code does not
reproduce so well either the lamina compression branch or its tension
branch This stems from the analysis of [13] which assumes a perfectly
elastic response of the lamina up to failure in the so called 11
direction ie fiber direction As already stated this might influence
6
the predicted responses of the angle ply laminates
It is seen from Table IA and Fig 1A that RDS yields an ultimate stress which is slightly higher than that experienced experimentally
(200ksi compared with 191ksi respectively) N0LIN Max Stress
and Quadratic Interaction Fail-predict-a lower stress value than
the experimental one 180ksi and N0LIN Max Strain Fail yields a
higher strength value than experienced brth experimentally and by RDS 209ksi This ultimate stress is also predicted by SQ5E8]
312 [plusmn150] Laminates
The experimental responses of ElI together with thepredicted ones[5] and [13] are shown in Fig 4 It appears from Fig 4 that
there is good agreement between RDS and N0LIN predictions as well
as very good correlation between the empirical compression branch
corresponding to the coupons and the theoretical predictions It is
also observed that once the true measured thickness of the tubes
is accounted for the tube compression-response correlates wellwith that experienced by the coupons however the true ultimate stresses
yielded by the tubes are significantly lower than those obtained for thecoupons (see alsoTable 1A) Fig 4 also reveals that there is
no correlation between the theoretical predictions of the tension
branch and the coupon tension branch The predictions display more
pronounced nonlinearity than do the coupons
Fig IA and Table IA indicate that the analyses of [5] [8]
and [13] yielded an identical modulus of 1324x106 psi which is slightly
lower than that of 1394x10 6 psi experienced by the coupons It is observed in Fig 2A and Table 1A that the ultimate stress predicted by SQS[8] is in excellent agreement with that yielded by the coupons
(117ksi) Also RSES] predicts an ultimate strength value of 105 ksi which is lower than that experienced by the coupons and in
very good agreement with N0LIN[13] Max Strain Fail (106ksi) It also appears that N0LIN QuadFail predicts a low strength value relative to
the coupons (929 ksi) and Max Stress yields a higher stress value
(140ksi) than that observed for th coupons As has already been stated earlier it is observed in Table lA that the tubes sustained a low
7
ultimate strength value independent of whether nominal or true
thickness is considered
313 [plusmn300] Laminates
The experimental responses of E1] as well as the predicted
ones are presented in Fig 5 It is observed that RDs[5] andNLIN[13]
predictions are in good agreement It appears that these predictions
display more pronounced nonlinearity and considerably lower strength
values (see Table lA) than those experienced experimentally by the
coupons It is also observed in this figure that once the true
thickness is being considered for the tubes their compression branch
of the response is in good agreement with the predicted ones However
very poor ultimate stresses are then experienced by them (see
Table 1A) Comparing the tension branch of the responses predicted
by the analyses with those experienced empirically it is seen that the tubes when true thickness is accounted for respond similarlyto the theoretical predictions whereas the coupons respond with acompletely different
behavior higher stiffness and not as much as pronounced nonlinearity
The results of Table 1A and Fig IA show that the analyses
yield identical moduli of 576x10 6 psi which are noticeably lower
than those experienced by both the coupons (687x06) and the tubes
(655xlO6 when true thickness is accounted for) Regarding the
ultimate stresses it is found that the coupons sustained appreciably
higher strength values (591 ksi) than were predicted by the analyses
487 by SQ518] 400 by RDS[5] and 434 376 4 288 by N0LIN[13]
Max Stress Max Strain and Quad Fail respectively Also the
strength experienced by the coupons is almost twice as high as that
yielded by the tubes
314 [plusmn45] Laminates
Fig 6 presents the empirical responses of [1] together with
those predicted by [5] and [13] This figure displays good agreement between the linear portion of the compressioh branches of the responses
predicted by the analyses and those experienced by the coupons and
tubes (when true thickness is being considered) It is observed
in this figure that N0LIN[13] predicts significantly less pronounced
8
-nonlinearity than RDS and correlates well with the response
corresponding to the tubes (true thickness) It is also seen
from this figure that the coupons experienced a significantly higher
compression stressing and straining capacity than was predicted by
the analyses The compression response of the tubes when nominal
thickness is considered behaves very similarly to that of the coupons
exhibiting however adonsiderably lower strength value (see Table IA)
Comparing the predicted and empirical tension branches of the responses
it is seen that they display a similar behavior to that already
experienced and discussed for the compression branches
It appears from Table IA and Fig 1A that the analyses predict
a modulus of 204x106 psi which is noticeably lower than the 227x106
experienced by the coupons Also Table lA and Figs 2A and 6 indicate
-that the coupons experienced considerably higher ultimate stresses
(382 ksi) than were predicted by the analyses a maximum value of
313 by RD5[5] and a minimum of 162 by N0LIN Max Stress Note
that Table 1A includes two values for RDS 313 ksi and (60)+ The
second value of 60 defines theultimate stress according to the
computer code of this analysis however this stress value is associated
with very high unresonable and unacceptable strain values The
stress of 313 generated by the computer code was found to be the
last one corresponding to acceptable strain values It is also seen
from Table 1A that the ultimate stress corresponding to the tubes
is close to that predicted by RD5[5] when nominal thickness is
considered and to that yielded by SQ5[81 when true thickness i
accounted for
315 [plusmn600] Laminates
The responses of [1] and those predicted by the analyses of
[5] and [13] are shown in Fig 7 It is seen from this figure that
the responses predicted by the analyses are slightly and insignificantly
different and correlate fairly well with the response experienced by
the coupons However the coupons display considerably higher stressing
and straining capability both in compression and tens-ion than do
the analytical predictions It is also observed in this figure
9
that the compression branch of the response corresponding to the tubes
when true thickness is accounted for correlates very well with the analytical predictions- Good agreement of the tension branch
corresponding to the tubes with the numerical studies is also found
Fig 1A and Table 1A indicate a predicted modulus of 161xl06psi
by SQ5[8] and N0LIN[13] which is slightly higher than 158x106 yielded
by RDS[5] These moduli values are noticeably lower than 172x106
experienced by the coupons and 179x106 obtained for the tubes (true
thickness) As mentioned already above in the discussion on Fig 7
the predicted ultimate stresses are considerably lower than those
experienced by the coupons (see Table 1A and Fig 2A) It is found
in Table 1A that the coupons sustained a strength value of 376 ksi
compared with the highest ultimate value of 308 predicted by SQS[8]
and the lowest value of 195 yielded by N0LIN Max Stress [is]
It is also observed in this Table that the tubes when nominal thickness
is being considered experienced higher ultimate stresses than those
predicted analytically -However once their true thickness is taken
into account they experience a strength of 221 ksi which is in very
good agreement with 223 and 233 ksi calculated with N0LIN Max Strain and Quad Fail respectivelyand with 238 ksi predicted by RDS5]
316 [plusmn750] Laminates
The experimental responses of [i] are displayed together
with the analyticl predictions of [5] and [1s] in fig 8 Good
correlation is observed in Fig 8 between the prediction of N0LIN[13]
and the response experiencedby the coupons Good agreement is also obseived between the prediction of RDS[5] and N0LIN[13] in the low stressshy
strain range while with increase in stress RD5 responds less
nonlinearly than does N0LIN This discussion also applies to comparison
of the RDS prediction with the coupon response It is also seen from
this figure that the tubes (nominal thickness) respond very similarly
to the analytical predictions and the coupons experiencing however
considerably low stress-strain values relative to either the coupons
or analytical predictions (see Table 1A)
10
Comparing the moduli predicted by the analyses it is seen
from Table IA and Fig IA that SQS[8J and N0LIN[13] yielddd an identical
modulus of 181x10 6 psi which is slightly higher than 175x106
These moduli values are lower than 191x106
calculated with RDS[5]
experienced by the coupons and in very good agreement with 175x106
yielded by the tubes when nominal thickness is being considered
Once true thickness is accounted for very poor correlation with
analytical predictions is found (120x06) It is observed in Fig 2A
and Table 1A that the empirical ultimate stress of 360 ksi experienced
by the coupons is in good agreement with 375 yielded by RDS[5] and
325 predicted by N0LIN Max Stress and Max Strain [13] SQ5[8]
is found to predict a considerably high stress of 489 ksi and N0LIN
QuadFail a relatively low stress of 298 ksi The tubes appear
to sustain considerably low stress Values (214 ksi for nominal
thickness)i
317 1 190] Laminates
Like for the [0] laminates the experimental responses of
this laminate configuration are utilized as data input for the computer
codes of the different analyses [5] [8] nd [13] Uence evaluation
of the empirical responses of [1] which are presented in-Fig 9
together with the predicted or rather reproduced ones indicate the-degree
of effectiveness of the analytical models on which the computer codes
are based at least in reproducing the data input Very good agreement
is observed between N0LIN [13] and the experimental response experienced
by the coupons RD5[5] is seen to follow the empirical response in
the range of low stress-strain levels but with increase in stress
values displays less nonlinearity than either the coupons or N0LIN
It is also seen from Fig 9 as well as Table 1A that the tubes
experience considerably lower stress-strain values and a less stiffer
compression response relative to the coupons
Table 1A reveals that RDS[5] predicts a modulus of 184xlO6psi
which is slightly lower than that of 191x106 experienced by the
coupons Fig 2A and Table IA indicate very good-agreement between
the strength of 344 ksi yielded by the coupons and 350 by RDS
11
good correlation with N0LIN[13] predictions 320 332 amp 320 ksi
for Max Stress Max Strain and Quad Fail respectively and no
correlation with SQS[8] ultimate stress of 478 ksi
318 [00900] Laminates
Fig 10 presents the empirical responses of [I] and those
predicted by the analyses It is observed that in the region
corresponding to low stress-strain values there is very good correlation
between the analyses and the empirical compression branch-corresponding
to the coupons However with increase in stress-strain values the
response of RDS[5] deviates slightly from the empirical one while
that predicted by N0LIN[13] becomes pronouncedly nonlinear This
behavior of N0LIN might be explained by recalling the nature of
reproduction observed earlier in Fig 3 for the [0deg] unidirectional
laminate It is also seen from this figure that the analytical predicted
tension branches are stiffer than the tension response displayed by
the coupons However RDS agrees better than N0LIN with the test
results
Table 1A and Fig IA revealvery good correlation of the 882x10 6
empiricalmodulus of 879x106 psi with the calculated ones
by SQS[81 and N0LIN[13] and 899xl06 by RDS[S] Table IA and Fig 2A
indicate that the ultimate stresses predicted by RD5 SQ5 and N0LIN
Max Strain 110 115 and 112 ksi respectively are in very good
agreement with 115 ksi experienced by the coupons The stress of
107 ksi yielded by N0LIN Quad Fail is in good agreement with
the test results and that corresponding to Max Stress 962 ksi
is appreciably lower It is found from Table 1A and Figs 2A and 10
that the tubes sustained very low stress-strain values relative to
either the coupons or analytical predictions
319 100plusmn45090 deg1 Laminates
The experimental responses of [1] together with thb analytical
predictions are shown in Fig 11 It is observed that RDS[5] correlates
well with N0LIN[13] displaying very good agreement for low and moderate
stress-strain levels Fig 11 also displays good agreement between
the response experienced by the coupons and the analytical predicted
12
responses However the coupon response appears to-behave to some extent less nonlinearly and more stiffely than predicted (see Table IA and Pig IA) It is also observed in this figure that the tubes
(nominal thickness) respond similarly to the coupons but sustain very
low stresses (see Table IA)
Fig 1A and Table 1A indicate that SQ5[8] and N0LIN[131
predict a modulus of 632x106 psi which is lower than 642x106 predicted
by RDS[5] and 674 experienced by the coupons It also appears from
Table 1A and Fig 2A that the coupons sustained a considerably higher
ultimate stress (978 ksi) than that predicted by the analyses (850 ksi
by RDS 821 by SQ5 and 687 792 and 648 by N0LIN Max Stress
Max Strain and Quad Fail respectively)
32 BORON-EPOXY LAMINATES (AVCO 550556 MIL DIA)
In additionto the analyses of [5] [8] and [131 the empirical
results of [1] corresponding to this material are compared with the
predicted response by the analysis of [io]amp[ii] The results yielded
by the computer code of this analysis N0NLII should not however
be treated with the same degree of confidence as those of the other
analyses because the data input for thematrixmaterial of this composite
required in the analysis was not provided Hence available information
about the matrix reported in-the literature [10] was adopted Also 4note that no ultimate stress values appear either in Table lB or
Fig 2B because the analysis of [io]amp[Ii] does not predict ultimate
stresses except for the case when the fibers in any of the laminae
reach their assigned strength values
321 Unidirectional [00] Laminates
Like in the case of the unidirectional [0o Graphite-Epoxy
laminates the reproduction capability of the computer codes are again
evaluated The empirical response of [i] together with the reproduced ones are presented in Fig 12 It is observed that the compression
branch of RDS[5] correlates very well with the experiments except
in the neighbourhood of ultimate stress values N0LIN[13] deviates
slightly from the empirical one at high stress-strain levels because
as already mentioned earlier it does not allow for nonlinear behavior
13
in the 11 fiber direction and N0NLIN[10]amp[I1] isseen to bd in very
godd agreement with N0LIN The tension branch of RDS and N0LIN are
almost identical and agree with the coupon response except for high
stress-strain levels when they display less nonlinearity than that
experienced by the coupons The tension branch of N0NLIN is observed to
exhibit less nonlinear effects than either RDS or N0LIN
Table 1B and Fig 2B reveal very good agreement between the
experimental ultimate stress 342ksi and the strength predicted
by RDS[5 and N0LIN Max Stress and Quad Fail [13] 340 ksi by
all of the three SQ5 and N0LIN Max Strain are observed to yield
a slightly higher strength than that experienced empirically 353 ksi
It is seen from Table 1B and Fig IB that except forN0NLIN all the
analyses predict the experimental modulus of 3127xlO6 pstN0NLINyields 0 6 a slightly lower modulus of 3120x106
322 [plusmn150] Laminates
Fig 13 presents the experimental responses of [1] and the
predicted ones It is observed that all of the analyses predict almost
identical compression branches which are in very good agreement
with the response yielded by the coupons-for low stress-strain values
and that expeienced by the tubes when true thickness is accounted
for With increase in stress-strain values the coupons respond more
nonlinearly than predicted by the analyses Also RD51] displays
more nonlinear behavior than N0NLIN[10][II]andN0LIN[l3] Reffering
to the tension branch of the responses it appears that neither of
the predicted responses agrees with the experimental responses
Very good correlation is observed between RD5 and N0LIN in the low
stressstrain range whereas with increase in stress-strain levels
N0LIN displays slightly more pronounced nonlinear behavior At very
high stress values this behavior inverts and RDS displays very strong
nonlinear effects N0NLIN is seen to respond more linearly but
less stiffly than either RDS or N0LIN except for high stress values
where an opposite trend is observed
It is seen from Table 1B and Fig 1B that RDS[S] SQ5[8] and
N0LIN[13] yield a modulus of 2526x106 psi which is slightly higher
14
than 2496x106 predicted by N0NLIN [10]4[II] and also higher than
2365x106 experienced by the coupons Table IB and Fig 2B reveal
good agreement between the ultimate stress of 139 ksi experienced
by the coupons and 133 predicted by SQS[8] Also the strength
of 150 ksi yielded by RDS[5] correlates well with that sustained by
the coupons It is seen in Table IB that only one strength value
was predicted by N0LIN This ultimate strength value of 104 ksi is
appreciably lower than the empirical one Onlyone value was obtained
due to the fact that it was impossible to achieve convergence of the
solution with the algorithm which solves the nonlinear equations of
this computer code It is found from Table 1B Fig 2B and Fig 13
that the tubes sustained very low ultimate stresses relative to either
the -coupons or the analytical predictions
323 [plusmn3001 Laminates
It wasreported in [1] that two batches of coupons were
manufactured and delivered for testing for this type of laminate
configuration and when tested they displayed completely different
responses Hencethe empirical response corresponding to each
batch is presented separately together with the responses predicted
by the analyses in Figs 14A and 14B Fig 14B reveals immediately
that there is no correlation betweenthe analyses and the response
experienced by the coupons and as such wont be discussed any further
Fig 14A displays very good agreement between the compression branch
experienced by the coupons and that corresponding to the tubes when
nominal thickness is considered However it is observed in this
figure as well as TablelB that the tubes experienced very low ultimate
stresses relative to the coupons Referring to the tension branch
of the experimental responses it is observed that the coupons and
tubes respond completely differently one frot another It appears
from Fig 14A that the analytical predictions agree one with another
only in the very low stress-strain range At a stress level of about
200 ksi which corresponds to the ultimate stress of the tubes when
true thitkness is accounted for N0LIN[13] response deviates from
the responses predicted by RDS[S] and N0NLIN [10][Iil while displaying
initiation of pronounced nonlinearity At a stress level of about shy
15
350 ksi a similar behavior is observed for the response of RDS which
deviates from N0NLIN and also displays initiation of pronounced shy
nonlinearity The above discussion applies to both the compression
and tension branches of the analytical predictions Correlation of
the predicted responses with the empirical ones indicates fair
agreement with the response yielded by the tubes (nominal thickness)
No correlation is observed with the response experienced by the coupons
This is rather emphasized in the pronounced nonlinear region of the
responses where the coupons display a very high stressing and straining
capacity realtive to the analyses of RDS and NOLIN The mode of the
response predicted by N0NLIN is observed to differ from that corresponding
to the coupons as it displays less stiff behavior in the range of
stresses corresponding to the almost linear response of the coupons
andweak nonlinearbehavior in the range of high stresses which is
associated with the pronounced nonlinear behavior of the coupons
It appears from Table lB and Fig IB that the coupons experienced
a modulus of 1098xi06 psi which is noticeably higher than 923xl06
predicted by RD55] SQSE8] and N0LIN[13] It is also found that
N0NLIN [10amp][II] predicted an even lower modulus of 887x106 psi
As already discussed above and as can be seen from Table 1B and Fig 2B
the analyses predict ultimate stresses which are significantly lower
than 589 ksi sustained by the coupons It is also observed in Table IB
that no ultimate stress was generated by RDS[5] (The last stress
value corresponding to acceptable strains is 425 ksi and above this
stress the calculated stresses are associated with unacceptable strain
values)
324 [plusmn450] Laminates
Fig 15 presents the experimental responses of [1] together
with thepredicted ones In the range of low stress-strain values
good correlation is found for the tubes (true thickness) with the
analytical predictions but with increase in stress-strain values the
analyses of RDS[S] and N0LIN[13] predicted more pronounced nonlinear
behavior than that experienced by the tubes whereas N0NLIN [10][11]
displays less emphasized nonlinear behavior and also displays a tendency
16
to follow the response experienced by the tubes when nominal thickness
is considered No correlation between the response experienced by
the coupons-and either of the predicted responses is observed in Fig 15
The coupons are found to sustain a considerably higher stress-strain
capacity than that predicted analytically (see also Table 1B and
Fig 2B) This is also observed to be true when correlating either
representation of the responses experienced by the tubes with the
predicted responses in spite of the fact that the tubes display a
considerably low stressing capacity relative to the coupons (Note
that the straining capability of the tubes ts of the samemagnitude
of that experienced by the coupons)
Fig 1B and Table 1B indicate that N0NLIN [10][l1] predicts a modulus of 257x106 psi whichis in very good agreement with 253
experienced by the coupons RDS[5] SQ5[8j and N0LIN[1SI yield a
lower modulus of 246x1066 which is in good agreement with 239x106
experienced by the tubes (truethickness)
Comparing the ultimate stresses predicted by the different
analyses with the empirical strength values experienced by the coupons
it is found from Table lB and Fig 2B that SQ5[8] predicts a strength
of 356 ksi which is in very good agreement with 351 experienced
by the coupons N0LIN[13] yields very low strength values which are even considerably lower than those experienced by the tubes RD5[53
again generates meaningless stresses (see discussion above on the
[plusmn300] laminates)
325 [plusmn600] Laminates
The empirical responses of [1]together with the predicted
onesare presented in Fig 16 Poor correlations is observed among
the responses predicted by the different-analyses Fig 16 displays
good agreement between the responses experienced by the tubes (true
thickness) and the coupons however the coupons exhibit appreciably
higher stressing and straining capability than do the tubes Also it
is observed in this figure that N0NLIN [1o]h[i1] correlates well with
the experimental responses except for high stress levels where it
predicts less nonlinear behavior than that observed experimentally
17
It is observed in Fig 16 that in the range of low ttresses and
strains the response of N0LIN[131 also agrees with the empirical
responses however at a very low stress of about 100 ksi it deviates
from the empirical one and displays strong nonlinear behavior As
can be seen from Fig 16 this results in a considerably lower stressing and
straining capability relative to the coupons Correlating the response
predicted by RDS[S] with the experimental ones itisobserved inFig 16
that its response is stiffer and less nonlinear than that observed
for the coupons
Table 1B-and Fig lB indicate that RDS[5] SQS8] and N0LIN[13]
yield a modulus of 221x106 psi which is noticeably higher than 184x106
predicted by N0NLIN [101amp[111 These moduli are higher than 162x106
observed for the coupons
Comparing the ultimate stresses predicted by the different
analyses with the experimental strength values it is seen from
Table IB and Fig 2B that SQ5[8] predicts a high strength of 500 ksi
compared with 318 experienced by the coupons whereas N0LIN[131
predicts relatively low strength values 173 for Max Stress 180
for Max Strain and 205 ksi for Quad Fail No ultimate was generated degby RD5 (see discussion on [plusmn30 ] laminates) It appears from Table lB
and Figs 2B and 16 that the tubes (nominal thickness) yielded the
highest ultimate stress for this particular laminate
326 [plusmn750] Laminates
Fig 17 presents the experimental response of [I] together
with the predicted ones No agreement among the different predicted
responses is observed in this figure Good agreement between the
compression branch corresponding to the coupons and RDS[S] is observed
very good correlation in the almost linear range of response whereas
with increase in stress RDS responds less nonlinearly than do the
coupons Good agreement of N0LIN[13] response with the coupons is
also observed in Fig 17 in the range of low stresses and strains
(linear range) however with increase in stresses the response of
N0LIN deviates from the empirical one while displaying an appreciably
more pronounced nonlinear response The response predicted by N0NLIN
18
[101[111] is observed to display more emphasized nonlinear behavior
than N0LIN and does not agree with either the experimental response
or RDS and NOLIN predictions In regards to the tension branch of
the responses it is observed in Fig 17 that there is good agreement
among the different analyses and between the analyses and experimental
response (Note that tubes are not presented in the present evaluation
See [i)
Table iB and Fig iB indicate that the experimental modulus of 279x106 is in very good agreement with 276x106 calculated with
RDS SQ5 and N0LIN N0NLIN is found to predict a lower modulus of
197x106 psi It appears from Table lB and Fig 2B that the empirical
ultimate stress of 348 ksi is considerably lower than 446 predicted
by SQS[8] and is in good agreement with the strength value of 319
yielded by N0LIN Max Stress [13] N0LIN Max Strain and Quad Fail
are found to predict low ultimate stress values 264 and 285 ksi
respectively Again like for the [plusmn30 deg] laminate no ultimate stress
was predicted by RDS[S]
327 [900] Laminates
As with the IoV] unidirectional laminates the reproduction
capability of the different computer codes is evaluated In Fig 18
the empirical responses of [1] are presented with the predicted-ones
It is observed that in the range of moderate stress-strain levels
reproduction by both RDS[S] and N0LIN[13] is very good With increase
in stress levels both predictions deviate from the empirical response
experienced by the coupons while displaying a less nonlinear behavior
than that observed for the coupons a trend which is more emphasized
for N0LIN It is also observed in this figure that there is good
agreement between the experimental responses corresponding to the
tubes (nominal thickness) and coupons however the tubes sustain
a considerably lower ultimate stress than that experienced by the
coupons (see also Table IB) Referring to N0NLIN response [101amp[111]
it is seen from Fig 18 that this analysis predicts an appreciably
lower stressing capacity than that observed for the coupons and
predicted by the other analyses This response is found to be in very
19
good agreement with that experienced by the tubes when true thickness
is accounted for Comparing the tension branch of-the-predicted responses as
well as theeihpirical ones of Fig 18 very good agreement is found
It appears from Table IB and Fig IB that RD51J SQ5[8] and
N0LIN[13] reproduce the modulus of 298x106 psi experienced by the
coupons whereas N0NLIN [0]0[i11] predicts a considerably lower modulus 6of205xlO Comparing the ultimate stresses yielded by the different
analyses with the empirical ones it is found from Table lB and Fig
2B that the stresses of 320 ksi predicted by NOLIN Max Stress and
Quad Fail are in very good agreement with 317 experienced by the
coupons Good correlation is also observed between the empirical
stress and 341 ks predicted by N0LIN Max Strain It is also observed
in Table lB that RD5 yields a similar stress of 340 ksi for the last
acceptable-strain value
328 [00900] Laminates
The experimental responses of [1] and the ones predicted by
the analyses are presented in Fig 19 Comparison of the analytical
predictions with the response experienced by the coupons reveals very
good agreement between the empirical response and RD[51] as well as
very good agreement with the predictions of N0NLIN [101amp[11] and N0LIN[13]
in the range of moderate stress-strain values With increase in stressshy
strain levels N0NLIN and N0LIN which predict almost identical responses
display some minor nonlinear behavior which is hot observed for the
coupons Note that N0NLIN and N0LIN yield strength values which are
in good agreement with that predicted by the coupons whereas RDS
yields an appreciably lower stress (see Table lB and Fig 2B) It
is also observed in Fig 19 that once the true thickness of the
tubes is accounted for they respond wimilarly to the coupons but
fail at a considerably lower strength value (see Table iB)
It is found from Table 1B and Fig lB that N0NLIN yields the
lowest modulus 1667x106 psi N0LIN and SQ5 predict a modulus of
1715xlO6 which is in very good agreement with the empirical one of 6 6
1717x10 and RUB yields a slightly higher modulus of 1721x10
20
Table 1B and Fig 2B indicate very good agreement between
the strength of 230 ksi observed for the coupons and 220 yielded
by N0NLIN Also it is observed that all other analyses predict lower
ultimate stress values than that experienced by the coupons
deg329 [0degplusmn45090 1 Laminates
In Fig 20 the experimental responses of [1] are shown together
with the ones predicted by the analyses Very good agreement is observed
between the response yielded by the coupons and those predicted by
the analyses in particular the one calculated with N0NLIN [10311]
No correlation is observed in Fig 20 between the response observed
for the coupons and either version of the responses experienced by
the tubes
It is seen from Fig IB and Table IB that N0NLIN predicts a 6 6moIulus of 162x10 psi which isslightlyhigher than l147x10
experienced by the coupons and -slightly lower than 1187 yielded by
either SQ518] or N0LIN[3I] and i192xlO predicted by RDS[5]
Comparing the ultimate stresses experienced empirically and those
-predicted analytically it appears from Table 1B and Fig 2B that
N0NLIN strength of 141 ksi is in good agreement with 158 ksi bserved
for the coupons whereas N0LIN[13] in spite of its very good ageement
with the coupons mentioned above yields a stress of 125 ksi fQoMax
Strain and lower stresses of 121 and 113 ksi for Max Stress and
Quad Fail respectively It is also observed that RDS[S] predicts a
noticeably lower ultimate of 130 ksi and SQ5[8] a strength of 134
4 CONCLUSIONS
(a) None of the analyses namely RD[51] SQ5[8] N0NLIN[10][l1]
and N0LIN[13] utilized in the present comparison studies is
found to be adequate to predict satisfactorily the compression
response of angle-ply laminates
(b) As mentioned in the text of this report the responses corresponding to the unidirectional laminates which were experienced
by-the compression coupons of [l]were utilized as data input
for thecomputer codes RDS SQ5 and N0LIN It is observed from
21
the present comparison studies for the angle-ply laminates that
in spite of this the predicted response with these codes do not
favor the responses experienced by the coupons better than the
ones observed for the tubes For some laminate configurations
better correlation is observed with the responses yielded by
the tubes
(c) Present numerical studies indicate that no unique compression
responses were predicted by the various analyses employed in
the present comparison studies for the large variety of laminate
configurations invesrigated For some laminate configurations
considerably different responses were predicted for the same
laminate by the various analyses
(d) The analyses were found to be inadequate to predict the ultimate
stresses of the angle-ply laminates The built-in failure
mechanisms in the analytical models were not verified by the
test results because of very poor correlation between the calculated
strength values and those observed experimentally
(e) The very good correlation of the predicted moduli with the
empirical onesand the pronounced disagreement among the predicted
ultimate stresses nibther verifies nor contradicts the influence
of the edge effects discussed in Appendix B In view of the
arguments in this Appendix and the lack of success of a sound
test program with the compression tubes of [11 coupons having
different dimensions than those employed in [1] should further
be tested to accomplish the objectives of the test program of
[1] and present comparison studies and evaluations
6
22
REFRENCES
1 T Weller tExperimental Studies of Graphite-Epoxy and Baron-Epoxy Angle Ply Laminates in Compression NASA CR 145233 Sep (1977)
2 R T Haftka and J H Starnes JR-- Application of an Interior Penalty Function for Structural Optimization -AIAA Paper 75-764 t1975)
3 SW Tsai - Strength Characteristics of Composite Materials - NASA CR-224 April (1965)
4 S W Tsai D F Adams and D R Doner - Analysis of Composite Structures - NASA CR-620 November (1966)
S P H Petit - Ultimate Strength of Laminated Composites -
Report FZM-4977 prepared for Advanced Filaments and Composites-Division Air Force Materials Laboratory Air Force System Command Wright - Patterson Air Force Base Ohio December (1967)
P H Petit and M B Waddoups -AMethod of Predicting the Nonlinear Behavior of Laminated Composites -J Composite Materials Vol 3 p 2 January (1969)shy
7 K 0 Chiu - Ultimate Strength of Laminated Composites -
J Composite Materials Vol 3 P 578 July (1969)
8 D L Reed - Point Stress Laminate Analysis - Report PZM-5494 prepared for Advanced Composite Division Air Force Materials Laboratory Air Force Systems Command Wright - Patterson Air Force Base Ohio April (1970) (Also T J Muha - Users Manual for the Laminate Point Stress Analysis Computer Program SQ5 as Revised by AFFDLFBC - AFPDL-TM-74-107-FBC July C1974))
9 H T Hahn -Nonlinear Behavior of Laminated Composites -
J Composite Materials Vol 7 P 257 April (1973)
10 R L Foye - Theoretical Post Yielding Behavior of Composite Laminates Part I Inelastic Micromechanics -J Composite Materials Vol 7 p 178 April (1973)
23
11 R L Foye - Theoretical Post Yielding Behavior of Composite Laminates Part II Inelastic Micromechanics J Composite Materials- Vol 7 P310 July (1973)
12 R S Sandahu-- Nonlinear Response of Unidirectional and Angle-Ply Laminates - AIAA Paper 74-380 April (1974)
13 Z Hashin D Bagchi and W B Rosen - Nonlinear Behavior of Composite Laminates - NASA CR-2313 April (1974)
14 T Weller - Experimental Studies ofGraphite-Epoxy and Boron-Expoxy Angle Ply Landnates-in Shear NASACR 145232 Sep (1977)
15 W D Whetstone - Structural Network Analysis Program -
Users Manual Static ANAlysis Version V70E LMSC-HREC D162812 December (1970)
24
APPENDIX A
It has been pointed out in the section on the Numerical studies
that the computer codes RDS15] and N0LIN[15] require the existence of
the unidirectional [00] and [90] laminae responses in tension
compression and shear for their application The images of these
data inputs or library data input are presented in Tables APA-1A and
APA-IB as being input into RDS code In addition to the data in these
Tables also required by N0LIN the information presented in Table
APA-2 has to be provided to operate the N0LIN code (Instead of feeding
N0LIN with the stress-strain data input for the responses one may
use the Ramberg-Osgood parameters as explained in [13] and avoid the
utilizing of curve fitting alegorithms to generate these parameters)
The mechanical properties given in Table APA-2 are also required
as data input by SQ5 code
It was mentioned in the section on Results and Discussion that
the data input for the matrix material of the AVCO 5505 Boron-Epoxy
laminates was taken from [10][l1] The mechanical properties are as
follows
Young Modulus of Matrix 510000 psi
Shear Modulus of Matrix 200000 psi
Poissons Ratio of Matrix 310
and the equivalent stressequivalent strain curve is reproduced from
these references SLI = 106ESI = 5000 SL2 = 5x10⁶ ES2 = 10000 SL3 = 19x106 ES3 = 15000
ES4 = 20000 SL4 = 1Oxl06
ESS = 25000 SL5 = 3230
ES6 = 30000 SL6 = 0
25
The Boron fiber properties are Provided by the manufacturer and
are as follows
Young Modulus of Fiber 58x106 psi
Shear Modulus of Fiber 2375x106 psi
Poissons Ratio of Fiber 200
Fiber Tension Ultimate 500 ksi
Fiber Compression Ultimate 750 ksi
26
APPENDIX B
Ithas been mentioned in [I] that edge effects might be induced
far away from the loaded boundcaries of the coupons resulting in an
unevenstress-strain distribution even for a-coupon loaded uniformally
This kind of behavior was experienced by all the angle ply laminates
of []
When the coupon is loaded in a manner described in Fig APB
allowing for a uniform axial displacement u=(-S) and completely
restraining the lateral displacement y = 0 along the loaded boundaries
plusmn12 it is anticipated that the coupon width or rather its aspect
ratio AR = 1 will have an appreciable influence on the stressshy
strain distribution of angle-ply laminates possessing high Poissons
ratios
Withthe prescribed boundary conditions the specimen might
experience an induced transverse stress approaching in the limit a
stress of
ay= Gx yx
A wide specimen will contain a wide zone of continuous fibers subject
to this high degree of lateral restraint Consequently this zone will
result in both higher stresses and stiffnesses than the regions close
to the free edges of the coupon where the filaments are noncontinuous
and hence shear the load from the termination of one diagonal fiber
into the begining ofan adjecant one through the matrix This of course
will result in an unknown uneven stress-strain field which renders wide
specimens unsuitable for application The stress is picking up towards
the center and hence ishigher than the average stress utilized to
present the response of such specimens On the other hand too narrow
specimens will be affected primarily and subject to the edge effect
which-will reduce both their strength and stiffness
A numerical study was carried out to determine the actual
lateral edge effect combined withPoissons ratio and to define the
best aspect ratio ie the minimum length of the coupon1 free
27
of lateral boundary influence at least along its center line transverse
to the direction of applied compression SNAP computer code [15] was
used for this purpose and the obtained results are presented in Fig
APB-2 The coupons of [1] have an aspect ratiq AR=75 which according
to Fig APB-2 is too short to eliminate the lateral boundary influence
The above discussion calls for a different type of specimen
Indeed tubes were also tested and reported in [1] A tube is free
of the free edge region but on the -other hand is susceptible to
another deficiency if the radial displacementsat the loaded boundaries
are prevented from expanding to allow for Poissons expansion high
bending stresses develop at the restrained boundaries These stresses
might precipitate early local failure at the specimen edges or might
be superimposed on the compressive stresses in case the tube is too
short again bringing about failure at a stress lower than the ultimate
one corresponding to the tested laminate
TABLE 1A Compression Response - Comparison of Experimental Ultimate Stresses and Moduli With Analytical Predictions of RDS[S]
SQs[S1 N0NLIN[101amp[11] and N0LIN[13]
GRAPHITE-EPOXY LAMINATES -3m SP-286T3
EST RESULTS OF [1] ANAL RDS [5 ANAL SQS [8) ANAL NPNLIN ANAL N0LIN [13]
Laminate
Configuratlon
ompressionCoupons
Ult Comp Cop Mo Stress __(si) x1Opsi)
Compression TubesU
Mo M esod
Thick Thick 6 ks(ksi) ksi x O si)
Ultimate
CoSteStress
(ksi) 6
xlO si
Ultiate
(ks ) 6ai ps
Ultimate
Co Stress ksi ops )
015 Com stress (kst
Max Max quad Stress Strain InteracIl Fal Faill
Ex
(x O psi)
[00]
164 191 115 664 510
200 1609 20911 1607 8011
20911 180 1607
[plusmn15 ] 117
1394 105 826
1842 [14251
105 1324 --
11722 -
1324 14022 10622 929 1324
[plusmn30] 548
5911 374
687 292
357 283
246
286 224
811 [655]
400 1
575 48722 576 43412 37622 288 575
[plusmn453 382
227 289 234
312 [251]
313 (60)1
203 25122 204 16212 19712 175 204
[plusmn601 3547 172
222 163 251 238 158 30812 161 19512 22312 233 161
[plusmn731 312
360
191
5376321 194
214
221 14
150
[1793
175
[120]
375 175 48922 181 32522 32522 298 181
330
344 [191
155
241
102
180 132
1101-3 350 184 47822 191 32022 33222 320 191o
111 115115898
879 294
493382 287
42229 835[7791
110 1
899 11511 883 96211 11211 107 883
[0__48deg 97 _674 76[979476 359 71571 as 642 82111 632 6871 79 211 648 632
2Corrected for measured thickness
A11 Failure in compressionor tension in laina 11 direction A2 F1
1-(inch) n2540x1 2 meter
I pound fo ce - 4448222 Newton (N)kip = 10 poundtrce
b)
)+ Ulitimate stress values corresponding to very high unreasonable strain values upper number - last stress value which corresponds to an acceptable strain value
TABLE 1B Compression Response - Comparison of Experimental Ultimate Stresses and Moduli With Analytical Predictions of DS[5]
SQs[8] N0NLIN[10]G(li] and N0LIN[I3]-
TEST BORON-EPOXY LAMINATES (AVCO 550556 MIL DIA)
SANALRESULTS OF ANAL RDS (5] ANAL SQ5 -
(8] NLINAL0NL N AANLN[3ANAL N0LIN [13]
Laminate
Configuratio
Compression Copons
lt EStressCmpComp Mod
Compression Tubes
UltCom Stres m MeasuredThick x
Ultimate
CompStress
Ex
Ultimate
CompStress
Ex
Ultimate
ConyStress
Ex
Comp Stress (ksi)Ult
x Stress Strain Interac
Bx
(ksi) (xIO 6psi) (ksi) tksi) (xl06psi) (ksi) (xLOp$i) (ksz) (x06psi) (ksi) (xlO psi) si__ (xlO6psi)
10] 263
342 3127 - - 3340 3128 35311 3127 3120 54011 35311 340 3127
[1300]
( 45]
135 2365
139
947 5551095 O9
961 S89
337
253 351 308
838
918 290 3 300
255
280 331
576
680 206
2T4
194
204 234I
3749 [2685]
1111 [800]
323 [239]
150 2527
425 - 923 (NoULTOBT)OET
135 246 (NOULTOBT)
13322
4422
350612
2526
923
246
2496
887
257
32122
11212
10422
24622
11SIZ
246
115
2526
923
246
[plusmn601l 318 333
162 387 274
264 199
397 (272]
300 (NOULTOBT
221 50022 221 184 17312 18012 205 2 21
[plusmn7S) 348
279 2 311
19360 214 (64)+
276 44622 276 197 31922 26422 285 276
[90deg]
(090]
298
517 179
1
298
177
178
2171 206
126
143 1 8
339 [232] 2534
340
(38)+
190
299
11
1721
44722
194 111
298
1715
220
205
1667
32022
17611
34122
18411
320
21
298
1715 t
230 233 157 [1773] k
[0iplusmn4rso] 146
158 1147
137
147
881
874 1665
_110201 130 1192 13411 1187 141 1162 12111 12511
1 113
1 1 1187
1 q 1
Fiber failure in D degree layer
Calculations exceeded maximum observed experimental strain values
Solution does not converge
[ 3 Corrected for Measured thickness Ail Failure in compressionor tension
in lamina 11 directionIi
-2II (inch) = 2540x10 2 meter Tmi) I pound fojee = 4448222 Newton(N)
psz = 69477x10ound f rPascal (Pa)
)+Ultimate stress values corresponding to very high unreasonable strain values- upper number shy last stress value which corresponds to an acceptable strainvalue
A22 Failure in compressionor tension
A12 Failure in shear
I ksi i 105 psi
LIBRARY DATA FOR MATERIAL 2 - - SMSP2B6T-3(A-S)LEA1FA INPUT
SIGTO EPSTO SIGT9O EPSTS0O SIGCO EPSCO SIGC90 YPSCc9o
013500E 05 080000E-0 09O0000E 03 06000E-03 022500F 05 014000E-02 O46000E 04 025000E-b2 026500E 05 0O16000E-02 018000E 04 012000E-02 045000E 05 028000E-02 090006t 04 0500Q0E-02 O405hOE 05 O24OOOE-02 -026700E 04 018000E-02 067500E 05 02000E-02 013250E Oi 075000E-2 054500E 05 03200t-02 Q4860E 04 024000E-02 087200E 05 056000E-02 016800E 05 OlOOOE-01 069000E 05 00000E-02 042700E 04 q30000t-02 010670E 06 070000E-02 020500E 05 012500E-01
048 0 0 0E- 0 50 8 0 0E 04O3500E 05 0 2 036 000 E-02 012560E 06 O840OE-02 02375OE 05 015000F-01 097500E 05 056000E-02 058300E 04 O042000E-02 O14OE 06 098000E-02 026600E 05 ot17500E-Q1 011150E 06 064OOE-02 066200E 04 048000E-02 016250E 06 011200E-01 029100E 05 020000E-01 012559E 06 072000E-02 073600E 04 0540O0E-02 017900E 06 012600E01 031400E 05 p22500E-O1 013950E 06 08000E-02 081000E 04 060000E 02 019400E 06 01400OE-01 033500c 05 0250nOE-01 00 08BOOOE-02 00 amp66000E-02 00 0154600E-01 00 027500E-01 00 096000E-02 00 072000 E-02 00 016800E-01 00 03000AE-01
SIG45 EPS45 TbU12 CNL12 1 TNU21 CNU21
012540E 0 022000E-02 031400E 00 024000E 00 027911E-01 027477E-01 025080C 04 044000E-02 031600E 00 026000E 00 029169E-01 028073E-01 037620E 014 066000E-02 031800E 00 027500E 00 026349E-01 029089E-01 O5IOO1 E 04 0880OOE-02 0319nOE 00 028000E 00 024609E-01 028256E-01 058500 04 0i1000E-01 032000E 00 030000E 00 023246E-01 031877r-01 064000E 04 01300E-01 032000E00 031500E 00 023835E-01 030333E-01 069600E 04 015400Fr01 032000 00 03250OE 00 02857E-01 027590E-01 074000E 04 017600E-01 032000E 00 033000E 00 024076E-01 025525E-01 077500E 04 01VSOOE-01 032000E O0 033500 E 00 022552E-01 P26150E-01 080500E 04 022000E-01 031900E 00 034000E 00 022482E-01 026656E-01 00 024200E-01 0 00 00 0i0 00 026400E-01 00 00 00 00
TABLE ApA B- INPUT LIBRARY DATA FOR MATERIAL -1 - - AVCO 550556
SIGTO EPSTO SIGT9O EPST9O SIGCO EPSCO STGCSO CpSc90
021700E 05 043400E 05 065100E 05 086800E 05 010850E 06 0130206 06 015190r 06 017360E 06 Olq530E 06 021700F 06 00 00
070000E-03 0o4OOOE-02 O210OOE-02 028000E-02 035000E-02 042000E-02 049000t-02 056000E-02 0630OE602 070006E-02 077000E-02 084000E-02
011500 04 023000E 04 033500E 04 043400E 04 052700E 04 0610OE 04 070600E 04 078500E 04 084500E 04 089000E 04 00 00
04000E-03 080000E-03 012000Er02 016000E-02 020r00E-02 024000E-02 028000E-02 032000E-02 036000E-02 040000E-02 044000E-02 048000E-02
031270E 05 062540E 05 093810E 05 012508F 06 015635E 06 018762E 06 022100E 06 025400E 06 028800E 06 03l000E 06 00 00
010OOE-02 920000E-02 030000E-02 040000E-02 050000E-02 0600OOE-02 070000E-02 080000E-02 090000E-02 016000-01 011000E-01 012000E-01
044800E 04 069500E 04 013150E 05 016800E 05 020200E 05 023100E 05 025750E 05 028000E 05 031000E P9 031700E 05 00 00
015000E-02 - 030000E-02 045000E-02 96000E-02 075000E-02 090000E-02 010500E-01 0120006 1 013500E-01 0150OOE-01 0165O6E-01 oaeooor-Oi
SIG45 EPS45 TNU12 CNL12 TNU21 CNU21
0BgPE 04 033200E 04 042500E 04 0116500E 04 048500E O 050500E 04 052200E 04 053500E 04 055000E 04 O596000E 04 00 00
02700E-02 054000E-02 081000E-02 0108OOE-01 013500E-01 016200E-01 018900E-0 02tOOE-01 024300E-01 027000E-01 029790E-01 032400E-01
022700E 00 022700E 00 022700E 00 022400E 00 022400E 00 022400E 00 0224006 00 023000E 00 023300E 00 022700E 00 00 00
02640nE 00 026600E 00 026800E 00 026800E 00 027000E 00 02720 0 E 00 027500E 00 028000E 00 029000E 00 032000E 00 00 00
021052E-01 021052E-01 019222E-01 017884E-01 016800E-01 016439E-01 158976-01 014653E-01 011274E-01 0823806-02 00 00
025215E-01 025350E-b1 023997E-01 020855E-01 019572E-01 016817E-01 014555E-01 0i2727E-01 017059E-01 028118 -02 00 00
00 -
32 ou~IGV AGT32~ jO Q1JA1ATY
TABLE APA-2 Unidirectional Lamina Properties Utilized In The Predictions Of SQS9] and N0LIN[14]
3M SP-286T3 AVCO 550556 Mil GRAPHITE-EPOXY BORON-EPOXY
(Ell)Tension 1687x106 psi 3100xlO6 psi
(E11)Coinpression 1607x106 psi 3127x1O6 psi
(E22)Tension 152x106 psi 288x106 psi
(E22)Compression 191x106 psi 298x106 psi
GO2 057x106 psi 066x106 psi
(aULTll)Tension 140 ksi 220 ksi
(eULTllTension 008 007
(cULTll)Compression 180 ksi 340 ksi
(eULTll)Compression 013 0113
(t ULT22)Tension 8 ksi 89 ksi
(ULT 22)Tension 006 00405
(aULT22)Compression 32 ksi 32 ksi
(EULT22)Compression 025 015
((ULT12) 81 ksi 56 ksi
(CULT12) 022 0275
(v12)Compression 230 267
(v12)Tension 298 216
-1 (inch) = 2540x10 2 meter Cm)
1 pound force = 4448222 Newton (N)
I kip = 103 pound force
I psi = 6894757x105 Pascal (Pa)
I ksi = 103 psi
A test results [1] (coupons)0 analysis (8] amp 131
I00
w CL
10
-0
5
66
0 I I I I I I Cgt t C00o
01 +1 +1 +shy
g LAMINATE CONFIGURATION
FIG 1A YOUNGS MODULUS OF 3M SP-286T3 GRAPHITE EPOXY LAMINATES ASAFUNCTION OF LAMINATE CONFIGURATION
30 7A test results [i](coupons)0 analysis [81 amp [131 v [10] ampIll]
C o
w 20
109
0I III I I I + +1 +1 +1 +1
LAMINATE CONFIGURATION 0
FIG 1B YOUNGS MODULUS OFACO 5505(56MIL DIA BORON-EPOXY LAMINATES AS AFUNCTION OF LAMINATE CONFIGURATION
200t 200 3 0 mxx stress falla test results [1) (coupons) analysis NOLIN 03] V max strain fail
0 analysis RD 5 [5] r[ quadr interaction 0 analysis SQ5 [8] fail
150 150
0x(0
a
0~ARA 0
100- V13 100- 0
A A
A
50- 0 0 0 50shy000 v A A
0 A 13 V 0 0
0 in 0 10 0 O 0 to CD +1~j4 3 + +1 owi +1 +1 +1 4
LAMINATE CONFIGURATION LAMINATE CONFIGURATION
FIG 2A ULTIMATE STRESS OF 3M SP 286T3 GRAPHITE EPOXY LAMINATES AS AFUNCTION OF LAMINATE CONFIGURAiON
A tests results [1] (coupons) 0 maxstressfail 0 analysis RD5 [5] analysis NLIN [13] v max strain fail
300 0 analysis SQ5 [8] 300 0 quadr interaction fail
200
00
-A
200 -3
A
100 00
A A0 100 A
09 0A
o
0 LO lcent
O O -t to
TL +1 + 1 +1 1 LAMINATE CONFIGURATION
FIG 2B ULTIMATE STRESS OFAVCO LAMINATE CONFIGURATION
0 C gt 1LO L O C La mmO) rt
+ 1 + 1 + 1 + 1 4 LAMINATE CONFIGURATION
550556 MIL DIA BORON-EPOXY LAMINATES AS A FUNCTIONOF
200 -+ A
o 0
A
o 0~
ab A
0 Aa AA
0shy 0500shy
15-15 - 0 0l FIG Z
-0
OMPESIONRESONEO 003MSP-66T GAPHTE-POY LMINTA
AxC)0o00A
001 A0e
_150
0
0 00
0
coupons 0
00 0
u coupons
100 tubes nom
thick A
0
ubes horn thick
tubes t thickK 077 tubes tthick
50 -
-15 -10 -05 0 05 10Ex (4) 6 (0)FIG 4 COMPRESSION RESPONSE OF plusmn15 deg 3M SP-286T3 GRAPHITE-EPOXY LAMINATES
75
0C
E 50
coupons coupon 00
a 00 tubes noa oo
tubes tubes fern
0A
tubes t~ 4 tubes tthick 25 thick - shy
cento 4 AOa
0-10 -05 Ex (0) 0 y 05 10 15
FIG 5 COMPRESSION RESPONSE OF -30 3M SP-286T3 GRAPHITE-EPOXY LAMINATES
40
30-S
tubes hnmhick tubes nom
tik
a
20--
a-P III
-5 -3
FI30OMRESONtubes
-4
tubes tthick
2co1upo1s
FLJ-5 3 M28Thick
IF- PO
tues fain thIkEshy
tubes trthick
(60)
10G COPESONRSOSE-5 3MS-8t-RPIEEOY AIAE
40
couponstubes nor
copn thick
nomn btubes thick th
30CL
U
1shy
o
S-4 -3 -2 -ex (0) 0 y 2
degFIG 7 COMPRESSION RESPONSE OF +-60 3M SP-286T3 GRAPHITE-EPOXY LAMINATES
40
CL E 0 U
30
U) coupons
A
A
coupons
A
20-
0
tubes nom thick
0
tubes nom thick
-
tubes t thick
tubes t thick
10shy
-3 -2 -1 Ex() Cy (1)
FIG8 COMPRESSION RESPONSE OF plusmn750 3M SP-286T3 GRAPHITEEPOXY LAMINATES
-4 0
35 +
CL o0
Di couon coupons
S25
bull--
20shy
--
tubes nom thick
tubes nom thick
t
15-tubes
thick t
tubes tthickN N
10 -N
NN
0n -25 -20 -15 -10 ex -05 0 ey 05
FIG 9 COMPRESSION RESPONSE OF 906 3M SP-286T3 GRAPHITE-EPOXY LAMINATES
120
100- A
2 coupons
E080 A 2 0
60shy
thick tubes nom hidk
40shy
tubes t 20- tubes tthick - thick
0shy-16 44 -12 -10 -08 -06 -04 -02 0 02
FIG 10 COMPRESSION RESPONSE OF 0900 3M SP-286T3 GRAPHITE-EPOXY LAMINATES y
100
oo coupons
ns coupons
0
UIi75 - -
50- C
tubes nom tubes nor thick thick
25 tubes tthick Kc_ tubes tthick
-20
FIG11
-15
COMPRESSION -1o
RESPONSE OF 0145900
-05 0 05 e1 (C) OE y (0)3M SP-286T3 GRAPHITE-EPOXY LAMINATES
10
400
(0
6 coupons coupons 200- shy
100 shy
-12 -10 -08 -06 -04 Q02 0 0Q2 ey 04 FIG 1V COMPRESSION RESPONSE OF 00 AVCO 5505156 MIL DIA BORO-EPOXY LAMINATES
150- +-- V
o
U)
In
_
A coupons
100 tubes florn
E
nom
tthick
tubes tthick-- t
copos7L A
V(10
-otubesnomathick ov
tubes tik IV deg tub es t t h ic k o
50 0
10
001
I
FIG 13
-05 0Eri)
COMPRESSION RESPONSE
A H I
05ey (0)
OF t 150 AVCO 5505 BORON-EPOXY
10
LAMINATES
15
75
0v VU)InI v v 03pn coupons
degu v
- 50v V
(no ultobt) A (no ultobt)amp
25- 0
tubes nom thick 04 tubes nom thick
tubes tthick0 tubes tthick
- Q5 0 05 10 15Ex (sect) Ey (dego)
FIG 14A COMPRESSION RESPONSE OF plusmn300 AVCO 550556 MIL DIA BORON-EPOXY LAMINATES (BATCH 1)
20
100
0
0
U
75
(no V V V
V50 -- V V -o uponsV (outat)v (no ultobt)
nora tubes 47
VAnom 0V thick AV
25tubes noma th
tubest~thikK~iVx tubes tthick
5 -D -05 E M0 (o) 05 10 15
FIG 14B COMPRESSION RESPONSE OF plusmn300 AVCO 550556 MIL DIA BORON-EPOXY LAMINATES (BATCH E1)
40
0
CLcuoscoupons
E 0 v
30shy
230 ---shy
thick thick -S- -- - tin
20- tube2 k- -shyc
1 e thick
(noul Xe (no ult)
10- (t A
0 04 ey SA)x (15FIG 15 COMPRESSION RESPONSE OF plusmn450 AVCO 550556 MIL DIA BORON-EPOXY LAMINATES
_ _ _ _ _
40
tubes nom thick V
tubes nom thick
c-oupons v (no ult obt) v n
(no ult30- A obt) VA coupons
0
~hck tubes tthick2tbs8 ZE AA
00 In AA_
vA 0 b 0 A 0
A 00 0
0 10 AA
OI I I -5 -4 -3 -2 1 ( y 2
FPAxI E y ()MFIG 16 COMPRESSION RE-SPON$EOFi60 AVCO -550556 MIL DIA BORON-EPOXY LAMINATES-
40
(64 ksi) (64)
30
oV CO
coupons
0A 0
AA A coupons
0-A 5
20
0
0 00
10shy
00
V
-25 -20 -15 -10 -05 0 05eF (0) Ey (CI)05FIG 17 COMPRESSION RESPONSE-OF +-750AVCO 5505156 MIL DIA BORON-EPOXY LAMINATES
40 -
C
En Ult 3 0 L
0 deg 3 0 - cou on coupons u
830
tubes nom 20 V thick
tubes nom thick V
-tubes tthicdk
thick 10shy
-16 -14 -12 -10 -08 -06 -04 -2 0 2 ei () ey (0)
FIG 18 COMPRESSION RESPONSE OF 906 AVCO 550556 MIL DIA BORON EPOXY LAMINATES
2-250 upons coupons
CL tubes nom thick tubesno]
ktubes t tubes t
0 thick thickS 150- O
0
wA
201 thck
50
-14 -12 -10 -08 -06 -04 -02 0 02 ex (0f) ey (l)
FIG 19 COMPRESSION RESPONSE OF 0900 AVCO 550556 MIL DIA BORON-EPOXY LAMINATES
200
2 0
E coupons
150 tubbs nom tubes thick nom
thick
100
tubes t tubes thick tthick
50shy
- I
0-15 -10 -05 05Lx () 00 y (l) 0
FIG 20 COMPRESSION RESPONSE OF 0145900 AVCO 5505156 MIL DIA BORON-EPOXY LAMINATES
IxJu
uniform compression
L u=-8 I I I I I
I Ib
I 1IIAP II ICPSIx I I
I I
I- b
FIG APB 1 COUPON UNDER UNIFORM COMPRESSION
AR AR (SNAP) t xy
0 POISSON RATIO -xy
2 10lj
ISOTROPIC 0 PANEL
I bullI 00
0 05
0 10 20 30 40 50 60 70 80 90 t a (degrees)
FIG APB 2 MIN AR FOR 6BESTSTRESS DISTRIBUTION ALONG THE CENTER LINE OF THE COUPON
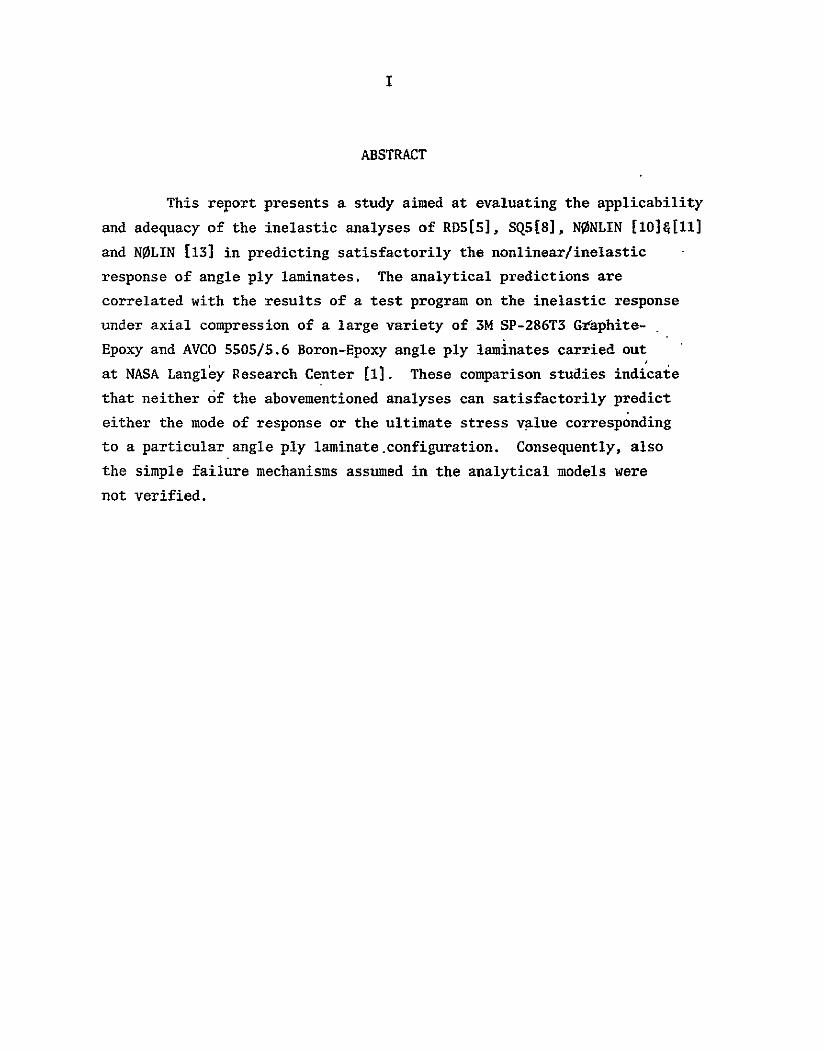
I
ABSTRACT
This report presents a study aimed at evaluating the applicability
and adequacy of the inelastic analyses of RDS[1] Sq5E8] N0NLIN [i0]amp[lI]
and N0LIN [1i] in predicting satisfactorily the nonlinearinelastic
response of angle ply laminates The analytical predictions are
correlated with the results of a test program on the inelastic response
under axial compression of a large variety of 3M SP-286T3 Graphite-
Epoxy and AVCO 550556 Boron-Epoxy angle ply laminates carried out
at NASA Langley Research Center [1] These comparison studies indicate
that neither of the abovementioned analyses can satisfactorily predict
either the mode of response or the ultimate stress value corresponding
to a particular angle ply laminateconfiguration Consequently also
the simple failure mechanisms assumed in the analytical models were
not verified
II
TABLE OF CONTENTS
I
TABLE OF CONTENTS II
LIST OF SYMBOLS IV
LIST OF FIGURES VI
Part 1 INTRODUCTION 1
Part 2 NUMERICAL STUDIES 2
Chapter 21 COMPUTER CODES 2
ABSTRACT
211 RDS-ULTIMATE [5] 2
212 SQS [8] 2
213 N0NLIN[10] 8 [11] 3
214 N0LIN [13] 3
Part 3 RESULTS AND DISCUiSION 4
Chapter 31 GRAPHITE-EPOXY LAMINATES (3M SP 286T3) 5
311 Unidirectional [00] Laminates 5 312 [ 150 Laminates 6 312 [ 50] Laminates 7
314 [ 450 ] Laminates 7
315 [ 600] Laminates 8
deg316 [ 75 J Laminates 9
317 900] Laminates 10
318 [790] Laminates 11
319 [O 45900] Laminates 10
Chapter 32 BORON-EPOXY LAMINATES (AVCO 550556 MIL
DIA) 12
deg 321 Unidirectional [O ] Laminates 12
322 [150] Laminates 13
323 [ 300] Laminates 14
324 [ 450] Laminates 15
325 [ 600] Laminates 16
326 [750] Laminates
327 [9001 Laminates 18
328 [ 090deg] Laminates 19
329 [ 0plusmn450900] Laminates 20
20Part 4 CONCLUSIONS
REFERENCES 22
24APPENDIX A
APPENDIX B 26
29
TABLE lA 28
TABLE 1B
30TABLE APA-IA
TABLE APA-iB 31
32 TABLE APA 2
AR
b I
Eli
E22
Ex
C12
EPSTO
EPST90
EPSCO
EPSC90
EPS45
SIGTO
SIGT90
SIGCO
SIGC90
SIG4S
TNUI2
CNU12
x y
U v 6
SULTI1 5ULT22
EULT12
Cx y a x yULTl1
0ULT22 aULT2
Vp2
x Vyx
IV
LIST OF SYMBOLS
Stress field aspect ratio
Coupdh stress field dimensions Fig APB 1
Lamina Young Modulus in the 11 fiber direction
Lamina Young Modulus in the transverse 22 direction
Laminate Young Modulus
Lamina Shear Modulus
[00] Lamina strain in tension
[90] Lamina strain in tension
[0] Lamina strain in compression
[900] Lamina strain in compression
[00] Lamina inplane strain in shear
[0deg] Lamina stress in tension
[9001 Lamina stress in tension
[0] Lamina stress in compression
[900] Lamina stress in compression
[00] Lamina inplane shear stress
Tension Poisson Ratio
Compression Poisson Ratio
Axial andtransverse coordinates respectively Fig APB 1
Displacements Fig APB 1
Axial end displacement Fig APB 1
Lamina ultimate strain in the 11 fiber direction
Lamina ultimate strain in the tranverse 22 direction
Lamina ultimate inplane shear strain
Laminate strains
Laminate stresses Laminalbngitudinal strength
Lamina transverse strength Lamina inplane shear stress
Lamina major Poisson Ratio
Laminate Poisson Ratio
-v
Note All Figures Are Read As Follows
A -A
RDS Prediction [5] RDS Predicted Ultimate Stress
V
TN0LIN
N0NLIN Prediction [10]amp[11
riber Failure
o N0LIN Prediction [13 - Q Max Stress Fail
Max Strain-Fail
UQuadratic Interaction Fail
Empirical Response of [1]
Tubes Nom Thick -Corresponding to tubes - Stress calculations based on laminate nominal thickness (number of plies times nominal ply thickness )
Tubes T Thick - Corresponding to tubes - stress calculations based on laminate true measured thickness
VI
LIST OF FIGURES
1A Youngs Modulus of 3M SP-286T3 Graphite-Epoxy Laminates As A Function Of Laminate Configuration
1B Youngs Modulus of AVCO 550556 Mil Dia Boron-Epoxy Laminates As A Function of Laminate Configuration
2A Ultimate Stress of 3M SP-286T3 Graphite-Epoxy Laminates As A Function of Laminate Configuration
2B Ultimate Stress of AVCO 550556 Mil Dia Boron-Epoxy Laminates As A Function of Laminate Configuration
3 Compression Response of [00] 3M SP-286T3 Graphite-Epoxy Laminates
4 Compression-Response of [plusmn150] 3M SP-286T3 Graphite Epoxy Laminates
5 Compression Response of [plusmn300] 3M SP-286T3 Graphite-Epoxy Laminates
6 Compression Response of [plusmn450] 3M SP-286T3 Graphite-Epoxy Laminates
7 Compression Response of [plusmn60] 3M SP-286T3 Graphite-Epoxy Laminates
8 Compression Response of [plusmn750] 3M SP-286T3 Graphite-Epoxy Laminates
9 Compression Response of [900] 3M SP-286T3 Graphite-Epoxy Laminates
10 Compression Response of [00900] 3M SP-286T3 Graphite-Epoxy Laminates
11 Compression Response of [00plusmn450900] 3M SP-286T3 Graphite-Epoxy Laminates
12 Compression Response of [00] AVCO 550556 Mil Dia Boron-Epoxy Laminates
13 Compression Response of [plusmn150] AVCO 550556 Mil Dia Boron-Epoxy Laminates
14A Compression Response of [plusmn300] AVCO550556 Mil Dia Boron-Epoxy Laminates (Batch I)
14B Compression Response of [plusmn300]AVCO 550556 Mil Dia Boron-Epoxy Laminates (Batch II)
15 Compression Response of [plusmn450] AVCO 550556 Mil Dia Boron-Epoxy Laminates
VII
16 Compression Response of [plusmn600] AVCO 550556 Mii Dia Boron-Epoxy Laminates
17 Compression Response of [plusmn750] AVCO 550556 Mil Dia Boron-Epoxy Laminates
18 Compression Response of [900] AVCO 550556 Mil Dia Boron-Epoxy Laminates
19 Compression Response of [009001 AVCO 550556 Mil Dia Boron-Epoxy Laminates
20 Compression Response of [0plusmn4590] AVCO 550556 Mil Dia Boron-Epoxy Laminates
APB I Coupon Under Uniform Axial Compression
APB 2 Min AR For Best Stress Distribution Along the Center Line of the Coupon
1 INTRODUCTION
The experimental results of an intensive test program carried
out at NASA Langley Research Center and aimed at studying the nonlinear
inelasic compression response of Graphite-Epoxy and Boron-Epoxy
laminates were reported in [1]
Advanced composites are increasingly being introduced into
the design of primary structural components of advanced aircraft and
space vehicles due to their high moduli and strength to density ratio
and particularly because of their tailoring capability to match
and resist any type of load introduction into the structure These
characteristics propose them as an excellent if not the number one
candidate for advanced optimized structures [2]
In spite of their outstanding performances the satisfactory
and advantageous application of composite materials is limited unless
there exist reliable analytical tools to predict and provide the
response and design allowables of any tailored laminate with full
confidence ie verified by ample experimental evidence
Theoretical studies include assumptions which can only be
postulated when they are based on sound experimental evidence and then
have to be verified experimentally As a matter of fact theoretical
studies were derived [3] through [13] but allof them lacked the
experimental background to justify both the assumptions made in their
derivation and their adequacy to predict the response of laminated
materials
In the present report the experimental studies of [i] are
correlated with the predictions of [s] [8] [lo] [lI] and [13]
and the adequacy for satisfactory application of these analytical
tools to generate and predict the response as well as strength
allowables of different laminate configurations is evaluated Some
of these analyses for example [5] [8] and [13] consider and account
for simplified failure criteria such as Max Stress Or Strain and
Quadratic Interaction Failure for the laminate and hence in the case
of good agreement with the empirical investigation of [1] might
2
allow for a better physical insight into failure mechanismr and
critical stress combinations which trigger failure of the laminate
Abrief description of the computer codes of [5] Es] [10] [11] and [13]
follows in the next section
2 NUMERICAL STUDIES
In the present numerical studies four computer codes were utilized to predict analytically the stress-strain response of the
variety of laminates tested and reported in El] These codes are
known as RD5 or ULTIMATE SQ5 N0NLIN and N0LIN and they are based on
the analyses of [S] [8] [I0][Ii] and [13] respectively The main
features of these programs follow
21 COMPUTER CODES
211 RDS - ULTIMATE[5]
Predicts the stress-strain response to ultimate failure for
a plane unisotropic laminate with mid-plane symmetry consisting of
orthotropic laminae with nonlinear stress-strain responses This
analysis assumes that any degradation occurring due to lamina yielding
or failure is restricted to that lamina and has no influence on the
adjacent laminae The technique of analysis requires the stressshy
strain responses of the individual unidirectional lamina This
information in conjuction with a generalized Hooks low provides the
laminate response In addition to the response the program furnishes
for each stage of loading the instantaneous stiffnesses and Poisson
ratios
212 SQS[8]
Provides the stress allowables for a particular laminate
based upon the maximum strain theory of failure It is based on a
coupled inplane and bending-point stress analysis of the laminate
The laminate constitutive equations are derived-from the laminae
constitutive relations Then it is used to determine the mid-plane
strains and curvatures arising from the inplane stress and moment
resultants These are then applied to determine the stresses and
strains in each layer of the laminate
3
213 N0NLIN[10]1[II]
This is a micromacro analysis utilizing the discrete finite
element method (DEM) to determine the nonlinear response of a laminate
subjected to inplane loading The inelastic effective properties of a
unidirectional rectangular and square arrays of elastic fibers
introduced into an inelastic matrix are generated with the aid of
the DEM method The obtained properties are then used on the macro
level in conjuction with an inelasticlaminate analysis The analysis
is based on an incremental plasticity theory and consequently is very
complicated relative to the other analyses The analysis does not
include any type of built-in failure mechanisms
214 N0LIN[13]
Generates the nonlinear stress-strain response of a symmetric laminate-under inplane loading by relating its behavior to the nonlinear
responses of the unidirectional laminae The nonlinear response of
the individual lamina is defined by a Ramberg-Osgood type of
representation and materialnoniinearities are represented by deformation
type theory As a starting point for its application the analysis
requires the input of the nonlineartransverse and inplane shear
responses of the bullunidirectional laminae Then the appropriate Ramberg-
Osgood parameters ate calculated to formulate an interaction expression
for simultaneous application of transverse and inplane shear stresses
The analysis predicts ultimate stress values corresponding to Max Stress Max Strain and Quadratic Interaction Fail oV-an individual lamina
Hence it assumes that lamina faiiure precipitates overall failure of
the laminate
The codes of [5] [8] and [13] require the existence of lamina
unidirectional stress-strain responses asvital informatioi for their
application Such information can be generated on a micro level
but is usually obtained experimentally In Appendix A the stressshy
strain responses corresponding to the unidirectional laminae of
3M SP-286T3 Graphite-Epoxy and AVCO 550556 Mil Dia Boron-Epoxy
which were the prepreged materials used to fabricate the specimens
of [1] are presented The tension responses were generated by SWRI
4
the manufacturer of the test specimens of [1] The compression and
shear responses were reproduced from the experimental responses yielded
by the [00] and [900] unidirectional laminates otf1] and [14]
3 RESULTS AND DISCUSSION
In Tables IA and lB experimental values of the ultimate stresses and
moduli incompression corresponding tothe laminates tested and reported
in [i] arerepresented together with the predicted values of the
analyses of [5] [8] [10] [il] and [13] (No values are given in
Table IA for N0NLIN [101ll1] because of lack of information both on
the fiber andmatrix material of 3M SP-286T3 This information is
required as data input for the application of this computer code)
In Fig IA the moduli observed for the Graphite-Epoxy laminates
(coupons) are correlated-with the predicted moduli by [8] and [13]
A similar comparison is shown in Fig 1B for the Boron-Epoxy laminates
(includingthe modulipredictedby Eo] liI]) Tables IA and 1B reveal thatthe
analyses of [81 and [is] yield identical moduli values whereas the analysis of
[5-predicts slightly but insignificantly different modulivalues
Consequently the comparisonspresented in Figs IA and IB also apply
to the analysis pf [5]
Tables 1A and lB reveal considerable differences among the
ultimate compression stresses predicted by the different analyses
The calculated ultimate strength values are compared with the empirical
ones of [1] in Fig 2A for the Graphite-Epoxy laminates and in-F ig
2B for the Boron-Epoxy ones Each of these figures consists of two
sub-figures one correlating the test results of [11with the analyses
of [S and [8] and the second with the predictions of [13] The
figures are presented in such a manner as to allow for better distinction
of the predicted ultimate values of [13] where three different such
values are yielded for each laminate corresponding to Max Stress
Max Strain and Quadratic Interaction modes of failure of the laminate
The results presented in Tables 1A and IB and Figs 1A IB
2A-and 2B will be discussed individually for each material and laminate
configuration when a particular laminate is being considered in the
following discussions and evaluations of analytical predictions vs
observed test results
5
Before proceeding with the discussion the following remarks
and comments on the presentation of Figs3 to 20 of this report
should be noted each figure consists of the test results reproduced
from [1] and the analytical predictions of RD515 N0NLIN [10][i11 (only
for Boron-Epoxy laminates) and N0LIN[13] The reproduced test results
include the response experienced by the coupons and two plots
corresponding to the tubes one when nominal thickness is considered
and designated Tubes Nom Thick in the figures and the second when
true measured thickness is accounted for and designated Tubes T
Thick in the figures
31 GRAPHITE-EPOXY LAMINATES (3M SP-286T3)
311 Unidirectional [00] Laminates
The experimental response of [1 ispresented together with
the predicted ones by RDS[5] and N0LIN[13] in Fig 3 As already
mentioned earlier the analyses of [5] and [13] require the unidirectional
[001 and [90O] lamina responses in tension compression and shear
as data input or rather data library for application of their computei
codes This type of information for the compression response was
extracted from the experimental compression response of the [00)
compression coupons of [1] Hence Fig 3 assists in evaluating the
capability of the computer codes RDS[5] and N0LIN[13] to reproduce the
stress-strain response of the [00] unidirectional lamina This of
course might affect the predicted responses of the angle ply laminates
and their correlation with the empirical responses of [i) It is shy
observed from Fig 3 that RDS reproduces excellently the compression
branch of the lamina whereas reproduction of the tension branch is
very good in the range of low stress-strain levels and becomes poorer
with increase in stress values displaying less nonlinearity than
that experienced by the coupons This nature of behavior depends
very much upon reproduction of the unidirectional [900] lamina response
in tension by RDS Fig 3 also reveals that the NJ0LIN code does not
reproduce so well either the lamina compression branch or its tension
branch This stems from the analysis of [13] which assumes a perfectly
elastic response of the lamina up to failure in the so called 11
direction ie fiber direction As already stated this might influence
6
the predicted responses of the angle ply laminates
It is seen from Table IA and Fig 1A that RDS yields an ultimate stress which is slightly higher than that experienced experimentally
(200ksi compared with 191ksi respectively) N0LIN Max Stress
and Quadratic Interaction Fail-predict-a lower stress value than
the experimental one 180ksi and N0LIN Max Strain Fail yields a
higher strength value than experienced brth experimentally and by RDS 209ksi This ultimate stress is also predicted by SQ5E8]
312 [plusmn150] Laminates
The experimental responses of ElI together with thepredicted ones[5] and [13] are shown in Fig 4 It appears from Fig 4 that
there is good agreement between RDS and N0LIN predictions as well
as very good correlation between the empirical compression branch
corresponding to the coupons and the theoretical predictions It is
also observed that once the true measured thickness of the tubes
is accounted for the tube compression-response correlates wellwith that experienced by the coupons however the true ultimate stresses
yielded by the tubes are significantly lower than those obtained for thecoupons (see alsoTable 1A) Fig 4 also reveals that there is
no correlation between the theoretical predictions of the tension
branch and the coupon tension branch The predictions display more
pronounced nonlinearity than do the coupons
Fig IA and Table IA indicate that the analyses of [5] [8]
and [13] yielded an identical modulus of 1324x106 psi which is slightly
lower than that of 1394x10 6 psi experienced by the coupons It is observed in Fig 2A and Table 1A that the ultimate stress predicted by SQS[8] is in excellent agreement with that yielded by the coupons
(117ksi) Also RSES] predicts an ultimate strength value of 105 ksi which is lower than that experienced by the coupons and in
very good agreement with N0LIN[13] Max Strain Fail (106ksi) It also appears that N0LIN QuadFail predicts a low strength value relative to
the coupons (929 ksi) and Max Stress yields a higher stress value
(140ksi) than that observed for th coupons As has already been stated earlier it is observed in Table lA that the tubes sustained a low
7
ultimate strength value independent of whether nominal or true
thickness is considered
313 [plusmn300] Laminates
The experimental responses of E1] as well as the predicted
ones are presented in Fig 5 It is observed that RDs[5] andNLIN[13]
predictions are in good agreement It appears that these predictions
display more pronounced nonlinearity and considerably lower strength
values (see Table lA) than those experienced experimentally by the
coupons It is also observed in this figure that once the true
thickness is being considered for the tubes their compression branch
of the response is in good agreement with the predicted ones However
very poor ultimate stresses are then experienced by them (see
Table 1A) Comparing the tension branch of the responses predicted
by the analyses with those experienced empirically it is seen that the tubes when true thickness is accounted for respond similarlyto the theoretical predictions whereas the coupons respond with acompletely different
behavior higher stiffness and not as much as pronounced nonlinearity
The results of Table 1A and Fig IA show that the analyses
yield identical moduli of 576x10 6 psi which are noticeably lower
than those experienced by both the coupons (687x06) and the tubes
(655xlO6 when true thickness is accounted for) Regarding the
ultimate stresses it is found that the coupons sustained appreciably
higher strength values (591 ksi) than were predicted by the analyses
487 by SQ518] 400 by RDS[5] and 434 376 4 288 by N0LIN[13]
Max Stress Max Strain and Quad Fail respectively Also the
strength experienced by the coupons is almost twice as high as that
yielded by the tubes
314 [plusmn45] Laminates
Fig 6 presents the empirical responses of [1] together with
those predicted by [5] and [13] This figure displays good agreement between the linear portion of the compressioh branches of the responses
predicted by the analyses and those experienced by the coupons and
tubes (when true thickness is being considered) It is observed
in this figure that N0LIN[13] predicts significantly less pronounced
8
-nonlinearity than RDS and correlates well with the response
corresponding to the tubes (true thickness) It is also seen
from this figure that the coupons experienced a significantly higher
compression stressing and straining capacity than was predicted by
the analyses The compression response of the tubes when nominal
thickness is considered behaves very similarly to that of the coupons
exhibiting however adonsiderably lower strength value (see Table IA)
Comparing the predicted and empirical tension branches of the responses
it is seen that they display a similar behavior to that already
experienced and discussed for the compression branches
It appears from Table IA and Fig 1A that the analyses predict
a modulus of 204x106 psi which is noticeably lower than the 227x106
experienced by the coupons Also Table lA and Figs 2A and 6 indicate
-that the coupons experienced considerably higher ultimate stresses
(382 ksi) than were predicted by the analyses a maximum value of
313 by RD5[5] and a minimum of 162 by N0LIN Max Stress Note
that Table 1A includes two values for RDS 313 ksi and (60)+ The
second value of 60 defines theultimate stress according to the
computer code of this analysis however this stress value is associated
with very high unresonable and unacceptable strain values The
stress of 313 generated by the computer code was found to be the
last one corresponding to acceptable strain values It is also seen
from Table 1A that the ultimate stress corresponding to the tubes
is close to that predicted by RD5[5] when nominal thickness is
considered and to that yielded by SQ5[81 when true thickness i
accounted for
315 [plusmn600] Laminates
The responses of [1] and those predicted by the analyses of
[5] and [13] are shown in Fig 7 It is seen from this figure that
the responses predicted by the analyses are slightly and insignificantly
different and correlate fairly well with the response experienced by
the coupons However the coupons display considerably higher stressing
and straining capability both in compression and tens-ion than do
the analytical predictions It is also observed in this figure
9
that the compression branch of the response corresponding to the tubes
when true thickness is accounted for correlates very well with the analytical predictions- Good agreement of the tension branch
corresponding to the tubes with the numerical studies is also found
Fig 1A and Table 1A indicate a predicted modulus of 161xl06psi
by SQ5[8] and N0LIN[13] which is slightly higher than 158x106 yielded
by RDS[5] These moduli values are noticeably lower than 172x106
experienced by the coupons and 179x106 obtained for the tubes (true
thickness) As mentioned already above in the discussion on Fig 7
the predicted ultimate stresses are considerably lower than those
experienced by the coupons (see Table 1A and Fig 2A) It is found
in Table 1A that the coupons sustained a strength value of 376 ksi
compared with the highest ultimate value of 308 predicted by SQS[8]
and the lowest value of 195 yielded by N0LIN Max Stress [is]
It is also observed in this Table that the tubes when nominal thickness
is being considered experienced higher ultimate stresses than those
predicted analytically -However once their true thickness is taken
into account they experience a strength of 221 ksi which is in very
good agreement with 223 and 233 ksi calculated with N0LIN Max Strain and Quad Fail respectivelyand with 238 ksi predicted by RDS5]
316 [plusmn750] Laminates
The experimental responses of [i] are displayed together
with the analyticl predictions of [5] and [1s] in fig 8 Good
correlation is observed in Fig 8 between the prediction of N0LIN[13]
and the response experiencedby the coupons Good agreement is also obseived between the prediction of RDS[5] and N0LIN[13] in the low stressshy
strain range while with increase in stress RD5 responds less
nonlinearly than does N0LIN This discussion also applies to comparison
of the RDS prediction with the coupon response It is also seen from
this figure that the tubes (nominal thickness) respond very similarly
to the analytical predictions and the coupons experiencing however
considerably low stress-strain values relative to either the coupons
or analytical predictions (see Table 1A)
10
Comparing the moduli predicted by the analyses it is seen
from Table IA and Fig IA that SQS[8J and N0LIN[13] yielddd an identical
modulus of 181x10 6 psi which is slightly higher than 175x106
These moduli values are lower than 191x106
calculated with RDS[5]
experienced by the coupons and in very good agreement with 175x106
yielded by the tubes when nominal thickness is being considered
Once true thickness is accounted for very poor correlation with
analytical predictions is found (120x06) It is observed in Fig 2A
and Table 1A that the empirical ultimate stress of 360 ksi experienced
by the coupons is in good agreement with 375 yielded by RDS[5] and
325 predicted by N0LIN Max Stress and Max Strain [13] SQ5[8]
is found to predict a considerably high stress of 489 ksi and N0LIN
QuadFail a relatively low stress of 298 ksi The tubes appear
to sustain considerably low stress Values (214 ksi for nominal
thickness)i
317 1 190] Laminates
Like for the [0] laminates the experimental responses of
this laminate configuration are utilized as data input for the computer
codes of the different analyses [5] [8] nd [13] Uence evaluation
of the empirical responses of [1] which are presented in-Fig 9
together with the predicted or rather reproduced ones indicate the-degree
of effectiveness of the analytical models on which the computer codes
are based at least in reproducing the data input Very good agreement
is observed between N0LIN [13] and the experimental response experienced
by the coupons RD5[5] is seen to follow the empirical response in
the range of low stress-strain levels but with increase in stress
values displays less nonlinearity than either the coupons or N0LIN
It is also seen from Fig 9 as well as Table 1A that the tubes
experience considerably lower stress-strain values and a less stiffer
compression response relative to the coupons
Table 1A reveals that RDS[5] predicts a modulus of 184xlO6psi
which is slightly lower than that of 191x106 experienced by the
coupons Fig 2A and Table IA indicate very good-agreement between
the strength of 344 ksi yielded by the coupons and 350 by RDS
11
good correlation with N0LIN[13] predictions 320 332 amp 320 ksi
for Max Stress Max Strain and Quad Fail respectively and no
correlation with SQS[8] ultimate stress of 478 ksi
318 [00900] Laminates
Fig 10 presents the empirical responses of [I] and those
predicted by the analyses It is observed that in the region
corresponding to low stress-strain values there is very good correlation
between the analyses and the empirical compression branch-corresponding
to the coupons However with increase in stress-strain values the
response of RDS[5] deviates slightly from the empirical one while
that predicted by N0LIN[13] becomes pronouncedly nonlinear This
behavior of N0LIN might be explained by recalling the nature of
reproduction observed earlier in Fig 3 for the [0deg] unidirectional
laminate It is also seen from this figure that the analytical predicted
tension branches are stiffer than the tension response displayed by
the coupons However RDS agrees better than N0LIN with the test
results
Table 1A and Fig IA revealvery good correlation of the 882x10 6
empiricalmodulus of 879x106 psi with the calculated ones
by SQS[81 and N0LIN[13] and 899xl06 by RDS[S] Table IA and Fig 2A
indicate that the ultimate stresses predicted by RD5 SQ5 and N0LIN
Max Strain 110 115 and 112 ksi respectively are in very good
agreement with 115 ksi experienced by the coupons The stress of
107 ksi yielded by N0LIN Quad Fail is in good agreement with
the test results and that corresponding to Max Stress 962 ksi
is appreciably lower It is found from Table 1A and Figs 2A and 10
that the tubes sustained very low stress-strain values relative to
either the coupons or analytical predictions
319 100plusmn45090 deg1 Laminates
The experimental responses of [1] together with thb analytical
predictions are shown in Fig 11 It is observed that RDS[5] correlates
well with N0LIN[13] displaying very good agreement for low and moderate
stress-strain levels Fig 11 also displays good agreement between
the response experienced by the coupons and the analytical predicted
12
responses However the coupon response appears to-behave to some extent less nonlinearly and more stiffely than predicted (see Table IA and Pig IA) It is also observed in this figure that the tubes
(nominal thickness) respond similarly to the coupons but sustain very
low stresses (see Table IA)
Fig 1A and Table 1A indicate that SQ5[8] and N0LIN[131
predict a modulus of 632x106 psi which is lower than 642x106 predicted
by RDS[5] and 674 experienced by the coupons It also appears from
Table 1A and Fig 2A that the coupons sustained a considerably higher
ultimate stress (978 ksi) than that predicted by the analyses (850 ksi
by RDS 821 by SQ5 and 687 792 and 648 by N0LIN Max Stress
Max Strain and Quad Fail respectively)
32 BORON-EPOXY LAMINATES (AVCO 550556 MIL DIA)
In additionto the analyses of [5] [8] and [131 the empirical
results of [1] corresponding to this material are compared with the
predicted response by the analysis of [io]amp[ii] The results yielded
by the computer code of this analysis N0NLII should not however
be treated with the same degree of confidence as those of the other
analyses because the data input for thematrixmaterial of this composite
required in the analysis was not provided Hence available information
about the matrix reported in-the literature [10] was adopted Also 4note that no ultimate stress values appear either in Table lB or
Fig 2B because the analysis of [io]amp[Ii] does not predict ultimate
stresses except for the case when the fibers in any of the laminae
reach their assigned strength values
321 Unidirectional [00] Laminates
Like in the case of the unidirectional [0o Graphite-Epoxy
laminates the reproduction capability of the computer codes are again
evaluated The empirical response of [i] together with the reproduced ones are presented in Fig 12 It is observed that the compression
branch of RDS[5] correlates very well with the experiments except
in the neighbourhood of ultimate stress values N0LIN[13] deviates
slightly from the empirical one at high stress-strain levels because
as already mentioned earlier it does not allow for nonlinear behavior
13
in the 11 fiber direction and N0NLIN[10]amp[I1] isseen to bd in very
godd agreement with N0LIN The tension branch of RDS and N0LIN are
almost identical and agree with the coupon response except for high
stress-strain levels when they display less nonlinearity than that
experienced by the coupons The tension branch of N0NLIN is observed to
exhibit less nonlinear effects than either RDS or N0LIN
Table 1B and Fig 2B reveal very good agreement between the
experimental ultimate stress 342ksi and the strength predicted
by RDS[5 and N0LIN Max Stress and Quad Fail [13] 340 ksi by
all of the three SQ5 and N0LIN Max Strain are observed to yield
a slightly higher strength than that experienced empirically 353 ksi
It is seen from Table 1B and Fig IB that except forN0NLIN all the
analyses predict the experimental modulus of 3127xlO6 pstN0NLINyields 0 6 a slightly lower modulus of 3120x106
322 [plusmn150] Laminates
Fig 13 presents the experimental responses of [1] and the
predicted ones It is observed that all of the analyses predict almost
identical compression branches which are in very good agreement
with the response yielded by the coupons-for low stress-strain values
and that expeienced by the tubes when true thickness is accounted
for With increase in stress-strain values the coupons respond more
nonlinearly than predicted by the analyses Also RD51] displays
more nonlinear behavior than N0NLIN[10][II]andN0LIN[l3] Reffering
to the tension branch of the responses it appears that neither of
the predicted responses agrees with the experimental responses
Very good correlation is observed between RD5 and N0LIN in the low
stressstrain range whereas with increase in stress-strain levels
N0LIN displays slightly more pronounced nonlinear behavior At very
high stress values this behavior inverts and RDS displays very strong
nonlinear effects N0NLIN is seen to respond more linearly but
less stiffly than either RDS or N0LIN except for high stress values
where an opposite trend is observed
It is seen from Table 1B and Fig 1B that RDS[S] SQ5[8] and
N0LIN[13] yield a modulus of 2526x106 psi which is slightly higher
14
than 2496x106 predicted by N0NLIN [10]4[II] and also higher than
2365x106 experienced by the coupons Table IB and Fig 2B reveal
good agreement between the ultimate stress of 139 ksi experienced
by the coupons and 133 predicted by SQS[8] Also the strength
of 150 ksi yielded by RDS[5] correlates well with that sustained by
the coupons It is seen in Table IB that only one strength value
was predicted by N0LIN This ultimate strength value of 104 ksi is
appreciably lower than the empirical one Onlyone value was obtained
due to the fact that it was impossible to achieve convergence of the
solution with the algorithm which solves the nonlinear equations of
this computer code It is found from Table 1B Fig 2B and Fig 13
that the tubes sustained very low ultimate stresses relative to either
the -coupons or the analytical predictions
323 [plusmn3001 Laminates
It wasreported in [1] that two batches of coupons were
manufactured and delivered for testing for this type of laminate
configuration and when tested they displayed completely different
responses Hencethe empirical response corresponding to each
batch is presented separately together with the responses predicted
by the analyses in Figs 14A and 14B Fig 14B reveals immediately
that there is no correlation betweenthe analyses and the response
experienced by the coupons and as such wont be discussed any further
Fig 14A displays very good agreement between the compression branch
experienced by the coupons and that corresponding to the tubes when
nominal thickness is considered However it is observed in this
figure as well as TablelB that the tubes experienced very low ultimate
stresses relative to the coupons Referring to the tension branch
of the experimental responses it is observed that the coupons and
tubes respond completely differently one frot another It appears
from Fig 14A that the analytical predictions agree one with another
only in the very low stress-strain range At a stress level of about
200 ksi which corresponds to the ultimate stress of the tubes when
true thitkness is accounted for N0LIN[13] response deviates from
the responses predicted by RDS[S] and N0NLIN [10][Iil while displaying
initiation of pronounced nonlinearity At a stress level of about shy
15
350 ksi a similar behavior is observed for the response of RDS which
deviates from N0NLIN and also displays initiation of pronounced shy
nonlinearity The above discussion applies to both the compression
and tension branches of the analytical predictions Correlation of
the predicted responses with the empirical ones indicates fair
agreement with the response yielded by the tubes (nominal thickness)
No correlation is observed with the response experienced by the coupons
This is rather emphasized in the pronounced nonlinear region of the
responses where the coupons display a very high stressing and straining
capacity realtive to the analyses of RDS and NOLIN The mode of the
response predicted by N0NLIN is observed to differ from that corresponding
to the coupons as it displays less stiff behavior in the range of
stresses corresponding to the almost linear response of the coupons
andweak nonlinearbehavior in the range of high stresses which is
associated with the pronounced nonlinear behavior of the coupons
It appears from Table lB and Fig IB that the coupons experienced
a modulus of 1098xi06 psi which is noticeably higher than 923xl06
predicted by RD55] SQSE8] and N0LIN[13] It is also found that
N0NLIN [10amp][II] predicted an even lower modulus of 887x106 psi
As already discussed above and as can be seen from Table 1B and Fig 2B
the analyses predict ultimate stresses which are significantly lower
than 589 ksi sustained by the coupons It is also observed in Table IB
that no ultimate stress was generated by RDS[5] (The last stress
value corresponding to acceptable strains is 425 ksi and above this
stress the calculated stresses are associated with unacceptable strain
values)
324 [plusmn450] Laminates
Fig 15 presents the experimental responses of [1] together
with thepredicted ones In the range of low stress-strain values
good correlation is found for the tubes (true thickness) with the
analytical predictions but with increase in stress-strain values the
analyses of RDS[S] and N0LIN[13] predicted more pronounced nonlinear
behavior than that experienced by the tubes whereas N0NLIN [10][11]
displays less emphasized nonlinear behavior and also displays a tendency
16
to follow the response experienced by the tubes when nominal thickness
is considered No correlation between the response experienced by
the coupons-and either of the predicted responses is observed in Fig 15
The coupons are found to sustain a considerably higher stress-strain
capacity than that predicted analytically (see also Table 1B and
Fig 2B) This is also observed to be true when correlating either
representation of the responses experienced by the tubes with the
predicted responses in spite of the fact that the tubes display a
considerably low stressing capacity relative to the coupons (Note
that the straining capability of the tubes ts of the samemagnitude
of that experienced by the coupons)
Fig 1B and Table 1B indicate that N0NLIN [10][l1] predicts a modulus of 257x106 psi whichis in very good agreement with 253
experienced by the coupons RDS[5] SQ5[8j and N0LIN[1SI yield a
lower modulus of 246x1066 which is in good agreement with 239x106
experienced by the tubes (truethickness)
Comparing the ultimate stresses predicted by the different
analyses with the empirical strength values experienced by the coupons
it is found from Table lB and Fig 2B that SQ5[8] predicts a strength
of 356 ksi which is in very good agreement with 351 experienced
by the coupons N0LIN[13] yields very low strength values which are even considerably lower than those experienced by the tubes RD5[53
again generates meaningless stresses (see discussion above on the
[plusmn300] laminates)
325 [plusmn600] Laminates
The empirical responses of [1]together with the predicted
onesare presented in Fig 16 Poor correlations is observed among
the responses predicted by the different-analyses Fig 16 displays
good agreement between the responses experienced by the tubes (true
thickness) and the coupons however the coupons exhibit appreciably
higher stressing and straining capability than do the tubes Also it
is observed in this figure that N0NLIN [1o]h[i1] correlates well with
the experimental responses except for high stress levels where it
predicts less nonlinear behavior than that observed experimentally
17
It is observed in Fig 16 that in the range of low ttresses and
strains the response of N0LIN[131 also agrees with the empirical
responses however at a very low stress of about 100 ksi it deviates
from the empirical one and displays strong nonlinear behavior As
can be seen from Fig 16 this results in a considerably lower stressing and
straining capability relative to the coupons Correlating the response
predicted by RDS[S] with the experimental ones itisobserved inFig 16
that its response is stiffer and less nonlinear than that observed
for the coupons
Table 1B-and Fig lB indicate that RDS[5] SQS8] and N0LIN[13]
yield a modulus of 221x106 psi which is noticeably higher than 184x106
predicted by N0NLIN [101amp[111 These moduli are higher than 162x106
observed for the coupons
Comparing the ultimate stresses predicted by the different
analyses with the experimental strength values it is seen from
Table IB and Fig 2B that SQ5[8] predicts a high strength of 500 ksi
compared with 318 experienced by the coupons whereas N0LIN[131
predicts relatively low strength values 173 for Max Stress 180
for Max Strain and 205 ksi for Quad Fail No ultimate was generated degby RD5 (see discussion on [plusmn30 ] laminates) It appears from Table lB
and Figs 2B and 16 that the tubes (nominal thickness) yielded the
highest ultimate stress for this particular laminate
326 [plusmn750] Laminates
Fig 17 presents the experimental response of [I] together
with the predicted ones No agreement among the different predicted
responses is observed in this figure Good agreement between the
compression branch corresponding to the coupons and RDS[S] is observed
very good correlation in the almost linear range of response whereas
with increase in stress RDS responds less nonlinearly than do the
coupons Good agreement of N0LIN[13] response with the coupons is
also observed in Fig 17 in the range of low stresses and strains
(linear range) however with increase in stresses the response of
N0LIN deviates from the empirical one while displaying an appreciably
more pronounced nonlinear response The response predicted by N0NLIN
18
[101[111] is observed to display more emphasized nonlinear behavior
than N0LIN and does not agree with either the experimental response
or RDS and NOLIN predictions In regards to the tension branch of
the responses it is observed in Fig 17 that there is good agreement
among the different analyses and between the analyses and experimental
response (Note that tubes are not presented in the present evaluation
See [i)
Table iB and Fig iB indicate that the experimental modulus of 279x106 is in very good agreement with 276x106 calculated with
RDS SQ5 and N0LIN N0NLIN is found to predict a lower modulus of
197x106 psi It appears from Table lB and Fig 2B that the empirical
ultimate stress of 348 ksi is considerably lower than 446 predicted
by SQS[8] and is in good agreement with the strength value of 319
yielded by N0LIN Max Stress [13] N0LIN Max Strain and Quad Fail
are found to predict low ultimate stress values 264 and 285 ksi
respectively Again like for the [plusmn30 deg] laminate no ultimate stress
was predicted by RDS[S]
327 [900] Laminates
As with the IoV] unidirectional laminates the reproduction
capability of the different computer codes is evaluated In Fig 18
the empirical responses of [1] are presented with the predicted-ones
It is observed that in the range of moderate stress-strain levels
reproduction by both RDS[S] and N0LIN[13] is very good With increase
in stress levels both predictions deviate from the empirical response
experienced by the coupons while displaying a less nonlinear behavior
than that observed for the coupons a trend which is more emphasized
for N0LIN It is also observed in this figure that there is good
agreement between the experimental responses corresponding to the
tubes (nominal thickness) and coupons however the tubes sustain
a considerably lower ultimate stress than that experienced by the
coupons (see also Table IB) Referring to N0NLIN response [101amp[111]
it is seen from Fig 18 that this analysis predicts an appreciably
lower stressing capacity than that observed for the coupons and
predicted by the other analyses This response is found to be in very
19
good agreement with that experienced by the tubes when true thickness
is accounted for Comparing the tension branch of-the-predicted responses as
well as theeihpirical ones of Fig 18 very good agreement is found
It appears from Table IB and Fig IB that RD51J SQ5[8] and
N0LIN[13] reproduce the modulus of 298x106 psi experienced by the
coupons whereas N0NLIN [0]0[i11] predicts a considerably lower modulus 6of205xlO Comparing the ultimate stresses yielded by the different
analyses with the empirical ones it is found from Table lB and Fig
2B that the stresses of 320 ksi predicted by NOLIN Max Stress and
Quad Fail are in very good agreement with 317 experienced by the
coupons Good correlation is also observed between the empirical
stress and 341 ks predicted by N0LIN Max Strain It is also observed
in Table lB that RD5 yields a similar stress of 340 ksi for the last
acceptable-strain value
328 [00900] Laminates
The experimental responses of [1] and the ones predicted by
the analyses are presented in Fig 19 Comparison of the analytical
predictions with the response experienced by the coupons reveals very
good agreement between the empirical response and RD[51] as well as
very good agreement with the predictions of N0NLIN [101amp[11] and N0LIN[13]
in the range of moderate stress-strain values With increase in stressshy
strain levels N0NLIN and N0LIN which predict almost identical responses
display some minor nonlinear behavior which is hot observed for the
coupons Note that N0NLIN and N0LIN yield strength values which are
in good agreement with that predicted by the coupons whereas RDS
yields an appreciably lower stress (see Table lB and Fig 2B) It
is also observed in Fig 19 that once the true thickness of the
tubes is accounted for they respond wimilarly to the coupons but
fail at a considerably lower strength value (see Table iB)
It is found from Table 1B and Fig lB that N0NLIN yields the
lowest modulus 1667x106 psi N0LIN and SQ5 predict a modulus of
1715xlO6 which is in very good agreement with the empirical one of 6 6
1717x10 and RUB yields a slightly higher modulus of 1721x10
20
Table 1B and Fig 2B indicate very good agreement between
the strength of 230 ksi observed for the coupons and 220 yielded
by N0NLIN Also it is observed that all other analyses predict lower
ultimate stress values than that experienced by the coupons
deg329 [0degplusmn45090 1 Laminates
In Fig 20 the experimental responses of [1] are shown together
with the ones predicted by the analyses Very good agreement is observed
between the response yielded by the coupons and those predicted by
the analyses in particular the one calculated with N0NLIN [10311]
No correlation is observed in Fig 20 between the response observed
for the coupons and either version of the responses experienced by
the tubes
It is seen from Fig IB and Table IB that N0NLIN predicts a 6 6moIulus of 162x10 psi which isslightlyhigher than l147x10
experienced by the coupons and -slightly lower than 1187 yielded by
either SQ518] or N0LIN[3I] and i192xlO predicted by RDS[5]
Comparing the ultimate stresses experienced empirically and those
-predicted analytically it appears from Table 1B and Fig 2B that
N0NLIN strength of 141 ksi is in good agreement with 158 ksi bserved
for the coupons whereas N0LIN[13] in spite of its very good ageement
with the coupons mentioned above yields a stress of 125 ksi fQoMax
Strain and lower stresses of 121 and 113 ksi for Max Stress and
Quad Fail respectively It is also observed that RDS[S] predicts a
noticeably lower ultimate of 130 ksi and SQ5[8] a strength of 134
4 CONCLUSIONS
(a) None of the analyses namely RD[51] SQ5[8] N0NLIN[10][l1]
and N0LIN[13] utilized in the present comparison studies is
found to be adequate to predict satisfactorily the compression
response of angle-ply laminates
(b) As mentioned in the text of this report the responses corresponding to the unidirectional laminates which were experienced
by-the compression coupons of [l]were utilized as data input
for thecomputer codes RDS SQ5 and N0LIN It is observed from
21
the present comparison studies for the angle-ply laminates that
in spite of this the predicted response with these codes do not
favor the responses experienced by the coupons better than the
ones observed for the tubes For some laminate configurations
better correlation is observed with the responses yielded by
the tubes
(c) Present numerical studies indicate that no unique compression
responses were predicted by the various analyses employed in
the present comparison studies for the large variety of laminate
configurations invesrigated For some laminate configurations
considerably different responses were predicted for the same
laminate by the various analyses
(d) The analyses were found to be inadequate to predict the ultimate
stresses of the angle-ply laminates The built-in failure
mechanisms in the analytical models were not verified by the
test results because of very poor correlation between the calculated
strength values and those observed experimentally
(e) The very good correlation of the predicted moduli with the
empirical onesand the pronounced disagreement among the predicted
ultimate stresses nibther verifies nor contradicts the influence
of the edge effects discussed in Appendix B In view of the
arguments in this Appendix and the lack of success of a sound
test program with the compression tubes of [11 coupons having
different dimensions than those employed in [1] should further
be tested to accomplish the objectives of the test program of
[1] and present comparison studies and evaluations
6
22
REFRENCES
1 T Weller tExperimental Studies of Graphite-Epoxy and Baron-Epoxy Angle Ply Laminates in Compression NASA CR 145233 Sep (1977)
2 R T Haftka and J H Starnes JR-- Application of an Interior Penalty Function for Structural Optimization -AIAA Paper 75-764 t1975)
3 SW Tsai - Strength Characteristics of Composite Materials - NASA CR-224 April (1965)
4 S W Tsai D F Adams and D R Doner - Analysis of Composite Structures - NASA CR-620 November (1966)
S P H Petit - Ultimate Strength of Laminated Composites -
Report FZM-4977 prepared for Advanced Filaments and Composites-Division Air Force Materials Laboratory Air Force System Command Wright - Patterson Air Force Base Ohio December (1967)
P H Petit and M B Waddoups -AMethod of Predicting the Nonlinear Behavior of Laminated Composites -J Composite Materials Vol 3 p 2 January (1969)shy
7 K 0 Chiu - Ultimate Strength of Laminated Composites -
J Composite Materials Vol 3 P 578 July (1969)
8 D L Reed - Point Stress Laminate Analysis - Report PZM-5494 prepared for Advanced Composite Division Air Force Materials Laboratory Air Force Systems Command Wright - Patterson Air Force Base Ohio April (1970) (Also T J Muha - Users Manual for the Laminate Point Stress Analysis Computer Program SQ5 as Revised by AFFDLFBC - AFPDL-TM-74-107-FBC July C1974))
9 H T Hahn -Nonlinear Behavior of Laminated Composites -
J Composite Materials Vol 7 P 257 April (1973)
10 R L Foye - Theoretical Post Yielding Behavior of Composite Laminates Part I Inelastic Micromechanics -J Composite Materials Vol 7 p 178 April (1973)
23
11 R L Foye - Theoretical Post Yielding Behavior of Composite Laminates Part II Inelastic Micromechanics J Composite Materials- Vol 7 P310 July (1973)
12 R S Sandahu-- Nonlinear Response of Unidirectional and Angle-Ply Laminates - AIAA Paper 74-380 April (1974)
13 Z Hashin D Bagchi and W B Rosen - Nonlinear Behavior of Composite Laminates - NASA CR-2313 April (1974)
14 T Weller - Experimental Studies ofGraphite-Epoxy and Boron-Expoxy Angle Ply Landnates-in Shear NASACR 145232 Sep (1977)
15 W D Whetstone - Structural Network Analysis Program -
Users Manual Static ANAlysis Version V70E LMSC-HREC D162812 December (1970)
24
APPENDIX A
It has been pointed out in the section on the Numerical studies
that the computer codes RDS15] and N0LIN[15] require the existence of
the unidirectional [00] and [90] laminae responses in tension
compression and shear for their application The images of these
data inputs or library data input are presented in Tables APA-1A and
APA-IB as being input into RDS code In addition to the data in these
Tables also required by N0LIN the information presented in Table
APA-2 has to be provided to operate the N0LIN code (Instead of feeding
N0LIN with the stress-strain data input for the responses one may
use the Ramberg-Osgood parameters as explained in [13] and avoid the
utilizing of curve fitting alegorithms to generate these parameters)
The mechanical properties given in Table APA-2 are also required
as data input by SQ5 code
It was mentioned in the section on Results and Discussion that
the data input for the matrix material of the AVCO 5505 Boron-Epoxy
laminates was taken from [10][l1] The mechanical properties are as
follows
Young Modulus of Matrix 510000 psi
Shear Modulus of Matrix 200000 psi
Poissons Ratio of Matrix 310
and the equivalent stressequivalent strain curve is reproduced from
these references SLI = 106ESI = 5000 SL2 = 5x10⁶ ES2 = 10000 SL3 = 19x106 ES3 = 15000
ES4 = 20000 SL4 = 1Oxl06
ESS = 25000 SL5 = 3230
ES6 = 30000 SL6 = 0
25
The Boron fiber properties are Provided by the manufacturer and
are as follows
Young Modulus of Fiber 58x106 psi
Shear Modulus of Fiber 2375x106 psi
Poissons Ratio of Fiber 200
Fiber Tension Ultimate 500 ksi
Fiber Compression Ultimate 750 ksi
26
APPENDIX B
Ithas been mentioned in [I] that edge effects might be induced
far away from the loaded boundcaries of the coupons resulting in an
unevenstress-strain distribution even for a-coupon loaded uniformally
This kind of behavior was experienced by all the angle ply laminates
of []
When the coupon is loaded in a manner described in Fig APB
allowing for a uniform axial displacement u=(-S) and completely
restraining the lateral displacement y = 0 along the loaded boundaries
plusmn12 it is anticipated that the coupon width or rather its aspect
ratio AR = 1 will have an appreciable influence on the stressshy
strain distribution of angle-ply laminates possessing high Poissons
ratios
Withthe prescribed boundary conditions the specimen might
experience an induced transverse stress approaching in the limit a
stress of
ay= Gx yx
A wide specimen will contain a wide zone of continuous fibers subject
to this high degree of lateral restraint Consequently this zone will
result in both higher stresses and stiffnesses than the regions close
to the free edges of the coupon where the filaments are noncontinuous
and hence shear the load from the termination of one diagonal fiber
into the begining ofan adjecant one through the matrix This of course
will result in an unknown uneven stress-strain field which renders wide
specimens unsuitable for application The stress is picking up towards
the center and hence ishigher than the average stress utilized to
present the response of such specimens On the other hand too narrow
specimens will be affected primarily and subject to the edge effect
which-will reduce both their strength and stiffness
A numerical study was carried out to determine the actual
lateral edge effect combined withPoissons ratio and to define the
best aspect ratio ie the minimum length of the coupon1 free
27
of lateral boundary influence at least along its center line transverse
to the direction of applied compression SNAP computer code [15] was
used for this purpose and the obtained results are presented in Fig
APB-2 The coupons of [1] have an aspect ratiq AR=75 which according
to Fig APB-2 is too short to eliminate the lateral boundary influence
The above discussion calls for a different type of specimen
Indeed tubes were also tested and reported in [1] A tube is free
of the free edge region but on the -other hand is susceptible to
another deficiency if the radial displacementsat the loaded boundaries
are prevented from expanding to allow for Poissons expansion high
bending stresses develop at the restrained boundaries These stresses
might precipitate early local failure at the specimen edges or might
be superimposed on the compressive stresses in case the tube is too
short again bringing about failure at a stress lower than the ultimate
one corresponding to the tested laminate
TABLE 1A Compression Response - Comparison of Experimental Ultimate Stresses and Moduli With Analytical Predictions of RDS[S]
SQs[S1 N0NLIN[101amp[11] and N0LIN[13]
GRAPHITE-EPOXY LAMINATES -3m SP-286T3
EST RESULTS OF [1] ANAL RDS [5 ANAL SQS [8) ANAL NPNLIN ANAL N0LIN [13]
Laminate
Configuratlon
ompressionCoupons
Ult Comp Cop Mo Stress __(si) x1Opsi)
Compression TubesU
Mo M esod
Thick Thick 6 ks(ksi) ksi x O si)
Ultimate
CoSteStress
(ksi) 6
xlO si
Ultiate
(ks ) 6ai ps
Ultimate
Co Stress ksi ops )
015 Com stress (kst
Max Max quad Stress Strain InteracIl Fal Faill
Ex
(x O psi)
[00]
164 191 115 664 510
200 1609 20911 1607 8011
20911 180 1607
[plusmn15 ] 117
1394 105 826
1842 [14251
105 1324 --
11722 -
1324 14022 10622 929 1324
[plusmn30] 548
5911 374
687 292
357 283
246
286 224
811 [655]
400 1
575 48722 576 43412 37622 288 575
[plusmn453 382
227 289 234
312 [251]
313 (60)1
203 25122 204 16212 19712 175 204
[plusmn601 3547 172
222 163 251 238 158 30812 161 19512 22312 233 161
[plusmn731 312
360
191
5376321 194
214
221 14
150
[1793
175
[120]
375 175 48922 181 32522 32522 298 181
330
344 [191
155
241
102
180 132
1101-3 350 184 47822 191 32022 33222 320 191o
111 115115898
879 294
493382 287
42229 835[7791
110 1
899 11511 883 96211 11211 107 883
[0__48deg 97 _674 76[979476 359 71571 as 642 82111 632 6871 79 211 648 632
2Corrected for measured thickness
A11 Failure in compressionor tension in laina 11 direction A2 F1
1-(inch) n2540x1 2 meter
I pound fo ce - 4448222 Newton (N)kip = 10 poundtrce
b)
)+ Ulitimate stress values corresponding to very high unreasonable strain values upper number - last stress value which corresponds to an acceptable strain value
TABLE 1B Compression Response - Comparison of Experimental Ultimate Stresses and Moduli With Analytical Predictions of DS[5]
SQs[8] N0NLIN[10]G(li] and N0LIN[I3]-
TEST BORON-EPOXY LAMINATES (AVCO 550556 MIL DIA)
SANALRESULTS OF ANAL RDS (5] ANAL SQ5 -
(8] NLINAL0NL N AANLN[3ANAL N0LIN [13]
Laminate
Configuratio
Compression Copons
lt EStressCmpComp Mod
Compression Tubes
UltCom Stres m MeasuredThick x
Ultimate
CompStress
Ex
Ultimate
CompStress
Ex
Ultimate
ConyStress
Ex
Comp Stress (ksi)Ult
x Stress Strain Interac
Bx
(ksi) (xIO 6psi) (ksi) tksi) (xl06psi) (ksi) (xLOp$i) (ksz) (x06psi) (ksi) (xlO psi) si__ (xlO6psi)
10] 263
342 3127 - - 3340 3128 35311 3127 3120 54011 35311 340 3127
[1300]
( 45]
135 2365
139
947 5551095 O9
961 S89
337
253 351 308
838
918 290 3 300
255
280 331
576
680 206
2T4
194
204 234I
3749 [2685]
1111 [800]
323 [239]
150 2527
425 - 923 (NoULTOBT)OET
135 246 (NOULTOBT)
13322
4422
350612
2526
923
246
2496
887
257
32122
11212
10422
24622
11SIZ
246
115
2526
923
246
[plusmn601l 318 333
162 387 274
264 199
397 (272]
300 (NOULTOBT
221 50022 221 184 17312 18012 205 2 21
[plusmn7S) 348
279 2 311
19360 214 (64)+
276 44622 276 197 31922 26422 285 276
[90deg]
(090]
298
517 179
1
298
177
178
2171 206
126
143 1 8
339 [232] 2534
340
(38)+
190
299
11
1721
44722
194 111
298
1715
220
205
1667
32022
17611
34122
18411
320
21
298
1715 t
230 233 157 [1773] k
[0iplusmn4rso] 146
158 1147
137
147
881
874 1665
_110201 130 1192 13411 1187 141 1162 12111 12511
1 113
1 1 1187
1 q 1
Fiber failure in D degree layer
Calculations exceeded maximum observed experimental strain values
Solution does not converge
[ 3 Corrected for Measured thickness Ail Failure in compressionor tension
in lamina 11 directionIi
-2II (inch) = 2540x10 2 meter Tmi) I pound fojee = 4448222 Newton(N)
psz = 69477x10ound f rPascal (Pa)
)+Ultimate stress values corresponding to very high unreasonable strain values- upper number shy last stress value which corresponds to an acceptable strainvalue
A22 Failure in compressionor tension
A12 Failure in shear
I ksi i 105 psi
LIBRARY DATA FOR MATERIAL 2 - - SMSP2B6T-3(A-S)LEA1FA INPUT
SIGTO EPSTO SIGT9O EPSTS0O SIGCO EPSCO SIGC90 YPSCc9o
013500E 05 080000E-0 09O0000E 03 06000E-03 022500F 05 014000E-02 O46000E 04 025000E-b2 026500E 05 0O16000E-02 018000E 04 012000E-02 045000E 05 028000E-02 090006t 04 0500Q0E-02 O405hOE 05 O24OOOE-02 -026700E 04 018000E-02 067500E 05 02000E-02 013250E Oi 075000E-2 054500E 05 03200t-02 Q4860E 04 024000E-02 087200E 05 056000E-02 016800E 05 OlOOOE-01 069000E 05 00000E-02 042700E 04 q30000t-02 010670E 06 070000E-02 020500E 05 012500E-01
048 0 0 0E- 0 50 8 0 0E 04O3500E 05 0 2 036 000 E-02 012560E 06 O840OE-02 02375OE 05 015000F-01 097500E 05 056000E-02 058300E 04 O042000E-02 O14OE 06 098000E-02 026600E 05 ot17500E-Q1 011150E 06 064OOE-02 066200E 04 048000E-02 016250E 06 011200E-01 029100E 05 020000E-01 012559E 06 072000E-02 073600E 04 0540O0E-02 017900E 06 012600E01 031400E 05 p22500E-O1 013950E 06 08000E-02 081000E 04 060000E 02 019400E 06 01400OE-01 033500c 05 0250nOE-01 00 08BOOOE-02 00 amp66000E-02 00 0154600E-01 00 027500E-01 00 096000E-02 00 072000 E-02 00 016800E-01 00 03000AE-01
SIG45 EPS45 TbU12 CNL12 1 TNU21 CNU21
012540E 0 022000E-02 031400E 00 024000E 00 027911E-01 027477E-01 025080C 04 044000E-02 031600E 00 026000E 00 029169E-01 028073E-01 037620E 014 066000E-02 031800E 00 027500E 00 026349E-01 029089E-01 O5IOO1 E 04 0880OOE-02 0319nOE 00 028000E 00 024609E-01 028256E-01 058500 04 0i1000E-01 032000E 00 030000E 00 023246E-01 031877r-01 064000E 04 01300E-01 032000E00 031500E 00 023835E-01 030333E-01 069600E 04 015400Fr01 032000 00 03250OE 00 02857E-01 027590E-01 074000E 04 017600E-01 032000E 00 033000E 00 024076E-01 025525E-01 077500E 04 01VSOOE-01 032000E O0 033500 E 00 022552E-01 P26150E-01 080500E 04 022000E-01 031900E 00 034000E 00 022482E-01 026656E-01 00 024200E-01 0 00 00 0i0 00 026400E-01 00 00 00 00
TABLE ApA B- INPUT LIBRARY DATA FOR MATERIAL -1 - - AVCO 550556
SIGTO EPSTO SIGT9O EPST9O SIGCO EPSCO STGCSO CpSc90
021700E 05 043400E 05 065100E 05 086800E 05 010850E 06 0130206 06 015190r 06 017360E 06 Olq530E 06 021700F 06 00 00
070000E-03 0o4OOOE-02 O210OOE-02 028000E-02 035000E-02 042000E-02 049000t-02 056000E-02 0630OE602 070006E-02 077000E-02 084000E-02
011500 04 023000E 04 033500E 04 043400E 04 052700E 04 0610OE 04 070600E 04 078500E 04 084500E 04 089000E 04 00 00
04000E-03 080000E-03 012000Er02 016000E-02 020r00E-02 024000E-02 028000E-02 032000E-02 036000E-02 040000E-02 044000E-02 048000E-02
031270E 05 062540E 05 093810E 05 012508F 06 015635E 06 018762E 06 022100E 06 025400E 06 028800E 06 03l000E 06 00 00
010OOE-02 920000E-02 030000E-02 040000E-02 050000E-02 0600OOE-02 070000E-02 080000E-02 090000E-02 016000-01 011000E-01 012000E-01
044800E 04 069500E 04 013150E 05 016800E 05 020200E 05 023100E 05 025750E 05 028000E 05 031000E P9 031700E 05 00 00
015000E-02 - 030000E-02 045000E-02 96000E-02 075000E-02 090000E-02 010500E-01 0120006 1 013500E-01 0150OOE-01 0165O6E-01 oaeooor-Oi
SIG45 EPS45 TNU12 CNL12 TNU21 CNU21
0BgPE 04 033200E 04 042500E 04 0116500E 04 048500E O 050500E 04 052200E 04 053500E 04 055000E 04 O596000E 04 00 00
02700E-02 054000E-02 081000E-02 0108OOE-01 013500E-01 016200E-01 018900E-0 02tOOE-01 024300E-01 027000E-01 029790E-01 032400E-01
022700E 00 022700E 00 022700E 00 022400E 00 022400E 00 022400E 00 0224006 00 023000E 00 023300E 00 022700E 00 00 00
02640nE 00 026600E 00 026800E 00 026800E 00 027000E 00 02720 0 E 00 027500E 00 028000E 00 029000E 00 032000E 00 00 00
021052E-01 021052E-01 019222E-01 017884E-01 016800E-01 016439E-01 158976-01 014653E-01 011274E-01 0823806-02 00 00
025215E-01 025350E-b1 023997E-01 020855E-01 019572E-01 016817E-01 014555E-01 0i2727E-01 017059E-01 028118 -02 00 00
00 -
32 ou~IGV AGT32~ jO Q1JA1ATY
TABLE APA-2 Unidirectional Lamina Properties Utilized In The Predictions Of SQS9] and N0LIN[14]
3M SP-286T3 AVCO 550556 Mil GRAPHITE-EPOXY BORON-EPOXY
(Ell)Tension 1687x106 psi 3100xlO6 psi
(E11)Coinpression 1607x106 psi 3127x1O6 psi
(E22)Tension 152x106 psi 288x106 psi
(E22)Compression 191x106 psi 298x106 psi
GO2 057x106 psi 066x106 psi
(aULTll)Tension 140 ksi 220 ksi
(eULTllTension 008 007
(cULTll)Compression 180 ksi 340 ksi
(eULTll)Compression 013 0113
(t ULT22)Tension 8 ksi 89 ksi
(ULT 22)Tension 006 00405
(aULT22)Compression 32 ksi 32 ksi
(EULT22)Compression 025 015
((ULT12) 81 ksi 56 ksi
(CULT12) 022 0275
(v12)Compression 230 267
(v12)Tension 298 216
-1 (inch) = 2540x10 2 meter Cm)
1 pound force = 4448222 Newton (N)
I kip = 103 pound force
I psi = 6894757x105 Pascal (Pa)
I ksi = 103 psi
A test results [1] (coupons)0 analysis (8] amp 131
I00
w CL
10
-0
5
66
0 I I I I I I Cgt t C00o
01 +1 +1 +shy
g LAMINATE CONFIGURATION
FIG 1A YOUNGS MODULUS OF 3M SP-286T3 GRAPHITE EPOXY LAMINATES ASAFUNCTION OF LAMINATE CONFIGURATION
30 7A test results [i](coupons)0 analysis [81 amp [131 v [10] ampIll]
C o
w 20
109
0I III I I I + +1 +1 +1 +1
LAMINATE CONFIGURATION 0
FIG 1B YOUNGS MODULUS OFACO 5505(56MIL DIA BORON-EPOXY LAMINATES AS AFUNCTION OF LAMINATE CONFIGURATION
200t 200 3 0 mxx stress falla test results [1) (coupons) analysis NOLIN 03] V max strain fail
0 analysis RD 5 [5] r[ quadr interaction 0 analysis SQ5 [8] fail
150 150
0x(0
a
0~ARA 0
100- V13 100- 0
A A
A
50- 0 0 0 50shy000 v A A
0 A 13 V 0 0
0 in 0 10 0 O 0 to CD +1~j4 3 + +1 owi +1 +1 +1 4
LAMINATE CONFIGURATION LAMINATE CONFIGURATION
FIG 2A ULTIMATE STRESS OF 3M SP 286T3 GRAPHITE EPOXY LAMINATES AS AFUNCTION OF LAMINATE CONFIGURAiON
A tests results [1] (coupons) 0 maxstressfail 0 analysis RD5 [5] analysis NLIN [13] v max strain fail
300 0 analysis SQ5 [8] 300 0 quadr interaction fail
200
00
-A
200 -3
A
100 00
A A0 100 A
09 0A
o
0 LO lcent
O O -t to
TL +1 + 1 +1 1 LAMINATE CONFIGURATION
FIG 2B ULTIMATE STRESS OFAVCO LAMINATE CONFIGURATION
0 C gt 1LO L O C La mmO) rt
+ 1 + 1 + 1 + 1 4 LAMINATE CONFIGURATION
550556 MIL DIA BORON-EPOXY LAMINATES AS A FUNCTIONOF
200 -+ A
o 0
A
o 0~
ab A
0 Aa AA
0shy 0500shy
15-15 - 0 0l FIG Z
-0
OMPESIONRESONEO 003MSP-66T GAPHTE-POY LMINTA
AxC)0o00A
001 A0e
_150
0
0 00
0
coupons 0
00 0
u coupons
100 tubes nom
thick A
0
ubes horn thick
tubes t thickK 077 tubes tthick
50 -
-15 -10 -05 0 05 10Ex (4) 6 (0)FIG 4 COMPRESSION RESPONSE OF plusmn15 deg 3M SP-286T3 GRAPHITE-EPOXY LAMINATES
75
0C
E 50
coupons coupon 00
a 00 tubes noa oo
tubes tubes fern
0A
tubes t~ 4 tubes tthick 25 thick - shy
cento 4 AOa
0-10 -05 Ex (0) 0 y 05 10 15
FIG 5 COMPRESSION RESPONSE OF -30 3M SP-286T3 GRAPHITE-EPOXY LAMINATES
40
30-S
tubes hnmhick tubes nom
tik
a
20--
a-P III
-5 -3
FI30OMRESONtubes
-4
tubes tthick
2co1upo1s
FLJ-5 3 M28Thick
IF- PO
tues fain thIkEshy
tubes trthick
(60)
10G COPESONRSOSE-5 3MS-8t-RPIEEOY AIAE
40
couponstubes nor
copn thick
nomn btubes thick th
30CL
U
1shy
o
S-4 -3 -2 -ex (0) 0 y 2
degFIG 7 COMPRESSION RESPONSE OF +-60 3M SP-286T3 GRAPHITE-EPOXY LAMINATES
40
CL E 0 U
30
U) coupons
A
A
coupons
A
20-
0
tubes nom thick
0
tubes nom thick
-
tubes t thick
tubes t thick
10shy
-3 -2 -1 Ex() Cy (1)
FIG8 COMPRESSION RESPONSE OF plusmn750 3M SP-286T3 GRAPHITEEPOXY LAMINATES
-4 0
35 +
CL o0
Di couon coupons
S25
bull--
20shy
--
tubes nom thick
tubes nom thick
t
15-tubes
thick t
tubes tthickN N
10 -N
NN
0n -25 -20 -15 -10 ex -05 0 ey 05
FIG 9 COMPRESSION RESPONSE OF 906 3M SP-286T3 GRAPHITE-EPOXY LAMINATES
120
100- A
2 coupons
E080 A 2 0
60shy
thick tubes nom hidk
40shy
tubes t 20- tubes tthick - thick
0shy-16 44 -12 -10 -08 -06 -04 -02 0 02
FIG 10 COMPRESSION RESPONSE OF 0900 3M SP-286T3 GRAPHITE-EPOXY LAMINATES y
100
oo coupons
ns coupons
0
UIi75 - -
50- C
tubes nom tubes nor thick thick
25 tubes tthick Kc_ tubes tthick
-20
FIG11
-15
COMPRESSION -1o
RESPONSE OF 0145900
-05 0 05 e1 (C) OE y (0)3M SP-286T3 GRAPHITE-EPOXY LAMINATES
10
400
(0
6 coupons coupons 200- shy
100 shy
-12 -10 -08 -06 -04 Q02 0 0Q2 ey 04 FIG 1V COMPRESSION RESPONSE OF 00 AVCO 5505156 MIL DIA BORO-EPOXY LAMINATES
150- +-- V
o
U)
In
_
A coupons
100 tubes florn
E
nom
tthick
tubes tthick-- t
copos7L A
V(10
-otubesnomathick ov
tubes tik IV deg tub es t t h ic k o
50 0
10
001
I
FIG 13
-05 0Eri)
COMPRESSION RESPONSE
A H I
05ey (0)
OF t 150 AVCO 5505 BORON-EPOXY
10
LAMINATES
15
75
0v VU)InI v v 03pn coupons
degu v
- 50v V
(no ultobt) A (no ultobt)amp
25- 0
tubes nom thick 04 tubes nom thick
tubes tthick0 tubes tthick
- Q5 0 05 10 15Ex (sect) Ey (dego)
FIG 14A COMPRESSION RESPONSE OF plusmn300 AVCO 550556 MIL DIA BORON-EPOXY LAMINATES (BATCH 1)
20
100
0
0
U
75
(no V V V
V50 -- V V -o uponsV (outat)v (no ultobt)
nora tubes 47
VAnom 0V thick AV
25tubes noma th
tubest~thikK~iVx tubes tthick
5 -D -05 E M0 (o) 05 10 15
FIG 14B COMPRESSION RESPONSE OF plusmn300 AVCO 550556 MIL DIA BORON-EPOXY LAMINATES (BATCH E1)
40
0
CLcuoscoupons
E 0 v
30shy
230 ---shy
thick thick -S- -- - tin
20- tube2 k- -shyc
1 e thick
(noul Xe (no ult)
10- (t A
0 04 ey SA)x (15FIG 15 COMPRESSION RESPONSE OF plusmn450 AVCO 550556 MIL DIA BORON-EPOXY LAMINATES
_ _ _ _ _
40
tubes nom thick V
tubes nom thick
c-oupons v (no ult obt) v n
(no ult30- A obt) VA coupons
0
~hck tubes tthick2tbs8 ZE AA
00 In AA_
vA 0 b 0 A 0
A 00 0
0 10 AA
OI I I -5 -4 -3 -2 1 ( y 2
FPAxI E y ()MFIG 16 COMPRESSION RE-SPON$EOFi60 AVCO -550556 MIL DIA BORON-EPOXY LAMINATES-
40
(64 ksi) (64)
30
oV CO
coupons
0A 0
AA A coupons
0-A 5
20
0
0 00
10shy
00
V
-25 -20 -15 -10 -05 0 05eF (0) Ey (CI)05FIG 17 COMPRESSION RESPONSE-OF +-750AVCO 5505156 MIL DIA BORON-EPOXY LAMINATES
40 -
C
En Ult 3 0 L
0 deg 3 0 - cou on coupons u
830
tubes nom 20 V thick
tubes nom thick V
-tubes tthicdk
thick 10shy
-16 -14 -12 -10 -08 -06 -04 -2 0 2 ei () ey (0)
FIG 18 COMPRESSION RESPONSE OF 906 AVCO 550556 MIL DIA BORON EPOXY LAMINATES
2-250 upons coupons
CL tubes nom thick tubesno]
ktubes t tubes t
0 thick thickS 150- O
0
wA
201 thck
50
-14 -12 -10 -08 -06 -04 -02 0 02 ex (0f) ey (l)
FIG 19 COMPRESSION RESPONSE OF 0900 AVCO 550556 MIL DIA BORON-EPOXY LAMINATES
200
2 0
E coupons
150 tubbs nom tubes thick nom
thick
100
tubes t tubes thick tthick
50shy
- I
0-15 -10 -05 05Lx () 00 y (l) 0
FIG 20 COMPRESSION RESPONSE OF 0145900 AVCO 5505156 MIL DIA BORON-EPOXY LAMINATES
IxJu
uniform compression
L u=-8 I I I I I
I Ib
I 1IIAP II ICPSIx I I
I I
I- b
FIG APB 1 COUPON UNDER UNIFORM COMPRESSION
AR AR (SNAP) t xy
0 POISSON RATIO -xy
2 10lj
ISOTROPIC 0 PANEL
I bullI 00
0 05
0 10 20 30 40 50 60 70 80 90 t a (degrees)
FIG APB 2 MIN AR FOR 6BESTSTRESS DISTRIBUTION ALONG THE CENTER LINE OF THE COUPON
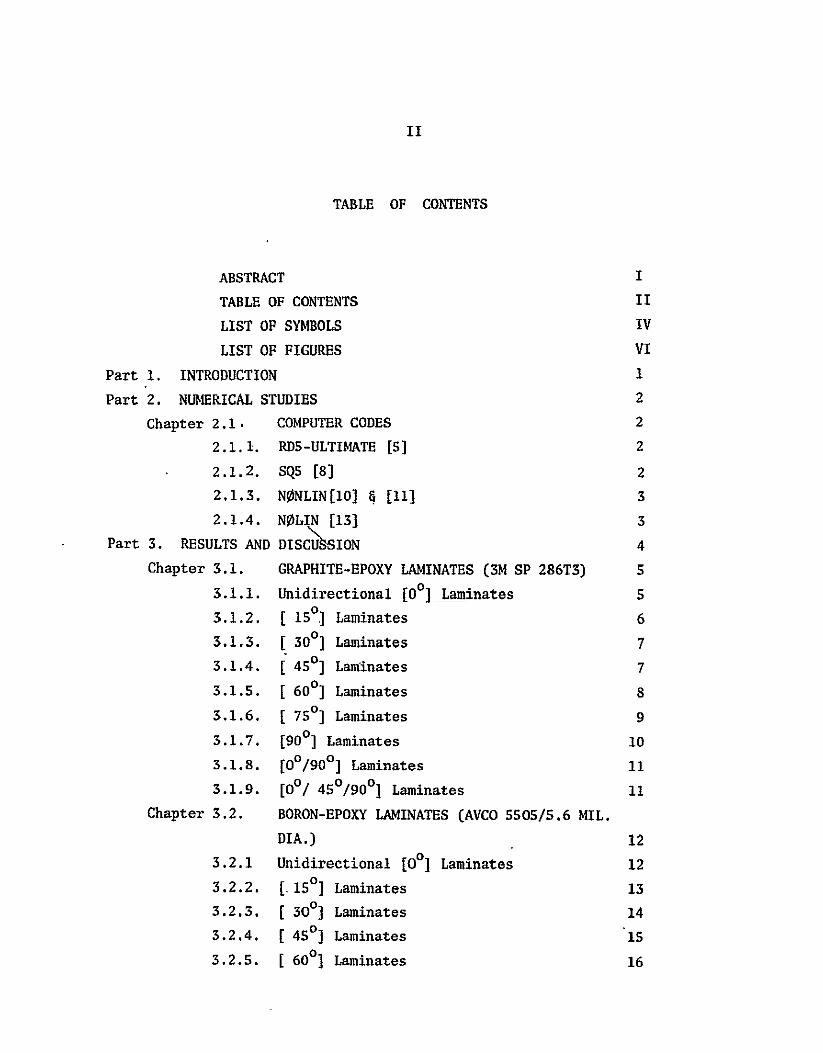
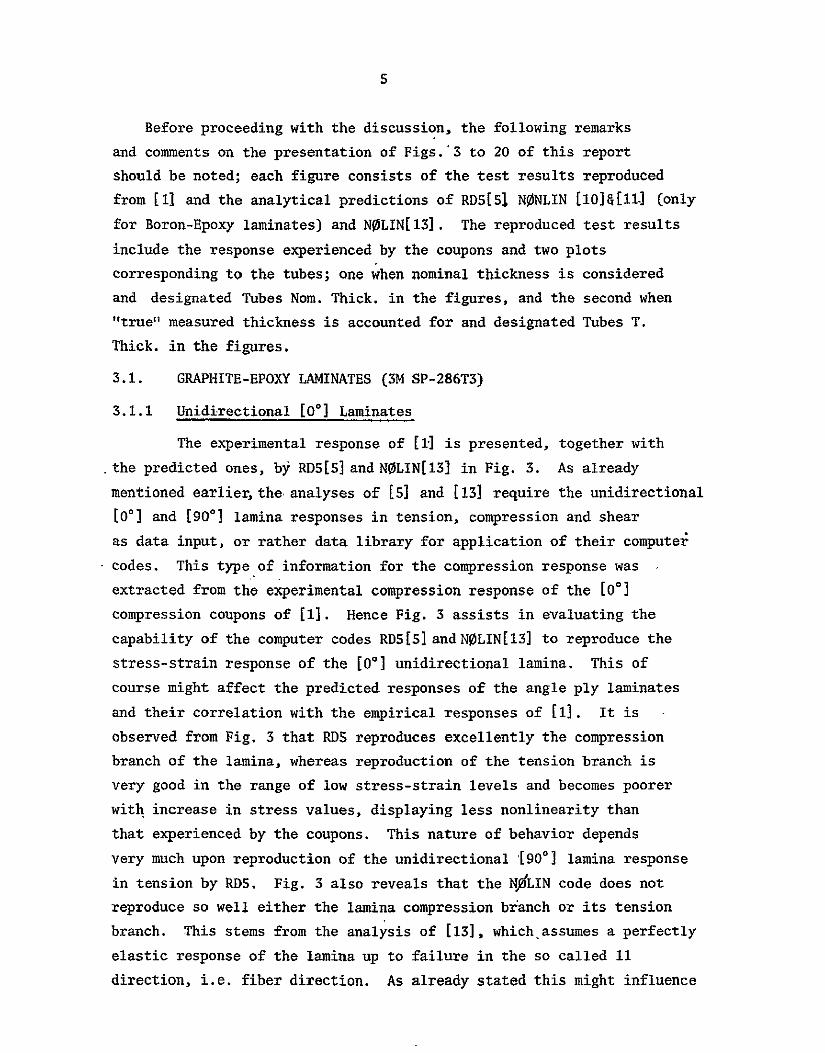
5
Before proceeding with the discussion the following remarks
and comments on the presentation of Figs3 to 20 of this report
should be noted each figure consists of the test results reproduced
from [1] and the analytical predictions of RD515 N0NLIN [10][i11 (only
for Boron-Epoxy laminates) and N0LIN[13] The reproduced test results
include the response experienced by the coupons and two plots
corresponding to the tubes one when nominal thickness is considered
and designated Tubes Nom Thick in the figures and the second when
true measured thickness is accounted for and designated Tubes T
Thick in the figures
31 GRAPHITE-EPOXY LAMINATES (3M SP-286T3)
311 Unidirectional [00] Laminates
The experimental response of [1 ispresented together with
the predicted ones by RDS[5] and N0LIN[13] in Fig 3 As already
mentioned earlier the analyses of [5] and [13] require the unidirectional
[001 and [90O] lamina responses in tension compression and shear
as data input or rather data library for application of their computei
codes This type of information for the compression response was
extracted from the experimental compression response of the [00)
compression coupons of [1] Hence Fig 3 assists in evaluating the
capability of the computer codes RDS[5] and N0LIN[13] to reproduce the
stress-strain response of the [00] unidirectional lamina This of
course might affect the predicted responses of the angle ply laminates
and their correlation with the empirical responses of [i) It is shy
observed from Fig 3 that RDS reproduces excellently the compression
branch of the lamina whereas reproduction of the tension branch is
very good in the range of low stress-strain levels and becomes poorer
with increase in stress values displaying less nonlinearity than
that experienced by the coupons This nature of behavior depends
very much upon reproduction of the unidirectional [900] lamina response
in tension by RDS Fig 3 also reveals that the NJ0LIN code does not
reproduce so well either the lamina compression branch or its tension
branch This stems from the analysis of [13] which assumes a perfectly
elastic response of the lamina up to failure in the so called 11
direction ie fiber direction As already stated this might influence
6
the predicted responses of the angle ply laminates
It is seen from Table IA and Fig 1A that RDS yields an ultimate stress which is slightly higher than that experienced experimentally
(200ksi compared with 191ksi respectively) N0LIN Max Stress
and Quadratic Interaction Fail-predict-a lower stress value than
the experimental one 180ksi and N0LIN Max Strain Fail yields a
higher strength value than experienced brth experimentally and by RDS 209ksi This ultimate stress is also predicted by SQ5E8]
312 [plusmn150] Laminates
The experimental responses of ElI together with thepredicted ones[5] and [13] are shown in Fig 4 It appears from Fig 4 that
there is good agreement between RDS and N0LIN predictions as well
as very good correlation between the empirical compression branch
corresponding to the coupons and the theoretical predictions It is
also observed that once the true measured thickness of the tubes
is accounted for the tube compression-response correlates wellwith that experienced by the coupons however the true ultimate stresses
yielded by the tubes are significantly lower than those obtained for thecoupons (see alsoTable 1A) Fig 4 also reveals that there is
no correlation between the theoretical predictions of the tension
branch and the coupon tension branch The predictions display more
pronounced nonlinearity than do the coupons
Fig IA and Table IA indicate that the analyses of [5] [8]
and [13] yielded an identical modulus of 1324x106 psi which is slightly
lower than that of 1394x10 6 psi experienced by the coupons It is observed in Fig 2A and Table 1A that the ultimate stress predicted by SQS[8] is in excellent agreement with that yielded by the coupons
(117ksi) Also RSES] predicts an ultimate strength value of 105 ksi which is lower than that experienced by the coupons and in
very good agreement with N0LIN[13] Max Strain Fail (106ksi) It also appears that N0LIN QuadFail predicts a low strength value relative to
the coupons (929 ksi) and Max Stress yields a higher stress value
(140ksi) than that observed for th coupons As has already been stated earlier it is observed in Table lA that the tubes sustained a low
7
ultimate strength value independent of whether nominal or true
thickness is considered
313 [plusmn300] Laminates
The experimental responses of E1] as well as the predicted
ones are presented in Fig 5 It is observed that RDs[5] andNLIN[13]
predictions are in good agreement It appears that these predictions
display more pronounced nonlinearity and considerably lower strength
values (see Table lA) than those experienced experimentally by the
coupons It is also observed in this figure that once the true
thickness is being considered for the tubes their compression branch
of the response is in good agreement with the predicted ones However
very poor ultimate stresses are then experienced by them (see
Table 1A) Comparing the tension branch of the responses predicted
by the analyses with those experienced empirically it is seen that the tubes when true thickness is accounted for respond similarlyto the theoretical predictions whereas the coupons respond with acompletely different
behavior higher stiffness and not as much as pronounced nonlinearity
The results of Table 1A and Fig IA show that the analyses
yield identical moduli of 576x10 6 psi which are noticeably lower
than those experienced by both the coupons (687x06) and the tubes
(655xlO6 when true thickness is accounted for) Regarding the
ultimate stresses it is found that the coupons sustained appreciably
higher strength values (591 ksi) than were predicted by the analyses
487 by SQ518] 400 by RDS[5] and 434 376 4 288 by N0LIN[13]
Max Stress Max Strain and Quad Fail respectively Also the
strength experienced by the coupons is almost twice as high as that
yielded by the tubes
314 [plusmn45] Laminates
Fig 6 presents the empirical responses of [1] together with
those predicted by [5] and [13] This figure displays good agreement between the linear portion of the compressioh branches of the responses
predicted by the analyses and those experienced by the coupons and
tubes (when true thickness is being considered) It is observed
in this figure that N0LIN[13] predicts significantly less pronounced
8
-nonlinearity than RDS and correlates well with the response
corresponding to the tubes (true thickness) It is also seen
from this figure that the coupons experienced a significantly higher
compression stressing and straining capacity than was predicted by
the analyses The compression response of the tubes when nominal
thickness is considered behaves very similarly to that of the coupons
exhibiting however adonsiderably lower strength value (see Table IA)
Comparing the predicted and empirical tension branches of the responses
it is seen that they display a similar behavior to that already
experienced and discussed for the compression branches
It appears from Table IA and Fig 1A that the analyses predict
a modulus of 204x106 psi which is noticeably lower than the 227x106
experienced by the coupons Also Table lA and Figs 2A and 6 indicate
-that the coupons experienced considerably higher ultimate stresses
(382 ksi) than were predicted by the analyses a maximum value of
313 by RD5[5] and a minimum of 162 by N0LIN Max Stress Note
that Table 1A includes two values for RDS 313 ksi and (60)+ The
second value of 60 defines theultimate stress according to the
computer code of this analysis however this stress value is associated
with very high unresonable and unacceptable strain values The
stress of 313 generated by the computer code was found to be the
last one corresponding to acceptable strain values It is also seen
from Table 1A that the ultimate stress corresponding to the tubes
is close to that predicted by RD5[5] when nominal thickness is
considered and to that yielded by SQ5[81 when true thickness i
accounted for
315 [plusmn600] Laminates
The responses of [1] and those predicted by the analyses of
[5] and [13] are shown in Fig 7 It is seen from this figure that
the responses predicted by the analyses are slightly and insignificantly
different and correlate fairly well with the response experienced by
the coupons However the coupons display considerably higher stressing
and straining capability both in compression and tens-ion than do
the analytical predictions It is also observed in this figure
9
that the compression branch of the response corresponding to the tubes
when true thickness is accounted for correlates very well with the analytical predictions- Good agreement of the tension branch
corresponding to the tubes with the numerical studies is also found
Fig 1A and Table 1A indicate a predicted modulus of 161xl06psi
by SQ5[8] and N0LIN[13] which is slightly higher than 158x106 yielded
by RDS[5] These moduli values are noticeably lower than 172x106
experienced by the coupons and 179x106 obtained for the tubes (true
thickness) As mentioned already above in the discussion on Fig 7
the predicted ultimate stresses are considerably lower than those
experienced by the coupons (see Table 1A and Fig 2A) It is found
in Table 1A that the coupons sustained a strength value of 376 ksi
compared with the highest ultimate value of 308 predicted by SQS[8]
and the lowest value of 195 yielded by N0LIN Max Stress [is]
It is also observed in this Table that the tubes when nominal thickness
is being considered experienced higher ultimate stresses than those
predicted analytically -However once their true thickness is taken
into account they experience a strength of 221 ksi which is in very
good agreement with 223 and 233 ksi calculated with N0LIN Max Strain and Quad Fail respectivelyand with 238 ksi predicted by RDS5]
316 [plusmn750] Laminates
The experimental responses of [i] are displayed together
with the analyticl predictions of [5] and [1s] in fig 8 Good
correlation is observed in Fig 8 between the prediction of N0LIN[13]
and the response experiencedby the coupons Good agreement is also obseived between the prediction of RDS[5] and N0LIN[13] in the low stressshy
strain range while with increase in stress RD5 responds less
nonlinearly than does N0LIN This discussion also applies to comparison
of the RDS prediction with the coupon response It is also seen from
this figure that the tubes (nominal thickness) respond very similarly
to the analytical predictions and the coupons experiencing however
considerably low stress-strain values relative to either the coupons
or analytical predictions (see Table 1A)
10
Comparing the moduli predicted by the analyses it is seen
from Table IA and Fig IA that SQS[8J and N0LIN[13] yielddd an identical
modulus of 181x10 6 psi which is slightly higher than 175x106
These moduli values are lower than 191x106
calculated with RDS[5]
experienced by the coupons and in very good agreement with 175x106
yielded by the tubes when nominal thickness is being considered
Once true thickness is accounted for very poor correlation with
analytical predictions is found (120x06) It is observed in Fig 2A
and Table 1A that the empirical ultimate stress of 360 ksi experienced
by the coupons is in good agreement with 375 yielded by RDS[5] and
325 predicted by N0LIN Max Stress and Max Strain [13] SQ5[8]
is found to predict a considerably high stress of 489 ksi and N0LIN
QuadFail a relatively low stress of 298 ksi The tubes appear
to sustain considerably low stress Values (214 ksi for nominal
thickness)i
317 1 190] Laminates
Like for the [0] laminates the experimental responses of
this laminate configuration are utilized as data input for the computer
codes of the different analyses [5] [8] nd [13] Uence evaluation
of the empirical responses of [1] which are presented in-Fig 9
together with the predicted or rather reproduced ones indicate the-degree
of effectiveness of the analytical models on which the computer codes
are based at least in reproducing the data input Very good agreement
is observed between N0LIN [13] and the experimental response experienced
by the coupons RD5[5] is seen to follow the empirical response in
the range of low stress-strain levels but with increase in stress
values displays less nonlinearity than either the coupons or N0LIN
It is also seen from Fig 9 as well as Table 1A that the tubes
experience considerably lower stress-strain values and a less stiffer
compression response relative to the coupons
Table 1A reveals that RDS[5] predicts a modulus of 184xlO6psi
which is slightly lower than that of 191x106 experienced by the
coupons Fig 2A and Table IA indicate very good-agreement between
the strength of 344 ksi yielded by the coupons and 350 by RDS
11
good correlation with N0LIN[13] predictions 320 332 amp 320 ksi
for Max Stress Max Strain and Quad Fail respectively and no
correlation with SQS[8] ultimate stress of 478 ksi
318 [00900] Laminates
Fig 10 presents the empirical responses of [I] and those
predicted by the analyses It is observed that in the region
corresponding to low stress-strain values there is very good correlation
between the analyses and the empirical compression branch-corresponding
to the coupons However with increase in stress-strain values the
response of RDS[5] deviates slightly from the empirical one while
that predicted by N0LIN[13] becomes pronouncedly nonlinear This
behavior of N0LIN might be explained by recalling the nature of
reproduction observed earlier in Fig 3 for the [0deg] unidirectional
laminate It is also seen from this figure that the analytical predicted
tension branches are stiffer than the tension response displayed by
the coupons However RDS agrees better than N0LIN with the test
results
Table 1A and Fig IA revealvery good correlation of the 882x10 6
empiricalmodulus of 879x106 psi with the calculated ones
by SQS[81 and N0LIN[13] and 899xl06 by RDS[S] Table IA and Fig 2A
indicate that the ultimate stresses predicted by RD5 SQ5 and N0LIN
Max Strain 110 115 and 112 ksi respectively are in very good
agreement with 115 ksi experienced by the coupons The stress of
107 ksi yielded by N0LIN Quad Fail is in good agreement with
the test results and that corresponding to Max Stress 962 ksi
is appreciably lower It is found from Table 1A and Figs 2A and 10
that the tubes sustained very low stress-strain values relative to
either the coupons or analytical predictions
319 100plusmn45090 deg1 Laminates
The experimental responses of [1] together with thb analytical
predictions are shown in Fig 11 It is observed that RDS[5] correlates
well with N0LIN[13] displaying very good agreement for low and moderate
stress-strain levels Fig 11 also displays good agreement between
the response experienced by the coupons and the analytical predicted
12
responses However the coupon response appears to-behave to some extent less nonlinearly and more stiffely than predicted (see Table IA and Pig IA) It is also observed in this figure that the tubes
(nominal thickness) respond similarly to the coupons but sustain very
low stresses (see Table IA)
Fig 1A and Table 1A indicate that SQ5[8] and N0LIN[131
predict a modulus of 632x106 psi which is lower than 642x106 predicted
by RDS[5] and 674 experienced by the coupons It also appears from
Table 1A and Fig 2A that the coupons sustained a considerably higher
ultimate stress (978 ksi) than that predicted by the analyses (850 ksi
by RDS 821 by SQ5 and 687 792 and 648 by N0LIN Max Stress
Max Strain and Quad Fail respectively)
32 BORON-EPOXY LAMINATES (AVCO 550556 MIL DIA)
In additionto the analyses of [5] [8] and [131 the empirical
results of [1] corresponding to this material are compared with the
predicted response by the analysis of [io]amp[ii] The results yielded
by the computer code of this analysis N0NLII should not however
be treated with the same degree of confidence as those of the other
analyses because the data input for thematrixmaterial of this composite
required in the analysis was not provided Hence available information
about the matrix reported in-the literature [10] was adopted Also 4note that no ultimate stress values appear either in Table lB or
Fig 2B because the analysis of [io]amp[Ii] does not predict ultimate
stresses except for the case when the fibers in any of the laminae
reach their assigned strength values
321 Unidirectional [00] Laminates
Like in the case of the unidirectional [0o Graphite-Epoxy
laminates the reproduction capability of the computer codes are again
evaluated The empirical response of [i] together with the reproduced ones are presented in Fig 12 It is observed that the compression
branch of RDS[5] correlates very well with the experiments except
in the neighbourhood of ultimate stress values N0LIN[13] deviates
slightly from the empirical one at high stress-strain levels because
as already mentioned earlier it does not allow for nonlinear behavior
13
in the 11 fiber direction and N0NLIN[10]amp[I1] isseen to bd in very
godd agreement with N0LIN The tension branch of RDS and N0LIN are
almost identical and agree with the coupon response except for high
stress-strain levels when they display less nonlinearity than that
experienced by the coupons The tension branch of N0NLIN is observed to
exhibit less nonlinear effects than either RDS or N0LIN
Table 1B and Fig 2B reveal very good agreement between the
experimental ultimate stress 342ksi and the strength predicted
by RDS[5 and N0LIN Max Stress and Quad Fail [13] 340 ksi by
all of the three SQ5 and N0LIN Max Strain are observed to yield
a slightly higher strength than that experienced empirically 353 ksi
It is seen from Table 1B and Fig IB that except forN0NLIN all the
analyses predict the experimental modulus of 3127xlO6 pstN0NLINyields 0 6 a slightly lower modulus of 3120x106
322 [plusmn150] Laminates
Fig 13 presents the experimental responses of [1] and the
predicted ones It is observed that all of the analyses predict almost
identical compression branches which are in very good agreement
with the response yielded by the coupons-for low stress-strain values
and that expeienced by the tubes when true thickness is accounted
for With increase in stress-strain values the coupons respond more
nonlinearly than predicted by the analyses Also RD51] displays
more nonlinear behavior than N0NLIN[10][II]andN0LIN[l3] Reffering
to the tension branch of the responses it appears that neither of
the predicted responses agrees with the experimental responses
Very good correlation is observed between RD5 and N0LIN in the low
stressstrain range whereas with increase in stress-strain levels
N0LIN displays slightly more pronounced nonlinear behavior At very
high stress values this behavior inverts and RDS displays very strong
nonlinear effects N0NLIN is seen to respond more linearly but
less stiffly than either RDS or N0LIN except for high stress values
where an opposite trend is observed
It is seen from Table 1B and Fig 1B that RDS[S] SQ5[8] and
N0LIN[13] yield a modulus of 2526x106 psi which is slightly higher
14
than 2496x106 predicted by N0NLIN [10]4[II] and also higher than
2365x106 experienced by the coupons Table IB and Fig 2B reveal
good agreement between the ultimate stress of 139 ksi experienced
by the coupons and 133 predicted by SQS[8] Also the strength
of 150 ksi yielded by RDS[5] correlates well with that sustained by
the coupons It is seen in Table IB that only one strength value
was predicted by N0LIN This ultimate strength value of 104 ksi is
appreciably lower than the empirical one Onlyone value was obtained
due to the fact that it was impossible to achieve convergence of the
solution with the algorithm which solves the nonlinear equations of
this computer code It is found from Table 1B Fig 2B and Fig 13
that the tubes sustained very low ultimate stresses relative to either
the -coupons or the analytical predictions
323 [plusmn3001 Laminates
It wasreported in [1] that two batches of coupons were
manufactured and delivered for testing for this type of laminate
configuration and when tested they displayed completely different
responses Hencethe empirical response corresponding to each
batch is presented separately together with the responses predicted
by the analyses in Figs 14A and 14B Fig 14B reveals immediately
that there is no correlation betweenthe analyses and the response
experienced by the coupons and as such wont be discussed any further
Fig 14A displays very good agreement between the compression branch
experienced by the coupons and that corresponding to the tubes when
nominal thickness is considered However it is observed in this
figure as well as TablelB that the tubes experienced very low ultimate
stresses relative to the coupons Referring to the tension branch
of the experimental responses it is observed that the coupons and
tubes respond completely differently one frot another It appears
from Fig 14A that the analytical predictions agree one with another
only in the very low stress-strain range At a stress level of about
200 ksi which corresponds to the ultimate stress of the tubes when
true thitkness is accounted for N0LIN[13] response deviates from
the responses predicted by RDS[S] and N0NLIN [10][Iil while displaying
initiation of pronounced nonlinearity At a stress level of about shy
15
350 ksi a similar behavior is observed for the response of RDS which
deviates from N0NLIN and also displays initiation of pronounced shy
nonlinearity The above discussion applies to both the compression
and tension branches of the analytical predictions Correlation of
the predicted responses with the empirical ones indicates fair
agreement with the response yielded by the tubes (nominal thickness)
No correlation is observed with the response experienced by the coupons
This is rather emphasized in the pronounced nonlinear region of the
responses where the coupons display a very high stressing and straining
capacity realtive to the analyses of RDS and NOLIN The mode of the
response predicted by N0NLIN is observed to differ from that corresponding
to the coupons as it displays less stiff behavior in the range of
stresses corresponding to the almost linear response of the coupons
andweak nonlinearbehavior in the range of high stresses which is
associated with the pronounced nonlinear behavior of the coupons
It appears from Table lB and Fig IB that the coupons experienced
a modulus of 1098xi06 psi which is noticeably higher than 923xl06
predicted by RD55] SQSE8] and N0LIN[13] It is also found that
N0NLIN [10amp][II] predicted an even lower modulus of 887x106 psi
As already discussed above and as can be seen from Table 1B and Fig 2B
the analyses predict ultimate stresses which are significantly lower
than 589 ksi sustained by the coupons It is also observed in Table IB
that no ultimate stress was generated by RDS[5] (The last stress
value corresponding to acceptable strains is 425 ksi and above this
stress the calculated stresses are associated with unacceptable strain
values)
324 [plusmn450] Laminates
Fig 15 presents the experimental responses of [1] together
with thepredicted ones In the range of low stress-strain values
good correlation is found for the tubes (true thickness) with the
analytical predictions but with increase in stress-strain values the
analyses of RDS[S] and N0LIN[13] predicted more pronounced nonlinear
behavior than that experienced by the tubes whereas N0NLIN [10][11]
displays less emphasized nonlinear behavior and also displays a tendency
16
to follow the response experienced by the tubes when nominal thickness
is considered No correlation between the response experienced by
the coupons-and either of the predicted responses is observed in Fig 15
The coupons are found to sustain a considerably higher stress-strain
capacity than that predicted analytically (see also Table 1B and
Fig 2B) This is also observed to be true when correlating either
representation of the responses experienced by the tubes with the
predicted responses in spite of the fact that the tubes display a
considerably low stressing capacity relative to the coupons (Note
that the straining capability of the tubes ts of the samemagnitude
of that experienced by the coupons)
Fig 1B and Table 1B indicate that N0NLIN [10][l1] predicts a modulus of 257x106 psi whichis in very good agreement with 253
experienced by the coupons RDS[5] SQ5[8j and N0LIN[1SI yield a
lower modulus of 246x1066 which is in good agreement with 239x106
experienced by the tubes (truethickness)
Comparing the ultimate stresses predicted by the different
analyses with the empirical strength values experienced by the coupons
it is found from Table lB and Fig 2B that SQ5[8] predicts a strength
of 356 ksi which is in very good agreement with 351 experienced
by the coupons N0LIN[13] yields very low strength values which are even considerably lower than those experienced by the tubes RD5[53
again generates meaningless stresses (see discussion above on the
[plusmn300] laminates)
325 [plusmn600] Laminates
The empirical responses of [1]together with the predicted
onesare presented in Fig 16 Poor correlations is observed among
the responses predicted by the different-analyses Fig 16 displays
good agreement between the responses experienced by the tubes (true
thickness) and the coupons however the coupons exhibit appreciably
higher stressing and straining capability than do the tubes Also it
is observed in this figure that N0NLIN [1o]h[i1] correlates well with
the experimental responses except for high stress levels where it
predicts less nonlinear behavior than that observed experimentally
17
It is observed in Fig 16 that in the range of low ttresses and
strains the response of N0LIN[131 also agrees with the empirical
responses however at a very low stress of about 100 ksi it deviates
from the empirical one and displays strong nonlinear behavior As
can be seen from Fig 16 this results in a considerably lower stressing and
straining capability relative to the coupons Correlating the response
predicted by RDS[S] with the experimental ones itisobserved inFig 16
that its response is stiffer and less nonlinear than that observed
for the coupons
Table 1B-and Fig lB indicate that RDS[5] SQS8] and N0LIN[13]
yield a modulus of 221x106 psi which is noticeably higher than 184x106
predicted by N0NLIN [101amp[111 These moduli are higher than 162x106
observed for the coupons
Comparing the ultimate stresses predicted by the different
analyses with the experimental strength values it is seen from
Table IB and Fig 2B that SQ5[8] predicts a high strength of 500 ksi
compared with 318 experienced by the coupons whereas N0LIN[131
predicts relatively low strength values 173 for Max Stress 180
for Max Strain and 205 ksi for Quad Fail No ultimate was generated degby RD5 (see discussion on [plusmn30 ] laminates) It appears from Table lB
and Figs 2B and 16 that the tubes (nominal thickness) yielded the
highest ultimate stress for this particular laminate
326 [plusmn750] Laminates
Fig 17 presents the experimental response of [I] together
with the predicted ones No agreement among the different predicted
responses is observed in this figure Good agreement between the
compression branch corresponding to the coupons and RDS[S] is observed
very good correlation in the almost linear range of response whereas
with increase in stress RDS responds less nonlinearly than do the
coupons Good agreement of N0LIN[13] response with the coupons is
also observed in Fig 17 in the range of low stresses and strains
(linear range) however with increase in stresses the response of
N0LIN deviates from the empirical one while displaying an appreciably
more pronounced nonlinear response The response predicted by N0NLIN
18
[101[111] is observed to display more emphasized nonlinear behavior
than N0LIN and does not agree with either the experimental response
or RDS and NOLIN predictions In regards to the tension branch of
the responses it is observed in Fig 17 that there is good agreement
among the different analyses and between the analyses and experimental
response (Note that tubes are not presented in the present evaluation
See [i)
Table iB and Fig iB indicate that the experimental modulus of 279x106 is in very good agreement with 276x106 calculated with
RDS SQ5 and N0LIN N0NLIN is found to predict a lower modulus of
197x106 psi It appears from Table lB and Fig 2B that the empirical
ultimate stress of 348 ksi is considerably lower than 446 predicted
by SQS[8] and is in good agreement with the strength value of 319
yielded by N0LIN Max Stress [13] N0LIN Max Strain and Quad Fail
are found to predict low ultimate stress values 264 and 285 ksi
respectively Again like for the [plusmn30 deg] laminate no ultimate stress
was predicted by RDS[S]
327 [900] Laminates
As with the IoV] unidirectional laminates the reproduction
capability of the different computer codes is evaluated In Fig 18
the empirical responses of [1] are presented with the predicted-ones
It is observed that in the range of moderate stress-strain levels
reproduction by both RDS[S] and N0LIN[13] is very good With increase
in stress levels both predictions deviate from the empirical response
experienced by the coupons while displaying a less nonlinear behavior
than that observed for the coupons a trend which is more emphasized
for N0LIN It is also observed in this figure that there is good
agreement between the experimental responses corresponding to the
tubes (nominal thickness) and coupons however the tubes sustain
a considerably lower ultimate stress than that experienced by the
coupons (see also Table IB) Referring to N0NLIN response [101amp[111]
it is seen from Fig 18 that this analysis predicts an appreciably
lower stressing capacity than that observed for the coupons and
predicted by the other analyses This response is found to be in very
19
good agreement with that experienced by the tubes when true thickness
is accounted for Comparing the tension branch of-the-predicted responses as
well as theeihpirical ones of Fig 18 very good agreement is found
It appears from Table IB and Fig IB that RD51J SQ5[8] and
N0LIN[13] reproduce the modulus of 298x106 psi experienced by the
coupons whereas N0NLIN [0]0[i11] predicts a considerably lower modulus 6of205xlO Comparing the ultimate stresses yielded by the different
analyses with the empirical ones it is found from Table lB and Fig
2B that the stresses of 320 ksi predicted by NOLIN Max Stress and
Quad Fail are in very good agreement with 317 experienced by the
coupons Good correlation is also observed between the empirical
stress and 341 ks predicted by N0LIN Max Strain It is also observed
in Table lB that RD5 yields a similar stress of 340 ksi for the last
acceptable-strain value
328 [00900] Laminates
The experimental responses of [1] and the ones predicted by
the analyses are presented in Fig 19 Comparison of the analytical
predictions with the response experienced by the coupons reveals very
good agreement between the empirical response and RD[51] as well as
very good agreement with the predictions of N0NLIN [101amp[11] and N0LIN[13]
in the range of moderate stress-strain values With increase in stressshy
strain levels N0NLIN and N0LIN which predict almost identical responses
display some minor nonlinear behavior which is hot observed for the
coupons Note that N0NLIN and N0LIN yield strength values which are
in good agreement with that predicted by the coupons whereas RDS
yields an appreciably lower stress (see Table lB and Fig 2B) It
is also observed in Fig 19 that once the true thickness of the
tubes is accounted for they respond wimilarly to the coupons but
fail at a considerably lower strength value (see Table iB)
It is found from Table 1B and Fig lB that N0NLIN yields the
lowest modulus 1667x106 psi N0LIN and SQ5 predict a modulus of
1715xlO6 which is in very good agreement with the empirical one of 6 6
1717x10 and RUB yields a slightly higher modulus of 1721x10
20
Table 1B and Fig 2B indicate very good agreement between
the strength of 230 ksi observed for the coupons and 220 yielded
by N0NLIN Also it is observed that all other analyses predict lower
ultimate stress values than that experienced by the coupons
deg329 [0degplusmn45090 1 Laminates
In Fig 20 the experimental responses of [1] are shown together
with the ones predicted by the analyses Very good agreement is observed
between the response yielded by the coupons and those predicted by
the analyses in particular the one calculated with N0NLIN [10311]
No correlation is observed in Fig 20 between the response observed
for the coupons and either version of the responses experienced by
the tubes
It is seen from Fig IB and Table IB that N0NLIN predicts a 6 6moIulus of 162x10 psi which isslightlyhigher than l147x10
experienced by the coupons and -slightly lower than 1187 yielded by
either SQ518] or N0LIN[3I] and i192xlO predicted by RDS[5]
Comparing the ultimate stresses experienced empirically and those
-predicted analytically it appears from Table 1B and Fig 2B that
N0NLIN strength of 141 ksi is in good agreement with 158 ksi bserved
for the coupons whereas N0LIN[13] in spite of its very good ageement
with the coupons mentioned above yields a stress of 125 ksi fQoMax
Strain and lower stresses of 121 and 113 ksi for Max Stress and
Quad Fail respectively It is also observed that RDS[S] predicts a
noticeably lower ultimate of 130 ksi and SQ5[8] a strength of 134
4 CONCLUSIONS
(a) None of the analyses namely RD[51] SQ5[8] N0NLIN[10][l1]
and N0LIN[13] utilized in the present comparison studies is
found to be adequate to predict satisfactorily the compression
response of angle-ply laminates
(b) As mentioned in the text of this report the responses corresponding to the unidirectional laminates which were experienced
by-the compression coupons of [l]were utilized as data input
for thecomputer codes RDS SQ5 and N0LIN It is observed from
21
the present comparison studies for the angle-ply laminates that
in spite of this the predicted response with these codes do not
favor the responses experienced by the coupons better than the
ones observed for the tubes For some laminate configurations
better correlation is observed with the responses yielded by
the tubes
(c) Present numerical studies indicate that no unique compression
responses were predicted by the various analyses employed in
the present comparison studies for the large variety of laminate
configurations invesrigated For some laminate configurations
considerably different responses were predicted for the same
laminate by the various analyses
(d) The analyses were found to be inadequate to predict the ultimate
stresses of the angle-ply laminates The built-in failure
mechanisms in the analytical models were not verified by the
test results because of very poor correlation between the calculated
strength values and those observed experimentally
(e) The very good correlation of the predicted moduli with the
empirical onesand the pronounced disagreement among the predicted
ultimate stresses nibther verifies nor contradicts the influence
of the edge effects discussed in Appendix B In view of the
arguments in this Appendix and the lack of success of a sound
test program with the compression tubes of [11 coupons having
different dimensions than those employed in [1] should further
be tested to accomplish the objectives of the test program of
[1] and present comparison studies and evaluations
6
22
REFRENCES
1 T Weller tExperimental Studies of Graphite-Epoxy and Baron-Epoxy Angle Ply Laminates in Compression NASA CR 145233 Sep (1977)
2 R T Haftka and J H Starnes JR-- Application of an Interior Penalty Function for Structural Optimization -AIAA Paper 75-764 t1975)
3 SW Tsai - Strength Characteristics of Composite Materials - NASA CR-224 April (1965)
4 S W Tsai D F Adams and D R Doner - Analysis of Composite Structures - NASA CR-620 November (1966)
S P H Petit - Ultimate Strength of Laminated Composites -
Report FZM-4977 prepared for Advanced Filaments and Composites-Division Air Force Materials Laboratory Air Force System Command Wright - Patterson Air Force Base Ohio December (1967)
P H Petit and M B Waddoups -AMethod of Predicting the Nonlinear Behavior of Laminated Composites -J Composite Materials Vol 3 p 2 January (1969)shy
7 K 0 Chiu - Ultimate Strength of Laminated Composites -
J Composite Materials Vol 3 P 578 July (1969)
8 D L Reed - Point Stress Laminate Analysis - Report PZM-5494 prepared for Advanced Composite Division Air Force Materials Laboratory Air Force Systems Command Wright - Patterson Air Force Base Ohio April (1970) (Also T J Muha - Users Manual for the Laminate Point Stress Analysis Computer Program SQ5 as Revised by AFFDLFBC - AFPDL-TM-74-107-FBC July C1974))
9 H T Hahn -Nonlinear Behavior of Laminated Composites -
J Composite Materials Vol 7 P 257 April (1973)
10 R L Foye - Theoretical Post Yielding Behavior of Composite Laminates Part I Inelastic Micromechanics -J Composite Materials Vol 7 p 178 April (1973)
23
11 R L Foye - Theoretical Post Yielding Behavior of Composite Laminates Part II Inelastic Micromechanics J Composite Materials- Vol 7 P310 July (1973)
12 R S Sandahu-- Nonlinear Response of Unidirectional and Angle-Ply Laminates - AIAA Paper 74-380 April (1974)
13 Z Hashin D Bagchi and W B Rosen - Nonlinear Behavior of Composite Laminates - NASA CR-2313 April (1974)
14 T Weller - Experimental Studies ofGraphite-Epoxy and Boron-Expoxy Angle Ply Landnates-in Shear NASACR 145232 Sep (1977)
15 W D Whetstone - Structural Network Analysis Program -
Users Manual Static ANAlysis Version V70E LMSC-HREC D162812 December (1970)
24
APPENDIX A
It has been pointed out in the section on the Numerical studies
that the computer codes RDS15] and N0LIN[15] require the existence of
the unidirectional [00] and [90] laminae responses in tension
compression and shear for their application The images of these
data inputs or library data input are presented in Tables APA-1A and
APA-IB as being input into RDS code In addition to the data in these
Tables also required by N0LIN the information presented in Table
APA-2 has to be provided to operate the N0LIN code (Instead of feeding
N0LIN with the stress-strain data input for the responses one may
use the Ramberg-Osgood parameters as explained in [13] and avoid the
utilizing of curve fitting alegorithms to generate these parameters)
The mechanical properties given in Table APA-2 are also required
as data input by SQ5 code
It was mentioned in the section on Results and Discussion that
the data input for the matrix material of the AVCO 5505 Boron-Epoxy
laminates was taken from [10][l1] The mechanical properties are as
follows
Young Modulus of Matrix 510000 psi
Shear Modulus of Matrix 200000 psi
Poissons Ratio of Matrix 310
and the equivalent stressequivalent strain curve is reproduced from
these references SLI = 106ESI = 5000 SL2 = 5x10⁶ ES2 = 10000 SL3 = 19x106 ES3 = 15000
ES4 = 20000 SL4 = 1Oxl06
ESS = 25000 SL5 = 3230
ES6 = 30000 SL6 = 0
25
The Boron fiber properties are Provided by the manufacturer and
are as follows
Young Modulus of Fiber 58x106 psi
Shear Modulus of Fiber 2375x106 psi
Poissons Ratio of Fiber 200
Fiber Tension Ultimate 500 ksi
Fiber Compression Ultimate 750 ksi
26
APPENDIX B
Ithas been mentioned in [I] that edge effects might be induced
far away from the loaded boundcaries of the coupons resulting in an
unevenstress-strain distribution even for a-coupon loaded uniformally
This kind of behavior was experienced by all the angle ply laminates
of []
When the coupon is loaded in a manner described in Fig APB
allowing for a uniform axial displacement u=(-S) and completely
restraining the lateral displacement y = 0 along the loaded boundaries
plusmn12 it is anticipated that the coupon width or rather its aspect
ratio AR = 1 will have an appreciable influence on the stressshy
strain distribution of angle-ply laminates possessing high Poissons
ratios
Withthe prescribed boundary conditions the specimen might
experience an induced transverse stress approaching in the limit a
stress of
ay= Gx yx
A wide specimen will contain a wide zone of continuous fibers subject
to this high degree of lateral restraint Consequently this zone will
result in both higher stresses and stiffnesses than the regions close
to the free edges of the coupon where the filaments are noncontinuous
and hence shear the load from the termination of one diagonal fiber
into the begining ofan adjecant one through the matrix This of course
will result in an unknown uneven stress-strain field which renders wide
specimens unsuitable for application The stress is picking up towards
the center and hence ishigher than the average stress utilized to
present the response of such specimens On the other hand too narrow
specimens will be affected primarily and subject to the edge effect
which-will reduce both their strength and stiffness
A numerical study was carried out to determine the actual
lateral edge effect combined withPoissons ratio and to define the
best aspect ratio ie the minimum length of the coupon1 free
27
of lateral boundary influence at least along its center line transverse
to the direction of applied compression SNAP computer code [15] was
used for this purpose and the obtained results are presented in Fig
APB-2 The coupons of [1] have an aspect ratiq AR=75 which according
to Fig APB-2 is too short to eliminate the lateral boundary influence
The above discussion calls for a different type of specimen
Indeed tubes were also tested and reported in [1] A tube is free
of the free edge region but on the -other hand is susceptible to
another deficiency if the radial displacementsat the loaded boundaries
are prevented from expanding to allow for Poissons expansion high
bending stresses develop at the restrained boundaries These stresses
might precipitate early local failure at the specimen edges or might
be superimposed on the compressive stresses in case the tube is too
short again bringing about failure at a stress lower than the ultimate
one corresponding to the tested laminate
TABLE 1A Compression Response - Comparison of Experimental Ultimate Stresses and Moduli With Analytical Predictions of RDS[S]
SQs[S1 N0NLIN[101amp[11] and N0LIN[13]
GRAPHITE-EPOXY LAMINATES -3m SP-286T3
EST RESULTS OF [1] ANAL RDS [5 ANAL SQS [8) ANAL NPNLIN ANAL N0LIN [13]
Laminate
Configuratlon
ompressionCoupons
Ult Comp Cop Mo Stress __(si) x1Opsi)
Compression TubesU
Mo M esod
Thick Thick 6 ks(ksi) ksi x O si)
Ultimate
CoSteStress
(ksi) 6
xlO si
Ultiate
(ks ) 6ai ps
Ultimate
Co Stress ksi ops )
015 Com stress (kst
Max Max quad Stress Strain InteracIl Fal Faill
Ex
(x O psi)
[00]
164 191 115 664 510
200 1609 20911 1607 8011
20911 180 1607
[plusmn15 ] 117
1394 105 826
1842 [14251
105 1324 --
11722 -
1324 14022 10622 929 1324
[plusmn30] 548
5911 374
687 292
357 283
246
286 224
811 [655]
400 1
575 48722 576 43412 37622 288 575
[plusmn453 382
227 289 234
312 [251]
313 (60)1
203 25122 204 16212 19712 175 204
[plusmn601 3547 172
222 163 251 238 158 30812 161 19512 22312 233 161
[plusmn731 312
360
191
5376321 194
214
221 14
150
[1793
175
[120]
375 175 48922 181 32522 32522 298 181
330
344 [191
155
241
102
180 132
1101-3 350 184 47822 191 32022 33222 320 191o
111 115115898
879 294
493382 287
42229 835[7791
110 1
899 11511 883 96211 11211 107 883
[0__48deg 97 _674 76[979476 359 71571 as 642 82111 632 6871 79 211 648 632
2Corrected for measured thickness
A11 Failure in compressionor tension in laina 11 direction A2 F1
1-(inch) n2540x1 2 meter
I pound fo ce - 4448222 Newton (N)kip = 10 poundtrce
b)
)+ Ulitimate stress values corresponding to very high unreasonable strain values upper number - last stress value which corresponds to an acceptable strain value
TABLE 1B Compression Response - Comparison of Experimental Ultimate Stresses and Moduli With Analytical Predictions of DS[5]
SQs[8] N0NLIN[10]G(li] and N0LIN[I3]-
TEST BORON-EPOXY LAMINATES (AVCO 550556 MIL DIA)
SANALRESULTS OF ANAL RDS (5] ANAL SQ5 -
(8] NLINAL0NL N AANLN[3ANAL N0LIN [13]
Laminate
Configuratio
Compression Copons
lt EStressCmpComp Mod
Compression Tubes
UltCom Stres m MeasuredThick x
Ultimate
CompStress
Ex
Ultimate
CompStress
Ex
Ultimate
ConyStress
Ex
Comp Stress (ksi)Ult
x Stress Strain Interac
Bx
(ksi) (xIO 6psi) (ksi) tksi) (xl06psi) (ksi) (xLOp$i) (ksz) (x06psi) (ksi) (xlO psi) si__ (xlO6psi)
10] 263
342 3127 - - 3340 3128 35311 3127 3120 54011 35311 340 3127
[1300]
( 45]
135 2365
139
947 5551095 O9
961 S89
337
253 351 308
838
918 290 3 300
255
280 331
576
680 206
2T4
194
204 234I
3749 [2685]
1111 [800]
323 [239]
150 2527
425 - 923 (NoULTOBT)OET
135 246 (NOULTOBT)
13322
4422
350612
2526
923
246
2496
887
257
32122
11212
10422
24622
11SIZ
246
115
2526
923
246
[plusmn601l 318 333
162 387 274
264 199
397 (272]
300 (NOULTOBT
221 50022 221 184 17312 18012 205 2 21
[plusmn7S) 348
279 2 311
19360 214 (64)+
276 44622 276 197 31922 26422 285 276
[90deg]
(090]
298
517 179
1
298
177
178
2171 206
126
143 1 8
339 [232] 2534
340
(38)+
190
299
11
1721
44722
194 111
298
1715
220
205
1667
32022
17611
34122
18411
320
21
298
1715 t
230 233 157 [1773] k
[0iplusmn4rso] 146
158 1147
137
147
881
874 1665
_110201 130 1192 13411 1187 141 1162 12111 12511
1 113
1 1 1187
1 q 1
Fiber failure in D degree layer
Calculations exceeded maximum observed experimental strain values
Solution does not converge
[ 3 Corrected for Measured thickness Ail Failure in compressionor tension
in lamina 11 directionIi
-2II (inch) = 2540x10 2 meter Tmi) I pound fojee = 4448222 Newton(N)
psz = 69477x10ound f rPascal (Pa)
)+Ultimate stress values corresponding to very high unreasonable strain values- upper number shy last stress value which corresponds to an acceptable strainvalue
A22 Failure in compressionor tension
A12 Failure in shear
I ksi i 105 psi
LIBRARY DATA FOR MATERIAL 2 - - SMSP2B6T-3(A-S)LEA1FA INPUT
SIGTO EPSTO SIGT9O EPSTS0O SIGCO EPSCO SIGC90 YPSCc9o
013500E 05 080000E-0 09O0000E 03 06000E-03 022500F 05 014000E-02 O46000E 04 025000E-b2 026500E 05 0O16000E-02 018000E 04 012000E-02 045000E 05 028000E-02 090006t 04 0500Q0E-02 O405hOE 05 O24OOOE-02 -026700E 04 018000E-02 067500E 05 02000E-02 013250E Oi 075000E-2 054500E 05 03200t-02 Q4860E 04 024000E-02 087200E 05 056000E-02 016800E 05 OlOOOE-01 069000E 05 00000E-02 042700E 04 q30000t-02 010670E 06 070000E-02 020500E 05 012500E-01
048 0 0 0E- 0 50 8 0 0E 04O3500E 05 0 2 036 000 E-02 012560E 06 O840OE-02 02375OE 05 015000F-01 097500E 05 056000E-02 058300E 04 O042000E-02 O14OE 06 098000E-02 026600E 05 ot17500E-Q1 011150E 06 064OOE-02 066200E 04 048000E-02 016250E 06 011200E-01 029100E 05 020000E-01 012559E 06 072000E-02 073600E 04 0540O0E-02 017900E 06 012600E01 031400E 05 p22500E-O1 013950E 06 08000E-02 081000E 04 060000E 02 019400E 06 01400OE-01 033500c 05 0250nOE-01 00 08BOOOE-02 00 amp66000E-02 00 0154600E-01 00 027500E-01 00 096000E-02 00 072000 E-02 00 016800E-01 00 03000AE-01
SIG45 EPS45 TbU12 CNL12 1 TNU21 CNU21
012540E 0 022000E-02 031400E 00 024000E 00 027911E-01 027477E-01 025080C 04 044000E-02 031600E 00 026000E 00 029169E-01 028073E-01 037620E 014 066000E-02 031800E 00 027500E 00 026349E-01 029089E-01 O5IOO1 E 04 0880OOE-02 0319nOE 00 028000E 00 024609E-01 028256E-01 058500 04 0i1000E-01 032000E 00 030000E 00 023246E-01 031877r-01 064000E 04 01300E-01 032000E00 031500E 00 023835E-01 030333E-01 069600E 04 015400Fr01 032000 00 03250OE 00 02857E-01 027590E-01 074000E 04 017600E-01 032000E 00 033000E 00 024076E-01 025525E-01 077500E 04 01VSOOE-01 032000E O0 033500 E 00 022552E-01 P26150E-01 080500E 04 022000E-01 031900E 00 034000E 00 022482E-01 026656E-01 00 024200E-01 0 00 00 0i0 00 026400E-01 00 00 00 00
TABLE ApA B- INPUT LIBRARY DATA FOR MATERIAL -1 - - AVCO 550556
SIGTO EPSTO SIGT9O EPST9O SIGCO EPSCO STGCSO CpSc90
021700E 05 043400E 05 065100E 05 086800E 05 010850E 06 0130206 06 015190r 06 017360E 06 Olq530E 06 021700F 06 00 00
070000E-03 0o4OOOE-02 O210OOE-02 028000E-02 035000E-02 042000E-02 049000t-02 056000E-02 0630OE602 070006E-02 077000E-02 084000E-02
011500 04 023000E 04 033500E 04 043400E 04 052700E 04 0610OE 04 070600E 04 078500E 04 084500E 04 089000E 04 00 00
04000E-03 080000E-03 012000Er02 016000E-02 020r00E-02 024000E-02 028000E-02 032000E-02 036000E-02 040000E-02 044000E-02 048000E-02
031270E 05 062540E 05 093810E 05 012508F 06 015635E 06 018762E 06 022100E 06 025400E 06 028800E 06 03l000E 06 00 00
010OOE-02 920000E-02 030000E-02 040000E-02 050000E-02 0600OOE-02 070000E-02 080000E-02 090000E-02 016000-01 011000E-01 012000E-01
044800E 04 069500E 04 013150E 05 016800E 05 020200E 05 023100E 05 025750E 05 028000E 05 031000E P9 031700E 05 00 00
015000E-02 - 030000E-02 045000E-02 96000E-02 075000E-02 090000E-02 010500E-01 0120006 1 013500E-01 0150OOE-01 0165O6E-01 oaeooor-Oi
SIG45 EPS45 TNU12 CNL12 TNU21 CNU21
0BgPE 04 033200E 04 042500E 04 0116500E 04 048500E O 050500E 04 052200E 04 053500E 04 055000E 04 O596000E 04 00 00
02700E-02 054000E-02 081000E-02 0108OOE-01 013500E-01 016200E-01 018900E-0 02tOOE-01 024300E-01 027000E-01 029790E-01 032400E-01
022700E 00 022700E 00 022700E 00 022400E 00 022400E 00 022400E 00 0224006 00 023000E 00 023300E 00 022700E 00 00 00
02640nE 00 026600E 00 026800E 00 026800E 00 027000E 00 02720 0 E 00 027500E 00 028000E 00 029000E 00 032000E 00 00 00
021052E-01 021052E-01 019222E-01 017884E-01 016800E-01 016439E-01 158976-01 014653E-01 011274E-01 0823806-02 00 00
025215E-01 025350E-b1 023997E-01 020855E-01 019572E-01 016817E-01 014555E-01 0i2727E-01 017059E-01 028118 -02 00 00
00 -
32 ou~IGV AGT32~ jO Q1JA1ATY
TABLE APA-2 Unidirectional Lamina Properties Utilized In The Predictions Of SQS9] and N0LIN[14]
3M SP-286T3 AVCO 550556 Mil GRAPHITE-EPOXY BORON-EPOXY
(Ell)Tension 1687x106 psi 3100xlO6 psi
(E11)Coinpression 1607x106 psi 3127x1O6 psi
(E22)Tension 152x106 psi 288x106 psi
(E22)Compression 191x106 psi 298x106 psi
GO2 057x106 psi 066x106 psi
(aULTll)Tension 140 ksi 220 ksi
(eULTllTension 008 007
(cULTll)Compression 180 ksi 340 ksi
(eULTll)Compression 013 0113
(t ULT22)Tension 8 ksi 89 ksi
(ULT 22)Tension 006 00405
(aULT22)Compression 32 ksi 32 ksi
(EULT22)Compression 025 015
((ULT12) 81 ksi 56 ksi
(CULT12) 022 0275
(v12)Compression 230 267
(v12)Tension 298 216
-1 (inch) = 2540x10 2 meter Cm)
1 pound force = 4448222 Newton (N)
I kip = 103 pound force
I psi = 6894757x105 Pascal (Pa)
I ksi = 103 psi
A test results [1] (coupons)0 analysis (8] amp 131
I00
w CL
10
-0
5
66
0 I I I I I I Cgt t C00o
01 +1 +1 +shy
g LAMINATE CONFIGURATION
FIG 1A YOUNGS MODULUS OF 3M SP-286T3 GRAPHITE EPOXY LAMINATES ASAFUNCTION OF LAMINATE CONFIGURATION
30 7A test results [i](coupons)0 analysis [81 amp [131 v [10] ampIll]
C o
w 20
109
0I III I I I + +1 +1 +1 +1
LAMINATE CONFIGURATION 0
FIG 1B YOUNGS MODULUS OFACO 5505(56MIL DIA BORON-EPOXY LAMINATES AS AFUNCTION OF LAMINATE CONFIGURATION
200t 200 3 0 mxx stress falla test results [1) (coupons) analysis NOLIN 03] V max strain fail
0 analysis RD 5 [5] r[ quadr interaction 0 analysis SQ5 [8] fail
150 150
0x(0
a
0~ARA 0
100- V13 100- 0
A A
A
50- 0 0 0 50shy000 v A A
0 A 13 V 0 0
0 in 0 10 0 O 0 to CD +1~j4 3 + +1 owi +1 +1 +1 4
LAMINATE CONFIGURATION LAMINATE CONFIGURATION
FIG 2A ULTIMATE STRESS OF 3M SP 286T3 GRAPHITE EPOXY LAMINATES AS AFUNCTION OF LAMINATE CONFIGURAiON
A tests results [1] (coupons) 0 maxstressfail 0 analysis RD5 [5] analysis NLIN [13] v max strain fail
300 0 analysis SQ5 [8] 300 0 quadr interaction fail
200
00
-A
200 -3
A
100 00
A A0 100 A
09 0A
o
0 LO lcent
O O -t to
TL +1 + 1 +1 1 LAMINATE CONFIGURATION
FIG 2B ULTIMATE STRESS OFAVCO LAMINATE CONFIGURATION
0 C gt 1LO L O C La mmO) rt
+ 1 + 1 + 1 + 1 4 LAMINATE CONFIGURATION
550556 MIL DIA BORON-EPOXY LAMINATES AS A FUNCTIONOF
200 -+ A
o 0
A
o 0~
ab A
0 Aa AA
0shy 0500shy
15-15 - 0 0l FIG Z
-0
OMPESIONRESONEO 003MSP-66T GAPHTE-POY LMINTA
AxC)0o00A
001 A0e
_150
0
0 00
0
coupons 0
00 0
u coupons
100 tubes nom
thick A
0
ubes horn thick
tubes t thickK 077 tubes tthick
50 -
-15 -10 -05 0 05 10Ex (4) 6 (0)FIG 4 COMPRESSION RESPONSE OF plusmn15 deg 3M SP-286T3 GRAPHITE-EPOXY LAMINATES
75
0C
E 50
coupons coupon 00
a 00 tubes noa oo
tubes tubes fern
0A
tubes t~ 4 tubes tthick 25 thick - shy
cento 4 AOa
0-10 -05 Ex (0) 0 y 05 10 15
FIG 5 COMPRESSION RESPONSE OF -30 3M SP-286T3 GRAPHITE-EPOXY LAMINATES
40
30-S
tubes hnmhick tubes nom
tik
a
20--
a-P III
-5 -3
FI30OMRESONtubes
-4
tubes tthick
2co1upo1s
FLJ-5 3 M28Thick
IF- PO
tues fain thIkEshy
tubes trthick
(60)
10G COPESONRSOSE-5 3MS-8t-RPIEEOY AIAE
40
couponstubes nor
copn thick
nomn btubes thick th
30CL
U
1shy
o
S-4 -3 -2 -ex (0) 0 y 2
degFIG 7 COMPRESSION RESPONSE OF +-60 3M SP-286T3 GRAPHITE-EPOXY LAMINATES
40
CL E 0 U
30
U) coupons
A
A
coupons
A
20-
0
tubes nom thick
0
tubes nom thick
-
tubes t thick
tubes t thick
10shy
-3 -2 -1 Ex() Cy (1)
FIG8 COMPRESSION RESPONSE OF plusmn750 3M SP-286T3 GRAPHITEEPOXY LAMINATES
-4 0
35 +
CL o0
Di couon coupons
S25
bull--
20shy
--
tubes nom thick
tubes nom thick
t
15-tubes
thick t
tubes tthickN N
10 -N
NN
0n -25 -20 -15 -10 ex -05 0 ey 05
FIG 9 COMPRESSION RESPONSE OF 906 3M SP-286T3 GRAPHITE-EPOXY LAMINATES
120
100- A
2 coupons
E080 A 2 0
60shy
thick tubes nom hidk
40shy
tubes t 20- tubes tthick - thick
0shy-16 44 -12 -10 -08 -06 -04 -02 0 02
FIG 10 COMPRESSION RESPONSE OF 0900 3M SP-286T3 GRAPHITE-EPOXY LAMINATES y
100
oo coupons
ns coupons
0
UIi75 - -
50- C
tubes nom tubes nor thick thick
25 tubes tthick Kc_ tubes tthick
-20
FIG11
-15
COMPRESSION -1o
RESPONSE OF 0145900
-05 0 05 e1 (C) OE y (0)3M SP-286T3 GRAPHITE-EPOXY LAMINATES
10
400
(0
6 coupons coupons 200- shy
100 shy
-12 -10 -08 -06 -04 Q02 0 0Q2 ey 04 FIG 1V COMPRESSION RESPONSE OF 00 AVCO 5505156 MIL DIA BORO-EPOXY LAMINATES
150- +-- V
o
U)
In
_
A coupons
100 tubes florn
E
nom
tthick
tubes tthick-- t
copos7L A
V(10
-otubesnomathick ov
tubes tik IV deg tub es t t h ic k o
50 0
10
001
I
FIG 13
-05 0Eri)
COMPRESSION RESPONSE
A H I
05ey (0)
OF t 150 AVCO 5505 BORON-EPOXY
10
LAMINATES
15
75
0v VU)InI v v 03pn coupons
degu v
- 50v V
(no ultobt) A (no ultobt)amp
25- 0
tubes nom thick 04 tubes nom thick
tubes tthick0 tubes tthick
- Q5 0 05 10 15Ex (sect) Ey (dego)
FIG 14A COMPRESSION RESPONSE OF plusmn300 AVCO 550556 MIL DIA BORON-EPOXY LAMINATES (BATCH 1)
20
100
0
0
U
75
(no V V V
V50 -- V V -o uponsV (outat)v (no ultobt)
nora tubes 47
VAnom 0V thick AV
25tubes noma th
tubest~thikK~iVx tubes tthick
5 -D -05 E M0 (o) 05 10 15
FIG 14B COMPRESSION RESPONSE OF plusmn300 AVCO 550556 MIL DIA BORON-EPOXY LAMINATES (BATCH E1)
40
0
CLcuoscoupons
E 0 v
30shy
230 ---shy
thick thick -S- -- - tin
20- tube2 k- -shyc
1 e thick
(noul Xe (no ult)
10- (t A
0 04 ey SA)x (15FIG 15 COMPRESSION RESPONSE OF plusmn450 AVCO 550556 MIL DIA BORON-EPOXY LAMINATES
_ _ _ _ _
40
tubes nom thick V
tubes nom thick
c-oupons v (no ult obt) v n
(no ult30- A obt) VA coupons
0
~hck tubes tthick2tbs8 ZE AA
00 In AA_
vA 0 b 0 A 0
A 00 0
0 10 AA
OI I I -5 -4 -3 -2 1 ( y 2
FPAxI E y ()MFIG 16 COMPRESSION RE-SPON$EOFi60 AVCO -550556 MIL DIA BORON-EPOXY LAMINATES-
40
(64 ksi) (64)
30
oV CO
coupons
0A 0
AA A coupons
0-A 5
20
0
0 00
10shy
00
V
-25 -20 -15 -10 -05 0 05eF (0) Ey (CI)05FIG 17 COMPRESSION RESPONSE-OF +-750AVCO 5505156 MIL DIA BORON-EPOXY LAMINATES
40 -
C
En Ult 3 0 L
0 deg 3 0 - cou on coupons u
830
tubes nom 20 V thick
tubes nom thick V
-tubes tthicdk
thick 10shy
-16 -14 -12 -10 -08 -06 -04 -2 0 2 ei () ey (0)
FIG 18 COMPRESSION RESPONSE OF 906 AVCO 550556 MIL DIA BORON EPOXY LAMINATES
2-250 upons coupons
CL tubes nom thick tubesno]
ktubes t tubes t
0 thick thickS 150- O
0
wA
201 thck
50
-14 -12 -10 -08 -06 -04 -02 0 02 ex (0f) ey (l)
FIG 19 COMPRESSION RESPONSE OF 0900 AVCO 550556 MIL DIA BORON-EPOXY LAMINATES
200
2 0
E coupons
150 tubbs nom tubes thick nom
thick
100
tubes t tubes thick tthick
50shy
- I
0-15 -10 -05 05Lx () 00 y (l) 0
FIG 20 COMPRESSION RESPONSE OF 0145900 AVCO 5505156 MIL DIA BORON-EPOXY LAMINATES
IxJu
uniform compression
L u=-8 I I I I I
I Ib
I 1IIAP II ICPSIx I I
I I
I- b
FIG APB 1 COUPON UNDER UNIFORM COMPRESSION
AR AR (SNAP) t xy
0 POISSON RATIO -xy
2 10lj
ISOTROPIC 0 PANEL
I bullI 00
0 05
0 10 20 30 40 50 60 70 80 90 t a (degrees)
FIG APB 2 MIN AR FOR 6BESTSTRESS DISTRIBUTION ALONG THE CENTER LINE OF THE COUPON

6
the predicted responses of the angle ply laminates
It is seen from Table IA and Fig 1A that RDS yields an ultimate stress which is slightly higher than that experienced experimentally
(200ksi compared with 191ksi respectively) N0LIN Max Stress
and Quadratic Interaction Fail-predict-a lower stress value than
the experimental one 180ksi and N0LIN Max Strain Fail yields a
higher strength value than experienced brth experimentally and by RDS 209ksi This ultimate stress is also predicted by SQ5E8]
312 [plusmn150] Laminates
The experimental responses of ElI together with thepredicted ones[5] and [13] are shown in Fig 4 It appears from Fig 4 that
there is good agreement between RDS and N0LIN predictions as well
as very good correlation between the empirical compression branch
corresponding to the coupons and the theoretical predictions It is
also observed that once the true measured thickness of the tubes
is accounted for the tube compression-response correlates wellwith that experienced by the coupons however the true ultimate stresses
yielded by the tubes are significantly lower than those obtained for thecoupons (see alsoTable 1A) Fig 4 also reveals that there is
no correlation between the theoretical predictions of the tension
branch and the coupon tension branch The predictions display more
pronounced nonlinearity than do the coupons
Fig IA and Table IA indicate that the analyses of [5] [8]
and [13] yielded an identical modulus of 1324x106 psi which is slightly
lower than that of 1394x10 6 psi experienced by the coupons It is observed in Fig 2A and Table 1A that the ultimate stress predicted by SQS[8] is in excellent agreement with that yielded by the coupons
(117ksi) Also RSES] predicts an ultimate strength value of 105 ksi which is lower than that experienced by the coupons and in
very good agreement with N0LIN[13] Max Strain Fail (106ksi) It also appears that N0LIN QuadFail predicts a low strength value relative to
the coupons (929 ksi) and Max Stress yields a higher stress value
(140ksi) than that observed for th coupons As has already been stated earlier it is observed in Table lA that the tubes sustained a low
7
ultimate strength value independent of whether nominal or true
thickness is considered
313 [plusmn300] Laminates
The experimental responses of E1] as well as the predicted
ones are presented in Fig 5 It is observed that RDs[5] andNLIN[13]
predictions are in good agreement It appears that these predictions
display more pronounced nonlinearity and considerably lower strength
values (see Table lA) than those experienced experimentally by the
coupons It is also observed in this figure that once the true
thickness is being considered for the tubes their compression branch
of the response is in good agreement with the predicted ones However
very poor ultimate stresses are then experienced by them (see
Table 1A) Comparing the tension branch of the responses predicted
by the analyses with those experienced empirically it is seen that the tubes when true thickness is accounted for respond similarlyto the theoretical predictions whereas the coupons respond with acompletely different
behavior higher stiffness and not as much as pronounced nonlinearity
The results of Table 1A and Fig IA show that the analyses
yield identical moduli of 576x10 6 psi which are noticeably lower
than those experienced by both the coupons (687x06) and the tubes
(655xlO6 when true thickness is accounted for) Regarding the
ultimate stresses it is found that the coupons sustained appreciably
higher strength values (591 ksi) than were predicted by the analyses
487 by SQ518] 400 by RDS[5] and 434 376 4 288 by N0LIN[13]
Max Stress Max Strain and Quad Fail respectively Also the
strength experienced by the coupons is almost twice as high as that
yielded by the tubes
314 [plusmn45] Laminates
Fig 6 presents the empirical responses of [1] together with
those predicted by [5] and [13] This figure displays good agreement between the linear portion of the compressioh branches of the responses
predicted by the analyses and those experienced by the coupons and
tubes (when true thickness is being considered) It is observed
in this figure that N0LIN[13] predicts significantly less pronounced
8
-nonlinearity than RDS and correlates well with the response
corresponding to the tubes (true thickness) It is also seen
from this figure that the coupons experienced a significantly higher
compression stressing and straining capacity than was predicted by
the analyses The compression response of the tubes when nominal
thickness is considered behaves very similarly to that of the coupons
exhibiting however adonsiderably lower strength value (see Table IA)
Comparing the predicted and empirical tension branches of the responses
it is seen that they display a similar behavior to that already
experienced and discussed for the compression branches
It appears from Table IA and Fig 1A that the analyses predict
a modulus of 204x106 psi which is noticeably lower than the 227x106
experienced by the coupons Also Table lA and Figs 2A and 6 indicate
-that the coupons experienced considerably higher ultimate stresses
(382 ksi) than were predicted by the analyses a maximum value of
313 by RD5[5] and a minimum of 162 by N0LIN Max Stress Note
that Table 1A includes two values for RDS 313 ksi and (60)+ The
second value of 60 defines theultimate stress according to the
computer code of this analysis however this stress value is associated
with very high unresonable and unacceptable strain values The
stress of 313 generated by the computer code was found to be the
last one corresponding to acceptable strain values It is also seen
from Table 1A that the ultimate stress corresponding to the tubes
is close to that predicted by RD5[5] when nominal thickness is
considered and to that yielded by SQ5[81 when true thickness i
accounted for
315 [plusmn600] Laminates
The responses of [1] and those predicted by the analyses of
[5] and [13] are shown in Fig 7 It is seen from this figure that
the responses predicted by the analyses are slightly and insignificantly
different and correlate fairly well with the response experienced by
the coupons However the coupons display considerably higher stressing
and straining capability both in compression and tens-ion than do
the analytical predictions It is also observed in this figure
9
that the compression branch of the response corresponding to the tubes
when true thickness is accounted for correlates very well with the analytical predictions- Good agreement of the tension branch
corresponding to the tubes with the numerical studies is also found
Fig 1A and Table 1A indicate a predicted modulus of 161xl06psi
by SQ5[8] and N0LIN[13] which is slightly higher than 158x106 yielded
by RDS[5] These moduli values are noticeably lower than 172x106
experienced by the coupons and 179x106 obtained for the tubes (true
thickness) As mentioned already above in the discussion on Fig 7
the predicted ultimate stresses are considerably lower than those
experienced by the coupons (see Table 1A and Fig 2A) It is found
in Table 1A that the coupons sustained a strength value of 376 ksi
compared with the highest ultimate value of 308 predicted by SQS[8]
and the lowest value of 195 yielded by N0LIN Max Stress [is]
It is also observed in this Table that the tubes when nominal thickness
is being considered experienced higher ultimate stresses than those
predicted analytically -However once their true thickness is taken
into account they experience a strength of 221 ksi which is in very
good agreement with 223 and 233 ksi calculated with N0LIN Max Strain and Quad Fail respectivelyand with 238 ksi predicted by RDS5]
316 [plusmn750] Laminates
The experimental responses of [i] are displayed together
with the analyticl predictions of [5] and [1s] in fig 8 Good
correlation is observed in Fig 8 between the prediction of N0LIN[13]
and the response experiencedby the coupons Good agreement is also obseived between the prediction of RDS[5] and N0LIN[13] in the low stressshy
strain range while with increase in stress RD5 responds less
nonlinearly than does N0LIN This discussion also applies to comparison
of the RDS prediction with the coupon response It is also seen from
this figure that the tubes (nominal thickness) respond very similarly
to the analytical predictions and the coupons experiencing however
considerably low stress-strain values relative to either the coupons
or analytical predictions (see Table 1A)
10
Comparing the moduli predicted by the analyses it is seen
from Table IA and Fig IA that SQS[8J and N0LIN[13] yielddd an identical
modulus of 181x10 6 psi which is slightly higher than 175x106
These moduli values are lower than 191x106
calculated with RDS[5]
experienced by the coupons and in very good agreement with 175x106
yielded by the tubes when nominal thickness is being considered
Once true thickness is accounted for very poor correlation with
analytical predictions is found (120x06) It is observed in Fig 2A
and Table 1A that the empirical ultimate stress of 360 ksi experienced
by the coupons is in good agreement with 375 yielded by RDS[5] and
325 predicted by N0LIN Max Stress and Max Strain [13] SQ5[8]
is found to predict a considerably high stress of 489 ksi and N0LIN
QuadFail a relatively low stress of 298 ksi The tubes appear
to sustain considerably low stress Values (214 ksi for nominal
thickness)i
317 1 190] Laminates
Like for the [0] laminates the experimental responses of
this laminate configuration are utilized as data input for the computer
codes of the different analyses [5] [8] nd [13] Uence evaluation
of the empirical responses of [1] which are presented in-Fig 9
together with the predicted or rather reproduced ones indicate the-degree
of effectiveness of the analytical models on which the computer codes
are based at least in reproducing the data input Very good agreement
is observed between N0LIN [13] and the experimental response experienced
by the coupons RD5[5] is seen to follow the empirical response in
the range of low stress-strain levels but with increase in stress
values displays less nonlinearity than either the coupons or N0LIN
It is also seen from Fig 9 as well as Table 1A that the tubes
experience considerably lower stress-strain values and a less stiffer
compression response relative to the coupons
Table 1A reveals that RDS[5] predicts a modulus of 184xlO6psi
which is slightly lower than that of 191x106 experienced by the
coupons Fig 2A and Table IA indicate very good-agreement between
the strength of 344 ksi yielded by the coupons and 350 by RDS
11
good correlation with N0LIN[13] predictions 320 332 amp 320 ksi
for Max Stress Max Strain and Quad Fail respectively and no
correlation with SQS[8] ultimate stress of 478 ksi
318 [00900] Laminates
Fig 10 presents the empirical responses of [I] and those
predicted by the analyses It is observed that in the region
corresponding to low stress-strain values there is very good correlation
between the analyses and the empirical compression branch-corresponding
to the coupons However with increase in stress-strain values the
response of RDS[5] deviates slightly from the empirical one while
that predicted by N0LIN[13] becomes pronouncedly nonlinear This
behavior of N0LIN might be explained by recalling the nature of
reproduction observed earlier in Fig 3 for the [0deg] unidirectional
laminate It is also seen from this figure that the analytical predicted
tension branches are stiffer than the tension response displayed by
the coupons However RDS agrees better than N0LIN with the test
results
Table 1A and Fig IA revealvery good correlation of the 882x10 6
empiricalmodulus of 879x106 psi with the calculated ones
by SQS[81 and N0LIN[13] and 899xl06 by RDS[S] Table IA and Fig 2A
indicate that the ultimate stresses predicted by RD5 SQ5 and N0LIN
Max Strain 110 115 and 112 ksi respectively are in very good
agreement with 115 ksi experienced by the coupons The stress of
107 ksi yielded by N0LIN Quad Fail is in good agreement with
the test results and that corresponding to Max Stress 962 ksi
is appreciably lower It is found from Table 1A and Figs 2A and 10
that the tubes sustained very low stress-strain values relative to
either the coupons or analytical predictions
319 100plusmn45090 deg1 Laminates
The experimental responses of [1] together with thb analytical
predictions are shown in Fig 11 It is observed that RDS[5] correlates
well with N0LIN[13] displaying very good agreement for low and moderate
stress-strain levels Fig 11 also displays good agreement between
the response experienced by the coupons and the analytical predicted
12
responses However the coupon response appears to-behave to some extent less nonlinearly and more stiffely than predicted (see Table IA and Pig IA) It is also observed in this figure that the tubes
(nominal thickness) respond similarly to the coupons but sustain very
low stresses (see Table IA)
Fig 1A and Table 1A indicate that SQ5[8] and N0LIN[131
predict a modulus of 632x106 psi which is lower than 642x106 predicted
by RDS[5] and 674 experienced by the coupons It also appears from
Table 1A and Fig 2A that the coupons sustained a considerably higher
ultimate stress (978 ksi) than that predicted by the analyses (850 ksi
by RDS 821 by SQ5 and 687 792 and 648 by N0LIN Max Stress
Max Strain and Quad Fail respectively)
32 BORON-EPOXY LAMINATES (AVCO 550556 MIL DIA)
In additionto the analyses of [5] [8] and [131 the empirical
results of [1] corresponding to this material are compared with the
predicted response by the analysis of [io]amp[ii] The results yielded
by the computer code of this analysis N0NLII should not however
be treated with the same degree of confidence as those of the other
analyses because the data input for thematrixmaterial of this composite
required in the analysis was not provided Hence available information
about the matrix reported in-the literature [10] was adopted Also 4note that no ultimate stress values appear either in Table lB or
Fig 2B because the analysis of [io]amp[Ii] does not predict ultimate
stresses except for the case when the fibers in any of the laminae
reach their assigned strength values
321 Unidirectional [00] Laminates
Like in the case of the unidirectional [0o Graphite-Epoxy
laminates the reproduction capability of the computer codes are again
evaluated The empirical response of [i] together with the reproduced ones are presented in Fig 12 It is observed that the compression
branch of RDS[5] correlates very well with the experiments except
in the neighbourhood of ultimate stress values N0LIN[13] deviates
slightly from the empirical one at high stress-strain levels because
as already mentioned earlier it does not allow for nonlinear behavior
13
in the 11 fiber direction and N0NLIN[10]amp[I1] isseen to bd in very
godd agreement with N0LIN The tension branch of RDS and N0LIN are
almost identical and agree with the coupon response except for high
stress-strain levels when they display less nonlinearity than that
experienced by the coupons The tension branch of N0NLIN is observed to
exhibit less nonlinear effects than either RDS or N0LIN
Table 1B and Fig 2B reveal very good agreement between the
experimental ultimate stress 342ksi and the strength predicted
by RDS[5 and N0LIN Max Stress and Quad Fail [13] 340 ksi by
all of the three SQ5 and N0LIN Max Strain are observed to yield
a slightly higher strength than that experienced empirically 353 ksi
It is seen from Table 1B and Fig IB that except forN0NLIN all the
analyses predict the experimental modulus of 3127xlO6 pstN0NLINyields 0 6 a slightly lower modulus of 3120x106
322 [plusmn150] Laminates
Fig 13 presents the experimental responses of [1] and the
predicted ones It is observed that all of the analyses predict almost
identical compression branches which are in very good agreement
with the response yielded by the coupons-for low stress-strain values
and that expeienced by the tubes when true thickness is accounted
for With increase in stress-strain values the coupons respond more
nonlinearly than predicted by the analyses Also RD51] displays
more nonlinear behavior than N0NLIN[10][II]andN0LIN[l3] Reffering
to the tension branch of the responses it appears that neither of
the predicted responses agrees with the experimental responses
Very good correlation is observed between RD5 and N0LIN in the low
stressstrain range whereas with increase in stress-strain levels
N0LIN displays slightly more pronounced nonlinear behavior At very
high stress values this behavior inverts and RDS displays very strong
nonlinear effects N0NLIN is seen to respond more linearly but
less stiffly than either RDS or N0LIN except for high stress values
where an opposite trend is observed
It is seen from Table 1B and Fig 1B that RDS[S] SQ5[8] and
N0LIN[13] yield a modulus of 2526x106 psi which is slightly higher
14
than 2496x106 predicted by N0NLIN [10]4[II] and also higher than
2365x106 experienced by the coupons Table IB and Fig 2B reveal
good agreement between the ultimate stress of 139 ksi experienced
by the coupons and 133 predicted by SQS[8] Also the strength
of 150 ksi yielded by RDS[5] correlates well with that sustained by
the coupons It is seen in Table IB that only one strength value
was predicted by N0LIN This ultimate strength value of 104 ksi is
appreciably lower than the empirical one Onlyone value was obtained
due to the fact that it was impossible to achieve convergence of the
solution with the algorithm which solves the nonlinear equations of
this computer code It is found from Table 1B Fig 2B and Fig 13
that the tubes sustained very low ultimate stresses relative to either
the -coupons or the analytical predictions
323 [plusmn3001 Laminates
It wasreported in [1] that two batches of coupons were
manufactured and delivered for testing for this type of laminate
configuration and when tested they displayed completely different
responses Hencethe empirical response corresponding to each
batch is presented separately together with the responses predicted
by the analyses in Figs 14A and 14B Fig 14B reveals immediately
that there is no correlation betweenthe analyses and the response
experienced by the coupons and as such wont be discussed any further
Fig 14A displays very good agreement between the compression branch
experienced by the coupons and that corresponding to the tubes when
nominal thickness is considered However it is observed in this
figure as well as TablelB that the tubes experienced very low ultimate
stresses relative to the coupons Referring to the tension branch
of the experimental responses it is observed that the coupons and
tubes respond completely differently one frot another It appears
from Fig 14A that the analytical predictions agree one with another
only in the very low stress-strain range At a stress level of about
200 ksi which corresponds to the ultimate stress of the tubes when
true thitkness is accounted for N0LIN[13] response deviates from
the responses predicted by RDS[S] and N0NLIN [10][Iil while displaying
initiation of pronounced nonlinearity At a stress level of about shy
15
350 ksi a similar behavior is observed for the response of RDS which
deviates from N0NLIN and also displays initiation of pronounced shy
nonlinearity The above discussion applies to both the compression
and tension branches of the analytical predictions Correlation of
the predicted responses with the empirical ones indicates fair
agreement with the response yielded by the tubes (nominal thickness)
No correlation is observed with the response experienced by the coupons
This is rather emphasized in the pronounced nonlinear region of the
responses where the coupons display a very high stressing and straining
capacity realtive to the analyses of RDS and NOLIN The mode of the
response predicted by N0NLIN is observed to differ from that corresponding
to the coupons as it displays less stiff behavior in the range of
stresses corresponding to the almost linear response of the coupons
andweak nonlinearbehavior in the range of high stresses which is
associated with the pronounced nonlinear behavior of the coupons
It appears from Table lB and Fig IB that the coupons experienced
a modulus of 1098xi06 psi which is noticeably higher than 923xl06
predicted by RD55] SQSE8] and N0LIN[13] It is also found that
N0NLIN [10amp][II] predicted an even lower modulus of 887x106 psi
As already discussed above and as can be seen from Table 1B and Fig 2B
the analyses predict ultimate stresses which are significantly lower
than 589 ksi sustained by the coupons It is also observed in Table IB
that no ultimate stress was generated by RDS[5] (The last stress
value corresponding to acceptable strains is 425 ksi and above this
stress the calculated stresses are associated with unacceptable strain
values)
324 [plusmn450] Laminates
Fig 15 presents the experimental responses of [1] together
with thepredicted ones In the range of low stress-strain values
good correlation is found for the tubes (true thickness) with the
analytical predictions but with increase in stress-strain values the
analyses of RDS[S] and N0LIN[13] predicted more pronounced nonlinear
behavior than that experienced by the tubes whereas N0NLIN [10][11]
displays less emphasized nonlinear behavior and also displays a tendency
16
to follow the response experienced by the tubes when nominal thickness
is considered No correlation between the response experienced by
the coupons-and either of the predicted responses is observed in Fig 15
The coupons are found to sustain a considerably higher stress-strain
capacity than that predicted analytically (see also Table 1B and
Fig 2B) This is also observed to be true when correlating either
representation of the responses experienced by the tubes with the
predicted responses in spite of the fact that the tubes display a
considerably low stressing capacity relative to the coupons (Note
that the straining capability of the tubes ts of the samemagnitude
of that experienced by the coupons)
Fig 1B and Table 1B indicate that N0NLIN [10][l1] predicts a modulus of 257x106 psi whichis in very good agreement with 253
experienced by the coupons RDS[5] SQ5[8j and N0LIN[1SI yield a
lower modulus of 246x1066 which is in good agreement with 239x106
experienced by the tubes (truethickness)
Comparing the ultimate stresses predicted by the different
analyses with the empirical strength values experienced by the coupons
it is found from Table lB and Fig 2B that SQ5[8] predicts a strength
of 356 ksi which is in very good agreement with 351 experienced
by the coupons N0LIN[13] yields very low strength values which are even considerably lower than those experienced by the tubes RD5[53
again generates meaningless stresses (see discussion above on the
[plusmn300] laminates)
325 [plusmn600] Laminates
The empirical responses of [1]together with the predicted
onesare presented in Fig 16 Poor correlations is observed among
the responses predicted by the different-analyses Fig 16 displays
good agreement between the responses experienced by the tubes (true
thickness) and the coupons however the coupons exhibit appreciably
higher stressing and straining capability than do the tubes Also it
is observed in this figure that N0NLIN [1o]h[i1] correlates well with
the experimental responses except for high stress levels where it
predicts less nonlinear behavior than that observed experimentally
17
It is observed in Fig 16 that in the range of low ttresses and
strains the response of N0LIN[131 also agrees with the empirical
responses however at a very low stress of about 100 ksi it deviates
from the empirical one and displays strong nonlinear behavior As
can be seen from Fig 16 this results in a considerably lower stressing and
straining capability relative to the coupons Correlating the response
predicted by RDS[S] with the experimental ones itisobserved inFig 16
that its response is stiffer and less nonlinear than that observed
for the coupons
Table 1B-and Fig lB indicate that RDS[5] SQS8] and N0LIN[13]
yield a modulus of 221x106 psi which is noticeably higher than 184x106
predicted by N0NLIN [101amp[111 These moduli are higher than 162x106
observed for the coupons
Comparing the ultimate stresses predicted by the different
analyses with the experimental strength values it is seen from
Table IB and Fig 2B that SQ5[8] predicts a high strength of 500 ksi
compared with 318 experienced by the coupons whereas N0LIN[131
predicts relatively low strength values 173 for Max Stress 180
for Max Strain and 205 ksi for Quad Fail No ultimate was generated degby RD5 (see discussion on [plusmn30 ] laminates) It appears from Table lB
and Figs 2B and 16 that the tubes (nominal thickness) yielded the
highest ultimate stress for this particular laminate
326 [plusmn750] Laminates
Fig 17 presents the experimental response of [I] together
with the predicted ones No agreement among the different predicted
responses is observed in this figure Good agreement between the
compression branch corresponding to the coupons and RDS[S] is observed
very good correlation in the almost linear range of response whereas
with increase in stress RDS responds less nonlinearly than do the
coupons Good agreement of N0LIN[13] response with the coupons is
also observed in Fig 17 in the range of low stresses and strains
(linear range) however with increase in stresses the response of
N0LIN deviates from the empirical one while displaying an appreciably
more pronounced nonlinear response The response predicted by N0NLIN
18
[101[111] is observed to display more emphasized nonlinear behavior
than N0LIN and does not agree with either the experimental response
or RDS and NOLIN predictions In regards to the tension branch of
the responses it is observed in Fig 17 that there is good agreement
among the different analyses and between the analyses and experimental
response (Note that tubes are not presented in the present evaluation
See [i)
Table iB and Fig iB indicate that the experimental modulus of 279x106 is in very good agreement with 276x106 calculated with
RDS SQ5 and N0LIN N0NLIN is found to predict a lower modulus of
197x106 psi It appears from Table lB and Fig 2B that the empirical
ultimate stress of 348 ksi is considerably lower than 446 predicted
by SQS[8] and is in good agreement with the strength value of 319
yielded by N0LIN Max Stress [13] N0LIN Max Strain and Quad Fail
are found to predict low ultimate stress values 264 and 285 ksi
respectively Again like for the [plusmn30 deg] laminate no ultimate stress
was predicted by RDS[S]
327 [900] Laminates
As with the IoV] unidirectional laminates the reproduction
capability of the different computer codes is evaluated In Fig 18
the empirical responses of [1] are presented with the predicted-ones
It is observed that in the range of moderate stress-strain levels
reproduction by both RDS[S] and N0LIN[13] is very good With increase
in stress levels both predictions deviate from the empirical response
experienced by the coupons while displaying a less nonlinear behavior
than that observed for the coupons a trend which is more emphasized
for N0LIN It is also observed in this figure that there is good
agreement between the experimental responses corresponding to the
tubes (nominal thickness) and coupons however the tubes sustain
a considerably lower ultimate stress than that experienced by the
coupons (see also Table IB) Referring to N0NLIN response [101amp[111]
it is seen from Fig 18 that this analysis predicts an appreciably
lower stressing capacity than that observed for the coupons and
predicted by the other analyses This response is found to be in very
19
good agreement with that experienced by the tubes when true thickness
is accounted for Comparing the tension branch of-the-predicted responses as
well as theeihpirical ones of Fig 18 very good agreement is found
It appears from Table IB and Fig IB that RD51J SQ5[8] and
N0LIN[13] reproduce the modulus of 298x106 psi experienced by the
coupons whereas N0NLIN [0]0[i11] predicts a considerably lower modulus 6of205xlO Comparing the ultimate stresses yielded by the different
analyses with the empirical ones it is found from Table lB and Fig
2B that the stresses of 320 ksi predicted by NOLIN Max Stress and
Quad Fail are in very good agreement with 317 experienced by the
coupons Good correlation is also observed between the empirical
stress and 341 ks predicted by N0LIN Max Strain It is also observed
in Table lB that RD5 yields a similar stress of 340 ksi for the last
acceptable-strain value
328 [00900] Laminates
The experimental responses of [1] and the ones predicted by
the analyses are presented in Fig 19 Comparison of the analytical
predictions with the response experienced by the coupons reveals very
good agreement between the empirical response and RD[51] as well as
very good agreement with the predictions of N0NLIN [101amp[11] and N0LIN[13]
in the range of moderate stress-strain values With increase in stressshy
strain levels N0NLIN and N0LIN which predict almost identical responses
display some minor nonlinear behavior which is hot observed for the
coupons Note that N0NLIN and N0LIN yield strength values which are
in good agreement with that predicted by the coupons whereas RDS
yields an appreciably lower stress (see Table lB and Fig 2B) It
is also observed in Fig 19 that once the true thickness of the
tubes is accounted for they respond wimilarly to the coupons but
fail at a considerably lower strength value (see Table iB)
It is found from Table 1B and Fig lB that N0NLIN yields the
lowest modulus 1667x106 psi N0LIN and SQ5 predict a modulus of
1715xlO6 which is in very good agreement with the empirical one of 6 6
1717x10 and RUB yields a slightly higher modulus of 1721x10
20
Table 1B and Fig 2B indicate very good agreement between
the strength of 230 ksi observed for the coupons and 220 yielded
by N0NLIN Also it is observed that all other analyses predict lower
ultimate stress values than that experienced by the coupons
deg329 [0degplusmn45090 1 Laminates
In Fig 20 the experimental responses of [1] are shown together
with the ones predicted by the analyses Very good agreement is observed
between the response yielded by the coupons and those predicted by
the analyses in particular the one calculated with N0NLIN [10311]
No correlation is observed in Fig 20 between the response observed
for the coupons and either version of the responses experienced by
the tubes
It is seen from Fig IB and Table IB that N0NLIN predicts a 6 6moIulus of 162x10 psi which isslightlyhigher than l147x10
experienced by the coupons and -slightly lower than 1187 yielded by
either SQ518] or N0LIN[3I] and i192xlO predicted by RDS[5]
Comparing the ultimate stresses experienced empirically and those
-predicted analytically it appears from Table 1B and Fig 2B that
N0NLIN strength of 141 ksi is in good agreement with 158 ksi bserved
for the coupons whereas N0LIN[13] in spite of its very good ageement
with the coupons mentioned above yields a stress of 125 ksi fQoMax
Strain and lower stresses of 121 and 113 ksi for Max Stress and
Quad Fail respectively It is also observed that RDS[S] predicts a
noticeably lower ultimate of 130 ksi and SQ5[8] a strength of 134
4 CONCLUSIONS
(a) None of the analyses namely RD[51] SQ5[8] N0NLIN[10][l1]
and N0LIN[13] utilized in the present comparison studies is
found to be adequate to predict satisfactorily the compression
response of angle-ply laminates
(b) As mentioned in the text of this report the responses corresponding to the unidirectional laminates which were experienced
by-the compression coupons of [l]were utilized as data input
for thecomputer codes RDS SQ5 and N0LIN It is observed from
21
the present comparison studies for the angle-ply laminates that
in spite of this the predicted response with these codes do not
favor the responses experienced by the coupons better than the
ones observed for the tubes For some laminate configurations
better correlation is observed with the responses yielded by
the tubes
(c) Present numerical studies indicate that no unique compression
responses were predicted by the various analyses employed in
the present comparison studies for the large variety of laminate
configurations invesrigated For some laminate configurations
considerably different responses were predicted for the same
laminate by the various analyses
(d) The analyses were found to be inadequate to predict the ultimate
stresses of the angle-ply laminates The built-in failure
mechanisms in the analytical models were not verified by the
test results because of very poor correlation between the calculated
strength values and those observed experimentally
(e) The very good correlation of the predicted moduli with the
empirical onesand the pronounced disagreement among the predicted
ultimate stresses nibther verifies nor contradicts the influence
of the edge effects discussed in Appendix B In view of the
arguments in this Appendix and the lack of success of a sound
test program with the compression tubes of [11 coupons having
different dimensions than those employed in [1] should further
be tested to accomplish the objectives of the test program of
[1] and present comparison studies and evaluations
6
22
REFRENCES
1 T Weller tExperimental Studies of Graphite-Epoxy and Baron-Epoxy Angle Ply Laminates in Compression NASA CR 145233 Sep (1977)
2 R T Haftka and J H Starnes JR-- Application of an Interior Penalty Function for Structural Optimization -AIAA Paper 75-764 t1975)
3 SW Tsai - Strength Characteristics of Composite Materials - NASA CR-224 April (1965)
4 S W Tsai D F Adams and D R Doner - Analysis of Composite Structures - NASA CR-620 November (1966)
S P H Petit - Ultimate Strength of Laminated Composites -
Report FZM-4977 prepared for Advanced Filaments and Composites-Division Air Force Materials Laboratory Air Force System Command Wright - Patterson Air Force Base Ohio December (1967)
P H Petit and M B Waddoups -AMethod of Predicting the Nonlinear Behavior of Laminated Composites -J Composite Materials Vol 3 p 2 January (1969)shy
7 K 0 Chiu - Ultimate Strength of Laminated Composites -
J Composite Materials Vol 3 P 578 July (1969)
8 D L Reed - Point Stress Laminate Analysis - Report PZM-5494 prepared for Advanced Composite Division Air Force Materials Laboratory Air Force Systems Command Wright - Patterson Air Force Base Ohio April (1970) (Also T J Muha - Users Manual for the Laminate Point Stress Analysis Computer Program SQ5 as Revised by AFFDLFBC - AFPDL-TM-74-107-FBC July C1974))
9 H T Hahn -Nonlinear Behavior of Laminated Composites -
J Composite Materials Vol 7 P 257 April (1973)
10 R L Foye - Theoretical Post Yielding Behavior of Composite Laminates Part I Inelastic Micromechanics -J Composite Materials Vol 7 p 178 April (1973)
23
11 R L Foye - Theoretical Post Yielding Behavior of Composite Laminates Part II Inelastic Micromechanics J Composite Materials- Vol 7 P310 July (1973)
12 R S Sandahu-- Nonlinear Response of Unidirectional and Angle-Ply Laminates - AIAA Paper 74-380 April (1974)
13 Z Hashin D Bagchi and W B Rosen - Nonlinear Behavior of Composite Laminates - NASA CR-2313 April (1974)
14 T Weller - Experimental Studies ofGraphite-Epoxy and Boron-Expoxy Angle Ply Landnates-in Shear NASACR 145232 Sep (1977)
15 W D Whetstone - Structural Network Analysis Program -
Users Manual Static ANAlysis Version V70E LMSC-HREC D162812 December (1970)
24
APPENDIX A
It has been pointed out in the section on the Numerical studies
that the computer codes RDS15] and N0LIN[15] require the existence of
the unidirectional [00] and [90] laminae responses in tension
compression and shear for their application The images of these
data inputs or library data input are presented in Tables APA-1A and
APA-IB as being input into RDS code In addition to the data in these
Tables also required by N0LIN the information presented in Table
APA-2 has to be provided to operate the N0LIN code (Instead of feeding
N0LIN with the stress-strain data input for the responses one may
use the Ramberg-Osgood parameters as explained in [13] and avoid the
utilizing of curve fitting alegorithms to generate these parameters)
The mechanical properties given in Table APA-2 are also required
as data input by SQ5 code
It was mentioned in the section on Results and Discussion that
the data input for the matrix material of the AVCO 5505 Boron-Epoxy
laminates was taken from [10][l1] The mechanical properties are as
follows
Young Modulus of Matrix 510000 psi
Shear Modulus of Matrix 200000 psi
Poissons Ratio of Matrix 310
and the equivalent stressequivalent strain curve is reproduced from
these references SLI = 106ESI = 5000 SL2 = 5x10⁶ ES2 = 10000 SL3 = 19x106 ES3 = 15000
ES4 = 20000 SL4 = 1Oxl06
ESS = 25000 SL5 = 3230
ES6 = 30000 SL6 = 0
25
The Boron fiber properties are Provided by the manufacturer and
are as follows
Young Modulus of Fiber 58x106 psi
Shear Modulus of Fiber 2375x106 psi
Poissons Ratio of Fiber 200
Fiber Tension Ultimate 500 ksi
Fiber Compression Ultimate 750 ksi
26
APPENDIX B
Ithas been mentioned in [I] that edge effects might be induced
far away from the loaded boundcaries of the coupons resulting in an
unevenstress-strain distribution even for a-coupon loaded uniformally
This kind of behavior was experienced by all the angle ply laminates
of []
When the coupon is loaded in a manner described in Fig APB
allowing for a uniform axial displacement u=(-S) and completely
restraining the lateral displacement y = 0 along the loaded boundaries
plusmn12 it is anticipated that the coupon width or rather its aspect
ratio AR = 1 will have an appreciable influence on the stressshy
strain distribution of angle-ply laminates possessing high Poissons
ratios
Withthe prescribed boundary conditions the specimen might
experience an induced transverse stress approaching in the limit a
stress of
ay= Gx yx
A wide specimen will contain a wide zone of continuous fibers subject
to this high degree of lateral restraint Consequently this zone will
result in both higher stresses and stiffnesses than the regions close
to the free edges of the coupon where the filaments are noncontinuous
and hence shear the load from the termination of one diagonal fiber
into the begining ofan adjecant one through the matrix This of course
will result in an unknown uneven stress-strain field which renders wide
specimens unsuitable for application The stress is picking up towards
the center and hence ishigher than the average stress utilized to
present the response of such specimens On the other hand too narrow
specimens will be affected primarily and subject to the edge effect
which-will reduce both their strength and stiffness
A numerical study was carried out to determine the actual
lateral edge effect combined withPoissons ratio and to define the
best aspect ratio ie the minimum length of the coupon1 free
27
of lateral boundary influence at least along its center line transverse
to the direction of applied compression SNAP computer code [15] was
used for this purpose and the obtained results are presented in Fig
APB-2 The coupons of [1] have an aspect ratiq AR=75 which according
to Fig APB-2 is too short to eliminate the lateral boundary influence
The above discussion calls for a different type of specimen
Indeed tubes were also tested and reported in [1] A tube is free
of the free edge region but on the -other hand is susceptible to
another deficiency if the radial displacementsat the loaded boundaries
are prevented from expanding to allow for Poissons expansion high
bending stresses develop at the restrained boundaries These stresses
might precipitate early local failure at the specimen edges or might
be superimposed on the compressive stresses in case the tube is too
short again bringing about failure at a stress lower than the ultimate
one corresponding to the tested laminate
TABLE 1A Compression Response - Comparison of Experimental Ultimate Stresses and Moduli With Analytical Predictions of RDS[S]
SQs[S1 N0NLIN[101amp[11] and N0LIN[13]
GRAPHITE-EPOXY LAMINATES -3m SP-286T3
EST RESULTS OF [1] ANAL RDS [5 ANAL SQS [8) ANAL NPNLIN ANAL N0LIN [13]
Laminate
Configuratlon
ompressionCoupons
Ult Comp Cop Mo Stress __(si) x1Opsi)
Compression TubesU
Mo M esod
Thick Thick 6 ks(ksi) ksi x O si)
Ultimate
CoSteStress
(ksi) 6
xlO si
Ultiate
(ks ) 6ai ps
Ultimate
Co Stress ksi ops )
015 Com stress (kst
Max Max quad Stress Strain InteracIl Fal Faill
Ex
(x O psi)
[00]
164 191 115 664 510
200 1609 20911 1607 8011
20911 180 1607
[plusmn15 ] 117
1394 105 826
1842 [14251
105 1324 --
11722 -
1324 14022 10622 929 1324
[plusmn30] 548
5911 374
687 292
357 283
246
286 224
811 [655]
400 1
575 48722 576 43412 37622 288 575
[plusmn453 382
227 289 234
312 [251]
313 (60)1
203 25122 204 16212 19712 175 204
[plusmn601 3547 172
222 163 251 238 158 30812 161 19512 22312 233 161
[plusmn731 312
360
191
5376321 194
214
221 14
150
[1793
175
[120]
375 175 48922 181 32522 32522 298 181
330
344 [191
155
241
102
180 132
1101-3 350 184 47822 191 32022 33222 320 191o
111 115115898
879 294
493382 287
42229 835[7791
110 1
899 11511 883 96211 11211 107 883
[0__48deg 97 _674 76[979476 359 71571 as 642 82111 632 6871 79 211 648 632
2Corrected for measured thickness
A11 Failure in compressionor tension in laina 11 direction A2 F1
1-(inch) n2540x1 2 meter
I pound fo ce - 4448222 Newton (N)kip = 10 poundtrce
b)
)+ Ulitimate stress values corresponding to very high unreasonable strain values upper number - last stress value which corresponds to an acceptable strain value
TABLE 1B Compression Response - Comparison of Experimental Ultimate Stresses and Moduli With Analytical Predictions of DS[5]
SQs[8] N0NLIN[10]G(li] and N0LIN[I3]-
TEST BORON-EPOXY LAMINATES (AVCO 550556 MIL DIA)
SANALRESULTS OF ANAL RDS (5] ANAL SQ5 -
(8] NLINAL0NL N AANLN[3ANAL N0LIN [13]
Laminate
Configuratio
Compression Copons
lt EStressCmpComp Mod
Compression Tubes
UltCom Stres m MeasuredThick x
Ultimate
CompStress
Ex
Ultimate
CompStress
Ex
Ultimate
ConyStress
Ex
Comp Stress (ksi)Ult
x Stress Strain Interac
Bx
(ksi) (xIO 6psi) (ksi) tksi) (xl06psi) (ksi) (xLOp$i) (ksz) (x06psi) (ksi) (xlO psi) si__ (xlO6psi)
10] 263
342 3127 - - 3340 3128 35311 3127 3120 54011 35311 340 3127
[1300]
( 45]
135 2365
139
947 5551095 O9
961 S89
337
253 351 308
838
918 290 3 300
255
280 331
576
680 206
2T4
194
204 234I
3749 [2685]
1111 [800]
323 [239]
150 2527
425 - 923 (NoULTOBT)OET
135 246 (NOULTOBT)
13322
4422
350612
2526
923
246
2496
887
257
32122
11212
10422
24622
11SIZ
246
115
2526
923
246
[plusmn601l 318 333
162 387 274
264 199
397 (272]
300 (NOULTOBT
221 50022 221 184 17312 18012 205 2 21
[plusmn7S) 348
279 2 311
19360 214 (64)+
276 44622 276 197 31922 26422 285 276
[90deg]
(090]
298
517 179
1
298
177
178
2171 206
126
143 1 8
339 [232] 2534
340
(38)+
190
299
11
1721
44722
194 111
298
1715
220
205
1667
32022
17611
34122
18411
320
21
298
1715 t
230 233 157 [1773] k
[0iplusmn4rso] 146
158 1147
137
147
881
874 1665
_110201 130 1192 13411 1187 141 1162 12111 12511
1 113
1 1 1187
1 q 1
Fiber failure in D degree layer
Calculations exceeded maximum observed experimental strain values
Solution does not converge
[ 3 Corrected for Measured thickness Ail Failure in compressionor tension
in lamina 11 directionIi
-2II (inch) = 2540x10 2 meter Tmi) I pound fojee = 4448222 Newton(N)
psz = 69477x10ound f rPascal (Pa)
)+Ultimate stress values corresponding to very high unreasonable strain values- upper number shy last stress value which corresponds to an acceptable strainvalue
A22 Failure in compressionor tension
A12 Failure in shear
I ksi i 105 psi
LIBRARY DATA FOR MATERIAL 2 - - SMSP2B6T-3(A-S)LEA1FA INPUT
SIGTO EPSTO SIGT9O EPSTS0O SIGCO EPSCO SIGC90 YPSCc9o
013500E 05 080000E-0 09O0000E 03 06000E-03 022500F 05 014000E-02 O46000E 04 025000E-b2 026500E 05 0O16000E-02 018000E 04 012000E-02 045000E 05 028000E-02 090006t 04 0500Q0E-02 O405hOE 05 O24OOOE-02 -026700E 04 018000E-02 067500E 05 02000E-02 013250E Oi 075000E-2 054500E 05 03200t-02 Q4860E 04 024000E-02 087200E 05 056000E-02 016800E 05 OlOOOE-01 069000E 05 00000E-02 042700E 04 q30000t-02 010670E 06 070000E-02 020500E 05 012500E-01
048 0 0 0E- 0 50 8 0 0E 04O3500E 05 0 2 036 000 E-02 012560E 06 O840OE-02 02375OE 05 015000F-01 097500E 05 056000E-02 058300E 04 O042000E-02 O14OE 06 098000E-02 026600E 05 ot17500E-Q1 011150E 06 064OOE-02 066200E 04 048000E-02 016250E 06 011200E-01 029100E 05 020000E-01 012559E 06 072000E-02 073600E 04 0540O0E-02 017900E 06 012600E01 031400E 05 p22500E-O1 013950E 06 08000E-02 081000E 04 060000E 02 019400E 06 01400OE-01 033500c 05 0250nOE-01 00 08BOOOE-02 00 amp66000E-02 00 0154600E-01 00 027500E-01 00 096000E-02 00 072000 E-02 00 016800E-01 00 03000AE-01
SIG45 EPS45 TbU12 CNL12 1 TNU21 CNU21
012540E 0 022000E-02 031400E 00 024000E 00 027911E-01 027477E-01 025080C 04 044000E-02 031600E 00 026000E 00 029169E-01 028073E-01 037620E 014 066000E-02 031800E 00 027500E 00 026349E-01 029089E-01 O5IOO1 E 04 0880OOE-02 0319nOE 00 028000E 00 024609E-01 028256E-01 058500 04 0i1000E-01 032000E 00 030000E 00 023246E-01 031877r-01 064000E 04 01300E-01 032000E00 031500E 00 023835E-01 030333E-01 069600E 04 015400Fr01 032000 00 03250OE 00 02857E-01 027590E-01 074000E 04 017600E-01 032000E 00 033000E 00 024076E-01 025525E-01 077500E 04 01VSOOE-01 032000E O0 033500 E 00 022552E-01 P26150E-01 080500E 04 022000E-01 031900E 00 034000E 00 022482E-01 026656E-01 00 024200E-01 0 00 00 0i0 00 026400E-01 00 00 00 00
TABLE ApA B- INPUT LIBRARY DATA FOR MATERIAL -1 - - AVCO 550556
SIGTO EPSTO SIGT9O EPST9O SIGCO EPSCO STGCSO CpSc90
021700E 05 043400E 05 065100E 05 086800E 05 010850E 06 0130206 06 015190r 06 017360E 06 Olq530E 06 021700F 06 00 00
070000E-03 0o4OOOE-02 O210OOE-02 028000E-02 035000E-02 042000E-02 049000t-02 056000E-02 0630OE602 070006E-02 077000E-02 084000E-02
011500 04 023000E 04 033500E 04 043400E 04 052700E 04 0610OE 04 070600E 04 078500E 04 084500E 04 089000E 04 00 00
04000E-03 080000E-03 012000Er02 016000E-02 020r00E-02 024000E-02 028000E-02 032000E-02 036000E-02 040000E-02 044000E-02 048000E-02
031270E 05 062540E 05 093810E 05 012508F 06 015635E 06 018762E 06 022100E 06 025400E 06 028800E 06 03l000E 06 00 00
010OOE-02 920000E-02 030000E-02 040000E-02 050000E-02 0600OOE-02 070000E-02 080000E-02 090000E-02 016000-01 011000E-01 012000E-01
044800E 04 069500E 04 013150E 05 016800E 05 020200E 05 023100E 05 025750E 05 028000E 05 031000E P9 031700E 05 00 00
015000E-02 - 030000E-02 045000E-02 96000E-02 075000E-02 090000E-02 010500E-01 0120006 1 013500E-01 0150OOE-01 0165O6E-01 oaeooor-Oi
SIG45 EPS45 TNU12 CNL12 TNU21 CNU21
0BgPE 04 033200E 04 042500E 04 0116500E 04 048500E O 050500E 04 052200E 04 053500E 04 055000E 04 O596000E 04 00 00
02700E-02 054000E-02 081000E-02 0108OOE-01 013500E-01 016200E-01 018900E-0 02tOOE-01 024300E-01 027000E-01 029790E-01 032400E-01
022700E 00 022700E 00 022700E 00 022400E 00 022400E 00 022400E 00 0224006 00 023000E 00 023300E 00 022700E 00 00 00
02640nE 00 026600E 00 026800E 00 026800E 00 027000E 00 02720 0 E 00 027500E 00 028000E 00 029000E 00 032000E 00 00 00
021052E-01 021052E-01 019222E-01 017884E-01 016800E-01 016439E-01 158976-01 014653E-01 011274E-01 0823806-02 00 00
025215E-01 025350E-b1 023997E-01 020855E-01 019572E-01 016817E-01 014555E-01 0i2727E-01 017059E-01 028118 -02 00 00
00 -
32 ou~IGV AGT32~ jO Q1JA1ATY
TABLE APA-2 Unidirectional Lamina Properties Utilized In The Predictions Of SQS9] and N0LIN[14]
3M SP-286T3 AVCO 550556 Mil GRAPHITE-EPOXY BORON-EPOXY
(Ell)Tension 1687x106 psi 3100xlO6 psi
(E11)Coinpression 1607x106 psi 3127x1O6 psi
(E22)Tension 152x106 psi 288x106 psi
(E22)Compression 191x106 psi 298x106 psi
GO2 057x106 psi 066x106 psi
(aULTll)Tension 140 ksi 220 ksi
(eULTllTension 008 007
(cULTll)Compression 180 ksi 340 ksi
(eULTll)Compression 013 0113
(t ULT22)Tension 8 ksi 89 ksi
(ULT 22)Tension 006 00405
(aULT22)Compression 32 ksi 32 ksi
(EULT22)Compression 025 015
((ULT12) 81 ksi 56 ksi
(CULT12) 022 0275
(v12)Compression 230 267
(v12)Tension 298 216
-1 (inch) = 2540x10 2 meter Cm)
1 pound force = 4448222 Newton (N)
I kip = 103 pound force
I psi = 6894757x105 Pascal (Pa)
I ksi = 103 psi
A test results [1] (coupons)0 analysis (8] amp 131
I00
w CL
10
-0
5
66
0 I I I I I I Cgt t C00o
01 +1 +1 +shy
g LAMINATE CONFIGURATION
FIG 1A YOUNGS MODULUS OF 3M SP-286T3 GRAPHITE EPOXY LAMINATES ASAFUNCTION OF LAMINATE CONFIGURATION
30 7A test results [i](coupons)0 analysis [81 amp [131 v [10] ampIll]
C o
w 20
109
0I III I I I + +1 +1 +1 +1
LAMINATE CONFIGURATION 0
FIG 1B YOUNGS MODULUS OFACO 5505(56MIL DIA BORON-EPOXY LAMINATES AS AFUNCTION OF LAMINATE CONFIGURATION
200t 200 3 0 mxx stress falla test results [1) (coupons) analysis NOLIN 03] V max strain fail
0 analysis RD 5 [5] r[ quadr interaction 0 analysis SQ5 [8] fail
150 150
0x(0
a
0~ARA 0
100- V13 100- 0
A A
A
50- 0 0 0 50shy000 v A A
0 A 13 V 0 0
0 in 0 10 0 O 0 to CD +1~j4 3 + +1 owi +1 +1 +1 4
LAMINATE CONFIGURATION LAMINATE CONFIGURATION
FIG 2A ULTIMATE STRESS OF 3M SP 286T3 GRAPHITE EPOXY LAMINATES AS AFUNCTION OF LAMINATE CONFIGURAiON
A tests results [1] (coupons) 0 maxstressfail 0 analysis RD5 [5] analysis NLIN [13] v max strain fail
300 0 analysis SQ5 [8] 300 0 quadr interaction fail
200
00
-A
200 -3
A
100 00
A A0 100 A
09 0A
o
0 LO lcent
O O -t to
TL +1 + 1 +1 1 LAMINATE CONFIGURATION
FIG 2B ULTIMATE STRESS OFAVCO LAMINATE CONFIGURATION
0 C gt 1LO L O C La mmO) rt
+ 1 + 1 + 1 + 1 4 LAMINATE CONFIGURATION
550556 MIL DIA BORON-EPOXY LAMINATES AS A FUNCTIONOF
200 -+ A
o 0
A
o 0~
ab A
0 Aa AA
0shy 0500shy
15-15 - 0 0l FIG Z
-0
OMPESIONRESONEO 003MSP-66T GAPHTE-POY LMINTA
AxC)0o00A
001 A0e
_150
0
0 00
0
coupons 0
00 0
u coupons
100 tubes nom
thick A
0
ubes horn thick
tubes t thickK 077 tubes tthick
50 -
-15 -10 -05 0 05 10Ex (4) 6 (0)FIG 4 COMPRESSION RESPONSE OF plusmn15 deg 3M SP-286T3 GRAPHITE-EPOXY LAMINATES
75
0C
E 50
coupons coupon 00
a 00 tubes noa oo
tubes tubes fern
0A
tubes t~ 4 tubes tthick 25 thick - shy
cento 4 AOa
0-10 -05 Ex (0) 0 y 05 10 15
FIG 5 COMPRESSION RESPONSE OF -30 3M SP-286T3 GRAPHITE-EPOXY LAMINATES
40
30-S
tubes hnmhick tubes nom
tik
a
20--
a-P III
-5 -3
FI30OMRESONtubes
-4
tubes tthick
2co1upo1s
FLJ-5 3 M28Thick
IF- PO
tues fain thIkEshy
tubes trthick
(60)
10G COPESONRSOSE-5 3MS-8t-RPIEEOY AIAE
40
couponstubes nor
copn thick
nomn btubes thick th
30CL
U
1shy
o
S-4 -3 -2 -ex (0) 0 y 2
degFIG 7 COMPRESSION RESPONSE OF +-60 3M SP-286T3 GRAPHITE-EPOXY LAMINATES
40
CL E 0 U
30
U) coupons
A
A
coupons
A
20-
0
tubes nom thick
0
tubes nom thick
-
tubes t thick
tubes t thick
10shy
-3 -2 -1 Ex() Cy (1)
FIG8 COMPRESSION RESPONSE OF plusmn750 3M SP-286T3 GRAPHITEEPOXY LAMINATES
-4 0
35 +
CL o0
Di couon coupons
S25
bull--
20shy
--
tubes nom thick
tubes nom thick
t
15-tubes
thick t
tubes tthickN N
10 -N
NN
0n -25 -20 -15 -10 ex -05 0 ey 05
FIG 9 COMPRESSION RESPONSE OF 906 3M SP-286T3 GRAPHITE-EPOXY LAMINATES
120
100- A
2 coupons
E080 A 2 0
60shy
thick tubes nom hidk
40shy
tubes t 20- tubes tthick - thick
0shy-16 44 -12 -10 -08 -06 -04 -02 0 02
FIG 10 COMPRESSION RESPONSE OF 0900 3M SP-286T3 GRAPHITE-EPOXY LAMINATES y
100
oo coupons
ns coupons
0
UIi75 - -
50- C
tubes nom tubes nor thick thick
25 tubes tthick Kc_ tubes tthick
-20
FIG11
-15
COMPRESSION -1o
RESPONSE OF 0145900
-05 0 05 e1 (C) OE y (0)3M SP-286T3 GRAPHITE-EPOXY LAMINATES
10
400
(0
6 coupons coupons 200- shy
100 shy
-12 -10 -08 -06 -04 Q02 0 0Q2 ey 04 FIG 1V COMPRESSION RESPONSE OF 00 AVCO 5505156 MIL DIA BORO-EPOXY LAMINATES
150- +-- V
o
U)
In
_
A coupons
100 tubes florn
E
nom
tthick
tubes tthick-- t
copos7L A
V(10
-otubesnomathick ov
tubes tik IV deg tub es t t h ic k o
50 0
10
001
I
FIG 13
-05 0Eri)
COMPRESSION RESPONSE
A H I
05ey (0)
OF t 150 AVCO 5505 BORON-EPOXY
10
LAMINATES
15
75
0v VU)InI v v 03pn coupons
degu v
- 50v V
(no ultobt) A (no ultobt)amp
25- 0
tubes nom thick 04 tubes nom thick
tubes tthick0 tubes tthick
- Q5 0 05 10 15Ex (sect) Ey (dego)
FIG 14A COMPRESSION RESPONSE OF plusmn300 AVCO 550556 MIL DIA BORON-EPOXY LAMINATES (BATCH 1)
20
100
0
0
U
75
(no V V V
V50 -- V V -o uponsV (outat)v (no ultobt)
nora tubes 47
VAnom 0V thick AV
25tubes noma th
tubest~thikK~iVx tubes tthick
5 -D -05 E M0 (o) 05 10 15
FIG 14B COMPRESSION RESPONSE OF plusmn300 AVCO 550556 MIL DIA BORON-EPOXY LAMINATES (BATCH E1)
40
0
CLcuoscoupons
E 0 v
30shy
230 ---shy
thick thick -S- -- - tin
20- tube2 k- -shyc
1 e thick
(noul Xe (no ult)
10- (t A
0 04 ey SA)x (15FIG 15 COMPRESSION RESPONSE OF plusmn450 AVCO 550556 MIL DIA BORON-EPOXY LAMINATES
_ _ _ _ _
40
tubes nom thick V
tubes nom thick
c-oupons v (no ult obt) v n
(no ult30- A obt) VA coupons
0
~hck tubes tthick2tbs8 ZE AA
00 In AA_
vA 0 b 0 A 0
A 00 0
0 10 AA
OI I I -5 -4 -3 -2 1 ( y 2
FPAxI E y ()MFIG 16 COMPRESSION RE-SPON$EOFi60 AVCO -550556 MIL DIA BORON-EPOXY LAMINATES-
40
(64 ksi) (64)
30
oV CO
coupons
0A 0
AA A coupons
0-A 5
20
0
0 00
10shy
00
V
-25 -20 -15 -10 -05 0 05eF (0) Ey (CI)05FIG 17 COMPRESSION RESPONSE-OF +-750AVCO 5505156 MIL DIA BORON-EPOXY LAMINATES
40 -
C
En Ult 3 0 L
0 deg 3 0 - cou on coupons u
830
tubes nom 20 V thick
tubes nom thick V
-tubes tthicdk
thick 10shy
-16 -14 -12 -10 -08 -06 -04 -2 0 2 ei () ey (0)
FIG 18 COMPRESSION RESPONSE OF 906 AVCO 550556 MIL DIA BORON EPOXY LAMINATES
2-250 upons coupons
CL tubes nom thick tubesno]
ktubes t tubes t
0 thick thickS 150- O
0
wA
201 thck
50
-14 -12 -10 -08 -06 -04 -02 0 02 ex (0f) ey (l)
FIG 19 COMPRESSION RESPONSE OF 0900 AVCO 550556 MIL DIA BORON-EPOXY LAMINATES
200
2 0
E coupons
150 tubbs nom tubes thick nom
thick
100
tubes t tubes thick tthick
50shy
- I
0-15 -10 -05 05Lx () 00 y (l) 0
FIG 20 COMPRESSION RESPONSE OF 0145900 AVCO 5505156 MIL DIA BORON-EPOXY LAMINATES
IxJu
uniform compression
L u=-8 I I I I I
I Ib
I 1IIAP II ICPSIx I I
I I
I- b
FIG APB 1 COUPON UNDER UNIFORM COMPRESSION
AR AR (SNAP) t xy
0 POISSON RATIO -xy
2 10lj
ISOTROPIC 0 PANEL
I bullI 00
0 05
0 10 20 30 40 50 60 70 80 90 t a (degrees)
FIG APB 2 MIN AR FOR 6BESTSTRESS DISTRIBUTION ALONG THE CENTER LINE OF THE COUPON

10
Comparing the moduli predicted by the analyses it is seen
from Table IA and Fig IA that SQS[8J and N0LIN[13] yielddd an identical
modulus of 181x10 6 psi which is slightly higher than 175x106
These moduli values are lower than 191x106
calculated with RDS[5]
experienced by the coupons and in very good agreement with 175x106
yielded by the tubes when nominal thickness is being considered
Once true thickness is accounted for very poor correlation with
analytical predictions is found (120x06) It is observed in Fig 2A
and Table 1A that the empirical ultimate stress of 360 ksi experienced
by the coupons is in good agreement with 375 yielded by RDS[5] and
325 predicted by N0LIN Max Stress and Max Strain [13] SQ5[8]
is found to predict a considerably high stress of 489 ksi and N0LIN
QuadFail a relatively low stress of 298 ksi The tubes appear
to sustain considerably low stress Values (214 ksi for nominal
thickness)i
317 1 190] Laminates
Like for the [0] laminates the experimental responses of
this laminate configuration are utilized as data input for the computer
codes of the different analyses [5] [8] nd [13] Uence evaluation
of the empirical responses of [1] which are presented in-Fig 9
together with the predicted or rather reproduced ones indicate the-degree
of effectiveness of the analytical models on which the computer codes
are based at least in reproducing the data input Very good agreement
is observed between N0LIN [13] and the experimental response experienced
by the coupons RD5[5] is seen to follow the empirical response in
the range of low stress-strain levels but with increase in stress
values displays less nonlinearity than either the coupons or N0LIN
It is also seen from Fig 9 as well as Table 1A that the tubes
experience considerably lower stress-strain values and a less stiffer
compression response relative to the coupons
Table 1A reveals that RDS[5] predicts a modulus of 184xlO6psi
which is slightly lower than that of 191x106 experienced by the
coupons Fig 2A and Table IA indicate very good-agreement between
the strength of 344 ksi yielded by the coupons and 350 by RDS
11
good correlation with N0LIN[13] predictions 320 332 amp 320 ksi
for Max Stress Max Strain and Quad Fail respectively and no
correlation with SQS[8] ultimate stress of 478 ksi
318 [00900] Laminates
Fig 10 presents the empirical responses of [I] and those
predicted by the analyses It is observed that in the region
corresponding to low stress-strain values there is very good correlation
between the analyses and the empirical compression branch-corresponding
to the coupons However with increase in stress-strain values the
response of RDS[5] deviates slightly from the empirical one while
that predicted by N0LIN[13] becomes pronouncedly nonlinear This
behavior of N0LIN might be explained by recalling the nature of
reproduction observed earlier in Fig 3 for the [0deg] unidirectional
laminate It is also seen from this figure that the analytical predicted
tension branches are stiffer than the tension response displayed by
the coupons However RDS agrees better than N0LIN with the test
results
Table 1A and Fig IA revealvery good correlation of the 882x10 6
empiricalmodulus of 879x106 psi with the calculated ones
by SQS[81 and N0LIN[13] and 899xl06 by RDS[S] Table IA and Fig 2A
indicate that the ultimate stresses predicted by RD5 SQ5 and N0LIN
Max Strain 110 115 and 112 ksi respectively are in very good
agreement with 115 ksi experienced by the coupons The stress of
107 ksi yielded by N0LIN Quad Fail is in good agreement with
the test results and that corresponding to Max Stress 962 ksi
is appreciably lower It is found from Table 1A and Figs 2A and 10
that the tubes sustained very low stress-strain values relative to
either the coupons or analytical predictions
319 100plusmn45090 deg1 Laminates
The experimental responses of [1] together with thb analytical
predictions are shown in Fig 11 It is observed that RDS[5] correlates
well with N0LIN[13] displaying very good agreement for low and moderate
stress-strain levels Fig 11 also displays good agreement between
the response experienced by the coupons and the analytical predicted
12
responses However the coupon response appears to-behave to some extent less nonlinearly and more stiffely than predicted (see Table IA and Pig IA) It is also observed in this figure that the tubes
(nominal thickness) respond similarly to the coupons but sustain very
low stresses (see Table IA)
Fig 1A and Table 1A indicate that SQ5[8] and N0LIN[131
predict a modulus of 632x106 psi which is lower than 642x106 predicted
by RDS[5] and 674 experienced by the coupons It also appears from
Table 1A and Fig 2A that the coupons sustained a considerably higher
ultimate stress (978 ksi) than that predicted by the analyses (850 ksi
by RDS 821 by SQ5 and 687 792 and 648 by N0LIN Max Stress
Max Strain and Quad Fail respectively)
32 BORON-EPOXY LAMINATES (AVCO 550556 MIL DIA)
In additionto the analyses of [5] [8] and [131 the empirical
results of [1] corresponding to this material are compared with the
predicted response by the analysis of [io]amp[ii] The results yielded
by the computer code of this analysis N0NLII should not however
be treated with the same degree of confidence as those of the other
analyses because the data input for thematrixmaterial of this composite
required in the analysis was not provided Hence available information
about the matrix reported in-the literature [10] was adopted Also 4note that no ultimate stress values appear either in Table lB or
Fig 2B because the analysis of [io]amp[Ii] does not predict ultimate
stresses except for the case when the fibers in any of the laminae
reach their assigned strength values
321 Unidirectional [00] Laminates
Like in the case of the unidirectional [0o Graphite-Epoxy
laminates the reproduction capability of the computer codes are again
evaluated The empirical response of [i] together with the reproduced ones are presented in Fig 12 It is observed that the compression
branch of RDS[5] correlates very well with the experiments except
in the neighbourhood of ultimate stress values N0LIN[13] deviates
slightly from the empirical one at high stress-strain levels because
as already mentioned earlier it does not allow for nonlinear behavior
13
in the 11 fiber direction and N0NLIN[10]amp[I1] isseen to bd in very
godd agreement with N0LIN The tension branch of RDS and N0LIN are
almost identical and agree with the coupon response except for high
stress-strain levels when they display less nonlinearity than that
experienced by the coupons The tension branch of N0NLIN is observed to
exhibit less nonlinear effects than either RDS or N0LIN
Table 1B and Fig 2B reveal very good agreement between the
experimental ultimate stress 342ksi and the strength predicted
by RDS[5 and N0LIN Max Stress and Quad Fail [13] 340 ksi by
all of the three SQ5 and N0LIN Max Strain are observed to yield
a slightly higher strength than that experienced empirically 353 ksi
It is seen from Table 1B and Fig IB that except forN0NLIN all the
analyses predict the experimental modulus of 3127xlO6 pstN0NLINyields 0 6 a slightly lower modulus of 3120x106
322 [plusmn150] Laminates
Fig 13 presents the experimental responses of [1] and the
predicted ones It is observed that all of the analyses predict almost
identical compression branches which are in very good agreement
with the response yielded by the coupons-for low stress-strain values
and that expeienced by the tubes when true thickness is accounted
for With increase in stress-strain values the coupons respond more
nonlinearly than predicted by the analyses Also RD51] displays
more nonlinear behavior than N0NLIN[10][II]andN0LIN[l3] Reffering
to the tension branch of the responses it appears that neither of
the predicted responses agrees with the experimental responses
Very good correlation is observed between RD5 and N0LIN in the low
stressstrain range whereas with increase in stress-strain levels
N0LIN displays slightly more pronounced nonlinear behavior At very
high stress values this behavior inverts and RDS displays very strong
nonlinear effects N0NLIN is seen to respond more linearly but
less stiffly than either RDS or N0LIN except for high stress values
where an opposite trend is observed
It is seen from Table 1B and Fig 1B that RDS[S] SQ5[8] and
N0LIN[13] yield a modulus of 2526x106 psi which is slightly higher
14
than 2496x106 predicted by N0NLIN [10]4[II] and also higher than
2365x106 experienced by the coupons Table IB and Fig 2B reveal
good agreement between the ultimate stress of 139 ksi experienced
by the coupons and 133 predicted by SQS[8] Also the strength
of 150 ksi yielded by RDS[5] correlates well with that sustained by
the coupons It is seen in Table IB that only one strength value
was predicted by N0LIN This ultimate strength value of 104 ksi is
appreciably lower than the empirical one Onlyone value was obtained
due to the fact that it was impossible to achieve convergence of the
solution with the algorithm which solves the nonlinear equations of
this computer code It is found from Table 1B Fig 2B and Fig 13
that the tubes sustained very low ultimate stresses relative to either
the -coupons or the analytical predictions
323 [plusmn3001 Laminates
It wasreported in [1] that two batches of coupons were
manufactured and delivered for testing for this type of laminate
configuration and when tested they displayed completely different
responses Hencethe empirical response corresponding to each
batch is presented separately together with the responses predicted
by the analyses in Figs 14A and 14B Fig 14B reveals immediately
that there is no correlation betweenthe analyses and the response
experienced by the coupons and as such wont be discussed any further
Fig 14A displays very good agreement between the compression branch
experienced by the coupons and that corresponding to the tubes when
nominal thickness is considered However it is observed in this
figure as well as TablelB that the tubes experienced very low ultimate
stresses relative to the coupons Referring to the tension branch
of the experimental responses it is observed that the coupons and
tubes respond completely differently one frot another It appears
from Fig 14A that the analytical predictions agree one with another
only in the very low stress-strain range At a stress level of about
200 ksi which corresponds to the ultimate stress of the tubes when
true thitkness is accounted for N0LIN[13] response deviates from
the responses predicted by RDS[S] and N0NLIN [10][Iil while displaying
initiation of pronounced nonlinearity At a stress level of about shy
15
350 ksi a similar behavior is observed for the response of RDS which
deviates from N0NLIN and also displays initiation of pronounced shy
nonlinearity The above discussion applies to both the compression
and tension branches of the analytical predictions Correlation of
the predicted responses with the empirical ones indicates fair
agreement with the response yielded by the tubes (nominal thickness)
No correlation is observed with the response experienced by the coupons
This is rather emphasized in the pronounced nonlinear region of the
responses where the coupons display a very high stressing and straining
capacity realtive to the analyses of RDS and NOLIN The mode of the
response predicted by N0NLIN is observed to differ from that corresponding
to the coupons as it displays less stiff behavior in the range of
stresses corresponding to the almost linear response of the coupons
andweak nonlinearbehavior in the range of high stresses which is
associated with the pronounced nonlinear behavior of the coupons
It appears from Table lB and Fig IB that the coupons experienced
a modulus of 1098xi06 psi which is noticeably higher than 923xl06
predicted by RD55] SQSE8] and N0LIN[13] It is also found that
N0NLIN [10amp][II] predicted an even lower modulus of 887x106 psi
As already discussed above and as can be seen from Table 1B and Fig 2B
the analyses predict ultimate stresses which are significantly lower
than 589 ksi sustained by the coupons It is also observed in Table IB
that no ultimate stress was generated by RDS[5] (The last stress
value corresponding to acceptable strains is 425 ksi and above this
stress the calculated stresses are associated with unacceptable strain
values)
324 [plusmn450] Laminates
Fig 15 presents the experimental responses of [1] together
with thepredicted ones In the range of low stress-strain values
good correlation is found for the tubes (true thickness) with the
analytical predictions but with increase in stress-strain values the
analyses of RDS[S] and N0LIN[13] predicted more pronounced nonlinear
behavior than that experienced by the tubes whereas N0NLIN [10][11]
displays less emphasized nonlinear behavior and also displays a tendency
16
to follow the response experienced by the tubes when nominal thickness
is considered No correlation between the response experienced by
the coupons-and either of the predicted responses is observed in Fig 15
The coupons are found to sustain a considerably higher stress-strain
capacity than that predicted analytically (see also Table 1B and
Fig 2B) This is also observed to be true when correlating either
representation of the responses experienced by the tubes with the
predicted responses in spite of the fact that the tubes display a
considerably low stressing capacity relative to the coupons (Note
that the straining capability of the tubes ts of the samemagnitude
of that experienced by the coupons)
Fig 1B and Table 1B indicate that N0NLIN [10][l1] predicts a modulus of 257x106 psi whichis in very good agreement with 253
experienced by the coupons RDS[5] SQ5[8j and N0LIN[1SI yield a
lower modulus of 246x1066 which is in good agreement with 239x106
experienced by the tubes (truethickness)
Comparing the ultimate stresses predicted by the different
analyses with the empirical strength values experienced by the coupons
it is found from Table lB and Fig 2B that SQ5[8] predicts a strength
of 356 ksi which is in very good agreement with 351 experienced
by the coupons N0LIN[13] yields very low strength values which are even considerably lower than those experienced by the tubes RD5[53
again generates meaningless stresses (see discussion above on the
[plusmn300] laminates)
325 [plusmn600] Laminates
The empirical responses of [1]together with the predicted
onesare presented in Fig 16 Poor correlations is observed among
the responses predicted by the different-analyses Fig 16 displays
good agreement between the responses experienced by the tubes (true
thickness) and the coupons however the coupons exhibit appreciably
higher stressing and straining capability than do the tubes Also it
is observed in this figure that N0NLIN [1o]h[i1] correlates well with
the experimental responses except for high stress levels where it
predicts less nonlinear behavior than that observed experimentally
17
It is observed in Fig 16 that in the range of low ttresses and
strains the response of N0LIN[131 also agrees with the empirical
responses however at a very low stress of about 100 ksi it deviates
from the empirical one and displays strong nonlinear behavior As
can be seen from Fig 16 this results in a considerably lower stressing and
straining capability relative to the coupons Correlating the response
predicted by RDS[S] with the experimental ones itisobserved inFig 16
that its response is stiffer and less nonlinear than that observed
for the coupons
Table 1B-and Fig lB indicate that RDS[5] SQS8] and N0LIN[13]
yield a modulus of 221x106 psi which is noticeably higher than 184x106
predicted by N0NLIN [101amp[111 These moduli are higher than 162x106
observed for the coupons
Comparing the ultimate stresses predicted by the different
analyses with the experimental strength values it is seen from
Table IB and Fig 2B that SQ5[8] predicts a high strength of 500 ksi
compared with 318 experienced by the coupons whereas N0LIN[131
predicts relatively low strength values 173 for Max Stress 180
for Max Strain and 205 ksi for Quad Fail No ultimate was generated degby RD5 (see discussion on [plusmn30 ] laminates) It appears from Table lB
and Figs 2B and 16 that the tubes (nominal thickness) yielded the
highest ultimate stress for this particular laminate
326 [plusmn750] Laminates
Fig 17 presents the experimental response of [I] together
with the predicted ones No agreement among the different predicted
responses is observed in this figure Good agreement between the
compression branch corresponding to the coupons and RDS[S] is observed
very good correlation in the almost linear range of response whereas
with increase in stress RDS responds less nonlinearly than do the
coupons Good agreement of N0LIN[13] response with the coupons is
also observed in Fig 17 in the range of low stresses and strains
(linear range) however with increase in stresses the response of
N0LIN deviates from the empirical one while displaying an appreciably
more pronounced nonlinear response The response predicted by N0NLIN
18
[101[111] is observed to display more emphasized nonlinear behavior
than N0LIN and does not agree with either the experimental response
or RDS and NOLIN predictions In regards to the tension branch of
the responses it is observed in Fig 17 that there is good agreement
among the different analyses and between the analyses and experimental
response (Note that tubes are not presented in the present evaluation
See [i)
Table iB and Fig iB indicate that the experimental modulus of 279x106 is in very good agreement with 276x106 calculated with
RDS SQ5 and N0LIN N0NLIN is found to predict a lower modulus of
197x106 psi It appears from Table lB and Fig 2B that the empirical
ultimate stress of 348 ksi is considerably lower than 446 predicted
by SQS[8] and is in good agreement with the strength value of 319
yielded by N0LIN Max Stress [13] N0LIN Max Strain and Quad Fail
are found to predict low ultimate stress values 264 and 285 ksi
respectively Again like for the [plusmn30 deg] laminate no ultimate stress
was predicted by RDS[S]
327 [900] Laminates
As with the IoV] unidirectional laminates the reproduction
capability of the different computer codes is evaluated In Fig 18
the empirical responses of [1] are presented with the predicted-ones
It is observed that in the range of moderate stress-strain levels
reproduction by both RDS[S] and N0LIN[13] is very good With increase
in stress levels both predictions deviate from the empirical response
experienced by the coupons while displaying a less nonlinear behavior
than that observed for the coupons a trend which is more emphasized
for N0LIN It is also observed in this figure that there is good
agreement between the experimental responses corresponding to the
tubes (nominal thickness) and coupons however the tubes sustain
a considerably lower ultimate stress than that experienced by the
coupons (see also Table IB) Referring to N0NLIN response [101amp[111]
it is seen from Fig 18 that this analysis predicts an appreciably
lower stressing capacity than that observed for the coupons and
predicted by the other analyses This response is found to be in very
19
good agreement with that experienced by the tubes when true thickness
is accounted for Comparing the tension branch of-the-predicted responses as
well as theeihpirical ones of Fig 18 very good agreement is found
It appears from Table IB and Fig IB that RD51J SQ5[8] and
N0LIN[13] reproduce the modulus of 298x106 psi experienced by the
coupons whereas N0NLIN [0]0[i11] predicts a considerably lower modulus 6of205xlO Comparing the ultimate stresses yielded by the different
analyses with the empirical ones it is found from Table lB and Fig
2B that the stresses of 320 ksi predicted by NOLIN Max Stress and
Quad Fail are in very good agreement with 317 experienced by the
coupons Good correlation is also observed between the empirical
stress and 341 ks predicted by N0LIN Max Strain It is also observed
in Table lB that RD5 yields a similar stress of 340 ksi for the last
acceptable-strain value
328 [00900] Laminates
The experimental responses of [1] and the ones predicted by
the analyses are presented in Fig 19 Comparison of the analytical
predictions with the response experienced by the coupons reveals very
good agreement between the empirical response and RD[51] as well as
very good agreement with the predictions of N0NLIN [101amp[11] and N0LIN[13]
in the range of moderate stress-strain values With increase in stressshy
strain levels N0NLIN and N0LIN which predict almost identical responses
display some minor nonlinear behavior which is hot observed for the
coupons Note that N0NLIN and N0LIN yield strength values which are
in good agreement with that predicted by the coupons whereas RDS
yields an appreciably lower stress (see Table lB and Fig 2B) It
is also observed in Fig 19 that once the true thickness of the
tubes is accounted for they respond wimilarly to the coupons but
fail at a considerably lower strength value (see Table iB)
It is found from Table 1B and Fig lB that N0NLIN yields the
lowest modulus 1667x106 psi N0LIN and SQ5 predict a modulus of
1715xlO6 which is in very good agreement with the empirical one of 6 6
1717x10 and RUB yields a slightly higher modulus of 1721x10
20
Table 1B and Fig 2B indicate very good agreement between
the strength of 230 ksi observed for the coupons and 220 yielded
by N0NLIN Also it is observed that all other analyses predict lower
ultimate stress values than that experienced by the coupons
deg329 [0degplusmn45090 1 Laminates
In Fig 20 the experimental responses of [1] are shown together
with the ones predicted by the analyses Very good agreement is observed
between the response yielded by the coupons and those predicted by
the analyses in particular the one calculated with N0NLIN [10311]
No correlation is observed in Fig 20 between the response observed
for the coupons and either version of the responses experienced by
the tubes
It is seen from Fig IB and Table IB that N0NLIN predicts a 6 6moIulus of 162x10 psi which isslightlyhigher than l147x10
experienced by the coupons and -slightly lower than 1187 yielded by
either SQ518] or N0LIN[3I] and i192xlO predicted by RDS[5]
Comparing the ultimate stresses experienced empirically and those
-predicted analytically it appears from Table 1B and Fig 2B that
N0NLIN strength of 141 ksi is in good agreement with 158 ksi bserved
for the coupons whereas N0LIN[13] in spite of its very good ageement
with the coupons mentioned above yields a stress of 125 ksi fQoMax
Strain and lower stresses of 121 and 113 ksi for Max Stress and
Quad Fail respectively It is also observed that RDS[S] predicts a
noticeably lower ultimate of 130 ksi and SQ5[8] a strength of 134
4 CONCLUSIONS
(a) None of the analyses namely RD[51] SQ5[8] N0NLIN[10][l1]
and N0LIN[13] utilized in the present comparison studies is
found to be adequate to predict satisfactorily the compression
response of angle-ply laminates
(b) As mentioned in the text of this report the responses corresponding to the unidirectional laminates which were experienced
by-the compression coupons of [l]were utilized as data input
for thecomputer codes RDS SQ5 and N0LIN It is observed from
21
the present comparison studies for the angle-ply laminates that
in spite of this the predicted response with these codes do not
favor the responses experienced by the coupons better than the
ones observed for the tubes For some laminate configurations
better correlation is observed with the responses yielded by
the tubes
(c) Present numerical studies indicate that no unique compression
responses were predicted by the various analyses employed in
the present comparison studies for the large variety of laminate
configurations invesrigated For some laminate configurations
considerably different responses were predicted for the same
laminate by the various analyses
(d) The analyses were found to be inadequate to predict the ultimate
stresses of the angle-ply laminates The built-in failure
mechanisms in the analytical models were not verified by the
test results because of very poor correlation between the calculated
strength values and those observed experimentally
(e) The very good correlation of the predicted moduli with the
empirical onesand the pronounced disagreement among the predicted
ultimate stresses nibther verifies nor contradicts the influence
of the edge effects discussed in Appendix B In view of the
arguments in this Appendix and the lack of success of a sound
test program with the compression tubes of [11 coupons having
different dimensions than those employed in [1] should further
be tested to accomplish the objectives of the test program of
[1] and present comparison studies and evaluations
6
22
REFRENCES
1 T Weller tExperimental Studies of Graphite-Epoxy and Baron-Epoxy Angle Ply Laminates in Compression NASA CR 145233 Sep (1977)
2 R T Haftka and J H Starnes JR-- Application of an Interior Penalty Function for Structural Optimization -AIAA Paper 75-764 t1975)
3 SW Tsai - Strength Characteristics of Composite Materials - NASA CR-224 April (1965)
4 S W Tsai D F Adams and D R Doner - Analysis of Composite Structures - NASA CR-620 November (1966)
S P H Petit - Ultimate Strength of Laminated Composites -
Report FZM-4977 prepared for Advanced Filaments and Composites-Division Air Force Materials Laboratory Air Force System Command Wright - Patterson Air Force Base Ohio December (1967)
P H Petit and M B Waddoups -AMethod of Predicting the Nonlinear Behavior of Laminated Composites -J Composite Materials Vol 3 p 2 January (1969)shy
7 K 0 Chiu - Ultimate Strength of Laminated Composites -
J Composite Materials Vol 3 P 578 July (1969)
8 D L Reed - Point Stress Laminate Analysis - Report PZM-5494 prepared for Advanced Composite Division Air Force Materials Laboratory Air Force Systems Command Wright - Patterson Air Force Base Ohio April (1970) (Also T J Muha - Users Manual for the Laminate Point Stress Analysis Computer Program SQ5 as Revised by AFFDLFBC - AFPDL-TM-74-107-FBC July C1974))
9 H T Hahn -Nonlinear Behavior of Laminated Composites -
J Composite Materials Vol 7 P 257 April (1973)
10 R L Foye - Theoretical Post Yielding Behavior of Composite Laminates Part I Inelastic Micromechanics -J Composite Materials Vol 7 p 178 April (1973)
23
11 R L Foye - Theoretical Post Yielding Behavior of Composite Laminates Part II Inelastic Micromechanics J Composite Materials- Vol 7 P310 July (1973)
12 R S Sandahu-- Nonlinear Response of Unidirectional and Angle-Ply Laminates - AIAA Paper 74-380 April (1974)
13 Z Hashin D Bagchi and W B Rosen - Nonlinear Behavior of Composite Laminates - NASA CR-2313 April (1974)
14 T Weller - Experimental Studies ofGraphite-Epoxy and Boron-Expoxy Angle Ply Landnates-in Shear NASACR 145232 Sep (1977)
15 W D Whetstone - Structural Network Analysis Program -
Users Manual Static ANAlysis Version V70E LMSC-HREC D162812 December (1970)
24
APPENDIX A
It has been pointed out in the section on the Numerical studies
that the computer codes RDS15] and N0LIN[15] require the existence of
the unidirectional [00] and [90] laminae responses in tension
compression and shear for their application The images of these
data inputs or library data input are presented in Tables APA-1A and
APA-IB as being input into RDS code In addition to the data in these
Tables also required by N0LIN the information presented in Table
APA-2 has to be provided to operate the N0LIN code (Instead of feeding
N0LIN with the stress-strain data input for the responses one may
use the Ramberg-Osgood parameters as explained in [13] and avoid the
utilizing of curve fitting alegorithms to generate these parameters)
The mechanical properties given in Table APA-2 are also required
as data input by SQ5 code
It was mentioned in the section on Results and Discussion that
the data input for the matrix material of the AVCO 5505 Boron-Epoxy
laminates was taken from [10][l1] The mechanical properties are as
follows
Young Modulus of Matrix 510000 psi
Shear Modulus of Matrix 200000 psi
Poissons Ratio of Matrix 310
and the equivalent stressequivalent strain curve is reproduced from
these references SLI = 106ESI = 5000 SL2 = 5x10⁶ ES2 = 10000 SL3 = 19x106 ES3 = 15000
ES4 = 20000 SL4 = 1Oxl06
ESS = 25000 SL5 = 3230
ES6 = 30000 SL6 = 0
25
The Boron fiber properties are Provided by the manufacturer and
are as follows
Young Modulus of Fiber 58x106 psi
Shear Modulus of Fiber 2375x106 psi
Poissons Ratio of Fiber 200
Fiber Tension Ultimate 500 ksi
Fiber Compression Ultimate 750 ksi
26
APPENDIX B
Ithas been mentioned in [I] that edge effects might be induced
far away from the loaded boundcaries of the coupons resulting in an
unevenstress-strain distribution even for a-coupon loaded uniformally
This kind of behavior was experienced by all the angle ply laminates
of []
When the coupon is loaded in a manner described in Fig APB
allowing for a uniform axial displacement u=(-S) and completely
restraining the lateral displacement y = 0 along the loaded boundaries
plusmn12 it is anticipated that the coupon width or rather its aspect
ratio AR = 1 will have an appreciable influence on the stressshy
strain distribution of angle-ply laminates possessing high Poissons
ratios
Withthe prescribed boundary conditions the specimen might
experience an induced transverse stress approaching in the limit a
stress of
ay= Gx yx
A wide specimen will contain a wide zone of continuous fibers subject
to this high degree of lateral restraint Consequently this zone will
result in both higher stresses and stiffnesses than the regions close
to the free edges of the coupon where the filaments are noncontinuous
and hence shear the load from the termination of one diagonal fiber
into the begining ofan adjecant one through the matrix This of course
will result in an unknown uneven stress-strain field which renders wide
specimens unsuitable for application The stress is picking up towards
the center and hence ishigher than the average stress utilized to
present the response of such specimens On the other hand too narrow
specimens will be affected primarily and subject to the edge effect
which-will reduce both their strength and stiffness
A numerical study was carried out to determine the actual
lateral edge effect combined withPoissons ratio and to define the
best aspect ratio ie the minimum length of the coupon1 free
27
of lateral boundary influence at least along its center line transverse
to the direction of applied compression SNAP computer code [15] was
used for this purpose and the obtained results are presented in Fig
APB-2 The coupons of [1] have an aspect ratiq AR=75 which according
to Fig APB-2 is too short to eliminate the lateral boundary influence
The above discussion calls for a different type of specimen
Indeed tubes were also tested and reported in [1] A tube is free
of the free edge region but on the -other hand is susceptible to
another deficiency if the radial displacementsat the loaded boundaries
are prevented from expanding to allow for Poissons expansion high
bending stresses develop at the restrained boundaries These stresses
might precipitate early local failure at the specimen edges or might
be superimposed on the compressive stresses in case the tube is too
short again bringing about failure at a stress lower than the ultimate
one corresponding to the tested laminate
TABLE 1A Compression Response - Comparison of Experimental Ultimate Stresses and Moduli With Analytical Predictions of RDS[S]
SQs[S1 N0NLIN[101amp[11] and N0LIN[13]
GRAPHITE-EPOXY LAMINATES -3m SP-286T3
EST RESULTS OF [1] ANAL RDS [5 ANAL SQS [8) ANAL NPNLIN ANAL N0LIN [13]
Laminate
Configuratlon
ompressionCoupons
Ult Comp Cop Mo Stress __(si) x1Opsi)
Compression TubesU
Mo M esod
Thick Thick 6 ks(ksi) ksi x O si)
Ultimate
CoSteStress
(ksi) 6
xlO si
Ultiate
(ks ) 6ai ps
Ultimate
Co Stress ksi ops )
015 Com stress (kst
Max Max quad Stress Strain InteracIl Fal Faill
Ex
(x O psi)
[00]
164 191 115 664 510
200 1609 20911 1607 8011
20911 180 1607
[plusmn15 ] 117
1394 105 826
1842 [14251
105 1324 --
11722 -
1324 14022 10622 929 1324
[plusmn30] 548
5911 374
687 292
357 283
246
286 224
811 [655]
400 1
575 48722 576 43412 37622 288 575
[plusmn453 382
227 289 234
312 [251]
313 (60)1
203 25122 204 16212 19712 175 204
[plusmn601 3547 172
222 163 251 238 158 30812 161 19512 22312 233 161
[plusmn731 312
360
191
5376321 194
214
221 14
150
[1793
175
[120]
375 175 48922 181 32522 32522 298 181
330
344 [191
155
241
102
180 132
1101-3 350 184 47822 191 32022 33222 320 191o
111 115115898
879 294
493382 287
42229 835[7791
110 1
899 11511 883 96211 11211 107 883
[0__48deg 97 _674 76[979476 359 71571 as 642 82111 632 6871 79 211 648 632
2Corrected for measured thickness
A11 Failure in compressionor tension in laina 11 direction A2 F1
1-(inch) n2540x1 2 meter
I pound fo ce - 4448222 Newton (N)kip = 10 poundtrce
b)
)+ Ulitimate stress values corresponding to very high unreasonable strain values upper number - last stress value which corresponds to an acceptable strain value
TABLE 1B Compression Response - Comparison of Experimental Ultimate Stresses and Moduli With Analytical Predictions of DS[5]
SQs[8] N0NLIN[10]G(li] and N0LIN[I3]-
TEST BORON-EPOXY LAMINATES (AVCO 550556 MIL DIA)
SANALRESULTS OF ANAL RDS (5] ANAL SQ5 -
(8] NLINAL0NL N AANLN[3ANAL N0LIN [13]
Laminate
Configuratio
Compression Copons
lt EStressCmpComp Mod
Compression Tubes
UltCom Stres m MeasuredThick x
Ultimate
CompStress
Ex
Ultimate
CompStress
Ex
Ultimate
ConyStress
Ex
Comp Stress (ksi)Ult
x Stress Strain Interac
Bx
(ksi) (xIO 6psi) (ksi) tksi) (xl06psi) (ksi) (xLOp$i) (ksz) (x06psi) (ksi) (xlO psi) si__ (xlO6psi)
10] 263
342 3127 - - 3340 3128 35311 3127 3120 54011 35311 340 3127
[1300]
( 45]
135 2365
139
947 5551095 O9
961 S89
337
253 351 308
838
918 290 3 300
255
280 331
576
680 206
2T4
194
204 234I
3749 [2685]
1111 [800]
323 [239]
150 2527
425 - 923 (NoULTOBT)OET
135 246 (NOULTOBT)
13322
4422
350612
2526
923
246
2496
887
257
32122
11212
10422
24622
11SIZ
246
115
2526
923
246
[plusmn601l 318 333
162 387 274
264 199
397 (272]
300 (NOULTOBT
221 50022 221 184 17312 18012 205 2 21
[plusmn7S) 348
279 2 311
19360 214 (64)+
276 44622 276 197 31922 26422 285 276
[90deg]
(090]
298
517 179
1
298
177
178
2171 206
126
143 1 8
339 [232] 2534
340
(38)+
190
299
11
1721
44722
194 111
298
1715
220
205
1667
32022
17611
34122
18411
320
21
298
1715 t
230 233 157 [1773] k
[0iplusmn4rso] 146
158 1147
137
147
881
874 1665
_110201 130 1192 13411 1187 141 1162 12111 12511
1 113
1 1 1187
1 q 1
Fiber failure in D degree layer
Calculations exceeded maximum observed experimental strain values
Solution does not converge
[ 3 Corrected for Measured thickness Ail Failure in compressionor tension
in lamina 11 directionIi
-2II (inch) = 2540x10 2 meter Tmi) I pound fojee = 4448222 Newton(N)
psz = 69477x10ound f rPascal (Pa)
)+Ultimate stress values corresponding to very high unreasonable strain values- upper number shy last stress value which corresponds to an acceptable strainvalue
A22 Failure in compressionor tension
A12 Failure in shear
I ksi i 105 psi
LIBRARY DATA FOR MATERIAL 2 - - SMSP2B6T-3(A-S)LEA1FA INPUT
SIGTO EPSTO SIGT9O EPSTS0O SIGCO EPSCO SIGC90 YPSCc9o
013500E 05 080000E-0 09O0000E 03 06000E-03 022500F 05 014000E-02 O46000E 04 025000E-b2 026500E 05 0O16000E-02 018000E 04 012000E-02 045000E 05 028000E-02 090006t 04 0500Q0E-02 O405hOE 05 O24OOOE-02 -026700E 04 018000E-02 067500E 05 02000E-02 013250E Oi 075000E-2 054500E 05 03200t-02 Q4860E 04 024000E-02 087200E 05 056000E-02 016800E 05 OlOOOE-01 069000E 05 00000E-02 042700E 04 q30000t-02 010670E 06 070000E-02 020500E 05 012500E-01
048 0 0 0E- 0 50 8 0 0E 04O3500E 05 0 2 036 000 E-02 012560E 06 O840OE-02 02375OE 05 015000F-01 097500E 05 056000E-02 058300E 04 O042000E-02 O14OE 06 098000E-02 026600E 05 ot17500E-Q1 011150E 06 064OOE-02 066200E 04 048000E-02 016250E 06 011200E-01 029100E 05 020000E-01 012559E 06 072000E-02 073600E 04 0540O0E-02 017900E 06 012600E01 031400E 05 p22500E-O1 013950E 06 08000E-02 081000E 04 060000E 02 019400E 06 01400OE-01 033500c 05 0250nOE-01 00 08BOOOE-02 00 amp66000E-02 00 0154600E-01 00 027500E-01 00 096000E-02 00 072000 E-02 00 016800E-01 00 03000AE-01
SIG45 EPS45 TbU12 CNL12 1 TNU21 CNU21
012540E 0 022000E-02 031400E 00 024000E 00 027911E-01 027477E-01 025080C 04 044000E-02 031600E 00 026000E 00 029169E-01 028073E-01 037620E 014 066000E-02 031800E 00 027500E 00 026349E-01 029089E-01 O5IOO1 E 04 0880OOE-02 0319nOE 00 028000E 00 024609E-01 028256E-01 058500 04 0i1000E-01 032000E 00 030000E 00 023246E-01 031877r-01 064000E 04 01300E-01 032000E00 031500E 00 023835E-01 030333E-01 069600E 04 015400Fr01 032000 00 03250OE 00 02857E-01 027590E-01 074000E 04 017600E-01 032000E 00 033000E 00 024076E-01 025525E-01 077500E 04 01VSOOE-01 032000E O0 033500 E 00 022552E-01 P26150E-01 080500E 04 022000E-01 031900E 00 034000E 00 022482E-01 026656E-01 00 024200E-01 0 00 00 0i0 00 026400E-01 00 00 00 00
TABLE ApA B- INPUT LIBRARY DATA FOR MATERIAL -1 - - AVCO 550556
SIGTO EPSTO SIGT9O EPST9O SIGCO EPSCO STGCSO CpSc90
021700E 05 043400E 05 065100E 05 086800E 05 010850E 06 0130206 06 015190r 06 017360E 06 Olq530E 06 021700F 06 00 00
070000E-03 0o4OOOE-02 O210OOE-02 028000E-02 035000E-02 042000E-02 049000t-02 056000E-02 0630OE602 070006E-02 077000E-02 084000E-02
011500 04 023000E 04 033500E 04 043400E 04 052700E 04 0610OE 04 070600E 04 078500E 04 084500E 04 089000E 04 00 00
04000E-03 080000E-03 012000Er02 016000E-02 020r00E-02 024000E-02 028000E-02 032000E-02 036000E-02 040000E-02 044000E-02 048000E-02
031270E 05 062540E 05 093810E 05 012508F 06 015635E 06 018762E 06 022100E 06 025400E 06 028800E 06 03l000E 06 00 00
010OOE-02 920000E-02 030000E-02 040000E-02 050000E-02 0600OOE-02 070000E-02 080000E-02 090000E-02 016000-01 011000E-01 012000E-01
044800E 04 069500E 04 013150E 05 016800E 05 020200E 05 023100E 05 025750E 05 028000E 05 031000E P9 031700E 05 00 00
015000E-02 - 030000E-02 045000E-02 96000E-02 075000E-02 090000E-02 010500E-01 0120006 1 013500E-01 0150OOE-01 0165O6E-01 oaeooor-Oi
SIG45 EPS45 TNU12 CNL12 TNU21 CNU21
0BgPE 04 033200E 04 042500E 04 0116500E 04 048500E O 050500E 04 052200E 04 053500E 04 055000E 04 O596000E 04 00 00
02700E-02 054000E-02 081000E-02 0108OOE-01 013500E-01 016200E-01 018900E-0 02tOOE-01 024300E-01 027000E-01 029790E-01 032400E-01
022700E 00 022700E 00 022700E 00 022400E 00 022400E 00 022400E 00 0224006 00 023000E 00 023300E 00 022700E 00 00 00
02640nE 00 026600E 00 026800E 00 026800E 00 027000E 00 02720 0 E 00 027500E 00 028000E 00 029000E 00 032000E 00 00 00
021052E-01 021052E-01 019222E-01 017884E-01 016800E-01 016439E-01 158976-01 014653E-01 011274E-01 0823806-02 00 00
025215E-01 025350E-b1 023997E-01 020855E-01 019572E-01 016817E-01 014555E-01 0i2727E-01 017059E-01 028118 -02 00 00
00 -
32 ou~IGV AGT32~ jO Q1JA1ATY
TABLE APA-2 Unidirectional Lamina Properties Utilized In The Predictions Of SQS9] and N0LIN[14]
3M SP-286T3 AVCO 550556 Mil GRAPHITE-EPOXY BORON-EPOXY
(Ell)Tension 1687x106 psi 3100xlO6 psi
(E11)Coinpression 1607x106 psi 3127x1O6 psi
(E22)Tension 152x106 psi 288x106 psi
(E22)Compression 191x106 psi 298x106 psi
GO2 057x106 psi 066x106 psi
(aULTll)Tension 140 ksi 220 ksi
(eULTllTension 008 007
(cULTll)Compression 180 ksi 340 ksi
(eULTll)Compression 013 0113
(t ULT22)Tension 8 ksi 89 ksi
(ULT 22)Tension 006 00405
(aULT22)Compression 32 ksi 32 ksi
(EULT22)Compression 025 015
((ULT12) 81 ksi 56 ksi
(CULT12) 022 0275
(v12)Compression 230 267
(v12)Tension 298 216
-1 (inch) = 2540x10 2 meter Cm)
1 pound force = 4448222 Newton (N)
I kip = 103 pound force
I psi = 6894757x105 Pascal (Pa)
I ksi = 103 psi
A test results [1] (coupons)0 analysis (8] amp 131
I00
w CL
10
-0
5
66
0 I I I I I I Cgt t C00o
01 +1 +1 +shy
g LAMINATE CONFIGURATION
FIG 1A YOUNGS MODULUS OF 3M SP-286T3 GRAPHITE EPOXY LAMINATES ASAFUNCTION OF LAMINATE CONFIGURATION
30 7A test results [i](coupons)0 analysis [81 amp [131 v [10] ampIll]
C o
w 20
109
0I III I I I + +1 +1 +1 +1
LAMINATE CONFIGURATION 0
FIG 1B YOUNGS MODULUS OFACO 5505(56MIL DIA BORON-EPOXY LAMINATES AS AFUNCTION OF LAMINATE CONFIGURATION
200t 200 3 0 mxx stress falla test results [1) (coupons) analysis NOLIN 03] V max strain fail
0 analysis RD 5 [5] r[ quadr interaction 0 analysis SQ5 [8] fail
150 150
0x(0
a
0~ARA 0
100- V13 100- 0
A A
A
50- 0 0 0 50shy000 v A A
0 A 13 V 0 0
0 in 0 10 0 O 0 to CD +1~j4 3 + +1 owi +1 +1 +1 4
LAMINATE CONFIGURATION LAMINATE CONFIGURATION
FIG 2A ULTIMATE STRESS OF 3M SP 286T3 GRAPHITE EPOXY LAMINATES AS AFUNCTION OF LAMINATE CONFIGURAiON
A tests results [1] (coupons) 0 maxstressfail 0 analysis RD5 [5] analysis NLIN [13] v max strain fail
300 0 analysis SQ5 [8] 300 0 quadr interaction fail
200
00
-A
200 -3
A
100 00
A A0 100 A
09 0A
o
0 LO lcent
O O -t to
TL +1 + 1 +1 1 LAMINATE CONFIGURATION
FIG 2B ULTIMATE STRESS OFAVCO LAMINATE CONFIGURATION
0 C gt 1LO L O C La mmO) rt
+ 1 + 1 + 1 + 1 4 LAMINATE CONFIGURATION
550556 MIL DIA BORON-EPOXY LAMINATES AS A FUNCTIONOF
200 -+ A
o 0
A
o 0~
ab A
0 Aa AA
0shy 0500shy
15-15 - 0 0l FIG Z
-0
OMPESIONRESONEO 003MSP-66T GAPHTE-POY LMINTA
AxC)0o00A
001 A0e
_150
0
0 00
0
coupons 0
00 0
u coupons
100 tubes nom
thick A
0
ubes horn thick
tubes t thickK 077 tubes tthick
50 -
-15 -10 -05 0 05 10Ex (4) 6 (0)FIG 4 COMPRESSION RESPONSE OF plusmn15 deg 3M SP-286T3 GRAPHITE-EPOXY LAMINATES
75
0C
E 50
coupons coupon 00
a 00 tubes noa oo
tubes tubes fern
0A
tubes t~ 4 tubes tthick 25 thick - shy
cento 4 AOa
0-10 -05 Ex (0) 0 y 05 10 15
FIG 5 COMPRESSION RESPONSE OF -30 3M SP-286T3 GRAPHITE-EPOXY LAMINATES
40
30-S
tubes hnmhick tubes nom
tik
a
20--
a-P III
-5 -3
FI30OMRESONtubes
-4
tubes tthick
2co1upo1s
FLJ-5 3 M28Thick
IF- PO
tues fain thIkEshy
tubes trthick
(60)
10G COPESONRSOSE-5 3MS-8t-RPIEEOY AIAE
40
couponstubes nor
copn thick
nomn btubes thick th
30CL
U
1shy
o
S-4 -3 -2 -ex (0) 0 y 2
degFIG 7 COMPRESSION RESPONSE OF +-60 3M SP-286T3 GRAPHITE-EPOXY LAMINATES
40
CL E 0 U
30
U) coupons
A
A
coupons
A
20-
0
tubes nom thick
0
tubes nom thick
-
tubes t thick
tubes t thick
10shy
-3 -2 -1 Ex() Cy (1)
FIG8 COMPRESSION RESPONSE OF plusmn750 3M SP-286T3 GRAPHITEEPOXY LAMINATES
-4 0
35 +
CL o0
Di couon coupons
S25
bull--
20shy
--
tubes nom thick
tubes nom thick
t
15-tubes
thick t
tubes tthickN N
10 -N
NN
0n -25 -20 -15 -10 ex -05 0 ey 05
FIG 9 COMPRESSION RESPONSE OF 906 3M SP-286T3 GRAPHITE-EPOXY LAMINATES
120
100- A
2 coupons
E080 A 2 0
60shy
thick tubes nom hidk
40shy
tubes t 20- tubes tthick - thick
0shy-16 44 -12 -10 -08 -06 -04 -02 0 02
FIG 10 COMPRESSION RESPONSE OF 0900 3M SP-286T3 GRAPHITE-EPOXY LAMINATES y
100
oo coupons
ns coupons
0
UIi75 - -
50- C
tubes nom tubes nor thick thick
25 tubes tthick Kc_ tubes tthick
-20
FIG11
-15
COMPRESSION -1o
RESPONSE OF 0145900
-05 0 05 e1 (C) OE y (0)3M SP-286T3 GRAPHITE-EPOXY LAMINATES
10
400
(0
6 coupons coupons 200- shy
100 shy
-12 -10 -08 -06 -04 Q02 0 0Q2 ey 04 FIG 1V COMPRESSION RESPONSE OF 00 AVCO 5505156 MIL DIA BORO-EPOXY LAMINATES
150- +-- V
o
U)
In
_
A coupons
100 tubes florn
E
nom
tthick
tubes tthick-- t
copos7L A
V(10
-otubesnomathick ov
tubes tik IV deg tub es t t h ic k o
50 0
10
001
I
FIG 13
-05 0Eri)
COMPRESSION RESPONSE
A H I
05ey (0)
OF t 150 AVCO 5505 BORON-EPOXY
10
LAMINATES
15
75
0v VU)InI v v 03pn coupons
degu v
- 50v V
(no ultobt) A (no ultobt)amp
25- 0
tubes nom thick 04 tubes nom thick
tubes tthick0 tubes tthick
- Q5 0 05 10 15Ex (sect) Ey (dego)
FIG 14A COMPRESSION RESPONSE OF plusmn300 AVCO 550556 MIL DIA BORON-EPOXY LAMINATES (BATCH 1)
20
100
0
0
U
75
(no V V V
V50 -- V V -o uponsV (outat)v (no ultobt)
nora tubes 47
VAnom 0V thick AV
25tubes noma th
tubest~thikK~iVx tubes tthick
5 -D -05 E M0 (o) 05 10 15
FIG 14B COMPRESSION RESPONSE OF plusmn300 AVCO 550556 MIL DIA BORON-EPOXY LAMINATES (BATCH E1)
40
0
CLcuoscoupons
E 0 v
30shy
230 ---shy
thick thick -S- -- - tin
20- tube2 k- -shyc
1 e thick
(noul Xe (no ult)
10- (t A
0 04 ey SA)x (15FIG 15 COMPRESSION RESPONSE OF plusmn450 AVCO 550556 MIL DIA BORON-EPOXY LAMINATES
_ _ _ _ _
40
tubes nom thick V
tubes nom thick
c-oupons v (no ult obt) v n
(no ult30- A obt) VA coupons
0
~hck tubes tthick2tbs8 ZE AA
00 In AA_
vA 0 b 0 A 0
A 00 0
0 10 AA
OI I I -5 -4 -3 -2 1 ( y 2
FPAxI E y ()MFIG 16 COMPRESSION RE-SPON$EOFi60 AVCO -550556 MIL DIA BORON-EPOXY LAMINATES-
40
(64 ksi) (64)
30
oV CO
coupons
0A 0
AA A coupons
0-A 5
20
0
0 00
10shy
00
V
-25 -20 -15 -10 -05 0 05eF (0) Ey (CI)05FIG 17 COMPRESSION RESPONSE-OF +-750AVCO 5505156 MIL DIA BORON-EPOXY LAMINATES
40 -
C
En Ult 3 0 L
0 deg 3 0 - cou on coupons u
830
tubes nom 20 V thick
tubes nom thick V
-tubes tthicdk
thick 10shy
-16 -14 -12 -10 -08 -06 -04 -2 0 2 ei () ey (0)
FIG 18 COMPRESSION RESPONSE OF 906 AVCO 550556 MIL DIA BORON EPOXY LAMINATES
2-250 upons coupons
CL tubes nom thick tubesno]
ktubes t tubes t
0 thick thickS 150- O
0
wA
201 thck
50
-14 -12 -10 -08 -06 -04 -02 0 02 ex (0f) ey (l)
FIG 19 COMPRESSION RESPONSE OF 0900 AVCO 550556 MIL DIA BORON-EPOXY LAMINATES
200
2 0
E coupons
150 tubbs nom tubes thick nom
thick
100
tubes t tubes thick tthick
50shy
- I
0-15 -10 -05 05Lx () 00 y (l) 0
FIG 20 COMPRESSION RESPONSE OF 0145900 AVCO 5505156 MIL DIA BORON-EPOXY LAMINATES
IxJu
uniform compression
L u=-8 I I I I I
I Ib
I 1IIAP II ICPSIx I I
I I
I- b
FIG APB 1 COUPON UNDER UNIFORM COMPRESSION
AR AR (SNAP) t xy
0 POISSON RATIO -xy
2 10lj
ISOTROPIC 0 PANEL
I bullI 00
0 05
0 10 20 30 40 50 60 70 80 90 t a (degrees)
FIG APB 2 MIN AR FOR 6BESTSTRESS DISTRIBUTION ALONG THE CENTER LINE OF THE COUPON

11
good correlation with N0LIN[13] predictions 320 332 amp 320 ksi
for Max Stress Max Strain and Quad Fail respectively and no
correlation with SQS[8] ultimate stress of 478 ksi
318 [00900] Laminates
Fig 10 presents the empirical responses of [I] and those
predicted by the analyses It is observed that in the region
corresponding to low stress-strain values there is very good correlation
between the analyses and the empirical compression branch-corresponding
to the coupons However with increase in stress-strain values the
response of RDS[5] deviates slightly from the empirical one while
that predicted by N0LIN[13] becomes pronouncedly nonlinear This
behavior of N0LIN might be explained by recalling the nature of
reproduction observed earlier in Fig 3 for the [0deg] unidirectional
laminate It is also seen from this figure that the analytical predicted
tension branches are stiffer than the tension response displayed by
the coupons However RDS agrees better than N0LIN with the test
results
Table 1A and Fig IA revealvery good correlation of the 882x10 6
empiricalmodulus of 879x106 psi with the calculated ones
by SQS[81 and N0LIN[13] and 899xl06 by RDS[S] Table IA and Fig 2A
indicate that the ultimate stresses predicted by RD5 SQ5 and N0LIN
Max Strain 110 115 and 112 ksi respectively are in very good
agreement with 115 ksi experienced by the coupons The stress of
107 ksi yielded by N0LIN Quad Fail is in good agreement with
the test results and that corresponding to Max Stress 962 ksi
is appreciably lower It is found from Table 1A and Figs 2A and 10
that the tubes sustained very low stress-strain values relative to
either the coupons or analytical predictions
319 100plusmn45090 deg1 Laminates
The experimental responses of [1] together with thb analytical
predictions are shown in Fig 11 It is observed that RDS[5] correlates
well with N0LIN[13] displaying very good agreement for low and moderate
stress-strain levels Fig 11 also displays good agreement between
the response experienced by the coupons and the analytical predicted
12
responses However the coupon response appears to-behave to some extent less nonlinearly and more stiffely than predicted (see Table IA and Pig IA) It is also observed in this figure that the tubes
(nominal thickness) respond similarly to the coupons but sustain very
low stresses (see Table IA)
Fig 1A and Table 1A indicate that SQ5[8] and N0LIN[131
predict a modulus of 632x106 psi which is lower than 642x106 predicted
by RDS[5] and 674 experienced by the coupons It also appears from
Table 1A and Fig 2A that the coupons sustained a considerably higher
ultimate stress (978 ksi) than that predicted by the analyses (850 ksi
by RDS 821 by SQ5 and 687 792 and 648 by N0LIN Max Stress
Max Strain and Quad Fail respectively)
32 BORON-EPOXY LAMINATES (AVCO 550556 MIL DIA)
In additionto the analyses of [5] [8] and [131 the empirical
results of [1] corresponding to this material are compared with the
predicted response by the analysis of [io]amp[ii] The results yielded
by the computer code of this analysis N0NLII should not however
be treated with the same degree of confidence as those of the other
analyses because the data input for thematrixmaterial of this composite
required in the analysis was not provided Hence available information
about the matrix reported in-the literature [10] was adopted Also 4note that no ultimate stress values appear either in Table lB or
Fig 2B because the analysis of [io]amp[Ii] does not predict ultimate
stresses except for the case when the fibers in any of the laminae
reach their assigned strength values
321 Unidirectional [00] Laminates
Like in the case of the unidirectional [0o Graphite-Epoxy
laminates the reproduction capability of the computer codes are again
evaluated The empirical response of [i] together with the reproduced ones are presented in Fig 12 It is observed that the compression
branch of RDS[5] correlates very well with the experiments except
in the neighbourhood of ultimate stress values N0LIN[13] deviates
slightly from the empirical one at high stress-strain levels because
as already mentioned earlier it does not allow for nonlinear behavior
13
in the 11 fiber direction and N0NLIN[10]amp[I1] isseen to bd in very
godd agreement with N0LIN The tension branch of RDS and N0LIN are
almost identical and agree with the coupon response except for high
stress-strain levels when they display less nonlinearity than that
experienced by the coupons The tension branch of N0NLIN is observed to
exhibit less nonlinear effects than either RDS or N0LIN
Table 1B and Fig 2B reveal very good agreement between the
experimental ultimate stress 342ksi and the strength predicted
by RDS[5 and N0LIN Max Stress and Quad Fail [13] 340 ksi by
all of the three SQ5 and N0LIN Max Strain are observed to yield
a slightly higher strength than that experienced empirically 353 ksi
It is seen from Table 1B and Fig IB that except forN0NLIN all the
analyses predict the experimental modulus of 3127xlO6 pstN0NLINyields 0 6 a slightly lower modulus of 3120x106
322 [plusmn150] Laminates
Fig 13 presents the experimental responses of [1] and the
predicted ones It is observed that all of the analyses predict almost
identical compression branches which are in very good agreement
with the response yielded by the coupons-for low stress-strain values
and that expeienced by the tubes when true thickness is accounted
for With increase in stress-strain values the coupons respond more
nonlinearly than predicted by the analyses Also RD51] displays
more nonlinear behavior than N0NLIN[10][II]andN0LIN[l3] Reffering
to the tension branch of the responses it appears that neither of
the predicted responses agrees with the experimental responses
Very good correlation is observed between RD5 and N0LIN in the low
stressstrain range whereas with increase in stress-strain levels
N0LIN displays slightly more pronounced nonlinear behavior At very
high stress values this behavior inverts and RDS displays very strong
nonlinear effects N0NLIN is seen to respond more linearly but
less stiffly than either RDS or N0LIN except for high stress values
where an opposite trend is observed
It is seen from Table 1B and Fig 1B that RDS[S] SQ5[8] and
N0LIN[13] yield a modulus of 2526x106 psi which is slightly higher
14
than 2496x106 predicted by N0NLIN [10]4[II] and also higher than
2365x106 experienced by the coupons Table IB and Fig 2B reveal
good agreement between the ultimate stress of 139 ksi experienced
by the coupons and 133 predicted by SQS[8] Also the strength
of 150 ksi yielded by RDS[5] correlates well with that sustained by
the coupons It is seen in Table IB that only one strength value
was predicted by N0LIN This ultimate strength value of 104 ksi is
appreciably lower than the empirical one Onlyone value was obtained
due to the fact that it was impossible to achieve convergence of the
solution with the algorithm which solves the nonlinear equations of
this computer code It is found from Table 1B Fig 2B and Fig 13
that the tubes sustained very low ultimate stresses relative to either
the -coupons or the analytical predictions
323 [plusmn3001 Laminates
It wasreported in [1] that two batches of coupons were
manufactured and delivered for testing for this type of laminate
configuration and when tested they displayed completely different
responses Hencethe empirical response corresponding to each
batch is presented separately together with the responses predicted
by the analyses in Figs 14A and 14B Fig 14B reveals immediately
that there is no correlation betweenthe analyses and the response
experienced by the coupons and as such wont be discussed any further
Fig 14A displays very good agreement between the compression branch
experienced by the coupons and that corresponding to the tubes when
nominal thickness is considered However it is observed in this
figure as well as TablelB that the tubes experienced very low ultimate
stresses relative to the coupons Referring to the tension branch
of the experimental responses it is observed that the coupons and
tubes respond completely differently one frot another It appears
from Fig 14A that the analytical predictions agree one with another
only in the very low stress-strain range At a stress level of about
200 ksi which corresponds to the ultimate stress of the tubes when
true thitkness is accounted for N0LIN[13] response deviates from
the responses predicted by RDS[S] and N0NLIN [10][Iil while displaying
initiation of pronounced nonlinearity At a stress level of about shy
15
350 ksi a similar behavior is observed for the response of RDS which
deviates from N0NLIN and also displays initiation of pronounced shy
nonlinearity The above discussion applies to both the compression
and tension branches of the analytical predictions Correlation of
the predicted responses with the empirical ones indicates fair
agreement with the response yielded by the tubes (nominal thickness)
No correlation is observed with the response experienced by the coupons
This is rather emphasized in the pronounced nonlinear region of the
responses where the coupons display a very high stressing and straining
capacity realtive to the analyses of RDS and NOLIN The mode of the
response predicted by N0NLIN is observed to differ from that corresponding
to the coupons as it displays less stiff behavior in the range of
stresses corresponding to the almost linear response of the coupons
andweak nonlinearbehavior in the range of high stresses which is
associated with the pronounced nonlinear behavior of the coupons
It appears from Table lB and Fig IB that the coupons experienced
a modulus of 1098xi06 psi which is noticeably higher than 923xl06
predicted by RD55] SQSE8] and N0LIN[13] It is also found that
N0NLIN [10amp][II] predicted an even lower modulus of 887x106 psi
As already discussed above and as can be seen from Table 1B and Fig 2B
the analyses predict ultimate stresses which are significantly lower
than 589 ksi sustained by the coupons It is also observed in Table IB
that no ultimate stress was generated by RDS[5] (The last stress
value corresponding to acceptable strains is 425 ksi and above this
stress the calculated stresses are associated with unacceptable strain
values)
324 [plusmn450] Laminates
Fig 15 presents the experimental responses of [1] together
with thepredicted ones In the range of low stress-strain values
good correlation is found for the tubes (true thickness) with the
analytical predictions but with increase in stress-strain values the
analyses of RDS[S] and N0LIN[13] predicted more pronounced nonlinear
behavior than that experienced by the tubes whereas N0NLIN [10][11]
displays less emphasized nonlinear behavior and also displays a tendency
16
to follow the response experienced by the tubes when nominal thickness
is considered No correlation between the response experienced by
the coupons-and either of the predicted responses is observed in Fig 15
The coupons are found to sustain a considerably higher stress-strain
capacity than that predicted analytically (see also Table 1B and
Fig 2B) This is also observed to be true when correlating either
representation of the responses experienced by the tubes with the
predicted responses in spite of the fact that the tubes display a
considerably low stressing capacity relative to the coupons (Note
that the straining capability of the tubes ts of the samemagnitude
of that experienced by the coupons)
Fig 1B and Table 1B indicate that N0NLIN [10][l1] predicts a modulus of 257x106 psi whichis in very good agreement with 253
experienced by the coupons RDS[5] SQ5[8j and N0LIN[1SI yield a
lower modulus of 246x1066 which is in good agreement with 239x106
experienced by the tubes (truethickness)
Comparing the ultimate stresses predicted by the different
analyses with the empirical strength values experienced by the coupons
it is found from Table lB and Fig 2B that SQ5[8] predicts a strength
of 356 ksi which is in very good agreement with 351 experienced
by the coupons N0LIN[13] yields very low strength values which are even considerably lower than those experienced by the tubes RD5[53
again generates meaningless stresses (see discussion above on the
[plusmn300] laminates)
325 [plusmn600] Laminates
The empirical responses of [1]together with the predicted
onesare presented in Fig 16 Poor correlations is observed among
the responses predicted by the different-analyses Fig 16 displays
good agreement between the responses experienced by the tubes (true
thickness) and the coupons however the coupons exhibit appreciably
higher stressing and straining capability than do the tubes Also it
is observed in this figure that N0NLIN [1o]h[i1] correlates well with
the experimental responses except for high stress levels where it
predicts less nonlinear behavior than that observed experimentally
17
It is observed in Fig 16 that in the range of low ttresses and
strains the response of N0LIN[131 also agrees with the empirical
responses however at a very low stress of about 100 ksi it deviates
from the empirical one and displays strong nonlinear behavior As
can be seen from Fig 16 this results in a considerably lower stressing and
straining capability relative to the coupons Correlating the response
predicted by RDS[S] with the experimental ones itisobserved inFig 16
that its response is stiffer and less nonlinear than that observed
for the coupons
Table 1B-and Fig lB indicate that RDS[5] SQS8] and N0LIN[13]
yield a modulus of 221x106 psi which is noticeably higher than 184x106
predicted by N0NLIN [101amp[111 These moduli are higher than 162x106
observed for the coupons
Comparing the ultimate stresses predicted by the different
analyses with the experimental strength values it is seen from
Table IB and Fig 2B that SQ5[8] predicts a high strength of 500 ksi
compared with 318 experienced by the coupons whereas N0LIN[131
predicts relatively low strength values 173 for Max Stress 180
for Max Strain and 205 ksi for Quad Fail No ultimate was generated degby RD5 (see discussion on [plusmn30 ] laminates) It appears from Table lB
and Figs 2B and 16 that the tubes (nominal thickness) yielded the
highest ultimate stress for this particular laminate
326 [plusmn750] Laminates
Fig 17 presents the experimental response of [I] together
with the predicted ones No agreement among the different predicted
responses is observed in this figure Good agreement between the
compression branch corresponding to the coupons and RDS[S] is observed
very good correlation in the almost linear range of response whereas
with increase in stress RDS responds less nonlinearly than do the
coupons Good agreement of N0LIN[13] response with the coupons is
also observed in Fig 17 in the range of low stresses and strains
(linear range) however with increase in stresses the response of
N0LIN deviates from the empirical one while displaying an appreciably
more pronounced nonlinear response The response predicted by N0NLIN
18
[101[111] is observed to display more emphasized nonlinear behavior
than N0LIN and does not agree with either the experimental response
or RDS and NOLIN predictions In regards to the tension branch of
the responses it is observed in Fig 17 that there is good agreement
among the different analyses and between the analyses and experimental
response (Note that tubes are not presented in the present evaluation
See [i)
Table iB and Fig iB indicate that the experimental modulus of 279x106 is in very good agreement with 276x106 calculated with
RDS SQ5 and N0LIN N0NLIN is found to predict a lower modulus of
197x106 psi It appears from Table lB and Fig 2B that the empirical
ultimate stress of 348 ksi is considerably lower than 446 predicted
by SQS[8] and is in good agreement with the strength value of 319
yielded by N0LIN Max Stress [13] N0LIN Max Strain and Quad Fail
are found to predict low ultimate stress values 264 and 285 ksi
respectively Again like for the [plusmn30 deg] laminate no ultimate stress
was predicted by RDS[S]
327 [900] Laminates
As with the IoV] unidirectional laminates the reproduction
capability of the different computer codes is evaluated In Fig 18
the empirical responses of [1] are presented with the predicted-ones
It is observed that in the range of moderate stress-strain levels
reproduction by both RDS[S] and N0LIN[13] is very good With increase
in stress levels both predictions deviate from the empirical response
experienced by the coupons while displaying a less nonlinear behavior
than that observed for the coupons a trend which is more emphasized
for N0LIN It is also observed in this figure that there is good
agreement between the experimental responses corresponding to the
tubes (nominal thickness) and coupons however the tubes sustain
a considerably lower ultimate stress than that experienced by the
coupons (see also Table IB) Referring to N0NLIN response [101amp[111]
it is seen from Fig 18 that this analysis predicts an appreciably
lower stressing capacity than that observed for the coupons and
predicted by the other analyses This response is found to be in very
19
good agreement with that experienced by the tubes when true thickness
is accounted for Comparing the tension branch of-the-predicted responses as
well as theeihpirical ones of Fig 18 very good agreement is found
It appears from Table IB and Fig IB that RD51J SQ5[8] and
N0LIN[13] reproduce the modulus of 298x106 psi experienced by the
coupons whereas N0NLIN [0]0[i11] predicts a considerably lower modulus 6of205xlO Comparing the ultimate stresses yielded by the different
analyses with the empirical ones it is found from Table lB and Fig
2B that the stresses of 320 ksi predicted by NOLIN Max Stress and
Quad Fail are in very good agreement with 317 experienced by the
coupons Good correlation is also observed between the empirical
stress and 341 ks predicted by N0LIN Max Strain It is also observed
in Table lB that RD5 yields a similar stress of 340 ksi for the last
acceptable-strain value
328 [00900] Laminates
The experimental responses of [1] and the ones predicted by
the analyses are presented in Fig 19 Comparison of the analytical
predictions with the response experienced by the coupons reveals very
good agreement between the empirical response and RD[51] as well as
very good agreement with the predictions of N0NLIN [101amp[11] and N0LIN[13]
in the range of moderate stress-strain values With increase in stressshy
strain levels N0NLIN and N0LIN which predict almost identical responses
display some minor nonlinear behavior which is hot observed for the
coupons Note that N0NLIN and N0LIN yield strength values which are
in good agreement with that predicted by the coupons whereas RDS
yields an appreciably lower stress (see Table lB and Fig 2B) It
is also observed in Fig 19 that once the true thickness of the
tubes is accounted for they respond wimilarly to the coupons but
fail at a considerably lower strength value (see Table iB)
It is found from Table 1B and Fig lB that N0NLIN yields the
lowest modulus 1667x106 psi N0LIN and SQ5 predict a modulus of
1715xlO6 which is in very good agreement with the empirical one of 6 6
1717x10 and RUB yields a slightly higher modulus of 1721x10
20
Table 1B and Fig 2B indicate very good agreement between
the strength of 230 ksi observed for the coupons and 220 yielded
by N0NLIN Also it is observed that all other analyses predict lower
ultimate stress values than that experienced by the coupons
deg329 [0degplusmn45090 1 Laminates
In Fig 20 the experimental responses of [1] are shown together
with the ones predicted by the analyses Very good agreement is observed
between the response yielded by the coupons and those predicted by
the analyses in particular the one calculated with N0NLIN [10311]
No correlation is observed in Fig 20 between the response observed
for the coupons and either version of the responses experienced by
the tubes
It is seen from Fig IB and Table IB that N0NLIN predicts a 6 6moIulus of 162x10 psi which isslightlyhigher than l147x10
experienced by the coupons and -slightly lower than 1187 yielded by
either SQ518] or N0LIN[3I] and i192xlO predicted by RDS[5]
Comparing the ultimate stresses experienced empirically and those
-predicted analytically it appears from Table 1B and Fig 2B that
N0NLIN strength of 141 ksi is in good agreement with 158 ksi bserved
for the coupons whereas N0LIN[13] in spite of its very good ageement
with the coupons mentioned above yields a stress of 125 ksi fQoMax
Strain and lower stresses of 121 and 113 ksi for Max Stress and
Quad Fail respectively It is also observed that RDS[S] predicts a
noticeably lower ultimate of 130 ksi and SQ5[8] a strength of 134
4 CONCLUSIONS
(a) None of the analyses namely RD[51] SQ5[8] N0NLIN[10][l1]
and N0LIN[13] utilized in the present comparison studies is
found to be adequate to predict satisfactorily the compression
response of angle-ply laminates
(b) As mentioned in the text of this report the responses corresponding to the unidirectional laminates which were experienced
by-the compression coupons of [l]were utilized as data input
for thecomputer codes RDS SQ5 and N0LIN It is observed from
21
the present comparison studies for the angle-ply laminates that
in spite of this the predicted response with these codes do not
favor the responses experienced by the coupons better than the
ones observed for the tubes For some laminate configurations
better correlation is observed with the responses yielded by
the tubes
(c) Present numerical studies indicate that no unique compression
responses were predicted by the various analyses employed in
the present comparison studies for the large variety of laminate
configurations invesrigated For some laminate configurations
considerably different responses were predicted for the same
laminate by the various analyses
(d) The analyses were found to be inadequate to predict the ultimate
stresses of the angle-ply laminates The built-in failure
mechanisms in the analytical models were not verified by the
test results because of very poor correlation between the calculated
strength values and those observed experimentally
(e) The very good correlation of the predicted moduli with the
empirical onesand the pronounced disagreement among the predicted
ultimate stresses nibther verifies nor contradicts the influence
of the edge effects discussed in Appendix B In view of the
arguments in this Appendix and the lack of success of a sound
test program with the compression tubes of [11 coupons having
different dimensions than those employed in [1] should further
be tested to accomplish the objectives of the test program of
[1] and present comparison studies and evaluations
6
22
REFRENCES
1 T Weller tExperimental Studies of Graphite-Epoxy and Baron-Epoxy Angle Ply Laminates in Compression NASA CR 145233 Sep (1977)
2 R T Haftka and J H Starnes JR-- Application of an Interior Penalty Function for Structural Optimization -AIAA Paper 75-764 t1975)
3 SW Tsai - Strength Characteristics of Composite Materials - NASA CR-224 April (1965)
4 S W Tsai D F Adams and D R Doner - Analysis of Composite Structures - NASA CR-620 November (1966)
S P H Petit - Ultimate Strength of Laminated Composites -
Report FZM-4977 prepared for Advanced Filaments and Composites-Division Air Force Materials Laboratory Air Force System Command Wright - Patterson Air Force Base Ohio December (1967)
P H Petit and M B Waddoups -AMethod of Predicting the Nonlinear Behavior of Laminated Composites -J Composite Materials Vol 3 p 2 January (1969)shy
7 K 0 Chiu - Ultimate Strength of Laminated Composites -
J Composite Materials Vol 3 P 578 July (1969)
8 D L Reed - Point Stress Laminate Analysis - Report PZM-5494 prepared for Advanced Composite Division Air Force Materials Laboratory Air Force Systems Command Wright - Patterson Air Force Base Ohio April (1970) (Also T J Muha - Users Manual for the Laminate Point Stress Analysis Computer Program SQ5 as Revised by AFFDLFBC - AFPDL-TM-74-107-FBC July C1974))
9 H T Hahn -Nonlinear Behavior of Laminated Composites -
J Composite Materials Vol 7 P 257 April (1973)
10 R L Foye - Theoretical Post Yielding Behavior of Composite Laminates Part I Inelastic Micromechanics -J Composite Materials Vol 7 p 178 April (1973)
23
11 R L Foye - Theoretical Post Yielding Behavior of Composite Laminates Part II Inelastic Micromechanics J Composite Materials- Vol 7 P310 July (1973)
12 R S Sandahu-- Nonlinear Response of Unidirectional and Angle-Ply Laminates - AIAA Paper 74-380 April (1974)
13 Z Hashin D Bagchi and W B Rosen - Nonlinear Behavior of Composite Laminates - NASA CR-2313 April (1974)
14 T Weller - Experimental Studies ofGraphite-Epoxy and Boron-Expoxy Angle Ply Landnates-in Shear NASACR 145232 Sep (1977)
15 W D Whetstone - Structural Network Analysis Program -
Users Manual Static ANAlysis Version V70E LMSC-HREC D162812 December (1970)
24
APPENDIX A
It has been pointed out in the section on the Numerical studies
that the computer codes RDS15] and N0LIN[15] require the existence of
the unidirectional [00] and [90] laminae responses in tension
compression and shear for their application The images of these
data inputs or library data input are presented in Tables APA-1A and
APA-IB as being input into RDS code In addition to the data in these
Tables also required by N0LIN the information presented in Table
APA-2 has to be provided to operate the N0LIN code (Instead of feeding
N0LIN with the stress-strain data input for the responses one may
use the Ramberg-Osgood parameters as explained in [13] and avoid the
utilizing of curve fitting alegorithms to generate these parameters)
The mechanical properties given in Table APA-2 are also required
as data input by SQ5 code
It was mentioned in the section on Results and Discussion that
the data input for the matrix material of the AVCO 5505 Boron-Epoxy
laminates was taken from [10][l1] The mechanical properties are as
follows
Young Modulus of Matrix 510000 psi
Shear Modulus of Matrix 200000 psi
Poissons Ratio of Matrix 310
and the equivalent stressequivalent strain curve is reproduced from
these references SLI = 106ESI = 5000 SL2 = 5x10⁶ ES2 = 10000 SL3 = 19x106 ES3 = 15000
ES4 = 20000 SL4 = 1Oxl06
ESS = 25000 SL5 = 3230
ES6 = 30000 SL6 = 0
25
The Boron fiber properties are Provided by the manufacturer and
are as follows
Young Modulus of Fiber 58x106 psi
Shear Modulus of Fiber 2375x106 psi
Poissons Ratio of Fiber 200
Fiber Tension Ultimate 500 ksi
Fiber Compression Ultimate 750 ksi
26
APPENDIX B
Ithas been mentioned in [I] that edge effects might be induced
far away from the loaded boundcaries of the coupons resulting in an
unevenstress-strain distribution even for a-coupon loaded uniformally
This kind of behavior was experienced by all the angle ply laminates
of []
When the coupon is loaded in a manner described in Fig APB
allowing for a uniform axial displacement u=(-S) and completely
restraining the lateral displacement y = 0 along the loaded boundaries
plusmn12 it is anticipated that the coupon width or rather its aspect
ratio AR = 1 will have an appreciable influence on the stressshy
strain distribution of angle-ply laminates possessing high Poissons
ratios
Withthe prescribed boundary conditions the specimen might
experience an induced transverse stress approaching in the limit a
stress of
ay= Gx yx
A wide specimen will contain a wide zone of continuous fibers subject
to this high degree of lateral restraint Consequently this zone will
result in both higher stresses and stiffnesses than the regions close
to the free edges of the coupon where the filaments are noncontinuous
and hence shear the load from the termination of one diagonal fiber
into the begining ofan adjecant one through the matrix This of course
will result in an unknown uneven stress-strain field which renders wide
specimens unsuitable for application The stress is picking up towards
the center and hence ishigher than the average stress utilized to
present the response of such specimens On the other hand too narrow
specimens will be affected primarily and subject to the edge effect
which-will reduce both their strength and stiffness
A numerical study was carried out to determine the actual
lateral edge effect combined withPoissons ratio and to define the
best aspect ratio ie the minimum length of the coupon1 free
27
of lateral boundary influence at least along its center line transverse
to the direction of applied compression SNAP computer code [15] was
used for this purpose and the obtained results are presented in Fig
APB-2 The coupons of [1] have an aspect ratiq AR=75 which according
to Fig APB-2 is too short to eliminate the lateral boundary influence
The above discussion calls for a different type of specimen
Indeed tubes were also tested and reported in [1] A tube is free
of the free edge region but on the -other hand is susceptible to
another deficiency if the radial displacementsat the loaded boundaries
are prevented from expanding to allow for Poissons expansion high
bending stresses develop at the restrained boundaries These stresses
might precipitate early local failure at the specimen edges or might
be superimposed on the compressive stresses in case the tube is too
short again bringing about failure at a stress lower than the ultimate
one corresponding to the tested laminate
TABLE 1A Compression Response - Comparison of Experimental Ultimate Stresses and Moduli With Analytical Predictions of RDS[S]
SQs[S1 N0NLIN[101amp[11] and N0LIN[13]
GRAPHITE-EPOXY LAMINATES -3m SP-286T3
EST RESULTS OF [1] ANAL RDS [5 ANAL SQS [8) ANAL NPNLIN ANAL N0LIN [13]
Laminate
Configuratlon
ompressionCoupons
Ult Comp Cop Mo Stress __(si) x1Opsi)
Compression TubesU
Mo M esod
Thick Thick 6 ks(ksi) ksi x O si)
Ultimate
CoSteStress
(ksi) 6
xlO si
Ultiate
(ks ) 6ai ps
Ultimate
Co Stress ksi ops )
015 Com stress (kst
Max Max quad Stress Strain InteracIl Fal Faill
Ex
(x O psi)
[00]
164 191 115 664 510
200 1609 20911 1607 8011
20911 180 1607
[plusmn15 ] 117
1394 105 826
1842 [14251
105 1324 --
11722 -
1324 14022 10622 929 1324
[plusmn30] 548
5911 374
687 292
357 283
246
286 224
811 [655]
400 1
575 48722 576 43412 37622 288 575
[plusmn453 382
227 289 234
312 [251]
313 (60)1
203 25122 204 16212 19712 175 204
[plusmn601 3547 172
222 163 251 238 158 30812 161 19512 22312 233 161
[plusmn731 312
360
191
5376321 194
214
221 14
150
[1793
175
[120]
375 175 48922 181 32522 32522 298 181
330
344 [191
155
241
102
180 132
1101-3 350 184 47822 191 32022 33222 320 191o
111 115115898
879 294
493382 287
42229 835[7791
110 1
899 11511 883 96211 11211 107 883
[0__48deg 97 _674 76[979476 359 71571 as 642 82111 632 6871 79 211 648 632
2Corrected for measured thickness
A11 Failure in compressionor tension in laina 11 direction A2 F1
1-(inch) n2540x1 2 meter
I pound fo ce - 4448222 Newton (N)kip = 10 poundtrce
b)
)+ Ulitimate stress values corresponding to very high unreasonable strain values upper number - last stress value which corresponds to an acceptable strain value
TABLE 1B Compression Response - Comparison of Experimental Ultimate Stresses and Moduli With Analytical Predictions of DS[5]
SQs[8] N0NLIN[10]G(li] and N0LIN[I3]-
TEST BORON-EPOXY LAMINATES (AVCO 550556 MIL DIA)
SANALRESULTS OF ANAL RDS (5] ANAL SQ5 -
(8] NLINAL0NL N AANLN[3ANAL N0LIN [13]
Laminate
Configuratio
Compression Copons
lt EStressCmpComp Mod
Compression Tubes
UltCom Stres m MeasuredThick x
Ultimate
CompStress
Ex
Ultimate
CompStress
Ex
Ultimate
ConyStress
Ex
Comp Stress (ksi)Ult
x Stress Strain Interac
Bx
(ksi) (xIO 6psi) (ksi) tksi) (xl06psi) (ksi) (xLOp$i) (ksz) (x06psi) (ksi) (xlO psi) si__ (xlO6psi)
10] 263
342 3127 - - 3340 3128 35311 3127 3120 54011 35311 340 3127
[1300]
( 45]
135 2365
139
947 5551095 O9
961 S89
337
253 351 308
838
918 290 3 300
255
280 331
576
680 206
2T4
194
204 234I
3749 [2685]
1111 [800]
323 [239]
150 2527
425 - 923 (NoULTOBT)OET
135 246 (NOULTOBT)
13322
4422
350612
2526
923
246
2496
887
257
32122
11212
10422
24622
11SIZ
246
115
2526
923
246
[plusmn601l 318 333
162 387 274
264 199
397 (272]
300 (NOULTOBT
221 50022 221 184 17312 18012 205 2 21
[plusmn7S) 348
279 2 311
19360 214 (64)+
276 44622 276 197 31922 26422 285 276
[90deg]
(090]
298
517 179
1
298
177
178
2171 206
126
143 1 8
339 [232] 2534
340
(38)+
190
299
11
1721
44722
194 111
298
1715
220
205
1667
32022
17611
34122
18411
320
21
298
1715 t
230 233 157 [1773] k
[0iplusmn4rso] 146
158 1147
137
147
881
874 1665
_110201 130 1192 13411 1187 141 1162 12111 12511
1 113
1 1 1187
1 q 1
Fiber failure in D degree layer
Calculations exceeded maximum observed experimental strain values
Solution does not converge
[ 3 Corrected for Measured thickness Ail Failure in compressionor tension
in lamina 11 directionIi
-2II (inch) = 2540x10 2 meter Tmi) I pound fojee = 4448222 Newton(N)
psz = 69477x10ound f rPascal (Pa)
)+Ultimate stress values corresponding to very high unreasonable strain values- upper number shy last stress value which corresponds to an acceptable strainvalue
A22 Failure in compressionor tension
A12 Failure in shear
I ksi i 105 psi
LIBRARY DATA FOR MATERIAL 2 - - SMSP2B6T-3(A-S)LEA1FA INPUT
SIGTO EPSTO SIGT9O EPSTS0O SIGCO EPSCO SIGC90 YPSCc9o
013500E 05 080000E-0 09O0000E 03 06000E-03 022500F 05 014000E-02 O46000E 04 025000E-b2 026500E 05 0O16000E-02 018000E 04 012000E-02 045000E 05 028000E-02 090006t 04 0500Q0E-02 O405hOE 05 O24OOOE-02 -026700E 04 018000E-02 067500E 05 02000E-02 013250E Oi 075000E-2 054500E 05 03200t-02 Q4860E 04 024000E-02 087200E 05 056000E-02 016800E 05 OlOOOE-01 069000E 05 00000E-02 042700E 04 q30000t-02 010670E 06 070000E-02 020500E 05 012500E-01
048 0 0 0E- 0 50 8 0 0E 04O3500E 05 0 2 036 000 E-02 012560E 06 O840OE-02 02375OE 05 015000F-01 097500E 05 056000E-02 058300E 04 O042000E-02 O14OE 06 098000E-02 026600E 05 ot17500E-Q1 011150E 06 064OOE-02 066200E 04 048000E-02 016250E 06 011200E-01 029100E 05 020000E-01 012559E 06 072000E-02 073600E 04 0540O0E-02 017900E 06 012600E01 031400E 05 p22500E-O1 013950E 06 08000E-02 081000E 04 060000E 02 019400E 06 01400OE-01 033500c 05 0250nOE-01 00 08BOOOE-02 00 amp66000E-02 00 0154600E-01 00 027500E-01 00 096000E-02 00 072000 E-02 00 016800E-01 00 03000AE-01
SIG45 EPS45 TbU12 CNL12 1 TNU21 CNU21
012540E 0 022000E-02 031400E 00 024000E 00 027911E-01 027477E-01 025080C 04 044000E-02 031600E 00 026000E 00 029169E-01 028073E-01 037620E 014 066000E-02 031800E 00 027500E 00 026349E-01 029089E-01 O5IOO1 E 04 0880OOE-02 0319nOE 00 028000E 00 024609E-01 028256E-01 058500 04 0i1000E-01 032000E 00 030000E 00 023246E-01 031877r-01 064000E 04 01300E-01 032000E00 031500E 00 023835E-01 030333E-01 069600E 04 015400Fr01 032000 00 03250OE 00 02857E-01 027590E-01 074000E 04 017600E-01 032000E 00 033000E 00 024076E-01 025525E-01 077500E 04 01VSOOE-01 032000E O0 033500 E 00 022552E-01 P26150E-01 080500E 04 022000E-01 031900E 00 034000E 00 022482E-01 026656E-01 00 024200E-01 0 00 00 0i0 00 026400E-01 00 00 00 00
TABLE ApA B- INPUT LIBRARY DATA FOR MATERIAL -1 - - AVCO 550556
SIGTO EPSTO SIGT9O EPST9O SIGCO EPSCO STGCSO CpSc90
021700E 05 043400E 05 065100E 05 086800E 05 010850E 06 0130206 06 015190r 06 017360E 06 Olq530E 06 021700F 06 00 00
070000E-03 0o4OOOE-02 O210OOE-02 028000E-02 035000E-02 042000E-02 049000t-02 056000E-02 0630OE602 070006E-02 077000E-02 084000E-02
011500 04 023000E 04 033500E 04 043400E 04 052700E 04 0610OE 04 070600E 04 078500E 04 084500E 04 089000E 04 00 00
04000E-03 080000E-03 012000Er02 016000E-02 020r00E-02 024000E-02 028000E-02 032000E-02 036000E-02 040000E-02 044000E-02 048000E-02
031270E 05 062540E 05 093810E 05 012508F 06 015635E 06 018762E 06 022100E 06 025400E 06 028800E 06 03l000E 06 00 00
010OOE-02 920000E-02 030000E-02 040000E-02 050000E-02 0600OOE-02 070000E-02 080000E-02 090000E-02 016000-01 011000E-01 012000E-01
044800E 04 069500E 04 013150E 05 016800E 05 020200E 05 023100E 05 025750E 05 028000E 05 031000E P9 031700E 05 00 00
015000E-02 - 030000E-02 045000E-02 96000E-02 075000E-02 090000E-02 010500E-01 0120006 1 013500E-01 0150OOE-01 0165O6E-01 oaeooor-Oi
SIG45 EPS45 TNU12 CNL12 TNU21 CNU21
0BgPE 04 033200E 04 042500E 04 0116500E 04 048500E O 050500E 04 052200E 04 053500E 04 055000E 04 O596000E 04 00 00
02700E-02 054000E-02 081000E-02 0108OOE-01 013500E-01 016200E-01 018900E-0 02tOOE-01 024300E-01 027000E-01 029790E-01 032400E-01
022700E 00 022700E 00 022700E 00 022400E 00 022400E 00 022400E 00 0224006 00 023000E 00 023300E 00 022700E 00 00 00
02640nE 00 026600E 00 026800E 00 026800E 00 027000E 00 02720 0 E 00 027500E 00 028000E 00 029000E 00 032000E 00 00 00
021052E-01 021052E-01 019222E-01 017884E-01 016800E-01 016439E-01 158976-01 014653E-01 011274E-01 0823806-02 00 00
025215E-01 025350E-b1 023997E-01 020855E-01 019572E-01 016817E-01 014555E-01 0i2727E-01 017059E-01 028118 -02 00 00
00 -
32 ou~IGV AGT32~ jO Q1JA1ATY
TABLE APA-2 Unidirectional Lamina Properties Utilized In The Predictions Of SQS9] and N0LIN[14]
3M SP-286T3 AVCO 550556 Mil GRAPHITE-EPOXY BORON-EPOXY
(Ell)Tension 1687x106 psi 3100xlO6 psi
(E11)Coinpression 1607x106 psi 3127x1O6 psi
(E22)Tension 152x106 psi 288x106 psi
(E22)Compression 191x106 psi 298x106 psi
GO2 057x106 psi 066x106 psi
(aULTll)Tension 140 ksi 220 ksi
(eULTllTension 008 007
(cULTll)Compression 180 ksi 340 ksi
(eULTll)Compression 013 0113
(t ULT22)Tension 8 ksi 89 ksi
(ULT 22)Tension 006 00405
(aULT22)Compression 32 ksi 32 ksi
(EULT22)Compression 025 015
((ULT12) 81 ksi 56 ksi
(CULT12) 022 0275
(v12)Compression 230 267
(v12)Tension 298 216
-1 (inch) = 2540x10 2 meter Cm)
1 pound force = 4448222 Newton (N)
I kip = 103 pound force
I psi = 6894757x105 Pascal (Pa)
I ksi = 103 psi
A test results [1] (coupons)0 analysis (8] amp 131
I00
w CL
10
-0
5
66
0 I I I I I I Cgt t C00o
01 +1 +1 +shy
g LAMINATE CONFIGURATION
FIG 1A YOUNGS MODULUS OF 3M SP-286T3 GRAPHITE EPOXY LAMINATES ASAFUNCTION OF LAMINATE CONFIGURATION
30 7A test results [i](coupons)0 analysis [81 amp [131 v [10] ampIll]
C o
w 20
109
0I III I I I + +1 +1 +1 +1
LAMINATE CONFIGURATION 0
FIG 1B YOUNGS MODULUS OFACO 5505(56MIL DIA BORON-EPOXY LAMINATES AS AFUNCTION OF LAMINATE CONFIGURATION
200t 200 3 0 mxx stress falla test results [1) (coupons) analysis NOLIN 03] V max strain fail
0 analysis RD 5 [5] r[ quadr interaction 0 analysis SQ5 [8] fail
150 150
0x(0
a
0~ARA 0
100- V13 100- 0
A A
A
50- 0 0 0 50shy000 v A A
0 A 13 V 0 0
0 in 0 10 0 O 0 to CD +1~j4 3 + +1 owi +1 +1 +1 4
LAMINATE CONFIGURATION LAMINATE CONFIGURATION
FIG 2A ULTIMATE STRESS OF 3M SP 286T3 GRAPHITE EPOXY LAMINATES AS AFUNCTION OF LAMINATE CONFIGURAiON
A tests results [1] (coupons) 0 maxstressfail 0 analysis RD5 [5] analysis NLIN [13] v max strain fail
300 0 analysis SQ5 [8] 300 0 quadr interaction fail
200
00
-A
200 -3
A
100 00
A A0 100 A
09 0A
o
0 LO lcent
O O -t to
TL +1 + 1 +1 1 LAMINATE CONFIGURATION
FIG 2B ULTIMATE STRESS OFAVCO LAMINATE CONFIGURATION
0 C gt 1LO L O C La mmO) rt
+ 1 + 1 + 1 + 1 4 LAMINATE CONFIGURATION
550556 MIL DIA BORON-EPOXY LAMINATES AS A FUNCTIONOF
200 -+ A
o 0
A
o 0~
ab A
0 Aa AA
0shy 0500shy
15-15 - 0 0l FIG Z
-0
OMPESIONRESONEO 003MSP-66T GAPHTE-POY LMINTA
AxC)0o00A
001 A0e
_150
0
0 00
0
coupons 0
00 0
u coupons
100 tubes nom
thick A
0
ubes horn thick
tubes t thickK 077 tubes tthick
50 -
-15 -10 -05 0 05 10Ex (4) 6 (0)FIG 4 COMPRESSION RESPONSE OF plusmn15 deg 3M SP-286T3 GRAPHITE-EPOXY LAMINATES
75
0C
E 50
coupons coupon 00
a 00 tubes noa oo
tubes tubes fern
0A
tubes t~ 4 tubes tthick 25 thick - shy
cento 4 AOa
0-10 -05 Ex (0) 0 y 05 10 15
FIG 5 COMPRESSION RESPONSE OF -30 3M SP-286T3 GRAPHITE-EPOXY LAMINATES
40
30-S
tubes hnmhick tubes nom
tik
a
20--
a-P III
-5 -3
FI30OMRESONtubes
-4
tubes tthick
2co1upo1s
FLJ-5 3 M28Thick
IF- PO
tues fain thIkEshy
tubes trthick
(60)
10G COPESONRSOSE-5 3MS-8t-RPIEEOY AIAE
40
couponstubes nor
copn thick
nomn btubes thick th
30CL
U
1shy
o
S-4 -3 -2 -ex (0) 0 y 2
degFIG 7 COMPRESSION RESPONSE OF +-60 3M SP-286T3 GRAPHITE-EPOXY LAMINATES
40
CL E 0 U
30
U) coupons
A
A
coupons
A
20-
0
tubes nom thick
0
tubes nom thick
-
tubes t thick
tubes t thick
10shy
-3 -2 -1 Ex() Cy (1)
FIG8 COMPRESSION RESPONSE OF plusmn750 3M SP-286T3 GRAPHITEEPOXY LAMINATES
-4 0
35 +
CL o0
Di couon coupons
S25
bull--
20shy
--
tubes nom thick
tubes nom thick
t
15-tubes
thick t
tubes tthickN N
10 -N
NN
0n -25 -20 -15 -10 ex -05 0 ey 05
FIG 9 COMPRESSION RESPONSE OF 906 3M SP-286T3 GRAPHITE-EPOXY LAMINATES
120
100- A
2 coupons
E080 A 2 0
60shy
thick tubes nom hidk
40shy
tubes t 20- tubes tthick - thick
0shy-16 44 -12 -10 -08 -06 -04 -02 0 02
FIG 10 COMPRESSION RESPONSE OF 0900 3M SP-286T3 GRAPHITE-EPOXY LAMINATES y
100
oo coupons
ns coupons
0
UIi75 - -
50- C
tubes nom tubes nor thick thick
25 tubes tthick Kc_ tubes tthick
-20
FIG11
-15
COMPRESSION -1o
RESPONSE OF 0145900
-05 0 05 e1 (C) OE y (0)3M SP-286T3 GRAPHITE-EPOXY LAMINATES
10
400
(0
6 coupons coupons 200- shy
100 shy
-12 -10 -08 -06 -04 Q02 0 0Q2 ey 04 FIG 1V COMPRESSION RESPONSE OF 00 AVCO 5505156 MIL DIA BORO-EPOXY LAMINATES
150- +-- V
o
U)
In
_
A coupons
100 tubes florn
E
nom
tthick
tubes tthick-- t
copos7L A
V(10
-otubesnomathick ov
tubes tik IV deg tub es t t h ic k o
50 0
10
001
I
FIG 13
-05 0Eri)
COMPRESSION RESPONSE
A H I
05ey (0)
OF t 150 AVCO 5505 BORON-EPOXY
10
LAMINATES
15
75
0v VU)InI v v 03pn coupons
degu v
- 50v V
(no ultobt) A (no ultobt)amp
25- 0
tubes nom thick 04 tubes nom thick
tubes tthick0 tubes tthick
- Q5 0 05 10 15Ex (sect) Ey (dego)
FIG 14A COMPRESSION RESPONSE OF plusmn300 AVCO 550556 MIL DIA BORON-EPOXY LAMINATES (BATCH 1)
20
100
0
0
U
75
(no V V V
V50 -- V V -o uponsV (outat)v (no ultobt)
nora tubes 47
VAnom 0V thick AV
25tubes noma th
tubest~thikK~iVx tubes tthick
5 -D -05 E M0 (o) 05 10 15
FIG 14B COMPRESSION RESPONSE OF plusmn300 AVCO 550556 MIL DIA BORON-EPOXY LAMINATES (BATCH E1)
40
0
CLcuoscoupons
E 0 v
30shy
230 ---shy
thick thick -S- -- - tin
20- tube2 k- -shyc
1 e thick
(noul Xe (no ult)
10- (t A
0 04 ey SA)x (15FIG 15 COMPRESSION RESPONSE OF plusmn450 AVCO 550556 MIL DIA BORON-EPOXY LAMINATES
_ _ _ _ _
40
tubes nom thick V
tubes nom thick
c-oupons v (no ult obt) v n
(no ult30- A obt) VA coupons
0
~hck tubes tthick2tbs8 ZE AA
00 In AA_
vA 0 b 0 A 0
A 00 0
0 10 AA
OI I I -5 -4 -3 -2 1 ( y 2
FPAxI E y ()MFIG 16 COMPRESSION RE-SPON$EOFi60 AVCO -550556 MIL DIA BORON-EPOXY LAMINATES-
40
(64 ksi) (64)
30
oV CO
coupons
0A 0
AA A coupons
0-A 5
20
0
0 00
10shy
00
V
-25 -20 -15 -10 -05 0 05eF (0) Ey (CI)05FIG 17 COMPRESSION RESPONSE-OF +-750AVCO 5505156 MIL DIA BORON-EPOXY LAMINATES
40 -
C
En Ult 3 0 L
0 deg 3 0 - cou on coupons u
830
tubes nom 20 V thick
tubes nom thick V
-tubes tthicdk
thick 10shy
-16 -14 -12 -10 -08 -06 -04 -2 0 2 ei () ey (0)
FIG 18 COMPRESSION RESPONSE OF 906 AVCO 550556 MIL DIA BORON EPOXY LAMINATES
2-250 upons coupons
CL tubes nom thick tubesno]
ktubes t tubes t
0 thick thickS 150- O
0
wA
201 thck
50
-14 -12 -10 -08 -06 -04 -02 0 02 ex (0f) ey (l)
FIG 19 COMPRESSION RESPONSE OF 0900 AVCO 550556 MIL DIA BORON-EPOXY LAMINATES
200
2 0
E coupons
150 tubbs nom tubes thick nom
thick
100
tubes t tubes thick tthick
50shy
- I
0-15 -10 -05 05Lx () 00 y (l) 0
FIG 20 COMPRESSION RESPONSE OF 0145900 AVCO 5505156 MIL DIA BORON-EPOXY LAMINATES
IxJu
uniform compression
L u=-8 I I I I I
I Ib
I 1IIAP II ICPSIx I I
I I
I- b
FIG APB 1 COUPON UNDER UNIFORM COMPRESSION
AR AR (SNAP) t xy
0 POISSON RATIO -xy
2 10lj
ISOTROPIC 0 PANEL
I bullI 00
0 05
0 10 20 30 40 50 60 70 80 90 t a (degrees)
FIG APB 2 MIN AR FOR 6BESTSTRESS DISTRIBUTION ALONG THE CENTER LINE OF THE COUPON
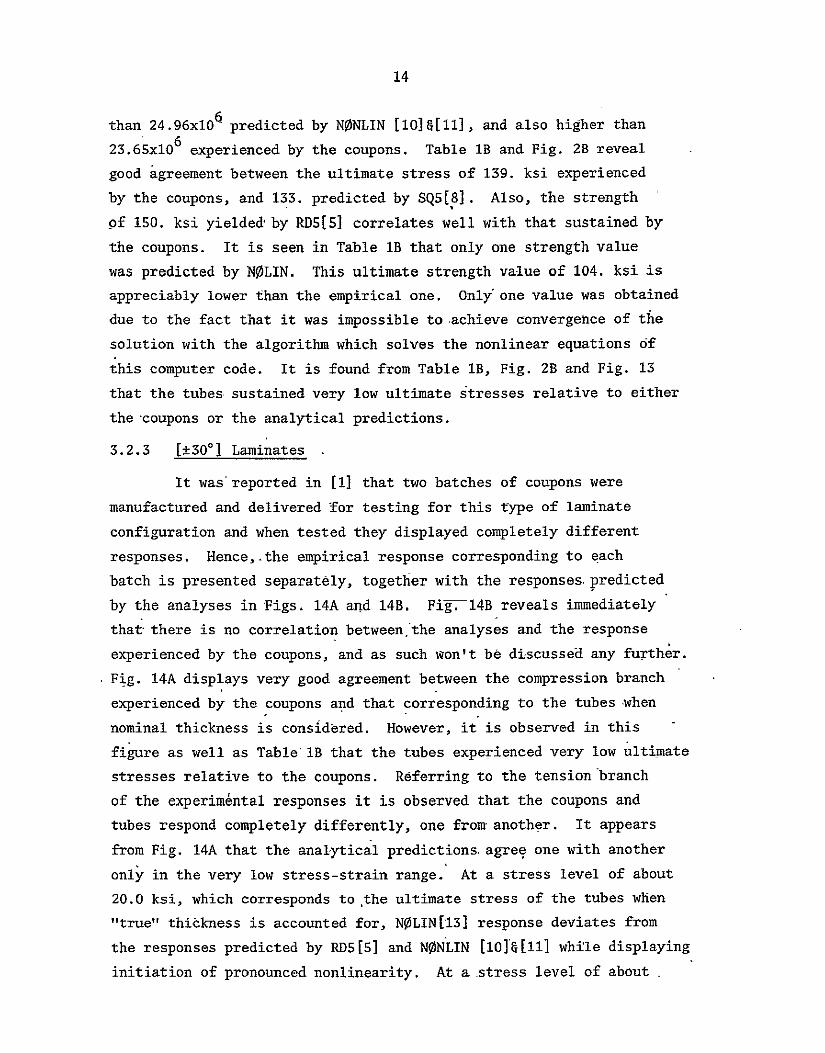

15
350 ksi a similar behavior is observed for the response of RDS which
deviates from N0NLIN and also displays initiation of pronounced shy
nonlinearity The above discussion applies to both the compression
and tension branches of the analytical predictions Correlation of
the predicted responses with the empirical ones indicates fair
agreement with the response yielded by the tubes (nominal thickness)
No correlation is observed with the response experienced by the coupons
This is rather emphasized in the pronounced nonlinear region of the
responses where the coupons display a very high stressing and straining
capacity realtive to the analyses of RDS and NOLIN The mode of the
response predicted by N0NLIN is observed to differ from that corresponding
to the coupons as it displays less stiff behavior in the range of
stresses corresponding to the almost linear response of the coupons
andweak nonlinearbehavior in the range of high stresses which is
associated with the pronounced nonlinear behavior of the coupons
It appears from Table lB and Fig IB that the coupons experienced
a modulus of 1098xi06 psi which is noticeably higher than 923xl06
predicted by RD55] SQSE8] and N0LIN[13] It is also found that
N0NLIN [10amp][II] predicted an even lower modulus of 887x106 psi
As already discussed above and as can be seen from Table 1B and Fig 2B
the analyses predict ultimate stresses which are significantly lower
than 589 ksi sustained by the coupons It is also observed in Table IB
that no ultimate stress was generated by RDS[5] (The last stress
value corresponding to acceptable strains is 425 ksi and above this
stress the calculated stresses are associated with unacceptable strain
values)
324 [plusmn450] Laminates
Fig 15 presents the experimental responses of [1] together
with thepredicted ones In the range of low stress-strain values
good correlation is found for the tubes (true thickness) with the
analytical predictions but with increase in stress-strain values the
analyses of RDS[S] and N0LIN[13] predicted more pronounced nonlinear
behavior than that experienced by the tubes whereas N0NLIN [10][11]
displays less emphasized nonlinear behavior and also displays a tendency
16
to follow the response experienced by the tubes when nominal thickness
is considered No correlation between the response experienced by
the coupons-and either of the predicted responses is observed in Fig 15
The coupons are found to sustain a considerably higher stress-strain
capacity than that predicted analytically (see also Table 1B and
Fig 2B) This is also observed to be true when correlating either
representation of the responses experienced by the tubes with the
predicted responses in spite of the fact that the tubes display a
considerably low stressing capacity relative to the coupons (Note
that the straining capability of the tubes ts of the samemagnitude
of that experienced by the coupons)
Fig 1B and Table 1B indicate that N0NLIN [10][l1] predicts a modulus of 257x106 psi whichis in very good agreement with 253
experienced by the coupons RDS[5] SQ5[8j and N0LIN[1SI yield a
lower modulus of 246x1066 which is in good agreement with 239x106
experienced by the tubes (truethickness)
Comparing the ultimate stresses predicted by the different
analyses with the empirical strength values experienced by the coupons
it is found from Table lB and Fig 2B that SQ5[8] predicts a strength
of 356 ksi which is in very good agreement with 351 experienced
by the coupons N0LIN[13] yields very low strength values which are even considerably lower than those experienced by the tubes RD5[53
again generates meaningless stresses (see discussion above on the
[plusmn300] laminates)
325 [plusmn600] Laminates
The empirical responses of [1]together with the predicted
onesare presented in Fig 16 Poor correlations is observed among
the responses predicted by the different-analyses Fig 16 displays
good agreement between the responses experienced by the tubes (true
thickness) and the coupons however the coupons exhibit appreciably
higher stressing and straining capability than do the tubes Also it
is observed in this figure that N0NLIN [1o]h[i1] correlates well with
the experimental responses except for high stress levels where it
predicts less nonlinear behavior than that observed experimentally
17
It is observed in Fig 16 that in the range of low ttresses and
strains the response of N0LIN[131 also agrees with the empirical
responses however at a very low stress of about 100 ksi it deviates
from the empirical one and displays strong nonlinear behavior As
can be seen from Fig 16 this results in a considerably lower stressing and
straining capability relative to the coupons Correlating the response
predicted by RDS[S] with the experimental ones itisobserved inFig 16
that its response is stiffer and less nonlinear than that observed
for the coupons
Table 1B-and Fig lB indicate that RDS[5] SQS8] and N0LIN[13]
yield a modulus of 221x106 psi which is noticeably higher than 184x106
predicted by N0NLIN [101amp[111 These moduli are higher than 162x106
observed for the coupons
Comparing the ultimate stresses predicted by the different
analyses with the experimental strength values it is seen from
Table IB and Fig 2B that SQ5[8] predicts a high strength of 500 ksi
compared with 318 experienced by the coupons whereas N0LIN[131
predicts relatively low strength values 173 for Max Stress 180
for Max Strain and 205 ksi for Quad Fail No ultimate was generated degby RD5 (see discussion on [plusmn30 ] laminates) It appears from Table lB
and Figs 2B and 16 that the tubes (nominal thickness) yielded the
highest ultimate stress for this particular laminate
326 [plusmn750] Laminates
Fig 17 presents the experimental response of [I] together
with the predicted ones No agreement among the different predicted
responses is observed in this figure Good agreement between the
compression branch corresponding to the coupons and RDS[S] is observed
very good correlation in the almost linear range of response whereas
with increase in stress RDS responds less nonlinearly than do the
coupons Good agreement of N0LIN[13] response with the coupons is
also observed in Fig 17 in the range of low stresses and strains
(linear range) however with increase in stresses the response of
N0LIN deviates from the empirical one while displaying an appreciably
more pronounced nonlinear response The response predicted by N0NLIN
18
[101[111] is observed to display more emphasized nonlinear behavior
than N0LIN and does not agree with either the experimental response
or RDS and NOLIN predictions In regards to the tension branch of
the responses it is observed in Fig 17 that there is good agreement
among the different analyses and between the analyses and experimental
response (Note that tubes are not presented in the present evaluation
See [i)
Table iB and Fig iB indicate that the experimental modulus of 279x106 is in very good agreement with 276x106 calculated with
RDS SQ5 and N0LIN N0NLIN is found to predict a lower modulus of
197x106 psi It appears from Table lB and Fig 2B that the empirical
ultimate stress of 348 ksi is considerably lower than 446 predicted
by SQS[8] and is in good agreement with the strength value of 319
yielded by N0LIN Max Stress [13] N0LIN Max Strain and Quad Fail
are found to predict low ultimate stress values 264 and 285 ksi
respectively Again like for the [plusmn30 deg] laminate no ultimate stress
was predicted by RDS[S]
327 [900] Laminates
As with the IoV] unidirectional laminates the reproduction
capability of the different computer codes is evaluated In Fig 18
the empirical responses of [1] are presented with the predicted-ones
It is observed that in the range of moderate stress-strain levels
reproduction by both RDS[S] and N0LIN[13] is very good With increase
in stress levels both predictions deviate from the empirical response
experienced by the coupons while displaying a less nonlinear behavior
than that observed for the coupons a trend which is more emphasized
for N0LIN It is also observed in this figure that there is good
agreement between the experimental responses corresponding to the
tubes (nominal thickness) and coupons however the tubes sustain
a considerably lower ultimate stress than that experienced by the
coupons (see also Table IB) Referring to N0NLIN response [101amp[111]
it is seen from Fig 18 that this analysis predicts an appreciably
lower stressing capacity than that observed for the coupons and
predicted by the other analyses This response is found to be in very
19
good agreement with that experienced by the tubes when true thickness
is accounted for Comparing the tension branch of-the-predicted responses as
well as theeihpirical ones of Fig 18 very good agreement is found
It appears from Table IB and Fig IB that RD51J SQ5[8] and
N0LIN[13] reproduce the modulus of 298x106 psi experienced by the
coupons whereas N0NLIN [0]0[i11] predicts a considerably lower modulus 6of205xlO Comparing the ultimate stresses yielded by the different
analyses with the empirical ones it is found from Table lB and Fig
2B that the stresses of 320 ksi predicted by NOLIN Max Stress and
Quad Fail are in very good agreement with 317 experienced by the
coupons Good correlation is also observed between the empirical
stress and 341 ks predicted by N0LIN Max Strain It is also observed
in Table lB that RD5 yields a similar stress of 340 ksi for the last
acceptable-strain value
328 [00900] Laminates
The experimental responses of [1] and the ones predicted by
the analyses are presented in Fig 19 Comparison of the analytical
predictions with the response experienced by the coupons reveals very
good agreement between the empirical response and RD[51] as well as
very good agreement with the predictions of N0NLIN [101amp[11] and N0LIN[13]
in the range of moderate stress-strain values With increase in stressshy
strain levels N0NLIN and N0LIN which predict almost identical responses
display some minor nonlinear behavior which is hot observed for the
coupons Note that N0NLIN and N0LIN yield strength values which are
in good agreement with that predicted by the coupons whereas RDS
yields an appreciably lower stress (see Table lB and Fig 2B) It
is also observed in Fig 19 that once the true thickness of the
tubes is accounted for they respond wimilarly to the coupons but
fail at a considerably lower strength value (see Table iB)
It is found from Table 1B and Fig lB that N0NLIN yields the
lowest modulus 1667x106 psi N0LIN and SQ5 predict a modulus of
1715xlO6 which is in very good agreement with the empirical one of 6 6
1717x10 and RUB yields a slightly higher modulus of 1721x10
20
Table 1B and Fig 2B indicate very good agreement between
the strength of 230 ksi observed for the coupons and 220 yielded
by N0NLIN Also it is observed that all other analyses predict lower
ultimate stress values than that experienced by the coupons
deg329 [0degplusmn45090 1 Laminates
In Fig 20 the experimental responses of [1] are shown together
with the ones predicted by the analyses Very good agreement is observed
between the response yielded by the coupons and those predicted by
the analyses in particular the one calculated with N0NLIN [10311]
No correlation is observed in Fig 20 between the response observed
for the coupons and either version of the responses experienced by
the tubes
It is seen from Fig IB and Table IB that N0NLIN predicts a 6 6moIulus of 162x10 psi which isslightlyhigher than l147x10
experienced by the coupons and -slightly lower than 1187 yielded by
either SQ518] or N0LIN[3I] and i192xlO predicted by RDS[5]
Comparing the ultimate stresses experienced empirically and those
-predicted analytically it appears from Table 1B and Fig 2B that
N0NLIN strength of 141 ksi is in good agreement with 158 ksi bserved
for the coupons whereas N0LIN[13] in spite of its very good ageement
with the coupons mentioned above yields a stress of 125 ksi fQoMax
Strain and lower stresses of 121 and 113 ksi for Max Stress and
Quad Fail respectively It is also observed that RDS[S] predicts a
noticeably lower ultimate of 130 ksi and SQ5[8] a strength of 134
4 CONCLUSIONS
(a) None of the analyses namely RD[51] SQ5[8] N0NLIN[10][l1]
and N0LIN[13] utilized in the present comparison studies is
found to be adequate to predict satisfactorily the compression
response of angle-ply laminates
(b) As mentioned in the text of this report the responses corresponding to the unidirectional laminates which were experienced
by-the compression coupons of [l]were utilized as data input
for thecomputer codes RDS SQ5 and N0LIN It is observed from
21
the present comparison studies for the angle-ply laminates that
in spite of this the predicted response with these codes do not
favor the responses experienced by the coupons better than the
ones observed for the tubes For some laminate configurations
better correlation is observed with the responses yielded by
the tubes
(c) Present numerical studies indicate that no unique compression
responses were predicted by the various analyses employed in
the present comparison studies for the large variety of laminate
configurations invesrigated For some laminate configurations
considerably different responses were predicted for the same
laminate by the various analyses
(d) The analyses were found to be inadequate to predict the ultimate
stresses of the angle-ply laminates The built-in failure
mechanisms in the analytical models were not verified by the
test results because of very poor correlation between the calculated
strength values and those observed experimentally
(e) The very good correlation of the predicted moduli with the
empirical onesand the pronounced disagreement among the predicted
ultimate stresses nibther verifies nor contradicts the influence
of the edge effects discussed in Appendix B In view of the
arguments in this Appendix and the lack of success of a sound
test program with the compression tubes of [11 coupons having
different dimensions than those employed in [1] should further
be tested to accomplish the objectives of the test program of
[1] and present comparison studies and evaluations
6
22
REFRENCES
1 T Weller tExperimental Studies of Graphite-Epoxy and Baron-Epoxy Angle Ply Laminates in Compression NASA CR 145233 Sep (1977)
2 R T Haftka and J H Starnes JR-- Application of an Interior Penalty Function for Structural Optimization -AIAA Paper 75-764 t1975)
3 SW Tsai - Strength Characteristics of Composite Materials - NASA CR-224 April (1965)
4 S W Tsai D F Adams and D R Doner - Analysis of Composite Structures - NASA CR-620 November (1966)
S P H Petit - Ultimate Strength of Laminated Composites -
Report FZM-4977 prepared for Advanced Filaments and Composites-Division Air Force Materials Laboratory Air Force System Command Wright - Patterson Air Force Base Ohio December (1967)
P H Petit and M B Waddoups -AMethod of Predicting the Nonlinear Behavior of Laminated Composites -J Composite Materials Vol 3 p 2 January (1969)shy
7 K 0 Chiu - Ultimate Strength of Laminated Composites -
J Composite Materials Vol 3 P 578 July (1969)
8 D L Reed - Point Stress Laminate Analysis - Report PZM-5494 prepared for Advanced Composite Division Air Force Materials Laboratory Air Force Systems Command Wright - Patterson Air Force Base Ohio April (1970) (Also T J Muha - Users Manual for the Laminate Point Stress Analysis Computer Program SQ5 as Revised by AFFDLFBC - AFPDL-TM-74-107-FBC July C1974))
9 H T Hahn -Nonlinear Behavior of Laminated Composites -
J Composite Materials Vol 7 P 257 April (1973)
10 R L Foye - Theoretical Post Yielding Behavior of Composite Laminates Part I Inelastic Micromechanics -J Composite Materials Vol 7 p 178 April (1973)
23
11 R L Foye - Theoretical Post Yielding Behavior of Composite Laminates Part II Inelastic Micromechanics J Composite Materials- Vol 7 P310 July (1973)
12 R S Sandahu-- Nonlinear Response of Unidirectional and Angle-Ply Laminates - AIAA Paper 74-380 April (1974)
13 Z Hashin D Bagchi and W B Rosen - Nonlinear Behavior of Composite Laminates - NASA CR-2313 April (1974)
14 T Weller - Experimental Studies ofGraphite-Epoxy and Boron-Expoxy Angle Ply Landnates-in Shear NASACR 145232 Sep (1977)
15 W D Whetstone - Structural Network Analysis Program -
Users Manual Static ANAlysis Version V70E LMSC-HREC D162812 December (1970)
24
APPENDIX A
It has been pointed out in the section on the Numerical studies
that the computer codes RDS15] and N0LIN[15] require the existence of
the unidirectional [00] and [90] laminae responses in tension
compression and shear for their application The images of these
data inputs or library data input are presented in Tables APA-1A and
APA-IB as being input into RDS code In addition to the data in these
Tables also required by N0LIN the information presented in Table
APA-2 has to be provided to operate the N0LIN code (Instead of feeding
N0LIN with the stress-strain data input for the responses one may
use the Ramberg-Osgood parameters as explained in [13] and avoid the
utilizing of curve fitting alegorithms to generate these parameters)
The mechanical properties given in Table APA-2 are also required
as data input by SQ5 code
It was mentioned in the section on Results and Discussion that
the data input for the matrix material of the AVCO 5505 Boron-Epoxy
laminates was taken from [10][l1] The mechanical properties are as
follows
Young Modulus of Matrix 510000 psi
Shear Modulus of Matrix 200000 psi
Poissons Ratio of Matrix 310
and the equivalent stressequivalent strain curve is reproduced from
these references SLI = 106ESI = 5000 SL2 = 5x10⁶ ES2 = 10000 SL3 = 19x106 ES3 = 15000
ES4 = 20000 SL4 = 1Oxl06
ESS = 25000 SL5 = 3230
ES6 = 30000 SL6 = 0
25
The Boron fiber properties are Provided by the manufacturer and
are as follows
Young Modulus of Fiber 58x106 psi
Shear Modulus of Fiber 2375x106 psi
Poissons Ratio of Fiber 200
Fiber Tension Ultimate 500 ksi
Fiber Compression Ultimate 750 ksi
26
APPENDIX B
Ithas been mentioned in [I] that edge effects might be induced
far away from the loaded boundcaries of the coupons resulting in an
unevenstress-strain distribution even for a-coupon loaded uniformally
This kind of behavior was experienced by all the angle ply laminates
of []
When the coupon is loaded in a manner described in Fig APB
allowing for a uniform axial displacement u=(-S) and completely
restraining the lateral displacement y = 0 along the loaded boundaries
plusmn12 it is anticipated that the coupon width or rather its aspect
ratio AR = 1 will have an appreciable influence on the stressshy
strain distribution of angle-ply laminates possessing high Poissons
ratios
Withthe prescribed boundary conditions the specimen might
experience an induced transverse stress approaching in the limit a
stress of
ay= Gx yx
A wide specimen will contain a wide zone of continuous fibers subject
to this high degree of lateral restraint Consequently this zone will
result in both higher stresses and stiffnesses than the regions close
to the free edges of the coupon where the filaments are noncontinuous
and hence shear the load from the termination of one diagonal fiber
into the begining ofan adjecant one through the matrix This of course
will result in an unknown uneven stress-strain field which renders wide
specimens unsuitable for application The stress is picking up towards
the center and hence ishigher than the average stress utilized to
present the response of such specimens On the other hand too narrow
specimens will be affected primarily and subject to the edge effect
which-will reduce both their strength and stiffness
A numerical study was carried out to determine the actual
lateral edge effect combined withPoissons ratio and to define the
best aspect ratio ie the minimum length of the coupon1 free
27
of lateral boundary influence at least along its center line transverse
to the direction of applied compression SNAP computer code [15] was
used for this purpose and the obtained results are presented in Fig
APB-2 The coupons of [1] have an aspect ratiq AR=75 which according
to Fig APB-2 is too short to eliminate the lateral boundary influence
The above discussion calls for a different type of specimen
Indeed tubes were also tested and reported in [1] A tube is free
of the free edge region but on the -other hand is susceptible to
another deficiency if the radial displacementsat the loaded boundaries
are prevented from expanding to allow for Poissons expansion high
bending stresses develop at the restrained boundaries These stresses
might precipitate early local failure at the specimen edges or might
be superimposed on the compressive stresses in case the tube is too
short again bringing about failure at a stress lower than the ultimate
one corresponding to the tested laminate
TABLE 1A Compression Response - Comparison of Experimental Ultimate Stresses and Moduli With Analytical Predictions of RDS[S]
SQs[S1 N0NLIN[101amp[11] and N0LIN[13]
GRAPHITE-EPOXY LAMINATES -3m SP-286T3
EST RESULTS OF [1] ANAL RDS [5 ANAL SQS [8) ANAL NPNLIN ANAL N0LIN [13]
Laminate
Configuratlon
ompressionCoupons
Ult Comp Cop Mo Stress __(si) x1Opsi)
Compression TubesU
Mo M esod
Thick Thick 6 ks(ksi) ksi x O si)
Ultimate
CoSteStress
(ksi) 6
xlO si
Ultiate
(ks ) 6ai ps
Ultimate
Co Stress ksi ops )
015 Com stress (kst
Max Max quad Stress Strain InteracIl Fal Faill
Ex
(x O psi)
[00]
164 191 115 664 510
200 1609 20911 1607 8011
20911 180 1607
[plusmn15 ] 117
1394 105 826
1842 [14251
105 1324 --
11722 -
1324 14022 10622 929 1324
[plusmn30] 548
5911 374
687 292
357 283
246
286 224
811 [655]
400 1
575 48722 576 43412 37622 288 575
[plusmn453 382
227 289 234
312 [251]
313 (60)1
203 25122 204 16212 19712 175 204
[plusmn601 3547 172
222 163 251 238 158 30812 161 19512 22312 233 161
[plusmn731 312
360
191
5376321 194
214
221 14
150
[1793
175
[120]
375 175 48922 181 32522 32522 298 181
330
344 [191
155
241
102
180 132
1101-3 350 184 47822 191 32022 33222 320 191o
111 115115898
879 294
493382 287
42229 835[7791
110 1
899 11511 883 96211 11211 107 883
[0__48deg 97 _674 76[979476 359 71571 as 642 82111 632 6871 79 211 648 632
2Corrected for measured thickness
A11 Failure in compressionor tension in laina 11 direction A2 F1
1-(inch) n2540x1 2 meter
I pound fo ce - 4448222 Newton (N)kip = 10 poundtrce
b)
)+ Ulitimate stress values corresponding to very high unreasonable strain values upper number - last stress value which corresponds to an acceptable strain value
TABLE 1B Compression Response - Comparison of Experimental Ultimate Stresses and Moduli With Analytical Predictions of DS[5]
SQs[8] N0NLIN[10]G(li] and N0LIN[I3]-
TEST BORON-EPOXY LAMINATES (AVCO 550556 MIL DIA)
SANALRESULTS OF ANAL RDS (5] ANAL SQ5 -
(8] NLINAL0NL N AANLN[3ANAL N0LIN [13]
Laminate
Configuratio
Compression Copons
lt EStressCmpComp Mod
Compression Tubes
UltCom Stres m MeasuredThick x
Ultimate
CompStress
Ex
Ultimate
CompStress
Ex
Ultimate
ConyStress
Ex
Comp Stress (ksi)Ult
x Stress Strain Interac
Bx
(ksi) (xIO 6psi) (ksi) tksi) (xl06psi) (ksi) (xLOp$i) (ksz) (x06psi) (ksi) (xlO psi) si__ (xlO6psi)
10] 263
342 3127 - - 3340 3128 35311 3127 3120 54011 35311 340 3127
[1300]
( 45]
135 2365
139
947 5551095 O9
961 S89
337
253 351 308
838
918 290 3 300
255
280 331
576
680 206
2T4
194
204 234I
3749 [2685]
1111 [800]
323 [239]
150 2527
425 - 923 (NoULTOBT)OET
135 246 (NOULTOBT)
13322
4422
350612
2526
923
246
2496
887
257
32122
11212
10422
24622
11SIZ
246
115
2526
923
246
[plusmn601l 318 333
162 387 274
264 199
397 (272]
300 (NOULTOBT
221 50022 221 184 17312 18012 205 2 21
[plusmn7S) 348
279 2 311
19360 214 (64)+
276 44622 276 197 31922 26422 285 276
[90deg]
(090]
298
517 179
1
298
177
178
2171 206
126
143 1 8
339 [232] 2534
340
(38)+
190
299
11
1721
44722
194 111
298
1715
220
205
1667
32022
17611
34122
18411
320
21
298
1715 t
230 233 157 [1773] k
[0iplusmn4rso] 146
158 1147
137
147
881
874 1665
_110201 130 1192 13411 1187 141 1162 12111 12511
1 113
1 1 1187
1 q 1
Fiber failure in D degree layer
Calculations exceeded maximum observed experimental strain values
Solution does not converge
[ 3 Corrected for Measured thickness Ail Failure in compressionor tension
in lamina 11 directionIi
-2II (inch) = 2540x10 2 meter Tmi) I pound fojee = 4448222 Newton(N)
psz = 69477x10ound f rPascal (Pa)
)+Ultimate stress values corresponding to very high unreasonable strain values- upper number shy last stress value which corresponds to an acceptable strainvalue
A22 Failure in compressionor tension
A12 Failure in shear
I ksi i 105 psi
LIBRARY DATA FOR MATERIAL 2 - - SMSP2B6T-3(A-S)LEA1FA INPUT
SIGTO EPSTO SIGT9O EPSTS0O SIGCO EPSCO SIGC90 YPSCc9o
013500E 05 080000E-0 09O0000E 03 06000E-03 022500F 05 014000E-02 O46000E 04 025000E-b2 026500E 05 0O16000E-02 018000E 04 012000E-02 045000E 05 028000E-02 090006t 04 0500Q0E-02 O405hOE 05 O24OOOE-02 -026700E 04 018000E-02 067500E 05 02000E-02 013250E Oi 075000E-2 054500E 05 03200t-02 Q4860E 04 024000E-02 087200E 05 056000E-02 016800E 05 OlOOOE-01 069000E 05 00000E-02 042700E 04 q30000t-02 010670E 06 070000E-02 020500E 05 012500E-01
048 0 0 0E- 0 50 8 0 0E 04O3500E 05 0 2 036 000 E-02 012560E 06 O840OE-02 02375OE 05 015000F-01 097500E 05 056000E-02 058300E 04 O042000E-02 O14OE 06 098000E-02 026600E 05 ot17500E-Q1 011150E 06 064OOE-02 066200E 04 048000E-02 016250E 06 011200E-01 029100E 05 020000E-01 012559E 06 072000E-02 073600E 04 0540O0E-02 017900E 06 012600E01 031400E 05 p22500E-O1 013950E 06 08000E-02 081000E 04 060000E 02 019400E 06 01400OE-01 033500c 05 0250nOE-01 00 08BOOOE-02 00 amp66000E-02 00 0154600E-01 00 027500E-01 00 096000E-02 00 072000 E-02 00 016800E-01 00 03000AE-01
SIG45 EPS45 TbU12 CNL12 1 TNU21 CNU21
012540E 0 022000E-02 031400E 00 024000E 00 027911E-01 027477E-01 025080C 04 044000E-02 031600E 00 026000E 00 029169E-01 028073E-01 037620E 014 066000E-02 031800E 00 027500E 00 026349E-01 029089E-01 O5IOO1 E 04 0880OOE-02 0319nOE 00 028000E 00 024609E-01 028256E-01 058500 04 0i1000E-01 032000E 00 030000E 00 023246E-01 031877r-01 064000E 04 01300E-01 032000E00 031500E 00 023835E-01 030333E-01 069600E 04 015400Fr01 032000 00 03250OE 00 02857E-01 027590E-01 074000E 04 017600E-01 032000E 00 033000E 00 024076E-01 025525E-01 077500E 04 01VSOOE-01 032000E O0 033500 E 00 022552E-01 P26150E-01 080500E 04 022000E-01 031900E 00 034000E 00 022482E-01 026656E-01 00 024200E-01 0 00 00 0i0 00 026400E-01 00 00 00 00
TABLE ApA B- INPUT LIBRARY DATA FOR MATERIAL -1 - - AVCO 550556
SIGTO EPSTO SIGT9O EPST9O SIGCO EPSCO STGCSO CpSc90
021700E 05 043400E 05 065100E 05 086800E 05 010850E 06 0130206 06 015190r 06 017360E 06 Olq530E 06 021700F 06 00 00
070000E-03 0o4OOOE-02 O210OOE-02 028000E-02 035000E-02 042000E-02 049000t-02 056000E-02 0630OE602 070006E-02 077000E-02 084000E-02
011500 04 023000E 04 033500E 04 043400E 04 052700E 04 0610OE 04 070600E 04 078500E 04 084500E 04 089000E 04 00 00
04000E-03 080000E-03 012000Er02 016000E-02 020r00E-02 024000E-02 028000E-02 032000E-02 036000E-02 040000E-02 044000E-02 048000E-02
031270E 05 062540E 05 093810E 05 012508F 06 015635E 06 018762E 06 022100E 06 025400E 06 028800E 06 03l000E 06 00 00
010OOE-02 920000E-02 030000E-02 040000E-02 050000E-02 0600OOE-02 070000E-02 080000E-02 090000E-02 016000-01 011000E-01 012000E-01
044800E 04 069500E 04 013150E 05 016800E 05 020200E 05 023100E 05 025750E 05 028000E 05 031000E P9 031700E 05 00 00
015000E-02 - 030000E-02 045000E-02 96000E-02 075000E-02 090000E-02 010500E-01 0120006 1 013500E-01 0150OOE-01 0165O6E-01 oaeooor-Oi
SIG45 EPS45 TNU12 CNL12 TNU21 CNU21
0BgPE 04 033200E 04 042500E 04 0116500E 04 048500E O 050500E 04 052200E 04 053500E 04 055000E 04 O596000E 04 00 00
02700E-02 054000E-02 081000E-02 0108OOE-01 013500E-01 016200E-01 018900E-0 02tOOE-01 024300E-01 027000E-01 029790E-01 032400E-01
022700E 00 022700E 00 022700E 00 022400E 00 022400E 00 022400E 00 0224006 00 023000E 00 023300E 00 022700E 00 00 00
02640nE 00 026600E 00 026800E 00 026800E 00 027000E 00 02720 0 E 00 027500E 00 028000E 00 029000E 00 032000E 00 00 00
021052E-01 021052E-01 019222E-01 017884E-01 016800E-01 016439E-01 158976-01 014653E-01 011274E-01 0823806-02 00 00
025215E-01 025350E-b1 023997E-01 020855E-01 019572E-01 016817E-01 014555E-01 0i2727E-01 017059E-01 028118 -02 00 00
00 -
32 ou~IGV AGT32~ jO Q1JA1ATY
TABLE APA-2 Unidirectional Lamina Properties Utilized In The Predictions Of SQS9] and N0LIN[14]
3M SP-286T3 AVCO 550556 Mil GRAPHITE-EPOXY BORON-EPOXY
(Ell)Tension 1687x106 psi 3100xlO6 psi
(E11)Coinpression 1607x106 psi 3127x1O6 psi
(E22)Tension 152x106 psi 288x106 psi
(E22)Compression 191x106 psi 298x106 psi
GO2 057x106 psi 066x106 psi
(aULTll)Tension 140 ksi 220 ksi
(eULTllTension 008 007
(cULTll)Compression 180 ksi 340 ksi
(eULTll)Compression 013 0113
(t ULT22)Tension 8 ksi 89 ksi
(ULT 22)Tension 006 00405
(aULT22)Compression 32 ksi 32 ksi
(EULT22)Compression 025 015
((ULT12) 81 ksi 56 ksi
(CULT12) 022 0275
(v12)Compression 230 267
(v12)Tension 298 216
-1 (inch) = 2540x10 2 meter Cm)
1 pound force = 4448222 Newton (N)
I kip = 103 pound force
I psi = 6894757x105 Pascal (Pa)
I ksi = 103 psi
A test results [1] (coupons)0 analysis (8] amp 131
I00
w CL
10
-0
5
66
0 I I I I I I Cgt t C00o
01 +1 +1 +shy
g LAMINATE CONFIGURATION
FIG 1A YOUNGS MODULUS OF 3M SP-286T3 GRAPHITE EPOXY LAMINATES ASAFUNCTION OF LAMINATE CONFIGURATION
30 7A test results [i](coupons)0 analysis [81 amp [131 v [10] ampIll]
C o
w 20
109
0I III I I I + +1 +1 +1 +1
LAMINATE CONFIGURATION 0
FIG 1B YOUNGS MODULUS OFACO 5505(56MIL DIA BORON-EPOXY LAMINATES AS AFUNCTION OF LAMINATE CONFIGURATION
200t 200 3 0 mxx stress falla test results [1) (coupons) analysis NOLIN 03] V max strain fail
0 analysis RD 5 [5] r[ quadr interaction 0 analysis SQ5 [8] fail
150 150
0x(0
a
0~ARA 0
100- V13 100- 0
A A
A
50- 0 0 0 50shy000 v A A
0 A 13 V 0 0
0 in 0 10 0 O 0 to CD +1~j4 3 + +1 owi +1 +1 +1 4
LAMINATE CONFIGURATION LAMINATE CONFIGURATION
FIG 2A ULTIMATE STRESS OF 3M SP 286T3 GRAPHITE EPOXY LAMINATES AS AFUNCTION OF LAMINATE CONFIGURAiON
A tests results [1] (coupons) 0 maxstressfail 0 analysis RD5 [5] analysis NLIN [13] v max strain fail
300 0 analysis SQ5 [8] 300 0 quadr interaction fail
200
00
-A
200 -3
A
100 00
A A0 100 A
09 0A
o
0 LO lcent
O O -t to
TL +1 + 1 +1 1 LAMINATE CONFIGURATION
FIG 2B ULTIMATE STRESS OFAVCO LAMINATE CONFIGURATION
0 C gt 1LO L O C La mmO) rt
+ 1 + 1 + 1 + 1 4 LAMINATE CONFIGURATION
550556 MIL DIA BORON-EPOXY LAMINATES AS A FUNCTIONOF
200 -+ A
o 0
A
o 0~
ab A
0 Aa AA
0shy 0500shy
15-15 - 0 0l FIG Z
-0
OMPESIONRESONEO 003MSP-66T GAPHTE-POY LMINTA
AxC)0o00A
001 A0e
_150
0
0 00
0
coupons 0
00 0
u coupons
100 tubes nom
thick A
0
ubes horn thick
tubes t thickK 077 tubes tthick
50 -
-15 -10 -05 0 05 10Ex (4) 6 (0)FIG 4 COMPRESSION RESPONSE OF plusmn15 deg 3M SP-286T3 GRAPHITE-EPOXY LAMINATES
75
0C
E 50
coupons coupon 00
a 00 tubes noa oo
tubes tubes fern
0A
tubes t~ 4 tubes tthick 25 thick - shy
cento 4 AOa
0-10 -05 Ex (0) 0 y 05 10 15
FIG 5 COMPRESSION RESPONSE OF -30 3M SP-286T3 GRAPHITE-EPOXY LAMINATES
40
30-S
tubes hnmhick tubes nom
tik
a
20--
a-P III
-5 -3
FI30OMRESONtubes
-4
tubes tthick
2co1upo1s
FLJ-5 3 M28Thick
IF- PO
tues fain thIkEshy
tubes trthick
(60)
10G COPESONRSOSE-5 3MS-8t-RPIEEOY AIAE
40
couponstubes nor
copn thick
nomn btubes thick th
30CL
U
1shy
o
S-4 -3 -2 -ex (0) 0 y 2
degFIG 7 COMPRESSION RESPONSE OF +-60 3M SP-286T3 GRAPHITE-EPOXY LAMINATES
40
CL E 0 U
30
U) coupons
A
A
coupons
A
20-
0
tubes nom thick
0
tubes nom thick
-
tubes t thick
tubes t thick
10shy
-3 -2 -1 Ex() Cy (1)
FIG8 COMPRESSION RESPONSE OF plusmn750 3M SP-286T3 GRAPHITEEPOXY LAMINATES
-4 0
35 +
CL o0
Di couon coupons
S25
bull--
20shy
--
tubes nom thick
tubes nom thick
t
15-tubes
thick t
tubes tthickN N
10 -N
NN
0n -25 -20 -15 -10 ex -05 0 ey 05
FIG 9 COMPRESSION RESPONSE OF 906 3M SP-286T3 GRAPHITE-EPOXY LAMINATES
120
100- A
2 coupons
E080 A 2 0
60shy
thick tubes nom hidk
40shy
tubes t 20- tubes tthick - thick
0shy-16 44 -12 -10 -08 -06 -04 -02 0 02
FIG 10 COMPRESSION RESPONSE OF 0900 3M SP-286T3 GRAPHITE-EPOXY LAMINATES y
100
oo coupons
ns coupons
0
UIi75 - -
50- C
tubes nom tubes nor thick thick
25 tubes tthick Kc_ tubes tthick
-20
FIG11
-15
COMPRESSION -1o
RESPONSE OF 0145900
-05 0 05 e1 (C) OE y (0)3M SP-286T3 GRAPHITE-EPOXY LAMINATES
10
400
(0
6 coupons coupons 200- shy
100 shy
-12 -10 -08 -06 -04 Q02 0 0Q2 ey 04 FIG 1V COMPRESSION RESPONSE OF 00 AVCO 5505156 MIL DIA BORO-EPOXY LAMINATES
150- +-- V
o
U)
In
_
A coupons
100 tubes florn
E
nom
tthick
tubes tthick-- t
copos7L A
V(10
-otubesnomathick ov
tubes tik IV deg tub es t t h ic k o
50 0
10
001
I
FIG 13
-05 0Eri)
COMPRESSION RESPONSE
A H I
05ey (0)
OF t 150 AVCO 5505 BORON-EPOXY
10
LAMINATES
15
75
0v VU)InI v v 03pn coupons
degu v
- 50v V
(no ultobt) A (no ultobt)amp
25- 0
tubes nom thick 04 tubes nom thick
tubes tthick0 tubes tthick
- Q5 0 05 10 15Ex (sect) Ey (dego)
FIG 14A COMPRESSION RESPONSE OF plusmn300 AVCO 550556 MIL DIA BORON-EPOXY LAMINATES (BATCH 1)
20
100
0
0
U
75
(no V V V
V50 -- V V -o uponsV (outat)v (no ultobt)
nora tubes 47
VAnom 0V thick AV
25tubes noma th
tubest~thikK~iVx tubes tthick
5 -D -05 E M0 (o) 05 10 15
FIG 14B COMPRESSION RESPONSE OF plusmn300 AVCO 550556 MIL DIA BORON-EPOXY LAMINATES (BATCH E1)
40
0
CLcuoscoupons
E 0 v
30shy
230 ---shy
thick thick -S- -- - tin
20- tube2 k- -shyc
1 e thick
(noul Xe (no ult)
10- (t A
0 04 ey SA)x (15FIG 15 COMPRESSION RESPONSE OF plusmn450 AVCO 550556 MIL DIA BORON-EPOXY LAMINATES
_ _ _ _ _
40
tubes nom thick V
tubes nom thick
c-oupons v (no ult obt) v n
(no ult30- A obt) VA coupons
0
~hck tubes tthick2tbs8 ZE AA
00 In AA_
vA 0 b 0 A 0
A 00 0
0 10 AA
OI I I -5 -4 -3 -2 1 ( y 2
FPAxI E y ()MFIG 16 COMPRESSION RE-SPON$EOFi60 AVCO -550556 MIL DIA BORON-EPOXY LAMINATES-
40
(64 ksi) (64)
30
oV CO
coupons
0A 0
AA A coupons
0-A 5
20
0
0 00
10shy
00
V
-25 -20 -15 -10 -05 0 05eF (0) Ey (CI)05FIG 17 COMPRESSION RESPONSE-OF +-750AVCO 5505156 MIL DIA BORON-EPOXY LAMINATES
40 -
C
En Ult 3 0 L
0 deg 3 0 - cou on coupons u
830
tubes nom 20 V thick
tubes nom thick V
-tubes tthicdk
thick 10shy
-16 -14 -12 -10 -08 -06 -04 -2 0 2 ei () ey (0)
FIG 18 COMPRESSION RESPONSE OF 906 AVCO 550556 MIL DIA BORON EPOXY LAMINATES
2-250 upons coupons
CL tubes nom thick tubesno]
ktubes t tubes t
0 thick thickS 150- O
0
wA
201 thck
50
-14 -12 -10 -08 -06 -04 -02 0 02 ex (0f) ey (l)
FIG 19 COMPRESSION RESPONSE OF 0900 AVCO 550556 MIL DIA BORON-EPOXY LAMINATES
200
2 0
E coupons
150 tubbs nom tubes thick nom
thick
100
tubes t tubes thick tthick
50shy
- I
0-15 -10 -05 05Lx () 00 y (l) 0
FIG 20 COMPRESSION RESPONSE OF 0145900 AVCO 5505156 MIL DIA BORON-EPOXY LAMINATES
IxJu
uniform compression
L u=-8 I I I I I
I Ib
I 1IIAP II ICPSIx I I
I I
I- b
FIG APB 1 COUPON UNDER UNIFORM COMPRESSION
AR AR (SNAP) t xy
0 POISSON RATIO -xy
2 10lj
ISOTROPIC 0 PANEL
I bullI 00
0 05
0 10 20 30 40 50 60 70 80 90 t a (degrees)
FIG APB 2 MIN AR FOR 6BESTSTRESS DISTRIBUTION ALONG THE CENTER LINE OF THE COUPON

20
Table 1B and Fig 2B indicate very good agreement between
the strength of 230 ksi observed for the coupons and 220 yielded
by N0NLIN Also it is observed that all other analyses predict lower
ultimate stress values than that experienced by the coupons
deg329 [0degplusmn45090 1 Laminates
In Fig 20 the experimental responses of [1] are shown together
with the ones predicted by the analyses Very good agreement is observed
between the response yielded by the coupons and those predicted by
the analyses in particular the one calculated with N0NLIN [10311]
No correlation is observed in Fig 20 between the response observed
for the coupons and either version of the responses experienced by
the tubes
It is seen from Fig IB and Table IB that N0NLIN predicts a 6 6moIulus of 162x10 psi which isslightlyhigher than l147x10
experienced by the coupons and -slightly lower than 1187 yielded by
either SQ518] or N0LIN[3I] and i192xlO predicted by RDS[5]
Comparing the ultimate stresses experienced empirically and those
-predicted analytically it appears from Table 1B and Fig 2B that
N0NLIN strength of 141 ksi is in good agreement with 158 ksi bserved
for the coupons whereas N0LIN[13] in spite of its very good ageement
with the coupons mentioned above yields a stress of 125 ksi fQoMax
Strain and lower stresses of 121 and 113 ksi for Max Stress and
Quad Fail respectively It is also observed that RDS[S] predicts a
noticeably lower ultimate of 130 ksi and SQ5[8] a strength of 134
4 CONCLUSIONS
(a) None of the analyses namely RD[51] SQ5[8] N0NLIN[10][l1]
and N0LIN[13] utilized in the present comparison studies is
found to be adequate to predict satisfactorily the compression
response of angle-ply laminates
(b) As mentioned in the text of this report the responses corresponding to the unidirectional laminates which were experienced
by-the compression coupons of [l]were utilized as data input
for thecomputer codes RDS SQ5 and N0LIN It is observed from
21
the present comparison studies for the angle-ply laminates that
in spite of this the predicted response with these codes do not
favor the responses experienced by the coupons better than the
ones observed for the tubes For some laminate configurations
better correlation is observed with the responses yielded by
the tubes
(c) Present numerical studies indicate that no unique compression
responses were predicted by the various analyses employed in
the present comparison studies for the large variety of laminate
configurations invesrigated For some laminate configurations
considerably different responses were predicted for the same
laminate by the various analyses
(d) The analyses were found to be inadequate to predict the ultimate
stresses of the angle-ply laminates The built-in failure
mechanisms in the analytical models were not verified by the
test results because of very poor correlation between the calculated
strength values and those observed experimentally
(e) The very good correlation of the predicted moduli with the
empirical onesand the pronounced disagreement among the predicted
ultimate stresses nibther verifies nor contradicts the influence
of the edge effects discussed in Appendix B In view of the
arguments in this Appendix and the lack of success of a sound
test program with the compression tubes of [11 coupons having
different dimensions than those employed in [1] should further
be tested to accomplish the objectives of the test program of
[1] and present comparison studies and evaluations
6
22
REFRENCES
1 T Weller tExperimental Studies of Graphite-Epoxy and Baron-Epoxy Angle Ply Laminates in Compression NASA CR 145233 Sep (1977)
2 R T Haftka and J H Starnes JR-- Application of an Interior Penalty Function for Structural Optimization -AIAA Paper 75-764 t1975)
3 SW Tsai - Strength Characteristics of Composite Materials - NASA CR-224 April (1965)
4 S W Tsai D F Adams and D R Doner - Analysis of Composite Structures - NASA CR-620 November (1966)
S P H Petit - Ultimate Strength of Laminated Composites -
Report FZM-4977 prepared for Advanced Filaments and Composites-Division Air Force Materials Laboratory Air Force System Command Wright - Patterson Air Force Base Ohio December (1967)
P H Petit and M B Waddoups -AMethod of Predicting the Nonlinear Behavior of Laminated Composites -J Composite Materials Vol 3 p 2 January (1969)shy
7 K 0 Chiu - Ultimate Strength of Laminated Composites -
J Composite Materials Vol 3 P 578 July (1969)
8 D L Reed - Point Stress Laminate Analysis - Report PZM-5494 prepared for Advanced Composite Division Air Force Materials Laboratory Air Force Systems Command Wright - Patterson Air Force Base Ohio April (1970) (Also T J Muha - Users Manual for the Laminate Point Stress Analysis Computer Program SQ5 as Revised by AFFDLFBC - AFPDL-TM-74-107-FBC July C1974))
9 H T Hahn -Nonlinear Behavior of Laminated Composites -
J Composite Materials Vol 7 P 257 April (1973)
10 R L Foye - Theoretical Post Yielding Behavior of Composite Laminates Part I Inelastic Micromechanics -J Composite Materials Vol 7 p 178 April (1973)
23
11 R L Foye - Theoretical Post Yielding Behavior of Composite Laminates Part II Inelastic Micromechanics J Composite Materials- Vol 7 P310 July (1973)
12 R S Sandahu-- Nonlinear Response of Unidirectional and Angle-Ply Laminates - AIAA Paper 74-380 April (1974)
13 Z Hashin D Bagchi and W B Rosen - Nonlinear Behavior of Composite Laminates - NASA CR-2313 April (1974)
14 T Weller - Experimental Studies ofGraphite-Epoxy and Boron-Expoxy Angle Ply Landnates-in Shear NASACR 145232 Sep (1977)
15 W D Whetstone - Structural Network Analysis Program -
Users Manual Static ANAlysis Version V70E LMSC-HREC D162812 December (1970)
24
APPENDIX A
It has been pointed out in the section on the Numerical studies
that the computer codes RDS15] and N0LIN[15] require the existence of
the unidirectional [00] and [90] laminae responses in tension
compression and shear for their application The images of these
data inputs or library data input are presented in Tables APA-1A and
APA-IB as being input into RDS code In addition to the data in these
Tables also required by N0LIN the information presented in Table
APA-2 has to be provided to operate the N0LIN code (Instead of feeding
N0LIN with the stress-strain data input for the responses one may
use the Ramberg-Osgood parameters as explained in [13] and avoid the
utilizing of curve fitting alegorithms to generate these parameters)
The mechanical properties given in Table APA-2 are also required
as data input by SQ5 code
It was mentioned in the section on Results and Discussion that
the data input for the matrix material of the AVCO 5505 Boron-Epoxy
laminates was taken from [10][l1] The mechanical properties are as
follows
Young Modulus of Matrix 510000 psi
Shear Modulus of Matrix 200000 psi
Poissons Ratio of Matrix 310
and the equivalent stressequivalent strain curve is reproduced from
these references SLI = 106ESI = 5000 SL2 = 5x10⁶ ES2 = 10000 SL3 = 19x106 ES3 = 15000
ES4 = 20000 SL4 = 1Oxl06
ESS = 25000 SL5 = 3230
ES6 = 30000 SL6 = 0
25
The Boron fiber properties are Provided by the manufacturer and
are as follows
Young Modulus of Fiber 58x106 psi
Shear Modulus of Fiber 2375x106 psi
Poissons Ratio of Fiber 200
Fiber Tension Ultimate 500 ksi
Fiber Compression Ultimate 750 ksi
26
APPENDIX B
Ithas been mentioned in [I] that edge effects might be induced
far away from the loaded boundcaries of the coupons resulting in an
unevenstress-strain distribution even for a-coupon loaded uniformally
This kind of behavior was experienced by all the angle ply laminates
of []
When the coupon is loaded in a manner described in Fig APB
allowing for a uniform axial displacement u=(-S) and completely
restraining the lateral displacement y = 0 along the loaded boundaries
plusmn12 it is anticipated that the coupon width or rather its aspect
ratio AR = 1 will have an appreciable influence on the stressshy
strain distribution of angle-ply laminates possessing high Poissons
ratios
Withthe prescribed boundary conditions the specimen might
experience an induced transverse stress approaching in the limit a
stress of
ay= Gx yx
A wide specimen will contain a wide zone of continuous fibers subject
to this high degree of lateral restraint Consequently this zone will
result in both higher stresses and stiffnesses than the regions close
to the free edges of the coupon where the filaments are noncontinuous
and hence shear the load from the termination of one diagonal fiber
into the begining ofan adjecant one through the matrix This of course
will result in an unknown uneven stress-strain field which renders wide
specimens unsuitable for application The stress is picking up towards
the center and hence ishigher than the average stress utilized to
present the response of such specimens On the other hand too narrow
specimens will be affected primarily and subject to the edge effect
which-will reduce both their strength and stiffness
A numerical study was carried out to determine the actual
lateral edge effect combined withPoissons ratio and to define the
best aspect ratio ie the minimum length of the coupon1 free
27
of lateral boundary influence at least along its center line transverse
to the direction of applied compression SNAP computer code [15] was
used for this purpose and the obtained results are presented in Fig
APB-2 The coupons of [1] have an aspect ratiq AR=75 which according
to Fig APB-2 is too short to eliminate the lateral boundary influence
The above discussion calls for a different type of specimen
Indeed tubes were also tested and reported in [1] A tube is free
of the free edge region but on the -other hand is susceptible to
another deficiency if the radial displacementsat the loaded boundaries
are prevented from expanding to allow for Poissons expansion high
bending stresses develop at the restrained boundaries These stresses
might precipitate early local failure at the specimen edges or might
be superimposed on the compressive stresses in case the tube is too
short again bringing about failure at a stress lower than the ultimate
one corresponding to the tested laminate
TABLE 1A Compression Response - Comparison of Experimental Ultimate Stresses and Moduli With Analytical Predictions of RDS[S]
SQs[S1 N0NLIN[101amp[11] and N0LIN[13]
GRAPHITE-EPOXY LAMINATES -3m SP-286T3
EST RESULTS OF [1] ANAL RDS [5 ANAL SQS [8) ANAL NPNLIN ANAL N0LIN [13]
Laminate
Configuratlon
ompressionCoupons
Ult Comp Cop Mo Stress __(si) x1Opsi)
Compression TubesU
Mo M esod
Thick Thick 6 ks(ksi) ksi x O si)
Ultimate
CoSteStress
(ksi) 6
xlO si
Ultiate
(ks ) 6ai ps
Ultimate
Co Stress ksi ops )
015 Com stress (kst
Max Max quad Stress Strain InteracIl Fal Faill
Ex
(x O psi)
[00]
164 191 115 664 510
200 1609 20911 1607 8011
20911 180 1607
[plusmn15 ] 117
1394 105 826
1842 [14251
105 1324 --
11722 -
1324 14022 10622 929 1324
[plusmn30] 548
5911 374
687 292
357 283
246
286 224
811 [655]
400 1
575 48722 576 43412 37622 288 575
[plusmn453 382
227 289 234
312 [251]
313 (60)1
203 25122 204 16212 19712 175 204
[plusmn601 3547 172
222 163 251 238 158 30812 161 19512 22312 233 161
[plusmn731 312
360
191
5376321 194
214
221 14
150
[1793
175
[120]
375 175 48922 181 32522 32522 298 181
330
344 [191
155
241
102
180 132
1101-3 350 184 47822 191 32022 33222 320 191o
111 115115898
879 294
493382 287
42229 835[7791
110 1
899 11511 883 96211 11211 107 883
[0__48deg 97 _674 76[979476 359 71571 as 642 82111 632 6871 79 211 648 632
2Corrected for measured thickness
A11 Failure in compressionor tension in laina 11 direction A2 F1
1-(inch) n2540x1 2 meter
I pound fo ce - 4448222 Newton (N)kip = 10 poundtrce
b)
)+ Ulitimate stress values corresponding to very high unreasonable strain values upper number - last stress value which corresponds to an acceptable strain value
TABLE 1B Compression Response - Comparison of Experimental Ultimate Stresses and Moduli With Analytical Predictions of DS[5]
SQs[8] N0NLIN[10]G(li] and N0LIN[I3]-
TEST BORON-EPOXY LAMINATES (AVCO 550556 MIL DIA)
SANALRESULTS OF ANAL RDS (5] ANAL SQ5 -
(8] NLINAL0NL N AANLN[3ANAL N0LIN [13]
Laminate
Configuratio
Compression Copons
lt EStressCmpComp Mod
Compression Tubes
UltCom Stres m MeasuredThick x
Ultimate
CompStress
Ex
Ultimate
CompStress
Ex
Ultimate
ConyStress
Ex
Comp Stress (ksi)Ult
x Stress Strain Interac
Bx
(ksi) (xIO 6psi) (ksi) tksi) (xl06psi) (ksi) (xLOp$i) (ksz) (x06psi) (ksi) (xlO psi) si__ (xlO6psi)
10] 263
342 3127 - - 3340 3128 35311 3127 3120 54011 35311 340 3127
[1300]
( 45]
135 2365
139
947 5551095 O9
961 S89
337
253 351 308
838
918 290 3 300
255
280 331
576
680 206
2T4
194
204 234I
3749 [2685]
1111 [800]
323 [239]
150 2527
425 - 923 (NoULTOBT)OET
135 246 (NOULTOBT)
13322
4422
350612
2526
923
246
2496
887
257
32122
11212
10422
24622
11SIZ
246
115
2526
923
246
[plusmn601l 318 333
162 387 274
264 199
397 (272]
300 (NOULTOBT
221 50022 221 184 17312 18012 205 2 21
[plusmn7S) 348
279 2 311
19360 214 (64)+
276 44622 276 197 31922 26422 285 276
[90deg]
(090]
298
517 179
1
298
177
178
2171 206
126
143 1 8
339 [232] 2534
340
(38)+
190
299
11
1721
44722
194 111
298
1715
220
205
1667
32022
17611
34122
18411
320
21
298
1715 t
230 233 157 [1773] k
[0iplusmn4rso] 146
158 1147
137
147
881
874 1665
_110201 130 1192 13411 1187 141 1162 12111 12511
1 113
1 1 1187
1 q 1
Fiber failure in D degree layer
Calculations exceeded maximum observed experimental strain values
Solution does not converge
[ 3 Corrected for Measured thickness Ail Failure in compressionor tension
in lamina 11 directionIi
-2II (inch) = 2540x10 2 meter Tmi) I pound fojee = 4448222 Newton(N)
psz = 69477x10ound f rPascal (Pa)
)+Ultimate stress values corresponding to very high unreasonable strain values- upper number shy last stress value which corresponds to an acceptable strainvalue
A22 Failure in compressionor tension
A12 Failure in shear
I ksi i 105 psi
LIBRARY DATA FOR MATERIAL 2 - - SMSP2B6T-3(A-S)LEA1FA INPUT
SIGTO EPSTO SIGT9O EPSTS0O SIGCO EPSCO SIGC90 YPSCc9o
013500E 05 080000E-0 09O0000E 03 06000E-03 022500F 05 014000E-02 O46000E 04 025000E-b2 026500E 05 0O16000E-02 018000E 04 012000E-02 045000E 05 028000E-02 090006t 04 0500Q0E-02 O405hOE 05 O24OOOE-02 -026700E 04 018000E-02 067500E 05 02000E-02 013250E Oi 075000E-2 054500E 05 03200t-02 Q4860E 04 024000E-02 087200E 05 056000E-02 016800E 05 OlOOOE-01 069000E 05 00000E-02 042700E 04 q30000t-02 010670E 06 070000E-02 020500E 05 012500E-01
048 0 0 0E- 0 50 8 0 0E 04O3500E 05 0 2 036 000 E-02 012560E 06 O840OE-02 02375OE 05 015000F-01 097500E 05 056000E-02 058300E 04 O042000E-02 O14OE 06 098000E-02 026600E 05 ot17500E-Q1 011150E 06 064OOE-02 066200E 04 048000E-02 016250E 06 011200E-01 029100E 05 020000E-01 012559E 06 072000E-02 073600E 04 0540O0E-02 017900E 06 012600E01 031400E 05 p22500E-O1 013950E 06 08000E-02 081000E 04 060000E 02 019400E 06 01400OE-01 033500c 05 0250nOE-01 00 08BOOOE-02 00 amp66000E-02 00 0154600E-01 00 027500E-01 00 096000E-02 00 072000 E-02 00 016800E-01 00 03000AE-01
SIG45 EPS45 TbU12 CNL12 1 TNU21 CNU21
012540E 0 022000E-02 031400E 00 024000E 00 027911E-01 027477E-01 025080C 04 044000E-02 031600E 00 026000E 00 029169E-01 028073E-01 037620E 014 066000E-02 031800E 00 027500E 00 026349E-01 029089E-01 O5IOO1 E 04 0880OOE-02 0319nOE 00 028000E 00 024609E-01 028256E-01 058500 04 0i1000E-01 032000E 00 030000E 00 023246E-01 031877r-01 064000E 04 01300E-01 032000E00 031500E 00 023835E-01 030333E-01 069600E 04 015400Fr01 032000 00 03250OE 00 02857E-01 027590E-01 074000E 04 017600E-01 032000E 00 033000E 00 024076E-01 025525E-01 077500E 04 01VSOOE-01 032000E O0 033500 E 00 022552E-01 P26150E-01 080500E 04 022000E-01 031900E 00 034000E 00 022482E-01 026656E-01 00 024200E-01 0 00 00 0i0 00 026400E-01 00 00 00 00
TABLE ApA B- INPUT LIBRARY DATA FOR MATERIAL -1 - - AVCO 550556
SIGTO EPSTO SIGT9O EPST9O SIGCO EPSCO STGCSO CpSc90
021700E 05 043400E 05 065100E 05 086800E 05 010850E 06 0130206 06 015190r 06 017360E 06 Olq530E 06 021700F 06 00 00
070000E-03 0o4OOOE-02 O210OOE-02 028000E-02 035000E-02 042000E-02 049000t-02 056000E-02 0630OE602 070006E-02 077000E-02 084000E-02
011500 04 023000E 04 033500E 04 043400E 04 052700E 04 0610OE 04 070600E 04 078500E 04 084500E 04 089000E 04 00 00
04000E-03 080000E-03 012000Er02 016000E-02 020r00E-02 024000E-02 028000E-02 032000E-02 036000E-02 040000E-02 044000E-02 048000E-02
031270E 05 062540E 05 093810E 05 012508F 06 015635E 06 018762E 06 022100E 06 025400E 06 028800E 06 03l000E 06 00 00
010OOE-02 920000E-02 030000E-02 040000E-02 050000E-02 0600OOE-02 070000E-02 080000E-02 090000E-02 016000-01 011000E-01 012000E-01
044800E 04 069500E 04 013150E 05 016800E 05 020200E 05 023100E 05 025750E 05 028000E 05 031000E P9 031700E 05 00 00
015000E-02 - 030000E-02 045000E-02 96000E-02 075000E-02 090000E-02 010500E-01 0120006 1 013500E-01 0150OOE-01 0165O6E-01 oaeooor-Oi
SIG45 EPS45 TNU12 CNL12 TNU21 CNU21
0BgPE 04 033200E 04 042500E 04 0116500E 04 048500E O 050500E 04 052200E 04 053500E 04 055000E 04 O596000E 04 00 00
02700E-02 054000E-02 081000E-02 0108OOE-01 013500E-01 016200E-01 018900E-0 02tOOE-01 024300E-01 027000E-01 029790E-01 032400E-01
022700E 00 022700E 00 022700E 00 022400E 00 022400E 00 022400E 00 0224006 00 023000E 00 023300E 00 022700E 00 00 00
02640nE 00 026600E 00 026800E 00 026800E 00 027000E 00 02720 0 E 00 027500E 00 028000E 00 029000E 00 032000E 00 00 00
021052E-01 021052E-01 019222E-01 017884E-01 016800E-01 016439E-01 158976-01 014653E-01 011274E-01 0823806-02 00 00
025215E-01 025350E-b1 023997E-01 020855E-01 019572E-01 016817E-01 014555E-01 0i2727E-01 017059E-01 028118 -02 00 00
00 -
32 ou~IGV AGT32~ jO Q1JA1ATY
TABLE APA-2 Unidirectional Lamina Properties Utilized In The Predictions Of SQS9] and N0LIN[14]
3M SP-286T3 AVCO 550556 Mil GRAPHITE-EPOXY BORON-EPOXY
(Ell)Tension 1687x106 psi 3100xlO6 psi
(E11)Coinpression 1607x106 psi 3127x1O6 psi
(E22)Tension 152x106 psi 288x106 psi
(E22)Compression 191x106 psi 298x106 psi
GO2 057x106 psi 066x106 psi
(aULTll)Tension 140 ksi 220 ksi
(eULTllTension 008 007
(cULTll)Compression 180 ksi 340 ksi
(eULTll)Compression 013 0113
(t ULT22)Tension 8 ksi 89 ksi
(ULT 22)Tension 006 00405
(aULT22)Compression 32 ksi 32 ksi
(EULT22)Compression 025 015
((ULT12) 81 ksi 56 ksi
(CULT12) 022 0275
(v12)Compression 230 267
(v12)Tension 298 216
-1 (inch) = 2540x10 2 meter Cm)
1 pound force = 4448222 Newton (N)
I kip = 103 pound force
I psi = 6894757x105 Pascal (Pa)
I ksi = 103 psi
A test results [1] (coupons)0 analysis (8] amp 131
I00
w CL
10
-0
5
66
0 I I I I I I Cgt t C00o
01 +1 +1 +shy
g LAMINATE CONFIGURATION
FIG 1A YOUNGS MODULUS OF 3M SP-286T3 GRAPHITE EPOXY LAMINATES ASAFUNCTION OF LAMINATE CONFIGURATION
30 7A test results [i](coupons)0 analysis [81 amp [131 v [10] ampIll]
C o
w 20
109
0I III I I I + +1 +1 +1 +1
LAMINATE CONFIGURATION 0
FIG 1B YOUNGS MODULUS OFACO 5505(56MIL DIA BORON-EPOXY LAMINATES AS AFUNCTION OF LAMINATE CONFIGURATION
200t 200 3 0 mxx stress falla test results [1) (coupons) analysis NOLIN 03] V max strain fail
0 analysis RD 5 [5] r[ quadr interaction 0 analysis SQ5 [8] fail
150 150
0x(0
a
0~ARA 0
100- V13 100- 0
A A
A
50- 0 0 0 50shy000 v A A
0 A 13 V 0 0
0 in 0 10 0 O 0 to CD +1~j4 3 + +1 owi +1 +1 +1 4
LAMINATE CONFIGURATION LAMINATE CONFIGURATION
FIG 2A ULTIMATE STRESS OF 3M SP 286T3 GRAPHITE EPOXY LAMINATES AS AFUNCTION OF LAMINATE CONFIGURAiON
A tests results [1] (coupons) 0 maxstressfail 0 analysis RD5 [5] analysis NLIN [13] v max strain fail
300 0 analysis SQ5 [8] 300 0 quadr interaction fail
200
00
-A
200 -3
A
100 00
A A0 100 A
09 0A
o
0 LO lcent
O O -t to
TL +1 + 1 +1 1 LAMINATE CONFIGURATION
FIG 2B ULTIMATE STRESS OFAVCO LAMINATE CONFIGURATION
0 C gt 1LO L O C La mmO) rt
+ 1 + 1 + 1 + 1 4 LAMINATE CONFIGURATION
550556 MIL DIA BORON-EPOXY LAMINATES AS A FUNCTIONOF
200 -+ A
o 0
A
o 0~
ab A
0 Aa AA
0shy 0500shy
15-15 - 0 0l FIG Z
-0
OMPESIONRESONEO 003MSP-66T GAPHTE-POY LMINTA
AxC)0o00A
001 A0e
_150
0
0 00
0
coupons 0
00 0
u coupons
100 tubes nom
thick A
0
ubes horn thick
tubes t thickK 077 tubes tthick
50 -
-15 -10 -05 0 05 10Ex (4) 6 (0)FIG 4 COMPRESSION RESPONSE OF plusmn15 deg 3M SP-286T3 GRAPHITE-EPOXY LAMINATES
75
0C
E 50
coupons coupon 00
a 00 tubes noa oo
tubes tubes fern
0A
tubes t~ 4 tubes tthick 25 thick - shy
cento 4 AOa
0-10 -05 Ex (0) 0 y 05 10 15
FIG 5 COMPRESSION RESPONSE OF -30 3M SP-286T3 GRAPHITE-EPOXY LAMINATES
40
30-S
tubes hnmhick tubes nom
tik
a
20--
a-P III
-5 -3
FI30OMRESONtubes
-4
tubes tthick
2co1upo1s
FLJ-5 3 M28Thick
IF- PO
tues fain thIkEshy
tubes trthick
(60)
10G COPESONRSOSE-5 3MS-8t-RPIEEOY AIAE
40
couponstubes nor
copn thick
nomn btubes thick th
30CL
U
1shy
o
S-4 -3 -2 -ex (0) 0 y 2
degFIG 7 COMPRESSION RESPONSE OF +-60 3M SP-286T3 GRAPHITE-EPOXY LAMINATES
40
CL E 0 U
30
U) coupons
A
A
coupons
A
20-
0
tubes nom thick
0
tubes nom thick
-
tubes t thick
tubes t thick
10shy
-3 -2 -1 Ex() Cy (1)
FIG8 COMPRESSION RESPONSE OF plusmn750 3M SP-286T3 GRAPHITEEPOXY LAMINATES
-4 0
35 +
CL o0
Di couon coupons
S25
bull--
20shy
--
tubes nom thick
tubes nom thick
t
15-tubes
thick t
tubes tthickN N
10 -N
NN
0n -25 -20 -15 -10 ex -05 0 ey 05
FIG 9 COMPRESSION RESPONSE OF 906 3M SP-286T3 GRAPHITE-EPOXY LAMINATES
120
100- A
2 coupons
E080 A 2 0
60shy
thick tubes nom hidk
40shy
tubes t 20- tubes tthick - thick
0shy-16 44 -12 -10 -08 -06 -04 -02 0 02
FIG 10 COMPRESSION RESPONSE OF 0900 3M SP-286T3 GRAPHITE-EPOXY LAMINATES y
100
oo coupons
ns coupons
0
UIi75 - -
50- C
tubes nom tubes nor thick thick
25 tubes tthick Kc_ tubes tthick
-20
FIG11
-15
COMPRESSION -1o
RESPONSE OF 0145900
-05 0 05 e1 (C) OE y (0)3M SP-286T3 GRAPHITE-EPOXY LAMINATES
10
400
(0
6 coupons coupons 200- shy
100 shy
-12 -10 -08 -06 -04 Q02 0 0Q2 ey 04 FIG 1V COMPRESSION RESPONSE OF 00 AVCO 5505156 MIL DIA BORO-EPOXY LAMINATES
150- +-- V
o
U)
In
_
A coupons
100 tubes florn
E
nom
tthick
tubes tthick-- t
copos7L A
V(10
-otubesnomathick ov
tubes tik IV deg tub es t t h ic k o
50 0
10
001
I
FIG 13
-05 0Eri)
COMPRESSION RESPONSE
A H I
05ey (0)
OF t 150 AVCO 5505 BORON-EPOXY
10
LAMINATES
15
75
0v VU)InI v v 03pn coupons
degu v
- 50v V
(no ultobt) A (no ultobt)amp
25- 0
tubes nom thick 04 tubes nom thick
tubes tthick0 tubes tthick
- Q5 0 05 10 15Ex (sect) Ey (dego)
FIG 14A COMPRESSION RESPONSE OF plusmn300 AVCO 550556 MIL DIA BORON-EPOXY LAMINATES (BATCH 1)
20
100
0
0
U
75
(no V V V
V50 -- V V -o uponsV (outat)v (no ultobt)
nora tubes 47
VAnom 0V thick AV
25tubes noma th
tubest~thikK~iVx tubes tthick
5 -D -05 E M0 (o) 05 10 15
FIG 14B COMPRESSION RESPONSE OF plusmn300 AVCO 550556 MIL DIA BORON-EPOXY LAMINATES (BATCH E1)
40
0
CLcuoscoupons
E 0 v
30shy
230 ---shy
thick thick -S- -- - tin
20- tube2 k- -shyc
1 e thick
(noul Xe (no ult)
10- (t A
0 04 ey SA)x (15FIG 15 COMPRESSION RESPONSE OF plusmn450 AVCO 550556 MIL DIA BORON-EPOXY LAMINATES
_ _ _ _ _
40
tubes nom thick V
tubes nom thick
c-oupons v (no ult obt) v n
(no ult30- A obt) VA coupons
0
~hck tubes tthick2tbs8 ZE AA
00 In AA_
vA 0 b 0 A 0
A 00 0
0 10 AA
OI I I -5 -4 -3 -2 1 ( y 2
FPAxI E y ()MFIG 16 COMPRESSION RE-SPON$EOFi60 AVCO -550556 MIL DIA BORON-EPOXY LAMINATES-
40
(64 ksi) (64)
30
oV CO
coupons
0A 0
AA A coupons
0-A 5
20
0
0 00
10shy
00
V
-25 -20 -15 -10 -05 0 05eF (0) Ey (CI)05FIG 17 COMPRESSION RESPONSE-OF +-750AVCO 5505156 MIL DIA BORON-EPOXY LAMINATES
40 -
C
En Ult 3 0 L
0 deg 3 0 - cou on coupons u
830
tubes nom 20 V thick
tubes nom thick V
-tubes tthicdk
thick 10shy
-16 -14 -12 -10 -08 -06 -04 -2 0 2 ei () ey (0)
FIG 18 COMPRESSION RESPONSE OF 906 AVCO 550556 MIL DIA BORON EPOXY LAMINATES
2-250 upons coupons
CL tubes nom thick tubesno]
ktubes t tubes t
0 thick thickS 150- O
0
wA
201 thck
50
-14 -12 -10 -08 -06 -04 -02 0 02 ex (0f) ey (l)
FIG 19 COMPRESSION RESPONSE OF 0900 AVCO 550556 MIL DIA BORON-EPOXY LAMINATES
200
2 0
E coupons
150 tubbs nom tubes thick nom
thick
100
tubes t tubes thick tthick
50shy
- I
0-15 -10 -05 05Lx () 00 y (l) 0
FIG 20 COMPRESSION RESPONSE OF 0145900 AVCO 5505156 MIL DIA BORON-EPOXY LAMINATES
IxJu
uniform compression
L u=-8 I I I I I
I Ib
I 1IIAP II ICPSIx I I
I I
I- b
FIG APB 1 COUPON UNDER UNIFORM COMPRESSION
AR AR (SNAP) t xy
0 POISSON RATIO -xy
2 10lj
ISOTROPIC 0 PANEL
I bullI 00
0 05
0 10 20 30 40 50 60 70 80 90 t a (degrees)
FIG APB 2 MIN AR FOR 6BESTSTRESS DISTRIBUTION ALONG THE CENTER LINE OF THE COUPON

21
the present comparison studies for the angle-ply laminates that
in spite of this the predicted response with these codes do not
favor the responses experienced by the coupons better than the
ones observed for the tubes For some laminate configurations
better correlation is observed with the responses yielded by
the tubes
(c) Present numerical studies indicate that no unique compression
responses were predicted by the various analyses employed in
the present comparison studies for the large variety of laminate
configurations invesrigated For some laminate configurations
considerably different responses were predicted for the same
laminate by the various analyses
(d) The analyses were found to be inadequate to predict the ultimate
stresses of the angle-ply laminates The built-in failure
mechanisms in the analytical models were not verified by the
test results because of very poor correlation between the calculated
strength values and those observed experimentally
(e) The very good correlation of the predicted moduli with the
empirical onesand the pronounced disagreement among the predicted
ultimate stresses nibther verifies nor contradicts the influence
of the edge effects discussed in Appendix B In view of the
arguments in this Appendix and the lack of success of a sound
test program with the compression tubes of [11 coupons having
different dimensions than those employed in [1] should further
be tested to accomplish the objectives of the test program of
[1] and present comparison studies and evaluations
6
22
REFRENCES
1 T Weller tExperimental Studies of Graphite-Epoxy and Baron-Epoxy Angle Ply Laminates in Compression NASA CR 145233 Sep (1977)
2 R T Haftka and J H Starnes JR-- Application of an Interior Penalty Function for Structural Optimization -AIAA Paper 75-764 t1975)
3 SW Tsai - Strength Characteristics of Composite Materials - NASA CR-224 April (1965)
4 S W Tsai D F Adams and D R Doner - Analysis of Composite Structures - NASA CR-620 November (1966)
S P H Petit - Ultimate Strength of Laminated Composites -
Report FZM-4977 prepared for Advanced Filaments and Composites-Division Air Force Materials Laboratory Air Force System Command Wright - Patterson Air Force Base Ohio December (1967)
P H Petit and M B Waddoups -AMethod of Predicting the Nonlinear Behavior of Laminated Composites -J Composite Materials Vol 3 p 2 January (1969)shy
7 K 0 Chiu - Ultimate Strength of Laminated Composites -
J Composite Materials Vol 3 P 578 July (1969)
8 D L Reed - Point Stress Laminate Analysis - Report PZM-5494 prepared for Advanced Composite Division Air Force Materials Laboratory Air Force Systems Command Wright - Patterson Air Force Base Ohio April (1970) (Also T J Muha - Users Manual for the Laminate Point Stress Analysis Computer Program SQ5 as Revised by AFFDLFBC - AFPDL-TM-74-107-FBC July C1974))
9 H T Hahn -Nonlinear Behavior of Laminated Composites -
J Composite Materials Vol 7 P 257 April (1973)
10 R L Foye - Theoretical Post Yielding Behavior of Composite Laminates Part I Inelastic Micromechanics -J Composite Materials Vol 7 p 178 April (1973)
23
11 R L Foye - Theoretical Post Yielding Behavior of Composite Laminates Part II Inelastic Micromechanics J Composite Materials- Vol 7 P310 July (1973)
12 R S Sandahu-- Nonlinear Response of Unidirectional and Angle-Ply Laminates - AIAA Paper 74-380 April (1974)
13 Z Hashin D Bagchi and W B Rosen - Nonlinear Behavior of Composite Laminates - NASA CR-2313 April (1974)
14 T Weller - Experimental Studies ofGraphite-Epoxy and Boron-Expoxy Angle Ply Landnates-in Shear NASACR 145232 Sep (1977)
15 W D Whetstone - Structural Network Analysis Program -
Users Manual Static ANAlysis Version V70E LMSC-HREC D162812 December (1970)
24
APPENDIX A
It has been pointed out in the section on the Numerical studies
that the computer codes RDS15] and N0LIN[15] require the existence of
the unidirectional [00] and [90] laminae responses in tension
compression and shear for their application The images of these
data inputs or library data input are presented in Tables APA-1A and
APA-IB as being input into RDS code In addition to the data in these
Tables also required by N0LIN the information presented in Table
APA-2 has to be provided to operate the N0LIN code (Instead of feeding
N0LIN with the stress-strain data input for the responses one may
use the Ramberg-Osgood parameters as explained in [13] and avoid the
utilizing of curve fitting alegorithms to generate these parameters)
The mechanical properties given in Table APA-2 are also required
as data input by SQ5 code
It was mentioned in the section on Results and Discussion that
the data input for the matrix material of the AVCO 5505 Boron-Epoxy
laminates was taken from [10][l1] The mechanical properties are as
follows
Young Modulus of Matrix 510000 psi
Shear Modulus of Matrix 200000 psi
Poissons Ratio of Matrix 310
and the equivalent stressequivalent strain curve is reproduced from
these references SLI = 106ESI = 5000 SL2 = 5x10⁶ ES2 = 10000 SL3 = 19x106 ES3 = 15000
ES4 = 20000 SL4 = 1Oxl06
ESS = 25000 SL5 = 3230
ES6 = 30000 SL6 = 0
25
The Boron fiber properties are Provided by the manufacturer and
are as follows
Young Modulus of Fiber 58x106 psi
Shear Modulus of Fiber 2375x106 psi
Poissons Ratio of Fiber 200
Fiber Tension Ultimate 500 ksi
Fiber Compression Ultimate 750 ksi
26
APPENDIX B
Ithas been mentioned in [I] that edge effects might be induced
far away from the loaded boundcaries of the coupons resulting in an
unevenstress-strain distribution even for a-coupon loaded uniformally
This kind of behavior was experienced by all the angle ply laminates
of []
When the coupon is loaded in a manner described in Fig APB
allowing for a uniform axial displacement u=(-S) and completely
restraining the lateral displacement y = 0 along the loaded boundaries
plusmn12 it is anticipated that the coupon width or rather its aspect
ratio AR = 1 will have an appreciable influence on the stressshy
strain distribution of angle-ply laminates possessing high Poissons
ratios
Withthe prescribed boundary conditions the specimen might
experience an induced transverse stress approaching in the limit a
stress of
ay= Gx yx
A wide specimen will contain a wide zone of continuous fibers subject
to this high degree of lateral restraint Consequently this zone will
result in both higher stresses and stiffnesses than the regions close
to the free edges of the coupon where the filaments are noncontinuous
and hence shear the load from the termination of one diagonal fiber
into the begining ofan adjecant one through the matrix This of course
will result in an unknown uneven stress-strain field which renders wide
specimens unsuitable for application The stress is picking up towards
the center and hence ishigher than the average stress utilized to
present the response of such specimens On the other hand too narrow
specimens will be affected primarily and subject to the edge effect
which-will reduce both their strength and stiffness
A numerical study was carried out to determine the actual
lateral edge effect combined withPoissons ratio and to define the
best aspect ratio ie the minimum length of the coupon1 free
27
of lateral boundary influence at least along its center line transverse
to the direction of applied compression SNAP computer code [15] was
used for this purpose and the obtained results are presented in Fig
APB-2 The coupons of [1] have an aspect ratiq AR=75 which according
to Fig APB-2 is too short to eliminate the lateral boundary influence
The above discussion calls for a different type of specimen
Indeed tubes were also tested and reported in [1] A tube is free
of the free edge region but on the -other hand is susceptible to
another deficiency if the radial displacementsat the loaded boundaries
are prevented from expanding to allow for Poissons expansion high
bending stresses develop at the restrained boundaries These stresses
might precipitate early local failure at the specimen edges or might
be superimposed on the compressive stresses in case the tube is too
short again bringing about failure at a stress lower than the ultimate
one corresponding to the tested laminate
TABLE 1A Compression Response - Comparison of Experimental Ultimate Stresses and Moduli With Analytical Predictions of RDS[S]
SQs[S1 N0NLIN[101amp[11] and N0LIN[13]
GRAPHITE-EPOXY LAMINATES -3m SP-286T3
EST RESULTS OF [1] ANAL RDS [5 ANAL SQS [8) ANAL NPNLIN ANAL N0LIN [13]
Laminate
Configuratlon
ompressionCoupons
Ult Comp Cop Mo Stress __(si) x1Opsi)
Compression TubesU
Mo M esod
Thick Thick 6 ks(ksi) ksi x O si)
Ultimate
CoSteStress
(ksi) 6
xlO si
Ultiate
(ks ) 6ai ps
Ultimate
Co Stress ksi ops )
015 Com stress (kst
Max Max quad Stress Strain InteracIl Fal Faill
Ex
(x O psi)
[00]
164 191 115 664 510
200 1609 20911 1607 8011
20911 180 1607
[plusmn15 ] 117
1394 105 826
1842 [14251
105 1324 --
11722 -
1324 14022 10622 929 1324
[plusmn30] 548
5911 374
687 292
357 283
246
286 224
811 [655]
400 1
575 48722 576 43412 37622 288 575
[plusmn453 382
227 289 234
312 [251]
313 (60)1
203 25122 204 16212 19712 175 204
[plusmn601 3547 172
222 163 251 238 158 30812 161 19512 22312 233 161
[plusmn731 312
360
191
5376321 194
214
221 14
150
[1793
175
[120]
375 175 48922 181 32522 32522 298 181
330
344 [191
155
241
102
180 132
1101-3 350 184 47822 191 32022 33222 320 191o
111 115115898
879 294
493382 287
42229 835[7791
110 1
899 11511 883 96211 11211 107 883
[0__48deg 97 _674 76[979476 359 71571 as 642 82111 632 6871 79 211 648 632
2Corrected for measured thickness
A11 Failure in compressionor tension in laina 11 direction A2 F1
1-(inch) n2540x1 2 meter
I pound fo ce - 4448222 Newton (N)kip = 10 poundtrce
b)
)+ Ulitimate stress values corresponding to very high unreasonable strain values upper number - last stress value which corresponds to an acceptable strain value
TABLE 1B Compression Response - Comparison of Experimental Ultimate Stresses and Moduli With Analytical Predictions of DS[5]
SQs[8] N0NLIN[10]G(li] and N0LIN[I3]-
TEST BORON-EPOXY LAMINATES (AVCO 550556 MIL DIA)
SANALRESULTS OF ANAL RDS (5] ANAL SQ5 -
(8] NLINAL0NL N AANLN[3ANAL N0LIN [13]
Laminate
Configuratio
Compression Copons
lt EStressCmpComp Mod
Compression Tubes
UltCom Stres m MeasuredThick x
Ultimate
CompStress
Ex
Ultimate
CompStress
Ex
Ultimate
ConyStress
Ex
Comp Stress (ksi)Ult
x Stress Strain Interac
Bx
(ksi) (xIO 6psi) (ksi) tksi) (xl06psi) (ksi) (xLOp$i) (ksz) (x06psi) (ksi) (xlO psi) si__ (xlO6psi)
10] 263
342 3127 - - 3340 3128 35311 3127 3120 54011 35311 340 3127
[1300]
( 45]
135 2365
139
947 5551095 O9
961 S89
337
253 351 308
838
918 290 3 300
255
280 331
576
680 206
2T4
194
204 234I
3749 [2685]
1111 [800]
323 [239]
150 2527
425 - 923 (NoULTOBT)OET
135 246 (NOULTOBT)
13322
4422
350612
2526
923
246
2496
887
257
32122
11212
10422
24622
11SIZ
246
115
2526
923
246
[plusmn601l 318 333
162 387 274
264 199
397 (272]
300 (NOULTOBT
221 50022 221 184 17312 18012 205 2 21
[plusmn7S) 348
279 2 311
19360 214 (64)+
276 44622 276 197 31922 26422 285 276
[90deg]
(090]
298
517 179
1
298
177
178
2171 206
126
143 1 8
339 [232] 2534
340
(38)+
190
299
11
1721
44722
194 111
298
1715
220
205
1667
32022
17611
34122
18411
320
21
298
1715 t
230 233 157 [1773] k
[0iplusmn4rso] 146
158 1147
137
147
881
874 1665
_110201 130 1192 13411 1187 141 1162 12111 12511
1 113
1 1 1187
1 q 1
Fiber failure in D degree layer
Calculations exceeded maximum observed experimental strain values
Solution does not converge
[ 3 Corrected for Measured thickness Ail Failure in compressionor tension
in lamina 11 directionIi
-2II (inch) = 2540x10 2 meter Tmi) I pound fojee = 4448222 Newton(N)
psz = 69477x10ound f rPascal (Pa)
)+Ultimate stress values corresponding to very high unreasonable strain values- upper number shy last stress value which corresponds to an acceptable strainvalue
A22 Failure in compressionor tension
A12 Failure in shear
I ksi i 105 psi
LIBRARY DATA FOR MATERIAL 2 - - SMSP2B6T-3(A-S)LEA1FA INPUT
SIGTO EPSTO SIGT9O EPSTS0O SIGCO EPSCO SIGC90 YPSCc9o
013500E 05 080000E-0 09O0000E 03 06000E-03 022500F 05 014000E-02 O46000E 04 025000E-b2 026500E 05 0O16000E-02 018000E 04 012000E-02 045000E 05 028000E-02 090006t 04 0500Q0E-02 O405hOE 05 O24OOOE-02 -026700E 04 018000E-02 067500E 05 02000E-02 013250E Oi 075000E-2 054500E 05 03200t-02 Q4860E 04 024000E-02 087200E 05 056000E-02 016800E 05 OlOOOE-01 069000E 05 00000E-02 042700E 04 q30000t-02 010670E 06 070000E-02 020500E 05 012500E-01
048 0 0 0E- 0 50 8 0 0E 04O3500E 05 0 2 036 000 E-02 012560E 06 O840OE-02 02375OE 05 015000F-01 097500E 05 056000E-02 058300E 04 O042000E-02 O14OE 06 098000E-02 026600E 05 ot17500E-Q1 011150E 06 064OOE-02 066200E 04 048000E-02 016250E 06 011200E-01 029100E 05 020000E-01 012559E 06 072000E-02 073600E 04 0540O0E-02 017900E 06 012600E01 031400E 05 p22500E-O1 013950E 06 08000E-02 081000E 04 060000E 02 019400E 06 01400OE-01 033500c 05 0250nOE-01 00 08BOOOE-02 00 amp66000E-02 00 0154600E-01 00 027500E-01 00 096000E-02 00 072000 E-02 00 016800E-01 00 03000AE-01
SIG45 EPS45 TbU12 CNL12 1 TNU21 CNU21
012540E 0 022000E-02 031400E 00 024000E 00 027911E-01 027477E-01 025080C 04 044000E-02 031600E 00 026000E 00 029169E-01 028073E-01 037620E 014 066000E-02 031800E 00 027500E 00 026349E-01 029089E-01 O5IOO1 E 04 0880OOE-02 0319nOE 00 028000E 00 024609E-01 028256E-01 058500 04 0i1000E-01 032000E 00 030000E 00 023246E-01 031877r-01 064000E 04 01300E-01 032000E00 031500E 00 023835E-01 030333E-01 069600E 04 015400Fr01 032000 00 03250OE 00 02857E-01 027590E-01 074000E 04 017600E-01 032000E 00 033000E 00 024076E-01 025525E-01 077500E 04 01VSOOE-01 032000E O0 033500 E 00 022552E-01 P26150E-01 080500E 04 022000E-01 031900E 00 034000E 00 022482E-01 026656E-01 00 024200E-01 0 00 00 0i0 00 026400E-01 00 00 00 00
TABLE ApA B- INPUT LIBRARY DATA FOR MATERIAL -1 - - AVCO 550556
SIGTO EPSTO SIGT9O EPST9O SIGCO EPSCO STGCSO CpSc90
021700E 05 043400E 05 065100E 05 086800E 05 010850E 06 0130206 06 015190r 06 017360E 06 Olq530E 06 021700F 06 00 00
070000E-03 0o4OOOE-02 O210OOE-02 028000E-02 035000E-02 042000E-02 049000t-02 056000E-02 0630OE602 070006E-02 077000E-02 084000E-02
011500 04 023000E 04 033500E 04 043400E 04 052700E 04 0610OE 04 070600E 04 078500E 04 084500E 04 089000E 04 00 00
04000E-03 080000E-03 012000Er02 016000E-02 020r00E-02 024000E-02 028000E-02 032000E-02 036000E-02 040000E-02 044000E-02 048000E-02
031270E 05 062540E 05 093810E 05 012508F 06 015635E 06 018762E 06 022100E 06 025400E 06 028800E 06 03l000E 06 00 00
010OOE-02 920000E-02 030000E-02 040000E-02 050000E-02 0600OOE-02 070000E-02 080000E-02 090000E-02 016000-01 011000E-01 012000E-01
044800E 04 069500E 04 013150E 05 016800E 05 020200E 05 023100E 05 025750E 05 028000E 05 031000E P9 031700E 05 00 00
015000E-02 - 030000E-02 045000E-02 96000E-02 075000E-02 090000E-02 010500E-01 0120006 1 013500E-01 0150OOE-01 0165O6E-01 oaeooor-Oi
SIG45 EPS45 TNU12 CNL12 TNU21 CNU21
0BgPE 04 033200E 04 042500E 04 0116500E 04 048500E O 050500E 04 052200E 04 053500E 04 055000E 04 O596000E 04 00 00
02700E-02 054000E-02 081000E-02 0108OOE-01 013500E-01 016200E-01 018900E-0 02tOOE-01 024300E-01 027000E-01 029790E-01 032400E-01
022700E 00 022700E 00 022700E 00 022400E 00 022400E 00 022400E 00 0224006 00 023000E 00 023300E 00 022700E 00 00 00
02640nE 00 026600E 00 026800E 00 026800E 00 027000E 00 02720 0 E 00 027500E 00 028000E 00 029000E 00 032000E 00 00 00
021052E-01 021052E-01 019222E-01 017884E-01 016800E-01 016439E-01 158976-01 014653E-01 011274E-01 0823806-02 00 00
025215E-01 025350E-b1 023997E-01 020855E-01 019572E-01 016817E-01 014555E-01 0i2727E-01 017059E-01 028118 -02 00 00
00 -
32 ou~IGV AGT32~ jO Q1JA1ATY
TABLE APA-2 Unidirectional Lamina Properties Utilized In The Predictions Of SQS9] and N0LIN[14]
3M SP-286T3 AVCO 550556 Mil GRAPHITE-EPOXY BORON-EPOXY
(Ell)Tension 1687x106 psi 3100xlO6 psi
(E11)Coinpression 1607x106 psi 3127x1O6 psi
(E22)Tension 152x106 psi 288x106 psi
(E22)Compression 191x106 psi 298x106 psi
GO2 057x106 psi 066x106 psi
(aULTll)Tension 140 ksi 220 ksi
(eULTllTension 008 007
(cULTll)Compression 180 ksi 340 ksi
(eULTll)Compression 013 0113
(t ULT22)Tension 8 ksi 89 ksi
(ULT 22)Tension 006 00405
(aULT22)Compression 32 ksi 32 ksi
(EULT22)Compression 025 015
((ULT12) 81 ksi 56 ksi
(CULT12) 022 0275
(v12)Compression 230 267
(v12)Tension 298 216
-1 (inch) = 2540x10 2 meter Cm)
1 pound force = 4448222 Newton (N)
I kip = 103 pound force
I psi = 6894757x105 Pascal (Pa)
I ksi = 103 psi
A test results [1] (coupons)0 analysis (8] amp 131
I00
w CL
10
-0
5
66
0 I I I I I I Cgt t C00o
01 +1 +1 +shy
g LAMINATE CONFIGURATION
FIG 1A YOUNGS MODULUS OF 3M SP-286T3 GRAPHITE EPOXY LAMINATES ASAFUNCTION OF LAMINATE CONFIGURATION
30 7A test results [i](coupons)0 analysis [81 amp [131 v [10] ampIll]
C o
w 20
109
0I III I I I + +1 +1 +1 +1
LAMINATE CONFIGURATION 0
FIG 1B YOUNGS MODULUS OFACO 5505(56MIL DIA BORON-EPOXY LAMINATES AS AFUNCTION OF LAMINATE CONFIGURATION
200t 200 3 0 mxx stress falla test results [1) (coupons) analysis NOLIN 03] V max strain fail
0 analysis RD 5 [5] r[ quadr interaction 0 analysis SQ5 [8] fail
150 150
0x(0
a
0~ARA 0
100- V13 100- 0
A A
A
50- 0 0 0 50shy000 v A A
0 A 13 V 0 0
0 in 0 10 0 O 0 to CD +1~j4 3 + +1 owi +1 +1 +1 4
LAMINATE CONFIGURATION LAMINATE CONFIGURATION
FIG 2A ULTIMATE STRESS OF 3M SP 286T3 GRAPHITE EPOXY LAMINATES AS AFUNCTION OF LAMINATE CONFIGURAiON
A tests results [1] (coupons) 0 maxstressfail 0 analysis RD5 [5] analysis NLIN [13] v max strain fail
300 0 analysis SQ5 [8] 300 0 quadr interaction fail
200
00
-A
200 -3
A
100 00
A A0 100 A
09 0A
o
0 LO lcent
O O -t to
TL +1 + 1 +1 1 LAMINATE CONFIGURATION
FIG 2B ULTIMATE STRESS OFAVCO LAMINATE CONFIGURATION
0 C gt 1LO L O C La mmO) rt
+ 1 + 1 + 1 + 1 4 LAMINATE CONFIGURATION
550556 MIL DIA BORON-EPOXY LAMINATES AS A FUNCTIONOF
200 -+ A
o 0
A
o 0~
ab A
0 Aa AA
0shy 0500shy
15-15 - 0 0l FIG Z
-0
OMPESIONRESONEO 003MSP-66T GAPHTE-POY LMINTA
AxC)0o00A
001 A0e
_150
0
0 00
0
coupons 0
00 0
u coupons
100 tubes nom
thick A
0
ubes horn thick
tubes t thickK 077 tubes tthick
50 -
-15 -10 -05 0 05 10Ex (4) 6 (0)FIG 4 COMPRESSION RESPONSE OF plusmn15 deg 3M SP-286T3 GRAPHITE-EPOXY LAMINATES
75
0C
E 50
coupons coupon 00
a 00 tubes noa oo
tubes tubes fern
0A
tubes t~ 4 tubes tthick 25 thick - shy
cento 4 AOa
0-10 -05 Ex (0) 0 y 05 10 15
FIG 5 COMPRESSION RESPONSE OF -30 3M SP-286T3 GRAPHITE-EPOXY LAMINATES
40
30-S
tubes hnmhick tubes nom
tik
a
20--
a-P III
-5 -3
FI30OMRESONtubes
-4
tubes tthick
2co1upo1s
FLJ-5 3 M28Thick
IF- PO
tues fain thIkEshy
tubes trthick
(60)
10G COPESONRSOSE-5 3MS-8t-RPIEEOY AIAE
40
couponstubes nor
copn thick
nomn btubes thick th
30CL
U
1shy
o
S-4 -3 -2 -ex (0) 0 y 2
degFIG 7 COMPRESSION RESPONSE OF +-60 3M SP-286T3 GRAPHITE-EPOXY LAMINATES
40
CL E 0 U
30
U) coupons
A
A
coupons
A
20-
0
tubes nom thick
0
tubes nom thick
-
tubes t thick
tubes t thick
10shy
-3 -2 -1 Ex() Cy (1)
FIG8 COMPRESSION RESPONSE OF plusmn750 3M SP-286T3 GRAPHITEEPOXY LAMINATES
-4 0
35 +
CL o0
Di couon coupons
S25
bull--
20shy
--
tubes nom thick
tubes nom thick
t
15-tubes
thick t
tubes tthickN N
10 -N
NN
0n -25 -20 -15 -10 ex -05 0 ey 05
FIG 9 COMPRESSION RESPONSE OF 906 3M SP-286T3 GRAPHITE-EPOXY LAMINATES
120
100- A
2 coupons
E080 A 2 0
60shy
thick tubes nom hidk
40shy
tubes t 20- tubes tthick - thick
0shy-16 44 -12 -10 -08 -06 -04 -02 0 02
FIG 10 COMPRESSION RESPONSE OF 0900 3M SP-286T3 GRAPHITE-EPOXY LAMINATES y
100
oo coupons
ns coupons
0
UIi75 - -
50- C
tubes nom tubes nor thick thick
25 tubes tthick Kc_ tubes tthick
-20
FIG11
-15
COMPRESSION -1o
RESPONSE OF 0145900
-05 0 05 e1 (C) OE y (0)3M SP-286T3 GRAPHITE-EPOXY LAMINATES
10
400
(0
6 coupons coupons 200- shy
100 shy
-12 -10 -08 -06 -04 Q02 0 0Q2 ey 04 FIG 1V COMPRESSION RESPONSE OF 00 AVCO 5505156 MIL DIA BORO-EPOXY LAMINATES
150- +-- V
o
U)
In
_
A coupons
100 tubes florn
E
nom
tthick
tubes tthick-- t
copos7L A
V(10
-otubesnomathick ov
tubes tik IV deg tub es t t h ic k o
50 0
10
001
I
FIG 13
-05 0Eri)
COMPRESSION RESPONSE
A H I
05ey (0)
OF t 150 AVCO 5505 BORON-EPOXY
10
LAMINATES
15
75
0v VU)InI v v 03pn coupons
degu v
- 50v V
(no ultobt) A (no ultobt)amp
25- 0
tubes nom thick 04 tubes nom thick
tubes tthick0 tubes tthick
- Q5 0 05 10 15Ex (sect) Ey (dego)
FIG 14A COMPRESSION RESPONSE OF plusmn300 AVCO 550556 MIL DIA BORON-EPOXY LAMINATES (BATCH 1)
20
100
0
0
U
75
(no V V V
V50 -- V V -o uponsV (outat)v (no ultobt)
nora tubes 47
VAnom 0V thick AV
25tubes noma th
tubest~thikK~iVx tubes tthick
5 -D -05 E M0 (o) 05 10 15
FIG 14B COMPRESSION RESPONSE OF plusmn300 AVCO 550556 MIL DIA BORON-EPOXY LAMINATES (BATCH E1)
40
0
CLcuoscoupons
E 0 v
30shy
230 ---shy
thick thick -S- -- - tin
20- tube2 k- -shyc
1 e thick
(noul Xe (no ult)
10- (t A
0 04 ey SA)x (15FIG 15 COMPRESSION RESPONSE OF plusmn450 AVCO 550556 MIL DIA BORON-EPOXY LAMINATES
_ _ _ _ _
40
tubes nom thick V
tubes nom thick
c-oupons v (no ult obt) v n
(no ult30- A obt) VA coupons
0
~hck tubes tthick2tbs8 ZE AA
00 In AA_
vA 0 b 0 A 0
A 00 0
0 10 AA
OI I I -5 -4 -3 -2 1 ( y 2
FPAxI E y ()MFIG 16 COMPRESSION RE-SPON$EOFi60 AVCO -550556 MIL DIA BORON-EPOXY LAMINATES-
40
(64 ksi) (64)
30
oV CO
coupons
0A 0
AA A coupons
0-A 5
20
0
0 00
10shy
00
V
-25 -20 -15 -10 -05 0 05eF (0) Ey (CI)05FIG 17 COMPRESSION RESPONSE-OF +-750AVCO 5505156 MIL DIA BORON-EPOXY LAMINATES
40 -
C
En Ult 3 0 L
0 deg 3 0 - cou on coupons u
830
tubes nom 20 V thick
tubes nom thick V
-tubes tthicdk
thick 10shy
-16 -14 -12 -10 -08 -06 -04 -2 0 2 ei () ey (0)
FIG 18 COMPRESSION RESPONSE OF 906 AVCO 550556 MIL DIA BORON EPOXY LAMINATES
2-250 upons coupons
CL tubes nom thick tubesno]
ktubes t tubes t
0 thick thickS 150- O
0
wA
201 thck
50
-14 -12 -10 -08 -06 -04 -02 0 02 ex (0f) ey (l)
FIG 19 COMPRESSION RESPONSE OF 0900 AVCO 550556 MIL DIA BORON-EPOXY LAMINATES
200
2 0
E coupons
150 tubbs nom tubes thick nom
thick
100
tubes t tubes thick tthick
50shy
- I
0-15 -10 -05 05Lx () 00 y (l) 0
FIG 20 COMPRESSION RESPONSE OF 0145900 AVCO 5505156 MIL DIA BORON-EPOXY LAMINATES
IxJu
uniform compression
L u=-8 I I I I I
I Ib
I 1IIAP II ICPSIx I I
I I
I- b
FIG APB 1 COUPON UNDER UNIFORM COMPRESSION
AR AR (SNAP) t xy
0 POISSON RATIO -xy
2 10lj
ISOTROPIC 0 PANEL
I bullI 00
0 05
0 10 20 30 40 50 60 70 80 90 t a (degrees)
FIG APB 2 MIN AR FOR 6BESTSTRESS DISTRIBUTION ALONG THE CENTER LINE OF THE COUPON
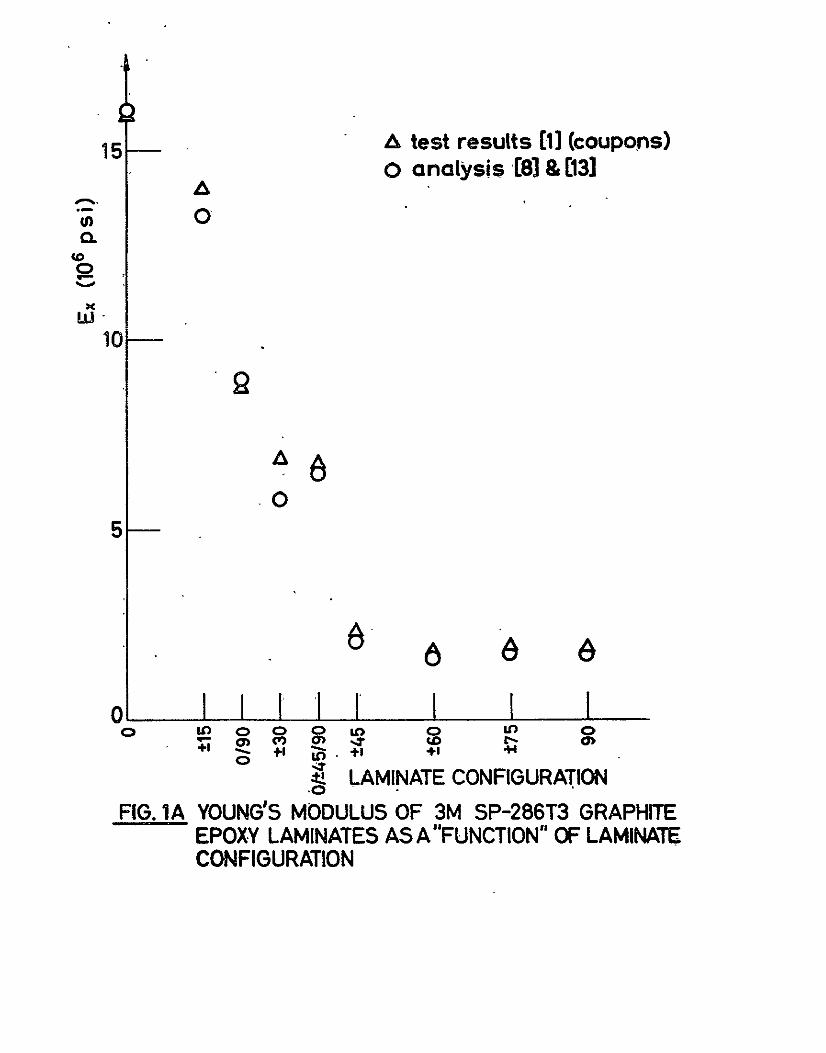
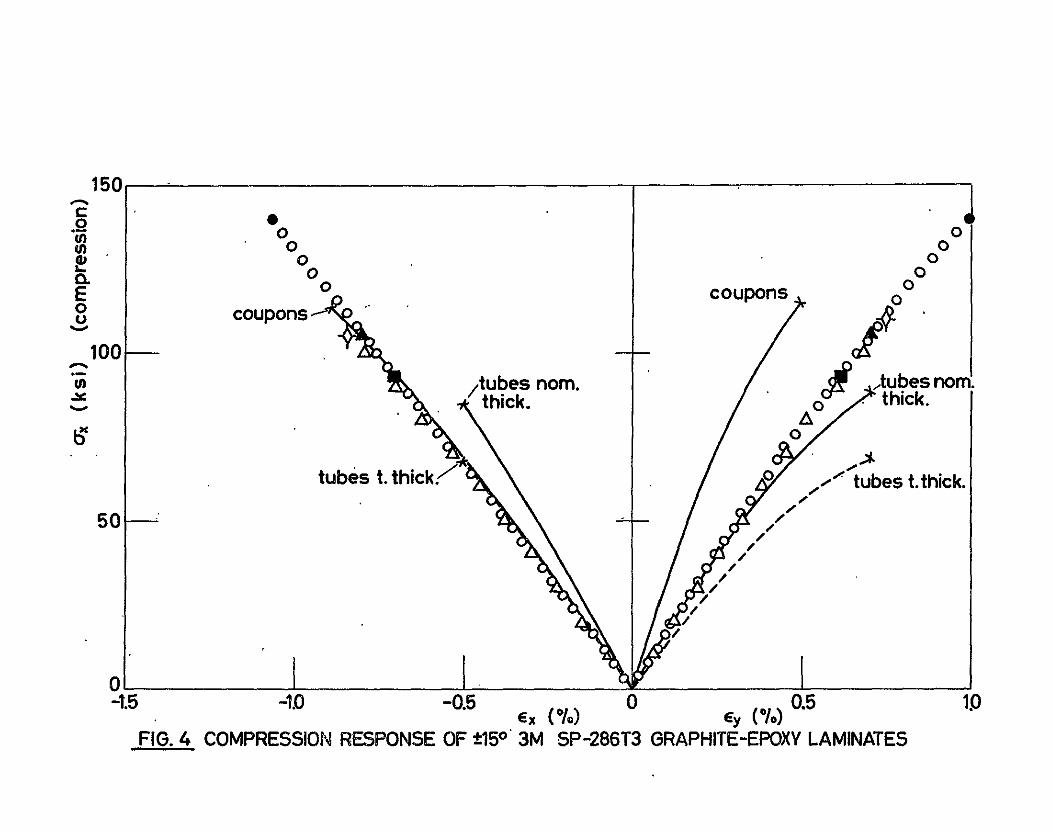

75
0C
E 50
coupons coupon 00
a 00 tubes noa oo
tubes tubes fern
0A
tubes t~ 4 tubes tthick 25 thick - shy
cento 4 AOa
0-10 -05 Ex (0) 0 y 05 10 15
FIG 5 COMPRESSION RESPONSE OF -30 3M SP-286T3 GRAPHITE-EPOXY LAMINATES
40
30-S
tubes hnmhick tubes nom
tik
a
20--
a-P III
-5 -3
FI30OMRESONtubes
-4
tubes tthick
2co1upo1s
FLJ-5 3 M28Thick
IF- PO
tues fain thIkEshy
tubes trthick
(60)
10G COPESONRSOSE-5 3MS-8t-RPIEEOY AIAE
40
couponstubes nor
copn thick
nomn btubes thick th
30CL
U
1shy
o
S-4 -3 -2 -ex (0) 0 y 2
degFIG 7 COMPRESSION RESPONSE OF +-60 3M SP-286T3 GRAPHITE-EPOXY LAMINATES
40
CL E 0 U
30
U) coupons
A
A
coupons
A
20-
0
tubes nom thick
0
tubes nom thick
-
tubes t thick
tubes t thick
10shy
-3 -2 -1 Ex() Cy (1)
FIG8 COMPRESSION RESPONSE OF plusmn750 3M SP-286T3 GRAPHITEEPOXY LAMINATES
-4 0
35 +
CL o0
Di couon coupons
S25
bull--
20shy
--
tubes nom thick
tubes nom thick
t
15-tubes
thick t
tubes tthickN N
10 -N
NN
0n -25 -20 -15 -10 ex -05 0 ey 05
FIG 9 COMPRESSION RESPONSE OF 906 3M SP-286T3 GRAPHITE-EPOXY LAMINATES
120
100- A
2 coupons
E080 A 2 0
60shy
thick tubes nom hidk
40shy
tubes t 20- tubes tthick - thick
0shy-16 44 -12 -10 -08 -06 -04 -02 0 02
FIG 10 COMPRESSION RESPONSE OF 0900 3M SP-286T3 GRAPHITE-EPOXY LAMINATES y
100
oo coupons
ns coupons
0
UIi75 - -
50- C
tubes nom tubes nor thick thick
25 tubes tthick Kc_ tubes tthick
-20
FIG11
-15
COMPRESSION -1o
RESPONSE OF 0145900
-05 0 05 e1 (C) OE y (0)3M SP-286T3 GRAPHITE-EPOXY LAMINATES
10
400
(0
6 coupons coupons 200- shy
100 shy
-12 -10 -08 -06 -04 Q02 0 0Q2 ey 04 FIG 1V COMPRESSION RESPONSE OF 00 AVCO 5505156 MIL DIA BORO-EPOXY LAMINATES
150- +-- V
o
U)
In
_
A coupons
100 tubes florn
E
nom
tthick
tubes tthick-- t
copos7L A
V(10
-otubesnomathick ov
tubes tik IV deg tub es t t h ic k o
50 0
10
001
I
FIG 13
-05 0Eri)
COMPRESSION RESPONSE
A H I
05ey (0)
OF t 150 AVCO 5505 BORON-EPOXY
10
LAMINATES
15
75
0v VU)InI v v 03pn coupons
degu v
- 50v V
(no ultobt) A (no ultobt)amp
25- 0
tubes nom thick 04 tubes nom thick
tubes tthick0 tubes tthick
- Q5 0 05 10 15Ex (sect) Ey (dego)
FIG 14A COMPRESSION RESPONSE OF plusmn300 AVCO 550556 MIL DIA BORON-EPOXY LAMINATES (BATCH 1)
20
100
0
0
U
75
(no V V V
V50 -- V V -o uponsV (outat)v (no ultobt)
nora tubes 47
VAnom 0V thick AV
25tubes noma th
tubest~thikK~iVx tubes tthick
5 -D -05 E M0 (o) 05 10 15
FIG 14B COMPRESSION RESPONSE OF plusmn300 AVCO 550556 MIL DIA BORON-EPOXY LAMINATES (BATCH E1)
40
0
CLcuoscoupons
E 0 v
30shy
230 ---shy
thick thick -S- -- - tin
20- tube2 k- -shyc
1 e thick
(noul Xe (no ult)
10- (t A
0 04 ey SA)x (15FIG 15 COMPRESSION RESPONSE OF plusmn450 AVCO 550556 MIL DIA BORON-EPOXY LAMINATES
_ _ _ _ _
40
tubes nom thick V
tubes nom thick
c-oupons v (no ult obt) v n
(no ult30- A obt) VA coupons
0
~hck tubes tthick2tbs8 ZE AA
00 In AA_
vA 0 b 0 A 0
A 00 0
0 10 AA
OI I I -5 -4 -3 -2 1 ( y 2
FPAxI E y ()MFIG 16 COMPRESSION RE-SPON$EOFi60 AVCO -550556 MIL DIA BORON-EPOXY LAMINATES-
40
(64 ksi) (64)
30
oV CO
coupons
0A 0
AA A coupons
0-A 5
20
0
0 00
10shy
00
V
-25 -20 -15 -10 -05 0 05eF (0) Ey (CI)05FIG 17 COMPRESSION RESPONSE-OF +-750AVCO 5505156 MIL DIA BORON-EPOXY LAMINATES
40 -
C
En Ult 3 0 L
0 deg 3 0 - cou on coupons u
830
tubes nom 20 V thick
tubes nom thick V
-tubes tthicdk
thick 10shy
-16 -14 -12 -10 -08 -06 -04 -2 0 2 ei () ey (0)
FIG 18 COMPRESSION RESPONSE OF 906 AVCO 550556 MIL DIA BORON EPOXY LAMINATES
2-250 upons coupons
CL tubes nom thick tubesno]
ktubes t tubes t
0 thick thickS 150- O
0
wA
201 thck
50
-14 -12 -10 -08 -06 -04 -02 0 02 ex (0f) ey (l)
FIG 19 COMPRESSION RESPONSE OF 0900 AVCO 550556 MIL DIA BORON-EPOXY LAMINATES
200
2 0
E coupons
150 tubbs nom tubes thick nom
thick
100
tubes t tubes thick tthick
50shy
- I
0-15 -10 -05 05Lx () 00 y (l) 0
FIG 20 COMPRESSION RESPONSE OF 0145900 AVCO 5505156 MIL DIA BORON-EPOXY LAMINATES
IxJu
uniform compression
L u=-8 I I I I I
I Ib
I 1IIAP II ICPSIx I I
I I
I- b
FIG APB 1 COUPON UNDER UNIFORM COMPRESSION
AR AR (SNAP) t xy
0 POISSON RATIO -xy
2 10lj
ISOTROPIC 0 PANEL
I bullI 00
0 05
0 10 20 30 40 50 60 70 80 90 t a (degrees)
FIG APB 2 MIN AR FOR 6BESTSTRESS DISTRIBUTION ALONG THE CENTER LINE OF THE COUPON

40
couponstubes nor
copn thick
nomn btubes thick th
30CL
U
1shy
o
S-4 -3 -2 -ex (0) 0 y 2
degFIG 7 COMPRESSION RESPONSE OF +-60 3M SP-286T3 GRAPHITE-EPOXY LAMINATES
40
CL E 0 U
30
U) coupons
A
A
coupons
A
20-
0
tubes nom thick
0
tubes nom thick
-
tubes t thick
tubes t thick
10shy
-3 -2 -1 Ex() Cy (1)
FIG8 COMPRESSION RESPONSE OF plusmn750 3M SP-286T3 GRAPHITEEPOXY LAMINATES
-4 0
35 +
CL o0
Di couon coupons
S25
bull--
20shy
--
tubes nom thick
tubes nom thick
t
15-tubes
thick t
tubes tthickN N
10 -N
NN
0n -25 -20 -15 -10 ex -05 0 ey 05
FIG 9 COMPRESSION RESPONSE OF 906 3M SP-286T3 GRAPHITE-EPOXY LAMINATES
120
100- A
2 coupons
E080 A 2 0
60shy
thick tubes nom hidk
40shy
tubes t 20- tubes tthick - thick
0shy-16 44 -12 -10 -08 -06 -04 -02 0 02
FIG 10 COMPRESSION RESPONSE OF 0900 3M SP-286T3 GRAPHITE-EPOXY LAMINATES y
100
oo coupons
ns coupons
0
UIi75 - -
50- C
tubes nom tubes nor thick thick
25 tubes tthick Kc_ tubes tthick
-20
FIG11
-15
COMPRESSION -1o
RESPONSE OF 0145900
-05 0 05 e1 (C) OE y (0)3M SP-286T3 GRAPHITE-EPOXY LAMINATES
10
400
(0
6 coupons coupons 200- shy
100 shy
-12 -10 -08 -06 -04 Q02 0 0Q2 ey 04 FIG 1V COMPRESSION RESPONSE OF 00 AVCO 5505156 MIL DIA BORO-EPOXY LAMINATES
150- +-- V
o
U)
In
_
A coupons
100 tubes florn
E
nom
tthick
tubes tthick-- t
copos7L A
V(10
-otubesnomathick ov
tubes tik IV deg tub es t t h ic k o
50 0
10
001
I
FIG 13
-05 0Eri)
COMPRESSION RESPONSE
A H I
05ey (0)
OF t 150 AVCO 5505 BORON-EPOXY
10
LAMINATES
15
75
0v VU)InI v v 03pn coupons
degu v
- 50v V
(no ultobt) A (no ultobt)amp
25- 0
tubes nom thick 04 tubes nom thick
tubes tthick0 tubes tthick
- Q5 0 05 10 15Ex (sect) Ey (dego)
FIG 14A COMPRESSION RESPONSE OF plusmn300 AVCO 550556 MIL DIA BORON-EPOXY LAMINATES (BATCH 1)
20
100
0
0
U
75
(no V V V
V50 -- V V -o uponsV (outat)v (no ultobt)
nora tubes 47
VAnom 0V thick AV
25tubes noma th
tubest~thikK~iVx tubes tthick
5 -D -05 E M0 (o) 05 10 15
FIG 14B COMPRESSION RESPONSE OF plusmn300 AVCO 550556 MIL DIA BORON-EPOXY LAMINATES (BATCH E1)
40
0
CLcuoscoupons
E 0 v
30shy
230 ---shy
thick thick -S- -- - tin
20- tube2 k- -shyc
1 e thick
(noul Xe (no ult)
10- (t A
0 04 ey SA)x (15FIG 15 COMPRESSION RESPONSE OF plusmn450 AVCO 550556 MIL DIA BORON-EPOXY LAMINATES
_ _ _ _ _
40
tubes nom thick V
tubes nom thick
c-oupons v (no ult obt) v n
(no ult30- A obt) VA coupons
0
~hck tubes tthick2tbs8 ZE AA
00 In AA_
vA 0 b 0 A 0
A 00 0
0 10 AA
OI I I -5 -4 -3 -2 1 ( y 2
FPAxI E y ()MFIG 16 COMPRESSION RE-SPON$EOFi60 AVCO -550556 MIL DIA BORON-EPOXY LAMINATES-
40
(64 ksi) (64)
30
oV CO
coupons
0A 0
AA A coupons
0-A 5
20
0
0 00
10shy
00
V
-25 -20 -15 -10 -05 0 05eF (0) Ey (CI)05FIG 17 COMPRESSION RESPONSE-OF +-750AVCO 5505156 MIL DIA BORON-EPOXY LAMINATES
40 -
C
En Ult 3 0 L
0 deg 3 0 - cou on coupons u
830
tubes nom 20 V thick
tubes nom thick V
-tubes tthicdk
thick 10shy
-16 -14 -12 -10 -08 -06 -04 -2 0 2 ei () ey (0)
FIG 18 COMPRESSION RESPONSE OF 906 AVCO 550556 MIL DIA BORON EPOXY LAMINATES
2-250 upons coupons
CL tubes nom thick tubesno]
ktubes t tubes t
0 thick thickS 150- O
0
wA
201 thck
50
-14 -12 -10 -08 -06 -04 -02 0 02 ex (0f) ey (l)
FIG 19 COMPRESSION RESPONSE OF 0900 AVCO 550556 MIL DIA BORON-EPOXY LAMINATES
200
2 0
E coupons
150 tubbs nom tubes thick nom
thick
100
tubes t tubes thick tthick
50shy
- I
0-15 -10 -05 05Lx () 00 y (l) 0
FIG 20 COMPRESSION RESPONSE OF 0145900 AVCO 5505156 MIL DIA BORON-EPOXY LAMINATES
IxJu
uniform compression
L u=-8 I I I I I
I Ib
I 1IIAP II ICPSIx I I
I I
I- b
FIG APB 1 COUPON UNDER UNIFORM COMPRESSION
AR AR (SNAP) t xy
0 POISSON RATIO -xy
2 10lj
ISOTROPIC 0 PANEL
I bullI 00
0 05
0 10 20 30 40 50 60 70 80 90 t a (degrees)
FIG APB 2 MIN AR FOR 6BESTSTRESS DISTRIBUTION ALONG THE CENTER LINE OF THE COUPON
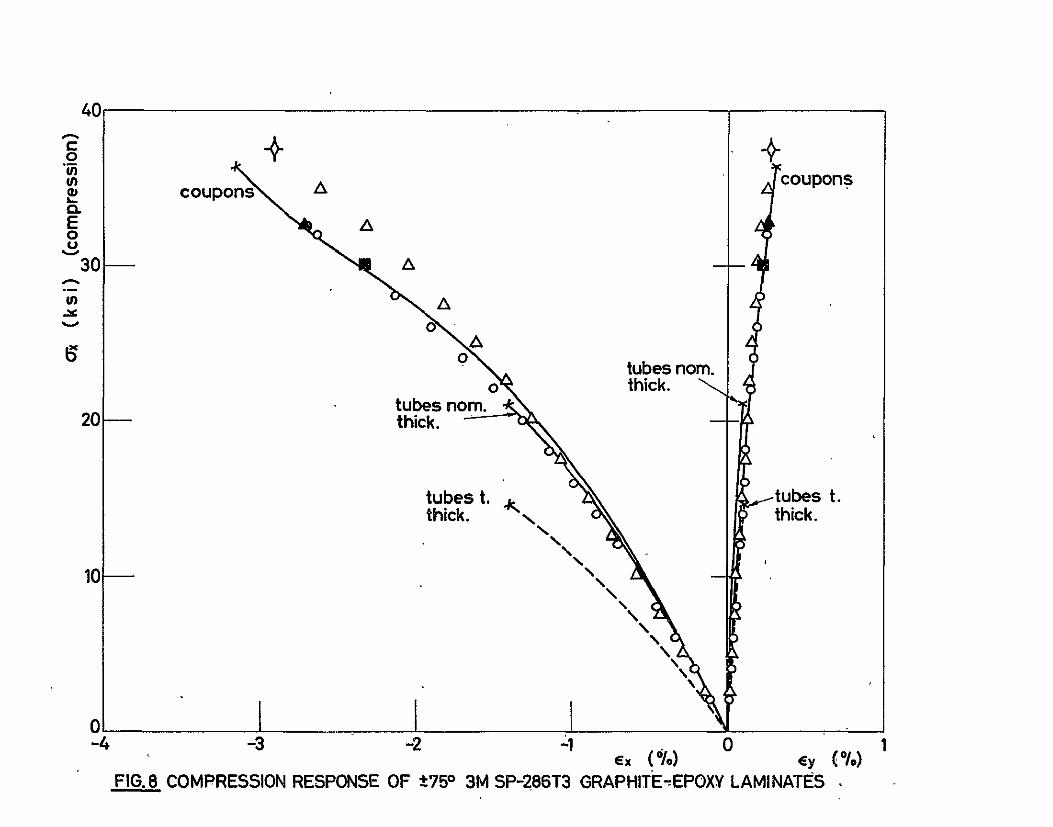
40
CL E 0 U
30
U) coupons
A
A
coupons
A
20-
0
tubes nom thick
0
tubes nom thick
-
tubes t thick
tubes t thick
10shy
-3 -2 -1 Ex() Cy (1)
FIG8 COMPRESSION RESPONSE OF plusmn750 3M SP-286T3 GRAPHITEEPOXY LAMINATES
-4 0
35 +
CL o0
Di couon coupons
S25
bull--
20shy
--
tubes nom thick
tubes nom thick
t
15-tubes
thick t
tubes tthickN N
10 -N
NN
0n -25 -20 -15 -10 ex -05 0 ey 05
FIG 9 COMPRESSION RESPONSE OF 906 3M SP-286T3 GRAPHITE-EPOXY LAMINATES
120
100- A
2 coupons
E080 A 2 0
60shy
thick tubes nom hidk
40shy
tubes t 20- tubes tthick - thick
0shy-16 44 -12 -10 -08 -06 -04 -02 0 02
FIG 10 COMPRESSION RESPONSE OF 0900 3M SP-286T3 GRAPHITE-EPOXY LAMINATES y
100
oo coupons
ns coupons
0
UIi75 - -
50- C
tubes nom tubes nor thick thick
25 tubes tthick Kc_ tubes tthick
-20
FIG11
-15
COMPRESSION -1o
RESPONSE OF 0145900
-05 0 05 e1 (C) OE y (0)3M SP-286T3 GRAPHITE-EPOXY LAMINATES
10
400
(0
6 coupons coupons 200- shy
100 shy
-12 -10 -08 -06 -04 Q02 0 0Q2 ey 04 FIG 1V COMPRESSION RESPONSE OF 00 AVCO 5505156 MIL DIA BORO-EPOXY LAMINATES
150- +-- V
o
U)
In
_
A coupons
100 tubes florn
E
nom
tthick
tubes tthick-- t
copos7L A
V(10
-otubesnomathick ov
tubes tik IV deg tub es t t h ic k o
50 0
10
001
I
FIG 13
-05 0Eri)
COMPRESSION RESPONSE
A H I
05ey (0)
OF t 150 AVCO 5505 BORON-EPOXY
10
LAMINATES
15
75
0v VU)InI v v 03pn coupons
degu v
- 50v V
(no ultobt) A (no ultobt)amp
25- 0
tubes nom thick 04 tubes nom thick
tubes tthick0 tubes tthick
- Q5 0 05 10 15Ex (sect) Ey (dego)
FIG 14A COMPRESSION RESPONSE OF plusmn300 AVCO 550556 MIL DIA BORON-EPOXY LAMINATES (BATCH 1)
20
100
0
0
U
75
(no V V V
V50 -- V V -o uponsV (outat)v (no ultobt)
nora tubes 47
VAnom 0V thick AV
25tubes noma th
tubest~thikK~iVx tubes tthick
5 -D -05 E M0 (o) 05 10 15
FIG 14B COMPRESSION RESPONSE OF plusmn300 AVCO 550556 MIL DIA BORON-EPOXY LAMINATES (BATCH E1)
40
0
CLcuoscoupons
E 0 v
30shy
230 ---shy
thick thick -S- -- - tin
20- tube2 k- -shyc
1 e thick
(noul Xe (no ult)
10- (t A
0 04 ey SA)x (15FIG 15 COMPRESSION RESPONSE OF plusmn450 AVCO 550556 MIL DIA BORON-EPOXY LAMINATES
_ _ _ _ _
40
tubes nom thick V
tubes nom thick
c-oupons v (no ult obt) v n
(no ult30- A obt) VA coupons
0
~hck tubes tthick2tbs8 ZE AA
00 In AA_
vA 0 b 0 A 0
A 00 0
0 10 AA
OI I I -5 -4 -3 -2 1 ( y 2
FPAxI E y ()MFIG 16 COMPRESSION RE-SPON$EOFi60 AVCO -550556 MIL DIA BORON-EPOXY LAMINATES-
40
(64 ksi) (64)
30
oV CO
coupons
0A 0
AA A coupons
0-A 5
20
0
0 00
10shy
00
V
-25 -20 -15 -10 -05 0 05eF (0) Ey (CI)05FIG 17 COMPRESSION RESPONSE-OF +-750AVCO 5505156 MIL DIA BORON-EPOXY LAMINATES
40 -
C
En Ult 3 0 L
0 deg 3 0 - cou on coupons u
830
tubes nom 20 V thick
tubes nom thick V
-tubes tthicdk
thick 10shy
-16 -14 -12 -10 -08 -06 -04 -2 0 2 ei () ey (0)
FIG 18 COMPRESSION RESPONSE OF 906 AVCO 550556 MIL DIA BORON EPOXY LAMINATES
2-250 upons coupons
CL tubes nom thick tubesno]
ktubes t tubes t
0 thick thickS 150- O
0
wA
201 thck
50
-14 -12 -10 -08 -06 -04 -02 0 02 ex (0f) ey (l)
FIG 19 COMPRESSION RESPONSE OF 0900 AVCO 550556 MIL DIA BORON-EPOXY LAMINATES
200
2 0
E coupons
150 tubbs nom tubes thick nom
thick
100
tubes t tubes thick tthick
50shy
- I
0-15 -10 -05 05Lx () 00 y (l) 0
FIG 20 COMPRESSION RESPONSE OF 0145900 AVCO 5505156 MIL DIA BORON-EPOXY LAMINATES
IxJu
uniform compression
L u=-8 I I I I I
I Ib
I 1IIAP II ICPSIx I I
I I
I- b
FIG APB 1 COUPON UNDER UNIFORM COMPRESSION
AR AR (SNAP) t xy
0 POISSON RATIO -xy
2 10lj
ISOTROPIC 0 PANEL
I bullI 00
0 05
0 10 20 30 40 50 60 70 80 90 t a (degrees)
FIG APB 2 MIN AR FOR 6BESTSTRESS DISTRIBUTION ALONG THE CENTER LINE OF THE COUPON

100
oo coupons
ns coupons
0
UIi75 - -
50- C
tubes nom tubes nor thick thick
25 tubes tthick Kc_ tubes tthick
-20
FIG11
-15
COMPRESSION -1o
RESPONSE OF 0145900
-05 0 05 e1 (C) OE y (0)3M SP-286T3 GRAPHITE-EPOXY LAMINATES
10
400
(0
6 coupons coupons 200- shy
100 shy
-12 -10 -08 -06 -04 Q02 0 0Q2 ey 04 FIG 1V COMPRESSION RESPONSE OF 00 AVCO 5505156 MIL DIA BORO-EPOXY LAMINATES
150- +-- V
o
U)
In
_
A coupons
100 tubes florn
E
nom
tthick
tubes tthick-- t
copos7L A
V(10
-otubesnomathick ov
tubes tik IV deg tub es t t h ic k o
50 0
10
001
I
FIG 13
-05 0Eri)
COMPRESSION RESPONSE
A H I
05ey (0)
OF t 150 AVCO 5505 BORON-EPOXY
10
LAMINATES
15
75
0v VU)InI v v 03pn coupons
degu v
- 50v V
(no ultobt) A (no ultobt)amp
25- 0
tubes nom thick 04 tubes nom thick
tubes tthick0 tubes tthick
- Q5 0 05 10 15Ex (sect) Ey (dego)
FIG 14A COMPRESSION RESPONSE OF plusmn300 AVCO 550556 MIL DIA BORON-EPOXY LAMINATES (BATCH 1)
20
100
0
0
U
75
(no V V V
V50 -- V V -o uponsV (outat)v (no ultobt)
nora tubes 47
VAnom 0V thick AV
25tubes noma th
tubest~thikK~iVx tubes tthick
5 -D -05 E M0 (o) 05 10 15
FIG 14B COMPRESSION RESPONSE OF plusmn300 AVCO 550556 MIL DIA BORON-EPOXY LAMINATES (BATCH E1)
40
0
CLcuoscoupons
E 0 v
30shy
230 ---shy
thick thick -S- -- - tin
20- tube2 k- -shyc
1 e thick
(noul Xe (no ult)
10- (t A
0 04 ey SA)x (15FIG 15 COMPRESSION RESPONSE OF plusmn450 AVCO 550556 MIL DIA BORON-EPOXY LAMINATES
_ _ _ _ _
40
tubes nom thick V
tubes nom thick
c-oupons v (no ult obt) v n
(no ult30- A obt) VA coupons
0
~hck tubes tthick2tbs8 ZE AA
00 In AA_
vA 0 b 0 A 0
A 00 0
0 10 AA
OI I I -5 -4 -3 -2 1 ( y 2
FPAxI E y ()MFIG 16 COMPRESSION RE-SPON$EOFi60 AVCO -550556 MIL DIA BORON-EPOXY LAMINATES-
40
(64 ksi) (64)
30
oV CO
coupons
0A 0
AA A coupons
0-A 5
20
0
0 00
10shy
00
V
-25 -20 -15 -10 -05 0 05eF (0) Ey (CI)05FIG 17 COMPRESSION RESPONSE-OF +-750AVCO 5505156 MIL DIA BORON-EPOXY LAMINATES
40 -
C
En Ult 3 0 L
0 deg 3 0 - cou on coupons u
830
tubes nom 20 V thick
tubes nom thick V
-tubes tthicdk
thick 10shy
-16 -14 -12 -10 -08 -06 -04 -2 0 2 ei () ey (0)
FIG 18 COMPRESSION RESPONSE OF 906 AVCO 550556 MIL DIA BORON EPOXY LAMINATES
2-250 upons coupons
CL tubes nom thick tubesno]
ktubes t tubes t
0 thick thickS 150- O
0
wA
201 thck
50
-14 -12 -10 -08 -06 -04 -02 0 02 ex (0f) ey (l)
FIG 19 COMPRESSION RESPONSE OF 0900 AVCO 550556 MIL DIA BORON-EPOXY LAMINATES
200
2 0
E coupons
150 tubbs nom tubes thick nom
thick
100
tubes t tubes thick tthick
50shy
- I
0-15 -10 -05 05Lx () 00 y (l) 0
FIG 20 COMPRESSION RESPONSE OF 0145900 AVCO 5505156 MIL DIA BORON-EPOXY LAMINATES
IxJu
uniform compression
L u=-8 I I I I I
I Ib
I 1IIAP II ICPSIx I I
I I
I- b
FIG APB 1 COUPON UNDER UNIFORM COMPRESSION
AR AR (SNAP) t xy
0 POISSON RATIO -xy
2 10lj
ISOTROPIC 0 PANEL
I bullI 00
0 05
0 10 20 30 40 50 60 70 80 90 t a (degrees)
FIG APB 2 MIN AR FOR 6BESTSTRESS DISTRIBUTION ALONG THE CENTER LINE OF THE COUPON

75
0v VU)InI v v 03pn coupons
degu v
- 50v V
(no ultobt) A (no ultobt)amp
25- 0
tubes nom thick 04 tubes nom thick
tubes tthick0 tubes tthick
- Q5 0 05 10 15Ex (sect) Ey (dego)
FIG 14A COMPRESSION RESPONSE OF plusmn300 AVCO 550556 MIL DIA BORON-EPOXY LAMINATES (BATCH 1)
20
100
0
0
U
75
(no V V V
V50 -- V V -o uponsV (outat)v (no ultobt)
nora tubes 47
VAnom 0V thick AV
25tubes noma th
tubest~thikK~iVx tubes tthick
5 -D -05 E M0 (o) 05 10 15
FIG 14B COMPRESSION RESPONSE OF plusmn300 AVCO 550556 MIL DIA BORON-EPOXY LAMINATES (BATCH E1)
40
0
CLcuoscoupons
E 0 v
30shy
230 ---shy
thick thick -S- -- - tin
20- tube2 k- -shyc
1 e thick
(noul Xe (no ult)
10- (t A
0 04 ey SA)x (15FIG 15 COMPRESSION RESPONSE OF plusmn450 AVCO 550556 MIL DIA BORON-EPOXY LAMINATES
_ _ _ _ _
40
tubes nom thick V
tubes nom thick
c-oupons v (no ult obt) v n
(no ult30- A obt) VA coupons
0
~hck tubes tthick2tbs8 ZE AA
00 In AA_
vA 0 b 0 A 0
A 00 0
0 10 AA
OI I I -5 -4 -3 -2 1 ( y 2
FPAxI E y ()MFIG 16 COMPRESSION RE-SPON$EOFi60 AVCO -550556 MIL DIA BORON-EPOXY LAMINATES-
40
(64 ksi) (64)
30
oV CO
coupons
0A 0
AA A coupons
0-A 5
20
0
0 00
10shy
00
V
-25 -20 -15 -10 -05 0 05eF (0) Ey (CI)05FIG 17 COMPRESSION RESPONSE-OF +-750AVCO 5505156 MIL DIA BORON-EPOXY LAMINATES
40 -
C
En Ult 3 0 L
0 deg 3 0 - cou on coupons u
830
tubes nom 20 V thick
tubes nom thick V
-tubes tthicdk
thick 10shy
-16 -14 -12 -10 -08 -06 -04 -2 0 2 ei () ey (0)
FIG 18 COMPRESSION RESPONSE OF 906 AVCO 550556 MIL DIA BORON EPOXY LAMINATES
2-250 upons coupons
CL tubes nom thick tubesno]
ktubes t tubes t
0 thick thickS 150- O
0
wA
201 thck
50
-14 -12 -10 -08 -06 -04 -02 0 02 ex (0f) ey (l)
FIG 19 COMPRESSION RESPONSE OF 0900 AVCO 550556 MIL DIA BORON-EPOXY LAMINATES
200
2 0
E coupons
150 tubbs nom tubes thick nom
thick
100
tubes t tubes thick tthick
50shy
- I
0-15 -10 -05 05Lx () 00 y (l) 0
FIG 20 COMPRESSION RESPONSE OF 0145900 AVCO 5505156 MIL DIA BORON-EPOXY LAMINATES
IxJu
uniform compression
L u=-8 I I I I I
I Ib
I 1IIAP II ICPSIx I I
I I
I- b
FIG APB 1 COUPON UNDER UNIFORM COMPRESSION
AR AR (SNAP) t xy
0 POISSON RATIO -xy
2 10lj
ISOTROPIC 0 PANEL
I bullI 00
0 05
0 10 20 30 40 50 60 70 80 90 t a (degrees)
FIG APB 2 MIN AR FOR 6BESTSTRESS DISTRIBUTION ALONG THE CENTER LINE OF THE COUPON

100
0
0
U
75
(no V V V
V50 -- V V -o uponsV (outat)v (no ultobt)
nora tubes 47
VAnom 0V thick AV
25tubes noma th
tubest~thikK~iVx tubes tthick
5 -D -05 E M0 (o) 05 10 15
FIG 14B COMPRESSION RESPONSE OF plusmn300 AVCO 550556 MIL DIA BORON-EPOXY LAMINATES (BATCH E1)
40
0
CLcuoscoupons
E 0 v
30shy
230 ---shy
thick thick -S- -- - tin
20- tube2 k- -shyc
1 e thick
(noul Xe (no ult)
10- (t A
0 04 ey SA)x (15FIG 15 COMPRESSION RESPONSE OF plusmn450 AVCO 550556 MIL DIA BORON-EPOXY LAMINATES
_ _ _ _ _
40
tubes nom thick V
tubes nom thick
c-oupons v (no ult obt) v n
(no ult30- A obt) VA coupons
0
~hck tubes tthick2tbs8 ZE AA
00 In AA_
vA 0 b 0 A 0
A 00 0
0 10 AA
OI I I -5 -4 -3 -2 1 ( y 2
FPAxI E y ()MFIG 16 COMPRESSION RE-SPON$EOFi60 AVCO -550556 MIL DIA BORON-EPOXY LAMINATES-
40
(64 ksi) (64)
30
oV CO
coupons
0A 0
AA A coupons
0-A 5
20
0
0 00
10shy
00
V
-25 -20 -15 -10 -05 0 05eF (0) Ey (CI)05FIG 17 COMPRESSION RESPONSE-OF +-750AVCO 5505156 MIL DIA BORON-EPOXY LAMINATES
40 -
C
En Ult 3 0 L
0 deg 3 0 - cou on coupons u
830
tubes nom 20 V thick
tubes nom thick V
-tubes tthicdk
thick 10shy
-16 -14 -12 -10 -08 -06 -04 -2 0 2 ei () ey (0)
FIG 18 COMPRESSION RESPONSE OF 906 AVCO 550556 MIL DIA BORON EPOXY LAMINATES
2-250 upons coupons
CL tubes nom thick tubesno]
ktubes t tubes t
0 thick thickS 150- O
0
wA
201 thck
50
-14 -12 -10 -08 -06 -04 -02 0 02 ex (0f) ey (l)
FIG 19 COMPRESSION RESPONSE OF 0900 AVCO 550556 MIL DIA BORON-EPOXY LAMINATES
200
2 0
E coupons
150 tubbs nom tubes thick nom
thick
100
tubes t tubes thick tthick
50shy
- I
0-15 -10 -05 05Lx () 00 y (l) 0
FIG 20 COMPRESSION RESPONSE OF 0145900 AVCO 5505156 MIL DIA BORON-EPOXY LAMINATES
IxJu
uniform compression
L u=-8 I I I I I
I Ib
I 1IIAP II ICPSIx I I
I I
I- b
FIG APB 1 COUPON UNDER UNIFORM COMPRESSION
AR AR (SNAP) t xy
0 POISSON RATIO -xy
2 10lj
ISOTROPIC 0 PANEL
I bullI 00
0 05
0 10 20 30 40 50 60 70 80 90 t a (degrees)
FIG APB 2 MIN AR FOR 6BESTSTRESS DISTRIBUTION ALONG THE CENTER LINE OF THE COUPON

40
0
CLcuoscoupons
E 0 v
30shy
230 ---shy
thick thick -S- -- - tin
20- tube2 k- -shyc
1 e thick
(noul Xe (no ult)
10- (t A
0 04 ey SA)x (15FIG 15 COMPRESSION RESPONSE OF plusmn450 AVCO 550556 MIL DIA BORON-EPOXY LAMINATES
_ _ _ _ _
40
tubes nom thick V
tubes nom thick
c-oupons v (no ult obt) v n
(no ult30- A obt) VA coupons
0
~hck tubes tthick2tbs8 ZE AA
00 In AA_
vA 0 b 0 A 0
A 00 0
0 10 AA
OI I I -5 -4 -3 -2 1 ( y 2
FPAxI E y ()MFIG 16 COMPRESSION RE-SPON$EOFi60 AVCO -550556 MIL DIA BORON-EPOXY LAMINATES-
40
(64 ksi) (64)
30
oV CO
coupons
0A 0
AA A coupons
0-A 5
20
0
0 00
10shy
00
V
-25 -20 -15 -10 -05 0 05eF (0) Ey (CI)05FIG 17 COMPRESSION RESPONSE-OF +-750AVCO 5505156 MIL DIA BORON-EPOXY LAMINATES
40 -
C
En Ult 3 0 L
0 deg 3 0 - cou on coupons u
830
tubes nom 20 V thick
tubes nom thick V
-tubes tthicdk
thick 10shy
-16 -14 -12 -10 -08 -06 -04 -2 0 2 ei () ey (0)
FIG 18 COMPRESSION RESPONSE OF 906 AVCO 550556 MIL DIA BORON EPOXY LAMINATES
2-250 upons coupons
CL tubes nom thick tubesno]
ktubes t tubes t
0 thick thickS 150- O
0
wA
201 thck
50
-14 -12 -10 -08 -06 -04 -02 0 02 ex (0f) ey (l)
FIG 19 COMPRESSION RESPONSE OF 0900 AVCO 550556 MIL DIA BORON-EPOXY LAMINATES
200
2 0
E coupons
150 tubbs nom tubes thick nom
thick
100
tubes t tubes thick tthick
50shy
- I
0-15 -10 -05 05Lx () 00 y (l) 0
FIG 20 COMPRESSION RESPONSE OF 0145900 AVCO 5505156 MIL DIA BORON-EPOXY LAMINATES
IxJu
uniform compression
L u=-8 I I I I I
I Ib
I 1IIAP II ICPSIx I I
I I
I- b
FIG APB 1 COUPON UNDER UNIFORM COMPRESSION
AR AR (SNAP) t xy
0 POISSON RATIO -xy
2 10lj
ISOTROPIC 0 PANEL
I bullI 00
0 05
0 10 20 30 40 50 60 70 80 90 t a (degrees)
FIG APB 2 MIN AR FOR 6BESTSTRESS DISTRIBUTION ALONG THE CENTER LINE OF THE COUPON
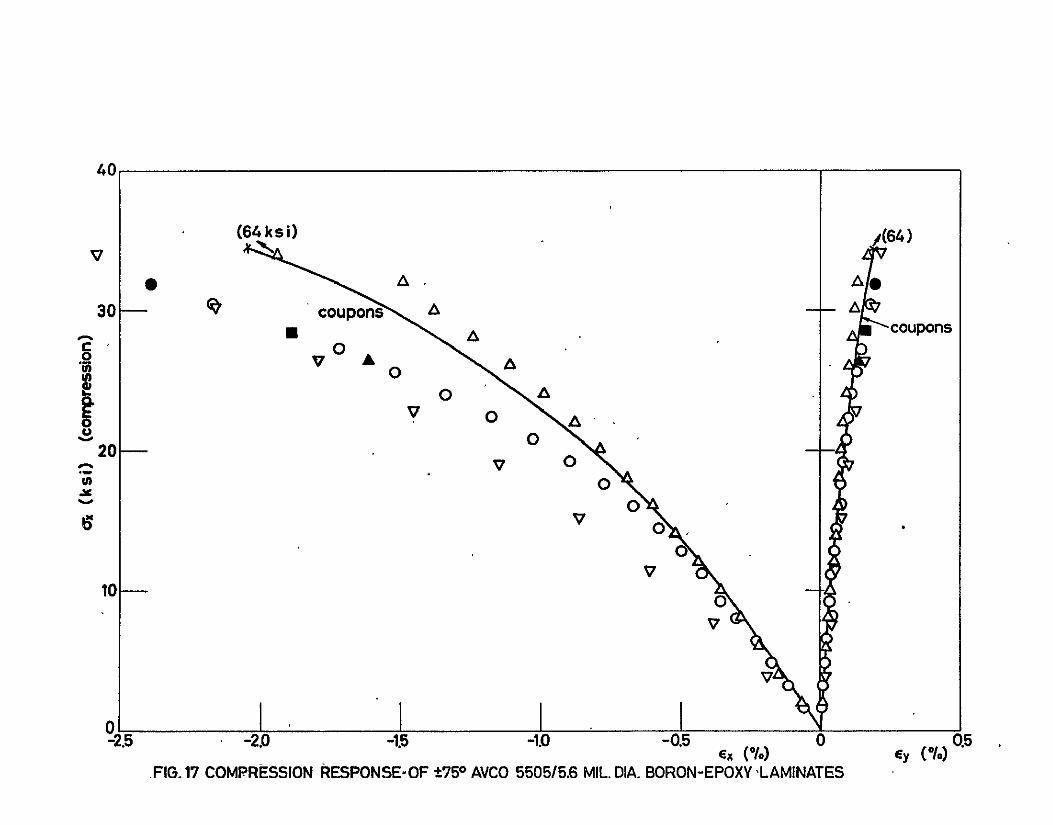
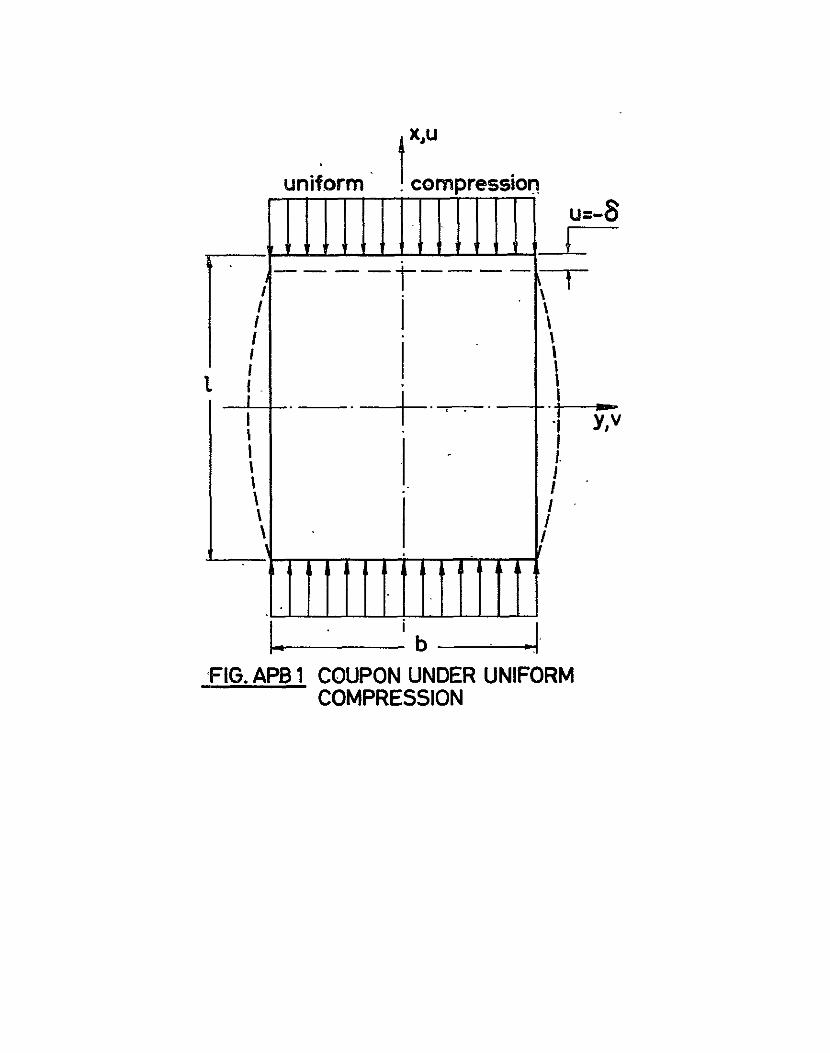

AR AR (SNAP) t xy
0 POISSON RATIO -xy
2 10lj
ISOTROPIC 0 PANEL
I bullI 00
0 05
0 10 20 30 40 50 60 70 80 90 t a (degrees)
FIG APB 2 MIN AR FOR 6BESTSTRESS DISTRIBUTION ALONG THE CENTER LINE OF THE COUPON