Embed Size (px)
Citation preview

Performance Specification 2 8/2/2017
1
While we have taken steps to ensure the accuracy of this Internet version of the document, it is not the
official version. The most recent edits to this method were published here:
https://www.gpo.gov/fdsys/pkg/FR-2016-08-30/pdf/2016-19642.pdf. To see a complete version
including any recent edits, visit: https://www.ecfr.gov/cgi-bin/ECFR?page=browse and search under
Title 40, Protection of Environment.
PERFORMANCE SPECIFICATION 2—SPECIFICATIONS AND TEST PROCEDURES FOR SO2 AND
NOX CONTINUOUS EMISSION MONITORING SYSTEMS IN STATIONARY SOURCES
1.0 Scope and Application
1.1 Analytes
Analyte CAS Nos.
Sulfur Dioxide (SO2) 7449-09-5
Nitrogen Oxides (NOX) 10102-44-0 (NO2), 10024-97-2 (NO)
1.2 Applicability.
1.2.1 This specification is for evaluating the acceptability of SO2 and NOX continuous emission
monitoring systems (CEMS) at the time of installation or soon after and whenever specified in
the regulations. The CEMS may include, for certain stationary sources, a diluent (O2 or CO2)
monitor.
1.2.2 This specification is not designed to evaluate the installed CEMS performance over an
extended period of time nor does it identify specific calibration techniques and other auxiliary
procedures to assess the CEMS performance. The source owner or operator is responsible to
calibrate, maintain, and operate the CEMS properly. The Administrator may require, under
section 114 of the Act, the operator to conduct CEMS performance evaluations at other times
besides the initial test to evaluate the CEMS performance. See 40 CFR Part 60, §60.13(c).
2.0 Summary of Performance Specification
Procedures for measuring CEMS relative accuracy and calibration drift are outlined. CEMS
installation and measurement location specifications, equipment specifications, performance
specifications, and data reduction procedures are included. Conformance of the CEMS with the
Performance Specification is determined.
3.0 Definitions
3.1 Calibration Drift (CD) means the difference in the CEMS output readings from the
established reference value after a stated period of operation during which no unscheduled
maintenance, repair, or adjustment took place.
Performance Specification 2 8/2/2017
2
3.2 Centroidal Area means a concentric area that is geometrically similar to the stack or duct
cross section and is no greater than l percent of the stack or duct cross-sectional area.
3.3 Continuous Emission Monitoring System means the total equipment required for the
determination of a gas concentration or emission rate. The sample interface, pollutant analyzer,
diluent analyzer, and data recorder are the major subsystems of the CEMS.
3.4 Data Recorder means that portion of the CEMS that provides a permanent record of the
analyzer output. The data recorder may include automatic data reduction capabilities.
3.5 Diluent Analyzer means that portion of the CEMS that senses the diluent gas (i.e., CO2 or O2)
and generates an output proportional to the gas concentration.
3.6 Path CEMS means a CEMS that measures the gas concentration along a path greater than 10
percent of the equivalent diameter of the stack or duct cross section.
3.7 Point CEMS means a CEMS that measures the gas concentration either at a single point or
along a path equal to or less than 10 percent of the equivalent diameter of the stack or duct cross
section.
3.8 Pollutant Analyzer means that portion of the CEMS that senses the pollutant gas and
generates an output proportional to the gas concentration.
3.9 Relative Accuracy (RA) means the absolute mean difference between the gas concentration or
emission rate determined by the CEMS and the value determined by the reference method (RM),
plus the 2.5 percent error confidence coefficient of a series of tests, divided by the mean of the
RM tests or the applicable emission limit.
3.10 Sample Interface means that portion of the CEMS used for one or more of the following:
sample acquisition, sample delivery, sample conditioning, or protection of the monitor from the
effects of the stack effluent.
3.11 Span Value means the calibration portion of the measurement range as specified in the
applicable regulation or other requirement. If the span is not specified in the applicable
regulation or other requirement, then it must be a value approximately equivalent to two times
the emission standard. For spans less than 500 ppm, the span value may either be rounded
upward to the next highest multiple of 10 ppm, or to the next highest multiple of 100 ppm such
that the equivalent emission concentration is not less than 30 percent of the selected span value.
4.0 Interferences [Reserved]
5.0 Safety
The procedures required under this performance specification may involve hazardous materials,
operations, and equipment. This performance specification may not address all of the safety
problems associated with these procedures. It is the responsibility of the user to establish
Performance Specification 2 8/2/2017
3
appropriate safety and health practices and determine the applicable regulatory limitations prior
to performing these procedures. The CEMS user's manual and materials recommended by the
reference method should be consulted for specific precautions to be taken.
6.0 Equipment and Supplies
6.1 CEMS Equipment Specifications.
6.1.1 Data Recorder. The portion of the CEMS that provides a record of analyzer output. The
data recorder may record other pertinent data such as effluent flow rates, various instrument
temperatures or abnormal CEMS operation. The data recorder output range must include the full
range of expected concentration values in the gas stream to be sampled including zero and span
values.
6.1.2 The CEMS design should also allow the determination of calibration drift at the zero and
span values. If this is not possible or practical, the design must allow these determinations to be
conducted at a low-level value (zero to 20 percent of the span value) and at a value between 50
and 100 percent of the span value. In special cases, the Administrator may approve a single-point
calibration drift determination.
6.2 Other equipment and supplies, as needed by the applicable reference method(s) (see section
8.4.2 of this Performance Specification), may be required.
7.0 Reagents and Standards
7.1 Reference Gases, Gas Cells, or Optical Filters. As specified by the CEMS manufacturer for
calibration of the CEMS (these need not be certified).
7.2 Reagents and Standards. May be required as needed by the applicable reference method(s)
(see section 8.4.2 of this Performance Specification).
8.0 Performance Specification Test Procedure
8.1 Installation and Measurement Location Specifications.
8.1.1 CEMS Installation. Install the CEMS at an accessible location where the pollutant
concentration or emission rate measurements are directly representative or can be corrected so as
to be representative of the total emissions from the affected facility or at the measurement
location cross section. Then select representative measurement points or paths for monitoring in
locations that the CEMS will pass the RA test (see section 8.4). If the cause of failure to meet the
RA test is determined to be the measurement location and a satisfactory correction technique
cannot be established, the Administrator may require the CEMS to be relocated. Suggested
measurement locations and points or paths that are most likely to provide data that will meet the
RA requirements are listed below.
8.1.2 CEMS Measurement Location. It is suggested that the measurement location be (1) at least
two equivalent diameters downstream from the nearest control device, the point of pollutant
Performance Specification 2 8/2/2017
4
generation, or other point at which a change in the pollutant concentration or emission rate may
occur and (2) at least a half equivalent diameter upstream from the effluent exhaust or control
device.
8.1.2.1 Point CEMS. It is suggested that the measurement point be (1) no less than 1.0 meter (3.3
ft) from the stack or duct wall or (2) within or centrally located over the centroidal area of the
stack or duct cross section.
8.1.2.2 Path CEMS. It is suggested that the effective measurement path (1) be totally within the
inner area bounded by a line 1.0 meter (3.3 ft) from the stack or duct wall, or (2) have at least 70
percent of the path within the inner 50 percent of the stack or duct cross-sectional area, or (3) be
centrally located over any part of the centroidal area.
8.1.3 Reference Method Measurement Location and Traverse Points.
8.1.3.1 Select, as appropriate, an accessible RM measurement point at least two equivalent
diameters downstream from the nearest control device, the point of pollutant generation, or other
point at which a change in the pollutant concentration or emission rate may occur, and at least a
half equivalent diameter upstream from the effluent exhaust or control device. When pollutant
concentration changes are due solely to diluent leakage (e.g., air heater leakages) and pollutants
and diluents are simultaneously measured at the same location, a half diameter may be used in
lieu of two equivalent diameters. The CEMS and RM locations need not be the same.
8.1.3.2 Select traverse points that assure acquisition of representative samples over the stack or
duct cross section. The minimum requirements are as follows: Establish a “measurement line”
that passes through the centroidal area and in the direction of any expected stratification. If this
line interferes with the CEMS measurements, displace the line up to 30 cm (12 in.) (or 5 percent
of the equivalent diameter of the cross section, whichever is less) from the centroidal area.
Locate three traverse points at 16.7, 50.0, and 83.3 percent of the measurement line. If the
measurement line is longer than 2.4 meters (7.8 ft) and pollutant stratification is not expected, the
three traverse points may be located on the line at 0.4, 1.2, and 2.0 meters from the stack or duct
wall. This option must not be used after wet scrubbers or at points where two streams with
different pollutant concentrations are combined. If stratification is suspected, the following
procedure is suggested. For rectangular ducts, locate at least nine sample points in the cross
section such that sample points are the centroids of similarly-shaped, equal area divisions of the
cross section. Measure the pollutant concentration, and, if applicable, the diluent concentration at
each point using appropriate reference methods or other appropriate instrument methods that
give responses relative to pollutant concentrations. Then calculate the mean value for all sample
points. For circular ducts, conduct a 12-point traverse (i.e., six points on each of the two
perpendicular diameters) locating the sample points as described in 40 CFR 60, Appendix A,
Method 1. Perform the measurements and calculations as described above. Determine if the
mean pollutant concentration is more than 10% different from any single point. If so, the cross
section is considered to be stratified, and the tester may not use the alternative traverse point
locations (...0.4, 1.2, and 2.0 meters from the stack or duct wall.) but must use the three traverse
points at 16.7, 50.0, and 83.3 percent of the entire measurement line. Other traverse points may
be selected, provided that they can be shown to the satisfaction of the Administrator to provide a

Performance Specification 2 8/2/2017
5
representative sample over the stack or duct cross section. Conduct all necessary RM tests within
3 cm (1.2 in.) of the traverse points, but no closer than 3 cm (1.2 in.) to the stack or duct wall.
8.2 Pretest Preparation. Install the CEMS, prepare the RM test site according to the
specifications in section 8.1, and prepare the CEMS for operation according to the
manufacturer's written instructions.
8.3 Calibration Drift Test Procedure.
8.3.1 CD Test Period. While the affected facility is operating, determine the magnitude of the
CD once each day (at 24-hour intervals) for 7 consecutive calendar days according to the
procedure given in sections 8.3.2 through 8.3.4. Alternatively, the CD test may be conducted
over 7 consecutive unit operating days.
8.3.2 The purpose of the CD measurement is to verify the ability of the CEMS to conform to the
established CEMS calibration used for determining the emission concentration or emission rate.
Therefore, if periodic automatic or manual adjustments are made to the CEMS zero and
calibration settings, conduct the CD test immediately before these adjustments, or conduct it in
such a way that the CD can be determined.
8.3.3 Conduct the CD test at the two points specified in section 6.1.2. Introduce to the CEMS the
reference gases, gas cells, or optical filters (these need not be certified). Record the CEMS
response and subtract this value from the reference value (see example data sheet in Figure 2-1).
8.4 Relative Accuracy Test Procedure.
8.4.1 RA Test Period. Conduct the RA test according to the procedure given in sections 8.4.2
through 8.4.6 while the affected facility is operating at more than 50 percent of normal load, or
as specified in an applicable subpart. The RA test may be conducted during the CD test period.
8.4.2 Reference Methods. Unless otherwise specified in an applicable subpart of the regulations,
Methods 3B, 4, 6, and 7, or their approved alternatives, are the reference methods for diluent
(O2 and CO2), moisture, SO2, and NOX, respectively.
8.4.3 Sampling Strategy for RM Tests. Conduct the RM tests in such a way that they will yield
results representative of the emissions from the source and can be correlated to the CEMS data.
It is preferable to conduct the diluent (if applicable), moisture (if needed), and pollutant
measurements simultaneously. However, diluent and moisture measurements that are taken
within an hour of the pollutant measurements may be used to calculate dry pollutant
concentration and emission rates. In order to correlate the CEMS and RM data properly, note the
beginning and end of each RM test period of each run (including the exact time of day) on the
CEMS chart recordings or other permanent record of output. Use the following strategies for the
RM tests:

Performance Specification 2 8/2/2017
6
8.4.3.1 For integrated samples (e.g., Methods 6 and Method 4), make a sample traverse of at
least 21 minutes, sampling for an equal time at each traverse point (see section 8.1.3.2 for
discussion of traverse points.
8.4.3.2 For grab samples (e.g., Method 7), take one sample at each traverse point, scheduling the
grab samples so that they are taken simultaneously (within a 3-minute period) or at an equal
interval of time apart over the span of time the CEM pollutant is measured. A test run for grab
samples must be made up of at least three separate measurements.
NOTE: At times, CEMS RA tests are conducted during new source performance standards
performance tests. In these cases, RM results obtained during CEMS RA tests may be used to
determine compliance as long as the source and test conditions are consistent with the applicable
regulations.
8.4.4 Number of RM Tests. Conduct a minimum of nine sets of all necessary RM test runs.
NOTE: More than nine sets of RM tests may be performed. If this option is chosen, a maximum
of three sets of the test results may be rejected so long as the total number of test results used to
determine the RA is greater than or equal to nine. However, all data must be reported, including
the rejected data.
8.4.5 Correlation of RM and CEMS Data. Correlate the CEMS and the RM test data as to the
time and duration by first determining from the CEMS final output (the one used for reporting)
the integrated average pollutant concentration or emission rate for each pollutant RM test period.
Consider system response time, if important, and confirm that the pair of results are on a
consistent moisture, temperature, and diluent concentration basis. Then, compare each integrated
CEMS value against the corresponding average RM value. Use the following guidelines to make
these comparisons.
8.4.5.1 If the RM has an integrated sampling technique, make a direct comparison of the RM
results and CEMS integrated average value.
8.4.5.2 If the RM has a grab sampling technique, first average the results from all grab samples
taken during the test run, and then compare this average value against the integrated value
obtained from the CEMS chart recording or output during the run. If the pollutant concentration
is varying with time over the run, the arithmetic average of the CEMS value recorded at the time
of each grab sample may be used.
8.4.6 Calculate the mean difference between the RM and CEMS values in the units of the
emission standard, the standard deviation, the confidence coefficient, and the relative accuracy
according to the procedures in section 12.0.
8.5 Reporting. At a minimum (check with the appropriate regional office, State, or Local agency
for additional requirements, if any), summarize in tabular form the results of the CD tests and the
RA tests or alternative RA procedure, as appropriate. Include all data sheets, calculations, charts
(records of CEMS responses), cylinder gas concentration certifications, and calibration cell
Performance Specification 2 8/2/2017
7
response certifications (if applicable) necessary to confirm that the performance of the CEMS
met the performance specifications.
9.0 Quality Control [Reserved]
10.0 Calibration and Standardization [Reserved]
11.0 Analytical Procedure
Sample collection and analysis are concurrent for this Performance Specification (see section
8.0). Refer to the RM for specific analytical procedures.
12.0 Calculations and Data Analysis
Summarize the results on a data sheet similar to that shown in Figure 2-2 (in section 18.0).
12.1 All data from the RM and CEMS must be on a consistent dry basis and, as applicable, on a
consistent diluent basis and in the units of the emission standard. Correct the RM and CEMS
data for moisture and diluent as follows:
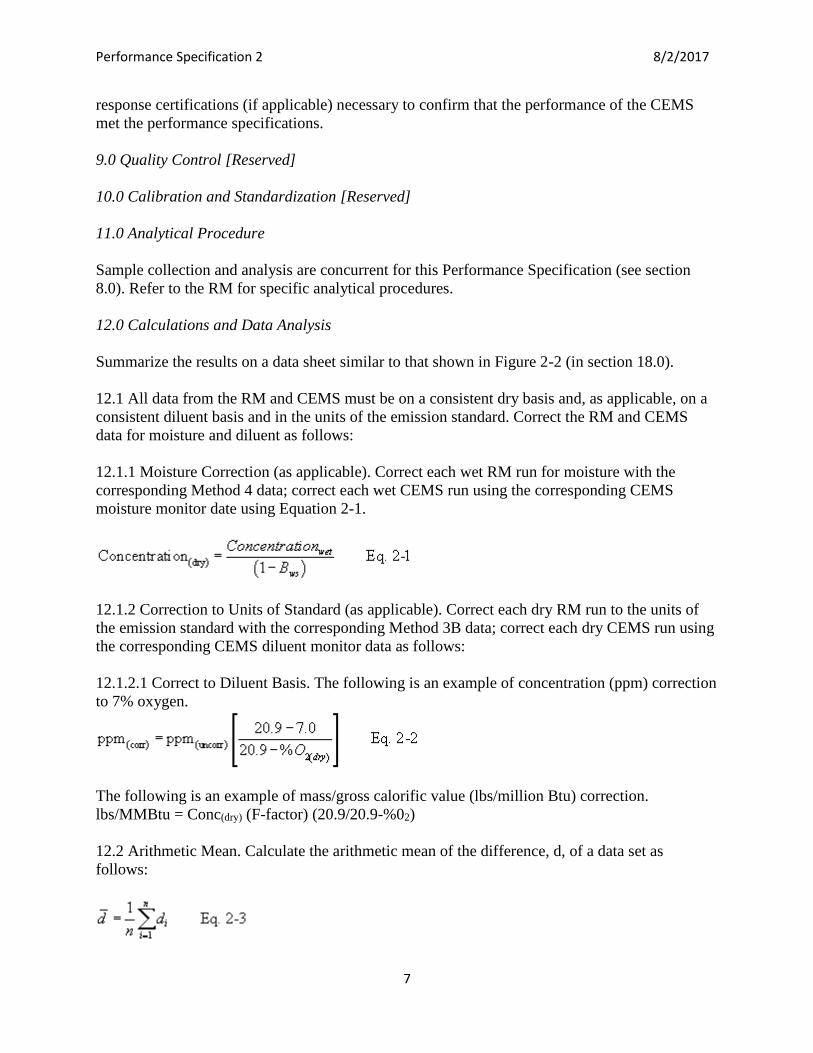
12.1.1 Moisture Correction (as applicable). Correct each wet RM run for moisture with the
corresponding Method 4 data; correct each wet CEMS run using the corresponding CEMS
moisture monitor date using Equation 2-1.
12.1.2 Correction to Units of Standard (as applicable). Correct each dry RM run to the units of
the emission standard with the corresponding Method 3B data; correct each dry CEMS run using
the corresponding CEMS diluent monitor data as follows:
12.1.2.1 Correct to Diluent Basis. The following is an example of concentration (ppm) correction
to 7% oxygen.
The following is an example of mass/gross calorific value (lbs/million Btu) correction.
lbs/MMBtu = Conc(dry) (F-factor) (20.9/20.9-%02)
12.2 Arithmetic Mean. Calculate the arithmetic mean of the difference, d, of a data set as
follows:

Performance Specification 2 8/2/2017
8
Where:
n = Number of data points.
12.3 Standard Deviation. Calculate the standard deviation, Sd, as follows:
12.4 Confidence Coefficient. Calculate the 2.5 percent error confidence coefficient (one-tailed),
CC, as follows:
Where:
t0̀.975 = t-value (see Table 2-1).
12.5 Relative Accuracy. Calculate the RA of a set of data as follows:
Where:
|d̅| = Absolute value of the mean differences (from Equation 2-3).
|CC| = Absolute value of the confidence coefficient (from Equation 2-3).
RM = Average RM value. In cases where the average emissions for the test are less than 50
percent of the applicable standard, substitute the emission standard value in the denominator of
Eq. 2-6 in place of RM. In all other cases, use RM.
Performance Specification 2 8/2/2017
9
13.0 Method Performance
13.1 Calibration Drift Performance Specification. The CEMS calibration must not drift or
deviate from the reference value of the gas cylinder, gas cell, or optical filter by more than 2.5
percent of the span value. If the CEMS includes pollutant and diluent monitors, the CD must be
determined separately for each in terms of concentrations (See Performance Specification 3 for
the diluent specifications), and none of the CDs may exceed the specification.
13.2 Relative Accuracy Performance Specification. The RA of the CEMS must be no greater
than 20 percent when RM̅ is used in the denominator of Eq. 2-6 (average emissions during test
are greater than 50 percent of the emission standard) or 10 percent when the applicable emission
standard is used in the denominator of Eq. 2-6 (average emissions during test are less than 50
percent of the emission standard). For SO2 emission standards of 130 to and including 86 ng/J
(0.30 and 0.20 lb/million Btu), inclusive, use 15 percent of the applicable standard; below 86
ng/J (0.20 lb/million Btu), use 20 percent of the emission standard.
13.3 For instruments that use common components to measure more than one effluent gas
constituent, all channels must simultaneously pass the RA requirement, unless it can be
demonstrated that any adjustments made to one channel did not affect the others.
14.0 Pollution Prevention [Reserved]
15.0 Waste Management [Reserved]
16.0 Alternative Procedures
Paragraphs 60.13(j)(1) and (2) of 40 CFR part 60 contain criteria for which the reference method
procedure for determining relative accuracy (see section 8.4 of this Performance Specification)
may be waived and the following procedure substituted.
16.1 Conduct a complete CEMS status check following the manufacturer's written instructions.
The check should include operation of the light source, signal receiver, timing mechanism
functions, data acquisition and data reduction functions, data recorders, mechanically operated
functions (mirror movements, zero pipe operation, calibration gas valve operations, etc.), sample
filters, sample line heaters, moisture traps, and other related functions of the CEMS, as
applicable. All parts of the CEMS shall be functioning properly before proceeding to the
alternative RA procedure.
16.2 Alternative RA Procedure.
16.2.1 Challenge each monitor (both pollutant and diluent, if applicable) with cylinder gases of
known concentrations or calibration cells that produce known responses at two measurement
points within the ranges shown in Table 2-2 (Section 18).
16.2.2 Use a separate cylinder gas (for point CEMS only) or calibration cell (for path CEMS or
where compressed gas cylinders can not be used) for measurement points 1 and 2. Challenge the

Performance Specification 2 8/2/2017
10
CEMS and record the responses three times at each measurement point. The Administrator may
allow dilution of cylinder gas using the performance criteria in Test Method 205, 40 CFR Part
51, Appendix M. Use the average of the three responses in determining relative accuracy.
16.2.3 Operate each monitor in its normal sampling mode as nearly as possible. When using
cylinder gases, pass the cylinder gas through all filters, scrubbers, conditioners, and other
monitor components used during normal sampling and as much of the sampling probe as
practical. When using calibration cells, the CEMS components used in the normal sampling
mode should not be by-passed during the RA determination. These include light sources, lenses,
detectors, and reference cells. The CEMS should be challenged at each measurement point for a
sufficient period of time to assure adsorption-desorption reactions on the CEMS surfaces have
stabilized.
16.2.4 Use cylinder gases that have been certified by comparison to National Institute of
Standards and Technology (NIST) gaseous standard reference material (SRM) or NIST/EPA
approved gas manufacturer's certified reference material (CRM) (See Reference 2 in section
17.0) following EPA Traceability Protocol Number 1 (See Reference 3 in section 17.0). As an
alternative to Protocol Number 1 gases, CRM's may be used directly as alternative RA cylinder
gases. A list of gas manufacturers that have prepared approved CRM's is available from EPA at
the address shown in Reference 2. Procedures for preparation of CRM's are described in
Reference 2.
16.2.5 Use calibration cells certified by the manufacturer to produce a known response in the
CEMS. The cell certification procedure shall include determination of CEMS response produced
by the calibration cell in direct comparison with measurement of gases of known concentration.
This can be accomplished using SRM or CRM gases in a laboratory source simulator or through
extended tests using reference methods at the CEMS location in the exhaust stack. These
procedures are discussed in Reference 4 in section 17.0. The calibration cell certification
procedure is subject to approval of the Administrator.
16.3 The differences between the known concentrations of the cylinder gases and the
concentrations indicated by the CEMS are used to assess the accuracy of the CEMS. The
calculations and limits of acceptable relative accuracy are as follows:
16.3.1 For pollutant CEMS:
Where:
d̅ = Average difference between responses and the concentration/responses (see section 16.2.2).
AC = The known concentration/response of the cylinder gas or calibration cell.
16.3.2 For diluent CEMS:

Performance Specification 2 8/2/2017
11
RA=�̅�; ≤0.7 percent O2 or CO2, as applicable.
Note: Waiver of the relative accuracy test in favor of the alternative RA procedure does not
preclude the requirements to complete the CD tests nor any other requirements specified in an
applicable subpart for reporting CEMS data and performing CEMS drift checks or audits.
17.0 References
1. Department of Commerce. Experimental Statistics. Handbook 91. Washington, D.C. p. 3-31,
paragraphs 3-3.1.4.
2. “A Procedure for Establishing Traceability of Gas Mixtures to Certain National Bureau of
Standards Standard Reference Materials.” Joint publication by NBS and EPA. EPA 600/7-81-
010. Available from U.S. Environmental Protection Agency, Quality Assurance Division (MD-
77), Research Triangle Park, North Carolina 27711.
3. “Traceability Protocol for Establishing True Concentrations of Gases Used for Calibration and
Audits of Continuous Source Emission Monitors. (Protocol Number 1).” June 1978. Protocol
Number 1 is included in the Quality Assurance Handbook for Air Pollution Measurement
Systems, Volume III, Stationary Source Specific Methods. EPA-600/4-77-027b. August 1977.
4. “Gaseous Continuous Emission Monitoring Systems—Performance Specification Guidelines
for SO2, NOX, CO2, O2, and TRS.” EPA-450/3-82-026. Available from the U.S. EPA, Emission
Measurement Center, Emission Monitoring and Data Analysis Division (MD-19), Research
Triangle Park, North Carolina 27711.
18.0 Tables, Diagrams, Flowcharts, and Validation Data

Performance Specification 2 8/2/2017
12
Table 2-1—t-Values
na
t0.975 n
a
t0.975 n
a
t0.975
2
12.706
7
2.447
12
2.201
3
4.303
8
2.365
13
2.179
4
3.182
9
2.306
14
2.160
5
2.776
10
2.262
15
2.145
6
2.571
11
2.228
16
2.131
A The values in this table are already corrected for n-1 degrees of freedom. Use n equal to
the number of individual values.
Table 2–2 Measurement Range
Measurement point
Pollutant monitor
Diluent monitor for
CO2
O2
1
20–30% of span value
5–8% by
volume
4–6% by volume.
2
50–60% of span value
10–14% by
volume
8–12% by volume.

Performance Specification 2 8/2/2017
13
Figure 2-1. Calibration Drift Determination
Day
Date
and
time
Calibration
value (C)
Monito
r value
(M)
Difference
(C-M)
Percent of
span value (C-
M)/span value
× 100
Low-
level
High-
level

Performance Specification 2 8/2/2017
14
FIGURE 2-2. RELATIVE ACCURACY DETERMINATION.
Run No.
Date
and
time
SO2 NOXb
CO2 or
O2a SO2
a NOXa
RM CEMS Diff RM CEMS Diff RM CEMS RM CEMS Diff RM CEMS Diff
ppmc ppmc %c %c mass/GCV mass/GCV
1
2
3
4
5
6
7
8
9
10
11
12
Average
Confidence
Interval
Accuracy
a For steam generators.
b Average of three samples.
c Make sure that RM and CEMS data are on a consistent basis, either wet or dry.