Embed Size (px)
Citation preview
Q4 and 12M 2019 Performance
Analyst Meeting28 February 2020
This presentation and the discussion that follows may contain forward-lookingstatements that involve known and unknown risks, uncertainties and otherfactors that may cause the actual results, performance or achievements ofMindChamps PreSchool Limited (the “Company”) and its subsidiaries or relatedentities (the “Group”) to be materially different from any future results,performance or achievements expressed or implied by these forward-lookingstatements. None of the Group, its advisers, or its representatives, is representingor warranting that the Group’s actual future results, performance orachievements will be as discussed in such forward-looking statements. Investorsare advised that the actual performance, achievements, investment decisionsand operations of the Group may vary significantly from such statements. Thispresentation is for information purposes only and does not constitute or form anypart of an offer of, or invitation or solicitation to purchase or subscribe for, anyshares or securities in any jurisdiction in the Company. None of the Group, itsadvisers, or its representatives, shall be liable whatsoever for any loss arising,whether directly or indirectly, from any use or distribution of this presentation orthe contents herein.
Disclaimer
2
Q4 and 12M 2019 Financial and
Non-Financial Highlights
Presented by Mr. Teo Wee JoneChief Financial Officer
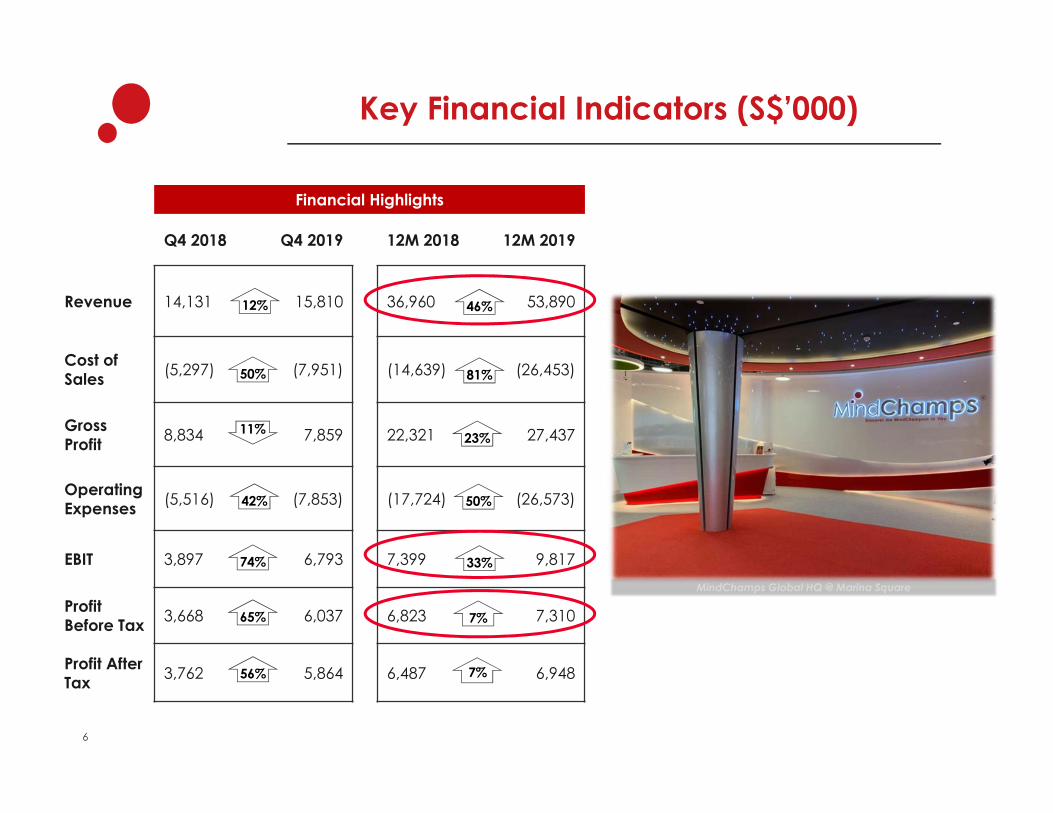
Key Financial Indicators (S$’000)
Financial Highlights
Q4 2018 Q4 2019 12M 2018 12M 2019
Revenue 14,131 15,810 36,960 53,890
Cost of Sales (5,297) (7,951) (14,639) (26,453)
Gross Profit 8,834 7,859 22,321 27,437
Operating Expenses (5,516) (7,853) (17,724) (26,573)
EBIT 3,897 6,793 7,399 9,817
Profit Before Tax 3,668 6,037 6,823 7,310
Profit After Tax 3,762 5,864 6,487 6,948
12%
11%
50%
42%
65%
56%
46%
81%
23%
50%
7%
7%
33%74%
MindChamps Global HQ @ Marina Square
6
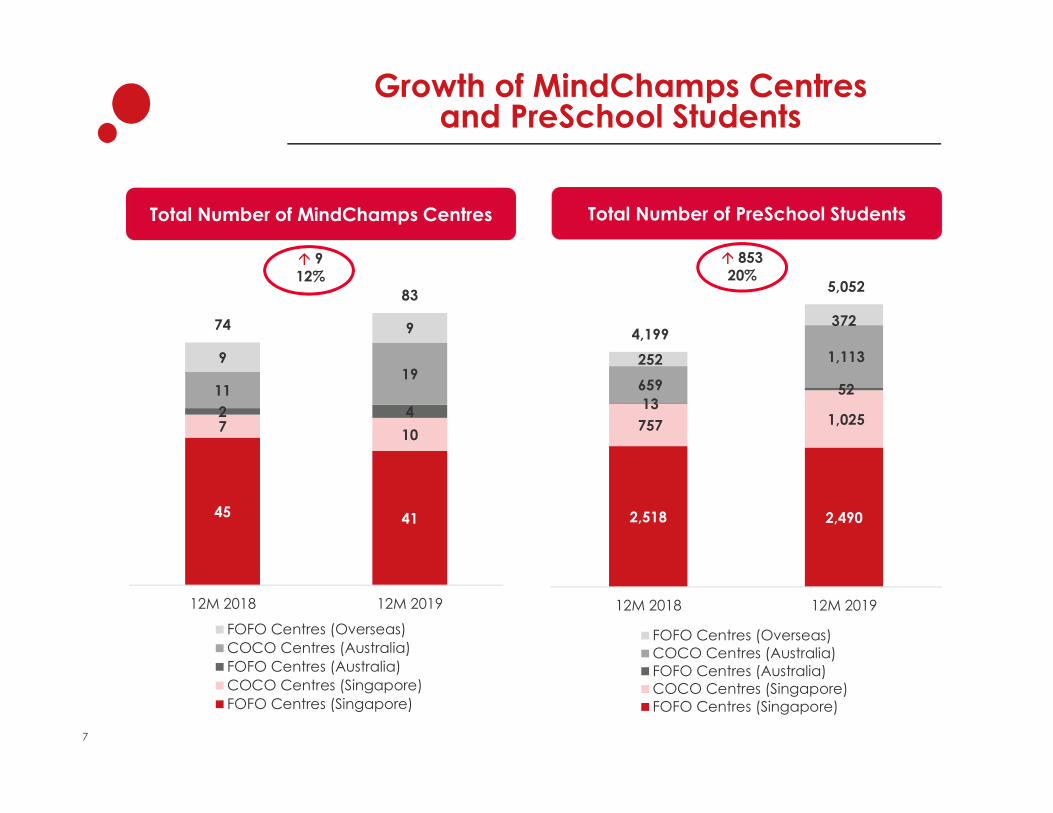
Growth of MindChamps Centres and PreSchool Students
2,518 2,490
757 1,025 13
52 659
1,113 252
372 4,199
5,052
12M 2018 12M 2019
FOFO Centres (Overseas)COCO Centres (Australia)FOFO Centres (Australia)COCO Centres (Singapore)FOFO Centres (Singapore)
85320%
45 41
7 10
2 411
199
974
83
12M 2018 12M 2019
FOFO Centres (Overseas)COCO Centres (Australia)FOFO Centres (Australia)COCO Centres (Singapore)FOFO Centres (Singapore)
Total Number of MindChamps Centres Total Number of PreSchool Students
9 12%
7
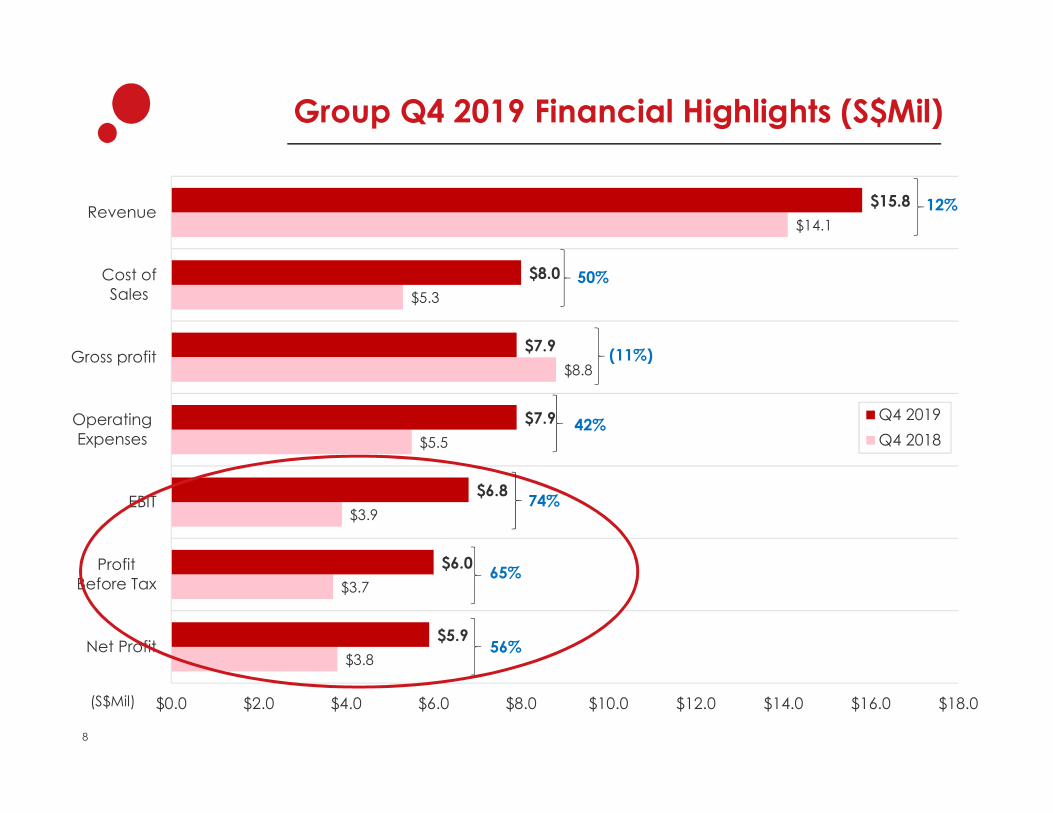
Group Q4 2019 Financial Highlights (S$Mil)
$3.8
$3.7
$3.9
$5.5
$8.8
$5.3
$14.1
$5.9
$6.0
$6.8
$7.9
$7.9
$8.0
$15.8
$0.0 $2.0 $4.0 $6.0 $8.0 $10.0 $12.0 $14.0 $16.0 $18.0
Net Profit
ProfitBefore Tax
EBIT
OperatingExpenses
Gross profit
Cost ofSales
Revenue
Q4 2019
Q4 201842%
65%
(S$Mil)
12%
50%
(11%)
56%
74%
8
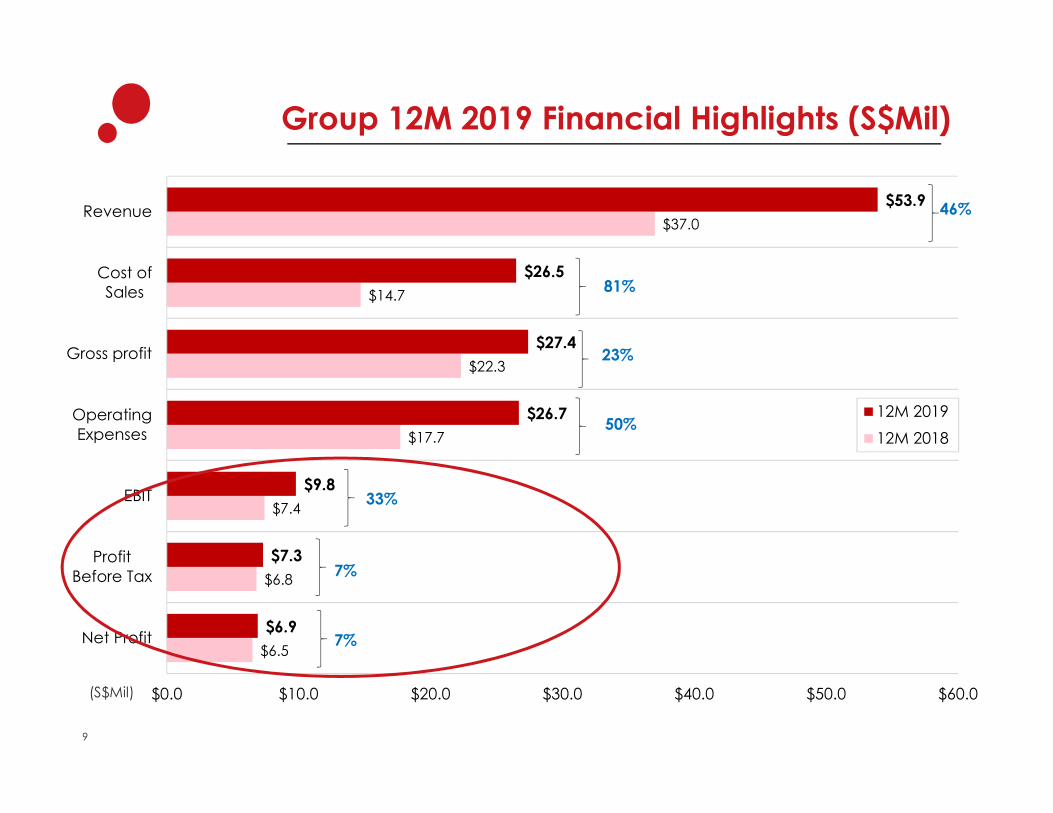
Group 12M 2019 Financial Highlights (S$Mil)
$6.5
$6.8
$7.4
$17.7
$22.3
$14.7
$37.0
$6.9
$7.3
$9.8
$26.7
$27.4
$26.5
$53.9
$0.0 $10.0 $20.0 $30.0 $40.0 $50.0 $60.0
Net Profit
ProfitBefore Tax
EBIT
OperatingExpenses
Gross profit
Cost ofSales
Revenue
12M 2019
12M 2018
46%
81%
23%
50%
33%
(S$Mil)
7%
7%
9
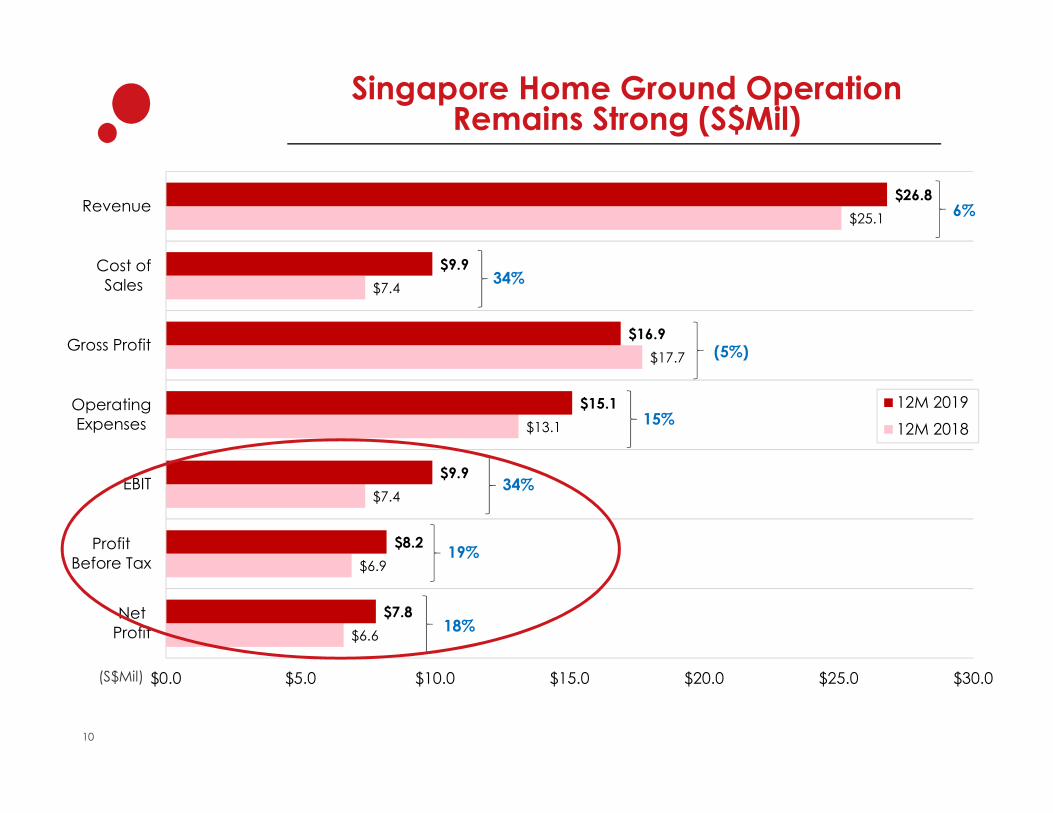
Singapore Home Ground Operation Remains Strong (S$Mil)
$6.6
$6.9
$7.4
$13.1
$17.7
$7.4
$25.1
$7.8
$8.2
$9.9
$15.1
$16.9
$9.9
$26.8
$0.0 $5.0 $10.0 $15.0 $20.0 $25.0 $30.0
NetProfit
ProfitBefore Tax
EBIT
OperatingExpenses
Gross Profit
Cost ofSales
Revenue
12M 2019
12M 2018
6%
34%
(5%)
15%
19%
18%
(S$Mil)
34%
10
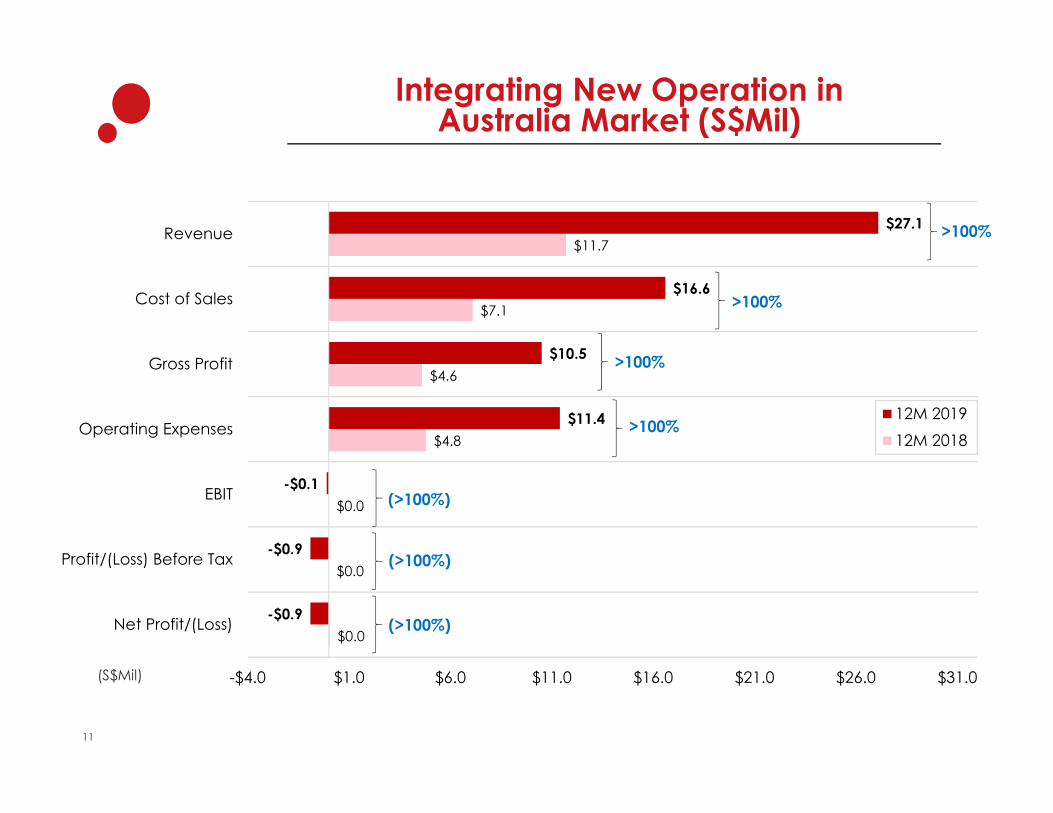
Integrating New Operation in Australia Market (S$Mil)
$0.0
$0.0
$0.0
$4.8
$4.6
$7.1
$11.7
-$0.9
-$0.9
-$0.1
$11.4
$10.5
$16.6
$27.1
-$4.0 $1.0 $6.0 $11.0 $16.0 $21.0 $26.0 $31.0
Net Profit/(Loss)
Profit/(Loss) Before Tax
EBIT
Operating Expenses
Gross Profit
Cost of Sales
Revenue
12M 2019
12M 2018
>100%
>100%
>100%
>100%
(>100%)
(>100%)
(S$Mil)
(>100%)
11
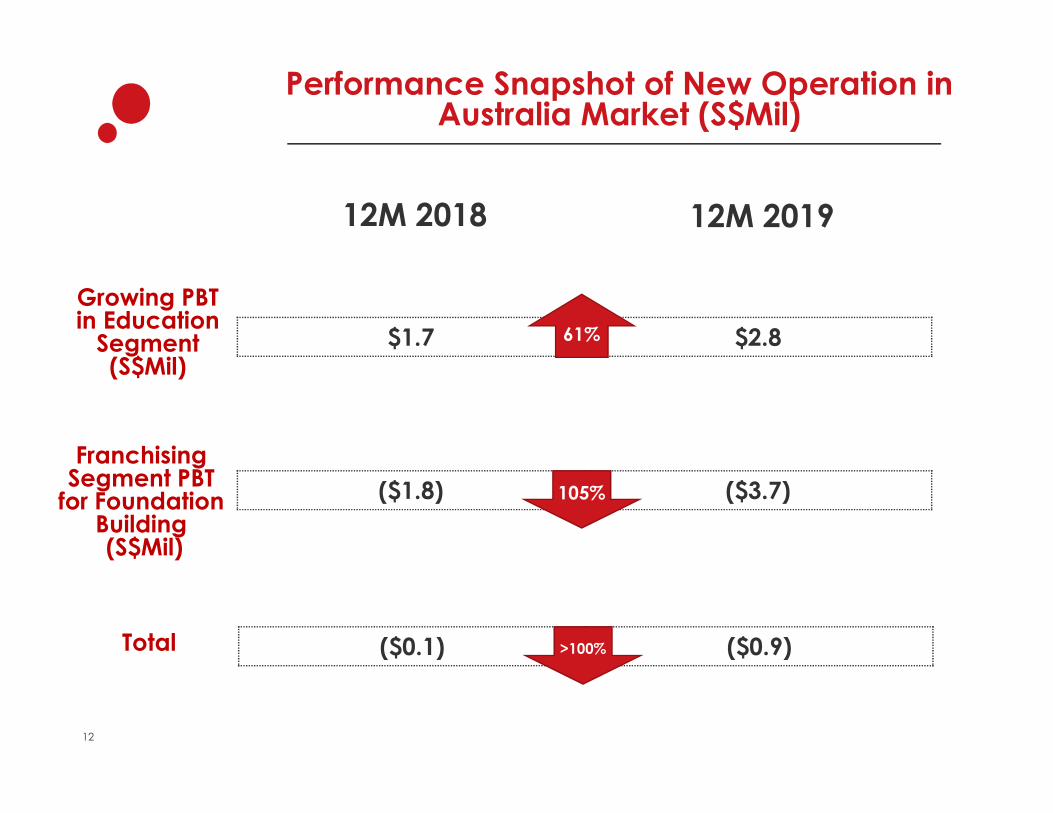
Performance Snapshot of New Operation in Australia Market (S$Mil)
12
12M 2019
($1.8) ($3.7)Franchising
Segment PBT for Foundation
Building(S$Mil)
$1.7 $2.8
Growing PBT in Education
Segment (S$Mil)
61%
105%
12M 2018
($0.1) ($0.9)Total >100%
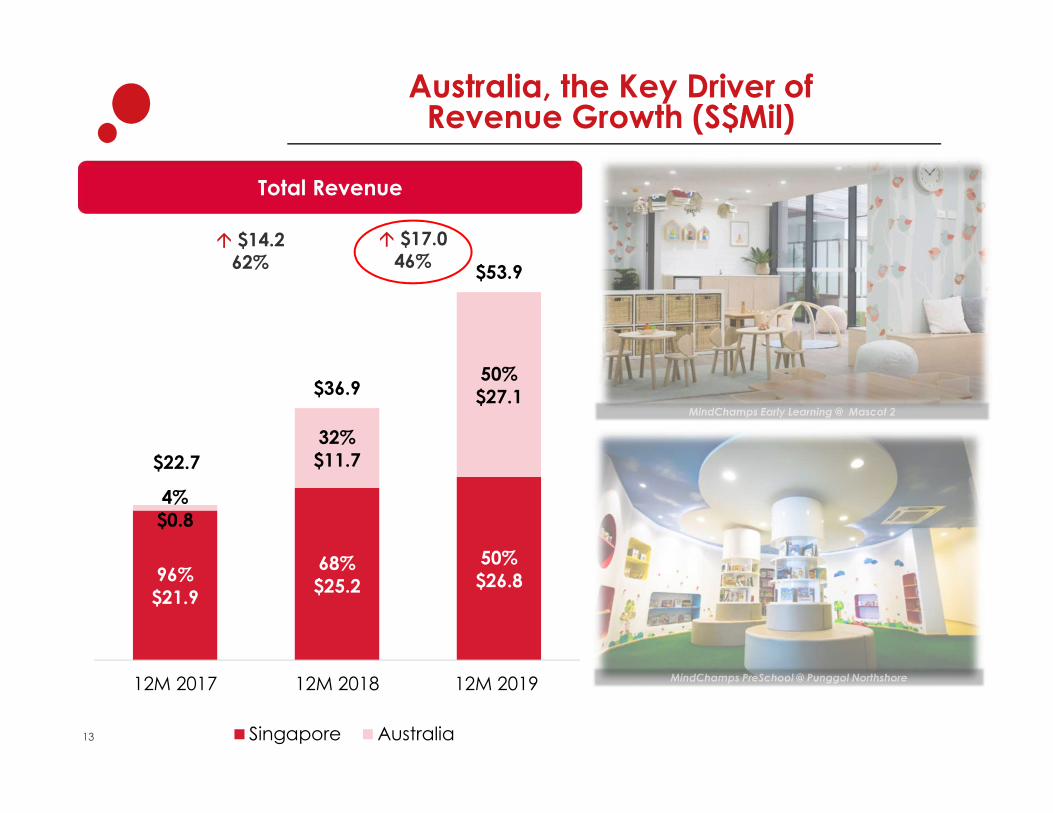
Australia, the Key Driver ofRevenue Growth (S$Mil)
96%$21.9
68%$25.2
50%$26.8
4%$0.8
32%$11.7
50%$27.1
$22.7
$36.9
$53.9
12M 2017 12M 2018 12M 2019
Singapore Australia
Total Revenue
$14.262%
$17.046%
13
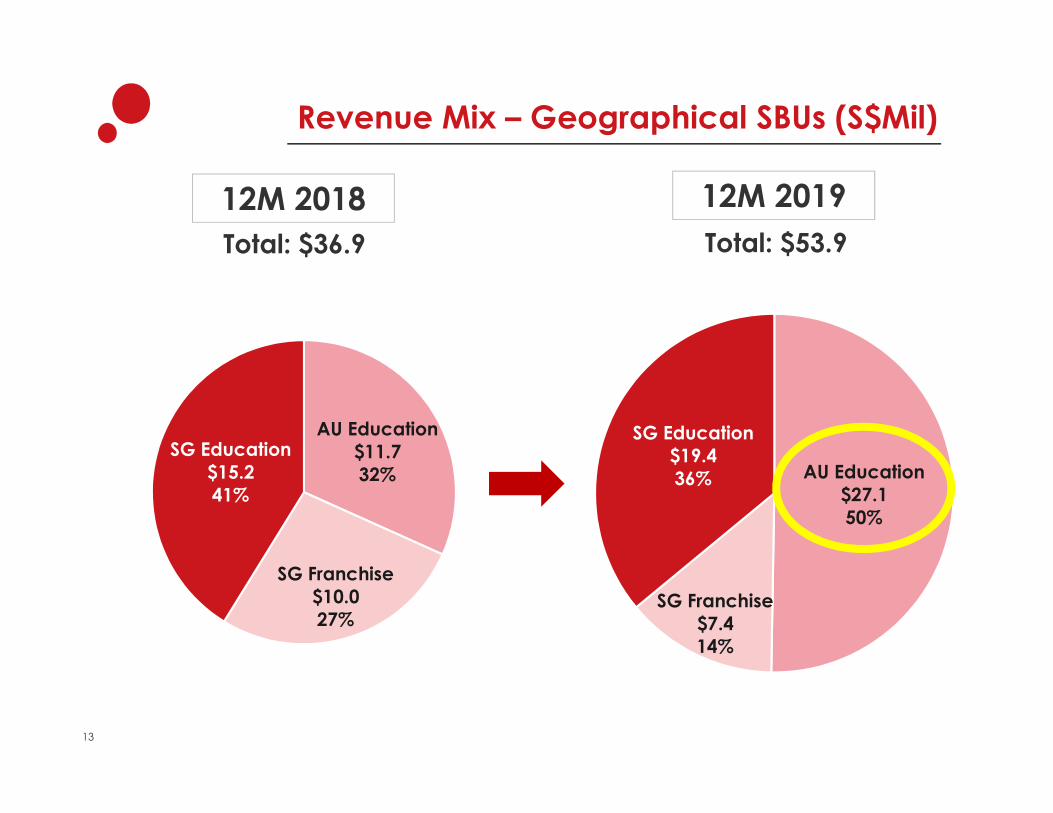
Revenue Mix – Geographical SBUs (S$Mil)
AU Education$27.1 50%
SG Franchise$7.4 14%
SG Education$19.4 36%
AU Education$11.7 32%
SG Franchise$10.0 27%
SG Education$15.2 41%
12M 2018 12M 2019Total: $36.9 Total: $53.9
13
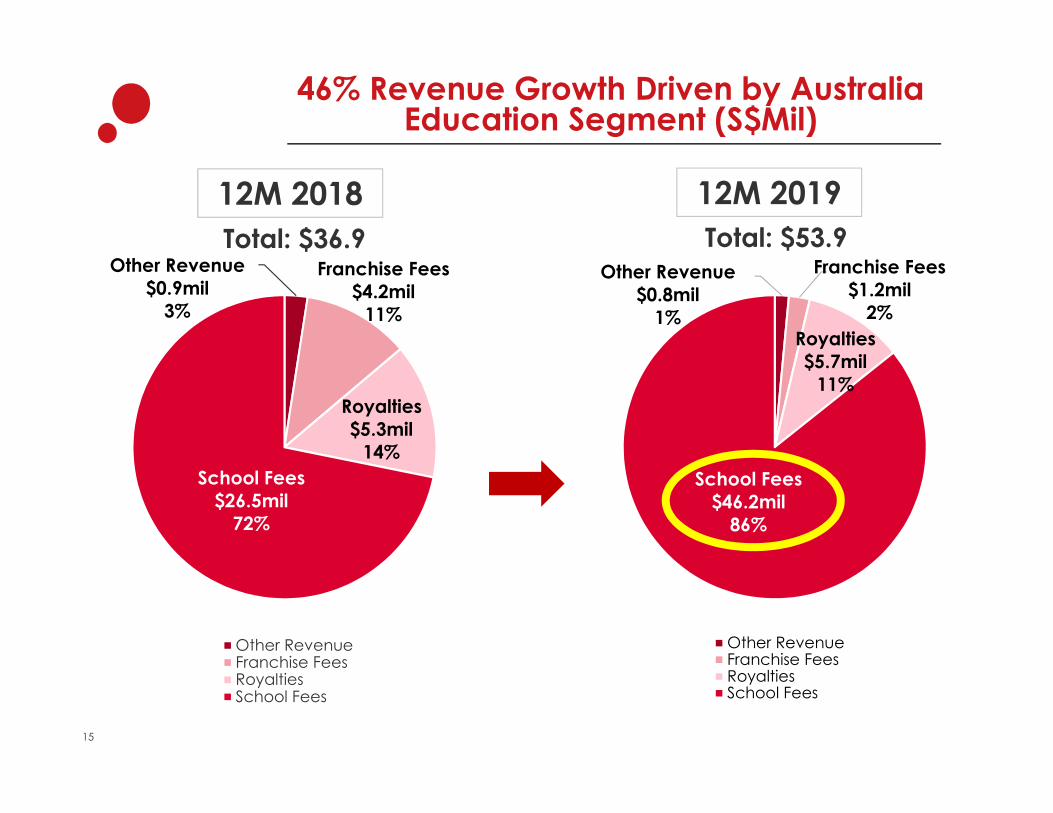
46% Revenue Growth Driven by Australia Education Segment (S$Mil)
Other Revenue$0.8mil
1%
Franchise Fees$1.2mil
2%Royalties$5.7mil
11%
School Fees$46.2mil
86%
Other RevenueFranchise FeesRoyaltiesSchool Fees
Other Revenue$0.9mil
3%
Franchise Fees$4.2mil
11%
Royalties$5.3mil
14%School Fees
$26.5mil72%
Other RevenueFranchise FeesRoyaltiesSchool Fees
12M 2018 12M 2019Total: $36.9 Total: $53.9
15
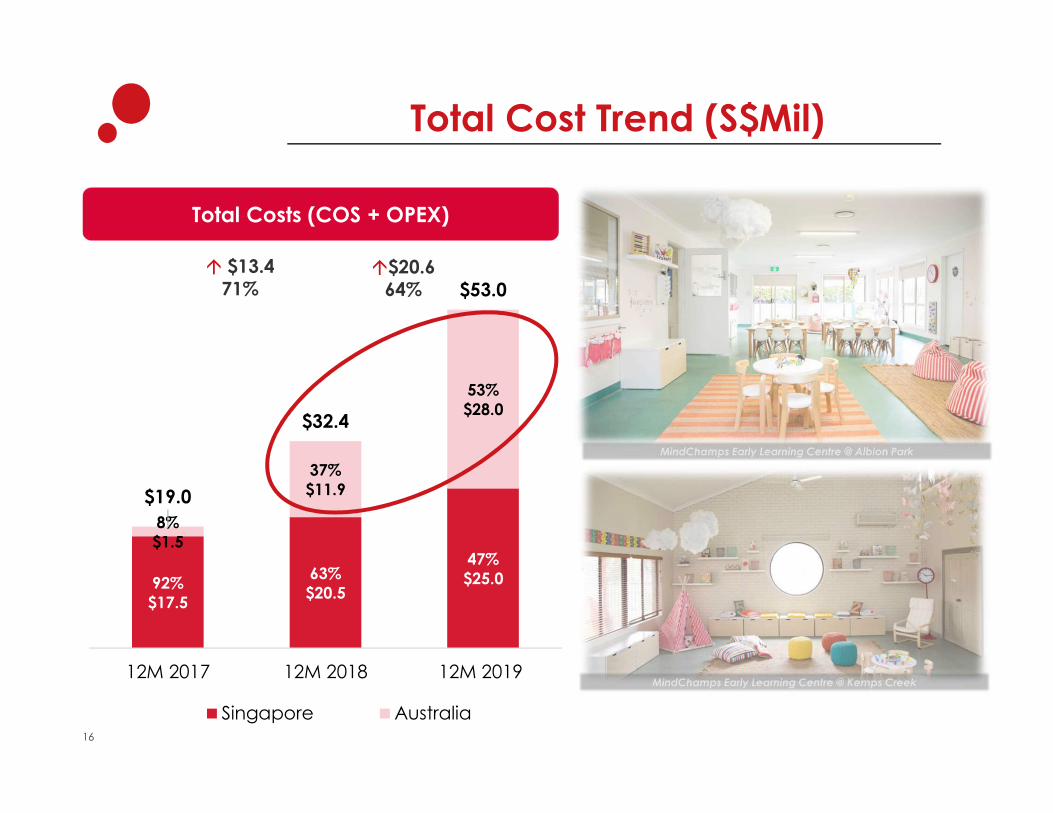
Total Cost Trend (S$Mil)
92%$17.5
63%$20.5
47%$25.0
8%$1.5
37%$11.9
53%$28.0
$19.0
$32.4
$53.0
12M 2017 12M 2018 12M 2019
Singapore Australia
Total Costs (COS + OPEX)
$13.471%
$20.6 64%
16
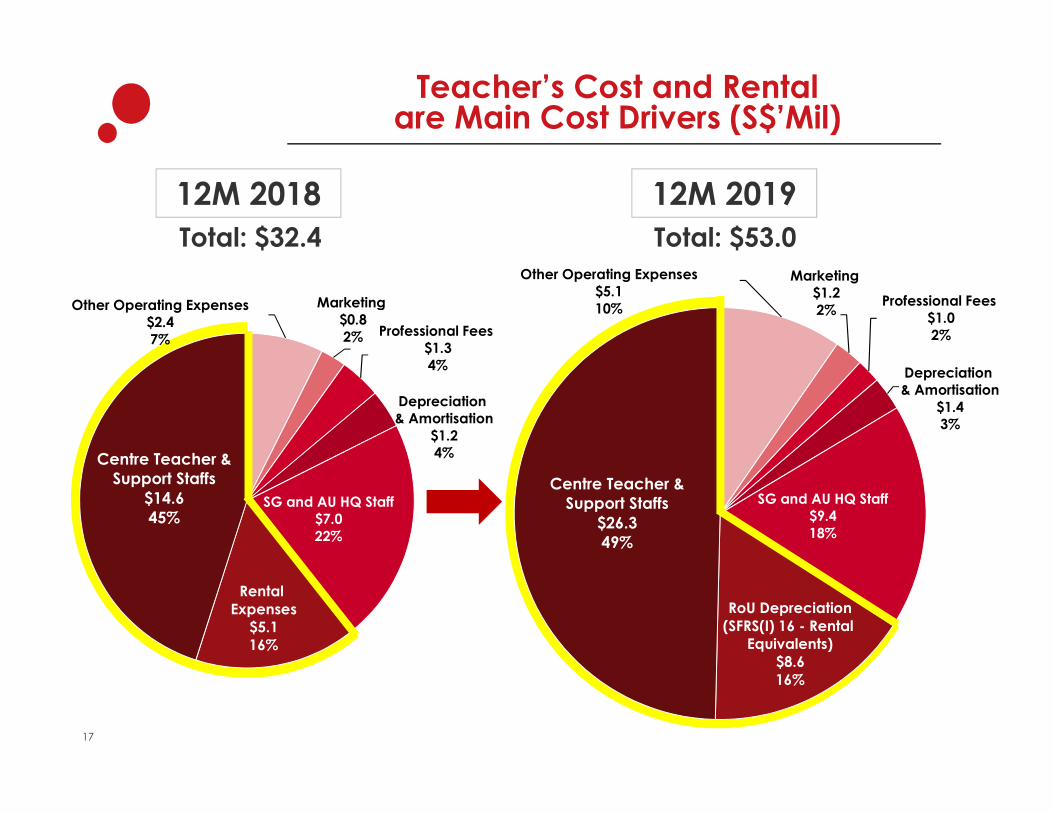
Other Operating Expenses$5.1 10%
Marketing $1.2 2%
Professional Fees $1.0 2%
Depreciation & Amortisation
$1.4 3%
SG and AU HQ Staff$9.4 18%
RoU Depreciation(SFRS(I) 16 - Rental
Equivalents)$8.6 16%
Centre Teacher &Support Staffs
$26.3 49%
Other Operating Expenses$2.4 7%
Marketing $0.8 2% Professional Fees
$1.3 4%
Depreciation & Amortisation
$1.2 4%
SG and AU HQ Staff$7.0 22%
Rental Expenses
$5.1 16%
Centre Teacher &Support Staffs
$14.6 45%
Teacher’s Cost and Rental are Main Cost Drivers (S$’Mil)
12M 2018 12M 2019Total: $32.4 Total: $53.0
17
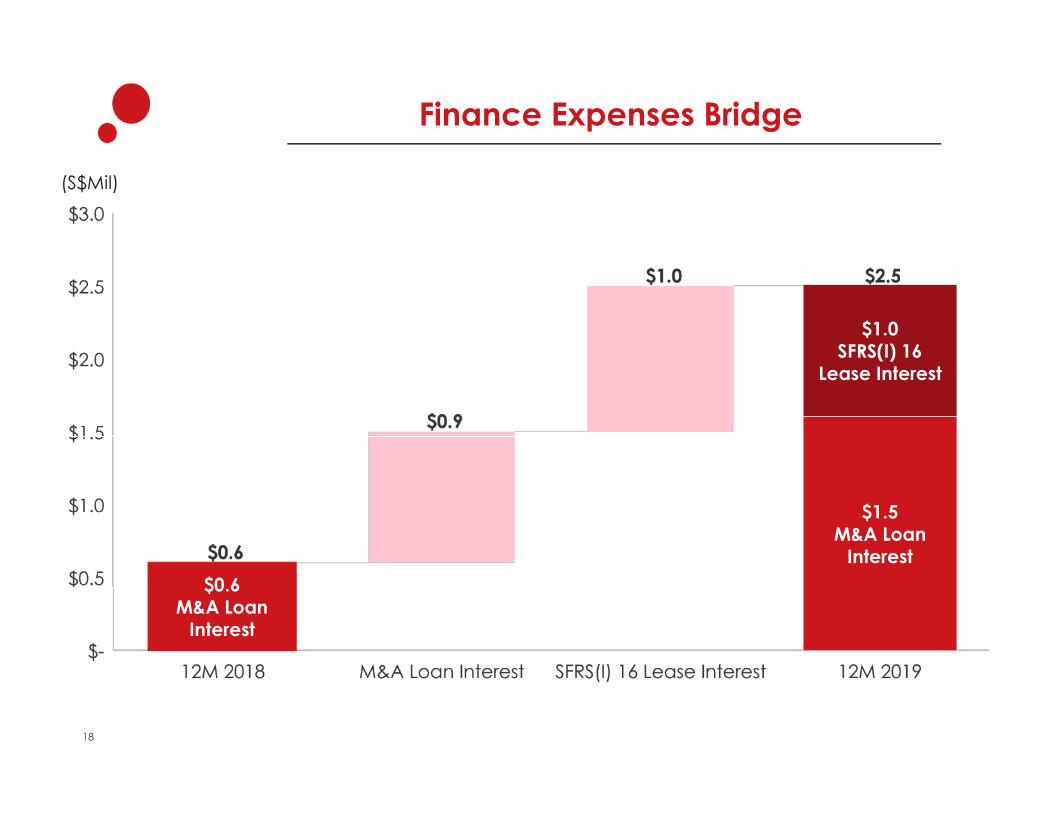
Finance Expenses Bridge
(S$Mil)
$1.5 M&A Loan
Interest
$1.0 SFRS(I) 16
Lease Interest
$0.6 M&A Loan
Interest
18
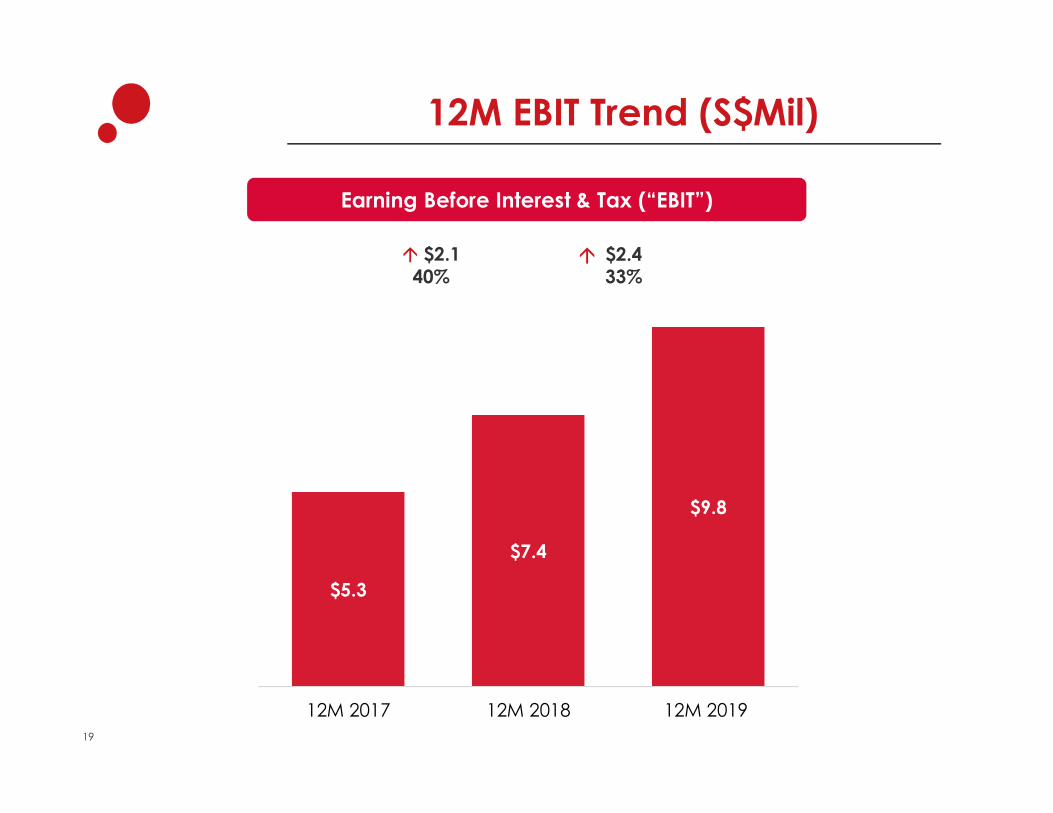
12M EBIT Trend (S$Mil)
$5.3
$7.4
$9.8
12M 2017 12M 2018 12M 2019
Earning Before Interest & Tax (“EBIT”)
$2.140%
$2.4 33%
19
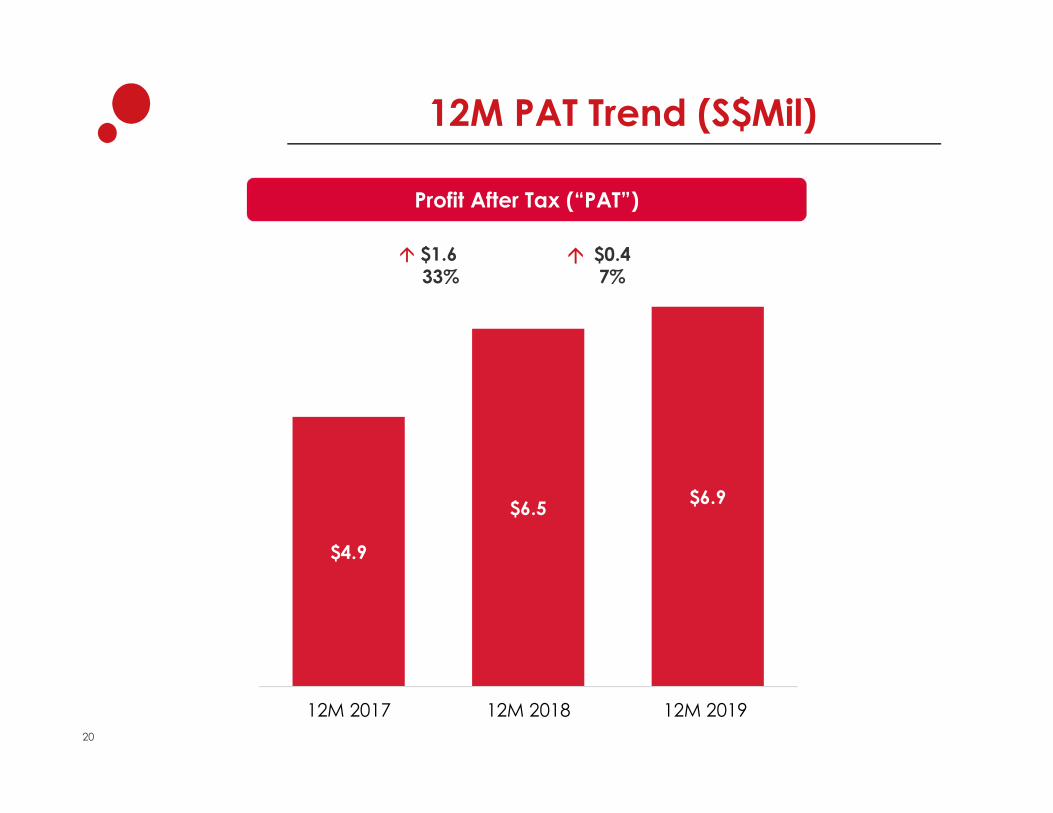
12M PAT Trend (S$Mil)
$4.9
$6.5 $6.9
12M 2017 12M 2018 12M 2019
Profit After Tax (“PAT”)
$1.633%
$0.4 7%
20
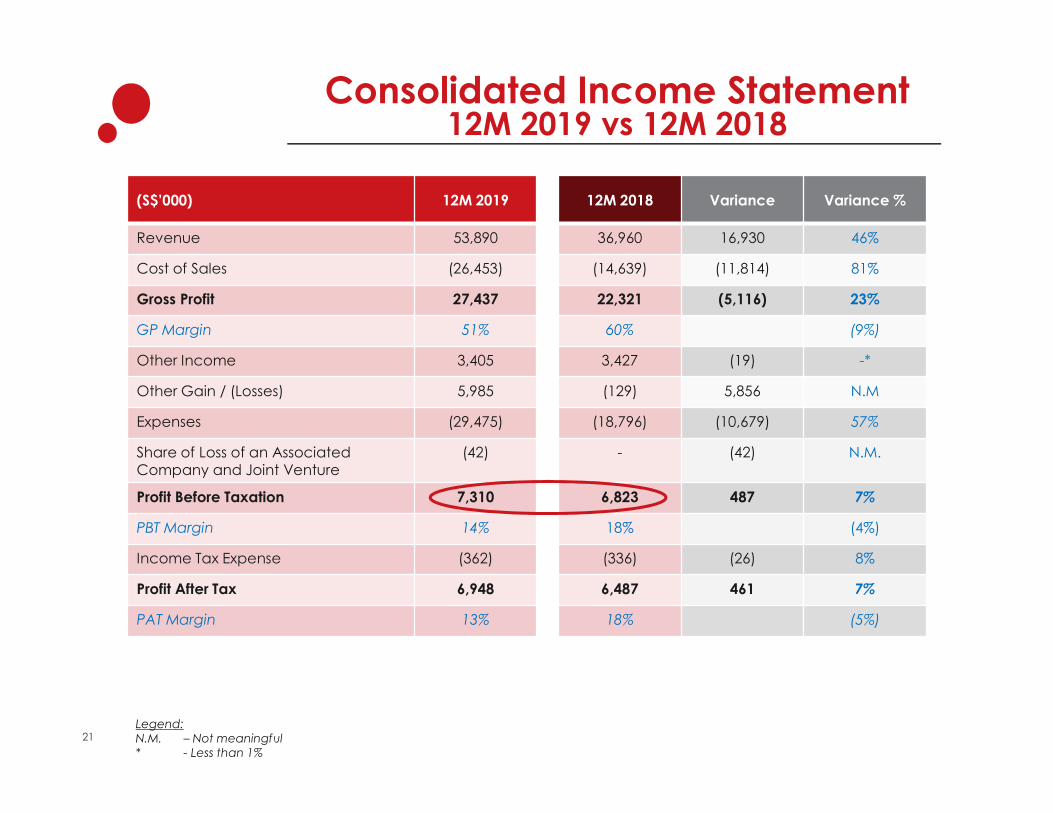
Consolidated Income Statement12M 2019 vs 12M 2018
(S$’000) 12M 2019 12M 2018 Variance Variance %
Revenue 53,890 36,960 16,930 46%
Cost of Sales (26,453) (14,639) (11,814) 81%
Gross Profit 27,437 22,321 (5,116) 23%
GP Margin 51% 60% (9%)
Other Income 3,405 3,427 (19) -*
Other Gain / (Losses) 5,985 (129) 5,856 N.M
Expenses (29,475) (18,796) (10,679) 57%
Share of Loss of an Associated Company and Joint Venture
(42) - (42) N.M.
Profit Before Taxation 7,310 6,823 487 7%
PBT Margin 14% 18% (4%)
Income Tax Expense (362) (336) (26) 8%
Profit After Tax 6,948 6,487 461 7%
PAT Margin 13% 18% (5%)
Legend:N.M. – Not meaningful* - Less than 1%
21
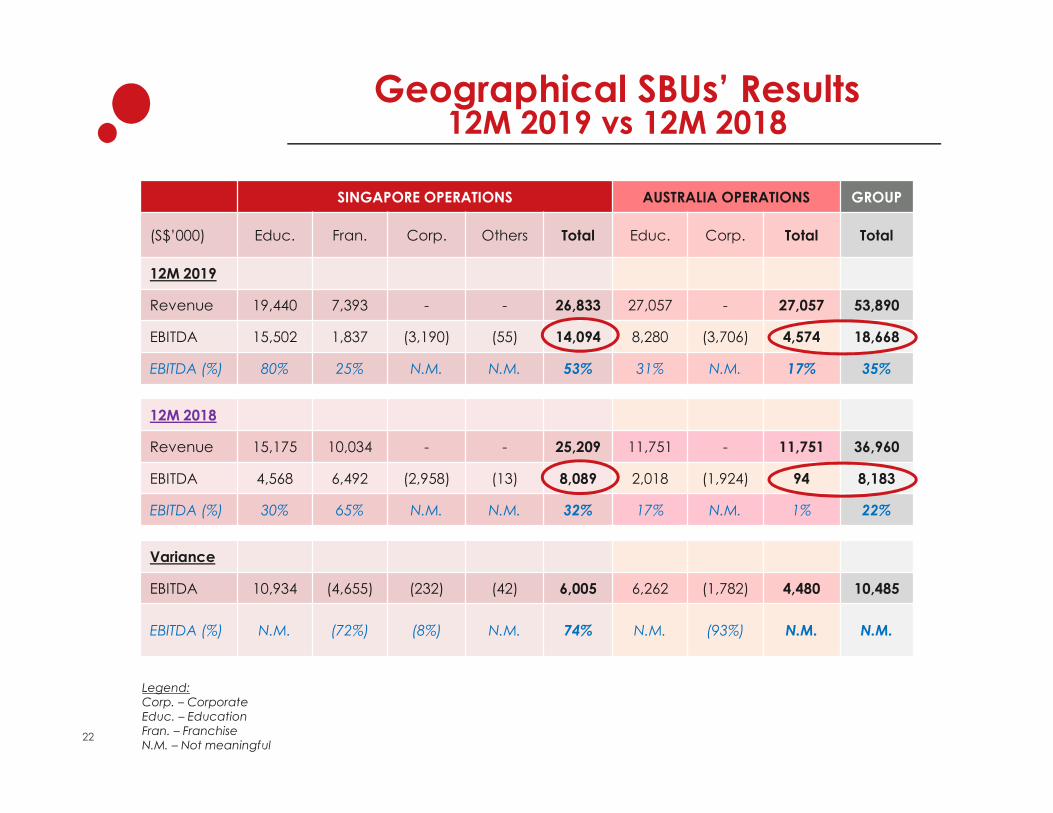
Geographical SBUs’ Results 12M 2019 vs 12M 2018
SINGAPORE OPERATIONS AUSTRALIA OPERATIONS GROUP
(S$’000) Educ. Fran. Corp. Others Total Educ. Corp. Total Total
12M 2019
Revenue 19,440 7,393 - - 26,833 27,057 - 27,057 53,890
EBITDA 15,502 1,837 (3,190) (55) 14,094 8,280 (3,706) 4,574 18,668
EBITDA (%) 80% 25% N.M. N.M. 53% 31% N.M. 17% 35%
12M 2018
Revenue 15,175 10,034 - - 25,209 11,751 - 11,751 36,960
EBITDA 4,568 6,492 (2,958) (13) 8,089 2,018 (1,924) 94 8,183
EBITDA (%) 30% 65% N.M. N.M. 32% 17% N.M. 1% 22%
Variance
EBITDA 10,934 (4,655) (232) (42) 6,005 6,262 (1,782) 4,480 10,485
EBITDA (%) N.M. (72%) (8%) N.M. 74% N.M. (93%) N.M. N.M.
Legend:Corp. – CorporateEduc. – EducationFran. – FranchiseN.M. – Not meaningful
22
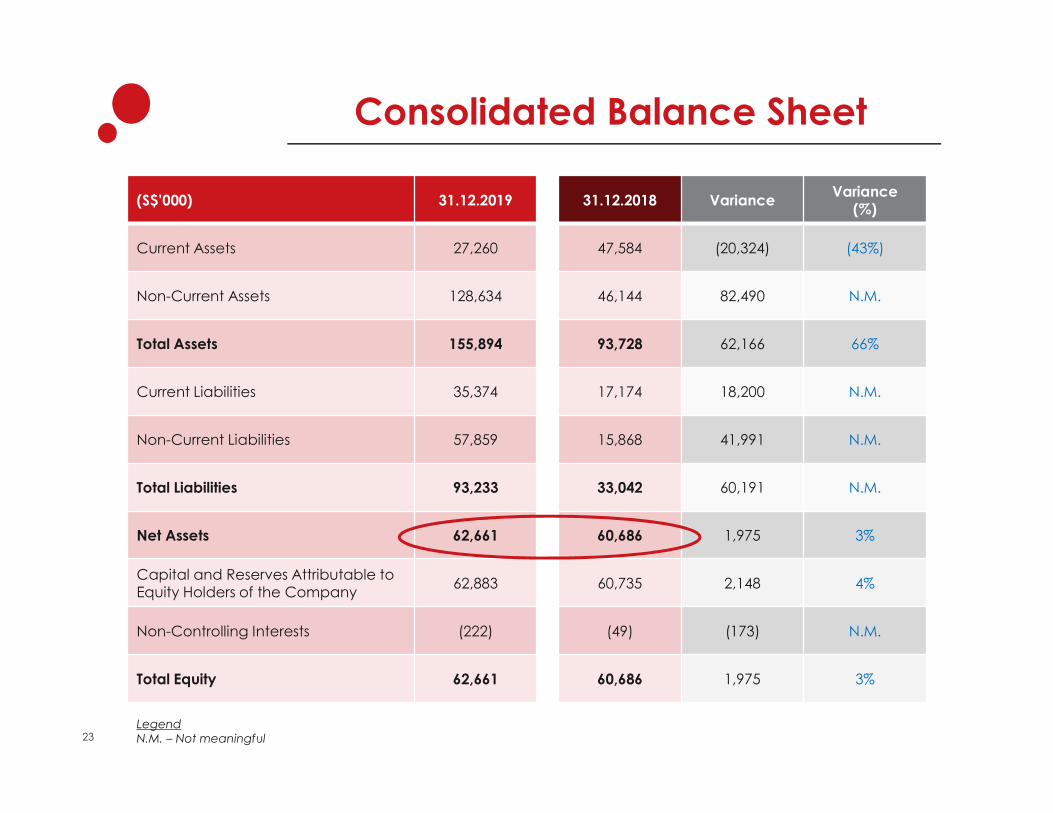
Consolidated Balance Sheet
(S$’000) 31.12.2019 31.12.2018 Variance Variance (%)
Current Assets 27,260 47,584 (20,324) (43%)
Non-Current Assets 128,634 46,144 82,490 N.M.
Total Assets 155,894 93,728 62,166 66%
Current Liabilities 35,374 17,174 18,200 N.M.
Non-Current Liabilities 57,859 15,868 41,991 N.M.
Total Liabilities 93,233 33,042 60,191 N.M.
Net Assets 62,661 60,686 1,975 3%
Capital and Reserves Attributable to Equity Holders of the Company
62,883 60,735 2,148 4%
Non-Controlling Interests (222) (49) (173) N.M.
Total Equity 62,661 60,686 1,975 3%
LegendN.M. – Not meaningful23
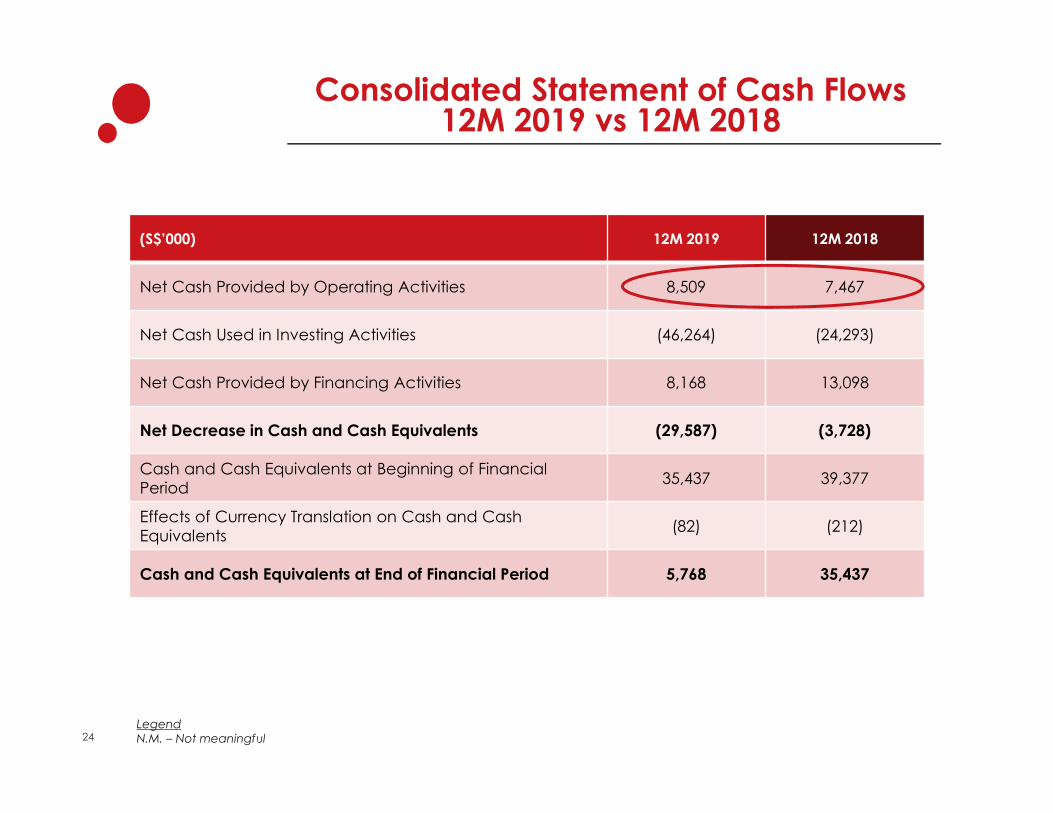
Consolidated Statement of Cash Flows 12M 2019 vs 12M 2018
(S$’000) 12M 2019 12M 2018
Net Cash Provided by Operating Activities 8,509 7,467
Net Cash Used in Investing Activities (46,264) (24,293)
Net Cash Provided by Financing Activities 8,168 13,098
Net Decrease in Cash and Cash Equivalents (29,587) (3,728)
Cash and Cash Equivalents at Beginning of Financial Period
35,437 39,377
Effects of Currency Translation on Cash and Cash Equivalents
(82) (212)
Cash and Cash Equivalents at End of Financial Period 5,768 35,437
LegendN.M. – Not meaningful24
25
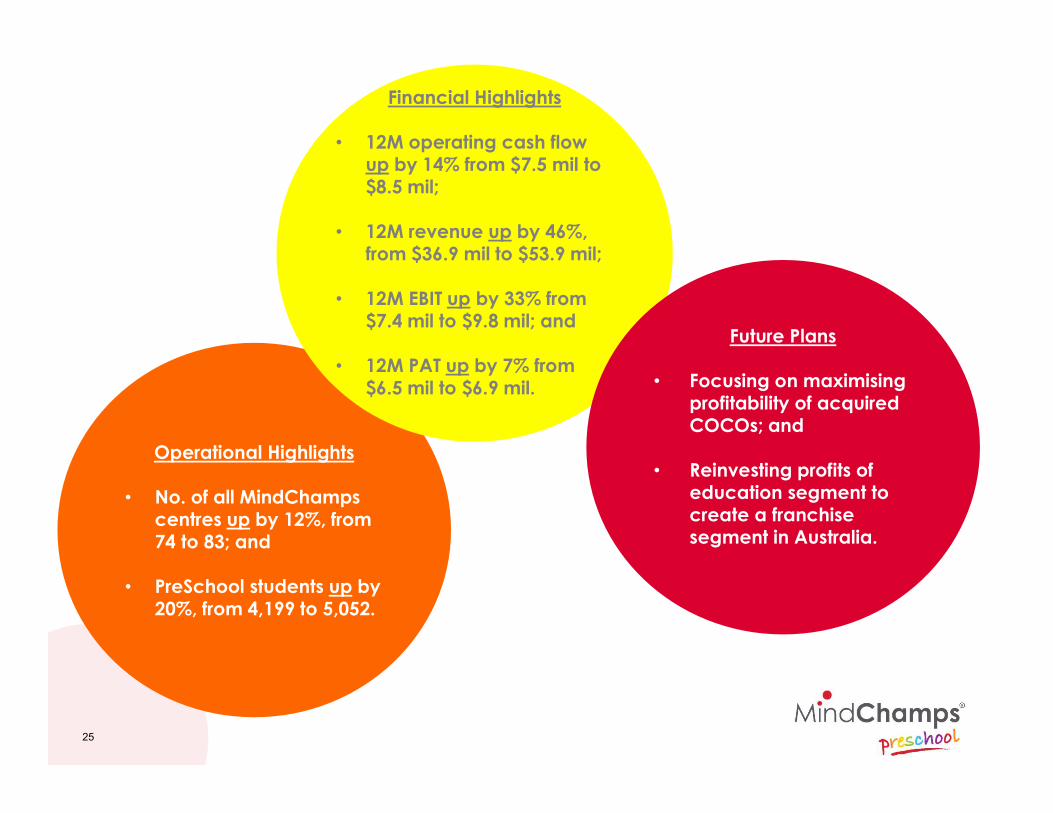
Operational Highlights
• No. of all MindChampscentres up by 12%, from 74 to 83; and
• PreSchool students up by 20%, from 4,199 to 5,052.
Financial Highlights
• 12M operating cash flow up by 14% from $7.5 mil to $8.5 mil;
• 12M revenue up by 46%, from $36.9 mil to $53.9 mil;
• 12M EBIT up by 33% from $7.4 mil to $9.8 mil; and
• 12M PAT up by 7% from $6.5 mil to $6.9 mil.
Future Plans
• Focusing on maximisingprofitability of acquired COCOs; and
• Reinvesting profits of education segment to create a franchise segment in Australia.