Embed Size (px)
DESCRIPTION
Analyst Meeting Financial report of Sava Re Group Six Months to 30 June 2011. August 2011. Major events. EVENTS PRIOR TO THE REPORTING DATE. Request of the Securities Market Agency relating to a potential takeover bid for POSR shares. - PowerPoint PPT Presentation
Citation preview


Pozavarovalnica Sava, d. d.
Analyst Meeting Financial report of
Sava Re GroupSix Months to 30 June 2011
August 2011

Major events
Recapitalisation of the subsidiary Sava životno osiguranje (Serbia) with EUR 0,3m
EVENTS PRIOR TO THE REPORTING DATE
EVENTS AFTER THE REPORTING DATE
Mateja Treven starts her 5-year term of office as Management Board Member on 3 February 2011
Request of the Securities Market Agency relating to a potential takeover bid for POSR shares
Sava Reinsurance Company signs a memorandum of co-operation on setting up a life insurer in Azerbaijan
Claim received from the designers of Sava’s former logo in the amount of EUR 0,4m
Resolution adopted to recapitalise the subsidiary Sava Tabak (Macedonia) with EUR 2,5m
Resolution adopted to recapitalise the subsidiary Velebit usluge (Croatia) with EUR 1,5m
3
The 24th General Meeting takes place on 29 June 2011
In July, Velebit usluge is recapitalised with EUR 0,5m
In July, recapitalisation of Zavarovalnica Maribor of EUR 5,9m completed
In July, the controlling company decides to recapitalise Sava životno osiguranje with EUR 0,4m
Increased stake in Zavarovalnica Maribor to 48,68%
General Meeting of Zavarovalnice Maribor called; proposal for dividend payout

Results 1-6 2011; Sava Re Group4
Sava Reinsurance Company 1-6 2010 1-6 2011 Plan 2011Index
2011/2010Realised as % of plan
Gross premiums written (EUR) 141.824.962 143.568.044 266.306.189 101,2 53,9%
Net profit/loss for the period (EUR) 2.734.450 3.990.775 8.480.464 145,9 47,1%
Net combined ratio 101,6% 93,0% 98,9% 91,5 94,0%
31.12.2010 31.6.2011 31.12.2011
Shareholders’equity (EUR) 154.684.613 157.643.413 162.038.302 101,9 97,3%
-The growth in gross premiums was contributed by the growth in Zavarovalnica Tilia and Illyria (the Kosovan non-life insurer). Premium income dropped in the Serbian market due to the strategy of limiting the growth in motor TPL and in Macedonia due to the loss of a large account. Also the the premium income of the Croatian life insurer dropped as single premium payments were larger in the past and surrenders are becoming more frequent.
- Results improved mostly because of more favourable loss ratios as a result of more selective underwriting and achieved growth in profitable busness segments.
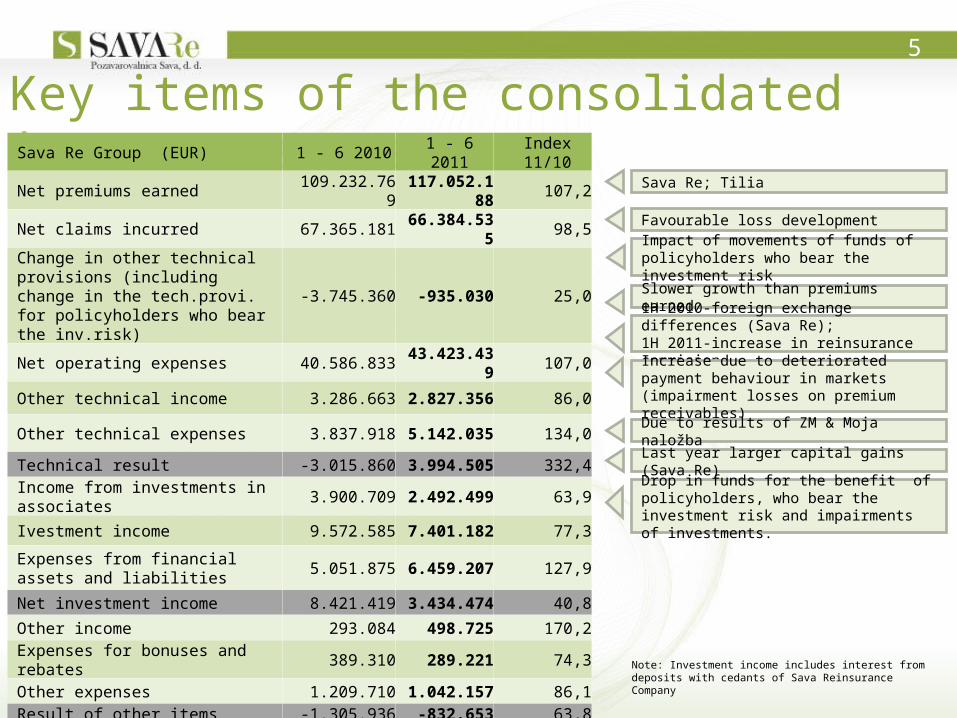
Key items of the consolidated income statement5
Sava Re; Tilia
Favourable loss development
Slower growth than premiums earned
1H 2010-foreign exchange differences (Sava Re);1H 2011-increase in reinsurance commision
Increase due to deteriorated payment behaviour in markets (impairment losses on premium receivables)
Sava Re Group (EUR) 1 - 6 2010 1 - 6 2011 Index 11/10
Net premiums earned 109.232.769 117.052.188 107,2
Net claims incurred 67.365.181 66.384.535 98,5
Change in other technical provisions (including change in the tech.provi. for policyholders who bear the inv.risk)
-3.745.360 -935.030 25,0
Net operating expenses 40.586.833 43.423.439 107,0
Other technical income 3.286.663 2.827.356 86,0
Other technical expenses 3.837.918 5.142.035 134,0
Technical result -3.015.860 3.994.505 332,4
Income from investments in associates 3.900.709 2.492.499 63,9
Ivestment income 9.572.585 7.401.182 77,3
Expenses from financial assets and liabilities
5.051.875 6.459.207 127,9
Net investment income 8.421.419 3.434.474 40,8
Other income 293.084 498.725 170,2
Expenses for bonuses and rebates 389.310 289.221 74,3
Other expenses 1.209.710 1.042.157 86,1
Result of other items -1.305.936 -832.653 63,8Profit/loss before tax 4.099.624 6.596.326 160,9
Net profit/loss for the period 2.734.450 3.990.775 145,9
Due to results of ZM & Moja naložba
Last year larger capital gains (Sava Re)
Drop in funds for the benefit of policyholders, who bear the investment risk and impairments of investments.
Note: Investment income includes interest from deposits with cedants of Sava Reinsurance Company
Impact of movements of funds of policyholders who bear the investment risk
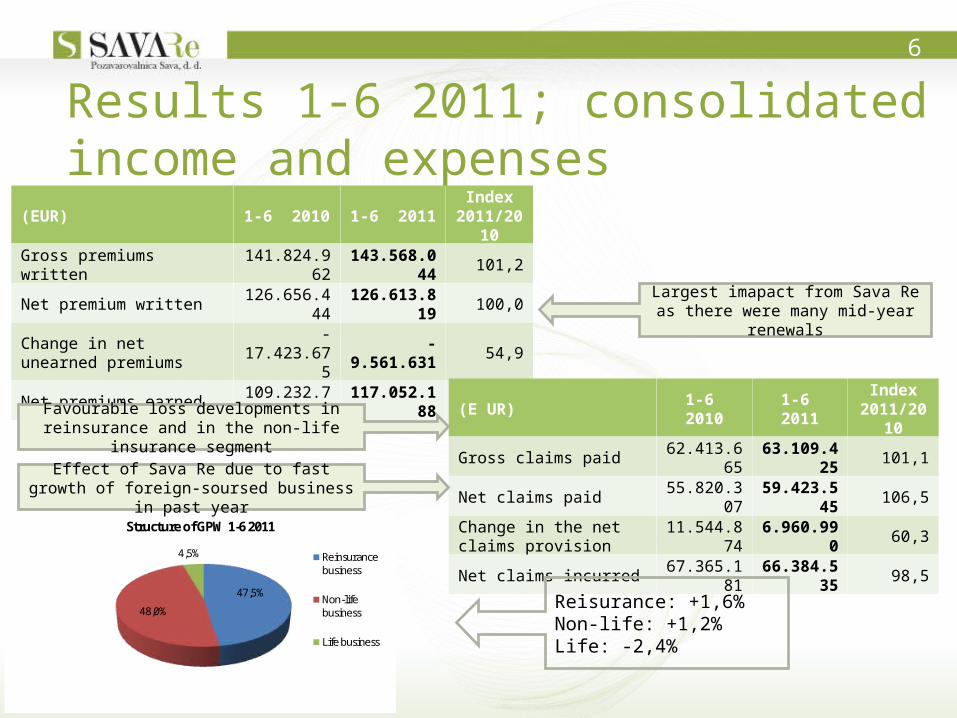
Results 1-6 2011; consolidated income and expenses
6
(EUR) 1-6 2010 1-6 2011Index
2011/2010
Gross premiums written 141.824.962 143.568.044 101,2
Net premium written 126.656.444 126.613.819 100,0Change in net unearned premiums
-17.423.675 -9.561.631 54,9
Net premiums earned 109.232.769 117.052.188 107,2
(E UR) 1-6 2010 1-6 2011Index
2011/2010Gross claims paid 62.413.665 63.109.425 101,1
Net claims paid 55.820.307 59.423.545 106,5Change in the net claims provision
11.544.874 6.960.990 60,3
Net claims incurred 67.365.181 66.384.535 98,5
Reisurance: +1,6%Non-life: +1,2%Life: -2,4%
Largest imapact from Sava Re as there were many mid-year renewals
Favourable loss developments in reinsurance and in the non-life insurance segment
47,5%
48,0%
4,5%
Structure of GPW 1-6 2011
Reinsurance business
Non-life business
Life business
Effect of Sava Re due to fast growth of foreign-soursed business in past year
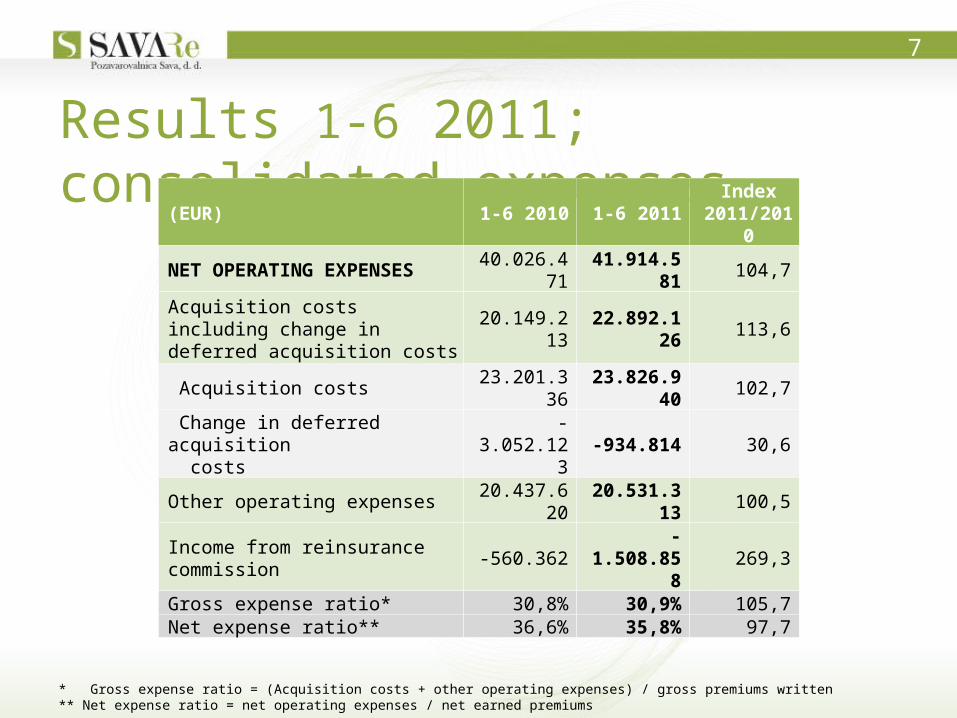
Results 1-6 2011; consolidated expenses
7
(EUR) 1-6 2010 1-6 2011Index
2011/2010
NET OPERATING EXPENSES 40.026.471 41.914.581 104,7
Acquisition costs including change in deferred acquisition costs
20.149.213 22.892.126 113,6
Acquisition costs 23.201.336 23.826.940 102,7
Change in deferred acquisition costs
-3.052.123 -934.814 30,6
Other operating expenses 20.437.620 20.531.313 100,5
Income from reinsurance commission -560.362 -1.508.858 269,3
Gross expense ratio* 30,8% 30,9% 105,7Net expense ratio** 36,6% 35,8% 97,7
* Gross expense ratio = (Acquisition costs + other operating expenses) / gross premiums written** Net expense ratio = net operating expenses / net earned premiums
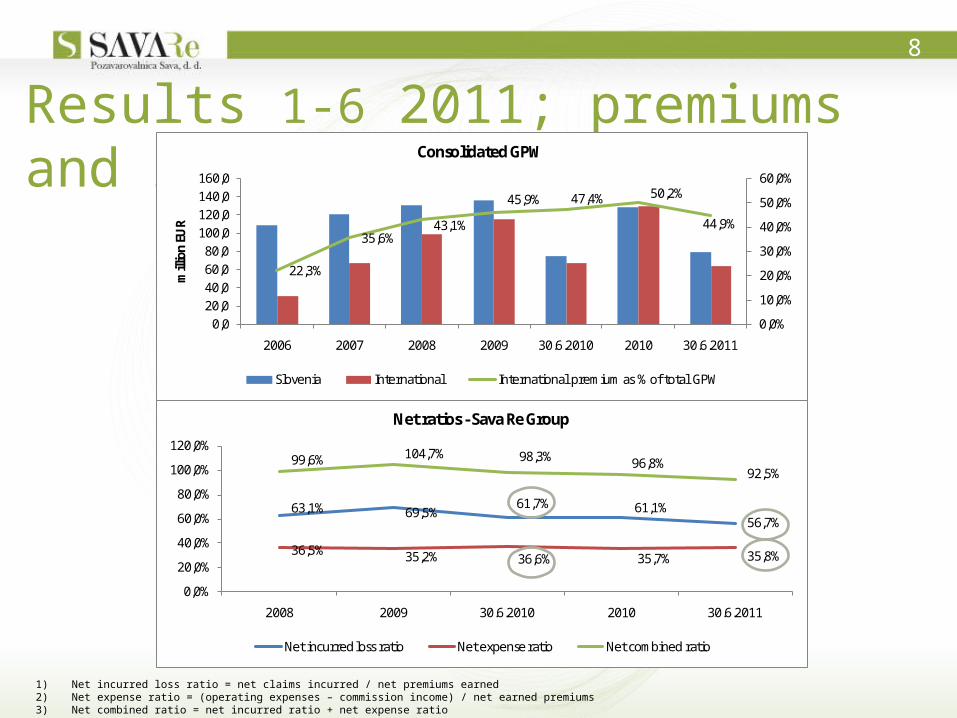
Results 1-6 2011; premiums and ratios8
1) Net incurred loss ratio = net claims incurred / net premiums earned2) Net expense ratio = (operating expenses – commission income) / net earned premiums 3) Net combined ratio = net incurred ratio + net expense ratio
63,1% 69,5%61,7% 61,1%
56,7%
36,5% 35,2% 36,6% 35,7% 35,8%
99,6% 104,7% 98,3% 96,8%92,5%
0,0%
20,0%
40,0%
60,0%
80,0%
100,0%
120,0%
2008 2009 30.6.2010 2010 30.6.2011
Net ratios - Sava Re Group
Net incurred loss ratio Net expense ratio Net combined ratio
22,3%
35,6%43,1%
45,9% 47,4% 50,2%
44,9%
0,0%
10,0%
20,0%
30,0%
40,0%
50,0%
60,0%
0,020,040,060,080,0
100,0120,0140,0160,0
2006 2007 2008 2009 30.6.2010 2010 30.6.2011
mill
ion
EUR
Consolidated GPW
Slovenia International International premium as % of total GPW
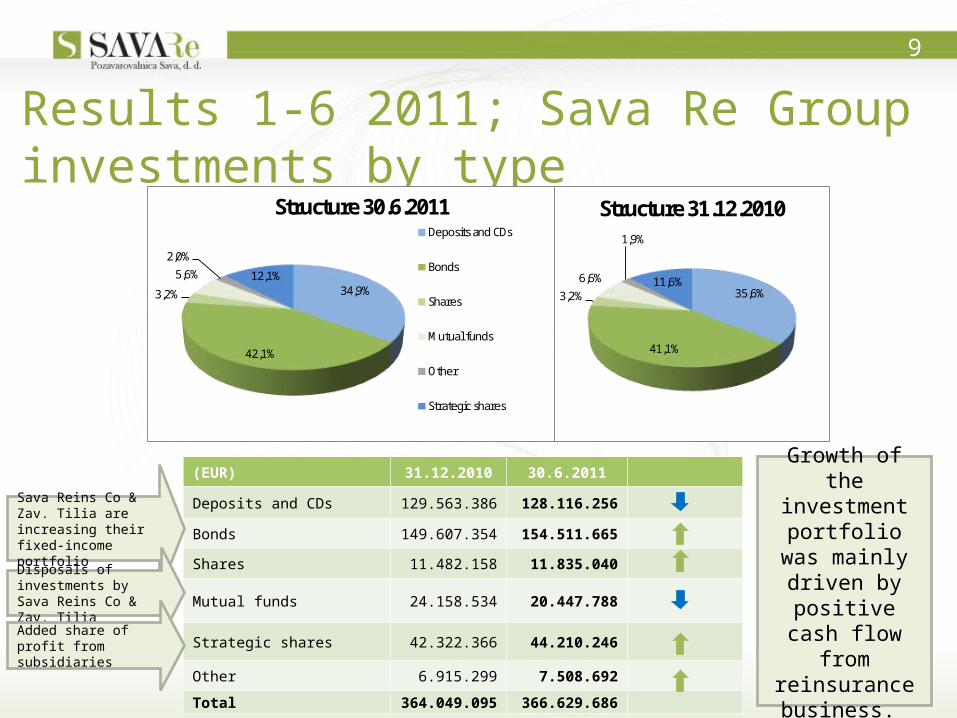
Results 1-6 2011; Sava Re Group investments by type
9
(EUR) 31.12.2010 30.6.2011
Deposits and CDs 129.563.386 128.116.256
Bonds 149.607.354 154.511.665
Shares 11.482.158 11.835.040
Mutual funds 24.158.534 20.447.788
Strategic shares 42.322.366 44.210.246
Other 6.915.299 7.508.692
Total 364.049.095 366.629.686
Growth of the investment
portfolio was mainly driven by
positive cash flow from
reinsurance business.
Sava Reins Co & Zav. Tilia are increasing their fixed-income portfolio
Disposals of investments by Sava Reins Co & Zav. Tilia
Added share of profit from subsidiaries
34,9%
42,1%
3,2%
5,6%
2,0%
12,1%
Structure 30.6.2011Deposits and CDs
Bonds
Shares
Mutual funds
Other
Strategic shares
35,6%
41,1%
3,2%
6,6%
1,9%
11,6%
Structure 31.12.2010
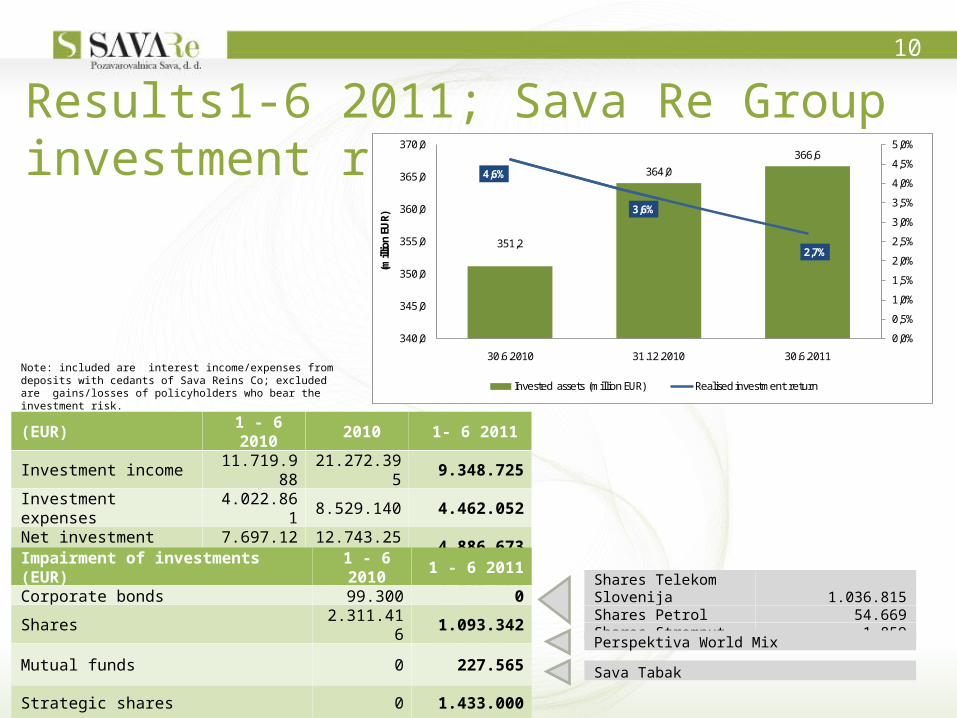
Results1-6 2011; Sava Re Group investment return
10
(EUR) 1 - 6 2010 2010 1- 6 2011
Investment income 11.719.988 21.272.395 9.348.725Investment expenses 4.022.861 8.529.140 4.462.052Net investment income 7.697.127 12.743.255 4.886.673Comprehensive income 3.580.291 4.113.237 2.958.803
Note: included are interest income/expenses from deposits with cedants of Sava Reins Co; excluded are gains/losses of policyholders who bear the investment risk.
Impairment of investments (EUR) 1 - 6 2010 1 - 6 2011Corporate bonds 99.300 0
Shares 2.311.416 1.093.342
Mutual funds 0 227.565
Strategic shares 0 1.433.000
Total 2.410.716 2.753.908
Shares Telekom Slovenija 1.036.815Shares Petrol 54.669Shares Stremput 1.859
Perspektiva World Mix
Sava Tabak
351,2
364,0
366,6
4,6%
3,6%
2,7%
0,0%
0,5%
1,0%
1,5%
2,0%
2,5%
3,0%
3,5%
4,0%
4,5%
5,0%
340,0
345,0
350,0
355,0
360,0
365,0
370,0
30.6.2010 31.12.2010 30.6.2011
(mill
ion
EUR)
Invested assets (million EUR) Realised investment return
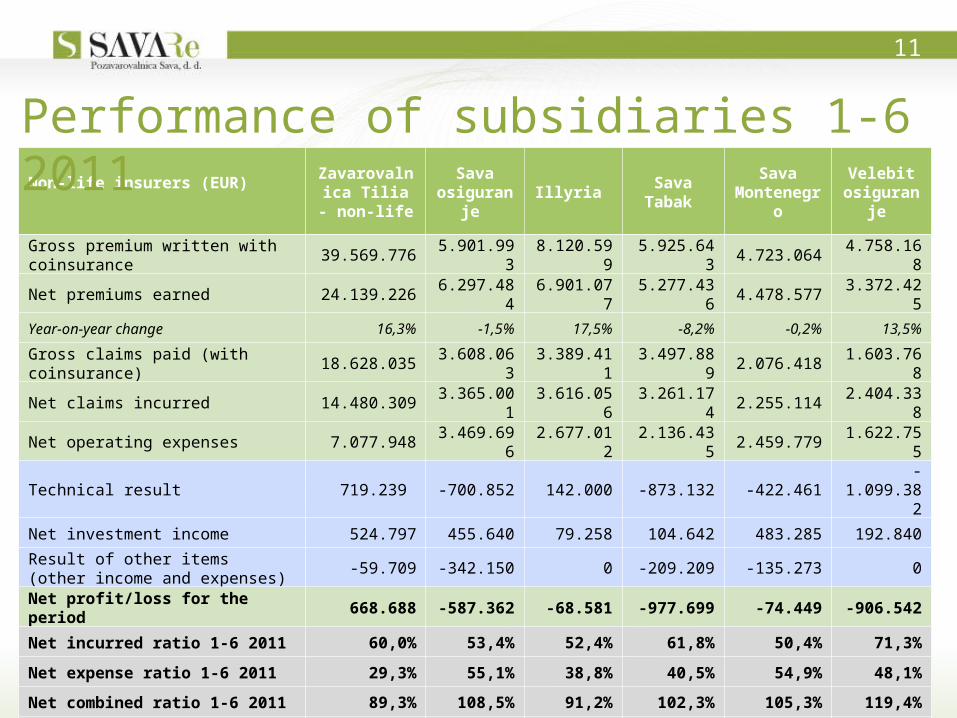
11
Non-life insurers (EUR) Zavarovalnica Tilia - non-life
Sava osiguranje
Illyria Sava Tabak Sava
MontenegroVelebit
osiguranje
Gross premium written with coinsurance 39.569.776 5.901.993 8.120.599 5.925.643 4.723.064 4.758.168
Net premiums earned 24.139.226 6.297.484 6.901.077 5.277.436 4.478.577 3.372.425
Year-on-year change 16,3% -1,5% 17,5% -8,2% -0,2% 13,5%
Gross claims paid (with coinsurance) 18.628.035 3.608.063 3.389.411 3.497.889 2.076.418 1.603.768
Net claims incurred 14.480.309 3.365.001 3.616.056 3.261.174 2.255.114 2.404.338
Net operating expenses 7.077.948 3.469.696 2.677.012 2.136.435 2.459.779 1.622.755
Technical result 719.239 -700.852 142.000 -873.132 -422.461 -1.099.382
Net investment income 524.797 455.640 79.258 104.642 483.285 192.840
Result of other items (other income and expenses)
-59.709 -342.150 0 -209.209 -135.273 0
Net profit/loss for the period 668.688 -587.362 -68.581 -977.699 -74.449 -906.542
Net incurred ratio 1-6 2011 60,0% 53,4% 52,4% 61,8% 50,4% 71,3%
Net expense ratio 1-6 2011 29,3% 55,1% 38,8% 40,5% 54,9% 48,1%
Net combined ratio 1-6 2011 89,3% 108,5% 91,2% 102,3% 105,3% 119,4%
Net combined ratio 1-6 2010 91,3% 107,9% 90,0% 105,5% 105,1% 133,2%
Performance of subsidiaries 1-6 2011
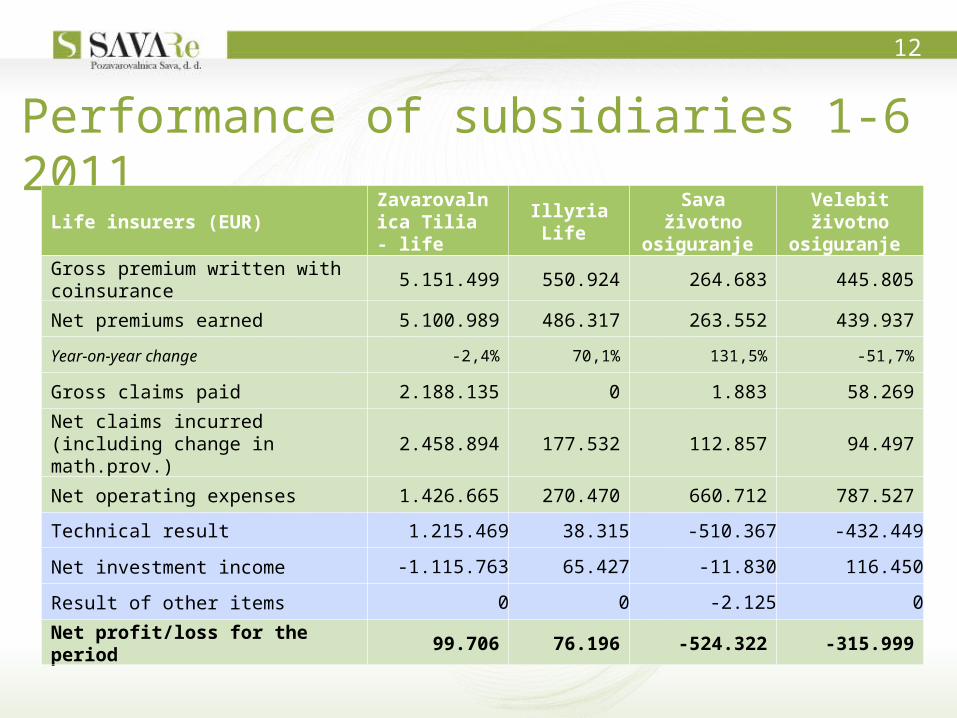
Performance of subsidiaries 1-6 2011
12
Life insurers (EUR)Zavarovalnica Tilia - life
Illyria Life Sava životno osiguranje
Velebit životno osiguranje
Gross premium written with coinsurance 5.151.499 550.924 264.683 445.805
Net premiums earned 5.100.989 486.317 263.552 439.937
Year-on-year change -2,4% 70,1% 131,5% -51,7%
Gross claims paid 2.188.135 0 1.883 58.269
Net claims incurred(including change in math.prov.)
2.458.894 177.532 112.857 94.497
Net operating expenses 1.426.665 270.470 660.712 787.527
Technical result 1.215.469 38.315 -510.367 -432.449
Net investment income -1.115.763 65.427 -11.830 116.450
Result of other items 0 0 -2.125 0
Net profit/loss for the period 99.706 76.196 -524.322 -315.999
Pozavarovalnica Sava, d. d.
Key performance indicators for Sava Reinsurance Company
for the Six Months to 30 June 2011
August 2011

Key items of the income statement14
Reinsurance Company Sava (EUR) 1 – 6 2010 1 – 6 2011 Index 11/10
Net premiums earned 56.533.941 60.419.368 106,9
Net claims incurred 37.888.794 34.676.834 91,5
Change in other technical provisions (including change in the tech.provi. for policyholders who bear the inv.risk)
-16.673 0
Net operating expenses 19.376.713 20.633.326 106,5
Other technical income 2.681.529 1.850.733 69,0
Other technical expenses 1.288.291 977.815 75,9
Technical result 644.998 5.982.126 927,5
Income from investments in associates 0 0
Ivestment income 4.791.508 3.834.159 80,0
Expenses from investments in associates 0 1.433.000
Expenses from financial assets and liabilities
3.655.975 2.364.529 64,7
Net investment income 1.135.534 36.630 3,2
Other income 1.809 251 13,9
Expenses for bonuses and rebates 0 26.071
Other expenses 158 10 6,3
Result of other items 1.651 -25.830
Profit/loss before tax 1.782.184 5.992.929 336,3
Net profit/loss for the period 1.282.168 4.220.401 329,2
Last year larger capital gains
Impact of dollar movements and increase in reinsurance commision
Favourable claims development
Growth lower than growth in earned premiums
Impairment loss on investment in subsidiary
Due to unearned premiums; larger amount of business written in mid-year renewals
Note: Investment income: includes interest from deposits with cedants of Sava Reinsurance Company
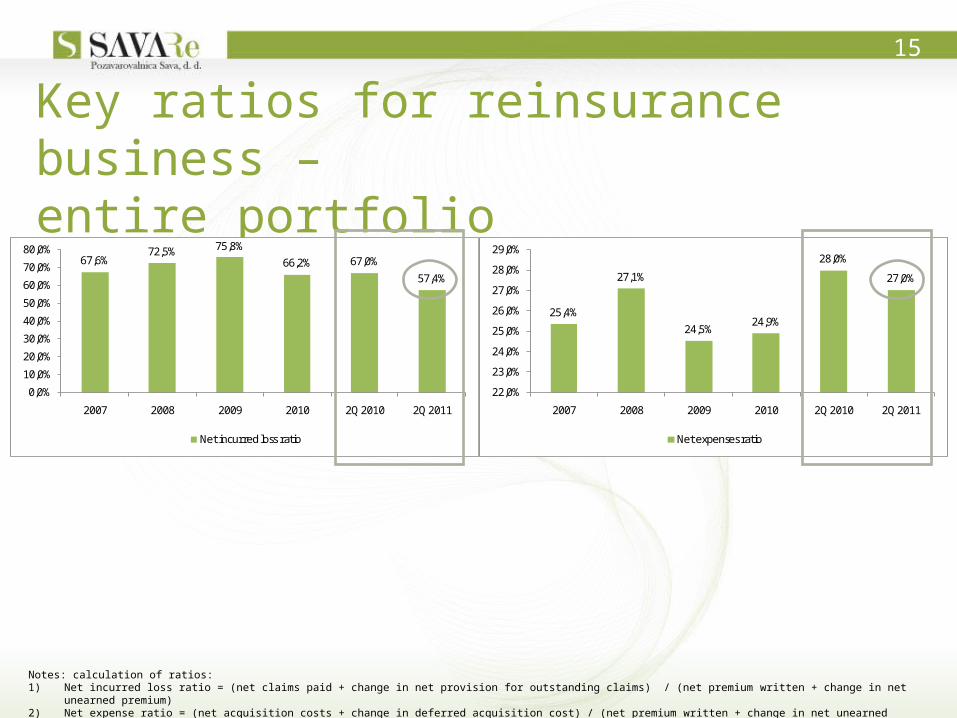
Key ratios for reinsurance business – entire portfolio
15
Notes: calculation of ratios:1) Net incurred loss ratio = (net claims paid + change in net provision for outstanding claims) / (net premium written + change in net unearned premium)2) Net expense ratio = (net acquisition costs + change in deferred acquisition cost) / (net premium written + change in net unearned premium)
67,6%72,5% 75,8%
66,2% 67,0%
57,4%
0,0%
10,0%
20,0%
30,0%
40,0%
50,0%
60,0%
70,0%
80,0%
2007 2008 2009 2010 2Q 2010 2Q 2011
Net incurred loss ratio
25,4%
27,1%
24,5%24,9%
28,0%
27,0%
22,0%
23,0%
24,0%
25,0%
26,0%
27,0%
28,0%
29,0%
2007 2008 2009 2010 2Q 2010 2Q 2011
Net expenses ratio