Embed Size (px)
Citation preview

Analyst Conference
May 30, 2014
V S Parthasarathy
Chief Financial Officer
1

Todays Theme
• Green shoots
• Hope…
• Performance amidst adversity
• Standalone Financials
• Consolidated Financials
• Zero Trauma in Turbulence
• Consistent Strong Financial Metrics
• Value Creation
• Milestone & Achievement
2

3

GDP Currency
2013 2012 2013 2012
Brazil 1.93 1.83 2.36 2.05
Russia 1.3 3.4 32.9 30.56
India 4.5 6.7 61.89 54.79
China 7.7 7.9 6.06 6.234

World economy outlook…
2014 2015
World Output 3.6 3.9
USA 2.8 3.0
Euro Area 1.2 1.5
Brazil 1.8 2.7
Russia 1.3 2.3
India 5.4 6.4
China 7.5 7.3
Source: IMF world economic outlook April 2014
Recovery Strengthens, Remains Uneven
5
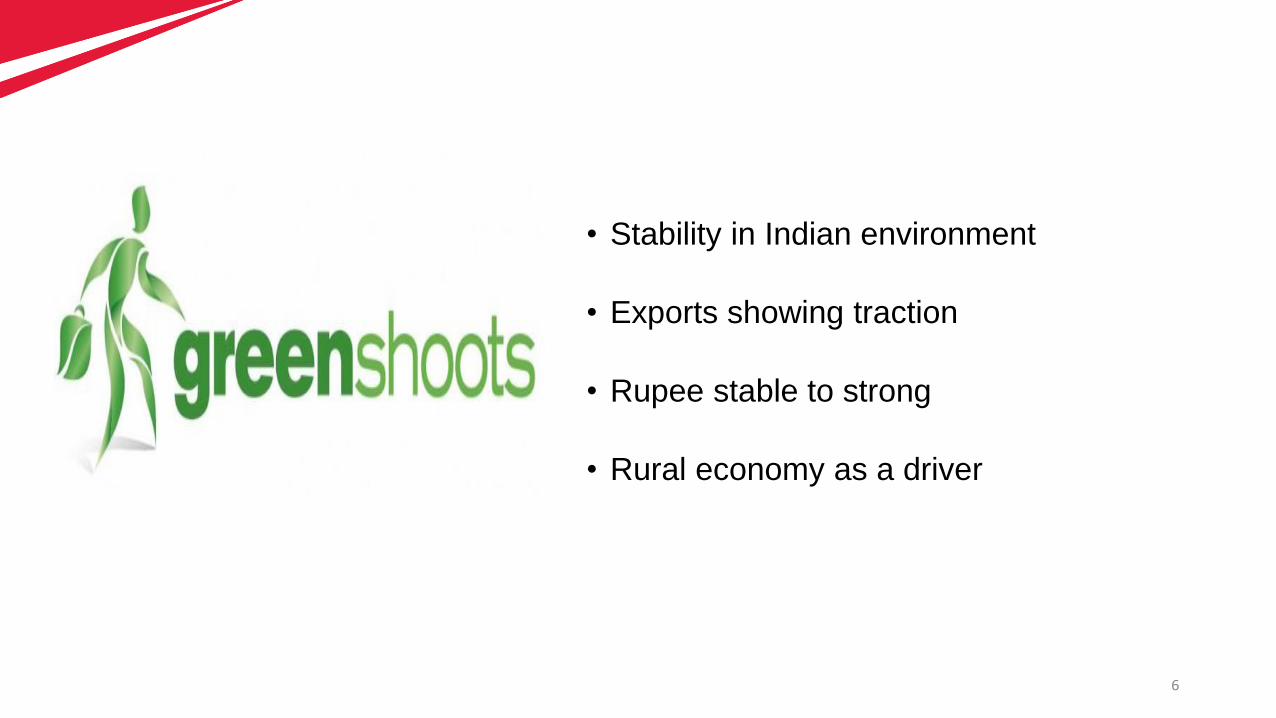
• Stability in Indian environment
• Exports showing traction
• Rupee stable to strong
• Rural economy as a driver
6

Glimmer of Hopes…
• Policy actions on FDI / Investments / GST etc. will it be fast tracked?
• Financing Cost will reduce
• Thrust on Infrastructure Investments
• With emergence of stability, estimates of GDP (5.4%) may be bettered…
The Return of Optimism
7

8
Mahindra
Tower

9
Mahindra
Tower
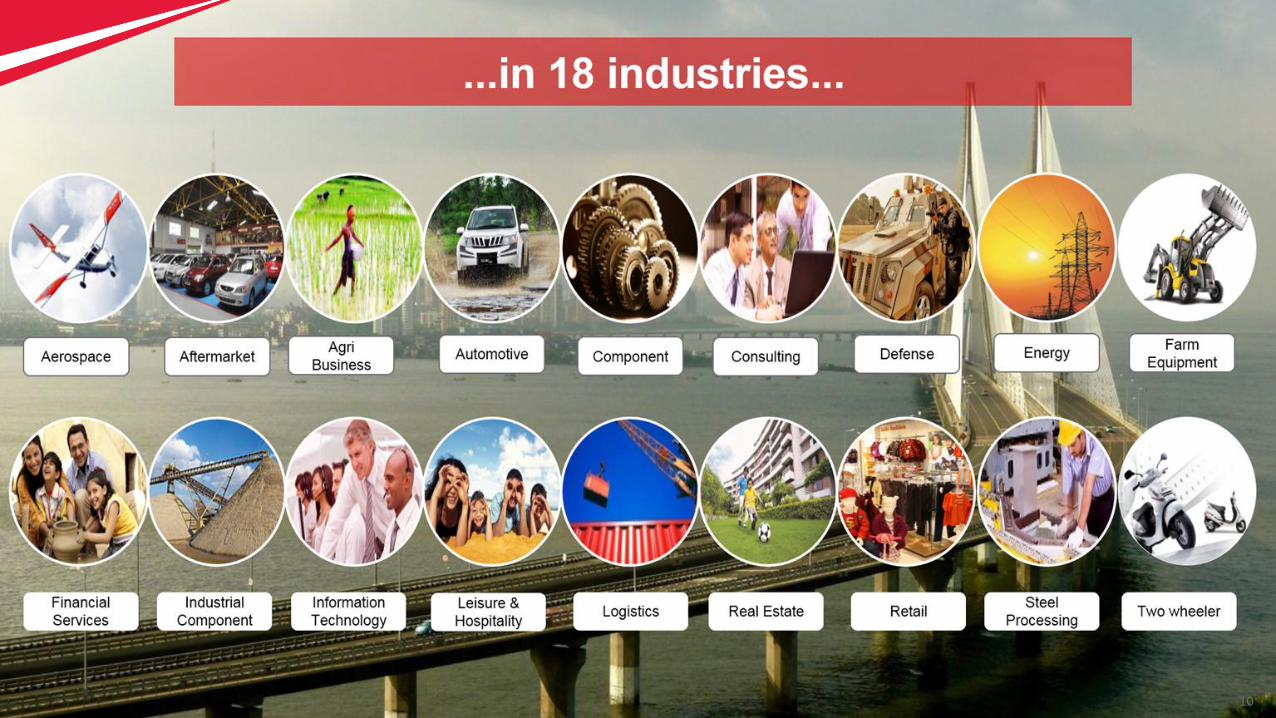
...in 10 business sectors...
Mahindra Partners (Steel,
Retail, Trade, Logistics, Boats,
Energy, Media)Defence Systems
Automotive
Aftermarket
Financial Services
Hospitality
Systech
Information Technology
Real Estate
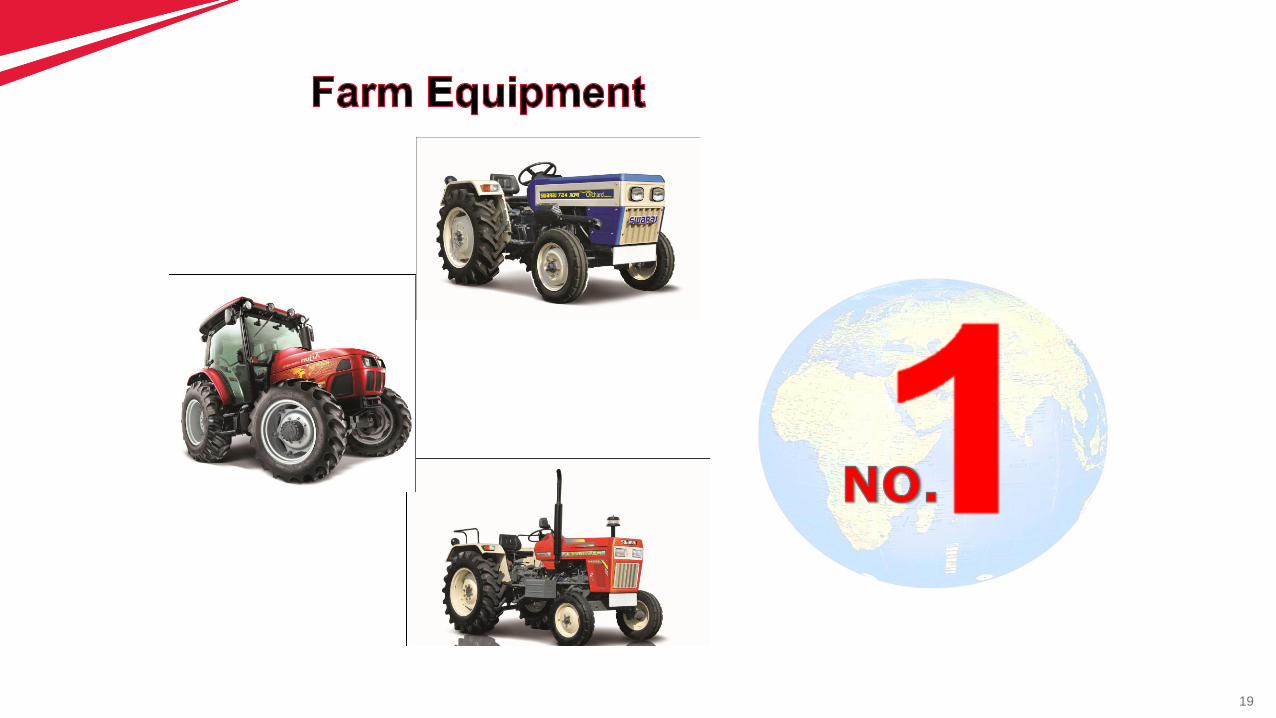
Farm Equipment
10

11
Life Insurance Corporation of India
First State Investments
Golboot Holdings Ltd (Goldman Sachs)
J P Morgan Group
Dodge & Cox
Capital Group
ICICI Prudential Life Insurance Ltd
Government of Singapore
Abu Dhabi Investment Authority
GIC, India
Top 10 Shareholders with > 1%
Shareholding Pattern… as on 31st March 2014
Promoter and
Promoter Group 25.3%
FII / NRI / GDR
45.6%
Insurance Cos.
14.3%
FI / MF / Banks1.5%
Individuals13.3%

12
Industry Growth
Auto Industry in downward spiral…
FY 14 FY 13 FY 12
Passenger Vehicle -6.1% 1.3% 4.7%
CV’s -20.2% -2.0% 18.2%
3 Wheelers -10.9% 4.9% -2.4%
Industry (Excl. 2 Wheelers) -9.5% 1.7% 6.2%
Sharpest fall
since 1976

13
To stand against all adversity is the most sacred moment
of existence

14
Strong Growth Trajectory
Gross Revenue & Other Income PAT
2,068
2,6872,997
3,6343,905
FY10 FY11 FY12 FY13 FY14
M&M + MVML (Standalone)
20,73526,201
35,005
43,655 43,256
FY10 FY11 FY12 FY13 FY14
EBITDA
2,965
3,6214,150
5,329 5,248
FY10 FY11 FY12 FY13 FY1414

15
Strong Growth Trajectory
Gross Revenue & Other IncomePAT after MI
2,479
3,080 3,127
4,099
4,667
FY10 FY11 FY12 FY13 FY14
Consolidated Accounts
33,79039,864
63,358
74,36178,736
FY10 FY11 FY12 FY13 FY14
EBITDA
5,0155,449
6,245
7,4497,843
FY10 FY11 FY12 FY13 FY14

16
Generating robust EPS growth
Note: Adjusted for Bonus & Stock-split
2.7 2.2 3.1 7.5
11.5
19.0 22.6 23.1
15.9
38.0
46.6 51.0
61.6 66.2
2001 2004 2007 2010 2014

17
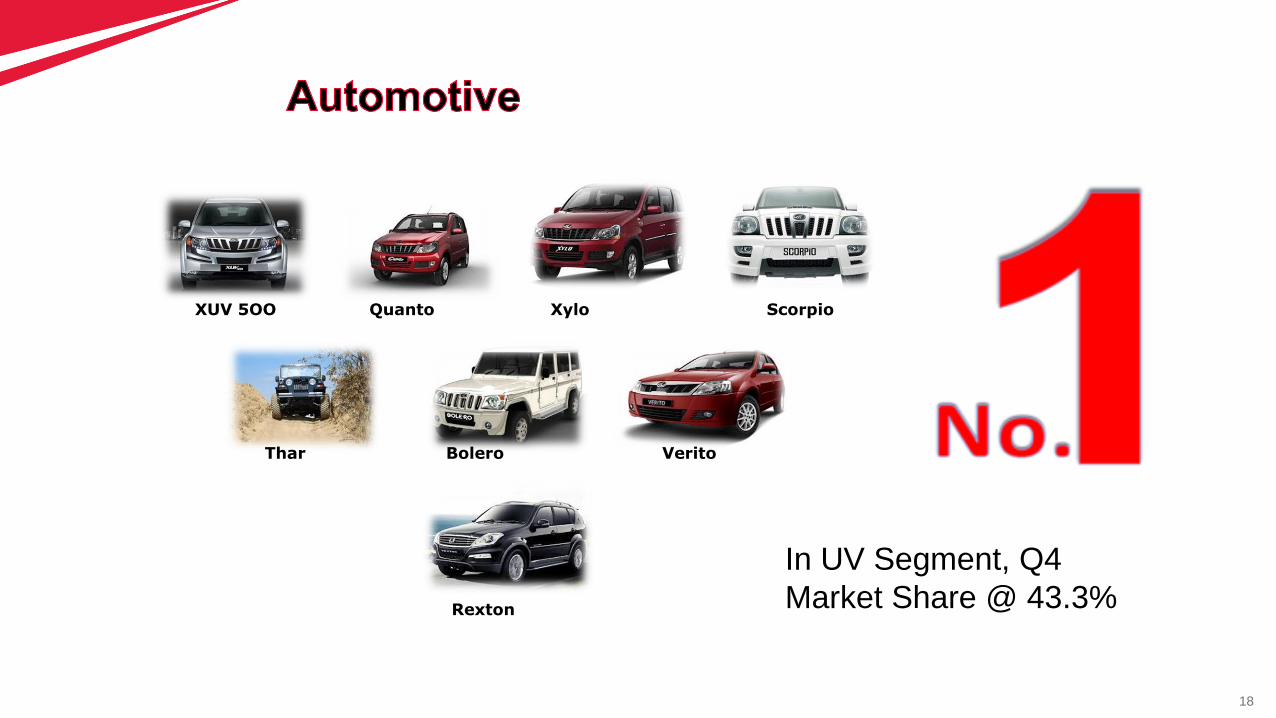
Our businesses are leaders in
their industries
18
XUV 5OO Quanto Xylo Scorpio
Thar Bolero Verito
Rexton
In UV Segment, Q4
Market Share @ 43.3%
19

20

21
Mahindra Holidays &
Resorts India Limited

22
23

24

25
Financials Snapshots

26
Mahindra Trucks & Buses…(MTBL)
De-merger Rationale
Operational efficiency
Financial benefits

Quarterly Performance – M&M + MVML Snapshot
Total Income
EBIDTA
PAT 976
1,400
10,137
Q4 FY 14 Q4 FY 13
10,085
1,435
963 1.3%
2.4%
0.5%
Without MTBL Merger
OPM 13.98% 14.38
27

Quarterly Performance – M&M + MVML Snapshot
Total Income
EBIDTA
PAT 976
1,400
10,137
Q4 FY 14 Q4 FY 13
10,085
1,435
963 1.3%
2.4%
0.5%
0.5%
26.1%
2.4%
Without MTBL Merger
OPM 13.98% 14.38
968
1,060
10,322
Q4 FY 14
With MTBL
10.38%
28
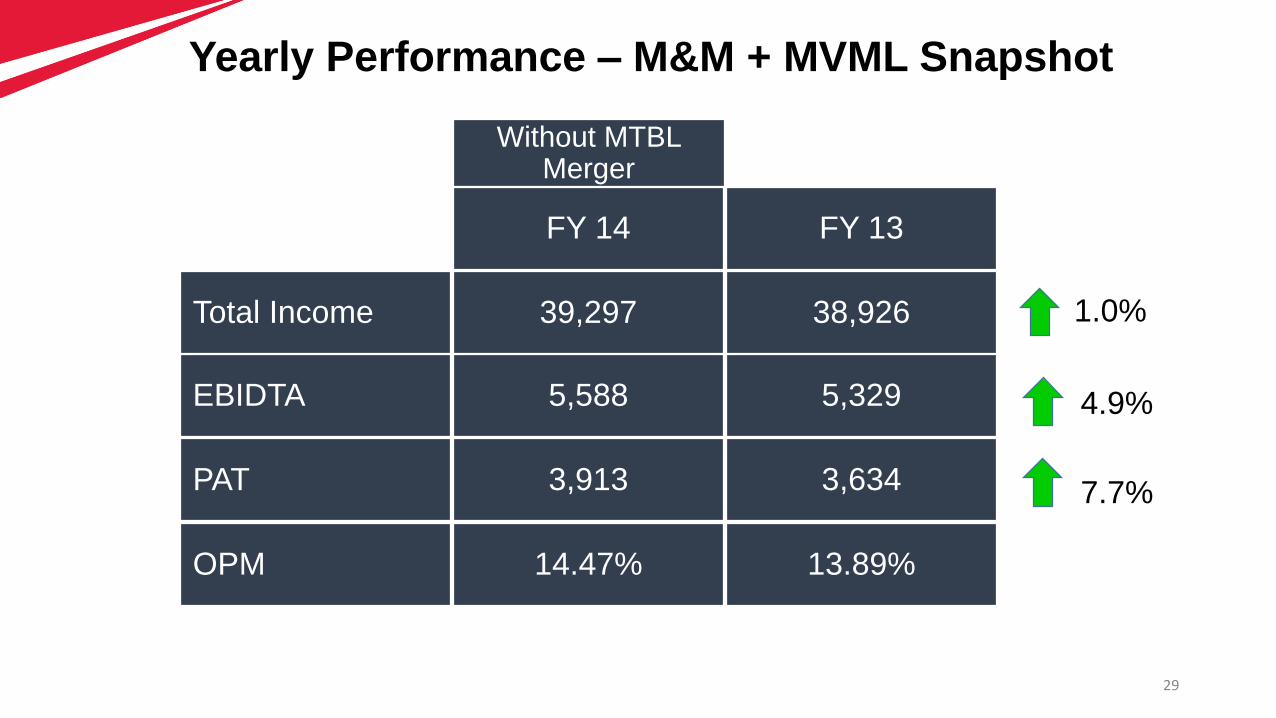
Yearly Performance – M&M + MVML Snapshot
Total Income
EBIDTA
PAT 3,913
5,588
39,297
FY 14 FY 13
38,926
5,329
3,634 7.7%
4.9%
1.0%
Without MTBL Merger
OPM 14.47% 13.89%
29

Yearly Performance – M&M + MVML Snapshot
Total Income
EBIDTA
PAT 3,913
5,588
39,297
FY 14 FY 13
38,926
5,329
3,6347.4%
1.5%
1.4%
Without MTBL Merger
OPM 14.47% 13.89%
3,905
5,248
39,482
FY 14
With MTBL
13.52%
30

Performance Indicators
Particulars F – 2014 F – 2013
OPM (%) 13.52 13.89
ROCE 22.16 26.77
Interest Coverage Ratio 14.91 16.08
Debt / Service Ratio 5.67 6.63
EPS (Basic) (Rs.) 66.15 61.63
Book Value (Rs.) 293.26 254.85
31

32Copyright © 2013 Mahindra & Mahindra Ltd. All rights reserved. 32
F-2014
Consolidated Result

Rs. 5,154 crs
Rs. 4,129 crs
25%
Financial Highlights
Total income
Rs. 78,736 crs
Rs. 74,361 crs
6%
M&M Consolidated – FY 14 vs. FY 13
Rs. 7,843
Rs. 7,449
5%
EBIDTA PAT before MI
33

Rs crs
Subsidiary Company Results
# includes share in profits of Associates
F – 2014 F – 2013% Inc/
(Dec)
Net Revenue 40,249 35,813 9%
PAT before MI # 1,457 754 93%
PAT after MI # 972 596 63%
34

Listed companies continues to perform…
F14 – Rs.954 crs
F13 – Rs.927 crs
F14 – Rs 101 crs
F13 –Rs 141 crs
F14 – Rs.3,029 crs
F13 – Rs.1,956 crs
F14 – Rs.87 crs
F13 – Rs.91 crs
35
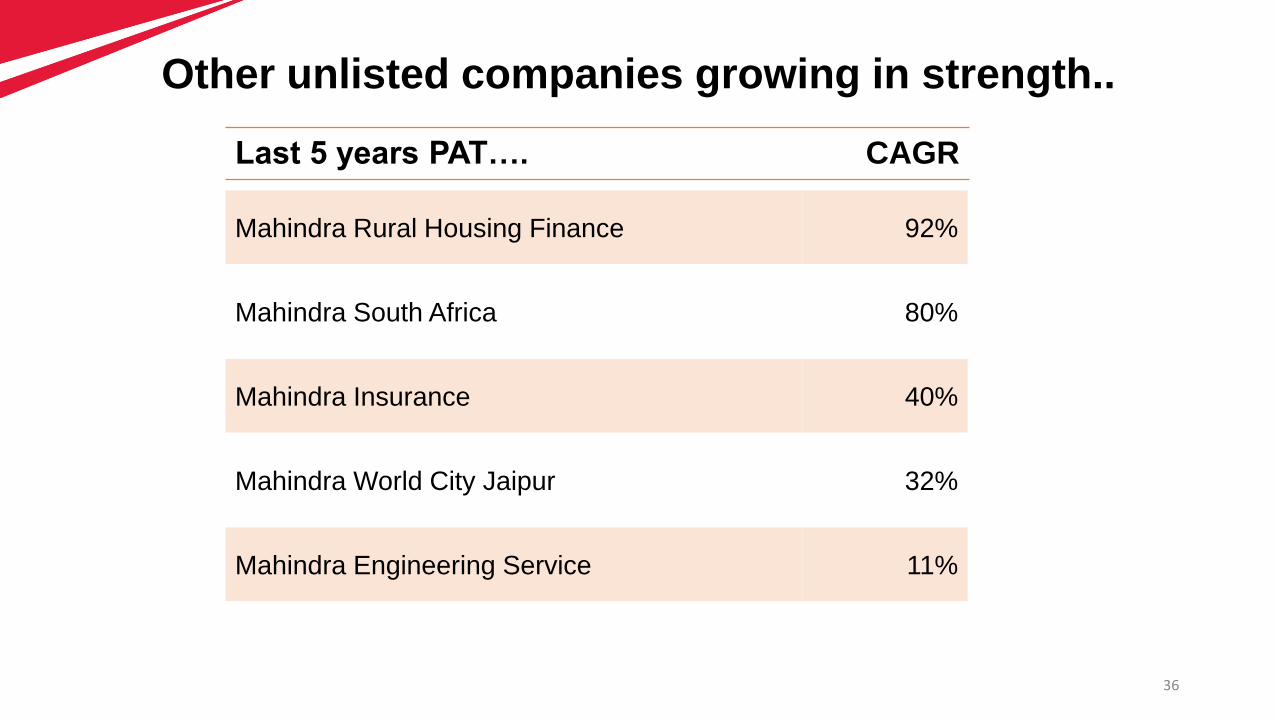
Other unlisted companies growing in strength..
Last 5 years PAT…. CAGR
Mahindra Rural Housing Finance 92%
Mahindra Insurance 40%
Mahindra South Africa 80%
Mahindra Engineering Service 11%
Mahindra World City Jaipur 32%
36

22812878 2934
3563
0
500
1000
1500
2000
2500
3000
3500
4000
2010 2011 2012 2013
Q1 CY 14 – Performance
• Revenue 14.5%
• Operating loss reduced by 95.5% and
a net current profit of 10.7 billion won
SYMC continues upward journey…
Revenue Billion won
37
Consolidated Segment Report
38

41798
44875
35000
37000
39000
41000
43000
45000
47000
2330 2358
1000
1500
2000
2500
13825
16884
10000
11000
12000
13000
14000
15000
16000
17000
18000
1828
2480
1000
1500
2000
2500
3000
Farm Equipment
4117
5306
3000
4000
5000
6000
1284
1461
500
1000
1500
2000
Segment Revenue
Segment Result
Automotive
FY13 FY14 FY13 FY14
Financial Service
FY13 FY14
FY13 FY14 FY13 FY14 FY13 FY14
7% 22% 29%
1% 36% 14%
39

727
817
500
1000
141
121
50
100
150
754722
200
500
800
243
161
100
200
300
IDS
1423
1298
500
1000
1500
88
95
50
70
90
110
Hospitality
FY13 FY14 FY13 FY14
Steel Trading
FY13 FY14
FY13 FY14 FY13 FY14 FY13 FY14
12% -4% -9%
-15% -34% 8%
Segment Revenue
Segment Result
40

2851
3208
2000
2500
3000
3500
-295
-502
100
200
300
400
500
600
Others
FY13 FY14
FY13 FY14
-70%
13%
Segment Revenue
Segment Result
41

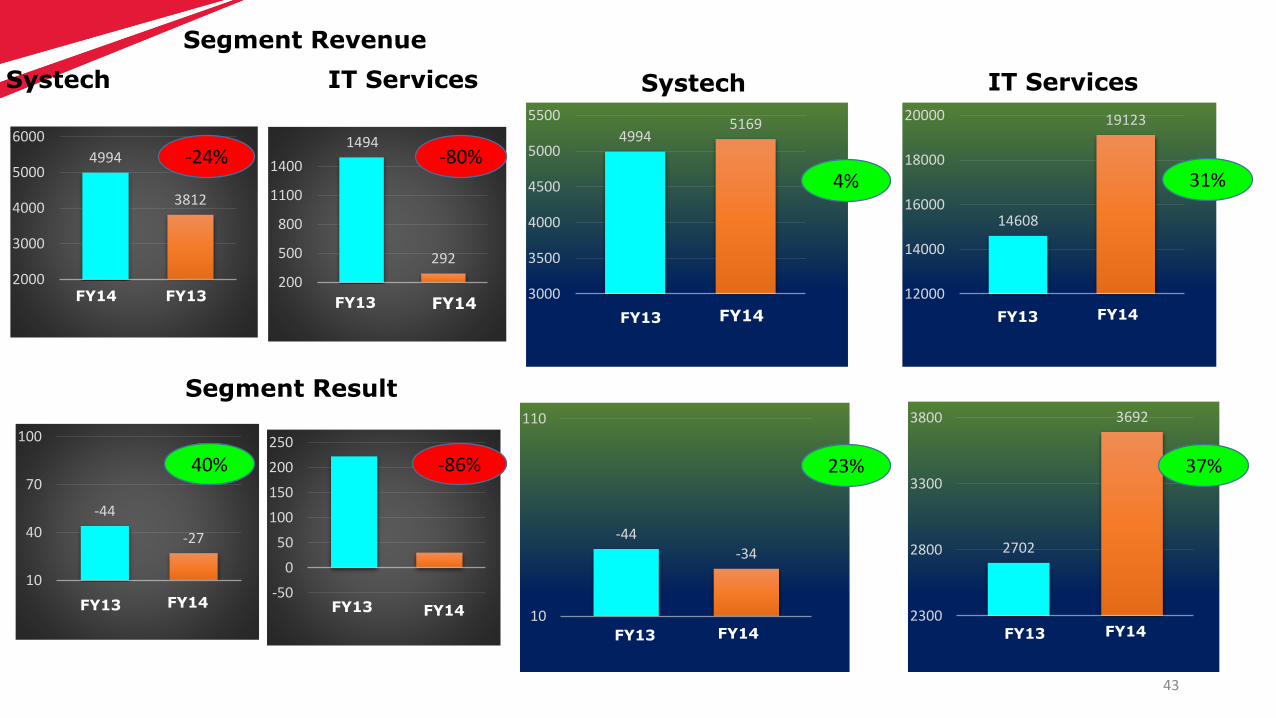
Segment Revenue
Segment Result
42
-44
-27
10
40
70
100
4994
3812
2000
3000
4000
5000
6000
Systech
FY13 FY14
FY13 FY14
-24%
40%
222
30
-50
0
50
100
150
200
250
FY13 FY14
1494
292
200
500
800
1100
1400
IT Services
FY13 FY14
-80%
-86%
Segment Revenue
Segment Result
43
-50
0
50
100
150
200
250
-44
-27
10
40
70
100
1494
292
200
500
800
1100
14004994
3812
2000
3000
4000
5000
6000
Systech
FY14
FY14
IT Services
FY13
FY13
FY14FY13
FY13 FY14
-24% -80%
40% -86%
14608
19123
12000
14000
16000
18000
20000
49945169
3000
3500
4000
4500
5000
5500
FY14
-44-34
10
110
Systech
FY13
FY13 FY14
2702
3692
2300
2800
3300
3800
IT Services
FY13 FY14
FY13 FY14
4%
23% 37%
31%

• Zero Trauma in Turbulence
Achieving Zero Trauma
44

30.9 28.1
23.324.7 23.6
25.5
20.3
15.717.6
17.2
10
15
20
25
30
35
40
2010 2011 2012 2013 2014
M&M + MVML M&M Consolidated
Healthy ROE
45
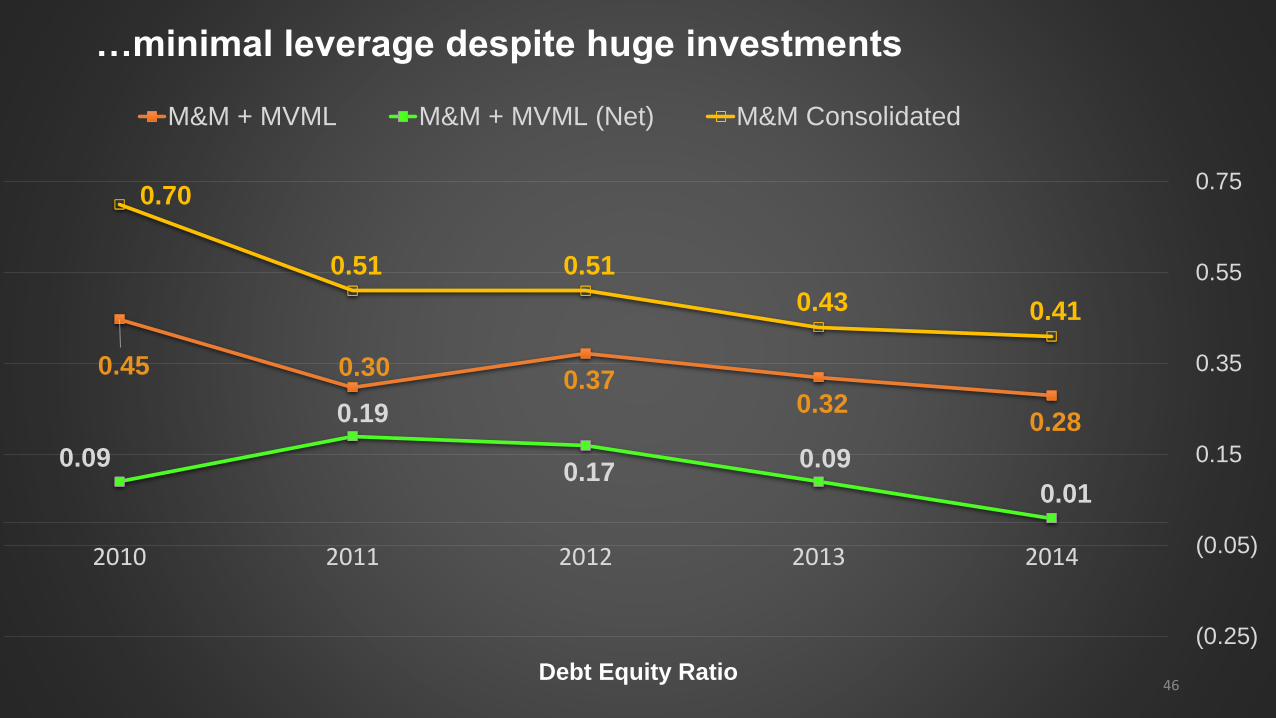
0.28 0.32
0.37 0.30 0.45
0.01
0.09 0.17
0.19
0.09
0.41 0.43
0.51 0.51
0.70
(0.25)
(0.05)
0.15
0.35
0.55
0.75
20142013201220112010
M&M + MVML M&M + MVML (Net) M&M Consolidated
…minimal leverage despite huge investments
46Debt Equity Ratio

India Ratings& ResearchA Fitch Group Company
Top notch Credit Rating….

48
0.45
0.32 0.37
0.30 0.28
F 2010 F 2011 F 2012 F 2013 F 2014
DE Ratio
M&M + MVML
1.12
0.82 0.98
0.760.83
F 2010 F 2011 F 2012 F 2013 F 2014
Gearing Multiple
M&M + MVML
Robust Financial Risk Profile

49

50
Unlocking Shareholders Value – Since 2005
Corporate Actions
Bonus Issue – FY 2005 –1:1
Stock Split – FY 2011 – 1:2

Original Investment Cost Vs. CMP
31st March 2014 31st March 2013
Cost Market Value CostMarket
Value
Listed Companies
Subsidiaries 2,735 15,029 2,994 11,090
Associates 651 11,178 649 6,592
Total 3,386 26,207 3,644 17,683
Rs crs
51

Recent
Value
Unlocking
52
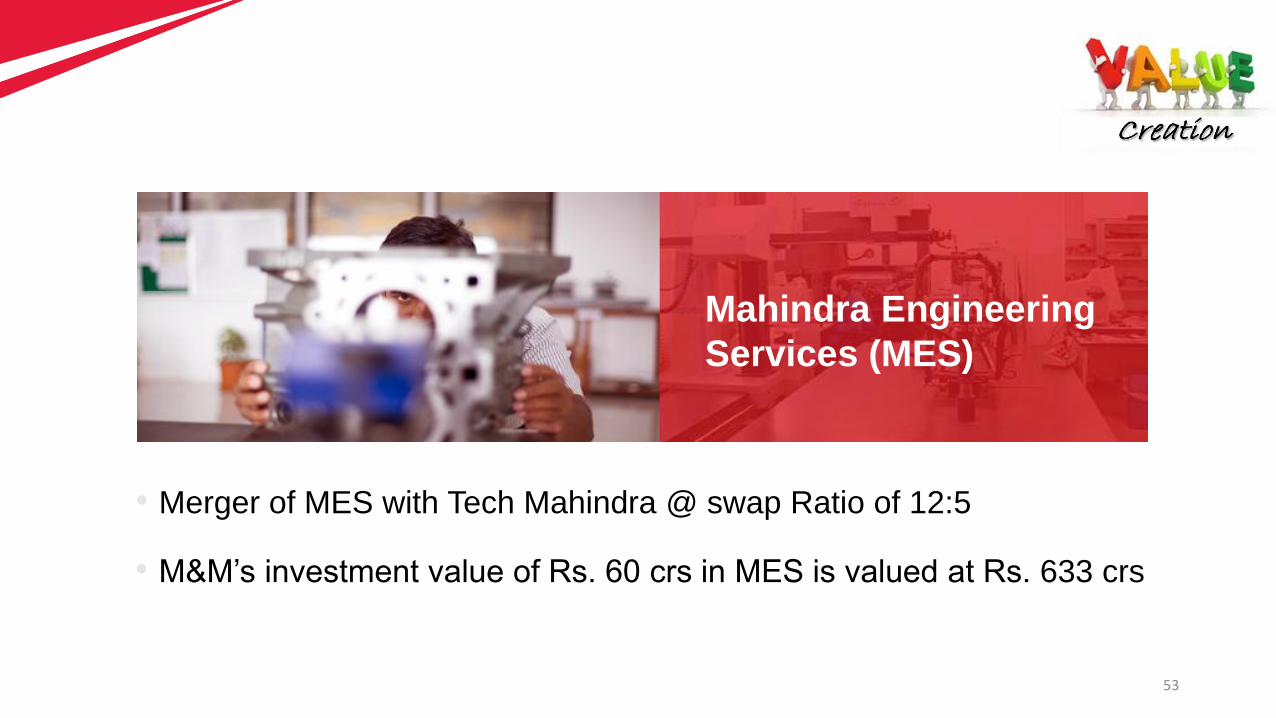
• Merger of MES with Tech Mahindra @ swap Ratio of 12:5
• M&M’s investment value of Rs. 60 crs in MES is valued at Rs. 633 crs
Mahindra Engineering
Services (MES)
53

Mahindra Logistic
(MLL)
• Divestment in MLL : Stake sale + PE Infusion
• M&M’s invested Rs. 58 crs in MLL, PE investment valuation ~ at Rs. 750 crs
54

Mahindra CIE Deal
• Mahindra CIE Deal
Per Share CMP
• Investment in Mahindra CIE Rs. 81 Rs. 106.7
• Investment in CIE Spain € 6 € 9.19
55

3.8
9.8
46.7
0.00 5.00 10.00 15.00 20.00 25.00 30.00 35.00 40.00 45.00 50.00
Gold
Sensex
M&M
Last 5 years
5.1
2.3
1.4
Note: Adjusted for Bonus & Stock-split
Ex Dividend price
Last 11 years
39.5
7.3
3.8
Last 21 years
As at 31st March 2014
Delivering consistent, long term value
$/Oz
56

IT 6x
40x
7x
4x
No.1 in Auto
Enhancing shareholders value … best among allLast 11 years…
Banking
36x
Mfg. 27xPharma
45x
57
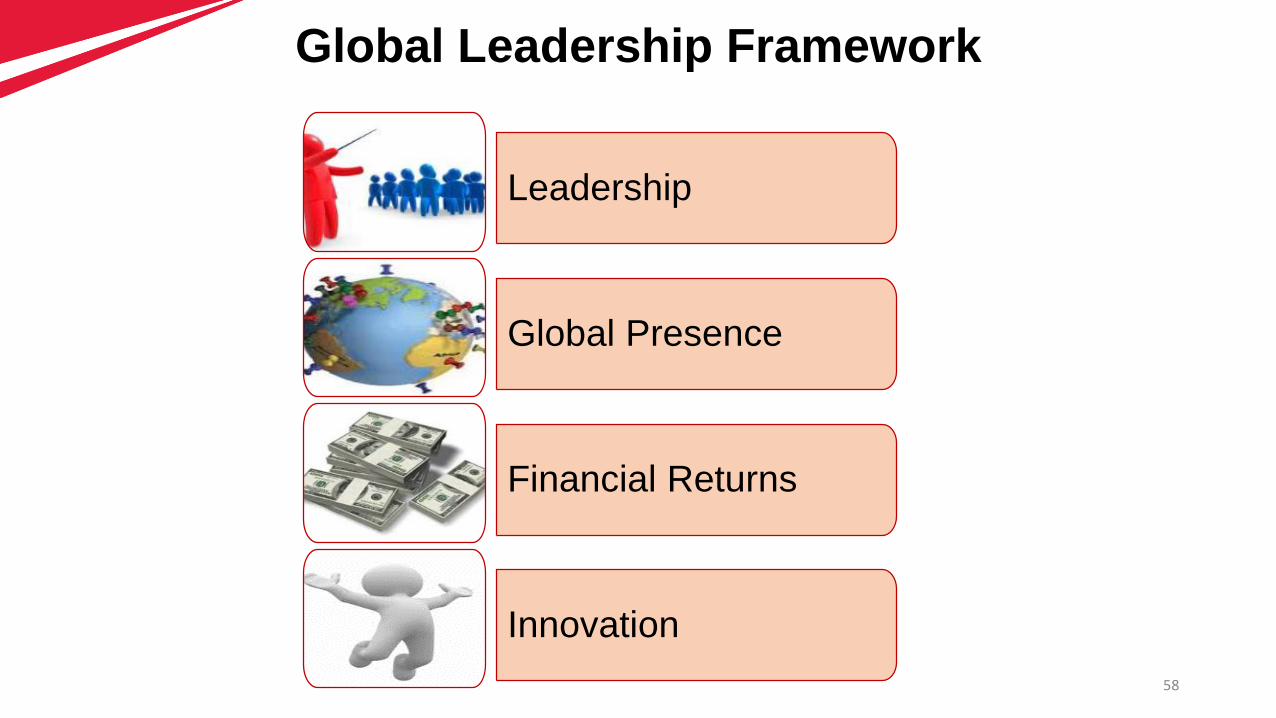
Global Leadership Framework
Leadership
Global Presence
Financial Returns
Innovation
58

Global Leadership Framework
Leadership
Global Presence
Financial Returns
Innovation
59

Finance and Accounts Milestones
50 Years Unsecured
NCD with bullet
payment
CIE
Strategic
Alliance
60
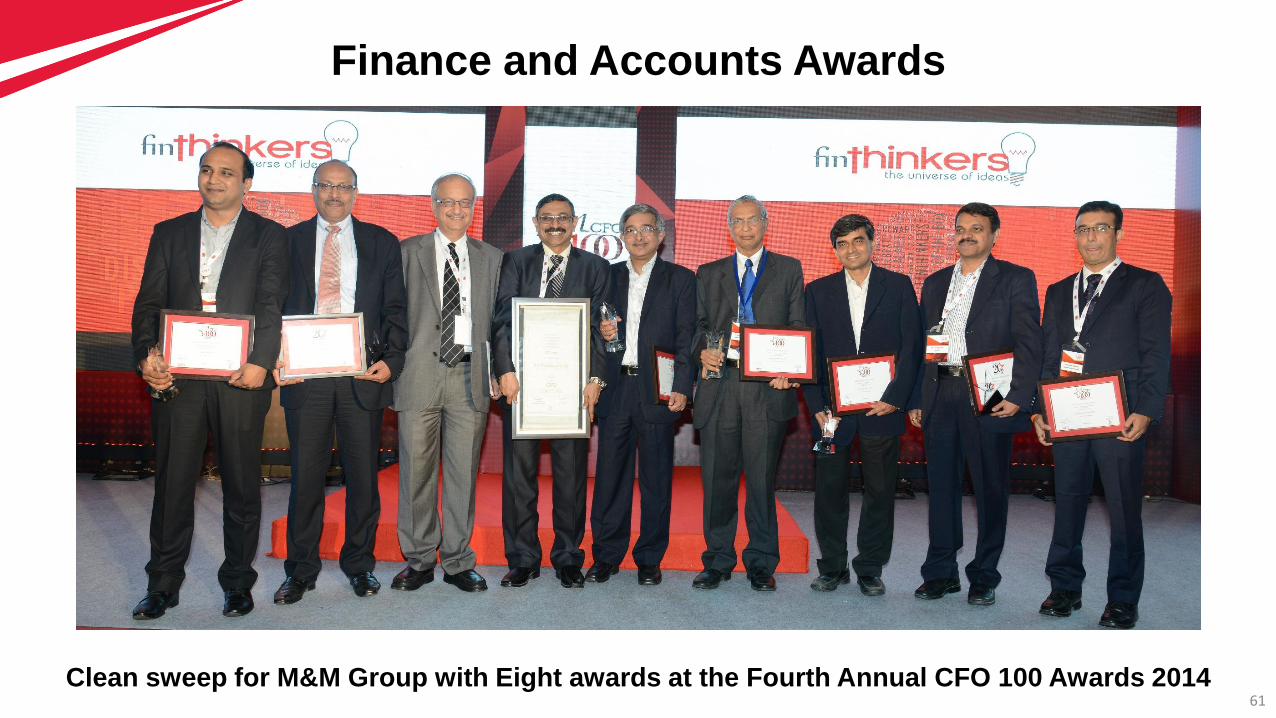
Clean sweep for M&M Group with Eight awards at the Fourth Annual CFO 100 Awards 2014
Finance and Accounts Awards
61

"No stars gleam as brightly as those which
glisten in the polar sky. No water tastes so
sweet as that which springs amid the desert
sand. And no faith is so precious as that which
lives and triumphs through adversity“
- Charles H Spurgeon
62

63